the Creative Commons Attribution 4.0 License.
the Creative Commons Attribution 4.0 License.
 | 11 Jul 2022
Brief communication: Improving ERA5-Land soil temperature in permafrost regions using an optimized multi-layer snow scheme
Gabriele Arduini
Ervin Zsoter
We previously reported a notable warm bias in ERA5-Land soil temperature in permafrost regions that was supposedly being caused by an underestimation of snow density. In this study, we implemented and evaluated a new multi-layer snow scheme in the land surface scheme of ERA5-Land, i.e., HTESSEL, with revised snow densification parameterizations. We compared permafrost soil temperatures from the numerical experiments with observations and the original ERA5-Land with a single-layer snow scheme. The revised HTESSEL significantly improved the representation of soil temperature in permafrost regions compared to ERA5-Land. The daily warm bias in winter was reduced by about 0.6–3.0 ∘C across the 522 observing stations in high-latitude permafrost regions, and the resulting modeled near-surface permafrost extent was improved (11.0–12.9×10⁶ km2 during 2001–2018), comparing reasonably with observed estimates for continuous and discontinuous permafrost areas. We therefore suggest that a better-resolved snow scheme with a multi-layer snow profile should be included in next-generation reanalyses as a first step towards improving the representation of permafrost.
- Article
(2889 KB) - Full-text XML
- Companion paper
-
Supplement
(463 KB) - BibTeX
- EndNote


Permafrost has been warming and degrading around the world (Biskaborn et al., 2019). Robust simulation of permafrost is essential for understanding responses to climate change and assessing associated changes in hydrological processes, terrain stability, and carbon losses (e.g., Westermann et al., 2016; Walter Anthony et al., 2018). The prevalence of snow cover for much of the year in permafrost regions can strongly affect soil temperature due to its influence on the surface energy balance (Zhang, 2005; Cao et al., 2018) and is typically a key uncertainty in the representation of permafrost soil temperature (Dutra et al., 2012; Domine et al., 2019).
Climate reanalysis is a valuable source of data for permafrost science (Cao et al., 2019a). ERA5 (Hersbach et al., 2020) and the land-only reanalysis ERA5-Land (ERA5L, Muñoz-Sabater et al., 2021) are the most recent advances produced by the European Centre for Medium-Range Weather Forecasts (ECMWF) within the Copernicus Climate Change Service (C3S). The land surface component of these reanalyses is the Tiled ECMWF Scheme for Surface Exchanges over Land with a revised land surface hydrology (HTESSEL) cycle 45r1, which is part of the ECLand modeling framework (Boussetta et al., 2021). The current HTESSEL used in ERA5 and ERA5L includes snow as an independent single layer on top of the soil layer and describes bulk temporal evolution of the snowpack (Dutra et al., 2009). In a previous study, we reported the notable warm bias of the ERA5L soil temperature in permafrost regions (Cao et al., 2020). By reviewing the snow scheme parameterization, we determined that a low snow density in ERA5L may cause the warm bias. Through further examination of the land scheme codes in ERA5L we identified that the current parameters do not permit thermal metamorphism to occur for snow densities higher than 150 kg m−3, which is far lower than metamorphosed snow in permafrost areas (Fig. 1). We hypothesized that this snow density underestimation could cause the overestimation of snow depth and hence of permafrost soil temperatures, due to an overestimated soil–atmosphere thermal decoupling (see Cao et al., 2020).
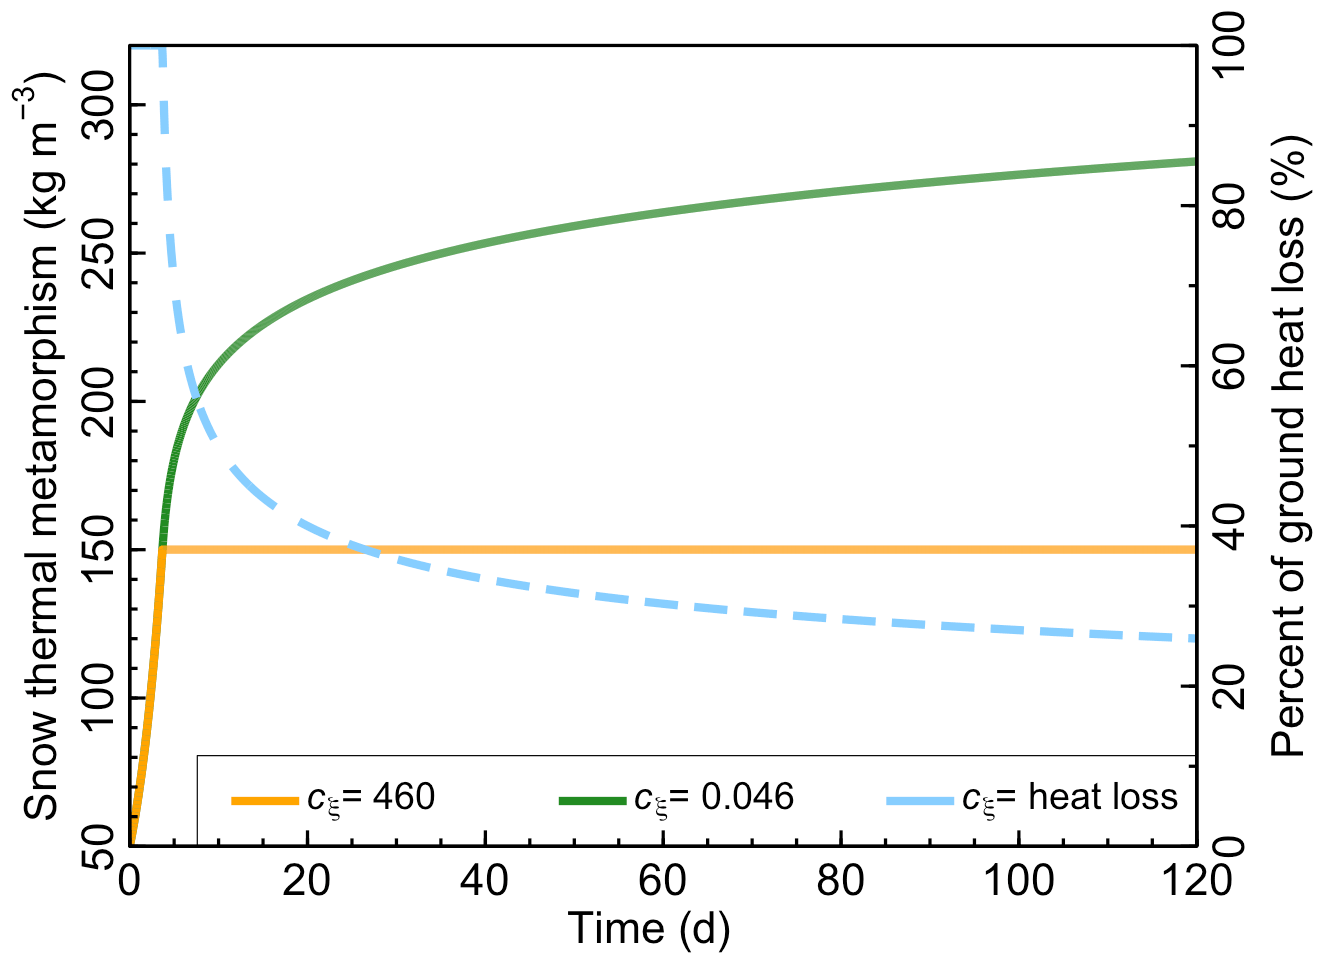
Figure 1Snow compaction rate due to thermal (destructive) metamorphism (excluding liquid water) using different cξ in Eq. (6). The dashed line is the percent of ground heat loss through the snow layer in Exp. MLS-Dis+Den compared using the cξ of 0.046 (kg m−3) in ERA5L, Exp. CTRL, and Exp. MLS-Std (see text for description).
The single-layer snow scheme (SLS) in HTESSEL can only represent the temporal evolution of snow processes at a single timescale and lacks a solution for processes that occur at different depths and temporal scales. For this reason, a multi-layer snow scheme (MLS) was developed independently by ECMWF (e.g., Dutra et al., 2010, 2012; Arduini et al., 2019) and is reported to have better representation of snow physics. The MLS has added value to many other phenomena over snow-covered regions, i.e., near-surface air temperature (Arduini et al., 2019). However, the state-of-the-art MLS has not been implemented in the current scheme for the latest-generation reanalysis production by ECMWF, and its impact on soil temperature in permafrost regions remains largely unknown.
In this study, we introduce a new MLS recently developed by Arduini et al. (2019) into the HTESSEL and evaluate its capability for representing soil temperature in permafrost regions. Four simulation experiments were designed and carried out to better understand its performance. We then evaluate the reproduced reanalysis, with a specific focus on soil temperature in permafrost regions, by comparing temperatures with observations and original ERA5L and published permafrost products.
2.1 ERA5-Land with single-layer snow scheme
ERA5 assimilates new datasets to improve snow representation compared to its predecessor of ERA-Interim, such as the in situ observations of the global surface synoptic report (SYNOP) network for snow depth and snow cover information from the Interactive Multisensor Snow and Ice Mapping System (IMS) system since 2004 (Hersbach et al., 2020). ERA5L, the land component of ERA5, has an improved horizontal resolution of 0.1∘ (or ∼9 km). ERA5L also uses an enhanced snow scheme with improved snow thermal insulation compared to ERA-Interim, although it inherits the SLS (Dutra et al., 2010). ERA5L has a soil profile of four layers with a total depth of 1.89 m.
2.2 Standard multi-layer snow scheme
The new MLS was developed and implemented in HTESSEL by Arduini et al. (2019). The MLS has a maximum of five snow layers depending on the snow height (hsn). The number of active snow layers and their thicknesses are simulated diagnostically at the beginning of each time step before the prognostic snow fields are updated. Multiple snow layers are used when hsn>0.1 m, the minimum hsn that ensures complete snow coverage of the grid box. Over flat terrain, the depth of the uppermost snow layer in contact with the atmosphere is fixed to 0.05 m. The second and third upper layers and the bottom layer in contact with the soil underneath can increase to maximum depths of 0.10, 0.20, and 0.15 m, respectively. This choice means that the fourth layer from the top is used as an accumulation layer for deep snowpack. Taking hsn=1.0 m as an example, the snow cover is discretized as follows: 0.05, 0.10, 0.20, 0.50, and 0.15 m (see Arduini et al., 2019, for details).
While MLS and SLS share a set of parameters for snow densification (see Sect. 2.3), a number of physical snow processes were changed in MLS. For example, the effects of heat conduction and water vapor (λv) on snow thermal conductivity (λsn, ) are treated separately in MLS. The former was parameterized following Calonne et al. (2011), and the latter was calculated using equation from Sun et al. (1999):
where Tsn is the snow temperature (K); Pa is air pressure (mbar); and a, b, and c are calibrated values of , −2.5425, and −289.99 from Sun et al. (1999). In addition, MLS includes the penetration of solar radiation within the snowpack, following Jordan (1991).
2.3 Revised multi-layer snow scheme
In this study, two parameterizations for snow discretization and densification in the MLS are revised. A variable vertical discretization algorithm is introduced for complex terrain, defined as regions where the standard deviation of the sub-grid-scale topography is >50 m, following Boussetta et al. (2021). This is used to maintain a relatively high vertical resolution for snow layers responding to fast timescales of deep snowpack development in hilly and mountainous terrain. Over complex terrain, the snow discretization is the same as in flat areas when hsn<0.25 m. When hsn⩾0.25 m, the minimum () and maximum () heights for layer i are variable depending on hsn.
where α0 is 0.1, and Δhsn is given as
Following Anderson (1976), snow densification in SLS and MLS is determined through (1) overburden pressure, (2) thermal metamorphism, and (3) melt metamorphism due to the presence and refreezing of liquid water in the snow layer. MLS additionally considers wind effects (snowdrift) in one dimension by following Decharme et al. (2016). Snow density (ρsn, kg m−3) is constrained between 50 and 450 kg m−3. When ρsn>150 kg m−3, the densification rate related to thermal metamorphism is parameterized as
where the aξ and bξ are constant values of (s−1) and 0.042 (unitless) derived or modified from Anderson (1976) and Jordan et al. (1999). TD (K) is the temperature depression:
where Tsn is the snow temperature (K). While cξ is empirical and highly site-specific, setting it as 460 m3 kg−1 in ERA5L is equivalent to halting the thermal metamorphism process for snow densities higher than 150 m3 kg−1 (Fig. 1). This means, for the same total snow mass, the SLS has an underestimated ρsn and an overestimated hsn, which reduces ground heat loss through the snow layer to about 26 (40) % after 120 (20) d of snowfall compared to using 0.046 m3 kg−1 (Fig. 1). Δβsn (kg m−3) is given as
where ρξ (kg m−3) is equal to 150 kg m−3.
In Anderson (1976) and many snow and land surface models such as CLM (van Kampenhout et al., 2017) and Noah-MP (Yang and Niu, 2003), a value of 0.046 m3 kg−1 is commonly used for cξ. Using this value, the snow thermal metamorphism was found to be more realistic (Fig. 1). We therefore revised cξ to 0.046 m3 kg−1 in the final simulations.
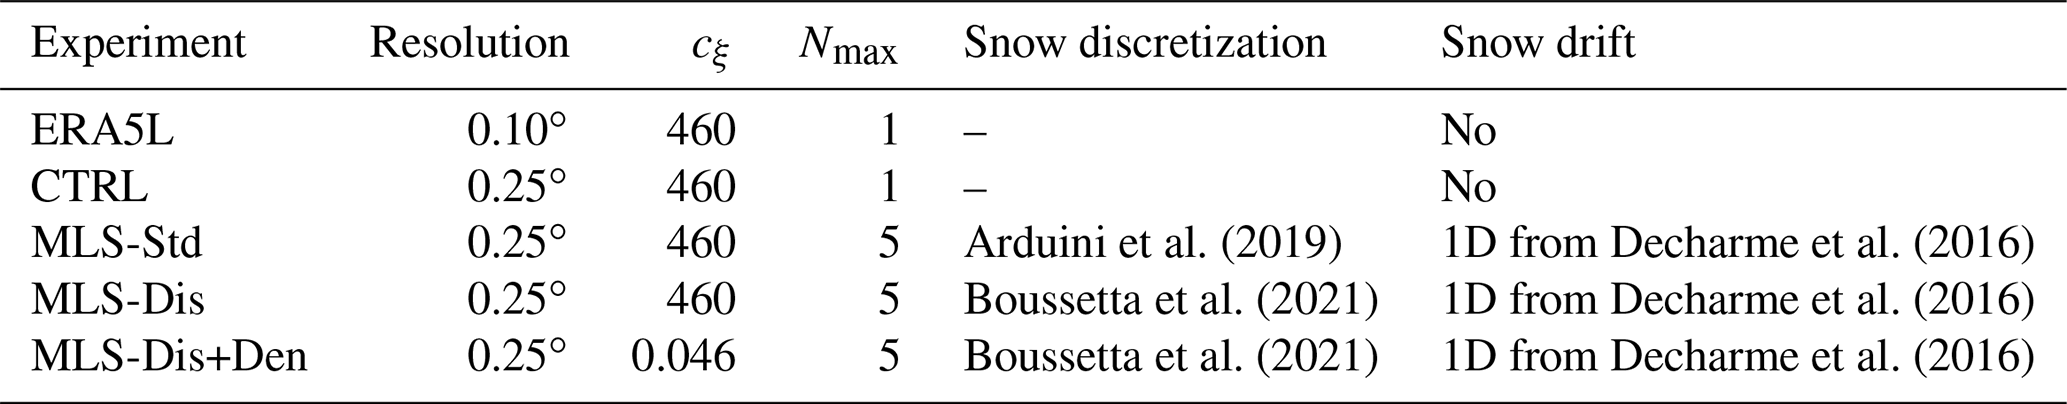
While conducting a like-to-like evaluation facilitates comparison, running sensitivity experiments at ERA5L resolution is computationally costly, and the data volume requirements are heavy. For this reason, experiments were performed using the same octahedral reduced Gaussian grid as ERA5L, but with a lower horizontal spatial resolution (∼ 28 km). All model results were then interpolated to a regular grid at a resolution of 0.25∘ based on the same interpolation method used for ERA5L. A control experiment using the same setup as ERA5L was used to assess the influence of the coarser resolution on simulated soil temperatures. Three simulation experiments with five-layer snow schemes were completed to investigate the effect of different snow schemes and parameterizations in the HTESSEL (Table 1). A simulation with MLS as described in Arduini et al. (2019) was also performed to identify if cξ of 460 kg m−3 is problematic in soil temperature simulations, regardless of the snow scheme. Two simulations with revised parameters, as described in Sect. 2.3, tested the capacity of optimized snow discretization and densification, respectively. All the experiments were conducted offline (Table 1).
-
The control simulation (Exp. CTRL) used the standard HTESSEL with bulk snow scheme and was conducted at a spatial resolution of 0.25∘.
-
The standard MLS simulation (Exp. MLS-Std) was the same as Exp. CTRL but implemented the five-layer snow scheme to HTESSEL.
-
The optimized MLS simulation (Exp. MLS-Dis) was the same as Exp. MLS-Std but used a variable snow discretization for complex terrain.
-
The optimized MLS simulation (Exp. MLS-Dis+Den) was the same as Exp. MLS-Std but revised cξ as 0.046 for snow compaction due to thermal (destructive) metamorphism.
The offline simulation experiments in this study were all initialized from ERA5 on 1 January 1979, and the period 1979–2000 was used to spin up before simulation and analyses were conducted.
Arduini et al. (2019)Decharme et al. (2016)Boussetta et al. (2021)Decharme et al. (2016)Boussetta et al. (2021)Decharme et al. (2016)Table 1Simulation schemes including their configurations, spatial resolution, snow destructive metamorphism parameterizations (cξ) in Eq. (6), maximum number of snow layers (Nmax), vertical snow discretization, and snow drift.
The numerical experiments were evaluated by comparing the snow depth and soil temperature with a large number of observations and ERA5L. To streamline the comparison with previous work, we used the same soil temperature observations dataset as Cao et al. (2020). The observed soil temperatures are from various sources around the world and 639 stations in permafrost regions representing the period of 2001–2018 (see Fig. B1 from Cao et al., 2020). The dataset represents a wide range of soil temperatures, elevations, and land uses. The snow performance was evaluated via snow depth at 173 sites where observations are available. We used bias (∘C) to evaluate the reproduced soil temperature at a grid scale. The surface offset (SO) in winter, as the difference between near-surface air temperature (Ta) and ground surface temperature (the soil temperature at the first layer of ERA5L), describes the land–atmosphere energy exchange through the present snow layer. It is therefore also selected here for evaluation of snow insulation effect on soil thermal regime. In the case where multiple sites were located in the same ERA5L grid cell, bias was calculated for each site and then aggregated by averaging all stations in each grid cell with equal weight. Active layer thickness was not re-evaluated here as it was minimally affected by the revised snow scheme. Evaluation was conducted separately for different geographic regions because the atmospheric component of ERA5, used as HTESSEL forcing, has variable performance for high and mid-latitudes. In addition, sites in complex terrain were used to test the suitability of optimized snow discretization.
Regions with the presence of near-surface permafrost were diagnosed based on the mean annual ground temperature of the fourth soil layer of reproduced reanalyses, i.e., where soil temperature is less than 0 ∘C for two consecutive years, and compared to the Circum-Arctic Map of Permafrost and Ground-Ice Conditions (hereafter referred to as the IPA map, Brown et al., 2002). Given the coarse spatial resolution of the reanalysis (i.e., 0.25∘) and shallow soil profile, the global land surface model like HTESSEL could only reasonably represent the presence of continuous (90 %–100 % coverage) and discontinuous (50 %–90 % coverage) permafrost zones (Lawrence et al., 2008; Zhang et al., 2000). We hence apply a threshold of 50 % for the permafrost zonations in the IPA map to allow for meaningful comparison with the simulated maps.
5.1 Soil temperature
Snow depth is generally improved at most observed sites (Fig. 2a and b), and the overestimation in ERA5L was reduced from 0.19 m to 0.08–0.11 m in the MLS (Fig. 2c). However, there is little improvement (i.e, 0.03 m) over the Tibetan Plateau. Orsolini et al. (2019) revealed that excessive winter precipitation in ERA5(-Land) might be an additional uncertainty for the overestimation of snow depth over the Tibetan Plateau.
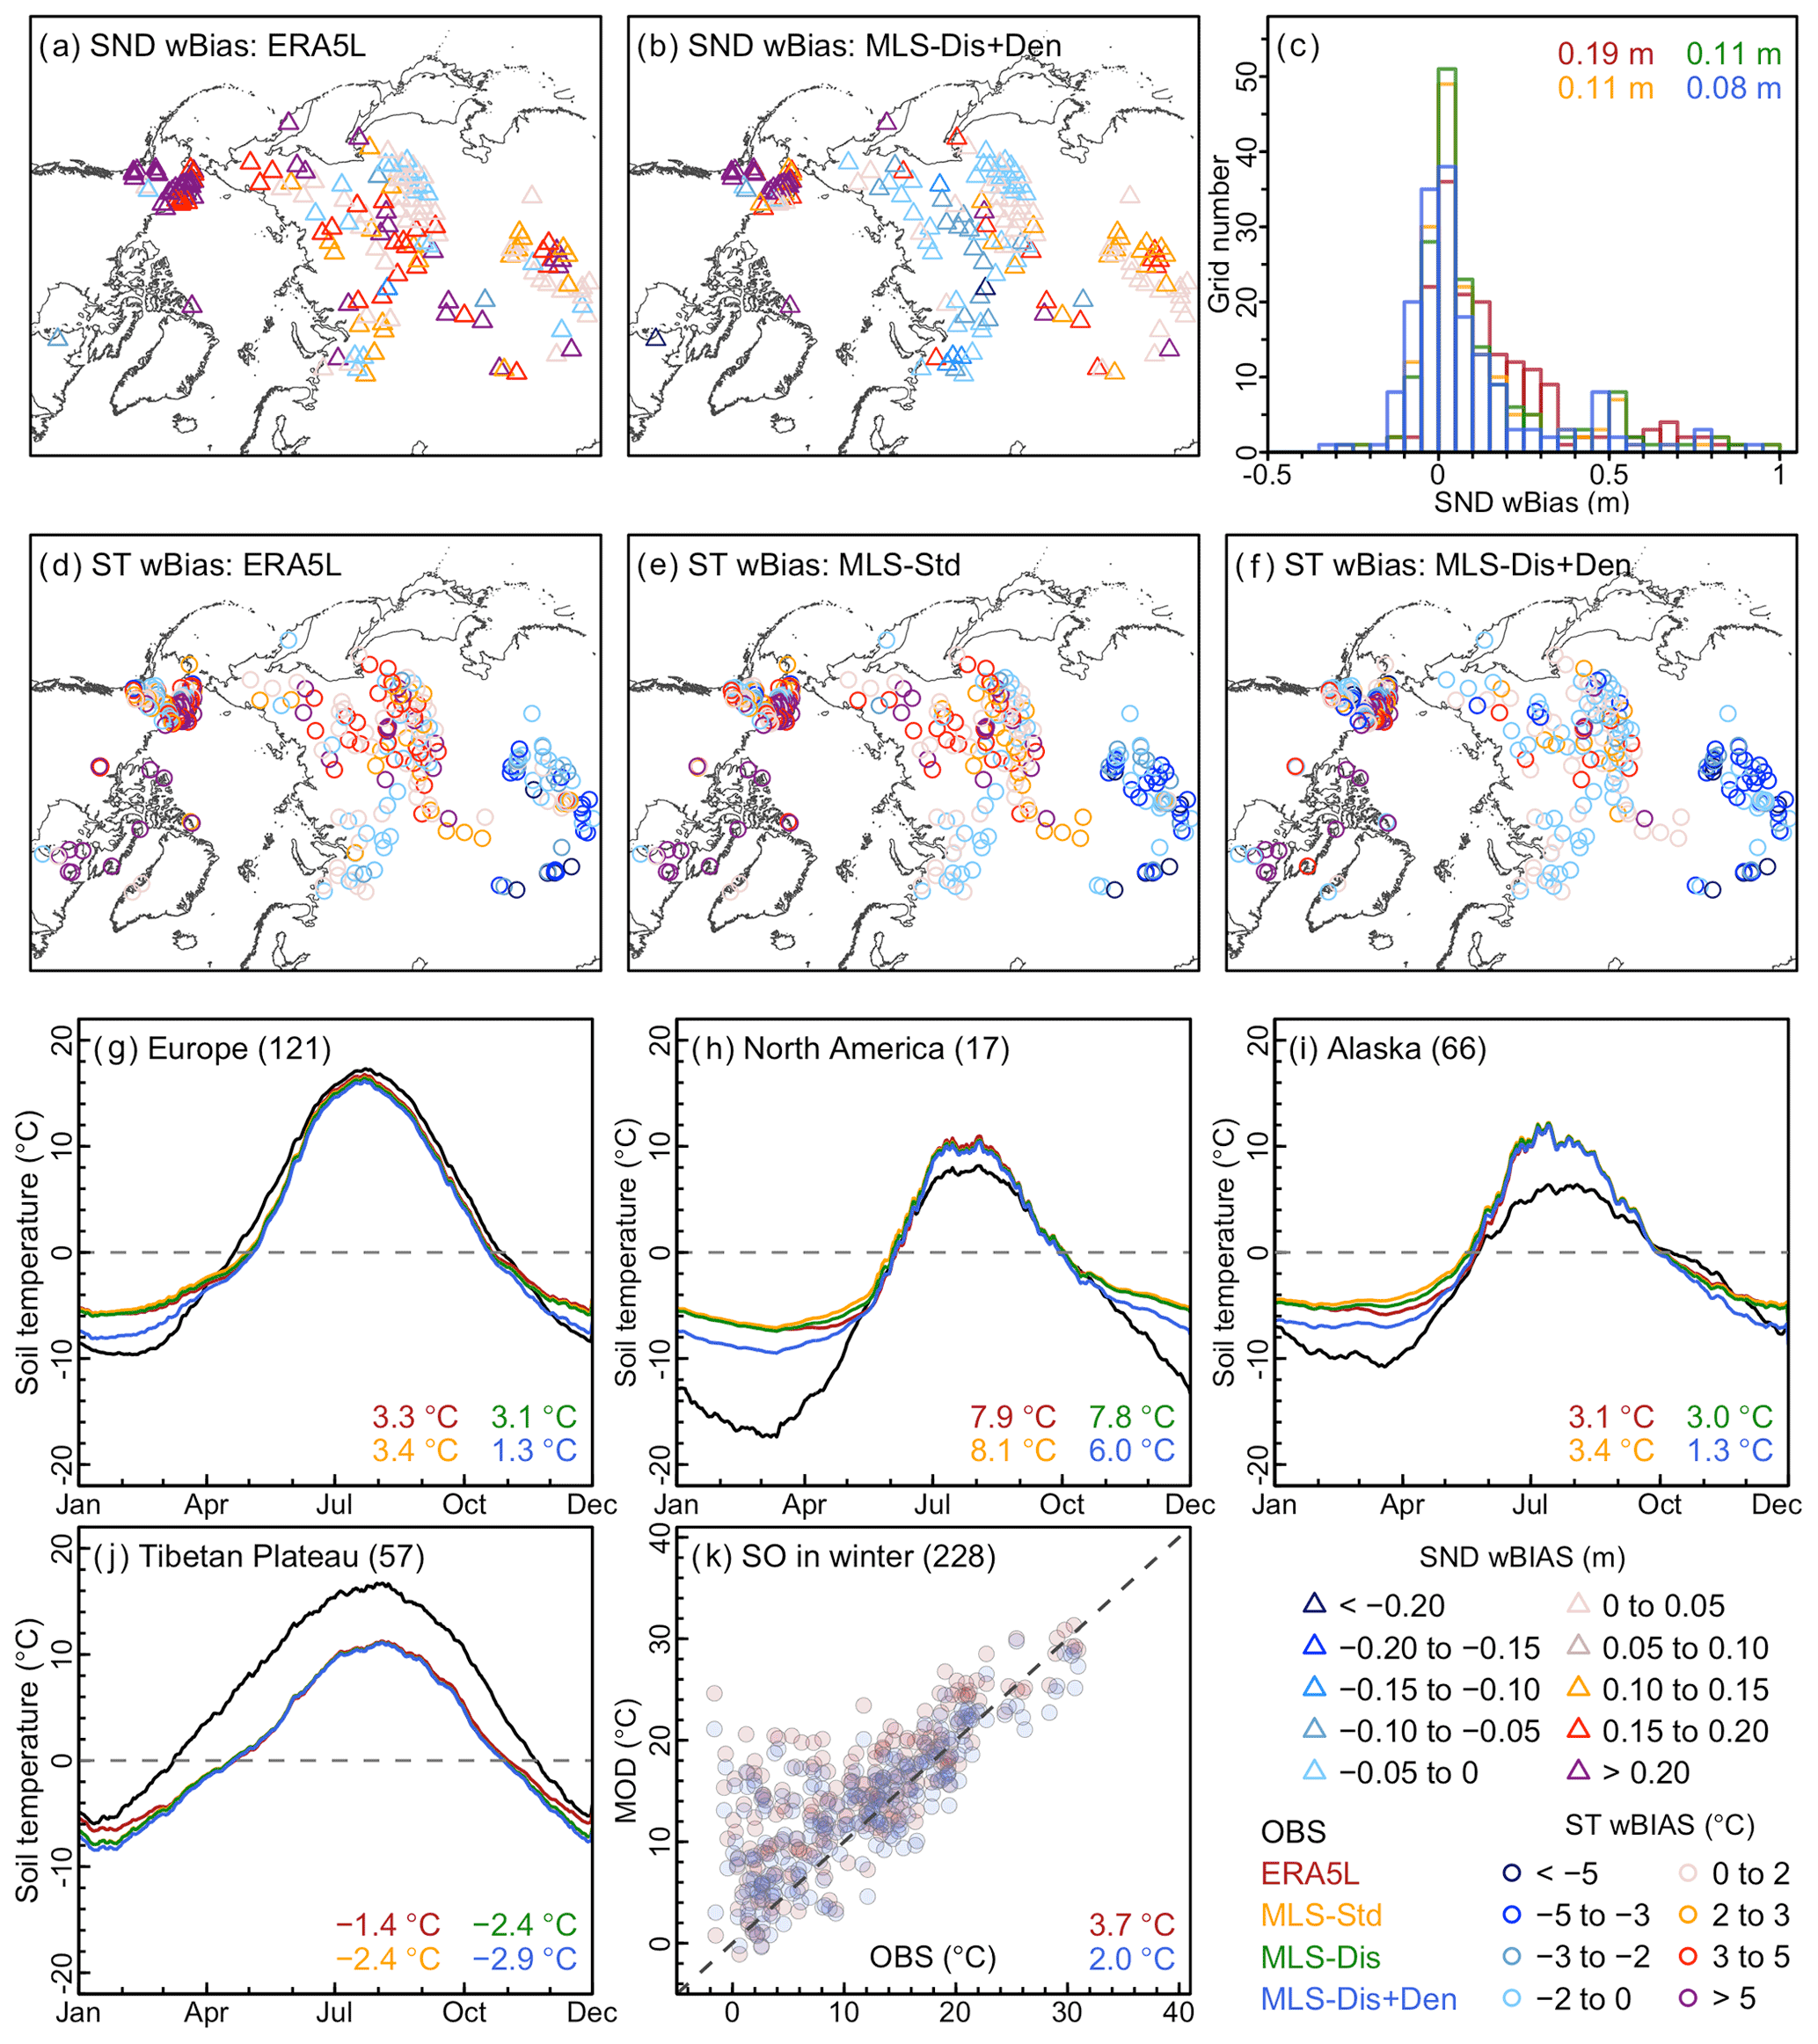
Figure 2Evaluation of simulated snow depth and soil temperatures during 2001–2018. Weighted bias (wBias) of daily snow depth (SND) for ERA5-Land (ERA5L, a) and Exp. MLS-Dis+Den (b). The distribution of SND wBias for ERA5L and each simulation experiment (c). wBias of soil temperature (ST) for 0.07–0.28 m depth for ERA5L (d), Exp. MLS-Std (e), and Exp. MLS-Dis+Den (f). Soil temperature for 0.07–0.28 m depth in different permafrost regions (g–k), and winter (DJF) surface offset (SO, k). The number of unique grid cells where observed sites are located is given in the bracket. Color numbers are estimated snow depth and soil temperature bias in winter for observation (OBS) and each simulation experiment. Time series of specific sites are available in the Supplement.
Soil temperatures in Exp. CTRL were generally close to those in ERA5L (Table 2), indicating that the experiment at a coarse resolution (i.e., 0.25∘) is comparable to the ERA5L with a higher spatial resolution of 0.1∘. Experiment MLS-Std produced slightly warmer temperatures than Exp. CTRL because of the increased thermal decoupling between the atmosphere–snow–soil interfaces (Dutra et al., 2012). The remaining strong warm bias in Exp. MLS-Std demonstrates that the 460 m3 kg−1 snow thermal metamorphism parameter is not reasonable although snow depth is improved (Fig. 2c and e). The soil temperature warm bias is reduced with the revised snow discretization algorithm, indicating that simulation of soil temperature in complex terrain benefits from the relatively high vertical resolution of the snow layer (Table 2). A MLS with variable vertical discretization had a minimal influence on simulated soil temperatures over the Tibetan Plateau. This is because the new snow discretization for complex terrain is only applied where hsn is ⩾0.25 m, while snow over the Tibetan Plateau is typically very thin (Cao et al., 2019b). The Exp. MLS-Dis+Den with cξ=0.046 m3 kg−1 performed best among the simulations (Fig. 2g–i). Comparing to ERA5L, the Exp. MLS-Dis+Den reduced winter wBias of aggregated daily soil temperature and surface offset by about 0.6–3.0 ∘C (Fig. 2g–j) and 1.7 ∘C (Fig. 2k) at the observed sites in high-latitude permafrost regions (Table 2). On the Tibetan Plateau, the soil temperature in Exp. MLS-Dis+Den is found to perform worse than ERA5L. This is because near-surface air temperature is significantly underestimated by about ∘C over the Tibetan Plateau, which could account for the cold bias of soil temperature, i.e., from −3.3 to −2.7 ∘C (Table 2). While the new MLS reduced overestimated snow depth (Fig. 2b), it suppressed snow insulation and hence enhanced soil temperature cold bias.
Table 2The wBias of near-surface air temperature (Ta, ∘C), soil temperature (Ts, ∘C) for four layers in DJF at a grid scale, and permafrost area (PA, 106 km2) estimated from the mean annual ground temperature of the fourth soil layer (1.89 m).
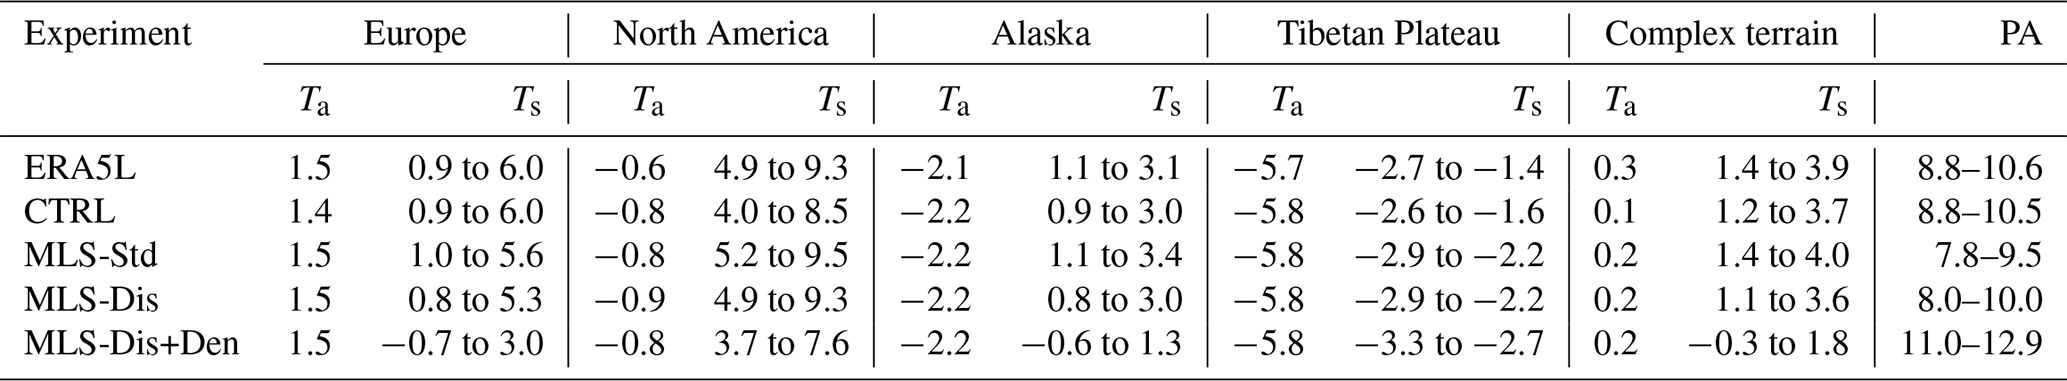
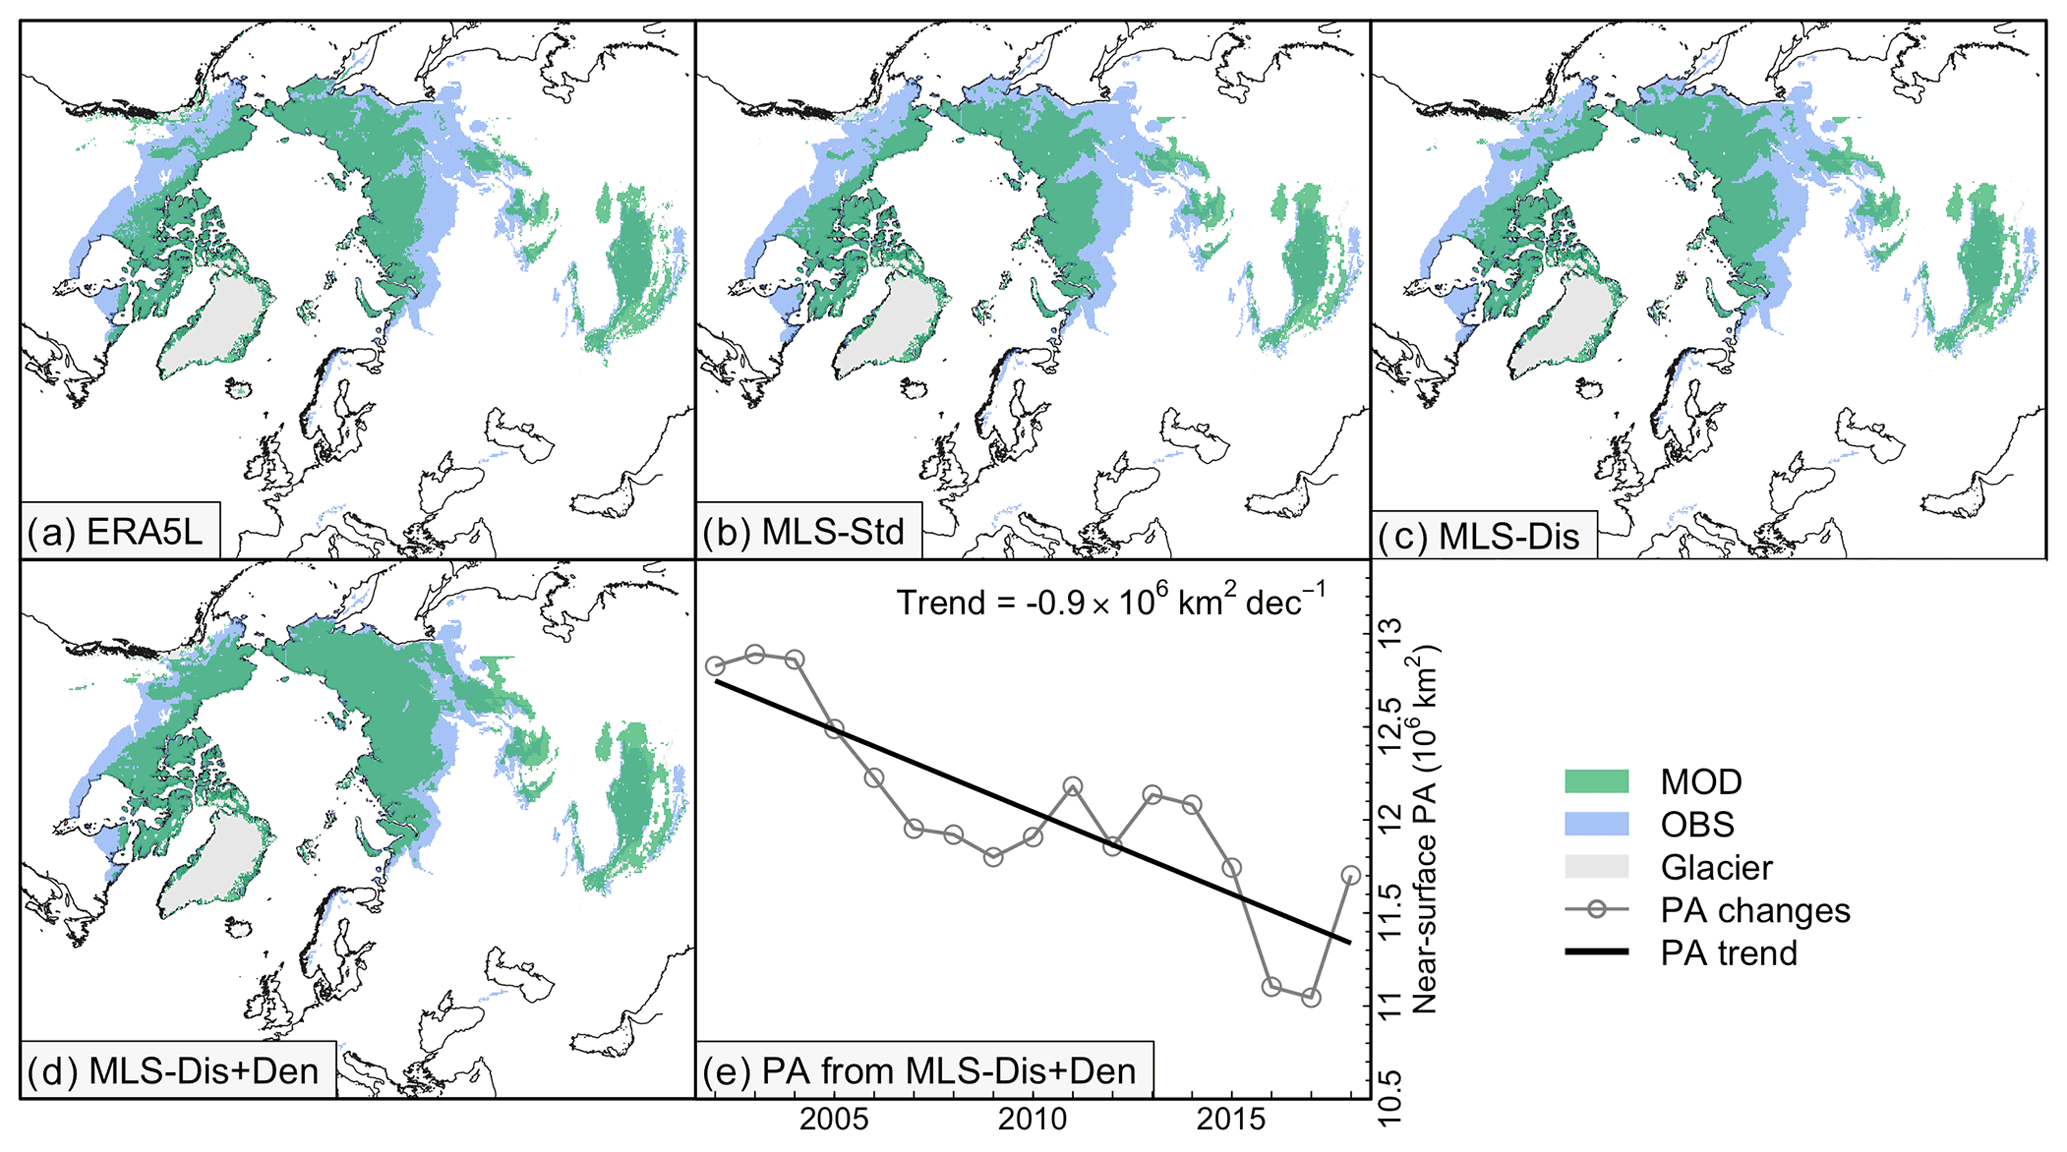
Figure 3Observed estimates for continuous and discontinuous permafrost area (PA) from the IPA map (OBS) and near-surface permafrost area derived from HTESSEL with different model schemes (MOD) in 2001–2002. The near-surface permafrost area trend (E) is derived from the Exp. MLS-Dis+Den during 2001–2018.
Summer soil temperatures in all experiments are similar since the revised snow scheme mainly affects winter temperatures. In North America and Alaska, soil temperatures generally have a significant warm bias year-round (Fig. 2h and i). This is thought to be related to a lack of vertical variation in soil texture within the soil column in HTESSEL, which does not allow a more sophisticated treatment of soil organic matter and its impact on soil thermal properties (Park, 2018).
5.2 Near-surface permafrost extent
Experiment MLS-Std underestimated near-surface permafrost extent compared to the extent of continuous and discontinuous permafrost area on the IPA map (11.8–14.6×10⁶ km2, Brown et al., 2002), due to the overestimated soil temperature (Fig. 3). The estimated global near-surface permafrost area increases from 8.8–10.0×10⁶ km2 in ERA5L to 11.0–12.9×10⁶ km2 in the Exp. MLS-Dis+Den scheme during 2001–2018, with the increase primarily represented along the southern fringes of permafrost in eastern Siberia and Canada. This is more reasonable when comparing to the observed distribution on the IPA map. Besides model uncertainties, such as the shallow soil profile, the smaller simulated permafrost area compared to the IPA map could be traced to the different periods represented, i.e., a few decades prior to 1990 for the IPA map and 2001–2018 for ERA5L and the simulation experiments. Furthermore, because permafrost is a hidden phenomenon, its extent is fundamentally difficult to observe and validate. The improved soil temperature in Exp. MLS-Dis+Den indicated that near-surface permafrost area decreased at a rate of 0.9×10⁶ km2 per decade, corresponding to a loss of 1.41×10⁶ km2 since 2002. This is similar to previous land surface model simulations, i.e., 0.9–1.1×10⁶ km2 per decade from 1990–2040 in Lawrence et al. (2008).
We identified that a bias toward lower snow density arising from an unreasonable thermal (destructive) metamorphism parameterization in snow densification routines is one of the main sources for a warm bias in ERA5L soil temperature in permafrost regions, particularly in high-latitude areas. We implemented and evaluated a recently developed MLS for ECLand, with revised/optimized parameters for snow thermal metamorphism. Using an optimized version of the multi-layer snow scheme in HTESSEL significantly improved winter daily soil temperature simulation in high-latitude permafrost regions by about 0.6–3.0 ∘C and produced a better representation of permafrost extent. Since most current reanalyses use the single-layer snow scheme, we suggest that a better-resolved snow scheme with a multi-layer snow profile should be included in next-generation reanalysis as a first step towards improving representation of permafrost conditions.
The numerical experiments were conducted offline with no coupling of the land surface to the atmospheric fields. Therefore, the influence of the revised snow scheme on the atmosphere is not considered, and further online simulations that include coupling with atmospheric processes are suggested for future study.
Temperature observations were made available by the authors of Cao et al. (2020). The improved soil temperature along with snow depth at specific sites in numerical experiment MLS-Dis+Den is produced at a daily resolution and is publicly available via Zenodo (https://doi.org/10.5281/zenodo.6008390; Cao et al., 2022).
The supplement related to this article is available online at: https://doi.org/10.5194/tc-16-2701-2022-supplement.
BC proposed the initial idea and carried out this study by designing simulation experiments, analyzing data, organizing, and writing the paper and was responsible for the compilation and quality control of the observations. GA developed and implemented the multi-layer snow scheme in HTESSEL, conducted the experiment, and reproduced reanalysis. All authors contributed to the writing of the paper.
The contact author has declared that none of the authors has any competing interests.
Publisher's note: Copernicus Publications remains neutral with regard to jurisdictional claims in published maps and institutional affiliations.
The authors thank Stephan Gruber and Baohong Ding for the helpful discussion and comments. ERA5-Land reanalysis data are provided by the ECMWF.
This research has been supported by the National Natural Science Foundation of China (grant nos. 41988101 and 42101134).
This paper was edited by Chris Derksen and reviewed by two anonymous referees.
Anderson, E. A.: A point energy and mass balance model of a snow cover, U.S. Department of Commerce, National Oceanic and Atmospheric Administration, National Weather Service, Office of Hydrology, 1976. a, b, c
Arduini, G., Balsamo, G., Dutra, E., Day, J. J., Sandu, I., Boussetta, S., and Haiden, T.: Impact of a Multi-Layer Snow Scheme on Near-Surface Weather Forecasts, J. Adv. Model. Earth Sy., 11, 4687–4710, https://doi.org/10.1029/2019MS001725, 2019. a, b, c, d, e, f, g
Biskaborn, B. K., Smith, S. L., Noetzli, J., Matthes, H., Vieira, G., Streletskiy, D. A., Schoeneich, P., Romanovsky, V. E., Lewkowicz, A. G., Abramov, A., Allard, M., Boike, J., Cable, W. L., Christiansen, H. H., Delaloye, R., Diekmann, B., Drozdov, D., Etzelmüller, B., Grosse, G., Guglielmin, M., Ingeman-Nielsen, T., Isaksen, K., Ishikawa, M., Johansson, M., Johannsson, H., Joo, A., Kaverin, D., Kholodov, A., Konstantinov, P., Kröger, T., Lambiel, C., Lanckman, J. P., Luo, D., Malkova, G., Meiklejohn, I., Moskalenko, N., Oliva, M., Phillips, M., Ramos, M., Sannel, A. B. K., Sergeev, D., Seybold, C., Skryabin, P., Vasiliev, A., Wu, Q., Yoshikawa, K., Zheleznyak, M., and Lantuit, H.: Permafrost is warming at a global scale, Nat. Commun., 10, 1–11, https://doi.org/10.1038/s41467-018-08240-4, 2019. a
Boussetta, S., Balsamo, G., Arduini, G., Dutra, E., McNorton, J., Choulga, M., Agustí-Panareda, A., Beljaars, A., Wedi, N., Munõz-Sabater, J., de Rosnay, P., Sandu, I., Hadade, I., Carver, G., Mazzetti, C., Prudhomme, C., Yamazaki, D., and Zsoter, E.: ECLand: The ECMWF Land Surface Modelling System, Atmosphere, 12, 723, https://doi.org/10.3390/atmos12060723, 2021. a, b, c, d
Brown, J., Ferrians, O., Heginbottom, J. A., and Melnikov, E.: Circum-Arctic Map of Permafrost and Ground-Ice Conditions, Version 2, NSIDC: National Snow and Ice Data Center [data set], Boulder, Colorado, USA, https://doi.org/10.7265/skbg-kf16, 2002. a, b
Calonne, N., Flin, F., Morin, S., Lesaffre, B., Du Roscoat, S. R., and Geindreau, C.: Numerical and experimental investigations of the effective thermal conductivity of snow, Geophys. Res. Lett., 38, 1–6, https://doi.org/10.1029/2011GL049234, 2011. a
Cao, B., Zhang, T., Peng, X., Mu, C., Wang, Q., Zheng, L., Wang, K., and Zhong, X.: Thermal Characteristics and Recent Changes of Permafrost in the Upper Reaches of the Heihe River Basin, Western China, J. Geophys. Res.-Atmos., 123, 7935–7949, https://doi.org/10.1029/2018JD028442, 2018. a
Cao, B., Quan, X., Brown, N., Stewart-Jones, E., and Gruber, S.: GlobSim (v1.0): deriving meteorological time series for point locations from multiple global reanalyses, Geosci. Model Dev., 12, 4661–4679, https://doi.org/10.5194/gmd-12-4661-2019, 2019a. a
Cao, B., Zhang, T., Wu, Q., Sheng, Y., Zhao, L., and Zou, D.: Permafrost zonation index map and statistics over the Qinghai-Tibet Plateau based on field evidence, Permafrost Periglac., 30, 178–194, https://doi.org/10.1002/ppp.2006, 2019b. a
Cao, B., Gruber, S., Zheng, D., and Li, X.: The ERA5-Land soil temperature bias in permafrost regions, The Cryosphere, 14, 2581–2595, https://doi.org/10.5194/tc-14-2581-2020, 2020. a, b, c, d, e
Cao, B., Arduini, G., and Zsoter, E.: Improving ERA5-Land soil temperature in permafrost regions (v1.0), Zenodo [data set], https://doi.org/10.5281/zenodo.6008390, 2022. a
Decharme, B., Brun, E., Boone, A., Delire, C., Le Moigne, P., and Morin, S.: Impacts of snow and organic soils parameterization on northern Eurasian soil temperature profiles simulated by the ISBA land surface model, The Cryosphere, 10, 853–877, https://doi.org/10.5194/tc-10-853-2016, 2016. a, b, c, d
Domine, F., Picard, G., Morin, S., Barrere, M., Madore, J.-B., and Langlois, A.: Major Issues in Simulating Some Arctic Snowpack Properties Using Current Detailed Snow Physics Models: Consequences for the Thermal Regime and Water Budget of Permafrost, J. Adv. Model. Earth Sy., 11, 34–44, https://doi.org/10.1029/2018MS001445, 2019. a
Dutra, E., Balsamo, G., Viterbo, P., Miranda, P. M. A., Beljaars, A., Schär, C., and Elder, K.: Description and Offline Validation, European Centre for Medium-Range Weather Forecast, https://doi.org/0.21957/98x9mrv1y, 2009. a
Dutra, E., Balsamo, G., Viterbo, P., Miranda, P. M. A., Beljaars, A., Schär, C., and Elder, K.: An Improved Snow Scheme for the ECMWF Land Surface Model: Description and Offline Validation, J. Hydrometeorol., 11, 899–916, https://doi.org/10.1175/2010JHM1249.1, 2010. a, b
Dutra, E., Viterbo, P., Miranda, P. M. A., and Balsamo, G.: Complexity of Snow Schemes in a Climate Model and Its Impact on Surface Energy and Hydrology, J. Hydrometeorol., 13, 521–538, https://doi.org/10.1175/JHM-D-11-072.1, 2012. a, b, c
Hersbach, H., Bell, B., Berrisford, P., Hirahara, S., Horányi, A., Muñoz-Sabater, J., Nicolas, J., Peubey, C., Radu, R., Schepers, D., Simmons, A., Soci, C., Abdalla, S., Abellan, X., Balsamo, G., Bechtold, P., Biavati, G., Bidlot, J., Bonavita, M., Chiara, G., Dahlgren, P., Dee, D., Diamantakis, M., Dragani, R., Flemming, J., Forbes, R., Fuentes, M., Geer, A., Haimberger, L., Healy, S., Hogan, R. J., Hólm, E., Janisková, M., Keeley, S., Laloyaux, P., Lopez, P., Lupu, C., Radnoti, G., Rosnay, P., Rozum, I., Vamborg, F., Villaume, S., and Thépaut, J.-N.: The ERA5 global reanalysis, Q. J. Roy. Meteor. Soc., 146, 1999–2049, https://doi.org/10.1002/qj.3803, 2020. a, b
Jordan, R.: A One-Dimensional Temperature Model for a Snow Cover: Technical Documentation for SNTHERM.89, U. S. Army Corps of Engineers, Cold Regions Research & Engineering Laboratory, 49, 1991. a
Jordan, R. E., Andreas, E. L., and Makshtas, A. P.: Heat budget of snow-covered sea ice at North Pole 4, J. Geophys. Res.-Oceans, 104, 7785–7806, https://doi.org/10.1029/1999JC900011, 1999. a
Lawrence, D. M., Slater, A. G., Romanovsky, V. E., and Nicolsky, D. J.: Sensitivity of a model projection of near-surface permafrost degradation to soil column depth and representation of soil organic matter, J. Geophys. Res., 113, F02011, https://doi.org/10.1029/2007JF000883, 2008. a, b
Melton, J. R., Verseghy, D. L., Sospedra-Alfonso, R., and Gruber, S.: Improving permafrost physics in the coupled Canadian Land Surface Scheme (v.3.6.2) and Canadian Terrestrial Ecosystem Model (v.2.1) (CLASS-CTEM), Geosci. Model Dev., 12, 4443–4467, https://doi.org/10.5194/gmd-12-4443-2019, 2019.
Muñoz-Sabater, J., Dutra, E., Agustí-Panareda, A., Albergel, C., Arduini, G., Balsamo, G., Boussetta, S., Choulga, M., Harrigan, S., Hersbach, H., Martens, B., Miralles, D. G., Piles, M., Rodríguez-Fernández, N. J., Zsoter, E., Buontempo, C., and Thépaut, J.-N.: ERA5-Land: a state-of-the-art global reanalysis dataset for land applications, Earth Syst. Sci. Data, 13, 4349–4383, https://doi.org/10.5194/essd-13-4349-2021, 2021. a
Orsolini, Y., Wegmann, M., Dutra, E., Liu, B., Balsamo, G., Yang, K., de Rosnay, P., Zhu, C., Wang, W., Senan, R., and Arduini, G.: Evaluation of snow depth and snow cover over the Tibetan Plateau in global reanalyses using in situ and satellite remote sensing observations, The Cryosphere, 13, 2221–2239, https://doi.org/10.5194/tc-13-2221-2019, 2019. a
Park, S.: IFS doc-Physical processes, European Centre for Medium-Range Weather Forecasts, 1–223, https://doi.org/10.21957/4whwo8jw0, 2018. a
Sun, S., Jin, J., and Xue, Y.: A simple snow-atmosphere-soil transfer model, J. Geophys. Res.-Atmos., 104, 19587–19597, https://doi.org/10.1029/1999JD900305, 1999. a, b
van Kampenhout, L., Lenaerts, J. T. M., Lipscomb, W. H., Sacks, W. J., Lawrence, D. M., Slater, A. G., and van den Broeke, M. R.: Improving the Representation of Polar Snow and Firn in the Community Earth System Model, J. Adv. Model. Earth Sy., 9, 2583–2600, https://doi.org/10.1002/2017MS000988, 2017. a
Walter Anthony, K., Schneider von Deimling, T., Nitze, I., Frolking, S., Emond, A., Daanen, R., Anthony, P., Lindgren, P., Jones, B., and Grosse, G.: 21St-Century Modeled Permafrost Carbon Emissions Accelerated By Abrupt Thaw Beneath Lakes, Nat. Commun., 9, https://doi.org/10.1038/s41467-018-05738-9, 2018. a
Westermann, S., Langer, M., Boike, J., Heikenfeld, M., Peter, M., Etzelmüller, B., and Krinner, G.: Simulating the thermal regime and thaw processes of ice-rich permafrost ground with the land-surface model CryoGrid 3, Geosci. Model Dev., 9, 523–546, https://doi.org/10.5194/gmd-9-523-2016, 2016. a
Yang, Z. L. and Niu, G. Y.: The versatile integrator of surface and atmosphere processes part 1. Model description, Global Planet. Change, 38, 175–189, https://doi.org/10.1016/S0921-8181(03)00028-6, 2003. a
Zhang, T.: Influence of the seasonal snow cover on the ground thermal regime: An overview, Rev. Geophys., 43, RG4002, https://doi.org/10.1029/2004RG000157, 2005. a
Zhang, T., Heginbottom, J. A., Barry, R. G., and Brown, J.: Further statistics on the distribution of permafrost and ground ice in the Northern Hemisphere 1, Polar Geography, 24, 126–131, https://doi.org/10.1080/10889370009377692, 2000. a