the Creative Commons Attribution 4.0 License.
the Creative Commons Attribution 4.0 License.
 | 06 Dec 2021
Multi-decadal (1953–2017) rock glacier kinematics analysed by high-resolution topographic data in the upper Kaunertal, Austria
Florian Haas
Livia Piermattei
Madlene Pfeiffer
Tobias Heckmann
Moritz Altmann
Jakob Rom
Manuel Stark
Michael H. Wimmer
Norbert Pfeifer
Michael Becht
Permafrost is being degraded worldwide due to the change in external forcing caused by climate change. This has also been shown to affect the morphodynamics of active rock glaciers. We studied these changes, depending on the analysis, on nine or eight active rock glaciers, respectively, with different characteristics in multiple epochs between 1953 and 2017 in Kaunertal, Austria. A combination of historical aerial photographs and airborne laser scanning data and their derivatives were used to analyse surface movement and surface elevation change. In general, the studied landforms showed a significant acceleration of varying magnitude in the epoch 1997–2006 and a volume loss to variable degrees throughout the investigation period. Rock glaciers related to glacier forefields showed significantly higher rates of subsidence than talus-connected ones. Besides, we detected two rock glaciers with deviating behaviour and one that showed an inactivation of its terminal part. By analysing meteorological data (temperature, precipitation and snow cover onset and duration), we were able to identify possible links to these external forcing parameters. The catchment-wide survey further revealed that, despite the general trend, timing, magnitude and temporal peaks of morphodynamic changes indicate a slightly different sensitivity, response or response time of individual rock glaciers to fluctuations and changes in external forcing parameters.
- Article
(25829 KB) - Full-text XML
-
Supplement
(671 KB) - BibTeX
- EndNote


Rock glaciers are a downslope creep phenomenon of mountain permafrost and are responsible for extensive mass transport in alpine environments (Barsch, 1996). As it has been shown that rock glacier kinematics are affected by changing external forcing factors, the aim of this study was to investigate how rock glaciers in the same catchment react to these changes on a multi-decadal timescale. Active rock glaciers consist of a generally coarse debris layer (active layer), covering ice supersaturated debris and forming lobate or tongue-shaped landforms (Haeberli et al., 2006). They can be found in most cold mountain regions of the earth (Jones et al., 2019). Although permafrost is the primary condition for rock glaciers to form, the deforming ice and debris may be of both glacial and periglacial origin (Berthling, 2011). Borehole cores and inclinometer measurements from different rock glaciers reveal the internal structure and deformation of these landforms (Arenson et al., 2002; Krainer et al., 2015; Buchli et al., 2018). They suggest rock glaciers to be similarly composed of such layers, although structure, composition and thickness of these layers differ to a certain extent also within individual rock glaciers. The few-metres-thick topmost active layer consists of unconsolidated debris and isolates the underlying ice-rich frozen body. The ice-rich permafrost body constitutes the main layer of the rock glacier, with a smaller proportion of coarser debris per volume than the active layer and volumetric ice contents between 40 %–90 % (Arenson et al., 2002; Haeberli et al., 2006; Hausmann et al., 2012). The thermal regime of the permafrost layer is mainly controlled by heat conduction; therefore the temperature signal from the surface is linearly delayed, and its amplitude exponentially decreases with depth (Haeberli et al., 2006). As a result, changes in temperature of the permafrost body below the depth of zero amplitude require long-term changes in the thermal forcing. In the permafrost layer, internal plastic deformation is the main component of deformation, which is governed by temperature and the structure of the debris–ice mixture. A large part of the horizontal deformation (50 %–97 %) takes place in one or more shear zones at the base of the ice-rich permafrost body, which are maximally a few metres thick (Arenson et al., 2002). The dynamics of rock glaciers vary at different temporal scales: decadal, inter-annual and intra-annual (Delaloye et al., 2008, 2010; Wirz et al., 2016; Kenner et al., 2017). Studies investigating the decadal-scale variability in rock glacier morphodynamics in the European Alps reveal a significant increase in flow velocities starting in the 1990s, while some studies also report phases of stable flow velocities and velocity decrease since then (Roer, 2005; Kellerer-Pirklbauer and Kaufmann, 2012; Scapozza et al., 2014; Hartl et al., 2016; Kellerer-Pirklbauer and Kaufmann, 2018; Kenner et al., 2020; Marcer et al., 2021). The increase in flow velocities has been explained by rising mean annual air and ground temperatures and mechanisms of heat conduction and meltwater advection (Roer, 2005; Kääb et al., 2007; Ikeda et al., 2008; Delaloye et al., 2010). More recent studies highlighted the role of liquid water, especially in the shear horizon, and attribute little or no significance to the change in permafrost temperature to explain the deformation variations on a multi-annual, inter-annual, seasonal and short-term scale (Wirz et al., 2016; Kenner et al., 2017; Buchli et al., 2018; Cicoira et al., 2019). Kenner et al. (2020) synthesise these findings by showing that water availability in the rock glacier is governed by ground temperature, which is a function of mean annual air temperature and onset as well as duration of snow cover and thus correlates with rock glacier deformation as well. Besides, rock glacier dynamics can also be influenced by other factors like topography, temporal and vertical variations in ice content, rheology of the ice–debris mixture, thickness, and input of ice and debris to the system. Although rock glaciers normally move at rates ranging from a few centimetres per year to a few metres per year, some studies show a destabilisation of rock glaciers, which results in a landslide-like movement with displacement rates of up to several tens of metres per year (Roer et al., 2008; Scotti et al., 2017; Vivero and Lambiel, 2019; Marcer et al., 2021).
The present and former response of rock glacier morphodynamics to atmospheric warming and climate change observed in many high mountain regions (Hock et al., 2019) is of large scientific interest for climate change projections and landscape evolution models. But an understanding of these landforms has also implications for natural hazard protection (Schoeneich et al., 2015), future water availability (Jones et al., 2019) or sediment connectivity (Kummert and Delaloye, 2018). Although there are several studies on rock glacier kinematics covering different timescales, the number of studies is low compared to ice glaciers. Apart from Roer et al. (2005), who investigated multi-decadal catchment-wide rock glacier kinematics in the Turtmann valley, Swiss Alps, most studies on a decadal timescale investigate just one or two large and prominent rock glaciers (e.g. Scapozza et al., 2014; Scotti et al., 2017; Kellerer-Pirklbauer et al., 2018; Kellerer-Pirklbauer and Kaufmann, 2018; Kaufmann et al., 2019; Kenner et al., 2020).
Therefore, we focus on the long-term (1953–2017) kinematic investigations of rock glaciers, located in the upper Kaunertal, Ötztal Alps, Austria, displaying different characteristics. By doing so we want to understand their reaction to climate change under similar climatic forcing. We do this by analysing surface movement (flow velocity) of eight rock glaciers by means of image correlation techniques on the basis of orthoimages and hillshades. In addition, multitemporal surface elevation changes are derived for one additional rock glacier (nine) by a digital elevation model (DEM) of difference (DoD) analysis using photogrammetric as well as airborne laser scanning (ALS) data. The identified changes in rock glacier kinematics are discussed with regard to rock glacier characteristics and changes in the meteorological forcing by investigating different climate parameters (temperature, precipitation and snow cover) recorded directly in the catchment and nearby meteorological stations.
The investigated rock glaciers are located in the catchment area of the upper Kaunertal within the Ötztal Alps, Austria (Fig. 1). The study area is more precisely defined as the hydrologically contributing area at the inlet of the Fagge river into the Gepatsch reservoir. It has an area of ∼ 62 km2 and a relief of 1773 m, ranging from 1810 m at the inlet to 3583 m at the summit of Hochvernagtspitze.
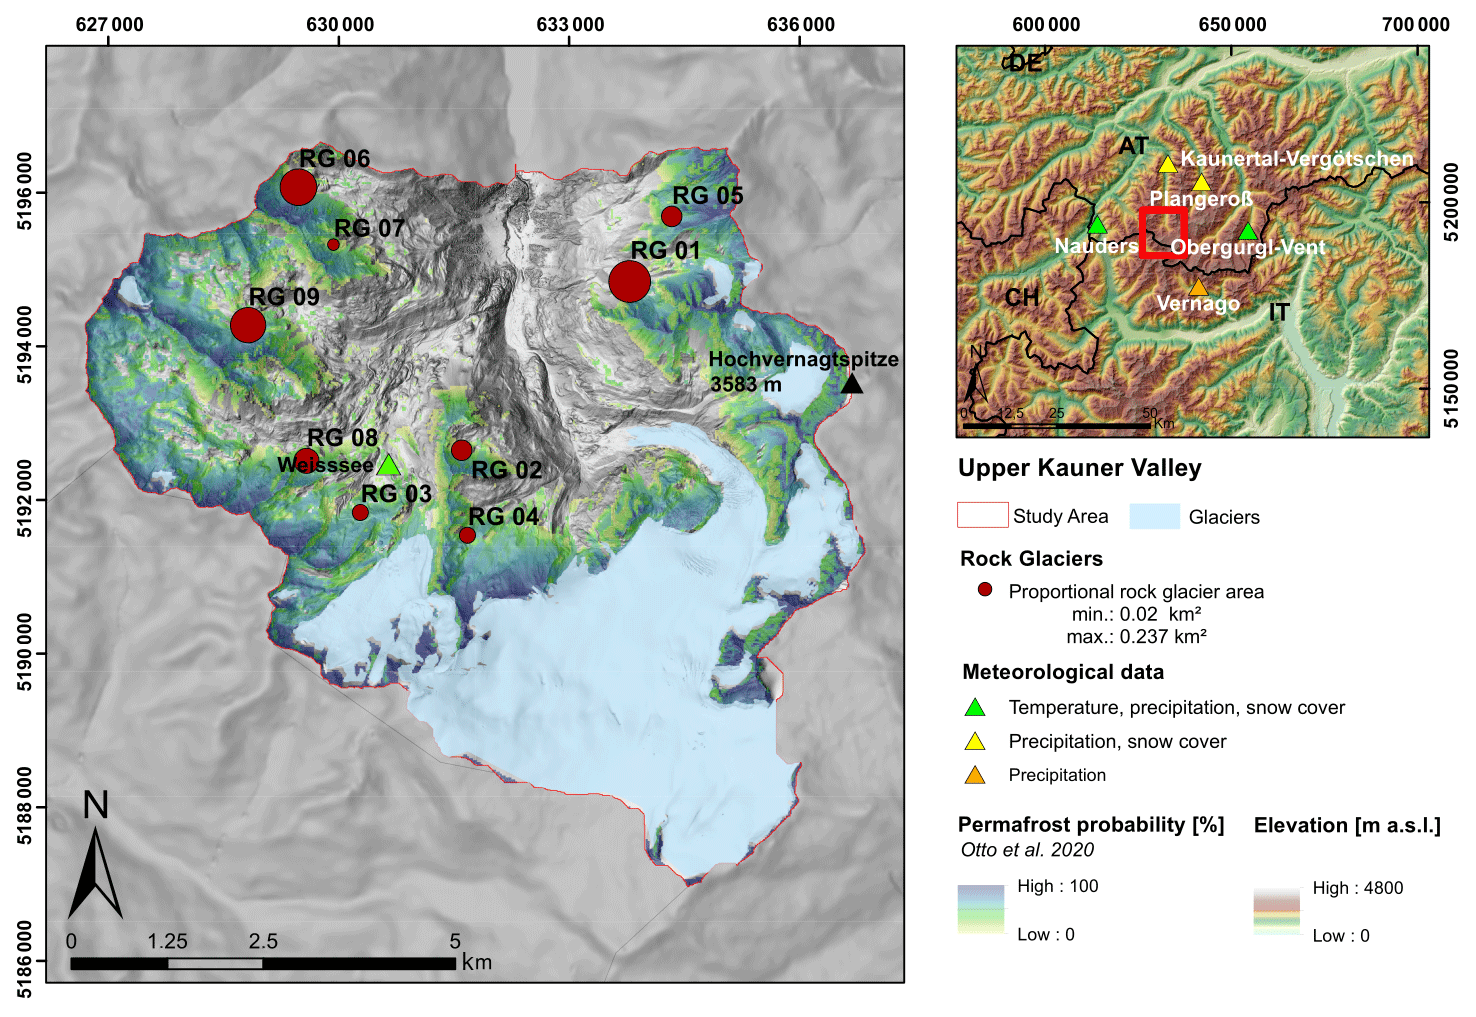
Figure 1Location and relative size of the investigated rock glaciers and location of the analysed meteorological stations. The stations Obergurgl and Obergurgl-Vent are marked as one station. The coordinate system used is ETRS89/UTM zone 32N EPSG:25832 with the unit metre. The background was created using Copernicus data and information funded by the European Union – EU-DEM layers (https://land.copernicus.eu/imagery-in-situ/eu-dem, last access: 1 November 2021).
Geologically, the study area belongs to the eastern Alps crystalline zone and the polymetamorphic Stubai complex. Paragneiss and orthogneiss are dominant, but amphibolite and mica schist occur subordinately (Hoinkes and Thöni, 1993). The study area is climatically characterised by the central-alpine dry region (Fliri, 1975). At Weißsee meteorological station (2470 m), a mean annual air temperature (MAAT) of −0.11 ∘C (2007–2019) and annual precipitation ranging from 731 to 1118 mm were recorded (data source: Tiroler Wasserkraft AG (TIWAG)). Detailed analysis of climate parameters of the study area is provided in Sect. 5.3 of this paper. According to a permafrost probability map (Otto et al., 2020), 38 % of the study area could be underlain by permafrost, and 30 % was covered by glaciers in 2015 (Buckel and Otto, 2018). The most prominent, Gepatschferner and Weißseeferner, are located in the southern part of the catchment. Due to the glacier road, which makes the valley accessible by car, many studies by geo- and bioscience have been carried out in this area (Dusik et al., 2015; Groh and Blöthe, 2019; Altmann et al., 2020). But the road, which intersects RG03, and the associated ski area also cause anthropogenic influences on natural systems, which have to be considered.
The study of rock glaciers has a long tradition in the Kaunertal, especially at the rock glacier Innere Ölgrube, which is named RG01 in this study (Fig. 2). The first velocity studies were already carried out by Finsterwalder (1928) and Pillewizer (1957), and more recent studies continue their research and contribute additional information about the hydrology, internal and external structure, and morphodynamics of this rock glacier (Berger et al., 2004; Krainer and Mostler, 2006; Hausmann et al., 2012; Groh and Blöthe, 2019). Groh and Blöthe (2019), who investigated the recent development of flow velocities of rock glaciers in Kaunertal, ascertained a slight increase and noted that the velocities of rock glaciers in the study area mainly depend on parameters describing the general inclination and that their activity status is controlled by their size and the topoclimate.
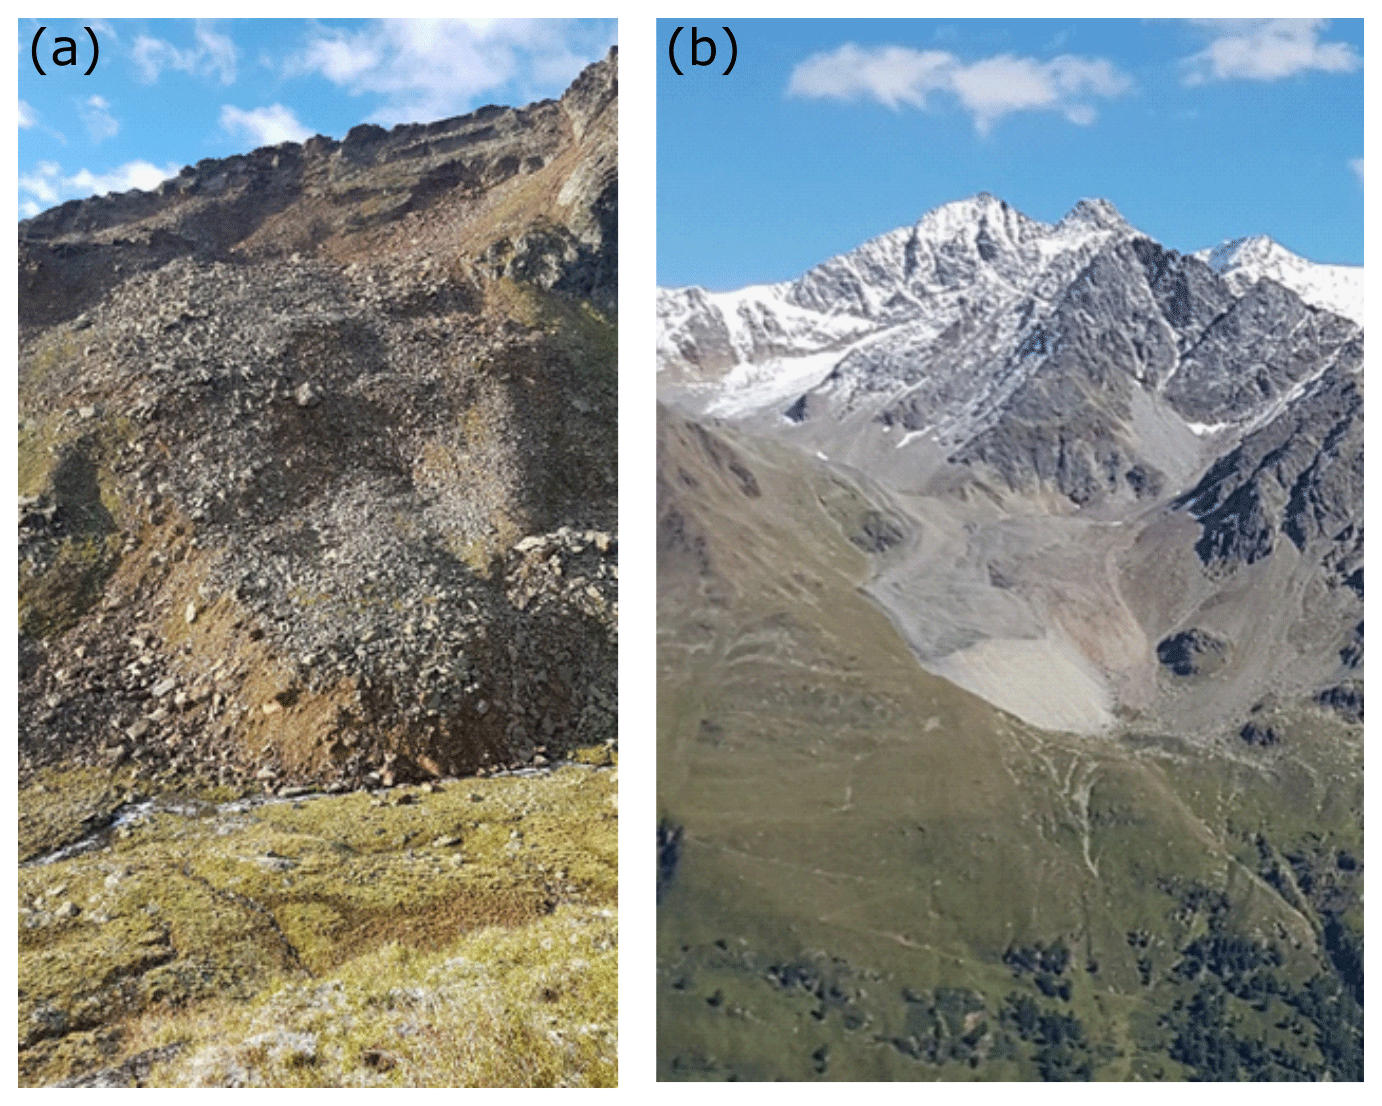
Figure 2Images of two of the studied rock glaciers. (a) The north-exposed rock glacier RG08, located at the entrance to the Krummgampen valley and covering an area of 0.088 km2. (b) The well-studied, west-exposed Ölgruben rock glacier RG01 covering an area of 0.237 km2.
We investigated eight active rock glaciers representing different characteristics and conditions in detail regarding flow velocities and one more rock glacier regarding the surface elevation change analysis (Fig. 1). These are described in more detail in Sect. 5.1.
3.1 Aerial photographs
In order to quantify the kinematic changes in the rock glaciers that occurred in the previous century, we used historical aerial photos to derive orthoimages and point clouds. The historical aerial photos used in this study were scanned and provided in TIFF format by the “Office of the Tyrolean Government – Department of Geoinformation” (https://www.tirol.gv.at/en/, last access: 15 September 2021) and the “Austrian Federal Office of Surveying and Metrology” (BEV) (https://www.bev.gv.at, last access: 15 September 2021) along with the camera calibration protocols if available (Table 1). The aerial photos for the Kaunertal catchment were collected at six separate epochs between 1953 and 1997. The epochs were chosen based on data availability, similarity in acquisition date (i.e. late summer), image quality and sufficient image overlap.
Table 1Overview of the acquired historical aerial image flights used to generate point clouds and orthoimages in Agisoft Metashape Professional (v.1.6.1).
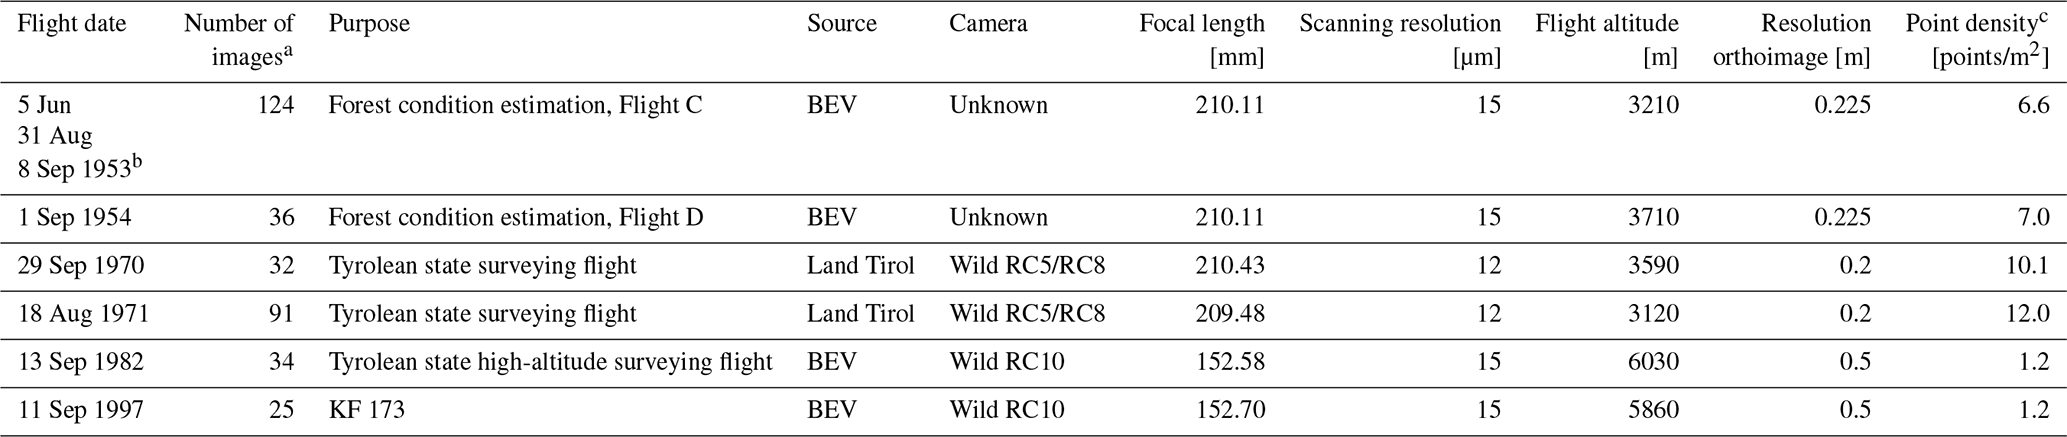
a Number of images used to reconstruct the whole catchment. b Three dates were processed as one dataset. c Mean point density on studied rock glaciers with snow patches excluded.
3.2 Airborne laser scanning (ALS) data
To analyse rock glacier flow velocities on hillshades (see Sect. 4.3) and surface elevation change using DoDs (see Sect. 4.4) in the two most recent epochs 2006–2012 and 2012–2017, we used data from different ALS campaigns (Table 2). The most recent one was acquired on 5 June 2017 by a helicopter and a mounted mobile laser scanning system VuxSys-LR from Riegl (http://www.riegl.com, last access: 26 February 2021). This ALS flight mission was carried out by the Chair of Physical Geography at the Catholic University of Eichstätt-Ingolstadt during the Deutsche Forschungsgemeinschaft (DFG)-funded project (PROSA), achieving a mean point density of 20.0 points/m2 on the studied rock glaciers. Due to weather conditions and time constrains of the contracted company, which made an area-wide data acquisition in 1 d impossible, the 2012 ALS data were recorded (also during the PROSA project) on 4 and 18 July.
Table 2Overview of ALS data used for flow velocity analysis and surface elevation change analysis. Average point density is given for the areas of the investigated rock glaciers without snow patches.
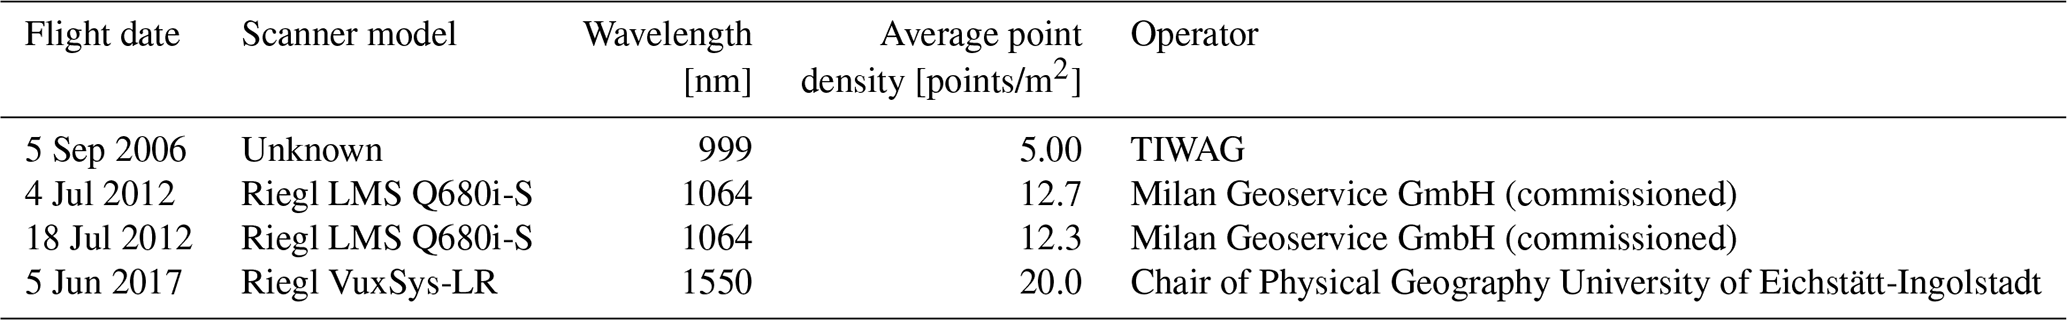
An LMS Q680i-S laser scanner from Riegl mounted on a helicopter was used for data recording. Depending on the date of recording, the average point density ranges between 12.3 and 12.7 points/m2. Furthermore, an additional ALS dataset from 5 September 2006 with an average point density of 5.0 points/m2 was provided by TIWAG. All datasets were georeferenced with parameters optimised by an automatic strip adjustment (Glira et al., 2015).
3.3 Meteorological data
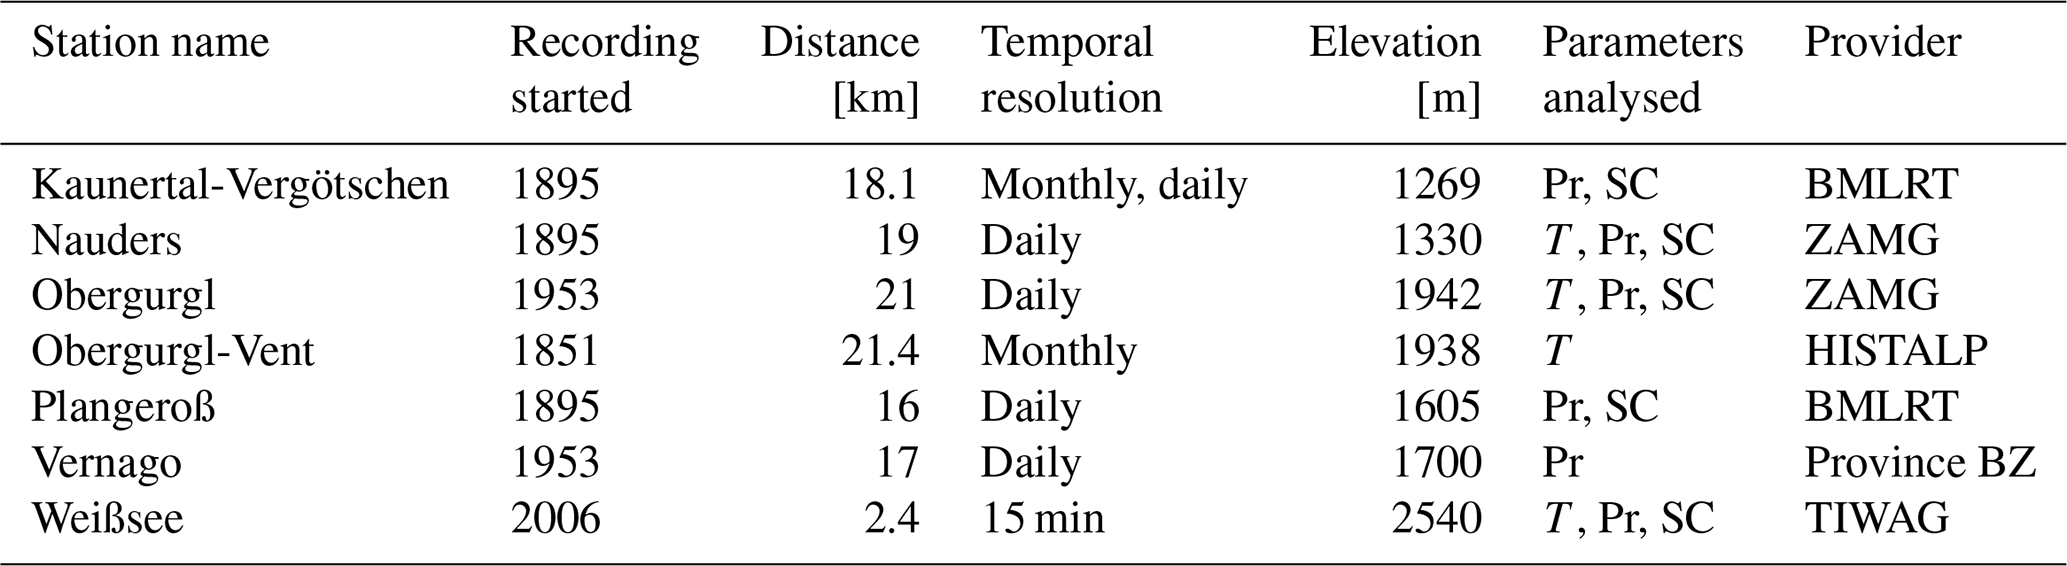
For the analysis of rock glacier morphodynamics over a decadal time period, a reference to climatic conditions that influence such systems in various ways is indispensable. However, long-time-series data in the high alpine areas are only very sporadically available as early climate monitoring stations tended to be located in population centres. This also applies to our catchment area, where the meteorological station Weißsee (2540 m) (data source: TIWAG) has been recording data since 2006. For this reason, we used additional data from nearby meteorological stations, which have longer time series available, to provide information on the approximate climatic development in the catchment area. The locations of these stations are shown in Fig. 1, while an overview of the stations and the used data is given in Table 3.
Table 3Overview of the meteorological stations used. The distance is given to the centre of the study area in kilometres. T – temperature, Pr – precipitation, SC – snow cover. The data were provided by the “Federal Ministry of Agriculture, Regions and Tourism” (BMLRT), the “Central Institute for Meteorology and Geodynamics” (ZAMG), “Historical Instrumental Climatological Surface Time Series of the Greater Alpine Region” (HISTALP), “Autonomous Province of Bozen/Bolzano” (Province BZ), and TIWAG.
4.1 Rock glacier inventory
Although manual mapping of rock glacier landforms is shown to be highly subjective (Brardinoni et al., 2019), we tried to minimise the heterogeneity in the inventory by incorporating the guidelines for inventorying rock glaciers (International Permafrost Association (IPA) Action Group: rock glacier inventories and kinematics 2020) and only mandate one operator to compile the inventory on the basis of the inventory by Krainer and Ribis (2012). Rock glacier outlines were corrected, and additional landforms were mapped on the basis of the most recent hillshade derived from the 2017 ALS campaign of the PROSA project and an orthoimage of 2015 (data source: Land Tirol, https://www.data.gv.at, last access: 1 December 2021). Activity status was assigned according to morphological characteristics in combination with a DoD of the 2012 and 2017 ALS campaigns to detect surface elevation change and therefore ice melting. Image correlation analysis on the derived hillshades was used to derive information on flow velocity. For the inventory of the entire study area, both analyses were carried out without local alignment of the data. The classification is based on the common division into active (contains ice and is in motion), inactive ((almost) no motion but still contains ice) and fossil (contains (almost) no more ice and is not in motion; e.g. Krainer and Ribis, 2012). We then derived rock glacier characteristics such as aspect, slope and elevation from the elevation model of the 2017 ALS campaign and classified them according to their spatial connection to the upslope unit. We further determined whether the area of the investigated rock glaciers was covered by a glacier during the Little Ice Age (LIA) with the help of a glacier inventory (Fischer et al., 2015).
4.2 Processing of aerial images
To derive point clouds and orthoimages from the aerial images, these were processed using advances in digital photogrammetry, particularly structure from motion (SfM) with multi-view stereo (MVS). The reconstruction of 3D information in the form of point clouds from scanned historical photos does not require specialised knowledge when important basic principles are followed (Bakker and Lane, 2017; Fawcett et al., 2019). The aerial images were processed in Agisoft Metashape (v.1.6.1) using the film camera tool, which estimates the camera calibration parameters based on the fiducial marks. The software automatically derived the locations of the fiducial mark in the images. Their distance in millimetres and the focal length were available from the calibration protocols. Having defined the camera interior orientation, the camera exterior orientation, the 3D point cloud reconstruction and the orthoimage generation followed the standard SfM–MVS workflow. This includes ground control point (GCP) measurement for georeferencing and dense image matching. The 3D coordinates of 101 GCPs were chosen from the ALS 2017 point cloud on stable terrain and were evenly distributed throughout the catchment. In the case of the 1953 dataset, three different aerial image flights from this year had to be processed together as there was insufficient image overlap in the individual flights.
The resulting average point density on the studied rock glaciers varied from 1.2 to 11.9 points/m2 (Table 1). Therefore, only the point clouds of the years 1953/54 and 1970/71 with a point density between 6.6 and 12 points/m2 were used in the DoD analysis. The ground resolution of the orthoimages varied between 0.2 and 0.5 m.
4.3 Horizontal flow velocities
Horizontal flow velocities of the rock glaciers were calculated for the six processed time steps between 1953 and 2017. For this purpose, an image correlation approach was chosen, which is a common method to derive glacier and rock glacier velocity from orthoimages, hillshades and satellite images (Scambos et al., 1992; Kääb and Vollmer, 2000; Heid and Kääb, 2012; Monnier and Kinnard, 2017; Kellerer-Pirklbauer and Kaufmann, 2018). In this study, orthoimage and hillshade image pairs were utilised. In order to ensure their comparability and to account for possible shifts in the orthoimages, we resampled them at a resolution of 0.5 m and locally co-registered all individual rock glaciers for each epoch to the 1953/54 orthoimage. We used 9 to 29 co-registration points equally distributed around the rock glaciers, obtaining co-registration root mean squared errors (RSMEs) between 0.23 and 0.55 m with an average of 0.32 m.
For the time step 1997–2006, where orthoimages and hillshades were used in combination, illumination was chosen for the 2006 DEM according to the exact position of the sun in the 1997 orthoimage. To calculate flow velocity vectors, the image correlation algorithm IMCORR (Scambos et al., 1992) within SAGA GIS software was applied. The algorithm attempts to match small sub-scenes from two images by applying a fast Fourier transform-based version of a cross-correlation. It can locally adjust the intensity values between two image pairs and therefore compensate for differences in illumination. Using this algorithm, sub-pixel precision of displacement vectors can be achieved. We used search and reference chip size combinations of 64 and 32, 128 and 64, and 256 and 128 with a fixed spacing of 5 m. The combinations were calculated for all image pairs, and the most reasonable was chosen for further analysis. This was done by visually analysing the resulting displacement vectors in combination with the input data. In general, larger chip sizes were chosen for faster-moving rock glaciers and/or long time spans between the image pairs. The resulting raw vector maps can contain erroneous displacement measurements or decorrelation, where no measurement is possible. Image decorrelation might be caused by snow, strong shading effects, areas where displacements are dominated by rockfall and large displacements, which cause a change in texture. These vectors were excluded manually for all time steps with the help of the matching orthoimages or hillshades. Subsequently, a mask was created for the areas where measurements were possible in all time steps, and just measurements in these areas were used for further analysis to make the individual time steps comparable. Since it is therefore not possible to measure the flow velocity over the entire rock glacier, the calculated statistics are only valid for the area in which measurements were possible in all epochs.
The combination of orthoimages and hillshades had to be chosen because low point densities in some of the aerial-image-derived point clouds resulted in low details in the resulting DEMs. Tests regarding image correlation on these DEMs showed very poor results. We are aware that the low point densities also affected the accuracy of the resulting orthoimages and outline the variable errors in Sect. 5.2. On the other hand, we decided not to use orthoimages for the more recent epochs from 2006 to 2017, available from the “Office of the Tyrolean Government – Department of Geoinformation” (https://www.tirol.gv.at/en/, last access: 10 September 2021) for the reason that they were orthorectified utilising the most up-to-date DEM with a resolution of 5 m, which could result in erroneous displacement measurements. If a non-contemporary DEM is used, it would lead to orthorectification errors, particularly on moving landforms, like rock glaciers (Kaufmann and Kellerer-Pirklbauer, 2015).
The measurement of horizontal flow velocities of rock glaciers on remote sensing data, especially when using historical aerial images and their derivatives, is prone to errors. As described by Kääb et al. (2021), the error budget is composed of the following components: (1) overall shifts between the orthorectified data, (2) lateral shifts in the orthoimages due to errors in the DEM used for orthorectification, (3) distortions in the aerial images or in the sensor model that propagate into the orthoimages, (4) image matching uncertainties and errors. We minimised the shifts between the orthoimages by a local co-registration of the orthoimages. By using the matching DEMs of the individual years for orthorectification, we addressed error type (2). However, quality of the DEMs varied locally in a single epoch and more crucially between the epochs and therefore might influence the accuracy of the orthorectification. The DEMs with the lowest quality were the epochs 1982 and 1997. These were also the years with the worst quality of the raw aerial images (error type 3). Another source of error when working with historical aerial images are scratches and alterations on the original image film caused by storage and age. These can lead to problems in the processing and thus were masked out before processing. Errors of type (4) contain errors caused by the image correlation method itself. The measurement errors as a consequence of image correlation vary with the image quality like resolution, shadow, contrast and noise of the image pairs (Kääb et al., 2021). We removed both directional and magnitudinous gross outliers manually by counterchecking the resulting displacement vectors with the corresponding orthoimage and hillshade pairs.
To quantify the overall error budget for horizontal flow velocities, we mapped close stable areas of similar texture or roughness and aspect on the single rock glaciers for all time steps. Due to snow and shading effects, these stable areas had to be adjusted slightly for some epochs. Subsequently, displacement vectors in these areas were analysed for all individual epochs and rock glaciers. As no gross outliers were found in these areas, we used the mean value (disp) added by 2 times the standard deviation (dispσ) as a measure for error budget (errordisp) of flow velocity measurements.
This measure was also applied by Fey and Krainer (2020) to determine a level of detection (LoD) for rock glacier flow velocity, and mean and standard deviation in stable areas are recommended as a statistical measure of flow velocity error by Paul et al. (2017).
4.4 Surface elevation and volume change
For the analysis of surface elevation and volume change on the rock glaciers we used both photogrammetric and ALS point clouds in a DoD analysis. All processing steps were performed in SAGA LIS (laser information system; https://www.laserdata.at, last access: 20 February 2021). The epochs for this analysis differ slightly from the datasets used for the flow velocity analysis as the processing of the aerial images did not lead to sufficient point cloud resolutions for the datasets 1982 and 1997. Therefore, four epochs between 1953–2017 were analysed. All point clouds (photogrammetrically derived and ALS) were thinned (0.5 m) to produce homogeneous point densities for all epochs, and outliers were removed. In order to minimise inherent systematic errors (Bakker and Lane, 2017) all point clouds were co-registered with the reference 2017 ALS data by using an iterative closest point (ICP) algorithm (Besl and McKay, 1992) on mapped stable areas around the rock glaciers. Fine registration was performed for all individual rock glaciers and epochs separately to account for any variable errors throughout the catchment. The point clouds were then converted into a DEM with a cell size of 1 m. The elevation change for each epoch and rock glacier was derived by subtracting the earlier DEM from the newer DEM (DoD). These values were summed and multiplied by the squared cell size to obtain the volume change. In order to be able to compare epochs, annual values were calculated. To avoid surface elevation changes and volume changes being influenced by snow, snow masks were created, and these areas were excluded from the analysis (Fig. 10). This implies that in some cases the entire landform cannot be considered for the mass balances, so the results of these must be interpreted with caution.
For the uncertainty analysis we followed the approach proposed by Anderson (2019), who presented an error propagation method to derive uncorrelated, correlated and systematic errors and combine them to a total uncertainty without applying a minimum LoD. We carried out this procedure in stable areas that we mapped in proximity to the rock glaciers. For visualisation, however, we applied a LoD of 1.96 times the standard deviation in stable areas.
4.5 Meteorological data
In order to identify possible links between rock glacier kinematics and external forcing factors, we analysed the changes in temperature, precipitation and snow cover during the study period from 1953 to 2017. In addition to a trend analysis of the data, we also calculated the annual anomalies based on the reference period 1961 to 1990 and the 5-year running mean to smooth out short-term fluctuations. In addition, we disaggregated these analyses by season; here, spring was defined as March–May, summer as July–August, autumn as September–November and winter as December–February. The variables snow cover onset and duration were determined according to Peng et al. (2013) From the depth-of-snow data of the individual station we also calculated the dates when a significant snow cover (> 50 cm) is established, allowing for ground isolation. Besides this we derived the date of complete snowmelt in spring.
5.1 Rock glacier inventory and investigated rock glaciers
A rock glacier inventory was compiled for the upper Kaunertal. Within the catchment, 40 rock glaciers were found, which were classified as active (15), inactive (11) and fossil (14) (Fig. 3). Due to poor image quality or snow cover and the activity status, the vast majority of these rock glaciers had to be excluded from the following analyses.
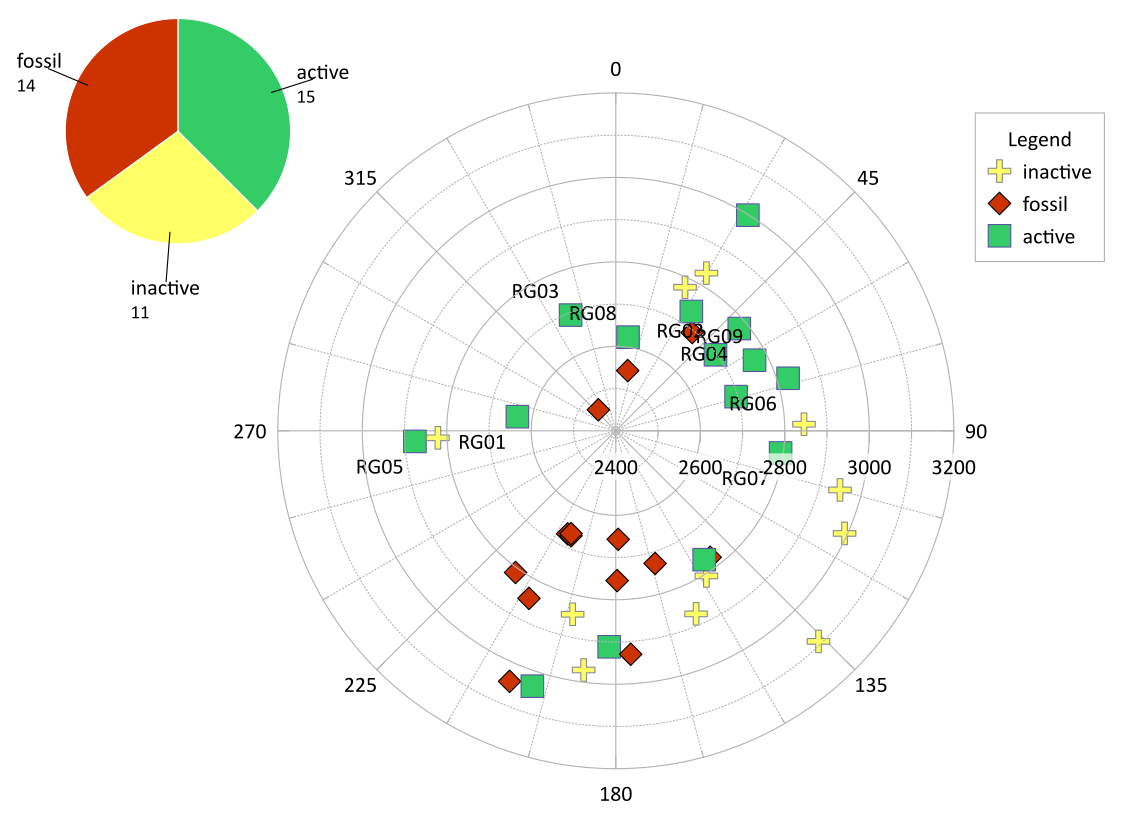
Figure 3Rose plot of the rock glacier inventory of the upper Kaunertal. The radial axis gives the mean elevation of the rock glaciers [m]; the angular axis gives the aspect of the rock glaciers [∘].
Nevertheless, eight active rock glaciers representing different characteristics and conditions were investigated in detail regarding flow velocities and one more regarding surface elevation change. The most prominent of those is the well-studied and largest (0.237 km2) rock glacier Innere Ölgrube (RG01) (Fig. 2). The area of these rock glaciers ranges from 0.02 km2 (RG07) to 0.237 km2 (RG01). They show aspects of north, north-east, east and west, with minimum elevation ranging from 2446 to 2727 m. Without geophysical, geochemical or petrographic information, interpretations about the genesis and internal structure are difficult (Berthling, 2011; Clark et al., 1998). In the case of the rock glaciers RG03, RG04 and RG09, a complete or partial covering of the rock glaciers by the LIA glacial extent (Fischer et al., 2015) suggested a glacial genesis after 1850 or at least a glacial influence during and after this time, as described by Dusik et al. (2015) for RG09. In the case of RG06, a thermokarst lake suggested a glacier coverage of the root zone during LIA and the presence of massive sedimentary ice (Supplement Fig. S1).
Table 4Characteristics of the rock glaciers studied. Permafrost occurrence gives the pseudo-probability of permafrost (Otto et al., 2020). Area covered by 1850 glacier extent is ascertained according to LIA glacier extents (Fischer et al., 2015) if not specified otherwise.
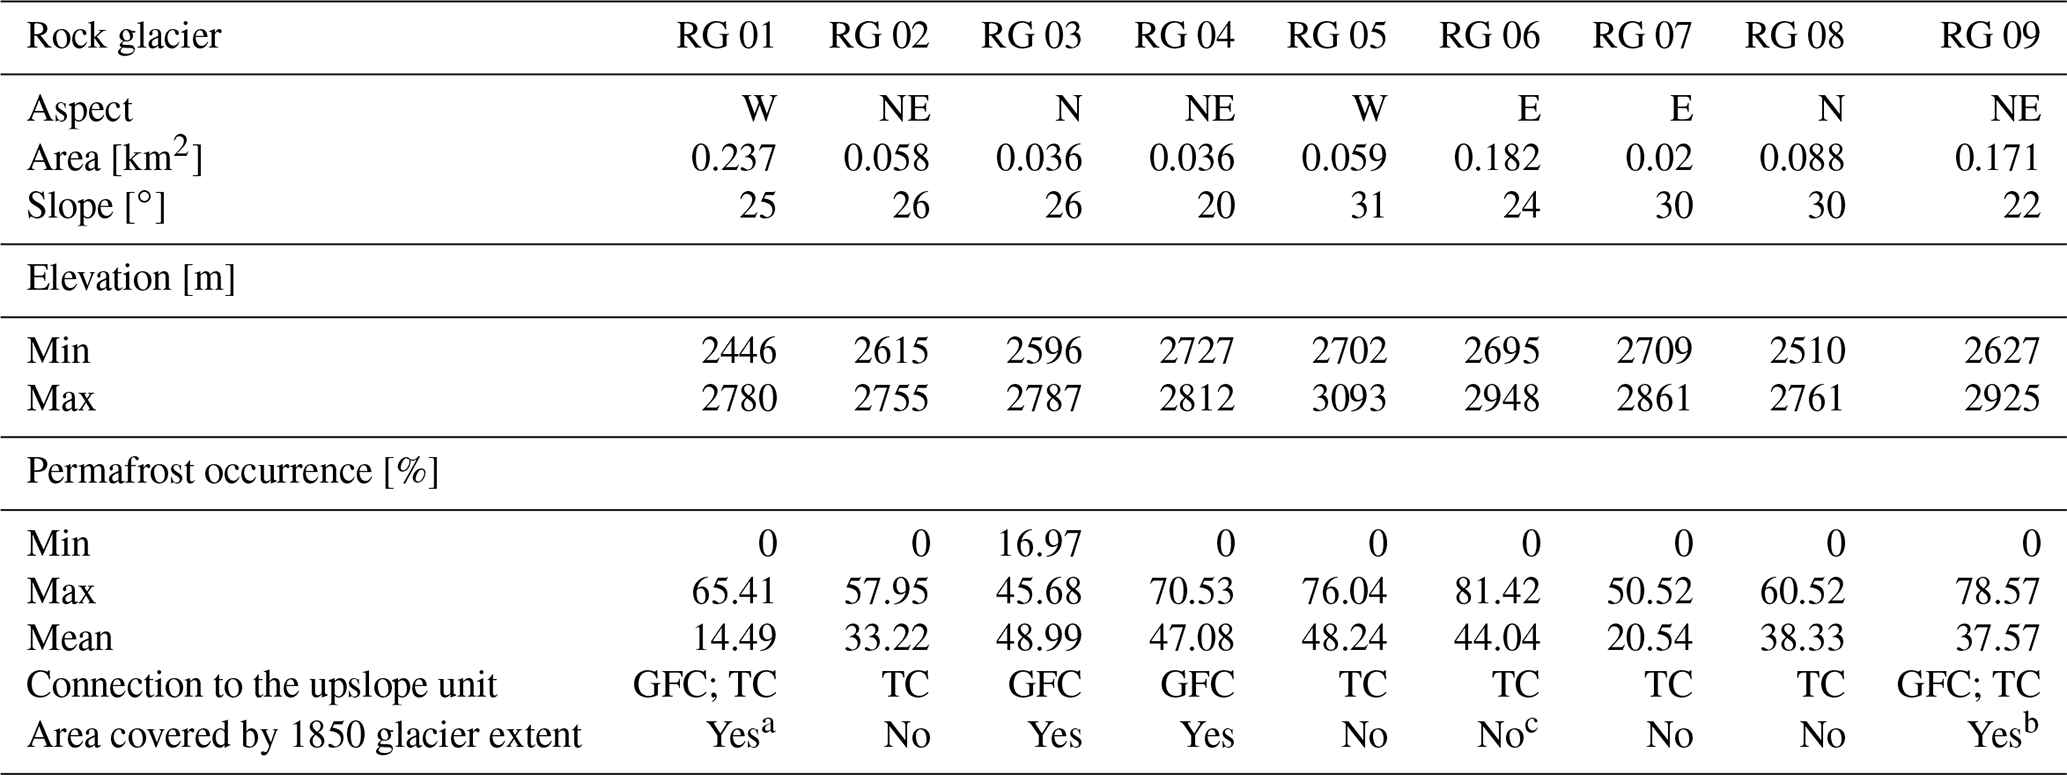
a As described in Berger et al. (2004). b As described in Dusik et al. (2015). c A thermokarst lake suggests massive ice and a covering of the root zone by LIA glacier.
Concerning the connection to the upslope unit both glacier-forefield-connected (GFC) and talus-connected (TC) rock glaciers were included in the further analysis. Detailed characteristics of the studied rock glaciers can be found in Table 4, and a KMZ file containing the locations of the investigated rock glaciers is included in the supporting materials.
5.2 Errors and uncertainties
Although the workflow was chosen to minimise errors during data processing, they are still present to some extent in the data. Wherever necessary and possible, we indicated the uncertainties in the values in the text and in the figures.
For flow velocity measurements, error values ranged between 0.01 and 0.09 m/yr. The distribution of these values from individual rock glaciers per image pair combination is displayed in Fig. 4. In general, the best results were obtained for epochs where hillshade image pairs were utilised. The largest errors on average were determined for the epoch 1997–2006, in which a combination of orthoimages and hillshade was used. We attribute this to the poor image quality of the 1997 dataset and the use of orthoimages in combination with hillshades. Although the illumination of the hillshades was adapted to the orthoimages, only contrasts and patterns, which are caused by the illumination, can be used to determine the flow velocity by image correlation. In contrast, contrasts and patterns that are caused by different colours in the orthoimage are not taken into account or can even lead to incorrect measurements. In other cases, the variability in the errors may be related to the accuracy of the co-registration but also to differences in the quality of the image in terms of contrast, illumination and resolution.
To assert the validity of our results we performed a qualitative comparison with differential global positioning system (DGPS) measurements, which were taken by Krainer and Mostler (2006) between 2002 and 2004 for Ölgruben rock glacier (RG01). This confirmed the magnitude, flow direction and pattern that were determined by our method. In addition, a comparison of flow velocities derived by Groh and Blöthe (2019) by feature tracking for Kaunertal rock glaciers between 2001 and 2015 showed good agreement (Supplement Table S1). Although other time steps were used, span, mean and median values showed similar and plausible results when compared to the values of the two most recent time steps of our study.
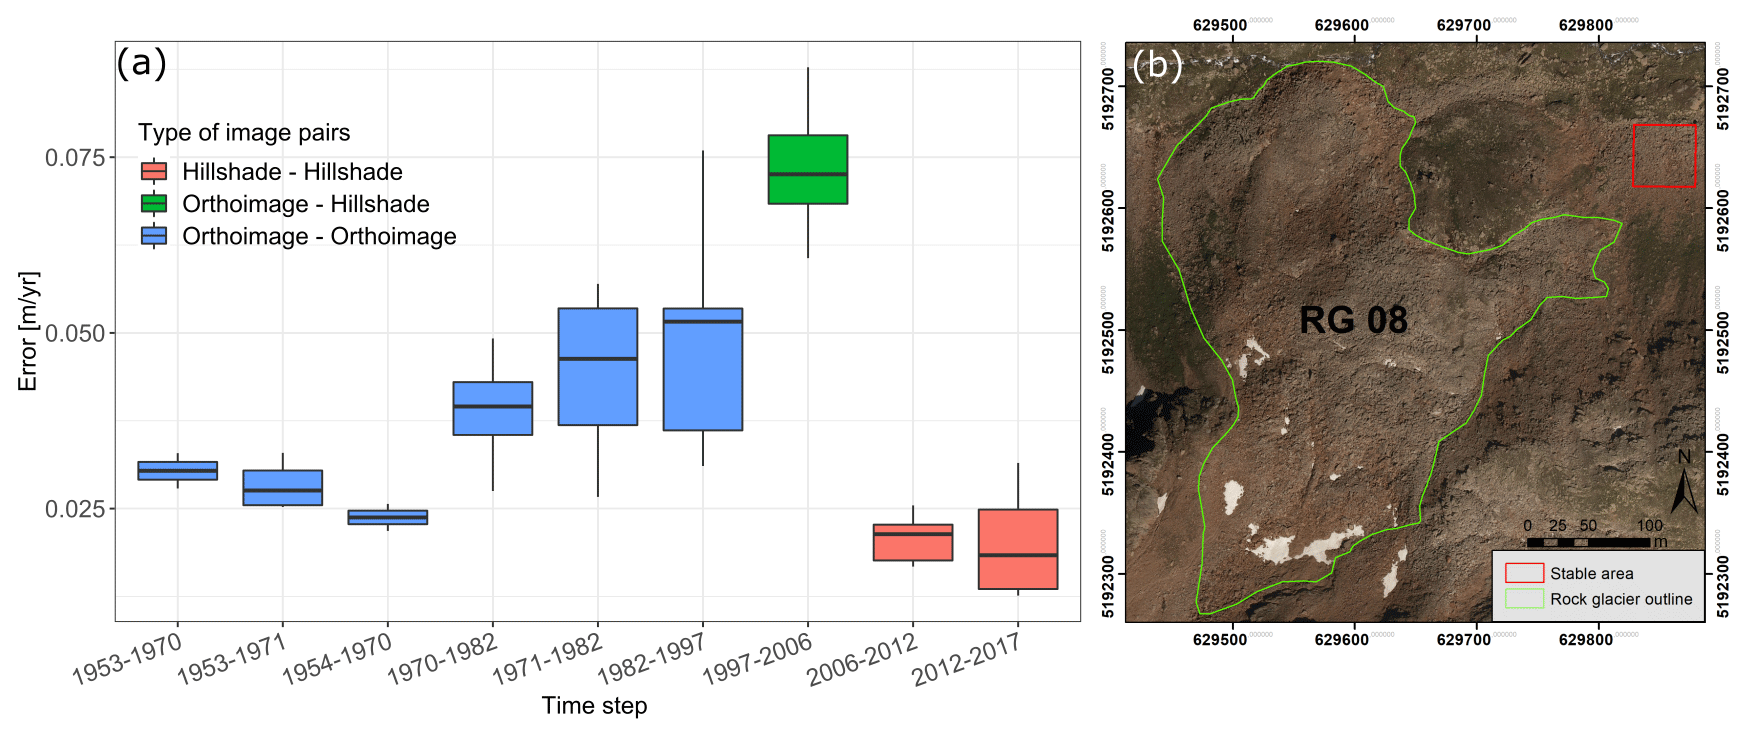
Figure 4(a) Flow velocity errors derived from stable areas in proximity to the individual rock glaciers for all image pair combinations. Like all subsequent boxplots, these show summary statistics of the data, with the bottom of the box representing the 25th percentile, the top of the box the 75th percentile and the black bar the median. The lines above and below the boxes indicate the minimum and maximum values. (b) Example of a stable area displaying similar aspect, texture and roughness used to analyse error for RG08.
For the surface elevation change and volume change analysis, the uncertainties were largely determined by the magnitude of the systematic error in the DoD. The analysis of the errors revealed that a systematic error mostly occurred if one or both DEMs used to calculate the DoD were photogrammetrically created from historical imagery. This is reasoned by the fact that, due to the quality of the data, these point clouds could not be matched to the reference dataset by the ICP algorithm with the same accuracy as, for example, high-resolution and high-precision modern ALS datasets. Since the data quality of the point clouds generated from historical images varies spatially, a systematic error did not occur to the same severity in all investigated rock glaciers of an epoch. The spatially correlated random error, on the other hand, always occurred in DoDs with at least one DEM generated from historical images, whereas it was not present in DoDs created from ALS data. However, similar to the uncorrelated random error, this contributed only little to the total uncertainty in case a systematic error was present (Table S2).
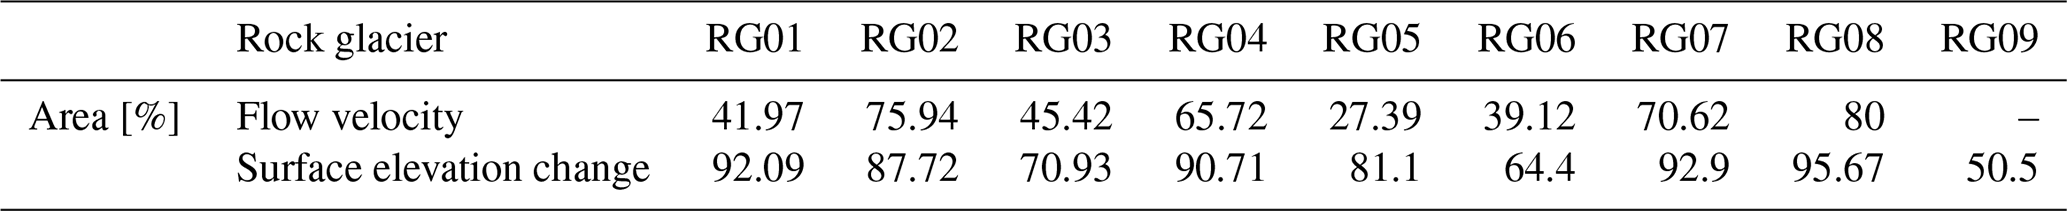
Since areas of snow cover, strong shadows or decorrelation in the image correlation would bias the results, masks were created comprising areas in which an unbiased analysis was possible in all epochs in order to ensure comparability. Therefore, the analysis of the flow velocity could be conducted on 27.39 % to 80.00 % of the rock glacier area, while, regarding the surface elevation change analysis, a coverage of 50.50 % to 95.67 % could be achieved (Table 5).
Table 5Percentage of the rock glacier area in which measurements were possible in all time steps and which were therefore considered for the analysis of flow velocity and surface elevation change. Reasons for exclusion were snow cover, shading effects or decorrelation in the image correlation.
5.3 Changes in meteorological forcing
All stations showed similar patterns of change, even if the manifestation of the anomalies was slightly different in some cases. We note that the positive trend of temperature increase was slightly higher for stations of higher elevation in the study period. In the case of temperature and snow cover, we mainly present data from the stations Obergurgl-Vent (1938 m a.s.l.) and Obergurgl (1942 m a.s.l.) as these are located at the highest elevation and only about 21 km away from the centre of our study area. In the case of precipitation, we mainly present data from the Plangeroß station (1605 m a.s.l.) because, although it is located at a significantly lower elevation than the Weißsee station (2540 m a.s.l.) and the studied rock glaciers, it offered the best agreement with the Weißsee station data in terms of monthly precipitation (r= 0.892, p < 0.001).
During the period of investigation (1953–2017), the temperature trend showed an increase of 1.92 ∘C in 65 years at the Obergurgl-Vent (1938 m a.s.l.) station (Fig. 5). This was a stronger increase than at the lower-elevated station Nauders (1330 m a.s.l.), where the increase was 1.29 ∘C. Possible reasons and explanations for the elevation-dependent warming are given in Rangwalla and Miller (2012). In general, the temperature increase goes well in line with the alpine-wide temperature increase, which has a significantly higher amplitude than the global average (Beniston, 2006). The seasonal development of the temperature trends showed a strong increase in temperatures in spring and summer of 2.73 ∘C and 2.64 ∘C, respectively. This trend was clearly weakened for winter and autumn temperatures and amounted to 1.6 ∘C for winter and 0.69 ∘C for autumn. The derived temperature anomalies showed exclusively positive anomalies from the beginning of the 1990s onwards for spring and summer temperatures (Fig. 12). The summers of 2015 and 2017 and in particular the summer of 2003 were conspicuous for their high temperatures and are known to have brought profound change to permafrost-affected systems (Ravanel et al., 2017). For the period before the beginning of the 1990s, periods and years with both positive and negative anomalies occurred, whereby the strong anomalies were mostly in the negative range.
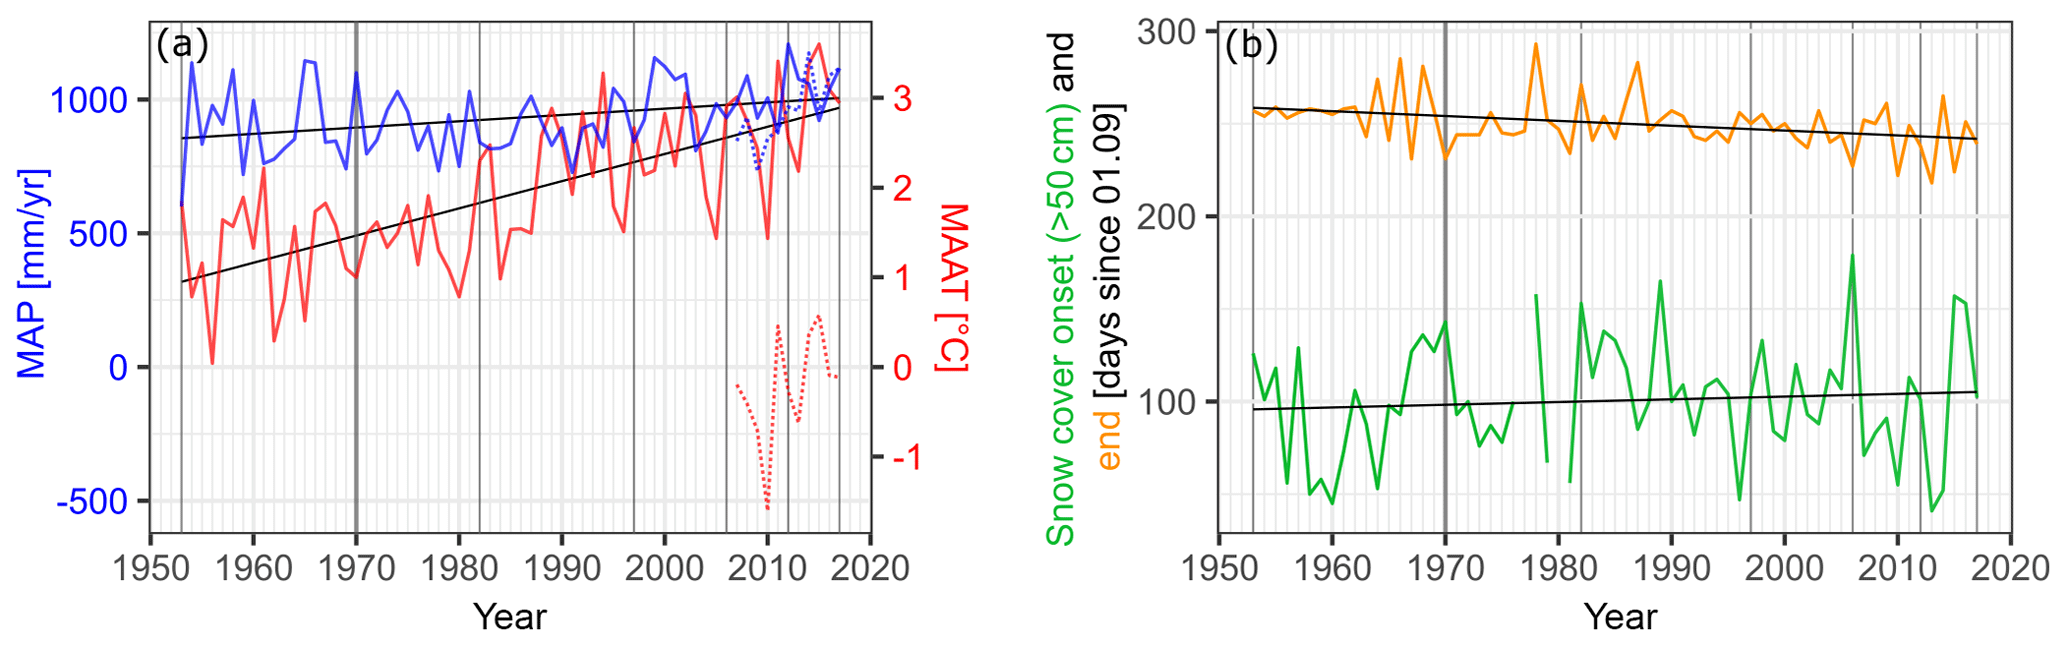
Figure 5Changes in meteorological forcing during the study period between 1953 and 2017. (a) Mean annual precipitation (MAP) for the station Plangeroß (1605 m a.s.l.) and mean annual air temperature (MAAT) for the station Obergurgl-Vent (1938 m a.s.l.); the dashed lines indicate the values for the Weißsee station (2540 m a.s.l.). (b) Snow cover onset and end for the station Obergurgl (1942 m a.s.l.). The black lines show the trend of the respective parameters.
All considered meteorological stations, except for the station Nauders (1330 m a.s.l.), recorded a slightly positive trend in terms of precipitation, translating to an increase between 53 and 241 mm during the investigation period. The positive trend for the station Plangeroß (1605 m a.s.l.) was expressed in an increase in precipitation of 152 mm per 65 years (Fig. 5). The mean annual precipitation accounted to 931 mm/yr during the period of investigation at the station Pangeroß (1605 m a.s.l.) and to 957 mm/yr at the Weißsee station (2540 m a.s.l.) in the period from 2007 to 2017. The greatest positive trend was recorded in autumn (52 mm per 65 years), the least in winter (18 mm per 65 years). On average, most precipitation fell in the summer months, with an average of 362 mm/yr, and the least in winter, with an average of 171 mm/yr.
Precipitation anomalies showed a clear increase from the mid-1990s for positive summer and autumn anomalies, which is particularly pronounced in the period 1995–2002 (Fig. 12).
The derived snow cover parameters are difficult to transfer to the study area as the station Obergurgl (1942 m a.s.l.) is located at a lower elevation than the rock glaciers studied but could provide an indication of general trends and anomalies in snow cover onset and duration (Fig. 5). For the entire study period from 1953 to 2017, no significant trend could be observed for the onset of the snow cover, significant snow cover and snow cover duration. This fits in with the results of Olefs et al. (2020), who found an elevation-dependent reduction in snow depth and duration in Austria between 1961 and 2020, but this only applies to elevations below 2000 m. However, there were some periods and years showing a particularly early or late onset of snow cover and significant snow cover, respectively (Fig. 12). On the other hand, a significant negative trend of −17 d was observed for the end of snowmelt over the study period, meaning the snowmelt takes place earlier with time (Fig. 5). Although this was not always the case, in general, the data showed that when the onset was earlier, the duration of the snow cover was also longer and vise versa.
5.4 Flow velocities
For the whole period of investigation, we derived maximum flow velocities ranging between 0.09 m/yr ± 0.03 and 1.72 m/yr ± 0.01 and mean flow velocities ranging between 0.08 m/yr ± 0.03 and 0.60 m/yr ± 0.01 m/yr for the eight individual rock glaciers (Fig. 6). The mean values were calculated for values above the maximum LoD of the respective rock glacier in order to exclude marginal areas, showing values close to zero, that do not move homogeneously with the rock glacier and to ensure comparability between the epochs. All of the investigated rock glaciers showed the highest mean and/or maximum values in either the epoch 1997–2006 or 2012–2017.
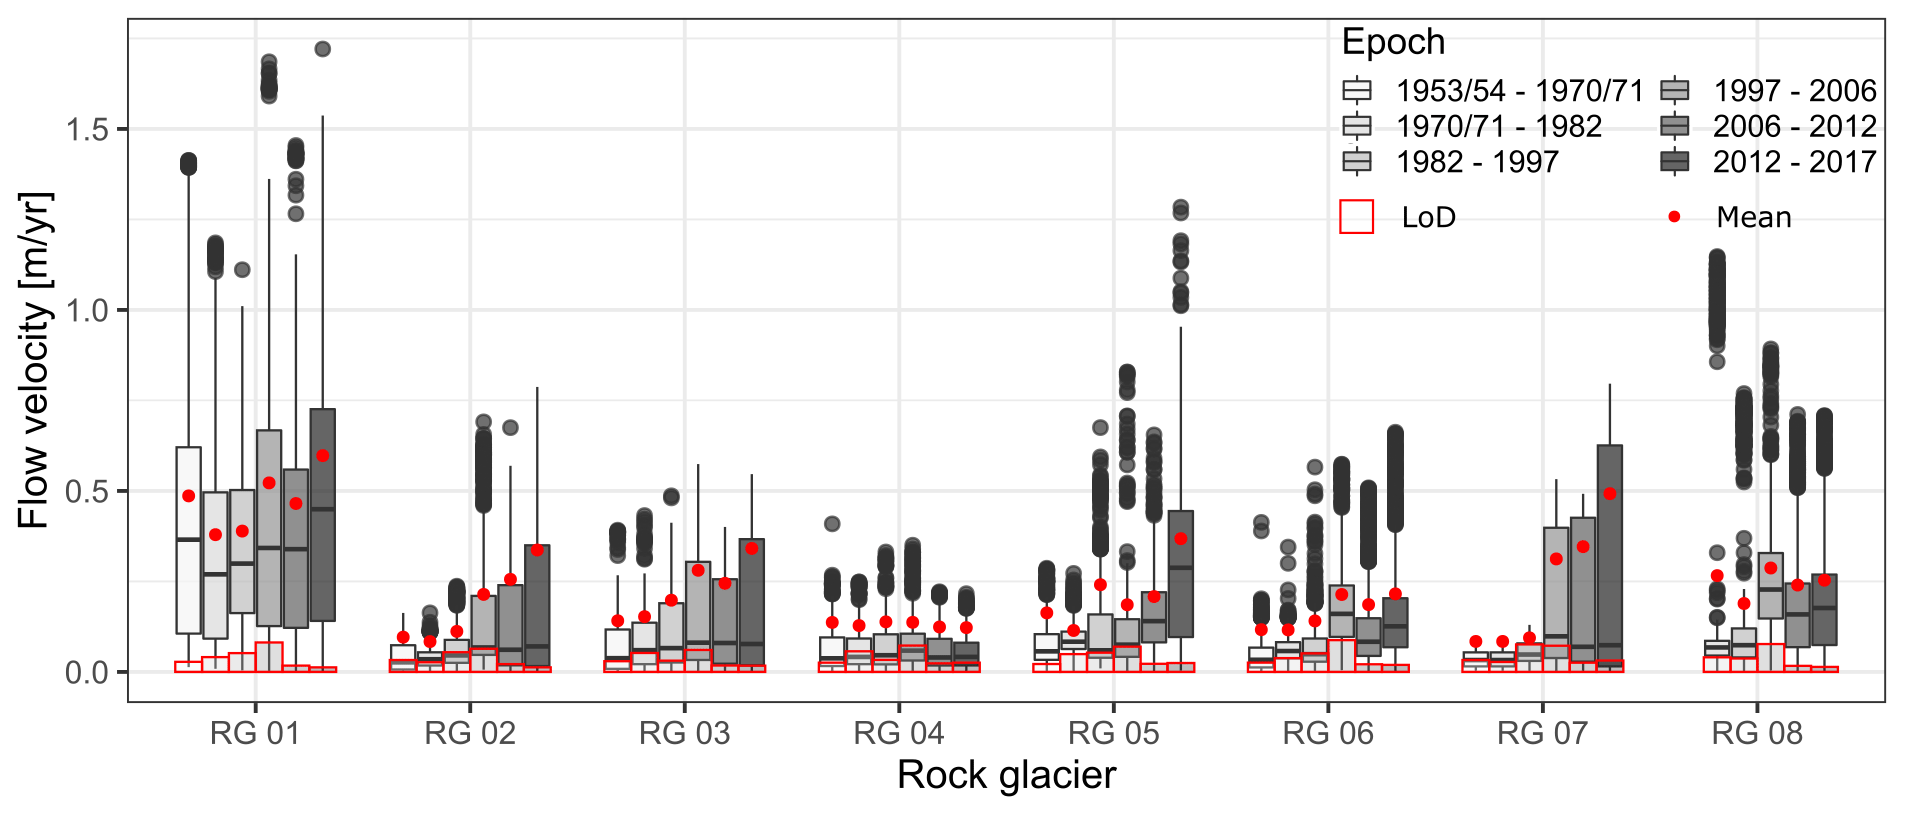
Figure 6Flow velocities for individual rock glaciers for six distinct epochs from 1953 to 2017. Rock glacier RG09 was not included in the flow velocity analysis, and rock glacier RG 08 had to be excluded from epoch 1 due to extensive decorrelation in the frontal part because of large displacements. The mean value (red dot) was calculated for values above the maximum LoD of the respective rock glaciers. The respective LoDs of the epochs are shown as red boxes. The black dots represent outliers, which by definition are located at least 1.5 times the box length (interquartile range) above the box.
An exception to this was RG08, which had the highest maximum flow velocity of 1.66 m/yr in the epoch 1953 to 1971. In this epoch, flow velocities for RG08 could only be determined by manual mapping of a few blocks as image correlation resulted in decorrelation due to excessive changes in surface structure. RG01, RG02, RG03, RG06, RG07 and RG08 showed a distinct acceleration of flow velocities beginning in the epoch 1997–2006. All of the investigated rock glaciers of the Kaunertal showed an increase in flow velocities in the most recent epoch, 2012–2017, compared to the previous 2006–2012 epoch. Exceptions to the general trend could particularly be seen in the case of RG04 as it was characterised by relatively constant mean flow velocities well below 0.15 m/yr during the whole investigation period.
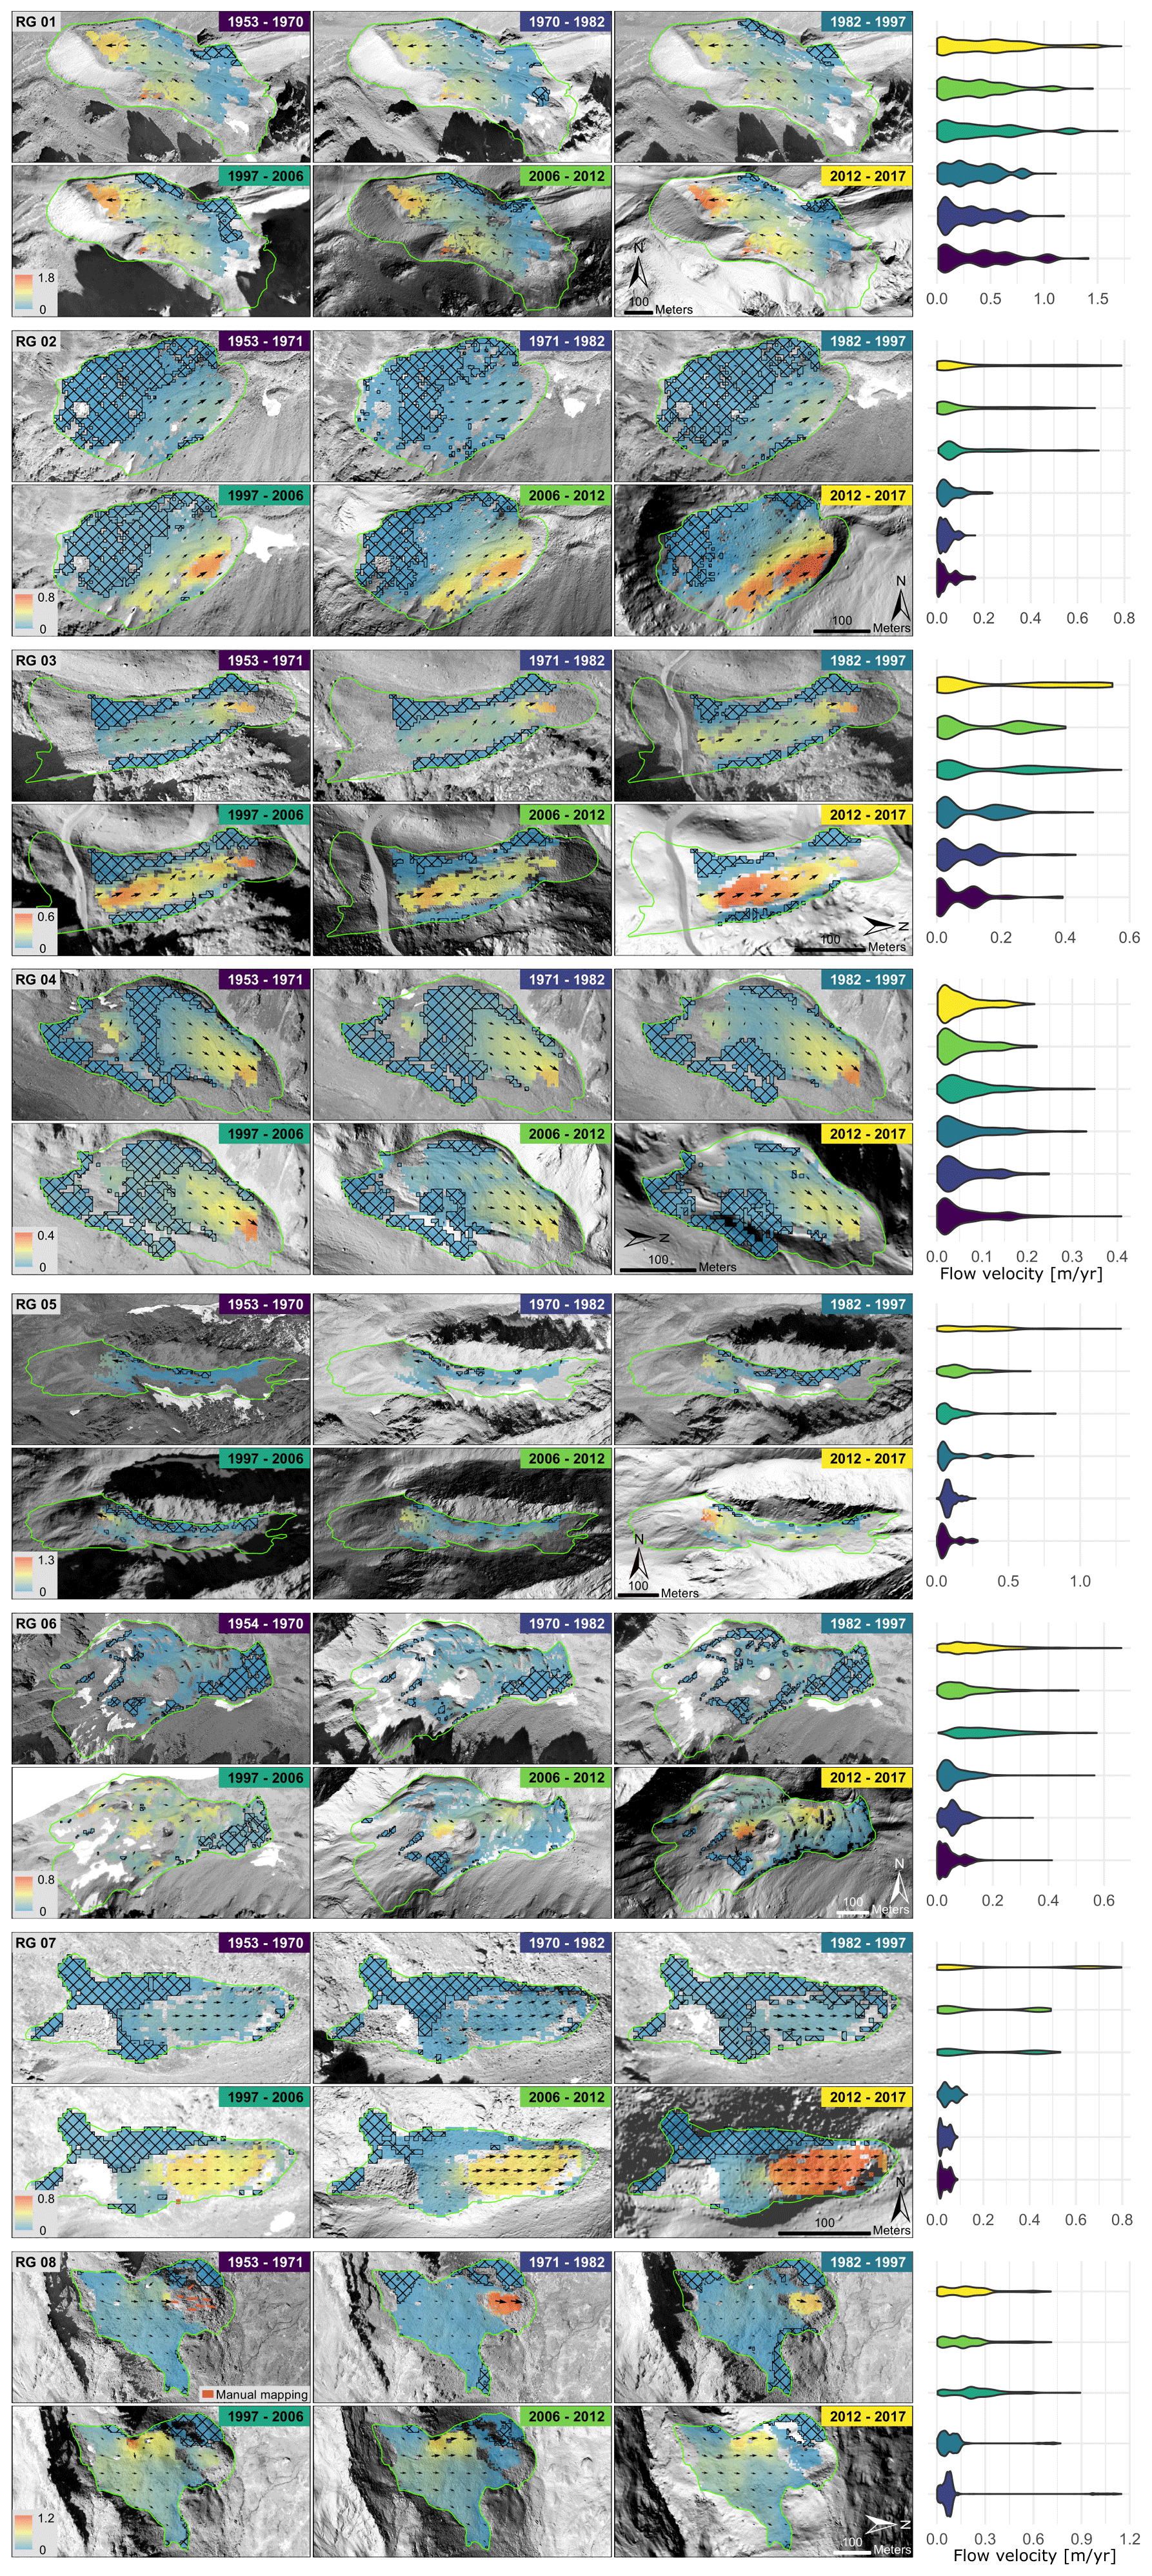
Figure 7Maps and violin plots showing the flow velocities and their distribution for the individual rock glaciers for six epochs between 1953 and 2017. The units of the colour scales are metres per year. Areas with flow velocities below the LoD are marked with a black grid. The background image is always the older date of the time span. The colour of the violin plots corresponds to the colour of the respective time period in the maps. Violin plots show the kernel probability density of the data at different values.
In the first epoch, all rock glaciers, except for RG01 (0.49 m/yr ± 0.03 m/yr) and RG08 (max 1.66 m/yr by manual mapping), displayed similar, low mean values ranging from 0.08 m/yr ± 0.03 to 0.16 m/yr ± 0.02 m/yr as well as similar value ranges (Fig. 6). If the maximum flow velocities are taken into account, this similarity has to be put into perspective as the range here was significantly greater and lies between 0.09 m/yr ± 0.03 and 0.41 m/yr ± 0.03 m/yr due to the higher flow rates of RG 03-05 at their terminal part (Fig. 7).
Compared to the first epoch, the range of the mean values increased significantly in the epoch 2012–2017 and was now between 0.12 m/yr ± 0.03 and 0.49 m/yr ± 0.03 and 0.60 m/yr ± 0.01 m/yr for RG01. The strongest proportional increase could be seen in rock glaciers RG07 and RG02, where mean flow velocities increased by 485 % and 251 % and maximum flow velocities increased by 799 % and 383 %, respectively. In contrast, in the case of RG04, the average and maximum flow velocity was reduced by −11 % and −47 %, respectively.
The relative changes between the first and the last epoch regarding the remaining rock glaciers differed clearly and ranged between 23 % and 141 % for mean flow velocity and 22 % and 348 % for maximum flow velocity (Fig. 6).
Some rock glaciers also showed a local temporal peak in one or more epochs, which was characterised by higher flow rates. On rock glaciers RG01 and RG08, higher mean flow velocities were measured between 1953/54 and 1970/71 compared to the subsequent two epochs. Higher mean flow velocities were also observed on rock glaciers RG01, RG03, RG06 and RG08 in the epoch 1997 to 2006, compared to the epochs before and after, although caution is required in the interpretation due to the higher error values (mean error 0.08 m/yr) in this epoch.
Furthermore, rock glaciers did not move uniformly, but flow velocities varied spatially (Fig. 7). The zones of higher flow velocity were usually, but not always, located in the terminal section of the rock glacier. Exceptions were mainly RG03, which showed a gradual change in its flow pattern over time, and RG06, which showed its maximum flow velocities in an area above a thermokarst depression in particular in the latest epoch. On RG08 maximum flow velocities were measured in the terminal part, which gradually decreased and were close to zero in the most recent epoch, whereas the rest of the rock glacier accelerated from the epoch 1997–2006 onwards.
For all landforms, there were areas of varying extent that showed very little to no measurable movement over the entire study period (Fig. S2). Apart from these areas, most of the remaining rock glacier areas accelerated, especially from the epoch 1997–2006, though to varying degrees. The taper (entire area accelerated) and thickening (individual areas of different velocities) of the violin plots as well as the observation of the flow velocity maps give an indication for the acceleration of different zones of the individual rock glaciers studied (Fig. 7).
5.5 Surface elevation and volume changes
The calculation of the surface elevation and volume change could be carried out on a total of nine rock glaciers in four epochs. The volume changes in the investigated rock glaciers ranged from −9931 m3/yr ± 57 m3/yr (RG1, epoch 2012–2017) to 235 m3/yr ± 121 m3/yr (RG05, epoch 1953–1970) (Fig. 9). Since the mean annual surface elevation changes allow for a better comparison of rock glaciers of different sizes, we describe them in more detail in the text. However, the volumetric changes in the individual rock glaciers are also shown in Fig. 9. Since snow-covered areas had to be excluded from the analysis, and only the rock glacier body was considered, it is not possible to speak of a true mass balance. Possible drawbacks and consequences are discussed in Sect. 6.5.
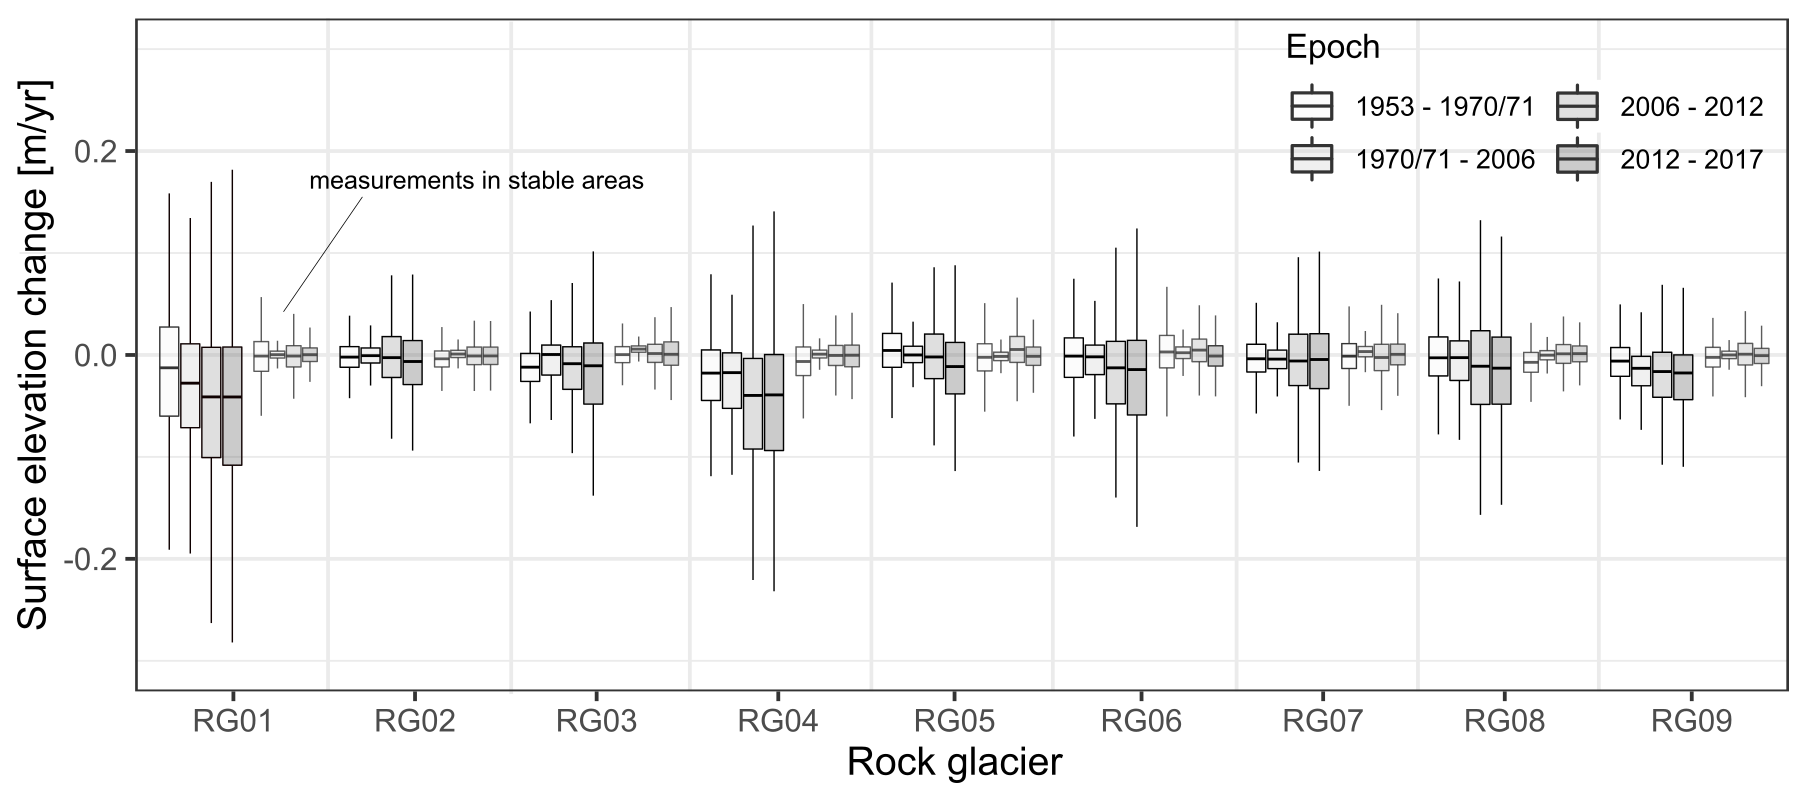
Figure 8Boxplots showing annual surface elevation changes on the single rock glaciers and corresponding stable areas (greyed out) for the four epochs between 1953 and 2017.
The mean values ranged from 0.005 m/yr ± 0.003 m/yr (RG05, epoch 1953–1970) to −0.047 m/yr ± 0.001 m/yr (RG04, epoch 2006–2012) (Fig. 9). In the entire study period, the values were predominantly in the negative range, with only three measurements showing positive values very close to zero. All rock glaciers showed values of surface elevation change in the negative and the positive range (Fig. 8). A clear difference could be seen in the temporal development of the surface and volume changes in different rock glaciers. On RG01, RG03, RG04 and RG09, negative values ranging between −0.022 m/yr ± 0.005 and −0.008 m/yr ± 0.002 m/yr already occurred in the first epoch and became increasingly negative in the following epochs, reaching values ranging between −0.046 m/yr ± 0.001 m/yr (RG04) and −0.021 m/yr ± 0.001 m/yr (RG03) in the last epoch. All of these rock glaciers were classified as GFC and were covered or partially covered by glaciers during the LIA (Table 4). On the other rock glaciers, which are of TC type, considering the uncertainties, there were no negative mean surface elevation changes or volume changes measurable in the first epoch. For RG02, RG05 and RG07 they only occurred in the last epoch between 2012 and 2017 and ranged from −0.015 m/yr ± 0.001 m/yr (RG05) to −0.003 m/yr ± 0.001 m/yr (RG07). In contrast, for RG06 and RG08, these already became increasingly negative from the epoch 1970–2006 onwards and in the last epoch showed values of −0.032 m/yr ± 0.001 m/yr (RG06) and −0.017 m/yr ± 0.001 m/yr (RG08).
The investigated rock glaciers differed not only in their temporal development but also in the magnitude of the change in surface elevation. RG01 and RG04 showed similar and very high values, and RG06, RG08 and RG 09 were similar, in the middle of the range. RG02, RG05 and RG07 showed values close to zero, with the exception of RG05, which had clearly negative values in the most recent epoch (Fig. 9). Figure 10 shows the spatial patterns of the surface changes in the rock glaciers and their temporal development. It can be seen that for a large part of the rock glaciers, the spatial patterns of positive and negative surface change remained relatively consistent, and the magnitude, mostly of the negative values, increased as time progresses. Exceptions to this spatial development are RG02, RG05 and RG07, where hardly any significant surface change was measured in the first epoch, and therefore a spatial pattern only emerged from 1970/71 onwards.

Figure 9Mean annual volume change and mean annual surface elevation change in the individual rock glaciers for four epochs between 1953 and 2017. Black error bars give the uncertainty in measurements.
RG04 only showed negative values of surface elevation change in the upper part in the first epoch, which were measured on the entire rock glacier from the second epoch onwards. Probably the greatest exception in the case of spatial patterns was RG08. After high values of both positive and negative surface elevation change were measured in the terminal area between 1953 and 2006, only small negative changes could be observed in this area thereafter. From 1971 onwards, however, the upper part of the rock glacier showed increasingly negative values.
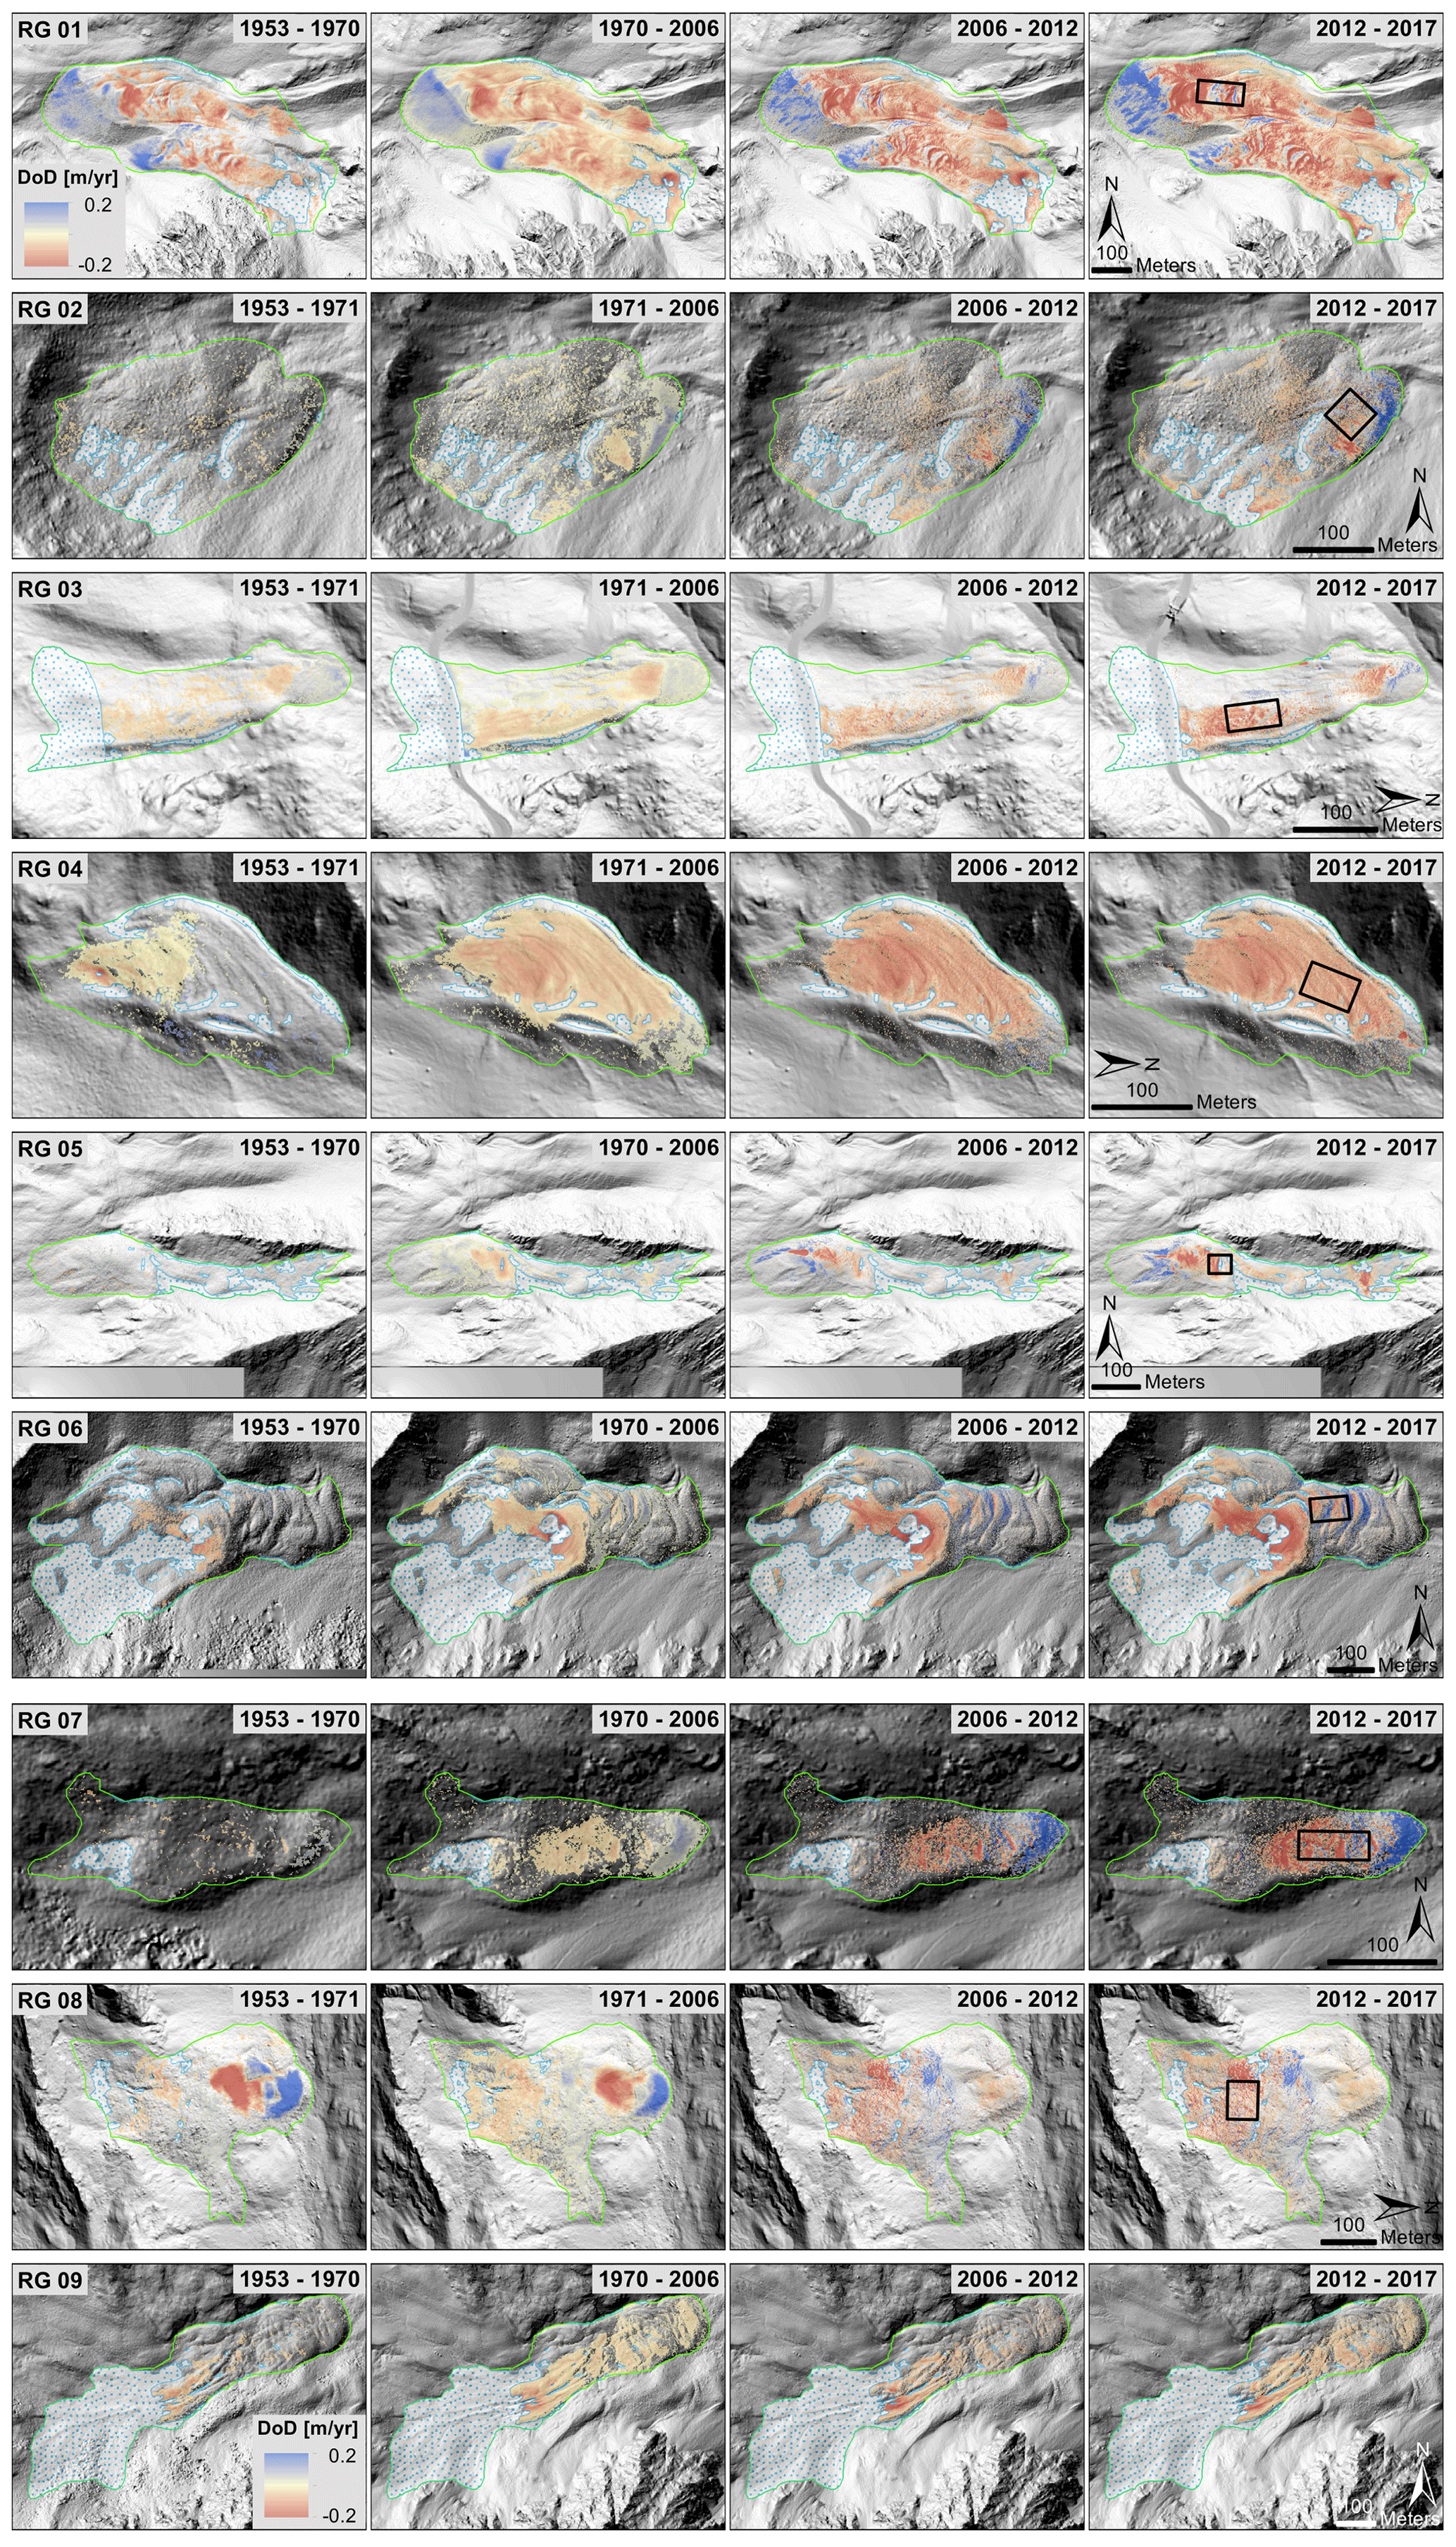
Figure 10Mean annual surface elevation change maps for all individual rock glaciers and four epochs between 1953 and 2017. A LoD of twice the standard deviation of measurements in stable areas was applied for reasons of visualisation. The background image is a hillshade of the more recent DEM of the epoch. The white area with blue dots represents the snow mask. The black boxes in the maps of epoch 2012–2017 represent the respective subareas used for Fig. 11.
5.6 Interaction of surface elevation change and flow velocity
To be able to relate and compare both the changes in flow velocity and the surface elevation change, we have plotted their mean values for subareas of the individual rock glaciers in Fig. 11, with the subareas shown in Fig. 10. The subareas were selected according to the following criteria: (1) representative of the rock glacier, (2) both surface elevation change and flow velocity measurements available, (3) areas above the LoD of flow velocity, (4) homogeneous flow velocities, (5) no influence of obvious thermokarst deepening. To make the two variables comparable for the entire study period, the epoch division of the surface elevation change analysis, which is not as highly resolved in terms of temporal resolution, was used. Although the general pattern of the previous analysis of the entire rock glaciers of increasing velocities and increasingly negative mean surface elevation change values was confirmed, the subarea analysis showed a slightly different pattern for some rock glaciers in terms of values, magnitude of change and timing of change, particularly for the surface elevation changes. This is to be expected due to the spatial heterogeneity and the different temporal development of both the flow velocities and the surface elevation changes on some of the investigated rock glaciers as described in the previous chapters and illustrated in Figs. 7 and 10.
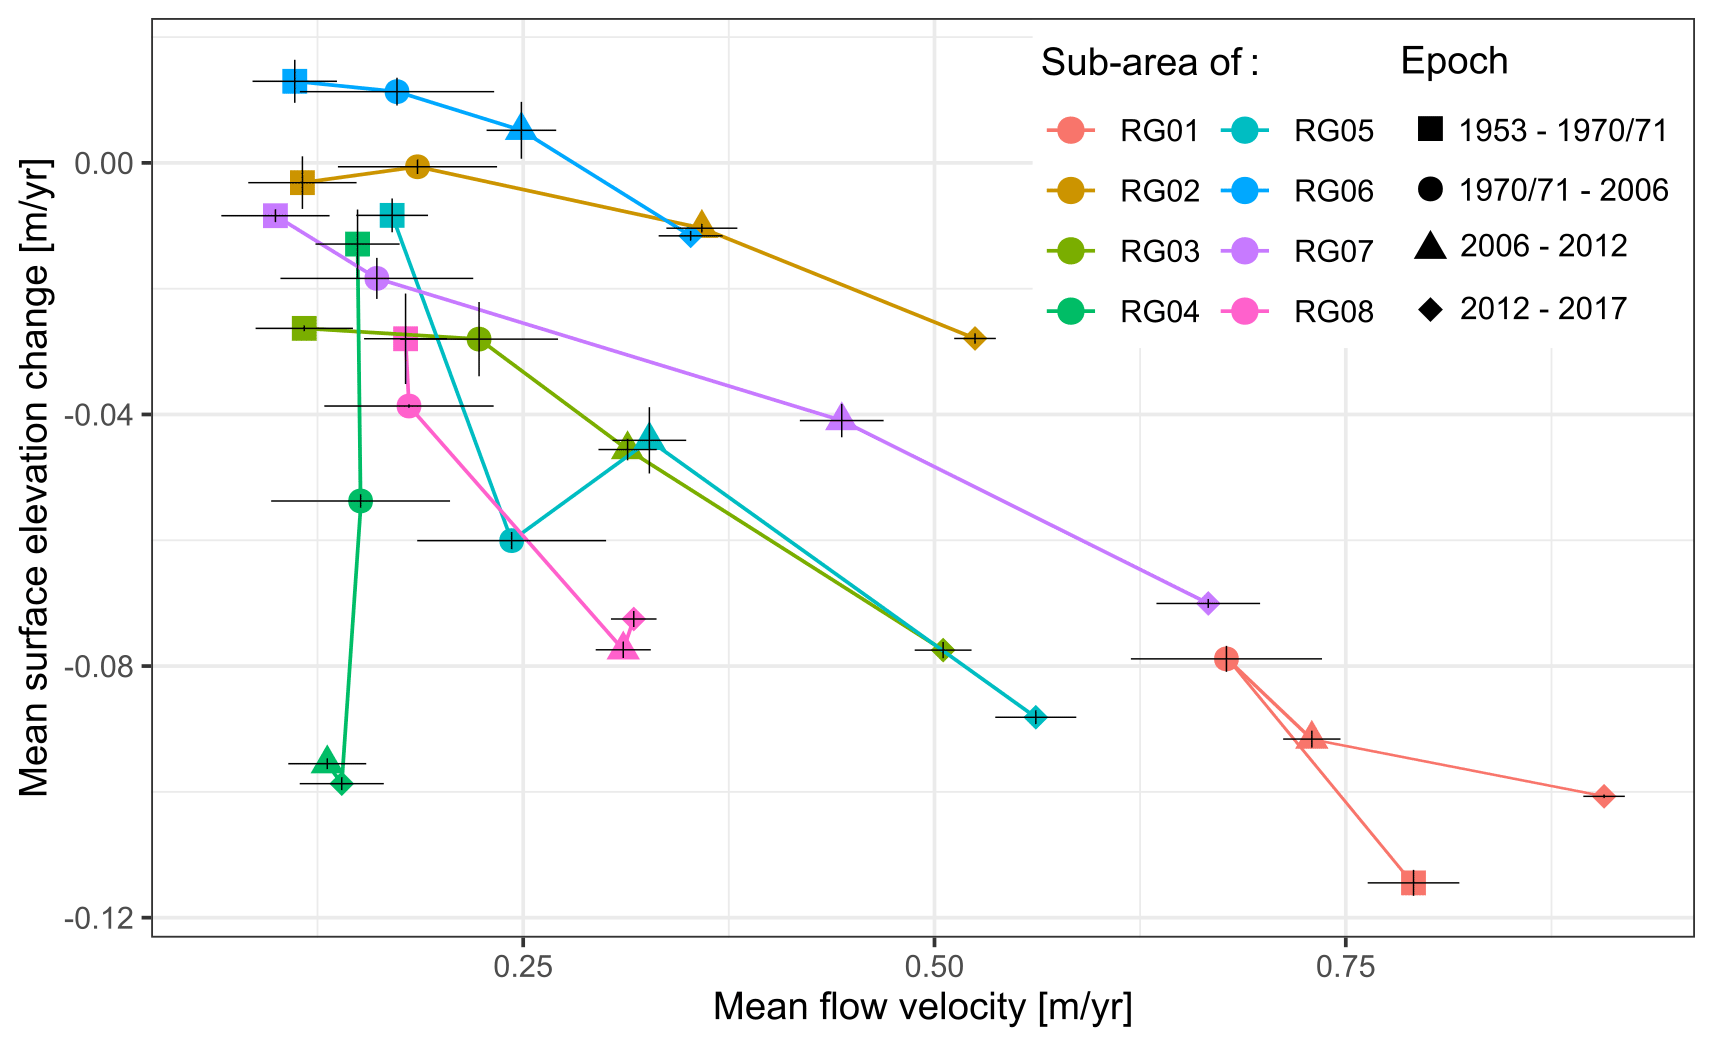
Figure 11Mean flow velocity plotted against mean surface elevation change for subareas of the investigated rock glaciers (indicated in Fig. 10) and the four epochs between 1953 and 2017. The black crosses represent the uncertainty in the mean flow velocity and the mean surface elevation change, respectively.
In the case of the subareas of the rock glaciers RG02, RG03, RG06, RG07 and RG08, the changes tended to be proportional to one another to a certain degree. Although the values of the subareas were obviously different from the mean values of the entire rock glaciers, both showed a similar temporal development. Whereas the values for RG02, RG03, RG06 and RG07 increased significantly in both epochs after 2006, RG08 showed a significant increase in both variables only between the epochs 1970–2006 and 2006–2012. Rock glaciers RG01, RG04 and RG05 showed a clear deviation from the behaviour described above since mean surface elevation change and flow velocity did not behave similarly. In addition, the observations in the subareas for RG01 and RG05 also differed from the observations made when considering the entire rock glaciers. RG04 showed no significant change in flow velocity, whereas the surface elevation changes between the three epochs between 1953 and 2012 increased significantly. In the case of RG01, the mean surface elevation change showed the most negative value in the epoch 1953–1970, becoming smaller again after a significant increase between 1970–2006. The flow velocity followed this trend but showed a higher value in the epoch 2012–2017 than in the first epoch. RG05, together with RG04, was the only one that showed significantly more negative surface elevation change values from epochs 1 to 2, whereas the flow velocity hardly increased. Between the epochs 2006–2012 and 2012–2017, the surface elevation changes became significantly more negative, and the flow velocity also increased sharply. In summary, in the case of the rock glacier subareas, the change in flow velocity and surface elevation change followed a similar trend. Exceptions to this could be observed in particular on rock glaciers RG04 and RG05.
6.1 Development of flow velocities in a regional context
The magnitude of the flow velocity of the studied rock glaciers was well within the range of the common movement of a few centimetres per year to a few metres per year over the entire study period (Delaloye et al., 2010). The timing of the acceleration of most rock glaciers in the 1997–2006 epoch also agreed well with other studies that have investigated the kinematics of rock glaciers in the European Alps over a multi-decadal period. All of these studies observed a significant acceleration of flow velocities in the early to late 1990s (Roer et al., 2005; Kellerer-Pirklbauer and Kaufmann, 2012; Micheletti et al., 2015; Scapozza et al., 2014; Hartl et al., 2016; Kaufmann et al., 2018; Kellerer-Pirklbauer and Kaufmann, 2018; Kellerer-Pirklbauer et al., 2018; Kenner et al., 2020). This is not surprising as an almost synchronicity of rock glacier flow velocity on an annual and multi-decadal scale has been ascertained for the European Alps (Delaloye et al., 2008, 2010).
Kellerer-Priklbauer and Kaufmann (2012) found values of 150 % to 320 % for relative changes in mean flow velocities for a similar period of study for three rock glaciers located in the Hohe Tauern Range, Austria. Furthermore, Roer (2005) determined values ranging from 16 % to 350 % investigating a multitude of rock glaciers located in the Turtmann valley, Switzerland. Therefore, our value range of 23 % to 251 %, except for RG04 (−11 %) and RG07 (485 %), agrees well with the previously determined multi-decadal relative velocity increases in rock glaciers. Conversely, rock glacier destabilisation, which is increasingly observed on rock glaciers in recent years (Roer et al., 2008; Scotti et al., 2017; Vivero and Lambiel, 2019; Marcer et al., 2021), could not be identified on any of the studied rock glaciers.
6.2 Atypical development of flow velocities
Although the magnitude of the change spatiotemporally varied both between individual rock glaciers and in different areas of the same rock glacier, the general trends observed throughout the Alps could be confirmed for most of the studied landforms. On the other hand, a few exhibited special characteristics, or an atypical behaviour could be detected. RG 08 is an example of how the lower part of a rock glacier can become inactive as flow velocities exceeded 1.5 m/yr in 1953–1971 in this area, progressively decreased until 2006 and were close to zero in the two most recent epochs. In the 2006–2017 epoch, a slight subsidence was still visible in this area, with a decreasing trend in the latest epoch. In contrast, as for most of the rock glaciers in our catchment, an acceleration of flow velocities was observed in the upper part of this rock glacier since the epoch 1997–2006. Here, we assume that the topography (terminal part overflowed escarpment and reached low slope valley floor) and altitude of the front of just 2510 m in combination with the separation of the upper part favoured the inactivation of the terminal part.
RG04 showed a clearly atypical temporal course of the flow velocities. These showed low mean values of well below 0.15 m/yr, no acceleration and back creeping movement in the upper part, which indicates that RG04 is a push moraine. Constant or even decreasing flow velocities on rock glaciers have also been observed by Roer (2005) on a multi-decadal scale. In recent years, for example, the Aget rock glacier (Lower Valais, Switzerland), which is also a push moraine, has followed such a course (PERMOS, 2019). In contrast, RG07 and RG02 showed flow velocities barely above the LoD (mean below 0.1 m/yr) in the epochs between 1953 and 1997, followed by the strongest proportional acceleration observed in the catchment. Such a behaviour of reactivation has already been described by Micheletti et al. (2015) for a small rock glacier in the Hérens valley (Switzerland). Beside rock glacier destabilisation, the proportional velocity increase in RG07 of 485 % was one of the highest compared to other studies, although its absolute speeds were not particularly high (cf. Roer, 2005; Kellerer-Pirklbauer and Kaufmann, 2012, 2018; PERMOS, 2019). Since rock glaciers RG 02, RG 07 and RG 04 show similar aspect, size and elevation ranges, we assume that the different behaviour might be explained by a topographic control (RG04 has a significantly lower mean slope), structural control (significant volume loss and LIA glacier cover of RG04 indicate high ice content, whereas RG02 and RG07 are of TC type and with the exception of the most recent epoch showed no or hardly any volume loss) or change in the mechanism of flow (creation or reactivation of a shear zone).
Another atypical development of flow velocities was observed in the case of RG05. Although a slight increase in flow velocity could already be ascertained in the terminal part during the epoch 1997–2006, a significant acceleration of the whole rock glacier was only observed in the epoch 2012–2017. This delayed reaction could be related to the relatively high altitude of the rock glacier (2702–3093 m) in combination with its location between two steep slopes. Although we have no annual data on this, all historical images show avalanche deposition, which have their origin in the steep adjacent slopes, over a large part of the rock glacier area (Fig. 10). This may have prevented effective heat transfer to the permafrost body of the rock glacier during the otherwise snow-free period until the last epoch, and therefore acceleration took place significantly later.
6.3 Possible implications of changes in external forcing for rock glacier flow velocities
Kenner et al. (2017) synthesise findings for external factors controlling rock glacier flow velocity. According to them, an increase in the permafrost temperature, which changes the viscosity, hardness, and shear and crushing strength of the permafrost ice, can thus increase its internal plastic deformation. Another factor would be the increase in water availability and water pressure, which reduces the friction resistance in the shear zone. The former is primarily determined by changes in air temperature, leading to changes in ground temperature and the timing and duration of snow cover. The latter can be controlled by precipitation, snowmelt, the formation of new drainage systems and melting permafrost ice. The following sections describe possible implications of changes in the meteorological forcing (Sect. 5.3) based on the development of the flow velocity for the six epochs between 1953 and 2017 (Sect. 5.4).
6.3.1 Temperature
As described by numerous studies, the development of temperatures, in particular ground surface temperatures, fits well with the development of flow velocities (e.g. Roer, 2005; Kääb et al., 2007; Delaloye et al., 2010; Scapozza et al., 2014; Hartl et al., 2016; Kenner et al., 2017, 2020). Even though they are not covered in Fig. 12, we observed exclusively positive temperature anomalies ranging between 0.5 and 1 ∘C between 1946–1951. Relatively warm temperatures were measured throughout the Alps during this period (Beniston, 2006). This could be a possible explanation for the local peak in flow velocities of RG01 and RG08 between 1953 and 1971. This phenomenon has also been observed in the Austrian Alps by Kellerer-Pirklbauer and Kaufmann (2012) and Kellerer-Pirklbauer et al. (2018) and for the Swiss Alps by Kenner et al. (2020) and is explained by decennial variations in mean annual air temperature (Delaloye et al., 2010). Since only the two rock glaciers that are located at the lowest elevation showed this reaction, this might indicate that the remaining rock glaciers have not yet reached a certain system state and have therefore hardly or not at all reacted to the increased temperatures of this period.
Looking at the strong increase in flow velocities from 1997 onwards, it appears that mainly spring and summer temperatures were likely to be responsible for the increase as the average winter temperature actually decreased, and the mean autumn temperature remained constant in the case of the sharp increase in the epoch 1997–2006. This is also supported by the fact that years with exceptionally high positive winter anomalies between 1982 and 1997 did not lead to an increase in flow velocities on the studied rock glaciers. As the positive spring and summer anomalies already began in the first half of the epoch 1982–1997, while a sharp increase in flow velocities was only evident from 1997 onwards, it shows that the increase in flow velocity, if simply controlled by temperature, is slightly delayed. This might be due to a delayed warming of the permafrost ice or to the duration of the formation of new drainage systems (Kenner et al., 2017, 2020), which also might explain the varying magnitude of the increases. The local peak of some rock glaciers between 1997 and 2006 could be explained by the particularly strong increase in spring temperatures or by the heatwave in the summer of 2003, which has also led to flow velocity peaks in annual studies (e.g. Kellerer-Pirklbauer and Kaufmann, 2012, 2018; PERMOS, 2019). The further increase in flow velocities in the epoch 2012–2017 could be due to the fact that, in addition to spring and summer temperatures, winter and autumn temperatures also showed exclusively positive anomalies in this time step. The low, otherwise constant or falling flow velocities in the period 1970/71 to 1982, on the other hand, fit in well with the relatively low summer and autumn temperatures.
6.3.2 Precipitation
While many studies, especially recent ones, emphasise the role of liquid water in rock glacier movement (Ikeda et al., 2008), especially in the shear horizon (Kenner et al., 2017; Cicoira et al., 2019; Kenner et al., 2020), only some show a correlation between precipitation and movement (Micheletti et al., 2015; Hartl et al., 2016; Eriksen et al., 2018), while others find no or only a weak connection (Kenner et al., 2017, 2020). Kenner et al. (2020) give an increase in runoff efficiency due to the formation of new drainage pathways in the permafrost body as a main reason for the observed acceleration.
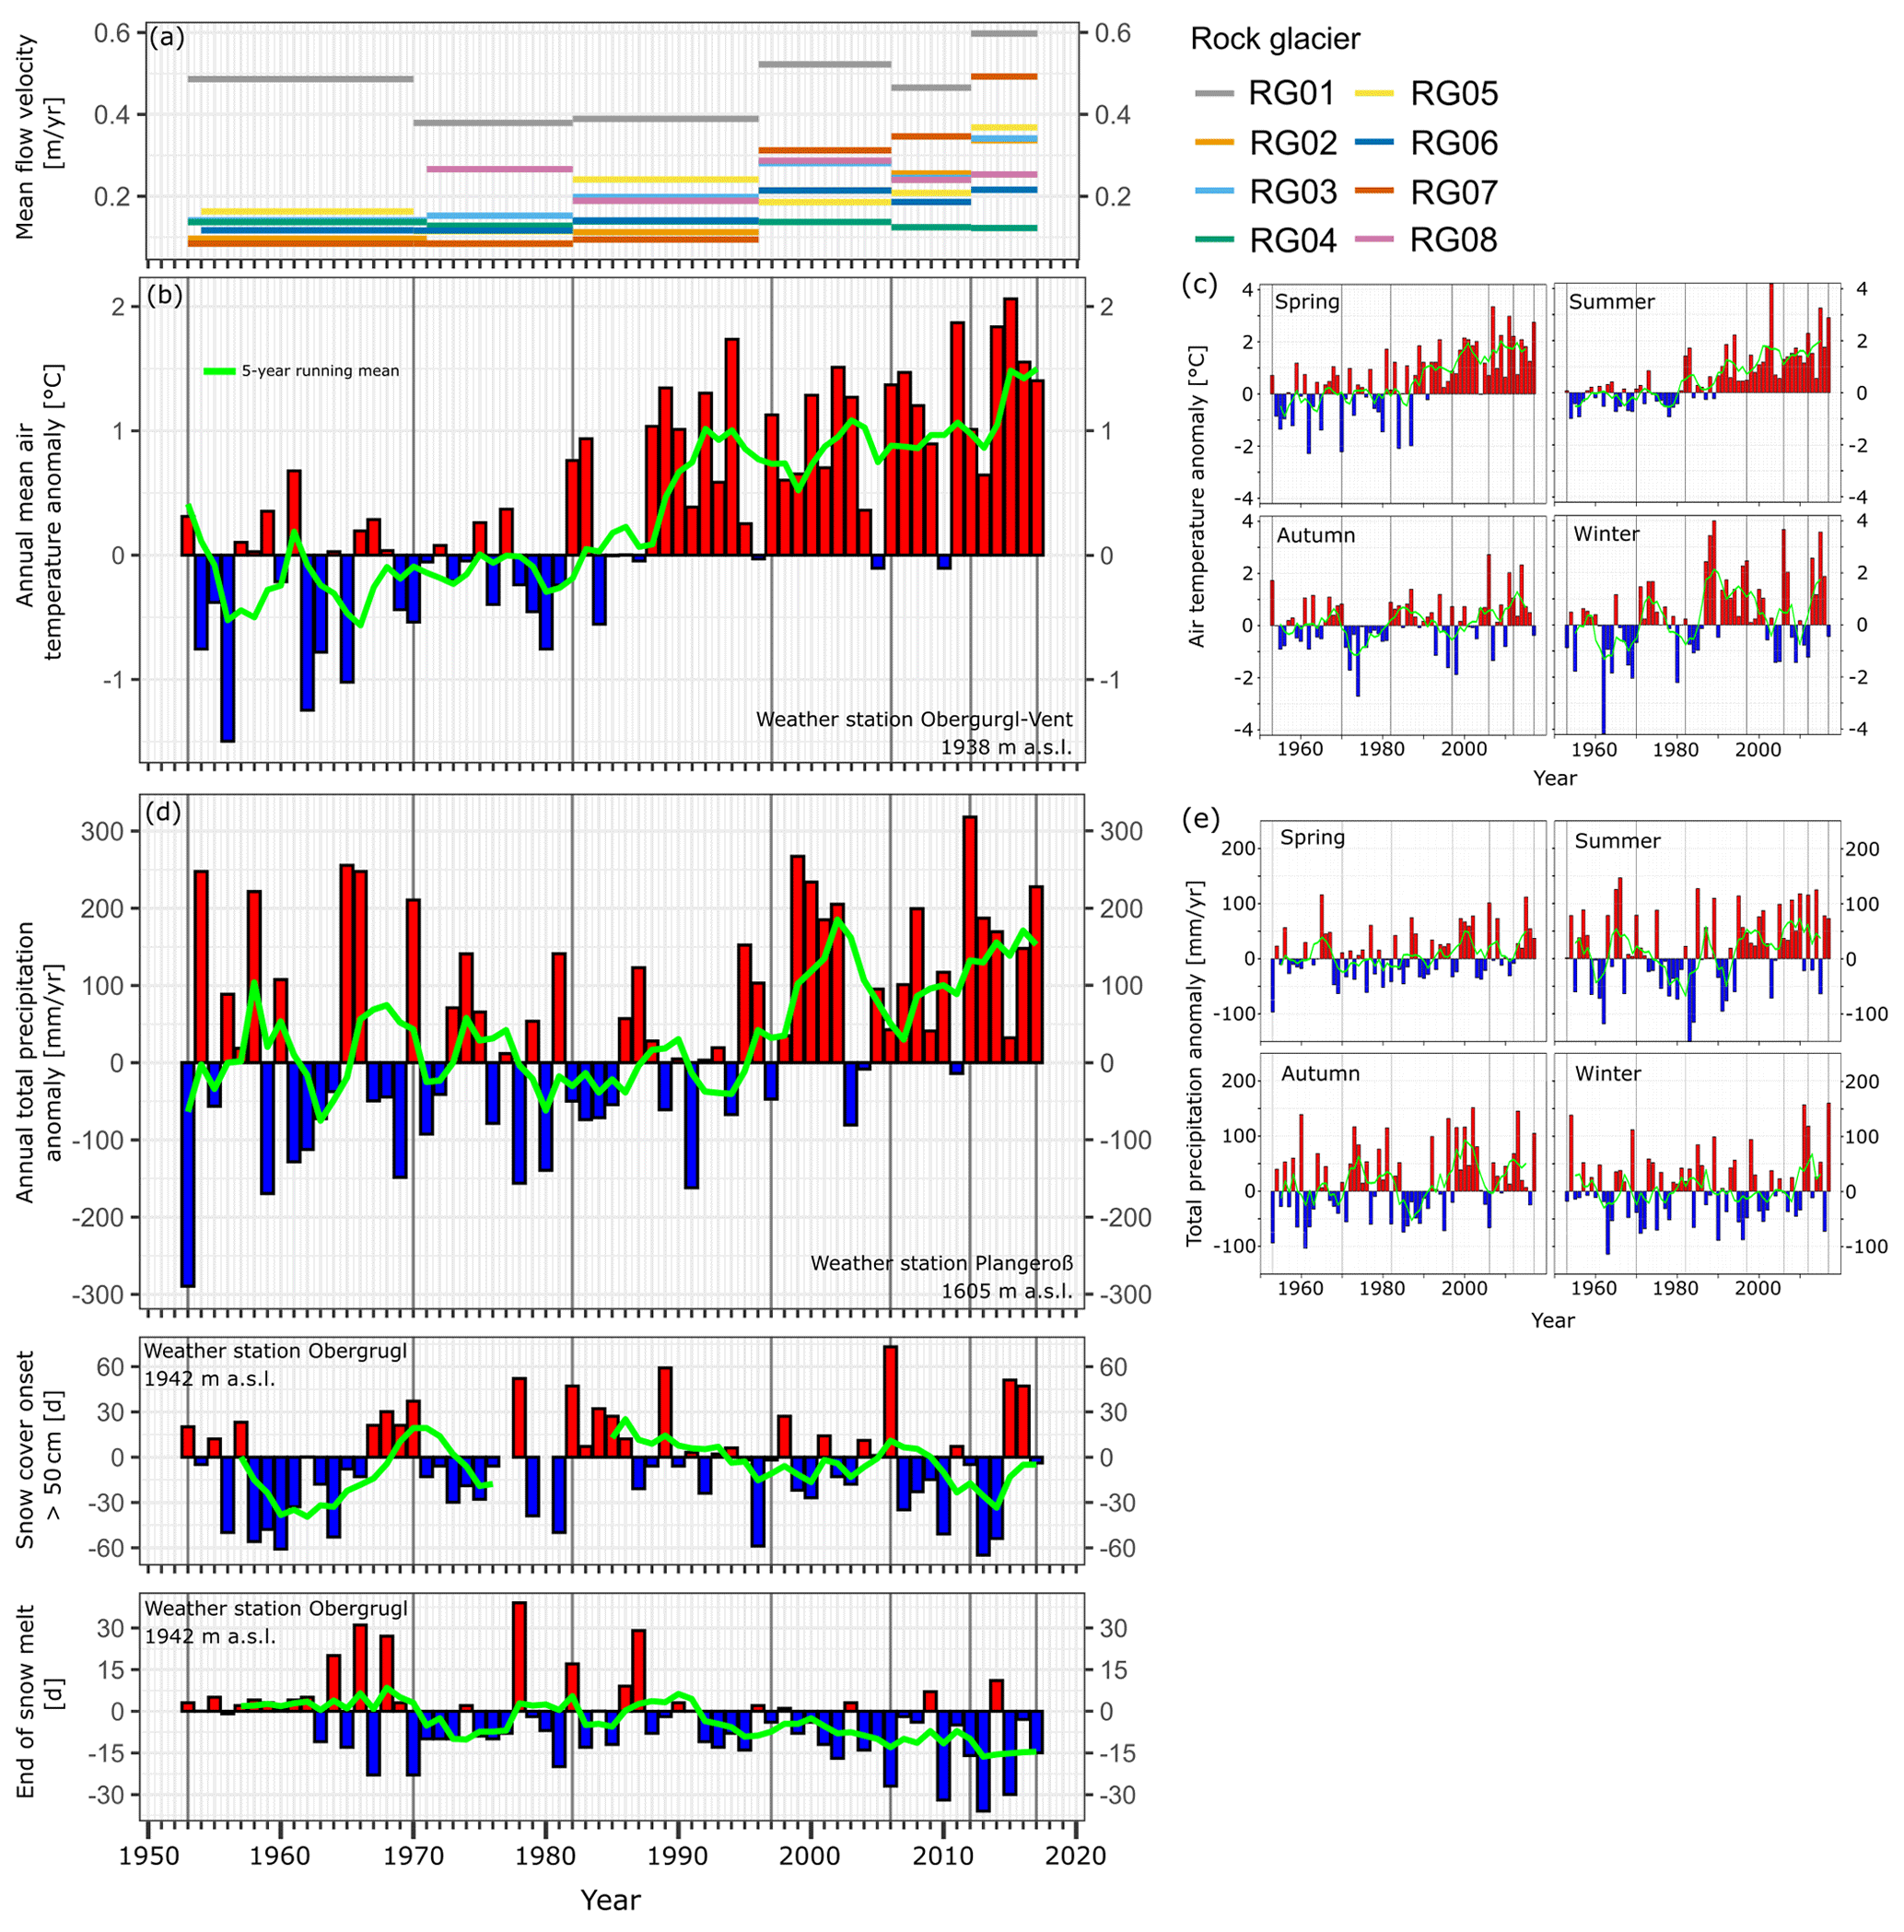
Figure 12Flow velocity variation in the context of climatic forcing. (a) Mean flow velocities of individual rock glaciers for six epochs between 1953 and 2017. (b) Annual mean air temperature anomalies and (c) seasonal mean air temperature anomalies at the weather station Obergurgl-Vent (1938 m a.s.l.). (d) Annual total precipitation anomalies and (e) seasonal total precipitation anomalies at the weather station Plangeroß (1605 m a.s.l.). (f) Onset of a significant snow cover (> 50 cm), (g) end of snowmelt at the station Obergurgl (1942 m a.s.l.). For (c) and (e) spring is defined as March–May, summer as June–August, autumn as September–November and winter as December–February. The reference period for the anomaly calculations is 1961–1990.
In our study, the development of flow velocities also corresponded well with the development of precipitation. Although a direct connection cannot be proven by the qualitative analysis. In the epoch from 1953 to 1997, no clear accumulation of positive or negative anomalies can be observed in the individual time steps. In the case of the epoch 1971 to 1997, the negative summer anomalies were balanced out by positive autumn anomalies and vice versa. In the epoch from 1997 to 2006 and between 2012 and 2017, positive precipitation anomalies occurred for spring as well as for summer and autumn. This did not apply to the epoch from 2006 to 2012, where only positive summer anomalies were increasingly observed. As this development fits in well with the determined flow velocities, the availability of water by liquid precipitation might influence acceleration in our catchment, as suggested by Micheletti et al. (2015) for rock glaciers in the Hérens valley (Switzerland).
6.3.3 Snow cover
The onset and duration of snow cover have been shown to be important factors for the development of rock glacier flow velocities as they control the time span of liquid water availability as well as the temperature in the subsurface due to the winter cooling intensity (Kenner et al., 2017, 2020). As for the other two parameters, temperature and precipitation, links could be found between the temporal development of snow cover and the evolution of flow velocities in the rock glaciers studied. In the last three epochs from 1997 to 2017 and in the case of significant snow cover (> 50 cm) in the last two epochs between 2006–2017, the snow cover set in relatively early. In combination with the amount of snow and the temperature, this could decrease the rock glacier deceleration in winter by isolating the rock glacier from cold winter temperatures, which in turn favours warming in spring and summer (Wirz et al., 2016). This could have led to an increase in the flow velocity, especially in the most recent time period. This is also suggested as an explanation for the velocity peak in 2015, which was recorded on many rock glaciers in the Alps in annual measurements (PERMOS, 2019). Although we cannot resolve this in terms of temporal resolution, the epoch 2012–2017 showed higher values on all rock glaciers than 2006–2012, and winters of both 2013/14 and 2014/15 showed a very early development of significant snow cover, although the following winters showed a contrasting development (Fig. 12).
Another factor that could be identified from the analysis of snow data is the end of snowmelt, which showed a negative trend over the study period and, especially from the beginning of the 1990s, almost exclusively negative anomalies. This is of great importance for the development of the velocity of rock glaciers as Wirz et al. (2016) show that seasonal rock glacier acceleration coincides with zero curtain during snowmelt. Kenner et al. (2020) give the end of active layer freezing and start of snowmelt as one of the most important factors controlling rock glacier flow velocities. Therefore, the timing of the end of snowmelt in the catchment might be seen as another factor for the acceleration observed.
In the period before 1997, it was more difficult to establish a connection. This may be due to the fact that the time periods were longer, and thus positive and negative anomalies balance each other out, but possibly also to the fact that the factor snow cover must always be seen in connection with the temperature, which only changed drastically from the beginning of the 1990s. This may have potentially led to the formation of new drainage systems, causing a tipping point of flow velocities to a higher level, which in turn might have changed the value of the influence of the snow cover and precipitation on the flow velocities.
6.4 Surface elevation changes in a regional context
The mean surface elevation changes ranged from −0.047 m/yr ± 0.001 to 0.005 m/yr ± 0.003 m/yr for all rock glaciers during the whole period of investigation. Although, to the best of our knowledge, there are only a few studies that examine surface elevation change and volume change in rock glaciers on a comparable temporal scale, their results are in good agreement with this study in terms of the magnitude of the values. For example, the Hintere Langtalkar rock glacier, located in the Hohe Tauern Range, Austria, which was partially covered by LIA glaciers, showed increasingly negative values between 0.016 and 0.058 m/yr and a sharp increase in the period 2002–2006 (Kellerer-Pirklbauer and Kaufmann, 2018). In terms of temporal development and magnitude, this compares well with RG01 and RG04 of this study.
Kaufmann et al. (2018) derived values of −0.0008 to −0.013 m/yr for Tschadinhorn rock glacier (Hohe Tauern Range, Austria). Although we found similar value ranges in our study, the temporal development differed since after an increase in negative values from 1953–2009, values very close to zero were recorded in the most recent epoch 2009–2015, whereas for the rock glaciers with comparable value ranges in our study there was a steady increase in either negative values (RG03, RG06, RG08, RG 09) or values very close to zero followed by a negative surface elevation change in the last epoch between 2012–2017 (RG05).
6.5 Interpretation and implications of surface elevation changes
Although an attempt was made to cover the entire area of the rock glaciers by analysing the surface elevation change, snow-covered areas had to be masked out for all epochs in order to increase comparability. Therefore, one cannot speak of a mass balance in the strictest sense; nevertheless, the temporal comparison of the rock glaciers allowed for interpretations to be made.
The surface elevation change in rock glaciers reflects the sum of the downslope movement, the strain pattern (compression and extension), compaction, debris input, and aggradation and melting of ice. Therefore, surface elevation changes close to zero result either because no significant surface elevation change has occurred (e.g. RG02 1953–1971) or because the aforementioned processes that lead to positive and negative changes compensate each other (e.g. RG08 1953–1971). The only area of substantial surface elevation gains on most rock glaciers was the front indicating a rock glacier advance or the front of flow bulges, particularly pronounced on RG01 and RG06, which was also largely due to the movement of the rock glacier (Frehner et al., 2015). Major debris mass input onto the rock glacier transport system in the rooting zone of the rock glacier due to larger rockfalls could not be observed. Masking out the patches of snow that often cover the root zones could however prevent such detection on some rock glaciers. These are particularly pronounced on TC-type rock glaciers RG05, RG06 and RG09 and might be an indication of both snow and debris input from avalanches in the rooting zone of these rock glaciers.
Over time, there was a clear tendency towards negative values of varying degrees on the individual rock glaciers, indicating a successive subsidence of the landforms at a rate of only a few centimetres per year. Although we could not clearly separate the individual processes that led to this in this study, we argue that this was mainly due to the melting of ice, loss of pore space or compaction of debris, which clearly outweighed the processes that led to positive changes.
If the negative mean surface elevation changes were mainly due to ice melt, the melt rate increased more and more on a majority of the rock glaciers during the investigated period. It is striking that the TC-type rock glaciers showed lower melt rates and that the mean surface elevation changes in three cases (RG02, RG05 and RG07) were only significantly negative in the most recent epoch. In contrast, GFC-type rock glaciers that were at least partially covered by LIA glaciers showed significantly higher values. As these rock glaciers vary in size, exposure, elevation and slope, we explain this on the one hand by the fact that GFC-type rock glaciers have no connection with an active feeding mechanism; therefore mass input can just occur by congelation of water. On the other hand, they are characterised by a high ice content and contain large amounts of massive sedimentary ice due to the LIA glacier cover. This is proven for RG01 (Hausmann et al., 2012) and RG09 (Dusik et al., 2015) by geophysical investigations and is very likely due to the occurrence of thermokarst depressions on RG04 and a thermokarst lake on RG06. On the other hand, the fact that the mean surface elevation change for rock glaciers RG02, RG05 and RG07 was significantly negative only in the last epoch indicated an active feeding mechanism or ice aggregation, a low ice content, or efficient isolation of the ice contained. Although the exclusion of the snow-covered areas weakens the validity of the statement to some extent, especially for RG05, RG06 and RG09, many observations indicate that the melt of ice was exceeding the feeding of the rock glaciers, or there is no connection with any active feeding mechanism.
We conclude that the combination of different remote sensing techniques used in this study is well suited for the detection of flow velocity and surface elevation change in rock glaciers back to the middle of the 20th century. Thus, long-term trends in rock glacier kinematics could be identified and linked to climate changes over such a long period.
As a general result, we were able to demonstrate a significant increase in flow velocities in the epoch 1997 to 2006 and an increase in subsidence to varying degrees over the entire study period. Both observations can be explained by changes in external forcing. The sharp increase especially in spring and summer temperatures since the 1990s led to a change in the flow properties of the permafrost body due to a warming of the permafrost ice. Although thawing of the permafrost ice could not be distinguished from compaction due to a loss of pore space, trends to negative mass balances suggest a progressive thaw of the permafrost body throughout the study period, which is more pronounced on GFC rock glaciers. Furthermore, the melting of the ice body might create new drainage systems. This results in more water being available to the system, which is crucial for horizontal movement in shear zones. Flow velocity in this catchment area could also be linked to changes in precipitation pattern, which again governs water availability and the onset and duration of snow cover, which controls the time span of liquid water availability as well as the temperature in the subsurface due to the winter cooling intensity.
Although we were able to identify a general trend in rock glacier kinematics, the catchment-wide view also showed a slightly different response of individual rock glaciers to similar external forcing regarding timing, magnitude and local temporal peaks. No characteristic could be identified that explains the different responses to external forcing over the entire study period. The different behaviour could be explained by different sensitivity, response or response time of individual rock glaciers to intra-annual, inter-annual or multi-annual fluctuations and changes in external forcing parameters. For some rock glaciers, internal structure and topography might explain different reactions as two rock glaciers of similar size, aspect, elevation and elevation range showed contrasting reactions of reactivation and constant flow velocities.
In addition, we were able to detect a rock glacier which shows an inactivation of its terminal part. By observing the surface elevation changes in all rock glaciers we conclude that the rates of rock glacier mass transport and volumetric losses of the rock glacier due to ice melt are much higher than debris and ice input, at least in those cases where an almost complete analysis of the entire rock glacier surface was possible. Therefore, the investigated rock glaciers are prone to starvation, which will eventually lead to rock glacier inactivation. However, since the current ice content of the rock glaciers is not known, and the analysis of future flow rates, melt rates, and ice and debris input was not the aim of this study, it is not possible to predict the timing of this inactivation.
We can also conclude that future studies are necessary to better understand the climate forcing on rock glacier morphodynamics. Therefore, the analysis should be transferred to other catchments in order to identify differences and similarities within the Alps. Surface elevation change and flow velocity analysis should be combined with downscaled reanalysis data to better understand catchment-wide differences in external forcing on a longer timescale. If possible, future studies should combine borehole measurements or geophysical investigation to shed light on the internal structure of rock glaciers and clarify some of the assumptions made in this study and possible explanations of their behaviour.
As a final important consideration, historical terrestrial images (if available) should be used with monoplotting tools. Mapping on such images would help to shorten the time span of the individual epochs, which is crucial to better differentiate the influence of individual forcing parameters as it is very likely that there are changes within our analysed epochs. Besides this, historical terrestrial images would offer the opportunity to expand the analysis back to the 19th century and thus closer to the LIA in order to study an important period in terms of massive system changes in the glacial and periglacial regions of the Alps.
The image correlation algorithm (IMCORR) used for the calculation of the rock glacier flow velocities is implemented in the open-source geoinformation system SAGA GIS. Furthermore, some modules of the commercial SAGA GIS extension SAGA LIS PRO 3D were used to calculate the surface elevation change in the rock glaciers. The software which was used to create digital elevation models and orthoimages from historical aerial images was the commercial software Agisoft Metashape.
The analysed metrological data are available from the “Federal Ministry of Agriculture, Regions and Tourism” (BMLRT), the “Central Institute for Meteorology and Geodynamics” (ZAMG), the “Historical Instrumental Climatological Surface Time Series of the Greater Alpine Region” (HISTALP), the “Autonomous Province of Bozen/Bolzano”, and “Tyrolean Hydropower AG” (TIWAG). The aerial images used to create digital elevation models and orthoimages are available from the “Office of the Tyrolean Government – Department of Geoinformation” (https://www.tirol.gv.at/en/, Land Tirol, 2021) and the “Austrian Federal Office of Surveying and Metrology” (BEV) (http://www.bev.gv.at, BEV, 2021). The self-collected ALS data will presumably be made available after completion of the SEHAG (Sensitivity of High Alpine Geosystems to Climate Change Since 1850) research project.
The supplement related to this article is available online at: https://doi.org/10.5194/tc-15-5345-2021-supplement.
The study was conceptualised by FF, FH and MB. FF, LP, MA, JR, MP, MS, FH and MHW were responsible for data curation. The methodological approach was developed by FF, FH, LP, MP, TH, MA, JR, MS, MHW, NP and MB. The investigation and formal analysis were carried out by FF, FH and MP. Supervision was provided by FH, TH and MB. The original draft was written by FF and FH, while FF, FH, LP, MP, MA, JR, MHW and NP were involved in reviewing and editing. MB, FH, TH and NP were responsible for funding acquisition and project administration.
The contact author has declared that neither they nor their co-authors have any competing interests.
Publisher’s note: Copernicus Publications remains neutral with regard to jurisdictional claims in published maps and institutional affiliations.
The study was part of the SEHAG project (Sensitivity of High Alpine Geosystems to Climate ChangeSince 1850) and financially supported by the German Research Foundation (DFG) and the Austrian Science Fund (FWF). For providing the meteorological data, we would also like to acknowledge the Tyrolean Hydropower AG (TIWAG; Innsbruck, Austria); the Federal Ministry of Agriculture, Regions and Tourism (BMLRT; Vienna, Austria); the Central Institute for Meteorology and Geodynamics (ZAMG; Vienna, Austria); and the Autonomous Province of Bozen/Bolzano. We would like to acknowledge the Office of the Tyrolean Government (Department of Geoinformation, Innsbruck, Austria) for providing the historical images 1970 and 1971 as well as the corresponding camera calibration certificates. We would also like to thank the Austrian Federal Office of Surveying and Metrology (BEV; Vienna, Austria) for providing the historical aerial images of 1953/54, 1982 and 1997. We acknowledge the Kaunertaler Gletscherbahnen GmbH for the free use of the toll road in the upper Kaunertal. The open-access publication of this article was supported by the Open Access Fund of the Catholic University of Eichstätt-Ingolstadt.
This research has been supported by the Deutsche Forschungsgemeinschaft (grant nos. BE 1118/38-1, BE 1118/39-1, BE 1118/40-1, HA 5740/10-1, HE 5747/6-1, MA 6966/4-1 and LA 4426/1-1) and the Austrian Science Fund (grant no. 4062-N29).
This paper was edited by Andreas Vieli and reviewed by three anonymous referees.
Altmann, M., Piermattei, L., Haas, F., Heckmann, T., Fleischer, F., Rom, J., Betz-Nutz, S., Knoflach, B., Müller, S., Ramskogler, K., Pfeiffer, M., Hofmeister, F., Ressl, C., and Becht, M.: Long-Term Changes of Morphodynamics on Little Ice Age Lateral Moraines and the Resulting Sediment Transfer into Mountain Streams in the Upper Kauner Valley, Austria, Water, 12, 3375, https://doi.org/10.3390/w12123375, 2020.
Anderson, S. W.: Uncertainty in quantitative analyses of topographic change: error propagation and the role of thresholding, Earth Surf. Proc. Land., 44, 1015–1033, https://doi.org/10.1002/esp.4551, 2019.
Arenson, L., Hoelzle, M., and Springman, S.: Borehole deformation measurements and internal structure of some rock glaciers in Switzerland, Permafrost Periglac., 13, 117–135, https://doi.org/10.1002/ppp.414, 2002.
Bakker, M. and Lane, S. N.: Archival photogrammetric analysis of river-floodplain systems using Structure from Motion (SfM) methods, Earth Surf. Proc. Land., 42, 1274–1286, https://doi.org/10.1002/esp.4085, 2017.
Barsch, D.: Rockglaciers: Indicators for the Present and Former Geoecology in High Mountain Environments, Springer Series in Physical Environment, 16, Springer Berlin Heidelberg, Berlin, Heidelberg, 331 pp., 1996.
Beniston, M.: Mountain Weather and Climate: A General Overview and a Focus on Climatic Change in the Alps, Hydrobiologia, 562, 3–16, https://doi.org/10.1007/s10750-005-1802-0, 2006.
Berger, J., Krainer, K., and Mostler, W.: Dynamics of an active rock glacier (Ötztal Alps, Austria), Quaternary Res., 62, 233–242, https://doi.org/10.1016/j.yqres.2004.07.002, 2004.
Berthling, I.: Beyond confusion: Rock glaciers as cryo-conditioned landforms, Geomorphology, 131, 98–106, https://doi.org/10.1016/j.geomorph.2011.05.002, 2011.
Besl, P. J. and McKay, N. D.: A method for registration of 3-D shapes, IEEE T. Pattern Anal., 14, 239–256, https://doi.org/10.1109/34.121791, 1992.
Brardinoni, F., Scotti, R., Sailer, R., and Mair, V.: Evaluating sources of uncertainty and variability in rock glacier inventories, Earth Surf. Proc. Land., 44, 2450–2466, https://doi.org/10.1002/esp.4674, 2019.
Buchli, T., Kos, A., Limpach, P., Merz, K., Zhou, X., and Springman, S. M.: Kinematic investigations on the Furggwanghorn Rock Glacier, Switzerland, Permafrost Periglac., 29, 3–20, https://doi.org/10.1002/ppp.1968, 2018.
Buckel, J. and Otto, J.-C.: The Austrian Glacier Inventory GI 4 (2015) in ArcGis (shapefile) format, supplement to: Buckel, Johannes; Otto, Jan-Christoph; Prasicek, Günther; Keuschnig, Markus (2018): Glacial lakes in Austria – Distribution and formation since the Little Ice Age, Global Planet. Change, 164, 39–51, 2018.
Bundesamt für Eich- und Vermessungswesen (BEV): http://www.bev.gv.at, last access: 15 September 2021.
Cicoira, A., Beutel, J., Faillettaz, J., and Vieli, A.: Water controls the seasonal rhythm of rock glacier flow, Earth Planet. Sc. Lett., 528, 115844, https://doi.org/10.1016/j.epsl.2019.115844, 2019.
Clark, D. H., Steig, E. J., Potter, J. N., and Gillespie, A. R.: Genetic variability of rock glaciers, Geogr. Ann. A, 80, 175–182, https://doi.org/10.1111/j.0435-3676.1998.00035.x, 1998.
Delaloye, R., Perruchoud, E., Avian, M., Kaufmann, V., Bodin, X., Hausmann, H., Ikeda, A., Kääb, A., Kellerer-Pirklbauer, A., Krainer, K., Lambiel, C., Mihajlovic, D., Staub, B., Roer, I., and Thibert, E.: Recent interannual variations of rock glacier creep in the European Alps, in: 9th International Conference on Permafrost, Fairbanks, Alaska, 29 Juni–3 Juli 2008, 343–348, https://doi.org/10.5167/uzh-7031, 2008.
Delaloye, R., Lambiel, C., and Gärtner-Roer, I.: Overview of rock glacier kinematics research in the Swiss Alps, Geogr. Helv., 65, 135–145, https://doi.org/10.5194/gh-65-135-2010, 2010.
Dusik, J.-M., Leopold, M., Heckmann, T., Haas, F., Hilger, L., Morche, D., Neugirg, F., and Becht, M.: Influence of glacier advance on the development of the multipart Riffeltal rock glacier, Central Austrian Alps, Earth Surf. Proc. Land., 40, 965–980, https://doi.org/10.1002/esp.3695, 2015.
Eriksen, H. Ø., Rouyet, L., Lauknes, T. R., Berthling, I., Isaksen, K., Hindberg, H., Larsen, Y., and Corner, G. D.: Recent Acceleration of a Rock Glacier Complex, Ádjet, Norway, Documented by 62 Years of Remote Sensing Observations, Geophys. Res. Lett., 45, 8314–8323, https://doi.org/10.1029/2018GL077605, 2018.
Fawcett, D., Blanco-Sacristán, J., and Benaud, P.: Two decades of digital photogrammetry: Revisiting Chandler's 1999 paper on “Effective application of automated digital photogrammetry for geomorphological research” – a synthesis, Prog. Phys. Geogr., 43, 299–312, https://doi.org/10.1177/0309133319832863, 2019.
Fey, C. and Krainer, K.: Analyses of UAV and GNSS based flow velocity variations of the rock glacier Lazaun (Ötztal Alps, South Tyrol, Italy), Geomorphology, 365, 107261, https://doi.org/10.1016/j.geomorph.2020.107261, 2020.
Finsterwalder, S.: Begleitworte zur Karte des Gepatschferners, in: Zeitschrift für Gletscherkunde, 16, 20–41, 1928.
Fischer, A., Seiser, B., Stocker Waldhuber, M., Mitterer, C., and Abermann, J.: Tracing glacier changes in Austria from the Little Ice Age to the present using a lidar-based high-resolution glacier inventory in Austria, The Cryosphere, 9, 753–766, https://doi.org/10.5194/tc-9-753-2015, 2015.
Fliri, F.: Das Klima der Alpen im Raume von Tirol, Monographien zur Landeskunde Tirol, Folge 1, Universitätsverlag, Innsbruck, 454 pp., 1975.
Frehner, M., Ling, A. H. M., and Gärtner-Roer, I.: Furrow-and-Ridge Morphology on Rockglaciers Explained by Gravity-Driven Buckle Folding: A Case Study From the Murtèl Rockglacier (Switzerland), Permafrost Periglac., 26, 57–66, https://doi.org/10.1002/ppp.1831, 2015.
Glira, P., Pfeifer, N., Briese, C., and Ressl, C.: A Correspondence Framework for ALS Strip Adjustments based on Variants of the ICP Algorithm < BR > Korrespondenzen für die ALS-Streifenausgleichung auf Basis von ICP, Photogrammetrie – Fernerkundung – Geoinformation, 2015, 275–289, https://doi.org/10.1127/pfg/2015/0270, 2015.
Groh, T. and Blöthe, J. H.: Rock Glacier Kinematics in the Kaunertal, Ötztal Alps, Austria, Geosciences, 9, 373, https://doi.org/10.3390/geosciences9090373, 2019.
Haeberli, W., Hallet, B., Arenson, L., Elconin, R., Humlum, O., Kääb, A., Kaufmann, V., Ladanyi, B., Matsuoka, N., Springman, S., and Mühll, D. V.: Permafrost creep and rock glacier dynamics, Permafrost Periglac., 17, 189–214, https://doi.org/10.1002/ppp.561, 2006.
Hartl, L., Fischer, A., Stocker-waldhuber, M., and Abermann, J.: Recent speed-up of an alpine rock glacier: an updated chronology of the kinematics of outer hochebenkar rock glacier based on geodetic measurements, Geogr. Ann. A, 98, 129–141, https://doi.org/10.1111/geoa.12127, 2016.
Hausmann, H., Krainer, K., Brückl, E., and Ullrich, C.: Internal structure, ice content and dynamics of Ölgrube and Kaiserberg rock glaciers (Ötztal Alps, Austria) determined from geophysical surveys, Austrian J. Earth Sci., 105, 12–31, 2012.
Heid, T. and Kääb, A.: Evaluation of existing image matching methods for deriving glacier surface displacements globally from optical satellite imagery, Remote Sens. Environ., 118, 339–355, https://doi.org/10.1016/j.rse.2011.11.024, 2012.
Hock, R., Rasul, G., Adler, C., Caceres, S., Gruber, S., Hirabayashi, Y., Jackson, M., Kääb, A., Kang, S., Kutuzov, S., Milner, A., Molau, U., Morin, S., Orlove, B., and Steltzer, H.: High Mountain Areas, in: IPCC Special Report on the Ocean and Cryosphere in a Changing Climate, edited by: Pörtner, H.-O., Roberts, D. C., Masson-Delmotte, V., Zhai, P., Tignor, M., Poloczanska, E., Mintenbeck, K., Alegria, A., Nicolai, M., Okem, A., Petzold, J., Rama, B., and Weyer, N. M., 2019.
Hoinkes, G. and Thöni, M.: Evolution of the Ötztal-Stubai, Scarl-Campo and Ulten Basement Units, in: Pre-Mesozoic Geology in the Alps, edited by: von Raumer, J. F. and Neubauer, F., Springer Berlin Heidelberg, Berlin, Heidelberg, 485–494, https://doi.org/10.1007/978-3-642-84640-3_29, 1993.
Ikeda, A., Matsuoka, N., and Kääb, A.: Fast deformation of perennially frozen debris in a warm rock glacier in the Swiss Alps: An effect of liquid water, J. Geophys. Res., 113, 212, https://doi.org/10.1029/2007JF000859, 2008.
Jones, D. B., Harrison, S., Anderson, K., and Whalley, W. B.: Rock glaciers and mountain hydrology: A review, Earth-Sci. Rev., 193, 66–90, https://doi.org/10.1016/j.earscirev.2019.04.001, 2019.
Kääb, A. and Vollmer, M.: Surface Geometry, Thickness Changes and Flow Fields on Creeping Mountain Permafrost: Automatic Extraction by Digital Image Analysis, Permafrost Periglac., 11, 315–326, https://doi.org/10.1002/1099-1530(200012)11:4<315:AID-PPP365>3.0.CO;2-J, 2000.
Kääb, A., Chiarle, M., Raup, B., and Schneider, C.: Climate change impacts on mountain glaciers and permafrost, Global Planet. Change, 56, vii–ix, https://doi.org/10.1016/j.gloplacha.2006.07.008, 2007.
Kääb, A., Strozzi, T., Bolch, T., Caduff, R., Trefall, H., Stoffel, M., and Kokarev, A.: Inventory and changes of rock glacier creep speeds in Ile Alatau and Kungöy Ala-Too, northern Tien Shan, since the 1950s, The Cryosphere, 15, 927–949, https://doi.org/10.5194/tc-15-927-2021, 2021.
Kaufmann, V. and Kellerer-Pirklbauer, A.: Regional quantification of rock glacier movement in Austria using governmental GIS data, in: Geomorphometry for geosciences: [this vol. is a contribution to the 4th International Conference on Geomorphometry; Geomorphometry 2015: Conference and Workshops; Geomorphometry for natural hazards geomodelling, Poznan (Poland), 22-26 June 2015], edited by: Jasiewicz, J., 165–168, 2015.
Kaufmann, V., Seier, G., Sulzer, W., Wecht, M., Liu, Q., Lauk, G., and Maurer, M.: ROCK GLACIER MONITORING USING AERIAL PHOTOGRAPHS: CONVENTIONAL VS. UAV-BASED MAPPING – A COMPARATIVE STUDY, Int. Arch. Photogramm. Remote Sens. Spatial Inf. Sci., XLII-1, 239–246, https://doi.org/10.5194/isprs-archives-XLII-1-239-2018, 2018.
Kaufmann, V., Sulzer, W., Seier, G., and Wecht, M.: Panta Rhei: Movement Change of Tschadinhorn Rock Glacier (Hohe Tauern Range, Austria), 1954–2017, Kartogr. Geoinf. (Online), 18, 4–24, https://doi.org/10.32909/kg.18.31.1, 2019.
Kellerer-Pirklbauer, A. and Kaufmann, V.: About the relationship between rock glacier velocity and climate parameters in central Austria, Austrian J. Earth Sci., 105, 94–112, 2012.
Kellerer-Pirklbauer, A. and Kaufmann, V.: Deglaciation and its impact on permafrost and rock glacier evolution: New insight from two adjacent cirques in Austria, Sci. Total Environ., 621, 1397–1414, https://doi.org/10.1016/j.scitotenv.2017.10.087, 2018.
Kellerer-Pirklbauer, A., Lieb, G. K., and Kaufmann, V.: The Dösen Rock Glacier in Central Austria: A key site for multidisciplinary long-term rock glacier monitoring in the Eastern Alps, Austrian J. Earth Sci., 110, 2, https://doi.org/10.17738/ajes.2017.0013, 2018.
Kenner, R., Phillips, M., Beutel, J., Hiller, M., Limpach, P., Pointner, E., and Volken, M.: Factors Controlling Velocity Variations at Short-Term, Seasonal and Multiyear Time Scales, Ritigraben Rock Glacier, Western Swiss Alps, Permafrost Periglac., 28, 675–684, https://doi.org/10.1002/ppp.1953, 2017.
Kenner, R., Pruessner, L., Beutel, J., Limpach, P., and Phillips, M.: How rock glacier hydrology, deformation velocities and ground temperatures interact: Examples from the Swiss Alps, Permafrost Periglac., 31, 3–14, https://doi.org/10.1002/ppp.2023, 2020.
Krainer, K. and Mostler, W.: Flow velocities of active rock glaciers in the Austrian Alps, Geogr. Ann. A, 88, 267–280, 2006.
Krainer, K. and Ribis, M.: A rock glacier inventory of the Tyrolean Alps (Austria), Austrian J. Earth Sci., 105, 32–57, 2012.
Krainer, K., Bressan, D., Dietre, B., Haas, J. N., Hajdas, I., Lang, K., Mair, V., Nickus, U., Reidl, D., Thies, H., and Tonidandel, D.: A 10,300-year-old permafrost core from the active rock glacier Lazaun, southern Ötztal Alps (South Tyrol, northern Italy), Quaternary Res., 83, 324–335, https://doi.org/10.1016/j.yqres.2014.12.005, 2015.
Kummert, M. and Delaloye, R.: Mapping and quantifying sediment transfer between the front of rapidly moving rock glaciers and torrential gullies, Geomorphology, 309, 60–76, https://doi.org/10.1016/j.geomorph.2018.02.021, 2018.
Land Tirol: https://www.tirol.gv.at/en/, last access: 15 September 2021.
Marcer, M., Cicoira, A., Cusicanqui, D., Bodin, X., Echelard, T., Obregon, R., and Schoeneich, P.: Rock glaciers throughout the French Alps accelerated and destabilised since 1990 as air temperatures increased, Commun. Earth Environ., 2, 383, https://doi.org/10.1038/s43247-021-00150-6, 2021.
Micheletti, N., Lambiel, C., and Lane, S. N.: Investigating decadal-scale geomorphic dynamics in an alpine mountain setting, J. Geophys. Res.-Earth, 120, 2155–2175, https://doi.org/10.1002/2015JF003656, 2015.
Monnier, S. and Kinnard, C.: Pluri-decadal (1955–2014) evolution of glacier–rock glacier transitional landforms in the central Andes of Chile (30–33° S), Earth Surf. Dynam., 5, 493–509, https://doi.org/10.5194/esurf-5-493-2017, 2017.
Olefs, M., Koch, R., Schöner, W., and Marke, T.: Changes in Snow Depth, Snow Cover Duration, and Potential Snowmaking Conditions in Austria, 1961–2020 – A Model Based Approach, Atmosphere, 11, 1330, https://doi.org/10.3390/atmos11121330, 2020.
Otto, J.-C., Schrott, L., and Keller, F.: Map of permafrost distribution for Austria, Europe, PANGAEA [data set], https://doi.org/10.1594/PANGAEA.917719, 2020
Paul, F., Bolch, T., Briggs, K., Kääb, A., McMillan, M., McNabb, R., Nagler, T., Nuth, C., Rastner, P., Strozzi, T., and Wuite, J.: Error sources and guidelines for quality assessment of glacier area, elevation change, and velocity products derived from satellite data in the Glaciers_cci project, Remote Sens. Environ., 203, 256–275, https://doi.org/10.1016/j.rse.2017.08.038, 2017.
Peng, S., Piao, S., Ciais, P., Friedlingstein, P., Zhou, L., and Wang, T.: Change in snow phenology and its potential feedback to temperature in the Northern Hemisphere over the last three decades, Environ. Res. Lett., 8, 14008, https://doi.org/10.1088/1748-9326/8/1/014008, 2013.
PERMOS: Permafrost in Switzerland 2014/2015 to 2017/2018, Swiss Permafrost Monitoring Network, Glaciological Report (Permafrost), No. 16–19, 2019.
Pillewizer, W.: Untersuchungen an Blockstrfmen der Ötztaler Alpen, Geomorphologische Abhandlungen des Geographischen Institutes derFU Berlin (Otto-Maull-Festschrift), 5, 37–50, 1957.
Rangwala, I. and Miller, J. R.: Climate change in mountains: a review of elevation-dependent warming and its possible causes, Climatic Change, 114, 527–547, https://doi.org/10.1007/s10584-012-0419-3, 2012.
Ravanel, L., Magnin, F., and Deline, P.: Impacts of the 2003 and 2015 summer heatwaves on permafrost-affected rock-walls in the Mont Blanc massif, Sci. Total Environ., 609, 132–143, https://doi.org/10.1016/j.scitotenv.2017.07.055, 2017.
Roer, I.: Rockglacier kinematics in a high mountain geosystem, Dissertation, Mathematisch-Naturwissenschaftliche Fakultät, Rheinische Friedrich-Wilhelms-Untiversität Bonn, Bonn, 263 pp., 2005.
Roer, I., Kääb, A., and Dikau, R.: Rockglacier acceleration in the Turtmann valley (Swiss Alps): Probable controls, Norsk Geogr. Tidsskr., 59, 157–163, https://doi.org/10.1080/00291950510020655, 2005.
Roer, I., Haeberli, W., Avian, M., Kaufmann, V., Delaloye, R., Lambiel, C., and Kääb, A.: Observations and considerations on destabilizing active rock glaciers in the European Alps, 9th International Conference on Permafrost, Fairbanks, Alaska, 29 June–3 July 2008, 1505–1510, 2008.
Scambos, T. A., Dutkiewicz, M. J., Wilson, J. C., and Bindschadler, R. A.: Application of image cross-correlation to the measurement of glacier velocity using satellite image data, Remote Sens. Environ., 42, 177–186, 1992.
Scapozza, C., Lambiel, C., Bozzini, C., Mari, S., and Conedera, M.: Assessing the rock glacier kinematics on three different timescales: a case study from the southern Swiss Alps, Earth Surf. Proc. Land., 39, 2056–2069, https://doi.org/10.1002/esp.3599, 2014.
Schoeneich, P., Bodin, X., Echelard, T., Kaufmann, V., Kellerer-Pirklbauer, A., Krysiecki, J.-M., and Lieb, G. K.: Velocity Changes of Rock Glaciers and Induced Hazards, in: Engineering Geology for Society and Territory – Volume 1, edited by: Lollino, G., Manconi, A., Clague, J., Shan, W., and Chiarle, M., Springer International Publishing, Cham, 223–227, https://doi.org/10.1007/978-3-319-09300-0_42, 2015.
Scotti, R., Crosta, G. B., and Villa, A.: Destabilisation of Creeping Permafrost: The Plator Rock Glacier Case Study (Central Italian Alps), Permafrost Periglac., 28, 224–236, https://doi.org/10.1002/ppp.1917, 2017.
Vivero, S. and Lambiel, C.: Monitoring the crisis of a rock glacier with repeated UAV surveys, Geogr. Helv., 74, 59–69, https://doi.org/10.5194/gh-74-59-2019, 2019.
Wirz, V., Gruber, S., Purves, R. S., Beutel, J., Gärtner-Roer, I., Gubler, S., and Vieli, A.: Short-term velocity variations at three rock glaciers and their relationship with meteorological conditions, Earth Surf. Dynam., 4, 103–123, https://doi.org/10.5194/esurf-4-103-2016, 2016.