the Creative Commons Attribution 4.0 License.
the Creative Commons Attribution 4.0 License.
 | 26 Oct 2021
Brief communication: Evaluation of the snow cover detection in the Copernicus High Resolution Snow & Ice Monitoring Service
Zacharie Barrou Dumont
Simon Gascoin
Olivier Hagolle
Michaël Ablain
Rémi Jugier
Germain Salgues
Florence Marti
Aurore Dupuis
Marie Dumont
Samuel Morin
The High Resolution Snow & Ice Monitoring Service was launched in 2020 to provide near-real-time, pan-European snow and ice information at 20 m resolution from Sentinel-2 observations. Here we present an evaluation of the snow detection using a database of snow depth observations from 1764 stations across Europe over the hydrological year 2016–2017. We find a good agreement between both datasets with an accuracy (proportion of correct classifications) of 94 % and kappa of 0.81. More accurate (+6 % kappa) retrievals are obtained by excluding low-quality pixels at the cost of a reduced coverage (−13 % data).
- Article
(1148 KB) - Full-text XML
-
Supplement
(110 KB) - BibTeX
- EndNote


The snow cover area, defined as the spatial extent of the snow cover on the land surface (Fierz et al., 2009), is a key variable in many hydrology, climatology and ecology studies. Earth observation satellites have been used to routinely map the snow cover area at continental scale since the late 1960s (Matson and Wiesnet, 1981). Such observations are increasingly used for meteorological, climate, hydrological, ecosystem and natural hazards applications. The Committee on Earth Observation Satellites has listed 19 operational remote sensing products which provide information on the spatial extent of the snow cover as either binary (snow/no-snow) or fractional (snow-covered fraction of the pixel area) representation. However, most of them have a spatial resolution of 500 m and above and therefore do not meet a range of user needs for both science and operational applications (Malnes et al., 2015). Previous studies suggest that the spatial scale of variability of snow depth is less than 100 m (e.g., Trujillo et al., 2007; Mendoza et al., 2020). In snow-dominated catchments, a fine description of snow cover property distribution is important to compute snowmelt (Freudiger et al., 2017). High-resolution snow cover maps reflect the spatial heterogeneity of the snow cover properties and can therefore be assimilated to improve snow water equivalent estimation (Margulis et al., 2016; Baba et al., 2018). High-resolution snow cover maps are also critical to understand plant species distribution in alpine and arctic ecosystems (Dedieu et al., 2016; Niittynen and Luoto, 2018). In the disaster management sector, high-spatial- and high-temporal-resolution snow products down to 50 m resolution were requested by road and avalanche authorities (Malnes et al., 2015). High-resolution snow cover maps can also be useful for outdoor activities.
On behalf of the European Commission, the European Environment Agency has commissioned the development and real-time production of the Copernicus High Resolution Snow & Ice products (HRSI), including a snow cover component to address these needs. In particular, this service provides a canopy-adjusted fractional snow cover (FSC) at 20 m resolution along with a cloud and cloud shadow mask and quality flags. The products are derived from Sentinel-2 observations, resulting in a revisit time less than or equal to 5 d. The products are distributed with a maximal latency of 3 h after the availability of the level 1C product in the Sentinel-2 mission ground segment, which means that they are generally available on the same day as the sensing time. The products are computed using MAJA (atmospheric correction and cloud detection) and LIS (snow detection and snow fraction calculation) software (Hagolle et al., 2015; Gascoin et al., 2019). The performance of the snow detection with this processing pipeline was previously evaluated over the French Alps and Pyrenees using snow depth records at 120 stations from the Météo-France database (Gascoin et al., 2019). The accuracy (proportion of correct classifications) was 94 % (κ= 0.83), with a higher false negative rate than the false positive rate. However, this evaluation was spatially limited to 10 Sentinel-2 tiles in France (a tile is 110 km by 110 km), whereas the HRSI products cover 1054 Sentinel-2 tiles over 39 countries in Europe. Any operational snow cover detection algorithm applied to optical multispectral imagery is challenged by spectral similarities between clouds and the snow cover (Stillinger et al., 2019), forest cover obstruction (Xin et al., 2012) and lack of solar irradiance during the winter, particularly in mountain regions (due to shading from the surrounding slopes) and high-latitude regions (due to low sun elevation). These factors vary significantly across Europe and could have been misrepresented by the former evaluation. In the aim of providing a more robust assessment of the snow product reliability to users of the service, we report here on a much more extensive evaluation using 1764 stations from 36 countries, covering a wider range of climate and topographic conditions. This evaluation was made possible thanks to a massive processing of the Sentinel-2 archive using MAJA and LIS to generate the HRSI collection (about 600 000 products, i.e., 500 TB of input data).
2.1 In situ data
The evaluation database was prepared by merging two datasets of in situ snow depth (height of snow, HS) measurements. First, we extracted daily snow depth measurements of 1094 SYNOP data (WMO automatic weather station) covering 36 countries. Then, we selected daily data from a recent compilation of snow depth measurements in the Alps (Matiu et al., 2021). The latter dataset consisted of 670 stations located in France, Italy and Germany. The evaluation period spans a hydrological year from 1 September 2017 to 31 August 2018. This period was chosen to take advantage of the 5 d revisit periodicity reached by the Sentinel-2 mission in September 2017 and because the Alps dataset is smaller after 2018. All values were rounded to the nearest centimeter. We combined all these data sources into a single dataset totaling 26 933 data points of daily snow depth measurements distributed across 36 countries in Europe (Fig. 1). A data point was classified as snow covered if HS was strictly greater than a threshold HS0. We tested the sensitivity to this threshold by calculating the confusion matrix between the FSC products and the reference dataset for 1 cm increments of HS0 from 0 to 10 cm (Klein and Barnett, 2003; Gascoin et al., 2015, 2019).

Figure 1Map of the study area and location of the in situ measurements. Each FSC (fractional snow cover) tile covers an area of 5490 by 5490 pixels of 20 m resolution.
2.2 Snow product
We used the on-ground fractional snow cover (FSCOG) layer but the analysis would be identical with the top-of-canopy layer (FSCTOC) as the canopy adjustment does not change the snow classification (HR-S&I consortium, 2020a). Pixels with values of 205 (cloud or cloud shadow) and 255 (no data) were set to “no data”. A pixel was classified as snow if 0 < FSC ≤ 100 and no-snow if FSC = 0. We matched each point of the reference dataset with the nearest pixel of an overlapping FSC product that was acquired on the same day, resulting in a maximal distance of 10√2 m between the pixel center and the station. If there was more than one matching FSC product on the same day, we selected one whose nearest pixel was neither cloud nor no data. We also assessed the impact of the quality layer on the performance. The QCFLAGS (quality control flags) layer provides bit-encoded quality flags to identify lower-quality retrievals, e.g., due to low sun elevation, thin cloud cover or surface water (HR-S&I consortium, 2020b). Hence we performed the same analysis as above by excluding all pixels with at least a non-zero quality flag, i.e., QCFLAGS > 0.
2.3 Stratification data
We stratified the analysis using four external variables: tree cover density, land cover type, elevation and country of measurement. The tree cover density (TCD) was obtained from the Copernicus Land Monitoring Service. It was derived using Sentinel-2 data too and is available at 20 m resolution with pixel values ranging from 0 % to 100 %. We used the 2015 product and partitioned the data into 10 segments of equal TCD range. The land cover was obtained from the Copernicus Global Land Service version 3 (Buchhorn et al., 2020). We used the 2018 discrete classification map where a pixel's label is the majority label from the fractional cover map. The classes were regrouped into the following labels: closed or open forest, herbaceous vegetation or wetland, urban, water bodies, snow and ice, shrubs, moss and lichen, bare and sparse vegetation, cropland, and open sea. The elevation was extracted from the Copernicus global 30 m digital elevation model. We used it to partition our data into 11 segments. We excluded from the analysis all pixels that were non-valid in at least one of the external datasets, so that the population sizes are equal for each stratification variable.
2.4 Metrics
The comparison between in situ–satellite matchups was performed by computing a confusion matrix and the derived false positive (FP), false negative (FN), true positive (TP), true negative (TN), recall or fraction of successfully identified positives (TP/(TP + FN)), precision (TP/(TP + FP)), accuracy ((TP + TN)/(TP + FP + FN + TN)), and kappa coefficient (κ).
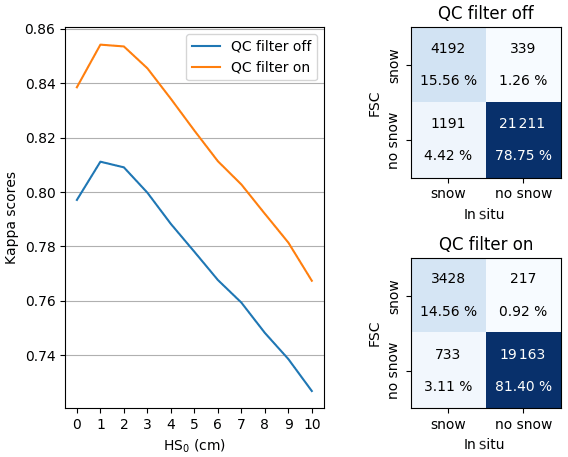
Figure 2Evaluation of the snow vs. no-snow detection with in situ data. Variation in the kappa coefficient with the HS0 threshold and confusion matrices with and without data flagged as low quality (using HS0= 1 cm). QC filter on–off indicates whether the retrievals were filtered using the corresponding QCFLAGS layer or not.

Figure 3Results of the evaluation by strata of land cover, elevation, countries and tree cover density. Each subplot shows three histograms for each stratification variable. The histograms represent, from top to bottom respectively, the kappa; the number of TPs (true positive), FNs (false negative), FPs (false positive) and TNs (true negative) on a logarithmic scale; and the amount of in situ snow (TP + FN) and no-snow (FP + TN) on a logarithmic scale for each strata. A kappa score of zero happens when there are zero snow observations or zero no-snow observations for either the HRSI FSC or the reference dataset. For example, we get a kappa of zero in Greece despite the results being all true negatives.
Figure 2 shows the evaluation of the snow vs. no-snow detection with in situ data, and in particular the variation in the kappa coefficient with the HS0 threshold and corresponding confusion matrices. It indicates a good overall agreement between both datasets with an accuracy of 94 % and κ= 0.80 at HS0= 0. The kappa coefficient increases to 0.84 if low-quality retrievals are excluded. The optimal HS0 is equal to 1 cm in both cases and used for the analysis with the stratification data. The false negative rate is higher than the false positive rate (precision is 93 % but recall is 78 %). The exclusion of low-quality data reduces the total number of available data points by 13 % and increases the recall (82 %) more than the precision (94 %), meaning that more false negative errors are avoided. Figure 3 shows that the best performances (κ > 0.8) are at locations of “urban”, “cropland”, “open forest”, “herbaceous vegetation” or “bare/sparse” land cover types. A lower performance (κ≈ 0.6) is evident for the “closed forest” and “water body” classes. The “shrubs” class has a very low performance (κ≈ 0.1), but there are only 13 snow values in the in situ data. The analysis by TCD bins shows that performances tend to decrease as the forest cover increases, in agreement with the lower accuracy for the closed forest land cover type. The snow detection is robust across elevations between 400 and 2800 m with kappa values above 0.7, but a higher proportion of false negatives between 100 and 400 m is observed; this is likely related to the presence of dense forest at low elevation in nordic regions. The performances are also shown for the countries with at least 100 data points. Countries with more than 1000 data points (France, Germany, Italy and Turkey) have kappa scores above 0.75 except Turkey. Finland and Norway, two high-latitude countries and with more than 200 data points each, also have kappa scores equal to or above 0.75. Stratifying the results of all countries by month (Supplement Fig. S1) indicates that the number of false negatives is highest in December while the accuracy increases every month from January to April.
The results are in line with the previous evaluation with an accuracy of 94 % and a kappa of 0.8 and an optimal snow depth threshold of 1 cm close to the previously reported 2 cm (Gascoin et al., 2019). This value is very low, 10 times lower than the one that can be obtained with MODIS data (Klein and Barnett, 2003; Gascoin et al., 2015). This suggests that Sentinel-2 is much more sensitive to thin snow cover due to its higher spatial resolution which reduces the prevalence of mixed pixels. We also find that the proportion of FNs is larger than the proportion of FPs, indicating that the HRSI snow products are more likely to omit a snow pixel than to falsely classify a pixel as snow covered at the station locations. This study demonstrates that this effect can be partly attributed to the adverse effect of the forest canopy on snow detection as the number of false negatives is higher in the closed forest land cover type. However, the results also show that this tendency for underdetection is present across nearly all subcategories, suggesting that this limitation is not only due to land cover. The lower performance in winter indicates that it may be a consequence of the low signal-to-noise ratio in Sentinel-2 radiances during the periods of low solar elevation angle. The lower proportion of FPs than FNs in this study also suggests that the occurrence of false snow detection under cloudy conditions which were visually identified in the previous evaluation (Gascoin et al., 2019) is actually not the main issue to focus on in order to improve the product accuracy.
This brief communication reports on the performance of the HRSI snow classification based on a year of in situ snow depth data. Although the in situ dataset is unbalanced with about 4 times more no-snow values than snow values, it is sufficiently large to have thousands of observations in the two categories. It is also well distributed across Europe, as we obtained hundreds of observations in many subcategories (country, land cover, elevation and tree cover density). This dataset therefore allows us to draw more robust conclusions than previously on the performance of the MAJA–LIS algorithm to detect the snow cover. We conclude that Sentinel-2-derived HRSI snow products are sufficiently reliable to study snow cover variations across the variety of European landscapes from the northernmost Arctic regions to the southern semiarid mountains, excluding the densest forest regions. Although the evaluation dataset spans only 1 year of data, its large geographical scale compensates for its short duration. Further progress would result from a wider public availability of in situ snow cover data in the future over extended periods, including additional sources of data (e.g., citizen science observations, webcam-based snow cover observations, higher-resolution satellite observations).
The FSC products are available from the Copernicus Land website (https://land.copernicus.eu/pan-european/biophysical-parameters/high-resolution-snow-and-ice-monitoring, Copernicus Land Monitoring Service, 2021a). The TCD product is also available from Copernicus Land (https://land.copernicus.eu/pan-european/high-resolution-layers/forests/tree-cover-density, Copernicus Land Monitoring Service, 2021b). The SYNOP data are available upon request to the authors. The Alps data providers are Météo France, Deutscher Wetterdienst, Agenzia regionale per la protezione dell'ambiente (ARPA) Friuli Venezia Giulia – Osservatorio Meteorologico Regionale e Gestione Rischi Naturali, ARPA Lombardia, the Hydrographic Office of Bolzano and Meteotrentino.
The supplement related to this article is available online at: https://doi.org/10.5194/tc-15-4975-2021-supplement.
This study was conceptualized by SG. Data curation was done by ZBD and MD. Formal analysis was done by ZBD. Funding acquisition involved SG, OH, GS, MA, MD and SM. Data analysis was performed by ZBD under the supervision of SG. The project was administered by MA and FM. The computing resources were provided by AD. The software was developed by RJ, GS, OH, ZBD, SG and AD. The original draft was written by ZBD and SG and reviewed and edited by SM, MD, FM and OH.
The contact author has declared that neither they nor their co-authors have any competing interests.
Publisher’s note: Copernicus Publications remains neutral with regard to jurisdictional claims in published maps and institutional affiliations.
We acknowledge the Centre National d'Etudes Spatiales, in particular Nicolas Picot and the High Performance Computer team. We also thank Michael Matiu for his comments on the manuscript.
This work was funded by the European Environment Agency and by the ANR TOP project, grant ANR-20-CE32-0002 of the French Agence Nationale de la Recherche. Marie Dumont has received funding from the European Research Council (ERC) under the European Union's Horizon 2020 research and innovation programme (grant agreement no. 949516, IVORI).
This paper was edited by Masashi Niwano and reviewed by two anonymous referees.
Baba, M. W., Gascoin, S., and Hanich, L.: Assimilation of Sentinel-2 data into a snowpack model in the High Atlas of Morocco, Remote Sens., 10, 1982, https://doi.org/10.3390/rs10121982, 2018.
Buchhorn, M., Smets, B., Bertels, L., De Roo, B., Lesiv, M., Tsendbazar, N.-E., Li, L., and Tarko, A.: Copernicus Global Land Service: Land Cover 100m: version 3 Globe 2015–2019: Product User Manual, Zenodo [data set], https://doi.org/10.5281/zenodo.3938963, 2020.
Copernicus Land Monitoring Service:High Resolution Snow and Ice Monitoring, available at: https://land.copernicus.eu/pan-european/biophysical-parameters/high-resolution-snow-and-ice-monitoring, last access: 21 October 2021.
Copernicus Land Monitoring Service: Tree Cover Density, available at: https://land.copernicus.eu/pan-european/high-resolution-layers/forests/tree-cover-density, last access: 21 October 2021.
Dedieu, J.-P., Carlson, B. Z., Bigot, S., Sirguey, P., Vionnet, V., and Choler, P.: On the Importance of High-Resolution Time Series of Optical Imagery for Quantifying the Effects of Snow Cover Duration on Alpine Plant Habitat, Remote Sens., 8, 481, https://doi.org/10.3390/rs8060481, 2016.
Fierz, C., Armstrong, R. L., Durand, Y., Etchevers, P., Greene, E., McClung, D. M., Nishimura, K., Satyawali, P. K., and Sokratov, S. A.: The international classification for seasonal snow on the ground, UNESCO, SC.2009/WS/15, 90 pp., 2009.
Freudiger, D., Kohn, I., Seibert, J., Stahl, K., and Weiler, M.: Snow redistribution for the hydrological modeling of alpine catchments: Snow redistribution for hydrological modeling, Wiley Interdiscip. Rev. Water, 4, e1232, https://doi.org/10.1002/wat2.1232, 2017.
Gascoin, S., Hagolle, O., Huc, M., Jarlan, L., Dejoux, J.-F., Szczypta, C., Marti, R., and Sánchez, R.: A snow cover climatology for the Pyrenees from MODIS snow products, Hydrol. Earth Syst. Sci., 19, 2337–2351, https://doi.org/10.5194/hess-19-2337-2015, 2015.
Gascoin, S., Grizonnet, M., Bouchet, M., Salgues, G., and Hagolle, O.: Theia Snow collection: high-resolution operational snow cover maps from Sentinel-2 and Landsat-8 data, Earth Syst. Sci. Data, 11, 493–514, https://doi.org/10.5194/essd-11-493-2019, 2019.
Hagolle, O., Huc, M., Villa Pascual, D., and Dedieu, G.: A Multi-Temporal and Multi-Spectral Method to Estimate Aerosol Optical Thickness over Land, for the Atmospheric Correction of FormoSat-2, LandSat, VENμS and Sentinel-2 Images, Remote Sens., 7, 2668–2691, https://doi.org/10.3390/rs70302668, 2015.
HR-S&I consortium: Algorithm theoretical basis document for snow products, available at: https://land.copernicus.eu/user-corner/technical-library/hrsi-snow-atbd (last access: 21 October 2021), 2020a.
HR-S&I consortium: Product user manual for snow products, available at: https://land.copernicus.eu/user-corner/technical-library/hrsi-snow-pum (last access: 21 October 2021) 2020b.
Klein, A. G. and Barnett, A. C.: Validation of daily MODIS snow cover maps of the Upper Rio Grande River Basin for the 2000–2001 snow year, Remote Sens. Environ., 86, 162–176, https://doi.org/10.1016/S0034-4257(03)00097-X, 2003.
Malnes, E., Buanes, A., Nagler, T., Bippus, G., Gustafsson, D., Schiller, C., Metsämäki, S., Pulliainen, J., Luojus, K., Larsen, H. E., Solberg, R., Diamandi, A., and Wiesmann, A.: User requirements for the snow and land ice services – CryoLand, The Cryosphere, 9, 1191–1202, https://doi.org/10.5194/tc-9-1191-2015, 2015.
Margulis, S. A., Cortés, G., Girotto, M., and Durand, M.: A Landsat-Era Sierra Nevada Snow Reanalysis (1985–2015), J. Hydrometeorol., 17, 1203–1221, https://doi.org/10.1175/JHM-D-15-0177.1, 2016.
Matiu, M., Crespi, A., Bertoldi, G., Carmagnola, C. M., Marty, C., Morin, S., Schöner, W., Cat Berro, D., Chiogna, G., De Gregorio, L., Kotlarski, S., Majone, B., Resch, G., Terzago, S., Valt, M., Beozzo, W., Cianfarra, P., Gouttevin, I., Marcolini, G., Notarnicola, C., Petitta, M., Scherrer, S. C., Strasser, U., Winkler, M., Zebisch, M., Cicogna, A., Cremonini, R., Debernardi, A., Faletto, M., Gaddo, M., Giovannini, L., Mercalli, L., Soubeyroux, J.-M., Sušnik, A., Trenti, A., Urbani, S., and Weilguni, V.: Observed snow depth trends in the European Alps: 1971 to 2019, The Cryosphere, 15, 1343–1382, https://doi.org/10.5194/tc-15-1343-2021, 2021.
Matson, M. and Wiesnet, D. R.: New data base for climate studies, Nature, 289, 451–456, https://doi.org/10.1038/289451a0, 1981.
Mendoza, P. A., Musselman, K. N., Revuelto, J., Deems, J. S., López-Moreno, J. I., and McPhee, J.: Interannual and Seasonal Variability of Snow Depth Scaling Behavior in a Subalpine Catchment, Water Resour. Res., 56, e2020WR027343, https://doi.org/10.1029/2020WR027343, 2020.
Niittynen, P. and Luoto, M.: The importance of snow in species distribution models of arctic vegetation, Ecography, 41, 1024–1037, https://doi.org/10.1111/ecog.03348, 2018.
Stillinger, T., Roberts, D. A., Collar, N. M., and Dozier, J.: Cloud Masking for Landsat 8 and MODIS Terra Over Snow-Covered Terrain: Error Analysis and Spectral Similarity Between Snow and Cloud, Water Resour. Res., 55, 6169–6184, https://doi.org/10.1029/2019WR024932, 2019.
Trujillo, E., Ramírez, J. A., and Elder, K. J.: Topographic, meteorologic, and canopy controls on the scaling characteristics of the spatial distribution of snow depth fields, Water Resour. Res., 43, W07409, https://doi.org/10.1029/2006WR005317, 2007.
Xin, Q., Woodcock, C. E., Liu, J., Tan, B., Melloh, R. A., and Davis, R. E.: View angle effects on MODIS snow mapping in forests, Remote Sens. Environ., 118, 50–59, https://doi.org/10.1016/j.rse.2011.10.029, 2012.