the Creative Commons Attribution 4.0 License.
the Creative Commons Attribution 4.0 License.
 | 05 Jan 2021
Continuous in situ measurements of anchor ice formation, growth, and release
Tadros R. Ghobrial
Mark R. Loewen
In northern rivers, turbulent water becomes supercooled (i.e. cooled to slightly below the freezing point) when exposed to freezing air temperatures. In supercooled turbulent water, frazil (small ice disks) crystals are generated in the water column, and anchor ice starts to form on the bed. Two anchor ice formation mechanisms have been reported in the literature: either by the accumulation of suspended frazil particles, which are adhesive (sticky) in nature, on the riverbed or by in situ growth of ice crystals on the bed material. Once anchor ice has formed on the bed, the accumulation typically continues to grow (due to either further frazil accumulation and/or crystal growth) until release occurs due to mechanical (shear force by the flow or buoyancy of the accumulation) or thermal (warming of the water column which weakens the ice-substrate bond) forcing or a combination of the two. There have been a number of detailed laboratory studies of anchor ice reported in the literature, but very few field measurements of anchor ice processes have been reported. These measurements have relied on either sampling anchor ice accumulations from the riverbed or qualitatively describing the observed formation and release. In this study, a custom-built imaging system (camera and lighting) was developed to capture high-resolution digital images of anchor ice formation and release on the riverbed. A total of six anchor ice events were successfully captured in the time-lapse images, and for the first time, the different initiation, growth, and release mechanisms were measured in the field. Four stages of the anchor ice cycle were identified: Stage 1: initiation by in situ crystal growth; Stage 2: transitional phase; Stage 3: linear growth; and Stage 4: release phase. Anchor ice initiation due to in situ growth was observed in three events, and in the remainder, the accumulation appeared to be initiated by frazil deposition. The Stage 1 growth rates ranged from 1.3 to 2.0 cm/h, and the Stage 2 and 3 growth rates varied from 0.3 to 0.9 cm/h. Anchor ice was observed releasing from the bed in three modes: lifting of the entire accumulation, shearing of layers of the accumulation, and rapid release of the entire accumulation.
- Article
(5529 KB) - Full-text XML
- BibTeX
- EndNote


Anchor ice is described as ice that is attached or “anchored” to the bed of natural water bodies (rivers, lakes, or sea floors) as defined by the World Meteorological Organization (1970). Although observations on the formation of anchor ice in rivers have been documented since the 18th century (Barnes, 1908; Altberg, 1936), the mechanisms of formation, growth, and release, as well as its overall effect on river ice processes, are still a relatively unstudied phenomenon (Tsang, 1982; Beltaos, 2013). Anchor ice formation and release can cause significant changes to the riverbed geometry, affecting water levels and discharges, and consequently leading to the loss of hydropower production during freeze-up seasons (e.g. Girling and Groeneveld, 1999; Jasek et al., 2015). Anchor ice released from the bottom often contains significant amounts of bed materials which contribute to the sediment transported in river systems (e.g. Kempema and Ettema, 2011; Kalke et al., 2017). Recently it has been shown that the duration and extent of anchor ice cycles have an effect on algae growth rates and its total biomass (Suzuki et al., 2018). Moreover, fish habitat, in particular fish spawning, can be affected by the formation of anchor ice on the bed which can block oxygen supply to substrate water and freeze the eggs under the ice (e.g. Prowse, 2001; Brown et al., 2011). Available river ice numerical models have attempted to include the effects of anchor ice in hydraulic modelling. These models have mostly relied on empirical or semi-empirical relations (e.g. Shen, 2010; Lindenschmidt, 2017; Blackburn and She, 2019; Makkonen and Tikanmäki, 2018), but the development of physically based models has been challenging due to the lack of accurate field measurements of anchor ice formation, growth, and release.
The process of anchor ice formation starts when surface water becomes supercooled (i.e. water is cooled below its freezing point) typically due to freezing air temperatures. In the presence of sufficient flow turbulence, the supercooled surface water is transported to lower layers and quickly reaches the riverbed (Daly, 1994). In supercooled turbulent water, active (sticky) frazil ice crystals are typically generated in the water column, and subsequently anchor ice may also form on the riverbed. It has been established that anchor ice formation can be initiated by two processes: in situ growth of ice crystals (i.e. nucleation of ice crystals atop the bed material) and/or accretion (i.e. deposition) of active frazil particles on submerged objects (Tsang, 1982). After the initial formation of anchor ice crystals on the riverbed, the accumulation continues to grow either by crystal growth due to heat loss to the surrounding supercooled water and/or by the further deposition of suspended frazil particles (Osterkamp and Gosink, 1983; Qu and Doering, 2007). The final thickness of the anchor ice layer is limited by several factors including the absence of supercooled water, the stream flow depth (although in some cases the accumulation can emerge above the water surface forming anchor ice dams), the growth of an overlaying surface layer of stationary or border ice, and the release of the anchor ice accumulation from the bottom (e.g. Osterkamp and Gosink, 1983; Beltaos, 2013; Turcotte et al., 2013). Increasing anchor ice thickness coincides with increases in the drag and buoyancy forces acting on the accumulation. Anchor ice release is thought to occur due to mechanical or thermal forcing or a combination of the two (e.g. Parkinson, 1984; Shen, 2005). The mechanical release of anchor ice occurs when the buoyancy and drag forces are greater than the ice-substrate bond or when these forces are greater than the submerged weight of the anchor ice and the attached bed materials (sands, gravel, or boulders). This latter mechanism results in the rafting of riverbed materials (sediments) as released anchor ice pans are advected downstream (Kempema and Ettema, 2011; Kalke et al., 2017). Anchor ice has often been observed to release in the morning following cold and clear nights (Barnes, 1908; Kempema et al., 2001; Daly and Ettema, 2006), and this has been attributed to warming of the water by solar radiation that weakens the ice-substrate bond leading to thermal release.
Many of the physical measurements available on anchor ice formation, growth, and release are from detailed laboratory experiments (Altberg, 1936; Kerr et al., 2002; Doering et al., 2001; Qu and Doering, 2007). In laboratories, the ambient conditions are controlled (air temperature, discharge, and channel characteristics), and the environment is favourable for conducting detailed measurements (e.g. video recordings, depth and velocity profiles) and for collecting samples of anchor ice accumulations. Altberg (1936) conducted the first reported controlled laboratory experiments to study anchor ice using a race-track recirculating flume. He concluded that two fundamental conditions must exist for anchor ice formation: supercooling of the water (thermodynamic effect) and flow turbulence (dynamic effect). Kerr et al. (2002) conducted a laboratory study on anchor ice formation and its hydraulic effects on a gravel bed in a refrigerated flume. In all of their experimental runs, they observed anchor ice initiation only due to frazil deposition or attachment to the bed (i.e. no in situ growth). They documented three distinct stages of anchor ice growth: initial, transitional, and final growth stages. The initial stage (referred to as “Stage 1” herein) is the formation of the first visible anchor ice crystal layers on the substrate. This stage was characterized by faster growth rates and uneven appearance along the bed. The transitional stage (referred to as “Stage 2” herein) started once the accumulations began to emerge out of the substrate and protruded into the flow. The hydrodynamic drag forces acting on the accumulation caused the flattening or release of the anchor ice formation. During this transitional stage, anchor ice accumulation either continued to increase due to frazil deposition or decreased slightly due to its release into the flow. The final growth stage (referred to as “Stage 3” herein) was defined as the nearly uniform (linear) and slower growth rates of anchor ice thickness due to continuous frazil deposition. At this stage, individual anchor ice forms were not distinguishable. The measured growth rates ranged between ∼ 0.02 and 0.05 cm/∘C-h, which for an average air temperature of −16.0 ∘C translates to a growth rate between 0.4 and 0.8 cm/h. Although they reported that anchor ice released only at a Reynolds number less than ∼ 22 000, it is worth noting that they only tested two values of Reynolds numbers (i.e. 21 800 and 29 000).
Doering et al. (2001) and Qu and Doering (2007) conducted laboratory experiments on anchor ice evolution in a counter-rotating flume. They measured growth rates between 0.3 and 0.7 cm/h, and their data suggested that anchor ice growth rates and densities increased with increasing Froude number. Although they visually observed that anchor ice always initiated with frazil deposition, with a careful interpretation of the water temperature (supercooling) curves, they were able to attribute some of the continuous growth of anchor ice thickness to the in situ growth of the crystals. They found that gravel size did not have an effect on the formation (initiation) mechanisms, but they found that anchor ice released more easily when it was attached to smaller gravel particles. They also observed that anchor ice tended to release when the Reynolds number is less than 42 000.
Several field observations on anchor ice processes have been reported in the literature using grab sampling techniques, onshore photographs, and intermittent underwater photography. Therefore, these observations were mostly limited to the qualitative description of anchor ice properties such as shape, thickness, extent of formation, and release and how these properties are related to hydro-meteorological conditions (e.g. Hirayama et al., 1997; Terada et al., 1998; Turcotte and Morse, 2011; Nafziger et al., 2017). Reasons for this limitation include the need for supercooled water, the fact that anchor ice typically forms during night time when visibility is low, the difficulty of predicting where anchor ice might form, and of course the limitation of working in cold weather. Despite these limitations, field studies have significantly advanced our knowledge of anchor ice processes.
Hirayama et al. (1997) conducted a three years study on a small gravel stream (6 to 9 m wide and 0.3 to 0.6 m deep) in Hokkaido, Japan. They mapped the Froude number contours within the study reach and showed that anchor ice only forms when the Froude number is between 0.2 and 1.5. They reported that sampled anchor ice masses consisted mainly of needle-like crystals which were growing either in the upstream or the downstream direction of the flow. They showed that the thickness and volume of anchor ice accumulations increased with the cumulative degree hour of freezing of air temperature and reported anchor ice thicknesses ranging between 3 and 17 cm. Moreover, they measured anchor ice accumulation densities between 300 and 700 kg/m3 and showed that the density tended to increase with the flow velocity.
Kempema and Ettema (2009, 2011) studied anchor ice on the Laramie River, USA, and reported that daily anchor ice cycles (formation at night and release in the morning) can generate anchor ice accumulation thicknesses between 0.2 and 0.3 m with no apparent relation between crystal sizes and Froude number. They examined the morphology of anchor ice accumulations and reported that large plate-like ice crystals exceeding 5 cm in length were most dominant. They also observed that these large crystals result from in situ growth of frazil crystals that become attached to the bed. While studying anchor ice rafting by sediments, they concluded that anchor ice release and associated ice rafting were diurnal events, which suggests that solar radiation was an important factor. Kempema and Ettema (2013, 2016) used time-lapse images from an underwater camera to measure the growth of anchor ice crystals forming on wedge-wire screens deployed on the riverbed. They reported that anchor ice formation was initiated by the accretion of frazil disks followed by relatively rapid in situ ice growth. They observed ice crystals up to 3 cm long with growth rates ranging between 1.0 and 4.0 cm/h. They also measured anchor ice accumulation porosities between 42 % and 68 %.
Stickler and Alfredsen (2009) conducted a detailed study on anchor ice formation at three sites: two sites on unregulated rivers (Southwest Brook, Canada, and the Sokna river, Norway) and one site on a regulated stream (Orkla River, Norway). They concluded that anchor ice formation is mainly due to frazil deposition and is dependent on the flow turbulence (i.e. Reynolds number) with no apparent correlation with the Froude number. They reported that in low-turbulence areas (median Reynolds number of ∼ 10 000), anchor ice grew in the vertical direction with a soft texture and low densities (between 360 and 600 kg/m3), smaller frazil crystals (<0.01 m), and thinner accumulation thicknesses (median of 0.04 m). In high-turbulence areas (median Reynolds number of ∼ 25 000), anchor ice grew in both the vertical and lateral directions with much higher densities (between 600 and 900 kg/m3), larger particles (up to 0.1 m), and larger accumulation thicknesses (median 0.07 m). Anchor ice release was only observed when the water temperature increased above zero and when shortwave radiation (direct sunlight) reached the bed.
Dubé et al. (2014) investigated the characteristics of anchor ice accumulations on the Montmorency River, Canada, using thin section analysis and computed axial tomography (CAT) scans of the collected anchor ice samples. Elongated columnar ice crystals were observed only in ice dam samples, and disk-shaped ice crystals were observed in both ice dam samples and submerged anchor ice samples. In both cases, the crystals grew preferentially perpendicular to the flow. Their results also suggested that in situ growth of disk-shaped ice crystals was the dominant process for the formation of anchor ice and ice dams. They reported individual ice crystals between 3 and 6 cm in length with mean accumulation porosity between 38 % and 44 %.
Jasek et al. (2015) and Jasek (2016) monitored anchor ice release in the Peace River, Canada. They showed that anchor ice formation and release caused significant fluctuations in discharge and water levels which caused ice cover instability and consolidation and consequently freeze-up jams. Their observations showed that anchor ice release appeared to be mainly due to hydraulic effects rather than the thermal influence of the sun. Acoustic scanning of the river bottom indicated length to thickness ratios of ∼ 24:1 for the anchor ice patches on the bed. They estimated ice coverage to be ∼ 70 % for a reach of over 200 km in length.
Nafziger et al. (2017) studied three streams in New Brunswick, Canada (two unregulated and one regulated), and 161 anchor ice formation/release events were observed using time-lapse photographs from the shore. A correlation was found between the increase in water depth (stage) during the formation of an anchor ice event and the corresponding accumulated freezing degree hours of air temperature. Although there were no direct measurements of growth of anchor ice accumulation, the “trend” of the increase in water levels showed good agreement with the laboratory growth rates reported by Kerr et al. (2002). On days with a net heat gain at the water surface and air temperatures >−15 ∘C, 98 % of anchor ice accumulations completely released, which indicates a strong thermal control on anchor ice release.
As discussed above, previous field and laboratory studies have provided considerable insight into the formation, release, and properties of anchor ice, but there are still considerable gaps in our knowledge, for example, the relative importance of frazil deposition versus in situ growth, mechanical versus thermal release and single versus multi-day cycles. However, one of the most critical gaps is that the anchor ice growth rates and mechanisms observed in the laboratory have never been confirmed in the field. The primary goal of this study was to address this gap by making direct measurements of anchor ice growth in the field. For this purpose, a custom-built underwater imaging system (camera and lighting) was deployed on the North Saskatchewan River in Edmonton. The imaging system was able to capture for the first time high-resolution digital time-lapse images of anchor ice formation, growth, and release mechanisms. This paper describes the deployments of the imaging system, results from the continuous measurements of anchor ice processes, and the effect of ambient hydro-meteorological conditions on these processes.
2.1 Study site
The North Saskatchewan River, Canada (length ∼ 1300 km; mean annual discharge of 245 m3/s at the downstream end at Prince Albert), is a glacier-fed, regulated river that flows east from the Canadian Rockies (1800 m above sea level) across Alberta (720 m above sea level at Edmonton) to central Saskatchewan (Kellerhals et al., 1972). The river reach within Edmonton is irregularly meandering with many point bars and side channel bars. It ranges in depth from 1 to 3 m and from 150 to 250 m in width (Gerard and Andres, 1982). The bed material is composed of glacial till and alluvial sands and gravels (Kellerhals et al., 1972). The winter discharge is largely controlled by the outflows from the Bighorn and Brazeau dams in the upper part of the basin, and the average daily winter discharge at Edmonton is 126 m3/s (Hicks, 1997). During winter, hydropeaking power generation at the two dams typically causes water level fluctuations of 30 to 50 cm at the study site. Freeze-up on the North Saskatchewan River in Edmonton can start as early as mid-October, and a complete ice cover can form as late as the end of December. Figure 1 presents a map showing the study site on the North Saskatchewan River in Edmonton. Measurements of anchor ice were conducted at the city of Edmonton's Quesnell Bridge (53∘30′20 N, 113∘33′60 W) during the freeze-up season (October to December) of 2018. The river in this reach has a slope of ∼ 0.0002 and a width of ∼ 200 m. This site was selected for its accessibility and because anchor ice had been observed forming in this reach during previous studies (e.g. Kalke et al., 2017).

Figure 1Map showing the study site on the North Saskatchewan River in Edmonton at the Quesnell Bridge (the base map was downloaded from the Atlas of Canada's Toporama website). The inset is a photo from the right bank looking north showing the deployment site under the bridge.
2.2 Instrumentation
In order to capture high-resolution photographs of anchor ice properties in the field, an underwater imaging system and artificial substrate were designed and built as shown in Fig. 2. The imaging system consisted of a 36 MP Nikon D800 digital single-lens reflex (DSLR) camera (equipped with a Micro-Nikkor 35 mm f/1.8D lens) coupled with a Nikon SB-910 Speedlight flash. Both the camera and the flash were contained in underwater housings which were mounted side-by-side on a MiniTec aluminum rail. The imaging system was secured in a 100 cm long, 50 cm wide, and 20 cm high PVC frame. The aluminum rail was designed to be released from the frame using two 20 cm high handles and a pivot hinge assembly. This feature allowed the rail to be lifted out of the frame so that images could be examined and batteries changed without removing the entire system from the river. The frame was equipped with two 10 pound (∼ 4.535 kg) weights to help anchor the system to the riverbed. In order to prevent frazil and anchor ice from forming on the camera and flash lenses, a 10 m long pipe heat trace cable was wrapped around both underwater housings and then covered with insulating bubble wrap. The heat trace cable was extended using a 30 m power cord laid out along the riverbed and connected to a Subaru R1700i gas generator secured on the river bank. The generator needed to be filled with gas every ∼ 7 to 8 h.
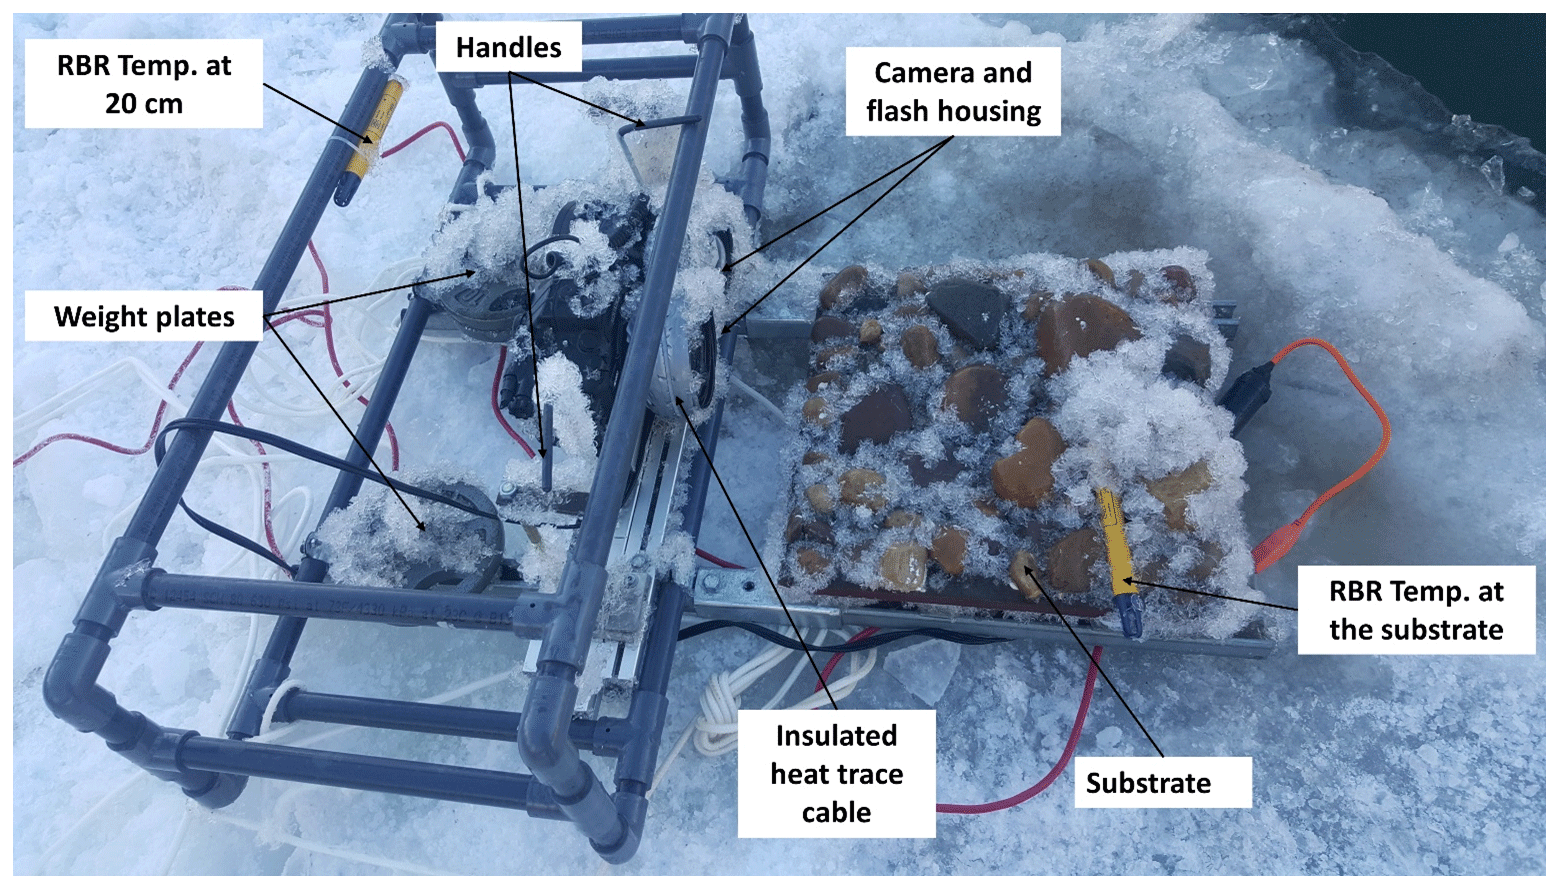
Figure 2Anchor ice imaging system and artificial substrate after its retrieval from the river on 12 November 2018.
An artificial substrate was constructed and bolted to the imaging system frame as shown in Fig. 2. Although imaging anchor ice formation directly on the natural riverbed would be ideal, it is very difficult to pre-adjust the camera settings and lightings to acquire clear images of the forming anchor ice. However, using a constructed substrate allowed us to conduct preliminary laboratory experiments to adjust these settings in a controlled environment. In addition, a constructed substrate offered the opportunity to observe multiple anchor ice events growing on an identical substrate, eliminating variation in bottom sediment properties as an experimental variable. Lastly, it also allowed us to closely examine and photograph any anchor ice deposits that had not released once the system was removed from the water. To make the constructed substrate as similar as possible to the natural riverbed, bed material was sampled from the river at the deployment site in early October 2018. The bed samples were oven dried and sieved in the University of Alberta geotechnical lab. Sediment particles that were greater than 3.8 cm (1.5 inch) in size were used for the substrate. The substrate materials were hand-picked so that they had one relatively flat side and ranged in size from 3.8 to 12.5 cm, which is classified as very coarse pebble gravel to fine cobble gravel (Valentine, 2019). The gravel particles were then glued (with the flat side facing down to increase contact area) to a 50 cm by 50 cm wide plywood base. Multiple 2.5 cm diameter holes were drilled into the base to reduce buoyancy forces on the substrate.
Initial imaging settings (including ISO, aperture, focus, and duration of the flash pulse) and the distance between the substrate and the lens face were determined in the laboratory by immersing the system in a tank of tap water. These camera settings and the setup configuration were modified over the course of the field deployments to improve image quality and increase the camera battery life. These modifications included decreasing the distance from the camera housing window to the in-focus bed material from 60 cm to 40 cm, adding a 25 mm extension tube to the camera lens, changing the underwater camera housing from a clear Ikelite D800 housing to a coated aluminum Aquatica AD800 housing, and increasing the image sampling interval from 30 s to 5 min. Adding the extension tube and moving the substrate closer resulted in a field of view in the images of 34 cm by 18 cm as opposed to 45 cm by 30 cm for the original configuration. Increasing the image sampling interval extended the camera battery life from about 6 to 24 h.
In addition to photographing anchor ice, the water temperature was measured to investigate the effect of temperature variations on anchor ice formation and release. Measurements were made using two RBRsolo T (accuracy ±0.002 ∘C) temperature loggers sampling every 5 s: one mounted on the substrate and another attached to the top of the frame at 20 cm above the bed (see Fig. 2). The anchor ice imaging system was deployed a total of four times during the freeze-up season. During each field deployment, the instruments were carried from the south bank of the river and installed on the riverbed. For the first three deployments, the system was installed 15 to 20 m from the south shore (between the right bank and the first Quesnell Bridge pier) where the water depth ranged between 0.6 and 0.7 m at the start of the deployments (see Fig. 1). For the last deployment, the instruments were lowered from the border ice ∼ 100 m upstream of the bridge and ∼ 30 m from the south shore at a water depth of 1.6 m.
Meteorological data were downloaded from the Alberta Climate Information Service (ACIS) website. The closest weather station (approximately 2.0 km southeast of the study site; see Fig. 1) was the “Edmonton South Campus UA” station (Climate ID 3012220) which provides hourly weather data for the air temperature, solar radiation, wind speed and direction, rainfall/snowfall depth, and relative humidity. Real-time hydrometric data for the North Saskatchewan River at Edmonton were obtained from Water Survey of Canada gauge #05DF001 at a 5 min interval. The gauge is located approximately 10.7 km downstream of the study site (Fig. 1).
A careful examination of the images showed that the imaging system was able to capture individual anchor ice crystals growing on the artificial substrate and also the thickness of anchor ice accumulation. Therefore, the images were processed to primarily estimate these two quantities. All of the captured anchor ice images were processed in two steps. First, the images were enhanced using image processing software (BatchPhoto Pro®). The enhancements included stamping the date and time when the image was taken, auto adjusting the contrast, reducing the hue, increasing the saturation, increasing the lightness, and reducing the noise in the images. These enhancements corrected for the continuous change in ambient lighting and flow turbidity over the course of a single deployment.
Second, the enhanced images were imported into MATLAB®, and the edge of anchor ice crystals and the anchor ice accumulation thickness were manually tracked as a function of time using the image processing toolbox. For the crystal growth measurements, the images were visually examined to identify a number of crystals (typically between one and four crystals) that were clearly visible in consecutive images. Then the pixel coordinates of the edge of each identified crystal were manually tracked and extracted from the series of images. The pixel distance between the edge of the same crystal on successive images was scaled by using the in-focus size of the substrate material. The total length of the crystal was then calculated to estimate the growth of the accumulation with time. A processed image showing the individual crystals forming on the substrate is presented in Fig. 3a. The anchor ice accumulation thickness was measured by manually tracking multiple points across the top of the accumulation in each image. The average accumulation thickness was calculated for each image by averaging these manually tracked points across the width of the image. A processed image showing anchor ice accumulation atop the substrate is shown in Fig. 3b.
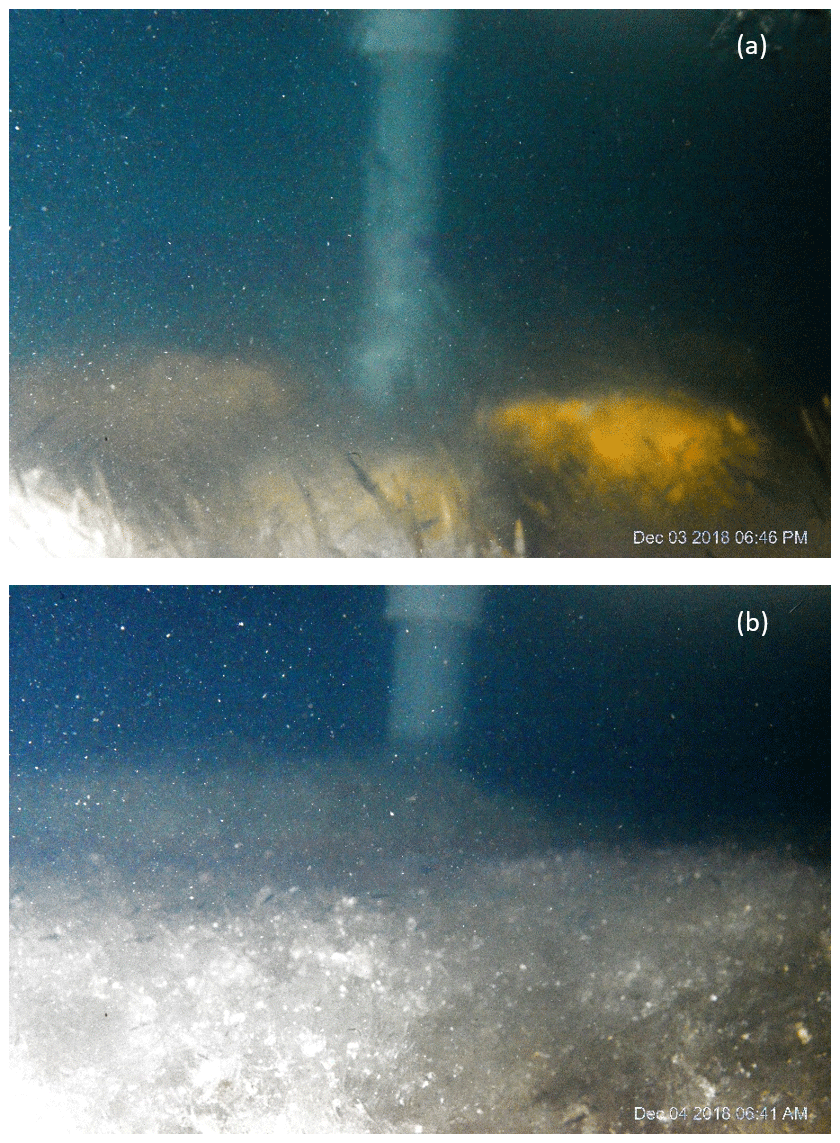
Figure 3Sample processed images from an anchor ice event on 3 and 4 December 2018 (Event C) showing (a) individual crystals growing off the substrate and (b) anchor ice accumulation over the substrate.
There are three possible sources of uncertainty in the anchor ice measurements that have been identified: (1) the camera resolution, (2) errors in identifying the same crystal in consecutive series of images, and (3) errors associated with the assumption that the scaling factor used to convert pixel dimensions to real dimensions (i.e. centimeters) was a constant. The camera resolution is 36 MP which resulted in a pixel size of approximately 40 µm, and therefore errors related to camera resolution are negligible. When tracking the growth of individual crystals, each pair of consecutive images were printed and overlapped (after applying a percentage of transparency to one image in MATLAB) to confirm that the same crystal was identified throughout a series of images. This procedure eliminated any possible errors in identifying individual crystals (Stage 1). The third source of uncertainty is due to the fact that objects of interest in the image (crystals or the top of an accumulation) may be located closer or farther away than was assumed when calculating the image scaling factor. Laboratory tests showed that the in-focus section of the substrate was ∼ 40 cm away from the face of the lens, and this was assumed to be the object distance (distance from an in-focus object to the camera lens) when calculating the scale factor. During Stage 2, the tops of anchor ice accumulations were typically clearly visible in the images (e.g. see Fig. 3b), but the object distance could not be estimated accurately in each image. This is due to the fact that the clarity of the water was reduced by the presence of both suspended frazil and sediment. As a result, it became impossible to know which features or objects in the image were in-focus and therefore located at an object distance of ∼ 40 cm (e.g. see both images in Fig. 3). It is estimated that the crystals or the top of accumulations could be ±10 cm closer or farther away from the lens than the 40 cm (the object distance) since the edge of the substrate facing the camera was 30 cm away from the lens and the camera flash could not illuminate beyond 50 cm from the camera. Therefore, this could produce a maximum error of ±25 % in measured crystal and accumulation dimensions and in the computed growth rates.
4.1 Synopsis of field deployments and anchor ice events
Figure 4 presents time series of the air temperature and the river stage measured from 1 November 2018 to 31 December 2018. The first ice pan was observed in the river on 7 November 2018, and the river was completely ice covered on 23 December 2018. The freeze-up season lasted almost 46 d and was one of the longest in recent years. During freeze-up, the weather forecast was monitored, and the dates of the deployments were determined based on when supercooling of the river was expected to occur and the availability of the research team. The anchor ice imaging system was deployed a total of four times (referred to as DEP-1 to DEP-4) during the 2018 freeze-up season as highlighted in Fig. 4. Table 1 summarizes the camera settings and the duration and timing of each deployment.
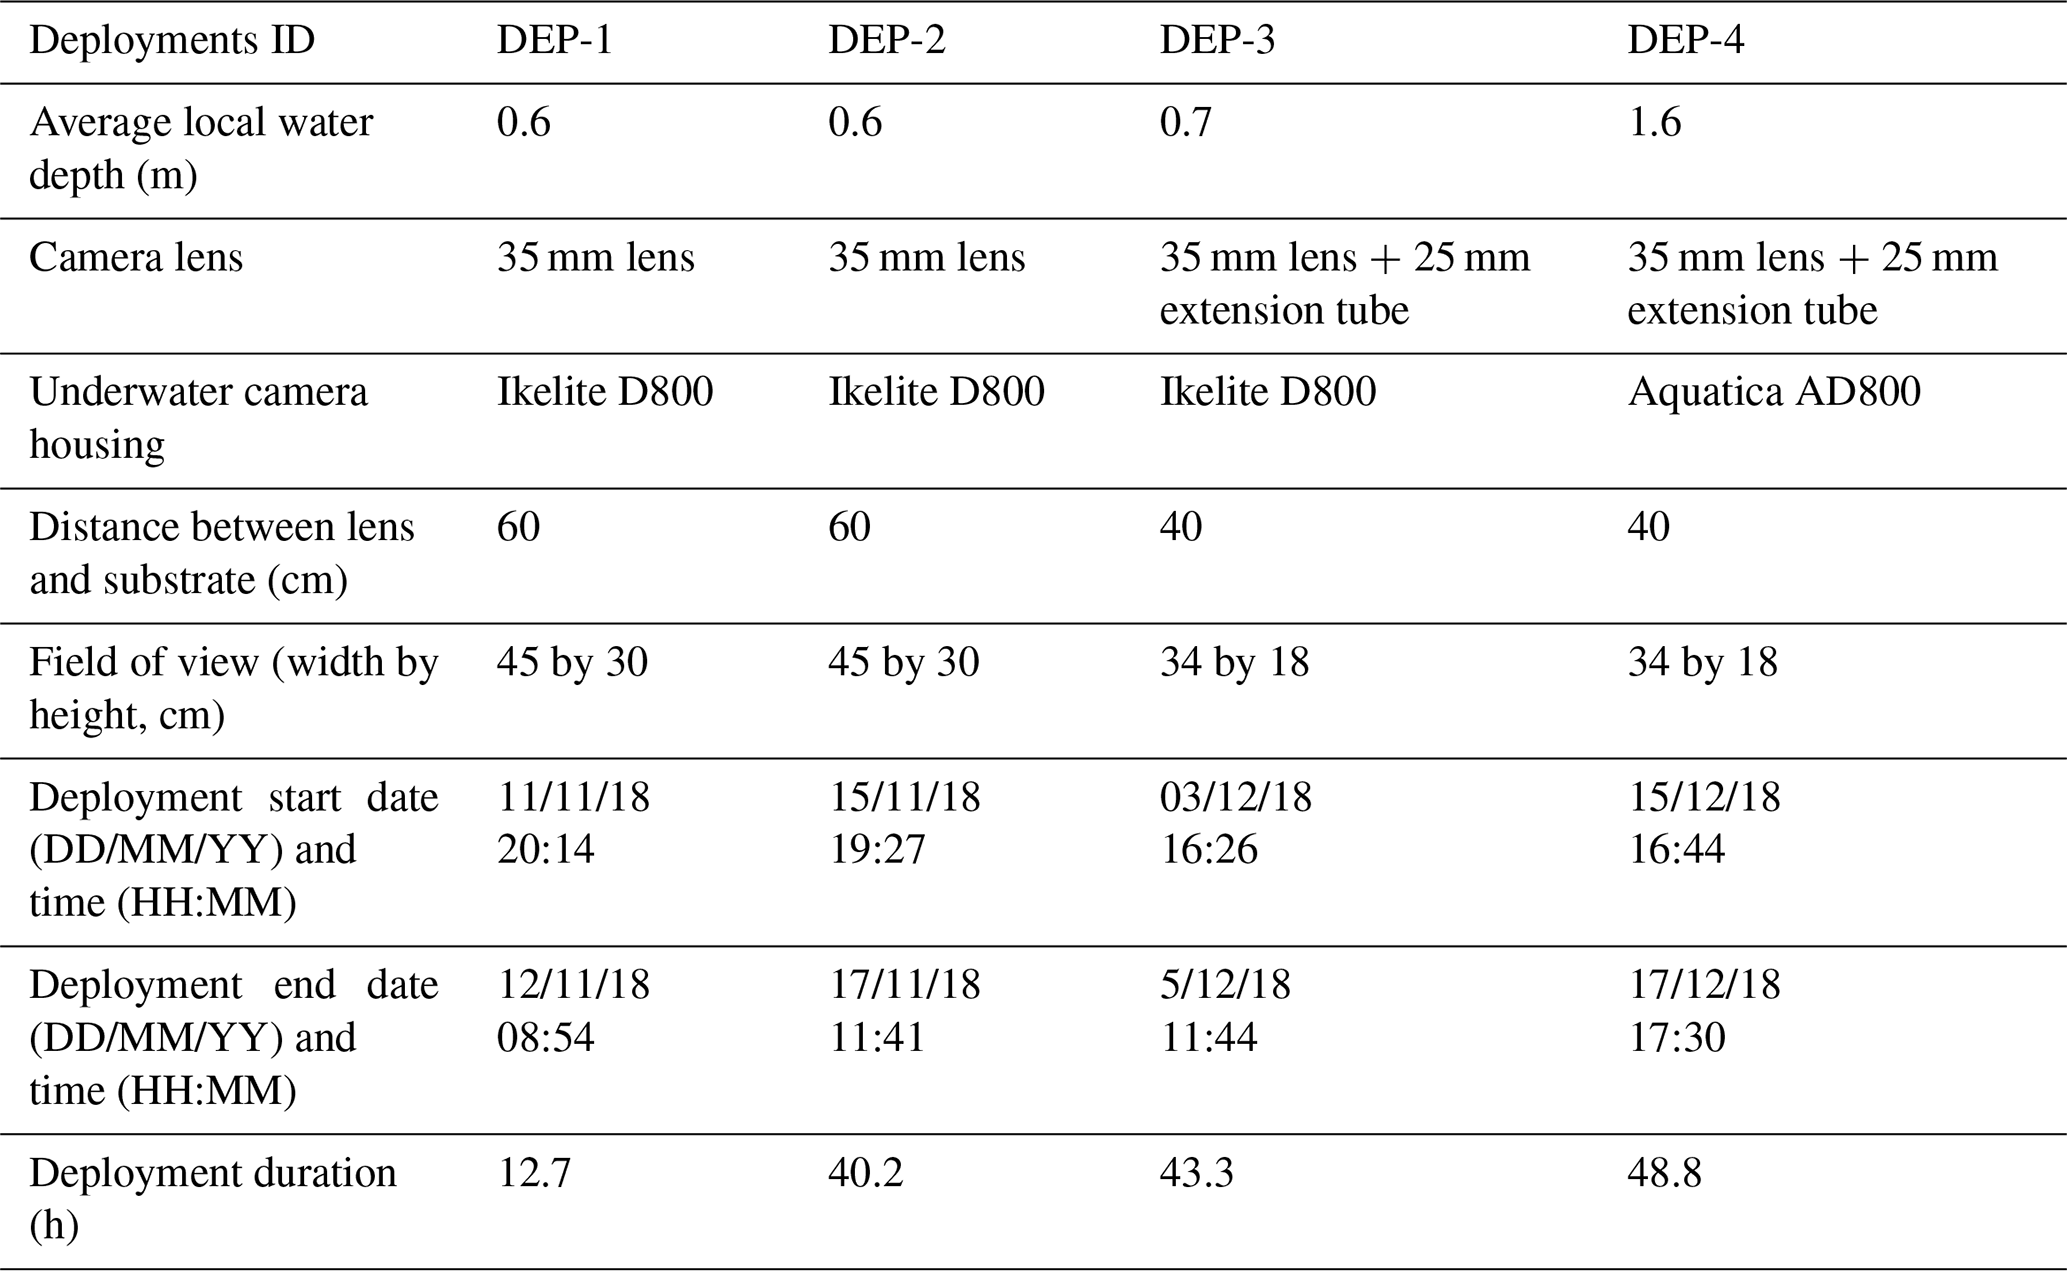

Figure 4Time series of (a) air temperature and (b) river stage during the 2018 freeze-up season. Field deployments are delineated with red lines.
Figures 5 to 8 present time series of the measured air temperature, water temperature, solar radiation, river stage, and anchor ice thickness during the field deployments DEP-1 to DEP-4, respectively. Prior to deployments DEP-1 and DEP-2, the air temperature was above zero and dropped to −10 and −15 ∘C, respectively, during the deployments, and frazil pans more than 30 cm thick were observed passing by the deployment site. For DEP-1, the instruments were deployed at 20:00 on 11 November 2018 (all times given are in mountain standard time) and were retrieved at 08:00 on 12 November 2018; a duration of 12 h. The recorded anchor ice event during DEP-1 was labelled as Event A (see Fig. 5). During this event, anchor ice started to form on the substrate at 21:00 on 11 November 2018 shortly after the deployment started. Unfortunately, the camera stopped working from 01:50 until the battery was replaced at 04:30 on 12 November 2018. During this event, the water was continuously supercooled at approximately a constant temperature of −0.009 ∘C. When the instruments were retrieved at 09:00 on 12 November 2018, anchor ice was still attached to the substrate, and therefore no images of anchor ice release were captured during this event. The quality of the images captured during this event did not allow for the tracking of individual crystals, but the top of the anchor ice accumulation was visible in the images. Figure 9 presents a photograph of the substrate after Event A showing a significant accumulation of anchor ice during this 12 h event.
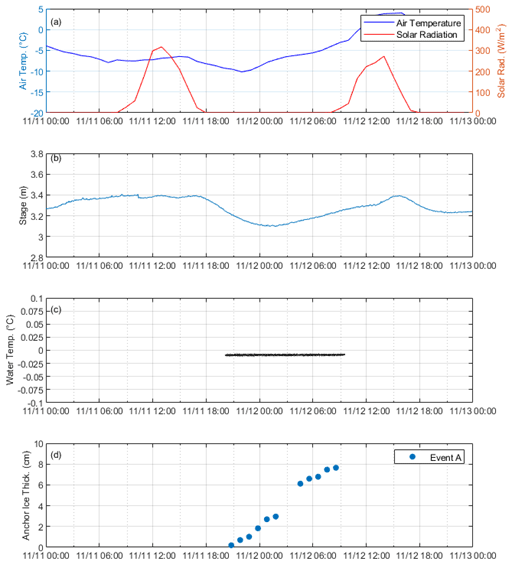
Figure 5Time series of results during deployment DEP-1 showing (a) air temperature and incoming solar radiation, (b) water depth at the Water Survey of Canada (WSC) gauge #05DF001, (c) water temperature on the substrate, and (d) anchor ice thickness above the substrate for Event A.
DEP-2 started at 18:00 on 15 November 2018 and ended at 12:00 on 17 November 2018, lasting for 40 h (see Fig. 6). Although DEP-2 lasted 2 nights, anchor ice did not form during the first night because the water was above 0 ∘C. The recorded anchor ice event during DEP-2 was labelled as Event B. During this event, a classic supercooling curve was observed which reached a maximum supercooling temperature of −0.09 ∘C at approximately 17:00 on 16 November 2018 and then warmed up to an average residual temperature of approximately −0.02 ∘C. Anchor ice crystals started to form on the substrate at ∼ 16:30 on 16 November 2018 just before the water reached its maximum supercooling and shortly before the solar radiation reached 0 W/m2. The camera stopped working from 02:25 until 05:53 on 17 November 2018 when the camera battery was replaced. At about 06:40, the heat trace stopped working because the generator stalled and the lens was completely covered with ice. When the instruments were retrieved at 11:40, some anchor ice was still attached to the substrate, but it seems that the majority of the detected anchor ice in the images had released sometime after 06:40 and prior to retrieval. Although this deployment experienced several instrument failures, it was possible to track individual crystal growth and the thickness of anchor ice accumulation in the images.
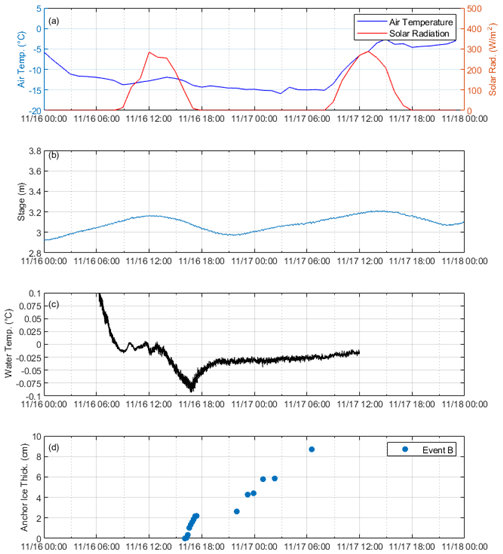
Figure 6Time series of results of DEP-2 showing (a) air temperature and incoming solar radiation, (b) water depth at the WSC gauge #05DF001, (c) water temperature on the substrate, and (d) anchor ice thickness above the substrate for Event B.
After DEP-2, the air temperature stayed relatively warm until 1 December 2018 when the temperature dropped below zero. DEP-3 started at 16:00 on 3 December 2018 when the air temperature decreased from −5 to −15 ∘C and lasted 43 h until 12:00 on 5 December 2018 when the instruments were retrieved (see Fig. 7). Events C and D were both captured during DEP-3. During these two events, the camera and the generator did not encounter any issues and worked throughout the entire deployment period. Anchor ice started to form on the substrate at 16:40 and 17:55 shortly after the solar radiation reached 0 W/m2 and released the next morning at 08:20 and 07:15 shortly before sunrise at 08:30 for events C and D, respectively. During this deployment, the water was constantly supercooled at about −0.009 ∘C except when it decreased to −0.018 ∘C around the time of the release of Event C. Images from events C and D were used to extract anchor ice crystal growth and the thickness of anchor ice accumulation.

Figure 7Time series of results of DEP-3 showing (a) air temperature and incoming solar radiation, (b) water depth at the WSC gauge #05DF001, (c) water temperature on the substrate, and (d) anchor ice thickness above the substrate for events C and D.
After DEP-3, the air temperature gradually warmed again, but rafts and ice pans were still observed in the river. On 15 December 2018, the temperature dropped from above 0 to −10 ∘C, and the river started to stage-up due to higher surface pan concentrations and possibly multiple bridging locations downstream of the study site. DEP-4 lasted for 49 h from 16:30 on 15 December 2018 until 17:30 on 17 December 2018 (see Fig. 8). During this deployment, the water was constantly supercooled at about −0.01 ∘C. Events E and F were both captured during DEP-4. Anchor ice started to form on the substrate at 16:45 and 16:25 (immediately after the solar radiation reached 0 W/m2) and released in the afternoon of the next day at 13:20 and 14:40 for events E and F, respectively. It was believed that these events lasted longer because the instruments were deployed in a much deeper location (1.6 m deep as opposed to ∼ 0.6 m for the previous deployments) which decreased the effect of heating by solar radiation. Due to higher turbidity, images from events E and F were only used to extract the thickness of anchor ice accumulation since it was not possible to distinguish individual crystals in the images.
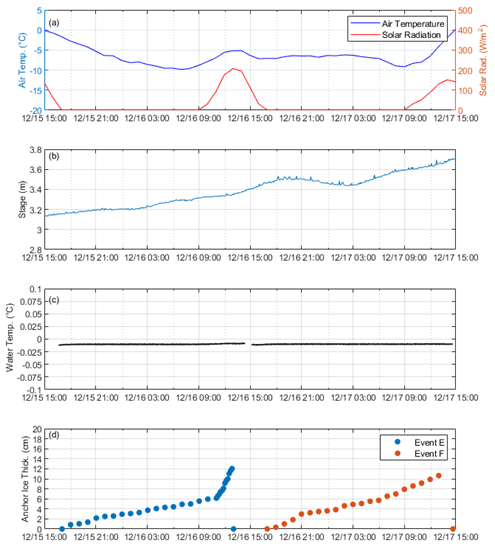
Figure 8Time series of results of DEP-4 showing (a) air temperature and incoming solar radiation, (b) water depth at the WSC gauge #05DF001, (c) water temperature on the substrate, and (d) anchor ice thickness above the substrate for events E and F.
At the end of each deployment, after the retrieval of the instruments from the river, images of anchor ice that had not released from the substrate were taken (e.g. Fig. 9). From these images, three distinct anchor ice crystal shapes were observed on the substrate as shown in Fig. 10. These shapes are (a) curved needle crystals that grew on the surface of the bed material from the contact edges between adjacent gravels towards the centre of the gravel from all sides, (b) platelet crystals that grew starting in the interstitial spaces between gravel particles and then grew vertically away from the gravel, typically angled upstream, and (c) disk-shaped crystals that look like typical suspended frazil ice crystals that attached to the substrate. It is clear in Fig. 10 that within each anchor ice accumulation, different crystal shapes are present, which demonstrates the complexity that is commonly observed in anchor ice accumulations.
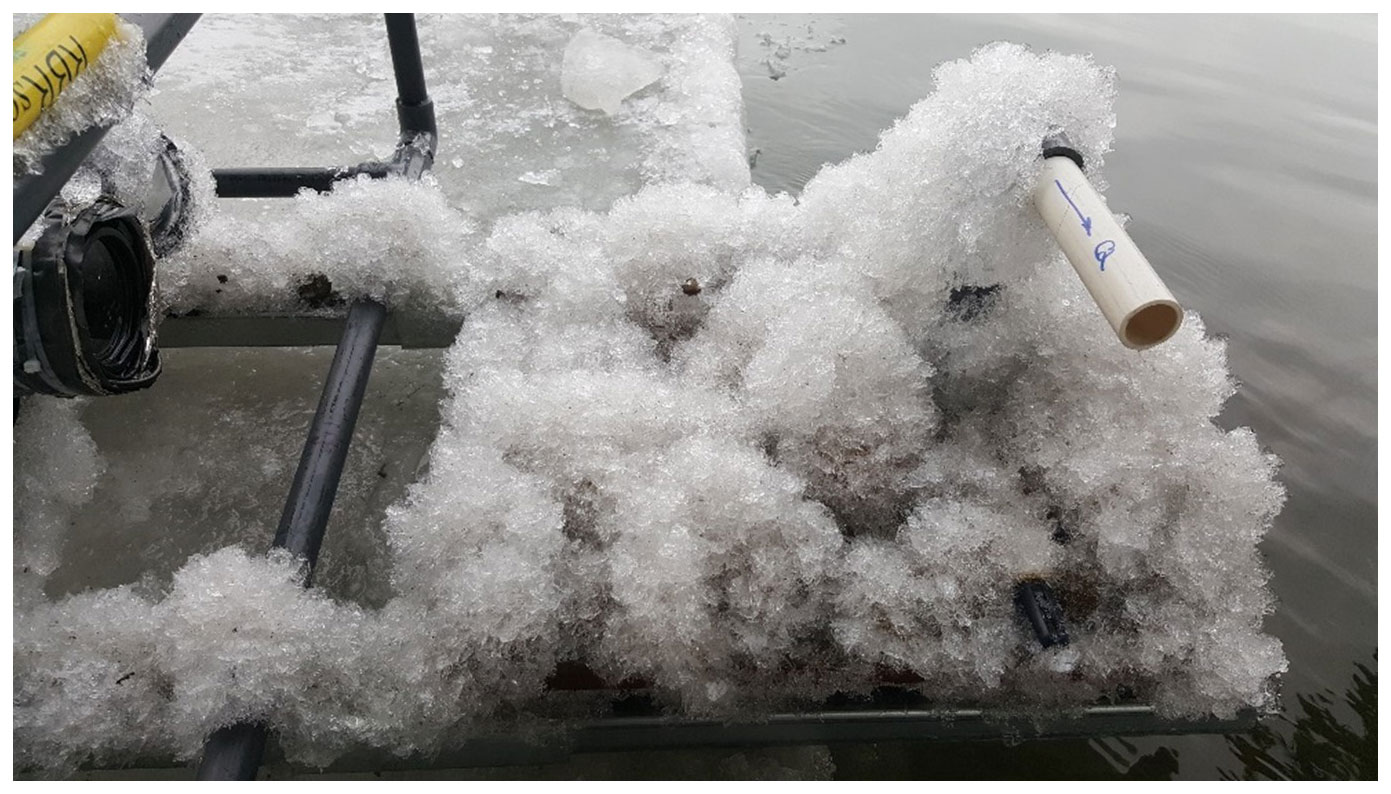
Figure 9Anchor ice formation on the artificial substrate after the instrument's retrieval on 12 November 2018.
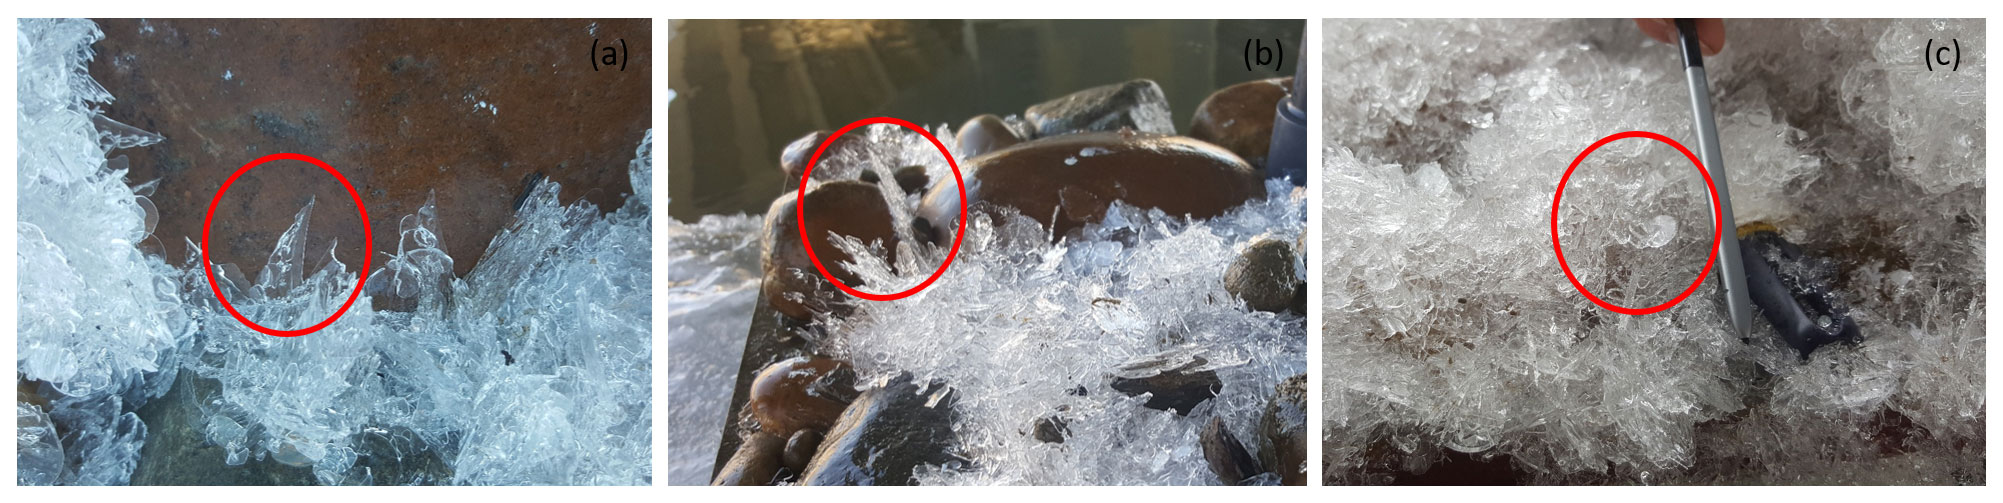
Figure 10Observed anchor ice crystal types (highlighted with red circles) from the 2018 freeze-up season showing (a) curved needle crystals, (b) platelet crystals, and (c) disk crystals.
4.2 Anchor ice formation, growth, and release
The processed images from each anchor ice event were combined in time-lapse videos to help visualize the results. An example of such videos for Event C is available for download at https://doi.org/10.7939/DVN/6X5ATL (Ghobrial and Loewen, 2019). Using these videos, the process of anchor ice formation, growth, and release was separated into four stages: Stage 1: initiation by in situ growth; Stage 2: transitional phase; Stage 3: linear growth; and Stage 4: release phase. For illustration purposes, these stages are labelled on the time series results of anchor ice thickness measured during Event C, as shown in Fig. 11. The results of all anchor ice events are summarized in Table 2. Initiation of anchor ice by in situ crystal growth (Stage 1) was only observed in events B, C, and D (see Figs. 6c and 7c). During Stage 1, individual anchor ice crystals started to grow off the substrate typically angled in the upstream direction of the flow. It is of interest to examine the rate of anchor ice crystal growth observed during these events. For this purpose, a total of nine crystals were tracked: four crystals each from events B and C and one crystal from Event D. The growth of the leading edge of these crystals is plotted against time in Fig. 12. Note that the timescale for each crystal length measurement was referenced to when the individual crystal first appeared in an image. The individual crystals grew at approximately linear rates ranging from 0.9 to 2.4 cm/h with an average of 1.7 cm/h. This stage lasted between ∼ 1.5 to 3.0 h (typically between 18:00 and 21:00). At the end of Stage 1, the crystals ranged between 2.8 and 7.7 cm in length.
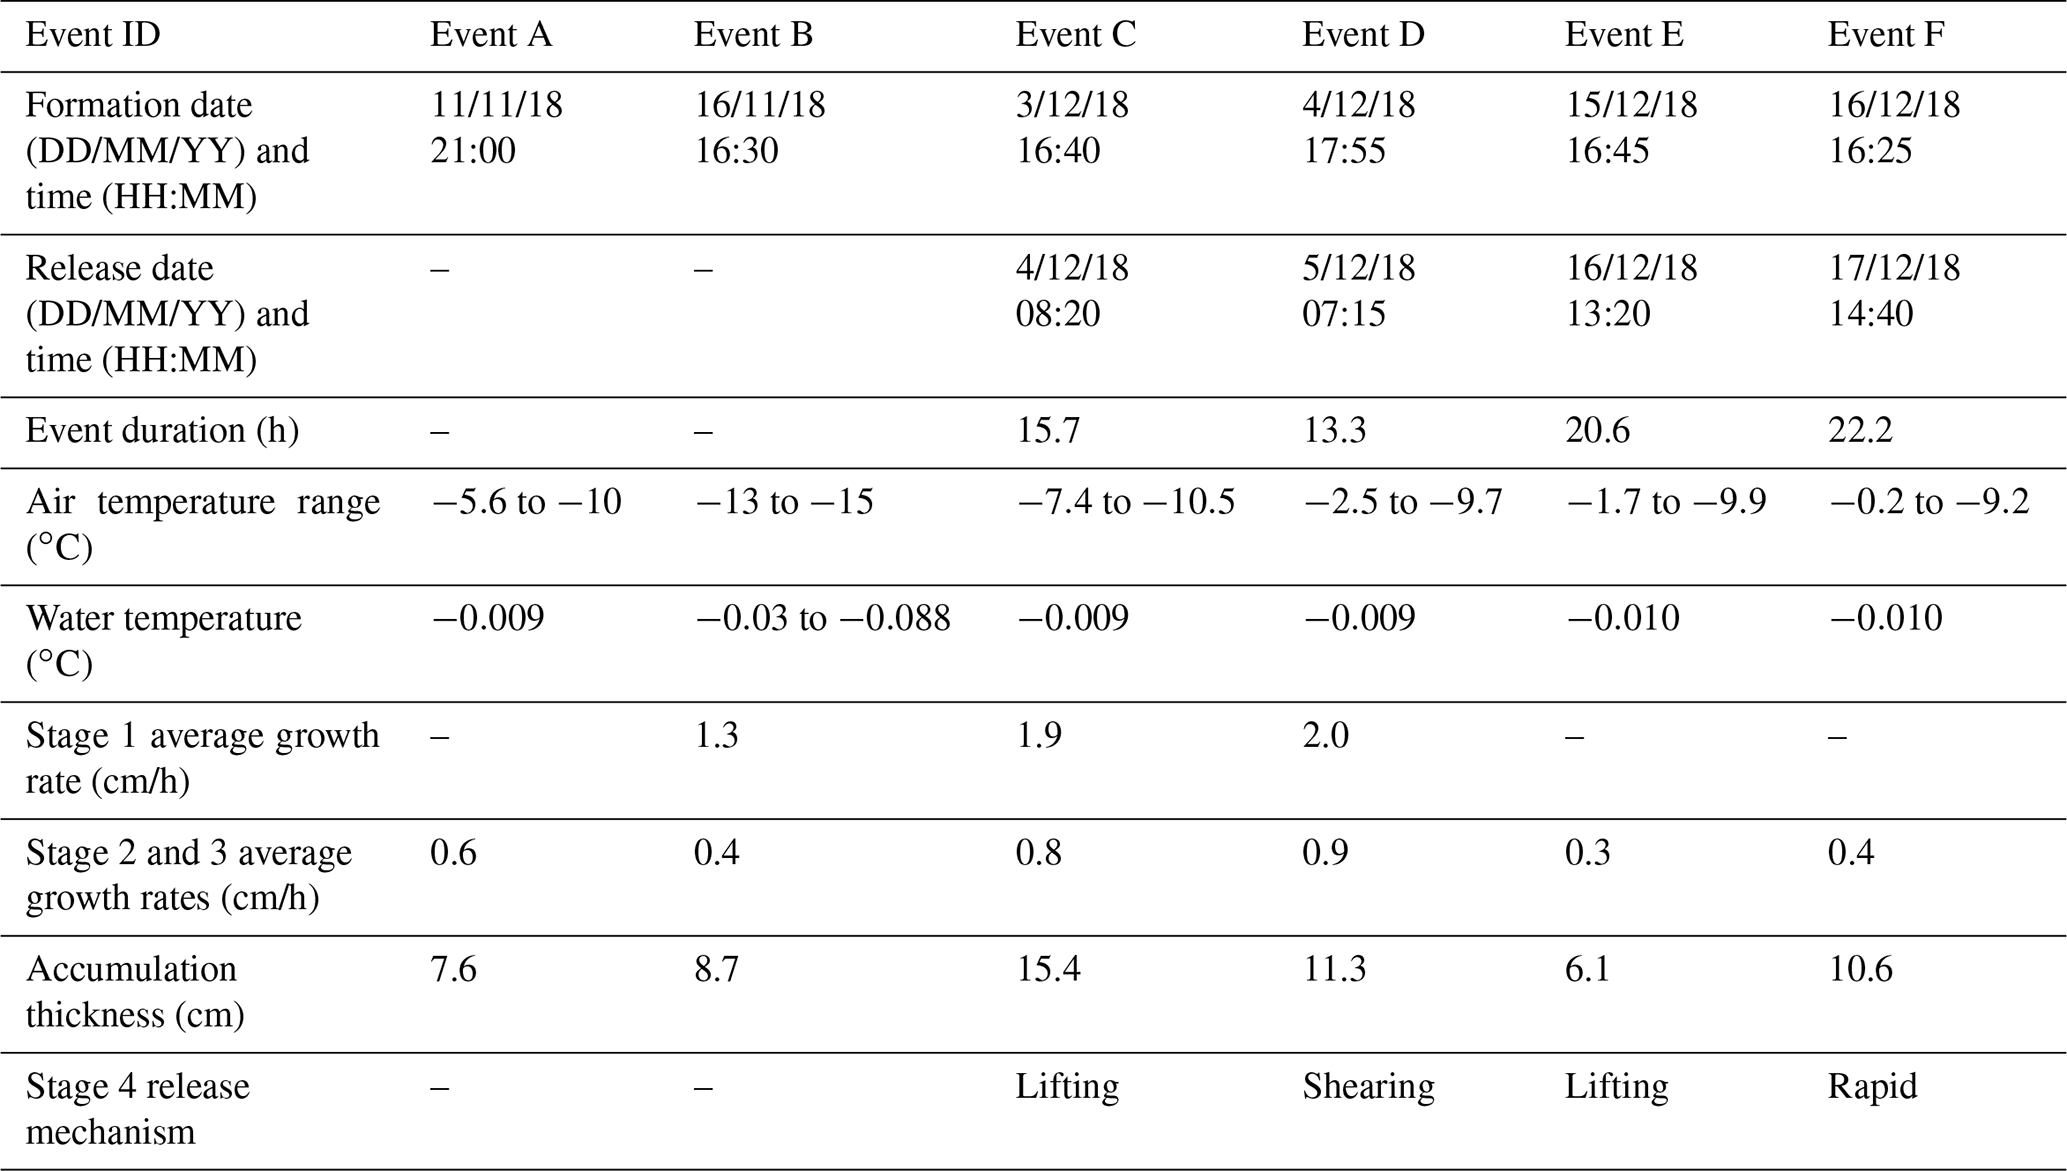
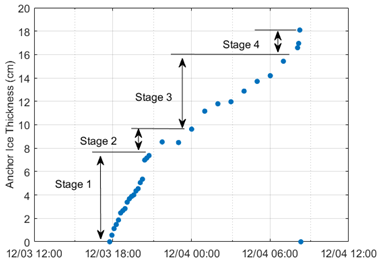
Figure 11Time series plot of the measured anchor ice thickness during Event C on 3–4 December 2018 labelled with the different stages of anchor ice formation, growth, and release. Note that Stage 4 shows the “lifting” release mechanism before the total removal of the anchor ice accumulation.
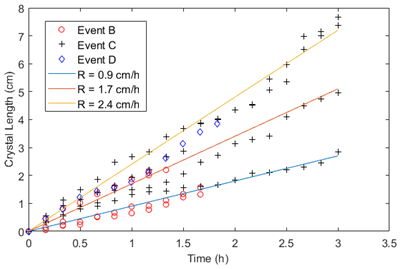
Figure 12Time series of individual crystal growth (Stage 1) measured from events B, C, and D. For illustrative purposes, linear growth rates of R=0.9, 1.7, and 2.4 cm/h were added to the plot.
Stage 2 is a transitional period when individual crystals came in contact with each other and were not easily distinguished in the photographs. During this stage, the surface of the anchor ice started to become flattened by the flow due to the increased drag force and then continued to grow through the deposition of suspended frazil crystals and flocs and/or further interstitial crystal growth. This stage was only distinguishable during events B, C, and D when in situ crystal growth was observed. This stage lasted for ∼ 4 h (typically between 21:00 and 01:00). In Stage 3, the deposition was already flattened out and the anchor ice accumulation had a distinct upper surface which continued to grow upwards at an approximately constant rate due to frazil deposition. This stage lasted for ∼ 8 h (typically between 01:00 and 07:00). For events A, E, and F, frazil deposition appeared to be the initiation mechanism of anchor ice formation, and therefore Stage 1 was not observed during these three events. Consequently, for analysis purposes, the growth of the anchor ice accumulation during stages 2 and 3 (combined) is plotted in Fig. 13 for all six events. The timescale for each event was referenced to when anchor ice first appeared in the images for events A, E, and F; but for Events B, C, and D, the start time was referenced to when Stage 1 ended. The average rate of accumulation growth during all events ranged between 0.3 and 0.9 cm/h with an average of ∼ 0.6 cm/h (Table 2). At the end of Stage 3, the anchor ice accumulation thickness due to frazil deposition only was between 5.3 and 9.6 cm.
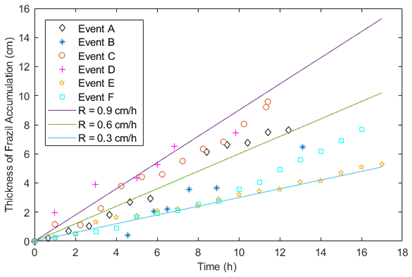
Figure 13Time series of anchor ice thickness growth due to frazil deposition (stages 2 and 3) for all the measured events. For illustrative purposes, linear growth rates of R=0.3, 0.6, and 0.9 cm/h were added to the plot.
Stage 4, the release of anchor ice, was recorded for events C, D, E, and F but not for events A and B due to equipment malfunction or due to retrieval prior to the release. Three modes of anchor ice release were observed in the data: lifting, shearing, and rapid release. During the release of events C and E, the entire anchor ice accumulation was observed lifting up and away from the substrate until it suddenly completely released. This mode lasted ∼ 20 and ∼ 100 min with a lifting rate of 9.0 and 3.3 cm/h for events C and E, respectively. During Event D, consecutive layers of accumulation were sheared off, with the top layer releasing first, followed by the bottom layer. This release mode lasted ∼ 20 min. The rapid release of the entire accumulation during Event F occurred in less than 5 min (i.e. the time between consecutive images), and therefore no lifting or shearing was observed.
Three stages of anchor ice growth very similar to those reported by Kerr et al. (2002) were observed for the first time in the field in this study using time-lapse photographs. Three of the six anchor ice events (events B, C, and D) were observed to be initiated by in situ crystal growth (Stage 1) followed by frazil deposition. For the remaining three events (events A, E, and F), no in situ crystal growth was observed, and it appeared that the accumulations grew only by frazil deposition (stages 2 and 3). It should be noted that Kerr et al. (2002) did not report observing in situ crystal growth and attributed the faster growth in Stage 1 only to frazil deposition. Qu and Doering (2007) did not directly observe in situ thermal growth in their anchor ice images but did conclude that it occurred in their laboratory experiments based on careful analysis of water temperature time series. Kempema and Ettema (2009) studied anchor ice crystal morphology on a small riffle and pool stream and collected anchor ice samples that were comprised of large blade-shaped crystals up to 5 cm in length (see their Fig. 1). They concluded that these larger crystals were formed by the in situ growth of suspended frazil crystals that had become attached to the bed. Furthermore, they wrote that anchor ice formed initially by the adhesion of frazil ice crystals to the bed and that subsequent growth occurred through a combination of frazil accretion and in situ growth. It is unclear if they are referring to the adhesion of a relatively small number of suspended frazil ice crystals to the bed that subsequently acted as nucleation sites for the growth of large crystals or if they are referring to the adhesion of a sufficient number of crystals that a layer of measurable thickness could initially form and that in situ growth could occur within this layer. Their description of anchor ice formation is certainly consistent with events A, E, and F in which only frazil deposition was observed. However, for events B, C, and D in which the in situ growth of large crystals was initially observed, there is some uncertainty. The initial adhesion of suspended frazil ice crystals to the bed prior to the start of large crystal growth was not observed in the time-lapse images, but this could be because the suspended crystals were much too small to be visible. Therefore, it is possible that the first step in anchor ice formation is the adhesion of suspended frazil crystals to the bed, and in this case, it would follow that some of these crystals could then act as nucleation sites for the large crystals that were observed growing on the bed in this study. This process would also be consistent with the description of Kempema and Ettema (2009) of their field observations.
The initial or Stage 1 average crystal growth rates measured in this study ranged from 1.3 to 2.0 cm/h. McFarlane et al. (2016) reported growth rates between 0.4 and 2.3 cm/h for dendritic frazil ice crystals observed in a sequence of images of a frazil floc trapped between two cross-polarizing filters at the same field site. Initial growth rates of anchor ice accumulations in a laboratory channel were estimated from the slopes of the curves plotted in Fig. 19 from Kerr et al. (1997), and these varied from approximately 1.7 to 2.8 cm/h. Kempema and Ettema (2013, 2016) observed anchor ice growing on wedge-wire screens in the Laramie River and plotted crystal growth as a function of time (e.g. see Fig. 5 in Kempema and Ettema, 2016). The initial growth rates estimated from these plots ranged from approximately 1.0 to 4.0 cm/h. In summary, the reported field and laboratory measurements of anchor ice crystal growth range between approximately 1.0 and 4.0 cm/h. The differences in observed crystal growth rates were likely due to local variations in turbulent flow properties, heat loss rates, and/or the characteristics of the substrate on which crystals grew. It is important to note that even on the same substrate and during the same time interval, individual anchor ice crystals grew at different rates as shown in Fig. 12 for Event C. In this case, the different growth rates might be because crystals growing at different positions on the substrate and in different orientations relative to the flow would be exposed to different flow conditions.
The time-lapse images of anchor ice during stages 2 and 3 indicate that the growth of the accumulations was mainly due to frazil deposition. It is possible that further in situ crystal growth in the interstitial spaces between the deposited frazil crystals occurred and that this would increase the accumulation density and strengthen the bond between crystals. The rate of growth of anchor ice accumulation during stages 2 and 3 ranged between 0.3 and 0.9 cm/h. This rate is in agreement with the laboratory measured rates of 0.4 to 0.8 cm/h reported by Kerr et al. (2002) and 0.3 to 0.7 cm/h reported by Doering et al. (2001). It is interesting to note that in this study, the average rate of crystal growth (Stage 1) of 1.7 cm/h was ∼ 3 times the average rate of the accumulation growth due to the deposition of frazil (stages 2 and 3). In order to examine the effects of heat loss on the growth rate of anchor ice, following Kerr et al. (2002), the thickness of accumulation from all the events during stages 2 and 3 was plotted against the cumulative degree hour of freezing air temperature, as shown in Fig. 14. The linear rates of growth observed in the field ranged between 0.05 and 0.12 cm/∘C-h compared to 0.02 to 0.05 cm/∘C-h observed in the experiments of Kerr et al. (2002). Nafziger et al. (2017) plotted the rise of water level due to anchor ice formation against the cumulative degree hours of freezing and also found that most of the observed events have rates of growth higher than 0.05 cm/∘C-h, which is in agreement with this study.
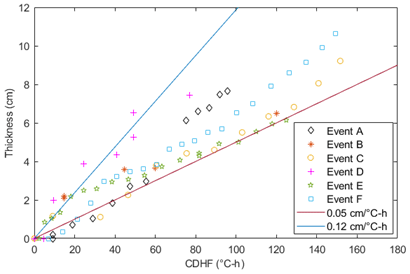
Figure 14Anchor ice thickness growth due to frazil deposition (stages 2 and 3) against the cumulative degree hour of freezing (CDHF). The linear rates of 0.05 and 0.12 cm/∘C-h were added to the plot for comparison.
Total anchor ice thicknesses measured in this study (at the end of Stage 3) ranged from 6.1 to 15.4 cm. This range is consistent with the ranges reported in some previous studies, e.g. 3 to 17 cm by Hirayama et al. (1997), 20 to 30 cm by Kempema et al. (2001), and 7 to 10 cm by Stickler and Alfredsen (2009). The crystal sizes observed in this study ranged from 2.8 to 7.7 cm and are in agreement with previous field studies, e.g. 3 to 6 cm by Dubé et al. (2014) and up to 10 cm by Kempema and Ettema (2011). However, several studies do report substantially thicker accumulations. Tremblay et al. (2014) reported thicknesses ranging from 0.18 to 0.46 m in a small river (width 6–12 m), and Evans et al. (2017) reported accumulations up to ∼ 0.9 m thick using side-scan sonar in a much larger river (width 220–440 m). It is important to note that during this study, the research team observed anchor ice accumulations projecting out of the water surface at water depths of 1.6 m or greater at the deployment site. Moreover, several holes augered through the border ice showed that the bottom of the border ice was in contact with and possibly supported on the underlying anchor ice accumulation at water depths of up to ∼ 1.5 m. The origins of these thick deposits could include local anchor ice growth, accumulation of floating frazil slush, stacking of released anchor ice from upstream, or a combination of any of these phenomena. If we only consider anchor ice growth, at an average growth rate of 0.6 cm/h, it would take 267 h for 1.6 m of anchor ice to accumulate. If anchor ice grows only during the ∼ 12 h a day of supercooling, about 22 d of growth would be required to accumulate 1.6 m. Anchor ice accumulations this thick are unusual in this reach of the North Saskatchewan River, but the freeze-up season was much longer in 2018 than is typical. Ice pans first appeared on the river on 7 November 2018, and a solid ice cover was not formed until 23 December 2018, a total duration of 46 d which is approximately twice as long as the typical duration. Evidently this much longer freeze-up duration might have enabled much thicker accumulations of anchor ice to form than is typical.
Four of the six anchor ice events observed in this study started within 0.5 h of sunset, and the remaining two events started 1.6 and 4.3 h after sunset. This is consistent with what would be expected for diurnal anchor ice events that begin in the late afternoon or evening. At this time of day, the combined effect of decreasing shortwave solar radiation and lower air temperatures typically leads to an increase in the net heat flux from the water to the atmosphere that initiates anchor ice formation. Events C and D occurred in shallow water (∼ 0.6 m) and released the following morning at 08:20 and 07:15 or 0.2 and 1.3 h prior to sunrise, respectively. Events E and F occurred in deeper water (∼ 1.6 m) and released in the afternoon at 13:20 and 14:40 or 4.5 and 6 h after sunrise, respectively. In all four cases, the water remained supercooled at the observed residual temperature for the entire duration of each event, indicating that there was no warming of the water detected by the temperature logger mounted on the substrate. The fact that release occurred while the water temperature remained constant and supercooled is evidence that release was not caused by the melting of the bond with the substrate due to warming water. However, it might be possible for the bond to melt due to heat transfer from the sediments with no observable change in the water temperature. Evidence for the role of shortwave solar radiation in the release is inconclusive since two accumulations released prior to sunrise and two near midday. The fact that the two accumulations in deeper water released later in the day suggests that solar radiation might have played a role in the release since this effect would take longer to penetrate deeper water, but this is not conclusive evidence. The air temperature at the time of release for events B, C, D, and E was −10, −9.7, −5.0, and −0.5 ∘C, respectively. This is in agreement with Nafziger et al. (2017) who reported that most of the anchor ice release events they observed occurred when there was a positive heat flux to the water and the air was warmer than −15 ∘C.
The possibility that mechanical forces triggered the release was also considered. Buoyancy and hydrodynamic forces always play some role in anchor ice release since they are always present. This can be illustrated by considering two limiting cases. In the first case, the ice-substrate bond is weakened by thermal effects, and one or both forces lift or shear the accumulation off the bed. This would be characterized as thermal release since it was thermal radiation and/or heating that triggered the release. In the second case, the strength of the ice-substrate bond remains constant, and the magnitude of one or both forces increases, triggering release. This would be characterized as mechanical release. In some cases, both the strength of the ice-substrate bond and the magnitude of the forces may be varying, and then release could be triggered by both a weakening of the bond and an increase in one or both of the forces. In this study, the four accumulations (events C, D, E, and F) grew to thicknesses that ranged from 6.1 to 15.4 cm and then released. Nafziger et al. (2017) estimated the strength of the anchor ice-substrate bond using an equation proposed by Malenchak (2011) and by assuming that the anchor ice accumulation released solely due to buoyancy forces. In order to make similar calculations, we assumed the anchor ice density varied from 300 to 700 kg/m3, ice density was equal to 917 kg/m3, substrate diameter ranged from 0.038 to 0.125 m (range of rock sizes used in the constructed substrate), and the accumulation thickness varied from 0.061 to 0.154 m (the range of observed thicknesses). This method gave estimates of the anchor ice-substrate bond strength that ranged from 18 to 111 N/m2 which is comparable to the values of Nafziger et al. (2017) which ranged from 45 to 138 N/m2.
It is difficult to quantitatively assess the role of hydrodynamic forces in the release of the four events since the only information available is the approximate local depth and the data from the Water Survey of Canada (WSC) gauge (#05DF001). The gauge data for events C and D do not appear to be ice affected, with water levels varying from approximately 3.15 to 3.45 m due to diurnal hydropeaking (see Fig. 7b). During events E and F, the water level was steadily rising from 3.16 to 3.71 m and did not follow the typical diurnal pattern, indicating that the presence of ice was affecting the gauge (see Fig. 8b). The release of Event C coincided with a peak in the daily water levels of 3.38 m. The release of Event D occurred during rising water levels 5–6 h prior to the daily peak, and the stage was 3.45 m. During events E and F, the water levels were also rising (see Fig. 8b) likely due to a combination of hydropeaking and backwater effects related to ice congestion downstream, and release occurred at a stage of 3.36 and 3.70 m, respectively. Therefore, all four anchor ice events that were observed releasing did so when water levels were rising or were approaching the daily maximum. This may indicate that hydrodynamic forces played a role in the release of these anchor ice accumulations, but it is difficult to conclude this with any certainty.
The rate of anchor ice growth is currently calculated in most river ice process models using the following equation:
where h is the anchor ice thickness, t is time, γ is the frazil accretion rate to the bed, Cv is the volumetric concentration of suspended frazil, ea is the porosity of anchor ice, ρi is the density of ice, Li is the latent heat of ice, and φwi is the net rate of heat transfer from the ice to the water (Shen et al., 1995). Using the average rates of growth measured in this study we can assess a realistic range for the parameters used in Eq. (1). The first term on the right-hand side models growth via frazil deposition and the second term models in situ growth and decay. There are two variables (Cv and φwi) to be predicted at each time step and four parameters (ea, ρi, Li, and γ) to be set to constant values in this equation. The density and latent heat of ice are typically assumed to be 917 kg/m3 and 334 kJ/kg, respectively. The porosity of anchor ice samples collected in the field ranges from 0.38 to 0.56 (Dubé et al., 2014; Jasek, 2016). The anchor ice samples collected in those two studies were either firm enough to maintain their structural integrity when removed from the water or were taken from released anchor ice pans. Newly formed anchor ice accumulations likely have higher porosities because they often do not maintain their structural integrity when sampling is attempted (Dubé et al., 2014). The porosity of frazil ice flocs has been estimated to be approximately 0.80 (Schneck et al., 2019), and this may represent a reasonable upper limit for the porosity of newly deposited anchor ice. Values for the accretion rate γ in the literature range from approximately 10−6 to 10−3 (Malenchak, 2011), and measurements of the volumetric concentration of frazil Cv reported in the literature vary from 10−6 to 10−2 (McFarlane et al., 2019). In this study, growth rates due to deposition during stages 2 and 3 were observed to vary from 0.3 to 0.9 cm/h. Using the average growth rate of 0.6 cm/h and assuming the porosity is 0.4, the value of the numerator γCv is predicted to be 10−6. This suggests that γ is likely not significantly less than ∼ 10−4 m/s since this would require that Cv be significantly greater than ∼ 10−2 which is not realistic.
During Stage 1 when in situ growth of anchor ice was observed, the average crystal growth rates ranged from 1.3 to 2.0 cm/h. Using these values and porosities of 0.4 and 0.8, the resulting range in φwi, the net rate of heat transfer from the ice to the water, is estimated to be 220 to 1030 W/m2. The higher heat flux corresponds to lower porosity and higher growth rate. Note that for the water to remain at a constant temperature, as was observed in this study, the heat flux from the ice to the water must be balanced by an equal net heat flux from the water to the air. The net heat flux from the water to the air can be estimated using a linear heat transfer equation with a heat transfer coefficient of 20 W/m2 ∘C, a typical value for North American rivers (Beltaos, 2013). The lowest air temperature during the three anchor ice events when in situ growth was observed was −15 ∘C, and therefore the maximum net water–air heat flux would be estimated to be 300 W/m2. This suggests that the lower limit of 220 W/m2 is a more realistic estimate of the net ice to the water heat flux and therefore that the porosity of anchor ice formed by in situ thermal growth might be closer to 0.8 than 0.4.
The first continuous field measurements of the complete anchor ice cycle including initiation, growth, and release mechanisms were captured in this study. Three stages of growth similar to those reported by Kerr et al. (2002) were observed in the time-lapse images. A total of six anchor ice events were captured: growth due to frazil deposition and in situ growth was observed in three events, and in the remainder only frazil deposition occurred. Anchor ice was observed releasing from the bed in three modes referred to as “lifting” of the entire accumulation, “shearing” of layers of the accumulation, and “rapid” release of the entire accumulation. The Stage 1 growth rates measured by tracking the growth of individual crystals on the substrate ranged from 1.3 to 2.0 cm/h, and these were comparable to rates observed in previous laboratory and field studies. The measured growth rates in stages 2 and 3 due to frazil deposition varied from 0.3 to 0.9 cm/h, which are comparable to measurements made in two previous laboratory studies. It is worth noting that in this study, significantly higher growth rates ranging from 0.05 to 0.12 cm/∘C-h were observed compared to the rates of 0.05 cm/∘C-h or less reported by Kerr et al. (2002).
All of the observed anchor ice accumulations began forming in the afternoon or evening between 16:30 and 21:00. The release of four of the accumulations was captured in the time-lapse images and occurred between 07:15 and 14:40. The two events in shallow water released just prior to sunrise and the two events in deeper water in the early afternoon. There is evidence that solar radiation, buoyancy, and hydrodynamic forces may have all played some role in the timing of the releases. It does not seem likely that release was triggered directly by hydrodynamic forces because the water level and flow rate variations were not significant at the time of release. The fact that during all four events the water temperature remained supercooled at residual temperatures of approximately −0.01 ∘C is clear evidence that weakening of the ice-substrate bond by warming water was not a factor. It seems likely that the two events in shallow water released due to buoyancy since both released prior to sunrise. However, all that can be concluded regarding the release of the two deeper water accumulations is that buoyancy forces and/or solar radiation may have played a role. Clearly additional research investigating the factors that cause anchor ice release is required.
River ice process models currently use a semi-empirical equation to model anchor ice growth due to frazil deposition and in situ growth. This simple equation accounts for the two observed growth mechanisms and is based on sound physics combined with reasonable engineering approximations (Shen et al., 1995). Analysis of the term in the equation modelling frazil deposition leads to the conclusion that the frazil accretion rate γ must be greater than or equal to ∼ 10−4 m/s. Analysis of the second term that models in situ growth suggests that the porosity of newly formed anchor ice may be significantly larger than 0.4, the value that is typically used in model studies. Unfortunately, the field data gathered in this study did not enable an assessment of the accuracy of this equation. A first step in accomplishing this task would be to capture accurate simultaneous measurement of suspended frazil concentrations, anchor ice porosity, and anchor ice growth rates under a variety of conditions. These would ideally be field measurements, but due to the significant challenges of making these types of measurements in the field, it might only be possible to perform them in the laboratory. These data would allow calculations of the frazil accretion rate and heat flux from the anchor ice by inverting the existing equation. This has the potential to improve the application of the existing equation in two ways. First, it could provide an empirical method for specifying the value of the frazil accretion rate as opposed to the current practice which is to set the value based on judgement alone. Secondly, the estimates of the anchor ice to water heat flux could be utilized to improve the method for computing it that would use the same equation used to predict the heat flux between the ice cover and the water. Finally, it is worth noting that recent progress improving and validating river ice process models by comparison to field data has been reported in the literature (Blackburn and She, 2019; Pan et al., 2020; Wazney et al., 2019).
Data are available from the authors upon request.
TRG and MRL designed the apparatus and performed the field work together. TRG carried out the analysis and processing of the data, prepared the figures, and wrote the paper with review and contributions from MRL.
The authors declare that they have no conflict of interest.
We would like to thank the Natural Sciences and Engineering Research Council of Canada (NSERC) for supporting this project and Perry Fedun for his valuable technical assistance. We are grateful for that support.
This research has been supported by the Natural Sciences and Engineering Research Council of Canada (NSERC) (grant nos. RGPIN-2015-04670 and RGPAS 477890-2015).
This paper was edited by Claude Duguay and reviewed by Edward Kempema and three anonymous referees.
Altberg, W.J.: Twenty years of work in the domain of underwater ice formation, International Association of Scientific Hydrology Bulletin, 23, 373–407, 1936.
Barnes, H. T.: Formation of Ground- or Anchor-Ice, and other Natural Ice, Nature, 78, 102–104, https://doi.org/10.1038/078102c0, 1908.
Beltaos, S.: River Ice Formation, 1st edition, Committee on River Ice Processes and the Environment, Edmonton, AB, Canaca, 2013.
Blackburn, J. and She, Y.: A Comprehensive Public-Domain River Ice Process Model and Its Application to a Complex Natural River, Cold Reg. Sci. Technol., 163, 44–58, 2019.
Brown, R., Hubert, W., and Daly, S.: A Primer on Winter, Ice, and Fish: What Fisheries Biologists Should Know about Winter Ice Processes and Stream-dwelling Fish, Fisheries, 36, 8–26, 2011.
Daly, S.: Report on frazil ice, International Association for Hydraulic Research, Working Group on Thermal Regimes, US Army Cold Regions Research and Research Laboratory, Hanover, New Hampshire, USA, 50 pp., 1994.
Daly, S. F. and Ettema, R.: Frazil Ice Blockage of Water Intakes in the Great Lakes, J. Hydraul. Eng., 132, 814–824, 2006.
Doering, J., Bekeris, L., Morris, M., Dow, K., and Girling, W.: Laboratory study of anchor ice growth, J. Cold Reg. Eng., 15, 60–66, 2001.
Dubé, M., Turcotte, B., and Morse, B.: Inner structure of anchor ice and ice dams in steep channels, Cold Reg. Sci. Technol., 106–107, 194–206, 2014.
Evans, J., Jasek, M., Paslawski, K., and Kraeutner, P.: 3D side scan sonar imaging of in-situ anchor ice in the Peace River, CGU HS Committee on River Ice Processes and the Environment, 19th Workshop on the Hydraulics of Ice Covered Rivers, Whitehorse, Yukon, Canada, 9–12 July, 27 pp., 2017.
Gerard, R. and Andres, D.: Hydraulic roughness of freeze-up ice accumulations: North Saskatchewan River through Edmonton, in: 2nd Workshop on the Hydraulics of Ice Covered Rivers, Edmonton, Alberta, Canada, May 1982, 62–87, 1982.
Ghobrial, T. R. and Loewen, M. R.: Continuous In situ Measurements of Anchor Ice Formation, Growth and Release Mechanisms in Rivers, UAL Dataverse, V1, https://doi.org/10.7939/DVN/6X5ATL, 2019.
Girling, W. C. and Groeneveld, J.: Anchor Ice Formation Below Limestone Generating Station, in: Proceedings of the 10th Workshop on Hydraulics of Ice-Covered Rivers, Winnipeg, Manitoba, Canada, 9–11 June 1999, 160–173, 1999.
Hicks, F. E.: An Analysis of Historical Freeze-up Data on the North Saskatchewan River Below the Bighorn Dam, TransAlta Utilities Corporation, Calgary, Canada, 171 pp., 1997.
Hirayama, K., Terada, K., Sato, M., Hirayama, K., Sasamoto, M., and Yamazaki, M.: Field measurements of anchor and frazil ice, in: Proceedings of the 9th Workshop on River Ice, Fredericton, NB, Canaca, 24–26 September 1997, 141–151, 1997.
Jasek, M.: Investigations of Anchor Ice Formation and Release Waves, in: Proceedings of the 23rd IAHR International Symposium on Ice, International Association of Hydro-Environment Engineering and Research, Ann Arbor, Michigan USA, 31 May–3 June, 2016, 10 pp., ISSN 2414-6331, 2016.
Jasek, M., Shen, H. T., Pan, J., and Paslawski, K.: Anchor Ice Waves and their Impact on Winter Ice Cover Stability, in: Proceedings of the 18th Workshop on the Hydraulics of Ice Covered Rivers, Quebec City, QC, Canada, 18–20 August 2015, 37 pp., 2015.
Kalke, H., McFarlane, V., Schneck, C., and Loewen, M.: The transport of sediments by released anchor ice, Cold Reg. Sci. Technol., 143, 70–80, 2017.
Kellerhals, R., Neill, C. R., and Bray, D. I.: Hydraulic and Geomorphic Characteristics of Rivers in Alberta, Alberta Research Council, River Engineering and Surface Hydrology Report 72-1, 52 pp., 1972.
Kempema, E. and Ettema, R.: Variations in Anchor-Ice Crystal Morphology Related to River Flow Characteristics, in: Proceedings of the 15th Workshop on River Ice, St. John's, Newfoundland, Canada, 15–17 June 2009, 159–168, 2009.
Kempema, E. and Ettema, R.: Anchor ice rafting: observations from the Laramie River, River Res. Appl., 27, 1126–1135, 2011.
Kempema, E. and Ettema, R.: Anchor Ice and Wedge-Wire Screens, in: Proceedings of the 17th Workshop on River Ice, Edmonton, Alberta, Canada, 21–24 July 2013, 15 pp., 2013.
Kempema E. and Ettema, R.: Fish, ice, and wedge-wire screen water intakes, J. Cold Reg. Eng., 30, 04015004, https://doi.org/10.1061/(ASCE)CR.1943-5495.0000097, 2016.
Kempema, E. W., Reimnitz, E., and Barnes, P. W.: Anchor-ice formation and ice rafting in Southwestern Lake Michigan, USA: J. Sediment. Res., 71, 346–354, 2001.
Kerr, D. J., Shen, H. T., and Daly, S. F.: Anchor ice formation and growth on gravel channel bed, in: Proceedings of the 9th Workshop on River Ice, Fredericton, NB, Canada, 26–24 September 1997, 153–171, 1997.
Kerr, D. J., Shen, H. T., and Daly, S. F.: Evolution and hydraulic resistance of anchor ice on gravel bed, Cold Reg. Sci. Technol. 35, 101–114, 2002.
Lindenschmidt, K. E.: RIVICE – A Non-Proprietary, Open-Source, One-Dimensional River-Ice Model, Water, 9, 1–15, 2017.
Makkonen, L. and Tikanmäki, M.: Modelling Frazil and Anchor Ice on Submerged Objects, Cold Reg. Sci. Technol., 151, 64–74, 2018.
Malenchak, J.: Numerical modelling of river ice processes on the Lower Nelson River, PhD thesis, University of Manitoba, Winnipeg, Canada, 289 pp., 2011.
McFarlane, V., Loewen, M., and Hicks, F.: Field observations of the growth rate of anchor ice crystals, in: Proceedings of the 23rd IAHR International Symposium on Ice, Ann Arbor, MI, USA, 31 May–3 June 2016, 10 pp., ISSN 2414-6331, 2016.
McFarlane, V., Loewen, M., and Hicks, F.: Field Measurements of Suspended Frazil Ice, Part II: Observations and Analyses of Frazil Ice Properties During the Principal and Residual Supercooling Phases, Cold Reg. Sci. Technol., 165, 102796, https://doi.org/10.1016/j.coldregions.2019.102796, 2019.
Nafziger, J., She, Y., Hicks, F., and Cunjak, R. A.: Anchor ice formation and release in small regulated and unregulated streams, Cold Reg. Sci. Technol., 141, 66–77, https://doi.org/10.1016/j.coldregions.2017.05.008, 2017.
Osterkamp, T. E. and Gosink, J. P.: Frazil ice formation and ice cover development in interior Alaska streams, Cold Reg. Sci. Technol., 8, 43–56, 1983.
Pan, J., Shen, H. T., and Jasek, M.: Anchor Ice Effects on River Hydraulics, Cold Reg. Sci. Technol., 174, 103062, https://doi.org/10.1016/j.coldregions.2020.103062, 2020.
Parkinson, F. E.: Anchor Ice Effects on Water Levels in Lake St. Louis, St. Lawrence River at Montreal, in: Proceedings of the 3rd CRIPE Workshop, 20–21 June 1984, Fredericton, New Brunswick, Canada, 345–370, 1984.
Prowse, T. D.: River-ice ecology I: hydrologic, geomorphic, and water-quality aspects, J. Cold Reg. Eng., 15, 1–16, 2001.
Qu, Y. X. and Doering, J.: Laboratory study of anchor ice evolution around rocks and on gravel beds, Can. J. Civ. Eng., 34, 46–55, 2007.
Schneck, C. C., Ghobrial, T. R., and Loewen, M. R.: Laboratory study of the properties of frazil ice particles and flocs in water of different salinities, The Cryosphere, 13, 2751–2769, https://doi.org/10.5194/tc-13-2751-2019, 2019.
Shen, H. T.: CRISSP1D Programmer's Manual, CEATI Report No. T012700-0401, Department of Civil and Environmental Engineering, Clarkson University, Potsdam, NY, USA, 188 pp., 2005.
Shen, H. T.: Mathematical modeling of river ice processes, Cold Reg. Sci. Technol., 62, 3–13, 2010.
Shen, H. T., Wang, D. S., and Lal, A. M. W.: Numerical simulation of river ice processes, J. Cold Reg. Eng., 9, 107–118, 1995.
Stickler, M. and Alfredsen, K.T.: Anchor ice formation in streams: a field study, Hydrol. Process., 23, 2307–2315, 2009.
Suzuki, H., Hashiba, M., Yoshikawa, Y., and Yokoyama, H.: Field Study of Anchor Ice Occurrence and Disappearance and Material Circulation in Cold Regions River, in: Proceedings of the 24th IAHR International Symposium on Ice, Vladivostok, Russia, 4–9 June 2018, 296–303, 2018.
Terada, K., Hirayama, K., and Sasamoto, M.: Field measurements of anchor and frazil ice, in: Proceedings of the 14th International Symposium on Ice, Potsdam, NY, USA, 27–31 July 1998, Vol. 2, 697–702, 1998.
Tsang, G.: Frazil and Anchor Ice: A Monograph, National Research Council of Canada, Ottawa, Canada, 1982.
Tremblay, P., Leconte, R., Lacey, J., and Bergeron, N.: Multi-day anchor ice cycles and bedload transport in a gravel-bed stream, J. Hydrol., 519, 364–375, 2014.
Turcotte, B. and Morse, B.: Ice processes in a steep river basin, Cold Reg. Sci. Technol., 67, 146–156, https://doi.org/10.1016/j.coldregions.2011.04.002, 2011.
Turcotte, B., Morse, B., Dubé, M., and Anctil, F.: Quantifying steep channel freezeup processes, Cold Reg. Sci. Technol., 94, 21–36, 2013.
Valentine, P. C.: Sediment classification and the characterization, identification, and mapping of geologic substrates for the glaciated Gulf of Maine seabed and other terrains, providing a physical framework for ecological research and seabed management, US Geological Survey Scientific Investigations Report 2019–5073, Reston, VA, USA, 37 pp., https://doi.org/10.3133/sir20195073, 2019.
Wazney, L., Clark, S. P., Malenchak, J., Knack, I., and Shen, H. T.: Numerical simulation of river ice cover formation and consolidation at freeze-up, Cold Reg. Sci. Technol., 168, 102884, https://doi.org/10.1016/j.coldregions.2019.102884, 2019.
World Meteorological Organization (WMO): WMO sea-ice nomenclature, codes, and illustrated glossary, Rep 259, TP145, World Meteorological Organization, Geneva, Switzerland, 1970.