the Creative Commons Attribution 4.0 License.
the Creative Commons Attribution 4.0 License.
 | 09 Jul 2021
The 2020 glacial lake outburst flood at Jinwuco, Tibet: causes, impacts, and implications for hazard and risk assessment
Guoxiong Zheng
Martin Mergili
Adam Emmer
Simon Allen
Anming Bao
Markus Stoffel
We analyze and reconstruct a recent glacial lake outburst flood (GLOF) process chain on 26 June 2020, involving the moraine-dammed proglacial lake – Jinwuco (30.356∘ N, 93.631∘ E) in eastern Nyainqentanglha, Tibet, China. Satellite images reveal that from 1965 to 2020, the surface area of Jinwuco has expanded by 0.2 km2 (+56 %) to 0.56 km2 and subsequently decreased to 0.26 km2 (−54 %) after the GLOF. Estimates based on topographic reconstruction and sets of published empirical relationships indicate that the GLOF had a volume of 10 million cubic meters, an average breach time of 0.62 h, and an average peak discharge of 5602 m3/s at the dam. Based on pre- and post-event high-resolution satellite scenes, we identified a large debris landslide originating from western lateral moraine that was most likely triggered by extremely heavy, south-Asian-monsoon-associated rainfall in June 2020. We back-calculate part of the GLOF process chain, using the GIS-based open-source numerical simulation tool r.avaflow. Two scenarios are considered, assuming a debris-landslide-induced impact wave with overtopping and resulting retrogressive erosion of the moraine dam (Scenario A), as well as retrogressive erosion without a major impact wave (Scenario B). Both scenarios are in line with empirically derived ranges of peak discharge and breach time. The breaching process is characterized by a slower onset and a resulting delay in Scenario B compared to Scenario A. Comparison of the simulation results with field evidence points towards Scenario B, with a peak discharge of 4600 m3/s. There were no casualties from this GLOF, but it caused severe destruction of infrastructure (e.g., roads and bridges) and property losses in downstream areas. Given the clear role of continued glacial retreat in destabilizing the adjacent lateral moraine slopes and directly enabling the landslide to deposit into the expanding lake body, the GLOF process chain can be plausibly linked to anthropogenic climate change, while downstream consequences have been enhanced by the development of infrastructure on exposed flood plains. Such process chains could become more frequent under a warmer and wetter future climate, calling for comprehensive and forward-looking risk reduction planning.
- Article
(24587 KB) - Full-text XML
-
Supplement
(405 KB) - BibTeX
- EndNote


The widespread retreat and thinning of glaciers observed in the 20th century has, in most regions, accelerated over recent decades as a consequence of global warming (Hock et al., 2019; Zemp et al., 2019), leading to the rapid expansion of glacial lakes (Shugar et al., 2020; Wang et al., 2020). When water is suddenly and catastrophically released, glacial lake outburst floods (GLOFs) can cause severe societal and geomorphic impacts over large distances downstream (Lliboutry, 1977; Carrivick and Tweed, 2016; Cook et al., 2018; Wilson et al., 2019). This threat is most apparent in high-mountain Asia, where severe, high-magnitude GLOFs have been recorded (Westoby et al., 2014; Harrison et al., 2018; Nie et al., 2018; Veh et al., 2019; Zheng et al., 2021). Lakes are increasing rapidly in both number and area (Gardelle et al., 2011; Zhang et al., 2015; Haritashya et al., 2018; Zheng et al., 2019), and GLOF impacts can extend across national boundaries to create severe challenges for early warning or other risk reduction strategies (Khanal et al., 2015; Allen et al., 2019). Scientific attention has primarily focused upon moraine-dammed glacial lakes, owing to their large volumes (Fujita et al., 2013; Veh et al., 2020), weak dam composition, and predisposition to various triggering mechanisms, of which ice and/or rock avalanches are most commonly reported (Emmer and Cochachin, 2013; Nie et al., 2018). However, despite numerous large-scale GLOF hazard and risk studies having been conducted at national (e.g., Wang et al., 2015; Rounce et al., 2017; Dubey and Goyal, 2020) and larger regional scales (e.g., Ives et al., 2010; Schwanghart et al., 2016), there remains a relative lack of site-specific investigations and reconstructions of past GLOF disasters. In fact, only a small fraction of recorded moraine-dammed GLOF events across high-mountain Asia have been comprehensively studied (e.g., Narama et al., 2010; Westoby et al., 2015; Allen et al., 2016; Gurung et al., 2017; Byers et al., 2018; Majeed et al., 2020; Nie et al., 2020), and as such, triggering mechanisms and processes for the majority of cases remain speculative. This is particularly true for the large number of GLOF events that have occurred during the monsoon months (Richardson and Reynolds, 2000), during which time a lack of cloud-free satellite image and/or safe access to the field can prevent detailed assessment. Nonetheless, based on limited case evidence from the Himalaya (Allen et al., 2016) and elsewhere (e.g., Clague and Evans, 2000; Worni et al., 2012), it is reasonable to assume that heavy rainfall may be an important yet often underrated trigger of GLOF events and related process chains. In view of projected climate change bringing warmer and also wetter conditions to monsoon-affected parts of high-mountain Asia (Mathison et al., 2013; Kitoh, 2017; Sanjay et al., 2017), there is hence an urgent need to learn from recent GLOF disasters, in order to improve our ability to assess and eventually manage future risks. This includes consideration of not only the physical drivers of GLOF hazard but also the underlying dimensions of societal exposure and vulnerability that may ultimately drive GLOF risk (Huggel et al., 2020).
During the onset of the 2020 monsoon, under the influence of warm temperatures and heavy rainfall, a GLOF occurred on 26 June in Tibet, China, causing severe damage to infrastructure and social impacts in downstream areas. Here, we aim to provide a rapid yet comprehensive investigation of this GLOF disaster, combining numerical modeling with the analysis of remotely sensed data, eye-witness accounts, and media reports. Specifically, the objectives of this study are to reconstruct both the longer-term conditioning and short-term triggering and dynamics of the GLOF event and to assess the immediate impacts upon downstream communities. Ultimately, we explore the extent to which this GLOF disaster can be linked to anthropogenic climate change or other drivers and discuss broader implications for future GLOF hazard and risk assessment.
The study area is located at the Nidou Zangbo (“Zangbo” refers to rivers in Tibetan) watershed in the eastern Nyainqentanglha, Tibet Autonomous Region, China (Fig. 1). The Nidou Zangbo originates from the eastern foothills of the Luola Mountains near the north of Zhongyu township in Lhari County with a length of 68 km (Liu, 2014) and is the right tributary of Yi'ong Zangbo. The watershed covers an area of 1267 km2 with an elevation difference of 3715 m. The topography of the watershed is high in the west and low in the east, with an average elevation of > 5000 m. Most of the peaks in the watershed reach more than 6000 m, with the highest peak, Nenang Peak, at 6870 m. The glacial and paraglacial landscapes are highly developed in the watershed, with a total of 294 glaciers (≥ 0.05 km2 around 2005) covering a combined area of 396 km2 (RGI Consortium, 2017). There are 96 glacial lakes (≥ 900 m2 around 2015) distributed in the watershed with a total area of 3.2 km2 and an average area of 0.03 km2 (Zheng et al., 2021), of which the majority are moraine-dammed lakes. The watershed is part of the sub-humid monsoon climate zone of the plateau with cold winters and cool summers (M. Sun et al., 2014). The average annual temperature recorded from the Lhari weather station during 1980–2019 is −0.2 ∘C with an average lowest temperature of −10.6 ∘C in January and an average highest temperature of 8.9 ∘C in July (Fig. 1). The average annual total precipitation is 753 mm, and about 80 % is concentrated from May to September (Fig. 1), largely controlled by the south Asian monsoon (M. Sun et al., 2014).
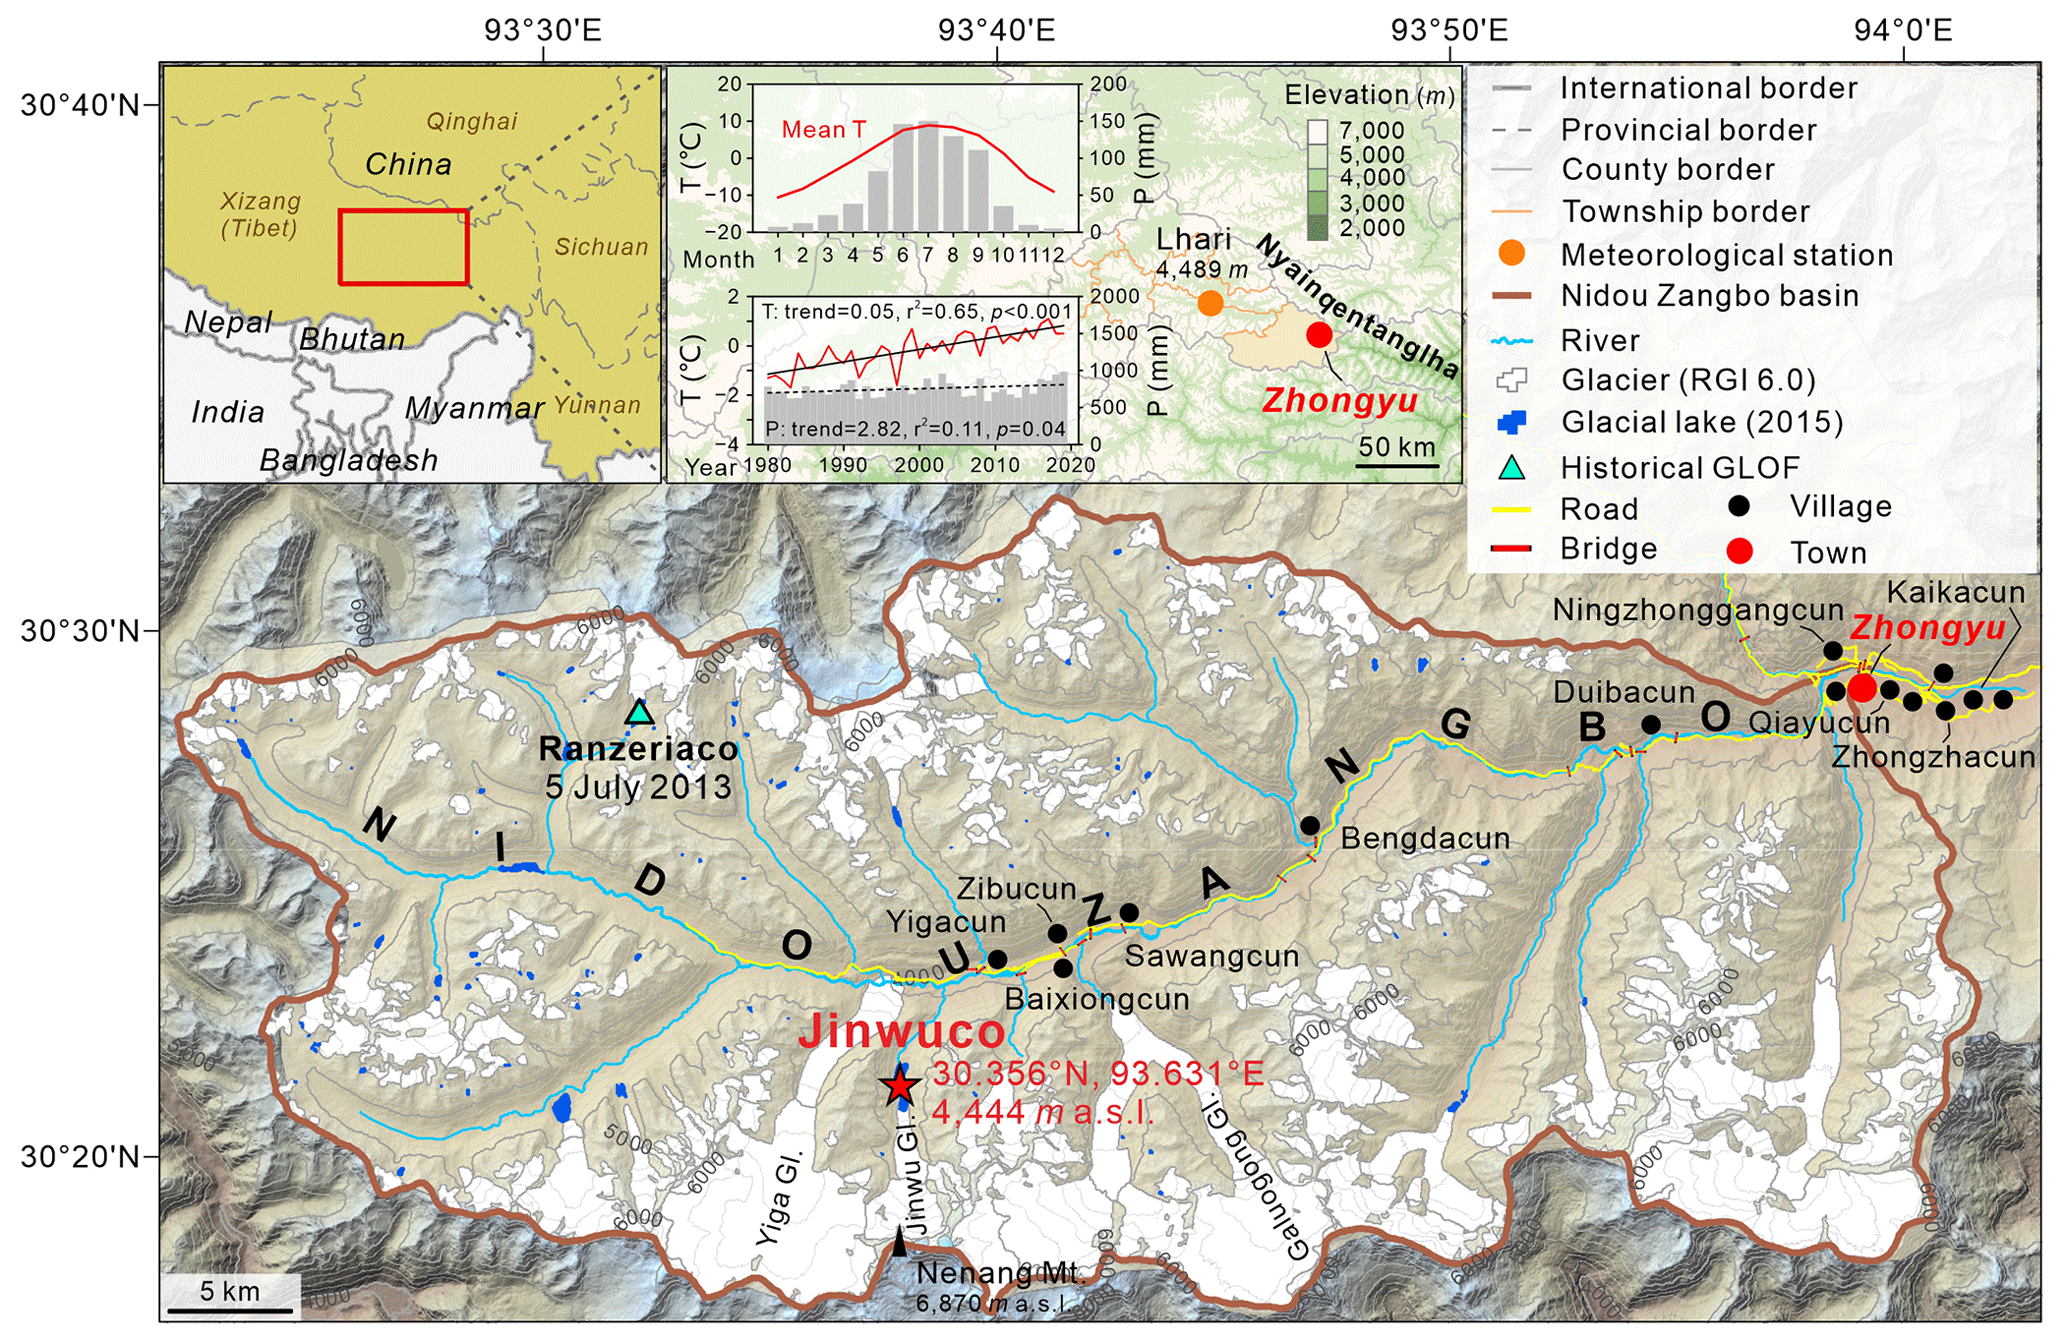
Figure 1Location of Jinwuco and surrounding geographic features, including terrain, rivers, glaciers, glacial lakes, settlements, and major infrastructures (roads and bridges) downstream. The climate statistics in the upper middle panel are based on the Lhari weather station, approx. 50 km away from Jinwuco, 1980–2019. The topographic base map is based on the DEM generated from Ziyuan-3 stereoscopic pairs. The borders and location of the villages are from © Baidu Maps.
Jinwuco (also known as Jiwengco, 30.356∘ N, 93.631∘ E) is a proglacial moraine-dammed lake (Fig. 2) which is also the largest glacial lake within the Nidou Zangbo basin (Zheng et al., 2021). It is situated at the terminal of the Jinwu Glacier that covers an area of 7.9 km2, and the lake is in contact with the steep ice tongue. The ice tongue enters the lake about 350 m below the steep ice cliff that has a height of approx. 250 m and an average slope of 35∘ measured based on the satellite scene and DEM acquired on 25 August 2020 (Table 1). The main axis of the lake is oriented in a north–south direction, flanked by steep slopes and lateral moraines. The average height of the lateral moraines is over 100 m, and the slopes are about 40∘. The upper end and both lateral moraine slopes surrounding the lake are seasonally snow covered, with an ablation period from April to September and an accumulation period from October to March. The lake shows a typical elongated irregular oblong shape with a straight-line length of approx. 1.8 km, and its width varies in different positions. Before the GLOF of 26 June 2020, it exhibited wider front and rear sections and a narrow middle section, with the section near the dam being 0.33 km wide. The part near the glacier is 0.24 km, and the middle section is about 0.23 km wide. The dam of the lake is formed by a vegetation-covered terminal moraine and has a length of about 400 m perpendicular to the streamline with an average slope of the distal (outer) face of 20∘ and an average height of 10 m. The outlet channel is located on the western side of the moraine dam where there is a permanent surficial outflow (i.e., dam freeboard = 0 m).

Figure 2Overview of Jinwuco before the collapse of the dam. (a) An overall view of Jinwuco and surroundings taken from the opposite valley on 19 June 2020. (b) Crevassed hanging glacier ice terminated in Jinwuco, taken from downstream to upstream of the lake on 11 June 2020. (c) Morphological parameters of Jinwuco; photo taken from upstream to downstream of the lake on 15 June 2020. (d) Lateral moraine and steep mountain slopes from west to east (11 June 2020) and (e) from east to west (30 May 2020). (f) Vegetation-covered moraine dam and the position of the outlet (11 June 2020). Photos: Qiangba Quying (used with permission).
From the administrative location, the Zhongyu township where Jinwuco is situated is part of the southeastern Lhari County, 118 km from the county seat. It contains 14 administrative villages in total. Six of them are within the middle and upper reaches of the Nidou Zangbo basin (Fig. 1).
3.1 Long-term evolution of Jinwuco and adjacent slopes
To investigate the evolution of Jinwuco, multiple sets of satellite scenes are used to obtain its surface area between 1965 and 2020. The details and parameters of the datasets used are presented in Table 1. The declassified spy photographs of Corona KH-4A and Hexagon KH-9, captured on 31 December 1965 and on 4 January 1976, are first geometrically corrected using a Landsat 8 scene taken on 28 September 2013 as the master image and are then projected onto the 1984 WGS UTM zone N46 coordinate system and resampled to 3 and 6 m, respectively. The multispectral and panchromatic bands of Landsat-7 ETM+ and Landsat-8 OLI are fused using a nearest-neighbor diffusion-based pan-sharpening algorithm (W. H. Sun et al., 2014) to improve the spatial resolution to 15 m.
The outlines of Jinwuco are manually delineated based on these satellite images. The lake area is then calculated based on the UTM projection, and its uncertainty is estimated using the following equation (Hanshaw and Bookhagen, 2014):
where P is the perimeter of the glacial lake and G is the spatial resolution of the images used.
The regression analysis method is used to quantify the long-term evolution trend of Jinwuco.
Table 1Details and parameters of datasets used.
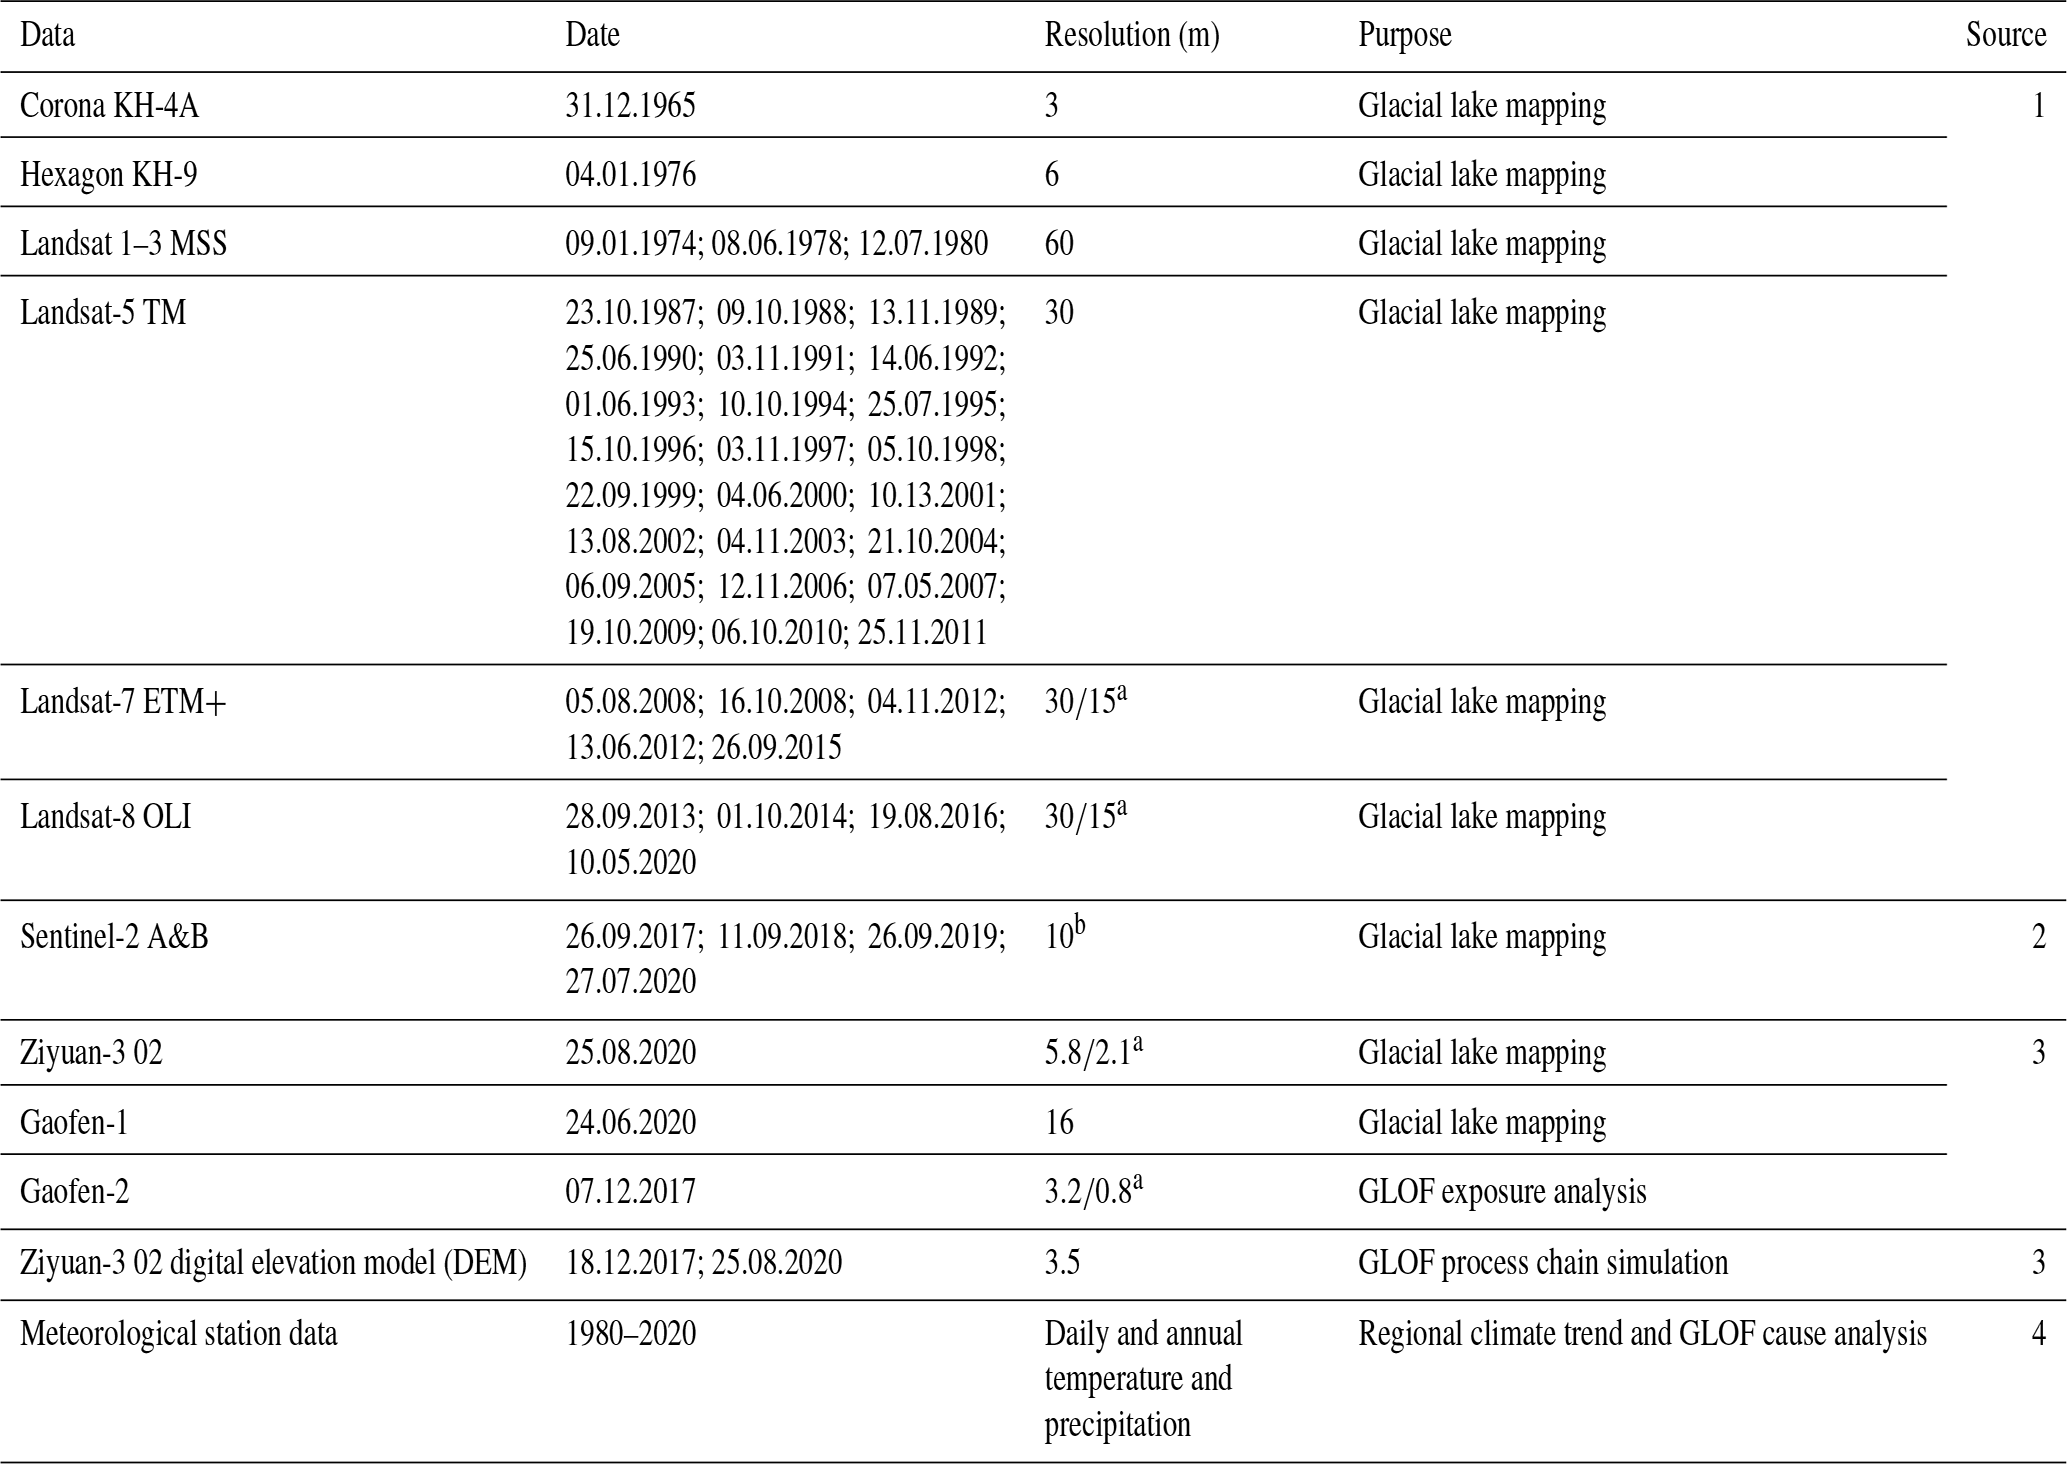
(1) USGS – United States Geological Survey (https://earthexplorer.usgs.gov/, last access: 1 December 2020); (2) ESA – European Space Agency (https://scihub.copernicus.eu/, last access: 1 December 2020); (3) RSGS – China Remote Sensing Satellite Ground Station – Kashi Ground Station; CRESDA – China Center for Resources Satellite Data and Application (http://www.cresda.com/, last access: 1 December 2020); (4) CMA – China Meteorological Administration (http://www.cma.gov.cn/, last access: 1 December 2020). a Spatial resolution of multispectral/panchromatic image. b Only multispectral and near-infrared bands () with 10 m spatial resolution were used.
3.2 Reconstruction and quantification of relevant features
Reconstruction of flood-related features is mainly based on two DEMs (one from 18 December 2017, i.e., before the event, and the other one from 25 August 2020, i.e., after the event) that were generated from Ziyuan-3 stereoscopic pairs (Table 1). A rough DEM of difference (DoD) is produced from the overlay of the two DEMs. Further, empirical equations estimating lake volume from lake surface area (Sect. 3.4) are employed. Specifically, the following steps are performed.
The lake bottom topography is reconstructed from the post-event DEM and the empirical volume estimation outlined in Sect. 3.4. In the pre-event DEM, the lake surface elevation is replaced by the reconstructed lake bottom elevation.
The landslide scarp area and the release volume and release thickness distribution are derived from the DoD, also considering the landslide features revealed by the post-event satellite image. The same is done for the landslide deposit.
The DoD is used to derive the breach geometry and volume at the moraine dam of Jinwuco.
The pre-event and the post-event DEM are mosaicked in order to obtain the best possible quality and the most-up-to-date information for each pixel of the study area. This is necessary as – on the one hand – both DEMs show areas of poor quality, with major artifacts. On the other hand, it is necessary to use the post-event DEM for the rear portion of Jinwuco, as the pre-event DEM shows the situation in 2017, which is outdated due to glacier retreat.
As a result, raster maps of the terrain surface (cleared for lake water as well as landslide material), distribution of landslide release and deposition thickness, and distribution of erosion depth at the moraine dam of Jinwuco are available for further analyses. All raster maps are prepared at a cell size of 3 m. The DEM is not corrected for the influence of vegetation, which is considered negligible within the scope of the present work. Further, a Gaofen-1 satellite image from 24 June 2020 was used to limit the timing of the landslide.
3.3 Meteorological conditions before the event
In order to ascertain and analyze the meteorological conditions in the region prior to the GLOF, the daily temperature and precipitation data pre- and post-event at the nearest Lhari weather station to Jinwuco are used (Fig. 1). The station is located approx. 50 km to the northwest of Jinwuco, at a comparable elevation (4489 vs. 4444 m a.s.l.). The mean and extreme temperature and precipitation over the first half of 2020 are compared to a 30-year climatological time series (1986 to 2015). It should be noted that due to rainfall shadow and other topographic effects, precipitation can be highly heterogeneous in mountain environments. For this reason, satellite-based accumulated precipitation patterns over southeastern Tibet in June 2020 were used to confirm the appropriateness of the Lhari weather station for representing conditions at Jinwuco (Supplement Fig. S1). Furthermore, interviews with local people confirmed there was indeed continuous rainfall in the period prior to the flood that was generally consistent with the weather station records.
3.4 Empirical estimation of lake volume, breach time, and peak discharge
We employ a set of empirical equations to estimate lake volume (V), breach time (tb), and peak discharge (Qp) in order to cross-check whether our simulation results are within the range of plausible values. Further, we use measured lake area (A) and calculated lake volume (V) to estimate the mean lake depth (D). The following input data are derived from the analysis of pre- and post-GLOF satellite images and DEMs and used in the calculations:
-
lake area before GLOF (A): 560 000 m2;
-
lake width (Lw): 360 m;
-
breach depth (Bd): 20 m;
-
maximum breach width (Bw_max): 80 m;
-
average breach width: 40 m (considering V-shaped cross profile; Bw_avg_v), 60 m (considering trapezoidal cross profile; Bw_avg_t);
-
breach width at the base considering trapezoidal cross profile (Bw_base_t): 40 m;
-
volume of material eroded from the dam (Ver): 300 000 m3;
-
released volume (VGLOF): 10 000 000 m3.
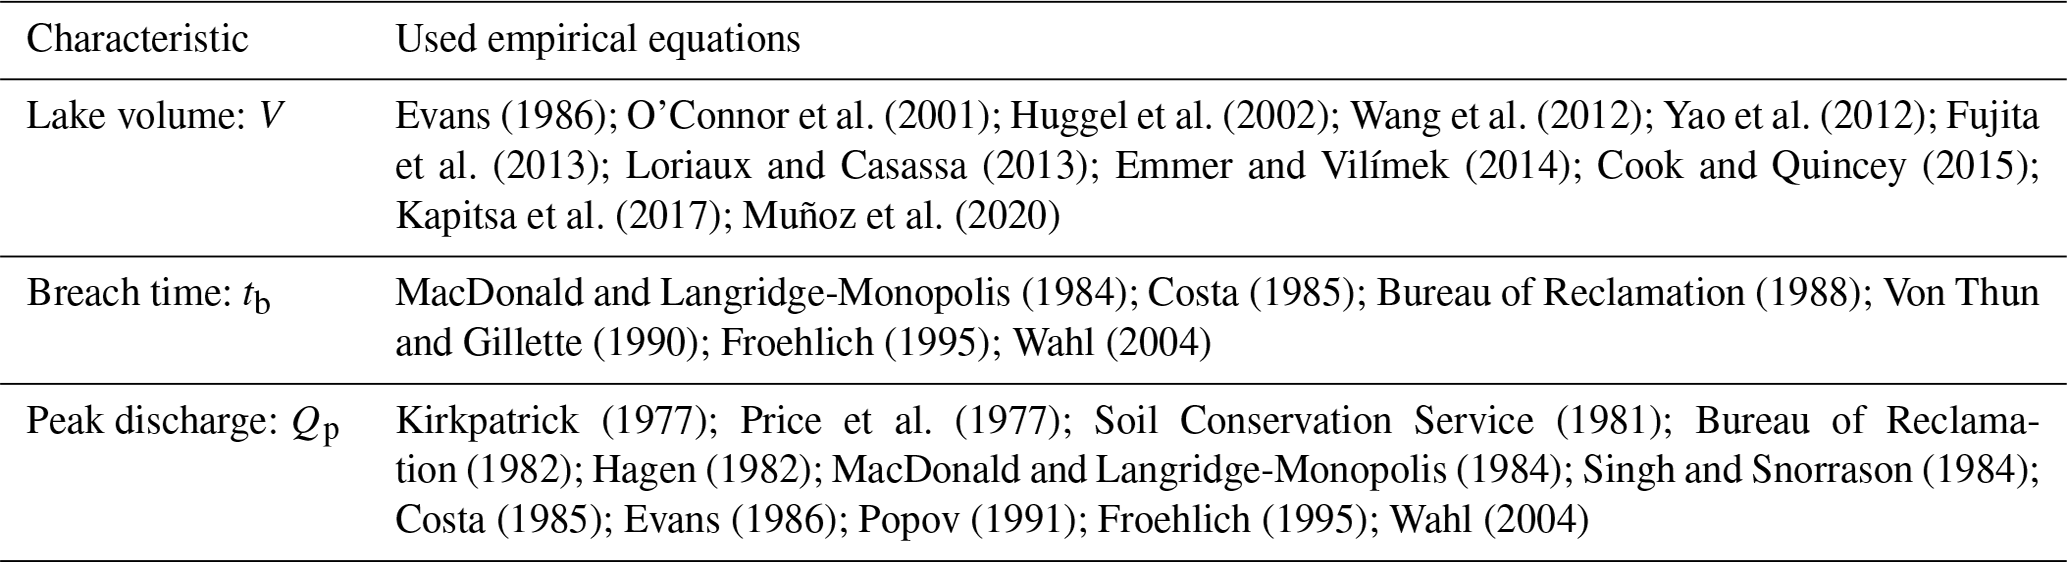
We employ a total of 16 different empirical equations to estimate V, 8 equations to estimate tb (considering both V-shaped and trapezoidal cross profile of the breach), and 17 equations to estimate Qp (see Table 2 and Supplement Table S1). These equations are based on relationships derived from plotted values of well-documented cases. Despite the widths of uncertainty bands and prediction intervals of these datasets being high (Froehlich, 1995; Wahl, 2004), they represent useful tools for approximating the range of plausible values.
Table 2A list of empirical equations used to estimate V, tb, and Qp (for detailed description of these equations see Supplement Table S1).
3.5 Process chain simulation with r.avaflow
We back-calculate part of the complex GLOF process chain, employing the simulation tool r.avaflow (Mergili et al., 2017; Pudasaini and Mergili, 2019; Mergili and Pudasaini, 2020). r.avaflow is a GIS-based open-source simulation framework for multi-phase mass flows, which has the capacity to dynamically compute the interaction between landslides and lakes. Therefore, it is considered most suitable for the 2020 GLOF process chain at Jinwuco. In the present work, we back-calculate the release of the initial landslide into the lake, formation and spreading of displacement wave(s), dam breach, lake drainage, and flood propagation 1.2 km downstream from Jinwuco. We do not consider the subsequent part of the process chain in the simulation continuing downstream, as quantitative reference data on travel times or discharges – and, farther downstream, also impact areas – are not available or are at least highly uncertain.
Two scenarios are simulated, representing the two extremes in the range of likely triggers of the process chain (see Sects. 4.2 and 5.1 for more detailed explanations).
-
Scenario A. The GLOF process chain is directly triggered by the extremely rapid movement of the initial landslide into the lake. The full reconstructed landslide volume is considered (Sect. 4.2).
-
Scenario B. The initial landslide does not directly trigger the GLOF process chain and is therefore disregarded. Instead, the breach of the moraine dam is initiated by incision of the surficial outlet channel. Such an incision is induced by increased outflow caused by a rather slow movement of the landslide into the lake.
Apart from the initial landslide, other model inputs are the same for both scenarios: the terrain is represented by the reconstructed DEM (Sects. 3.2 and 4.2), and so are the other input rasters: an initial landslide volume of 1.2 million cubic meters is released from the location shown in Fig. 5 in Scenario A but not in Scenario B. A solid fraction of 80 % with a density of 2700 kg/m3 and a fluid fraction of 20 % with a density of 1000 kg/m3 are applied, assuming largely saturated conditions. According to topographic considerations and the volume range derived from empirical relationships (Sects. 3.4 and 4.4), the volume of Jinwuco is set to 13.9 million cubic meters of water (fluid material with a density of 1000 kg/m3), which is a slightly more conservative volume than mean and median empirical estimates (Sect. 4.4). Erosion and entrainment of solid material from the terminal moraine is set to the extent of the calculated breach volume (300 000 m3, Sect. 4.2). For the erodible material, saturated conditions with 80 % solid and 20 % water are assumed. The same densities as for the landslide material are applied. The most important model parameters are the internal and basal friction angles of the solid material φ and δ, the fluid friction number n, and the coefficient of erosion CE. Empirically adequate results are obtained with φ=25∘, δ=10∘, n=0.05, and . This combination of parameters is probably not the only one possible due to equifinality (Beven, 1996). Nevertheless, it is considered physically plausible, and a detailed sensitivity analysis would go beyond the scope of the present work. The process duration considered in the simulation is t=7200 s (2 h) from the release of the initial landslide. All simulations are run at a raster cell size of 12 m.
3.6 Analysis of impacts on society
On-site photos, videos, and local news reports are collected to capture and quantify the immediate societal impacts of this GLOF event. Access to this information is largely made possible by the rapid development of online personal sharing applications (e.g., Douyin or TikTok) in recent years. Here, we gather an abundance of photos and videos from locals and travelers that can provide the most intuitive in situ information about the lake and the region.
4.1 Long-term evolution of Jinwuco and adjacent slopes
Historical satellite images reveal that Jinwuco has undergone significant areal expansion since 1965 (Fig. 3). In 1965, its surface area was 0.36 ± 0.003 km2. By 10 May 2020, the lake area has increased to 0.56 ± 0.02 km2, showing an increase of approx. 56 % relative to 1965 (Fig. 4). Overall, the surface area of Jinwuco shows a non-linear growth trend from 1965 to 2020 – with an accelerated growth rate observed from 1995. Importantly, the rear part of the lake, where the landslide deposited, is shown to have developed since 2010 (Fig. 3). After the GLOF event on 26 June 2020, the lake area is reduced by approx. 54 % to 0.26 ± 0.01 km2 (Fig. 4).
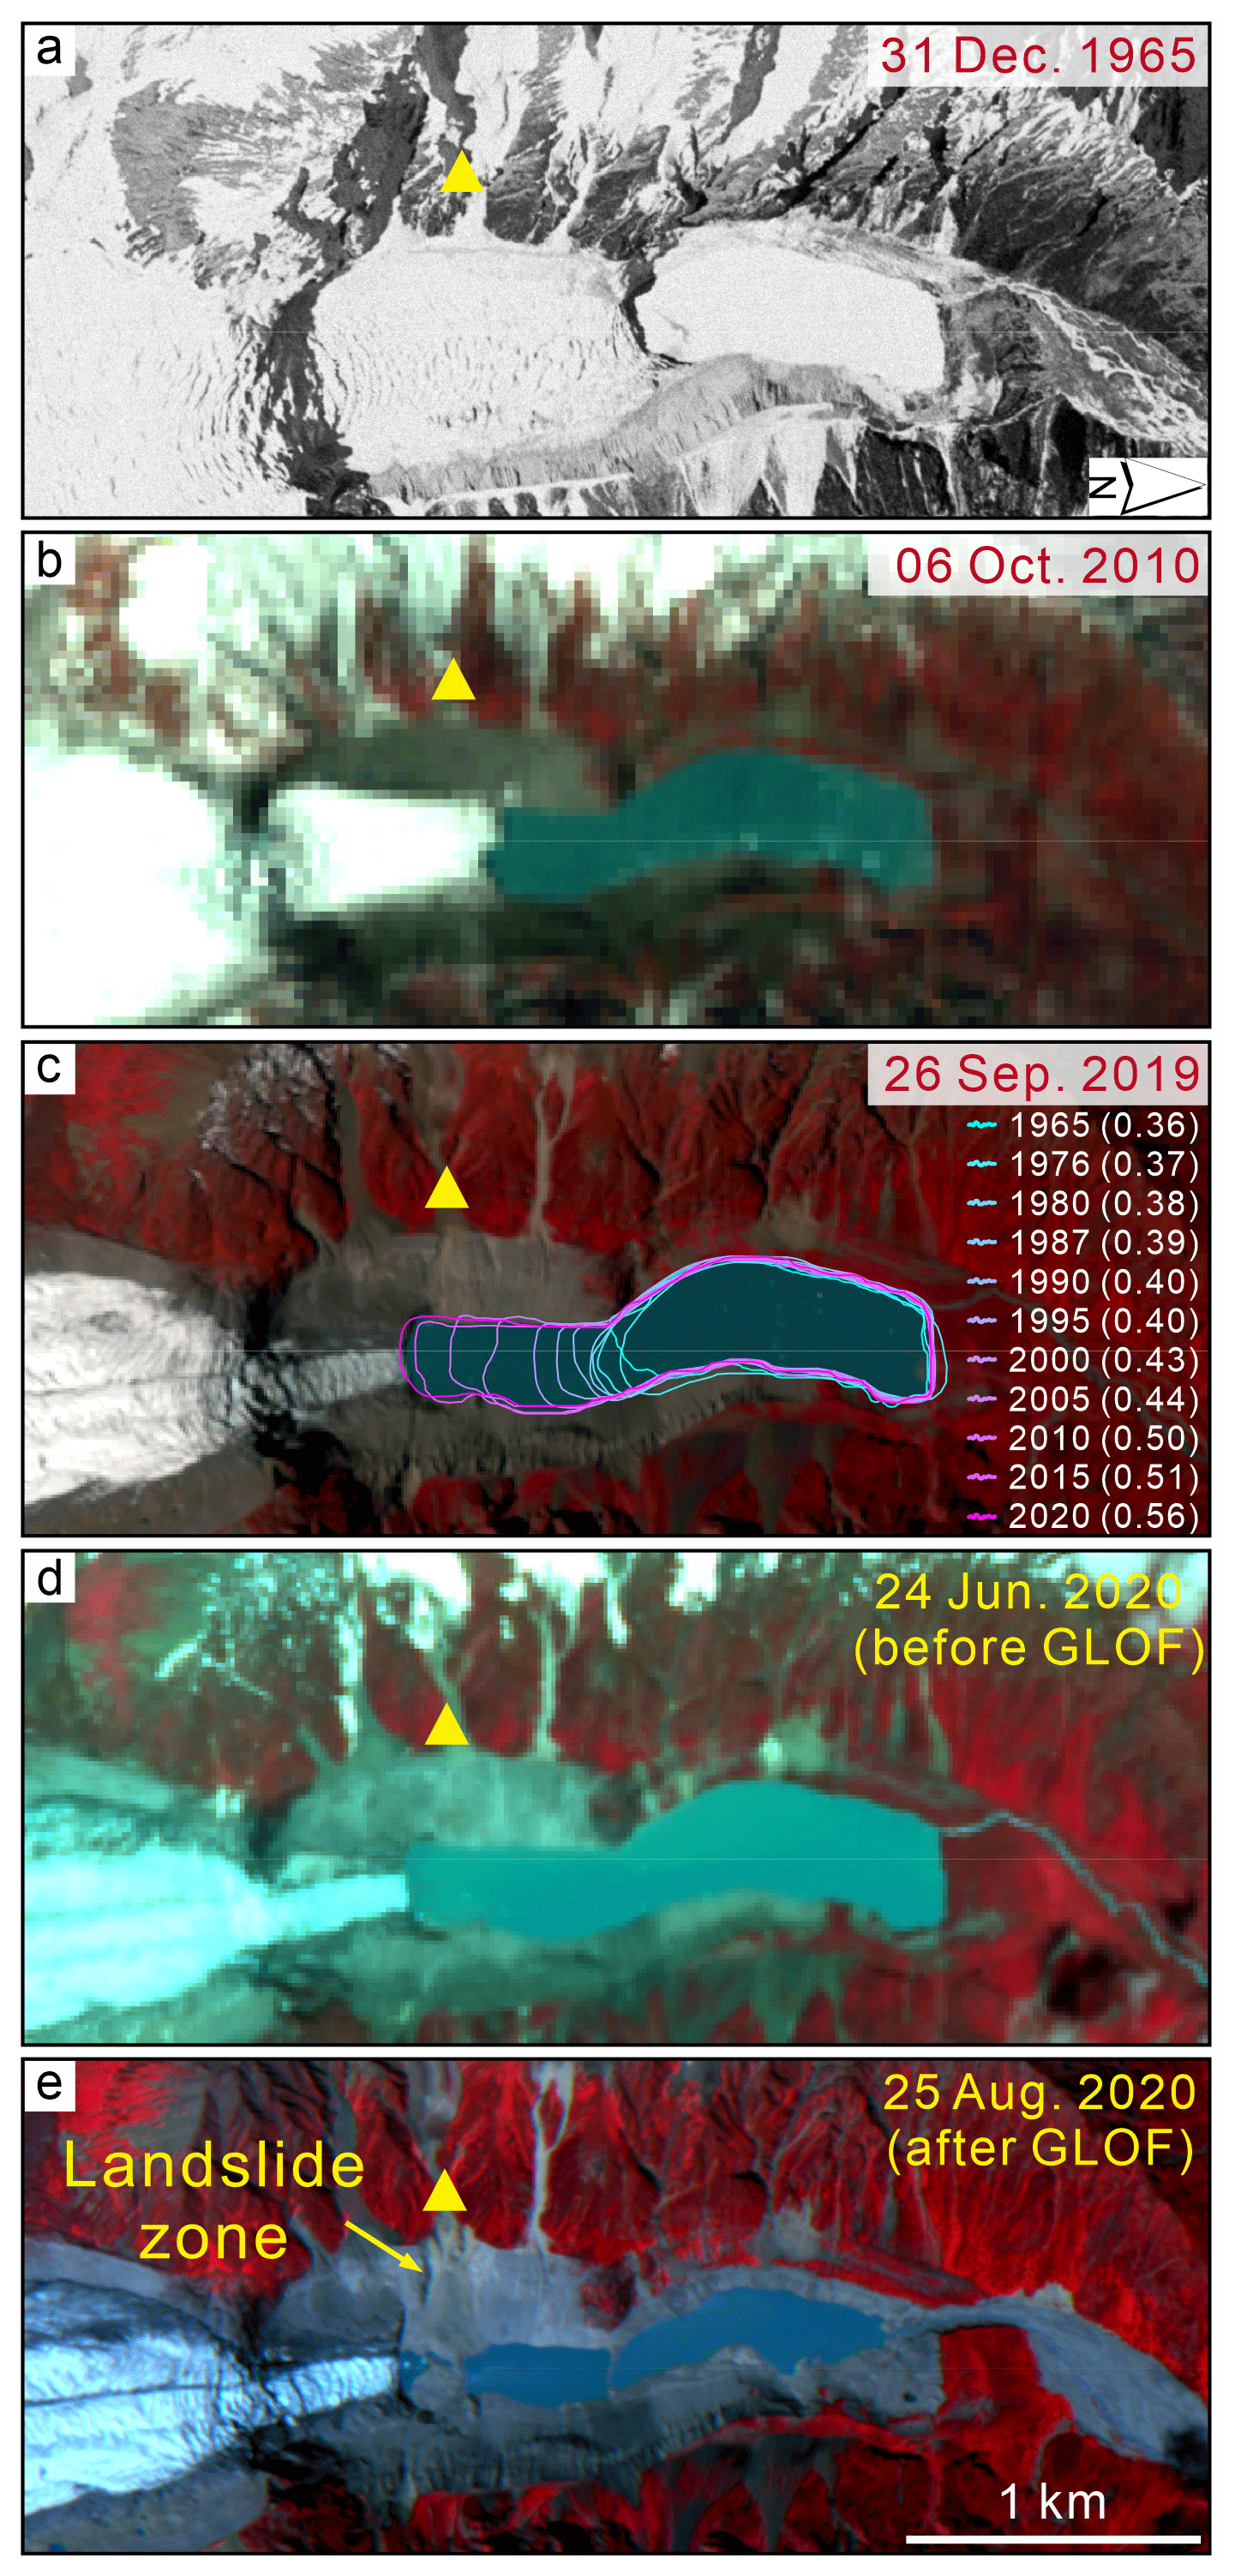
Figure 3Satellite images documenting the evolution of Jinwuco during 1965–2020 and the location of the debris landslide. The lake area in parentheses of panel (c) is given in square kilometers. The backgrounds are from Corona KH-4A, Landsat-5 TM, Sentinel-2A, Gaofen-1, and Ziyuan-3, respectively.
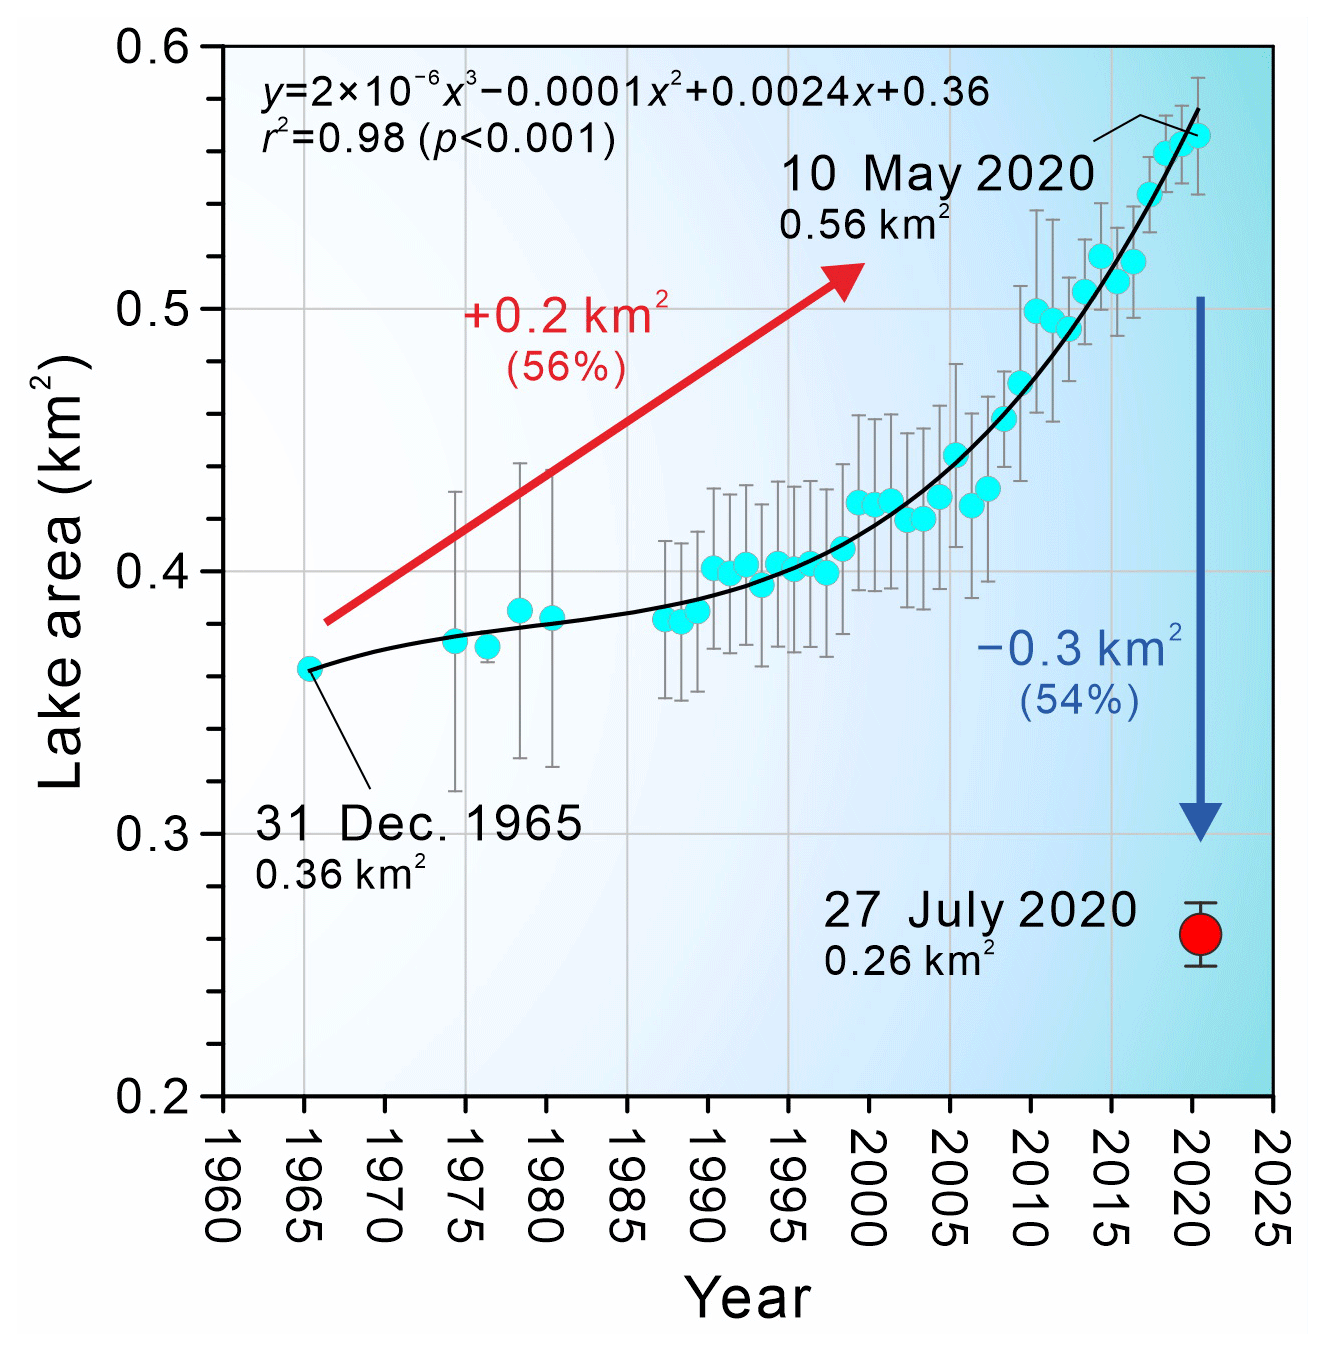
Figure 4Inter-annual dynamics of Jinwuco during 1965–2020 (prior to the GLOF), and the abrupt decrease in lake area after the GLOF.
4.2 Reconstruction and quantification of relevant features
The reconstruction of the main features allows for drawing some conclusions about the mechanisms involved in the GLOF process chain and for estimating the mobilized volumes (Figs. 5 and 6).
-
Lake. The pre-event lake area was approx. 560 000 m2 (Fig. 4), with a maximum width of ca. 360 m. A lake volume of 13.9 million cubic meters is reconstructed (Sect. 4.4), corresponding to a maximum lake depth of 54 m. The pre-event lake level is set to 4444 m, whereas the post-event lake level is set to 4424 m, resulting in a drop of 20 m during the event. In the frontal portion of Jinwuco, some discrepancies exist between the post-event lake extent derived from the DEM and the satellite image (Fig. 5): this mismatch most likely indicates inaccuracies of the DEM.
-
Landslide. The Gaofen-1 imagery of 24 June reveals that the landslide had not yet happened until this point in time. Assuming that the landslide occurred before the GLOF, we constrain the timing of the landslide to the period 24–26 June 2020. A landslide release volume of approx. 1.2 million cubic meters is estimated from the DoD. However, there is an error margin of a few hundred thousand cubic meters due to the non-perfect overlay of the two DEMs. Despite some uncertainty in relation to the exact volumes involved, it is quite clear from the DoD that the landslide initiated at the western lateral moraine slope in the very rear part of Jinwuco. The satellite image reveals that there might have been some indirect involvement of material from slopes located above, which accumulated behind the crest of the lateral moraine (possibly even slightly overtopping it). The additional load, in connection with saturation of the lateral moraine, might have triggered the landslide. However, this interpretation remains speculative. The landslide deposit is clearly visible in the rear portion of the post-event lake in the satellite image and is also clearly represented in the post-event DEM. It seems likely that the landslide did not deposit onto the glacier tongue and therefore entered directly into the lake (Fig. 5). A deposition volume of 1.0 million cubic meters is derived. This number is uncertain not only due to possible errors of the DoD, but also as part of the deposit is covered by lake water, and part of it might have been washed away. However, the order of magnitude of the deposition volume corresponds very well to the release volume, so that the general pattern appears fairly robust. However, the available data do not allow us to conclude on the landslide velocity, so that we consider it useful to assume two scenarios for the GLOF simulation (Scenario A of an extremely rapid landslide triggering an impact wave, and Scenario B of a slower landslide indirectly resulting in a GLOF) (Sect. 3.5).
-
Breach of the terminal moraine. A maximum breach depth of 25 m and an eroded volume of 300 000 m3 are derived from the DoD. The difference of 5 m between the maximum breach depth and the drop of the lake level is a result of the steeper longitudinal profile of the upper part of the drainage channel after the breach, compared to the situation before the breach. However, as it is clearly shown in Fig. 6, there is a vertical offset between the pre- and post-event DEMs, limiting the accuracy of the estimates. Even though the offset is not constant in space, it is likely that the pre-event DEM would have to be uplifted in the area of the terminal moraine, relative to the post-event-DEM, to bring the two in line, which would increase the maximum breach depth by up to approx. 7 m. However, the data basis is too insufficient to justify such a correction.
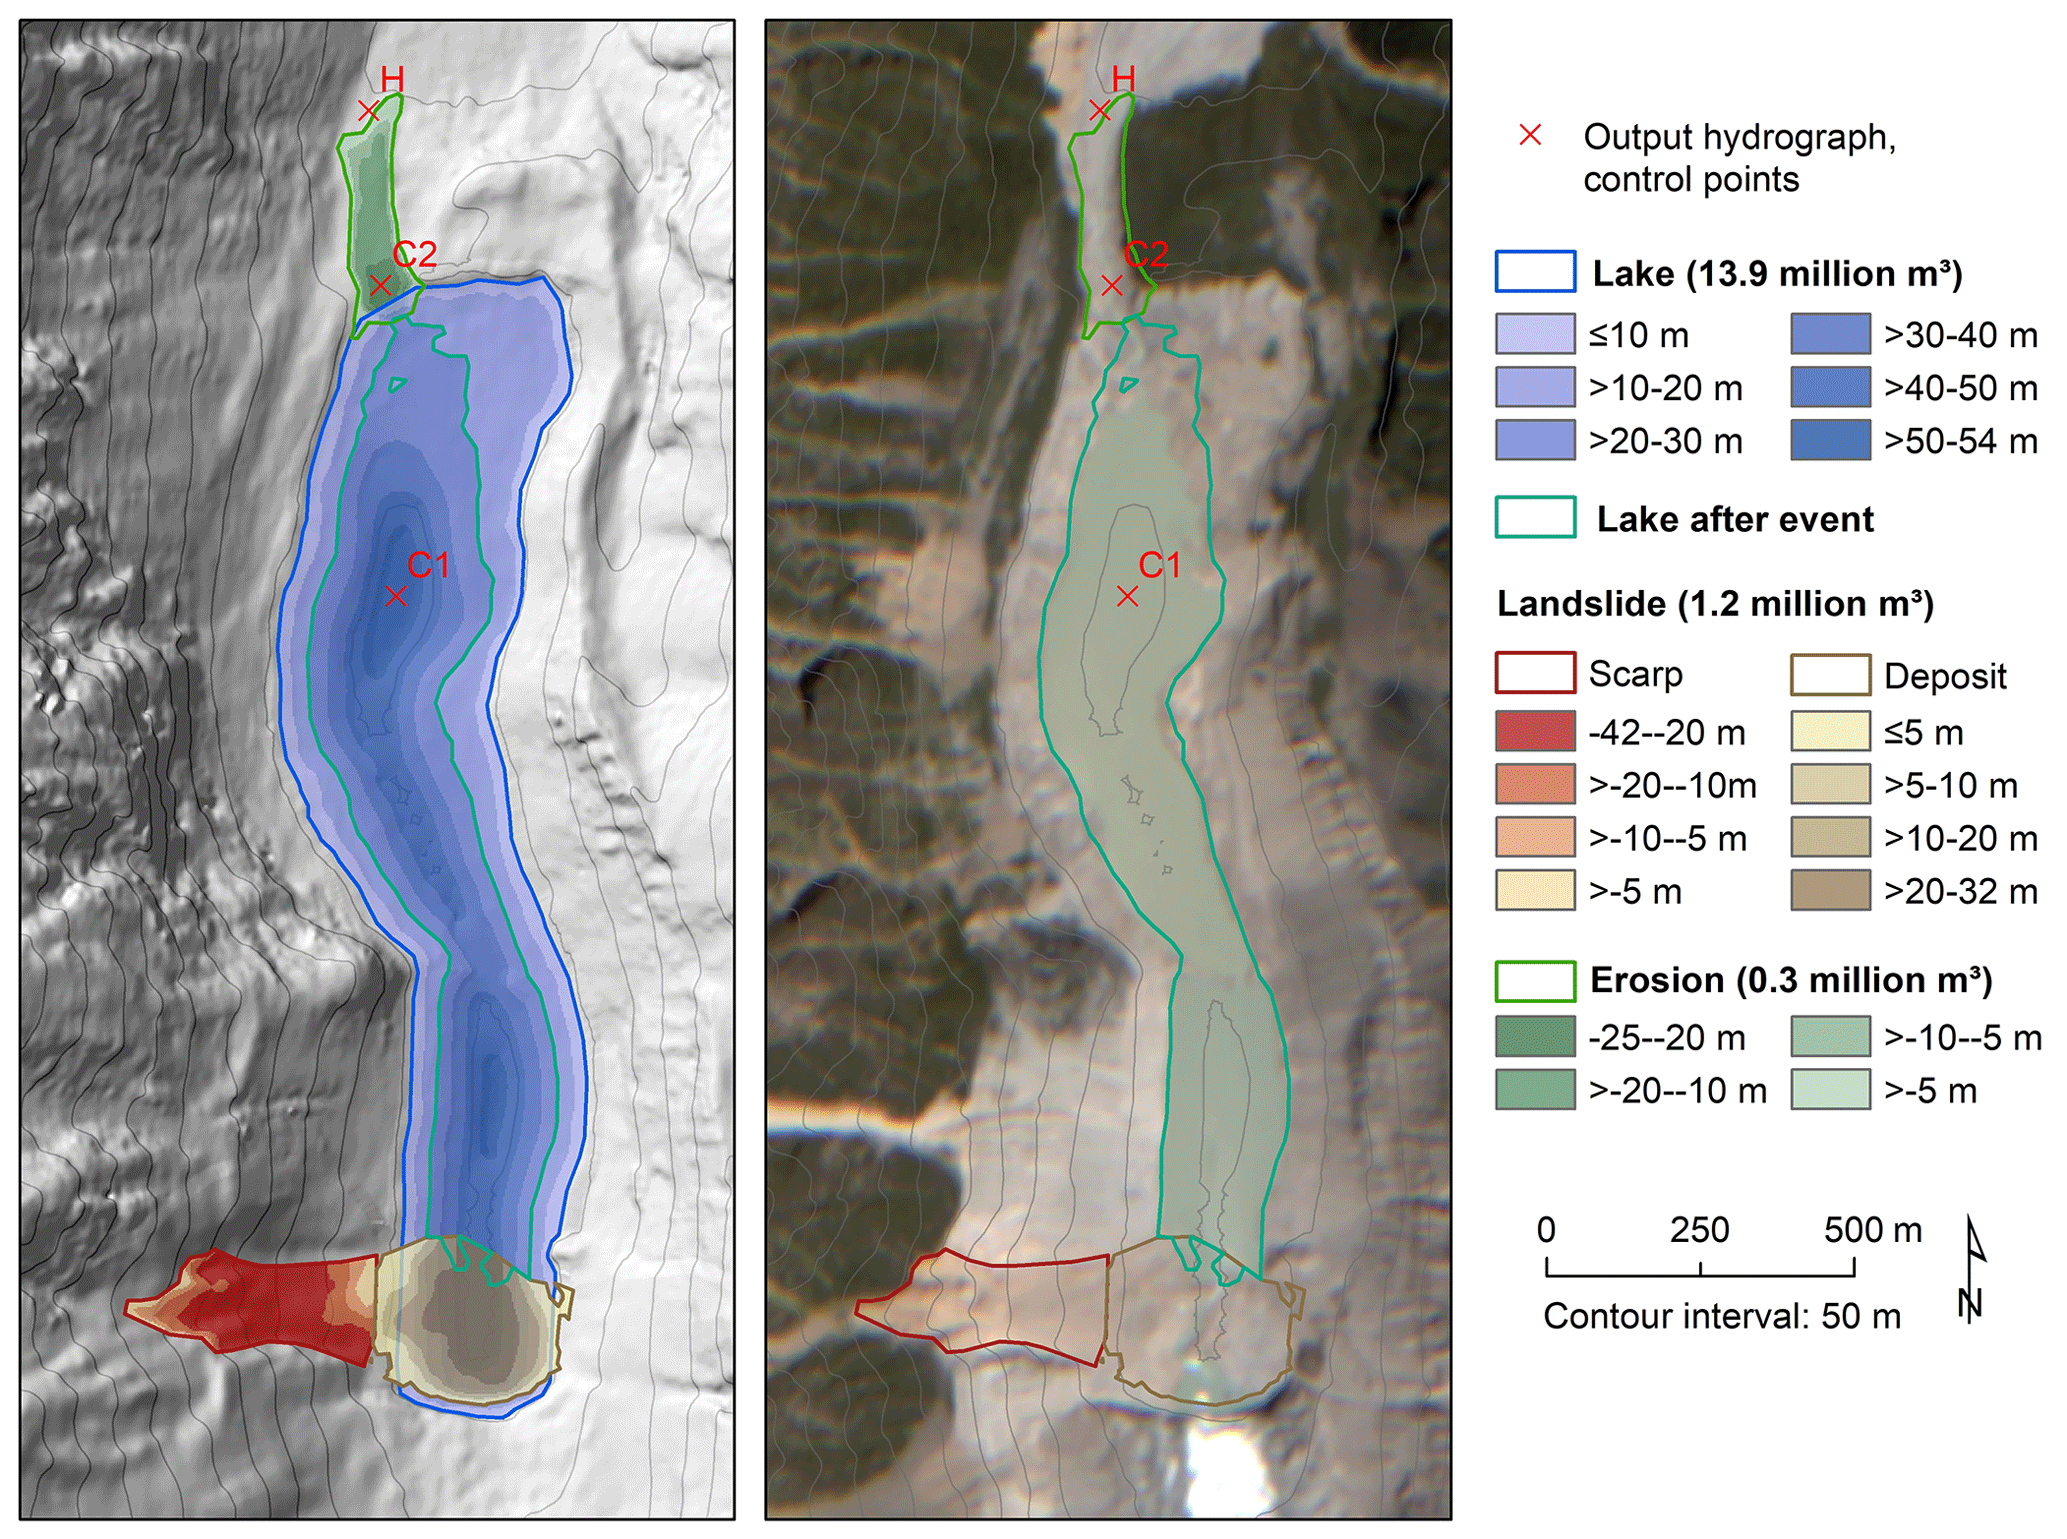
Figure 5Reconstruction of the lake depth, landslide, and breach of the moraine dam. The base map is a shaded relief map (left) based on the DEM generated from Ziyuan-3 stereoscopic pairs and the Ziyuan-3 satellite scene (right) acquired on 25 August 2020.
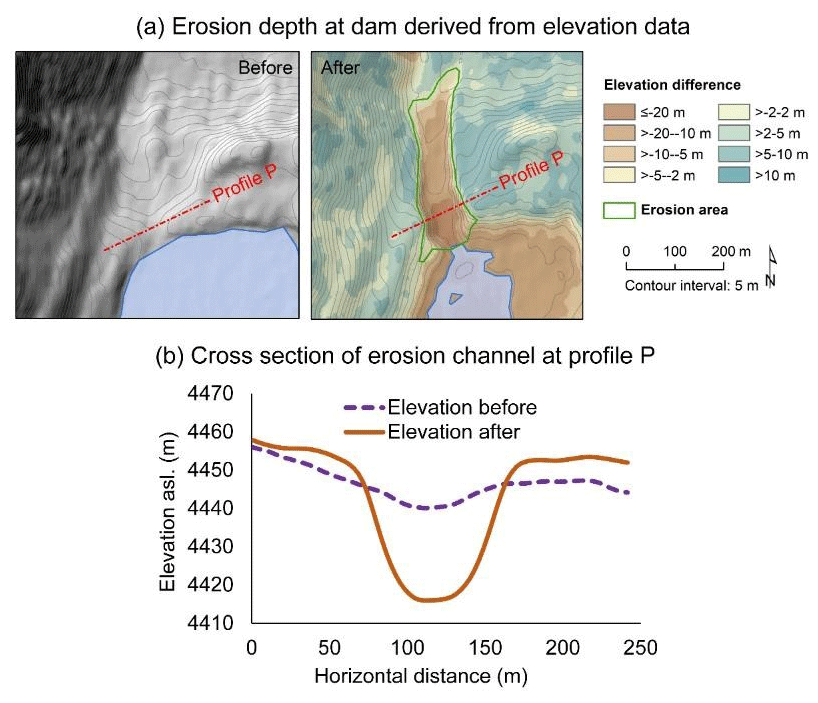
Figure 6Breach of the moraine dam of Jinwuco. (a) Situation before and after the event of 26 June 2020, with difference in elevation between the DEMs derived before and after the event. (b) Cross section along the profile P (see a) before and after the event. The topographic base map is based on the DEM generated from Ziyuan-3 stereoscopic pairs.
4.3 Meteorological conditions before the event
When compared to the longer-term climatology it becomes immediately obvious that the landslide and GLOF process chain at Jinwuco occurred following a period of above-average temperatures and unusually wet weather (Fig. 7). Over the dry winter and into the pre-monsoon months, precipitation measured at Lhari station was consistent with the longer-term mean, as seen in the accumulated totals (Fig. 7b). However, through May and particularly June 2020, notable periods of extremely heavy precipitation occurred, regularly exceeding 90th and even 95th percentile levels. In June, the 1986–2015 average precipitation total was 141 mm, compared to 240 mm in 2020, corresponding to an anomaly of +70 %. A particularly wet period is observed from 5–8 June 2020, with a total of 88 mm and a daily maximum of 31 mm of precipitation on 7 June 2020. Temperatures transitioned from unusually cold conditions in late May and early June to anonymously warm temperatures from mid-June onwards. Over the 14 d preceding the GLOF, temperatures were 1.6 ∘C warmer than average, peaking at 4.4 ∘C on 24 June, when an extremely warm daily maximum temperature of 19.4 ∘C exceeded 90th percentile values. During the cold period minimum temperatures were at or below freezing, suggesting some of the heavy precipitation from 5–8 June would have fallen as snow around Jinwuco. Subsequent gradual snowmelt could provide a plausible explanation for the lag between this heavy precipitation episode, landslide initiation, and moraine breach, given that the GLOF event was preceded by two relatively dry, yet warm days (Fig. 7a).

Figure 7Meteorological conditions from January–June 2020, measured at the Lhari weather station, compared to the longer-term climatology (1986–2015).
4.4 Empirical estimation of lake volume, breach time, and peak discharge
Out of 16 lake volume equations, 14 yielded meaningful results (within the range of mean ±1 standard deviation), ranging from 8.3 to 26.6 million cubic meters. Mean calculated lake volume is 15.9 million cubic meters, and the median value is 14.4 million cubic meters. This is slightly higher, but compares favorably to a reconstructed volume of 13.9 million cubic meters used in the process chain simulations (Sect. 3.5). The first (Q1) and the third quartile (Q3) are 13.3 and 15.9 million cubic meters respectively (Fig. 8a). Accordingly, calculated mean depth of the lake ranges from 14.8 to 51.3 m (average mean depth 28.5 m, median mean depth 25.7 m, Q1 is 23.7 m and Q3 is 28.4 m). Calculated breach times range from 0.28 to 1.76 h, with 11 out of 12 calculated values suggesting a breach time < 1 h, with the mean value of 0.62 h and a median of 0.47 h (0.61 and 0.43 h, respectively, if equations for erosion-resistant dam are excluded; Fig. 8c, d). Calculated peak discharge at the dam ranges from 2354 to 11 832 m3/s. The average value of calculated peak discharges is 5602 m3/s, while the median is 4237 m3/s. Q1 and Q3 are 3035 and 7636 m3/s respectively (Fig. 8b).
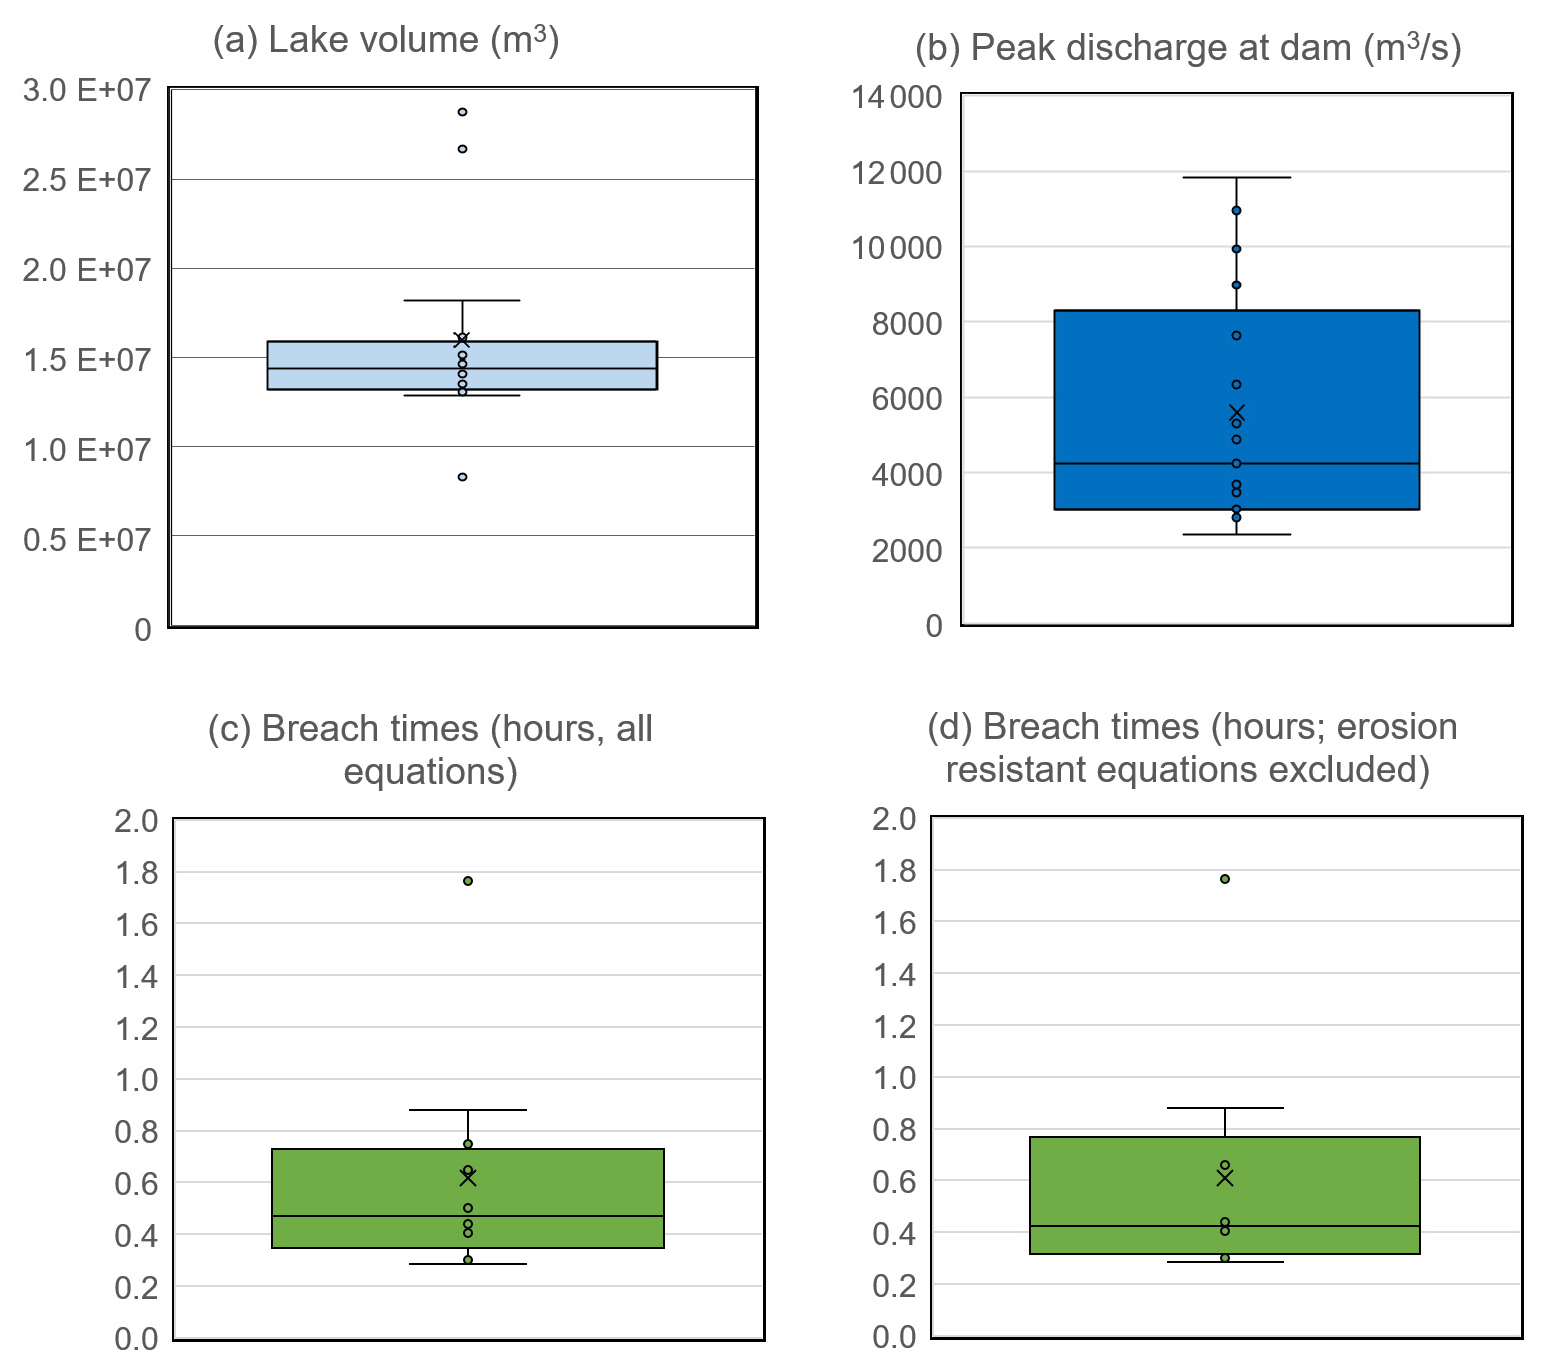
Figure 8Lake, dam breach, and flood parameters, derived from sets of published empirical relationships. (a) Volume of Jinwuco. (b) Peak discharge at the dam. (c) Breach time, considering all available equations. (d) Breach time, considering only those equations derived for easily erodible dams (an assumption we consider likely to hold for the dam of Jinwuco).
4.5 Process chain simulation with r.avaflow
A detailed look at the dam breach (Fig. 9) reveals that the simulation results for both scenarios A and B are in good correspondence with the ranges of peak discharge and breach depth derived through the empirical relationships described in Sect. 4.4 and illustrated in Fig. 8. For Scenario A, at the point C2 (Figs. 5 or 10), depth erosion is completed at t=26 min after landslide release, i.e., 24–25 min (0.41 h) after the impact wave had reached the outlet of the lake, initiating retrogressive erosion. This time span is well within, although in the lower part of, the range revealed in Fig. 8d. After the breach has developed to its full depth, lake drainage continues and asymptotically approaches the level of the eroded gully (Fig. 9a). The peak discharge associated with the landslide-induced impact wave reaches 17 900 m3/s after 100 s (computed at a higher temporal resolution and therefore not visible in Fig. 9b). Afterwards, discharge decreases and then increases again due to retrogressive erosion of the moraine dam. The simulated peak discharge during the retrogressive erosion stage reaches 5200 m3/s at t=28 min, being well within the range indicated in Fig. 8b. With dropping lake level, the simulated discharge slowly decreases to a small residual value after 2 h (Fig. 9b). At all stages, the simulated flow is dominated by water, with a peak of approx. 220 m3/s of solid discharge at t=23 min, when retrogressive erosion is the most intense.

Figure 9Dam breach as simulated with r.avaflow. (a) Scenario A, evolution of lake level and the erosion channel. (b) Scenario A, output hydrograph. (c) Scenario B, evolution of lake level and the erosion channel. (d) Scenario B, output hydrograph. Locations of the points C1, C2, and H are indicated in Figs. 5 and 11. In the output hydrographs, H means flow height, and Q means discharge. The subscript P1 refers to phase 1 (rock), P2 to phase 2 (not existent in this case), and P3 to phase 3 (water). Fluid discharge and flow height are plotted in the negative direction for better readability.
The patterns yielded with the simulation of Scenario B (Fig. 9c and d) are similar in general, with the exception of the initial impact wave that is only observed in Scenario A. However, onset of erosion takes more time, so that the breach and associated emptying of the lake are delayed. The tipping point where slight channel erosion turns into a rapid dam breach occurs at approx. 35–39 min after the start of the simulation, depending on the definition. The base level of the erodible material is reached at t=62 min (23–27 min or 0.38–0.45 h after the tipping point – in the lower part of the range indicated in Fig. 8d). The peak discharge of 4600 m3/s is reached at t=68 min. As is also the case in Scenario A, the flow is entirely dominated by fluid: solid discharge peaks at 200 m3/s at t=61 min. Emptying of the lake continues at a decreasing rate afterwards. The lake level has dropped by 17 m after 2 h, meaning that the final drop of 20 m has not yet been reached.
Figure 10a illustrates the evolution of the GLOF process chain for Scenario A (Sect. 3.5). This simulation only considers the section until the floodplain downstream of the moraine dam of Jinwuco. Initially, the landslide impacts the lake (t=10 s), inducing a push wave that runs up the opposite slope (t=20 s). At this time, the minor outflow at the moraine dam represents the usual surficial lake drainage and is not related to the landslide impact. The impact area shown at t=60 s and the increased lake width near point C1 reveal the evolution of the impact wave towards the front of Jinwuco. Still, at this point there is no major signal of the impact wave at the outlet of the lake. The maximum height of the impact wave at C1, with 10.5 m, is reached at t=70 s. Between t=80 s and t=85 s, a sudden increase of flow height at the point C2 from 0.8 to 8.2 m within 5 s indicates the onset of overtopping. Retrogressive erosion initiates along the main outflow channel, induced by the signal of the initial impact wave. Some of the wave energy is reflected at the shore of the lake towards the terminal moraine, so that a secondary wave with a height of 5.5 m passes through C1 at t=140 s. Linear retrogressive erosion of the moraine dam leads to a continuous lowering of the base of the outflow channel and, consequently, lowering of the lake level. Two hours after the onset of the initial landslide, the lake has shrunk to both a size and level which come close to the post-event observations. Until this point of time, approx. 9.5 million cubic meters of water have drained through the hydrograph profile at point H (Fig. 9), according to the simulation. A main difference to the observation consists in the massive overtopping of the moraine dam (visible at t=120 s), a behavior not revealed by the available post-event imagery. The simulated impact area on the floodplain immediately downstream of the dam is slightly overestimated compared to the observed impact area in that section. In comparison, Fig. 10b shows the flow height evolution for Scenario B where there is no initial impact wave, consequently also no sheet flow over the moraine dam, and a better correspondence of observed and simulated impact areas.

Figure 10Evolution of flow height and GLOF impact area as well as solid and water volume fractions during the first 2 h of the event, as simulated with r.avaflow for (a) Scenario A and (b) Scenario B. Only the section until the floodplain immediately downstream from the moraine dam is considered in these simulations. The base map is a shaded relief map based on the DEM generated from Ziyuan-3 stereoscopic pairs and the simulation results.
4.6 Analysis of impacts on society
According to the news report from the Lhari County radio and television station on 15 July 2020, this GLOF event caused severe destruction to villages and infrastructure to various degrees on both sides of the downstream river. The destruction consists mainly of damage to buildings, roads, bridges, or farmland, just to name a few (detailed statistics are provided in Table 3). Fortunately, this event did not lead to any fatalities or injuries largely because it took place during the daytime, and the villagers collecting medicinal herbs upstream observed the flood and promptly informed the downstream villages to evacuate. The affected area includes almost all the villages on both sides of the river, especially Baixiongcun and Zibucun. These are also the most affected by the 2013 Ranzeriaco GLOF (Fig. 1; Liu, 2014). The power of the flood is noticeably weakened after its confluence with the Gagring Qu in the Zhongyucun and hence does not result in much damage to areas further downstream. This flood damaged a major proportion of 43.9 km of roads between Yigacun and Zhongyu township (Fig. 1; Fig. 11), as well as the only steel bridge to the township office (Fig. 12a), which caused certain difficulties for timely emergency rescue operations.

Figure 11The situations in the valley and river channel below Jinwuco before, during, and after the GLOF. (a) Photo taken from Yiga Glacier looking to Yigacun. Insets showing the situations in the valley during and after the GLOF (photos: Qiangba Quying and Yixi Quzhen). (b) The river channel and road before the GLOF taken from Yigacun looking upstream. The yellow dashed line is the flood flow direction. (c) A view taken from upstream looking to Yigacun. Insets showing the situations in the river channel during the GLOF (photos: Qiangba Quying). Aerial photos from 2 May 2020 were taken by Kejun Liang.
Table 3Details of the damages and losses caused by the GLOF of 26 June 2020.
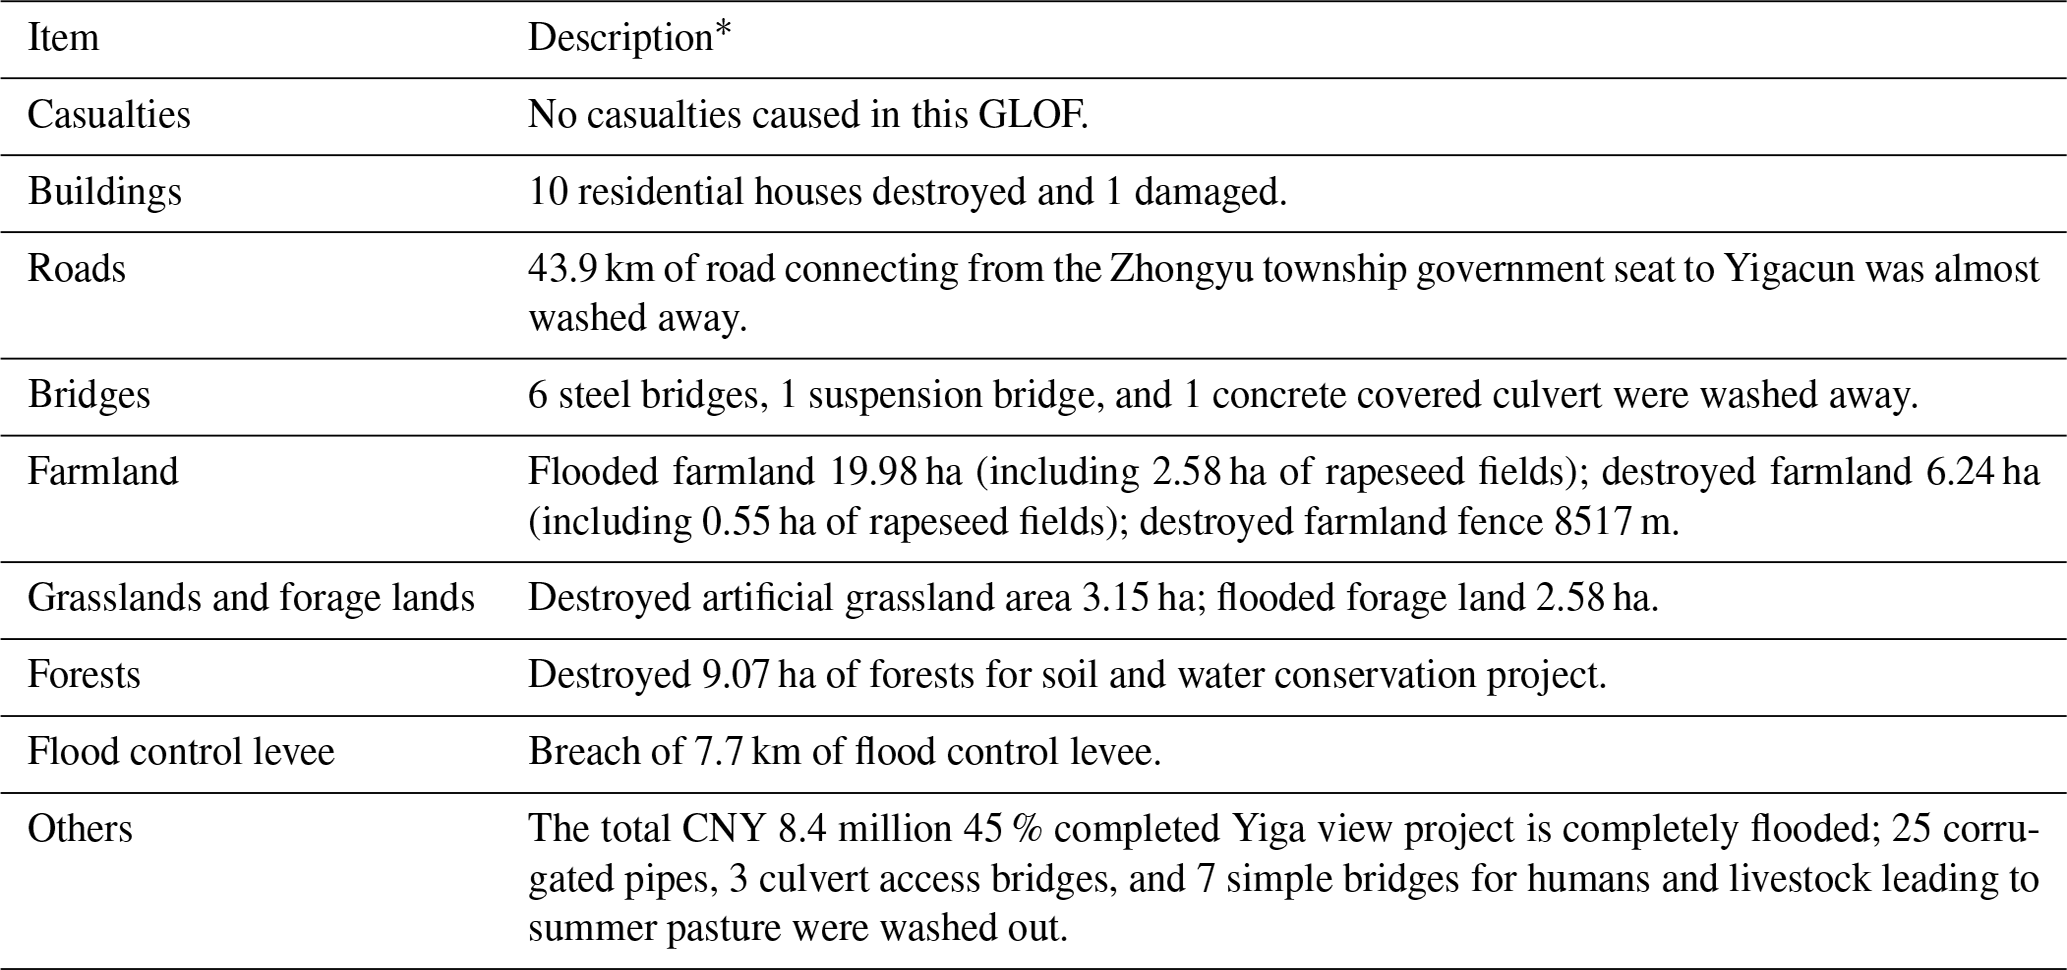
* Data from Lhari County radio and television station.
Figure 11 shows the valley and river channel below Jinwuco before, during, and after the GLOF. It is evident from the comparison of the photographs that the floodwaters almost inundated the wide river valley downstream and reached the location of Yigacun, which is located in a relatively high position. The large elevation difference between the surface of Jinwuco and the downstream river channel (approx. 630 m) provides significant potential energy, setting the stage for enhanced erosion and greater damage. Further, the flood caused severe erosion of the lower valley and alteration of the river channel below through the formation of alluvial fans. Figure 12 gives a picture of the situation during the flood further downstream at the location of Zhongyucun. The aerial photograph shows that the massive impact of the flood washed away roads and bridges and put some buildings along the river at risk. The Zhongyu township has experienced rapid development and expansion of infrastructure over the past 15 years (some examples are shown in Fig. 13). Such development has increased the level of exposure to potential GLOFs, as shown in Fig. 12c: these buildings were constructed recently in areas located directly on the riverbanks and exposed to flooding.
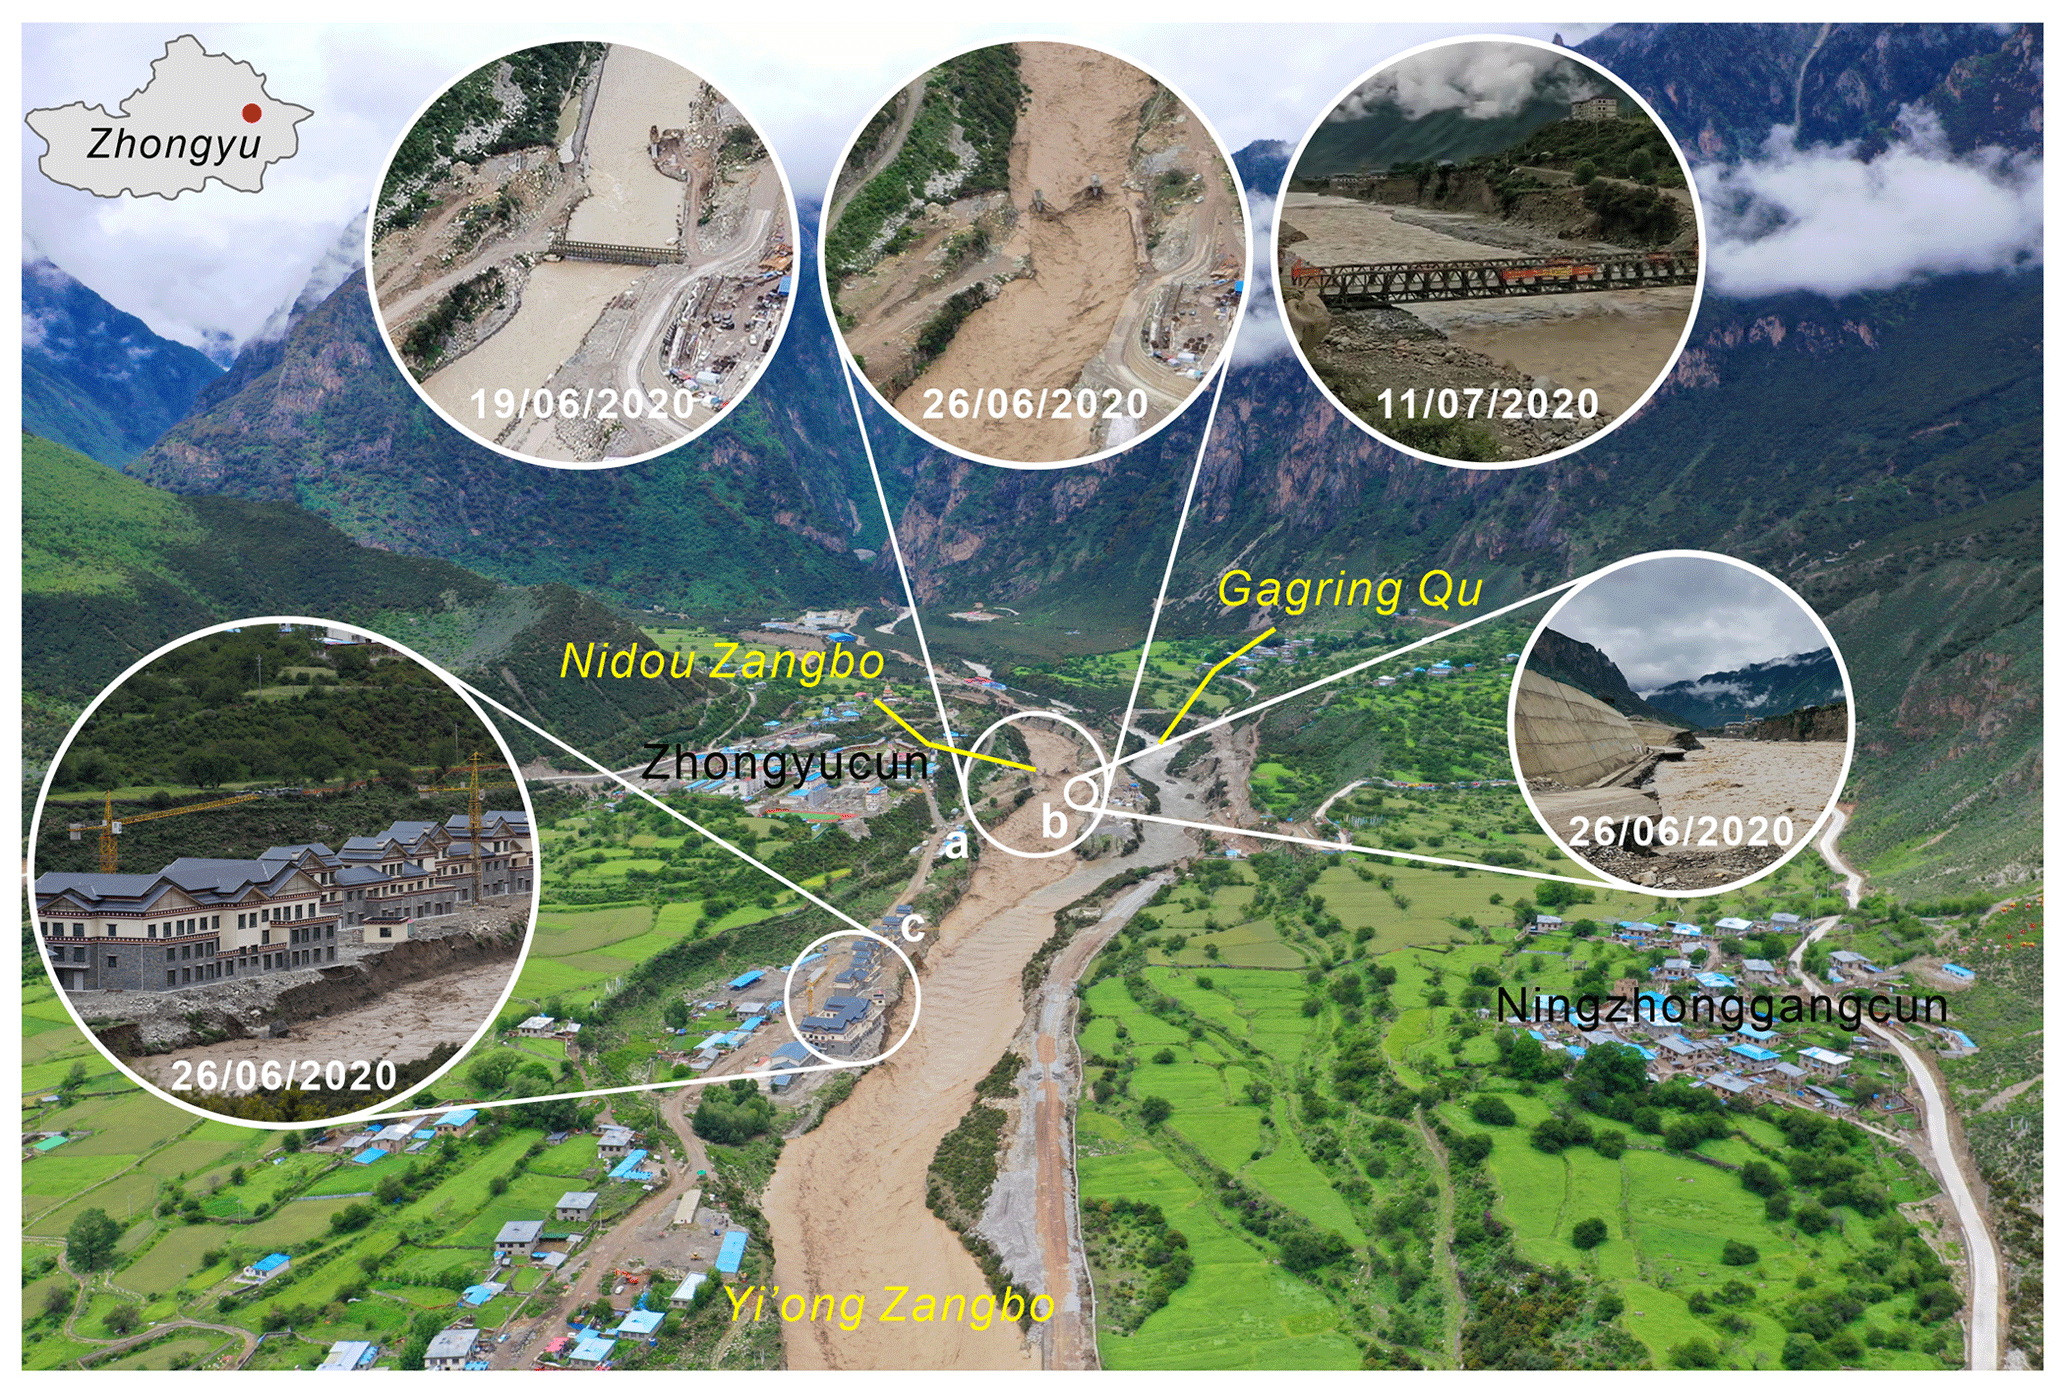
Figure 12Examples of GLOF damage to downstream infrastructure and buildings at the confluence of Nidou Zangbo and Gagring Qu. Background aerial photo by Heng Li taken on 26 June 2020. (a) Comparison of the bridge connecting Zhongyucun and Ningzhonggangcun before, during (photos: Heng Li), and after the GLOF (rebuilt, photo: Kejun Ma). (b) Destroyed roads (photo: Heng Li). (c) Affected buildings at risk (photo: Heng Li).
5.1 Reconstruction and timing of the event
The availability of satellite imagery at high spatial and temporal resolution is invaluable for the reconstruction of the timing and mechanisms of high-mountain process chains such as GLOFs. The understanding of events in earlier history sometimes suffers from the impossibility of determining the cause of a GLOF due to lacking data: in the 1941 event at Lake Palcacocha in the Peruvian Andes (Mergili et al., 2020), there is still speculation about triggering of the catastrophic moraine dam breach by calving or an ice avalanche, however poorly supported by evidence. In the case of the Jinwuco event, in contrast, there is clear evidence that a landslide has entered the lake not more than 2 d before the GLOF (Fig. 3), even though the quantification of landslide volume is to be interpreted as a rough estimate rather than exact value, given the hard-to-quantify uncertainties in the available pre- and post-event DEMs. We assume a direct temporal coincidence between the two processes, with the landslide having triggered the GLOF, as the most likely set of scenarios. However, there is strong evidence that there was no massive, extremely rapid landslide impact into the lake: comparison of pre-event and post-event satellite imagery reveals no overtopping of the dam and not even the run-up of lake water on the inner side of the moraine dam (Figs. 3 and 5). Both the simulation (Scenario A; Fig. 10a) and observations of other GLOFs (e.g., Schneider et al., 2014) would reveal such a behavior. Therefore, we consider a rather slow and/or progressive movement of the landslide into the lake much more likely, represented by Scenario B (Fig. 10b).
We now elaborate on the possible triggers of the landslide. The meteorological conditions in June 2020 (Fig. 7) were characterized by extremely high precipitation in the period from 5–8 June. Further rainfall and snowmelt under unusually warm conditions after 8 June are factors which most likely caused a gradual destabilization of the moraine. The rather dry and extremely warm conditions immediately prior to the GLOF may have induced increased melting and thawing processes, leading to the final tipping point of a system which had already been at the verge of collapse, resulting in slope failure and the GLOF-triggering landslide, most likely on 26 June.
5.2 Empirical estimations and process chain simulation
An extensive literature review with regard to the empirical estimation of lake volume, breach time, and peak discharge resulted in a broad range of possible values (Fig. 8). Both of the simulation scenarios A and B have provided plausible characteristics of peak discharge and breach time with the chosen parameter combinations. Due to the strong signal of the impact wave at the dam in Scenario A, there is a more rapid onset and progress of erosion, so that the peak discharge is higher and the breach time shorter compared to Scenario B. However, the general pattern is the same. The model setup has revealed two critical aspects for the simulation.
-
The results are very sensitive to the empirical entrainment coefficient, which is multiplied with the flow momentum in order to determine the erosion rate. In general, scaling of the erosion rate with flow momentum, though simple and straightforward, might not be the mechanically most appropriate way and could be replaced in the future by an excess shear stress approach, as it is used in some single-phase models (e.g., Iverson and Ouyang, 2015).
-
In the present work, erosion and entrainment is restricted to the breach reconstructed through the overlay of the pre-event and post-event DEMs. This constraint is introduced as the internal structure of the moraine dam is unknown. No information about a possible ice core in the moraine is available in particular. However, the maximum erosion depth reconstructed from the pre- and post-event DEMs was 25 m. This, in our opinion, indicates that the moraine has no substantial ice core, at least not in the area where the breach developed, because otherwise such an ice core would likely have constrained the breach depth and therefore also the degree of lowering of the lake level. In the simulation, it is assumed that the part most susceptible to erosion was actually eroded during the event on 26 June 2020. The entrainment coefficient is calibrated in such a way to yield plausible peak discharges, compared to the empirically derived peak discharges (Fig. 8). However, such simplifications limit the possibility to evaluate the performance of the entrainment model. Strategies for a more detailed parameterization of dam erodibility are still the subject of future research and would also be important to make predictive simulations of dam breach more reliable.
5.3 The potential role of anthropogenic climate change on the process chain
The Jinwuco process chain described herein provides a strong basis for assessing the role of anthropogenic climate change as a direct contributor to a GLOF-related disaster. While not within the scope here to undertake a full systematic climate attribution analyses (Huggel et al., 2020; Stuart-Smith et al., 2021), we discuss the available evidence linking anthropogenic emissions to observed temperature change in the region, the related role this has played in observed glacial retreat, and how this has potentially increased the likelihood and/or magnitude of this event. The nearest weather station at Lhari County has recorded a significant warming rate of 0.5 ∘C per decade over the last 40 years (Fig. 1), reflecting a general increasing warming trend seen across Tibet, with the most rapid warming observed since 2000 (You et al., 2016). While regional studies are lacking, there is a strong anthropogenic signal seen in general warming over Asia (Bindoff et al., 2013). These warming trends over Asia correspond with widespread glacial retreat and lake expansion across Tibet (Bolch et al., 2019) and particularly align to the period of accelerated expansion of Jinwuco (Fig. 4). While there are few studies directly linking the response of individual or even regional glacial changes to anthropogenic warming, it is considered extremely likely that anthropogenic emissions have been the primary driver of the cumulative glacier mass loss observed globally since 1850, with a central estimate of up to 100 % (Roe et al., 2021). Physically there is no obvious argument to suggest glaciers in this region of Tibet have responded anomalously from what has been established globally. If we therefore consider that anthropogenic warming has at least played a major (if not dominant) role in the retreat of Jinwu Glacier and associated lake growth, the discussion turns to how this retreat could have increased the likelihood and/or magnitude of the 26 June GLOF event. It is well established that paraglacial landscapes are characterized by anomalously high rates of erosion and mass movements compared to other environments, with debris flows, slides, and avalanches being the primary mode of failure (McColl, 2012; Knight and Harrison, 2014). The reworking and modification of paraglacial landscapes occurs rapidly following glacial retreat, with stabilization of proximal slopes occurring within a few decades to centuries (Ballantyne, 2002). Over this time, paraglacial slopes remain particularly susceptible to heavy rainfall or melt processes (Blair, 1994; Evans and Clague, 1994; Chiarle et al., 2007), and when mass movements of rock or debris enter adjacent lakes, GLOFs can be triggered (Klimeš et al., 2016). In the case of Jinwuco, the debris avalanche that triggered the GLOF has occurred within 10 years of the glacier retreating entirely from beneath the slope, suggesting a direct paraglacial response to this perturbation. A landslide occurring from this same zone would not only have been less likely to occur in the past, when the slope would have been in a more stable state supported by the glacier, but any time prior to around 2010 would have ran harmlessly across the tongue of the glacier. Hence, a robust argument suggests that retreat of Jinwu Glacier in response to anthropogenic warming has played not only a key role in destabilizing the lateral moraine from which the landslide initiated, but has also directly enabled the debris landslide to strike the expanding lake body leading to the GLOF.

Figure 13Examples of rapid development and expansion of the villages of lower Zhongyu township during 2006–2017. The background of panel (a) and the satellite scenes for the 2017 panels are a true-color composite Gaofen-2 image acquired on 7 December 2017. The satellite images for the 2006 panels are from © Google Earth, acquired on 30 April 2006.
5.4 Implications for future GLOF hazard and risk assessment
Steep lateral moraine walls are commonly observed adjacent to receding glacier tongues and proglacial lakes globally, and on a regional scale, lessons learned from the Peruvian Cordillera Blanca suggest that landslides from moraines are the most frequent GLOF trigger in later stages of glacier ice loss (Emmer et al., 2020a). Yet surprisingly, instabilities from lateral moraines have rarely been associated with large outburst disasters (Klimeš et al., 2016). Existing GLOF hazard assessment schemes (e.g., GAPHAZ, 2017) and related modeling studies (Schneider et al., 2014; Schaub et al., 2016) have typically emphasized the importance of rapid process chains relating to large rock and ice instabilities that enter a lake at high velocities generating massive flood waves. However, as with the GLOF case also triggered by moraine landslide reported in Patagonia (Wilson et al., 2019), results from this study further show that moraine instabilities can also produce large outburst flood hazards. Such process chains may become of increasing importance in the future, given further glacial retreat or downwasting (Knight and Harrison, 2014; Emmer et al., 2020b), leading to higher moraine walls being precariously positioned above expanding proglacial lakes. Furthermore, under a future climate, triggering of moraine instabilities under changing conditions could become more likely (Panday et al., 2015; Sanjay et al., 2017).
Beyond the hazardous process chain, downstream exposure of buildings and other infrastructure has been shown once again to be a key driver of GLOF risk (Kala, 2014; Huggel et al., 2020). Hence, there is an urgent need to ensure lives and livelihoods are better protected through effective hazard mapping and land use planning, coupled with comprehensive early warning and response strategies to minimize GLOF risk even under worst-case future climate scenarios. In the specific case of Jinwuco, although the significant incision of the moraine dam now limits the maximum depth of the lake, the lake area and volume will increase further as the glacier retreats, meaning the potential future outburst risk will continue to evolve. Furthermore, considering simple diagnostic topographical criteria (after Frey et al., 2010), there is a strong likelihood of a new glacial lake developing on the flat plateau higher on the Jinwu Glacier in response to a future retreat, meaning that anticipatory forward-looking approaches to risk management are required.
We have comprehensively analyzed the Jinwuco GLOF process chain that occurred on 26 June 2020 in eastern Nyainqentanglha, Tibet, China, based on remotely sensed data, eye-witness accounts, news reports, and computer simulations. The main findings of this work can be summarized as follows.
-
We identified the slope failure from a steep lateral moraine as the cause of this GLOF. Analysis of meteorological conditions from some weeks before the GLOF suggests that, most likely, the extremely heavy rainfall and above-average air temperatures in June were essential drivers of this process chain.
-
Two scenarios are considered in the back-calculation of the outburst process chain, with both of them producing results that are consistent with empirically derived ranges of peak discharge and breach time. Given the timeline revealed by the satellite images, and meteorological analyses, we consider a direct triggering of the GLOF by the landslide as the most likely scenario. However, Scenario A, assuming an extremely rapid landslide, results in an impact wave overtopping the moraine dam, a behavior not in line with empirical evidence: lacking run-up on the inner part of the moraine dam reveals that there was no major impact wave, excluding the possibility of a massive, extremely rapid landslide rather pointing towards a moderately rapid and/or progressive movement inducing retrogressive erosion of the dam. Such a process would be in line with the simulation results of Scenario B.
-
The long-term evolution of Jinwuco and its relationship to the likely landslide trigger, as revealed by a time series of satellite scenes, provide strong evidence that this event is directly related to anthropogenic climate change. Climate warming has led to the continued retreat of glaciers like Jinwu in the region, while associated lakes have expanded and the stability of the surrounding paraglacial slopes has been altered. Given the fact that instabilities from the flanks of a lake may increase under a warmer and wetter future climate, the Jinwuco case provides a timely reminder of the need for comprehensive and forward-looking hazard and risk assessment frameworks, considering complex instantaneous and gradual process chains.
The data, model codes, and start script needed to reproduce the simulations of the scenarios A and B are available at Zenodo under the identifier https://doi.org/10.5281/zenodo.4751110 (Mergili, 2021).
All satellite images and weather station data used in this study can be obtained free of charge or upon reasonable request. Additional datasets used are available from the corresponding authors on request.
The supplement related to this article is available online at: https://doi.org/10.5194/tc-15-3159-2021-supplement.
GZ and SA conceived the ideas and co-designed the research with MM. GZ collected and prepared the input data and performed analysis of lake evolution and societal impacts of the flood. MM provided the simulation tools and made the simulation of the outburst process chain. AE quantified flood-related parameters. SA carried out the meteorological analysis with discussions and contributions from GZ, MM, and HG. AB provided financial support and supervised this work with MS. GZ, MM, AE, and SA wrote the manuscript and prepared the charts. All authors discussed the results and commented on the manuscript.
The authors declare that they have no conflict of interest.
Publisher's note: Copernicus Publications remains neutral with regard to jurisdictional claims in published maps and institutional affiliations.
We appreciate the U.S. Geological Survey (USGS), European Space Agency (ESA), and China Center for Resources Satellite Date and Application (CRESDA) for allowing free access to their satellite archives. Special thanks to the China Remote Sensing Satellite Ground Station (RSGS) – Kashi Ground Station, which provided Ziyuan-3 satellite data after the flood and two DEMs before and after the flood. Special thanks also to Qiangba Quying, Yixi Quzhen, Kaining Liang, Heng Li, and Kejun Ma, who provided valuable field materials and flood-related information. A special acknowledgement goes to the China-Pakistan Joint Research Centre on Earth Sciences, which supported the implementation of this study.
This work was funded by the Strategic Priority Research Program of Chinese Academy of Sciences (grant no. XDA20030101). The contribution of Simon Allen was partially supported by the Swiss National Science Foundation (grant no. IZLCZ2_169979/1) and counterpart grant of the National Natural Science Foundation of China (grant no. 21661132003).
This paper was edited by Ketil Isaksen and reviewed by Dmitry Petrakov, Ashim Sattar, and one anonymous referee.
Allen, S., Rastner, P., Arora, M., Huggel, C., and Stoffel, M.: Lake outburst and debris flow disaster at Kedarnath, June 2013: hydrometeorological triggering and topographic predisposition, Landslides, 13, 1479–1491, https://doi.org/10.1007/s10346-015-0584-3, 2016.
Allen, S., Zhang, G., Wang, W., Yao, T., and Bolch, T.: Potentially dangerous glacial lakes across the Tibetan Plateau revealed using a large-scale automated assessment approach, Sci. Bull., 64, 435–445, https://doi.org/10.1016/j.scib.2019.03.011, 2019.
Ballantyne, C. K.: Paraglacial geomorphology, Quaternary Sci. Rev., 21, 1935–2017, https://doi.org/10.1016/S0277-3791(02)00005-7, 2002.
Beven, K.: Equifinality and Uncertainty in Geomorphological Modelling, in: The Scientific Nature of Geomorphology: Proceedings of the 27th Binghamton Symposium in Geomorphology, 27–29 September 1996, John Wiley & Sons, 289–313, 1996.
Bindoff, N., Stott, P., AchutaRao, M., Allen, M., Gillett, N., Gutzler, D., Hansingo, K., Hegerl, G., Hu, Y., Jain, S., Mokhov, II., Overland, J., Perlwitz, J., Sebbari, R., and Zhang, X.: Detection and attribution of climate change: from global to regional, in: Climate Change 2013 – The Physical Science Basis: Working Group I Contribution to the Fifth Assessment Report of the Intergovernmental Panel on Climate Change, edited by: Stocker, T., Qin, D., Plattner, G.-K., Tignor, M., Allen, S., Boschung, J., Nauels, A., Xia, Y., Bex, V., and Midgle, P. M., Cambridge University Press, Cambridge, 867–952, 2013.
Blair Jr., R. W.: Moraine and valley wall collapse due to rapid deglaciation in Mount Cook National Park, New Zealand, Mt. Res. Dev., 14, 347–358, 1994.
Bolch, T., Shea, J. M., Liu, S., Azam, F. M., Gao, Y., Gruber, S., Immerzeel, W. W., Kulkarni, A., Li, H., Tahir, A. A., Zhang, G., and Zhang, Y.: Status and change of the cryosphere in the extended Hindu Kush Himalaya region, in: The Hindu Kush Himalaya assessment: mountains, climate change, sustainability and people, edited by: Wester, P., Mishra, A., Mukherji, A., and Shrestha, A. B., Springer International Publishing, Cham, https://doi.org/10.1007/978-3-319-92288-1_7, 2019.
Bureau of Reclamation: Guidelines for defining inundated areas downstream from Bureau of Reclamation dams, Reclamation Planning Instruction No. 82-11, U.S. Department of the Interior, Bureau of Reclamation, Denver, 25, 1982.
Bureau of Reclamation: Downstream hazard classification guidelines, ACER Tech. Memoran-dum No. 11, U.S. Department of the Interior, Bureau of Reclamation, Denver, 57, 1988.
Byers, A. C., Rounce, D. R., Shugar, D. H., Lala, J. M., Byers, E. A., and Regmi, D.: A rockfall-induced glacial lake outburst flood, Upper Barun Valley, Nepal, Landslides, 16, 533–549, https://doi.org/10.1007/s10346-018-1079-9, 2018.
Carrivick, J. L. and Tweed, F. S.: A global assessment of the societal impacts of glacier outburst floods, Global Planet. Change, 144, 1–16, https://doi.org/10.1016/j.gloplacha.2016.07.001, 2016.
Chiarle, M., Iannotti, S., Mortara, G., and Deline, P.: Recent debris flow occurrences associated with glaciers in the Alps, Global Planet. Change, 56, 123–136, https://doi.org/10.1016/j.gloplacha.2006.07.003, 2007.
Clague, J. J. and Evans, S. G.: A review of catastrophic drainage of moraine-dammed lakes in British Columbia, Quaternary Sci. Rev., 19, 1763–1783, https://doi.org/10.1016/S0277-3791(00)00090-1, 2000.
Cook, K. L., Andermann, C., Gimbert, F., Adhikari, B. R., and Hovius, N.: Glacial lake outburst floods as drivers of fluvial erosion in the Himalaya, Science, 362, 53–57, https://doi.org/10.1126/science.aat4981, 2018.
Cook, S. J. and Quincey, D. J.: Estimating the volume of Alpine glacial lakes, Earth Surf. Dynam., 3, 559–575, https://doi.org/10.5194/esurf-3-559-2015, 2015.
Costa, J. E.: Floods from dam failures, U.S. Geological Survey, Open-File Rep. No. 85-560, Denver, 54, 1985.
Dubey, S. and Goyal, M. K.: Glacial Lake Outburst Flood (GLOF) hazard, downstream impact, and risk over the Indian Himalayas, Water Resour. Res., 56, e2019WR026533, https://doi.org/10.1029/2019wr026533, 2020.
Emmer, A. and Cochachin, A.: The causes and mechanisms of moraine-dammed lake failures in the Cordillera Blanca, North American Cordillera, and Himalayas, AUC Geographica, 48, 5–15, 2013.
Emmer, A. and Vilímek, V.: New method for assessing the susceptibility of glacial lakes to outburst floods in the Cordillera Blanca, Peru, Hydrol. Earth Syst. Sci., 18, 3461–3479, https://doi.org/10.5194/hess-18-3461-2014, 2014.
Emmer, A., Harrison, S., Mergili, M., Allen, S., Frey, H., and Huggel, C.: 70 years of lake evolution and glacial lake outburst floods in the Cordillera Blanca (Peru) and implications for the future, Geomorphology, 365, 107178, https://doi.org/10.1016/j.geomorph.2020.107178, 2020a.
Emmer, A., Klimeš, J., Hölbling, D., Abad Crespo, L. C., Draebing, D., Skalák, P., Štěpánek, P., and Zahradníček, P.: Distinct types of landslides in moraines associated with the post-LIA glacier thinning: observations from the Kinzl Glacier, Huascarán, Peru, Sci. Total Environ., 739, 139997, https://doi.org/10.1016/j.scitotenv.2020.139997, 2020b.
Evans, S. G.: The maximum discharge of outburst floods caused by the breaching of man-made and natural dams, Can. Geotech. J., 23, 385–387, https://doi.org/10.1139/t86-053, 1986.
Evans, S. G. and Clague, J. J.: Recent climatic change and catastrophic geomorphic processes in mountain environments, in: Geomorphology and Natural Hazards, edited by: Morisawa, M., Elsevier, Amsterdam, https://doi.org/10.1016/B978-0-444-82012-9.50012-8, 1994.
Frey, H., Haeberli, W., Linsbauer, A., Huggel, C., and Paul, F.: A multi-level strategy for anticipating future glacier lake formation and associated hazard potentials, Nat. Hazards Earth Syst. Sci., 10, 339–352, https://doi.org/10.5194/nhess-10-339-2010, 2010.
Froehlich, D. C.: Peak outflow from breached embankment dam, J. Water Resour. Plan. Manage. Div., 121, 90–97, https://doi.org/10.1061/(ASCE)0733-9496(1995)121:1(90), 1995.
Fujita, K., Sakai, A., Takenaka, S., Nuimura, T., Surazakov, A. B., Sawagaki, T., and Yamanokuchi, T.: Potential flood volume of Himalayan glacial lakes, Nat. Hazards Earth Syst. Sci., 13, 1827–1839, https://doi.org/10.5194/nhess-13-1827-2013, 2013.
GAPHAZ: Assessment of Glacier and Permafrost Hazards in Mountain Regions – Technical Guidance Document, Zurich/Lima, https://doi.org/10.13140/rg.2.2.26332.90245, 2017.
Gardelle, J., Arnaud, Y., and Berthier, E.: Contrasted evolution of glacial lakes along the Hindu Kush Himalaya mountain range between 1990 and 2009, Global Planet. Change, 75, 47–55, https://doi.org/10.1016/j.gloplacha.2010.10.003, 2011.
Gurung, D. R., Khanal, N. R., Bajracharya, S. R., Tsering, K., Joshi, S., Tshering, P., Chhetri, L. K., Lotay, Y., and Penjor, T.: Lemthang Tsho glacial Lake outburst flood (GLOF) in Bhutan: cause and impact, Geoenvironmental Disasters, 4, 17, https://doi.org/10.1186/s40677-017-0080-2, 2017.
Hagen, V. K.: Re-evaluation of design floods and dam safety, Proceedings of the 14th Con-gress of Int. Commission on Large Dams, International Commission on Large Dams, Paris, 1982.
Hanshaw, M. N. and Bookhagen, B.: Glacial areas, lake areas, and snow lines from 1975 to 2012: status of the Cordillera Vilcanota, including the Quelccaya Ice Cap, northern central Andes, Peru, The Cryosphere, 8, 359–376, https://doi.org/10.5194/tc-8-359-2014, 2014.
Haritashya, U., Kargel, J., Shugar, D., Leonard, G., Strattman, K., Watson, C., Shean, D., Harrison, S., Mandli, K., and Regmi, D.: Evolution and controls of large glacial lakes in the Nepal Himalaya, Remote Sens., 10, 798, https://doi.org/10.3390/rs10050798, 2018.
Harrison, S., Kargel, J. S., Huggel, C., Reynolds, J., Shugar, D. H., Betts, R. A., Emmer, A., Glasser, N., Haritashya, U. K., Klimeš, J., Reinhardt, L., Schaub, Y., Wiltshire, A., Regmi, D., and Vilímek, V.: Climate change and the global pattern of moraine-dammed glacial lake outburst floods, The Cryosphere, 12, 1195–1209, https://doi.org/10.5194/tc-12-1195-2018, 2018.
Hock, R., Rasul, G., Adler, C., Cáceres, B., Gruber, S., Hirabayashi, Y., Jackson, M., Kääb, A., Kang, S., Kutuzov, S., Milner, A., Molau, U., Morin, S., Orlove, B., and Steltzer, H.: High Mountain Areas, in: IPCC Special Report on the Ocean and Cryosphere in a Changing Climate, edited by: Pörtner, H.-O., Roberts, D. C., Masson-Delmotte, V., Zhai, P., Tignor, M., Poloczanska, E., Mintenbeck, K., Alegriìa, A., Nicolai, M., Okem, A., Petzold, J., Rama, B., and Weyer, N. M., 2019.
Huggel, C., Kaab, A., Haeberli, W., Teysseire, P., and Paul, F.: Remote sensing based assessment of hazards from glacier lake outbursts: a case study in the Swiss Alps, Can. Geotech. J., 39, 316–330, https://doi.org/10.1139/T01-099, 2002.
Huggel, C., Carey, M., Emmer, A., Frey, H., Walker-Crawford, N., and Wallimann-Helmer, I.: Anthropogenic climate change and glacier lake outburst flood risk: local and global drivers and responsibilities for the case of lake Palcacocha, Peru, Nat. Hazards Earth Syst. Sci., 20, 2175–2193, https://doi.org/10.5194/nhess-20-2175-2020, 2020.
Iverson, R. M. and Chaojun, O.: Entrainment of bed material by Earth-surface mass flows: review and reformulation of depth-integrated theory, Rev. Geophys., 53, 1–32, https://doi.org/10.1002/2013RG000447, 2015.
Ives, J. D., Shrestha, R. B., and Mool, P. K.: Formation of Glacial Lakes in the Hindu Kush-Himalayas and GLOF Risk Assessment, International Centre for Integrated Mountain Development (ICIMOD), Katmandu, 2010.
Kala, C. P.: Deluge, disaster and development in Uttarakhand Himalayan region of India: Challenges and lessons for disaster management, Int. J. Disaster Risk Reduct., 8, 143–152, https://doi.org/10.1016/j.ijdrr.2014.03.002, 2014.
Kapitsa, V., Shahgedanova, M., Machguth, H., Severskiy, I., and Medeu, A.: Assessment of evolution and risks of glacier lake outbursts in the Djungarskiy Alatau, Central Asia, using Landsat imagery and glacier bed topography modelling, Nat. Hazards Earth Syst. Sci., 17, 1837–1856, https://doi.org/10.5194/nhess-17-1837-2017, 2017.
Khanal, N. R., Mool, P. K., Shrestha, A. B., Rasul, G., Ghimire, P. K., Shrestha, R. B., and Joshi, S. P.: A comprehensive approach and methods for glacial lake outburst flood risk assessment, with examples from Nepal and the transboundary area, Int. J. Water Resour. Dev., 31, 219–237, https://doi.org/10.1080/07900627.2014.994116, 2015.
Kirkpatrick, G. W.: Evaluation guidelines for spillway adequacy. The evaluation of dam safety, Engineering Foundation Conf., ASCE, New York, 395–414, 1977.
Kitoh, A.: The Asian Monsoon and its Future Change in Climate Models: A Review, J. Meteorol. Soc. Jpn., 95, 7–33, https://doi.org/10.2151/jmsj.2017-002, 2017.
Klimeš, J., Novotný, J., Novotná, I., de Urries, B. J., Vilímek, V., Emmer, A., Strozzi, T., Kusák, M., Rapre, A. C., Hartvich, F., and Frey, H.: Landslides in moraines as triggers of glacial lake outburst floods: example from Palcacocha Lake (Cordillera Blanca, Peru), Landslides, 13, 1461–1477, https://doi.org/10.1007/s10346-016-0724-4, 2016.
Knight, J. and Harrison, S.: Mountain glacial and paraglacial environments under global climate change: Lessons from the past, future directions and policy implications, Geogr. Ann. Ser. A, 96, 245–264, https://doi.org/10.1111/geoa.12051, 2014.
Liu, X.: Thoughts on the moraine-dammed glacial lake outburst flood in Zhongyu township, Tibet, China Agriculture Information, p. 178, 2014 (in Chinese).
Lliboutry, L.: Glaciological problems set by the control of dangerous lakes in Cordillera Blanca, Peru. II. Movement of a covered glacier embedded within a rock glacier, J. Glaciol., 18, 255–274, https://doi.org/10.3189/S0022143000021341, 1977.
Loriaux, T. and Casassa, G.: Evolution of glacial lakes from the Northern Patagonia Icefield and terrestrial water storage in a sea-level rise context, Global Planet. Change, 102, 33–40, https://doi.org/10.1016/j.gloplacha.2012.12.012, 2013.
MacDonald, T. C. and Langridge-Monopolis, J.: Breaching Charateristics of Dam Failures, J. Hydraul. Eng., 110, 567–586, https://doi.org/10.1061/(ASCE)0733-9429(1984)110:5(567), 1984.
Majeed, U., Rashid, I., Sattar, A., Allen, S., Stoffel, M., Nüsser, M., and Schmidt, S.: Recession of Gya Glacier and the 2014 glacial lake outburst flood in the Trans-Himalayan region of Ladakh, India, Sci. Total Environ., 756, 144008, https://doi.org/10.1016/j.scitotenv.2020.144008, 2020.
Mathison, C., Wiltshire, A., Dimri, A. P., Falloon, P., Jacob, D., Kumar, P., Moors, E., Ridley, J., Siderius, C., Stoffel, M., and Yasunari, T.: Regional projections of North Indian climate for adaptation studies, Sci. Total Environ., 468–469, S4–S17, https://doi.org/10.1016/j.scitotenv.2012.04.066, 2013.
McColl, S. T.: Paraglacial rock-slope stability, Geomorphology, 153-154, 1–16, https://doi.org/10.1016/j.geomorph.2012.02.015, 2012.
Mergili, M.: r.avaflow simulation package for the 2020 Jinwuco GLOF (Version 1.0), Zenodo, https://doi.org/10.5281/zenodo.4751110, 2021.
Mergili, M., Fischer, J.-T., Krenn, J., and Pudasaini, S. P.: r.avaflow v1, an advanced open-source computational framework for the propagation and interaction of two-phase mass flows, Geosci. Model Dev., 10, 553–569, https://doi.org/10.5194/gmd-10-553-2017, 2017.
Mergili, M. and Pudasaini, S. P.: r.avaflow – The open source mass flow simulation model, available at: https://www.avaflow.org/, last access: 30 October 2020.
Mergili, M., Pudasaini, S. P., Emmer, A., Fischer, J.-T., Cochachin, A., and Frey, H.: Reconstruction of the 1941 GLOF process chain at Lake Palcacocha (Cordillera Blanca, Peru), Hydrol. Earth Syst. Sci., 24, 93–114, https://doi.org/10.5194/hess-24-93-2020, 2020.
Muñoz, R., Huggel, C., Frey, H., Cochachin, A., and Haeberli, W.: Glacial lake depth and volume estimation based on a large bathymetric dataset from the Cordillera Blanca, Peru, Earth Surf. Proc. Land., 45, 1510–1527, https://doi.org/10.1002/esp.4826, 2020.
Narama, C., Duishonakunov, M., Kääb, A., Daiyrov, M., and Abdrakhmatov, K.: The 24 July 2008 outburst flood at the western Zyndan glacier lake and recent regional changes in glacier lakes of the Teskey Ala-Too range, Tien Shan, Kyrgyzstan, Nat. Hazards Earth Syst. Sci., 10, 647–659, https://doi.org/10.5194/nhess-10-647-2010, 2010.
Nie, Y., Liu, Q., Wang, J., Zhang, Y., Sheng, Y., and Liu, S.: An inventory of historical glacial lake outburst floods in the Himalayas based on remote sensing observations and geomorphological analysis, Geomorphology, 308, 91–106, https://doi.org/10.1016/j.geomorph.2018.02.002, 2018.
Nie, Y., Liu, W., Liu, Q., Hu, X., and Westoby, M. J.: Reconstructing the Chongbaxia Tsho glacial lake outburst flood in the Eastern Himalaya: Evolution, process and impacts, Geomorphology, 370, 107393, https://doi.org/10.1016/j.geomorph.2020.107393, 2020.
O'Connor, J. E., Hardison, J. H., and Costa, J. E.: Debris Flows from Failures of Neoglacial – Age Moraine Dams in the Three Sisters and Mount Jefferson Wilderness Areas, Oregon, Professional Pa-per1606, U.S. Geological Survey, Reston, 93, 2001.
Panday, P. K., Thibeault, J., and Frey, K. E.: Changing temperature and precipitation extremes in the Hindu Kush-Himalayan region: an analysis of CMIP3 and CMIP5 simulations and projections, Int. J. Climatol., 35, 3058–3077, https://doi.org/10.1002/joc.4192, 2015.
Popov, N.: Assessment of glacial debris flow hazard in the north Tien-Shan, in: Proceedings of the Soviet-China-Japan Symposium and field workshop on natural disasters, 384–391, 2–17 September 1991.
Price, J. T., Lowe, G. W., and Garrison, J. M.: Unsteady flow modeling of dam-break waves, Proceedings: U.S. Water Resources Council, Hydrology Committee, Springfield, Virginia, 275–437, 1977.
Pudasaini, S. P. and Mergili, M.: A Multi-Phase Mass Flow Model, J. Geophys. Res.-Earth, 124, 2920–2942, https://doi.org/10.1029/2019jf005204, 2019.
RGI Consortium: Randolph Glacier Inventory – A dataset of global glacier outlines: version 6.0: Technical Report, Global Land Ice Measurements from Space (GLIMS), Colorado, Digital Media, https://doi.org/10.7265/N5-RGI-60, 2017.
Richardson, S. D. and Reynolds, J. M.: An overview of glacial hazards in the Himalayas, Quatern. Int., 65-6, 31–47, https://doi.org/10.1016/S1040-6182(99)00035-X, 2000.
Roe, G. H., Christian, J. E., and Marzeion, B.: On the attribution of industrial-era glacier mass loss to anthropogenic climate change, The Cryosphere, 15, 1889–1905, https://doi.org/10.5194/tc-15-1889-2021, 2021.
Rounce, D. R., Watson, C. S., and McKinney, D. C.: Identification of hazard and risk for glacial lakes in the Nepal Himalaya using satellite imagery from 2000–2015, Remote Sens., 9, 654, https://doi.org/10.3390/rs9070654, 2017.
Sanjay, J., Krishnan, R., Shrestha, A. B., Rajbhandari, R., and Ren, G.-Y.: Downscaled climate change projections for the Hindu Kush Himalayan region using CORDEX South Asia regional climate models, Adv. Clim. Change Res., 8, 185–198, https://doi.org/10.1016/j.accre.2017.08.003, 2017.
Schaub, Y., Huggel, C., and Cochachin, A.: Ice-avalanche scenario elaboration and uncertainty propagation in numerical simulation of rock-/ice-avalanche-induced impact waves at Mount Hualcán and Lake 513, Peru, Landslides, 13, 1445–1459, https://doi.org/10.1007/s10346-015-0658-2, 2016.
Schneider, D., Huggel, C., Cochachin, A., Guillén, S., and García, J.: Mapping hazards from glacier lake outburst floods based on modelling of process cascades at Lake 513, Carhuaz, Peru, Adv. Geosci., 35, 145–155, https://doi.org/10.5194/adgeo-35-145-2014, 2014.
Schwanghart, W., Worni, R., Huggel, C., Stoffel, M., and Korup, O.: Uncertainty in the Himalayan energy–water nexus: estimating regional exposure to glacial lake outburst floods, Environ. Res. Lett., 11, 074005, https://doi.org/10.1088/1748-9326/11/7/074005, 2016.
Shugar, D., Burr, A., Haritashya, U. K., Kargel, J. S., Watson, C. S., Kennedy, M. C., Bevington, A. R., Betts, R. A., Harrison, S., and Strattman, K.: Rapid worldwide growth of glacial lakes since 1990, Nat. Clim. Change, 10, 939–945, https://doi.org/10.1038/s41558-020-0855-4, 2020.
Singh, K. P. and Snorrason, A.: Sensitivity of outflow peaks and flood stages to the selection of dam breach parameters and simulation models, J. Hydrol., 68, 295–310, https://doi.org/10.1016/0022-1694(84)90217-8, 1984.
Soil Conservation Service: Simplified dam-breach routing procedure, U.S. Dept. of Agriculture, Washington, D.C., Tech. Release No. 66, 39, 1981.
Stuart-Smith, R. F., Roe, G. H., Li, S., and Allen, M. R.: Increased outburst flood hazard from Lake Palcacocha due to human-induced glacier retreat, Nat. Geosci., 14, 85–90, https://doi.org/10.1038/s41561-021-00686-4, 2021.
Sun, M., Liu, S., Yao, X., and Li, L.: The cause and potential hazard of glacial lake outburst flood occurred on July 5, 2013 in Jiali County, Tibet, Journal of Glaciology and Geocryology, 36, 158–165, 2014 (in Chinese).
Sun, W. H., Chen, B., and Messinger, D. W.: Nearest-neighbor diffusion-based pan-sharpening algorithm for spectral images, Opt. Eng., 53, 013107, https://doi.org/10.1117/1.Oe.53.1.013107, 2014.
Veh, G., Korup, O., von Specht, S., Roessner, S., and Walz, A.: Unchanged frequency of moraine-dammed glacial lake outburst floods in the Himalaya, Nat. Clim. Change, 9, 379–383, https://doi.org/10.1038/s41558-019-0437-5, 2019.
Veh, G., Korup, O., and Walz, A.: Hazard from Himalayan glacier lake outburst floods, P. Natl. Acad. Sci. USA, 117, 907–912, https://doi.org/10.1073/pnas.1914898117, 2020.
Von Thun, J. L. and Gillette, D. R.: Guidance on breach parameters. Internal Memorandum, U.S. Dept. of the Interior, Bureau of Reclamation, Denver, p. 17, 1990.
Wahl, T. L.: Uncertainty of Predictions of Embankment Dam Breach Parameters, J. Hydraul. Eng., 130, 389–397, https://doi.org/10.1061/(ASCE)0733-9429(2004)130:5(389), 2004.
Wang, S., Qin, D., and Xiao, C.: Moraine-dammed lake distribution and outburst flood risk in the Chinese Himalaya, J. Glaciol., 61, 115–126, https://doi.org/10.3189/2015JoG14J097, 2015.
Wang, X., Liu, S., Ding, Y., Guo, W., Jiang, Z., Lin, J., and Han, Y.: An approach for estimating the breach probabilities of moraine-dammed lakes in the Chinese Himalayas using remote-sensing data, Nat. Hazards Earth Syst. Sci., 12, 3109–3122, https://doi.org/10.5194/nhess-12-3109-2012, 2012.
Wang, X., Guo, X., Yang, C., Liu, Q., Wei, J., Zhang, Y., Liu, S., Zhang, Y., Jiang, Z., and Tang, Z.: Glacial lake inventory of high-mountain Asia in 1990 and 2018 derived from Landsat images, Earth Syst. Sci. Data, 12, 2169–2182, https://doi.org/10.5194/essd-12-2169-2020, 2020.
Westoby, M. J., Glasser, N. F., Hambrey, M. J., Brasington, J., Reynolds, J. M., and Hassan, M. A.: Reconstructing historic Glacial Lake Outburst Floods through numerical modelling and geomorphological assessment: Extreme events in the Himalaya, Earth Surf. Proc. Land., 39, 1675–1692, https://doi.org/10.1002/esp.3617, 2014.
Westoby, M. J., Brasington, J., Glasser, N. F., Hambrey, M. J., Reynolds, J. M., Hassan, M. A. A. M., and Lowe, A.: Numerical modelling of glacial lake outburst floods using physically based dam-breach models, Earth Surf. Dynam., 3, 171–199, https://doi.org/10.5194/esurf-3-171-2015, 2015.
Wilson, R., Harrison, S., Reynolds, J., Hubbard, A., Glasser, N. F., Wündrich, O., Iribarren Anacona, P., Mao, L., and Shannon, S.: The 2015 Chileno Valley glacial lake outburst flood, Patagonia, Geomorphology, 332, 51–65, https://doi.org/10.1016/j.geomorph.2019.01.015, 2019.
Worni, R., Stoffel, M., Huggel, C., Volz, C., Casteller, A., and Luckman, B.: Analysis and dynamic modeling of a moraine failure and glacier lake outburst flood at Ventisquero Negro, Patagonian Andes (Argentina), J. Hydrol., 444-445, 134–145, https://doi.org/10.1016/j.jhydrol.2012.04.013, 2012.
Yao, X., Liu, S., Sun, M., Wei, J., and Guo, W.: Volume calculation and analysis of the changes in moraine-dammed lakes in the north Himalaya: a case study of Longbasaba lake, J. Glaciol., 58, 753–760, 2012.
You, Q., Min, J., and Kang, S.: Rapid warming in the Tibetan Plateau from observations and CMIP5 models in recent decades, Int. J. Climatol., 36, 2660–2670, https://doi.org/10.1002/joc.4520, 2016.
Zemp, M., Huss, M., Thibert, E., Eckert, N., McNabb, R., Huber, J., Barandun, M., Machguth, H., Nussbaumer, S. U., Gartner-Roer, I., Thomson, L., Paul, F., Maussion, F., Kutuzov, S., and Cogley, J. G.: Global glacier mass changes and their contributions to sea-level rise from 1961 to 2016, Nature, 568, 382–386, https://doi.org/10.1038/s41586-019-1071-0, 2019.
Zhang, G., Yao, T., Xie, H., Wang, W., and Yang, W.: An inventory of glacial lakes in the Third Pole region and their changes in response to global warming, Global Planet. Change, 131, 148–157, https://doi.org/10.1016/j.gloplacha.2015.05.013, 2015.
Zheng, G., Bao, A., Li, J., Zhang, G., Xie, H., Guo, H., Jiang, L., Chen, T., Chang, C., and Chen, W.: Sustained growth of high mountain lakes in the headwaters of the Syr Darya River, Central Asia, Global Planet. Change, 176, 84–99, https://doi.org/10.1016/j.gloplacha.2019.03.004, 2019.
Zheng, G., Bao, A., Allen, S., Ballesteros-Cánovas, J., Yuan, Y., Jiapaer, G., and Stoffel, M.: Numerous unreported glacial lake outburst floods in the Third Pole revealed by high-resolution satellite data and geomorphological evidence, Sci. Bull., 66, 1270–1273, https://doi.org/10.1016/j.scib.2021.01.014, 2021.