the Creative Commons Attribution 4.0 License.
the Creative Commons Attribution 4.0 License.
 | 22 Dec 2020
Spatio-temporal flow variations driving heat exchange processes at a mountain glacier
Rebecca Mott
Ivana Stiperski
Lindsey Nicholson
Multi-scale interactions between the glacier surface, the overlying atmosphere, and the surrounding alpine terrain are highly complex and force temporally and spatially variable local glacier energy fluxes and melt rates. A comprehensive measurement campaign (Hintereisferner Experiment, HEFEX) was conducted during August 2018 with the aim to investigate spatial and temporal dynamics of the near-surface boundary layer and associated heat exchange processes close to the glacier surface during the melting season. The experimental set-up of five meteorological stations was designed to capture the spatial and temporal characteristics of the local wind system on the glacier and to quantify the contribution of horizontal heat advection from surrounding ice-free areas to the local energy flux variability at the glacier. Turbulence data suggest that temporal changes in the local wind system strongly affect the micrometeorology at the glacier surface. Persistent low-level katabatic flows during both night and daytime cause consistently low near-surface air temperatures with only small spatial variability. However, strong changes in the local thermodynamic characteristics occur when westerly flows disturbed this prevailing katabatic flow, forming across-glacier flows and facilitating warm-air advection from the surrounding ice-free areas. Such heat advection significantly increased near-surface air temperatures at the glacier, resulting in strong horizontal temperature gradients from the peripheral zones towards the centre line of the glacier. Despite generally lower near-surface wind speeds during across-glacier flow, peak horizontal heat advection from the peripheral zones towards the centre line and strong transport of turbulence from higher atmospheric layers downward resulted in enhanced turbulent heat exchange towards the glacier surface at the glacier centre line. Thus, at the centre line of the glacier, exposure to strong larger-scale westerly winds promoted heat exchange processes, potentially contributing to ice melt, while at the peripheral zones of the glacier, stronger sheltering from larger-scale flows allowed the preservation of a katabatic jet, which suppressed the efficiency of the across-glacier flow to drive heat exchange towards the glacier surface by decoupling low-level atmospheric layers from the flow aloft. A fuller explanation of the origin and structure of the across-glacier flow would require large-eddy simulations.
- Article
(8081 KB) - Full-text XML
- BibTeX
- EndNote


Mountain glaciers are important contributors to the regional and global hydrological cycle (e.g. Bahr and Radić, 2012) as well as sea-level rise (e.g. Radić and Hock, 2011). Thus, it is crucial to understand their mass changes and associated climatic drivers. Winter precipitation, avalanching (e.g. Kuhn, 1995; Sold et al., 2013; Mott et al., 2019), wind deposition of snow (e.g. Dadic et al., 2010), regional climate (e.g. Kaser et al., 2004), and specific micrometeorology (e.g. Kuhn, 1995; Denby and Greuell, 2000; Escher-Vetter, 2002; Oerlemans and Van Den Broeke, 2002; Strasser et al., 2004; Nicholson et al., 2013; Petersen et al., 2013; Conway and Cullen, 2016; Mott et al., 2019) have all been found to contribute to the survival of mountain glaciers in the face of generally increasingly unfavourable conditions. Energy balance models (e.g. Mölg et al., 2009; Klok and Oerlemans, 2002) have been used to analyse the climatic drivers of prevalent rapid mass losses of mountain glaciers, showing that although shortwave radiation is the main driver for snowmelt and ice melt, the sensitivity of the melt rate to temperature is strongly affected by the net longwave radiation and the turbulent heat fluxes (e.g. Oerlemans, 2001; Cullen and Conway, 2015). Several studies demonstrate insufficient representation of the variability in energy fluxes on mountain glaciers (e.g. MacDougall and Flowers, 2011; Prinz et al., 2016; Sauter and Galos, 2016), and potentially large biases in snowmelt predictions were also shown to be induced by the evolution of small-scale flow systems in alpine catchments (Mott et al., 2015; Dadic et al., 2013; Helbig et al., 2017; Schlögl et al., 2018a, b). Complex wind systems at glaciers, with strong spatial and temporal variations in the katabatic flow and interactions with cross-valley flows, have been highlighted as the cause of large variations in the local air temperature field (Petersen and Pellicciotti, 2011) and in turbulent heat exchange (Sauter and Galos, 2016), while Oerlemans and Grisogono (2002) suggest that deep glacier winds act as a heat pump for the glacier surface by generating shear and enhancing turbulent mixing close to the glacier surface. Zhong and Whiteman (2008) suggest that near-surface warming could also be caused by along-slope warm-air advection induced by katabatic flows, while Pinto et al. (2006) identify the entrainment of potentially warmer air down to the surface driven by stronger turbulent mixing. Furthermore, some studies highlighted the effect of katabatic flows in laterally decoupling the local atmosphere from its surroundings, thus lowering the climatic sensitivity of glaciers to external temperature changes (Shea and Moore, 2010; Sauter and Galos, 2016; Mott et al., 2019).
The effect of katabatic wind systems on the local air temperatures over glaciers has been intensively studied and forms the basis for parameterizations of turbulent fluxes (e.g. Oerlemans and Grisogono, 2002; Petersen et al., 2013). However, the complex interaction between different boundary layer processes on glacier mass balance has gained little attention so far. Recently, experimental and numerical studies on turbulent fluxes in the stable boundary layer of snow or ice (Daly et al., 2010; Mott et al., 2013; Curtis et al., 2014; Mott et al., 2016, 2017; Lapo et al., 2019) identified cold-air pooling, boundary layer decoupling, and advective heat transport as important counteracting processes altering the local air temperature and heat exchange processes. Advective transport of sensible heat has been shown to increase the local air temperature, strongly contributing to the net available melt energy for snow and ice (Essery et al., 2006; Mott et al., 2011; Harder et al., 2017; Schlögl et al., 2018a, b). The numerical simulations of Sauter and Galos (2016) showed that insufficient characterization of these temperature advection processes caused incorrect local sensible-heat-flux estimates. They showed that cross-valley flows in particular strongly drive the advection of warmer air from surrounding ice-free areas towards the glacier. The increase in local air temperatures enhances the turbulent heat exchange towards the glacier surface, particularly at the peripheral zones of the glacier.
The concurrent existence of counteracting processes such as katabatic flows, horizontal warm-air advection, and boundary layer decoupling increases the complexity of atmospheric boundary layer dynamics on glaciers, and the interaction between them is not well understood. Warm-air advection may disturb the katabatic flow at some areas of the glacier-altering thermal conditions and enhancing downward heat exchange towards the glacier surface (Ayala et al., 2015). In the presence of advective heat transport, however, shallow internal boundary layers may enhance local atmospheric stratification close to the snow surfaces, resulting in atmospheric decoupling of the air adjacent to the snow cover from the warm air above (Mott et al., 2017). The collapse of near-surface turbulence subsequently limits the amount of sensible and latent heat than can be transmitted from the atmosphere to the snow surface (Mott et al., 2018). Understanding the interplay of these processes is important for correctly interpreting the climatic significance of glacier mass balance studies that typically use interpolated fields for turbulent flux estimations.
2.1 Field site
The Hintereisferner is a valley glacier located in the Ötztal Alps, Austria. It has been classified as one of the “reference glaciers” by the World Glacier Monitoring Service, with observations dating back to the year 1952/53 and continuing to the present day as part of a comprehensive catchment monitoring programme (Strasser et al., 2018). The mass balance of the glacier has been extensively studied for decades (e.g. Hoinkes, 1970; Kuhn et al., 1999; Marzeion et al., 2012; Klug et al., 2018). Hintereisferner has also been used for development and testing of instruments, methods, and models (Kuhn et al., 1999) and for investigating glacier and valley winds (Obleitner, 1994).
Hintereisferner is a classical valley glacier approximately 6.3 km long (in 2018) with an elevation difference of approximately 1200 m (https://wgms.ch/, last access: 11 December 2020). The glacier tongue is located in a north-east-orientated valley surrounded by steep slopes (Fig. 1b). In the central part of the glacier tongue, the Langtaufererjoch valley discharges into the main valley, marking the former confluence of a tributary glacier. Hintereisferner is located in the “inner dry Alpine zone” (Frei and Schär, 1998), among the driest regions of the entire European Alps. Like many glaciers in the eastern Alps, Hintereisferner has experienced strong shrinkage during recent decades. Between 2001 and 2011 the area of the glacier decreased by 15 % (Abermann et al., 2009; Klug et al., 2018).
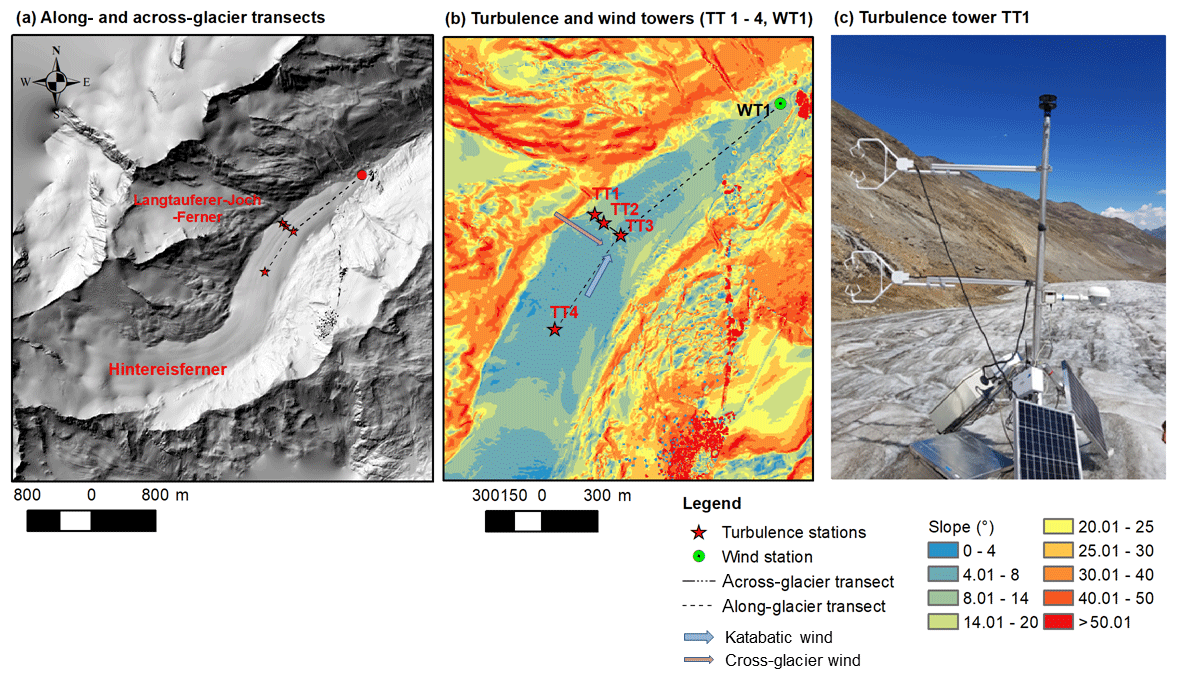
Figure 1Experimental test site Hintereisferner with an along- and across-glacier transect of five meteorological towers (a, b). Four of these towers, the turbulence towers (TT1–TT4), were additionally equipped with two turbulence sensors (c). The wind station WT1, installed at the glacier tongue, was equipped with three wind sensors. The hillshade (a) and slope maps (b) were produced based on a terrestrial laser scan of the glacier surface (August 2018), which was combined with an airborne lidar scan (September 2013) covering a larger area including the surroundings of the glacier.
2.2 Instrumentation
The Hintereisferner Experiment (HEFEX) micrometeorological measurement campaign was conducted during 3 weeks in August 2018. Measurement towers were installed on 1 and 2 August and removed on 22 August. The measurement network consisted of five 3 m tripod towers (Fig. 1a), located at an along- and an across-glacier transect to capture the spatial variations in the atmospheric flow system at the glacier and associated heat exchange processes. Floating tripods were chosen to allow the towers to migrate with the melting ice surface and maintain the same sensor height over the length of the experiment.
The across-glacier transect consisted of three turbulence towers installed from the peripheral zones of the glacier towards the centre line (TT1, TT2, TT3) at 2700 m a.s.l. (Fig. 1). The location of the across-glacier transect coincides with where the valley of Langtaufererjochferner discharges into the valley of the Hintereisferner glacier (Fig. 1a). In this area, thermal flows from the surrounding area were hypothesized to influence the surface of Hintereisferner. The distances between towers TT1 and TT2 were 65 m and 110 m between TT2 and TT3. One turbulence tower (TT4) was installed at an up-glacier location at the glacier centre line (at 2761 m a.s.l.), with a horizontal distance of 620 m to TT3. The fifth station (WT1) was installed at the glacier tongue. All stations were installed at comparatively flat areas of the glacier with slope angles varying between 6 and 8∘. Measurement towers were installed directly at the ice surface. Due to pronounced changes in the ice surface caused by strong ice melt during the measurement campaign, frequent visual inspection and small adjustments to the location of the towers were essential for good data quality. This mainly consisted of repositioning the tower feet to ensure the tower stability and re-levelling the sensors. Post-processing of data, i.e. correction of data for height changes and rotation of the mast, further ensured data quality (see details below).
Each tower measured wind properties at three heights above the ice surface (level 1: 1.7 m; level 2: 2.35 m; and level 3: 2.9 m) as well as air temperature, relative humidity, and pressure at level 1. The temperature and humidity sensors (HC2A-S3 Rotronic) were actively ventilated and together with air pressure (CS100 Campbell Scientific) measured with a 1 min resolution. At the four turbulence towers (TT1–TT4) the wind sensors at levels 1 and 2 were CSAT3 and CSAT3b sonic anemometers (Campbell Scientific), sampling at a frequency of 20 Hz, while at the fifth tower (WT1), these levels were recorded with two Young wind monitor (05103) propeller anemometers. At all towers the level 3 wind sensor was a two-dimensional wind sonic anemometer (Gill instruments).
2.3 Data processing
The turbulence data were processed as follows: multi-resolution flux decomposition (MRD) was used to determine the optimal averaging time for the turbulence data that eliminates the influence of non-turbulent (sub)mesoscale motions (Vickers and Mahrt, 2003). MRD is a wavelet transform that decomposes the signal into dyadic scales while preserving Reynolds averaging rules. According to Vickers and Mahrt (2003), the appropriate averaging time is taken to be that timescale at which the contribution to the flux (at its inter-quantile ranges) first crosses over 0.
The MRD analysis of the heat flux for the four examined stations during the period of the campaign (Fig. 2) shows that due to its stable nature, the turbulent contribution to the flux is found at scales smaller than 1 min, while scales larger than 1 min already show a strong contribution of the (sub)mesoscale motions. The exception here is station TT1, which exhibits a higher median contribution to the turbulent flux up until a 5 min scale. Following the approach of Vickers and Mahrt (2003), however, we choose the appropriate averaging timescale to be that where the upper quantile crosses over 0, and for comparability reasons we therefore block-average the data from all stations with an averaging time of 1 min.
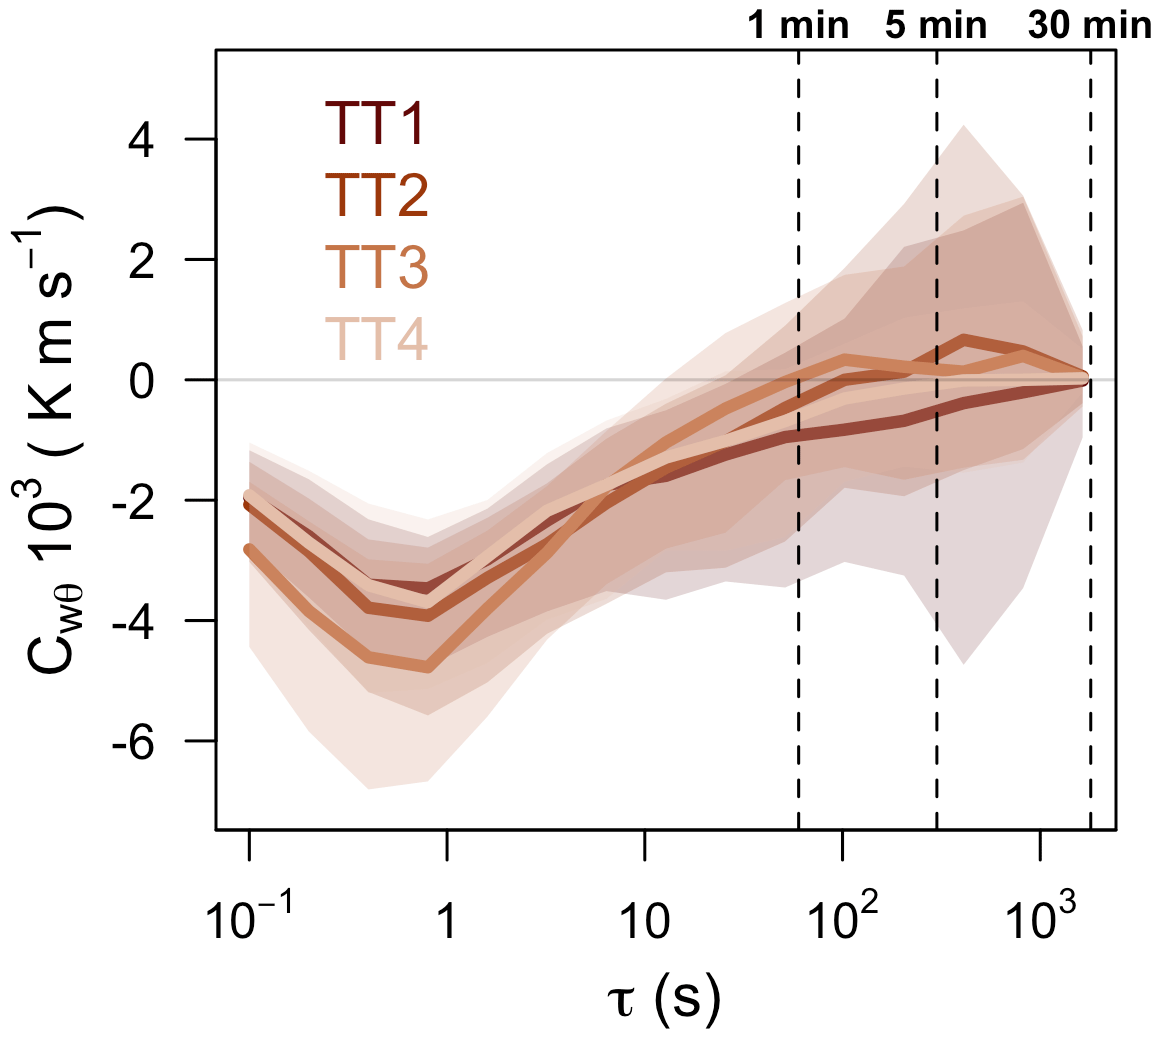
Figure 2Multi-resolution flux decomposition of buoyancy flux as a function of timescale τ for the four examined stations. Shown are median (full line) and interquantile ranges (shading).
Prior to block-averaging, the data in each 1 min averaging period were rotated using double rotation (Stiperski and Rotach, 2016) and detrended (Aubinet et al., 2012). Double-rotation is preferred over a planar fit method due to continual changes to the surface of the glacier and movement of the stations. The rotation method ensures that the z component corresponds to the local slope normal direction, while the x component is oriented into the mean wind direction. Thus, the momentum flux () and streamwise heat fluxes () are facing into the mean wind direction. Data were also corrected for repositioning of the stations and possible rotations during the campaign caused by strong melting of the glacier surface and associated changes in surface structure of the glacier. Finally, to calculate the advective terms, we rotated the coordinate system such that the x direction is facing down the glacier (), and the y direction is oriented along the across-glacier transect towards the glacier margin ().
Climatological flux footprints were calculated for each station, for katabatic and non-katabatic flows, using the two-dimensional footprint parametrization of Kljun et al. (2015), with a boundary layer height of 100 m and surface roughness of 0.004 m (Greuell and Smeets, 2001; Fitzpatrick et al., 2019; Nicholson and Stiperski, 2020). We use this model as a first guess for the flux source area only, given a number of uncertainties. First, the model was not specifically designed for use in sloping terrain; second, our dataset does not provide a reliable estimate of the boundary layer height; and third, estimation of surface roughness for katabatic flow is challenging. Indeed, a higher surface roughness would cause footprint area to decrease. Sensitivity analysis, however, shows that this decrease is not considerable even when increasing the surface roughness by an order of magnitude (Table 1). Increasing the roughness length from 0.004 to 0.01 m (cf. Smith et al., 2020) results in a decrease in footprint sizes that depends on the flow conditions but is consistent between the stations (a reduction to 88 % of the original footprint for katabatic flows and to 79 % for disturbed flows).
Table 1Estimates of flux footprint area in square metres for surface roughness of z0=0.004 m and z0=0.01 m. Flux footprint areas are provided for disturbed- and katabatic-flow conditions and for the three transect stations TT1, TT2, and TT3.
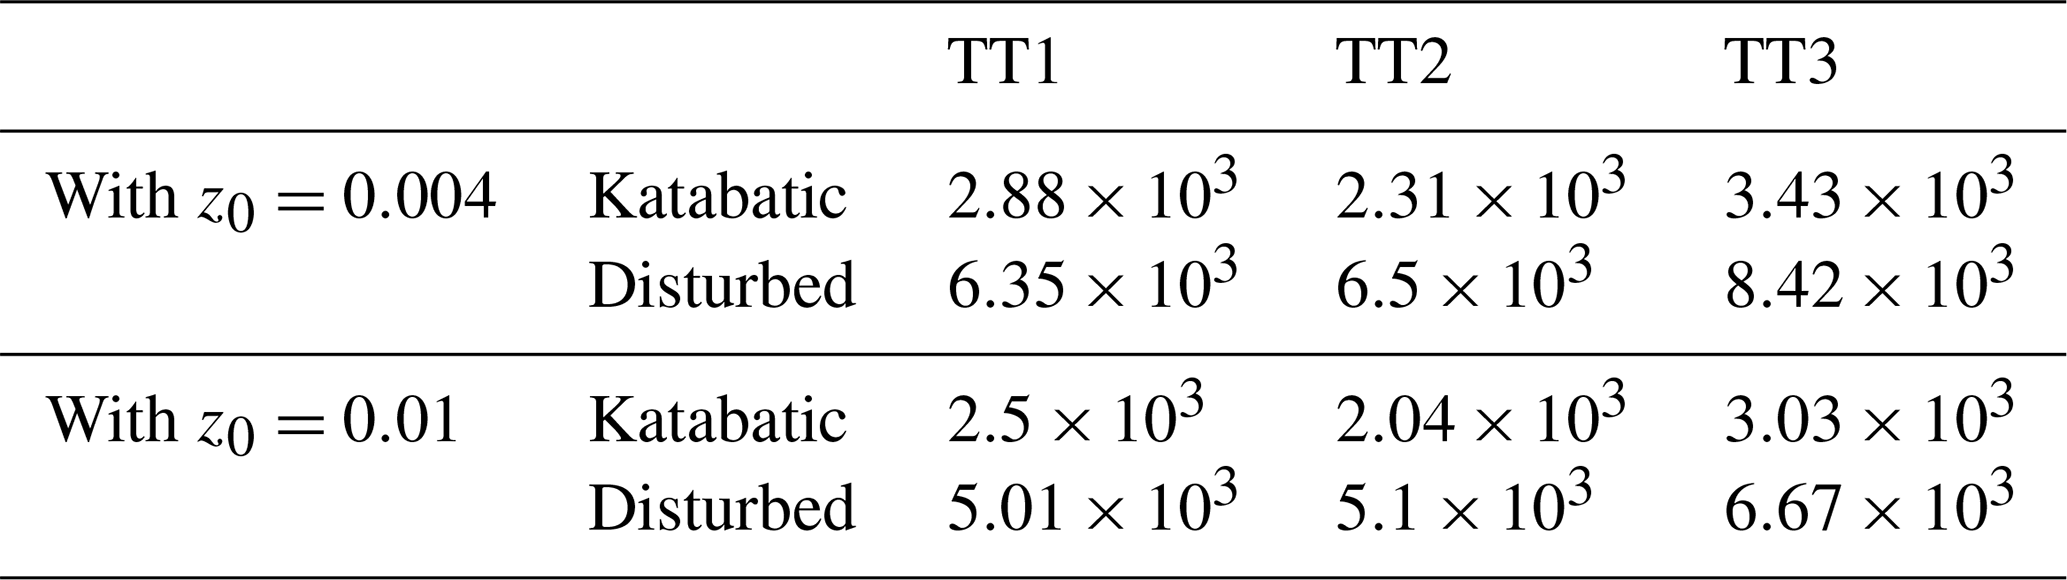
Decrease in footprint size with increasing roughness between 0.004 and 0.01 m is 88 % (katabatic) and 79 % (disturbed) of the original.
As we are interested in the interplay of katabatic flow with other local circulation patterns, in this study we focus on 5 d in August 2018 that meet three criteria: (1) good data quality at all the stations, (2) predominantly clear-sky conditions, and (3) flow characterized by a significant shift in wind direction from katabatic down-glacier flow direction to a westerly or north-westerly flow during the day. In order to allow a comparison between air temperature evolution and wind velocity differences during different days, we calculated the anomalies of 1 min air temperatures and wind velocities from the respective daytime averages of all transect stations between 10:00–18:00 UTC.
While a 1 min averaging period was chosen to calculate turbulent fluxes, a 30 min averaging period was used for wind profiles. The classification varies for averaging time periods of 1 and 30 min. The data analysis based entirely on 1 min averages used the following classification (as applied in Fig. 3): (1) purely katabatic conditions are defined as flows with persistent flow direction from the south-west (defined as 200∘ at station TT3) and wind velocities larger than 3 m s−1; (2) disturbed conditions are defined by a deviation of wind direction of more than 60∘ and less than 120∘ from the dominant katabatic-flow direction. This limits the flow sector to ±30∘ from the flow perfectly aligned with the transect (wind direction 290∘). Following these criteria, the analysis of turbulence data was performed for the following 5 d: 4, 5, 11, 15, and 20 August (referred to as day 1–5). During these days, persistent katabatic flow was disturbed by westerly winds. Following this classification, 45 % of the data are classified as katabatic conditions and 20 % as disturbed conditions. The 30 min averaged data used for profiles in Figs. 4 and 6 were classified using the following criteria: purely katabatic flows are defined as flows with persistent flow direction from the south-west (defined as 200∘ at station TT3) and wind velocities larger than 3 m s−1 for the entire 30 min averaging time period. All other flows were classified as disturbed flows without lower and upper limit of wind direction. Note that the upper turbulence sensor (CSAT, level 2) at TT2 was not working until 7 August due to a faulty cable which had to be replaced. During this period, turbulence profiles were analysed for stations TT1 and TT3.
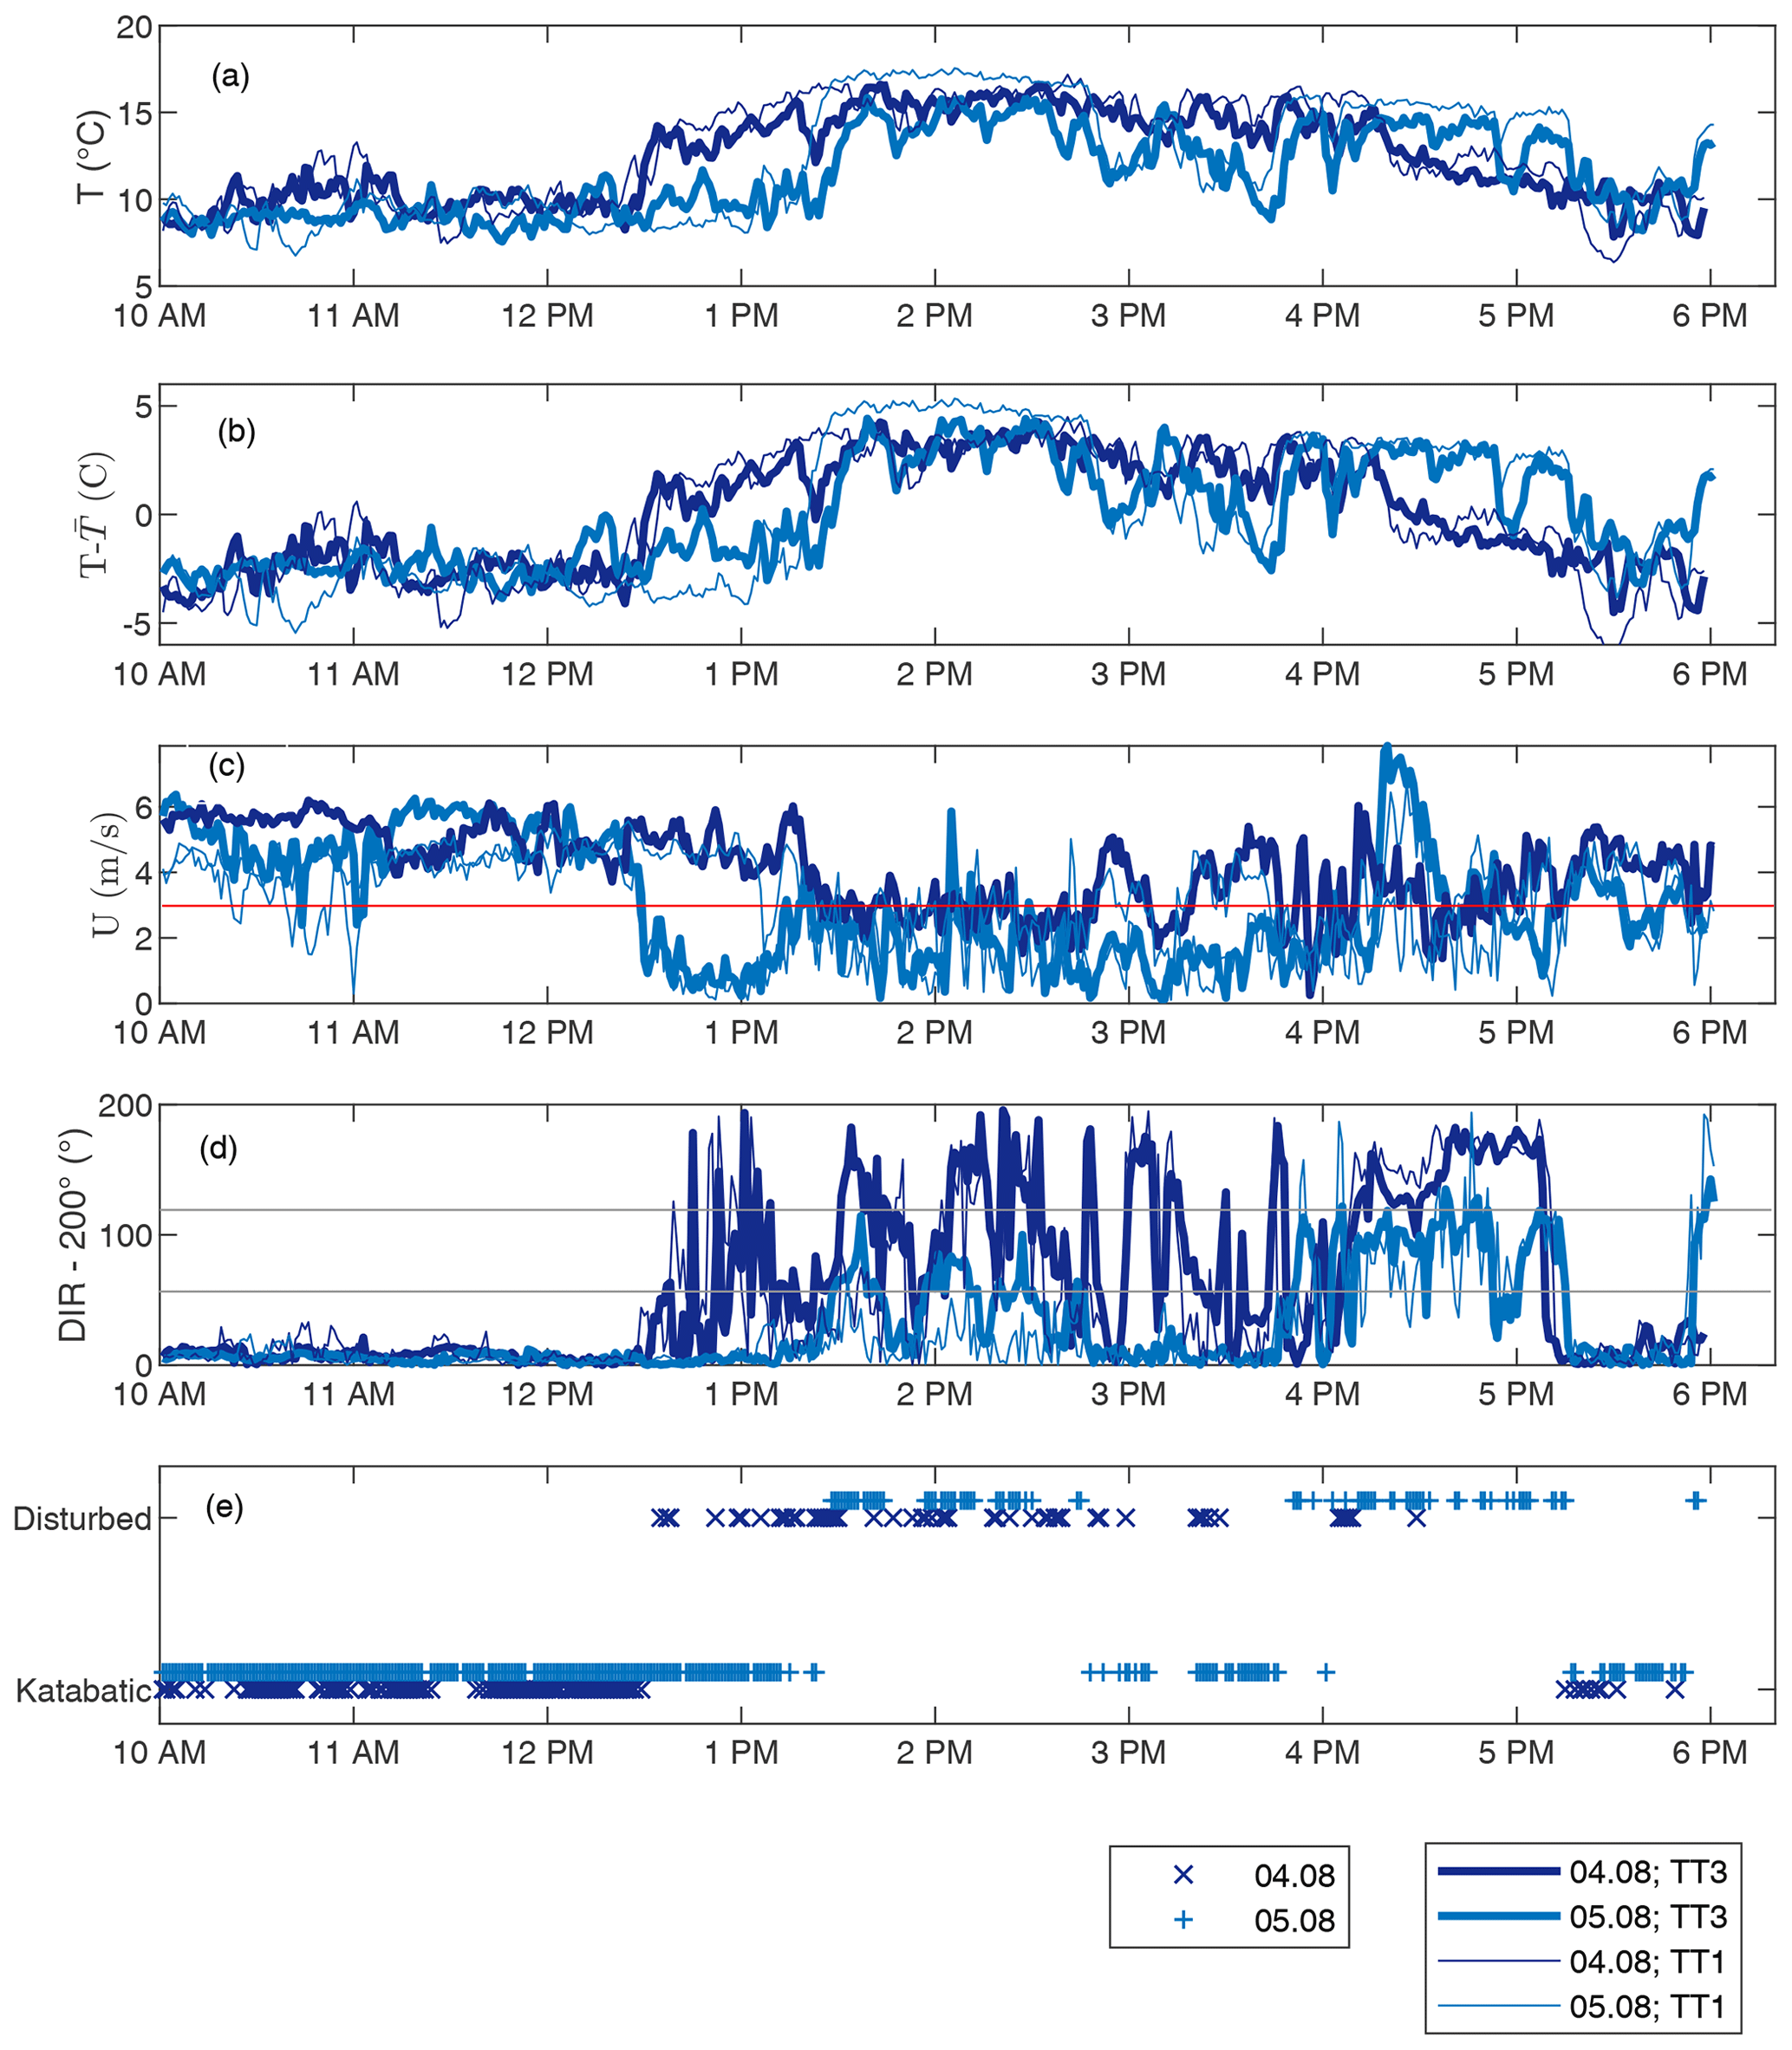
Figure 3The 1 min averages of (a) air temperature, (b) air temperature anomalies, (c) wind velocity, (d) wind direction deviation from the prevailing katabatic-wind direction (200∘) for stations TT1 and TT3, and (e) of classification of katabatic and disturbed flow based on station TT3. The solid line indicates the lower limit of 3 m s−1 for katabatic-flow classification in (c) and the lower and upper limit of the deviation of wind direction from dominant katabatic-flow direction to be classified as disturbed flow in (d). Data are shown for days d1 and d2 (04.08 and 05.08).
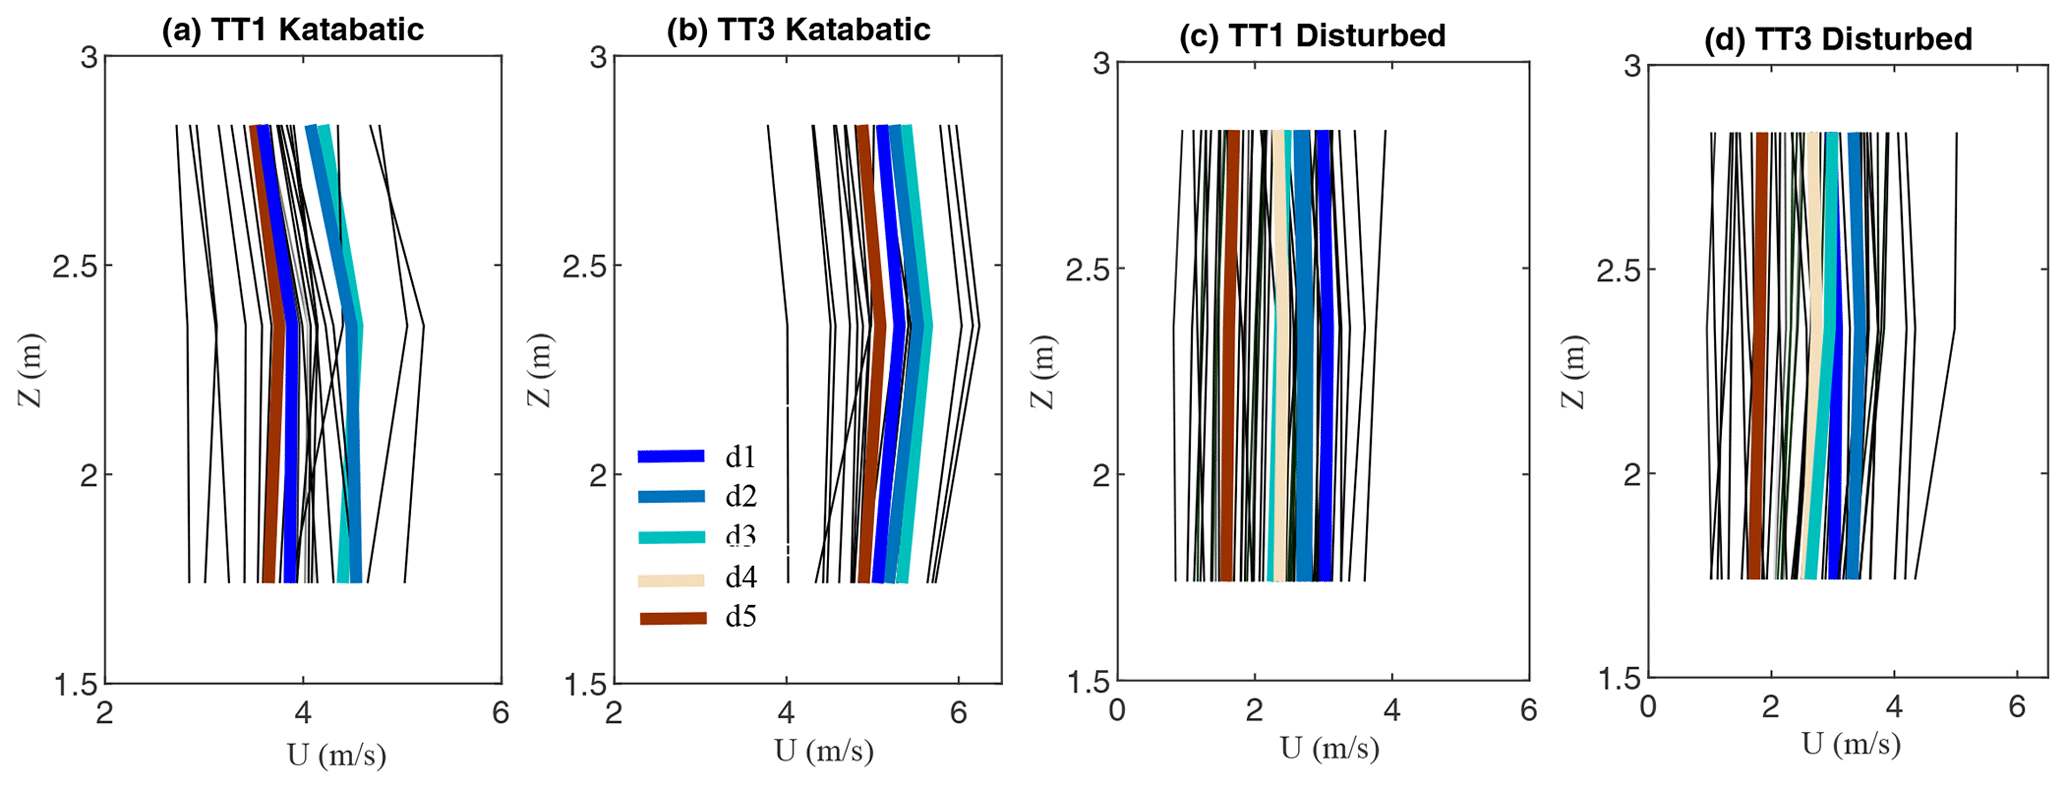
Figure 4Profiles of 30 min and daily (bold) averages of wind speed (U) measured during purely katabatic-flow and during disturbed-flow conditions at transect stations TT1 and TT3. Note that only 30 min averaged data were considered to be purely katabatic if data showed katabatic flow during the entire 30 min periods. Colours of bold lines indicate different measurement days.
Horizontal heat advection for disturbed conditions was calculated between transect stations TT1 and TT2 (distance of 65 m) and TT2 and TT3 (distance 114 m). We only calculated heat advection at the lowest level above ground as air temperature was measured only at this height (see Fig. 1c). In order to calculate heat advection along the transect, we introduced a new coordinate system that is defined along the transect. Therefore, heat advection HA was calculated as passive advection of temperature T (y, t) carried along by the mean y flow component using finite differences: . Here the flow component is defined as the mean wind velocity component along the transect and was calculated as the mathematical average of the y wind component between the pairs of stations.
The vertical flux divergence vFD of the vertical sensible-heat flux () was calculated between the two measurement levels as
Similarly, the horizontal flux divergence hFD of the streamwise sensible-heat flux () was calculated between two stations as
According to Denby (1999) and Grachev et al. (2016), profiles of streamwise momentum () and streamwise heat () flux provide an approximation of the vertical location of the jet height because typical turbulence profiles observed in the presence of low-level jets show a change in sign of the streamwise momentum flux (negative below and positive above) and heat flux (positive below and negative above) at the wind speed maximum. Following these observations, the position of the jet-speed maximum can be estimated by linear interpolation between two heights where momentum fluxes are measured (Grachev et al., 2016). This estimate assumes that the streamwise momentum flux decreases linearly and can be applied confidently only if the jet maximum height happens to be between the two measurement levels. We use this indirect estimate of jet maximum height from the turbulence profiles at the across-glacier transect to examine the change in katabatic-flow depth across the glacier and its disturbance by heat advection from the glacier surroundings. In this case the fluxes are not rotated into the new coordinate system but are streamwise.
3.1 Mean flow characteristics across the glacier
Profiles of mean wind speed at TT1 and TT3 are shown in Fig. 4. Furthermore, climatological flux footprints for all three transect stations are presented in Fig. 5, describing the upwind area where 80 % of fluxes measured at level 1 are generated. The areas of the footprints are provided in Table 1. During periods defined as purely katabatic flow, wind directions are quasi-constant at all stations, while wind direction is much more variable during periods of disruption of the katabatic flow (Fig. 5). This results in very consistent flux footprints during katabatic flows (Fig. 5a). Footprints vary between a few tens of metres to approximately 100 m and are largest at the centre line (Table 1), consistent with the highest wind speed observed there. During disturbed conditions footprints show a dominance of westerly to north-westerly flows but with a high temporal variability at all stations. Although the footprints for individual periods are smaller in their horizontal extent, their orientation is more varied during disturbed conditions, resulting in a larger overall footprint (Table 1). Still, the flux footprints for all periods capture ice and impinge only marginally to the rock at TT1 for NNW wind directions. We can also see that the footprints of TT1 and TT2 overlap during disturbed periods, justifying the calculation of horizontal flux divergence there but not between TT2 and TT3.

Figure 5Climatological flux footprints for transect stations TT1–TT3 and for (a) katabatic and (b) disturbed conditions. Background images: © Microsoft Bing™ Maps; arial screen shot(s) reprinted with permission from the Microsoft Corporation. Measurement days correspond to days d1–d5.
For katabatic conditions, wind speed profiles indicate a distinct low-level wind speed maximum within the lowest 2.9 m above the surface (Fig. 4a, b), with jet height between 1.7 and 2.3 m and observed wind speed maxima between 4 and 6 m s−1. In contrast, profiles during disturbed conditions show smaller wind speeds within the lowest 2.9 m above ground (Fig. 4c, d), small vertical gradients of wind speed, and less evidence of low-level jets within the height range of our measurements.
Persistent katabatic flows at the centre line are also indicated by the largest footprints at TT3 and decreasing footprints towards the glacier margin (Fig. 5, Table 1). Wind speed profile characteristics are typically similar for TT1 and TT3 (Fig. 4), although there are some periods when the stations at the glacier margins TT1 do not show a significant decrease in wind speed at level 3 or even showed an increase in wind speed at this level. This contrasting behaviour might be explained by disturbances from the non-glacierized surroundings at these two stations as wind speed at the marginal station tends to show more variability, especially at level 3, than in the more centrally located station.
During disturbed conditions (Fig. 4c, d) wind profiles at all sites show a much stronger temporal variability in wind direction also indicated by strong variation in the footprint (Fig. 5b). The horizontal extent of flux footprints tends to be smaller during disturbed conditions. Based on the predominantly measured westerly to north-westerly wind direction, we assume that these westerly flows were connected to a large-scale westerly circulation that developed over the day and disturbed the katabatic flow (Whiteman and Doran, 1993). A second explanation could be a thermal flow originating from the Langtalerjochferner or the development of cross-valley circulations caused by the curvature of the valley (cf. Weigel and Rotach, 2004) at the lower parts of the glacier.
3.2 Turbulence profiles of purely katabatic flows and disturbed conditions across the glacier
Vertical profiles of streamwise momentum fluxes for stations TT1 and TT3 (Fig. 6) show spatial and temporal patterns along the across-glacier transect. As not all three transect stations were properly working during the 5 d of interest, we present data from stations TT1 and TT3 in Fig. 7 to compare airflow and jet height along the across-glacier transect.
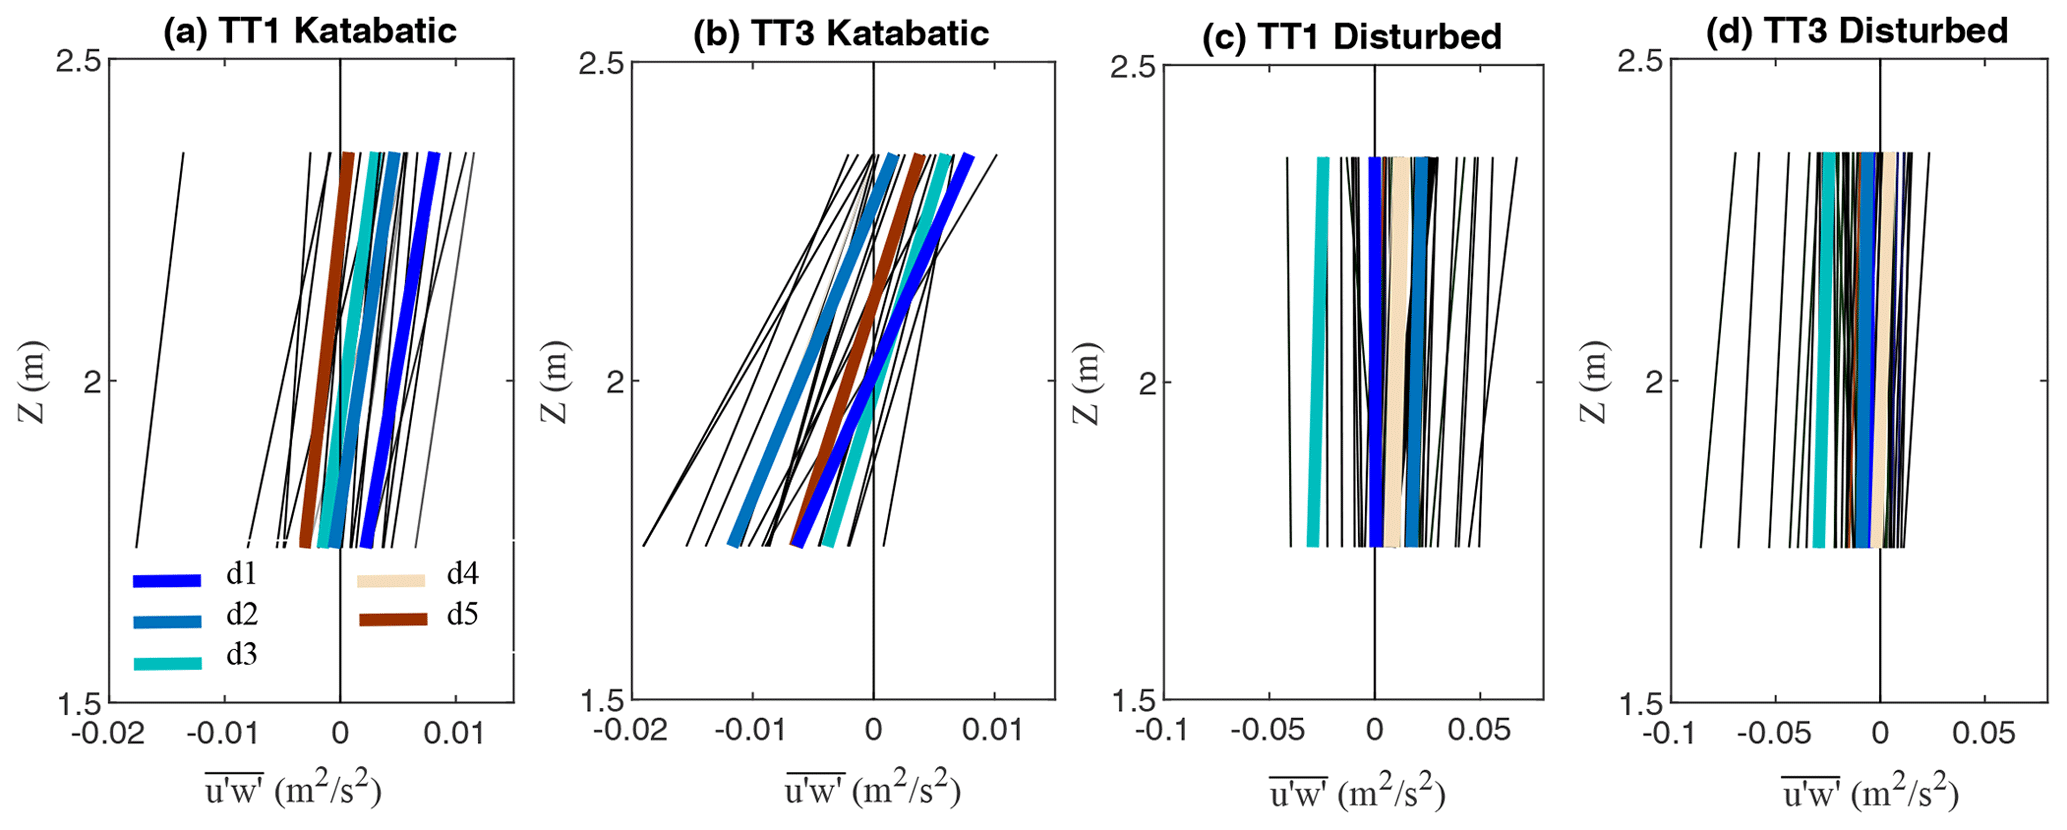
Figure 6Profiles of 30 min and daily (bold) averages of streamwise momentum flux () measured during purely katabatic-flow and during disturbed-flow conditions at transect stations TT1 and TT3. Note that only 30 min averaged data were considered to be purely katabatic if data showed katabatic flow during the entire 30 min periods. Colours of bold lines indicate different measurement days.
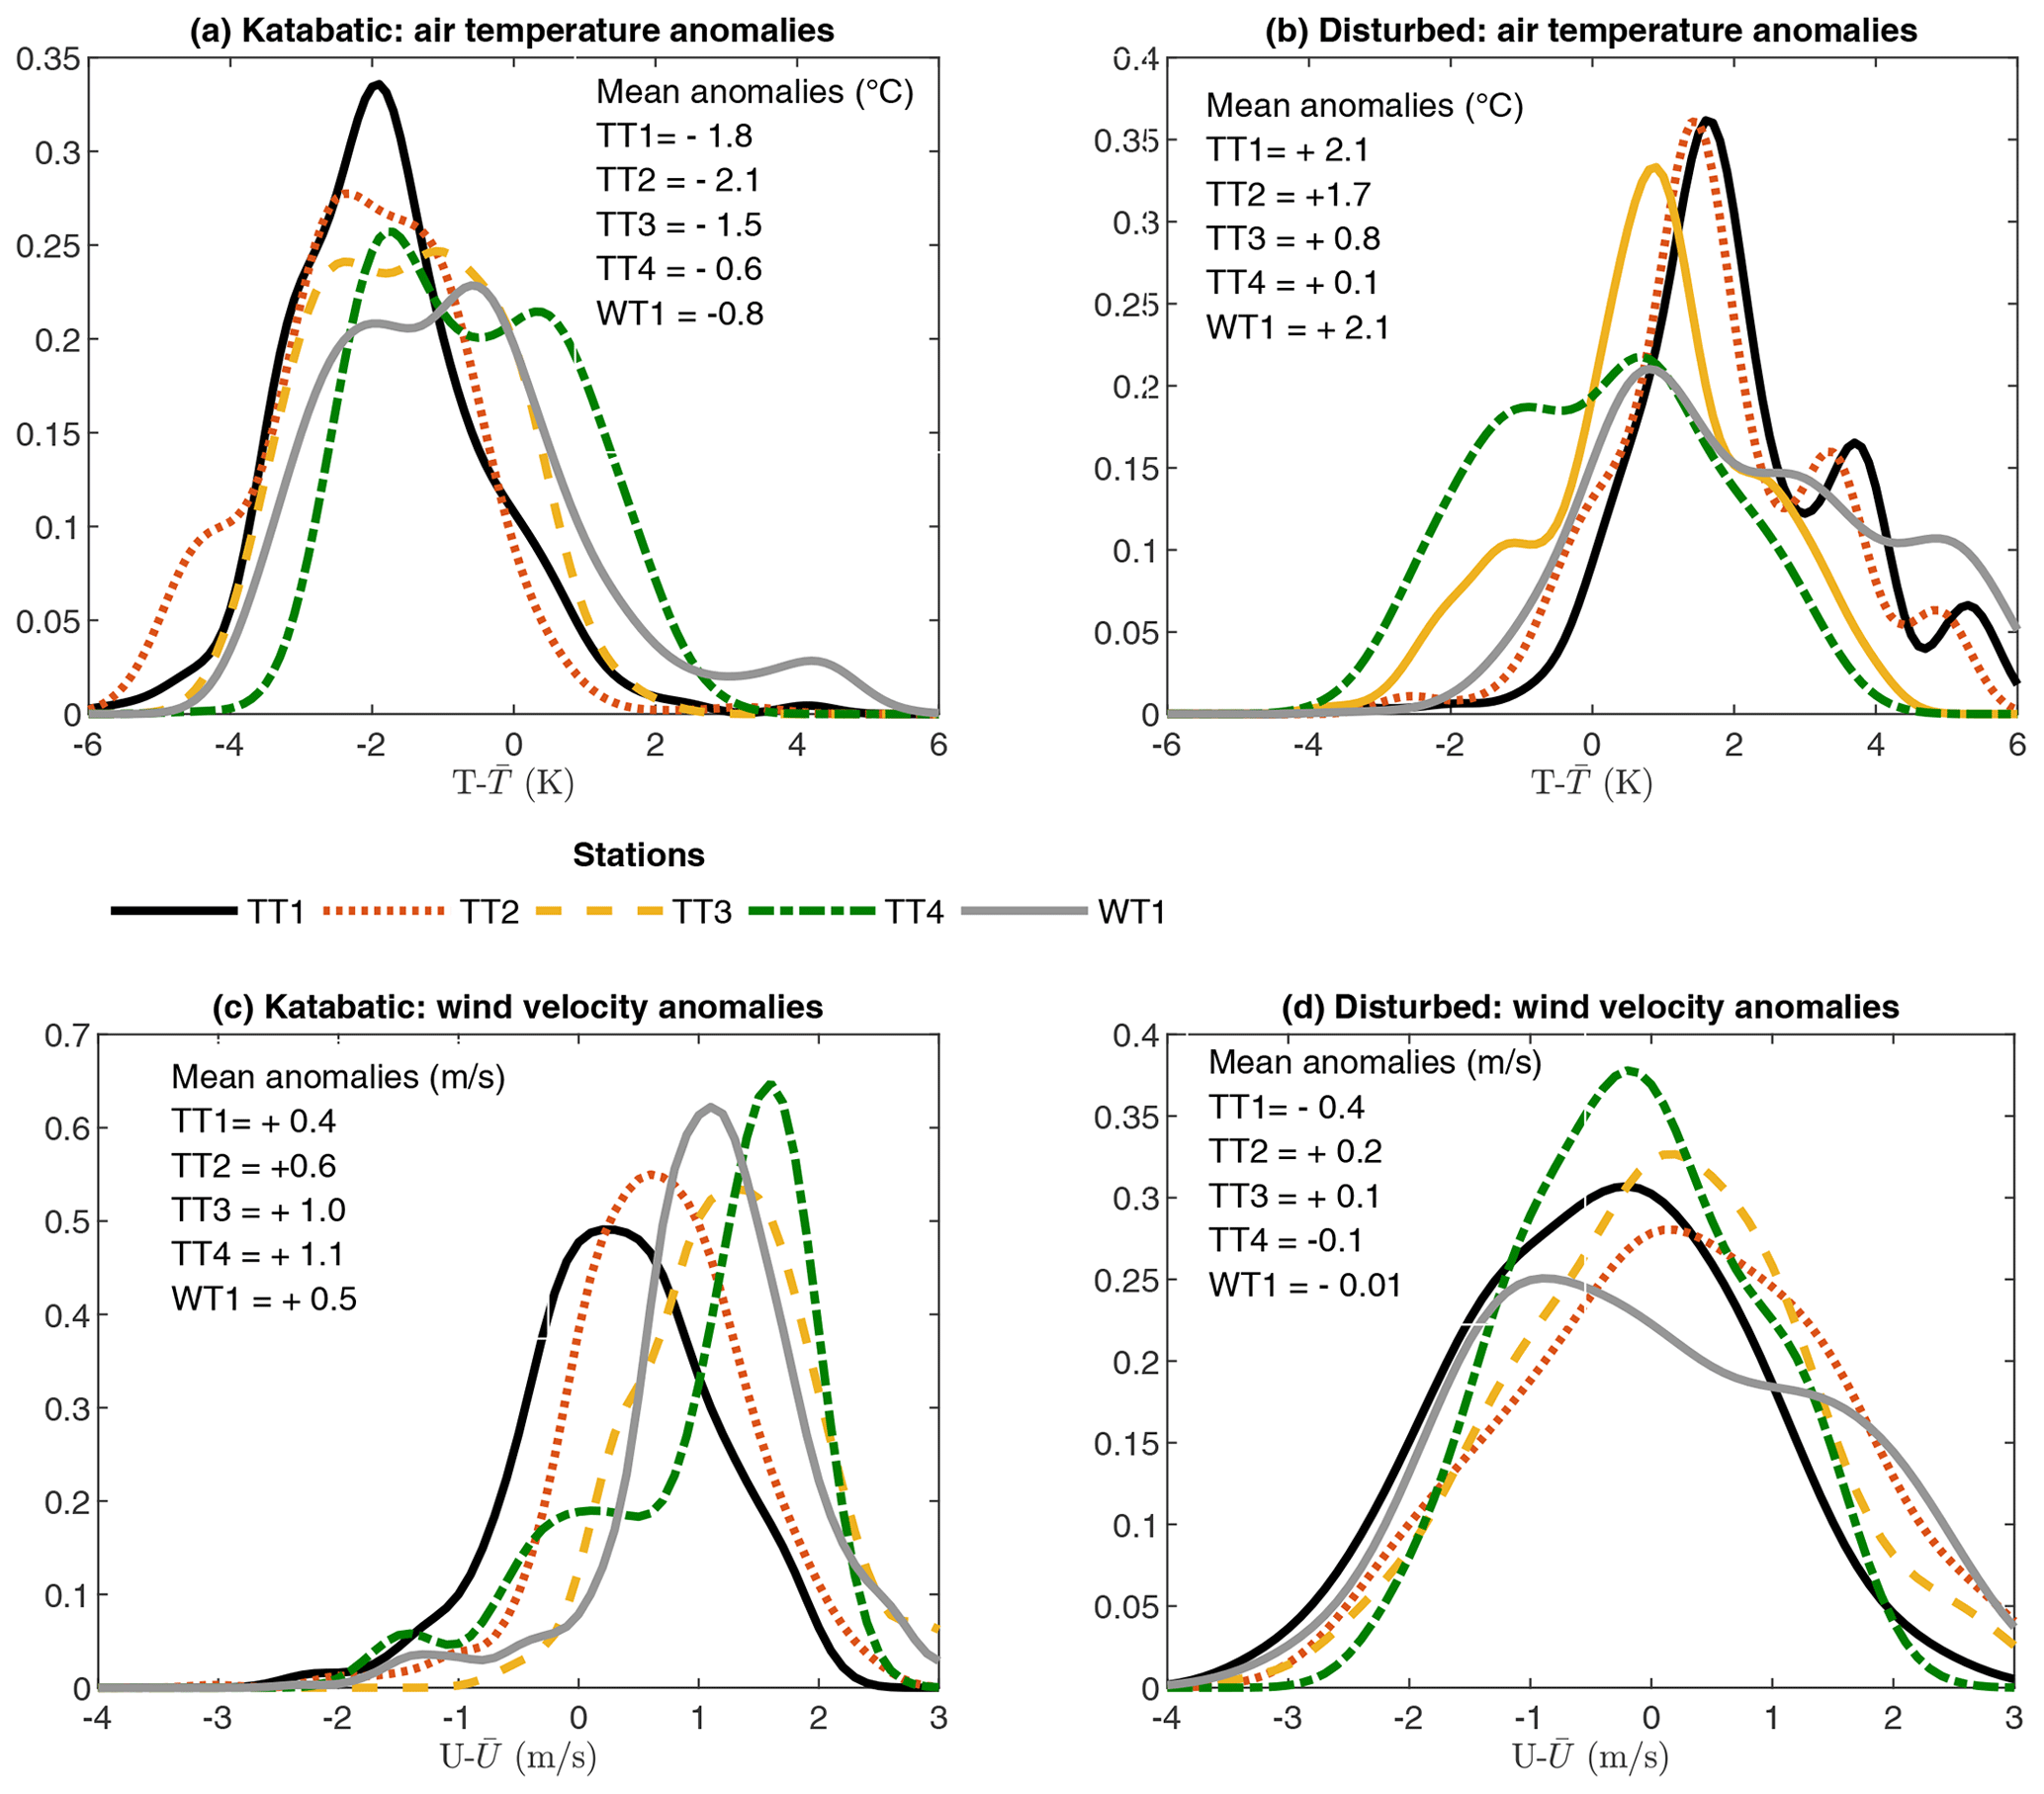
Figure 7Anomalies of air temperatures and wind velocities from mean daytime averages of the transect ensemble mean for stations TT1, TT2, TT3, TT4, and WT1 are shown for katabatic and disturbed conditions.
During katabatic-flow conditions, streamwise momentum fluxes measured at the centre line stations (TT3) clearly changed from a negative (downward) to a positive flux (upward) between the lower and the upper sensor (Fig. 6b), suggesting a jet height between the two measurement heights of 1.7 and 2.3 m above the ice surface. Jet heights are found to be more consistent at TT3. Furthermore, profiles of streamwise momentum fluxes at the centre line show a steeper gradient of streamwise momentum flux in the layer below the wind speed maximum than observed at the margin station, where the lower measurement level was predominantly located approximately at the jet height. At the margin station TT1, strong temporal variability in streamwise momentum flux profiles indicates jet heights lower and higher than levels 1 and 2. Streamwise momentum fluxes at station TT1 more frequently show positive fluxes at both measurement levels, indicating that measurements were conducted above a primary low-level jet height. Well-developed katabatic flows at the centre line also showed higher wind speeds and larger negative streamwise momentum fluxes, particularly at the lower measurement level.
There are considerable differences in the turbulence characteristics observed for disturbed conditions. First, streamwise momentum fluxes were much higher for the disturbed conditions, indicating a significantly stronger turbulence and transport of momentum. Second, streamwise momentum fluxes do not frequently change sign between the two measurement levels. In combination with the small vertical flux divergence between the two measurement levels, turbulence data during disturbed conditions indicate that measurements at these heights were conducted within a statically stable layer not much affected by a katabatic jet. We also observed similarities in the turbulence structure between the two different conditions. Similar to katabatic conditions, streamwise momentum fluxes at the lowest measurement level are predominantly negative at the centre line but were fluctuating between negative and positive directions at the margin station. The strong temporal variations in the sign of the streamwise momentum flux at the margin station suggest the presence of an intermittent flow with a wind speed maximum below the height of our turbulence measurements for some time periods. However, no measurements of wind speed profiles at high enough resolution close to the ground are available to test this hypothesis.
3.3 Evolution of air temperature and heat exchange connected to prevailing wind conditions
3.3.1 Mean air temperature, wind velocity, and relative humidity
The focus of this section is on the change in the local thermodynamic characteristics at the glacier, driven by local flow conditions. Figure 7 presents near-surface air temperature and wind velocity anomalies for katabatic- and disturbed-flow conditions measured at stations at the across-glacier transect (TT1, TT2, TT3) and the along-glacier transect (TT4, TT3, WT1).
During katabatic conditions, air temperature anomalies were low, with higher air temperatures along the centre line of the glacier (TT3, TT4) than at the margin stations TT2 and TT1. Stations located approximately at the centre line (TT3, TT4, and WT1) of the glacier featured highest positive wind velocity anomalies during katabatic flows (Fig. 7b).
As soon as the katabatic flow was disturbed by the westerly wind, local wind directions became much more variable (deviations from katabatic-wind direction ranging from 60 to 120∘). The change in wind directions evidenced by all across-glacier transect stations coincided with a significant increase in the near-surface air temperature of several degrees (Fig. 7c) and a decrease in relative humidity of 9 % to 13 % on average (Table 2). Near-surface wind speeds during disturbed conditions were typically close to, or lower than, the daytime average wind speed at all stations (Fig. 7d). The change in air temperatures showed strong spatial differences, with the strongest air temperature rise in the peripheral areas (TT1; +2.1 ∘C) and a significantly smaller temperature rise along the glacier centre line, with +0.8 ∘C at TT3 and only +0.1 ∘C at TT4 (Fig. 7b). Similarly, the drying-out of the near-surface air is stronger in the peripheral zone than at the centre line (Table 2). Local air temperatures at the higher-altitude station TT4 showed the lowest sensitivity to changes in wind direction at TT3, which is reflected by the smallest mean temperature anomaly for disturbed flows (Fig. 7b). Wind direction data at TT4 (not shown) suggest that the katabatic flow persisted at the higher-altitude station TT4 when, at the same time, all transect stations already evidenced a westerly flow. Data thus suggest that the station TT4 was more sheltered from westerly flows than stations located at lower parts of the glacier. Measurements reveal a higher impact of near-surface air warming during westerly flows on stations located in areas close to the glacier margin (TT1, TT2) and at the glacier tongue (WT1) (Fig. 7b).
Note that the wind system often changed between katabatic and disturbed flows within short time periods of a few minutes. During these intermittent conditions, short-term south-westerly flows (defined as katabatic flow direction) showed higher air temperatures than typically observed during persistent katabatic-flow conditions, which were most probably still influenced by the disturbed flow. This might partly explain the larger scatter of air temperatures for the katabatic-flow direction.
The strong sensitivity of the mean air temperature to the presence or the disturbance of an along-glacier katabatic wind indicates that well-developed katabatic winds decouple the local near-surface air temperature at the glacier from the warmer surrounding air. This is well reflected by significantly lower air temperatures during well-developed katabatic flows. Measurements also suggest that the local disturbance by the across-glacier flows promotes the advection of warm air towards the glacier, with the strongest effects at the peripheral zones of the glacier.
Table 2Averaged values of normalized air temperatures and wind velocities and of turbulent vertical heat flux () at stations TT1 and TT3. Correlation coefficients between (1) vertical turbulent heat flux and horizontal heat advection, (2) between vertical turbulent heat flux and the y wind speed component along the transects, and (3) the horizontal heat advection and y wind speed component along the transects. Values are provided for katabatic (in italics) and disturbed conditions and for stations TT1 and TT3.
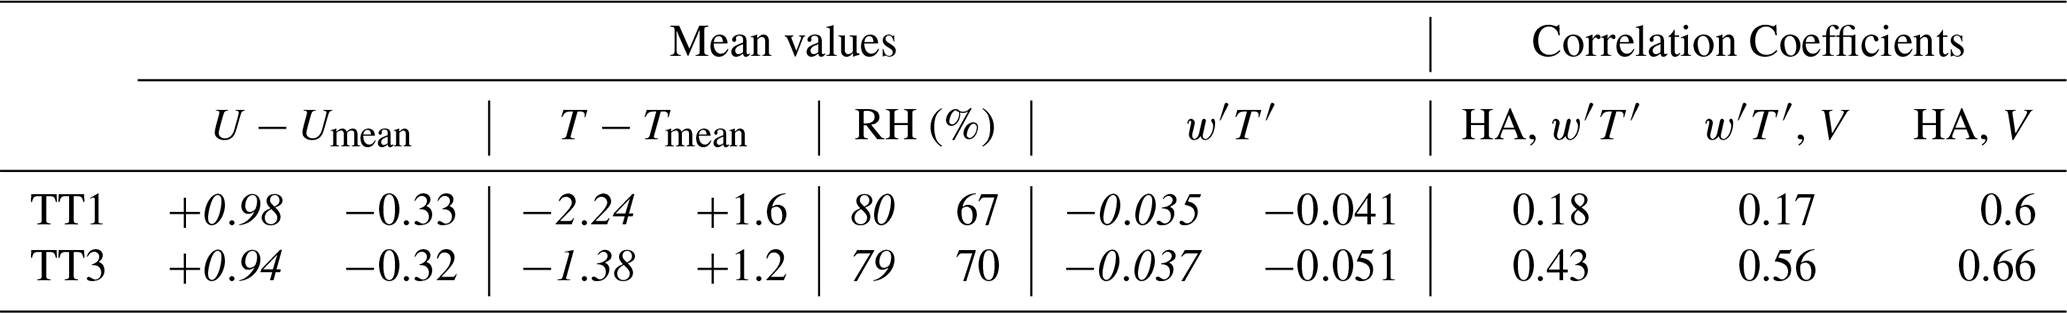
Table 3Correlation coefficient between (1) vertical turbulent heat flux and wind velocity anomalies and (2) between vertical turbulent heat flux and air temperature anomalies. Values are provided for katabatic and disturbed conditions and for stations TT1 and TT3. Values are provided for days d1–d5.

3.3.2 Vertical heat exchange
In order to address how increasing air temperatures during disturbed conditions affect local heat exchange processes, potentially promoting ice melt (Fig. 8a, b), we analysed turbulent sensible-heat fluxes at all three turbulence stations installed at the across-glacier transect (TT1–TT3). In glaciology it is conventional to give heat fluxes in terms of gains and losses with respect to the glacier surface, such that a downward flux, termed negative in atmospheric science, is given as a positive flux in glaciology as it represents an energy contribution to the glacier surface. We are following the convention of atmospheric science, where a negative sensible-heat flux indicates a flux directed towards the glacier surface. As most turbulent flux parameterizations assume a linear relationship between turbulent fluxes and wind speed, we plotted turbulent sensible-heat fluxes against wind velocity and air temperature anomalies measured at stations TT1–TT3 in Fig. 8a–d. Furthermore, the logarithm of stability parameter z∕L is plotted against the sensible-heat flux and wind velocity anomaly for katabatic and disturbed flows in Fig. 8e, f.
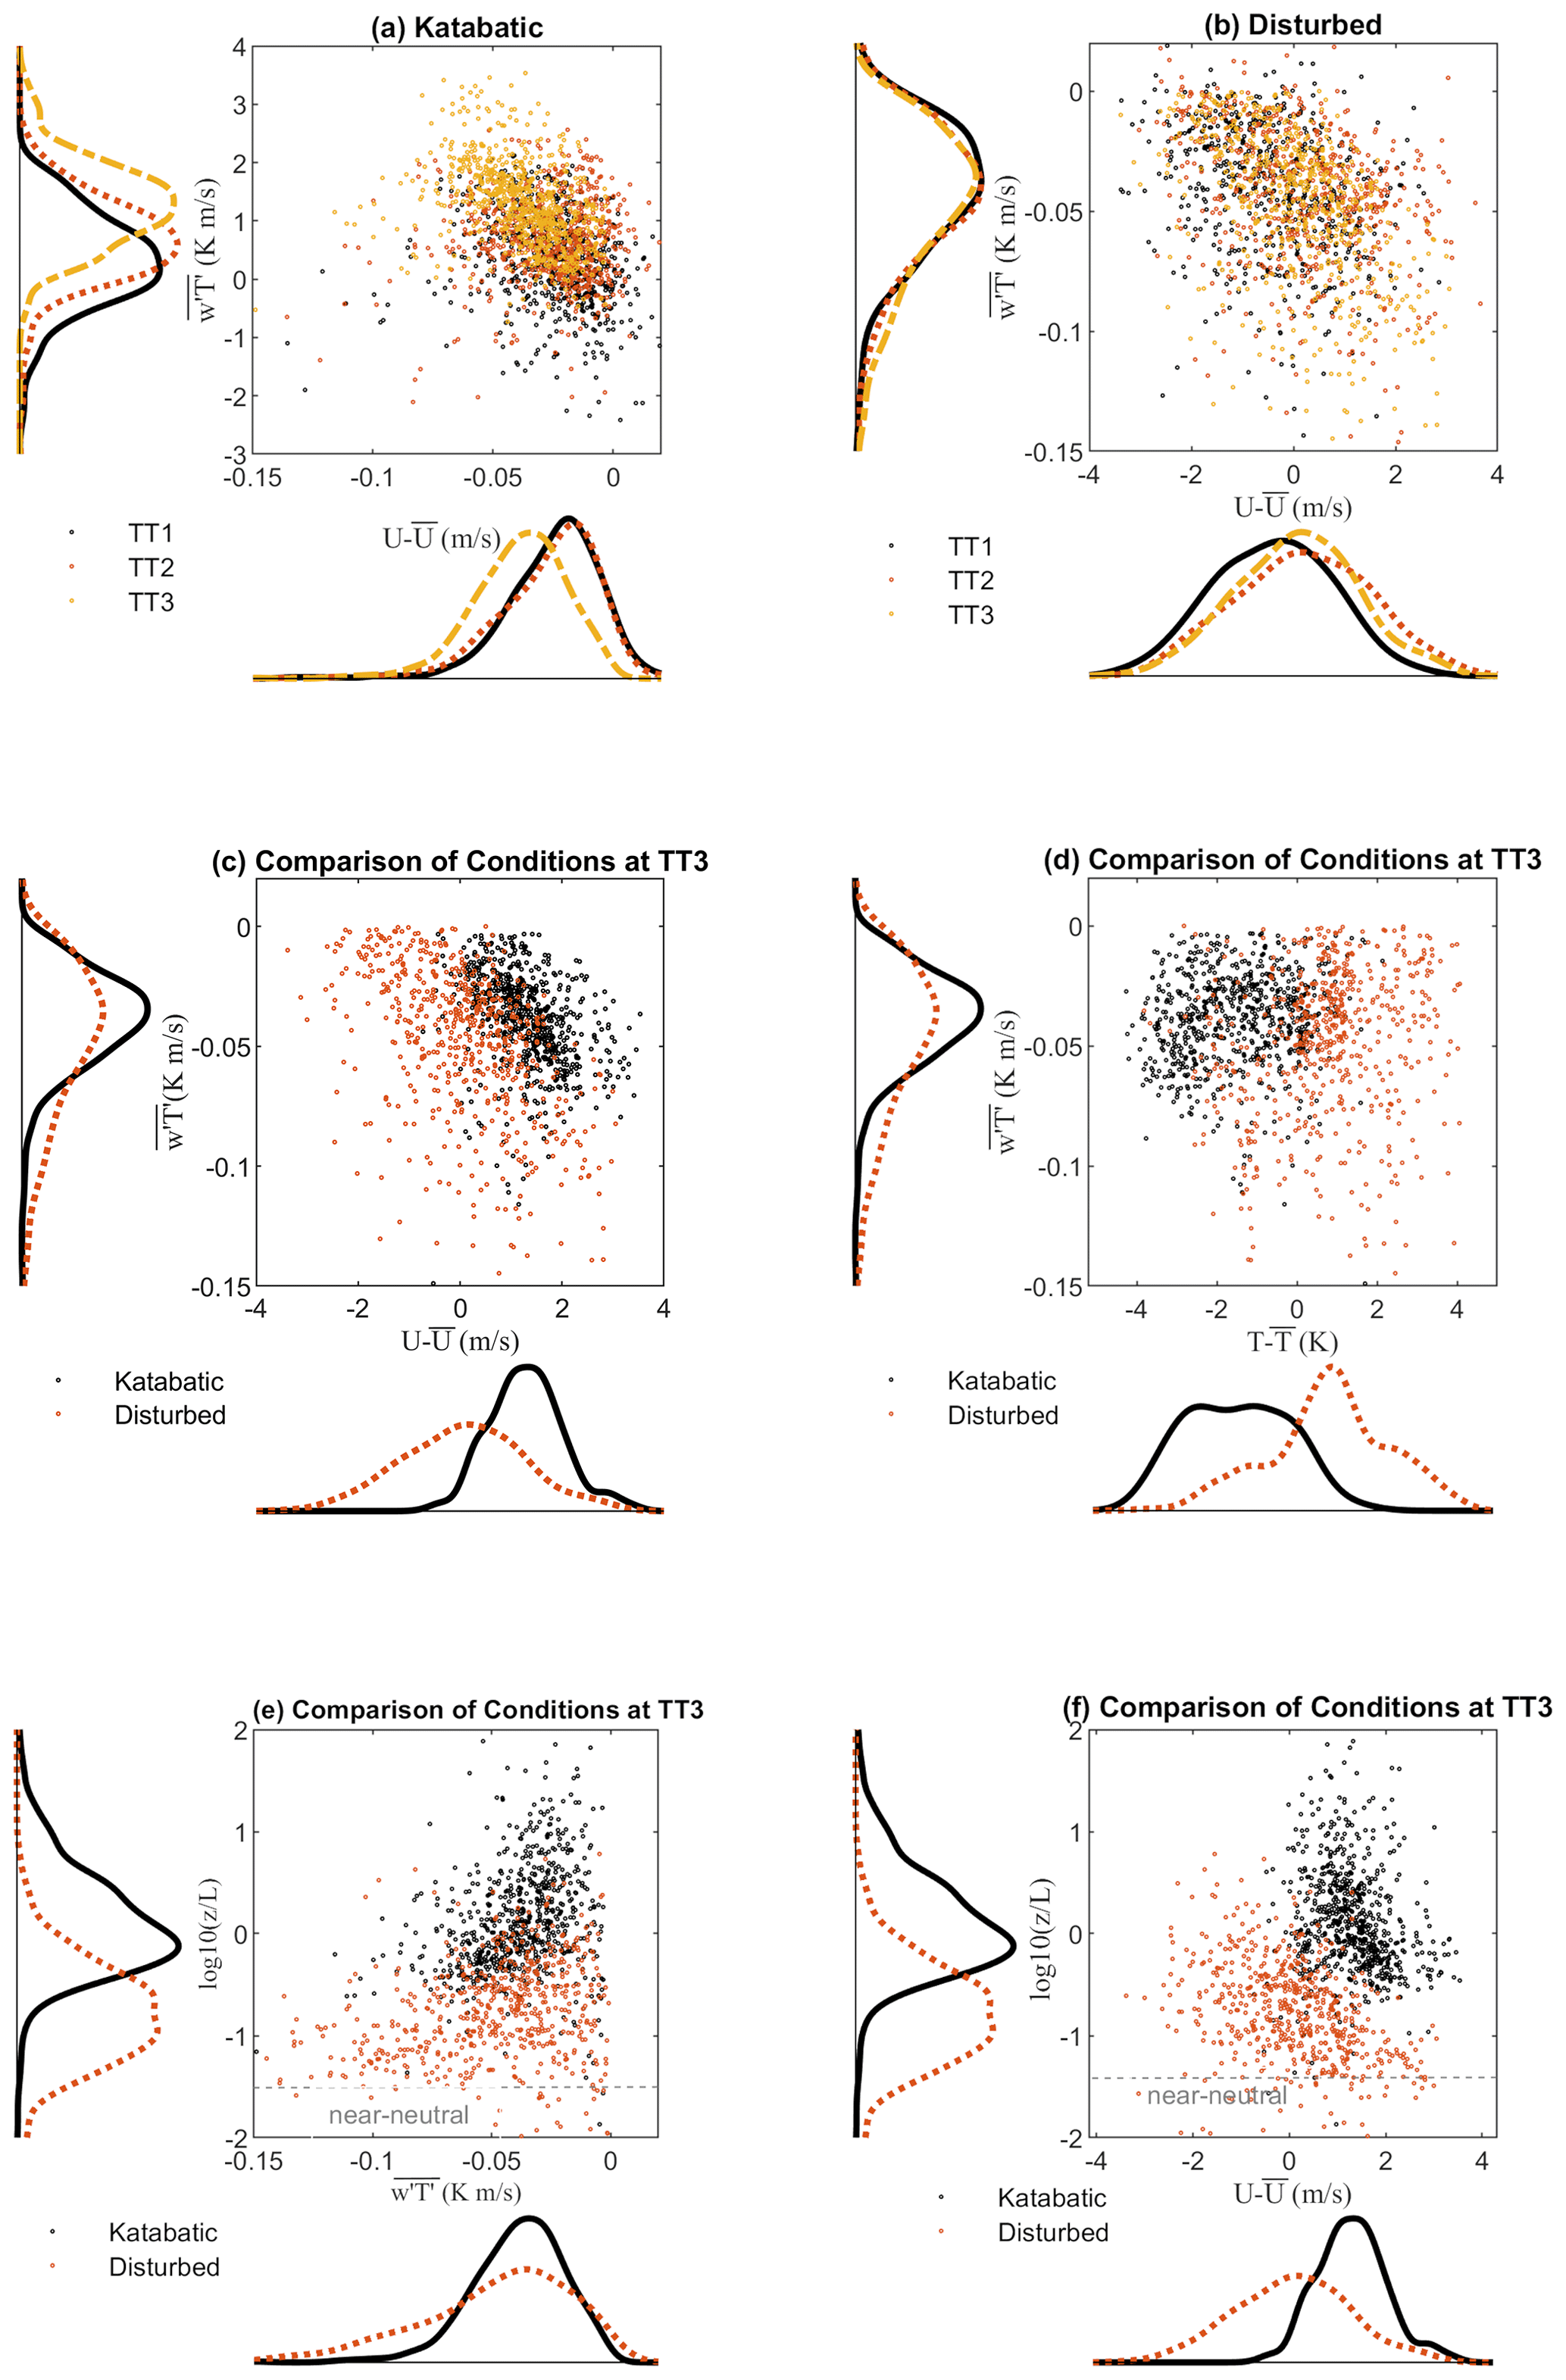
Figure 8Vertical heat flux plotted against anomalies of wind speed from mean daytime wind speed shown for stations TT1–TT3 for katabatic conditions (a) and disturbed conditions (b). Vertical turbulent heat flux plotted against anomalies of wind speed from mean daytime wind speed (c) and against anomalies of air temperature from mean daytime air temperature (d) shown for station TT3 for katabatic and disturbed conditions. Vertical turbulent heat flux (e) and normalized wind speed (f) plotted against the logarithm-of-stability parameter z∕L at TT3 during katabatic and disturbed flows.
Turbulence data reveal higher vertical turbulent sensible-heat fluxes during disturbed (−0.051 K m s−1) than during katabatic conditions (−0.037) (Fig. 8a–d), coinciding with higher air temperatures particularly at the margin station (Fig. 8a, b). With the melting surface of the glacier at 0 ∘C, the increasing near-surface temperature gradients coincided with an increase in downward turbulent heat flux. As already mentioned, near-surface wind speeds during disturbed conditions were typically lower than the daytime average wind speed (Fig. 7). Sensible-heat fluxes, however, show a much higher correlation with the low-level wind speed (correlation coefficient of −0.5 and −0.62 for TT1 and TT3) during disturbed conditions than during katabatic-flow conditions (−0.15 and −0.18 for TT1 and TT2). For disturbed conditions, no correlation between sensible-heat flux and air temperature can be found (−0.001 and 0.16 for TT1 and TT3). There are some situations when katabatic conditions coincided with higher air temperatures. Most of those situations, however, also coincided with negative wind velocity anomalies. This again indicates that these individual katabatic-flow conditions with high air temperatures can be rather characterized as intermittent flows than well-developed katabatic flows as discussed above.
During disturbed conditions turbulence data showed small spatial differences in turbulent heat exchange at the across-glacier transect (Fig. 8b). Fluxes are similar for all transect stations despite significantly higher air temperature anomalies observed at TT1 than at TT3 (+1.8 ∘ C for TT1 and +1.2 ∘C for TT3; Fig. 7). While air temperatures were lower at TT3 than at TT1, higher wind velocities at the centre line appeared to promote heat exchange there (Fig. 9b). This is also confirmed by statistics shown in Table 3. At the central station, wind shows higher correlations with turbulent heat fluxes than at the margin station.
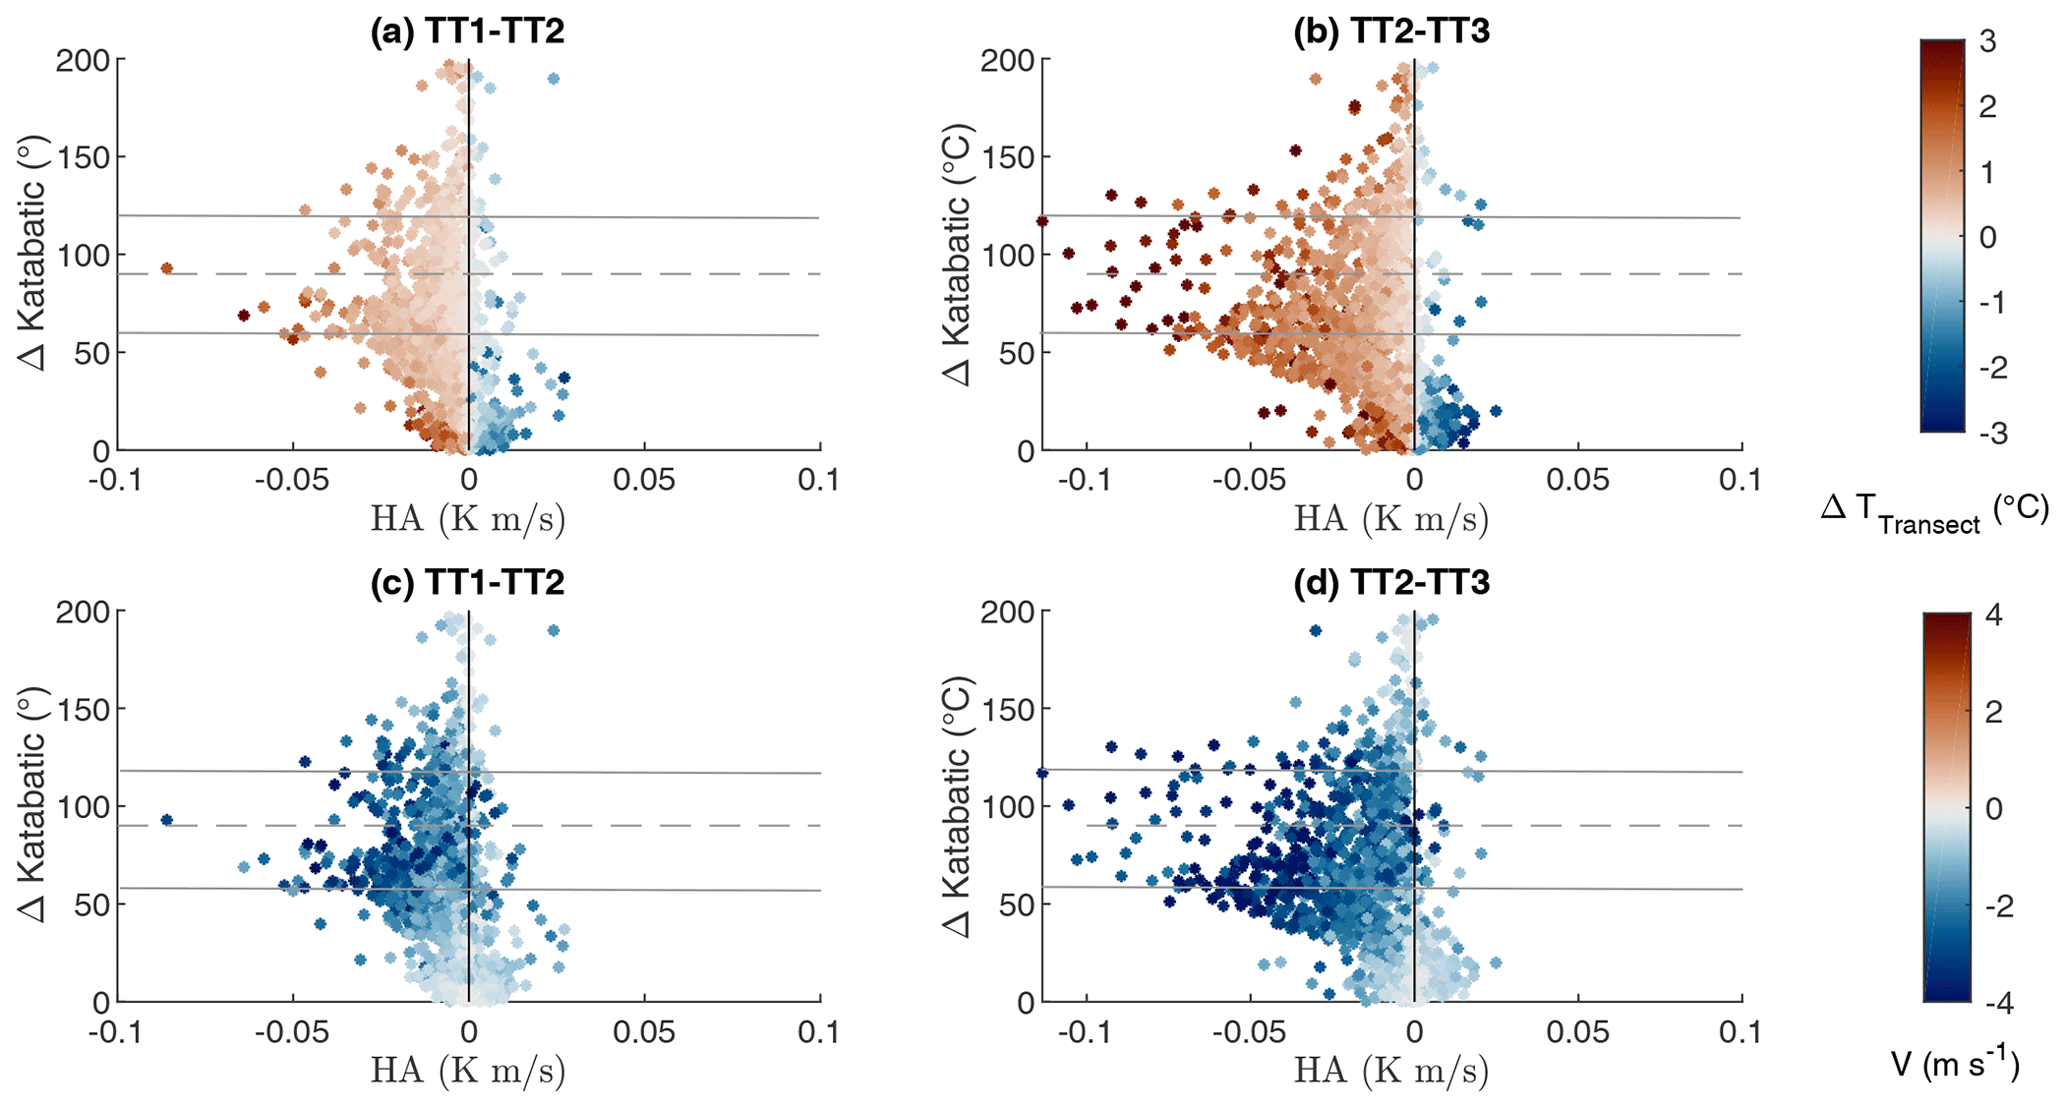
Figure 9Horizontal advection of heat (HA) calculated between stations TT1 and TT2 (a) and TT2 and TT3 (b) from the first level above ground is plotted against the deviation from katabatic-wind direction for 5 selected days with periods of clear deviation from the dominant katabatic-flow direction. Colour codes indicate the measured air temperature difference between stations TT1 and TT2 and TT2 and TT3 (a, b) and the wind velocity component along the transect V (wind speed component along the transect) (c, d). Note that all data (katabatic and disturbed flows) are shown here. Positive values of air temperature difference indicate higher air temperatures at the station closer to the glacier margin. Negative wind velocity components indicate wind from station TT1 to TT3. The dashed line indicates the deviation of the wind direction 90∘ from the dominant katabatic flow, which is the orientation of the transect. The solid lines indicate the 60∘ wind sector that the following heat advection analysis for disturbed conditions is based on.
The stability parameter z∕L shows much higher stability for katabatic-flow conditions than for disturbed conditions, when z∕L is often close to neutral (Fig. 8e, f). The magnitude of the vertical turbulent heat fluxes tends to increase with weaker stability (i.e. during disturbed flows that are more near-neutrally stratified).
3.3.3 Lateral heat advection
Measurements of air temperatures suggested a strong influence of warm-air advection during north-westerly flows, disturbing the katabatic flow at the glacier and forming an across-glacier flow. In a next step we quantify the horizontal warm-air advection (HA) for across-glacier flow conditions. A transect consisting of three stations was aligned in a north-westerly orientation, allowing the calculation of HA between neighbouring stations during across-glacier flows. Figure 9 illustrates the deviation of the flow from the dominant katabatic-flow direction plotted against advection of heat. The colour of each data point indicates air temperature differences between neighbouring stations TT1–TT2 and TT2–TT3 (Fig. 10a, b) and the mean V component in the direction of the transect (Fig. 9c, d). Positive horizontal differences in air temperature result from warmer air temperatures at the margin stations and a decrease towards the centre line. We defined a negative V component along the transect directing from TT1 to TT3 (Fig. 9c, d). Thus, a negative advective heat flux indicates the advection of warm air from the peripheral zones of the glacier towards the glacier centre line (positive air temperature differences and negative V component). Positive values of heat advection correspond to conditions when colder air was advected along the TT1–TT3 transect (negative V component and negative temperature gradient). Conditions with a positive V component along the transect were excluded from this analysis as these were conditions when wind direction was east to south-east. For these situations the transect was not properly aligned.
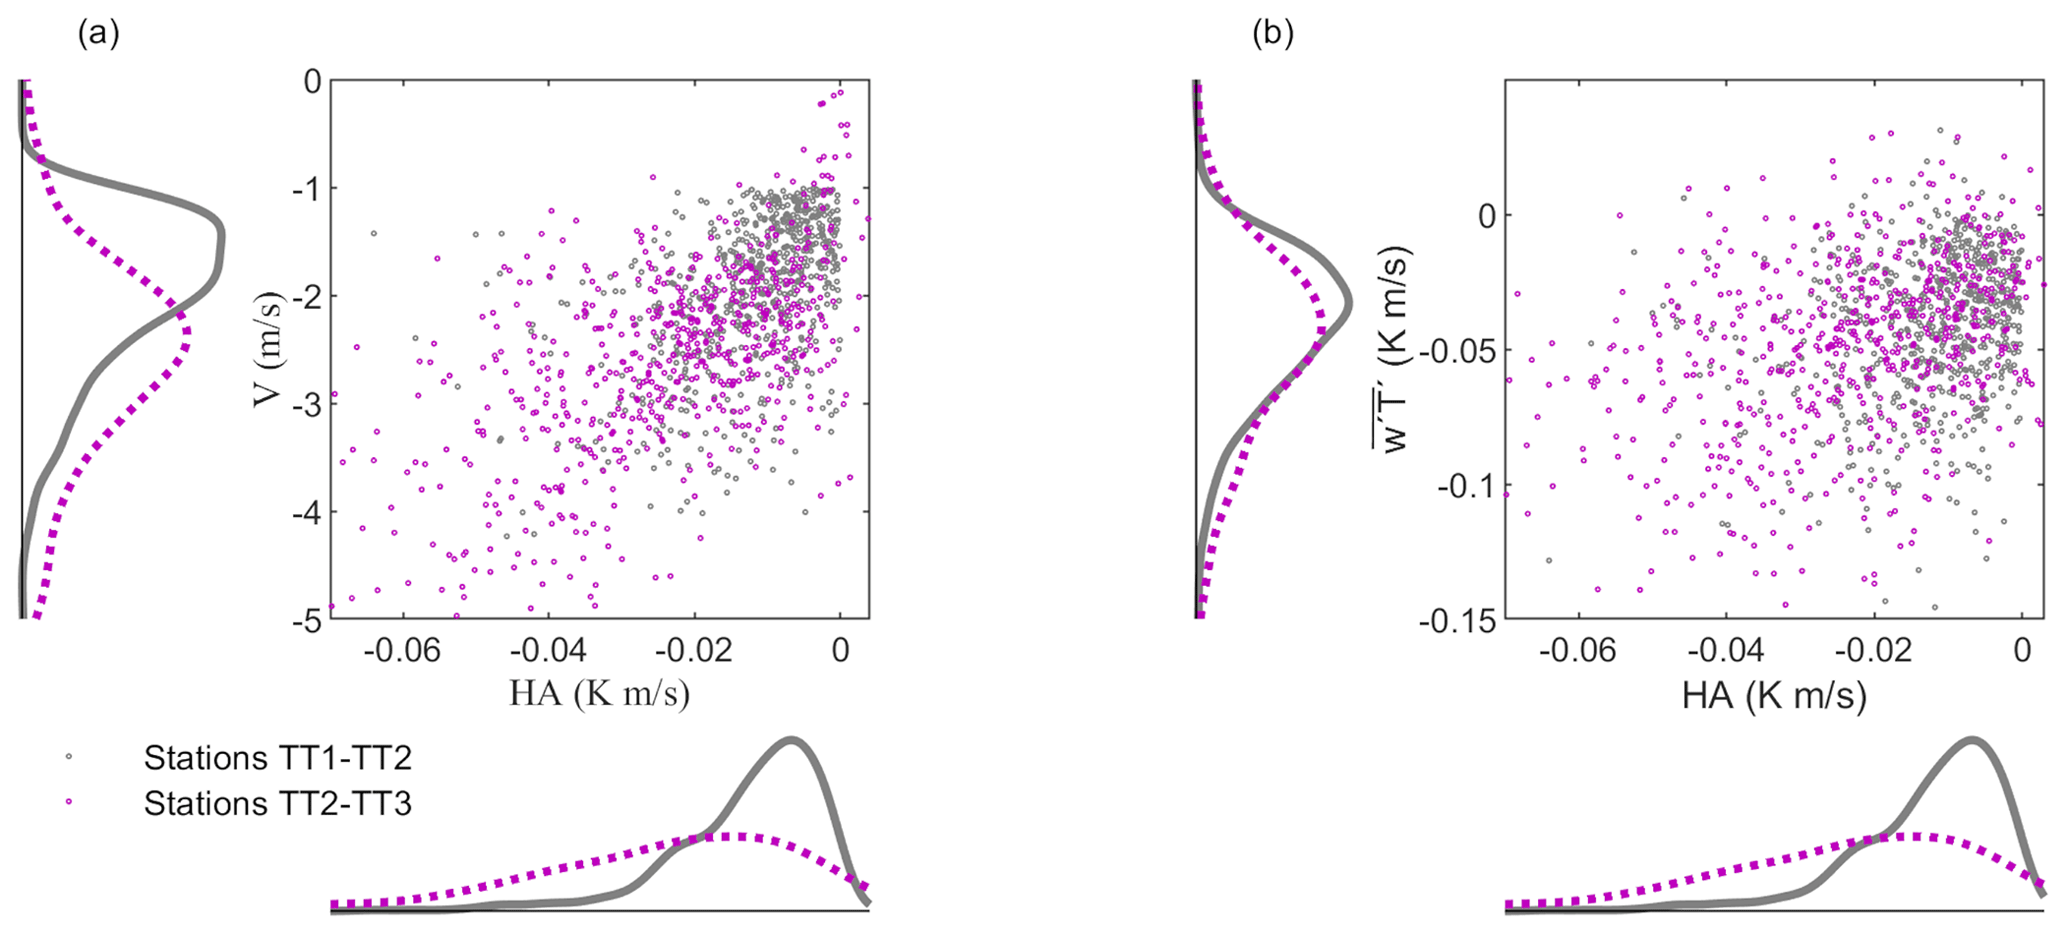
Figure 10Horizontal advection of heat (HA) between stations TT1 and TT2 and TT2 and TT3 plotted against the measured wind speed component along the transect V (a) and turbulent vertical heat flux (b) for disturbed conditions. Note that for this analysis we considered only data with evidence of horizontal heat advection along the transect (U component along the transect larger than 1 m s−1 and positive air temperature differences).
Strong positive horizontal air temperature gradients along the transects occurred for westerly to north-westerly winds (60–90∘ deviation from katabatic). Horizontal heat advection HA increased with temperature differences and V component along the transect line and increased from the peripheral stations towards the centre line station TT3. Therefore, peak HA at the centre line can be explained by the stronger temperature difference between the middle and the central station (TT2 and TT3) than between the two more peripheral stations. Furthermore, the strongest temperature differences between all stations concurred with peak V components in the direction of the transect of more than 4 m s−1. These V components increased towards the centre line. In contrast, the small V components at the peripheral station TT1 indicates that the margin stations are more sheltered from the synoptic westerly wind than the station at the centre line.
Negative air temperature gradients (colder air temperatures at the peripheral areas; blue colours) were only measured during short time intervals. For some cases, weak warm- and cold-air advection occurred during intermittent flow conditions (changing between south-westerly and north-westerly flow directions within a short time) but with much smaller wind velocities than observed during well-developed katabatic-flow conditions.
We are interested in the efficiency of the horizontal heat transport to warm near-surface air layers and thus to indirectly promote turbulent heat exchange towards the ice surface, contributing to the surface energy balance. We therefore analysed the relationship between horizontal heat advection HA (TT1–TT2 and TT2–TT3), the vertical turbulent heat flux, and the V component along the transect, illustrated in Fig. 10. Additionally, the correlation coefficient R between those variables is provided in Table 2. Note that for this analysis we considered only data for the 60∘ wind sector (see methods, disturbed conditions). Consistent with small correlations between air temperature and , correlations between HA and are rather small for all stations. The highest correlation was found at TT3 (0.43). Peak vertical turbulent heat fluxes coincided with peak V component at the centre line. Correlation coefficients were higher between TT2 and TT3 (0.56). Turbulent heat fluxes showed slightly smaller mean values at TT1, coinciding with significantly smaller wind speeds (Fig. 9b). Furthermore, the correlation between wind speed and vertical turbulent heat flux at the peripheral station was smaller (−0.5) than at the centre line (−0.62). Thus, at the centre line (TT3), strong winds promote not only stronger heat advection (; Table 2, Fig. 11a) but also maximum downward turbulent heat exchange (Fig. 11b). Heat advection appears to enhance turbulent heat exchange towards the glacier surface by enhancing near-surface temperature gradients. At the same time, atmospheric stability during disturbed conditions tended to be smaller for high-wind-velocity situations (although the scatter of the data is large), favouring stronger turbulent heat exchange. Consequently, at the glacier centre line (TT3), stronger winds enhanced both the heat advection and the turbulent heat exchange.

Figure 11Vertical flux divergence plotted against streamwise momentum flux for stations TT1, TT2, and TT3 is shown for katabatic (a) and disturbed conditions (b). To allow a better comparison of fluxes during different flow conditions, the vertical flux divergence (vFD) is plotted against streamwise momentum flux (c) and against vertical turbulent heat flux (d) for station TT3 for katabatic and disturbed flow.
In the presence of katabatic winds, similarity-based scaling parameterizations used to link the surface energy balance to the flow or the estimation of surface turbulent fluxes from turbulence measurements are not valid (Nadeau et al., 2013; Oldroyd et al., 2014; Grachev et al., 2016). This is because the jet height imposes a strong control on the turbulent structure of the katabatic flow (e.g. Denby and Smeets, 2000; Stiperski et al., 2020) so that turbulent fluxes in katabatic flows vary strongly with height as a function of the jet height location. Therefore, an estimation of the contribution of turbulent fluxes to the energy balance at the glacier surface is challenging, and inferring turbulent surface fluxes from measured fluxes at a certain height will lead to strongly biased surface energy balance calculations. Analysis of streamwise momentum flux profiles during katabatic and disturbed conditions showed that in the presence of a low-level wind jet, turbulent fluxes typically have their local minimum at the jet height and increase below the jet height in line with strong vertical gradients there (Figs. 4, 6). Thus, the magnitude of measured turbulent fluxes strongly depends on the measurement location relative to the jet height. A more detailed analysis on the existence of a jet during the disturbed conditions is needed to assess the effect of heat advection during prevailing westerly flows on the heat exchange towards the glacier surface. Figure 11 shows the streamwise momentum flux as a function of the vertical sensible-heat-flux divergence (vFD) at the across-glacier transect stations TT1, TT2, and TT3 for katabatic and disturbed conditions. Vertical flux divergence was calculated between the two measurement levels. Positive momentum fluxes are a sign of decreasing wind speed with height, suggesting the presence of a local wind speed maximum below the respective measurement height, while negative momentum fluxes suggest that measurements are within a layer with increasing wind speed with height (see also Fig. 4). Katabatic flows typically coincide with strong vertical flux divergences due to strong gradients in wind velocity and air temperature. While these high vertical flux divergences are typically observed in layers where wind speeds strongly increase with height, very small vertical divergences might indicate either a constant flux layer in the absence of a low-level jet (negative momentum flux) or that measurements are conducted close to or above the location of the wind speed maximum (small or positive momentum fluxes) or that strong stability is responsible for strong turbulence suppression (Stiperski et al., 2020).
We are interested not only in changes in the turbulent structure when changing from katabatic to disturbed conditions but also in the effect of heat advection on the turbulent heat fluxes. Turbulence data of katabatic and disturbed conditions reveal some similarities along the transect stations but also pronounced differences between the different flow conditions (Fig. 11a, b). First, the three transect stations show a similar spatial pattern for both conditions with an increase in the vertical turbulent heat flux (Fig. 9a, b) and heat flux divergence (Fig. 12a, b) from the margin station towards the central station. Second, for both katabatic and disturbed conditions, the transect stations show a spatial gradient from more frequently measured positive and small momentum fluxes at the margin to larger and more frequently measured negative momentum fluxes at the central station (Fig. 11a, b). However, the increase in magnitude of momentum flux and vertical flux divergence for disturbed conditions is much more pronounced than the spatial gradient in these properties along the transect.
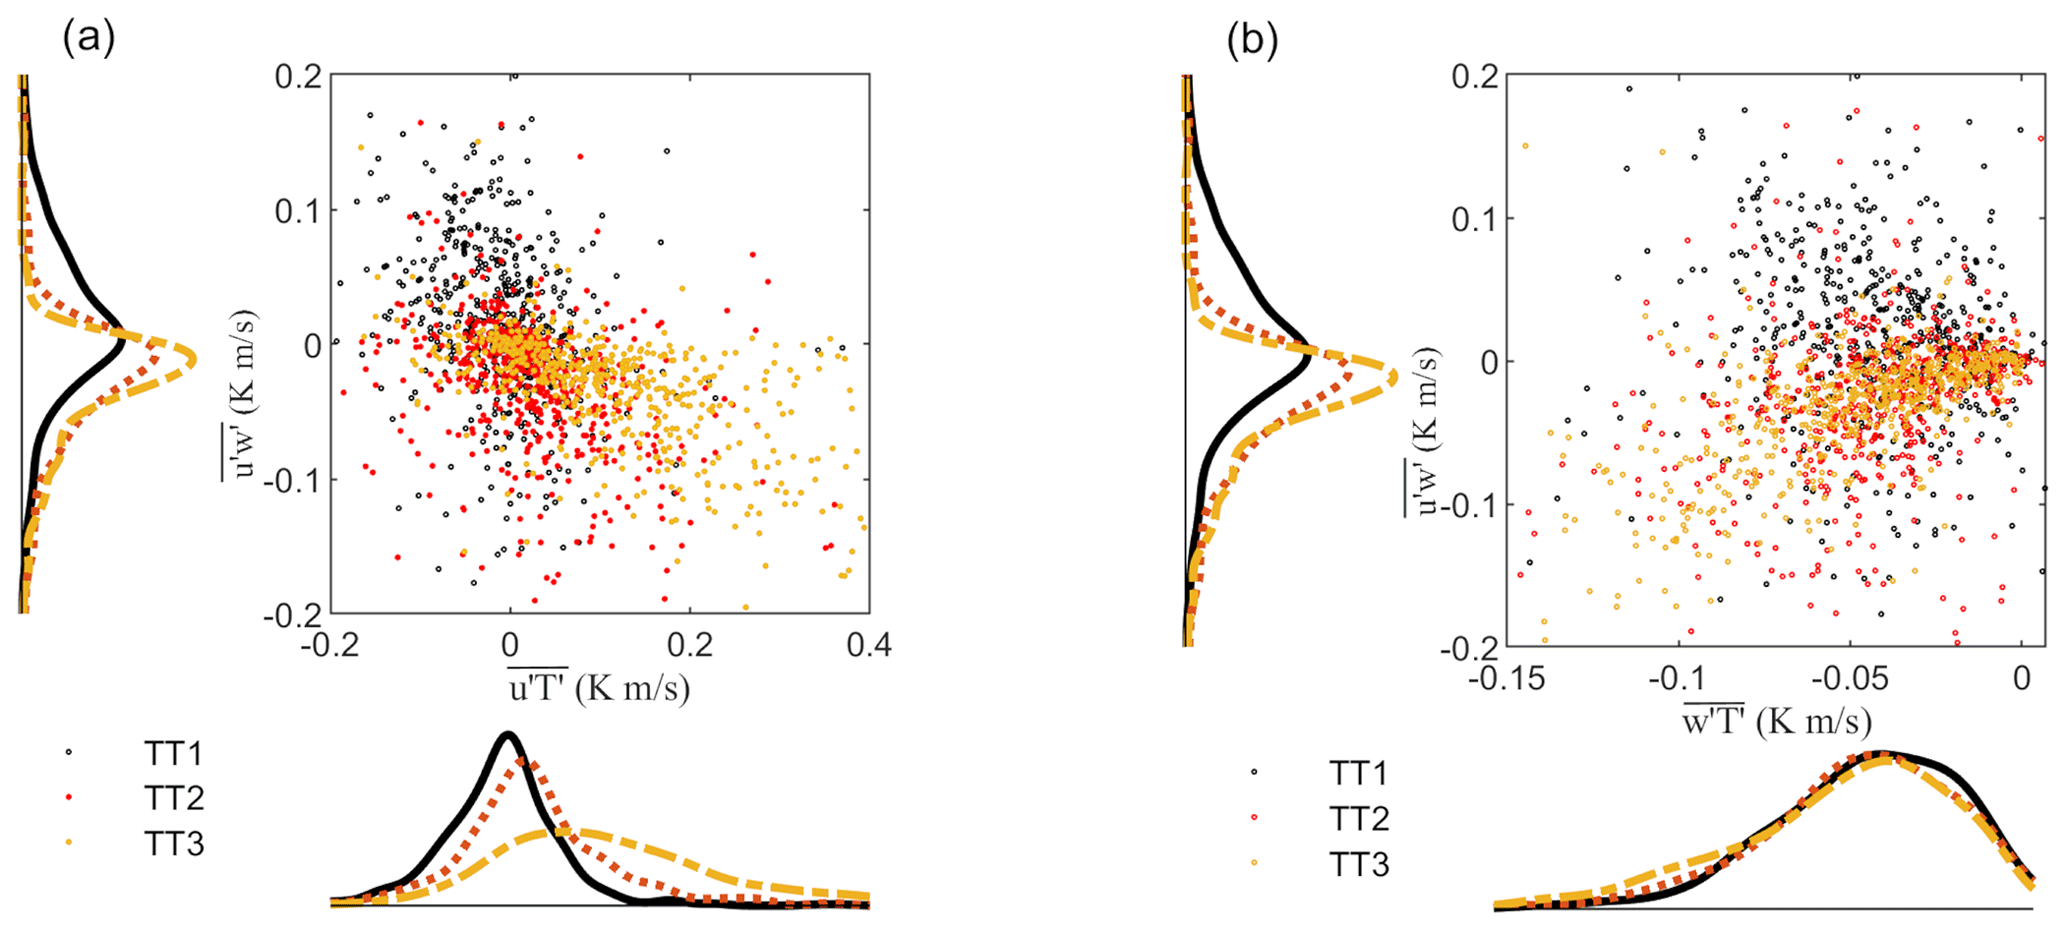
Figure 12Streamwise horizontal turbulent heat flux plotted against streamwise momentum flux for stations TT1, TT2, and TT3 (a). Vertical turbulent heat flux plotted against streamwise momentum flux for stations TT1, TT2, and TT3 (b). Data are only shown for disturbed conditions and the 60∘ wind sector from 260 to 320∘.
In order to assess the effect of heat advection on the heat exchange processes during disturbed conditions, we focus our analysis on flow characteristics during those conditions (Figs. 10, 12, 13). During westerly flow conditions turbulence data at the centre line of the glacier (TT3) show a strong increase in downward vertical sensible-heat fluxes with increasing downward momentum fluxes (negative values) (Fig. 13b). The strongest vertical turbulent heat fluxes coincided with peak vertical heat divergence (Fig. 11d). At the more wind-exposed centre line negative momentum fluxes and positive streamwise turbulent heat fluxes (Fig. 12a) and the strong vertical and horizontal heat flux divergence (Figs. 11b, 13) indicate that no pronounced katabatic jet is present below the lowest measurement level and that measurements were conducted within a stable atmospheric layer with increasing wind velocities with height featuring strong flux gradients close to the surface. While the vertical flux divergence increases towards the centre line, the horizontal flux divergence is similar between all stations and is smaller than the vertical flux divergence (Fig. 13). Strong turbulent momentum and sensible-heat fluxes (Fig. 12b) combined with strong vertical flux divergence at TT3 (Fig. 11) suggest very efficient turbulence transfer towards the surface in case of advection.
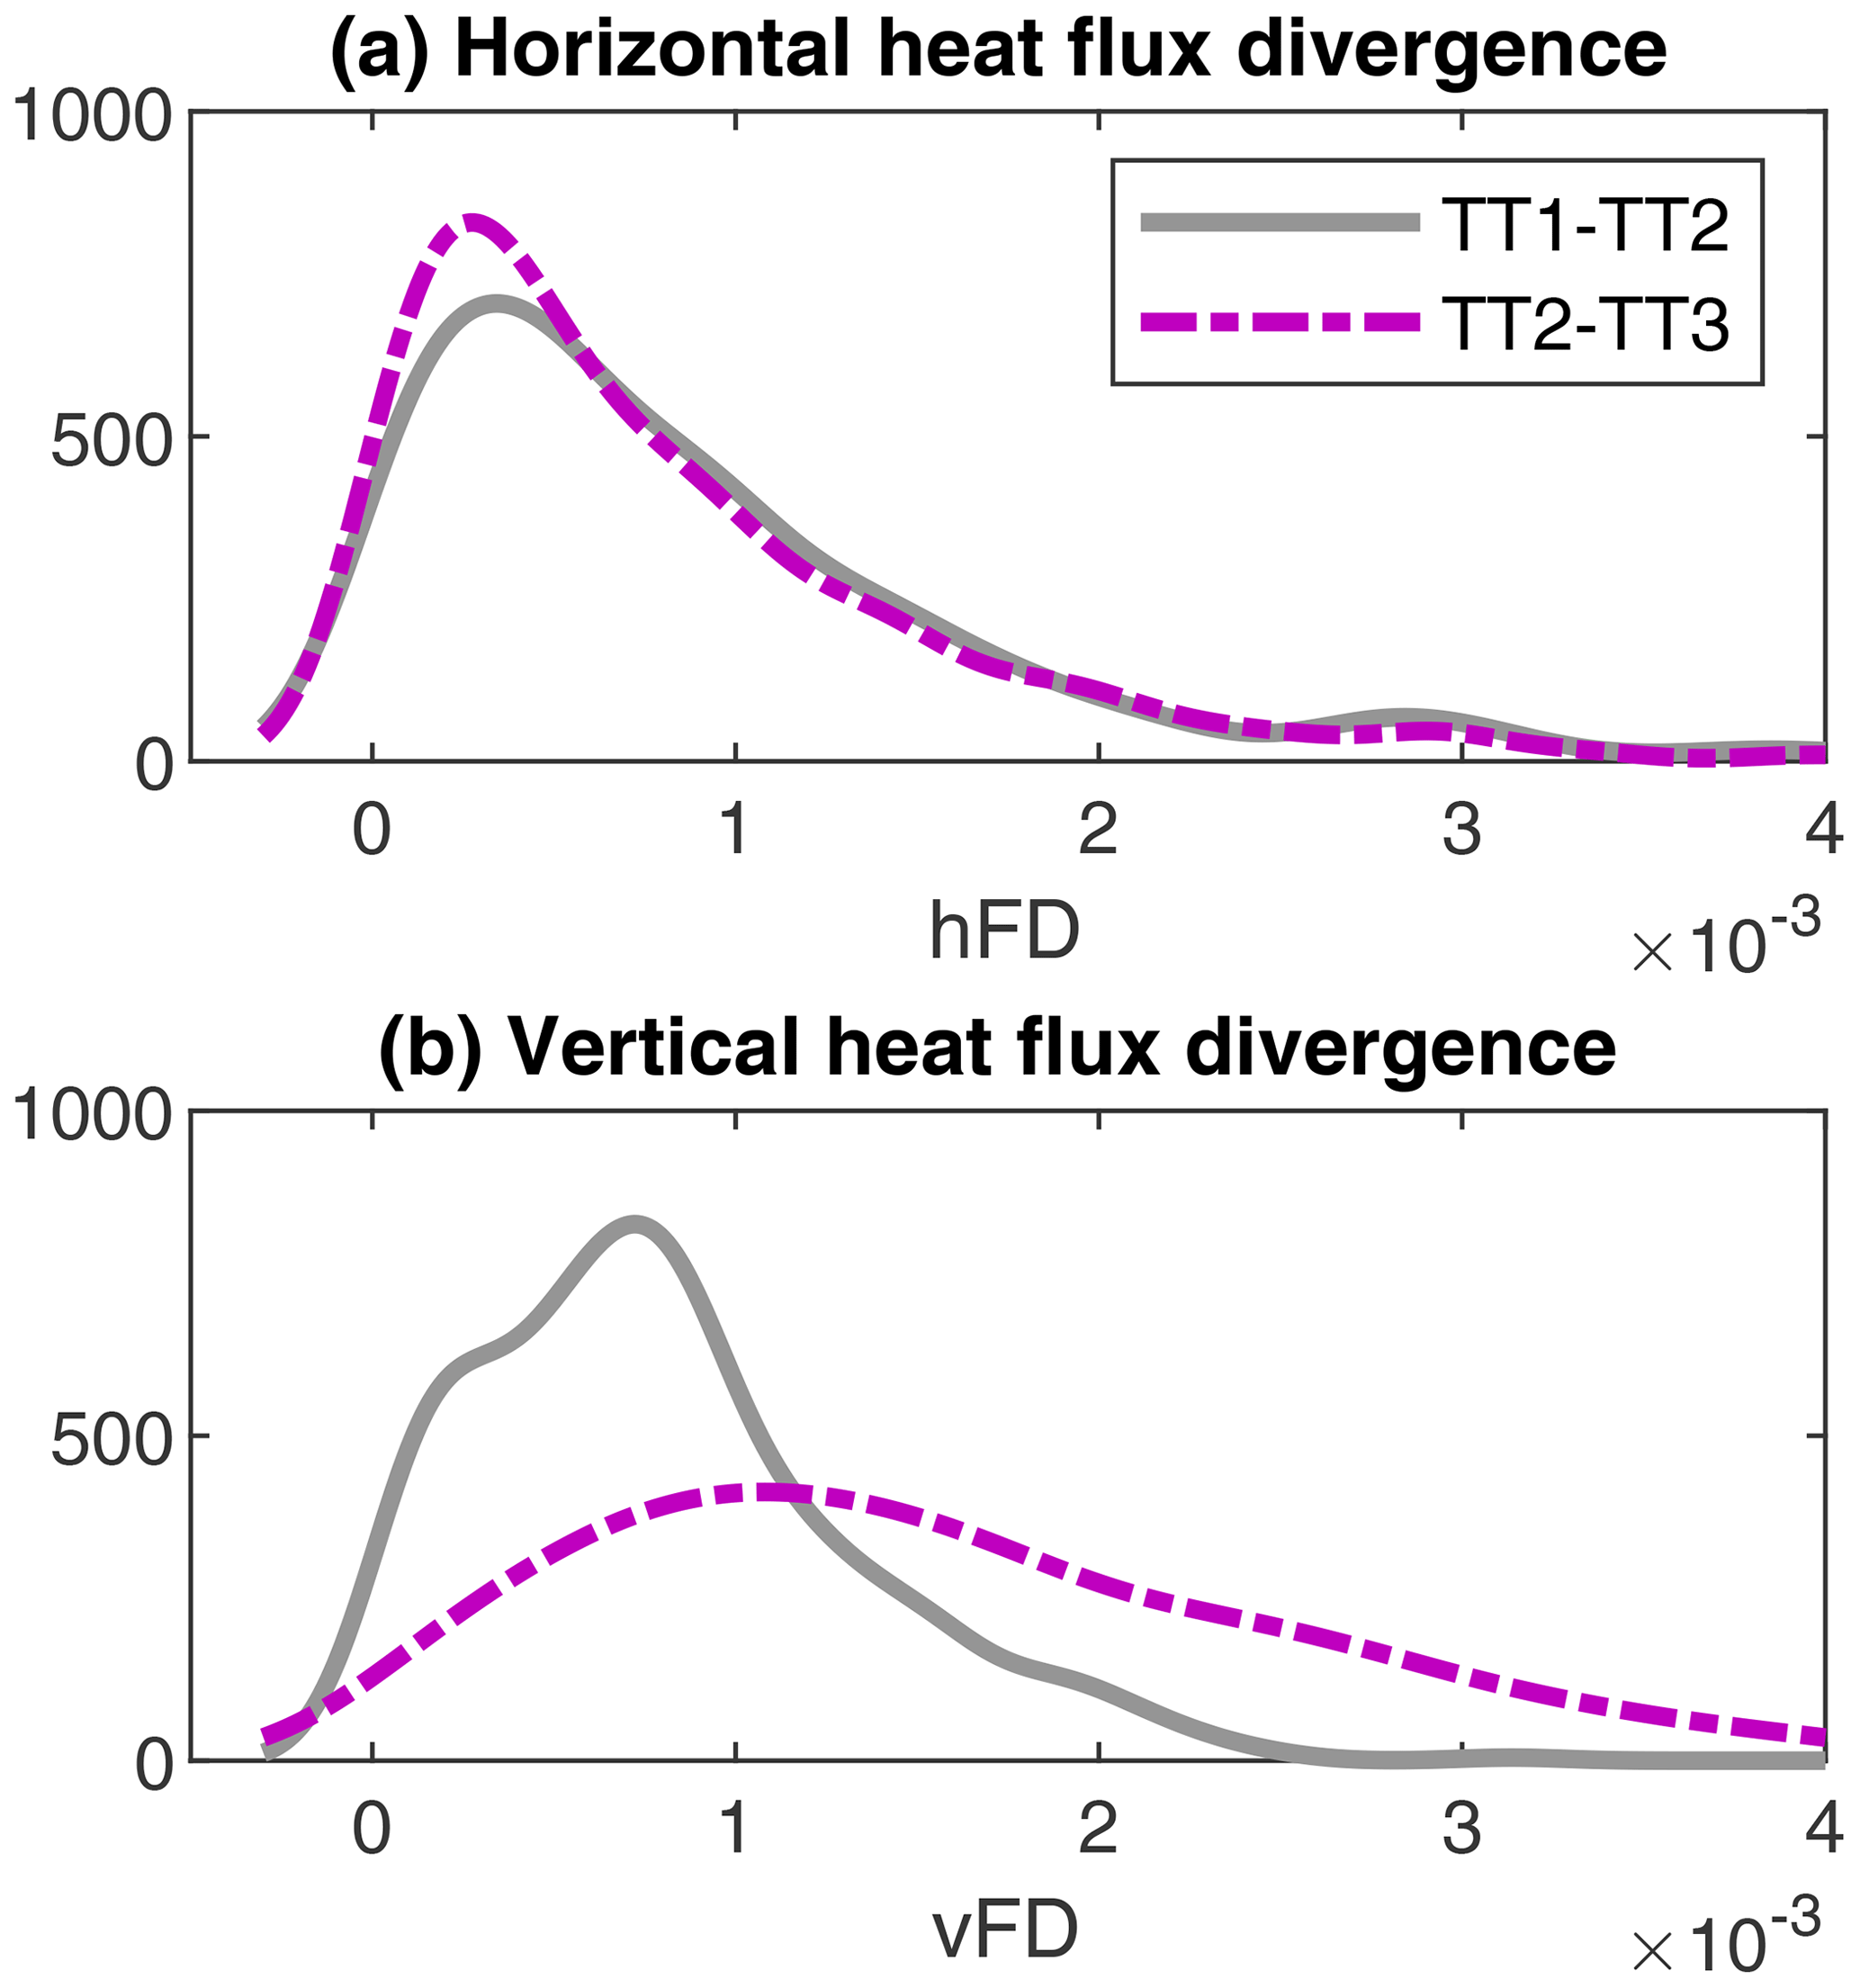
Figure 13Kernel distribution of streamwise horizontal (hDF) and vertical (vDF) heat flux divergence shown only for disturbed conditions and the 60∘ wind sector (260–320∘).
In contrast to the centre line stations, momentum fluxes measured at the more peripheral stations TT2 and TT1 show a trend towards a higher frequency of positive momentum fluxes and negative streamwise turbulent heat fluxes with decreasing distance to the glacier margin (Figs. 11b, 12a). While the mid-transect station TT2 evidences predominantly negative momentum fluxes with a considerably smaller flux divergence and smaller turbulent heat fluxes than observed at the centre line (Fig. 11b), the peripheral station TT1 predominantly shows positive momentum fluxes, suggesting that the lower measurement level was already located above a low-level jet or close to the jet height, which typically features a local flux minimum and small flux gradient. These positive momentum fluxes measured at TT1 coincided with smaller peak turbulent heat fluxes and heat flux divergence than measured at TT3 at the same time. This supports conclusions of Grachev et al. (2016) that turbulent fluxes in the layer below the wind speed maximum vary with height more rapidly than in the layer above the katabatic jet.
The more frequently measured positive streamwise momentum fluxes at TT1 and strongly negative momentum fluxes at TT2 and TT3 suggest that the flow at the centre line is more developed than the flow at the margin. Also, lower-level measurements at TT3 revealed significantly higher fluxes than at the peripheral stations, where measurements are supposed to be conducted above a very shallow low-level jet. Therefore, the strong increase in the wind speed component towards the centre line (Fig. 8a, b) and the potential formation of a very low-level jet height at the margin stations (TT1) suggest strong differences between the flow development at the centre line and in the peripheral zone of the glacier. One possible explanation for the occurrence of the low-level jet at TT1 is the formation of a shallow stable internal boundary layer (SIBL) at the peripheral areas of the glacier when the warm air crosses the peripheral area of the glacier induced by the step of surface characteristics between ice-free surroundings and the glacier (Mott et al., 2015). SIBLs favour the formation of very low-level jets (Mott et al., 2015) as the high static stabilities of SIBLs over ice are associated with reduced wind velocities near the ground. Above the shallow SIBL the flow field is characteristic of the upstream conditions despite the detachment of the larger-scale flow from the snow surface and its displacement to higher atmospheric levels. An alternative explanation might be that the stronger sheltering of the peripheral areas to the strong westerly winds allowed the preservations of a very shallow katabatic flow (below 1.7 m above ground) close to the glacier surface, which is not captured by measurement sensors above. Furthermore, wind and turbulence characteristics also infer a much stronger exposure of the central station to the across-glacier wind than the more sheltered margin station. Stronger exposure at the central line might allow a stronger disturbance of the katabatic flow. This is in contrast to earlier numerical results of Sauter and Galos (2016), who suggested that well-developed katabatic flows at the centre line of glaciers prevent warm-air advection from the surroundings. This conclusion seems not to be valid for synoptic winds strong enough to disturb the katabatic flow along the centre line.
The topographic setting of alpine glaciers is likely to play a significant role in sheltering sites closest to the glacier margin. Steep moraine sides and sharp slope transitions at the glacier margin strongly affect the local boundary layer flow (i.e. lee-side flow separation), reducing the ability of the flow hitting the glacier edge to influence the stable glacier boundary layer. In contrast, well-developed flows at the glacier line and associated higher wind speeds appear to promote turbulent mixing close to the surface, allowing the rush-in of high-speed fluid from the outer region into the near-surface atmospheric layer, as shown by Mott et al. (2016) for a wind tunnel experiment with warm-air advection over a melting snow surface.
Turbulence measurements thus highlight the strong consequences of the development of across-glacier flows for the energy balance at the glacier surface, although a thorough analysis of the origin of this flow requires a numerical modelling approach. The increasing wind velocity towards the centre line of the glacier promotes efficient heat exchange towards the glacier surface. Furthermore, measurements confirm that vertical heat fluxes measured below the jet height or in absence of the latter are significantly higher than measured at the jet height or just above, where fluxes typically show their minimum. Turbulence in the layer above the wind speed maximum, as observed at the margin of the glacier, is largely decoupled from the flow below and the underlying surface. Turbulence measured above the katabatic jet is thus no longer connected with the surface (Denby, 1999; Grachev et al., 2016; Mott et al., 2016). In case of the presence of an across-glacier flow, the very low-level wind speed maximum that potentially exists at the margin areas of the glacier might thus prevent heat exchange towards the glacier surface, partly decoupling the warmer air aloft, whereas the higher low-level wind velocities at the more wind-exposed centre line and the associated increase in turbulence close to the surface might promote heat exchange towards the glacier surface and ice melt there.
This study presents a unique set of turbulence data measured at a mid-latitude mountain glacier (Hintereisferner, Austria) evidencing a frequent disruption of down-glacier flow during typical midsummer conditions. The experiment was designed to capture near-surface airflow dynamics and associated turbulent-exchange processes at an along- and across-glacier transect. The high-density network of five meteorological stations and eight turbulence sensors allowed us to investigate governing micrometeorological heat exchange processes close to the glacier surface during both katabatically and non-katabatically dominated atmospheric flow conditions.
Measurements highlight the complex dynamics of boundary layer flows over a mountain glacier, which strongly affect the local meteorology and glacier–atmosphere exchanges, with vertical profiles of wind speed and turbulent fluxes varying strongly for different flow conditions. We measured persistent low-level katabatic flows during daytime driving consistently cold air temperatures close to the glacier surface with small spatial differences along the glacier. The across-glacier transect of stations showed katabatic-jet maximum height and wind velocity maxima decreasing from the centre line towards the glacier margin. Turbulent heat exchange was especially driven by stronger wind velocities at the glacier centre line.
The measurement days analysed showed a disturbance of the well-developed glacier wind by the evolution of an across-glacier flow. These predominantly westerly to north-westerly flows measured at the glacier were associated with strong advection of heat with the larger-scale flow. The horizontal heat advection was indicated by a significant rise in the near-surface air temperature, which was greatest at the glacier margin. Local turbulence profiles of momentum and heat revealed strong heat advection from the glacier margin towards the glacier centre line. The strongest horizontal advection of heat was promoted by large horizontal gradients of air temperature along the transect, coinciding with maximum heat exchange towards the glacier surface. The evolution of the across-glacier flow also coincided with an increasing turbulence from the peripheral zone towards the centre line. Turbulence measured along the across-glacier transect suggested different flow characteristics during disturbed conditions between the peripheral zone and the centre line of the glacier. Profiles of momentum inferred a very low-level wind speed maximum below the lowest measurement level at the margin station, potentially suppressing the heat exchange from the higher atmospheric layers towards the glacier surface. In contrast, at the centre line of the glacier, turbulence profiles suggested well-developed flow with high wind velocities promoting strong turbulence close to the glacier surface.
At the peripheral area of the glacier, weaker exposure to the westerly winds might promote the preservation of a very shallow low-level jet which potentially decouples near-surface turbulence from higher atmospheric levels (Parmhed et al., 2004). Although no wind direction measurements are available at heights below 1.7 m, positive streamwise momentum fluxes at the lowest measurement height indicate the existence of such a shallow low-level jet height, which might be connected to a glacier flow or a thermal flow originating from the moraine slopes. At the centre line, westerly wind conditions coincided with an increase in low-level turbulent mixing and heat exchange towards the glacier surface. In case of large-scale flows that are strong enough to disturb the katabatic wind on the glacier, we find the greatest increases in low-level heat exchange towards the glacier surface at the wind-exposed areas of the glacier, in our case at the centre line. This contrasts with previous studies (e.g. Sauter and Galos, 2016) that concluded that the heat exchange increases mostly at the peripheral areas of the glacier due to the strongest heat advection. These earlier findings, however, appear to be only valid for conditions when the katabatic flow at the centre line of the glacier was preserved. Furthermore, the steepness of the surrounding terrain plays a decisive role for the sheltering of peripheral areas from heat advection from the surrounding terrain. Steeper terrain might thus lead to a stronger sheltering of peripheral areas from a disturbance of the katabatic flow by larger-scale flows associated with strong winds and lateral heat advection.
Our experiments highlight the difficulty of experimentally characterizing the micrometeorological conditions over glaciers and their potential effect on the energy balance of the glacier surface. Even flux profiles at multiple locations at the glacier provide only local-scale information, and turbulence sensors only allow measurements at a certain distance away from the glacier surface. In the case of shallow katabatic-jet formation, the vertical flux divergence is high, and the knowledge of the exact local jet height is critically important for the interpretation of turbulence profiles. Turbulence measurements close to the jet height or even above will provide underestimated values of momentum and vertical heat fluxes not reflecting the turbulence characteristics at the glacier surface. These measurements do not necessarily provide meaningful information about heat exchange through the atmospheric layer adjacent to the ice surface. It is therefore critically important to apply measurement techniques that allow turbulence to be measured within the lowest metre above the glacier surface. For example, eddy covariance sensors with smaller path lengths can measure turbulent fluxes in the lowest 0.5 m above the surface (Mott et al., 2017), and high-resolution fibre-optic temperature sensing (Thomas et al., 2012) can be applied to measure the two-dimensional thermal structure of the surface layer at high resolution. A different very promising approach is the use of an infrared camera pointing at a synthetic projection screen. The surface temperature of the screen is used as a proxy for air temperature (Grudzielanek and Cermak, 2015), and high-frequency measurements (10 Hz) combined with eddy covariance measurements allow turbulent sensible-heat fluxes to be inferred in very high spatial resolution (less than 0.1 m resolution) and very close to the glacier surface.
Furthermore, the origin of the across-glacier flow and differences in the exposure to strong westerly winds at different parts of the glacier could not be ascertained due to the limited number of stations at higher elevations on the glacier and in the nearby surroundings. Numerical methods such as large-eddy simulations would complement our experiments to investigate the dynamics of the across-glacier flow and its development. In the framework of a current research project associated with the HEFEX campaign, large-eddy simulations with WRF are done at the Hintereisferner area at 240 and 48 m resolution. These simulations will allow us to combine and compare measurements such as these with modelling efforts. For glacier mass and energy balance studies, a dynamical downscaling (Gerber et al., 2018) of regional-scale atmospheric models to very high resolutions would help to better capture boundary layer dynamics at the glacier and their effect on temporal and spatial dynamics of heat exchange processes at the glacier. Although the measurements analysed here suggest the impact of across-glacier flows on the local energy balance to be non-negligible, the frequency of such flows at other glaciers remains unknown.
Turbulence data and meteorological data analysed in this study are available from the Zenodo data repository https://doi.org/10.5281/zenodo.4113867 (Mott et al., 2020).
RM, IS, and LN designed the field experiment, and RM, IS, and LN conducted field experiments. RM and IS analysed the data. RM prepared the manuscript with contributions from all co-authors.
We thank Jordan Mertes, Alexander Kehl, Josh Chambers, Maximilian Kehl, Mark Smith, Tom Smith, Anna Wirbel, and Zora Schirmeister for assisting during the field campaign.
This research has been supported by the Swiss National Science Foundation (SNF) (grant no. P300P2_164644) and the Austrian Science Fund (FWF) (grant no. T781-N32).
This paper was edited by Valentina Radic and reviewed by Jonathan Conway and one anonymous referee.
Abermann, J., Lambrecht, A., Fischer, A., and Kuhn, M.: Quantifying changes and trends in glacier area and volume in the Austrian Ötztal Alps (1969-1997-2006), The Cryosphere, 3, 205–215, https://doi.org/10.5194/tc-3-205-2009, 2009.
Aubinet, M., Vesala, T., and Papale, D. (Eds): Eddy Covariance: A Practical Guide to Measurement and Data Analysis, Springer, Berlin, 460 pp., 2012.
Ayala, A., Pellicciotti, F., and Shea, J. M.: Modeling 2 m air temperatures over mountain glaciers: Exploring the influence of katabatic cooling and external warming, J. Geophys. Res.-Atmos., 120, 3139–3157, https://doi.org/10.1002/2015JD023137, 2015.
Bahr, D. B. and Radić, V.: Significant contribution to total mass from very small glaciers, The Cryosphere, 6, 763–770, https://doi.org/10.5194/tc-6-763-2012, 2012.
Conway, J. P. and Cullen, N. J.: Cloud effects on surface energy and mass balance in the ablation area of Brewster Glacier, New Zealand, The Cryosphere, 10, 313–328, https://doi.org/10.5194/tc-10-313-2016, 2016.
Cullen, N. J. and Conway, J. P.: A 22-month record of surface meteorology and energy balance from the ablation zone of Brewster Glacier, New Zealand, J. Glaciol., 61, 931–946, https://doi.org/10.3189/2015JoG15J004, 2015.
Curtis, J. A., Flint, L. E., Flint, A. L., Lundquist, J. D., Hudgens, B., Boydston, E. E., and Young, J. K.: Incorporating Cold-Air Pooling into Downscaled Climate Models Increases Potential Refugia for Snow-Dependent Species within the Sierra Nevada Ecoregion, CA, PLoS ONE, 9, e106984 https://doi.org/10.1371/journal.pone.0106984, 2014.
Dadic, R., Mott, R., Lehning, M., and Burlando, P.: Wind influence on snow depth distribution and accumulation over glaciers, J. Geophys. Res., 115, F01012, https://doi.org/10.1029/2009JF001261, 2010.
Dadic, R., Mott, R., Lehning, M., Carenzo, M., Anderson, B., and Mackintosh, A.: Sensitivity of turbulent fluxes to wind speed over snow surfaces in different climatic settings, Adv. Water Resour., 55, 178–189, https://doi.org/10.1016/j.advwatres.2012.06.010, 2013.
Daly, C., Conklin, D. R., and Unsworth, M. H.: Local atmospheric decoupling in complex topography alters climate change impacts, Int. J. Climatol., 30, 1857–1864, 2010.
Denby, B.: Second order modeling of turbulence in katabatic flows, Bound.-Lay. Meteorol., 92, 67–100, 1999.
Denby, B. and Greuell, W.: The use of bulk and profile methods for determining surface heat fluxes in the presence of glacier winds, J. Glaciol., 46, 445–452, https://doi.org/10.3189/172756500781833124, 2000.
Denby, B. and Smeets, C. J. P. P.: Derivation of turbulent flux profiles and roughness lengths from katabatic flow dynamics, J. Atmos. Sci., 39, 1601–1612, 2000.
Escher-Vetter, H.: Zum Gletscherverhalten in den Alpen im zwanzigsten Jahrhundert, in: Klimastatusbericht 2001, Deutscher Wetterdienst, Offenbach, 51–57, 2002.
Essery, R., Granger, R., and Pomeroy, J. W.: Boundary-layer growth and advection of heat over snow and soil patches: Modelling and parameterization, Hydrol. Process., 20, 953–967, https://doi.org/10.1002/hyp.6122, 2006.
Fitzpatrick, N., Radić, V., and Menounos, B.: A multi-season investigation of glacier surface roughness lengths through in situ and remote observation, The Cryosphere, 13, 1051–1071, https://doi.org/10.5194/tc-13-1051-2019, 2019.
Frei, C. and Schär, C.: A precipitation climatology of the Alps from high-resolution rain-gauge observations, Int. J. Climatol., 18, 873–900, https://doi.org/10.1002/(SICI)1097-0088(19980630)18:8<873::AID-JOC255>3.0.CO;2-9, 1998.
Gerber, F., Besic, N., Sharma, V., Mott, R., Daniels, M., Gabella, M., Berne, A., Germann, U., and Lehning, M.: Spatial variability in snow precipitation and accumulation in COSMO–WRF simulations and radar estimations over complex terrain, The Cryosphere, 12, 3137–3160, https://doi.org/10.5194/tc-12-3137-2018, 2018.
Grachev, A. A., Leo, L. S., Sabatino, S. D., Fernando, H. J. S., Pardyjak, E. R., and Fairall, C. W.: Structure of turbulence in katabatic flows below and above the wind-speed maximum, Bound.-Lay. Meteorol., 159, 469–494, 2016.
Greuell, W. and Smeets, P.: Variations with elevation in the surface energy balance on the Pasterze (Austria), J. Geophys. Res., 106, 31717–31727, https://doi.org/10.1029/2001JD900127, 2001.
Grudzielanek, A. M. and Cermak, J.: Capturing Cold-Air Flow Using Thermal Imaging, Bound.-Lay. Meteorol., 157, 321–332, https://doi.org/10.1007/s10546-015-0042-8, 2015.
Harder, P., Pomeroy, J. W., and Helgason, W.: Local scale advection of sensible and latent heat during snowmelt, Geophys. Res. Lett., 44, 9769–9777, https://doi.org/10.1002/2017GL074394, 2017.
Helbig, N., Mott, R., Herwijnen, A., Winstral, A., and Jonas, T.: Parameterizing surface wind speed over complex topography, J. Geophys. Res.-Atmos., 122, 651–667, https://doi.org/10.1002/2016JD025593, 2017.
Hoinkes, H.: Methoden und Möglichkeiten von Massenhaushaltsstudien auf Gletschern, Zeitschrift für Gletscherkunde und Glazialgeologie, 6, 37–90, 1970.
Kaser, G., Hardy, D. R., Mölg, T., Bradley, R. S., and Hyera, T. M.: Modern glacier retreat on Kilimanjaro as evidence of climate change: observations and facts, Int. J. Climatol., 24, 329–339, https://doi.org/10.1002/joc.1008, 2004.
Kljun, N., Calanca, P., Rotach, M. W., and Schmid, H. P.: A simple two-dimensional parameterisation for Flux Footprint Prediction (FFP), Geosci. Model Dev., 8, 3695–3713, https://doi.org/10.5194/gmd-8-3695-2015, 2015.
Klok, E. and Oerlemans, J.: Model study of the spatial distribution of the energy and mass balance of Morteratschgletscher, Switzerland, J. Glaciol., 48, 505–518, https://doi.org/10.3189/172756502781831133, 2002.
Klug, C., Bollmann, E., Galos, S. P., Nicholson, L., Prinz, R., Rieg, L., Sailer, R., Stötter, J., and Kaser, G.: Geodetic reanalysis of annual glaciological mass balances (2001–2011) of Hintereisferner, Austria, The Cryosphere, 12, 833–849, https://doi.org/10.5194/tc-12-833-2018, 2018.
Kuhn, M.: The mass balance of very small glaciers, Zeitschrift für Gletscherkunde und Glazialgeologie, 31, 171–179, 1995.
Kuhn, M., Dreiseitl, E., Hofinger, S., Markl, G., Span, N., and Kaser, G.: Measurements and Models of the Mass Balance of Hintereisferner, Geogr. Ann. A, 81, 659–670, https://doi.org/10.1111/1468-0459.00094, 1999.
Lapo, K., Nijssen, B., and Lundquist, J. D.: Evaluation of turbulence stability schemes of land models for stable conditions, J. Geophys. Res.-Atmos., 124, 3072–3089, https://doi.org/10.1029/2018JD028970, 2019.
MacDougall, A. H. and Flowers, G. E.: Spatial and Temporal Transferability of a Distributed Energy-Balance Glacier Melt Model, J. Climate, 24, 1480–1498, https://doi.org/10.1175/2010JCLI3821.1, 2011.
Marzeion, B., Jarosch, A. H., and Hofer, M.: Past and future sea-level change from the surface mass balance of glaciers, The Cryosphere, 6, 1295–1322, https://doi.org/10.5194/tc-6-1295-2012, 2012.
Mott, R., Egli, L., Grünewald, T., Dawes, N., Manes, C., Bavay, M., and Lehning, M.: Micrometeorological processes driving snow ablation in an Alpine catchment, The Cryosphere, 5, 1083–1098, https://doi.org/10.5194/tc-5-1083-2011, 2011.
Mott, R., Gromke, C., Grünewald, T., and Lehning, M.: Relative importance of advective heat transport and boundary layer decoupling in the melt dynamics of a patchy snow cover, Adv. Water Resour., 55, 88–97, https://doi.org/10.1016/j.advwatres.2012.03.001, 2013.
Mott, R., Daniels, M., and Lehning, M.: Atmospheric flow development and associated changes in turbulent sensible heat flux over a patchy mountain snow cover, J. Hydrometeorol. 16, 1315–1340, https://doi.org/10.1175/JHM-D-14-0036.1, 2015.
Mott, R., Paterna, E., Horender, S., Crivelli, P., and Lehning, M.: Wind tunnel experiments: cold-air pooling and atmospheric decoupling above a melting snow patch, The Cryosphere, 10, 445–458, https://doi.org/10.5194/tc-10-445-2016, 2016.
Mott, R., Schlögl, S., Dirks, L., and Lehning, M.: Impact of extreme land surface heterogeneity on micrometeorology over spring snow cover, J. Hydrometeorol., 18, 2705–2722, https://doi.org/10.1175/JHM-D-17-0074.1, 2017.
Mott, R., Vionnet, V., and Grünewald, T.: The Seasonal Snow Cover Dynamics: Review on Wind-Driven Coupling Processes, Front. Earth Sci., 6, 197, https://doi.org/10.3389/feart.2018.00197, 2018.
Mott, R., Wolf, A., Kehl, M., Kunstmann, H., Warscher, M., and Grünewald, T.: Avalanches and micrometeorology driving mass and energy balance of the lowest perennial ice field of the Alps: a case study, The Cryosphere, 13, 1247–1265, https://doi.org/10.5194/tc-13-1247-2019, 2019.
Mott, R., Stiperski, I., and Nicholson, L.: Experimental data: measurement campaign Hintereisferner Experiment, HEFEX, Data set, The Cryosphere, Zenodo, https://doi.org/10.5281/zenodo.4113867, 2020.
Mölg, T., Cullen, N. J., and Kaser, G.: Solar radiation, cloudiness and longwave radiation over low-latitude glaciers: Implications for mass balance modelling, J. Glaciol., 55, 292–302, 2009.
Nadeau, D. F., Pardyjak, E. R., Higgins, C. W., Huwald, H., and Parlange, M. B.: Flow during the evening transition over steep Alpine slopes, Q. J. Roy. Meteor. Soc., 139, 607–624, https://doi.org/10.1002/qj.1985, 2013.
Nicholson, L. and Stiperski, I.: Comparison of turbulent structures and energy fluxes over exposed and debris-covered glacier ice, J. Glaciol., 66, 543–555, https://doi.org/10.1017/jog.2020.23, 2020.
Nicholson, L. I., Prinz, R., Mölg, T., and Kaser, G.: Micrometeorological conditions and surface mass and energy fluxes on Lewis Glacier, Mt Kenya, in relation to other tropical glaciers, The Cryosphere, 7, 1205–1225, https://doi.org/10.5194/tc-7-1205-2013, 2013.
Obleitner, F.: Climatological features of glacier and valley winds at the Hintereisferner (Ötztal Alps, Austria), Theor. Appl. Climatol., 49, 225–239, https://doi.org/10.1007/BF00867462, 1994.
Oerlemans, J.: Glaciers and Climate Change, Lisse, Balkema, 148 pp., 2001.
Oerlemans, J. and Grisogono, B.: Glacier winds and parameterisation of the related surface heat fluxes, Tellus A, 54, 440–452, https://doi.org/10.1034/j.1600-0870.2002.201398.x, 2002.
Oerlemans, J. and Van Den Broeke, M.: Katabatic flows over ice sheets and glaciers, Tellus A, 54, 440–452, https://doi.org/10.1034/j.1600-0870.2002.201398.x, 2002.
Oldroyd, H. J., Katul, G., Pardyjak, E. R., and Parlange, M. B.: Momentum balance of katabatic flow on steep slopes covered with short vegetation, Geophys. Res. Lett., 41, 4761–4768, https://doi.org/10.1002/2014GL060313, 2014.
Parmhed, O., Oerlemans, J., and Grisogono, B.: Describing surface fluxes in katabatic flow on Breidamerkurjökull, Iceland, Q. J. Roy. Meteor. Soc., 130, 1137–1151, https://doi.org/10.1256/qj.03.52, 2004.
Petersen, L. and Pellicciotti, F.: Spatial and temporal variability of air temperature on a melting glacier: Atmospheric controls, extrapolation methods and their effect on melt modeling, Juncal Norte Glacier, Chile, J. Geophys. Res., 116, D23109, https://doi.org/10.1029/2011JD015842, 2011.
Petersen, L., Pellicciotti, F., Juszak, I., Carenzo, M., and Brock, B.: Suitability of a constant air temperature lapse rate over an Alpine glacier: testing the Greuell and Böhm model as an alternative, Ann. Glaciol., 54, 120–130, https://doi.org/10.3189/2013AoG63A477, 2013.
Pinto, J. O., Parsons, D. B., Brown, W. O. J., Cohn, S., Chamberlain, N., and Morley, B.: Coevolution of down-valley flow and the nocturnal boundary layer in complex terrain, J. Appl. Meteorol. Clim., 45, 1429–1449, https://doi.org/10.1175/JAM2412.1, 2006.
Prinz, R., Nicholson, L. I., Mölg, T., Gurgiser, W., and Kaser, G.: Climatic controls and climate proxy potential of Lewis Glacier, Mt. Kenya, The Cryosphere, 10, 133–148, https://doi.org/10.5194/tc-10-133-2016, 2016.
Radić, V. and Hock, R.: Regionally differentiated contribution of mountain glaciers and ice caps to future sea-level rise, Nat. Geosci., 4, 91–94, https://doi.org/10.1038/ngeo1052, 2011.
Sauter, T. and Galos, S. P.: Effects of local advection on the spatial sensible heat flux variation on a mountain glacier, The Cryosphere, 10, 2887–2905, https://doi.org/10.5194/tc-10-2887-2016, 2016.
Schlögl, S., Lehning, M., and Mott, R.: How are turbulent heat fluxes and snow melt rates affected by a changing snow cover fraction?, Front. Earth Sci., 6, 154, https://doi.org/10.3389/feart.2018.00154, 2018a.
Schlögl, S., Lehning, M., and Mott, R.: Representation of horizontal transport processes in snow melt modelling by applying a footprint approach, Front. Earth Sci., 6, 120, https://doi.org/10.3389/feart.2018.00120, 2018b.
Shea, J. M. and Moore, R. D.: Prediction of spatially distributed regional-scale fields of air temperature and vapor pressure over mountain glaciers, J. Geophys. Res., 115, D23107, https://doi.org/10.1029/2010JD014351, 2010.
Smith, T., Smith, M., Chambers, J., Sailer, R., Nicholson, L., Mertes, J., Quincey, D. J., Carrivick, J. L., and Stiperski, I.: A scale-dependent model to represent changing aerodynamic roughness of ablating glacier ice based on repeat topographic surveys, J. Glaciol., 66, 950–964, https://doi.org/10.1017/jog.2020.56, 2020.
Sold, L., Huss, M., Hoelzle, M., Andereggen, H., Joerg, P., and Zemp, M.: Methodological approaches to infer end-of-winter snow distribution on alpine glaciers, J. Glaciol., 59, 1047–1059, https://doi.org/10.3189/2013JoG13J015, 2013.
Stiperski, I. and Rotach, M. W.: On the measurement of turbulence over complex mountainous terrain, Bound.-Lay. Meteorol., 159, 97–121, 2016.
Stiperski, I., Holtslag, A. A. M., Lehner, M., Hoch, S., and Whiteman, C. D.: On the turbulence structure of deep katabatic flows on a shallow mesoscale slope, Q. J. Roy. Meteor. Soc., 146, 1206–1231, https://doi.org/10.1002/qj.3734, 2020.
Strasser, U., Corripio, J., Pellicciotti, F., Burlando, P., Brock, B., and Funk, M.: Spatial and temporal variability of meteorological variables at Haut Glacier d'Arolla, Switzerland, during the ablation season 2001: measurements and simulations, J. Geophys. Res., 109, D03103, https://doi.org/10.1029/2003JD003973, 2004.
Strasser, U., Marke, T., Braun, L., Escher-Vetter, H., Juen, I., Kuhn, M., Maussion, F., Mayer, C., Nicholson, L., Niedertscheider, K., Sailer, R., Stötter, J., Weber, M., and Kaser, G.: The Rofental: a high Alpine research basin (1890–3770 m a.s.l.) in the Ötztal Alps (Austria) with over 150 years of hydrometeorological and glaciological observations, Earth Syst. Sci. Data, 10, 151–171, https://doi.org/10.5194/essd-10-151-2018, 2018.
Thomas, C. K., Kennedy, A.M., Selker, J. S., Moretti, A., Schroth, M. H., Smoot, A. R., Tufillaro, N. B., and Zeeman, M. J.: High-Resolution Fibre-Optic Temperature Sensing: A New Tool to Study the Two-Dimensional Structure of Atmospheric Surface-Layer Flow, Bound.-Lay. Meteorol., 142, 177–192, https://doi.org/10.1007/s10546-011-9672-7, 2012.
Vickers, D. and Mahrt, L.: The cospectral gap and turbulent flux calculations, J. Atmos. Ocean. Tech., 20, 660–672, https://doi.org/10.1175/1520-0426(2003)20<660:TCGATF>2.0.CO;2, 2003.
Weigel, A. P. and Rotach, M. W.: Flow structure and turbulence characteristics of the daytime atmosphere in a steep and narrow Alpine valley, Q. J. Roy. Meteor. Soc., 130, 2605–2627, https://doi.org/10.1256/qj.03.214, 2004.
Whiteman, C. D. and Doran, J. C.: The Relationship between Overlying Synoptic-Scale Flows and Winds within a Valley, J. Appl. Meteorol., 32, 1669–1682, https://doi.org/10.1175/1520-0450(1993)032<1669:TRBOSS>2.0.CO;2, 1993.
Zhong, S. and Whiteman, C.: Downslope Flows on a Low-Angle Slope and Their Interactions with Valley Inversions. Part II: Numerical Modeling, J. Appl. Meteorol. Clim., 47, 2039–2057, 2008.