the Creative Commons Attribution 4.0 License.
the Creative Commons Attribution 4.0 License.
 | 20 Aug 2020
A 14.5-million-year record of East Antarctic Ice Sheet fluctuations from the central Transantarctic Mountains, constrained with cosmogenic 3He, 10Be, 21Ne, and 26Al
Allie Balter-Kennedy
Gordon Bromley
Greg Balco
Holly Thomas
Margaret S. Jackson
The distribution of moraines in the Transantarctic Mountains affords direct constraint of past ice-marginal positions of the East Antarctic Ice Sheet (EAIS). Here, we describe glacial geologic observations and cosmogenic-nuclide exposure ages from Roberts Massif, an ice-free area in the central Transantarctic Mountains. We measured cosmogenic 3He, 10Be, 21Ne, and 26Al in 168 dolerite and sandstone boulders collected from 24 distinct deposits. Our data show that a cold-based EAIS was present, in a configuration similar to today, for many periods over the last ∼14.5 Myr, including the mid-Miocene, late Pliocene, and early to Middle Pleistocene. Moraine ages at Roberts Massif increase with distance from, and elevation above, the modern ice margin, which is consistent with a persistent EAIS extent during glacial maxima and slow, isostatic uplift of the massif itself in response to trough incision by outlet glaciers. We also employ the exceptionally high cosmogenic-nuclide concentrations in several boulders, along with multi-isotope measurements in sandstone boulders, to infer extremely low erosion rates (≪5 cm Myr−1) over the period covered by our record. Although our data are not a direct measure of ice volume, the Roberts Massif glacial record indicates that the EAIS was present and similar to its current configuration during at least some periods when the global temperature was believed to be warmer and/or atmospheric CO2 concentrations were likely higher than today.
- Article
(27439 KB) - Full-text XML
-
Supplement
(226 KB) - BibTeX
- EndNote


In this paper, we describe glacial deposits preserved in the central Transantarctic Mountains (TAM; Fig. 1) that provide unambiguous evidence for the presence of the East Antarctic Ice Sheet (EAIS), in a configuration similar to today, for periods of the middle Miocene, late Pliocene, and early to Middle Pleistocene. Our chronology therefore provides geologic targets for ice volume reconstructions derived from marine proxy records and sea-level estimates. Current estimates of pre-Pleistocene EAIS ice volume are based largely on δ18O of benthic foraminifera (e.g., Shevenell et al., 2008), which primarily records global temperature and ice volume, and far-field sea-level indicators (e.g., Miller et al., 2005), such as raised shorelines (e.g., Rovere et al., 2014). These proxy records (e.g., Holbourn et al., 2013), along with stratigraphic evidence from ice-proximal sediment cores (Levy et al., 2016) and modeling studies (Gasson et al., 2016), suggest that during the middle Miocene the EAIS oscillated between states both larger and smaller than present in response to fluctuations in CO2 and temperature. After ∼14 Ma, such proxy records suggest a general presence of the EAIS but with potentially significant retreat during past warm periods, such as the mid-Pliocene warm period (3.3–3.0 Ma; e.g., Dutton et al., 2015, and references therein), when temperatures are thought to have been 2–3 ∘C warmer than preindustrially (Haywood et al., 2013) and CO2 was ∼400 ppm (Pagani et al., 2010; Seki et al., 2010). Although valuable for elucidating long-term trends in sea-level change, these proxy records do not directly record the volume of specific ice sheets. In contrast, glacial deposits from ice-free areas of Antarctica itself provide direct geologic evidence for past ice sheet variability.
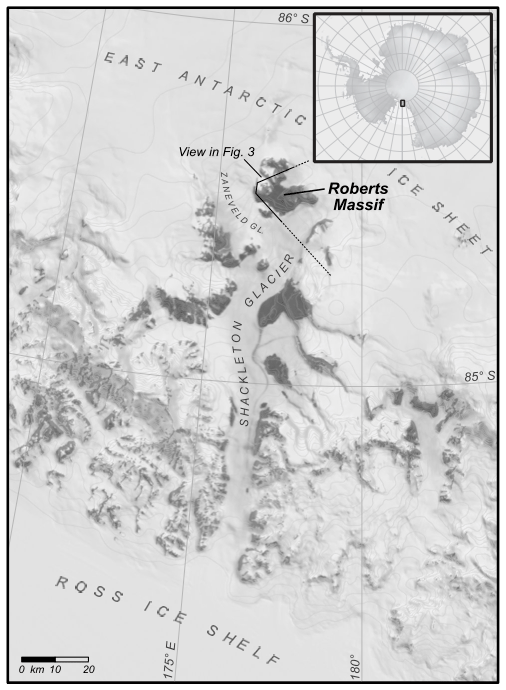
Figure 1Location of Roberts Massif. The massif lies at the head of the Shackleton Glacier, which flows from the polar plateau of the East Antarctic Ice Sheet at ∼2500 m elevation, down through the Transantarctic Mountains, to the Ross Ice Shelf near sea level. Base map generated from the MODIS MOA (Scambos et al., 2007) and Antarctic Digital Database via the Quantarctica compilation (http://quantarctica.npolar.no, last access: 22 July 2020).
Previous geomorphic and glacial chronologic studies in the Transantarctic Mountains (TAM), a ∼3000 km long topographic barrier through which outlet glaciers of the EAIS drain into the Ross Embayment (Fig. 1), suggest the presence of pre-Pleistocene glacial deposits. Two distinct categories of deposits characterize the Antarctic glacial geologic record: basal tills of the Sirius Group (e.g., Mayewski, 1975; Mercer, 1972), which indicate at least one period of temperate glaciation, and thin, bouldery drifts and moraines deposited by ice frozen to the bed (e.g., Prentice et al., 1986), which overlie the older temperate deposits. In southern Victoria Land, Schaefer et al. (1999) reported a minimum age of >10 Myr for Sirius Group tills at Mt Fleming. Similarly, relict subglacial flood deposits in the Coombs Hills resulting from wet-based glaciation afford 3He ages of between ∼8.5 and 10.5 Myr, assuming zero erosion, and as much as ∼15 Myr if erosion rates of 0.03–0.06 m Myr−1 are applied (Margerison et al., 2005). In the same region, 40Ar and 39Ar ages on in situ ash layers interbedded with cold-based ablation tills in the Asgard Range date the transition from temperate to polar glaciation to between 15 and 13.6 Ma (Sugden and Denton, 2004). The preservation of such deposits over the last ∼15 Myr has been invoked as evidence for persistent polar desert conditions and by extension the presence of the EAIS since that time (Denton et al., 1993).
Chronologic constraints on the overlying cold-based deposits come primarily from surface-exposure dating, which has been employed at several locations throughout the TAM, including southern Victoria Land (Brook et al., 1995, 1993; Brown et al., 1991; Bruno et al., 1997; Ivy-Ochs et al., 1995; Strasky et al., 2009), Beardmore (Ackert and Kurz, 2004) and Law (Kaplan et al., 2017) glaciers in the central TAM, and Scott (Spector et al., 2017) and Reedy (Bromley et al., 2010; Todd et al., 2010) glaciers in the southern TAM. Approximately 30 previously published exposure ages (see ICE-D:ANTARCTICA online database, http://antarctica.ice-d.org, last access: 22 July 2020) indicate the preservation of cold-based glacial landforms in Antarctica that are at least 5 Ma in age. For example, a prominent boulder moraine in the Dominion Range, upper Beardmore Glacier, was dated with 3He to 5.2 Ma (Ackert and Kurz, 2004). Similarly, 10Be ages from erratic boulders at Reedy Glacier suggest deposition of the “Reedy E drift” at Ma (Bromley et al., 2010).
To further constrain the pre-Pleistocene configurations of the EAIS, we exploit the extensive moraine record at Roberts Massif, a high-elevation site in the central TAM, where studies on nearby nunataks have suggested that old (>5 Ma) deposits exist (e.g., Ackert and Kurz, 2004). Roberts Massif (86.374∘ S, 177.135∘ W) is a ∼100 km2 ice-free area situated at the head of Shackleton Glacier, an outlet of the EAIS (Fig. 1). The massif is bounded to the south and east by the EAIS, to the north and west by the upper Shackleton Glacier, and to the northeast by an unnamed branch of Zaneveld Glacier. Today, the EAIS at Roberts Massif is cold based and the environment is that of a polar desert. We employed cosmogenic 3He, 21Ne, 10Be, and 26Al to date moraines at Roberts Massif to create a comprehensive glacial geologic record for this site comprising 168 samples. Our record affords an unprecedented view of EAIS variability in the central TAM over the last ∼15 Myr and provides valuable new insight into EAIS behavior during periods of the Miocene and Pliocene, when temperatures and atmospheric CO2 were likely similar to or higher than today.
2.1 Geomorphic mapping and sample collection
Fieldwork took place during the 2015–2016 and 2016–2017 austral summers. In the field, we identified and mapped moraines, till deposits, and fault scarps on to 2 m resolution satellite imagery provided by the Polar Geospatial Center, University of Minnesota. We collected samples for surface-exposure dating from the upper surfaces of erratic boulders located on moraine crests and drift sheets, focusing on boulders in stable positions (i.e., perched atop other boulders, not broken) and exhibiting minimal evidence for surficial erosion. Owing to the prevalence of nuclide inheritance documented by previous Antarctic cosmogenic studies (e.g., Stone et al., 2003; Todd et al., 2010), which is linked to incomplete erosion by cold-based ice of previously exposed surfaces, we sampled large (generally >1 m tall), angular boulders, following the reasoning that such forms are (i) less likely to have been reworked from the underlying Sirius Group tills than visibly molded, striated, and/or polished cobbles of exotic lithologies and (ii) more likely to have at least one side that is free of inherited nuclides.
We collected samples of ∼1–5 cm thickness using either a hammer and chisel or a drill and wedges. To characterize each sampled boulder fully and document its geomorphic context, we described, measured, sketched, and photographed each boulder from at least four different angles. We located samples in the field using an uncorrected handheld GPS unit (estimated horizontal precision typically ±6 m) and measured elevations by barometric traverse from temporary benchmarks established using differentially corrected GPS and corrected to orthometric heights relative to the EGM96 geoid. The estimated vertical precision of the temporary benchmarks is between ±0.05 and ±0.3 m. For barometric differential elevation measurements relative to the benchmarks, we used a Kestrel 4000 barometric altimeter and looped between samples and benchmarks to correct for time-dependent changes in atmospheric pressure. The estimated total uncertainty in sample elevations measured using this procedure is ±2.5 m, reflecting the precision of the differential GPS surveys and the barometer and the reproducibility of differential barometric elevation measurements of representative sites also surveyed by differential GPS in this and other studies. We measured topographic shielding at sample sites using a handheld compass and inclinometer and the procedure described by Balco et al. (2008, with accompanying online material).
2.2 Cosmogenic-nuclide measurements
2.2.1 Cosmogenic helium-3 analyses
We measured cosmogenic 3He concentrations in pyroxene separated from samples of Ferrar dolerite. To separate pyroxenes at the University of Maine Cosmogenic Isotope Laboratory, we followed a modified version of the method described by Bromley et al. (2014). We sieved crushed samples to isolate the 125–250 µm grain size fraction, which was boiled for 2 h in 10 % HNO3 to remove Fe oxides and other weathering products. We then removed lighter minerals (mostly plagioclase) using a water-based heavy liquid with a density of 2.94 g cm−3 and leached remaining material in 5 % HF to dissolve adhering plagioclase and remove outer surfaces of pyroxene grains potentially enriched in implanted 4He from U and Th decay (Blard and Farley, 2008; Bromley et al., 2014). Finally, etched pyroxenes were passed through a magnetic separator and handpicked to remove remaining contaminants under a binocular microscope.
We then measured 3He concentrations in clean pyroxene separates at the Berkeley Geochronology Center using the BGC “Ohio” system, which consists of a MAP 215-50 sector field mass spectrometer with updated detectors and counting electronics, coupled to a fully automated gas extraction and purification system. Gas extraction on this system uses a laser “microfurnace” in which ∼15–40 mg aliquots of pyroxene, encapsulated in Ta packets, are heated under vacuum using a 150 W, 810 nm diode laser coupled to a coaxial optical pyrometer in a feedback loop allowing control of the pyrometer temperature. The pyrometer is calibrated by heating a thermocouple in an identical apparatus. However, note that precise temperature measurement is not necessary for this work. In most cases (Table S2 in the Supplement), we extracted helium in an initial 15 min heating step at 1225 ∘C, followed by a second 15 min heating step at 1325 ∘C to ensure complete extraction. The second heating step typically contained 1 %–5 % of total He released. We added additional heating steps for a few representative samples to test for complete extraction and found He signals indistinguishable from blanks. Gases released into the extraction line were purified by reaction with SAES getters and frozen to activated charcoal at 12 K, after which helium was released into the mass spectrometer at 33 K. In all cases, we measured 4He signals on a Faraday cup and 3He on a continuous dynode electron multiplier operated in pulse-counting mode.
We quantified both 3He and 4He sensitivity by peak height comparison between samples and aliquots of custom-mixed helium gas standards, calibrated using direct pressure measurements of both isotopes using Baratron capacitance manometers, containing between and mol of 3He and between and mol of 4He. Ferrar pyroxene has relatively high and highly variable 4He concentrations, and the MAP 215 mass spectrometer displays a significant pressure dependence on He sensitivity (Burnard and Farley, 2000), so accurately quantifying machine sensitivity over a wide pressure range was an important aspect of this work. We addressed this by (i) source tuning at He pressures similar to those expected for sample analyses to improve linearity in the pressure range of interest and (ii) ensuring that observed He pressures in sample analyses were bracketed within the pressure range available from standard analyses. In many cases, this required discarding results of an initial analysis and reanalyzing the sample with a different size aliquot calculated to match sample and standard pressures. Total process blanks measured on empty Ta packets had fewer than 105 atoms 3He and 1010 atoms 4He, which is negligible for all samples discussed here. Reported measurement uncertainties in 3He concentrations include uncertainties from 3He counting statistics (typically 1 %–2 %) as well as the variance in sensitivity inferred from gas standard analyses spanning the pressure range of interest (typically 1 %–3 %).
As additional quality-control measures, we analyzed aliquots of the CRONUS-P pyroxene standard (Blard et al., 2015) together with samples throughout each period of analysis and made replicate analyses of a total of 121 pyroxene samples as well as an additional 21 samples of Ferrar pyroxene from other Antarctic sites (Fig. 2). In each of six distinct measurement periods between 2016 and 2019, we analyzed two to four aliquots of CRONUS-P. Although average measured 3He concentrations in individual measurement periods varied from to atoms g−1, data from different measurement periods were not distinguishable as separate populations. The mean and standard deviation of 19 measurements during the entire period was atoms g−1 (2.9 %), which is indistinguishable from the accepted value of 5.02×10⁹ (Blard et al., 2015). Replicate analyses of other samples had a mean relative standard deviation of 2.2 % (Fig. 2). As expected from counting statistics, replicate scatter varied with 3He concentrations, ranging from 3 % for concentrations atoms g−1 to 1.5 % for concentrations atoms g−1.
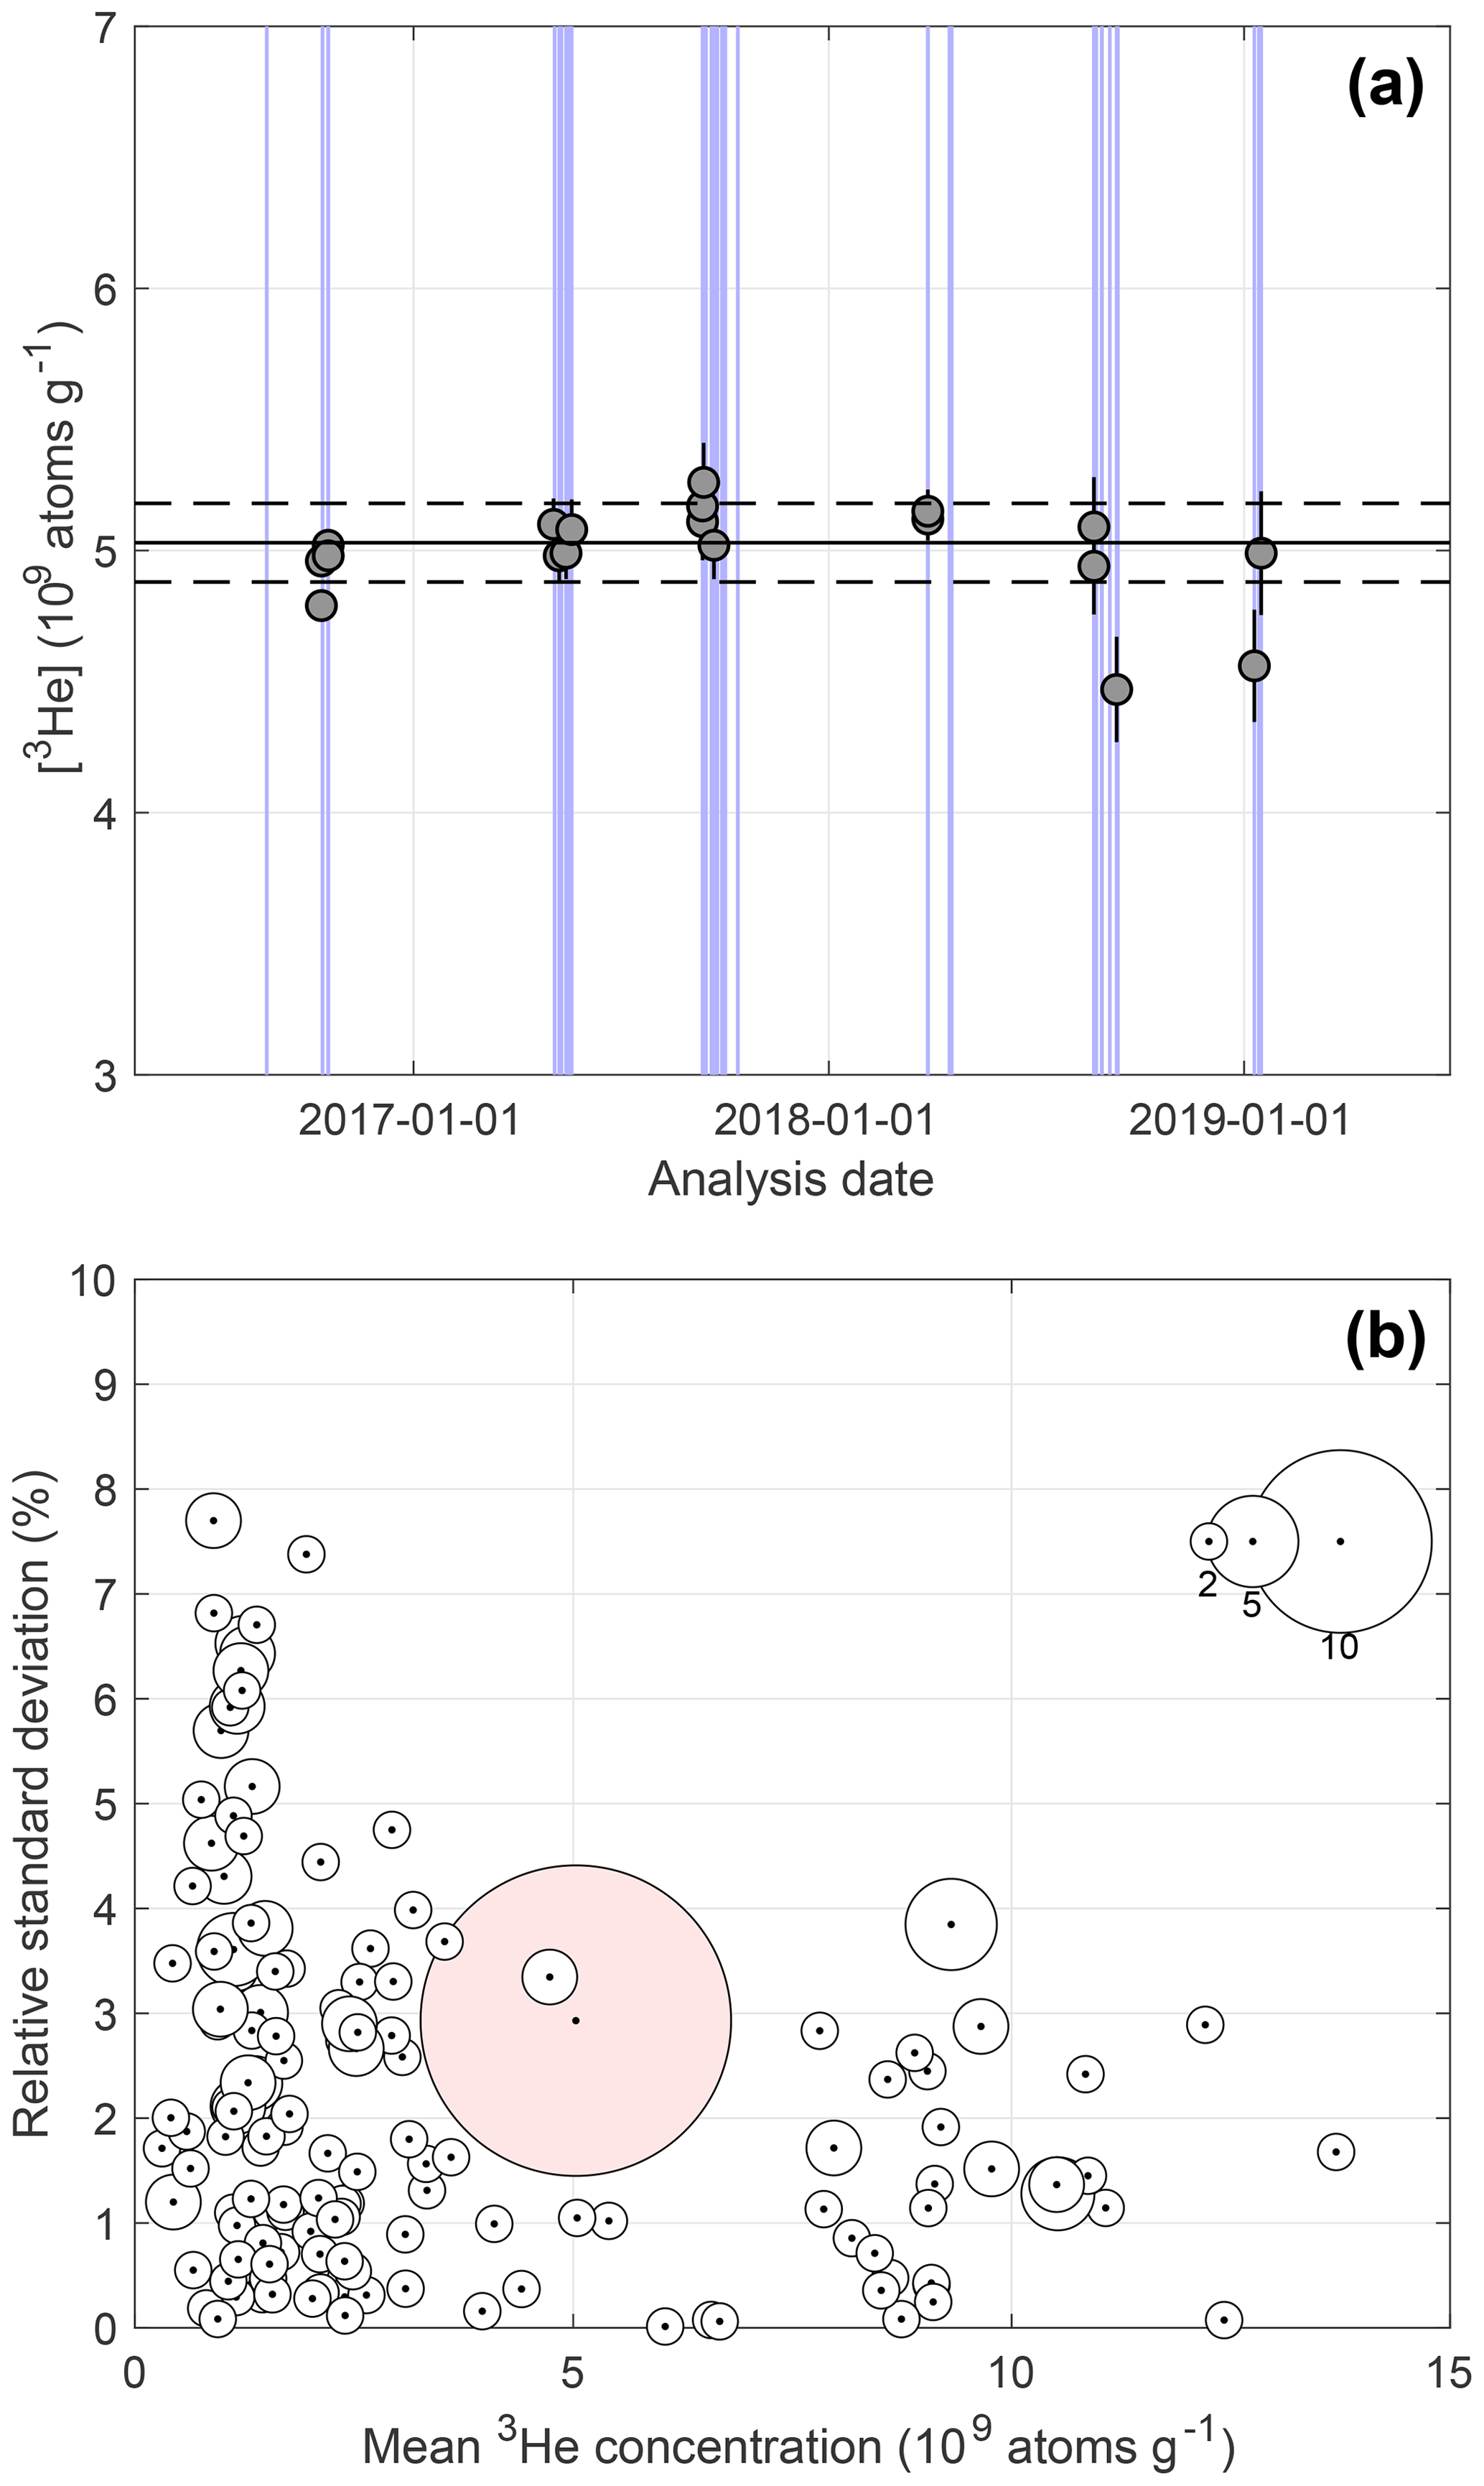
Figure 2Quality-control data for 3He measurements. (a) Replicate analyses of CRONUS-P in all measurement periods during 2016–2019. Blue lines indicate dates samples in this study were analyzed. Error bars show 68 % confidence estimates (i.e., 1σ); relatively large uncertainties and poor reproducibility in the final two measurement periods reflect unusually nonlinear helium sensitivity and relatively large scatter in analyses of gas standards during these periods. Horizontal lines show mean and standard deviation of all measurements. (b) Relative standard deviation of replicate analyses of 142 samples of Ferrar pyroxene analyzed during this study. Of these samples, 21 are not from Roberts Massif and therefore are not reported in this study but are included here for completeness. The size of the symbol indicates the number of times each sample was analyzed. The pink circle is CRONUS-P.
Ferrar pyroxene is known to contain a nonzero concentration of noncosmogenic (presumably magmatic) 3He. Kaplan et al. (2017), Margerison et al. (2005), and Ackert (2000) obtained maximum limiting concentrations for noncosmogenic 3He of 5–7×10⁶ atoms g−1, which are consistent with an unpublished estimate (Balco, unpublished data) of atoms g−1. As this is 1.2 % of the lowest total 3He concentration measured in a Roberts Massif erratic in this study and 0.1 % of the average concentration observed, we disregard it and assume that all observed 3He in pyroxene is cosmogenic.
2.2.2 Cosmogenic beryllium-10 and aluminum-26 analyses
We purified quartz from sandstone samples using established physical and chemical procedures (e.g., Schaefer et al., 2009) at the University of Maine Cosmogenic Isotope Laboratory. Chemical extraction of beryllium and aluminum and preparation of BeO and Al2O3 targets took place at the University of Maine and Lawrence Livermore National Laboratory (LLNL). Ratios of 10Be∕9Be were measured relative to the 07KNSTD standard (Nishiizumi et al., 2007) at LLNL and corrected for background 10Be by procedural blanks with a range of 23 000–44 000 atoms. Al isotope ratios are measured relative to the KNSTD standardization of Nishiizumi (2004) and corrected for a procedural blank of 75 000±75 000 atoms. Note that blank corrections for both 10Be and 26Al are negligible for samples in this study. One measurement of the CRONUS-A quartz standard (Jull et al., 2015) run together with these samples yielded atoms g−1 10Be and atoms g−1 26Al (Table S5), indistinguishable from accepted values for both nuclides. Reported uncertainties for 10Be and 26Al measurements include uncertainties in AMS isotope ratio measurement, process blanks, and 9Be∕27Al concentrations.
2.2.3 Cosmogenic neon-21 analyses
We measured 21Ne in the same quartz separates used for 10Be analysis using the BGC Ohio noble gas mass spectrometer system also used for 3He measurements and described above. Aliquots of quartz samples were degassed in two heating steps at 850 and 1100 ∘C, and calculations of excess 21Ne (see below) are based on total Ne released in both heating steps. Ne isotope measurements at BGC use a 39Ar spike to quantify and correct for the interference on mass 20 and are described in Balco and Shuster (2009). We quantified Ne abundances by peak height comparison between samples and aliquots of an air standard containing between and mol Ne and calibrated using a Baratron capacitance manometer. In contrast to helium, neon sensitivity was linear within this range at all times. Corrections for mass discrimination, when necessary, are also based on the air standard and assumed atmospheric 21Ne∕20Ne and 22Ne∕20Ne ratios of 0.002959 and 0.1020, respectively. A total of 20 analyses of the CRONUS-A quartz standard during the period of this study yielded a mean and standard deviation of 319.8±6.3 Matoms g−1 (2 % RSD) excess 21Ne, indistinguishable from the accepted value of 320 Matoms g−1 (Vermeesch et al., 2015).
Neon isotope ratios, as observed in previous studies for TAM sandstones, were indistinguishable from the atmospheric–cosmogenic mixing line (see Supplement, Table S3). However, Balco et al. (2019) and Middleton et al. (2012) have also shown that significant concentrations of nucleogenic 21Ne produced by decay of trace U and Th are present in quartz from this lithology. To calculate cosmogenic 21Ne concentrations in quartz samples, therefore, we first calculated excess 21Ne with respect to atmospheric composition, following Balco et al. (2019) in assuming that excess 21Ne consists of both cosmogenic and nucleogenic 21Ne, and estimated nucleogenic 21Ne concentrations using the following procedure. First, we measured excess 21Ne concentrations in a set of six sandstone samples from ice-proximal sites at Upper Roberts Massif that have apparent 10Be exposure ages of less than 10 kyr and one additional sample with an apparent 10Be exposure age of 75 kyr. Assuming that these samples have experienced a single period of exposure, we calculated the 21Ne concentration attributable to this exposure and subtracted it from total excess 21Ne concentrations to obtain estimates of nucleogenic 21Ne; the resulting mean and standard deviation for nucleogenic 21Ne estimates in these samples are 10.5±2.8 Matoms g−1, similar to but slightly higher than estimates for Beacon Supergroup sandstones in the Dry Valleys region (Balco et al., 2019; Middleton et al., 2012). We then measured U and Th concentrations in quartz and computed apparent closure ages as described in Balco et al. (2019); excluding one outlier attributed to a spurious Th measurement, the mean and standard deviation of apparent closure ages is 603±110 Myr. If we assume that all other sandstone erratics from Roberts Massif that we analyzed in this study have a similar source and therefore a similar apparent closure age, we can estimate nucleogenic 21Ne concentrations using U and Th concentrations and this closure age estimate. Note that this apparent closure age is older than the depositional age of the Beacon Supergroup. If these sandstone samples are derived from the Beacon Supergroup, therefore, it is most likely inaccurate as a cooling age. However, the provenance of the sandstone erratics is unknown, and in any case this inaccuracy would not affect the assumption that Roberts Massif sandstone erratics have a single characteristic apparent closure age. Table S4 shows the results of this procedure. For samples with less than 200 Matoms g−1 total excess 21Ne, we measured U and Th concentrations in individual samples and applied the mean closure age inferred from the ice-proximal samples, which resulted in subtraction of up to 20 % of total excess 21Ne as nucleogenic and had a significant effect on results. For samples with higher 21Ne concentrations, the uncertainty in the nucleogenic 21Ne estimate is negligible and we used an average value rather than measuring U and Th in individual samples. For example, for samples from the Southwest Col on Misery Platform, discussed below, estimated nucleogenic 21Ne is less than 0.5 % of total excess 21Ne. Reported uncertainties for 21Ne measurements, as for 3He, are derived from counting statistics as well as reproducibility of the gas standards.
2.2.4 Treatment of replicates for cosmogenic noble gas measurements
For the majority of samples, we made replicate 3He and 21Ne measurements and performed chi-squared tests on replicate sets with the null hypothesis that all measurements on the same sample belong to a single population and disagree only because of measurement uncertainty. If we could not reject the null hypothesis at 95 % confidence, we took the error-weighted mean of replicate analyses as the true nuclide concentration and the standard error as the uncertainty. If the null hypothesis was rejected, we used the arithmetic mean and standard deviation. A caveat to this procedure, however, is that we found that our 3He results from CRONUS-P during the period of this study did not pass a chi-squared test (p=0.02), indicating that our internal uncertainty estimates for individual 3He measurements are underestimating the true scatter in multiple measurements of the same sample. Thus, we adjusted calculated uncertainties upward when necessary such that no 3He concentration has a relative uncertainty of less than 2.9 %, the relative standard deviation of CRONUS-P measurements. 21Ne results from CRONUS-A, on the other hand, passed the chi-squared test (p=0.35), so we did not make a similar adjustment to 21Ne data. However, cosmogenic 21Ne concentrations do include an additional uncertainty derived from nucleogenic 21Ne subtraction after averaging of replicates.
2.3 Surface-exposure age calculations
We calculated exposure ages from measured nuclide concentrations using Version 3 of the online exposure age calculator described by Balco et al. (2008) and subsequently updated (http://hess.ess.washington.edu, last access: 22 July 2020). We employed the time-dependent “LSDn” scaling method of Lifton et al. (2014) and the Antarctic atmosphere model of Stone (2000). Production rate calibration for 10Be, 26Al, and 3He use the “primary” calibration datasets of Borchers et al. (2016) for these nuclides, and we compute 21Ne production rates by assuming a 21Ne∕10Be production ratio of 4.03 (Balco et al., 2019; Balco and Shuster, 2009; Kober et al., 2011). In contrast to exposure-dating studies that are located at similar altitude and latitude to production rate calibration sites, our study involves significant extrapolations from the locations of calibration data, mostly at low elevation and high latitude or high elevation and low latitude, to the high-elevation–high-latitude sites at Roberts Massif. Scaling methods that can be fit equivalently to the calibration data predict different production rates at our sites. Specifically, production rates predicted by LSDn scaling are ∼15 % higher than those predicted by the scaling method of Lal (1991) and Stone (2000; the “St” and “Lm” scaling methods of Balco et al., 2008). However, at several high-elevation sites in Antarctica, including Roberts Massif, measured 10Be and 26Al concentrations are significantly higher than values for production–decay saturation predicted by the St and Lm methods, indicating that these methods overpredict production rates at high-elevation–high-latitude locations (see discussion in Balco, 2016, https://cosmognosis.wordpress.com/2016/09/09/saturated-surfaces-in-antarctica/, last access: 22 July 2020). On the other hand, saturation concentrations predicted by the LSDn method are consistent with the highest measured 10Be and 26Al concentrations in Antarctica. Thus, we conclude that, at least in the high TAM, exposure ages calculated using LSDn scaling are likely accurate and exposure ages calculated using St or Lm scaling would be spuriously old.
Additional uncertainties in exposure-age estimates derive from the choice of production rate calibration data. Estimated total uncertainties for 10Be exposure ages derived from calibration data are ∼6 % (Borchers et al., 2016). Yet, any 10Be calibration dataset that predicted significantly lower production rates, and therefore lower saturation concentrations, would not be consistent with the 10Be data from the Southwest Col (see discussion in Sect. 4.3). These data permit us to have underestimated 10Be production rates but not to have overestimated them. However, a majority of data in this study are 3He exposure ages, and we have no similar constraint on 3He production rates. 3He production rate calibration data display substantially more scatter than 10Be, and estimates of total global uncertainty for 3He exposure dating range from less than 2 % (Goehring et al., 2018) to more than 10 % (Borchers et al., 2016; Phillips et al., 2016). Production rate calibration uncertainty therefore may be significant for 3He results.
3.1 Field observations
Roberts Massif is defined topographically by large-scale normal faulting that has produced escarpments as much as ∼1200 m in relief (Fig. 3). These faults delineate a number of broad, subhorizontal surfaces, including a lower-elevation platform (hereafter “Lower Roberts”); a middle-elevation platform, comprising the Misery Platform and Upper Roberts sites; and the high peaks of the massif, including Misery Peak (2725 m) and Arena Peak (informal name; 2700 m). Local bedrock comprises sandstones of the Beacon Supergroup and pyroxene-bearing Ferrar dolerite, which includes a fine-grained variety and a friable, coarse-grained variety. Notably, the termini of the EAIS, Shackleton Glacier, and the unnamed spur of Zaneveld Glacier at Roberts Massif are relatively free of debris, containing only the occasional boulder. Further, we did not observe any evidence of glacial outwash or liquid water at any of these margins, indicating that the ice bounding Roberts Massif is currently cold based.

Figure 3(a) Oblique aerial photograph of Roberts Massif looking west along the spine of the Transantarctic Mountains, with the East Antarctic Ice Sheet to the left. Enlargement (b) shows Misery Platform, which is the hanging wall of the large normal fault that bisects the massif. Panel (c) shows the extensive moraine sequence at Lower Roberts Massif. The moraine sequence at Upper Roberts (Fig. 7) faces west and is hidden from this viewing angle. The locations A and A′ match Fig. 4. Image is a 1963 US Navy trimetrogon aerial photograph, TMA 1211/179 R.
3.1.1 Lower Roberts
In the southern portion of the Lower Roberts area, a complex of faults forms a deep, back-tilted basin named “The Bowl” by Hambrey et al. (2003). With the exception of a 100 m relief bedrock hill, referred to here as the Central Rise, and the Bowl, the Lower Roberts area exhibits relatively gentle topography (Fig. 4). Dolerite bedrock surfaces outcrop at several locations throughout Roberts Massif and commonly exhibit glacial polish, striations, and molding consistent with erosion beneath a wet-based glacier. Most of these bedrock outcrops are directly overlain by semilithified, poorly sorted pockets of sediment (several meters thick in places), containing deeply striated gravel- to cobble-sized clasts of heterogenous, non-native lithologies embedded in an olive-gray, clay-rich matrix (Figs. 4 and 5). We interpret these sediments as lodgement tills associated with the Sirius Group. First described by Mercer (1972), the Sirius Group occurs throughout the upper ( m elevation) TAM as erosional remnants of clay-rich diamicton that are correlated with at least one period of past temperate glaciation. An in-depth sedimentological study of glacially eroded bedrock surfaces and Sirius Group tills at Roberts Massif and other locations along the upper Shackleton Glacier is provided by Hambrey et al. (2003).
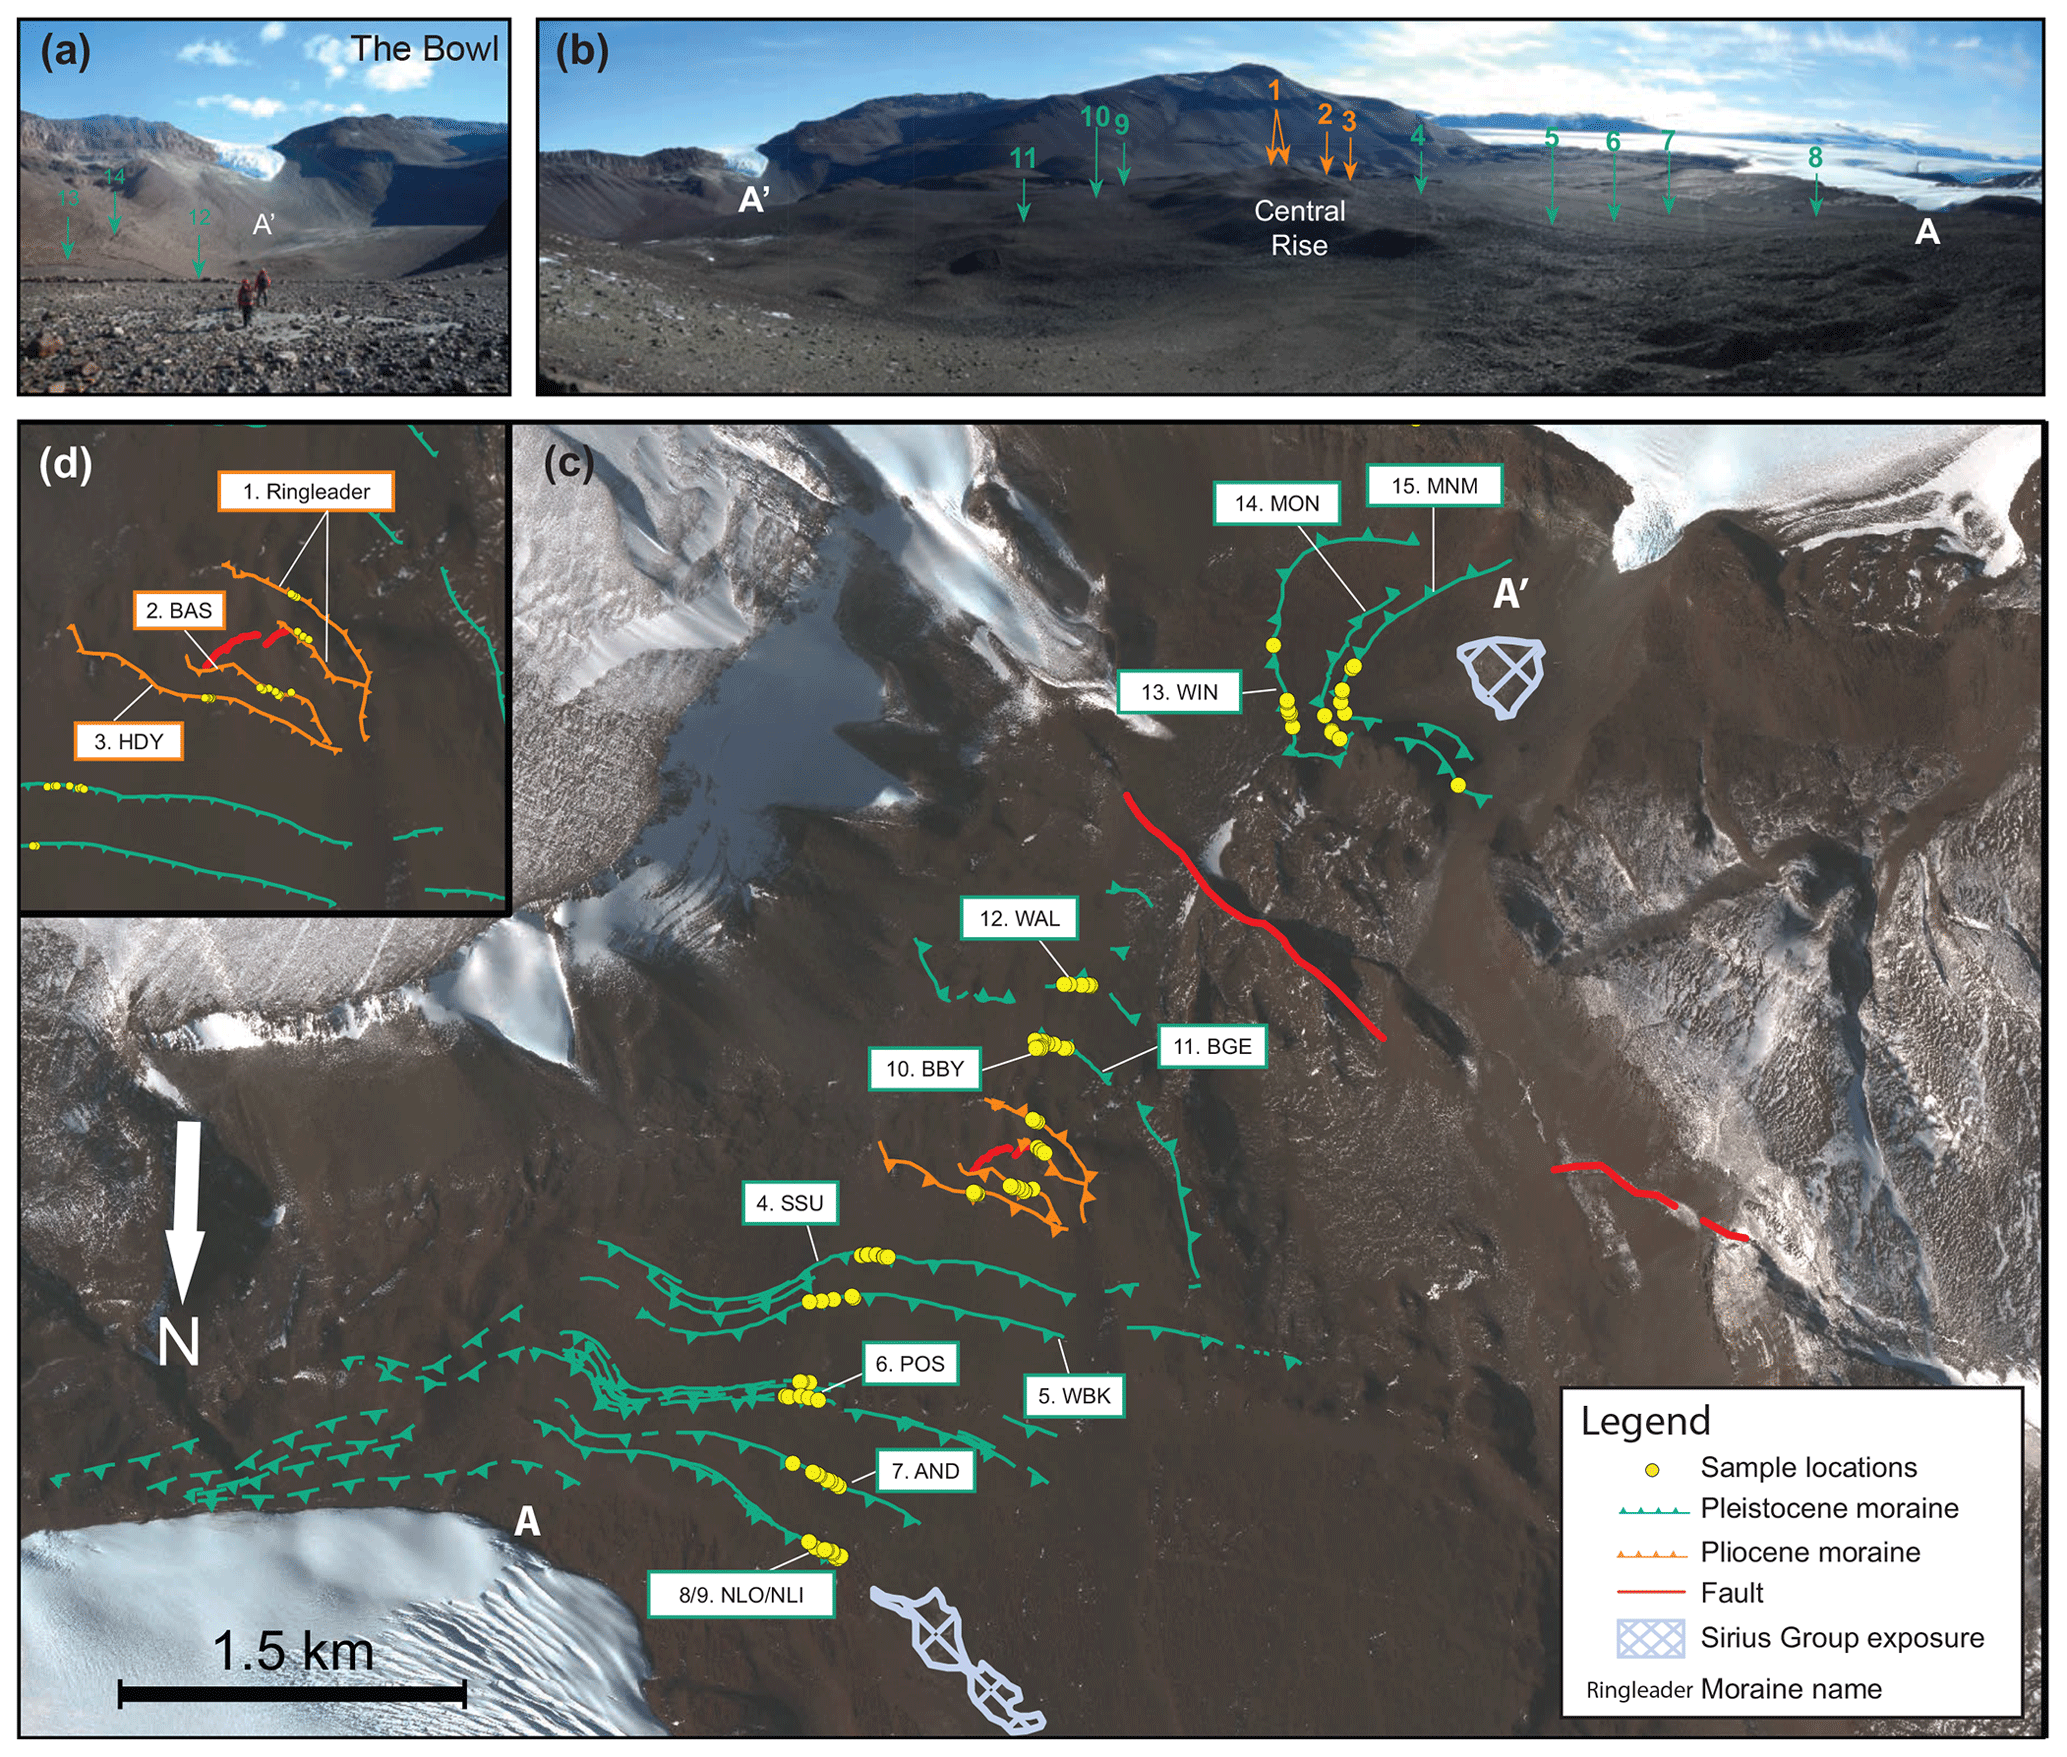
Figure 4Map of Lower Roberts. (a) Photograph of the Bowl, showing cold-based drift and moraines overlying Sirius Group deposits, which appear light gray, and (b) photo of the Lower Roberts area. In (a) and (b), arrows point to sampled moraines, with numbers corresponding to moraine names in (c) and (d), and letters A and A′ corresponding to positions in (c). (c) Glacial geomorphic map showing moraines and sample locations at Lower Roberts, as well as the location of observed Sirius Group outcrops. The NLO–NLI and POS are moraine complexes that comprise two or more crests, and the BBY moraine is a short moraine segment just north of the BGE moraine. (d) Closer view of the Pliocene-aged moraines encircling the Central Rise, shown in orange in (c). The base map is derived from WorldView-2 satellite imagery (© 2017, DigitalGlobe, Inc.).
Bedrock and Sirius Group tills are blanketed by patchy glacial drift, comprising primarily angular, cobble-to-boulder-sized clasts with little to no fine-grained material (Fig. 5). Ferrar dolerite is the most abundant lithology, although this drift includes the occasional sandstone boulder, as well as rounded cobbles reworked from the underlying tills described above. A key feature of this drift deposit is the abundance of open-work boulder moraines, which we targeted for surface-exposure dating (Fig. 6). These low-relief (1–2 m high) ridges are composed primarily of large, angular dolerite boulders and are oriented subparallel to the modern ice edge, marking former marginal positions of the EAIS to the south and the unnamed spur of the Zaneveld glacier to the north. The sediments of these drifts and associated boulder-belt moraines exhibit characteristics typical of cold-based glaciation, being thin, patchy, and clast-supported with little to no fine-grained material (Figs. 5 and 6; Atkins, 2013). Furthermore, clasts are generally angular and lack the striations, polish, and molding associated with erosive wet-based ice.
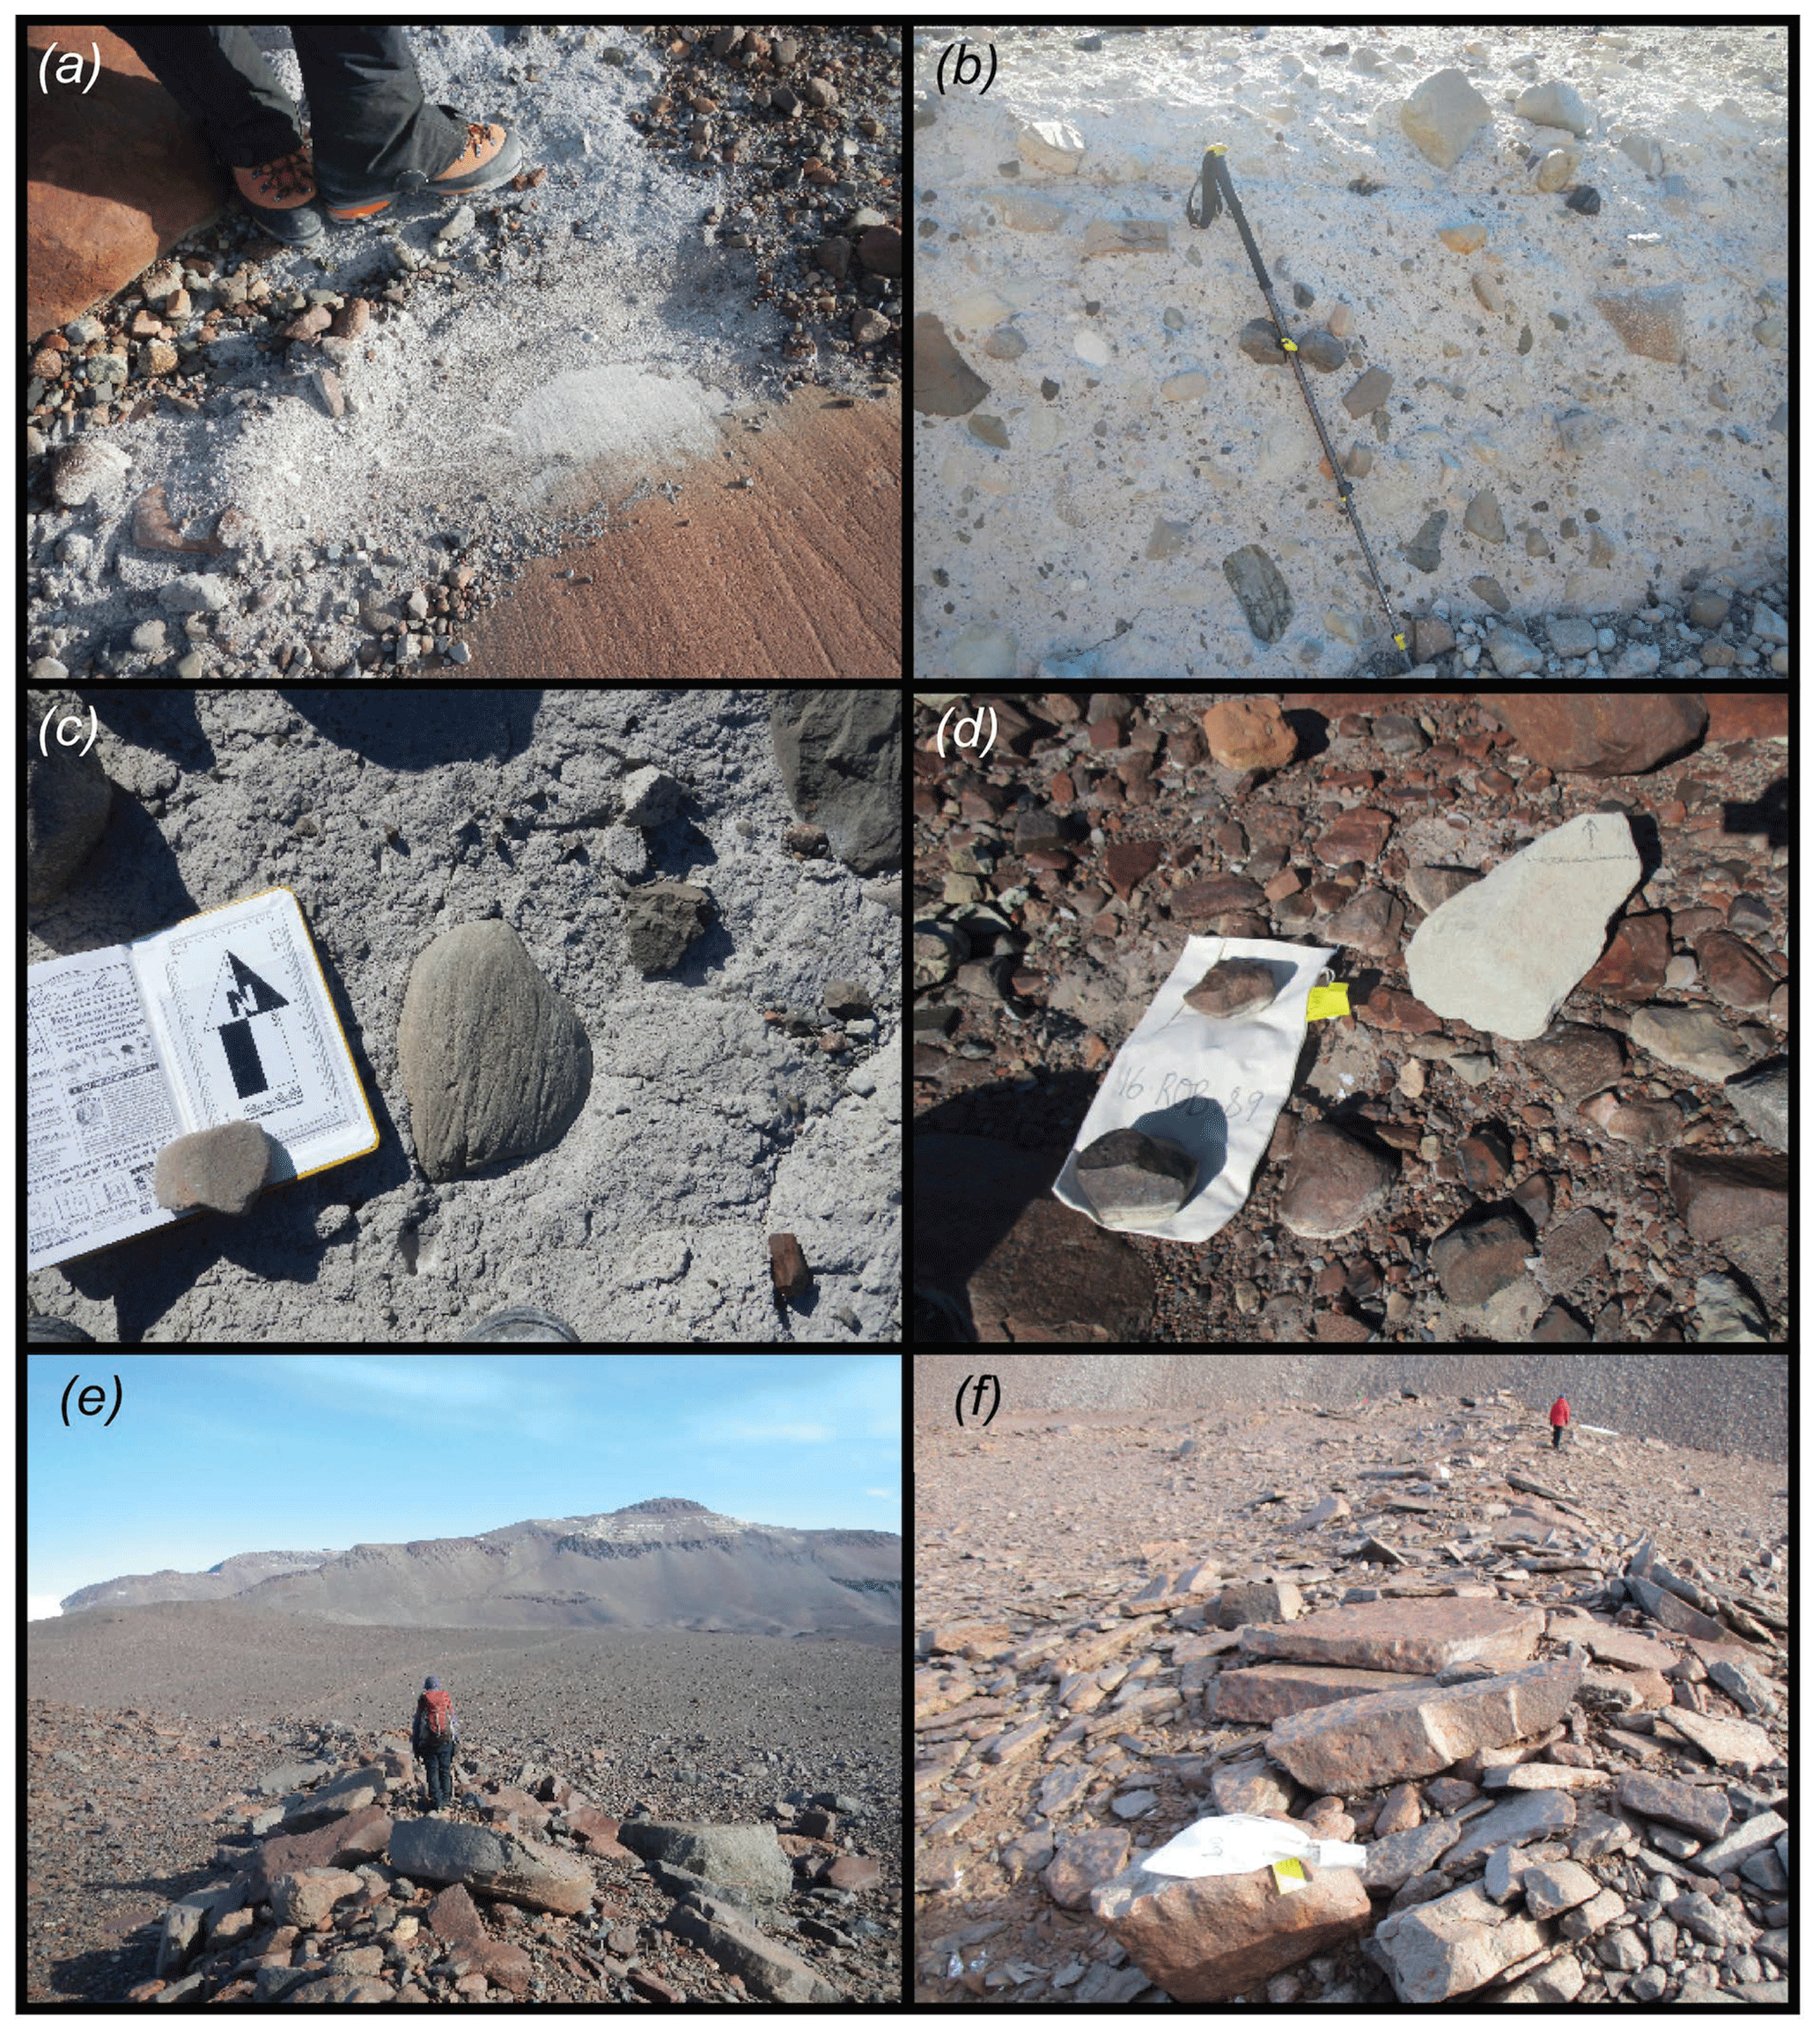
Figure 5Views of drifts and tills described at Roberts Massif. (a) The gray, fine-grained Sirius Group deposits atop striated dolerite bedrock; (b) Sirius Group exposed in section in the Bowl, with 120 cm long pole for scale; (c) striated, glacially molded Sirius cobble embedded in a fine-grained matrix; (d) sample 16-ROB-089-COL, a freshly scoured sandstone clast in the Bowl, likely deposited as a thin drift sheet atop older deposits during a Late Quaternary expansion of the EAIS; (e) cold-based AND moraine, which is Pleistocene in age; and (f) Misery B moraine, which is Miocene in age.

Figure 6Photographs of moraines and sampled boulders at Roberts Massif. (a) Blue-gray dolerite boulder 16-ROB-010-NLO on the second moraine from the modern EAIS in the Lower Roberts northern transect; (b) red-stained dolerite boulder 16-ROB-059-RIN on the Ringleader moraine, the outermost moraine in the Lower Roberts area; (c) relatively unweathered sandstone boulder 16-ROB-009-NLO; (d) red-stained and varnished sandstone boulder 16-ROB-062-RIN on the Ringleader moraine; (e) relatively unweathered, blue-gray dolerite boulder 15-ROB-064-MUS on the Musik moraine, the innermost moraine at Upper Roberts; and (f) weathered and red-stained dolerite boulder 15-ROB-038-ARM on the Arena moraine, the outermost moraine at Upper Roberts.
We identified and sampled for surface-exposure dating 15 moraines throughout the Lower Roberts area. We focused on the most prominent, laterally continuous moraines, which comprise accumulations of stacked boulders, and avoided the numerous discontinuous moraine mounds and isolated erratic boulders, from which former ice marginal positions are difficult to reconstruct. The stratigraphically oldest moraine in the Lower Roberts sequence, the Ringleader moraine (informal name) encircles the summit of the Central Rise, indicating that north- and south-flowing ice masses once converged to form a continuous ice surface across the Lower Roberts area at least ∼170 m higher than the modern ice margin to the north. From the Ringleader moraine, at the highest position in the Lower Roberts site, we sampled northern (extending from Ringleader to A in Fig. 4) and southern (extending from Ringleader to A′ in Fig. 4) moraine transects. Listed in stratigraphic order, the northern transect included the BAS, HDY, SSU, WBK, POS, AND, and NLO–NLI moraines (moraine initials correspond to informal names and sample ID suffixes listed in the ICE-D:ANTARCTICA online database and Table S1); from the southern transect we sampled the BBY, BGE, WAL, WIN, MON, and MNM moraines. Notably, the POS moraines constitute a complex of three main ridges, while the NLO–NLI moraines comprise two distinct ridges spaced only by ∼5 m.
The youngest deposit at Roberts Massif comprises a thin layer of sandstone and dolerite debris that extends several tens of meters beyond the current ice margins. Clasts are relatively unweathered (i.e., exhibit minimal staining and/or exfoliation) and exhibit fresh scuff marks (abrasions formed as cold-based ice drags entrained boulders across underlying surfaces; Atkins et al., 2002; Fig. 5f). With the exception of a few discontinuous segments, this unit generally is not associated with distinct moraines. Based on strong similarities in position, morphology, and relative weathering with deposits reported from other TAM sites (e.g., Todd et al., 2010), we correlate the youngest drift unit at Roberts Massif with the most recent late Quaternary expansion of Shackleton Glacier and EAIS and do not discuss it further.
Outboard of this relatively unweathered limit, drift and moraine boulders become progressively more weathered with distance from and elevation above the modern ice. For instance, dolerite boulders belonging to the outermost deposits of the HDY, BAS, and Ringleader moraines (up to 3 km from and 170 m above the modern ice margin) exhibit dark red staining, pitting of up to ∼0.5 cm depth, exfoliation up to ∼4 mm, and weathering rinds 1–2 mm thick, while the presence of sandstone clasts is increasingly rare (Fig. 6d). In contrast, dolerite boulders that we sampled on the innermost moraines were generally blue-gray in color and lacked significant weathering characteristics, such as staining or pitting (Fig. 6c). Although the boulders on the outermost moraines at Roberts Massif display more pronounced weathering than those on the inner moraines, the characteristics described here represent relatively minimal surface weathering compared to slightly warmer and wetter Antarctic locations, such as the McMurdo Dry Valleys. There, ∼3 Ma clasts, which are similar in age to those on the HDY, BAS, and Ringleader moraines (Sect. 3.4), display pitting of greater than 4 cm depth (Swanger et al., 2011). Additionally, we did not observe any cross-cutting relationships between moraine crests throughout Lower Roberts, either on the ground or in satellite imagery. Therefore, we conclude that moraines at this site increase in age with distance away from and elevation above the modern ice sheet surface. Altogether, these surfacemost deposits indicate that the Lower Roberts area records >15 prior expansions of cold-based ice.
3.1.2 Upper Roberts
The Upper Roberts site is situated on a steep, west-facing slope of Arena Peak, directly adjacent to the northward-flowing lobe of the EAIS that ultimately flows over the Bowl headwall (Fig. 7). Here, we mapped glacial drift and moraines identical in character to those at Lower Roberts, indicating deposition by a cold-based EAIS. Similar to observations at Lower Roberts, a fresh-looking drift of sandstone and dolerite boulders extends several tens of meters beyond the modern ice edge. At the Upper Roberts site, that fresh deposit is associated with a low-relief (∼1.5 m) ridge. We attribute this deposit to the most recent expansion of the EAIS during the Late Quaternary and do not discuss it further in this paper. We focused on five moraine ridges located along a vertical transect between ∼60 and 150 m above and oriented subparallel to the modern ice surface (2150 m). In order of descending elevation, we identified and sampled the Arena (2300 m), Eine (2260 m), Kleine (2240 m), Nacht (2220 m), and Musik (2220 m) moraines (informal names). Additionally, we mapped moraine segments preserved both within and above (up to ∼2500 m elevation) this transect, but, owing to lateral discontinuity and poor preservation on high-gradient slopes, we did not sample these limits for surface-exposure dating. As at Lower Roberts, the general increase in boulder-surface weathering (Fig. 6) and the absence of cross-cutting moraine stratigraphy (determined from field observations and satellite imagery; Fig. 7) suggest that glacial deposits at Upper Roberts become older with increasing elevation above the modern EAIS.
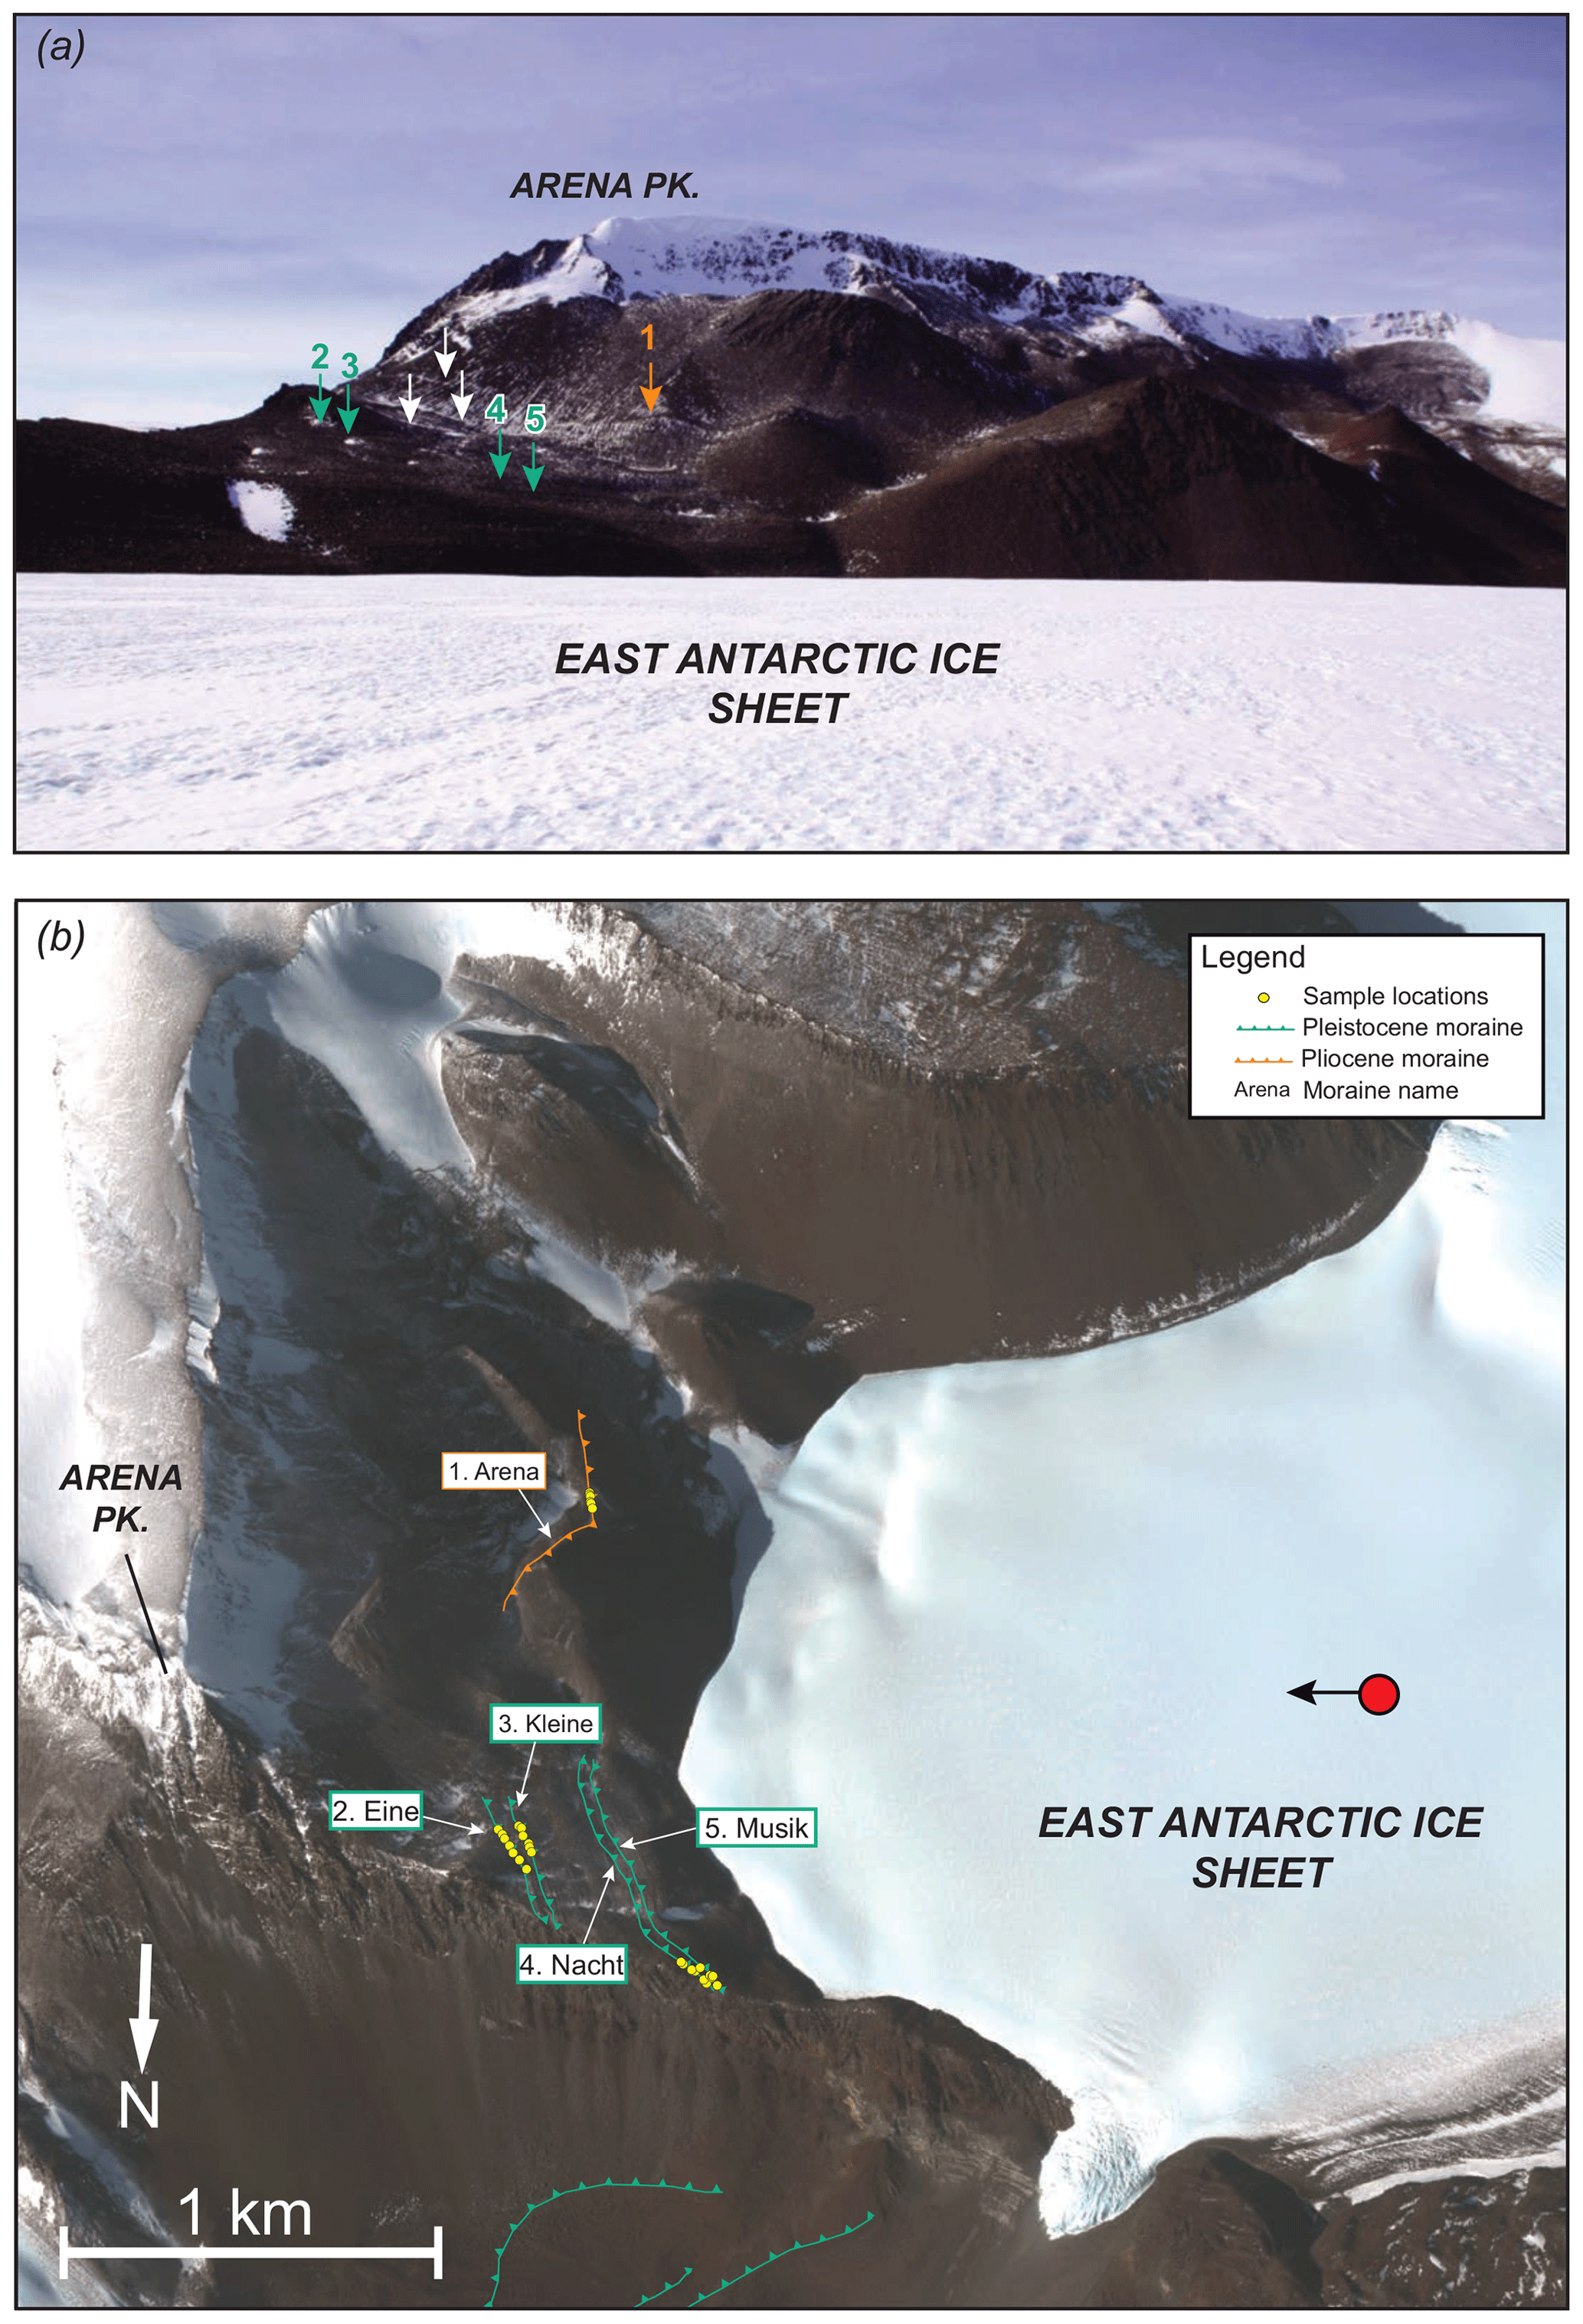
Figure 7Upper Roberts Massif. (a) Photograph of the Upper Roberts transect with moraines marked by arrows, numbered corresponding to sampled moraines in (b). White arrows in (a) denote undated moraines. (b) Geomorphic map of Upper Roberts. The red circle and arrow shows the location and vantage of photo in (a). The base map in (b) is derived from WorldView-2 satellite imagery (© 2017, DigitalGlobe, Inc.).
3.1.3 Misery Platform
Misery Platform is a broad, gently sloping platform in the southwest part of Roberts Massif (Figs. 3 and 8). Comprising the top surface of the hanging-wall block of a large normal fault, Misery Platform is bounded to the south by a ∼300–340 m high fault scarp. At the base of the scarp, we mapped a series of arcuate moraine ridges (here termed the Misery moraines), four of which we sampled for exposure-age dating (Figs. 8 and 9). The southern edge of the footwall block, which includes Misery Peak (2723 m elevation), drops steeply to the EAIS surface at ∼2200 m elevation and exhibits south-facing, amphitheater-shaped valleys that are occupied partially by north-flowing lobes of the EAIS (Fig. 8). The largest of these valleys is located directly south of the Misery moraines, and its extension above the current surface of the EAIS suggests that this lobe of ice was significantly thicker in the past. Further, a thin drift of glacial erratics atop the footwall block at ∼2550 m elevation marks where a north-flowing lobe of the EAIS overtopped the broad slopes east of Misery Peak and cascaded down the escarpment, where it deposited the Misery moraines on the platform below. This interpretation requires that the Misery moraines (a) postdate the formation of the fault scarp and (b) were deposited by an EAIS that was sufficiently thick (>300 m above the current surface) to overtop the footwall block. Although the Misery moraines are similar in elevation to those sampled at Upper Roberts, they represent the highest former ice surface elevation of the EAIS examined in this study.
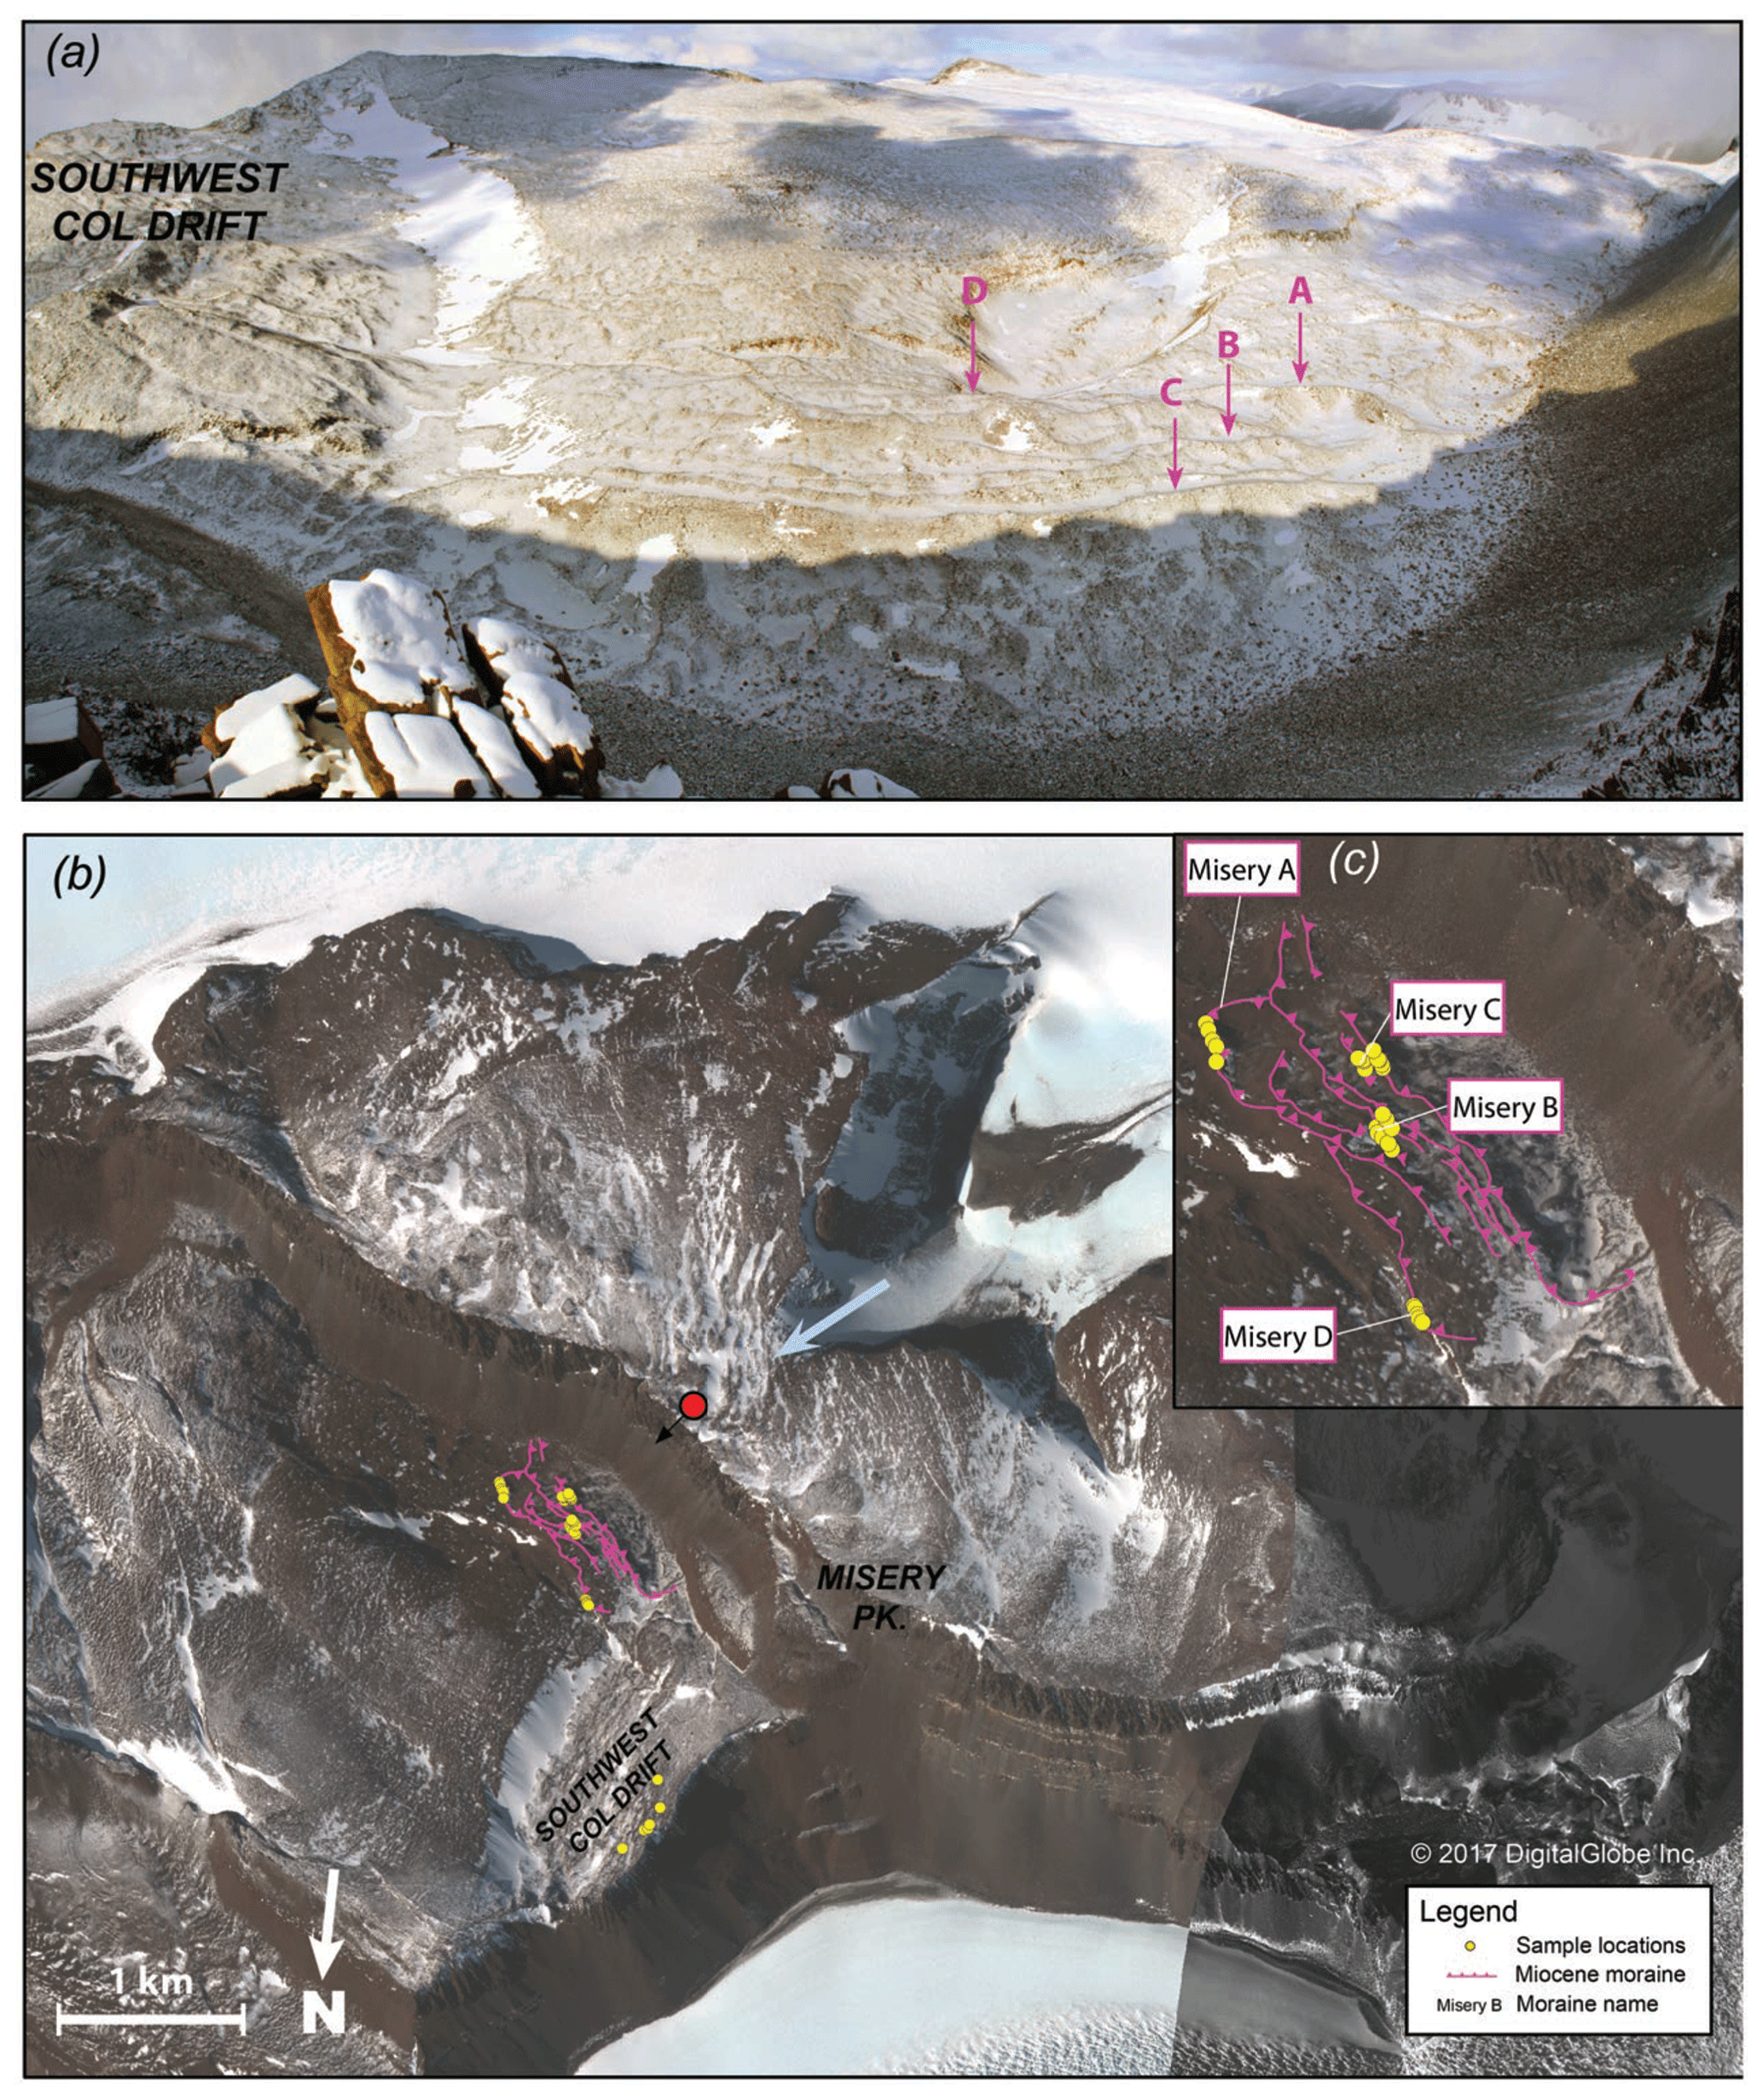
Figure 8Map of Misery Platform. (a) Photo of the Misery moraines. Pink arrows point to the sampled Misery moraines and are labeled with the corresponding moraine letter. The location of the Southwest Col drift is also labeled. The photo was taken from the location of the red circle in (b) looking in the direction of the black arrow (vantage to the northeast). (b) Geomorphic map of the Southwest Col area. The Southwest Col drift mantles the bedrock outboard of the Misery moraines. The blue arrow denotes the direction of ice flow when the Misery moraines were deposited. (c) Closer view of the Misery moraine complex. The base map in (b) and (c) is derived from WorldView-2 satellite imagery (© 2017, DigitalGlobe, Inc.).
Compared to moraines at Lower and Upper Roberts, the Misery moraines are relatively broad and high-relief (∼2–5 m high) and comprise finer matrix material (silt-to-gravel). Moraine crests are mantled with angular dolerite boulders exhibiting pronounced weathering features, including deep red-to-purple staining, 2–3 mm thick weathering rinds, and ventifaction pits of up to 2 cm depth. On the basis of these physical characteristics, they appear older than the outermost moraines at both Lower and Upper Roberts. Therefore, we interpret the Misery moraines as cold-based ice-marginal features marking the ostensibly oldest and most extensive EAIS terminus positions that we documented at Roberts Massif. We used cross-cutting relationships of the Misery moraines to determine their stratigraphic order. From outermost (oldest) to innermost (youngest), we sampled boulders on the following moraine crests: Misery D, Misery A, Misery B, Misery C (note that the designations A–D are field designations reflecting the sequence of sample collection, not the stratigraphic order; Fig. 8). Importantly, we avoided sampling adjacent to overlapping moraine segments.
Immediately outside of, and stratigraphically underlying, the Misery moraines, the weathered bedrock surface is mantled with a thin patchy ablation till, dominated by dolerite boulders and a small number of sandstone clasts, and associated with a coarse-grained sand and gravel deflation surface. We observed this unit throughout Misery Platform and collected samples for surface-exposure dating from boulders on Southwest Col, located approximately 1.5 km northwest of the Misery moraine complex and 400 m above the modern surface of Shackleton Glacier (Fig. 8). Here, the ablation till (“Southwest Col drift”) mantles a bedrock surface of heavily stained and deeply exfoliated coarse-grained dolerite. In places, granular sediments fill joints and depressions in the bedrock. These sediments are characterized by red-stained silt-to-gravel-sized grains, which may derive from the disintegration of the dolerite bedrock, and gravel-to-cobble-sized clasts of various lithologies. In contrast to the Sirius Group deposits observed elsewhere at Roberts Massif, boulders comprising Southwest Col drift are predominantly dolerite (as opposed to a broad mix) and generally more angular.
We sampled three dolerite clasts (one boulder and two cobbles) and four sandstone clasts (three boulders and one cobble), all of which are perched on bedrock and/or interstitial sediments, for surface-exposure dating. The surface of the dolerite boulder (15-ROB-28-COL) exhibits deep red staining and evidence of significant wind abrasion, except on the lee side where there is a thick red-brown weathering rind (Fig. 9). The sandstone boulders (15-ROB-32-COL, 15-ROB-33-COL, and 15-ROB-34-COL) exhibit orange-to-red staining, surface varnish, and ventifaction of up to 4 cm depth. Based on the thin nature of this deposit, we interpret the Southwest Col drift as a cold-based ablation till deposited by the EAIS. Owing to its weathering state, we suggest that this deposit is the oldest glacial unit in our record. Surface-exposure ages from this site therefore provide a minimum-limiting age for temperate glaciation at Roberts Massif.
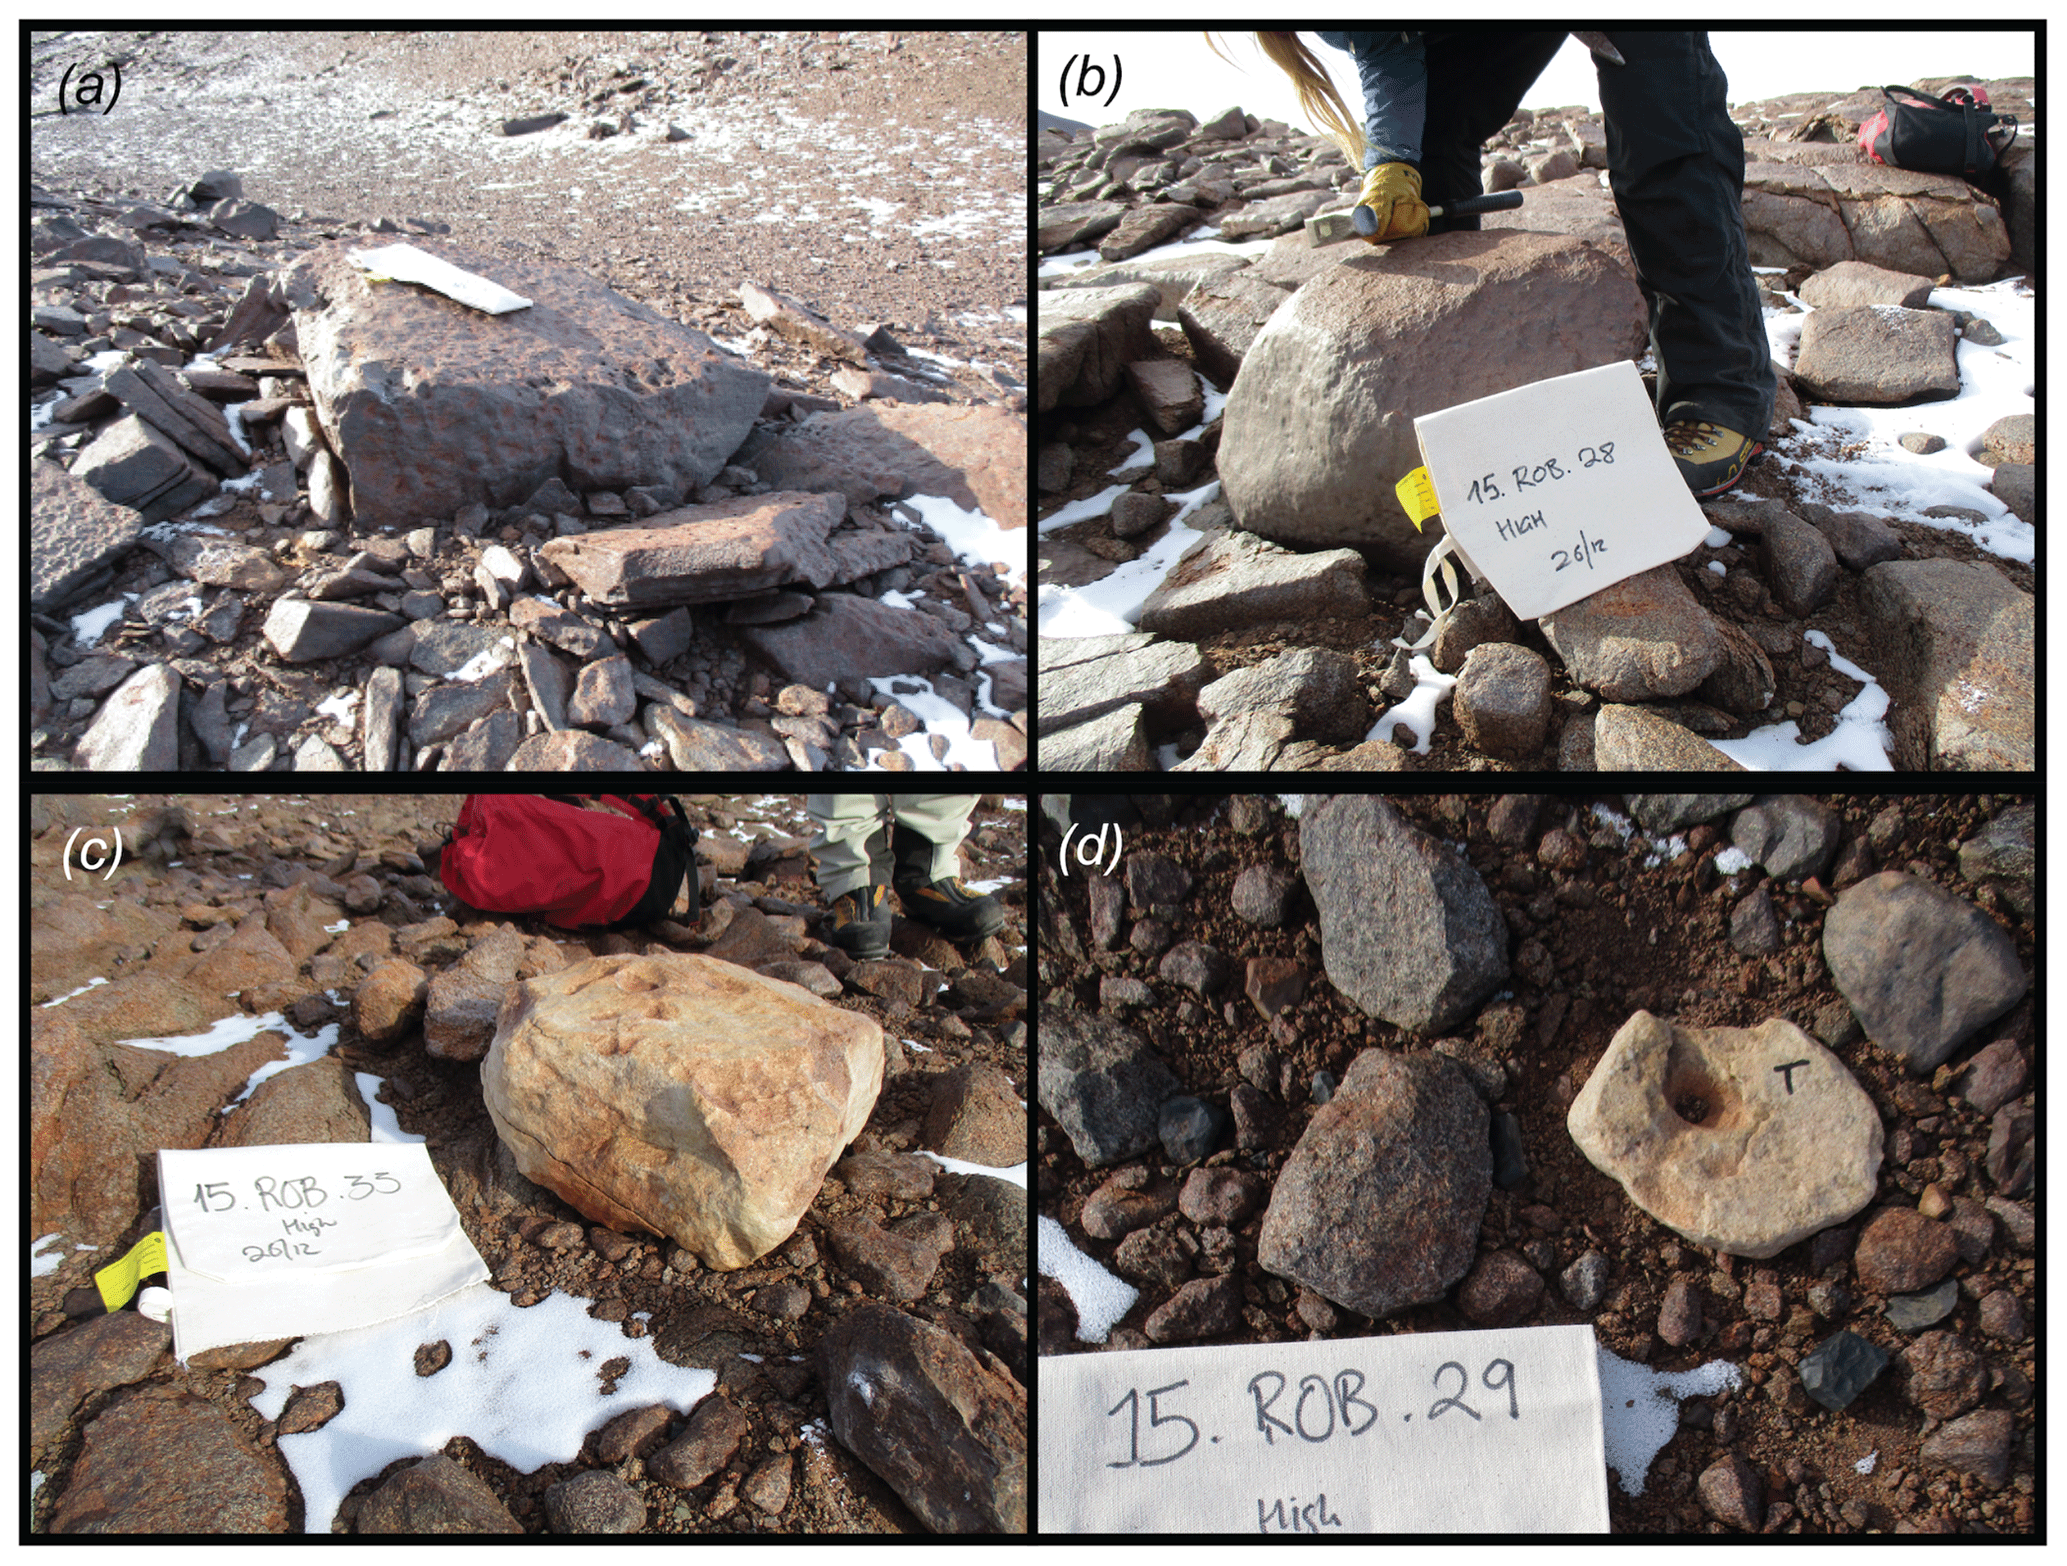
Figure 9Photographs of boulders from the Misery Platform. (a) dolerite boulder 15-ROB-017-MZC on the Misery C moraine; (b) Dolerite boulder 15-ROB-028-COL at the Southwest Col; (c) sandstone boulder 15-ROB-035-COL at the Southwest Col; (d) Sandstone cobble 15-ROB-029-COL at the Southwest Col.
3.1.4 Summary of field observations
We mapped three primary surfaces at Roberts Massif (listed in stratigraphic order): glacially molded and striated dolerite bedrock, temperate-style tills belonging to the Sirius Group, and cold-based drifts associated with openwork boulder moraines. All samples collected for surface-exposure dating are derived from the cold-based deposits marking former positions of the EAIS. At both the Lower and Upper Roberts sites, weathering patterns and the lack of cross-cutting moraines suggest that relative moraine ages increase with distance from, and elevation above, the modern ice sheet margin. Deposits on Misery Platform (the Misery moraines and the Southwest Col drift) exhibit more advanced subaerial weathering than our other sites, indicating that these deposits are significantly older. In Sect. 4.2, we describe results from cosmogenic-nuclide measurements made on samples from 23 separate moraine ridges and one drift sheet.
3.2 Results from cosmogenic-nuclide measurements
We made 293 cosmogenic 3He measurements in pyroxene from 155 dolerite boulders, 32 21Ne and 13 10Be measurements in quartz from 13 sandstone boulders, and two 26Al measurements in quartz from two sandstone boulders (also measured for 21Ne and 10Be). Samples were derived from 23 distinct moraine crests and one glacial drift sheet (Southwest Col). Apparent exposure ages span two periods: ∼13–8 Ma at Misery Platform and ∼3 Ma–400 ka at Upper and Lower Roberts (Tables 1 and S1). “Apparent” exposure ages refer to the calculated age of the boulder given the measured nuclide inventory, assuming that the boulder has experienced only one period of exposure, with no erosion or burial during that time. Boulder information, nuclide concentrations, complete step-degassing results for 3He and 21Ne are summarized in Tables S2, S3, and S5, and the full dataset is archived online in the ICE-D:ANTARCTICA database (http://antarctica.ice-d.org, last access: 22 July 2020). In this section, we summarize these cosmogenic-nuclide data and highlight the possible effects of surface erosion and other geomorphic processes on exposure ages, which ultimately lead us to estimates of the emplacement age of the moraines.
Table 1Roberts Massif moraine and drift ages and statistics.
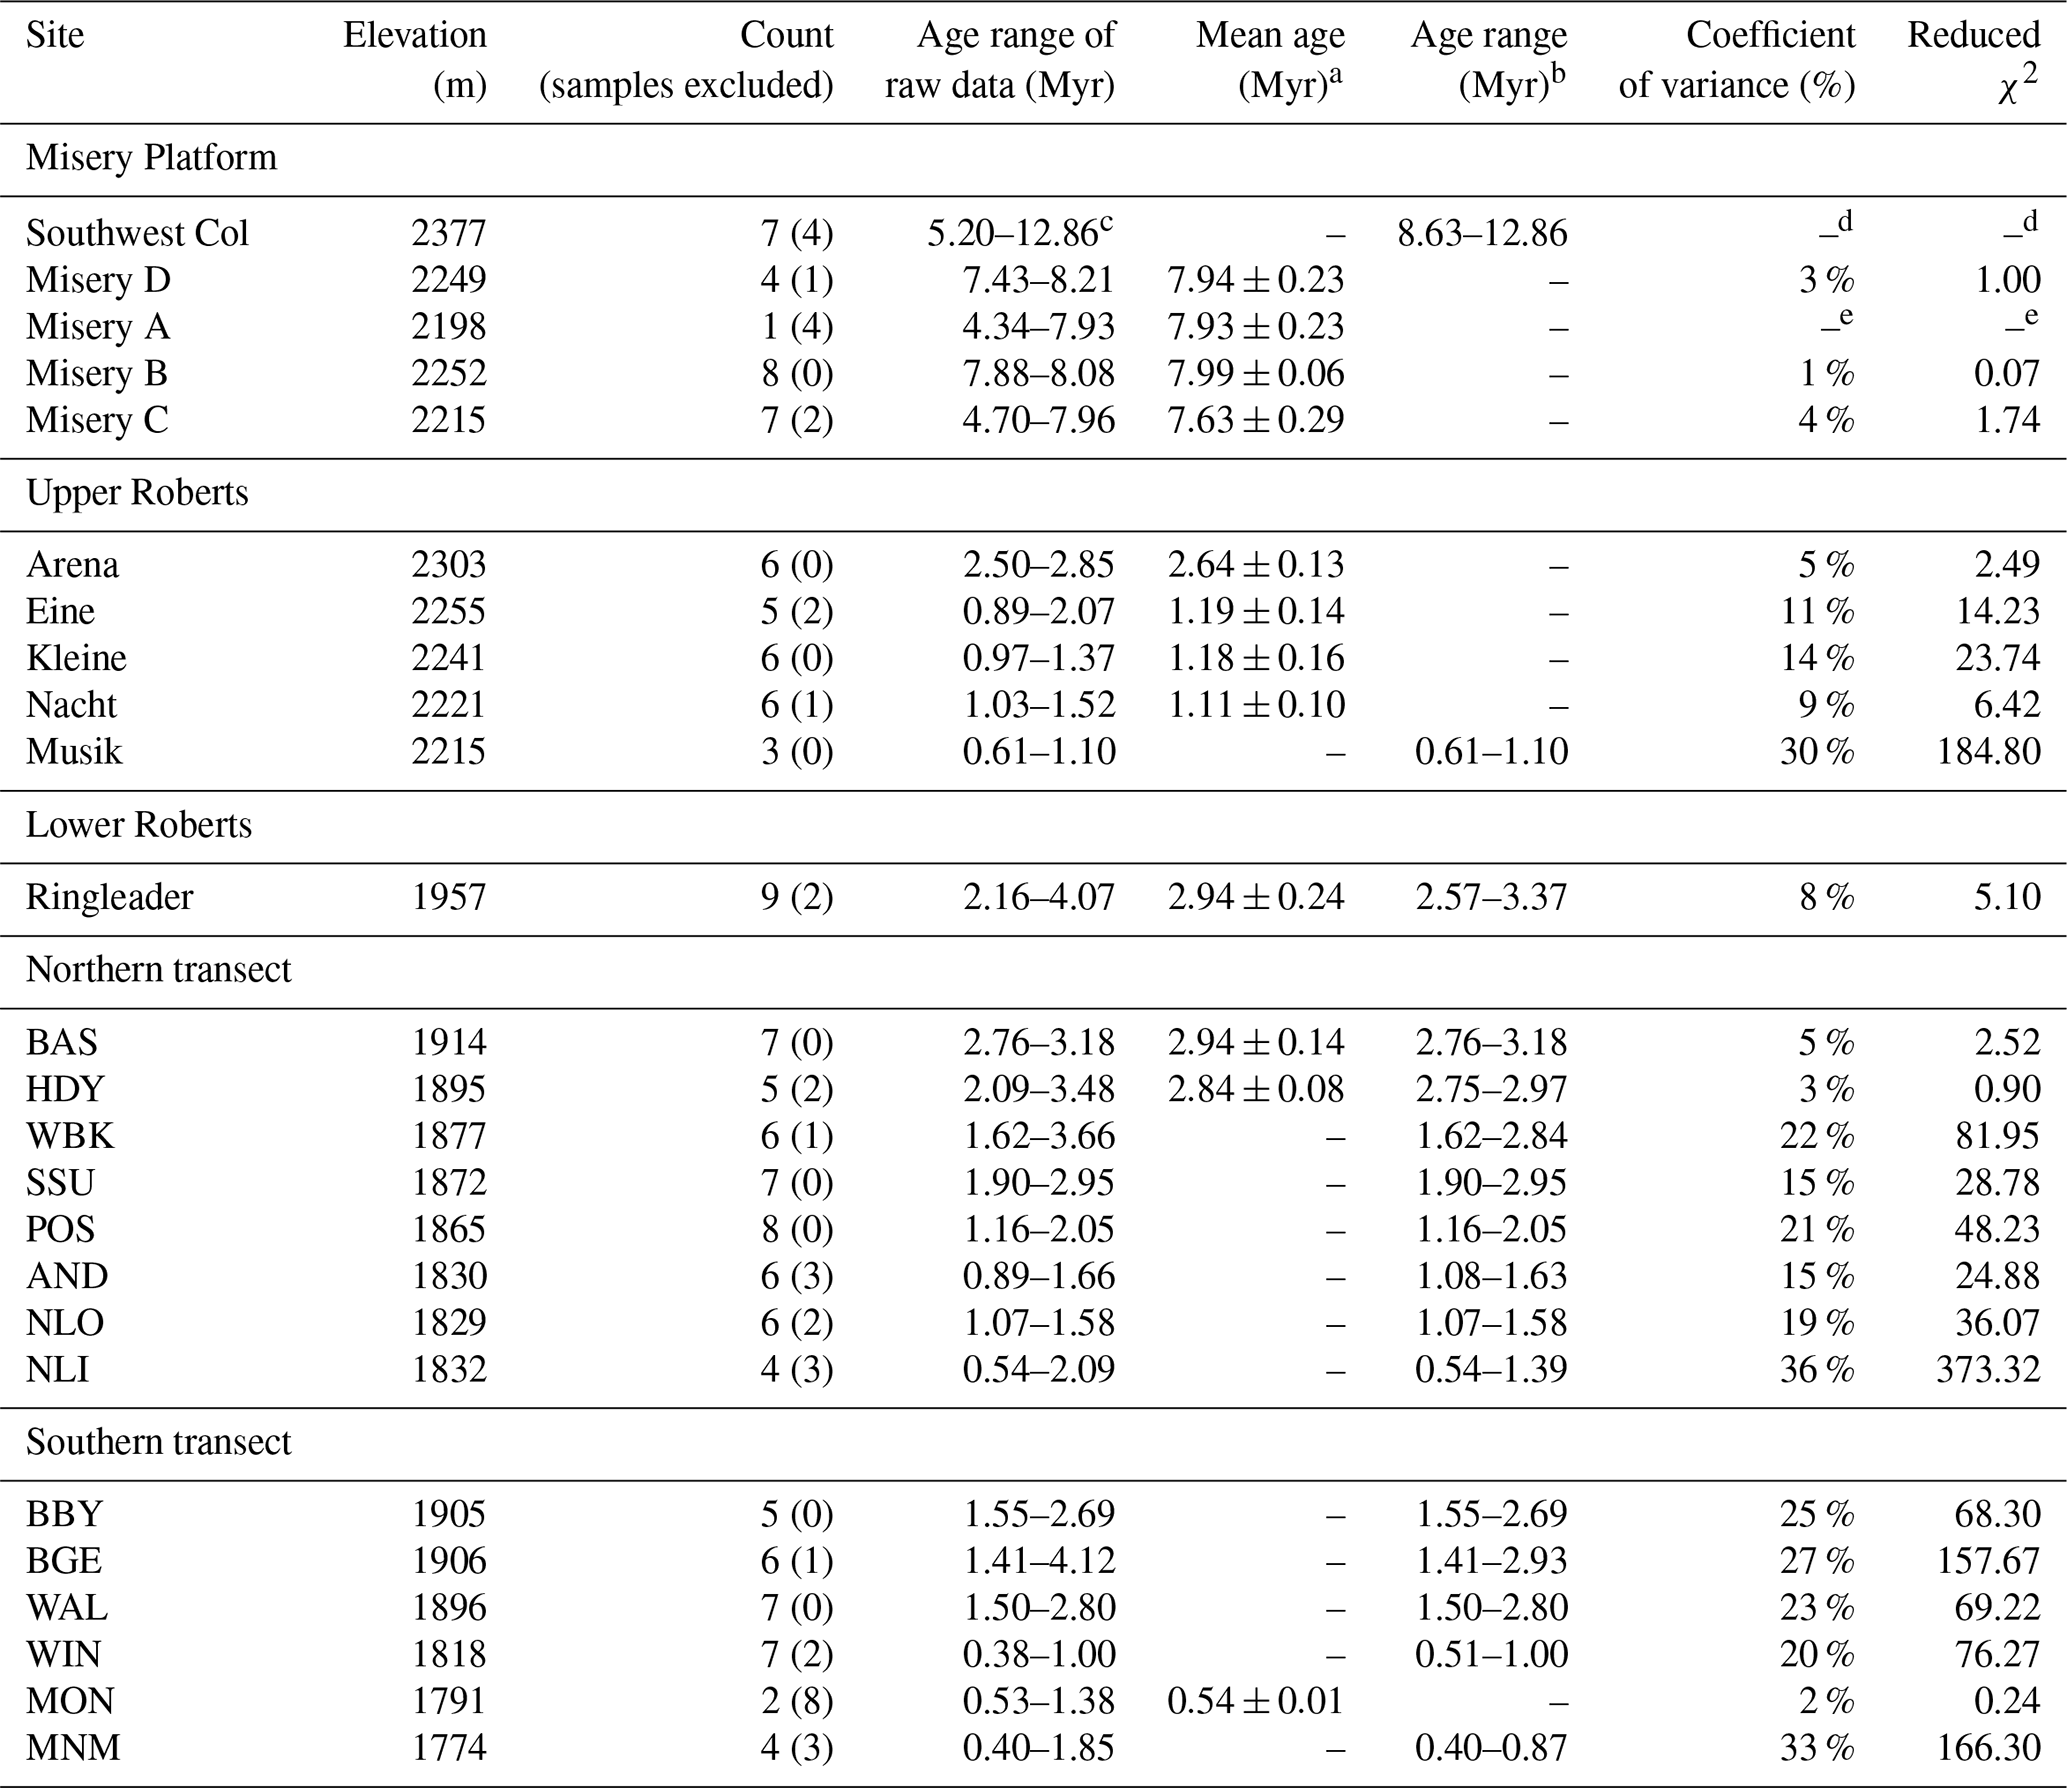
a Used for moraines with age distributions close to normal and/or a coefficient of variance <15 %. b Used for moraines with non-normal (scattered) age distributions which have a coefficient of variance >15 %. c Four youngest ages, obtained from 10Be measurements, are near saturation and thus not considered. d Population statistics only presented for moraines. e All boulders but one are considered outliers on Misery A.
3.2.1 Constraints on erosion rates from paired 10Be–21Ne measurements
As a majority of landforms at Roberts Massif are several million years old, quantifying the magnitude of surface erosion is key to accurate exposure dating. Here, we summarize geochemical data and field observations that allow us to place limits on long-term erosion rates. Four sandstone erratics at Southwest Col have 10Be concentrations close to predicted production-erosion saturation values, and apparent 21Ne exposure ages of 9–12 Myr. As these samples have nearly the highest concentrations of these nuclides yet measured on Earth, concentration measurements are correspondingly (and unusually) precise, making it possible to use the paired 10Be–21Ne data to simultaneously infer exposure ages and surface erosion rates from these samples (Fig. 10; Gillespie and Bierman, 1995; Lal, 1991). Given the assumption that these samples have experienced continuous exposure at a steady erosion rate, the 10Be–21Ne data imply true exposure ages in the range of 12–15 Myr but varying surface erosion rates in the range of 0.5–3 cm Myr−1. These low erosion rates are consistent with our field observations pertaining to surface erosion of these sandstones as described in Sect. 3.1.3.

Figure 1010Be–21Ne normalized two-nuclide diagram for Southwest Col sandstone erratics. Blue lines are isolines of constant steady erosion (cm Myr−1); black lines are isolines of constant exposure age (Myr). The diagram is constructed using LSDn production rate scaling and a 21Ne∕10Be production ratio of 4.03 (Balco et al., 2019). Note that the x coordinate, the 21Ne concentration normalized to the production rate, is equivalent to the apparent 21Ne exposure age. Although apparent 21Ne exposure ages for these samples are 9.5–13 Myr, the two-nuclide diagram shows that the data are better explained by 12–15 Ma exposure at erosion rates between 0.5 and 3 cm Myr−1.
Apparent 3He exposure ages from three dolerite clasts also located on Southwest Col, and which therefore should have the same true exposure age as the sandstone clasts, are 8.6, 10, and 11 Myr. Assuming that the true exposure age of the deposit is no greater than 14.5 Myr, as implied by the two-nuclide data for the highest-nuclide-concentration sandstone (15-ROB-032-COL) shown in Fig. 10, this implies maximum erosion rates for the dolerite clasts of 3.8, 2.7, and 1.9 cm Myr−1, respectively. Further assuming that the dolerite clast with the highest 3He concentration (15-ROB-028-COL) has been exposed at the drift surface for the longest period, and has therefore experienced mainly surface weathering rather than exhumation from till, we propose that ∼2 cm Myr−1 is likely a maximum limit on rock surface erosion rates for dolerite surfaces in our study area. The assumption that this clast has been exposed at the surface is supported by the fact that 15-ROB-028-COL is a boulder, while the rest of the dolerite surfaces we sampled on Southwest Col are cobbles. If the deposit is younger than 14.5 Myr, an even lower erosion rate would be implied. Although this is an extremely low surface weathering rate by global standards, it is nonetheless consistent with the polar desert climate and the field observations described in Sect. 3.1.3 (i.e., angular clasts with surface varnish and minimal pitting).
3.2.2 Information about geomorphic processes from multiple-nuclide measurements
As on Southwest Col, we also measured multiple nuclides (10Be and 21Ne and, in one case, 26Al) in several sandstone boulders on the Ringleader, WIN, MON, AND, and NLO moraines at Lower Roberts (Fig. 11). Although sandstone clasts are rare on these moraines, these data provide some insight into the exposure history of these boulders that we can use to assess the importance of inheritance and postdepositional disturbance for moraine exposure ages.
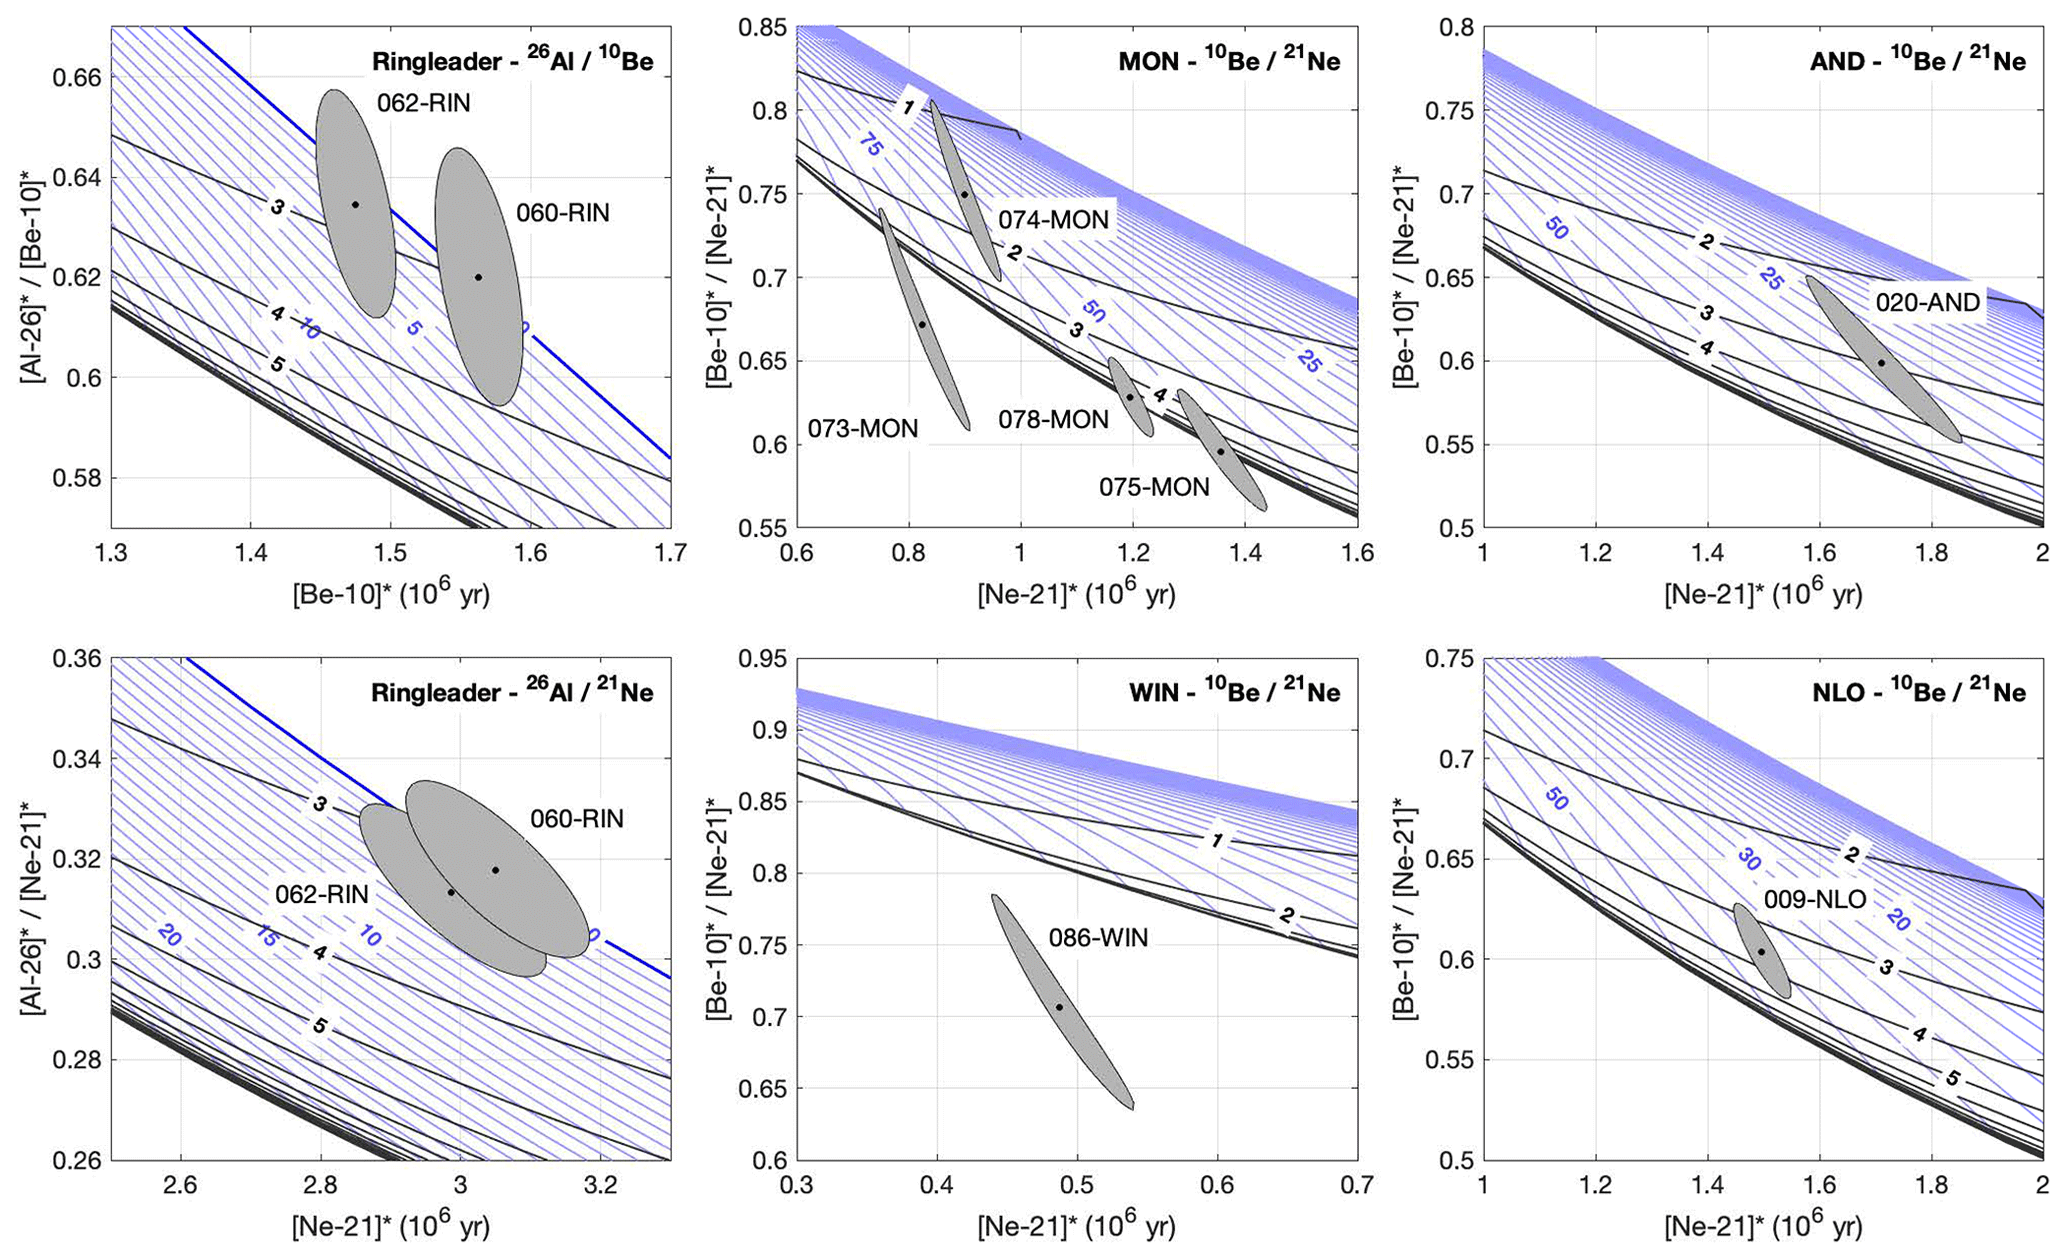
Figure 11Two-nuclide diagrams for all sandstone erratics collected from Lower Roberts Massif moraines. The construction of the diagrams is the same as in Fig. 10. Two-nuclide data for sandstones on the Ringleader moraine lie on the simple exposure line and are in agreement with 3He ages, suggesting that these samples experienced a single period of exposure at negligible erosion, and their apparent ages are a good estimate of the true age of the moraine. On the other hand, paired-nuclide data from sandstones on the MON, WIN, AND, and NLO moraines require either significant erosion or a multistage exposure history. An erosion explanation would predict that their apparent ages should be younger than 3He ages on the same moraines; as this is not the case, these samples most likely experienced a multistage exposure history and therefore were emplaced with significant nuclide inheritance.
In general, a boulder that has experienced a single period of exposure that is equal to the emplacement age of the moraine should display concordant 10Be, 21Ne, and 26Al ages that are the same as those of other boulders on the moraine. For the Ringleader moraine (Fig. 11), 10Be–21Ne–26Al measurements are concordant at 2.8–3 Ma, therefore consistent with simple exposure at negligible erosion, and lie in the center of the range of 3He ages from dolerite clasts on the same moraine (Fig. 12). These observations suggest that (i) the sandstone boulders have experienced a single period of exposure with minimal postdepositional exhumation or weathering, which is consistent with our field observations as described in Sect. 3.1.1; (ii) their exposure age most likely represents the true emplacement age of the moraine; and (iii) two outliers in the 3He age distribution can likely be attributed to both inheritance (one ∼4 Myr age) and postdepositional disturbance (one ∼2 Myr age).
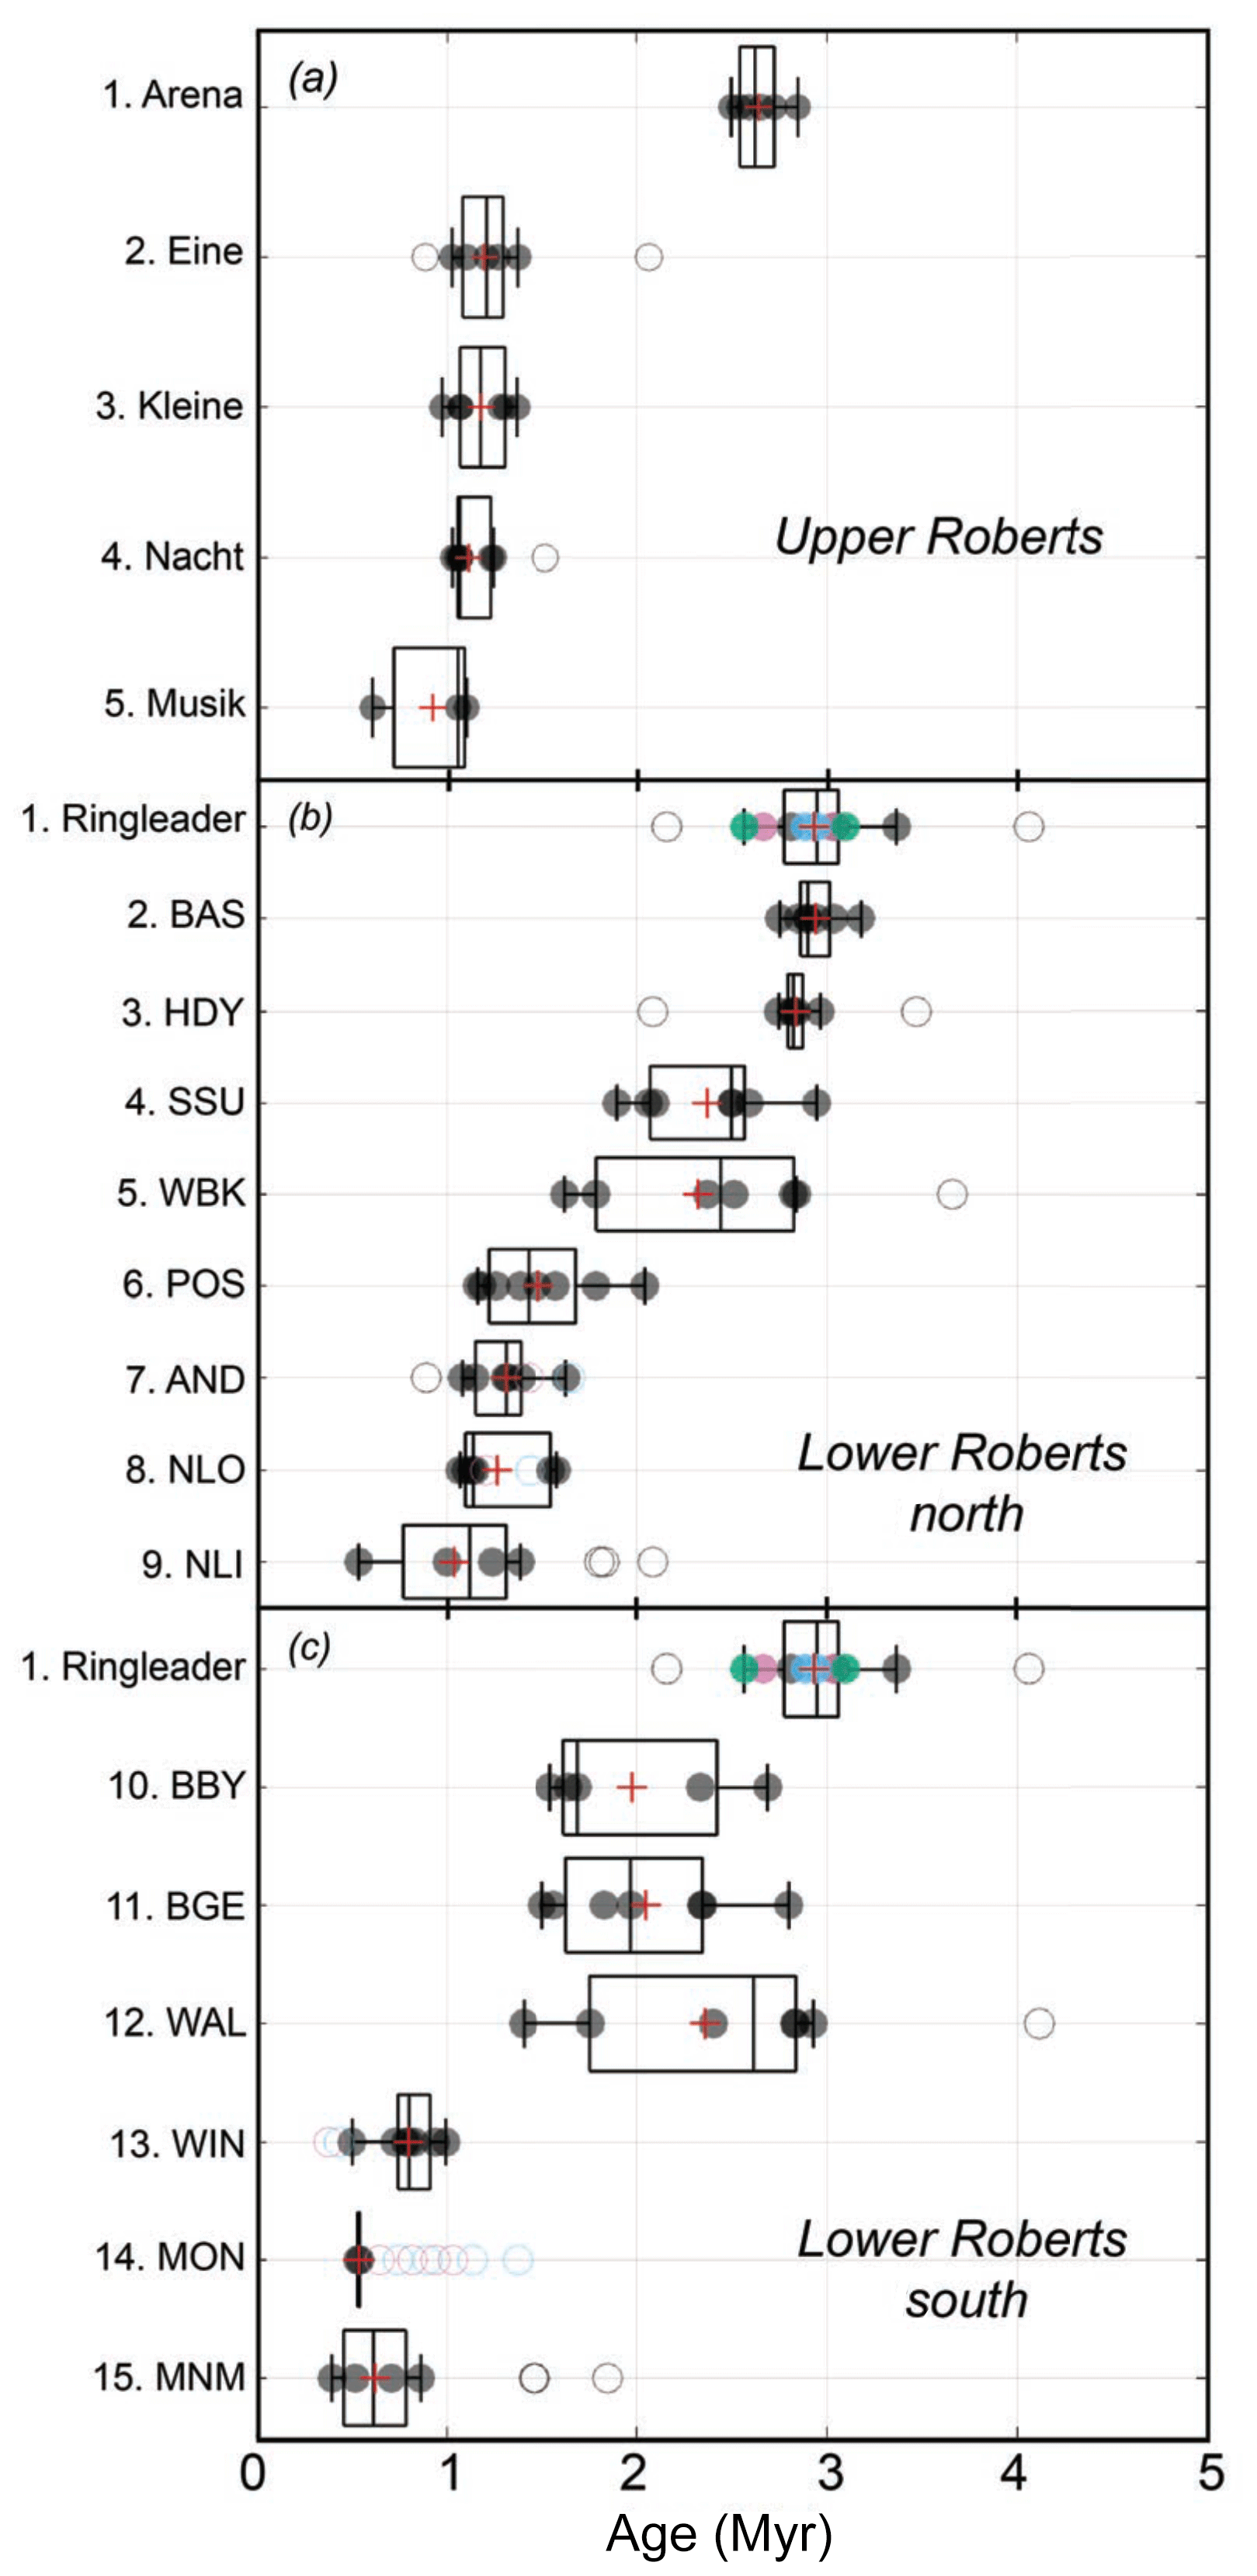
Figure 12Boxplots showing moraine ages for the Plio-Pleistocene part of the Roberts Massif record. Moraines for each site (Upper Roberts and Lower Roberts northern and southern transects) are listed in stratigraphic order, with the outermost moraine at the top of each panel. Moraine numbers in (a) correspond to those in Fig. 7, while moraine numbers in (b) and (c) correspond to those in Fig. 4. The Ringleader moraine is shown in both panels (b) and (c), as it is the uppermost moraine in both Lower Roberts transects. 3He ages are black; 21Ne ages are blue; 10Be ages are pink; and 26Al ages are green. Outliers are shown as open circles. The average moraine age is denoted by a red plus symbol.
In contrast, paired 10Be–21Ne measurements on four boulders on the MON moraine and one on the WIN moraine (Fig. 11), both adjacent to the Bowl and emplaced by ice from Upper Roberts overflowing the Bowl headwall (Fig. 4), display discordant apparent ages. Additionally, apparent exposure ages from both sandstone and dolerite boulders at these moraines are relatively scattered (coefficient of variance >20 %). The 10Be–21Ne data (Fig. 11) could be explained either (i) by an extended period of steady erosion at an ice-free site prior to entrainment and deposition of the clasts or (ii) by repeated exposure and ice cover of the samples prior to emplacement. Both of these conditions are likely if these boulders were sourced from the adjacent outcrop area of sandstone on the Bowl headwall (Fig. 4a). Thus, we consider it most plausible that the apparent exposure ages of these sandstones reflect prior exposure and, thus, overestimate the true age of the moraine. In general, these results imply that high scatter in exposure ages for moraines in the Bowl are most likely explained by inherited nuclide concentrations in clasts sourced from the adjacent headwall, and the true ages of the moraines are therefore likely close to the young end of their age distributions.
Finally, paired 10Be–21Ne measurements from the AND and NLO moraines (Fig. 11), both at the ice-proximal end of the northern Lower Roberts transect, fall within the “erosion island” on the two-nuclide diagram, indicating that their true exposure ages are older than the apparent ages for either nuclide. In addition, these clasts have apparent ages higher than most 3He ages from these moraines (Fig. 12). Again, this is best explained if the scatter exhibited by these moraines is largely the result of inheritance.
Overall, although we have a relatively small number of multiple-nuclide data from sandstone boulders, our results demonstrate that (i) inheritance is unequivocally present in some moraine boulders and (ii) inheritance is likely most significant at moraines where boulders are likely sourced from a combination of far-traveled EAIS subglacial debris and cliff fall within the massif itself. These scenarios are also consistent with the observation that boulders on moraines at Upper Roberts, which can only be derived from beneath the EAIS, exhibit substantially less scatter than moraines at Lower Roberts (Table 1 and Fig. 12), where additional input from rockfall is likely. Overall, while none of our observations exclude postdepositional disturbance as a potential source of scatter, they do show that inheritance is likely a more important contributor. However, the small number of young outliers in our dataset (Fig. 12) may reflect the ablation of an ice core from the moraine.
3.3 Outlier elimination
For each moraine dated, we measured cosmogenic nuclides in six to eight individual clasts. We observed a variety of distributions ranging from tightly grouped age sets, which likely reflect dispersion due to measurement uncertainties alone, to highly scattered distributions with both old (indicative of nuclide inheritance) and young outliers (e.g., due to ablation of an ice core from the moraine, subaerial weathering, and/or postdepositional disturbance such as rock toppling or cracking). To interpret these age distributions and arrive at realistic estimates of the moraine age, we utilized constraints from field observations, the stratigraphic ordering of the moraines, exposure-age trends across moraine transects, and measurements of multiple nuclides in various clasts (see above).
We first considered geomorphic stratigraphy, weathering characteristics, and trends in exposure-age distributions to identify and eliminate outliers. For Misery Platform, we utilized the cross-cutting relationships of the Misery moraines, which elucidate relative age, to identify exposure ages that are outliers. Although we did not observe such cross-cutting relationships at Upper and Lower Roberts, we exploited the fact that both apparent exposure ages and physical weathering state increase with distance from and elevation above the modern ice margins to determine relative ages of the moraines and thus to identify likely outliers.
We performed an initial screening to remove outliers by assuming that the true depositional age of each moraine lies within the range of measured exposure ages on this moraine. If true, then any exposure ages on one moraine that are older than all exposure ages on a stratigraphically older moraine must be erroneous. Likewise, any exposure ages that are younger than all ages on a stratigraphically younger moraine must also be erroneous. Applying this rule recursively to stratigraphically ordered sets of moraines resulted in the rejection of 46 measurements on 22 boulders (Figs. 12 and 13; Table S1). We also rejected nine measurements on five boulders as outliers likely resulting from geomorphic processes (i.e., inheritance or postdepositional disturbance), which were not rejected as stratigraphic outliers yet are >2σ beyond the main age population on that moraine (see Table S1). After this stratigraphic screening was complete, we also rejected as outliers 14 nonconcordant 10Be and 21Ne measurements on 10 sandstone boulders located on the NOLO, AND, WIN, and MON moraines, as those boulders likely contain inherited nuclides (see discussion in Sect. 3.2.3). In total, we rejected 69 measurements on 37 boulders (Figs. 12 and 13; Table S1).
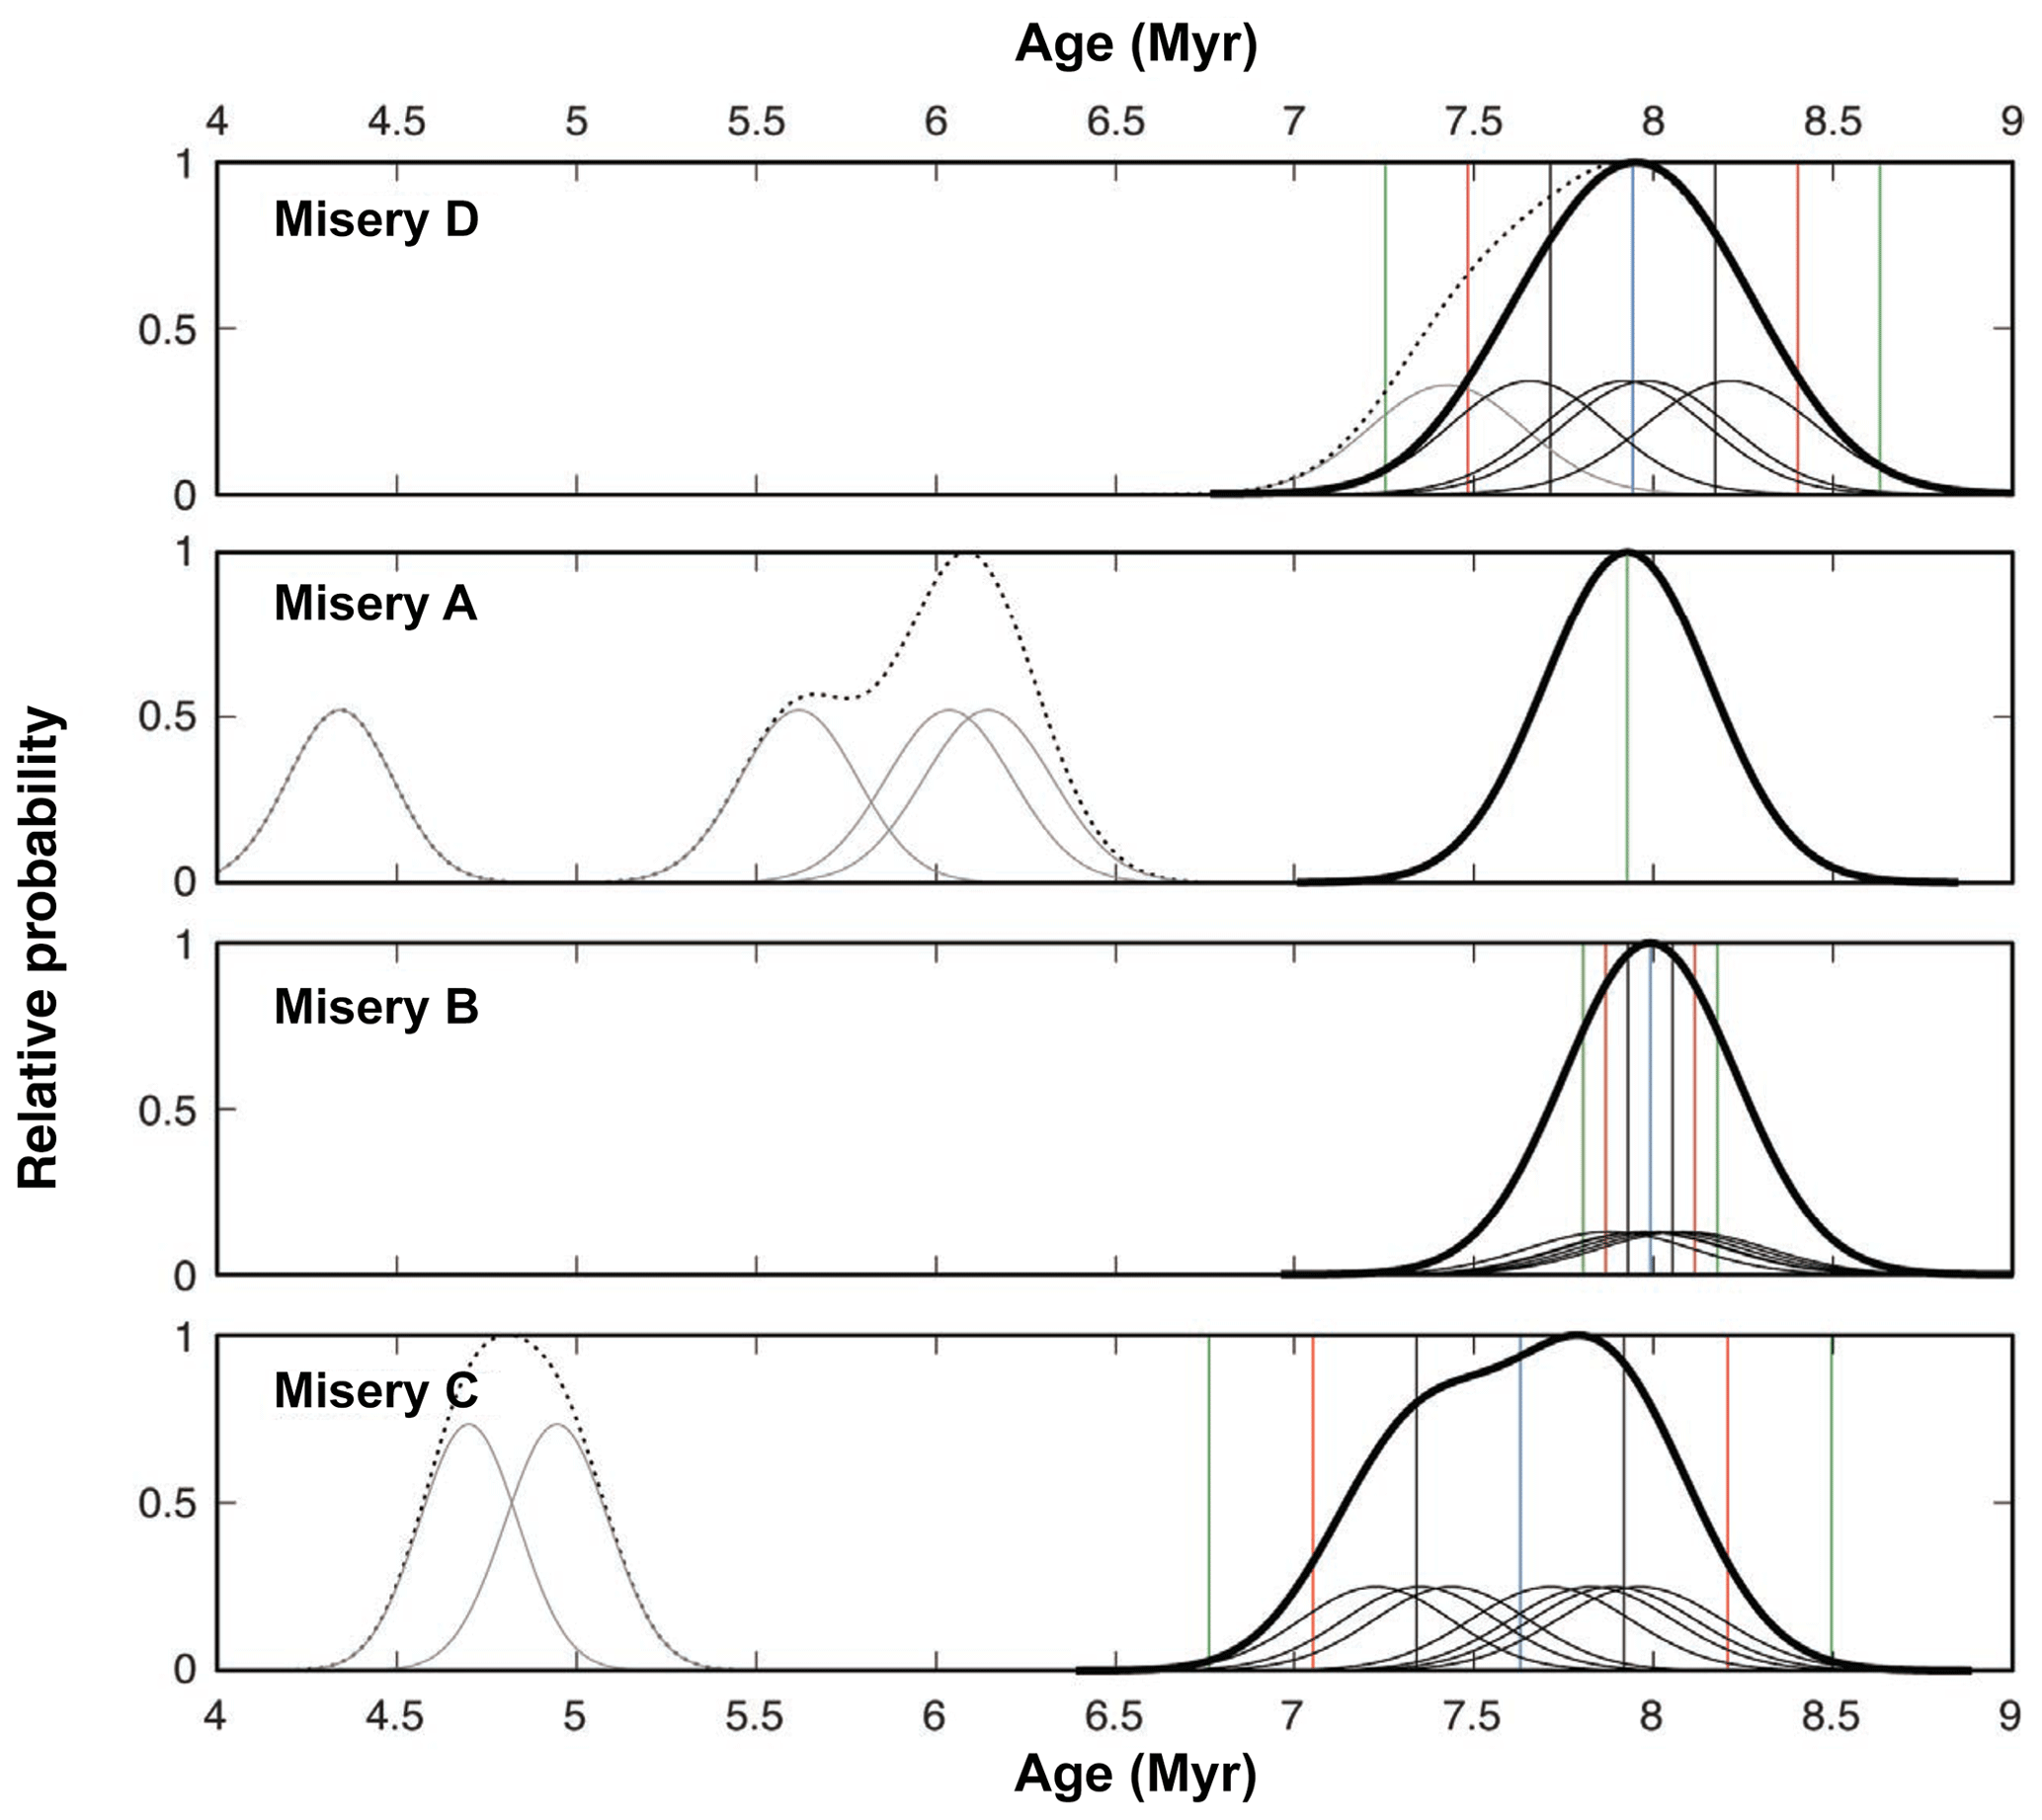
Figure 13Camel plots (i.e., normal kernel density functions) for the four Misery moraines. The arithmetic mean of the reduced dataset is denoted by the blue line, while the 1σ, 2σ, and 3σ uncertainty envelopes are shown in black, red, and green, respectively. Dotted black lines show the summed probability distributions for the full dataset, including outliers shown in gray, while the thick black lines show the probability distribution for the reduced dataset.
The resulting boulder age distributions for each moraine exhibit a variety of forms. Many moraines (e.g., Arena, BAS, Misery B moraines; Figs. 12 and 13) display a central cluster approximating a normal distribution, and for these moraines we assign the mean and standard deviation of the ages as the best estimate of the depositional age of the moraine. Other moraines (e.g., SSU, WAL, BGE) showed heavily skewed, bimodal, or scattered age distributions; for these we provide age ranges rather than means in the discussion that follows. In the case of those high-scatter moraines, it is likely that the true moraine age is closer to the younger end of the age range, as we identified inheritance as a more likely contributor to moraine scatter than postdepositional disturbance (Sect. 3.2.3).
3.4 Moraine ages
In this section, we summarize moraine age estimates assuming zero surface erosion (Table 1; Figs. 12 and 13); we discuss the effects of this assumption in later sections.
Lower Roberts. The oldest dated moraine in the Lower Roberts area – Ringleader – dates to 2.94±0.24 Ma. Along a northward transect from the summit of the Central Rise to the modern ice margin, subsequent moraines yielded the following ages (moraine initials correspond to informal names and sample ID suffixes listed in the ICE-D:ANTARCTICA online database; Fig. 12): BAS (2.94±0.14 Myr), HDY (2.84±0.08 Myr), WBK (1.62–2.84 Myr), SSU (1.90–2.95 Myr), POS (1.16–2.05 Myr), AND (1.08–1.63 Myr), NLO (1.07–1.58 Myr), NLI (0.54–2.09 Myr). A similar transect extending southward from the Central Rise provides the following moraine ages: BBY (1.55–2.69 Myr), BGE (1.41–2.93 Myr), WAL (1.50–2.80 Myr), WIN (0.51–1.00 Myr), MON (0.54±0.01 Myr), and MNM (0.40–0.87 Myr). As discussed in Sect. 3.2.3, this southern transect displays the highest degree of age scatter, potentially due to the incorporation of rockfall from the surrounding escarpments.
Upper Roberts. Moraine ages at Upper Roberts display a high degree of internal consistency and are reported here from highest moraine to lowest: Arena (2.64±0.13 Myr), Eine (1.19±0.14 Myr), Kleine (1.18±0.16 Myr), Nacht (1.11±0.10), and Musik (0.61–1.10 Myr; Fig. 12). As noted in Sect. 4.1, undated moraine segments located above the Arena moraine represent higher surface levels of the EAIS, potentially prior to ∼2.6 Ma. Additionally, undated moraine segments situated between the Arena and Eine moraines, which differ in elevation by ∼45 m, may account for the temporal gap between these two limits.
Misery moraines. Approximately 1.5 km southeast of the Southwest Col drift (∼14.5 Ma; Sect. 3.2.2), the Misery moraines yielded ages (listed from outermost moraine to innermost) of 7.94±0.23 Myr (Misery D; n=4), 7.93±0.23 Myr (Misery A; n=1), 7.99±0.06 Myr (Misery B; n=8), and 7.63±0.29 Myr (Misery C; n=5; Fig. 13). We consider a young population of ages, between ∼4 and 6 Myr, on the Misery A and Misery C moraines to be outliers as the bulk of ages from the complex cluster around 8 Myr. Due to the excellent internal consistency of these age populations, we consider it unlikely that the 8 Ma population reflects inheritance, as that mechanism typically introduces considerable scatter to the dataset (Balco, 2011).
Cosmogenic-exposure ages on moraines and glacial drift at Roberts Massif afford unprecedented insight into late Cenozoic variability of the EAIS. The record begins at ∼14.5 Ma (Southwest Col drift), while distinct ice-marginal positions date to ∼8 Ma and between ∼3 and 1 Ma. As described in Sect. 3.1, all moraines are characteristic of cold-based glacial conditions and are oriented subparallel to the modern EAIS margins, suggesting ice configuration similar to today at high elevation in the central TAM. Recognizing the influence of Ross Sea ice on even the uppermost reaches of transverse EAIS outlet glaciers (Mercer, 1968; Bockheim et al., 1989; Denton et al., 1989; Orombelli et al., 1990; Denton and Hall, 2000; Bromley et al., 2010, 2012), we speculate that the Roberts Massif moraines formed when Ross Sea ice (either an ice shelf or a grounded ice sheet) buttressed Shackleton Glacier and thus that ice configuration in the Ross Embayment was similar to today for considerable parts of our record. In the following sections, we discuss the length of the Roberts Massif glacial geologic record and address the climatic implications of our findings.
4.1 Uplift at Roberts Massif
Relative to previous glacial geologic archives from Antarctica, the Roberts Massif record is exceptionally long (∼14.5 Myr). At all three sites described in Sect. 3.1, moraine age increases with distance from and elevation above the modern EAIS, with the oldest site (Misery Platform) ostensibly indicating the thickest ice. One hypothesis to explain the age–elevation relationship at Roberts Massif is that, while the massif itself has remained isostatically stable for the duration of our record, the surface elevation of the EAIS during glacial maxima has lowered systematically over time. Alternatively, the configuration of the EAIS during glacial maxima has remained roughly constant for the duration of the record, but the underlying bedrock has undergone uplift due to tectonism, dynamic topography, and/or isostasy, processes relevant to the millions-of-years timescale. Tectonic uplift at Roberts Massif from ∼15 Ma likely was minimal; apatite fission thermochronology in the central TAM suggests that major faulting due to tectonism was complete by ∼30 Ma (Fitzgerald, 1994; Miller et al., 2010). However, over the last 3 Myr, approximately 40 m of uplift at Roberts Massif may be attributed to dynamic topography (Austermann et al., 2015), though this value cannot account fully for the ∼3 Ma ice positions situated ∼170 m (Ringleader moraines) and ∼180 m (Arena moraine) higher than the modern EAIS at Lower and Upper Roberts, respectively.
Instead, isostatic rebound resulting from deepening of outlet glacier troughs (i.e., removal of rock and replacement by less dense ice) may account for much of the apparent moraine elevation loss through the Roberts Massif record. While large portions of EAIS outlet glaciers, including Shackleton Glacier, are likely frozen to the bed and thus minimally erosive, regions of these glaciers are thick enough to be at the pressure melting point today (Golledge et al., 2014) and thus eroding their beds (Bader et al., 2017; Graly et al., 2018). Removal of several hundred meters of rock since the mid-Miocene would therefore result in isostatic rebound of a few hundred meters (Van der Wateren et al., 1999; Stern and Tenbrink, 1989). Although we cannot quantify total trough erosion over the course of our record, this magnitude of uplift is consistent with the observed elevational offset between relict moraines and the modern EAIS.
As well as elucidating deposition age, near-saturation concentrations of 10Be on Southwest Col (15-ROB-033-COL) and 26Al on the Ringleader moraine (16-ROB-062-RIN) afford maximum-limiting values for isostatic uplift at Roberts Massif, both since ∼14.5 Ma and during the last 3 Myr. For these samples, 10Be and 26Al concentrations become saturated (with respect to LSDn scaling) with erosion rates of ∼2.3 and ∼7 g cm−2 Myr−1, respectively. If we assume that this apparent erosion rate reflects not removal of mass by surface weathering but rather a decrease in atmospheric depth due to uplift, these erosion rate values provide maximum uplift rates. The 10Be saturation erosion rate for 15-ROB-033-COL yields an uplift rate of ∼24 m Myr−1 over the last ∼14 Myr, indicating that the total maximum uplift over the course of the record is ∼350 m or ∼70 m over the last 3 Myr. This estimate accounts for less than half of the elevation difference between the ∼3 Ma Ringleader moraine and the EAIS margin (∼170 m). In contrast, the 26Al saturation erosion rate for 16-ROB-062-RIN affords a higher uplift rate of ∼70 m Myr−1 over the last 3 Myr or ∼210 m over the Plio-Pleistocene portion of the record, a value that accounts for the full ∼170 m elevation difference between the Ringleader moraine and the modern EAIS. Importantly, both the 24 and 70 m Myr−1 values represent maximum uplift rates under the assumption of zero erosion, meaning that the average pace of uplift during the Plio-Pleistocene may not have differed from that during the last ∼14.5 Myr. In fact, because 26Al does not quite reach saturation in 3 Myr, it is likely that the 70 m Myr−1 is an overestimate. Moreover, the true uplift rate at Roberts Massif probably was lower than those calculated here, since our field observations indicated that some, albeit minor, postdepositional surficial erosion has taken place (Sect. 3.1).
Uplift of m over the Plio-Pleistocene is consistent with cosmogenic-nuclide concentrations from the McMurdo Dry Valleys, which indicate minimal vertical change during this period (Brook et al., 1995). Similarly, 40Ar and 39Ar ages on subaerial volcanic cones limit uplift to 300 m in the Dry Valleys over the past 3 Myr (Wilch et al., 1993) and <67 m in the Royal Society Range over the past 7.8 Myr (Sugden et al., 1999). In contrast, Stern et al. (2005) posit that >1 km of isostatic uplift throughout the central TAM has occurred since 35 Ma due to glacial erosion. If true, the cosmogenic-nuclide concentrations presented here imply that nearly all of this uplift must have taken place between 35 and 14 Ma.
Given the likelihood of isostatic uplift over the long duration of our record, which potentially accounts for much of the offset between moraine elevations and the modern EAIS, we cannot evaluate changes in ice thickness throughout this ∼14 Myr record with certainty. However, we emphasize that a large, cold-based ice sheet with configuration similar to today was present during the dated parts of this record.
4.2 Miocene presence of the EAIS
The oldest dated glacial unit at Roberts Massif, Southwest Col drift, was deposited at ∼14.5 Ma and demonstrates that the EAIS in the central TAM was cold based by at least the mid-Miocene (Fig. 14). This finding aligns closely with earlier work from the northern TAM that placed the transition to polar conditions at ∼14–15 Ma (Denton and Sugden, 2005). We note that deposition of Southwest Col drift also coincided broadly with a mid-Miocene climatic shift documented in the Olympus Range, McMurdo Dry Valleys, where well-preserved terrestrial and lacustrine fossils interbedded with ash fall deposits have been interpreted as reflecting an 8 ∘C cooling of Antarctic summers at ∼14.5 Ma (Lewis et al., 2008). In addition, the age of Southwest Col drift, which provides a minimum-limiting age for cold-based glaciation in the central TAM, is approximately coeval with the mid-Miocene cooling transition (∼15–13 Ma), marked by a decline in global sea-surface and bottom-water temperatures (Lear et al., 2015) and atmospheric CO2 concentrations (Zhang et al., 2013). Finally, Southwest Col drift affords minimum-limiting age constraint for the underlying Sirius Group till at Roberts Massif and supports previously published surface-exposure data suggesting that these temperate deposits are >5 Myr (Ivy-Ochs et al., 1995; Schaefer et al., 1999).

Figure 14Comparison between Roberts Massif glacial chronology and relevant climate records. (a) Southern Hemisphere alkenone-derived temperature stack (Herbert et al., 2016). (b) Boron-isotope-, paleosol-, and stomata-derived CO2 records (Beerling et al., 2009; Breecker and Retallack, 2014; Da et al., 2019; Dyez et al., 2018; Ji et al., 2018; Sosdian et al., 2018; Wang et al., 2015; Zhang et al., 2013). (c) Benthic oxygen isotope stack (De Vleeschouwer et al., 2017). (d) Moraine age and uncertainty at Roberts Massif, plotted against deposit elevation. Note that deposition of the Misery moraines required ice to be >300 m thicker than today, which is not reflected in the moraine elevation. The age of the Southwest Col sandstones account for erosion, as described in Sect. 3.2.2. (e) Histogram of all apparent exposure ages at Roberts Massif, including outliers. Vertical gray bars denote moraine ages, including uncertainty. Darker gray color shows a higher frequency of moraines.
Overlying Southwest Col drift, the ∼8 Ma Misery moraines represent the oldest ice-marginal landforms identified at Roberts Massif and suggest the presence of a large, cold-based ice sheet at that time. This EAIS configuration is broadly coincident with elevated sea-surface temperatures (Herbert et al., 2016) and Antarctic Bottom Water temperatures (Lear et al., 2015) and potentially higher atmospheric CO2 (Sosdian et al., 2018) relative to the Plio-Pleistocene. Therefore, our record suggests that a substantial EAIS occupied the central TAM at ∼8 Ma despite generally warmer-than-present climatic conditions (Fig. 14).
4.3 Plio-Pleistocene presence of the EAIS
A majority of moraines in the Roberts Massif record date to ∼3–1 Ma, thus documenting the persistence of a large EAIS during the Plio-Pleistocene transition and early Pleistocene (Fig. 14). Because the uncertainties in our moraine ages (∼0.1–0.5 Myr) exceed the 40 kyr climate cycles dominant prior to the Mid-Pleistocene Transition, we do not assign moraines to individual climate events, such as marine isotope stages (i.e., Lisiecki and Raymo, 2005; Railsback et al., 2015). Nonetheless, moraines dated to Ma indicate a large EAIS in the central TAM during times when global temperatures and atmospheric CO2 were likely higher than today (Willeit et al., 2019).
Several moraines at Roberts Massif date to ∼3 Ma (Ringleader, ∼3 Ma; BAS, ∼3 Ma; HDY, ∼2.8 Ma; Arena, ∼2.6 Ma), inviting the question of whether any of these landforms correspond to the mid-Pliocene warm period (MPWP: ∼3.3–3.0 Ma), which has garnered attention as a plausible analog for modern anthropogenic warming. The ongoing debate regarding the resilience of the EAIS during the MPWP bears two leading hypotheses: (i) that the EAIS was of similar extent to, or potentially larger than, today during the MPWP (e.g., Sugden et al., 1993; Winnick and Caves, 2015) due to increased East Antarctic precipitation under warmer atmospheric conditions (Huybrechts, 1993) and (ii) that the EAIS was significantly smaller than today (Scherer et al., 2016; Webb et al., 1984) as a result of enhanced melting along marine margins (Pollard and DeConto, 2016) and associated structural collapse (Pollard et al., 2015). At Roberts Massif, moraines dating to the MPWP would support the first hypothesis; however, an absence of MPWP moraines neither proves nor disproves the second hypothesis, as geologic evidence for even a slightly smaller EAIS would lie beneath the modern ice sheet surface (Balco, 2015). Below, we address the possibility that any Roberts Massif moraines date to the MPWP, given the uncertainties associated with exposure dating (i.e., erosion, production rate error, and uplift).
First, we address the possibility that erosion of boulder surfaces, which acts to remove a portion of the cosmogenic-nuclide inventory, yielded erroneously young apparent exposure ages for the late Pliocene moraines. As shown in Sect. 3.2.3, concordant 10Be–21Ne–26Al measurements on Ringleader sandstones afford an exposure age of ∼3 Myr, consistent with the 3He ages on that moraine, and both sandstone and dolerite boulders appear to have experienced relatively minimal erosion (i.e., angular, minimal pitting and exfoliation; Sect. 3.1.1). Applying the maximum surface erosion rate for dolerites of 2 cm Myr−1, determined using the 3He concentration of 15-ROB-028-COL (Sect. 3.2.2), the average dolerite age on Ringleader is 3.18 Myr and thus within the uncertainty of the apparent moraine age. Together, our field observations and cosmogenic-nuclide measurements suggest that the apparent age of the Ringleader moraine is not erroneously young due to surface erosion. As discussed in Sect. 4.1, the maximum possible error in moraine age due to uplift is the same as that for erosion, meaning that the inclusion of uplift has no significant impact on moraine age.
Next, we explore the potential effect of cosmogenic-nuclide production rate uncertainty on moraine age. The 10Be production rate is accompanied by a ∼6 % error and 3He by a ∼10 % error (Borchers et al., 2016), meaning that the Ringleader moraine could be ∼6 % older (with a lower production rate) or younger (with a higher production rate), using the more precise 10Be production rate as a limit (note that 10Be and 3He ages are statistically indistinguishable). However, we can use the boulder with the highest 10Be concentration on Southwest Col (15-ROB-033-COL), which is close to saturation, to provide a lower limit for the 10Be production rate. Applying a production rate that is ∼2 % lower than the globally calibrated production rate of Borchers et al. (2016), which we used to calculate the 10Be ages presented here, sample 15-ROB-033-COL becomes oversaturated with respect to LSDn scaling, suggesting that, at most, the Ringleader moraine (the oldest in the Plio-Pleistocene sequence) is no older than ∼3 Myr. Conversely, if the true production rate is higher than that of Borchers et al. (2016), it is possible that the Ringleader moraine is up to 6 % younger (∼2.8 Myr) than reported here. As there are no sandstones on the oldest landform in the Upper Roberts sequence – Arena moraine (∼2.7 Myr) – we assess the full 10 % range in the 3He production rate. Assuming a 10 % reduction in production rate, the Arena moraine could date to ∼3 Ma or the end of the MPWP.
In summary, we did not date any moraines unequivocally to the MPWP, suggesting that the EAIS was not significantly larger than today during that time. However, given the dataset presented here, we cannot evaluate further the configuration of the EAIS during the MPWP because evidence for the ice sheet extent during that time lies beneath the modern glacier. Moreover, we note that our moraine chronology lacks landforms dating to the earlier Pliocene (∼5 Ma), when conditions are thought to have been as warm as during the MPWP (Burke et al., 2018). Nevertheless, our current dataset provides evidence for a large, cold-based EAIS in the central TAM during the late Pliocene, immediately following the MPWP, and in the early to Middle Pleistocene.
Surficial deposits characteristic of cold-based glaciation at Roberts Massif span the Last Glacial Maximum to mid-Miocene, thereby providing an exceptionally long geologic record of glaciation for the central TAM. The preservation of numerous, vertically offset ice-marginal deposits is most plausibly explained by the persistence of an EAIS similar in configuration to today during multiple glacial maxima, accompanied by gradual isostatic uplift of Roberts Massif. Coupled with extremely low erosion rates (≪5 cm Myr−1), the prevalence of cold-based deposition over the last ∼14.5 Myr supports persistent polar desert climate conditions in East Antarctica since the mid-Miocene. Our record also provides minimum-limiting age control for the underlying Sirius Group deposits, suggesting that at least some of the temperate glacial deposits preserved in the TAM are older than 14.5 Myr.
Although the Roberts Massif record is not a direct measure of East Antarctic ice volume, our dataset indicates that the EAIS was not any larger during the late Pliocene–early Pleistocene than it was during parts of the Miocene, even though temperatures cooled progressively through the Plio-Pleistocene. Nonetheless, the absence at Roberts Massif of ice-marginal deposits dating unequivocally to the MPWP highlights a critical area for continued investigation, since distal paleoclimate evidence and model simulations suggest the EAIS was smaller than present at that time. Accepting that geologic evidence for even a slightly smaller EAIS during the MPWP would lie beneath the modern ice sheet, we cannot further evaluate the extent to which the EAIS was smaller during the MPWP with the current dataset from Roberts Massif.
In summary, the Roberts Massif dataset provides a long-term, terrestrial perspective of ice sheet extent in the central TAM and shows that the EAIS has been a persistent feature of this region since the mid-Miocene. Throughout this record, the EAIS has maintained a configuration similar to today, which requires the presence of buttressing ice in the Ross Embayment and, by extension, West Antarctica, even during periods when global temperature and atmospheric CO2 concentrations likely were similar to or higher than present.
All analytical information associated with cosmogenic-nuclide measurements appear in the tables in the Supplement. Analytical information, with additional sample documentation and photographs, is also available in the ICE-D:ANTARCTICA online database (http://antarctica.ice-d.org/, Balco, 2020).
The supplement related to this article is available online at: https://doi.org/10.5194/tc-14-2647-2020-supplement.
All authors conducted fieldwork, sample collection, and sample preparation for cosmogenic-nuclide analyses. GrB, ABK, and HT carried out cosmogenic noble gas measurements and were responsible for data reduction and analysis. ABK prepared the manuscript with contributions from GrB, GoB, and MSJ.
The authors declare that they have no conflict of interest.
This work would not have been possible without major contributions from many elements of the US Antarctic Program, including the 109th Airlift Wing of the New York Air National Guard, pilots and ground crews of Kenn Borek Air, and many USAP staff at Shackleton Glacier Camp and McMurdo Station. In addition, we thank Chris Simmons for field mountaineering support, Tim Becker for assistance with noble gas measurements at BGC, Kaj Overturf for help with sample crushing and sieving at the University of Maine, and Brenda Hall for insightful discussions. Geospatial support for this work was provided by the Polar Geospatial Center under NSF-OPP awards 1043681 and 1559691.
This research has been supported by the National Science Foundation, Office of Polar Programs (grant nos. 1443329 and 1443321), and by the Ann and Gordon Getty Foundation.
This paper was edited by Joel Savarino and reviewed by David Sugden and Julia Lindow.
Ackert, R. P.: Antarctic glacial chronology?: new constraints from surface exposure dating, PhD thesis, Woods Hole Oceanographic Institution, Massachusetts Institute of Technology, United States of America, 213 pp., 2000.
Ackert, R. P. and Kurz, M. D.: Age and uplift rates of Sirius Group sediments in the Dominion Range, Antarctica, from surface exposure dating and geomorphology, Global Planet. Change, 42, 207–225, 2004.
Atkins, C. B.: Geomorphological evidence of cold-based glacier activity in South Victoria Land, Antarctica, Geol. Soc. London Spec. Publ., 381, 299–318, https://doi.org/10.1144/SP381.18, 2013.
Atkins, C. B., Barrett, P. J., and Hicock, S. R.: Cold glaciers erode and deposit: Evidence from Allan Hills, Antarctica, Geology, 30, 659–662, https://doi.org/10.1130/0091-7613(2002)030<0659:CGEADE>2.0.CO;2, 2002.
Austermann, J., Pollard, D., Mitrovica, J. X., Moucha, R., Forte, A. M., DeConto, R. M., Rowley, D. B., and Raymo, M. E.: The impact of dynamic topography change on Antarctic ice sheet stability during the mid-Pliocene warm period, Geology, 43, 927–930, https://doi.org/10.1130/G36988.1, 2015.
Bader, N. A., Licht, K. J., Kaplan, M. R., and Kassab, C.: East Antarctic ice sheet stability recorded in a high-elevation ice-cored moraine, Quaternary Sci. Rev., 159, 88–102, https://doi.org/10.1016/j.quascirev.2016.12.005, 2017.
Balco, G.: Contributions and unrealized potential contributions of cosmogenic-nuclide exposure dating to glacier chronology, 1990–2010, Quaternary Sci. Rev., 30, 3–27, https://doi.org/10.1016/j.quascirev.2010.11.003, 2011.
Balco, G.: The absence of evidence of absence of the East Antarctic Ice Sheet, Geology, 43, 943–944, https://doi.org/10.1130/focus102015.1, 2015.
Balco, G.: Saturated Surfaces in Antarctica, available at: http://www.cosmognosis.wordpress.com/2016/09/09/saturated-surfaces-in-antarctica/ (last access: 15 February 2020), 2016.
Balco, G.: ICE-D:Antarctica, available at: http://antarctica.ice-d.org, last access: 22 July 2020.
Balco, G. and Shuster, D. L.: Production rate of cosmogenic 21Ne in quartz estimated from 10Be, 26Al, and 21Ne concentrations in slowly eroding Antarctic bedrock surfaces, Earth Planet. Sc. Lett., 281, 48–58, https://doi.org/10.1016/j.epsl.2009.02.006, 2009b.
Balco, G., Stone, J. O., Lifton, N. A. and Dunai, T. J.: A complete and easily accessible means of calculating surface exposure ages or erosion rates from 10Be and 26Al measurements, Quat. Geochronol., 3, 174–195, https://doi.org/10.1016/j.quageo.2007.12.001, 2008.
Balco, G., Blard, P. H., Shuster, D. L., and Stone, J. O. H.: Cosmogenic and nucleogenic 21Ne in quartz in a 28-meter sandstone core from the McMurdo Dry Valleys, Antarctica, Quat. Geochronol., 52, 63–76, 2019.
Beerling, D. J., Fox, A., and Anderson, C. W.: Quantitative uncertainty analyses of ancient atmospheric CO2 estimates from fossil leaves, Am. J. Sci., 309, 775–787, https://doi.org/10.2475/09.2009.01, 2009.
Blard, P. H. and Farley, K. A.: The influence of radiogenic 4He on cosmogenic 3He determinations in volcanic olivine and pyroxene, Earth Planet. Sc. Lett., 276, 20–29, https://doi.org/10.1016/j.epsl.2008.09.003, 2008.
Blard, P. H., Balco, G., Burnard, P. G., Farley, K. A., Fenton, C. R., Friedrich, R., Jull, A. J. T., Niedermann, S., Pik, R., Schaefer, J. M., Scott, E. M., Shuster, D. L., Stuart, F. M., Stute, M., Tibari, B., Winckler, G., and Zimmermann, L.: An inter-laboratory comparison of cosmogenic 3He and radiogenic 4He in the CRONUS-P pyroxene standard, Quat. Geochronol., 26, 11–19, https://doi.org/10.1016/j.quageo.2014.08.004, 2015.
Bockheim, J. G., Wilson, S. C., Denton, G. H., Andersen, B. G., and Stuiver, M.: Late Quaternary ice-surface fluctuations of Hatherton Glacier, Transantarctic Mountains, Quaternary Res., 31, 229–254, 1989.
Borchers, B., Marrero, S., Balco, G., Caffee, M., Goehring, B., Lifton, N., Nishiizumi, K., Phillips, F., Schaefer, J., and Stone, J.: Geological calibration of spallation production rates in the CRONUS-Earth project, Quat. Geochronol., 31, 188–198, https://doi.org/10.1016/j.quageo.2015.01.009, 2016.
Breecker, D. O. and Retallack, G. J.: Refining the pedogenic carbonate atmospheric CO2 proxy and application to Miocene CO2, Palaeogeogr. Palaeocl., 406, 1–8, https://doi.org/10.1016/j.palaeo.2014.04.012, 2014.
Bromley, G. R., Hall, B. L., Stone, J. O.: and Conway, H.: Late Pleistocene evolution of Scott Glacier, southern Transantarctic Mountains: implications for the Antarctic contribution to deglacial sea level, Quaternary Sci. Rev., 50, 1–13, 2012.
Bromley, G. R. M., Hall, B. L., Stone, J. O., Conway, H., and Todd, C. E.: Late Cenozoic deposits at Reedy Glacier, Transantarctic Mountains: implications for former thickness of the West Antarctic Ice Sheet, Quaternary Sci. Rev., 29, 384–398, https://doi.org/10.1016/j.quascirev.2009.07.001, 2010.
Bromley, G. R. M., Winckler, G., Schaefer, J. M., Kaplan, M. R., Licht, K. J., and Hall, B. L.: Pyroxene separation by HF leaching and its impact on helium surface-exposure dating, Quat. Geochronol., 23, 1–8, https://doi.org/10.1016/j.quageo.2014.04.003, 2014.
Brook, E. J., Kurz, M. D., Ackert Jr., R. P., Denton, G. H., Brown, E. T., Raisbeck, G. M., and Yiou, F.: Chronology of Taylor Glacier Advances in Arena Valley, Antarctica, Using in Situ Cosmogenic 3He and 10Be, Quaternary Res., 39, 11–23, 1993.
Brook, E. J., Brown, E. T., Kurz, M. D., Ackert, R. P., Raisbeck, G. M., and Yiou, F.: Constraints on Age, Erosion, and Uplift of Neogene Glacial Deposits in the Transantarctic-Mountains Determined From in-Situ Cosmogenic Be-10 and Al-26, Geology, 23, 1063–1066, https://doi.org/10.1130/0091-7613(1995)023<1063:COAEAU>2.3.CO;2, 1995.
Brown, E. T., Edmond, J. M., Raisbeck, G. M., Yiou, F., Kurz, M. D., and Brook, E. J.: Examination of surface exposure ages of Antarctic moraines using in situ produced 10Be and 26Al, Geochim. Cosmochim. Ac., 55, 2269–2283, https://doi.org/10.1016/0016-7037(91)90103-C, 1991.
Bruno, A. L., Baur, H., Graf, T., Schlkhter, C., Signer, P., and Wieler, R.: Dating of Sirius Group tillites in the Antarctic Dry Valleys with cosmogenic 3He and 21Ne, Earth Planet. Sc. Lett., 147, 37–54, https://doi.org/10.1016/S0012-821X(97)00003-4, 1997.
Burke, K. D., Williams, J. W., Chandler, M. A., Haywood, A. M., Lunt, D. J., and Otto-Bliesner, B. L.: Pliocene and Eocene provide best analogs for near-future climates, P. Natl. Acad. Sci. USA, 115, 13288–13293, https://doi.org/10.1073/pnas.1809600115, 2018.
Burnard, P. G. and Farley, K. A.: Calibration of pressure-dependent sensitivity and discrimination in Nier-type noble gas ion sources, Geochem. Geophy. Geosy., 1, 2000GC000038, https://doi.org/10.1029/2000GC000038, 2000.
Da, J., Zhang, Y. G., Li, G., Meng, X., and Ji, J.: Low CO2 levels of the entire Pleistocene epoch, Nat. Commun., 10, 1–9, https://doi.org/10.1038/s41467-019-12357-5, 2019.
Denton, G. H. and Hall, B. L.: Glacial and Paleoclimatic history of the Ross Ice drainage system of Antarctica, Geogr. Ann., 87, 139–432, 2000.
Denton, G. H. and Sugden, D. E.: Meltwater features that suggest Miocene ice-sheet overriding of the Transantarctic Mountains in Victoria Land, Antarctica, Geogr. Ann., 87, 67–85, 2005.
Denton, G. H., Bockheim, J. G., Wilson, S. C., and Leide, J. E.: Late Quaternary ice surface fluctuations of Beardmore Glacier, Transantarctic Mountains, Quaternary Res., 31, 183–209, 1989.
Denton, G. H., Sugden, D. E., Marchant, D. R., Hall, B. L., and Thomas, I.: East Antarctic Ice Sheet Sensitivity To Pliocene Climatic Change From a Dry Valleys Perspective, Geogr. Ann., 75, 155–204, 1993.
De Vleeschouwer, D., Vahlenkamp, M., Crucifix, M., and Pälike, H.: Alternating Southern and Northern Hemisphere climate response to astronomical forcing during the past 35 m.y, Geology, 45, 375–378, https://doi.org/10.1130/G38663.1, 2017.
Dutton, A., Carlson, A. E., Long, A. J., Milne, G. A., Clark, P. U., DeConto, R., Horton, B. P., Rahmstorf, S. and Raymo, M. E.: Sea-level rise due to polar ice-sheet mass loss during past warm periods, Science, 349, aaa4019, https://doi.org/10.1126/science.aaa4019, 2015.
Dyez, K. A., Hönisch, B., and Schmidt, G. A.: Early Pleistocene Obliquity-Scale pCO2 Variability at ∼1.5 Million Years Ago, Paleoceanogr. Paleoclim., 33, 1270–1291, https://doi.org/10.1029/2018PA003349, 2018.
Fitzgerald, P. G.: Thermochronologic constraints on post-Paleozoic tectonic evolution of the central Transantarctic Mountains, Antarctica, Tectonics, 13, 818–836, https://doi.org/10.1029/94TC00595, 1994.
Gasson, E., DeConto, R. M., Pollard, D., and Levy, R. H.: Dynamic Antarctic ice sheet during the early to mid-Miocene, P. Natl. Acad. Sci. USA, 113, 3459–3464, https://doi.org/10.1073/pnas.1516130113, 2016.
Gillespie, A. R. and Bierman, P. R.: Precision of terrestrial exposure ages and erosion rates estimated from analysis of cosmogenic isotopes produced in situ, J. Geophys. Res., 100, 24637–24649, https://doi.org/10.1029/95jb02911, 1995.
Goehring, B. M., Muzikar, P., and Lifton, N. A.: Establishing a Bayesian approach to determining cosmogenic nuclide reference production rates using He-3, Earth Planet. Sc. Lett., 481, 91–100, https://doi.org/10.1016/j.epsl.2017.10.025, 2018.
Golledge, N. R., Marsh, O. J., Rack, W., Braaten, D., and Jones, R. S.: Basal conditions of two Transantarctic Mountains outlet glaciers from observation-constrained diagnostic modelling, J. Glaciol., 60, 855–866, https://doi.org/10.3189/2014JoG13J131, 2014.
Graly, J. A., Licht, K. J., Kassab, C. M., Bird, B. W., and Kaplan, M. R.: Warm-based basal sediment entrainment and far-field Pleistocene origin evidenced in central Transantarctic blue ice through stable isotopes and internal structures, J. Glaciol, 64, 185–196, https://doi.org/10.1017/jog.2018.4, 2018.
Hambrey, M. J., Webb, P. N., Harwood, D. M., and Krissek, L. A.: Neogene glacial record from the Sirius Group of the Shackleton Glacier region, central Transantarctic Mountains, Antarctica, Bull. Geol. Soc. Am., 115, 994–1015, https://doi.org/10.1130/B25183.1, 2003.
Haywood, A. M., Hill, D. J., Dolan, A. M., Otto-Bliesner, B. L., Bragg, F., Chan, W.-L., Chandler, M. A., Contoux, C., Dowsett, H. J., Jost, A., Kamae, Y., Lohmann, G., Lunt, D. J., Abe-Ouchi, A., Pickering, S. J., Ramstein, G., Rosenbloom, N. A., Salzmann, U., Sohl, L., Stepanek, C., Ueda, H., Yan, Q., and Zhang, Z.: Large-scale features of Pliocene climate: results from the Pliocene Model Intercomparison Project, Clim. Past, 9, 191–209, https://doi.org/10.5194/cp-9-191-2013, 2013.
Herbert, T. D., Lawrence, K. T., Tzanova, A., Peterson, L. C., Caballero-Gill, R., and Kelly, C. S.: Late Miocene global cooling and the rise of modern ecosystems, Nat. Geosci., 9, 843–847, https://doi.org/10.1038/ngeo2813, 2016.
Holbourn, A., Kuhnt, W., Clemens, S., Prell, W., and Andersen, N.: Middle to late Miocene stepwise climate cooling: Evidence from a high-resolution deep water isotope curve spanning 8 million years, Paleoceanography, 28, 688–699, https://doi.org/10.1002/2013PA002538, 2013.
Huybrechts, P.: Glaciological Modelling of the Late Cenezoic East Antarctic Ice Sheet: Stability or Dynamism, Geogr. Ann., 75, 221–238, 1993.
Ivy-Ochs, S., Schluchter, C., Kubik, P. W., Dittrich-Hannen, B., and Beer, J.: Minimum 10Be exposure ages of early Pliocene for the Table Mountain plateau and the Sirius Group at Mount Fleming, Dry Valleys, Antarctica, Geology, 23, 1007–1010, https://doi.org/10.1130/0091-7613(1995)023<1007:MBEAOE>2.3.CO;2, 1995.
Ji, S., Nie, J., Lechler, A., Huntington, K. W., Heitmann, E. O., and Breecker, D. O.: A symmetrical CO2 peak and asymmetrical climate change during the middle Miocene, Earth Planet. Sc. Lett., 499, 134–144, https://doi.org/10.1016/j.epsl.2018.07.011, 2018.
Jull, A. J. T., Scott, E. M., and Bierman, P.: The CRONUS-Earth inter-comparison for cosmogenic isotope analysis, Quat. Geochronol., 26, 3–10, https://doi.org/10.1016/j.quageo.2013.09.003, 2015.
Kaplan, M. R., Licht, K. J., Winckler, G., Schaefer, J. M., Bader, N., Mathieson, C., Roberts, M., Kassab, C. M., Schwartz, R., and Graly, J. A.: Middle to Late Pleistocene stability of the central East Antarctic Ice Sheet at the head of Law Glacier, Geology, 45, 963–966, https://doi.org/10.1130/G39189.1, 2017.
Kober, F., Alfimov, V., Ivy-Ochs, S., Kubik, P. W., and Wieler, R.: The cosmogenic 21Ne production rate in quartz evaluated on a large set of existing 21Ne-10Be data, Earth Planet. Sc. Lett., 302, 163–171, https://doi.org/10.1016/j.epsl.2010.12.008, 2011.
Lal, D.: Cosmic ray labeling of erosion surfaces: in situ nuclide production rates and erosion models, Earth Planet. Sc. Lett., 104, 424–439, 1991.
Lear, C. H., Coxall, H., Foster, G. L., Lunt, D. J., Mawbey, E. M., Rosenthal, Y., Sosdian, S. M., Thomas, E., and Wilson, P. A.: Neogene ice volume and ocean temperatures: Insights from infaunal foraminiferal Mg/Ca paleothermometry, Paleoceanography, 30, 1437–1454, https://doi.org/10.1002/2015PA002833, 2015.
Levy, R., Harwood, D., Florindo, F., Sangiorgi, F., Tripati, R., von Eynatten, H., Gasson, E., Kuhn, G., Tripati, A., Deconto, R., Fielding, C., Field, B., Golledge, N., McKay, R., Naish, T., Olney, M., Pollard, D., Schouten, S., Talarico, F., Warny, S., Willmott, V., Acton, G., Panter, K., Paulsen, T., Taviani, M., Askin, R., Atkins, C., Bassett, K., Beu, A., Blackstone, B., Browne, G., Ceregato, A., Cody, R., Cornamusini, G., Corrado, S., Del Carlo, P., Di Vincenzo, G., Dunbar, G., Falk, C., Frank, T., Giorgetti, G., Grelle, T., Gui, Z., Handwerger, D., Hannah, M., Harwood, D. M., Hauptvogel, D., Hayden, T., Henrys, S., Hoffmann, S., Iacoviello, F., Ishman, S., Jarrard, R., Johnson, K., Jovane, L., Judge, S., Kominz, M., Konfirst, M., Krissek, L., Lacy, L., Maffioli, P., Magens, D., Marcano, M. C., Millan, C., Mohr, B., Montone, P., Mukasa, S., Niessen, F., Ohneiser, C., Passchier, S., Patterson, M., Pekar, S., Pierdominici, S., Raine, I., Reed, J., Reichelt, L., Riesselman, C., Rocchi, S., Sagnotti, L., Sandroni, S., Schmitt, D., Speece, M., Storey, B., Strada, E., Tuzzi, E., Verosub, K., Wilson, G., Wilson, T., Wonik, T., and Zattin, M.: Antarctic ice sheet sensitivity to atmospheric CO2 variations in the early to mid-Miocene, P. Natl. Acad. Sci. USA, 113, 3453–3458, https://doi.org/10.1073/pnas.1516030113, 2016.
Lewis, A. R., Marchant, D. R., Ashworth, A. C., Hedenas, L., Hemming, S. R., Johnson, J. V., Leng, M. J., Machlus, M. L., Newton, A. E., Raine, J. I., Willenbring, J. K., Williams, M., and Wolfe, A. P.: Mid-Miocene cooling and the extinction of tundra in continental Antarctica, P. Natl. Acad. Sci. USA, 105, 10676–10680, https://doi.org/10.1073/pnas.0802501105, 2008.
Lifton, N., Sato, T., and Dunai, T. J.: Scaling in situ cosmogenic nuclide production rates using analytical approximations to atmospheric cosmic-ray fluxes, Earth Planet. Sc. Lett., 386, 149–160, https://doi.org/10.1016/j.epsl.2013.10.052, 2014.
Lisiecki, L. E. and Raymo, M. E.: A Pliocene-Pleistocene stack of 57 globally distributed benthic d18O records, Paleoceanography, 20, 1–17, https://doi.org/10.1029/2004PA001071, 2005.
Margerison, H. R., Phillips, W. M., Stuart, F. M., and Sugden, D. E.: Cosmogenic 3He concentrations in ancient flood deposits from the Coombs Hills, northern Dry Valleys, East Antarctica: Interpreting exposure ages and erosion rates, Earth Planet. Sc. Lett., 230, 163–175, https://doi.org/10.1016/j.epsl.2004.11.007, 2005.
Mayewski, P. A.: Glacial geology and late Cenozoic history of the Transantarctic Mountains, Antarctica, PhD Thesis, Institute of Polar Studies, The Ohio State University, United States of America, 1975.
Mercer, J. H.: Glacial geology of the Reedy glacier area, Antarctica, Geol. Soc. Am. Bull., 79, 471–486, 1968.
Mercer, J. H.: Some observations on the glacial geology of the Beardmore Glacier area, Antarct Geol. Geophys., 1972, 427–433, 1972.
Middleton, J. L., Ackert, R. P., and Mukhopadhyay, S.: Pothole and channel system formation in the McMurdo Dry Valleys of Antarctica: New insights from cosmogenic nuclides, Earth Planet. Sc. Lett., 355–356, 341–350, https://doi.org/10.1016/j.epsl.2012.08.017, 2012.
Miller, K. G., Kominz, M. A., Browning, J. V., Wright, J. D., Mountain, G. S., Katz, M. E., Sugarman, P. J., Cramer, B. S., Christie-Blick, N., and Pekar, S. F.: The phanerozoic record of global sea-level change, Science, 310, 1293–1298, https://doi.org/10.1126/science.1116412, 2005.
Miller, S. R., Fitzgerald, P. G., and Baldwin, S. L.: Cenozoic range-front faulting and development of the Transantarctic Mountains near Cape Surprise, Antarctica: Thermochronologic and geomorphologic constraints, Tectonics, 29, 1–21, https://doi.org/10.1029/2009TC002457, 2010.
Nishiizumi, K.: Preparation of 26Al AMS standards, Nucl. Instrum. Meth. B, 223–224, 388–392, https://doi.org/10.1016/j.nimb.2004.04.075, 2004.
Nishiizumi, K., Imamura, M., Caffee, M. W., Southon, J. R., Finkel, R. C., and McAninch, J.: Absolute calibration of 10Be AMS standards, Nucl. Instrum. Meth. B, 258, 403–413, https://doi.org/10.1016/j.nimb.2007.01.297, 2007.
Orombelli, G., Baroni, C., and Denton, G. H.: Late Cenozoic glacial history of the Terra Nova Bay region, northern Victoria Land, Antarctica, Geografica Fisica e Dinamica Quaternaria 13, 139–163, 1990.
Pagani, M., Liu, Z., Lariviere, J., and Ravelo, A. C.: High Earth-system climate sensitivity determined from Pliocene carbon dioxide concentrations, Nat. Geosci., 3, 27–30, https://doi.org/10.1038/ngeo724, 2010.
Phillips, F. M., Argento, D. C., Balco, G., Caffee, M. W., Clem, J., Dunai, T. J., Finkel, R., Goehring, B., Gosse, J. C., Hudson, A. M., Jull, A. J. T., Kelly, M. A., Kurz, M., Lal, D., Lifton, N., Marrero, S. M., Nishiizumi, K., Reedy, R. C., Schaefer, J., Stone, J. O. H., Swanson, T., and Zreda, M. G.: Quaternary Geochronology The CRONUS-Earth Project?: A synthesis, Quat. Geochronol., 31, 119–154, 2016.
Pollard, D. and DeConto, R. M.: Contribution of Antarctica to past and future sea-level rise, Nature, 531, 591–597, https://doi.org/10.1038/nature17145, 2016.
Pollard, D., DeConto, R. M., and Alley, R. B.: Potential Antarctic Ice Sheet retreat driven by hydrofracturing and ice cliff failure, Earth Planet. Sc. Lett., 412, 112–121, https://doi.org/10.1016/j.epsl.2014.12.035, 2015.
Prentice, M. L., Denton, G. H., Lowell, T. V, Conway, H. C., and Heusser, L. E.: Pre-late Quaternary glaciation of the Beardmore glacier region, Antarctica, Antarct. J. US, 21, 95–98, 1986.
Railsback, L. B., Gibbard, P. L., Head, M. J., Voarintsoa, N. R. G., and Toucanne, S.: An optimized scheme of lettered marine isotope substages for the last 1.0 million years, and the climatostratigraphic nature of isotope stages and substages, Quaternary Sci. Rev., 111, 94–106, https://doi.org/10.1016/j.quascirev.2015.01.012, 2015.
Rovere, A., Raymo, M. E., Mitrovica, J. X., Hearty, P. J., O'Leary, M. J., Inglis, J. D., Leary, M. J. O., and Inglis, J. D.: The Mid-Pliocene sea-level conundrum: Glacial isostasy, eustasy and dynamic topography, Earth Planet. Sc. Lett., 387, 27–33, https://doi.org/10.1016/j.epsl.2013.10.030, 2014.
Scambos, T. A., Haran, T. M., Fahnestock, M. A., Painter, T. H., and Bohlander, J.: MODIS-based Mosaic of Antarctica (MOA) data sets: Continent-wide surface morphology and snow grain size, Remote Sens. Environ., 111, 242–257, https://doi.org/10.1016/j.rse.2006.12.020, 2007.
Schaefer, J. M., Ivy-Ochs, S., Wieler, R., Leya, I., Baur, Denton, G. H., and Schluchter, C.: Cosmogenic noble gas studies in the oldest landscape on Earth: surface exposure age of the Dry Valleys, Antarctica, Earth Planet. Sc. Lett., 167, 215–226, 1999.
Schaefer, J. M., Denton, G. H., Kaplan, M., Putnam, A., Finkel, R. C., Barrell, D. J. A., Andersen, B. G., Schwartz, R., Mackintosh, A., Chinn, T., and Schlüchter, C.: High-frequency Holocene glacier fluctuations in New Zealand differ from the northern signature, Science, 324, 622–625, https://doi.org/10.1126/science.1169312, 2009.
Scherer, R. P., DeConto, R. M., Pollard, D., and Alley, R. B.: Windblown Pliocene diatoms and East Antarctic Ice Sheet retreat, Nat. Commun., 7, 1–9, https://doi.org/10.1038/ncomms12957, 2016.
Seki, O., Foster, G. L., Schmidt, D. N., Mackensen, A., Kawamura, K., and Pancost, R. D.: Alkenone and boron-based Pliocene pCO2 records, Earth Planet. Sc. Lett., 292, 201–211, https://doi.org/10.1016/j.epsl.2010.01.037, 2010.
Shevenell, A. E., Kennett, J. P., and Lea, D. W.: Middle Miocene ice sheet dynamics, deep-sea temperatures, and carbon cycling: A Southern Ocean perspective, Geochem. Geophy. Geosy., 9, 2007GC001736, https://doi.org/10.1029/2007GC001736, 2008.
Sosdian, S. M., Greenop, R., Hain, M. P., Foster, G. L., Pearson, P. N., and Lear, C. H.: Constraining the evolution of Neogene ocean carbonate chemistry using the boron isotope pH proxy, Earth Planet. Sc. Lett., 498, 362–376, https://doi.org/10.1016/j.epsl.2018.06.017, 2018.
Spector, P., Stone, J., Cowdery, S. G., Hall, B., Conway, H., and Bromley, G.: Rapid early-Holocene deglaciation in the Ross Sea, Antarctica, Geophys. Res. Lett., 44, 7817–7825, https://doi.org/10.1002/2017GL074216, 2017.
Stern, T. A. and ten Brink, U. S.: Flexural Uplift of the Transantarctic Mountains, J. Geophys. Res., 94, 10315–10330, 1989.
Stern, T. A., Baxter, A. K., and Barrett, P. J.: Isostatic rebound due to glacial erosion within the Transantarctic Mountains, Geology, 33, 221–224, https://doi.org/10.1130/G21068.1, 2005.
Stone, J. O.: Air pressure and cosmogenic isotope production, J. Geophys. Res., 105, 23753–23759, 2000.
Stone, J. O., Balco, G., Sugden, D. E., Caffee, M. W., Sass, L. C. I., Cowdery, S. G., and Siddoway, C.: Holcene Deglaciation of Marie Byrd Land, West Antarctica, Science, 299, 99–102, https://doi.org/10.1126/science.1115233, 2003.
Strasky, S., Di Nicola, L., Baroni, C., Salvatore, M. C., Baur, H., Kubik, P. W., Schlüchter, C., and Wieler, R.: Surface exposure ages imply multiple low-amplitude Pleistocene variations in East Antarctic Ice Sheet, Ricker Hills, Victoria Land, Antarct. Sci., 21, 59–69, https://doi.org/10.1017/S0954102008001478, 2009.
Sugden, D. E., Summerfield, M. A., Denton, G. H., Wilch, T. I., McIntosh, W. C., Marchant, D. R., and Rutford, R. H.: Landscape development in the Royal Society Range, southern Victoria Land, Antarctica: stability since the mid-Miocene, Geomorphology, 28, 181–200, https://doi.org/10.1016/S0169-555X(98)00108-1, 1999.
Sugden, D. and Denton, G.: Cenozoic landscape evolution of the Convoy Range to Mackay Glacier area, Transantartic Mountains: Onshore to offshore synthesis, Bull. Geol. Soc. Am., 116, 840–857, https://doi.org/10.1130/B25356.1, 2004.
Sugden, D. E., Marchant, D. R., and Denton, G. H.: The Case for a Stable East Antarctic Ice Sheet, Geogr. Ann. A, 75, 151–154, 1993.
Swanger, K. M., Marchant, D. R., Schaefer, J. M., Winckler, G., and Head, J. W.: Elevated East Antarctic outlet glaciers during warmer-than-present climates in southern Victoria Land, Global Planet. Change, 79, 61–72, https://doi.org/10.1016/j.gloplacha.2011.07.012, 2011.
Todd, C., Stone, J., Conway, H., Hall, B., and Bromley, G.: Late Quaternary evolution of Reedy Glacier, Antarctica, Quaternary Sci. Rev., 29, 1328–1341, https://doi.org/10.1016/j.quascirev.2010.02.001, 2010.
Van der Wateren, F. M., Dunai, T. J., Van Balen, R. T., Klas, W., Verbers, A. L. L. M., Passchier, S., and Herpers, U.: Contrasting neogene denudation histories of different structural regions in the transantarctic mountains rift flank constrained by cosmogenic isotope measurements, Global Planet. Change, 23, 145–172, 1999.
Vermeesch, P., Balco, G., Blard, P. H., Dunai, T. J., Kober, F., Niedermann, S., Shuster, D. L., Strasky, S., Stuart, F. M., Wieler, R., and Zimmermann, L.: Interlaboratory comparison of cosmogenic21Ne in quartz, Quat. Geochronol., 26, 20–28, https://doi.org/10.1016/j.quageo.2012.11.009, 2015.
Wang, Y., Momohara, A., Wang, L., Lebreton-Anberrée, J., and Zhou, Z.: Evolutionary history of atmospheric CO2 during the late cenozoic from fossilized metasequoia needles, PLoS One, 10, 1–15, https://doi.org/10.1371/journal.pone.0130941, 2015.
Webb, P. N., Harwood, D. M., McKelvey, B. C., Mercer, J. H., and Stott, L. D.: Cenozoic marine sedimentation and ice-volume variation on the East Antarctic craton, Geology, 12, 287–291, https://doi.org/10.1130/0091-7613(1984)12<287:CMSAIV>2.0.CO;2, 1984.
Wilch, T. I., Lux, D. R., Denton, G. H., and McIntosh, W. C.: Minimal Pliocene-Pleistocene uplift of the dry valleys sector of the Transantarctic Mountains: a key parameter in ice-sheet reconstructions, Geology, 21, 841–844, https://doi.org/10.1130/0091-7613(1993)021<0841:MPPUOT>2.3.CO;2, 1993.
Willeit, M., Ganopolski, A., Calov, R., and Brovkin, V.: Mid-Pleistocene transition in glacial cycles explained by declining CO2 and regolith removal, Sci. Adv., 5, 1–8, https://doi.org/10.1126/sciadv.aav7337, 2019.
Winnick, M. J. and Caves, J. K.: Oxygen isotope mass-balance constraints on Pliocene sea level and East Antarctic Ice Sheet stability, Geology, 43, 879–882, https://doi.org/10.1130/G36999.1, 2015.
Zhang, Y. G., Pagani, M., Liu, Z., Bohaty, S. M., and DeConto, R.: A 40-million-year history of atmospheric CO2, Philos. T. Roy. Soc. A, 371, 1–20, 2013.