the Creative Commons Attribution 4.0 License.
the Creative Commons Attribution 4.0 License.
 | 11 Jun 2020
The current state and 125 kyr history of permafrost on the Kara Sea shelf: modeling constraints
Anatoliy Gavrilov
Vladimir Pavlov
Alexandr Fridenberg
Mikhail Boldyrev
Vanda Khilimonyuk
Elena Pizhankova
Sergey Buldovich
Natalia Kosevich
Ali Alyautdinov
Mariia Ogienko
Alexander Roslyakov
Maria Cherbunina
Evgeniy Ospennikov
The evolution of permafrost on the Kara shelf is reconstructed for the past 125 kyr. The work includes zoning of the shelf according to geological history; compiling sea level and ground temperature scenarios within the distinguished zones; and modeling to evaluate the thickness of permafrost and the distribution of frozen, cooled and thawed deposits. Special attention is given to the scenarios of the evolution of ground temperature in key stages of history that determined the current state of the Kara shelf permafrost zone: characterization of the extensiveness and duration of the existence of the sea during stage 3 of the marine oxygen isotope stratigraphy (MIS-3), the spread of glaciation and dammed basins in MIS-2. The present shelf is divided into areas of continuous, discontinuous-to-sporadic and sporadic permafrost. Cooled deposits occur at the western and northwestern water zones and correspond to areas of MIS-2 glaciation. Permafrost occurs in the periglacial domain that is within a zone of modern sea depth from 0 to 100 m, adjacent to the continent. The distribution of permafrost is mostly sporadic in the southwest of this zone, while it is mostly continuous in the northeast. The thickness of permafrost does not exceed 100 m in the southeast and ranges from 100 to 300 m in the northeast. Thawed deposits are confined to the estuaries of large rivers and the deepwater part of the St. Anna trench. The modeling results are correlated to the available field data and are presented as a geocryological map. The formation of frozen, cooled and thawed deposits of the region is inferred to depend on the spread of ice sheets, sea level, and duration of shelf freezing and thawing periods.
- Article
(15009 KB) - Full-text XML
-
Supplement
(507 KB) - BibTeX
- EndNote


Permafrost studies and mapping on the Kara Sea shelf (Fig. 1) have a long history. The first evidence of its distribution in the Kara and other Eurasian Arctic shelves appeared in early permafrost maps of the USSR (Parkhomenko, 1937; Baranov, 1960). The distribution and approximate thickness of the Kara shelf permafrost were first calculated numerically in the early 1970s (Chekhovsky, 1972). By the late 1970s–early 1980s, Soloviev and Neizvestnov had mapped the whole Russian shelf, and their work became part of the later 1:2 500 000 geocryological map of the USSR (Yershov, 1991). The dynamics of subsea permafrost on the Kara shelf during regression and transgression events were reconstructed by modeling (Danilov and Buldovich, 2001). Drilling was first used to study the features of permafrost and its recent formation in the nearshore zone of the Yamal Peninsula (Grigoriev, 1987).
Since 1986, drilling and seismoacoustic surveys have been run by the Arctic Marine Engineering Geological Survey (AMEGS) to constrain the extent of the Kara shelf permafrost and the depths to its top and base; the results were reported in a number of publications (Melnikov and Spesivtsev, 1995; Dlugach and Antonenko, 1996; Bondarev et al., 2001; Rokos et al., 2009; Kulikov and Rokos, 2017; Vasiliev et al., 2018). However, the available data are restricted to the southwestern part of the shelf, while the northeastern part remains poorly documented and undrilled.
Another recent map of permafrost distribution and thickness on the southwestern Kara shelf (Portnov et al., 2013) is based on seismoacoustic data and modeling with reference to the glacial eustatic curve but without regard to regional features related to the existence of marine oxygen isotope stratigraphy cold stage 3 (MIS-3) marine terraces. Followed by drilling and seismoacoustic results from the western Yamal Peninsula shelf (Melnikov and Spesivtsev, 1995; Dlugach and Antonenko, 1996; Baulin, 2001; Baulin et al., 2005; etc.), geocryological modeling has become quite realistic lately, but its quality is still insufficient for economic activity, even within the best-documented southwestern Kara shelf. As for the northeastern and central shelf parts, knowledge is very preliminary.
The available permafrost maps refer to the isobaths of the maximum regression during the peak of cold MIS-2. This reference is still uncertain because the sea depths and level apparently varied in a range of at least tens of meters during the Late Pleistocene–Holocene glaciation history and related isostatic movements, as one may infer from the elevations of MIS-4 and MIS-3 marine terraces on the Novaya Zemlya islands, which are raised high (+45, +55 and +60 m; Bolshiyanov et al., 2006), and the adjacent continent (Yamal and Gydan) terraces, which were formed at low sea level (−100 and −70 m, respectively; Siddall et al., 2003, 2006).
Given the logistic challenge and high costs of field studies, knowledge of the Kara shelf permafrost can be extended by numerical modeling. Its application makes it possible to establish the connection of permafrost with components of the natural environment, including glaciations, glacio-isostatic movements and sea level fluctuations.
Permafrost on the Arctic shelf is mostly of relict origin: it formed during regressions and cold climate events and then degraded during Late Pleistocene–Holocene transgressions.
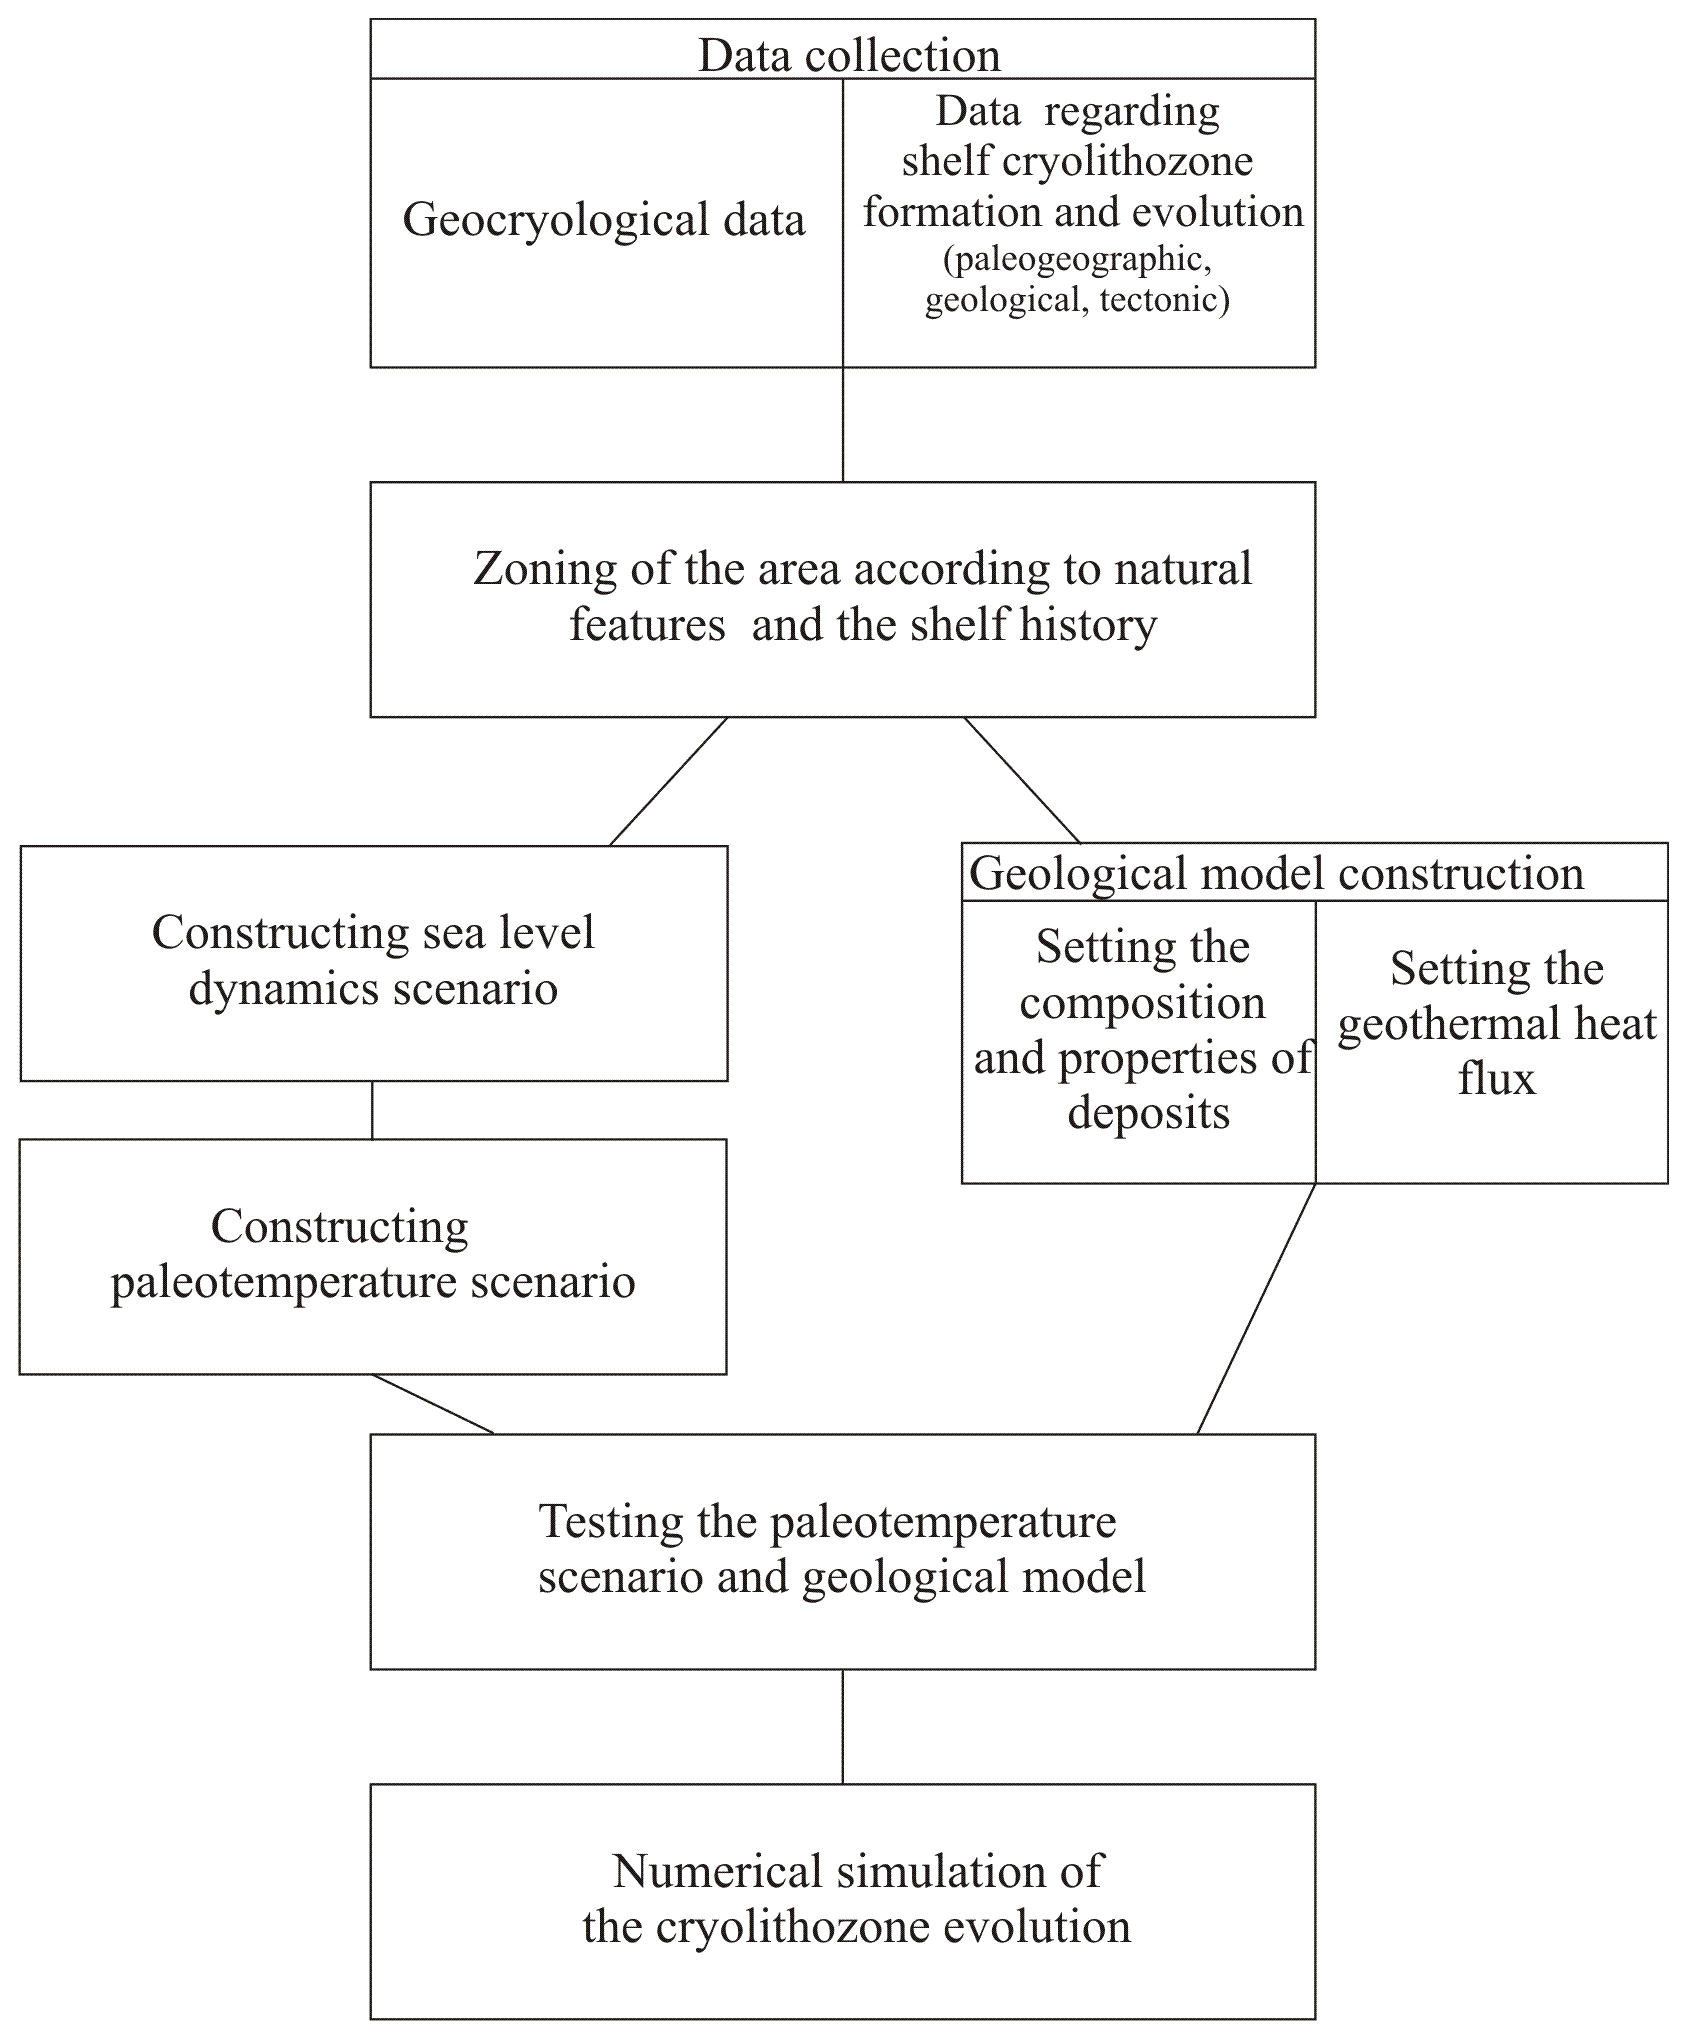
The methods for subsea permafrost research have been developed since the 1970s and use the retrospective approach of reconstructing the permafrost evolution (Gavrilov, 2008; Romanovskii and Tumskoy, 2011). The history of methods applied to study the structure and distribution of permafrost of the eastern Russian Arctic was reviewed previously (Gavrilov et al., 2001; Gavrilov, 2008; Nicolsky et al., 2012). We follow these methods in our research and are trying to extend their work. The work includes compiling a database of paleogeographic, geological, tectonic and geocryological conditions used further to divide the region according to geological history and for creating possible scenarios of sea level and ground temperature variations that serve as boundary conditions in heat transfer modeling. The general scheme of the methodology is presented in Fig. 1.
The zoning is determined by the allocation of territorial units that are characterized by uniformity of formation conditions and, accordingly, by similar (on the given scale of the studies) parameters of permafrost: its distribution, thickness and permafrost table (Kudryavtsev, 1979). The history of subsea permafrost has been modeled using software designed at the Department of Geocryology of the Faculty of Geology at Lomonosov Moscow State University (Khrustalev et al., 1994; Pesotsky, 2016). The software can solve the Stefan problems for non-steady-state thermal conductivity assuming moving fronts of pore moisture phase transitions within the modeling domain and variable boundary conditions. The explicit two-layer scheme is applied using the balance method (Pustovoit, 1999) and the enthalpy formulation of the problem. The code used is publicly available at https://github.com/kriolog/qfrost (last access: 15 February 2020) (kriolog, 2020).
The permafrost dynamics were simulated for numerous paleoclimate scenarios that cover the full range of presumable conditions on the Arctic shelves. The total number of paleoscenarios for the Kara Sea used in the course of mathematical modeling was 30. The 1D modeling domain had a vertical size of 5 km to avoid the effect of its base on the permafrost dynamics. The temperatures at the surface according to the available paleoclimate reconstructions and a heat flux at the base of the modeling domain were used as the first- and second-order boundary conditions, respectively. The heat flux was assumed to be 50 mW m−2, which corresponds to the average for most of the shelf territory, or 75 mW m−2, as in zones of relatively high heat flux in gas-bearing bottom sediments (Khutorskoi et al., 2013). The modeling was performed for several uniform reference rock and sediment types in order to reduce the number of possible solutions in the case of high lithological diversity in the area. In a next step the modeling results were extrapolated to complex sections that comprise alternating reference lithologies or different combinations of relatively thick layers. We consider two cases to extrapolate our results: in the first case, we consider the uniform alternation of homogeneous layers with relatively small thickness (relative to the total thickness of the permafrost). The linear interpolation is simply performed in accordance with the percentage of the thickness of frozen ground obtained during modeling for two “pure” soils at a given moment. The second case relates to the two-layer structure of the section, when a sufficiently thick (as compared with the permafrost thickness) homogeneous layer is underlain by a second homogeneous layer of unlimited thickness. In this case the following considerations are valid. If the thickness of the upper layer is zero, then the thickness of the permafrost is equal to the result of simulation for pure rocks/sediments of the second layer. If the thickness of the upper layer is equal to (or more than) the thickness of the permafrost obtained for the first layer, then the problem becomes single-layer and the thickness of the permafrost is equal to that of the first layer. Therefore, when the thickness of the upper layer changes from zero to the thickness of the permafrost of the first layer, the thickness of the two-layer section changes from the thickness of the permafrost of the second layer to the permafrost thickness the first layer. As a first approximation, we can therefore linearly interpolate between these two extreme cases (see Supplement).
All deposits were assumed to be saline from top to bottom of the modeling domain. All reference rocks and sediments were considered saline with Ds = 0.8–1.1 % according to the concentration of pore saline solution corresponding to the bottom water concentration of the Kara Sea (32–34 ‰). The freezing temperature was set to the freezing temperature of seawater (−1.8 ∘C) for all types of soils in the modeling. This assumption was made due to the fact that all the marine sediments composing the Yamal Peninsula have similar salinity to a depth of 300 m and more. A very high degree of averaging over the above properties had to be used for the modeling caused by the lack of data on the water area. The rare drilling data showed the salinization of sediments through the entire drilling depth. Because of this, salt diffusion could not be taken into account, and the salinity did not vary with the depth. We further used a scheme with complete freezing (thawing) of moisture in the ground at the moving front of phase transitions. The unfrozen water content in the sediments was taken into account by reducing the volumetric heat of phase transitions in the model by the value corresponding to the average content of unfrozen water in different types of rocks at negative temperatures typical of the process under study (Chuvilin et al., 2007). The thermophysical properties, such as the unfrozen water content and the heat of the phase transitions of water in the pores and the freezing point of the deposits, were set taking into account the indicated salinization.
The paleotemperature scenarios and the geological-tectonic model were tested by comparing the present permafrost state estimated by forward modeling with the available field data from well-documented areas, to achieve the best fit. The evolution of the shelf permafrost was reconstructed by heat transfer modeling for the Late Pleistocene–Holocene, since 125 ka, the end of a long-term interglacial transgression. At that time, subsea permafrost had presumably fully degraded over the whole studied part of the Kara Sea, as the entire north of the West Siberian Plain had been covered by the sea from 140 to 120 ka (Zastrozhnov et al., 2010; Shishkin et al., 2015) and the temperatures of unfrozen bottom sediments approached the steady state. The modeling results were correlated with field data, and both datasets were used for the final geocryological zoning of the Kara shelf region. The Kara shelf has been quite well studied in terms of paleogeography. Figure 2 compiles the various studies available for the paleogeography of this region.
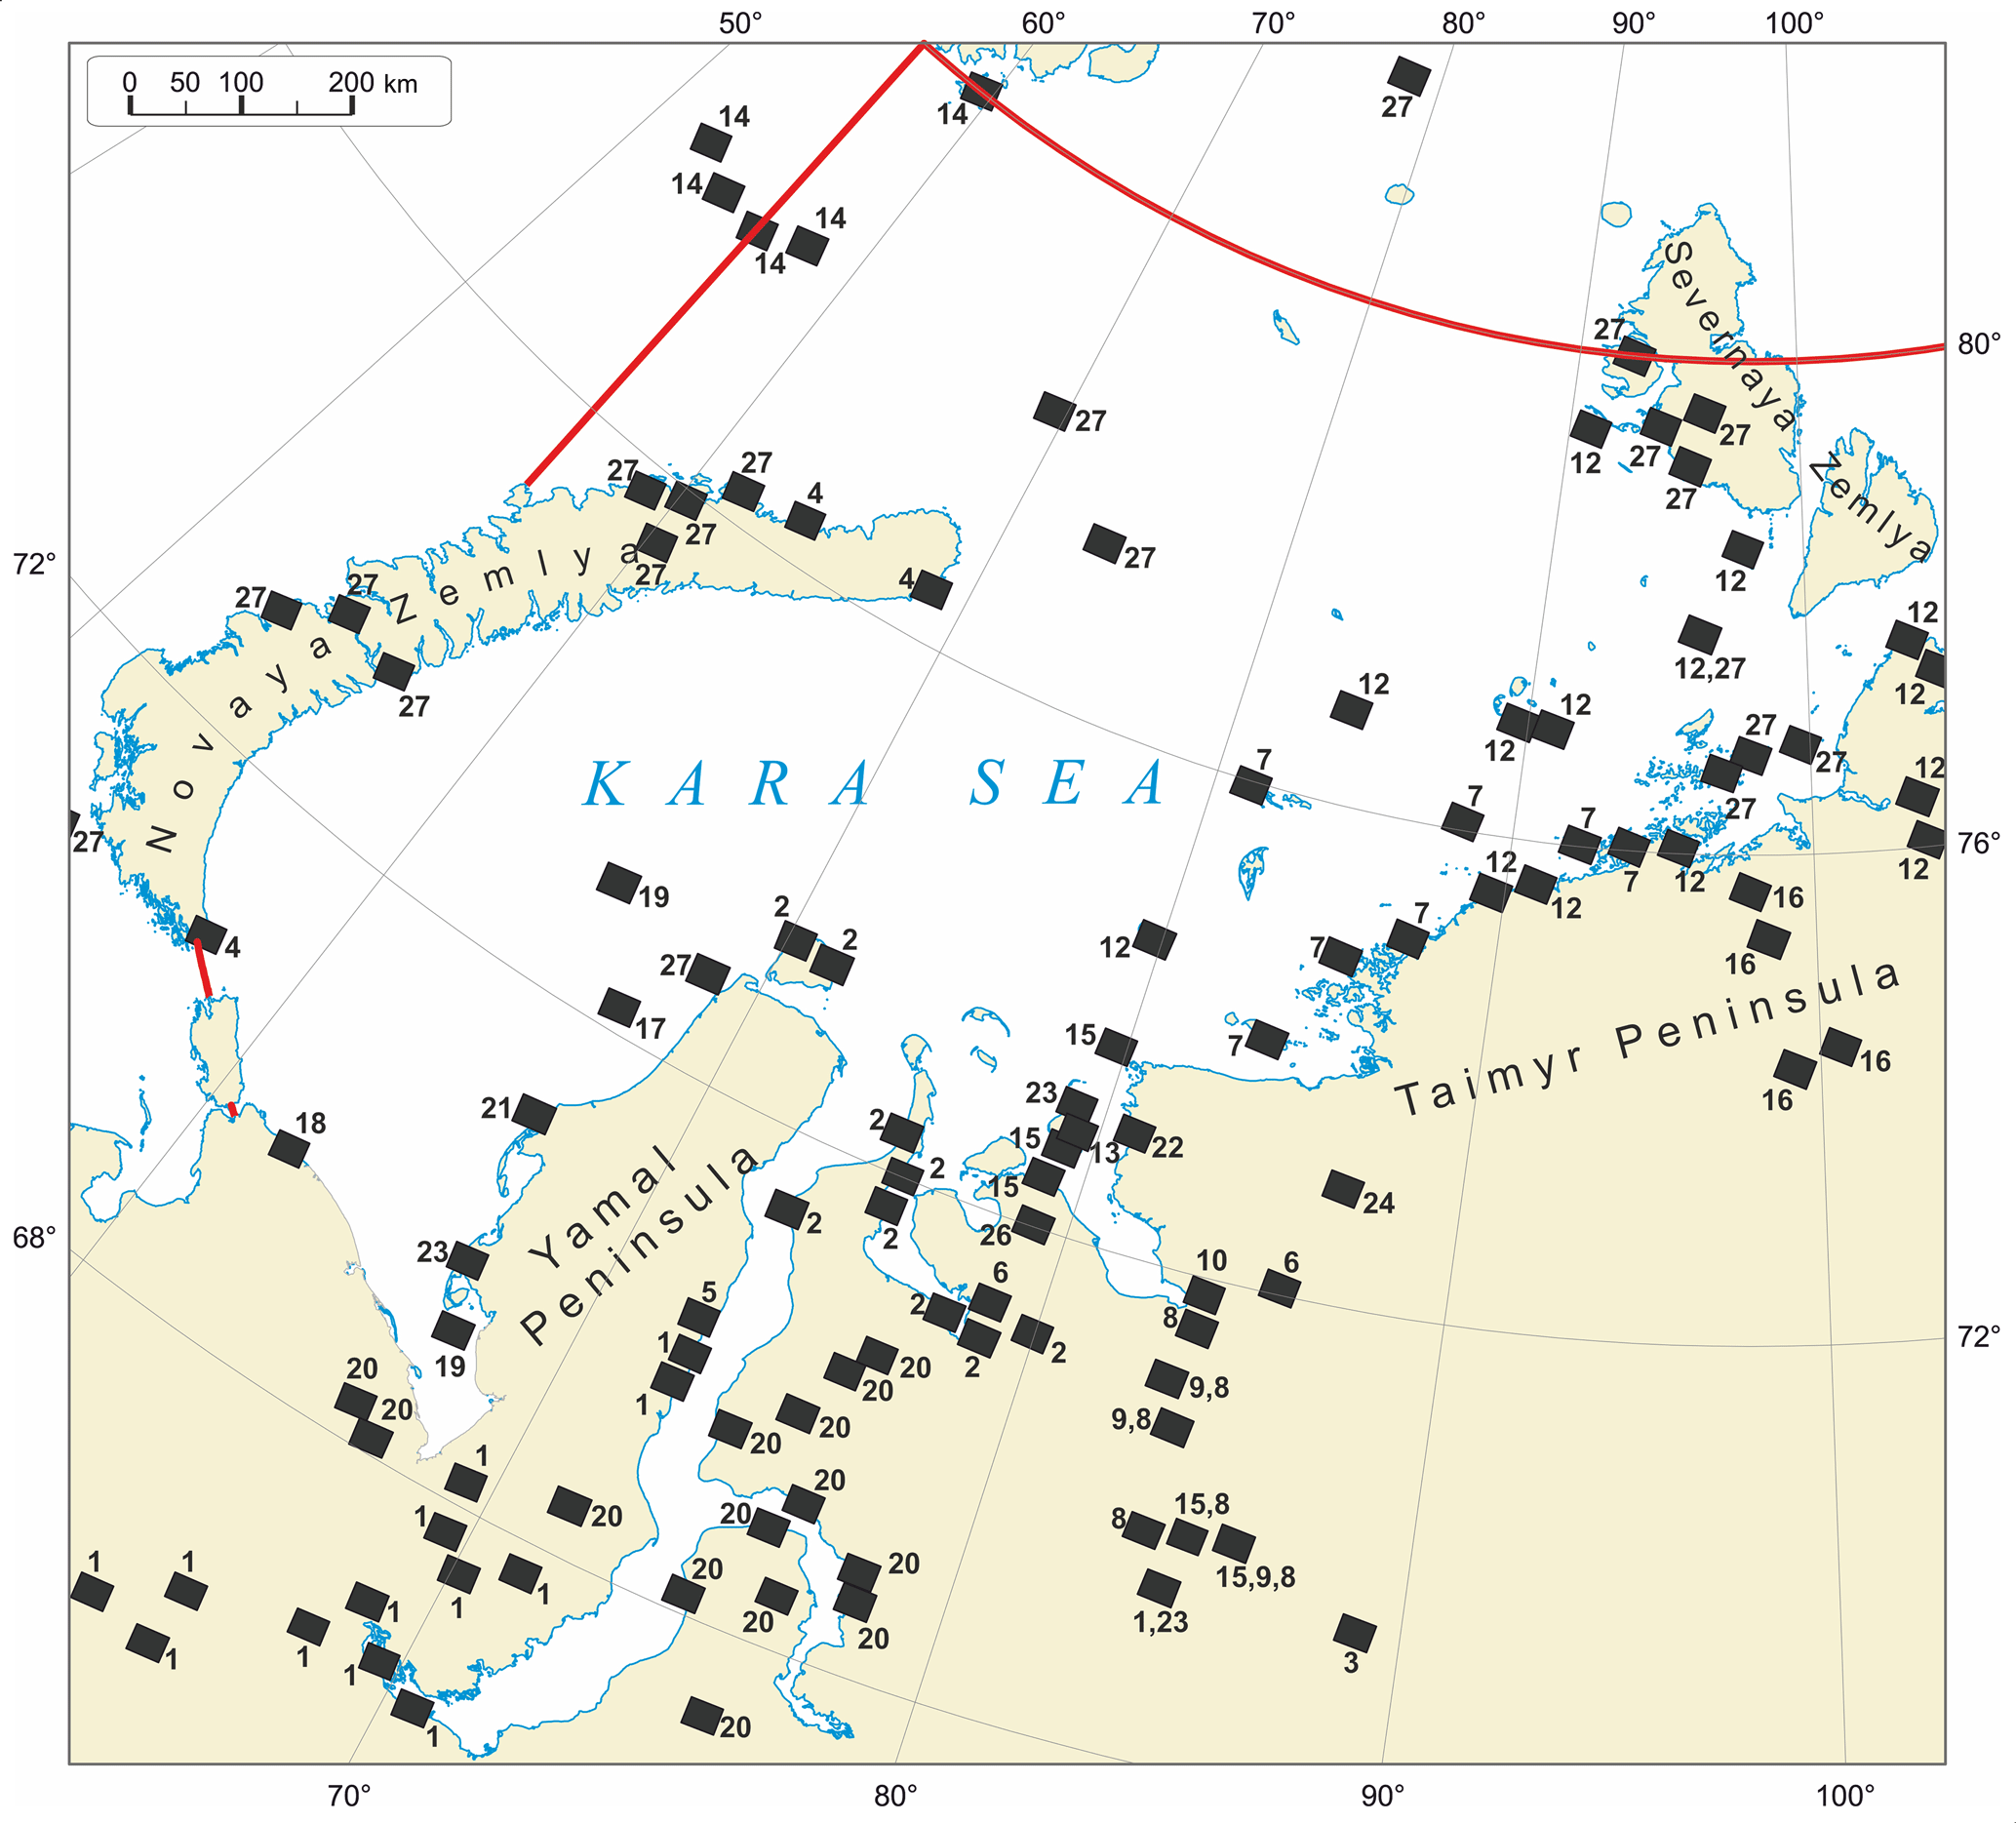
Figure 2Late Pleistocene geology of the Kara region: data coverage (the red line is the research region boundary). Black squares are sites studied in different years by different research teams. Numbers 1 to 28 refer to publications: 1 – Astakhov and Nazarov (2010); 2 – Baranskaya et al. (2018); 3 – Bolshiyanov et al. (2007); 4 – Bolshiyanov et al. (2009); 5 – Vasil`chuk (1992); 6 – Geinz and Garutt (1964); 7 – Gusev et al. (2016a); 8 – Gusev et al. (2016b); 9 – Gusev et al. (2015a); 10 – Gusev et al. (2015b); 11 – Gusev et al. (2013); 12 – Gusev et al. (2012a); 13 – Gusev and Molod`kov (2012); 14 – Gusev et al. (2012b); 15 – Gusev et al. (2011); 16 – Derevyagin et al. (1999); 17 – Kulikov and Rokos (2017); 18 – Leibman and Kizyakov (2007); 19 – Melnikov and Spesivtsev (1995); 20 – Nazarov (2011); 21 – Grigoriev (1987); 22 – Streletskaya et al. (2012); 23 – Streletskaya et al. (2015); 24 – Sulerzhitsky et al. (1995); 25 – Forman et al. (2002); 26 – Gilbert et al. (2007); 27 – Hughes et al. (2016); 28 – Svendsen et al. (2004).
There are a number of ideas about the paleogeography of the Kara region and its development in the Late Pleistocene. Evaluation of the validity of these ideas and the selection of the most reasonable of them was one of the objectives of the present study. The most popular are two controversial hypotheses implying the presence (Svendsen et al., 2004; Hughes et al., 2016) and absence (Gusev et al., 2012a) of ice sheets in the area. The absence of ice sheets is, however, inconsistent with the existence of (I) Late Pleistocene marine terraces on the Yamal and Gydan peninsulas and (II) large unfrozen zones in the offshore extensions of major West Siberian rivers (Ob, Yenisei, Taz and Gyda). The terraces most likely result from a 100 m sea level fall during the Zyryanian cold event (MIS-4). Their origin was possible only by subsidence and uplift due to ice loading (glaciation and low stand) and isostatic rebound (deglaciation and high stand), respectively. The unfrozen zone on the extension of the Ob, Yenisei, Taz, and Gyda River valleys is detectable by drilling and seismic surveys run by AMEGS (Kulikov and Rokos, 2017). In our opinion, it was formed in the place of a dammed freshwater lake (Fig. 3) that existed during the MIS-2 cold event when ice obstructed the continuing river flow. Currently, the largest part of the lake contoured according to the modern bathymetry looks like a shallow-water flat, which area occupies many hundreds of thousands of square kilometers. Within it, only the paleovalley of the Ob is expressed; it is absent from the Yenisei. The poor expression of the ancient valley network is especially clearly seen when comparing it with that in the eastern sector of the Arctic, where there were no glaciations. Paleovalleys of the Khatanga–Anabar, Olenek, Lena, Indigirka and Kolyma rivers are clearly traced in the bathymetry up to the outer shelf. The existence of a dammed lake produced by an ice dam during the MIS-2 cold event is recorded in the estuaries of the West Siberian rivers, which are much longer and farther advanced than those of any other river of the Eurasian Arctic basin. The duration of its existence is explained by the length of the Ob, Taz and Pur estuaries and their flatness. Both of these indicators are close to the record, if not the record, for Eurasia: the length of the Ob estuary is 800 km, and the average longitudinal slope of its bottom is 1–2 cm 1 km−1.
Thus, the paleogeographic scenarios we used for reference in the modeling assume the existence of ice sheets (Svendsen et al., 2004; Hughes et al., 2016). For modeling purposes, the shelf is divided by authors into domains, subdomains, areas and subareas according to its 125 kyr history of glaciations and the respective effects on bottom sediments (Fig. 3; Table 1). The largest taxa – the domains – were distinguished by the presence/absence of glaciation and its type during MIS-2, and subdomains by the presence and impact of ice and water cover on bottom deposits in MIS-2. When specifying latitudinal zonality during periods of shelf drying, we followed differences in ground temperatures reflected on the Russian geocryological map (Yershov, 1991). The mean annual ground temperature is 4–6 ∘C lower in the NE of the region (north of the Taymyr Peninsula) adjacent to the Kara coast than in the SW (southwest of the Yamal Peninsula). During the periods of drainage in the periglacial part of the shelf in MIS-2, the following values for the ground temperature were taken: −19 ∘C for the northeastern area and −15 ∘C for the southwestern one.
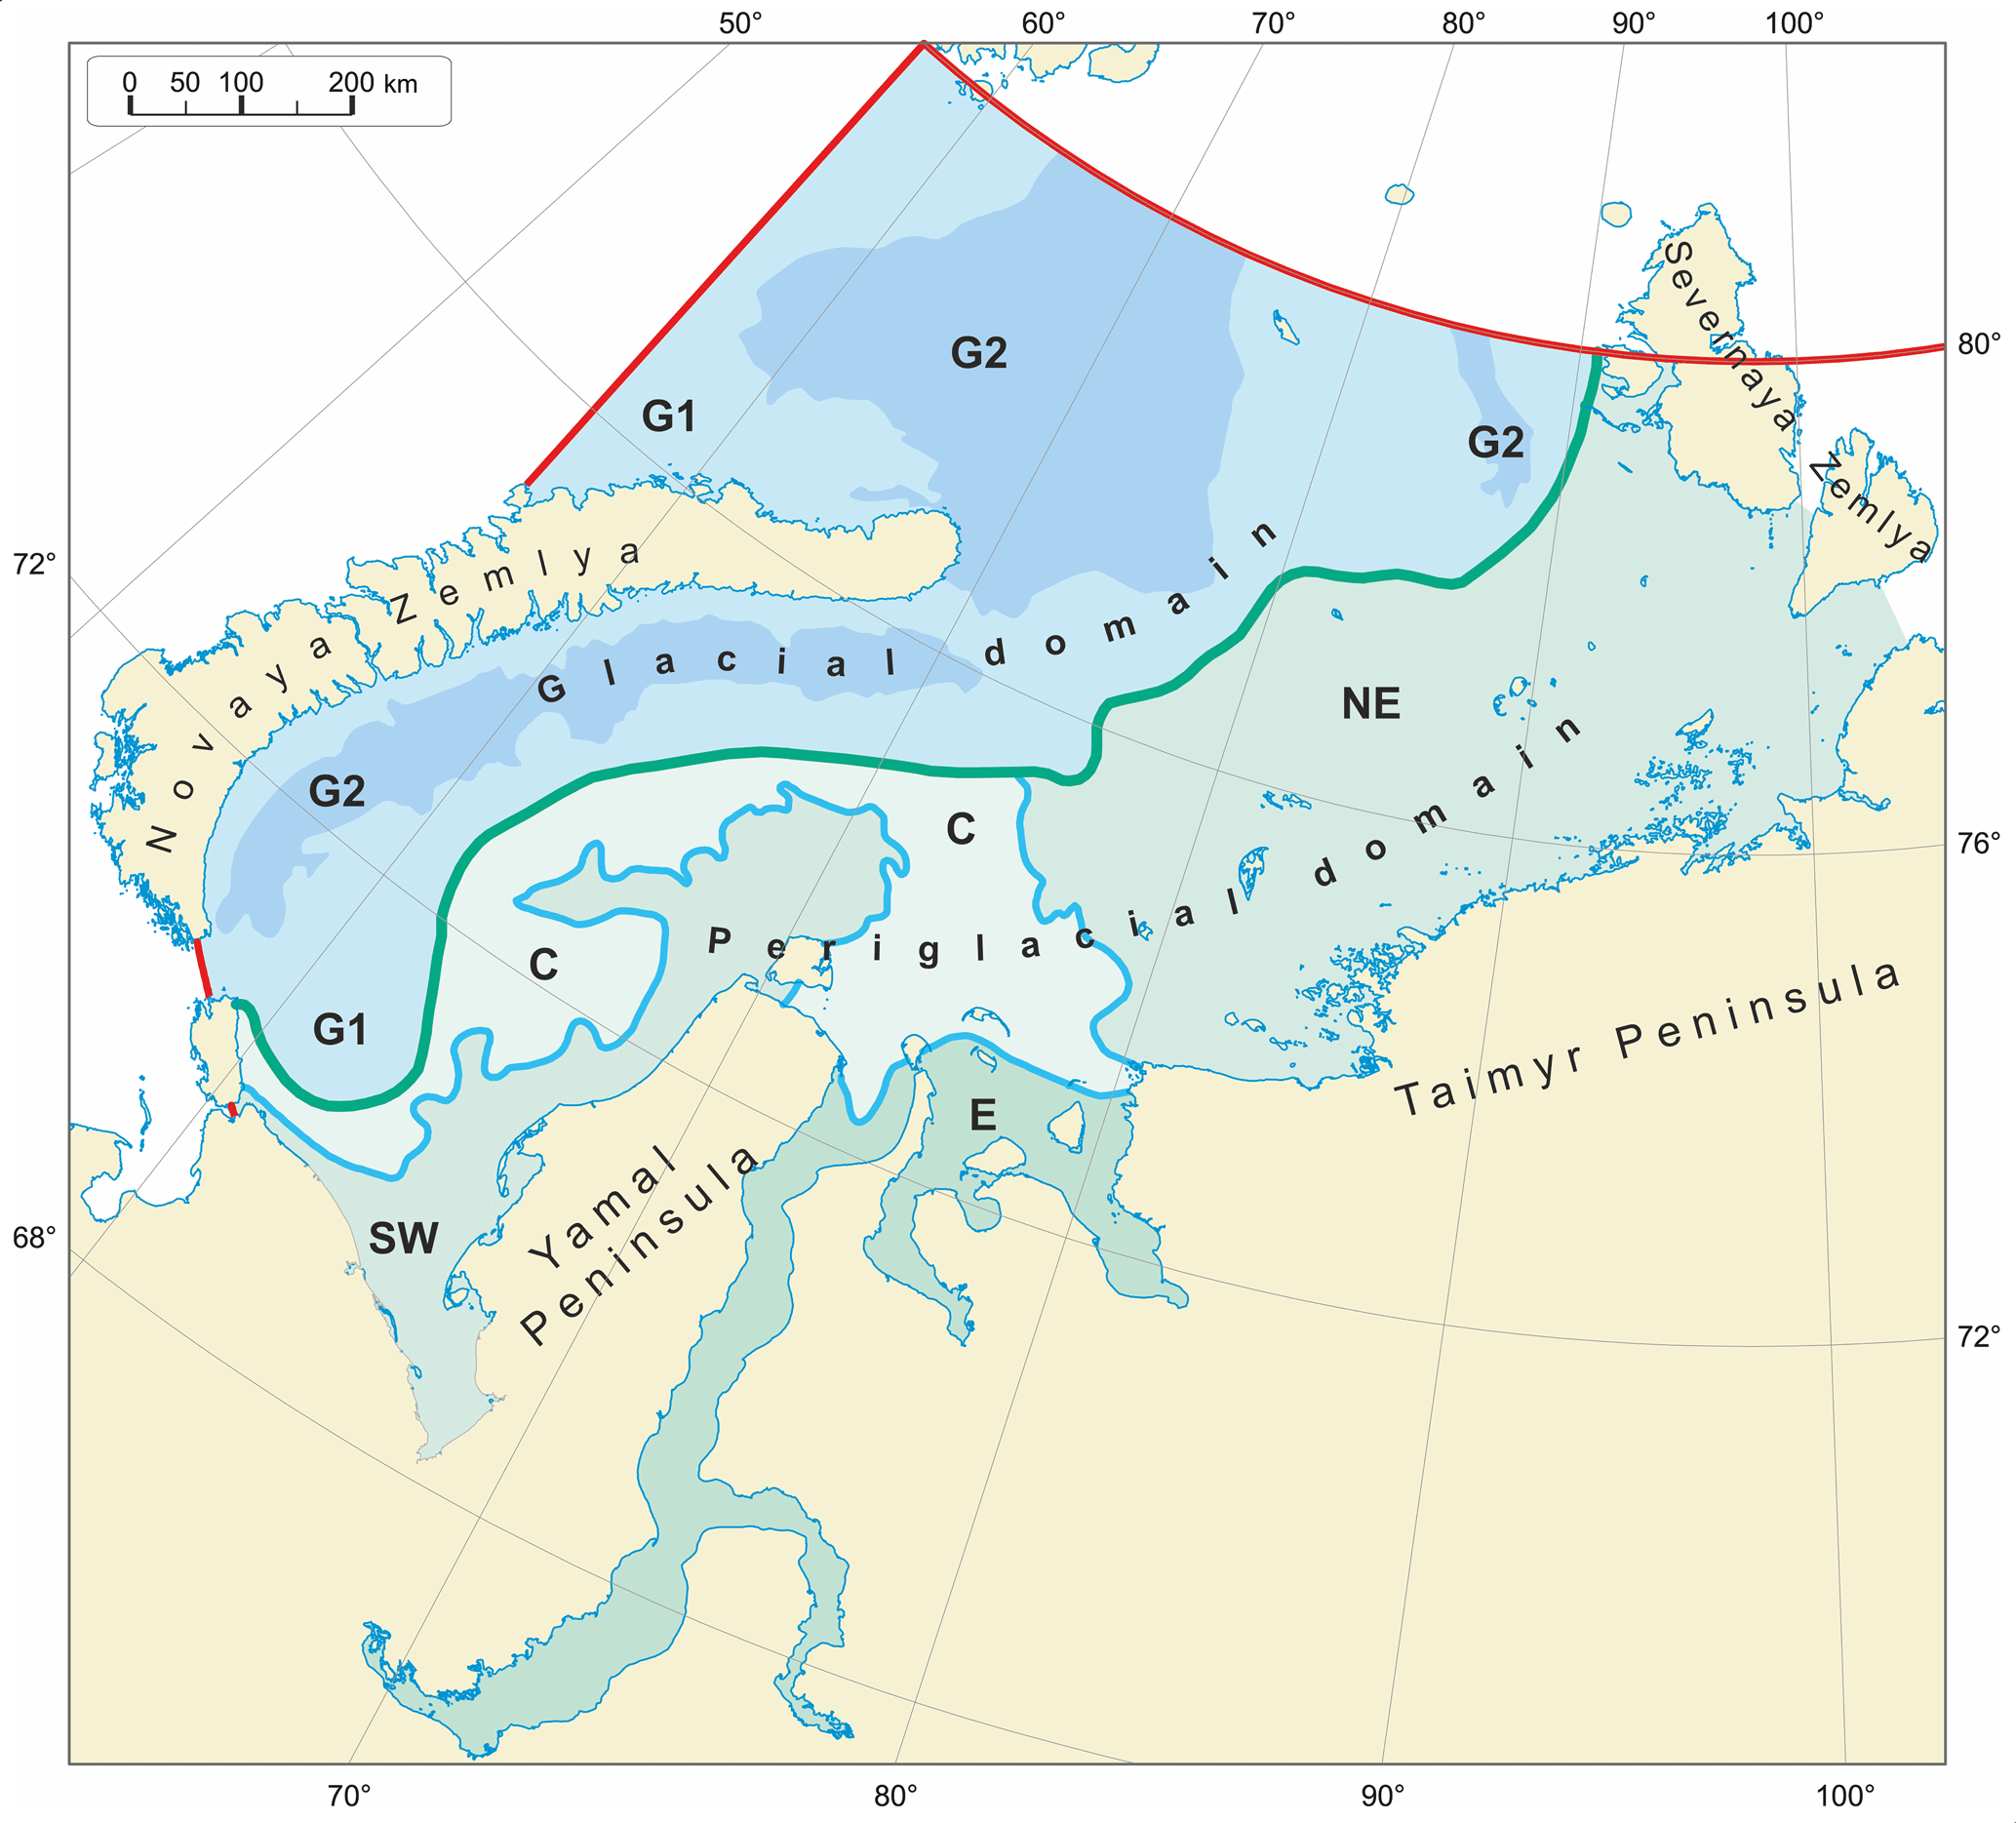
Figure 3Zoning of the Kara shelf according to its geological history for 125 kyr. Abbreviations are explained in the text and in Table 1. The red line is the region boundary in this study.
The glacial domain includes zones where the MIS-2 ice sheet reached the sea bottom (G-1) and those of shelf ice at greater sea depths (G-2); the periglacial domain consists of subaerial and subaqual (under the ice-dammed lake) subdomains, which are further divided into areas of the present sea bottom (central shelf, C) and estuaries (E) within the subaqual subdomain and southwestern (SW, 68–71∘ N) and northeastern (NE, 72–77∘ N) shelf parts within the subaerial subdomain (Fig. 3; Table 1). The SW and NE areas had different landscapes during MIS-2 and, correspondingly, differed in ground temperature and freezing depth. The areas C and E were flooded by cold (<0 ∘C) seawater and warmer (>0 ∘C) river water, respectively, in the Holocene.
Table 1Zoning of the Kara shelf (Late Pleistocene–Holocene history, past 125 kyr, events MIS-2 – MIS-1).
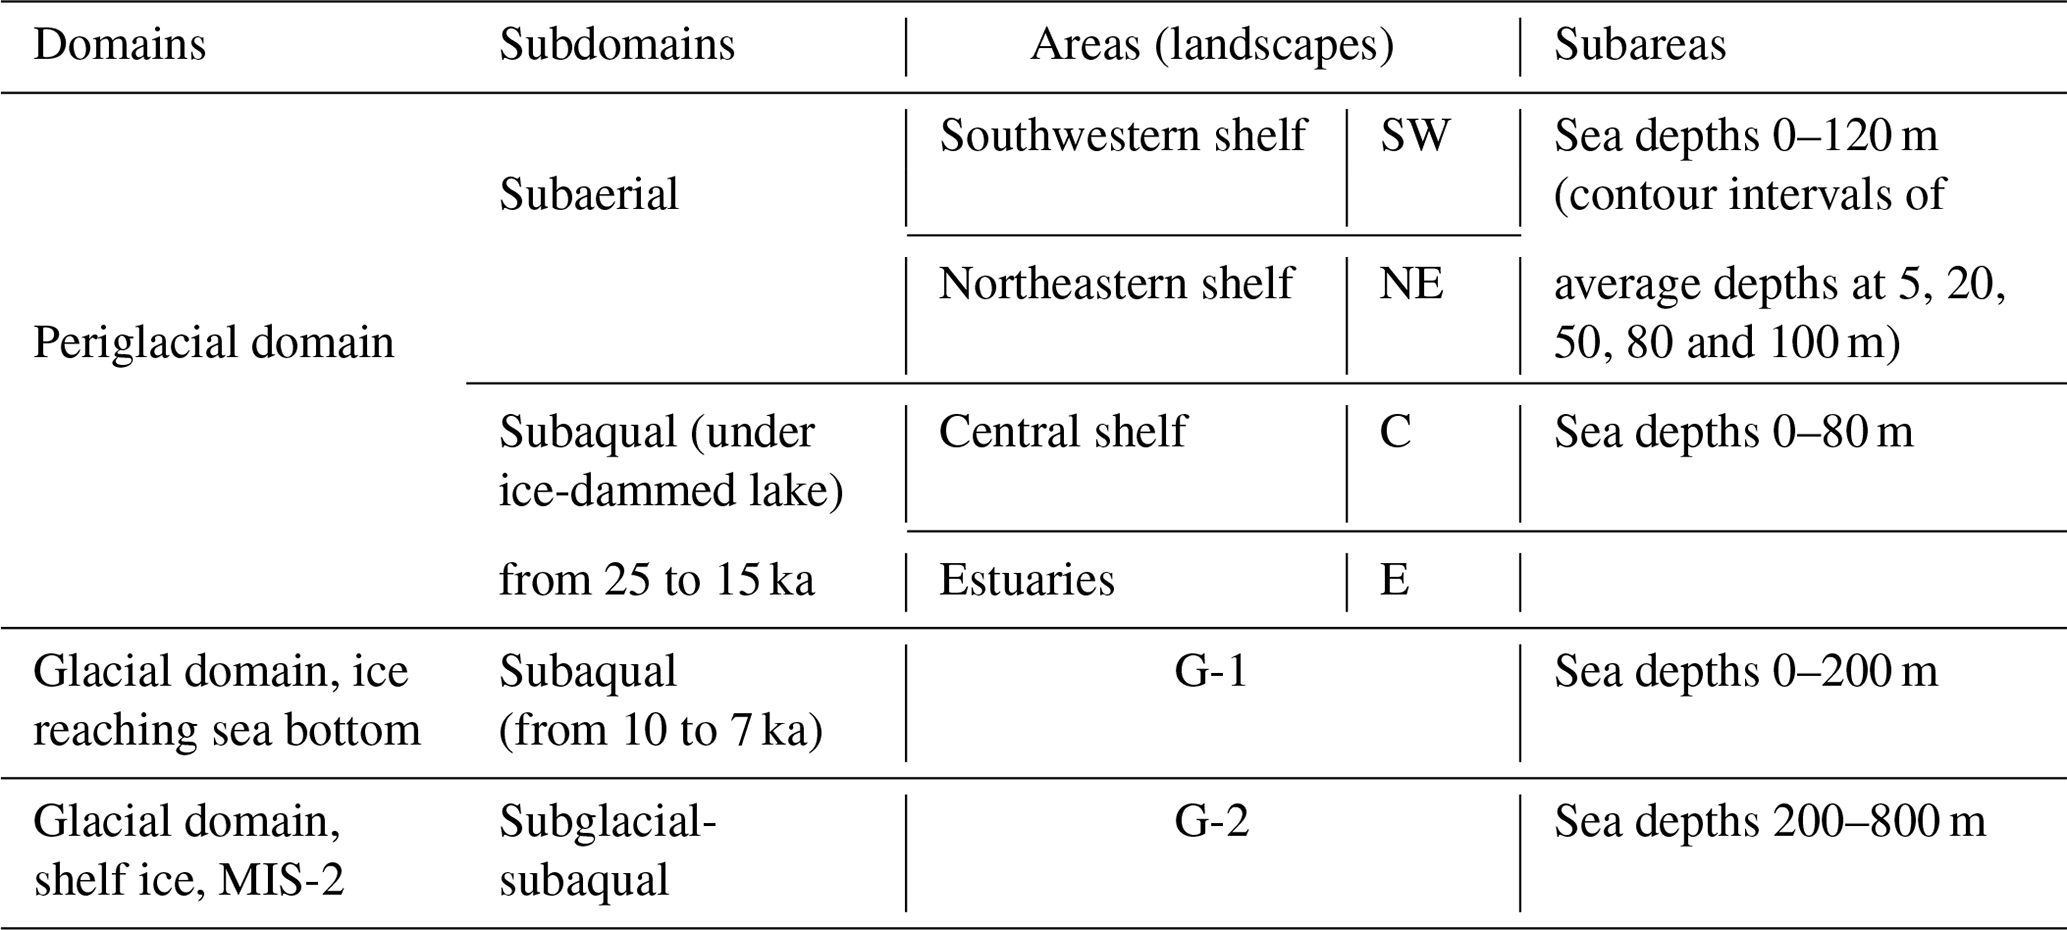
Finally, the periglacial areas were divided into subareas according to sea depths, which controlled the duration of permafrost formation during regressions and degradation during transgressions: 0–10, 10–35, 35–65, 65–90 and 90–140 m sea depth intervals with average values of 5, 20, 50, 80 and 120 m, respectively.
The subdomains of ice contacting (G-1) or not contacting (G-2) the sea bottom were revealed from seismoacoustic data, with reference to the 1:2 500 000 map of Quaternary deposits (Zastrozhnov et al., 2010): acoustically transparent deposits (below isobaths of 200 m) were considered as glacial-marine. Glaciers in these places were treated as shelf ice. The zones G-1 and G-2 are only shown in Fig. 3 and Table 1 and were not divided further. The modeling we carried out for the G-1 area showed that, to date, the permafrost formed in the MIS-2 has not survived.
The present permafrost in the region formed under the effect of climate-driven eustatic sea level change. The sea level curve for the 125–15 ka period was plotted using the eustatic curves of Lambeck and Chappell (2001) and Siddal et al. (2003, 2006). These curves were adapted to the regional specificity (Trofimov et al., 1975; Streletskaya et al., 2009; Shishkin et al., 2015), with regard to Late Pleistocene marine terraces on the Yamal Peninsula interpreted in the context of ice waxing and waning. We specifically focused on recreating the Late Pleistocene–Holocene transgression (Fig. 4a, b). The Fig. 4c shows the scenario of sea level fluctuations during the modeling period of 125–15 ka.
During the construction of a scenario of sea level fluctuations for the Kara shelf, the accounting for glacio-isostatic movements, resulting in the formation of marine terraces (Gutenberg, 1941; Flint, 1957; Bylinskiy, 1996), plays a large role. The reason for their formation is the sea flooding of the glacier bed, with a time lag reacting to the removal of the glacial load. Therefore, during the reconstructions, post-glacial sea level fluctuations are divided into two categories. In non-glacial areas, sea level rises in relation to the nearest coast; in glacial areas, it drops (Lamberk and Chappell, 2001).
In accordance with the above, the scenario is presented in the form of curves for the periglacial (with respect to the continent, Fig. 4a) and glacial (with respect to Novaya Zemlya, Fig. 4b) domains. The periglacial curve was obtained with reference to published evidence on the Laptev Sea (Bauch et al., 2001), and the glacial one was calculated according to data on isostatic subsidence and uplift during glaciation and deglaciation, respectively (Ushakov and Krass, 1972; Nikonov, 1977; Bylinskiy, 1996). Figure 4 shows the results of the calculations for the glacial domain taking into account the 500 m thickness of the MIS-2 ice sheet (Siegert and Dowdeswell, 2004). The rising of the sea level in the glacial area was caused by the bottom subsidence under the ice load reaching 140 m, while there was a sea level decrease in the periglacial area (Lamberk and Chappell, 2001).
In postglacial times, the sea level rose during transgression in the periglacial domain but fell in the glacial one as a result of Novaya Zemlya uplift. Thus, the glacial domain was exposed to weaker cooling during the glacial period and became flooded and exposed to permafrost degradation right after ice melting. Unlike this, flooding in the periglacial domain was accompanied by permafrost degradation for as long as 1500 years.
The construction of scenarios of ground temperature dynamics by the authors during the estimated time is the final part of the paleogeographic materials to conduct the numerical modeling. The ground temperatures were reconstructed in several 1D solutions, with reference to paleowater chemistry (Fotiev, 1999; Volkov, 2006) and oxygen isotope composition of ice wedges (IWs, (Vasil`chuk, 1992), as well as to reconstructed summer air temperatures. The data were corrected according to the results of Golubev et al. (2001).
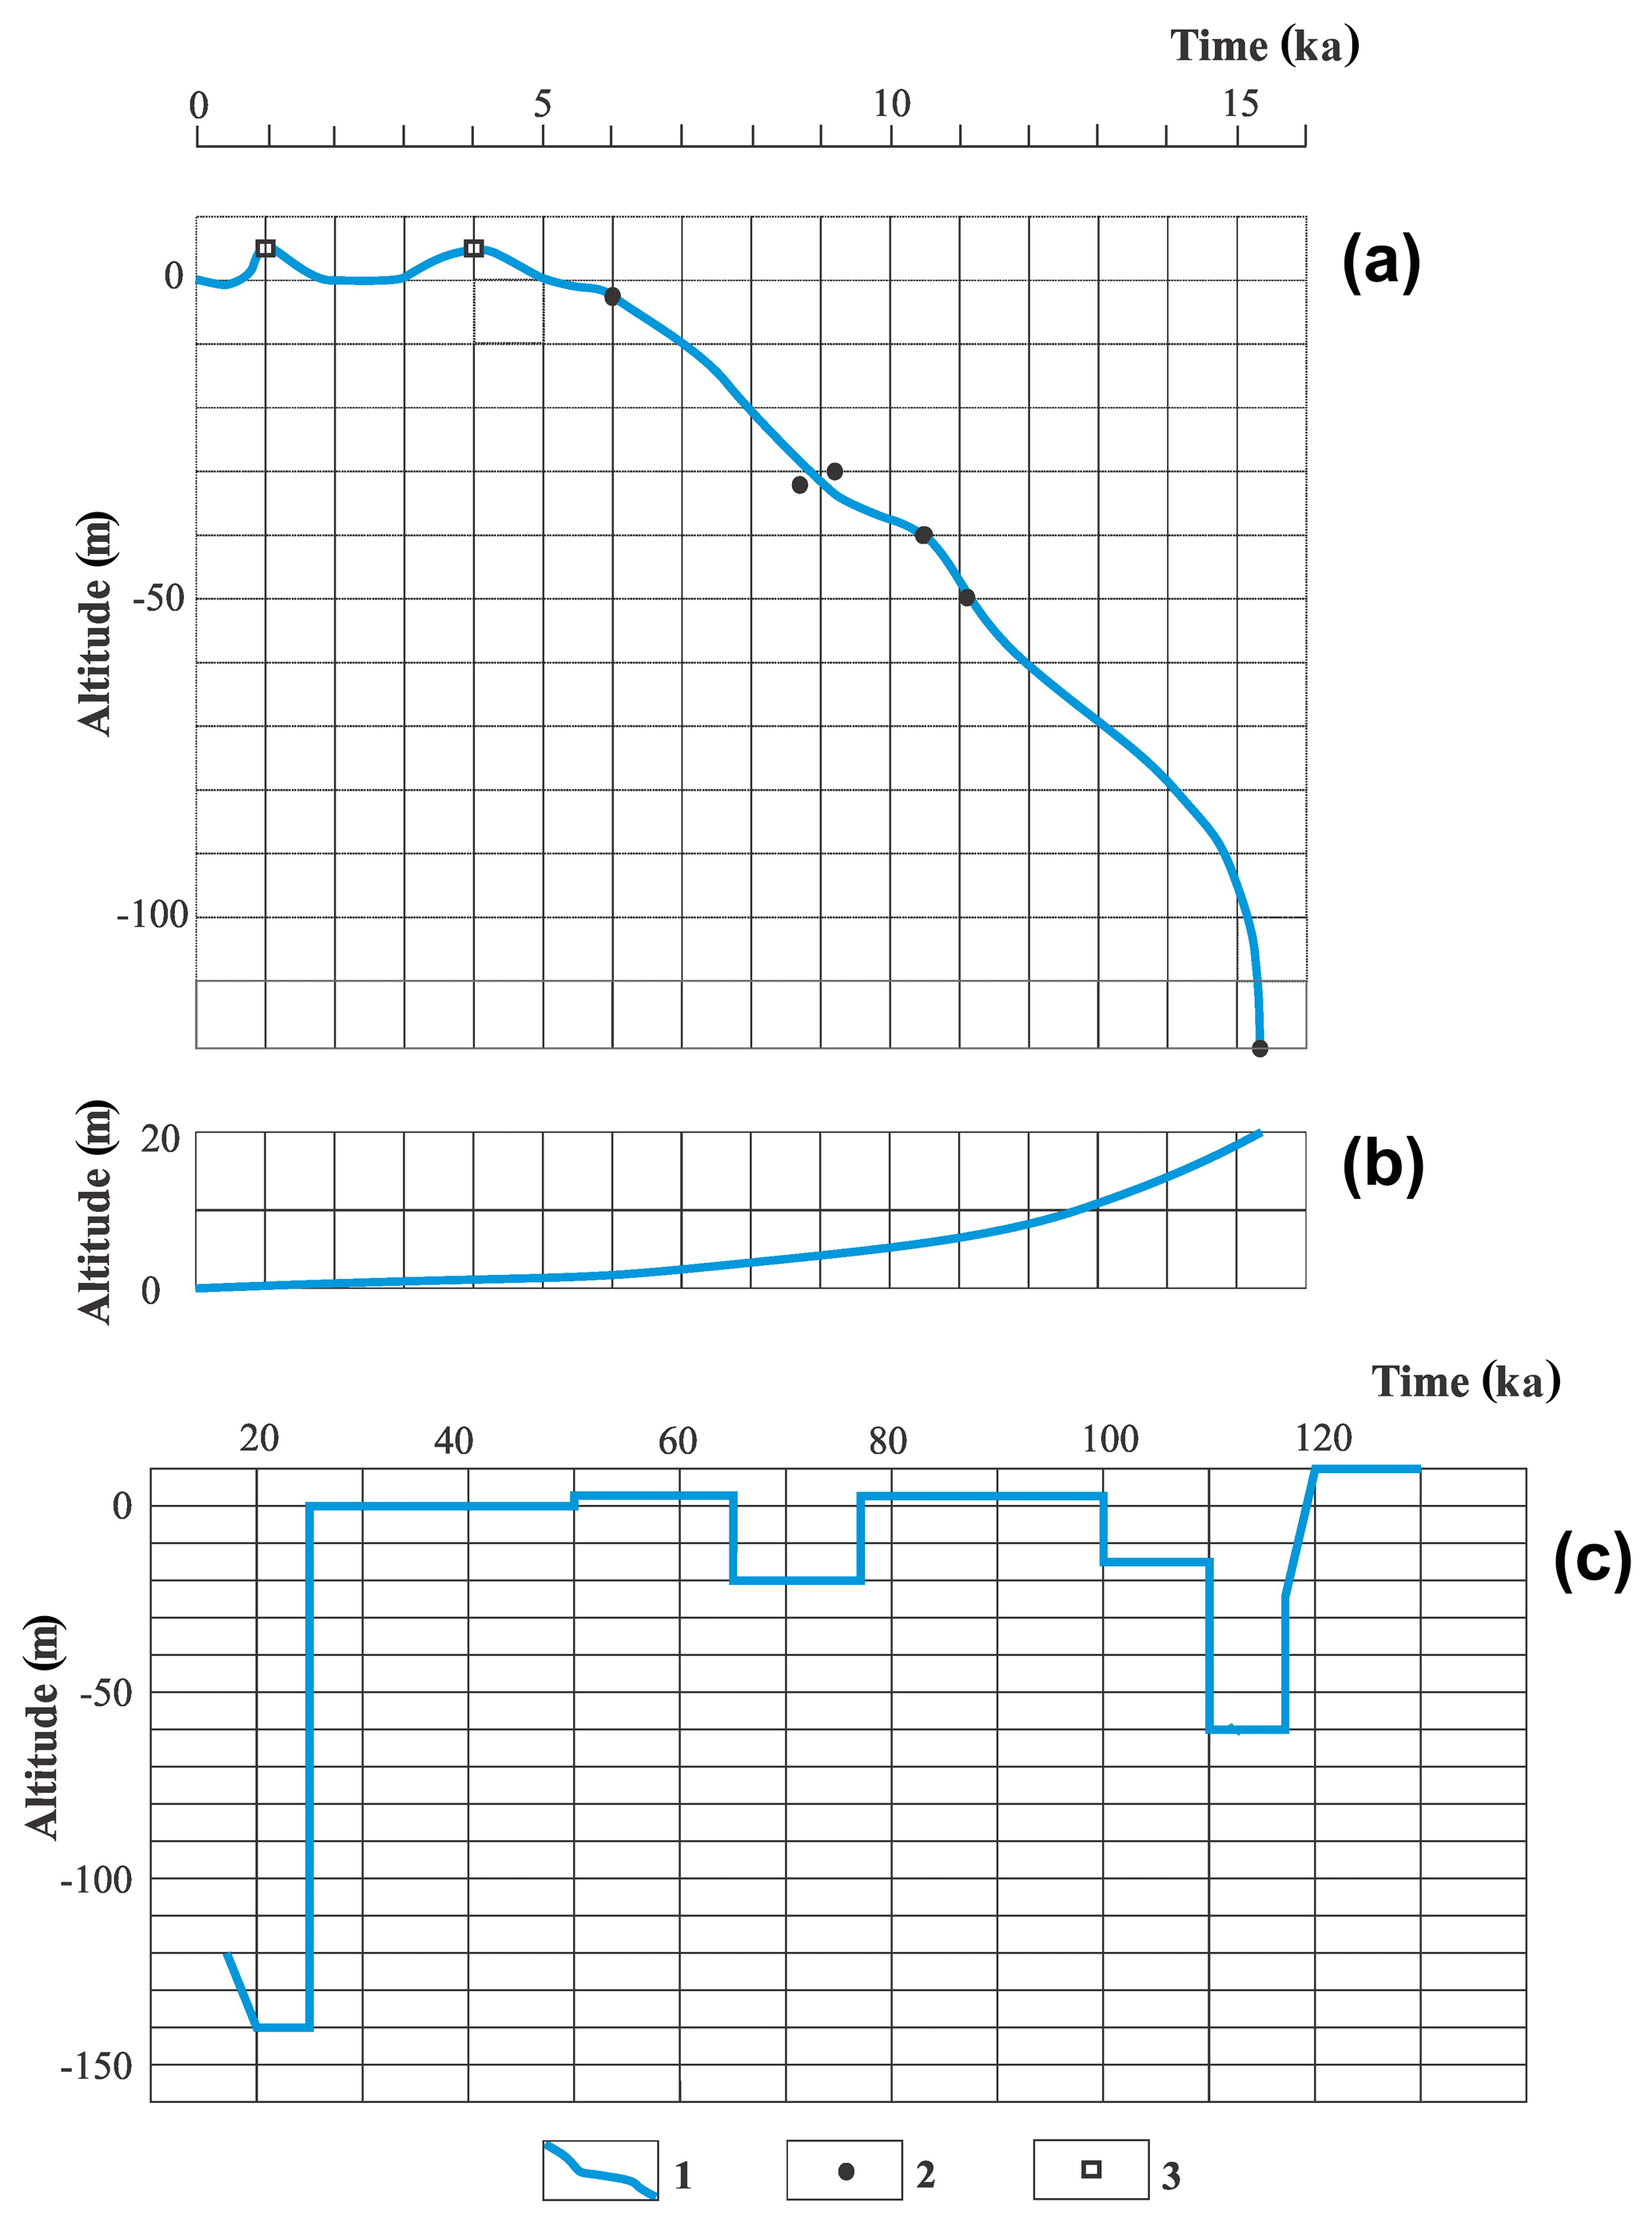
Figure 4Scenarios of sea level fluctuations: for the 15–0 ka (a) periglacial domain and (b) glacial domain, and for the 125–15 ka (c) periglacial domain. 1 – sea level curve; 2 – dated bottom sediment cores from the Gulf of Ob, Yenisei Gulf, and adjacent offshore (Stein et al., 2009) and Vilkitsky Strait (Levitan et al., 2007) sites; 3 – onshore data (Romanenko, 2012).
We present the paleogeographic scenarios as a series of paleotemperature curves adapted to the modeling purposes (Figs. 5, 6). In the following, the plots of mean annual ground temperatures over the past 125 kyr depending on paleogeographic events (shelf drainage, flooding, glaciation etc.), and in connection with the existence of latitudinal zoning and meridional sectorality, are presented.
The initial conditions are those given for the interglacial MIS-5e. There was a warm-water sea basin on the Kara shelf and adjacent lowlands from 140 to 117 ka (Figs. 5, 6) (Astakhov and Nazarov, 2010; Nazarov, 2011; Gusev et al., 2016a). Preliminary modeling for the interval MIS-6–MIS-5e (200–117 ka) showed that previously formed permafrost completely thawed under the sea during MIS-5e, which had existed for more than 20 kyr. The sequence of paleogeographic events in the form of a series of cartographic schemes is shown in Fig. 7.
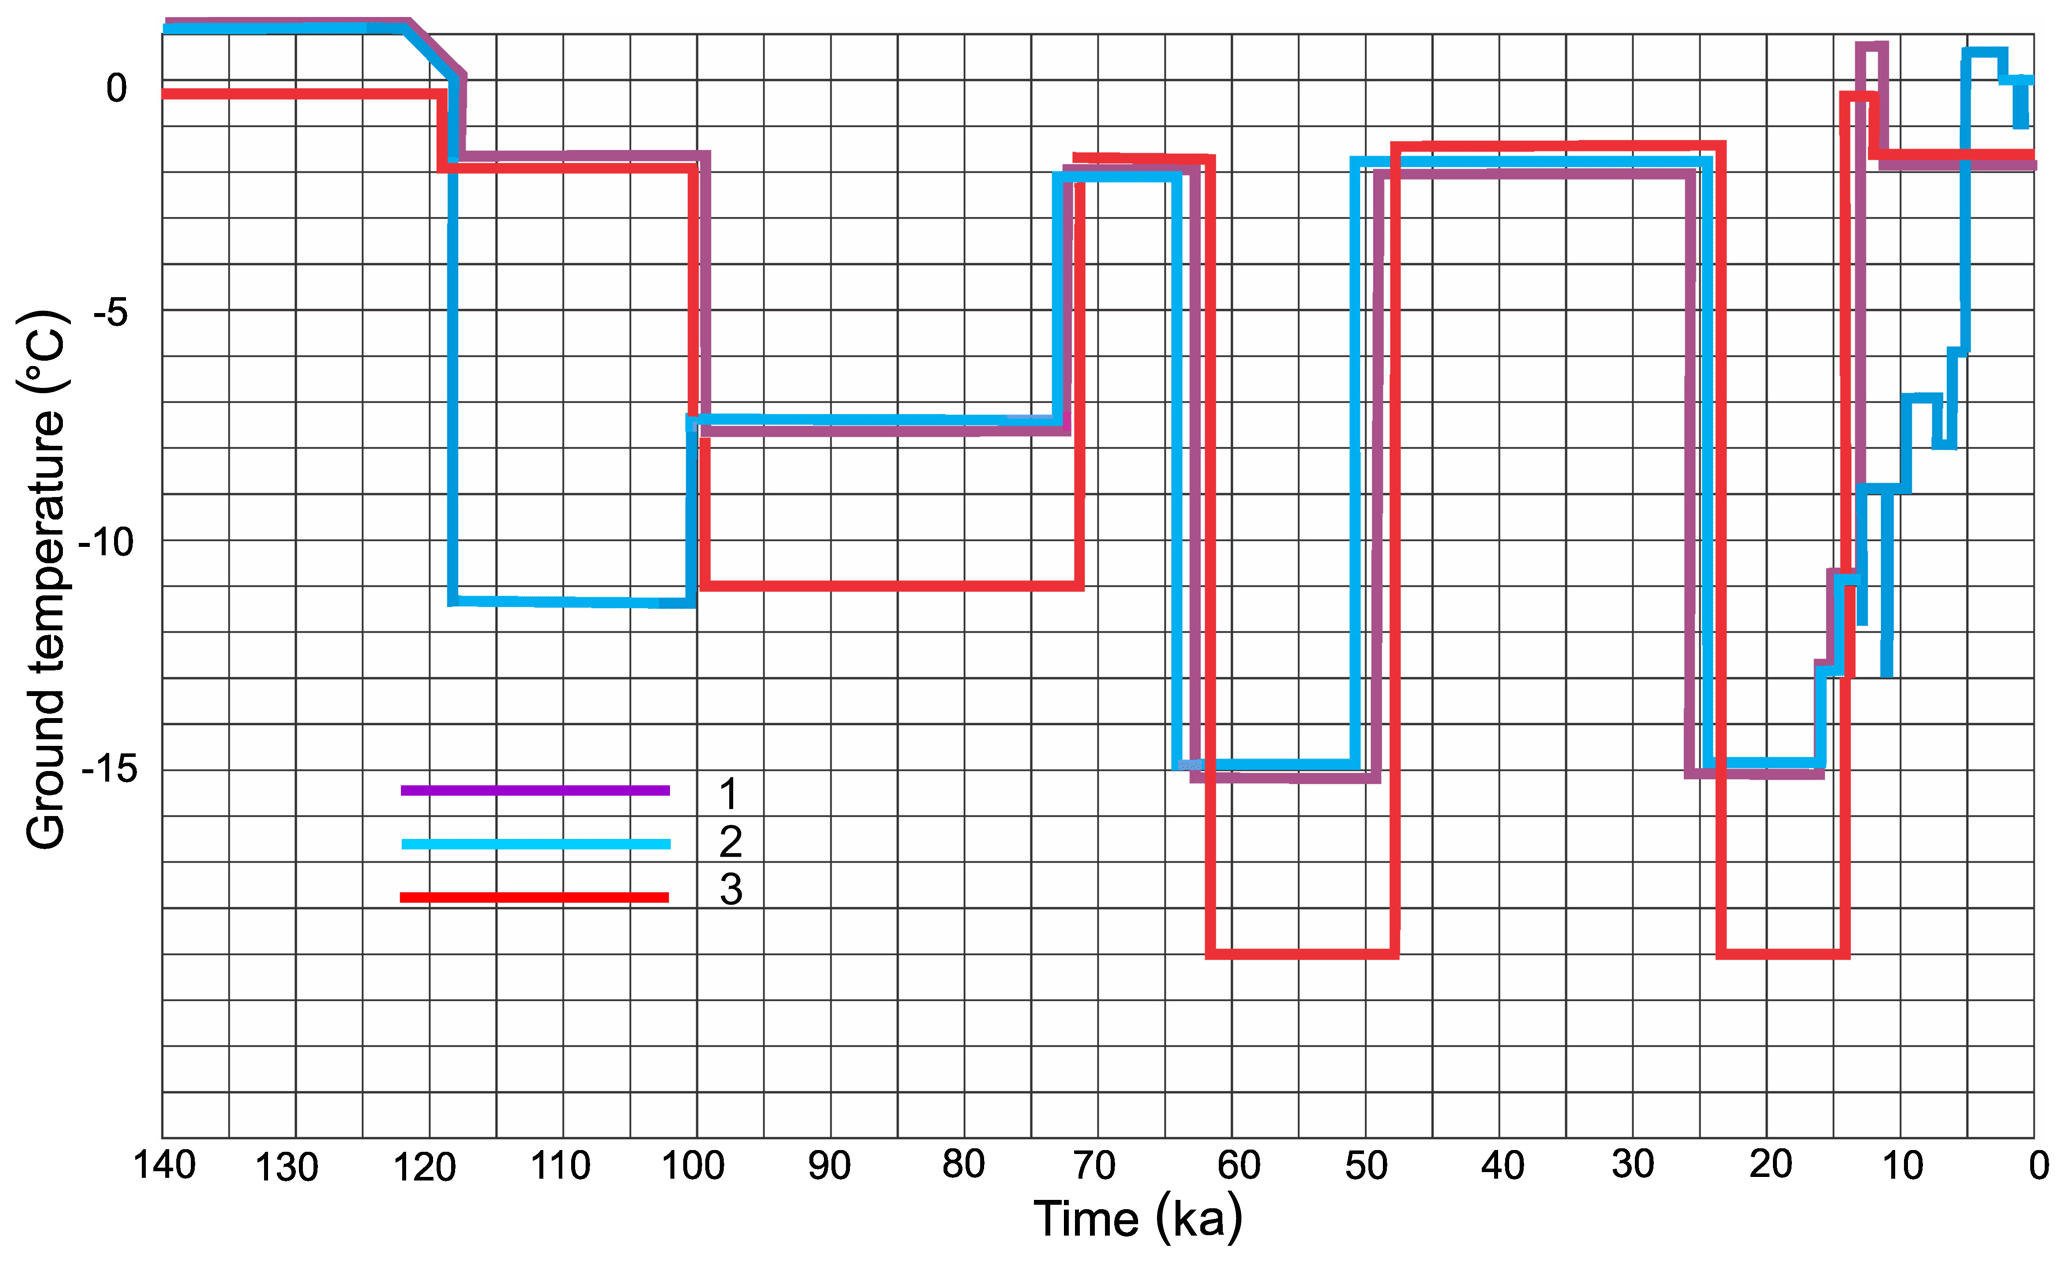
Figure 5Paleotemperature curves for the periglacial subaerial part of the shelf: 1 – southwestern shelf part (SW), 80 m isobath; 2 – southwestern shelf part (SW), 5 m isobath; 3 – northeastern shelf part (NE), 120 m isobath.
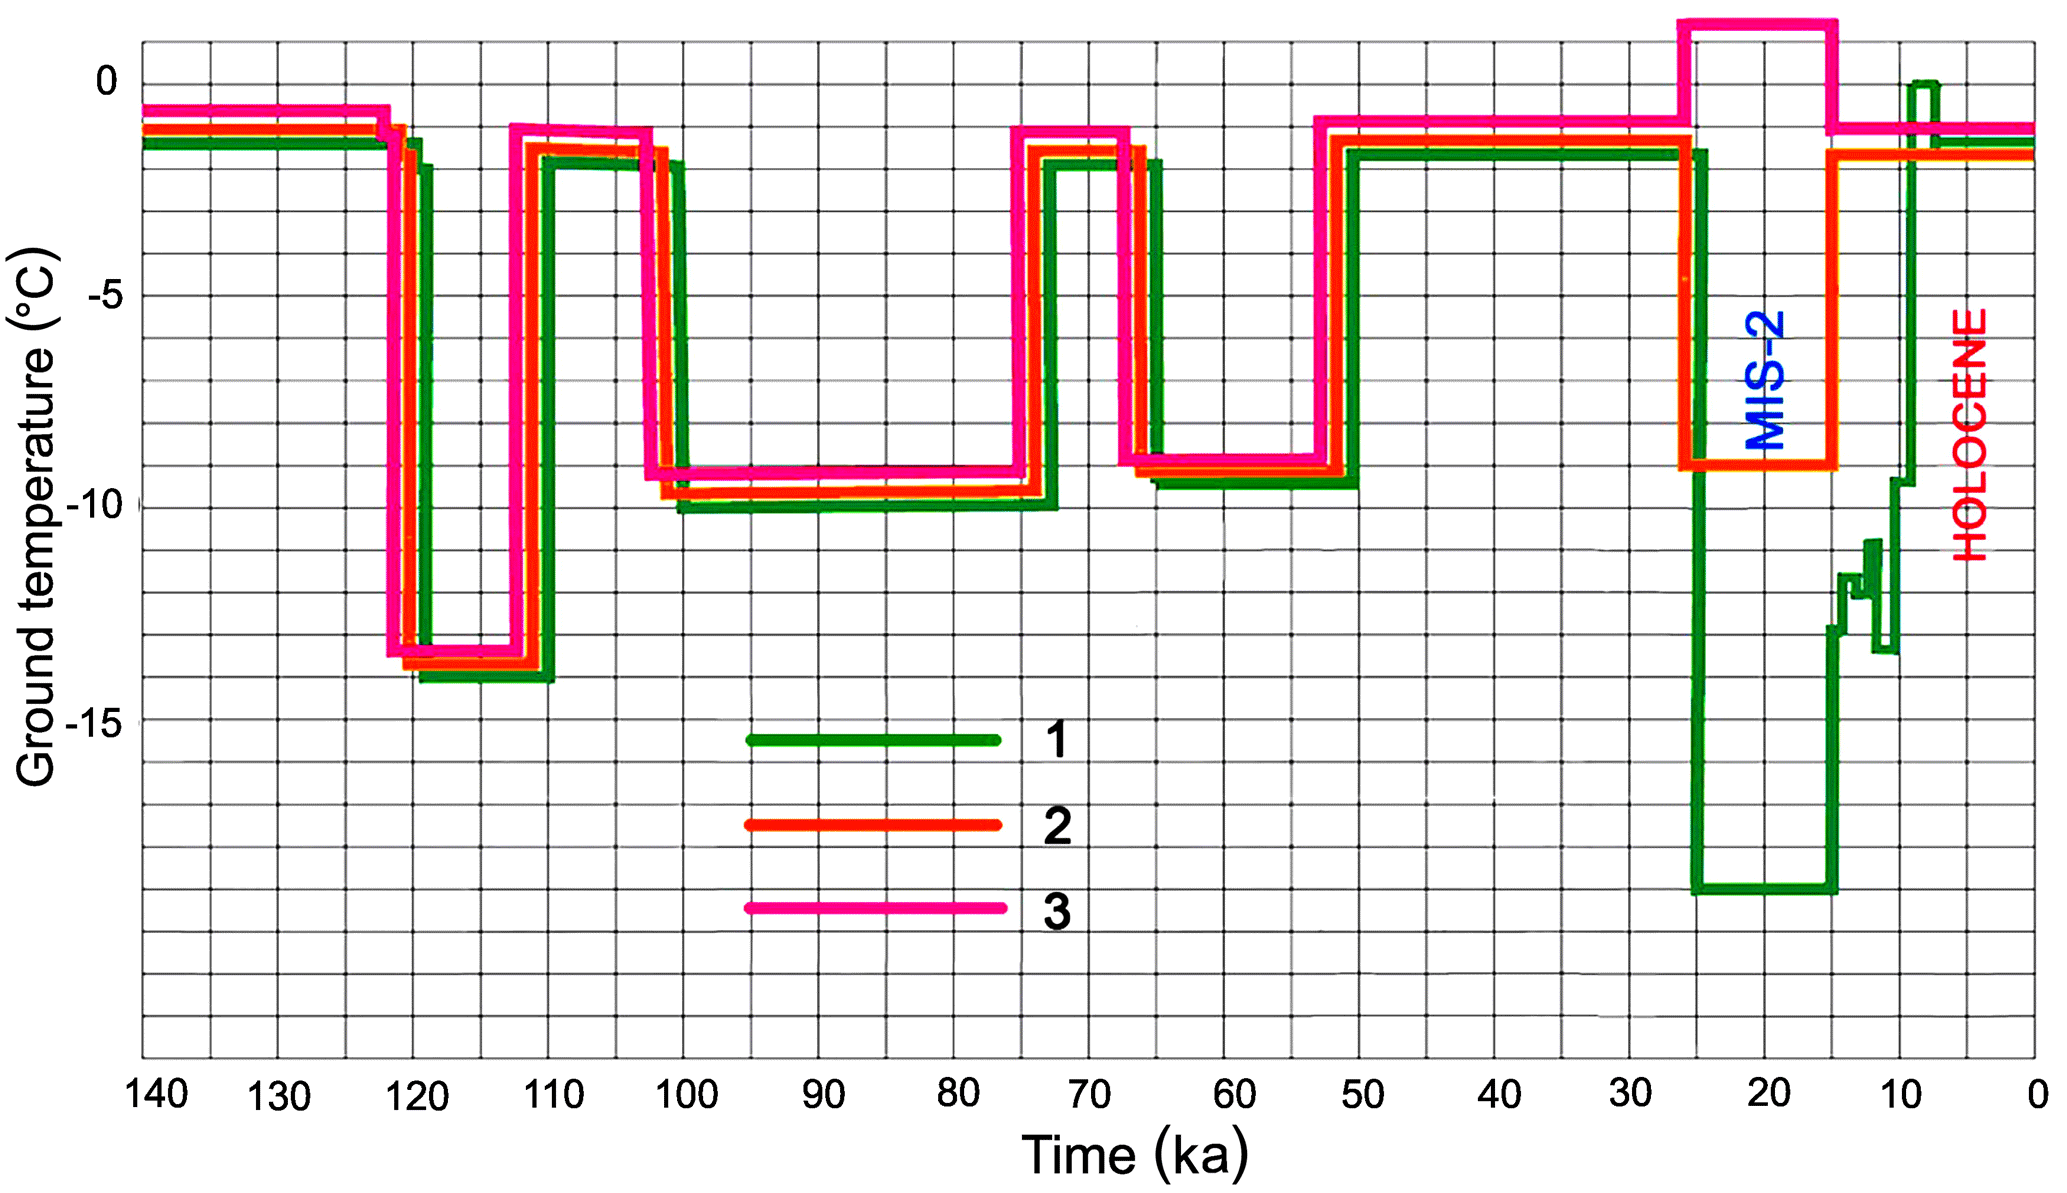
Figure 6Paleotemperature curves for 50 m isobath: 1 – periglacial subaerial northeastern shelf part (NE); 2 – ice that reached the bottom from 7 to 10 ka (G-1); 3 – subaqual (beneath dam lake) central shelf part (C).
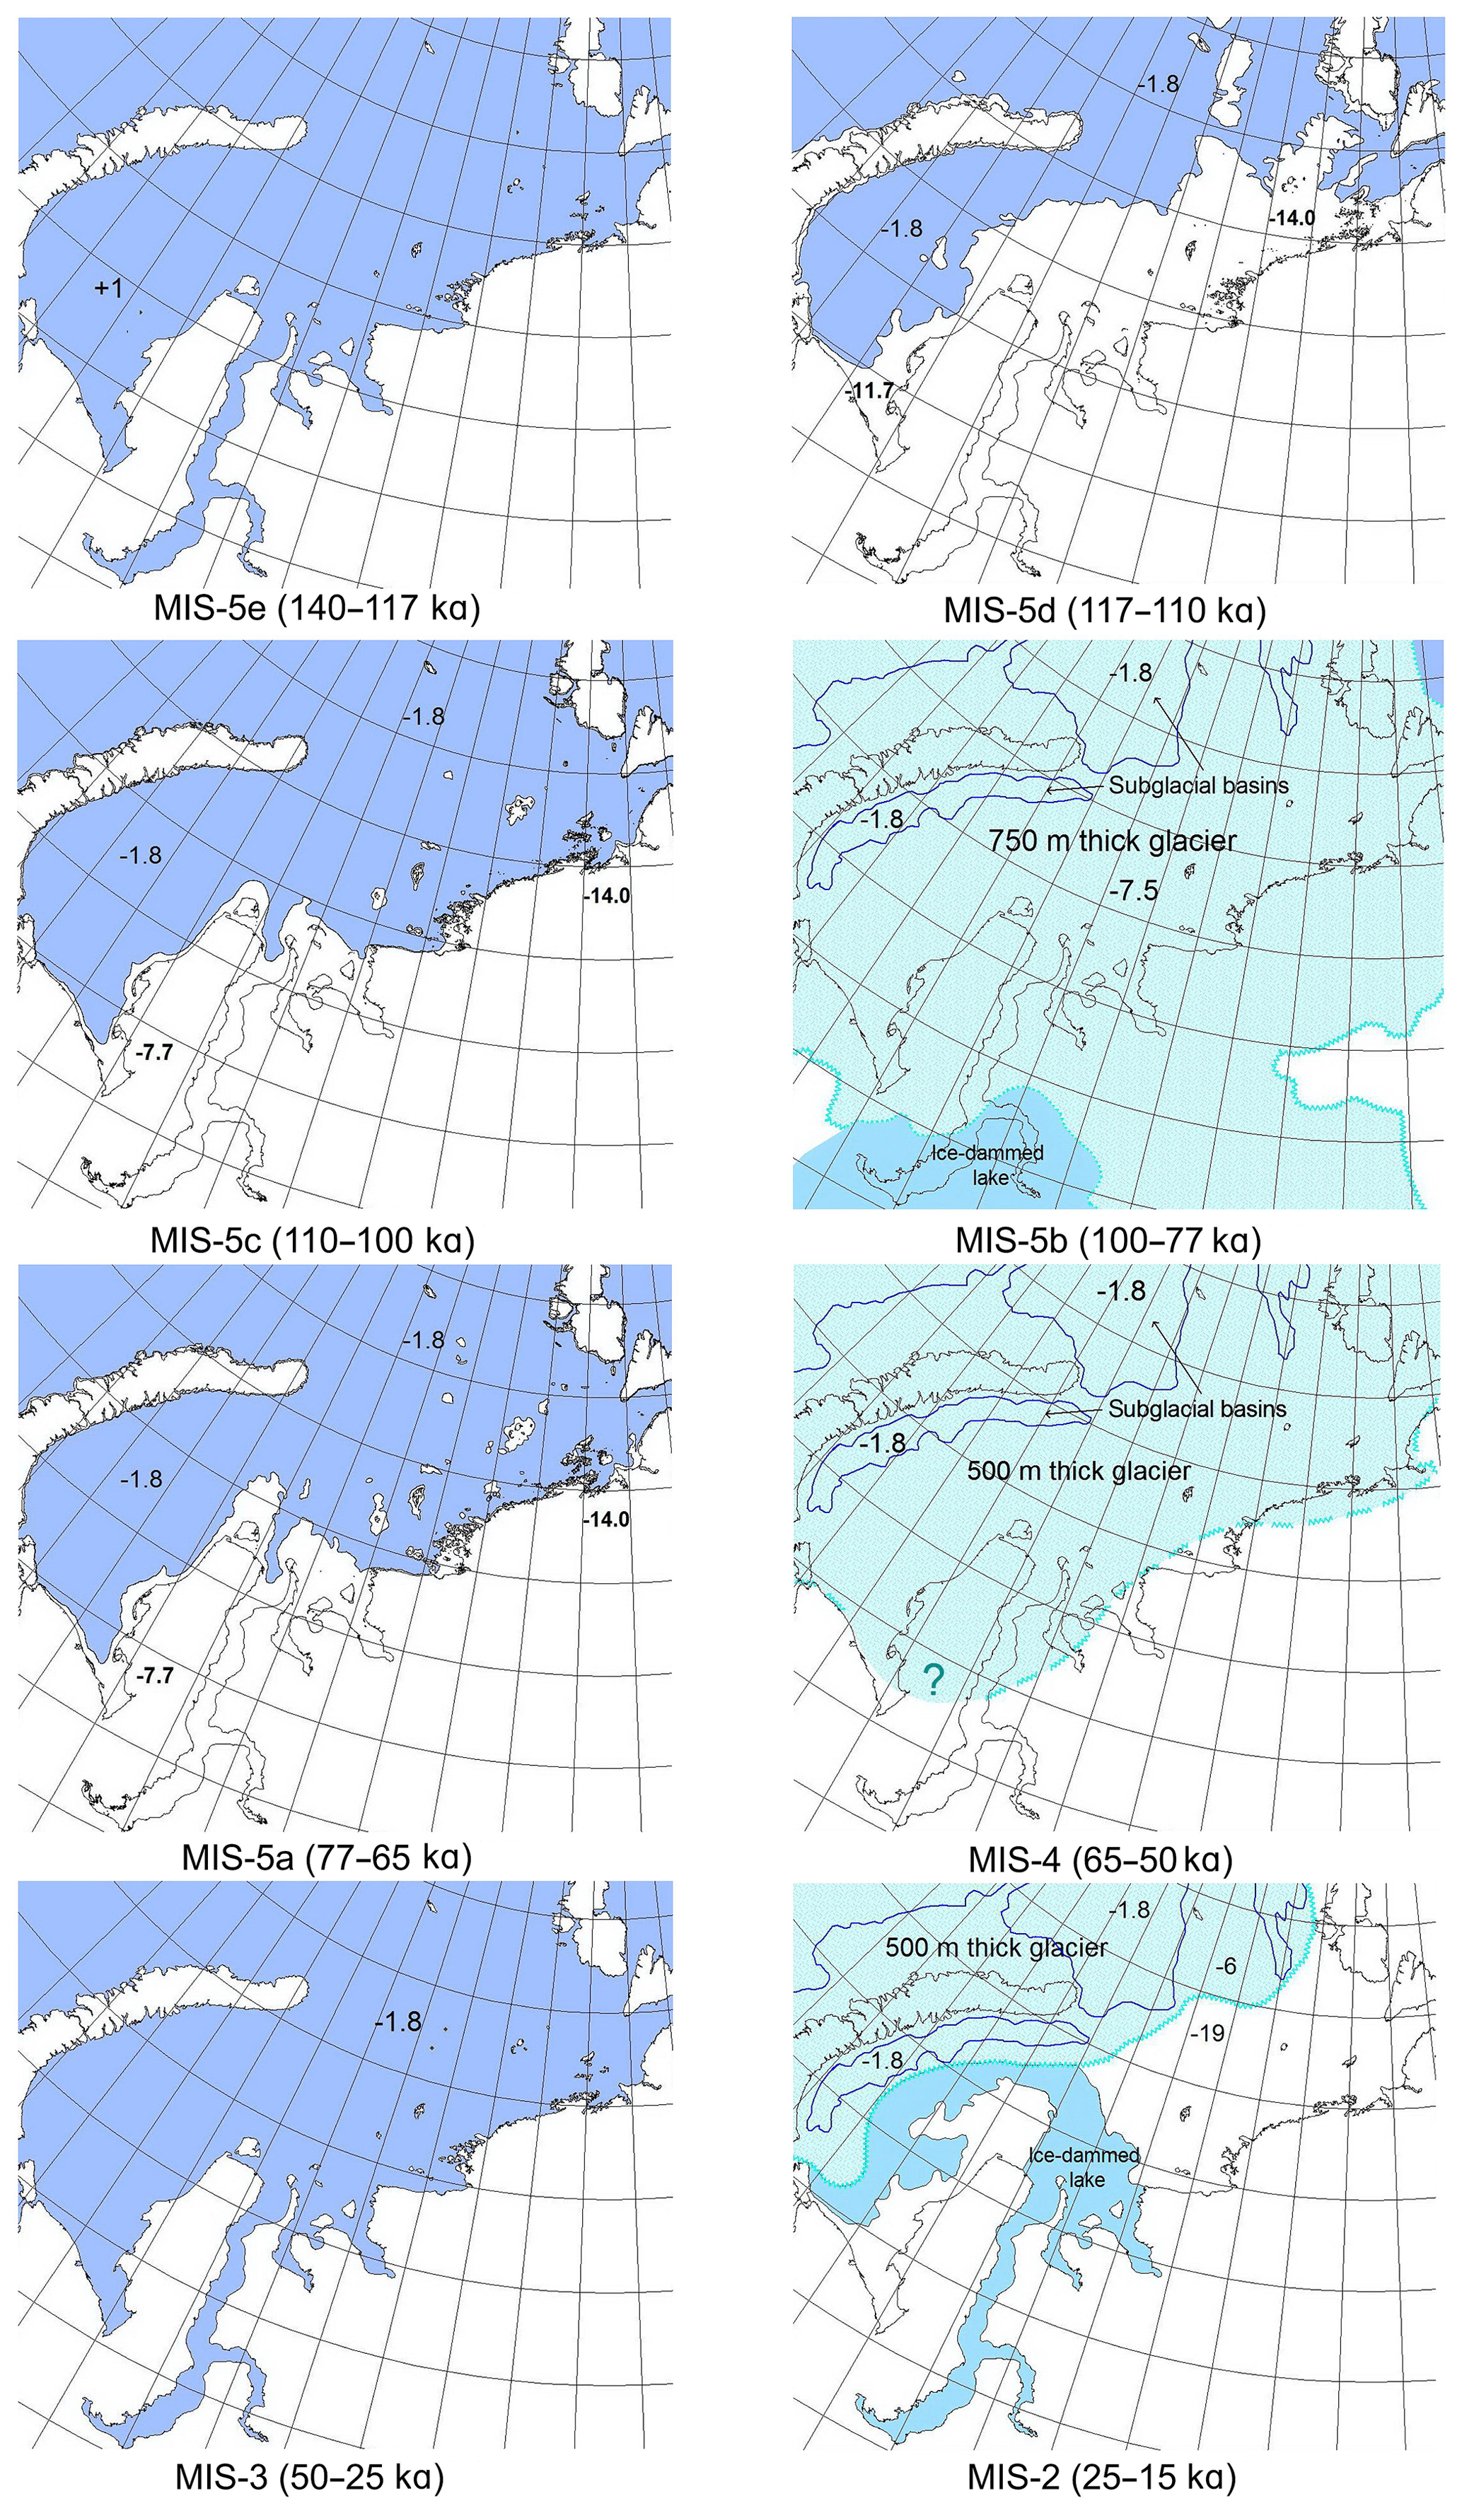
Figure 7The series of cartographic schemes illustrating the change in surface conditions on the Kara Sea shelf for the following moments: MIS-5e (140–117 ka); MIS-5d (117–110 ka); MIS-5c (110–100 ka); MIS-5b (100–77 ka); 5a (77–65 ka); MIS-4 (65–50 ka); MIS-3 (50–25 ka); MIS-2 (25–15 ka).
Altogether 30 temperature curves have been obtained. The calculations were conducted for four lithological types and two heat fluxes based on each curve. An important role in the formation of the current permafrost is the last (Holocene) transgression of the sea. Therefore, it was set such that each shelf part stayed for 400–2000 years in the coastal zone where bottom sediments were flooded with saline and warm near-bottom water. It is known that at sea depths from 2 to 7 m in the 1970s (Zhigarev, 1981) and up to 10 m in the 2000s (Dmitrenko et al., 2011) the mean annual temperature of bottom waters in the Laptev Sea stayed positive and bottom sediments thawed from above. For the Kara Sea, there are no such data on isobath intervals, but it is known that temperatures are generally lower. Therefore, we assumed that the interval of isobaths with such water temperatures is limited to 5–6 m. Episodes with positive mean annual bottom water temperatures occurred on the shelf during the postglacial transgression even in its initial periods, since the July temperature reconstructed for pre-Holocene warming (Allered) exceeds 2 ∘C the temperature of the 1980s by 2 ∘C (Velichko et al., 2000). Therefore, we constructed scenarios for these episodes. To determine their duration, dated data on the absolute altitudes of the sea level during the transgression of the Laptev Sea were used (Bauch et al., 2001) although the transgression rate was not the same. The shortest episodes (400 and 375 years) of positive temperatures are determined for the periods 15–11 and 10–9 ka, respectively. The longest intervals were 11–10, 9–5 and 5–0 ka with 1000, 750 and >5000 years according to simple calculations. Special mathematical modeling for desalinated coastal zones was not performed due to the relatively small area of their distribution and the specific nature of salinity distribution over the water column. Desalination of waters was taken into account directly when constructing the geocryological map.
The scenarios record alternating cold and warm events, accompanied by regressions and transgressions, respectively (Figs. 5, 6, 7), which created conditions for permafrost growth and degradation. At glaciation peaks, the present sea bottom in the periglacial shelf part was above the shores which subsided under the ice load. This led to the formation of marine terraces; i.e., the sea level fall during cold events (MIS-5b and MIS-4) was smaller than the global average.
The available data, though far from complete, show that the sea level between 50 and 25 ka (almost all of MIS-3) was the same as at present (Fig. 8). In our opinion this is also due to post-Zyryanian uplift (isostatic rebound). On the other hand, the current state of permafrost has been controlled by the ground temperature in the periglacial shelf part and by the presence of an ice-dammed freshwater basin in MIS-2 (Fig. 6). In the Holocene, the effect of >0 ∘C bottom water in the nearshore zone during warm climate events was critical for permafrost degradation from above (Figs. 5, 6). The MIS-2 ground temperature in the glacial shelf part was warmer (Fig. 6, curve 2) due to thermal insulation by ice.
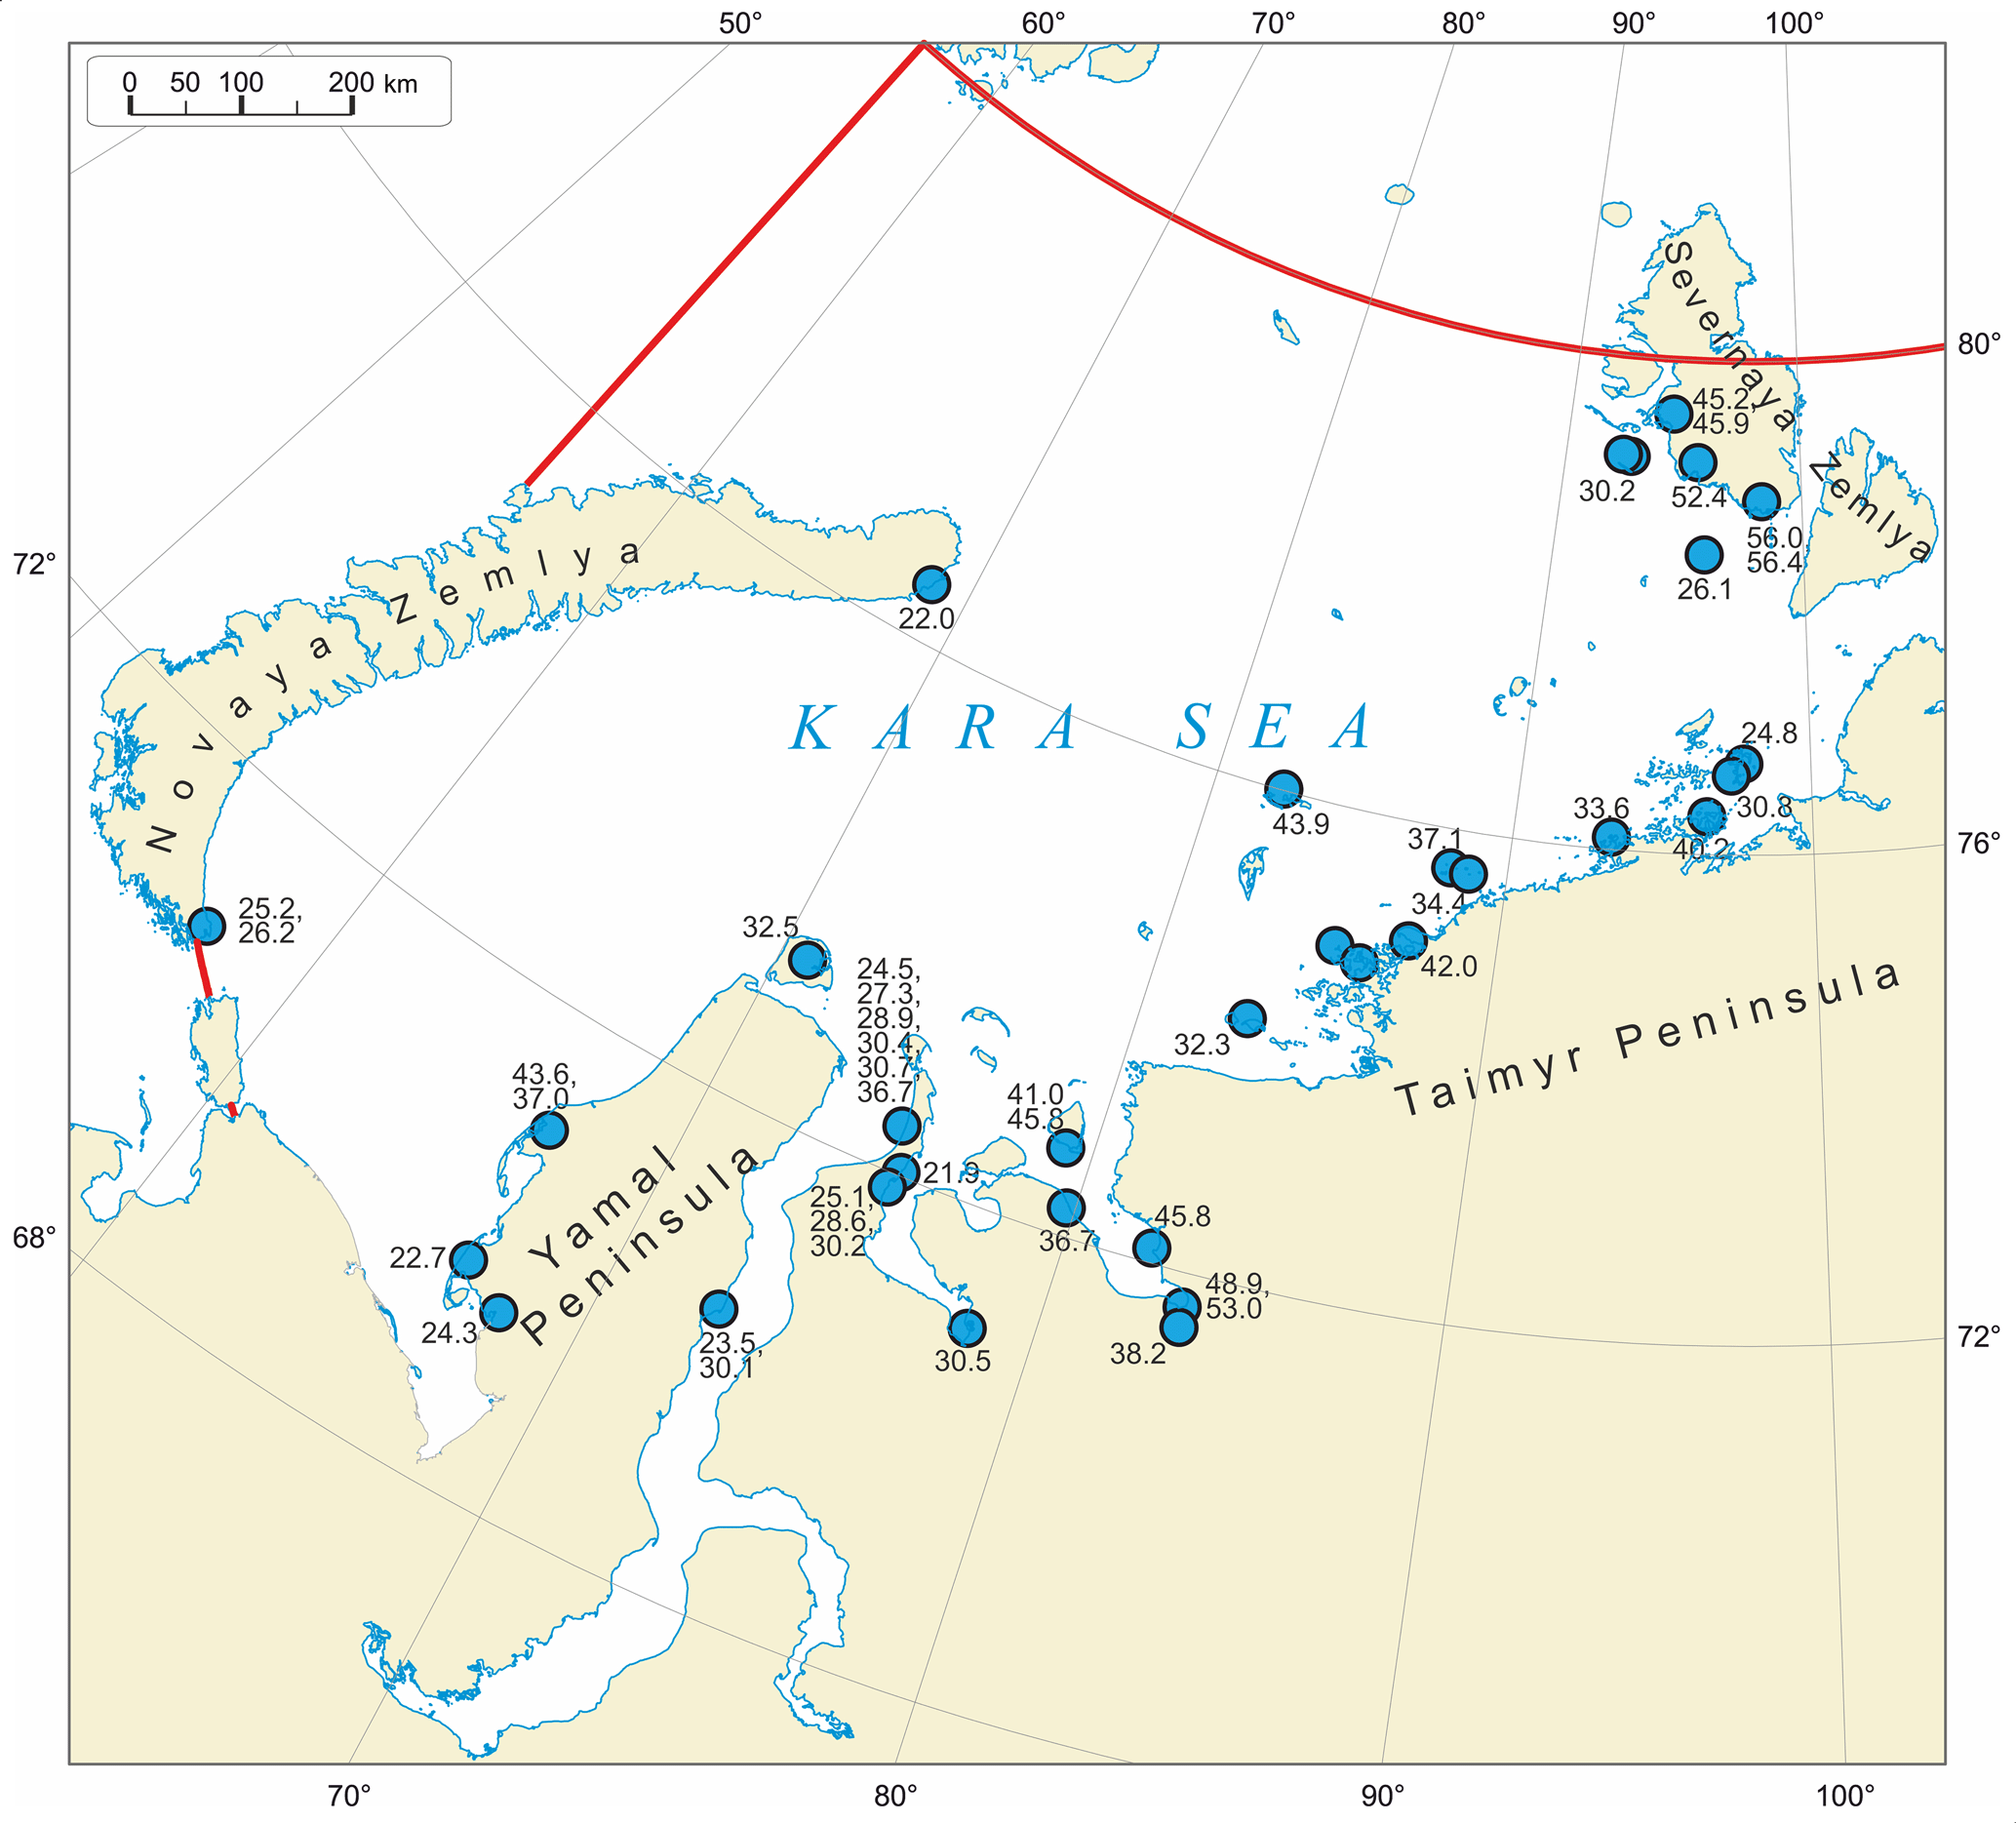
Figure 8Location of onshore and offshore sections (points) with marine sediments (14C – data, thousand years ago) of MIS-3 on the Kara Sea shelf, after Gusev et al. (2011, 2012a, b, 2013, 2016a, b), Baranskaya et al. (2018), Vasil`chuk et al. (1984), Molodkov et al. (1987) and Bolshiyanov et al. (2009). The red line is the region boundary of this study.
The simulation results show that the distribution of deposits that differ in their state (thawed, cooled or frozen) is associated with the paleogeographic events of the Late Pleistocene–Holocene. In the distribution of permafrost, a particularly close relationship occurs with glaciation in the MIS-2, the postglacial epoch and the Holocene optimum.

Figure 9Fragment of the geocryological map of the Kara Sea and its legend.
4.1 Distribution of frozen, cooled and thawed deposits
In the following the permafrost table (frozen permafrost) corresponds to the −1.8 ∘C isotherm. Further, we associate the term “permafrost” with frozen permafrost and the term “cooled deposits” (marine cryopeg) with the cryotic unfrozen deposits throughout the remainder of this section. Permafrost occurs within the areas that were free from MIS-2 ice sheets (SW, NE, C in Figs. 3, 9). The present areas of cooled ground were covered with ice that reached the sea bottom during MIS-2 (Fig. 3). Thawed deposits occupy the areas which were open to the inflow of >0 ∘C Atlantic waters (Levitan et al., 2009) in early postgalacial times (16–15 ka): i.e., a part of the G-2 zone (Fig. 3) and a large part of estuaries (E in Fig. 3).
Frozen ground is restricted to the periglacial domain. The boundary between the periglacial and glacial domains and, correspondingly, between the frozen, cooled and thawed deposits is delineated by the limits of MIS-2 ice that reached the sea bottom and remained in contact with it from 10 to 7 ka (Fig. 3) and by the 120 m isobath in the northeastern shelf part, within Severnaya Zemlya and the Chelyuskin Peninsula (Figs. 3, 9).
Table 2Modeling results for depths to permafrost top and base and permafrost thickness for a uniform lithology, SW area.
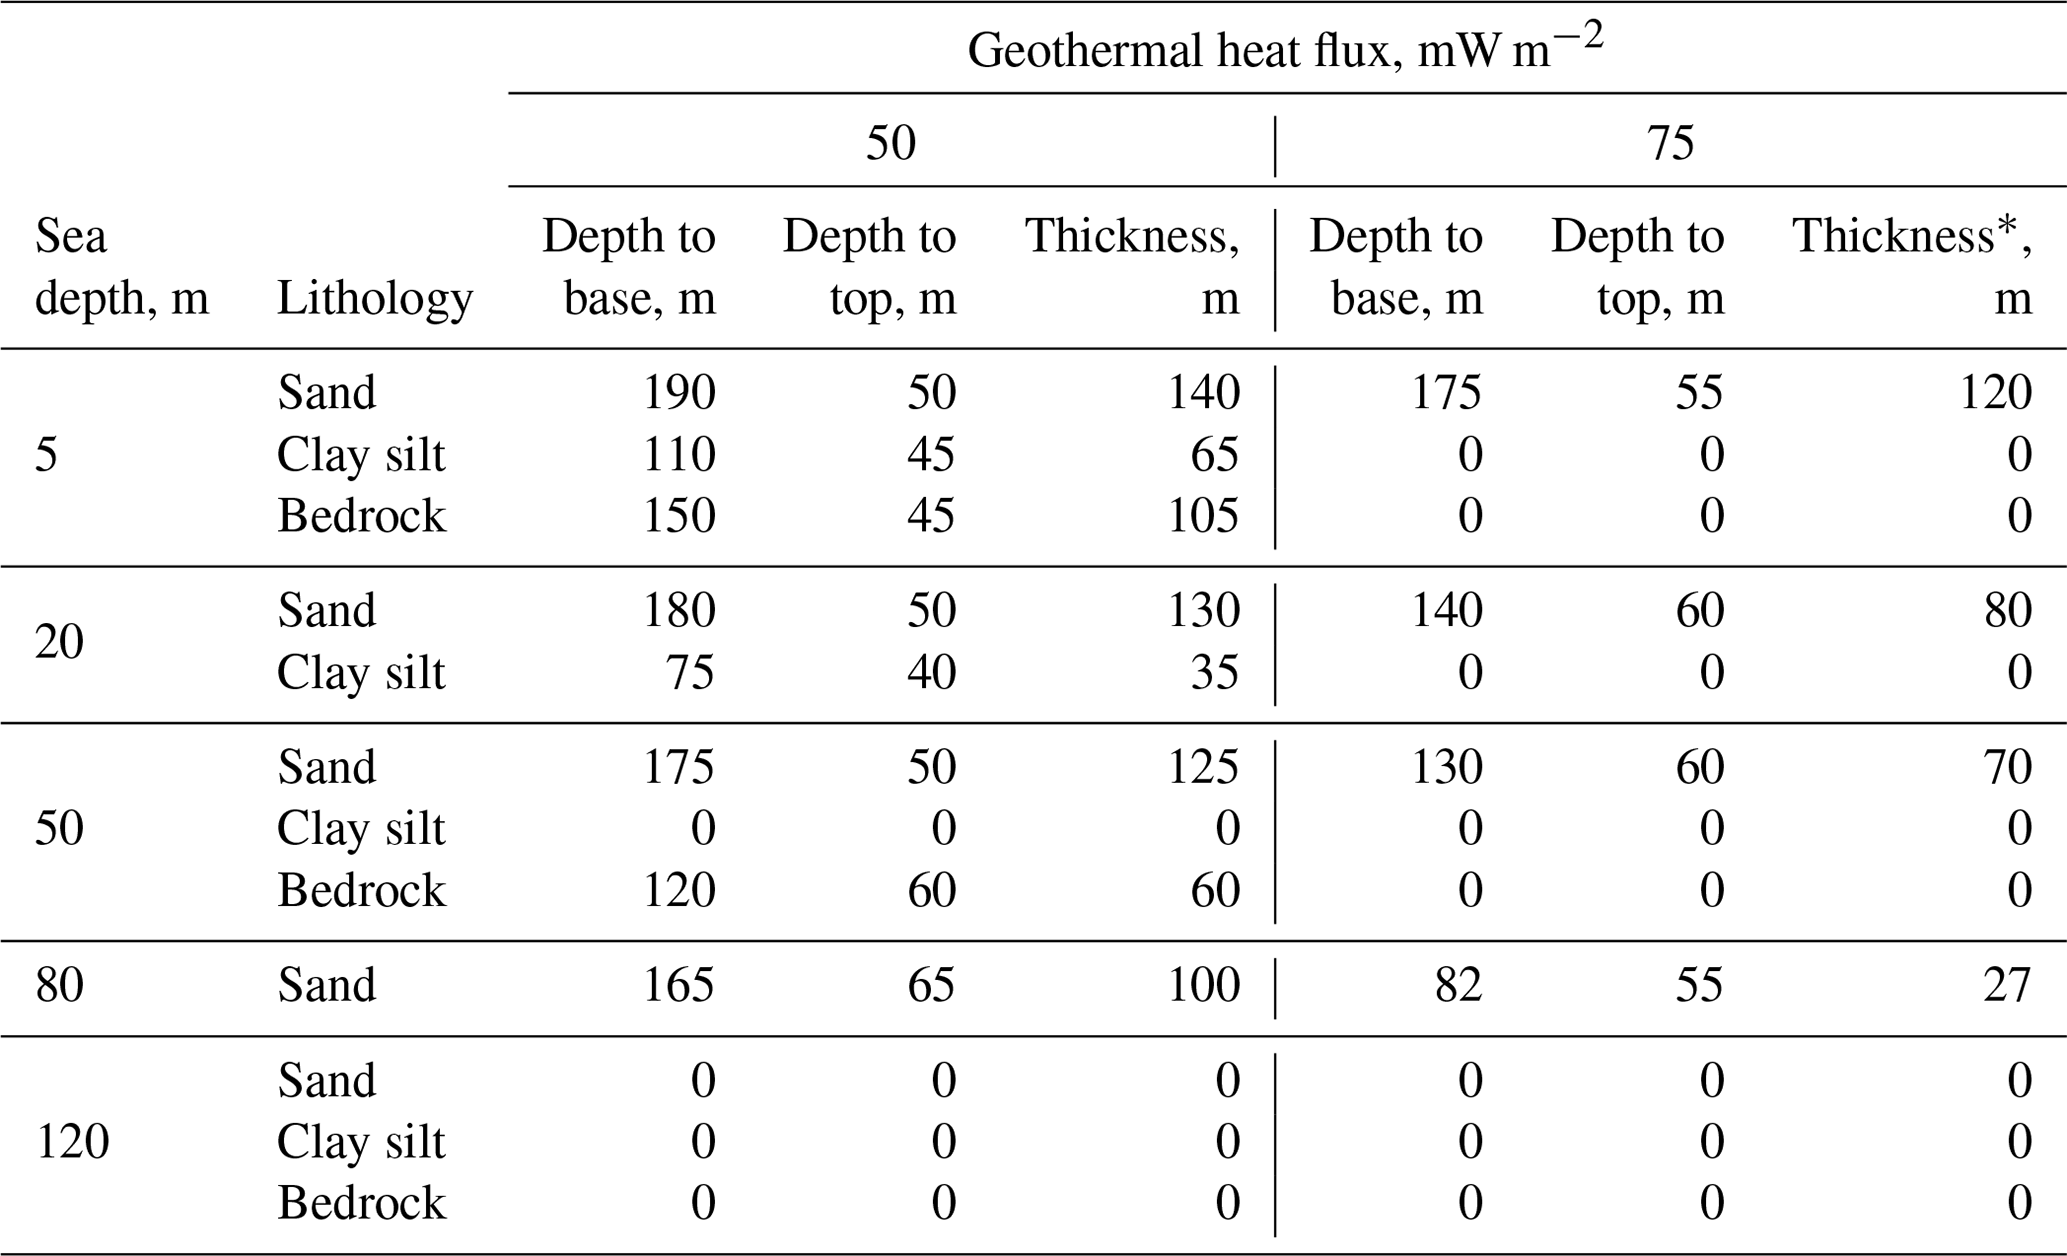
∗ The quoted permafrost thicknesses in all tables here and below are current residual values.
Table 3Modeling results for depths to permafrost top and base and permafrost thickness for alternating sand and clayey silt (clay) layers, SW area.

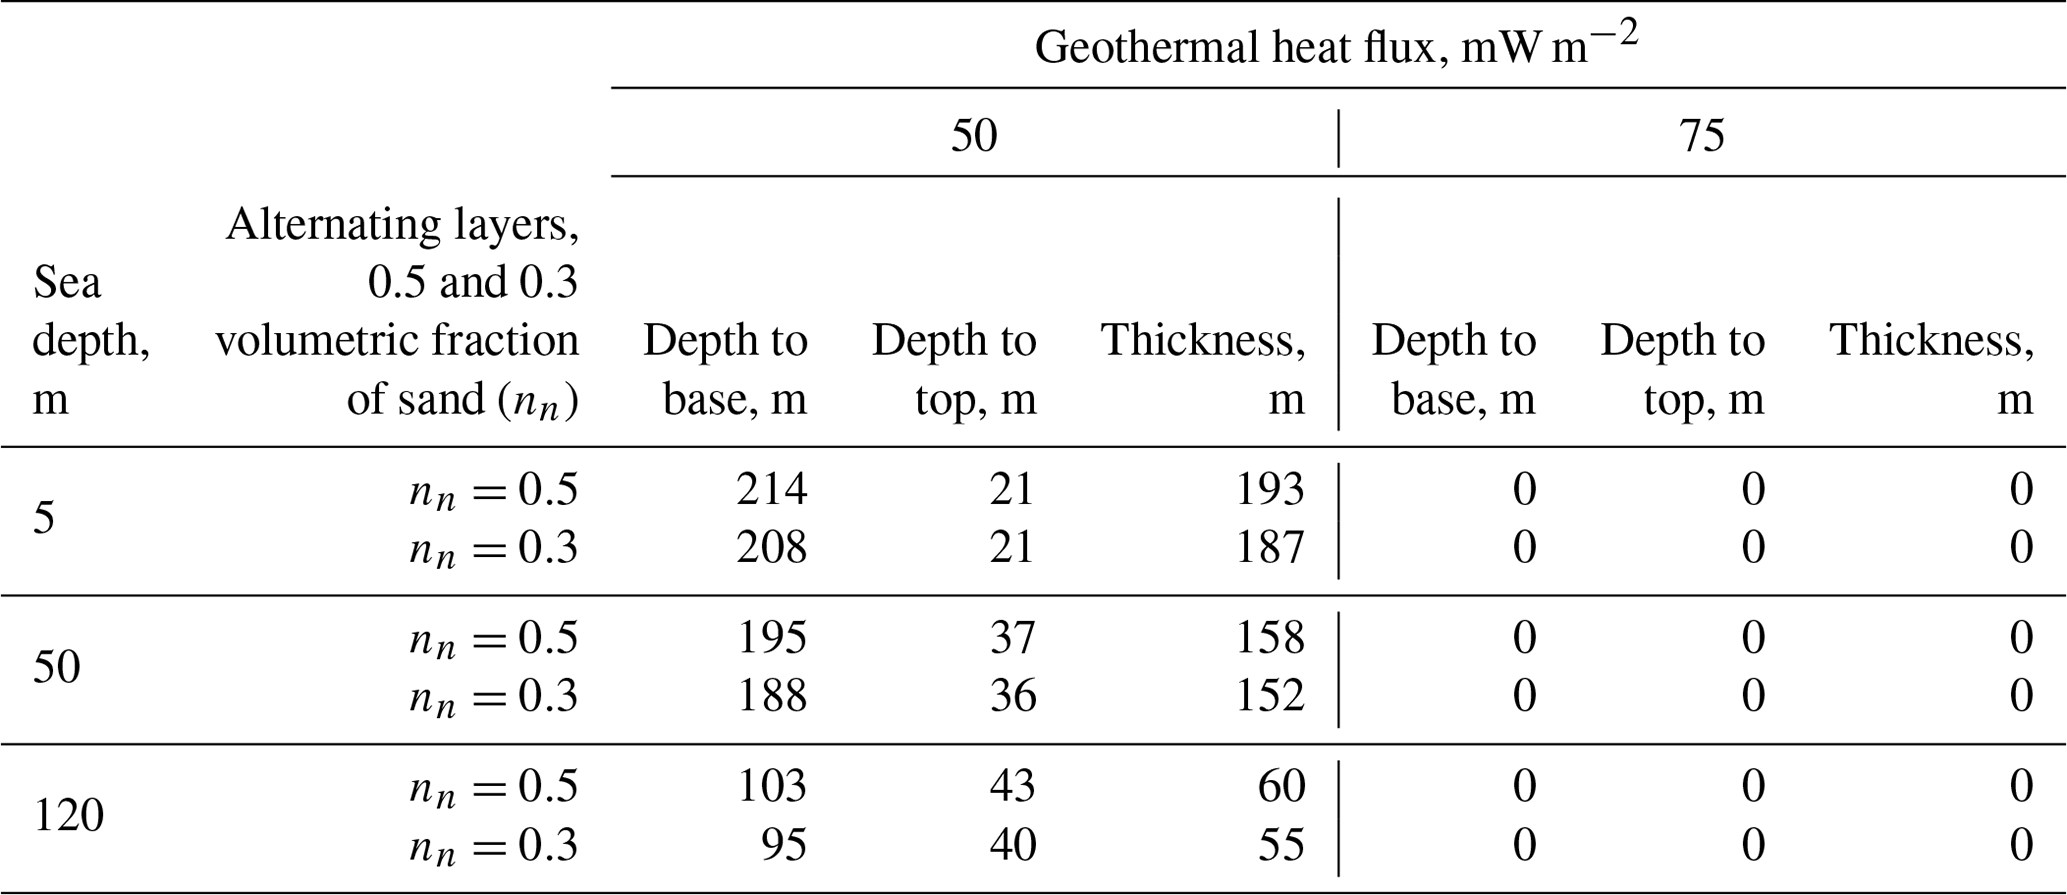
Table 4Modeling results for depths to permafrost top and base and permafrost thickness for 50 m of alternating sand and clayey silt (clay) layers lying over bedrock, SW area.

4.2 Distribution of permafrost, its thickness and depth to the permafrost table
Permafrost becomes more extensive, shallower and thicker from southwest to northeast and from deep offshore toward nearshore shallow waters. This pattern has several controls (Fig. S1 in the Supplement):
-
latitudinal climatic zonation and division into sectors,
-
sea depths that is related to the duration of shelf drying and flooding (permafrost formation and degradation, respectively),
-
ice-dammed freshwater basin in MIS-2,
-
geothermal heat flux,
-
lithology and properties of deposits,
-
seawater and seasonal ice cover (through salinity and freezing–thawing temperatures of deposits),
-
thermal effect of river waters,
-
Holocene climate optimum.
The southwestern part of the Kara Sea experienced an impact of warm-water inputs (Pogodina, 2009) in the middle Holocene (the Holocene optimum), judging by the distribution of thermophile foraminifera communities with predominant Arctic–Boreal species found currently in the Pechora Sea. Therefore, the >0 ∘C bottom water temperatures common to the present-day Pechora Sea may have existed from 7 to 5 ka on the southwestern Kara shelf and provided thawing of permafrost from above.
The distribution of permafrost also depends on deep heat flux, which may reach 50–60 mW m−2 over the greatest part of the Kara shelf (Khutorskoi et al., 2013). Temperature logs from deep boreholes in the shelf and coastal gas reservoirs of the Yamal Peninsula give heat flux values of 73–76 mW m−2. Other controls include lithology, water contents, physical properties and salinity (freezing–thawing temperatures) of deposits.
Tables 2 and 3 list the most common depths to the permafrost table determined in previous studies and according to our own calculations. They may vary significantly, even within marine geosystems of the same type: according to drilling results, they are 56 m in the nearshore zone at Cape Kharasavei and as shallow as 5 m in the Sharapov Shar Gulf 50–60 km to the south. The prospective values are 30–40 m below the sea bottom under the Yamal Peninsula shores and close to the water table under the retreating coast (Baulin et al., 2005). The permafrost thickness was estimated as the difference between the depths to permafrost table and base.
Table 5Modeling results for depths to permafrost top and base and permafrost thickness for uniform lithology, NE area.
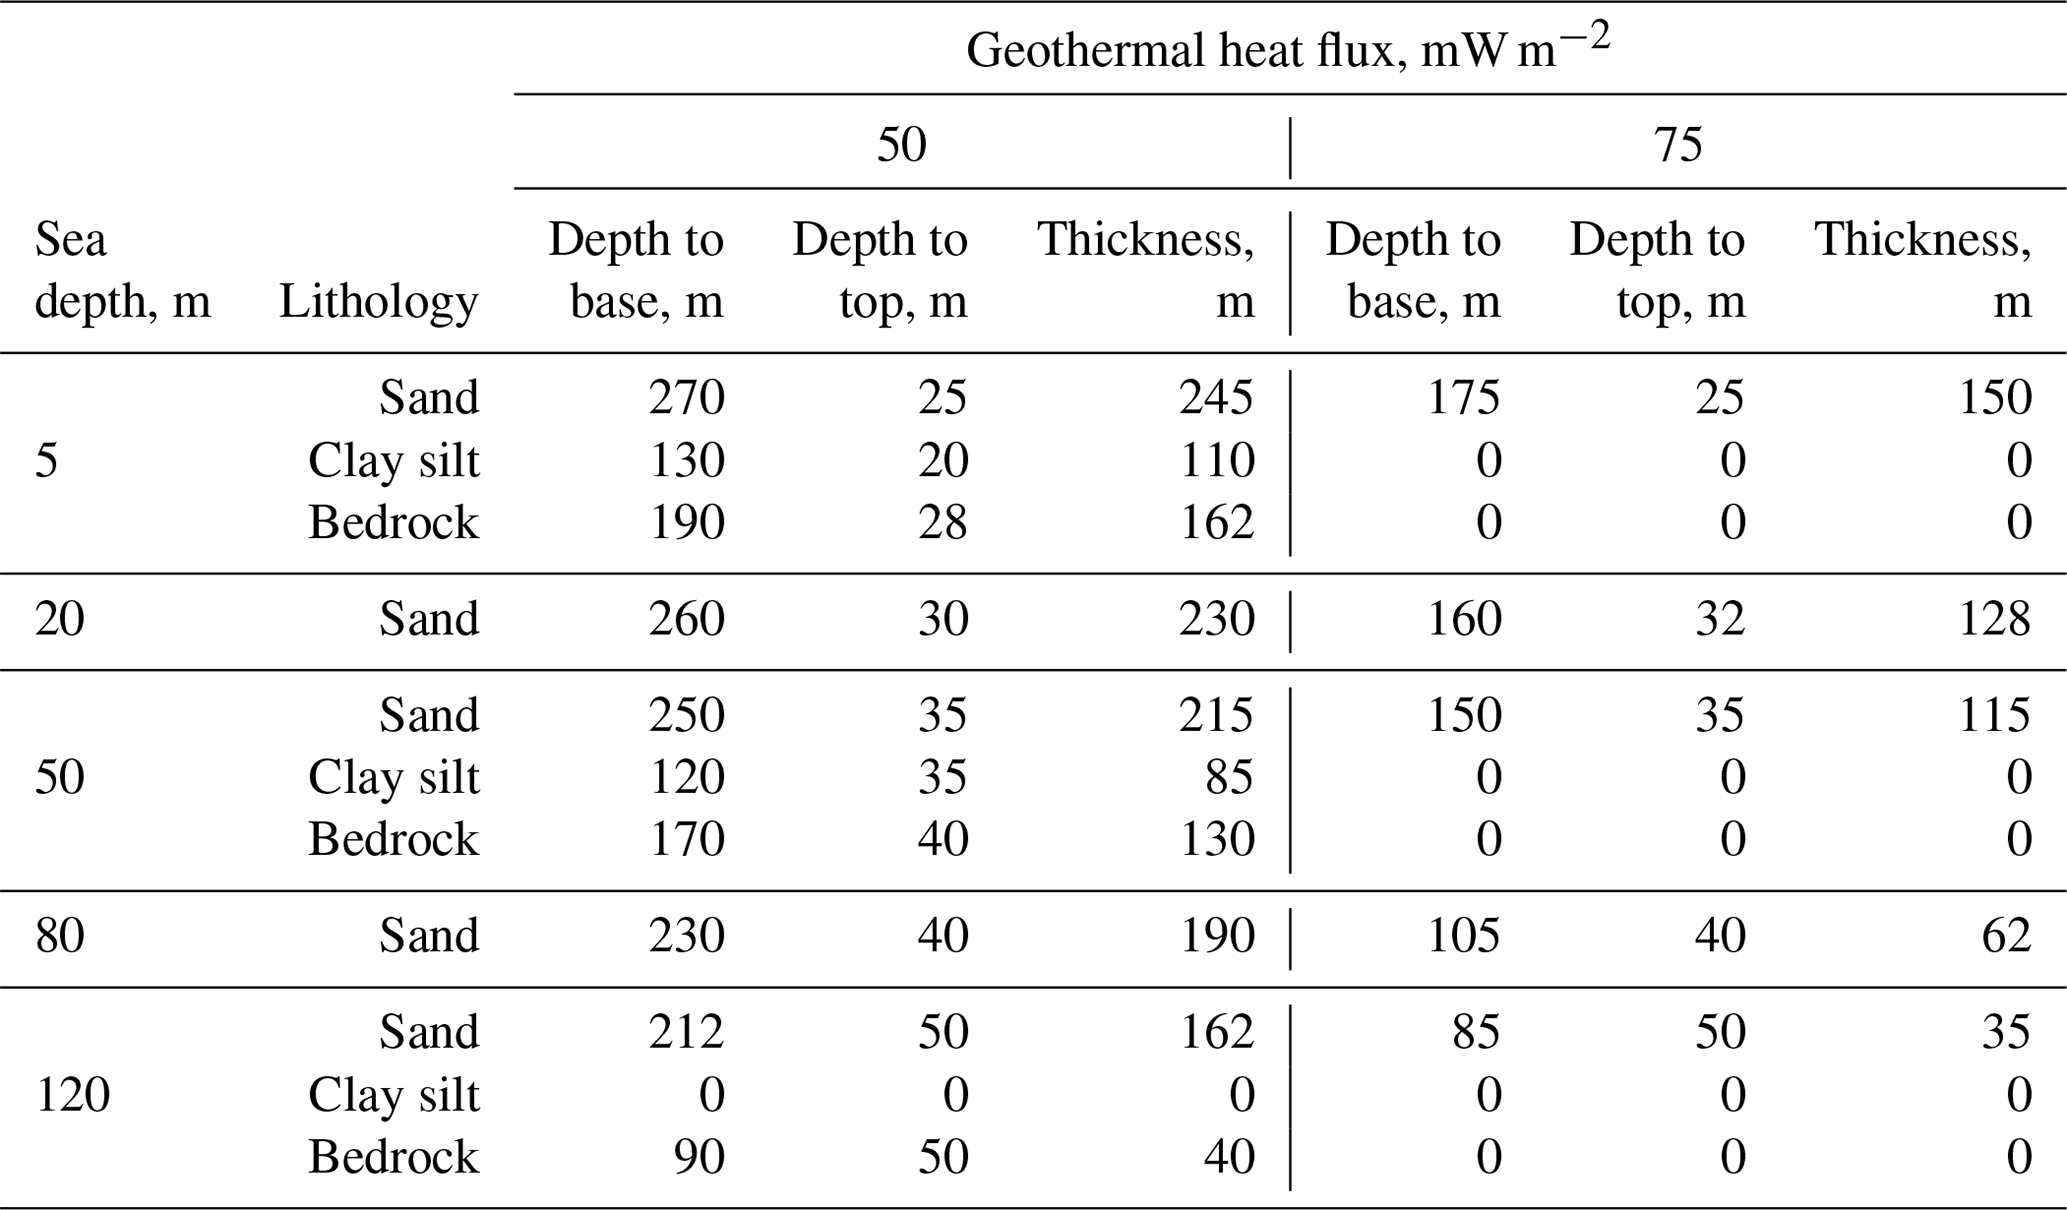
Table 6Modeling results for depths to permafrost top and base and permafrost thickness for alternating sand and clayey silt (clay) layers, NE area.
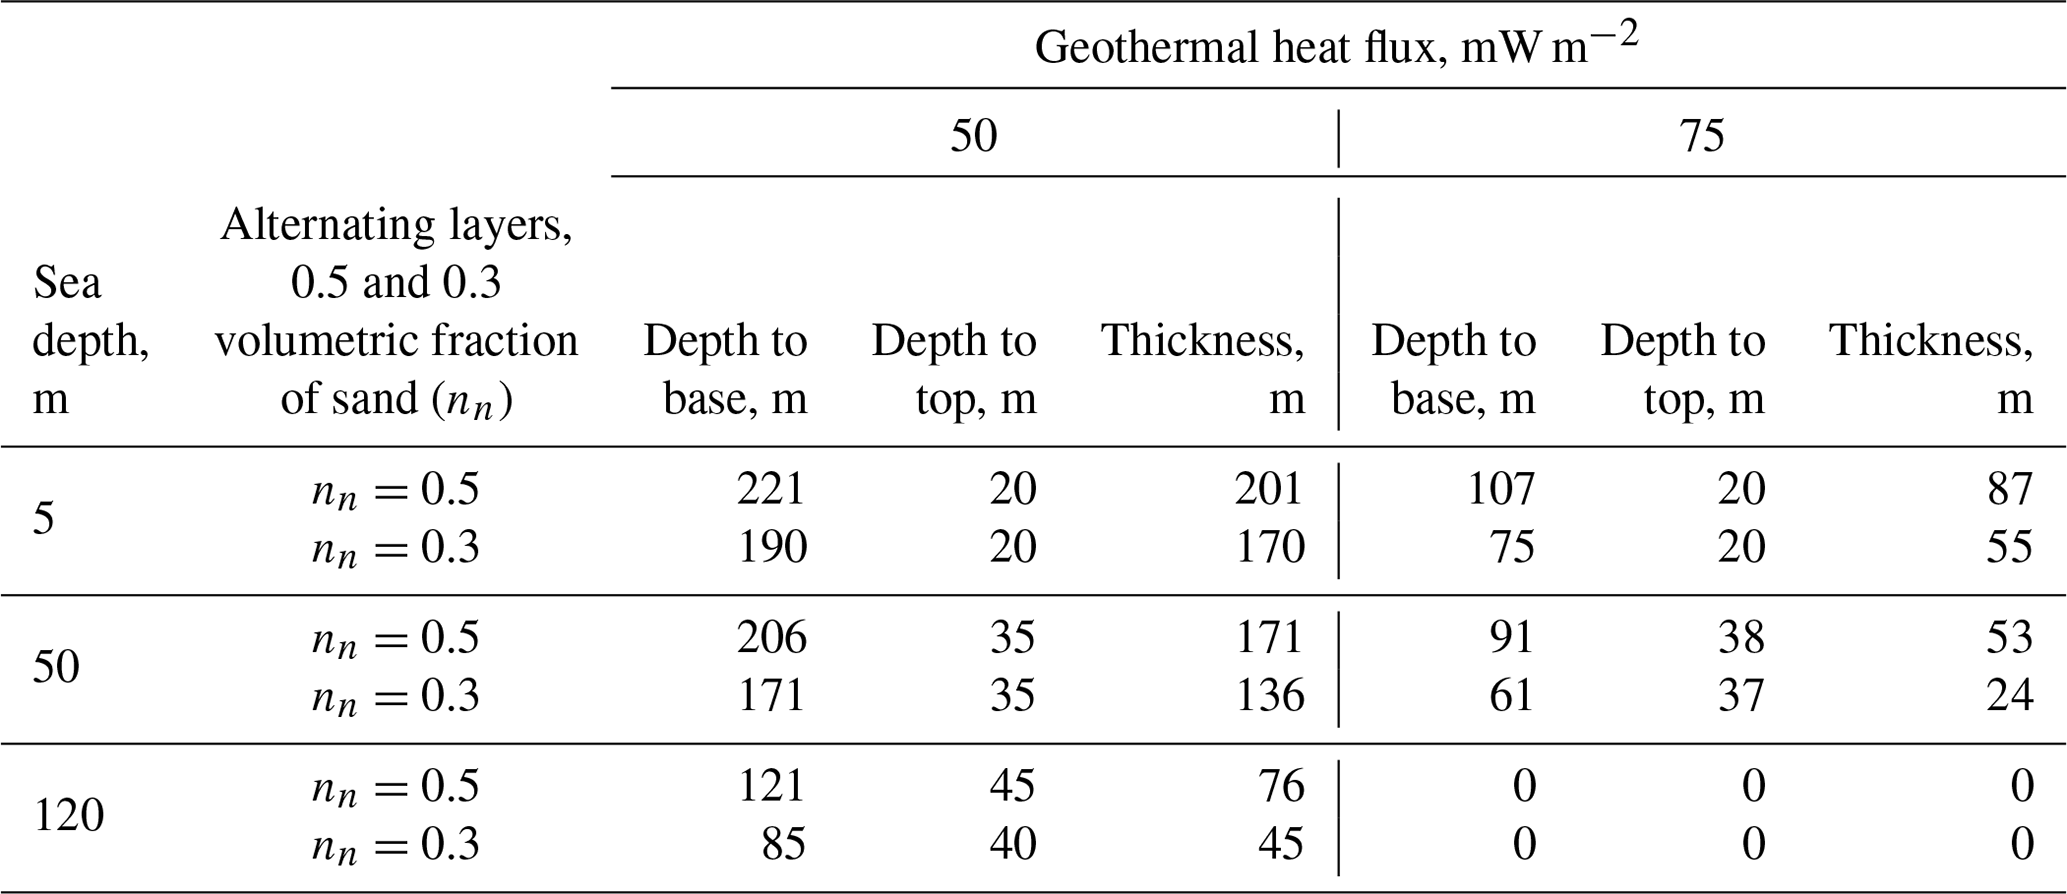
Table 7Modeling results for depths to permafrost top and base and permafrost thickness for 50 m of alternating sand and clayey silt (clay) layers lying over bedrock, NE area.
4.2.1 Southwestern periglacial shelf
The southwestern part of the Kara shelf (SW in Fig. 3) is occupied by discontinuous and sporadic permafrost (Fig. 9), as inferred from modeling with reference to field data (Dlugach and Antonenko, 1996; Melnikov and Spesivtsev, 1995; Baulin, 2001; Bondarev et al., 2001; Rokos et al., 2001, 2009; Rokos and Tarasov, 2007; Baulin et al., 2005; Neizvestnov et al., 2005; Kulikov and Rokos, 2017). According to the modeling results, permafrost can exist in sand at a heat flux of 50 mW m−2 but is absent in all other lithologies at 75 mW m−2 (Table 2).
The quantitative modeling results show (Table 2) that the permafrost state depends on lithology if it is uniform. However, the real shelf sections (e.g., in boreholes of the Leningradskaya and Rusanovskaya fields) consist of different alternating lithologies. Therefore, data listed in Table 2 are applicable uniquely as a check for the role of lithology and properties in the formation, distribution and thickness of permafrost, which were estimated for layered sections.
Along the west coast of the Yamal Peninsula (area of the Kharasavei Sea field) – where the modern frozen deposits form the upper part of the section, with relict ones underneath – permafrost and condensate deposit forms three elongate zones: ∼0.5 km wide zone of continuous permafrost near the shore (0–2 m sea depth); discontinuous permafrost, 1–3 km wide, sea depths to 5–7 m (Baulin, 2001; Baulin et al., 2005); and sporadic permafrost, which may spread to sea depths of 80 m (our estimate), or 100 m (Kulikov and Rokos, 2017) to 105 m (Vasiliev et al., 2018).
The depths to the permafrost table are variable, especially near the shore, as a result of coastal advance and retreat. Permafrost currently exists in zones of coast aggradation, while beneath retreating coasts permafrost is the shallowest at the shoreline and becomes deeper seaward. Specifically, permafrost was observed at a depth of 0.5 m below the sea bottom at the geocryological site Marre-Sale (borehole 16–14, drilled for temperature monitoring 0.5 km from a retreating coast; Dubrovin et al., 2015), but is deeper (3.5 m) in another monitoring borehole (15–14), located 0.9 km from the shore, where a 0 ∘C mean annual ground temperature was recorded at 3 m subbottom depth. On the other hand, the permafrost table beneath a stable coast may be as deep as 30–50 m (Baulin et al., 2005). Similar depth variations occurred also during the Holocene transgression; i.e., sharp differences in the depth of the top at short distances are a typical feature of local permafrost. However, generally the depths to permafrost increase offshore and depend on its composition and ice content, as well as on the time when it submerged.
Within the sea depths from 2 to 5–7 m, the depth to permafrost varies from 5 to 30–40 m. Similar values were inferred by modeling for the most realistic sections of interbedded sand and clay (40 m at a heat flux of 50 mW m−2). The calculated most probable permafrost thickness for these lithologies is 75–90 m at 50 mW m−2. It agrees with values of 60–80 m reported by Badu (2014) as well as with the estimates 90 and 70 m by Vasiliev et al. (2018) for sea depths of about 10 and 35 m, respectively. Permafrost in terrace I of the Yamal Peninsula, which formed from MIS-2 through the Holocene and was not exposed to prolonged subsea degradation, is as thick as 185 m (Trofimov et al., 1975; Yershov, 1989).
According to our calculations, on isobaths exceeding 7–10 m, the subsea permafrost table is as deep as 50–80 m (Table 3), which agrees with estimates based on field data (Melnikov and Spesivtsev, 1995). It is most likely beyond the reach of engineering geological drilling (Baulin et al., 2005).
Permafrost is discontinuous to sporadic closer to the shore and sporadic at greater sea depths, with the boundary at the 10 m isobath. The depths to the permafrost table are 0–30 in the first two zones and 20–50 m in the offshore zone. The permafrost thickness ranges from 0 to 100 m (Fig. 9).
A similar distribution and parameters of permafrost are common to other parts of the southwestern periglacial shelf, but they vary slightly as a function of zonal features. Farther in the north, the boundary between discontinuous and sporadic permafrost follows the 20 m isobath. The depths to the permafrost table are 30 to 70 m at sea depths from 0 to 20 m according to field data and 40 to 70 m according to our calculations; the calculated permafrost thickness is mainly <100 m (the estimates in Table 2 are for reference sections, and those in Tables 3–4 are extrapolated data). In complex sections within 20–80 m sea depths, permafrost lies at a depth of 50–55 m and is 70–90 m thick (Tables 3–4).
The permafrost changes from discontinuous to sporadic below the 5 m sea depth south of the Kharasavei gas field and is only sporadic still farther to the south (end of the Baydaratskaya Bay).
4.2.2 Northeastern periglacial shelf
There exist no drilling data for this shelf part (NE in Figs. 3, 8). According to logs from a test well on Sverdrup Island, the heat flux varies from 25 to 60 mW m−2 as a function of lithology and thermal properties of rocks and sediments at different core depths (Khutorskoi et al., 2013). Modeling results for a heat flux of 50 mW m−2 predict that permafrost is continuous at sea depths within 0–80 m and discontinuous to sporadic from 80 to 120 m (Tables 5–7). The possibility of the existence of cooled ground with the predominance of permafrost in this interval is mainly associated with clay sediments along with different heat flux values (Tables 5–7).
The depth to the top of continuous permafrost ranges from 20–25 m near the shore to 35–40 m at sea depths 50–80 m (Table 6). The permafrost thickness varies mainly from 150 to 200 m in sand–clay sediments depending on lithology and sea depth. Correspondingly, the map of Fig. 9 shows typical depths to permafrost in a range of 0 to 30 m and permafrost thicknesses from 100 to 300 m. Discontinuous permafrost lies at a depth of 40–45 m and is 0 to 100 m thick.
4.2.3 Central area
The central area covers the offshore extension of the Ob, Yenisei and Gyda rivers (C in Figs. 3, 9) in the middle between the southwestern and northeastern shelf part. The area was interpreted (Kulikov and Rokos, 2017) as an unfrozen zone (a talik) corresponding to paleo-estuaries and paleodeltas of the West Siberian rivers. In our view, however, it was rather a lake-like freshwater basin that formed when ice dammed the continuing flow of the large Siberian rivers (Ob, Yenisei, Taz etc.) during the MIS-2 glacial event. The ice dam caused flooding of the respective shelf part in different periods of glacier edge oscillations; the surface area and elevations of the lake table (C in Fig. 3) changed accordingly with the ice sheet contours. Therefore, our map delineates the lake by the isobaths from 0 to 80 m.
The central area is shown on the map as occupied by sporadic permafrost: the sea bottom which rises within its limits may be frozen (like the cases of the Yamal underwater coastal slope at the mouth of the Ob Gulf as well as the Gulf itself). In fact, permafrost patches beneath the Sartan dam lake are scarce as the deposits had stored large heat resources while staying under the ice sheet for thousands of years. The sediments currently occurring within the lake limits were much warmer than the surrounding ground during MIS-2: +4 ∘C against −19 to −23 ∘C, respectively. The patches of permafrost lie at depths from 0 to 30 m, and the permafrost thickness is a few tens of meters.
4.2.4 Estuary (bays)
Permafrost in the quite-well-documented Ob estuary (E in Fig. 3) is restricted to a narrow strip along the shore; it is relict permafrost beneath the coast exposed to marine erosion. The total thickness of present and relict permafrost exceeds 20 m within the 1 m isobath, is no more than 10 m at sea depths between 0 and 2–3 m, and pinches out seaward in deeper water; the depth to subsea permafrost within 3 m water depths is 5 to 15 m or more (Baulin, 2001). Coastal permafrost is traceable as far as Cape Kamenny at 68∘ N (Kokin and Tsvetinsky, 2013). The patches of frozen ground are limited to a 100 m wide strip along the shore (less often 300 m).
Seismic reflection profiling reveals numerous gas reservoir zones (Rokos and Tarasov, 2007) and presumably a frozen deposits at a sea depth of 15 m at 71∘ N (Slichenkov et al., 2009). The estuaries (south of 71.5∘ N) are mapped as mainly thawed zones with nearshore permafrost at ≤3 m sea depths.
We agree with the previous inference (Melnikov et al., 1998; Badu, 2014) that permafrost within gas fields (Rusanovskaya and other gas-bearing geological structures) does not refer to relict frozen deposits. Their genesis and cryogenic age is the subject of debate.
The present state and 125 kyr history of permafrost on the Kara shelf has been modeled with reference to existing knowledge. Since 125 ka, the parameters of permafrost have been controlled by glacial and isostatic rebound events: frozen ground is present currently in places which were free from ice but is absent from those covered by ice during the MIS-2 glacial period.
Degradation of glaciation led to ice rebound and related transgression. As a result, permafrost thawed, partially after the MIS-5b cold event and completely after the MIS-4 event (during the Karginian interstadial, MIS-3).
As a result, the present shelf comprises frozen, cooled and thawed deposits. Permafrost occurs in the periglacial domain, cooled ground correspond to areas of MIS-2 glaciation and thawed deposits occupy the areas that were exposed to temperature conditions of >0 ∘C Atlantic waters (e.g., the western St. Anna trench) in early postglacial times (16–15 ka); thawed deposits are also found over the overwhelming part of river estuaries in northern West Siberia.
The periglacial shelf part is divided into zones of continuous, discontinuous-to-sporadic and sporadic permafrost. The geocryological conditions become harsher from the southwest to northeast and from large sea depths to nearshore shallow water.
The distribution and parameters of permafrost have had multiple controls:
-
latitudinal climatic zonation and division into sectors;
-
sea depths that are related to the duration of regressions and transgressions and therefore freezing and thawing of permafrost, respectively;
-
an ice-dammed freshwater lake that existed during the MIS-2 event;
-
geothermal heat flux;
-
lithology and properties of deposits;
-
seawater and seasonal ice cover that affect salinity (and hence freezing–thawing temperatures) of deposits;
-
thermal effect from river waters.
The periglacial shelf part is divided into the southwestern, northeastern, central and estuary areas. The southwestern area comprises two subareas: a zone of discontinuous-to-sporadic permafrost along the shore, within 20 m sea depths in the north and 5–7 m in the south, which grades seaward into a zone of only sporadic permafrost. In the former zone, the permafrost has its table at depths from 0 to 30 m and is a few tens of meters to 100 m thick; in the latter zones, the depth to permafrost is 20 to 50 m and the permafrost thickness is less than 50 m.
In the northeastern area, continuous permafrost occurs within sea depths from 0 to 80 m and has a thickness of 100–200 m; the depth to its top varies from 0 to 30 m. The 80–120 m sea depth interval is occupied by ≤100 m thick discontinuous-to-sporadic permafrost with its table at a depth of 20–50 m.
Permafrost in the central area is sporadic; it is around 50 m thick, and its top lies at depths between 0 to 30 m deep. Deposits in the estuaries are mostly unfrozen; relict permafrost is restricted to a 100–300 m strip along the shore.
The studies performed were based on drilling and seismic acoustic data published to date. The study of the shelf by drilling and geophysical methods continues all over the world including the Russian Arctic. Therefore, the results of our studies can be used in planning new drilling and in the geocryological interpretation of seismoacoustic profiling.
The data used in this study are available at the Zenodo repository: https://doi.org/10.5281/zenodo.3866046 (Gavrilov et al., 2020). The project was ran by the National Intellectual Resource Foundation (involving experts from Moscow State University) jointly with the Arctic Research Center of the Rosneft Oil Company.
The supplement related to this article is available online at: https://doi.org/10.5194/tc-14-1857-2020-supplement.
AG conceived the research and mapping methodology, the zoning, and the construction of paleotemperature scenarios and compiled the text of the article. VP, AF and MB collected regional data and enabled the maintenance of project. VK was involved in collecting data, general management and editing. EP conducted the filling of the database, mapping and editing text and made drawings. SB provided all aspects of numerical modeling. AA and NK were responsible for GIS work along with the construction of the spatial database and graphic materials. MO was involved in filling the database. AR collected and interpreted the seismic data. MC collected source data, provided the calculation part of modeling and led the text editing. EO made the typification of the natural environment.
The authors declare that they have no conflict of interest.
The project was run by the National Intellectual Resource Foundation (involving experts from Moscow State University) jointly with the Arctic Research Center of the Rosneft Oil Company.
This paper was edited by Christian Hauck and reviewed by two anonymous referees.
Astakhov, V. I. and Nazarov, D. V.: Late Pleistocene stratigraphy in northern West Siberia, Regionalnaya Geologiya i Metallogeniya, 43, 36–47, 2010 (in Russian).
Badu, Yu. B.: The influence of gasbearing structures on the thickness of cryogenic strata of Jamal Peninsula, Kriosfera Zemli, XVIII, 11–22, 2014 (in Russian).
Baranov, I. Ya.: Goecryological Map of the USSR, Scale 1:10 000 000, Explanatory Note, Moscow, Russia, 48, 1960 (in Russian).
Baranskaya, A. V., Romanenko, F. A., Arslanov, Kh. A., Maksimov, F. E., Starikova, A. A., and Pushina, Z. V.: Perennially frozen deposits of Bely island: stratigraphy, age, depositional environments, Earth's Cryosphere, XXII, 3–15, https://doi.org/10.21782/KZ1560-7496-2018-2(3-15), 2018.
Bauch, H. A., Muller-Lupp, T., Taldenkova, E., Spielhagen, R. F., Kassens, H., Grootes, P. M., Thiede, J., Heinmeir, J., and Petryasov, V. V.: Chronology of the Holocene transgression at the Northern Siberia margin, Global Planet. Change, 31, 125–139, https://doi.org/10.1016/S0921-8181(01)00116-3, 2001.
Baulin, V. V.: Engineering geological studies in the Arctic shelf: experience, results, and regulations, in: Development of the Russian Arctic Shelf, Proc. 5th Intern. Conf. RAO-01, St. Petersburg, 36–239, 2001 (in Russian).
Baulin, V. V., Ivanova, N. V., Rivkin, F. M., Chernyad'ev, V. P., and Shamanova, I. I.: Coastal cryolithozone of the Northwest Yamal: problems of development, Kriosfera Zemli, IX, 28–37, 2005 (in Russian).
Bolshiyanov, D. Y., Grigoriev, M. N., Schneider, V., Makarov, A. S., and Gusev, E. A.: Late Pleistocene sealevel change and formation of an ice complex on the Laptev Sea shore, in: Basic Problems of the Quaternary: Results and Main Prospects, Geos, Moscow, 45–49, 2007 (in Russian).
Bolshiyanov, D. Yu., Pogodina, I. A., Gusev, E. A., Sharin, V. V., Aleksev, V. V., Dymov, V. A., Anohin, V. A., Anikina, N. Yu., and Derevyanko, L. G.: Shorelines of the Franz Joseph Land, Novaya Zemlya, and Svalbard: New data, Problemy Arktiki i Antarktiki, 82, 68–77, 2009 (in Russian).
Bolshiyanov, D. Yu., Anokhin, V. M., and Gusev, E. A.: New data on the structure of the relief and the fourth vertical deposits of the Novaya Zemlya archipelago, Geological and geophysical characteristics of the lithosphere of the Arctic region, Proceedings of VNIIOkeangeologia, 210, 149–161, 2006 (in Russian).
Bondarev, V. N., Loktev, A. S., Dlugach, A. G., and Potapkin, Yu. V.: Methods for studies of subsea permafrost, in: Sedimentological Processes and Evolution of Marine Ecosystems in Marine Periglacial Conditions, Apatity, 1, 15–19, 2001 (in Russian).
Bylinskiy, E. N.: Effect of Glacial Isostasy on the Pleistocene Terrane Evolution, National Geophysical Committee of the Russian Academy of Sciences, Moscow, 212, 1996 (in Russian).
Chekhovsky, A. L.: Distribution of permafrost under the Kara Sea bottom. Transactions, PNIIIS, Moscow, 18, 100–110, 1972 (in Russian).
Chuvilin, E. M., Perlova, E. V., Baranov, Yu. B., Kondakov, V. V., Osokin, A. B., and Yakushev, V. S.: The structure and properties of cryolithozone sediments of the southern part of the Bovanenkovo gas condensate field, Geos, Moscow, 20, 2007 (in Russian).
Danilov, I. D. and Buldovich, S. N.: Dynamics of permafrost related to transgressions and regressions in the Arctic basin, in: Fundamentals of Geocryology, Moscow State University, Moscow, 4, 372–382, 2001 (in Russian).
Derevyagin, A. Yu., Chizhov, A. B., Brezgunov, V. S., Hubberten, Kh.-V., and Siegert, K.: Stable isotope composition of ice wedges in the Sabler Cape (Lake Taimyr), Kriosfera Zemli, III, 41–49, 1999 (in Russian).
Dlugach, A. G. and Antonenko, S. V.: Main Distribution and Structure Patterns of Permafrost in the Barents-Kara Shelf: Implications for Petroleum Exploration, AMIGE, Murmansk, 271, 1996 (in Russian).
Dmitrenko, I. A., Kirillov, S. A., Tremblay, L. B., Kassens, H., Anisimov, O. A., Lavrov, S. A., Razumov, S. O., and Grigoriev, M. N.: Recent changes in shelf hydrography in the Siberian Arctic: Potential for subsea permafrost instability, J. Geophys. Res., 116, C10027, https://doi.org/10.1029/2011JC007218, 2011.
Dubrovin, V. A., Kritsuk, L. N., and Polyakova, E. I.: Temperature, composition and age of the Kara sea shelf sediments in the area of the geocryological station Marre-Sale, Earth's Cryosphere, XIX, 3–16, 2015 (in Russian).
Flint, R. F.: Glacial and Pleistocene geology, N. Y., J. Wiley, IV, 553, https://doi.org/10.3189/S0022143000024060, 1957
Forman, S. L., Ingolfsson, O., Gataullin, V., Manley, W., and Lockrantz, H.: Late Quaternary stratigraphy, glacial limits, and paleoenvironments of the Marresale area, western Yamal Peninsula, Russia, Quaternary Res., 57, 355–370, https://doi.org/10.1006/qres.2002.2322, 2002.
Fotiev, S. M.: Formation of the major-ion chemistry of natural waters in the Yamal Peninsula, Kriosfera Zemli, III, 40–65, 1999 (in Russian).
Gavrilov, A. V.: The cryolithozone of the Arctic shelf of Eastern Siberia (current state and history of development in the Middle Pleistocene – Holocene), Dissertation for a degree, D.Sc. M., 48, 2008 (in Russian).
Gavrilov, A. V., Romanovskii, N. N., Romanovsky, V. E., and Hubberten, H.-W.: Offshore Permafrost Distribution and Thickness in the Eastern Region of Russian Arctic, in: ”Changes in the Atmosphere-Land-Sea System in the American Arctic”, Proceedings of the Arctic Regional Centre vol. 3, edited by: Semiletov, I. P., Dalnauka, Vladivostok, 209–218, 2001 (in Russian).
Gavrilov, A., Pavlov, V., Fridenberg, A., Boldyrev, M., Khilimonyuk, V., Pizhankova, E., Buldovich, S., Kosevich, N., Alyautdinov, A., Ogienko, M., Roslyakov, A., Cherbunina, M., and Ospennikov, E.: The Current State and 125 Kyr History of Permafrost in the Kara Sea Shelf: Modeling Constraints, Zenodo, https://doi.org/10.5281/zenodo.3866046, 2020.
Geinz, A. E. and Garutt, V. E.: Radiocarbon (14C) dating of mammoth and woolly rhinoceros fossils from Siberian permafrost, Doklady Akademii Nauk, 154, 1367–1370, 1964 (in Russian).
Gilbert, M. Th. P., Tomsho, L. P., Rendulic, S., Packard, M., Drautz, D. I., Sher, A., Tikhonov, A., Dalen, L., Kuznetsova, T., Kosintsev, P., Campos, P. F., Higham, Th., Collins, M. J., Wilson, A. S., Shidlovskiy, F., Buigues, B., Ericson, P. G. P, Germonpre, M., Gotherstrom, A., Iacumin, P., Nikolaev, V., Nowak-Kemp, M., Willerslev, E., Knight, J. R., Irzyk, G. P., Perbost, C. S., Fredrikson, K. M., Harkins, T. T., Sheridan, Sh., Miller, W., and Schuster, S. C.: Whole-genome shotgun sequencing of mitochondria from ancient hair shafts, Science, 317, 1927–1930, 2007.
Golubev, V. N., Konishchev, V. N., Sokratov, S. A., and Grebennikov, P. B.: The effect of seasonal snow sublimation on the oxygen isotope composition of ice wedges, Kriosfera Zemli, 3, 71–77, 2001 (in Russian).
Grigoriev, N. F.: Coastal Permafrost in the Western Yamal Peninsula, Kn. Izdatelstvo, Yakutsk, 110, 1987 (in Russian).
Gusev, E. A. and Molod'kov, A. N.: Structure of sediments of the final stage of the Kazantsevo transgression (MIS 5) in the north of Western Siberia, Doklady Earth Sciences, 443, 458–461, 2012.
Gusev, E. A., Arslanov, Kh. A., Maksimov, F. E., Molod'kov, A. N., Kuznetsov, V. Yu., Smirnov, S. B., Chernov, S. B., Zherebtsov, I. E., and Levchenko, S. B.: Late Pleistocene-Holocene sediments in the Yensei lower reaches: New geochronological data, Problemy Arktiki i Antarktiki, 2, 36–44, 2011 (in Russian).
Gusev, E. A., Sharin, V. V., Dymov, V. A., Kachurina, N. V., and Arslanov, Kh. A,: Shallow sediments in the northern Kara shelf: New data, Razvedka i Okhrana Nedr, 8, 87–90, 2012a (in Russian).
Gusev, E. A., Kostin, D. A., and Rekant, P. V.: Genesis of Quaternary deposits in the Barentsevo-Kara shelf (State Geological Map of the Russian Federation, scale 1:1 000 000), Otechestvennaya Geologiya, 2, 84–89, 2012b (in Russian).
Gusev, E. A., Bolshiyanov, D. Yu., Dymov, V. A., Sharin, V. V., and Arslanov, Kh. A.: Holocene marine terraces of southern islands of the Franz Joseph Land archipelago, Problemy Arktiki i Antarktiki, 97, 103–108, 2013 (in Russian).
Gusev, E. A., Molodkov, A. N., Anikina, N. Yu., and Derevianko, L. G.: Origin and age of watershed sands in the northern part of the Yenisei catchment, Proceedings of the Russian Geographical Society, 147, 51–62, 2015a (in Russian).
Gusev, E. A., Molodkov, A. N., and Derevyanko, L. G.: The Sopkarga mammoth, its age and living conditions (northern West Siberia), Uspekhi Sovremennogo Estestvoznaniya, 1–3, 432–435, 2015b (in Russian).
Gusev, E. A., Maksimov, F. E., Molodkov, A. N, Yarzhembovsky, Ya. D., Makaryev, A. A., Arslanov, Kh. A., Kuznetsov, V. Yu., Petrov, A. Yu., Grigoryev V. A., and Tokarev, I. V.: Late Pleistocene-Holocene deposits of western Tai'myr and islands of the Kara Sea: New geochronological constraints, Problemy Arktiki i Antarktiki, 109, 74–84, 2016a (in Russian).
Gusev, E. A., Molodkov, A. N., Streletskaya, I. D., Vasiliev, A. A., Anikina, N. Yu., Bondarenko, S. A., Derevyanko, L. G., Kupriyanova, N. V., Maksimov, F. E., Polyakova, E. I., Pushina, Z. V., Stepanova, G. V., and Oblogov, G. E.: Deposits of the Kazantsevo transgression (MIS-5) in the northern part of the Yenisei catchment, Russ. Geol. Geophys.+, 54, 743–757, 2016b (in Russian).
Gutenberg, B.: Changes in sea level, postglacial uplift, and mobilityof the Earth's intertor, Geol. Soc. Am. Bull, 52, 251–286, 1941.
Hughes, A. L. C., Gyllencreutz, R., Lohne, Sh. S., Mangerud, J., and Svendsen, J. I.: The last Eurasian ice sheets – a chronological database and time-slice reconstruction, DATED-1, Boreas, 45, 1–45, https://doi.org/10.1111/bor.12142, 2016.
Khrustalev, L. N., Emeliyanov N. V., Pustovoit, G. P., and Yakovlev, S. V.: WARM software for calculating the thermal interaction of engineering structures with permafrost, Certificate No. 940281, RosAPO, 1994 (in Russian).
Khutorskoi, M. D., Akhmedzyanov, V. R., Ermakov, A. V., Leonov, Yu. G., Podgornykh, L. V., Polyak, B. G., Sukhikh, E. A., and Tsybula, L. A.: Geotehrmics of Arctic seas, Transactions, Geological Institute, Moscow, 605, 232, 2013 (in Russian).
Kokin, O. V. and Tsvetinskiy, A. S.: Geocryology of the Ob' Gulf slope contacting fast ice, Vesti Gazovoi Nauki, 14, 67–69, 2013 (in Russian).
kriolog: Software for a numerical geotechnical modeling of thermophysical processes in freezing and frozen soils, available at: https://github.com/kriolog/qfrost, last access: 15 February 2020.
Kudryavtsev, V. A. (Ed.): Methods of Cryogenic Survey, Moscow State University, Moscow, 358, 1979 (in Russian).
Kulikov, S. N. and Rokos, S. I.: Detection of permafrost in seismoacoustic time sections from shallow-water areas in the Pechora and Kara seas, Geofizicheskie Izyskaniya, 3, 34–42, 2017 (in Russian).
Lamberk, K. and Chappell, J.: Sea level change through the Last Glacial cycle, Science, 292, 679–686, https://doi.org/10.1126/science.1059549, 2001.
Leibman, M. O. and Kizyakov, A. I.: Cryogenic landslides in the Yamal and Yugor peninsulas, Tipografia Rosselkhozakademiya, Moscow, 206, 2007 (in Russian).
Levitan, M. A.: Quaternary advection of Atlantic waters into the Arctic: a review, in: Geology and Geoecology of the Eurasian Continental Margins, GEOS, Moscow, 1, 54–63, 2009 (in Russian).
Levitan, M. A., Lavrushin, Yu. A., and Stein, R.: Deposition history in the Arctic ocean and Subarctic seas for the past 130 kyr, GEOS, Moscow, 404, 2007 (in Russian).
Melnikov, V. P. and Spesivtsev, V. I.: Engineering Geological and Geocryological Conditions in the Barents and Kara Seas, Novosibirsk, Nauka, 198, 1995 (in Russian).
Melnikov, V. P., Fedorov, K. M., Wolf, A. A., and Spesivtsev, V. I.: Near-bottom ice mounds in the shelf: Possible formation scenario, Kriosfera Zemli, II, 51–57, 1998 (in Russian).
Molodkov, A. N., Hutte, G. I., Makeev, V. M., Baranovskaya, O. F., Kosmodamiansky, A. V., Ponomareva, D. P., and Bolshiyanov, D. Yu.: EPR dating of mollusk shells in Oktyabrskoi Revolutsii and Kotelny islands, in: New Data on Quaternary Geochronology, Nauka, Moscow, 236–243, 1987 (in Russian).
Nazarov, D. V.: Quaternary Deposits in the Central West Siberian Arctic. Author's Abstract, Ph.D. thesis), St. Petersburg, 24, 2011 (in Russian).
Neizvestnov, Ya. V., Borovik, O. V., Kozlov, S. A., and Kholmyansky, M. A.: Subsea permafrost in the Barents, Kara, and Beloye seas, in: Proc. 3rd Conf. of Russian Geocryologists,vol. 3, Moscow University, Moscow, 184–190, 2005 (in Russian).
Nicolsky, D. J., Romanovsky, V. E., Romanovskii, N. N., Kholodov, A. L., Shakhova, N. T., and Semiletov, I. P.: Modeling sub-sea permafrost in the East Siberian Arctic Shelf: The Laptev Sea region, J. Geophys. Res., 117, F03028, https://doi.org/10.1029/2012JF002358, 2012.
Nikonov, A. A.: Holocene and Current Crustal Movements, Nauka, Moscow, 240, 1977 (in Russian).
Parkhomenko, S. G.: Sketch Map of Permafrost and Frost Depth in the USSR, Transactions, CNIIGAiK, 16, 1937 (in Russian).
Pesotsky, D. G.: Qfrost software for geocryological modeling, Certificate of the State Registration No. 2016614404 of 22 April 2016 (in Russian).
Pogodina, I. A.: Spatial distribution and evolution of foraminiferal communities during global climate change, Vestnik Yuzhnogo Nauchnogo Centra RAN, 5, 64–72, 2009 (in Russian).
Portnov, A., Mienert, J., and Serov, P.: Modeling the evolution of climate-sensitive Arctic subsea permafrost in regions of extensive gas expulsion at the West Yamal shelf, J. Geophys. Res.-Biogeosci., 119, 2082–2094, https://doi.org/10.1002/2014JG002685, 2013.
Pustovoit, G. P.: Numerical solutions/Fundamentals of Geocryology, Part 5, (Engineering geocryology), edited by: Ershov, E. D., Moscow State University, Moscow, 41–55, 1999 (in Russian).
Rokos, S. I. and Tarasov, G. A.: Gas-saturated sediments in estuaries and gulfs in the southern Kara sea, Bull. Commission on the Quaternary, 67, 66–75, 2007.
Rokos, S. I., Kostin, D. A., and Dlugach, A. G.: Free gas and permafrost in shallow sediments of the Pechora and Kara shelf areas, in: Sedimentation Processes and Evolution of Marine Ecosystems in Marine Periglacial Conditions, Book 1, KNC RAN, Apatity, 40–51, 2001 (in Russian).
Rokos, S. I., Dlugach, A. G., Loktev, A. S., Kostin, D. A., and Kulikov, S. N.: Permafrost in the Pechora and Kara shelves: genesis, lithology, and distribution conditions, Vserossiyskiy Inzhenerno-analiticheskiy zhurnal, 10, 38–41, 2009 (in Russian).
Romanenko, F. A.: Regional evolution features of the Arctic shelf in the Holocene, Geomorfologiya, 4, 81–92, 2012 (in Russian).
Romanivskii, N. N. and Tumskoy, V. E.: Retrospective approach to the assessment of the modern distribution and structure of the shelf cryolithozone of the Eastern Arctic, Earth's Cryosphere, XV, 3–14, 2011 (in Russian).
Shishkin, M. A., Faibusovich, Ya. E., Shkarubo, S. I., Nazarov, D. V., Abakumova, L. A., Borozdina, Yu. A., Voronin, A. S., Gerasicheva, A. V., Gorelina, T. E., Zavarzina, G. A., Zinchenko, A. G., Zuikova, O. N., Kostin, D. A., Lang, E. I., Likhotin, V. G., Markina, T. V., Petrov, S. Yu., Petrova, M. N., Cannon, D. V., Radchenko, M. S., Rubin, L. I., Seregin, S. V., Solonina, S. F., Sychev, S. N., Tortsov, Yu. I., Bazhkova, S. F., Vasilenko, E. P., Ivanova, E. I., Perlov, D. K., Ruchkin, M. V., and Stepanova, A. P.: The State Geological Map of the Russian Federation Scale 1:1000000 (third generation). Ser. West Siberia, Sheet R-42, Yamal Peninsula, Explanatory note, Saint Petersburg, VSEGEI, 2015 (in Russian).
Siegert, M. J. and Dowdeswell, J. A.: Numerical reconstructions of the Eurasian Ice Sheet and climate during the Late Weichselian, Quaternary Sci. Rev., 23, 1273–1284, 2004.
Siddall, M., Chappel, J., and Potter, E. K.: Eustatic Sea Level During Past Interglacials, Dev. Quaternary Sci., 7, 75–92, https://doi.org/10.1016/S1571-0866(07)80032-7, 2006
Slichenkov, V. I., Samoilovich, Yu. G., Nikolaev, V. V., and Konstantinov, V. M.: Structure of Cenozoic sediments in the northern Ob' gulf, Kara Sea; evidence from acoustic data, Problemy Arktiki i Antarktiki, 82, 106–117, 2009 (in Russian).
Stein, R., Val, K., Polyakova, E. I., and Dittmers, K.: Postglacial changes in the river runoff and deposition environments in the southern Kara sea, in: The System of the Laptev Sea and Adjacent Arctic Seas, Current State and Evolution, Moscow State University, Moscow, 410–426, 2009 (in Russian).
Streletskaya, I. D., Shpolanskaya, N. A., Kritsuk, L. N., and Surkov, A. V.: Cenozoic deposits in the Yamal Peninsula and the problem of their origin, Vestnik Moscow University, ser. 5, Geography, 3, 50–57, 2009 (in Russian).
Streletskaya, I. D., Gusev, E. A., Vasiliev, A. A., Rekant, P. V., and Arslanov, Kh. A.: Late Pleistocene-Holocene ground ice in Quaternary deposits on the Kara shelf as a record of paleogeographic conditions, Bull. Commission on Quaternary, 72, 28–59, 2012 (in Russian).
Streletskaya, I. D., Vasiliev, A. A., Oblogov, G. E., and Tokarev, I. V.: Reconstruction of paleoclimate of Russian Arctic in Late Pleistocene–Holocene on the basis of isotope study of ice wedges, Earth Cryosphere, XIX, 98–106, 2015 (in Russian).
Sulerzhitsky, L. D., Tarasov, P. E., Andreev, A. A., and Romanenko, F. A.: The Upper Quaternary pollen-based stratigraphy of Sverdrupp Island. Stratigrafiya, Geologicheskaya Korrelatsiya, 3, 98–104, 1995 (in Russian).
Svendsen, J., Alexahderson, H., Astakhov, V., Demidov, I., Dowdeswell, Ju., Funder, S., Gataulin, V., Henriksen, M., Hjort, H., Houmark-Nielsen, M., Hubberten, H.-W., Ingolfsson, O., Jakobsson, M., Kjar, K., Larsen, E., Lokrantz, H., Lunkka, Ju. P., Lysa, A., Mangerud, J., Matiouchkov, A., Murray, A., Moller, P., Niessen, F., Nikolskaya, O., Polyak, L., Saarnisto, M., Siegert, Ch., Siegert, M., Spielhagen, R., and Stein, R.: Late Quaternary ice sheet history of northern Eurasia, Quaternary Sci. Rev., 23, 1229–1271, https://doi.org/10.1016/j.quascirev.2003.12.008, 2004.
Trofimov, V. T. (Ed.), Badu, Yu. B., Kudryashov, V. G., and Firsov, N. G.: The Yamal Peninsula (Engineering-Geological Review), Moscow State University, Moscow, 278, 1975 (in Russian).
Ushakov, S. A. and Krass, M. S.: Gravity and Mechanics of the Earth's Interior, Nedra, Moscow, 157, 1972 (in Russian).
Vasil`chuk, Yu. K.: Oxygen Isotope Composition of Ground Ice: An Experience of Geocryological Reconstructions. Mosobluprpoligrafizdat, Moscow, Book 1, 420 Book 2, 264 pp., 1992 (in Russian).
Vasil`chuk, Yu. K., Serova, A. K., and Trofimov, V. T.: Deposition environment of Karginian sediments in northern West Siberia, Bull. Commission for Quaternary, 53, 28–35, 1984 (in Russian).
Vasiliev, A. A., Rekant, P. V., Oblogov, G. E., and Korostelev, Yu. V.: A new GIS–oriented map of subsea permafrost in the Kara Sea, in: Proc. Session of Scientific Council on Geocryology, Russ. Ac. Sci., 1, 291–295, 2018 (in Russian).
Velichko, A. A., Kononov, Y. M., and Faustova, M. A.: Geochronology, distribution, and ice volume on the earth during the last glacial maximum: Inferences from new data, Stratigr. Geo. Correl.+, 8, 1–12, 2000.
Volkov, N. G.: Prediction of Temperature and Major-Ion Chemistry of Pore Water in Saline Permafrost and Cryopegs: Case Study of the Yamal Peninsula), Author's Abstract, Ph.D. thesis, Moscow, 26, 2006 (in Russian).
Yershov, E. D. (Ed.): Geocryology of the USSR, West Siberia, Nedra, Moscow, 454, 1989 (in Russian).
Yershov, E. D. (Ed.): Geocryological Map of the USSR, scale 1:2 500 000, Moscow State University, Moscow, 1991 (in Russian).
Zastrozhnov, A. S., Shkatova, V. K., Minina, E. A., Tarnogradsky, V. D., Astakhov, V. I., and Gusev, E. A.: Map of Quaternary deposits in the Russian Federation, scale 1:2 500 000, Explanatory note. Saint Petersburg, VSEGEI, VNII Okeangeologiya, 2010 (in Russian).
Zhigarev, L. A.: Patterns of permafrost development of the Arctic basin. The cryolithozone of the Arctic shelf, IM SO AN SSSR, Yakutsk, 4–17, 1981 (in Russian).