the Creative Commons Attribution 4.0 License.
the Creative Commons Attribution 4.0 License.
 | 22 Feb 2019
Large carbon cycle sensitivities to climate across a permafrost thaw gradient in subarctic Sweden
William J. Riley
Patrick M. Crill
Robert F. Grant
Virginia I. Rich
Scott R. Saleska
Permafrost peatlands store large amounts of carbon potentially vulnerable to decomposition. However, the fate of that carbon in a changing climate remains uncertain in models due to complex interactions among hydrological, biogeochemical, microbial, and plant processes. In this study, we estimated effects of climate forcing biases present in global climate reanalysis products on carbon cycle predictions at a thawing permafrost peatland in subarctic Sweden. The analysis was conducted with a comprehensive biogeochemical model (ecosys) across a permafrost thaw gradient encompassing intact permafrost palsa with an ice core and a shallow active layer, partly thawed bog with a deeper active layer and a variable water table, and fen with a water table close to the surface, each with distinct vegetation and microbiota. Using in situ observations to correct local cold and wet biases found in the Global Soil Wetness Project Phase 3 (GSWP3) climate reanalysis forcing, we demonstrate good model performance by comparing predicted and observed carbon dioxide (CO2) and methane (CH4) exchanges, thaw depth, and water table depth. The simulations driven by the bias-corrected climate suggest that the three peatland types currently accumulate carbon from the atmosphere, although the bog and fen sites can have annual positive radiative forcing impacts due to their higher CH4 emissions. Our simulations indicate that projected precipitation increases could accelerate CH4 emissions from the palsa area, even without further degradation of palsa permafrost. The GSWP3 cold and wet biases for this site significantly alter simulation results and lead to erroneous active layer depth (ALD) and carbon budget estimates. Biases in simulated CO2 and CH4 exchanges from biased climate forcing are as large as those among the thaw stages themselves at a landscape scale across the examined permafrost thaw gradient. Future studies should thus not only focus on changes in carbon budget associated with morphological changes in thawing permafrost, but also recognize the effects of climate forcing uncertainty on carbon cycling.
- Article
(3545 KB) - Full-text XML
-
Supplement
(363 KB) - BibTeX
- EndNote


Confidence in future climate projections depends on the accuracy of terrestrial carbon budget estimates, which are presently very uncertain (Friedlingstein et al., 2014; Arneth et al., 2017). In addition to the complexity in physical process representations, a major source of this uncertainty comes from challenges in quantifying climate responses induced by biogeochemical feedbacks. Increases in atmospheric carbon dioxide (CO2) concentrations can directly stimulate carbon sequestration from plant photosynthesis (Cox et al., 2000; Friedlingstein et al., 2006) and indirectly stimulate carbon emissions (e.g., from soil warming and resulting increased respiration), although the predicted magnitudes of these exchanges strongly depend on model process representations (Zaehle et al., 2010; Grant, 2013, 2014; Ghimire et al., 2016; Chang et al., 2018).
The undecomposed carbon stored in permafrost is of critical importance for biogeochemical feedbacks to climate because it is about twice as much as currently is in the atmosphere (Hugelius et al., 2014) and is vulnerable to release to the atmosphere as permafrost thaws (Schuur et al., 2015). O'Donnell et al. (2012) suggested that permafrost thaw would result in a net loss of soil organic carbon from the entire peat column because accumulation rates at the surface were insufficient to balance deep soil organic carbon losses upon thaw. Jones et al. (2017) indicated that the loss of sporadic and discontinuous permafrost by 2100 could result in a release of up to 24 Pg of soil carbon from permafrost peatlands to the atmosphere. Lundin et al. (2016) reported that it is plausible (71 % probability) for the subarctic landscapes to serve as a net carbon source to the atmosphere while its peatland components are atmospheric carbon sinks, which highlights the importance of spatial heterogeneity in high-latitude carbon budget estimation.
In addition to the overall carbon balance of the changing Arctic, the type of carbon gaseous emission is important to climate feedbacks. High latitudes are predicted to get wetter (IPCC, 2014), and saturated anaerobic conditions facilitate methane (CH4) production, which is a much more efficient greenhouse gas than CO2 in terms of global warming potential. Even habitats that can be net carbon sinks can produce positive radiative forcing impacts on climate due to CH4 release, as Bäckstrand et al. (2010) showed for a subarctic peatland. Under projected warming and wetting trends in the Arctic (Collins et al., 2013; Bintanja and Andry, 2017), carbon cycle feedbacks over the permafrost region could become stronger as increased precipitation enhances surface permafrost thaw and strengthens CH4 emissions through expansion of anaerobic volume (Christensen et al., 2004; Wickland et al., 2006).
The Stordalen Mire in northern Sweden (68.20∘ N, 19.03∘ E) is in the discontinuous permafrost zone, encompassing a mosaic of thaw stages with associated distinct hydrology and vegetation (Christensen et al., 2004; Malmer et al., 2005), microbiota (Mondav et al., 2014, 2017; Woodcroft et al., 2018), and organic matter chemistry (Hodgkins et al., 2014). These landscapes have been shifting over the last half-century to a more thawed state, likely due to recent warming (Christensen et al., 2004). Drier hummock sites dominated by shrubs have degraded to wetter sites dominated by graminoids (Malmer et al., 2005; Johansson et al., 2006). The thaw-induced habitat shifts are associated with increases in landscape-scale CH4 emissions (Christensen et al., 2004; Johansson et al., 2006; Cooper et al., 2017), reflective of the higher CH4 emissions of the wetter thawed habitats (McCalley et al., 2014). The higher CO2 uptake in later thaw-stage habitats has not compensated for the increase in positive radiative forcing from elevated CH4 emissions (Bäckstrand et al., 2010; Deng et al., 2014).
The impacts of climate sensitivity on the terrestrial carbon cycle have been investigated at the global scale, and the results highlight the need to consider uncertainty in climate datasets when evaluating permafrost region carbon cycle simulations (Ahlström et al., 2017; Guo et al., 2017; Wu et al., 2017). Ahlström et al. (2017) showed that climate forcing biases are responsible for a considerable fraction (∼40 %) of the uncertainty range in ecosystem carbon predictions from 18 Earth System Models (ESMs) reported by Anav et al. (2013). Guo et al. (2017) concluded that the differences in climate forcing contribute to significant differences in simulated soil temperature, permafrost area, and active layer depth (ALD). Wu et al. (2017) demonstrated that differences among climate forcing datasets contribute more to predictive uncertainty than differences in apparent model sensitivity to climate forcing. However, notably, none of these studies accessed the effects on CH4 emissions, and their spatial resolution could not represent site-level spatial heterogeneity observed in arctic tundra (Grant et al., 2017a, b).
Here, we use the ecosystem model ecosys, which employs a comprehensive set of coupled biogeochemical and hydrological processes to estimate the effects of climate forcing uncertainty and sensitivity on CO2 and CH4 exchanges and thaw depth simulations. For the Stordalen Mire site, we estimated bias in the Global Soil Wetness Project Phase 3 (GSWP3) climate reanalysis dataset using site-level long-term meteorological measurements and evaluated impacts on simulated soil and plant processes across the permafrost thaw gradient. This approach enables us to assess model sensitivity to individual climate forcing biases, instead of the aggregated uncertainty range embedded in climate datasets (e.g., variations of climate conditions represented in different climate datasets) presented in previous studies. We address the following questions for our study site at the Stordalen Mire. (1) What are the biases embedded in the GSWP3 climate reanalysis dataset? (2) How do these biases affect model predictions of thaw depth, CO2 exchanges, and CH4 exchanges? (3) How does climate sensitivity vary across the stages of permafrost thaw? In addition to improving understanding of permafrost responses to climate, we identify ecosystem carbon prediction uncertainty induced by climate forcing uncertainty in general as the biases found in GSWP3 were consistent with other climate reanalysis datasets during the last decade (Sect. 3).
2.1 Study site description
Our study sites are located at the Stordalen Mire (68.20∘ N, 19.03∘ E; 351 m above sea level), which is about 10 km southeast of the Abisko Scientific Research Station (ANS) in northern Sweden. The Stordalen Mire is in the discontinuous permafrost zone along the 0 ∘C isotherm, where permafrost at low elevations is primarily present in peatlands, bordered by lakes to the northwest and southeast (Kokfelt et al., 2010). A large portion of the mire consists of a slightly elevated drained area underlain by permafrost characterized by a hummocky topography, and the remaining portion is largely lacking permafrost with fen-like conditions (Johansson et al., 2006). The recent warming (more than 1 ∘C) has deepened the mean ALD measured at the Stordalen Mire by around 20 cm since the early 1980s, accompanied by palsa collapses and thermokarst erosion (Christensen et al., 2004; Malmer et al., 2005; Johansson et al., 2006). Specifically, the mean ALD increased from 0.48 to 0.63 m in the drier part of the mire and from 0.63 to 0.86 m in the wetter part, from September 1973–1976 (Rydén and Kostov, 1980) to September 2003–2005 (Johansson et al., 2006).
Significant changes in climate over this region have been recorded during the last few decades. The annual mean air temperature measured at the ANS rose by 2.5 ∘C from 1913 to 2006, when it exceeded the 0 ∘C threshold (0.6 ∘C in 2006) for the first time over the past century (Callaghan et al., 2010). The measured annual total precipitation also increased from 306 mm yr−1 (years 1913 to 2009) to 336 mm yr−1 (years 1980 to 2009) (Olefeldt and Roulet, 2012), along with increased variability in extreme precipitation (Callaghan et al., 2010). The measured annual maximum snow depth increased from 59 cm (years 1957 to 1971) to 70 cm (years 1986 to 2000); however, the snow cover period with snow depth greater than 20 cm decreased from 5.8 months (years 1957 to 1971) to 4.9 months (years 1986 to 2000) (Malmer et al., 2005).
Inception of peat deposition at the Stordalen Mire has been dated at around 6000 calendar years before present (cal BP) (Sonesson, 1972) in the southern part of the mire and at around 4700 cal BP in the northern part (Kokfelt et al., 2010). Kokfelt et al. (2010) suggested that permafrost aggregation initiated during the Little Ice Age (around 120–400 cal BP) in the Stordalen Mire. At present, the Stordalen Mire can be broadly classified into three peatland types: intact permafrost palsa, partly thawed bog, and fen (Hodgkins et al., 2014), hereafter referred to as palsa, bog, and fen (Fig. 1). The spatial distribution of these peatland types in 2000 is described in Olefeldt and Roulet (2012).
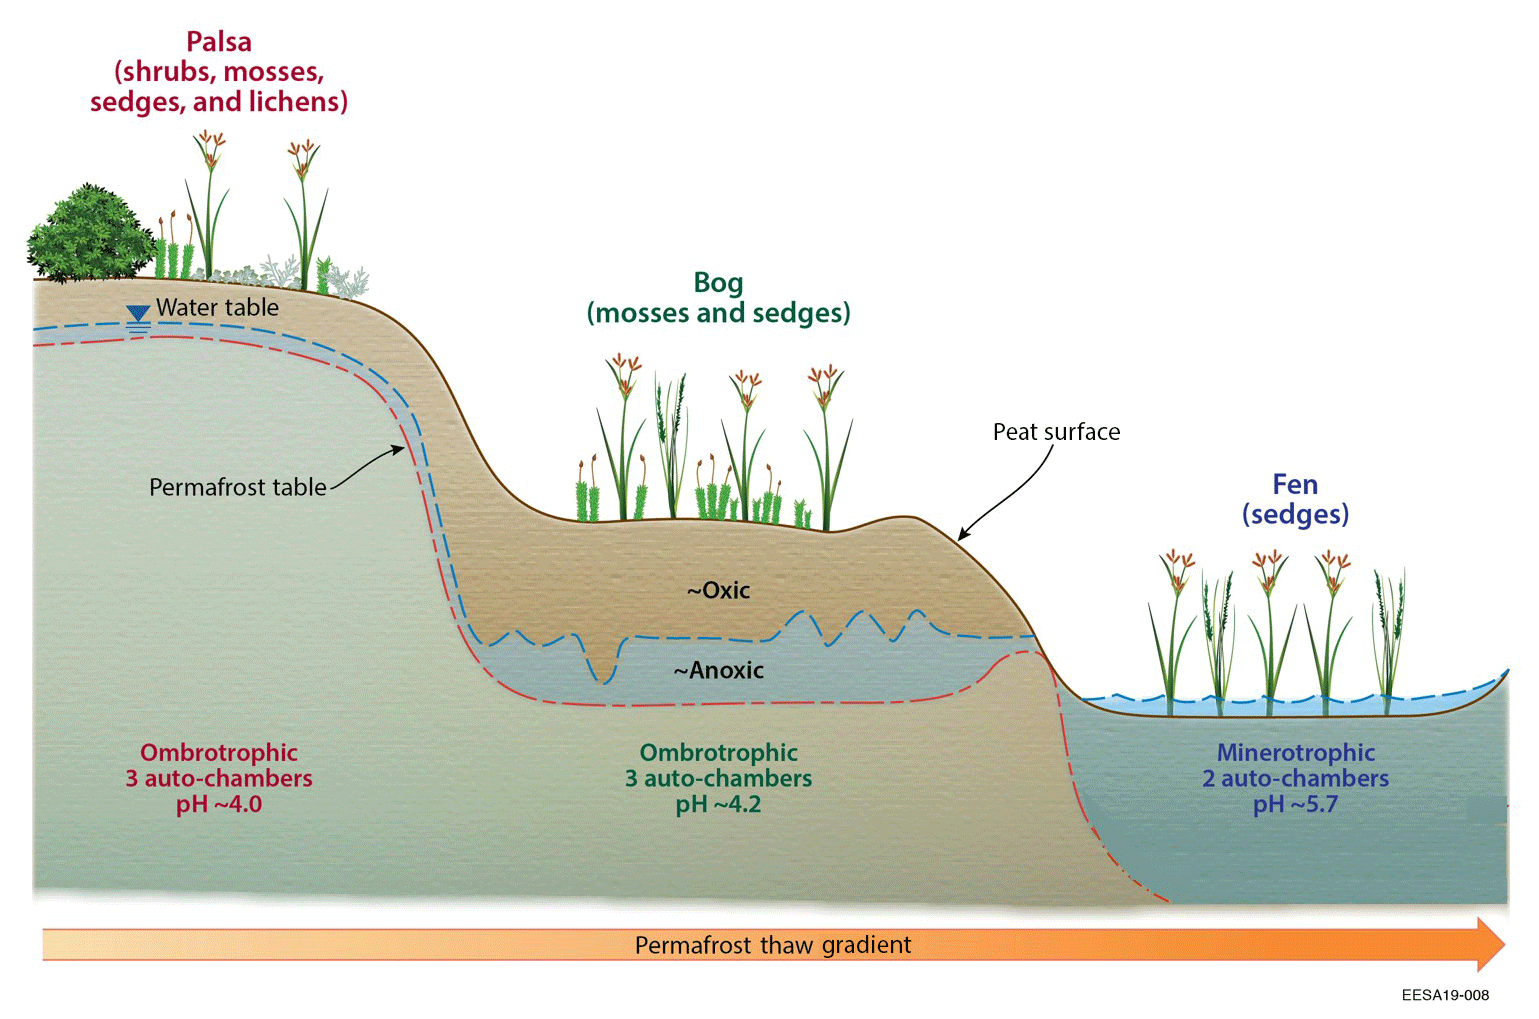
Figure 1Schematic diagram of the sampling sites at Stordalen Mire, adapted from Johansson et al. (2006).
Based on Swedish military photography, all three of the investigated peatland types have existed since at least the 1930s. The palsa sites are ombrotrophic and raised 0.5 to 2.0 m above their surroundings, with a relatively thin peat layer (0.4 to 0.7 m; Rydén et al., 1980), thinner active layer depth (less than 0.7 m in late summer), and no measurable water table depth (Bäckstrand et al., 2008a, b; Olefeldt and Roulet, 2012). The bog sites are ombrotrophic and are wetter than the palsa sites, with a thicker peat layer (0.5 to ∼1 m; Rydén et al., 1980), deeper ALD (greater than 0.9 m, the deepest measurement depth), and water table depth fluctuating from 35 cm below the peat surface to the ground surface (Bäckstrand et al., 2008a, b; Olefeldt and Roulet, 2012). The fen sites are minerotrophic, receiving a large amount of water from a lake to the east of the mire, with water table depths near or above the ground surface (Bäckstrand et al., 2008a, b; Olefeldt and Roulet, 2012).
Differences in hydrology and permafrost conditions create high spatial heterogeneity with different soil moisture, pH, and nutrient conditions that support different plant communities (Bäckstrand et al., 2008a, b). The palsa is dominated by dwarf shrubs with some sedges, feather mosses, and lichens (Malmer et al., 2005; Bäckstrand et al., 2008a, b; Olefeldt and Roulet, 2012). The bog is dominated by Sphagnum spp. mosses with a moderate abundance of sedges (Malmer et al., 2005; Bäckstrand et al., 2008a, b; Olefeldt and Roulet, 2012). The fen sites we studied are dominated by sedges (Bäckstrand et al., 2008a, b).
2.2 Field measurements
Continuous daily meteorological measurements have been recorded at the ANS since 1913, including air temperature, precipitation, wind speed, wind direction, relative humidity, and snow depth. Measurements of solar radiation, longwave radiation, and soil temperature have also been available at the ANS since 1982. The soil thaw depth (measured to 90 cm) and water table depth measurements were taken in the three peatland types three to five times per week from early May to mid-October during 2003 to 2007 (Bäckstrand et al., 2008b).
CO2 and CH4 exchanges in the three peatland types were measured with automated chambers during the thawed seasons from 2002 to 2007 (Bäckstrand et al., 2008b). Chamber lids were removed when snow accumulates in winter (around November), and the sampling periods for each year ranged from 60 days (28 March (day 87) to 27 May (day 147)) in 2002 (shortest) to 193 days (28 May (day 148) to 7 December (day 341)) (longest) (Bäckstrand et al., 2008b, 2010). Three chambers were installed in the palsa, another three in the bog, and two more in the fen (we term each chamber a “subsite” in the following). Each chamber covered an area of 0.14 m2 with a height of 25–45 cm depending on the vegetation and the depth of insertion and was closed for 5 min every 3 h to measure CO2 and total hydrocarbon (THC) exchanges. CH4 exchanges were manually observed approximately three times per week, and these measurements were used to quantify the proportion of CH4 in the measured THC (Bäckstrand et al., 2008a). The CH4 exchanges were near zero in the palsa sites (Bäckstrand et al., 2008a, b, 2010), so they were not used in model evaluation. We used the CO2 and CH4 exchanges observed at 3-hourly steps when the R2 values recorded in the measurements were greater than 0.8 (Tokida et al., 2007) and then calculated the associated daily mean exchanges when there were eight measurements per day (Table 1). The quality-controlled daily measurements only covered 12.4 %–33.7 % of the daily data points because of the lack of continuous quality-controlled 3-hourly measurements. The data screening was applied to exclude unreliable measurements and avoid biases from inappropriate gap filling, which is necessary for model evaluations. More detailed descriptions of the CO2 and CH4 exchange measurements can be found in Bäckstrand et al. (2008a).
Table 1Temporal coverage of quality-controlled CO2 and CH4 exchanges measured by automated chambers in the three peatland types in the Stordalen Mire during the years 2002 to 2007.
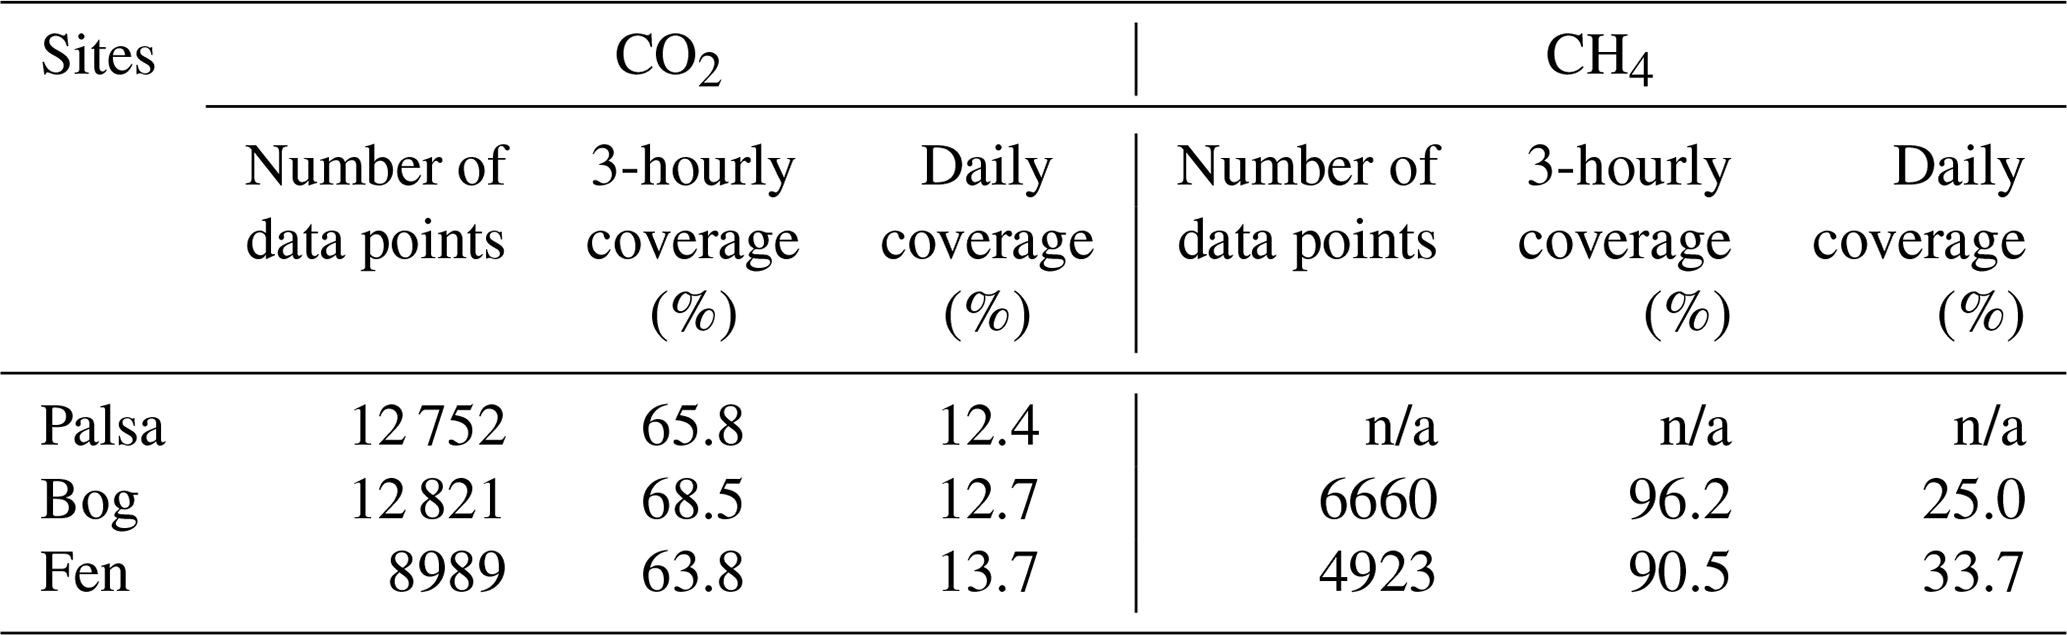
Note that the temporal coverage represents the percentage of data points that passed our quality-controlled threshold at the corresponding time steps. See main text for threshold details. n/a: not applicable.
2.3 GSWP3
GSWP3 is an ongoing modeling activity that provides global gridded meteorological forcing ( resolution) and investigates changes in energy, water, and carbon cycles throughout the 20th and 21st centuries. The GSWP3 dataset is based on the 20th Century Reanalysis (Compo et al., 2011), using a spectral nudging dynamical downscaling technique described in Yoshimura and Kanamitsu (2008). A more detailed description of the GSWP can be found in Dirmeyer (2011) and van den Hurk et al. (2016).
In this study, we extracted the meteorological conditions at the Stordalen Mire from 1901 to 2010 from the GSWP3 climate reanalysis dataset. The 3-hourly products of air temperature, precipitation, solar radiation, wind speed, and specific humidity were interpolated to hourly intervals with cubic spline interpolation to serve as the meteorological inputs used in our model.
The GSWP3 dataset was chosen over other existing climate reanalysis datasets for its spatial and temporal resolutions. For example, the Climatic Research Unit (CRU; Harris et al., 2014) dataset provided monthly meteorological forcing at resolution; the National Centers for Environmental Prediction (NCEP; Kalnay et al., 1996; Kanamitsu et al., 2002) dataset provided 6-hourly meteorological forcing for a T62 Gaussian grid ( resolution); the CRUNCEP (Viovy, 2018) dataset provided 6-hourly meteorological forcing at resolution; and the European Centre for Medium-Range Weather Forecasts (ECMWF; Berrisford et al., 2011) dataset provided 3-hourly meteorological forcing with 125 km (∼1.125 ∘) horizontal resolution.
2.4 Model description
The ecosys model is a comprehensive biogeochemistry model that simulates ecosystem responses to diverse environmental conditions with explicit representations of microbial dynamics and soil carbon, nitrogen, and phosphorus biogeochemistry. The above-ground processes are represented in multilayer plant interacting canopies that are allowed to change with changing environmental conditions, and the below-ground processes are represented in multiple soil layers with multiphase subsurface reactive transport. The ecosys model operates at variable time steps (down to seconds) determined by convergence criteria, and it can be applied at patch scale (spatially homogenous one-dimensional) and landscape scale (spatially variable two- or three-dimensional). Detailed descriptions, including inputs, outputs, governing equations, parameters, and references of the ecosys model can be found in Grant (2013). A qualitative summery of the ecosys model structure is provided in the Supplement.
The ecosys model has been extensively tested against eddy covariance fluxes and related ecophysiological measurements with a wide range of sites and weather conditions in boreal, temperate, and tropical forests (Grant et al., 2007a, c, 2009a, b, c, 2010), wetlands (Dimitrov et al., 2011, 2014; Grant et al., 2012b; Mezbahuddin et al., 2014), grasslands (Grant and Flanagan, 2007; Grant et al., 2012a), tundra (Grant et al., 2003, 2011b, 2015; Grant, 2015), croplands (Grant et al., 2007b, 2011a), and other permafrost-associated habitats (Grant and Roulet, 2002; Grant et al., 2017a, b). All ecosys model structures are unchanged from those described in these earlier studies.
2.5 Experimental design
To evaluate the effects of climate on model predictions, we conducted four sets of simulations in each of the three peatland types at the Stordalen Mire from 1901 to 2010. The climate data from 1901 to 2001 were used for model initialization (i.e., spin-up), and those from 2002 to 2010 were used for analysis. The 110-year simulations were performed to ensure the simulation was equilibrated with local climate (Grant et al., 2017a).
The meteorological conditions for all the simulations were based on the hourly data extracted from the GSWP3 climate reanalysis dataset (Sect. 2.3). The monthly mean bias of the GSWP3 for this location was calculated by comparing it to the air temperature and precipitation measured at the ANS, for the years 1913 to 2010 (Sect. 3.1). The full series of air temperature and precipitation extracted from GSWP3 were then bias-corrected using the monthly mean bias calculated from 1913 to 2010; we label this model scenario CTRL. Our bias correction was conceptually similar to the one used in Ahlström et al. (2017), in which the bias-corrected climate forcing fields were the ESM outputs adjusted by the corresponding bias calculated from observations in a reference period.
The simulation results from CTRL should represent the reliability of applying ecosys at the Stordalen Mire because CTRL is driven by the best local climate description. We first evaluated predicted thaw depth, water table depth, and CO2 and CH4 exchanges using the CTRL simulation (Sect. 3.2 to 3.4). In the second set of simulations, BIASED-COLD, the biased GSWP3 air temperature data were used, and we only corrected the GSWP3 precipitation. Deviations between CTRL and BIASED-COLD reflect the biased air temperature's effects on responses across the thaw gradient. In the third set of simulations, BIASED-WET, we bias-corrected the air temperature extracted from GSWP3, which allows us to quantify the effects of biased precipitation. Finally, we used the meteorological conditions directly extracted from GSWP3 to drive our fourth set of simulations, BIASED-COLD&BIASED-WET, which reveals the uncertainty range of subarctic peatland simulation associated with the local biases in GSWP3 climate forcing.
While the three peatland types share the same climate conditions, they differ in soil hydrologic conditions and vegetation characteristics (Sect. 2.1; Fig. 1). The bulk density and porosity profiles were set to the values reported in Rydén et al. (1980), who suggested a decreasing trend of bulk density and an increasing trend of porosity from palsa (0.12 Mg m−3 at surface; 92 %–93 % within the upper 10 cm) to bog and fen (0.06 Mg m−3 at surface; 96 %–97 % within the upper 10 cm). The peatland soil carbon-to-nitrogen (CN) ratios and pH values were assigned according to Hodgkins et al. (2014), who documented an increasing trend of pH from palsa (4.0), to bog (4.2), to fen (5.7), and a decreasing trend of soil organic matter CN ratio from bog (46±18), to palsa (39±24), to fen (19±0.4). Common values of field capacity (0.4) and wilting point (0.15) were used for the three peatland types (Deng et al., 2014). The soil property and vegetation parameters used in our simulation for the three peatland types are summarized in Tables S1 and S2 in the Supplement, respectively.
3.1 GSWP3 climate comparison to observations
As described in Sect. 2.3, we extracted meteorological conditions at the Stordalen Mire from the GSWP3 climate reanalysis dataset. The closest GSWP3 grid cell was centered at 68.0∘ N and 19.0∘ E, which covers the Stordalen Mire and the ANS. The annual mean air temperature and precipitation calculated at this GSWP3 grid cell were −3.65 ∘C and 683.88 mm yr−1, respectively, for the years 1913 to 2010. A cold bias (−3.09 ∘C) was identified in the GSWP3 annual mean air temperature during the 1913 to 2010 period, although a very high correlation coefficient (r=0.99) was found when compared with the ANS measurements (Fig. 2a). Both time series exhibit an overall warming trend from the early 20th century to the present (0.01 ∘C yr−1), with an even larger warming trend from 1980 to 2010 (0.05 ∘C yr−1 (ANS) and 0.04 ∘C yr−1 (GSWP3)).
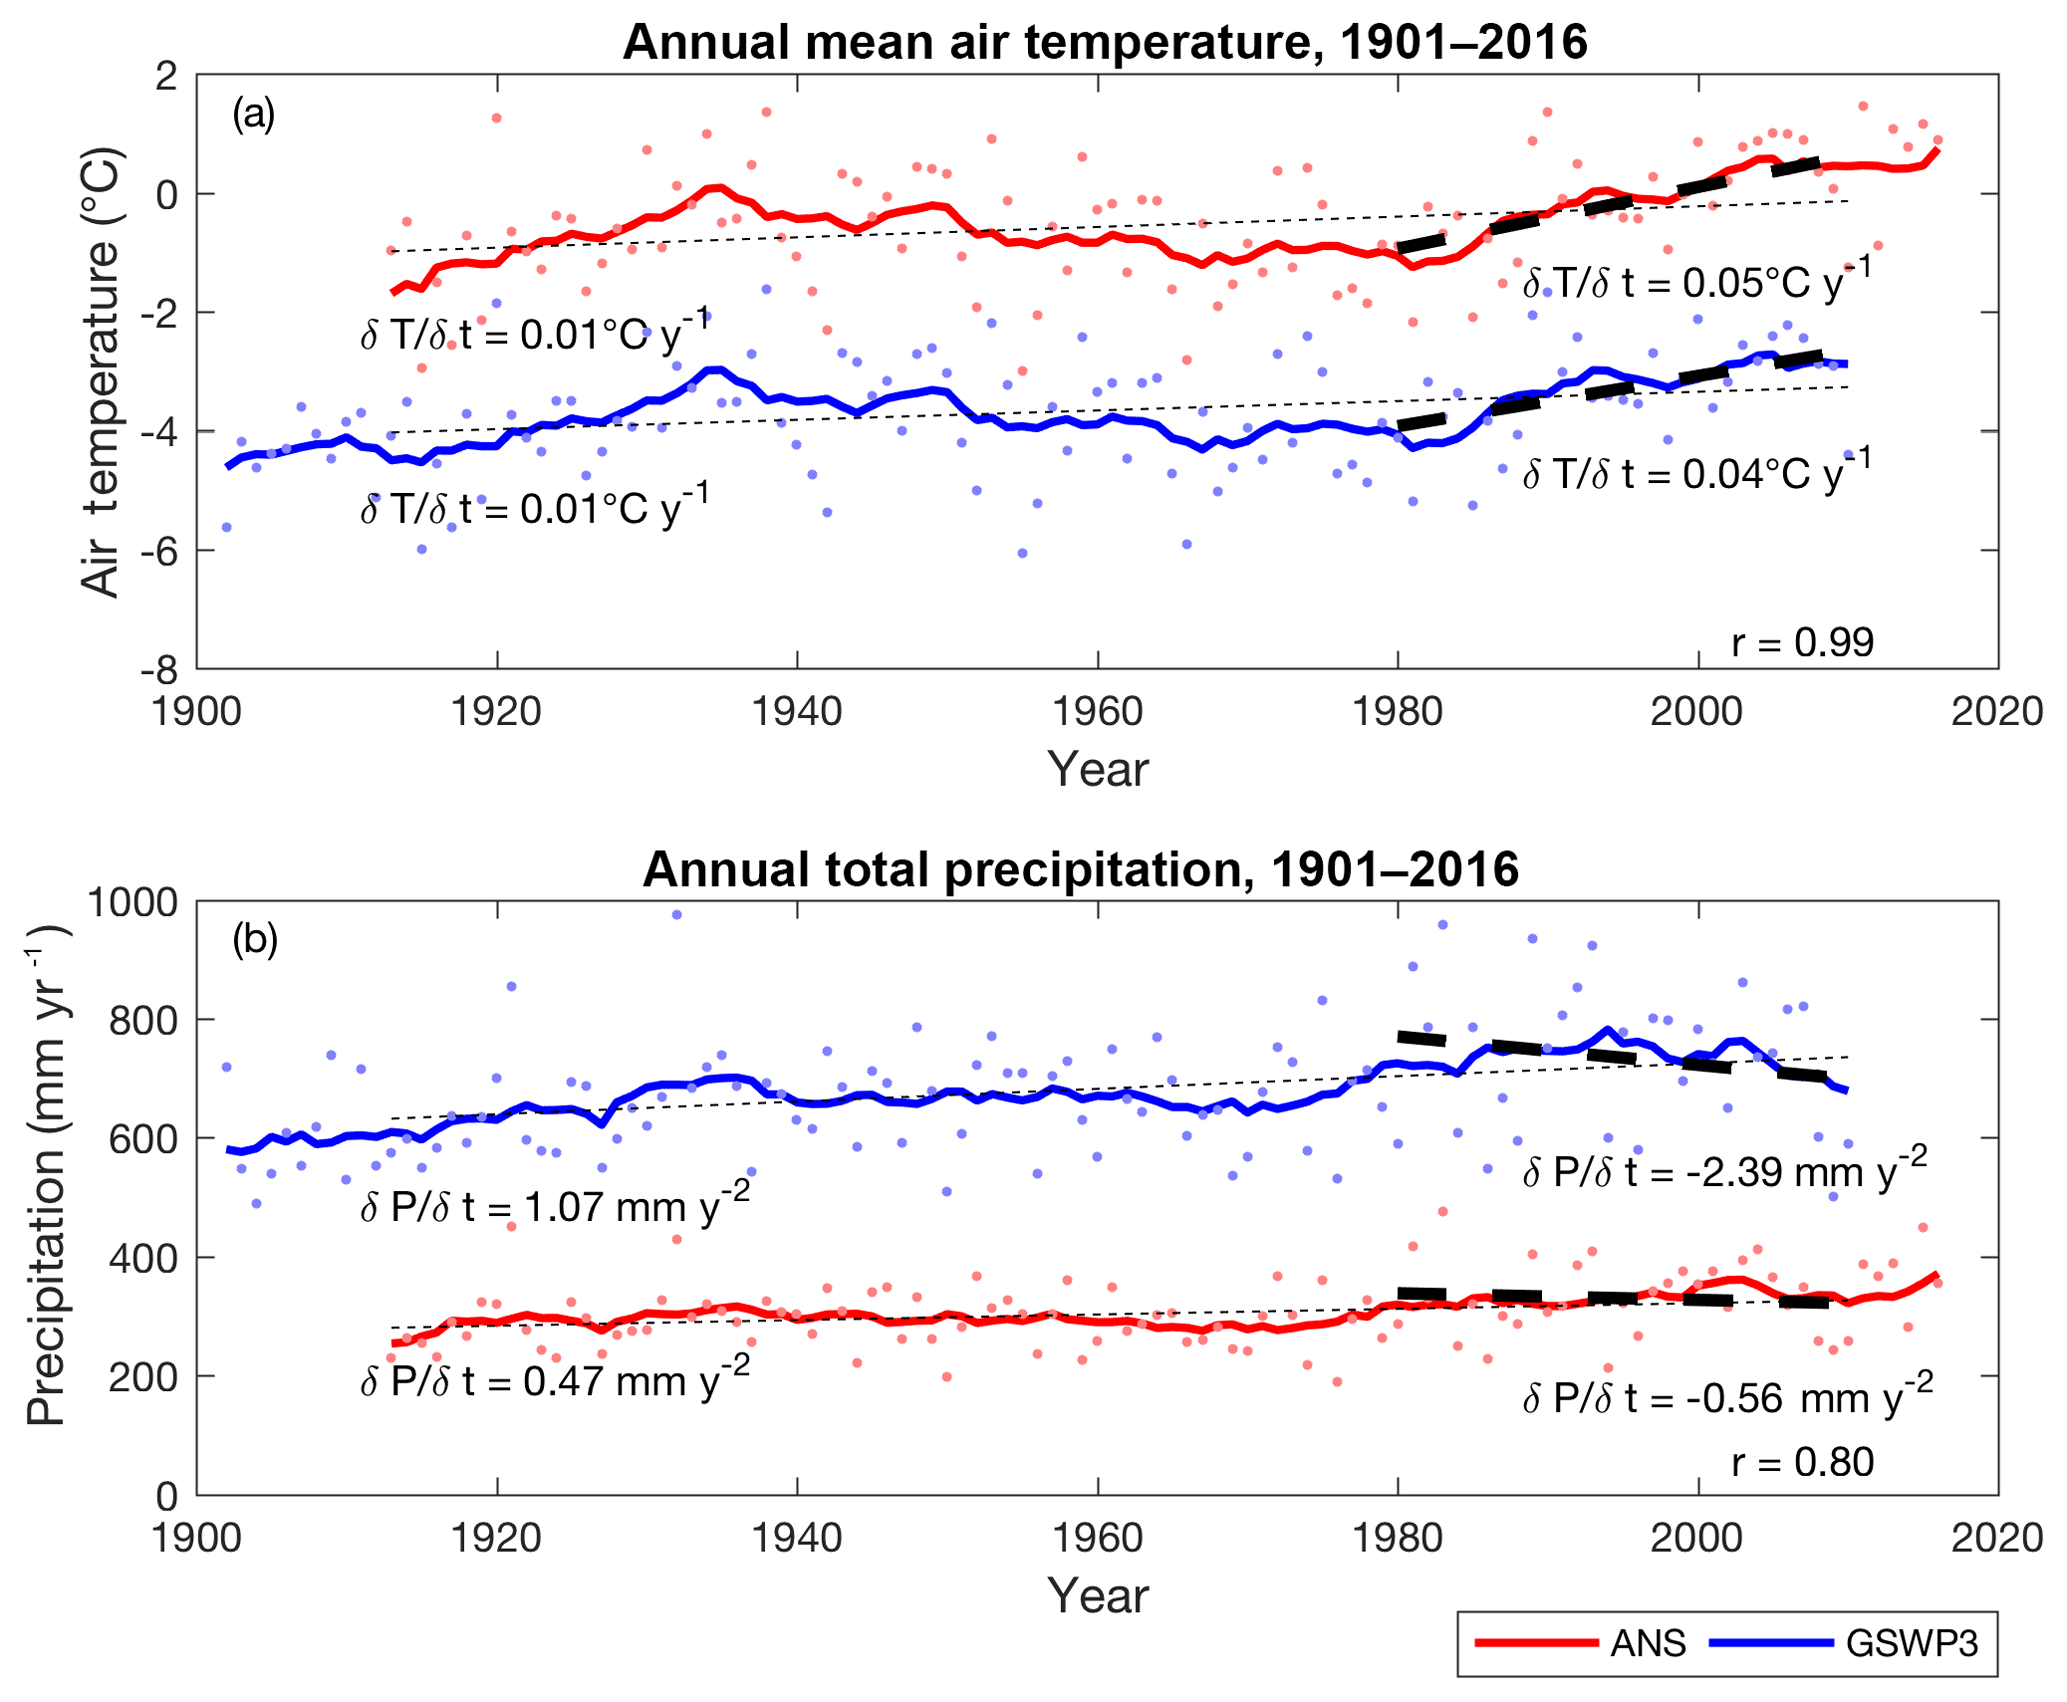
Figure 2Time series of air temperature (a) and precipitation (b) measured at ANS (red; years 1913–2016) and extracted from GSWP3 (blue; years 1901–2010). Dots are the annual means, and solid lines are the decadal moving averages of the corresponding annual means. Thin and thick dashed lines are the trends for the years 1913–2010 and the years 1980–2010, respectively. The inset r values are the correlation coefficients calculated between the two time series.
Similarly, the GSWP3 annual total precipitation data correlate well with ANS measurements (r=0.80) but have a wet bias of 380 mm yr−1 between 1913 and 2010 (Fig. 2b). An increasing trend in annual total precipitation was recorded in both time series from the early 20th century to present (0.47 mm yr−2 (ANS) and 1.07 mm yr−2 (GSWP3)), although a decreasing trend was found from 1980 to 2010 (−0.56 mm yr−2 (ANS) and −2.39 mm yr−2 (GSWP3)).
The seasonal cycle of the GSWP3 monthly mean air temperature also matches that measured at the ANS, with a very high correlation coefficient (r=0.99; Fig. 3a). The underestimation bias and interannual variability of GSWP3 air temperature are greater in winter (maximum underestimate in December, at −4.52 ∘C with interannual variability of 3.53 ∘C) and smaller in summer (minimum underestimate in July, at −1.52 ∘C with interannual variability of 1.65 ∘C), respectively.
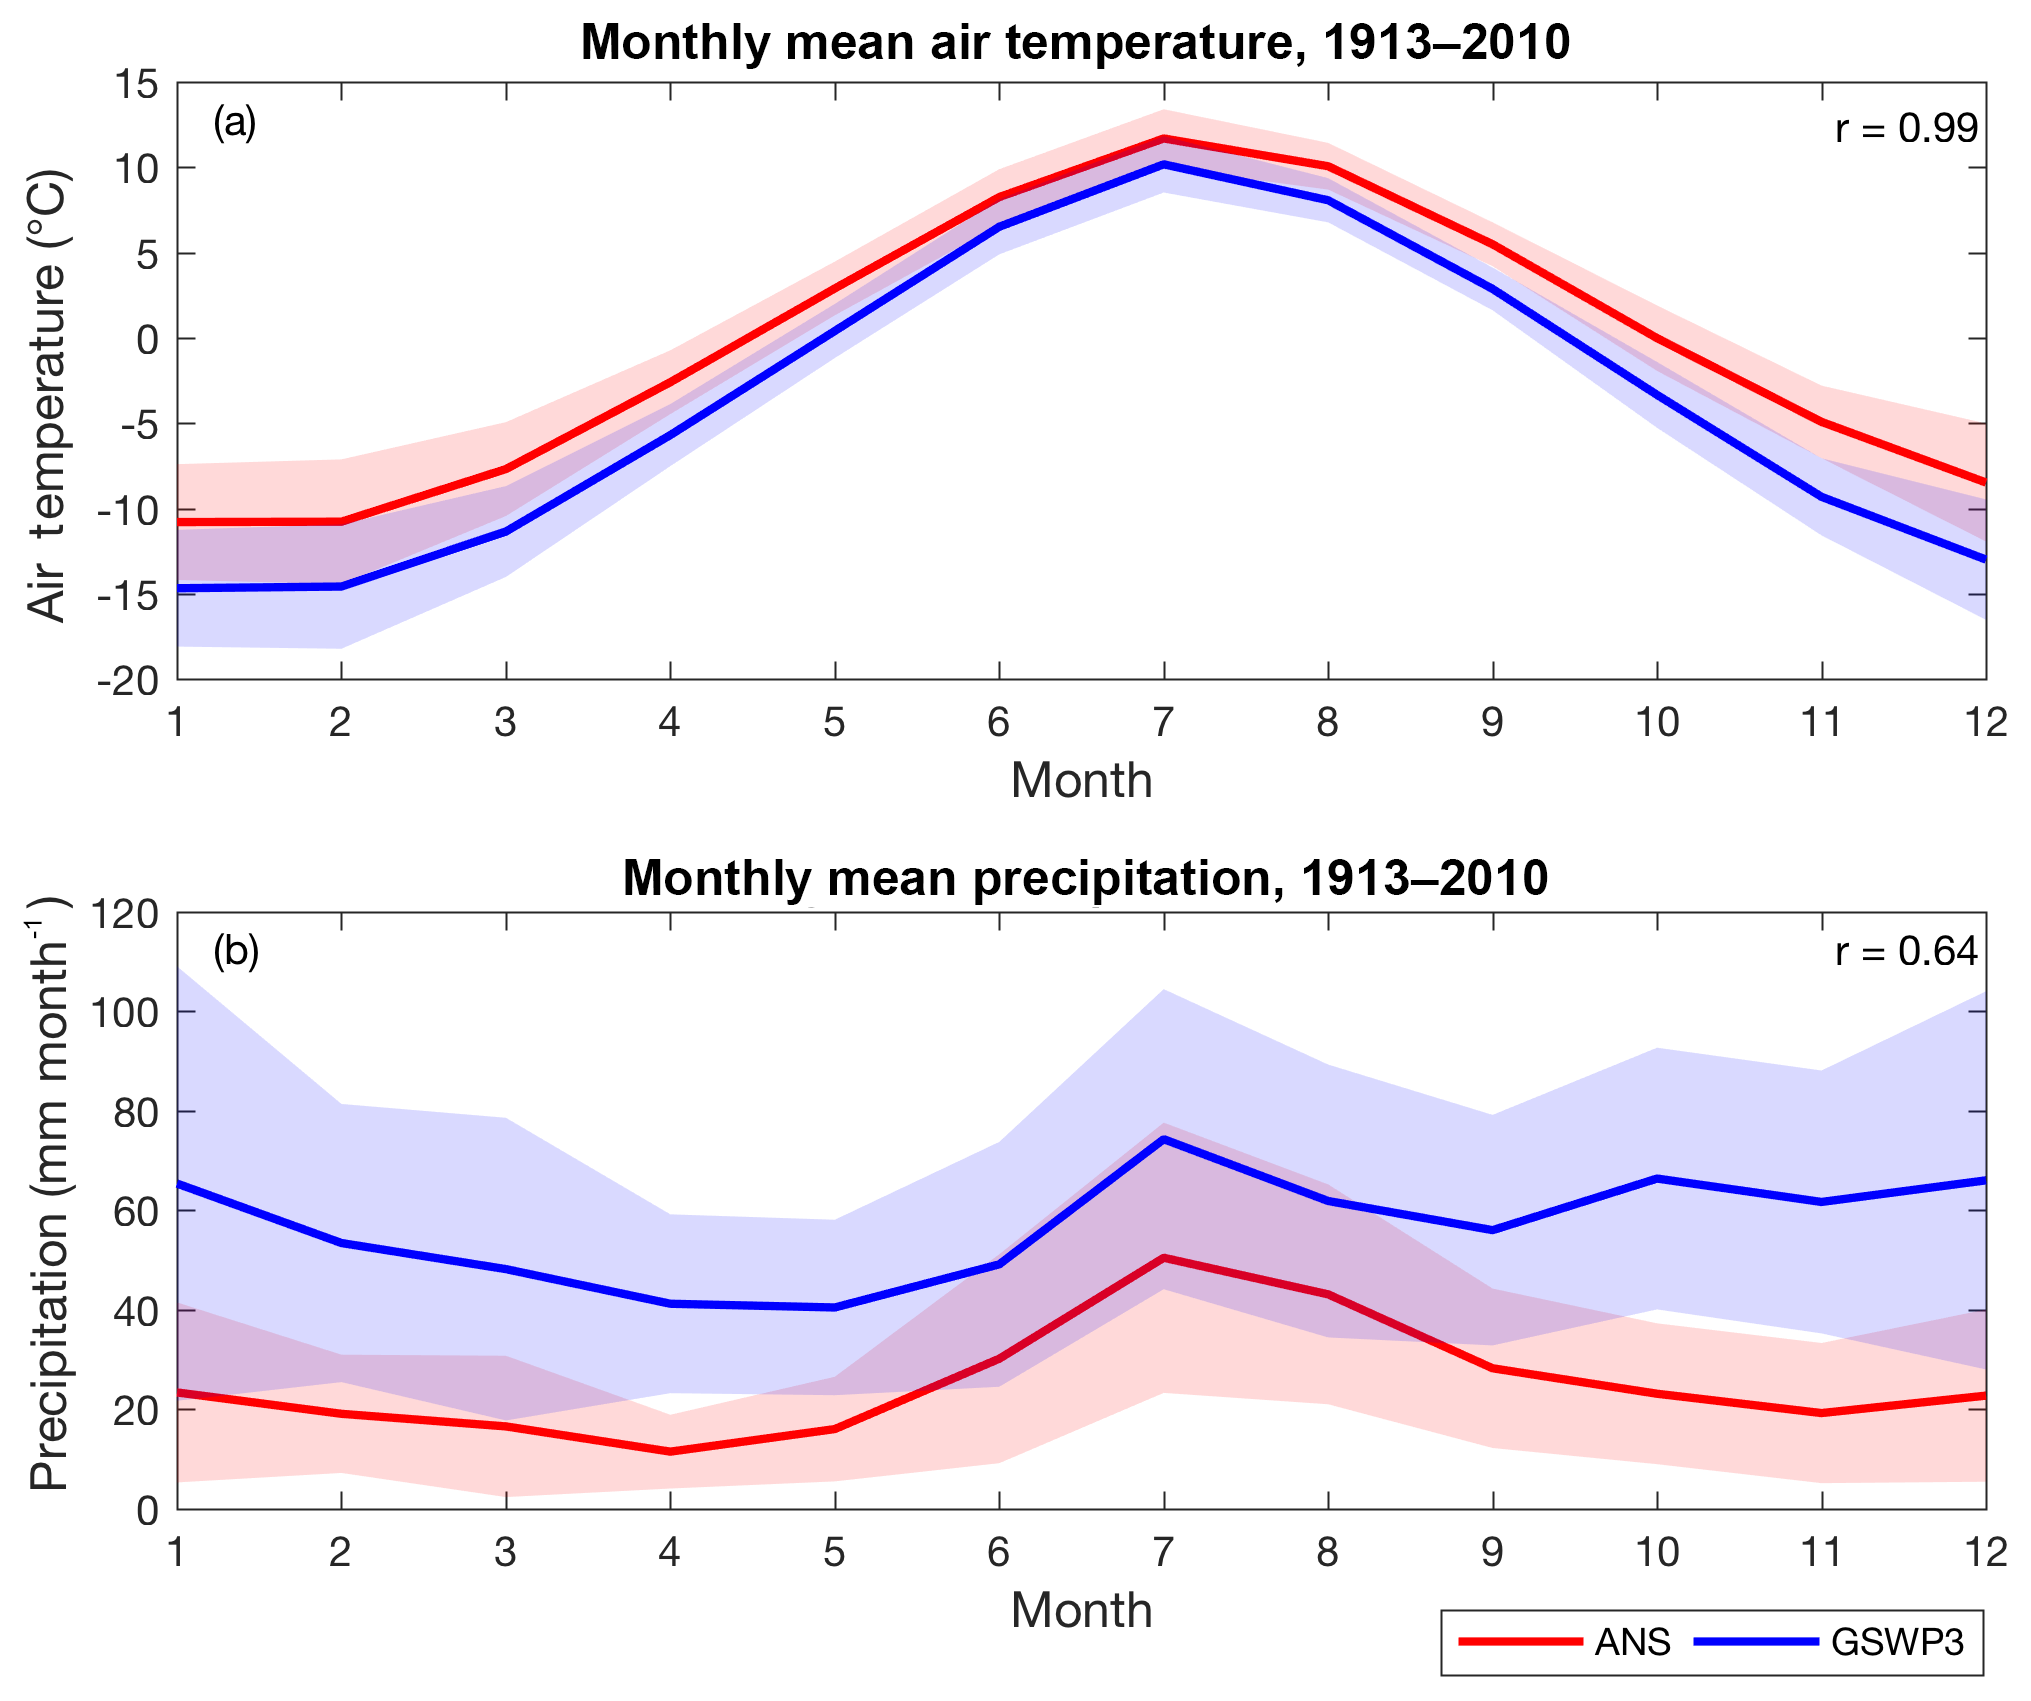
Figure 3Monthly mean air temperature (a) and precipitation (b) measured at ANS (red) and extracted from GSWP3 (blue). The shaded area is the interannual variability for the corresponding dataset, represented by the standard deviations calculated for each month. The inset r values are the correlation coefficients calculated between the two time series.
The magnitude and interannual variability of the GSWP3 monthly mean precipitation are comparable between winter and summer, while the ANS measurements exhibit stronger seasonality with lower magnitudes during winter. Despite the differences found in seasonal patterns, a high correlation coefficient (r=0.64) was found between the monthly mean precipitation extracted from GSWP3 and the ANS measurements. The overestimation of monthly mean precipitation was greatest in December (43.25 mm month−1) and smallest in August (18.75 mm month−1).
These comparisons suggest that GSPW3 air temperature and precipitation data reasonably capture measured seasonal and long-term trends over the past decades, but are biased cold and wet compared to observations, especially during winter. Similar cold and wet biases exist in CRUNCEP and ECMWF climate reanalysis datasets during our 2003 to 2007 study period (Fig. S1 in the Supplement). The annual mean air temperature and precipitation at the Stordalen Mire for the years 2003 to 2007 were −2.49 ∘C and 795.09 mm yr−1; −2.46 ∘C and 708.60 mm yr−1; and C and 765.67 mm yr−1 in the GSWP3, CRUNCEP, and ECMWF climate reanalysis datasets, respectively.
3.2 Model testing
3.2.1 Thaw depth
We first evaluated ecosys against observations using bias-corrected climate forcing (i.e., the CTRL simulation). Predicted thaw depth agrees well with measurements collected from 2003 to 2007 for all examined peatland types (Fig. 4), with a correlation coefficient of 0.95, 0.87, and 0.41 in the palsa, bog, and fen, respectively. Both simulations and observations show that the rate of thaw depth deepening in the summer varies with peatland type (i.e., relatively slow, moderate, and rapid in the palsa, bog, and fen, respectively).
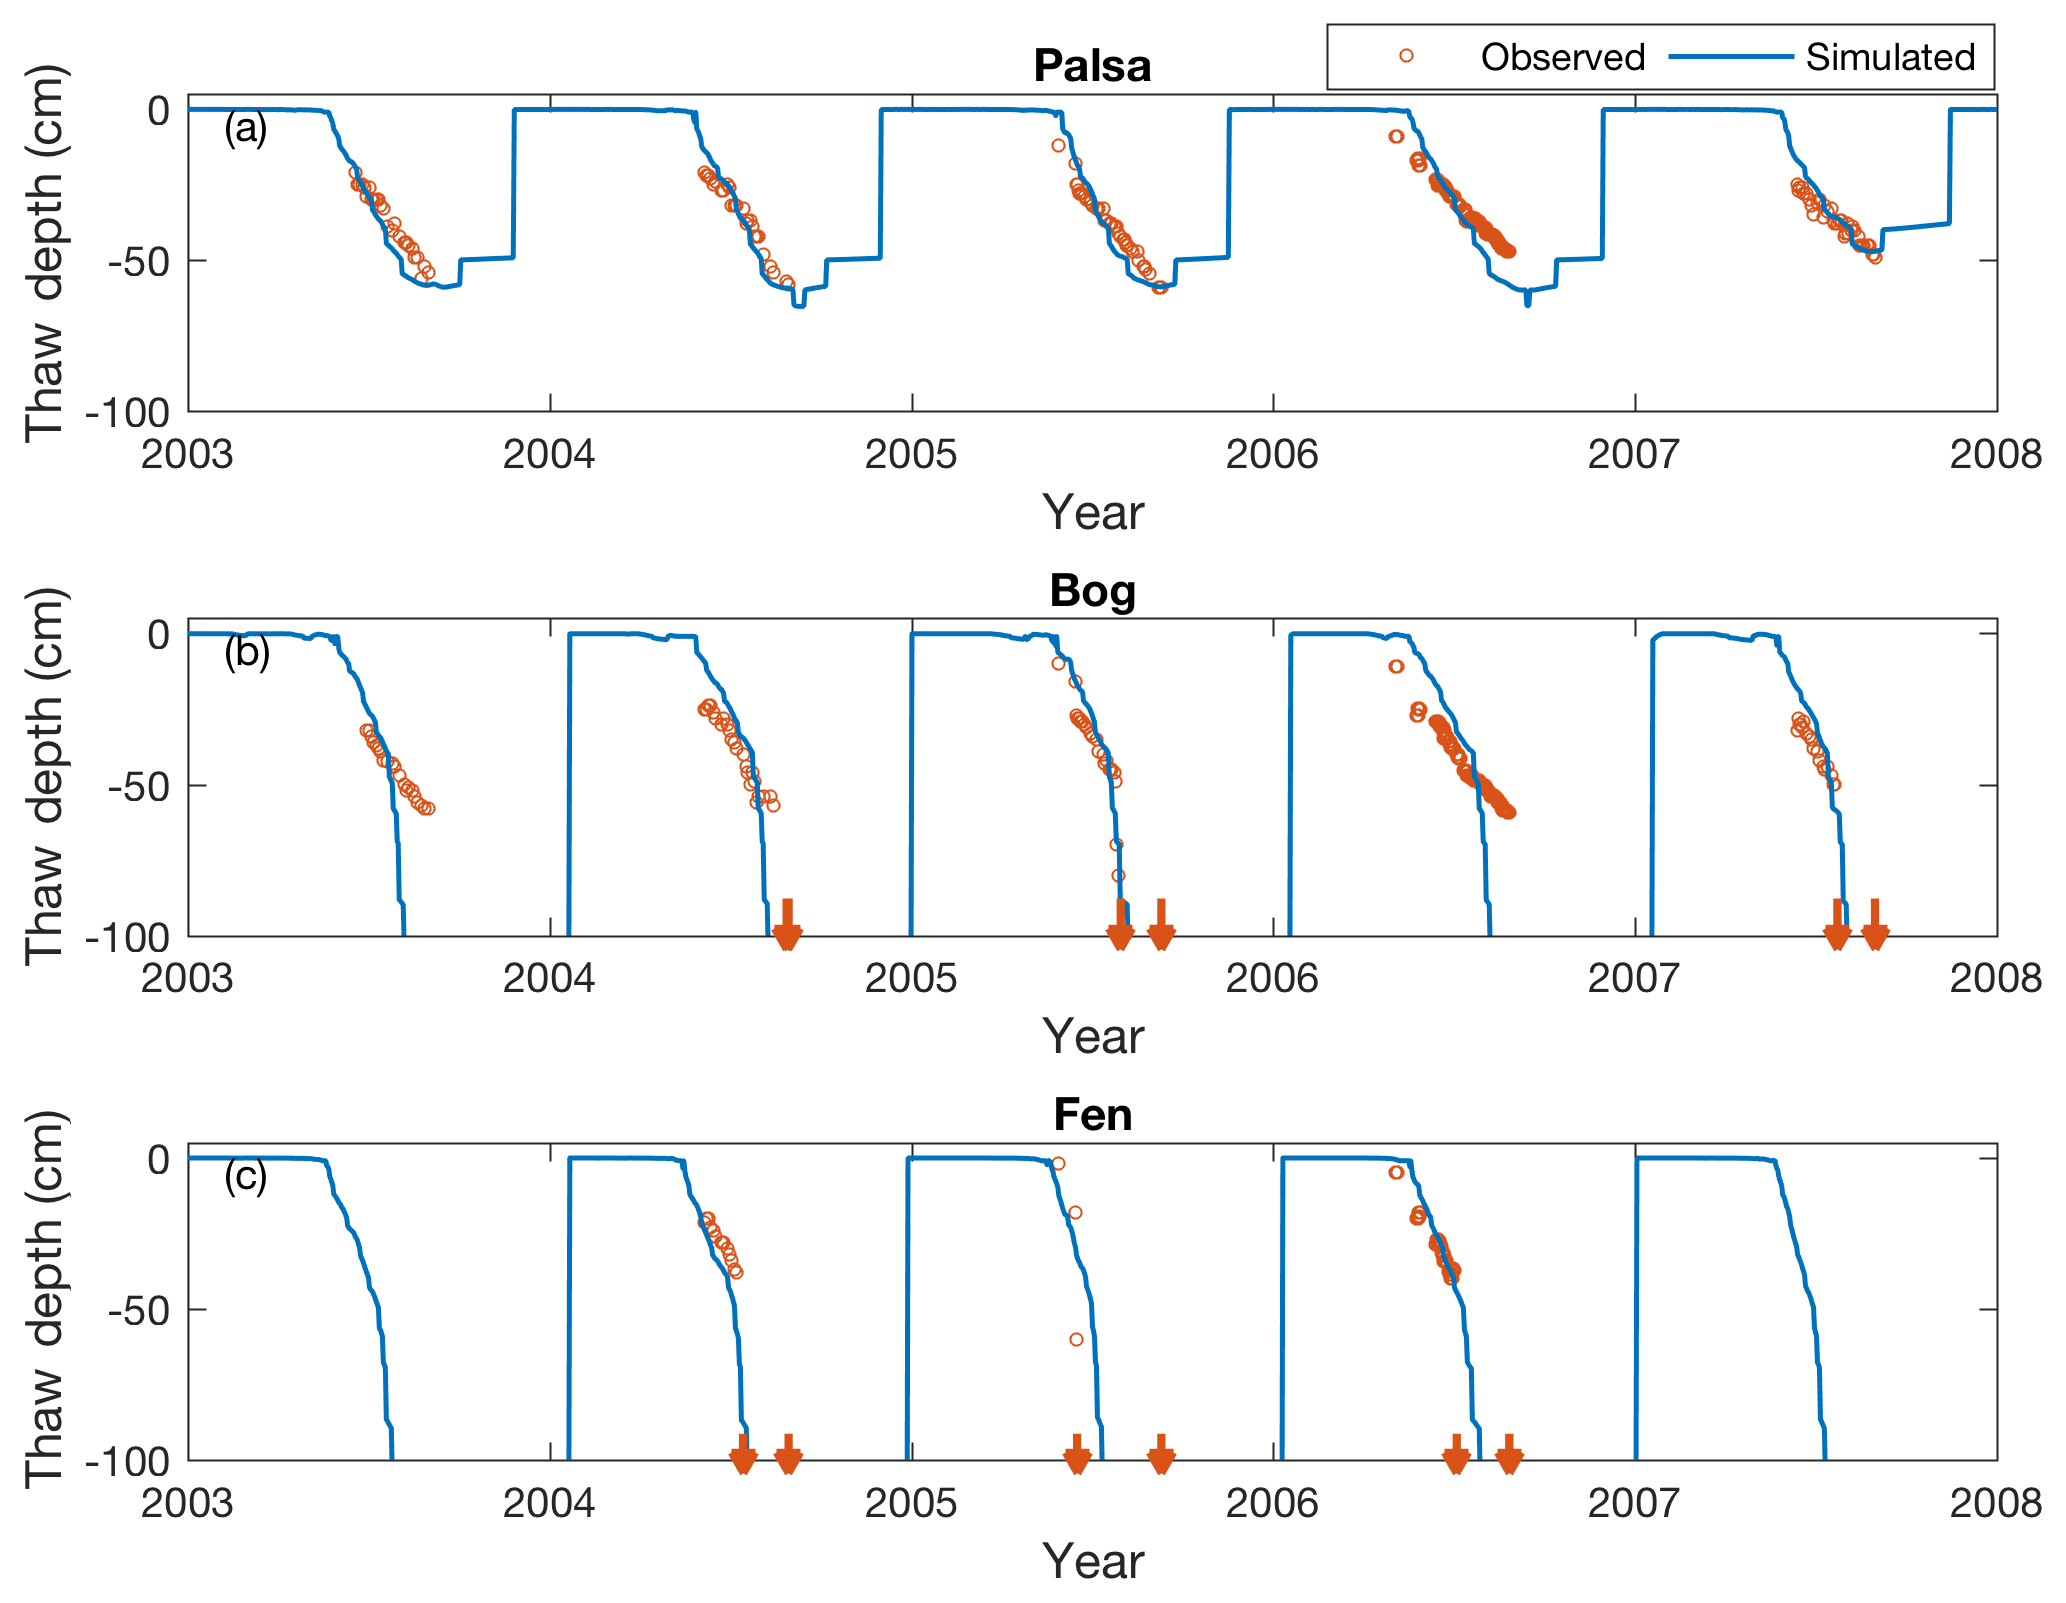
Figure 4Simulated (solid lines) and measured (open circles) seasonal dynamics of thaw depth in the palsa (a), bog (b), and fen (c) sites from 2003 to 2007. Downward arrows indicate the time when measured thaw depth exceeds 90 cm for a measurement year.
Predicted and observed maximum thaw depths (i.e., ALD) in the intact permafrost palsa were between 45 and 60 cm in September. In the partly thawed bog, the simulated thaw depth is slightly shallower than that observed before August. The simulated bog thaw depth exceeds 90 cm by the end of August, which matches the time when measured thaw depth reaches its maximum. In contrast, the thaw depth exceeds 90 cm nearly 1 month earlier in the fen. The patterns of thawing permafrost presented here are consistent with Deng et al. (2014), who simulated the same site using the DNDC model.
3.2.2 CO2 exchanges
The daily net ecosystem exchange (NEE) simulated in the CTRL simulation reasonably captures observed seasonal dynamics from 2003 to 2007 for all the examined peatland types (Fig. 5). The simulations and observations generally showed net CO2 uptake (with some episodic CO2 emissions) during summer and release during winter. The observations and simulations also showed large CO2 emissions in the palsa site during the fall of 2004. Simulated fall CO2 bursts in the three sites in other years could not be confirmed because of a lack of observations during these periods. Similar to the patterns reported in Raz-Yaseef et al. (2016), some episodic CO2 emission pulses were simulated as surface ice thaws in spring, but there were no measurements to confirm those events. The correlation coefficients of the simulated and observed daily NEE ranged from 0.58 to 0.60, and most of the discrepancies between the simulations and observations were within the ranges of NEE variability measured at different subsites (automated chambers) within the same peatland type. The simulated CO2 uptake rates in the bog were greater than the observations in summer, which could be due to overestimated plant biomass or overestimated CO2 uptake rate per plant biomass. However, we currently do not have data to examine the cause of this overestimation because the CO2 flux derived from automated chambers only represents the aggregated results of all controlling factors.
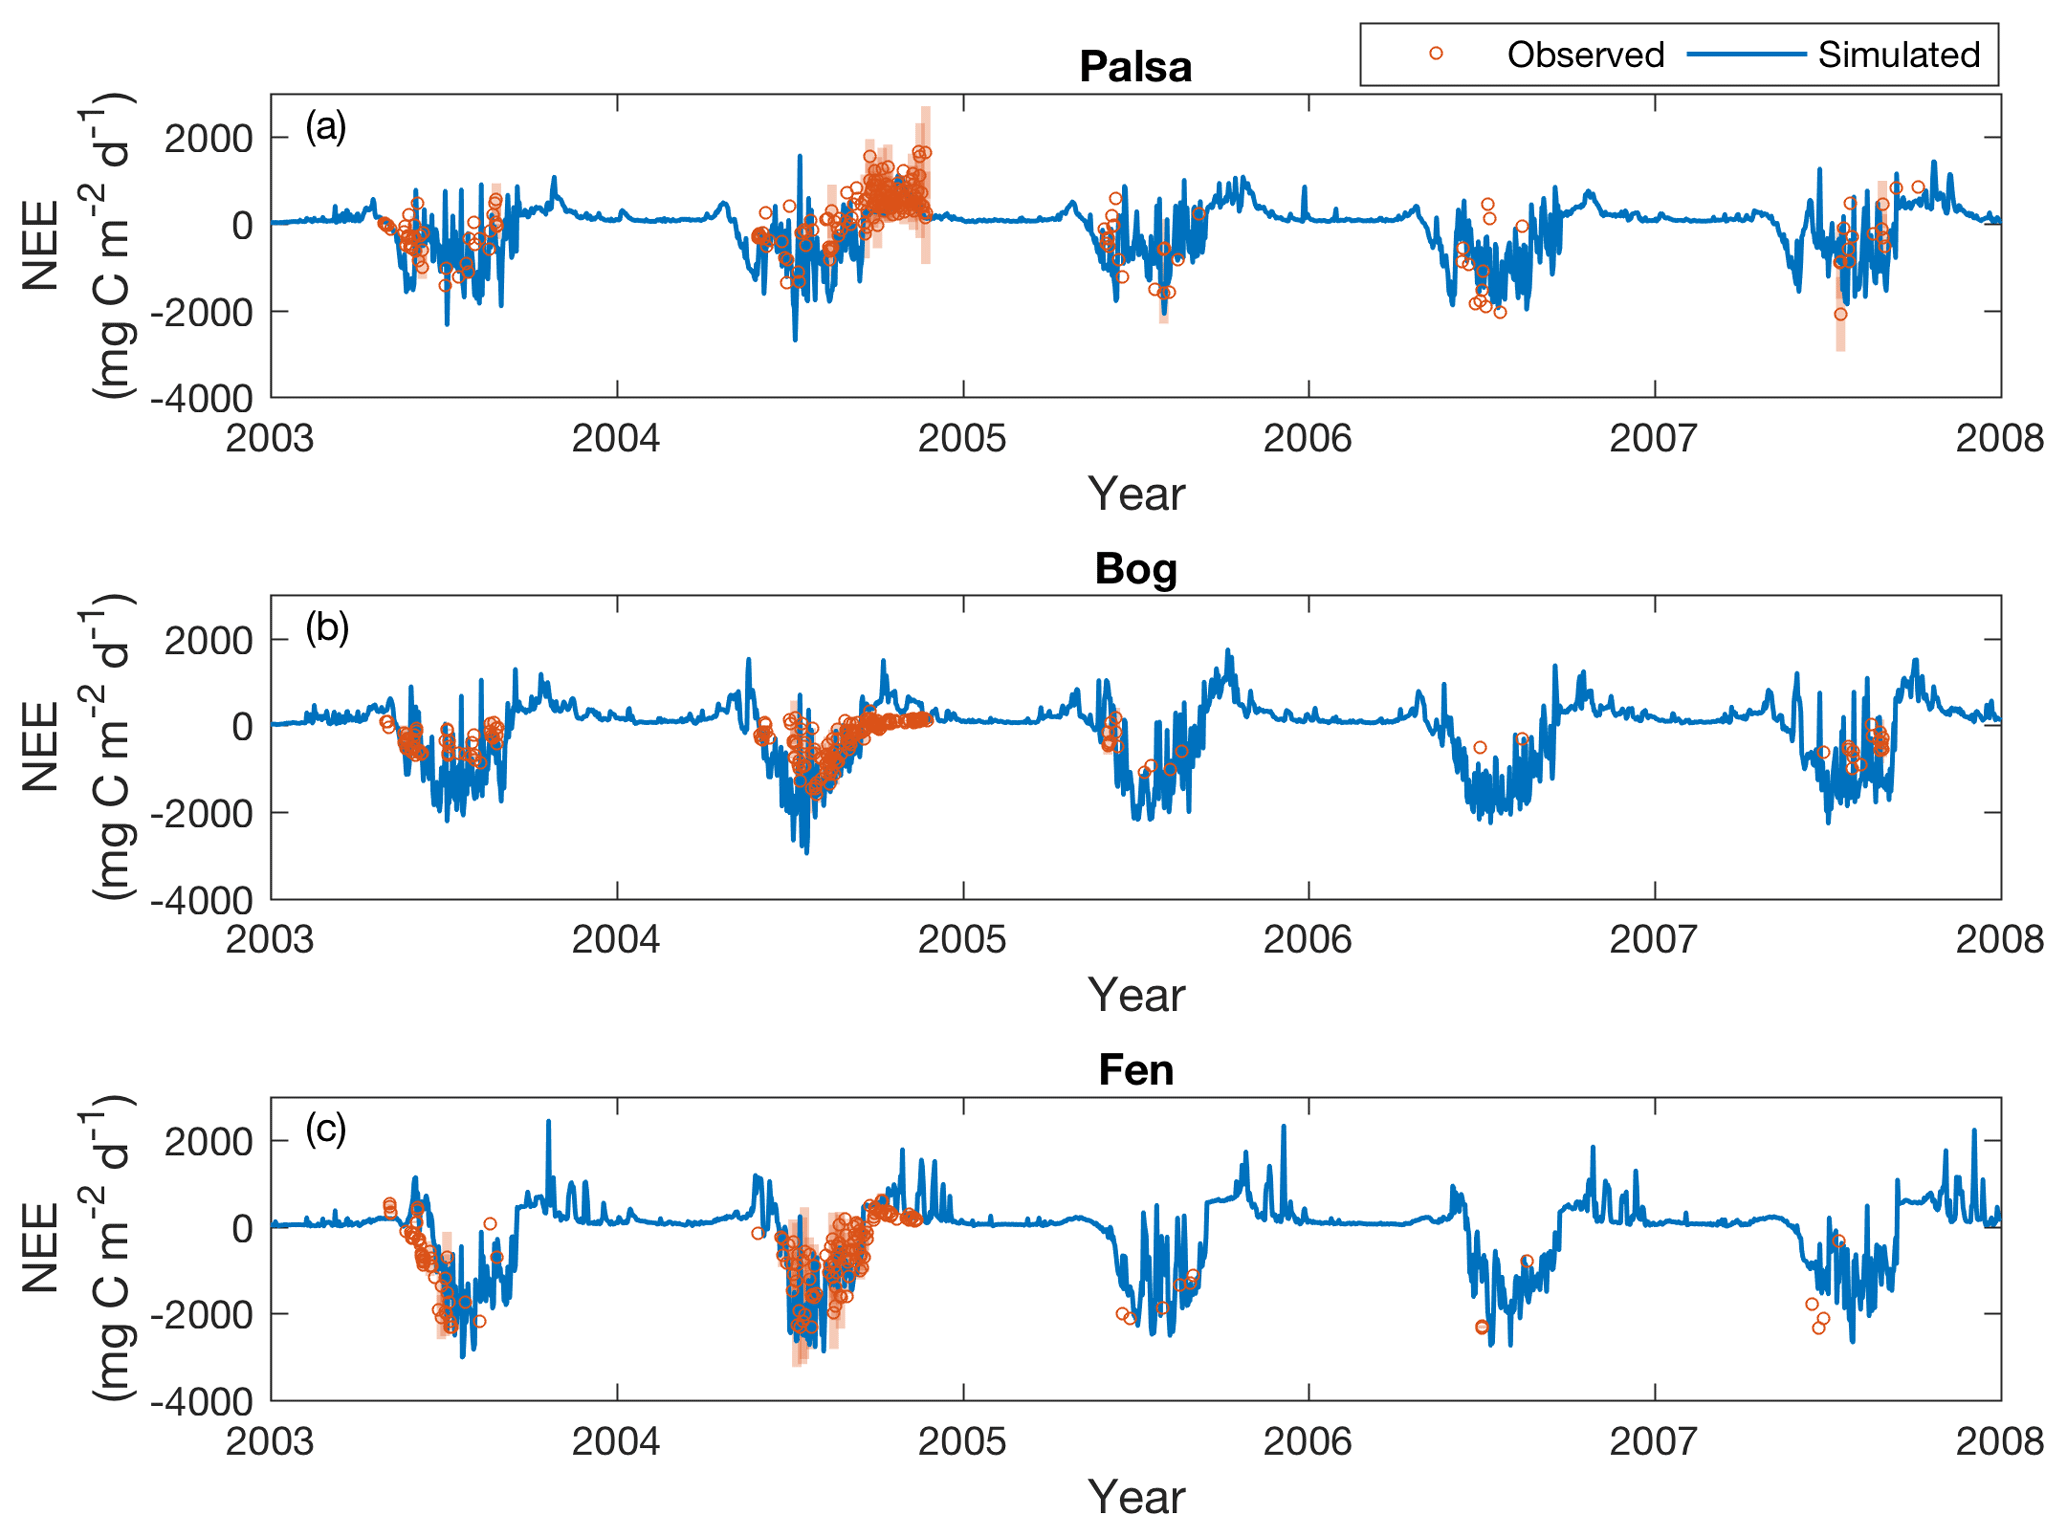
Figure 5Simulated (solid lines) and measured (open circles) daily CO2 exchanges (NEE) in the palsa (a), bog (b), and fen (c) sites from 2003 to 2007. Shaded bars are the standard deviations of daily NEE measured across subsites under each peatland type. Positive and negative values indicate effluxes from and influxes to the site, respectively.
As described in Sect. 2.2, simulated CO2 exchanges were evaluated for 3-hourly and daily time steps when quality-controlled measurements were available (R2 values and relative root mean squared errors (RRMSEs) shown in Table 2). Simulated NEE is in reasonable agreement with the 3-hourly NEE measurements, with RRMSEs ranging from 8.4 % to 19.1 %. Model comparisons with observations were generally poorer at daily time steps, although the calculated RRMSEs were comparable to those reported in Deng et al. (2014). We suspect these differences resulted from uncertainty in determining an accurate observed daily NEE that is representative of the entire peatland type. This may be due to (1) limited coverage of daily data points (less than 14 % across the study period; Table 1) due to a lack of continuous quality-controlled 3-hourly measurements and (2) the large variability of daily NEE ranges measured at different subsites within the same peatland type (Fig. 5). Our results thus indicate that NEE is affected by thaw stage (Bäckstrand et al., 2010; Deng et al., 2014) and fine-scale spatial heterogeneity of the system. More detailed measurements with higher spatial and temporal resolutions within the same peatland type would be necessary to characterize the effects of this type of heterogeneity.
Table 2Evaluation of the 3-hourly and daily CO2 and CH4 exchanges simulated in the palsa, bog, and fen sites.
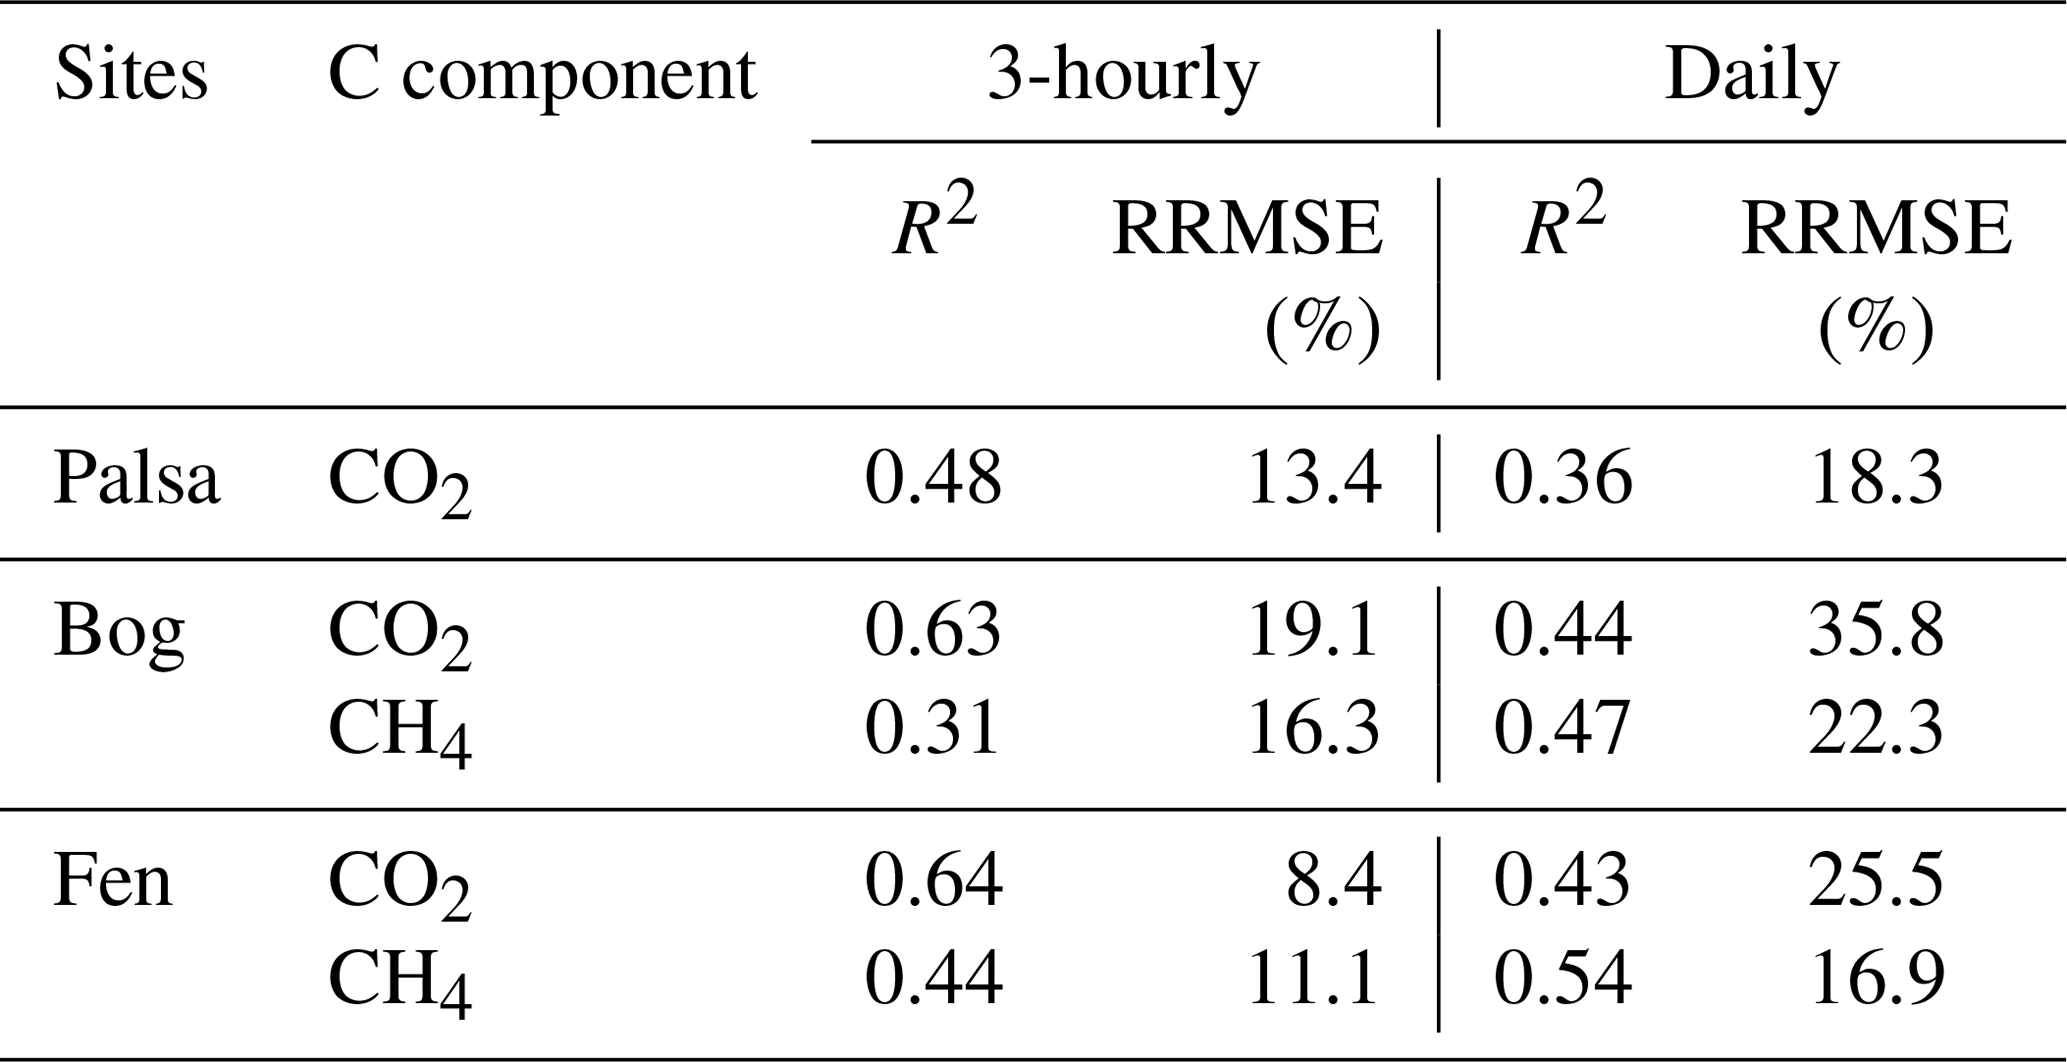
Note that RRMSE is the relative root mean squared error.
3.2.3 Water table depth and CH4 exchanges
Simulated water table depth generally captures observed seasonal patterns measured in the bog and fen sites from 2003 to 2007 (Fig. 6a, c). During summer, the predicted bog water table depth fluctuates around the ground surface (−7 to −1 cm), and the predicted water table depth is at or above the ground surface in the fen. Water table depths simulated by ecosys are generally higher than measured in the bog, where measured water table depths are often below the ground surface with greater seasonal variability. Simulated fen water table depths have better overall fit to observations, being higher (∼5 cm) than measurements in 2003 and 2004, close to measurements in 2005 and 2006, and slightly deeper (∼2 cm) than measurements in 2007. These differences in modeled and observed water table depth could be driven by the limitations of our one-dimensional column simulation that could not resolve topographic effects and thus hinder the variations of water table depth, which is a particular issue in simulating the dynamic water table of the bog. For example, no excessive water could be transported to the neighboring grids to deepen local water table depth under our current model configuration. A multidimensional simulation that includes realistic topographic effects could help improve the representation of water table dynamics, and estimates of the measurement uncertainty would help facilitate the assessment of simulation bias.
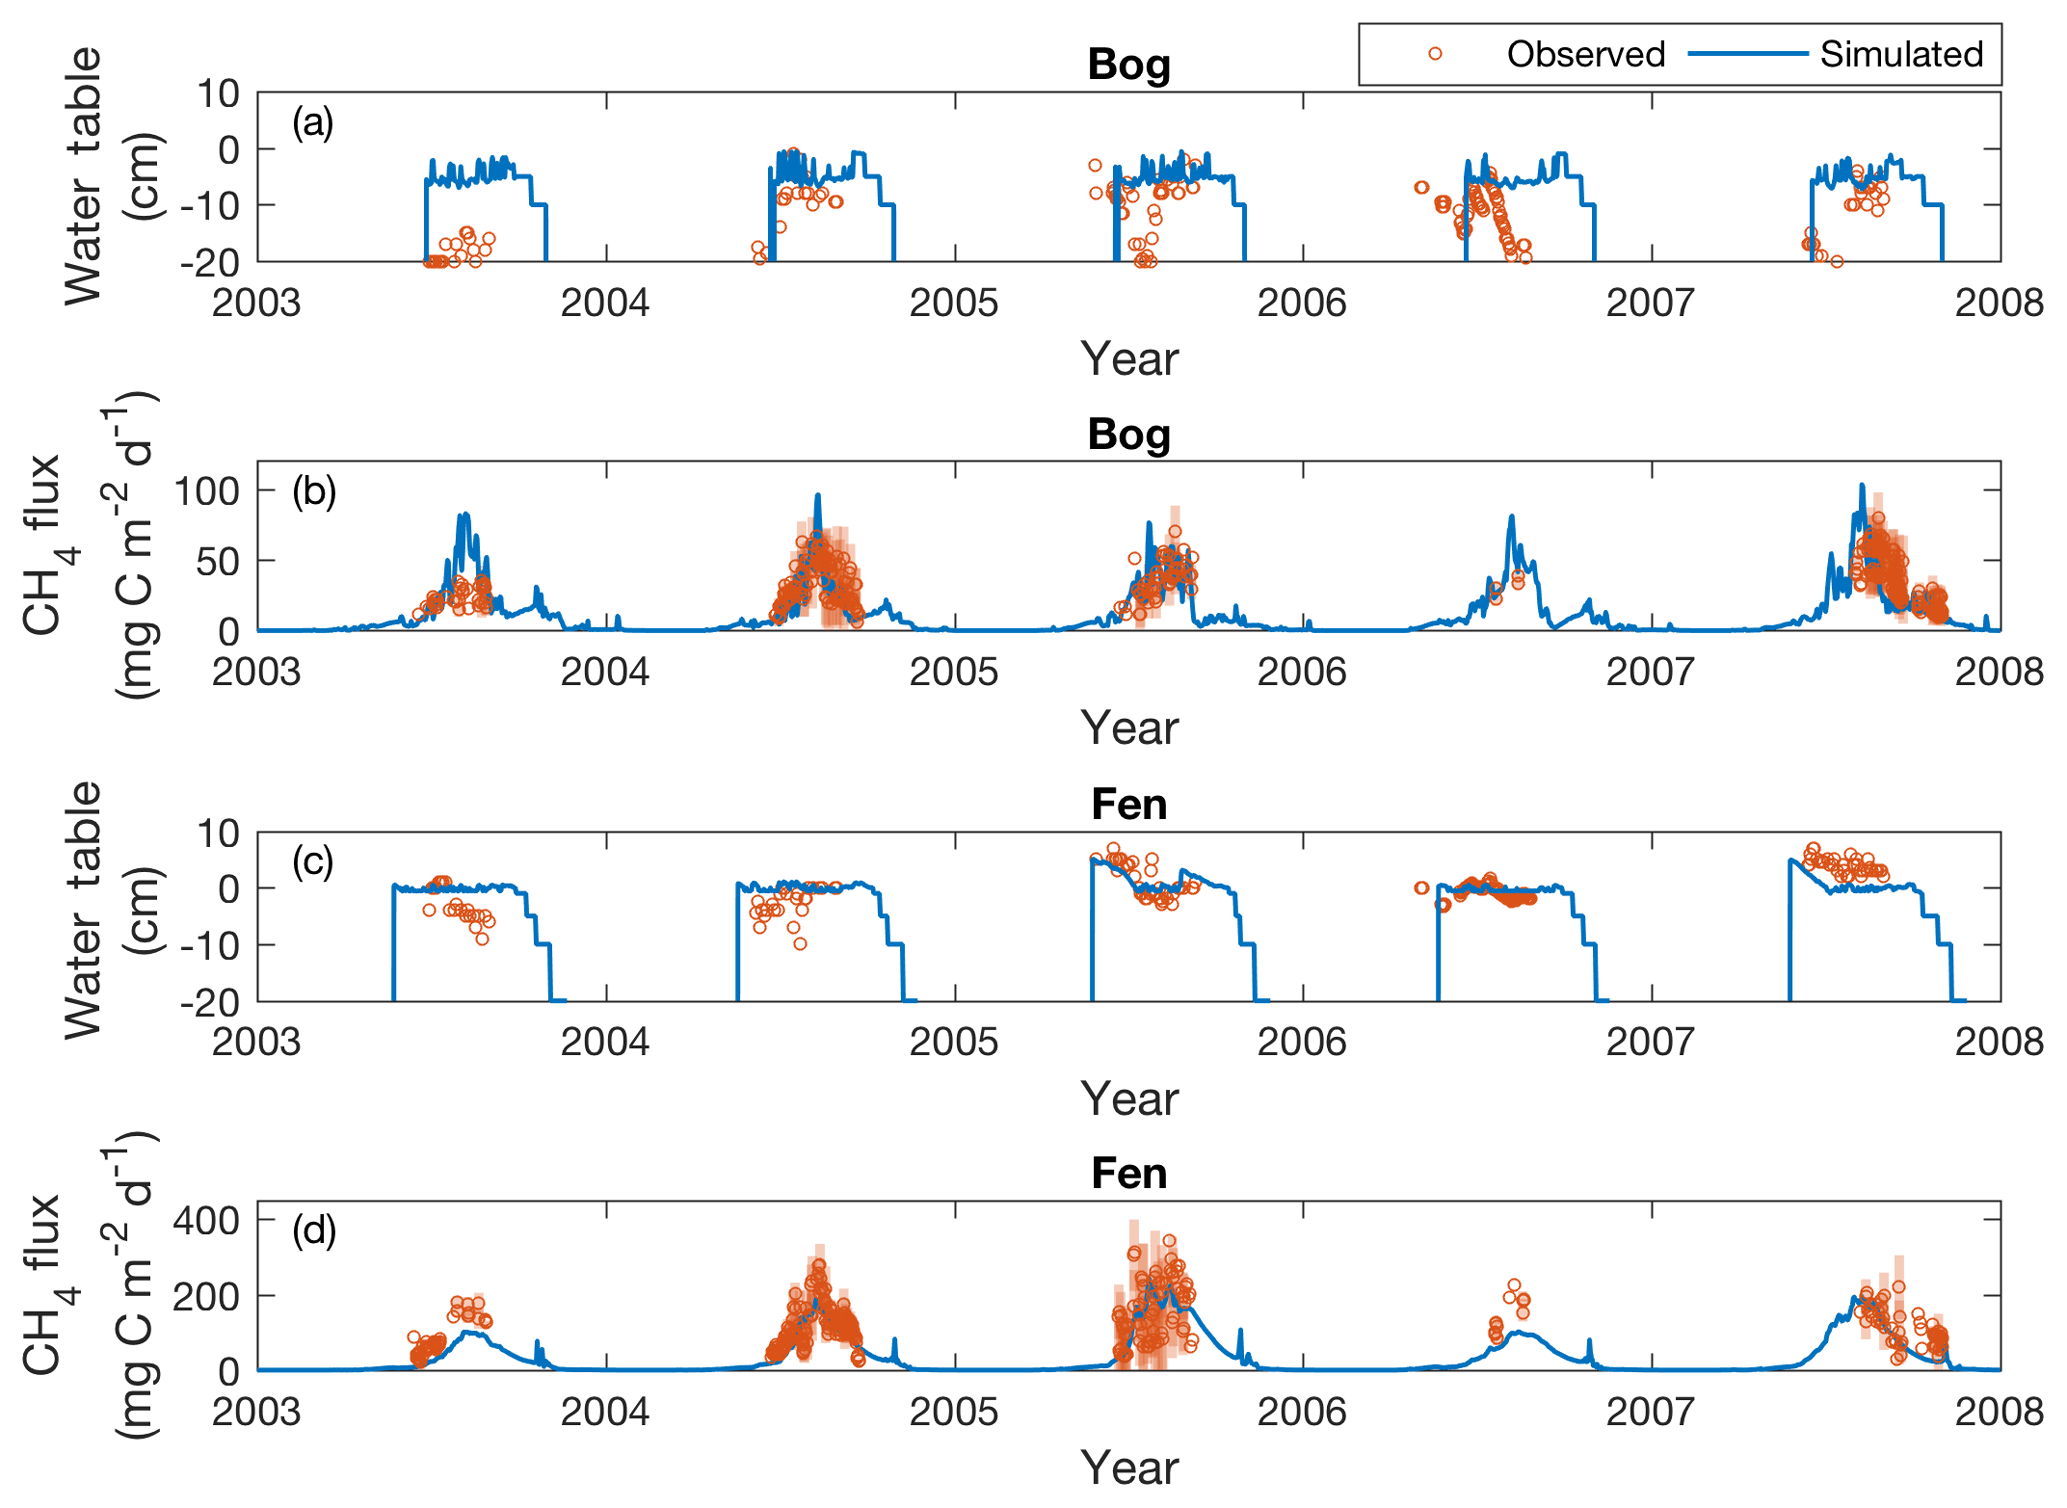
Figure 6Simulated (solid lines) and measured (open circles) water table depths and daily CH4 emissions at the bog and fen from 2003 to 2007. Shaded bars are the standard deviations of the daily CH4 emissions measured across the subsites under each peatland type.
Simulated and measured daily CH4 exchanges correlate reasonably well in the bog (r=0.49) and well in the fen (r=0.65) across the study period (Fig. 6b, d). Both the simulations and observations have stronger CH4 emissions during summer, with peak emissions in late summer. Some episodic CH4 emission pulses (Mastepanov et al., 2008) were simulated during shoulder seasons, and the simulated amount of post-growing season CH4 emissions agrees well with those measured in 2007.
Most of the discrepancies between simulated and observed CH4 emissions were within the variability of measurements across subsites within the same peatland type. The 3-hourly and daily RRMSEs ranged from 11.1 % to 22.3 % (Table 2), and the daily RRMSEs were comparable to results presented in Deng et al. (2014). Our results show that model evaluation of CH4 emissions with finer temporal resolution observations is not necessarily superior to evaluation with coarser temporal resolution, as compared to the NEE counterpart, which could be related to comparatively lesser CH4 emission variability measured across subsites within the same peatland type (Fig. 6b, d).
3.3 Variability across the permafrost thaw gradient
Thaw rate and ALD increase along the thaw gradient (i.e., palsa to bog to fen), and landscape variations are generally greater than simulated interannual variability (Fig. 7a). Maximum carbon uptake also increases along the thaw gradient, and variations across the landscape are comparable with simulated intraseasonal and interannual variabilities (Fig. 7b). The simulated mean seasonal cumulative NEE values were calculated based on the seasonality identified in Bäckstrand et al. (2010) to help facilitate the intercomparison of carbon budgets estimated at the Stordalen Mire and to better capture the actual seasonality recorded at the study site. The results show that the magnitude of mean growing season CO2 uptake is highest in the fen and lowest in the palsa (Table 3). The same rank applies to the magnitude of mean CO2 emissions over the non-growing season, although differences across the thaw gradient are smaller.
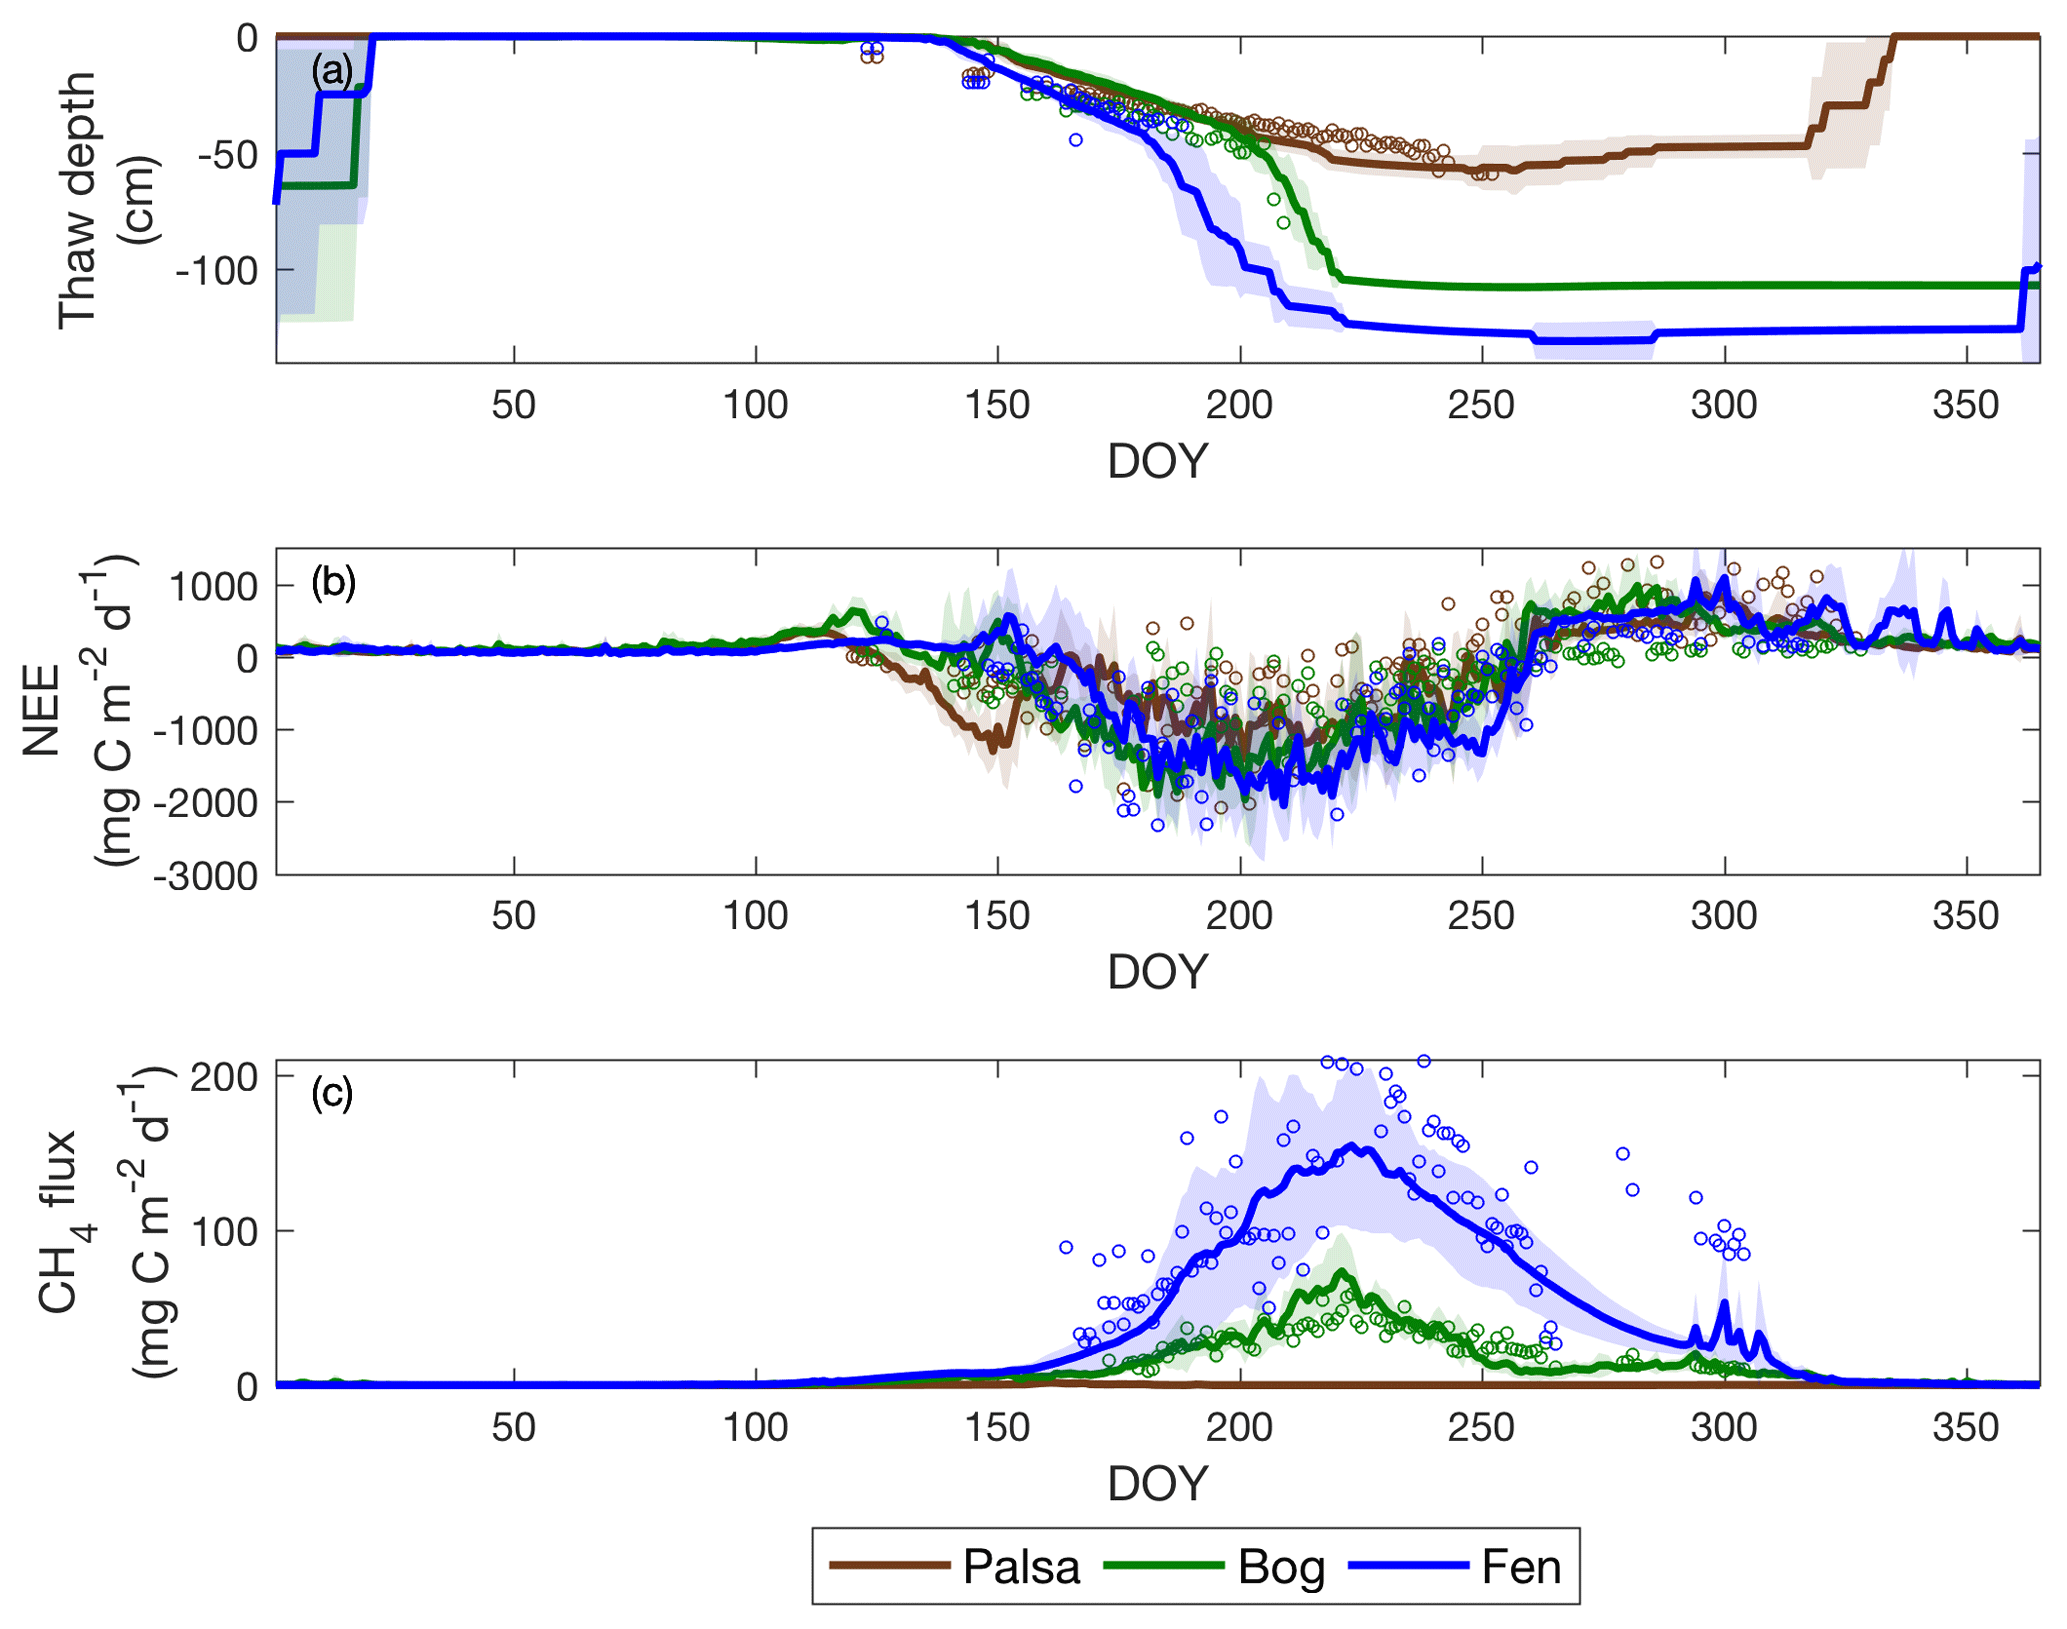
Figure 7Daily thaw depth (a), daily NEE (b), and daily CH4 (c) exchanges for the three sites from 2003 to 2007. Solid lines and open circles are the simulated and measured interannual means for each day of the year, respectively. The shaded area is the simulated interannual variability for the corresponding dataset, represented by the standard deviations calculated for each day of the year. Positive and negative carbon flux values indicate effluxes from and influxes to the site, respectively.
Table 3Means and standard deviations of cumulative CO2 and CH4 exchanges simulated in the palsa, bog, and fen during the period 2003 to 2007.

Note that all gas exchanges are in units of g C m−2.
CH4 emission rates increase significantly along the thaw gradient, and the palsa site emissions are negligible (Fig. 7c). Mean cumulative CH4 emissions simulated in the fen are much higher than those in the bog, and most CH4 emissions occur during the growing season (Table 3). The higher CH4 emissions in the fen can be attributed to its faster seasonal thaw rate (Fig. 7a) and a water table depth close to the surface (Fig. 6c). Seasonal cumulative NEE and CH4 emissions from observations could not be accessed due to the lack of continuous quality-controlled carbon flux measurements during our study period (Table 1).
3.4 Climate sensitivity of permafrost thaw
3.4.1 Thaw responses to climate
Our results indicate that the ALD currently simulated in the bog and fen is around 108 and 130 cm, respectively. However, the maximum depth of our thaw depth measurements is 90 cm, which makes it difficult to evaluate our model performance on ALD simulation. Our results highlight the need to acquire measurements at deeper depth to resolve whether there is no permafrost currently remaining in the bog and fen or there is a talik with permafrost developed deeper than the simulated ALDs. Such information could be important in predicting microbial activity and thermokarst in permafrost peatlands (Schuur et al., 2015), but it may not significantly alter the effects of climate forcing uncertainty discussed in our study.
For each of the four sets of simulations with different climate forcing (Sect. 2.5), simulated mean ALD from 2003 to 2007 is always greatest in the fen and lowest in the palsa (Fig. 8). This consistent trend along the thaw gradient indicates that ALDs are largely regulated by their distinct ecological and hydrological conditions because all three sites had the same climate forcing in each set of simulations (i.e., CTRL, BIASED-COLD, BIASED-WET, and BIASED-COLD&BIASED-WET). Therefore, the palsa, bog, and fen have different resilience against the changes in climate forcing, and this type of ecosystem resilience plays an important role in determining ALD under changes in climate conditions.
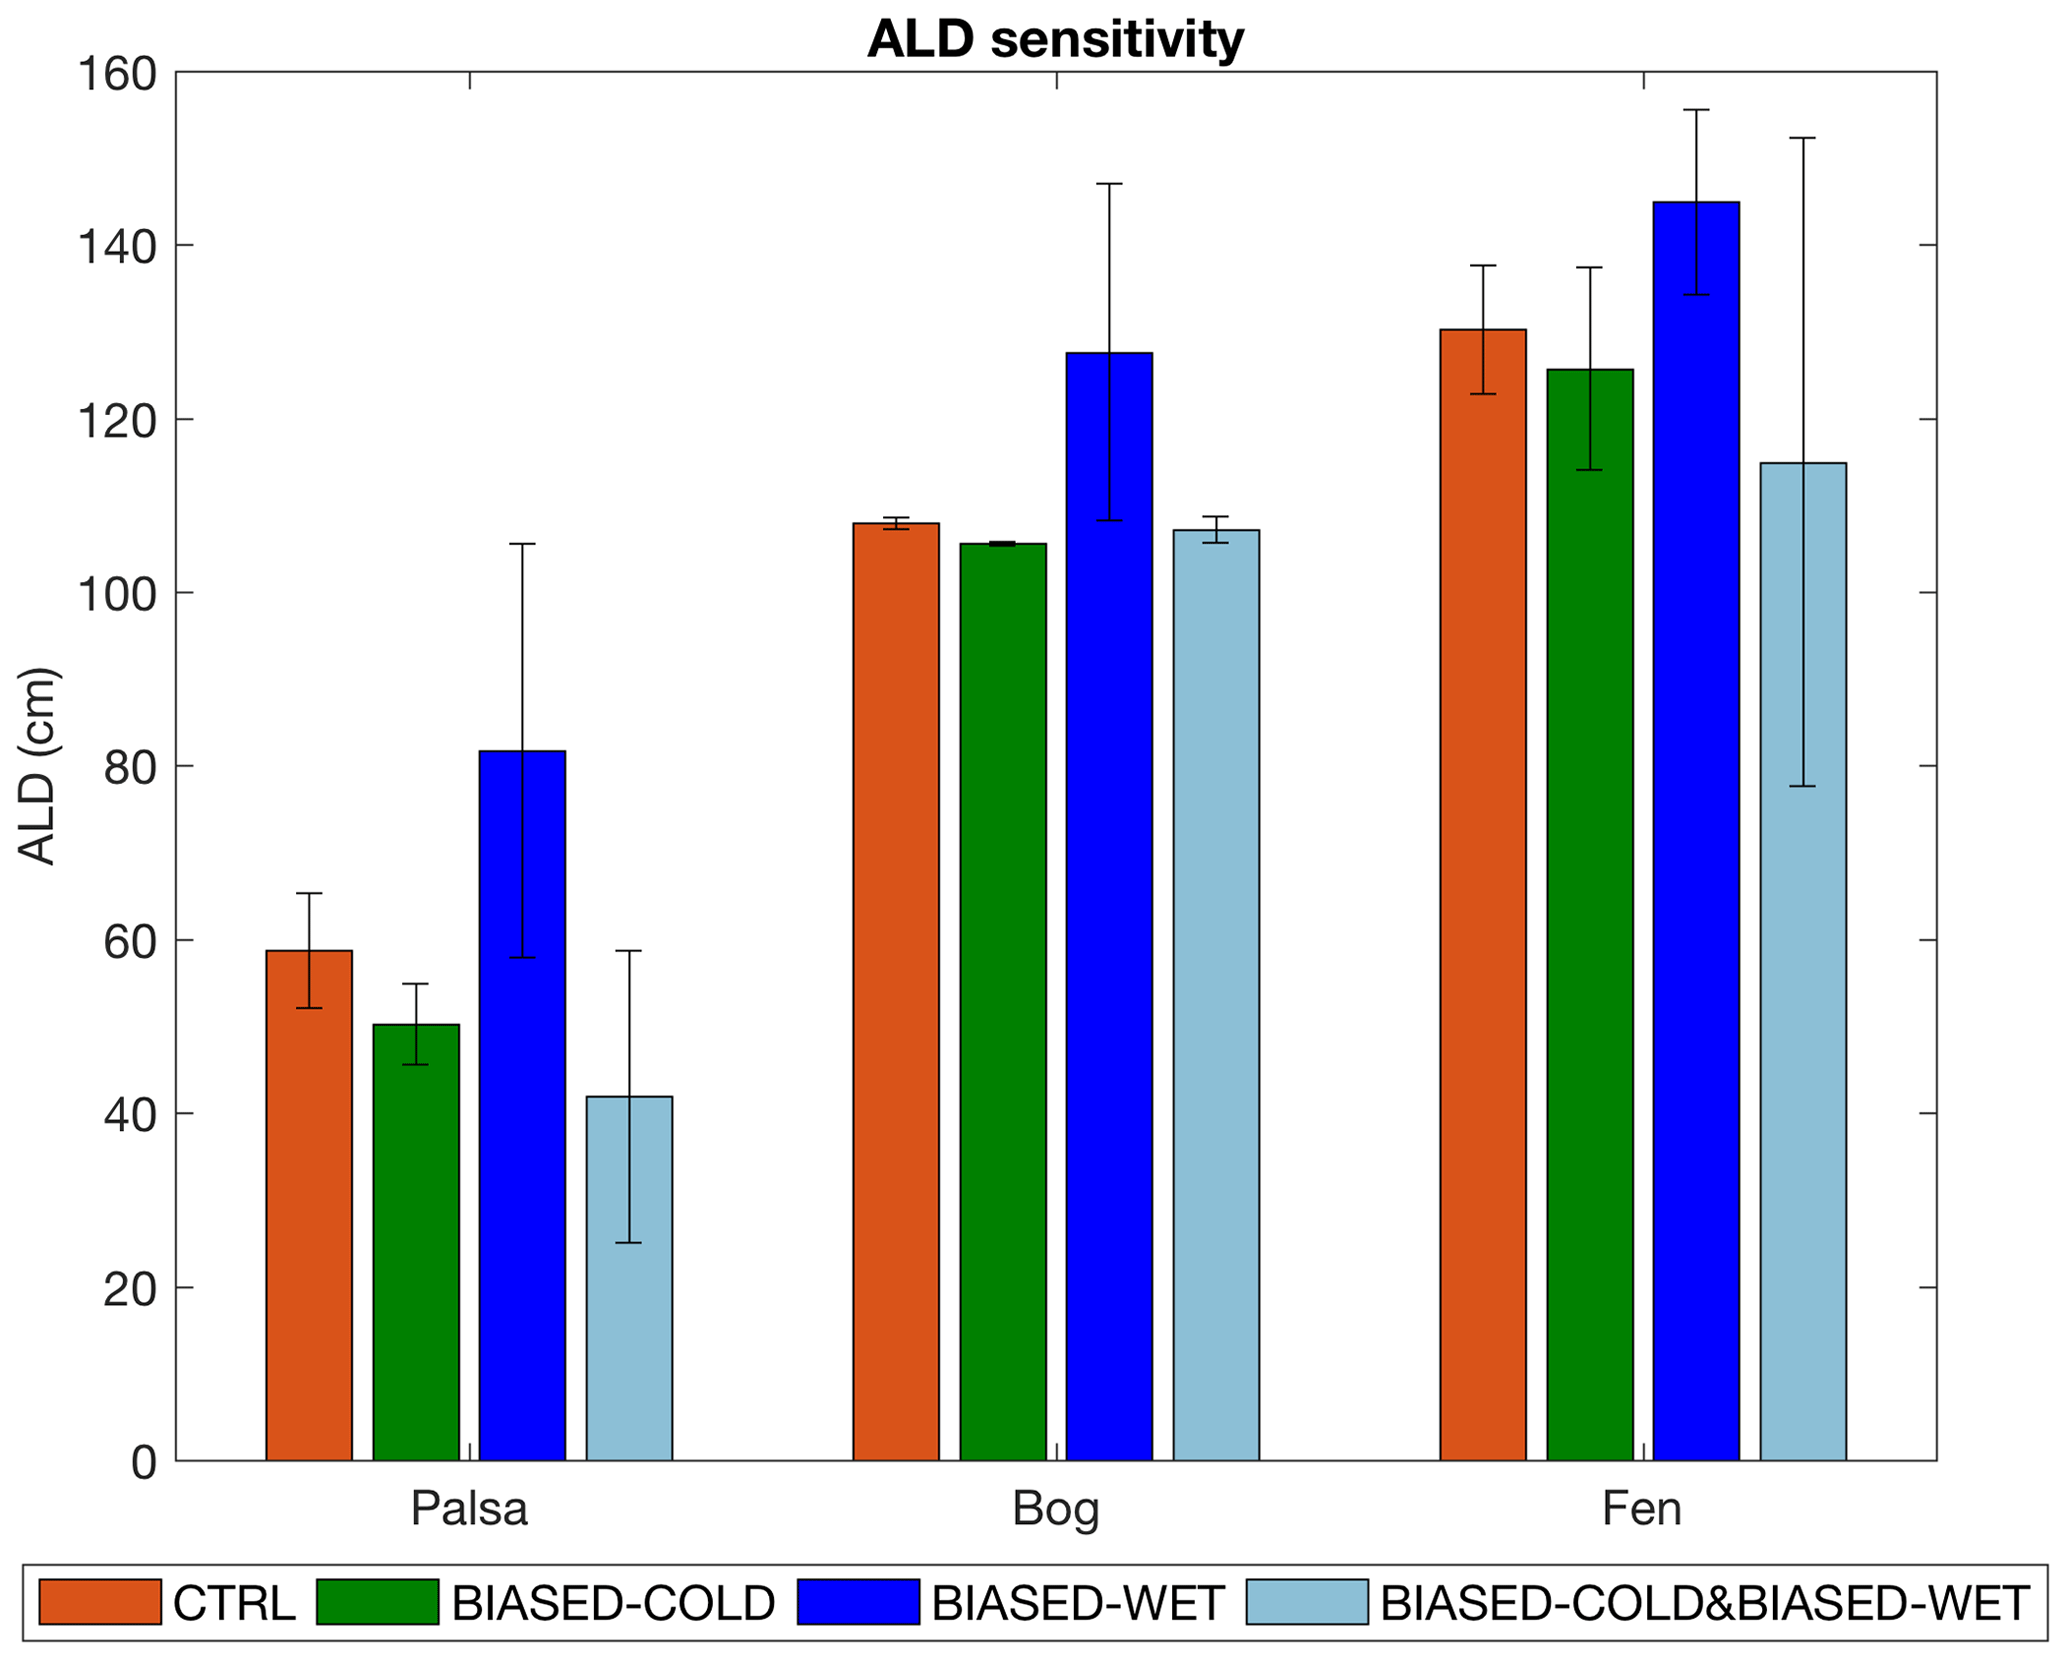
Figure 8Simulated ALD in the palsa, bog, and fen for four sets of climate forcing (Sect. 2.5). Bars and error bars are means and standard deviations calculated from 2003 to 2007, respectively.
Effects of climate on simulated ALD are similar across peatland types (Fig. 8). With increased precipitation (BIASED-WET vs. CTRL), simulated ALD generally becomes deeper with greater interannual variability because the increased snowpack depth keeps the soil warmer with lower soil ice content during winter. This effect is less prominent in the comparison between experiments BIASED-COLD and BIASED-COLD&BIASED-WET because the cold biases in these two experiments (Sect. 3.1) constrain thaw depth development. For example, summertime soil heating in some of the simulation years was not strong enough to thaw the soil ice between 20 and 40 cm completely in the BIASED-COLD&BIASED-WET run, resulting in shallower ALDs simulated in the palsa and fen even with the snowpack warming effect. The simulated ALD also becomes deeper with higher air temperature (CTRL vs. BIASED-COLD; BIASED-WET vs. BIASED-COLD&BIASED-WET) in all the examined peatland types. This response is more evident in the comparison between experiments BIASED-WET and BIASED-COLD&BIASED-WET, probably driven by their wet biases (Sect. 3.1) that facilitate thaw depth deepening (via increased thermal conductivity and advective heat transport; Grant et al. 2017a). Similar dependencies between ALD and climate were shown in Åkerman and Johansson (2008) and Johansson et al. (2013), based on multiyear measurements and snow manipulation experiments.
Therefore, the combined cold and wet biases in the GSWP3 climate reanalysis dataset could counteract their individual effects on simulated ALD development at the Stordalen Mire. Our results indicate a 28.6 %, 0.7 %, and 11.7 % underestimation of ALD simulated in the palsa, bog, and fen, respectively, when applying the GSWP3 climate reanalysis data over this region without proper bias correction (BIASED-COLD&BIASED-WET vs. CTRL). Our sensitivity analysis suggests that projected warming and wetting trends (Collins et al., 2013) could significantly increase ALD in the Arctic, since increases in precipitation and air temperature can both contribute to ALD deepening.
3.4.2 Carbon budget responses to climate
Simulations with the four climate forcing datasets (Sect. 2.5) indicate annual mean (from 2003 to 2007) CO2 sinks and CH4 sources, except the weak CO2 emissions simulated in the fen in experiment BIASED-COLD&BIASED-WET due to reduced sedge productivity driven by increased temperature and oxygen stresses (Fig. 9a, b). Our results also indicate that differences in annual CO2 and CH4 exchanges across the four climate forcing datasets for a single peatland type are as large as those across peatland types for a single climate forcing dataset (Fig. 9a, b). These large CO2 and CH4 exchange climate sensitivities demonstrate that the peatland's dynamical responses to climate have stronger effects on the carbon cycle than on ALDs (Fig. 8).
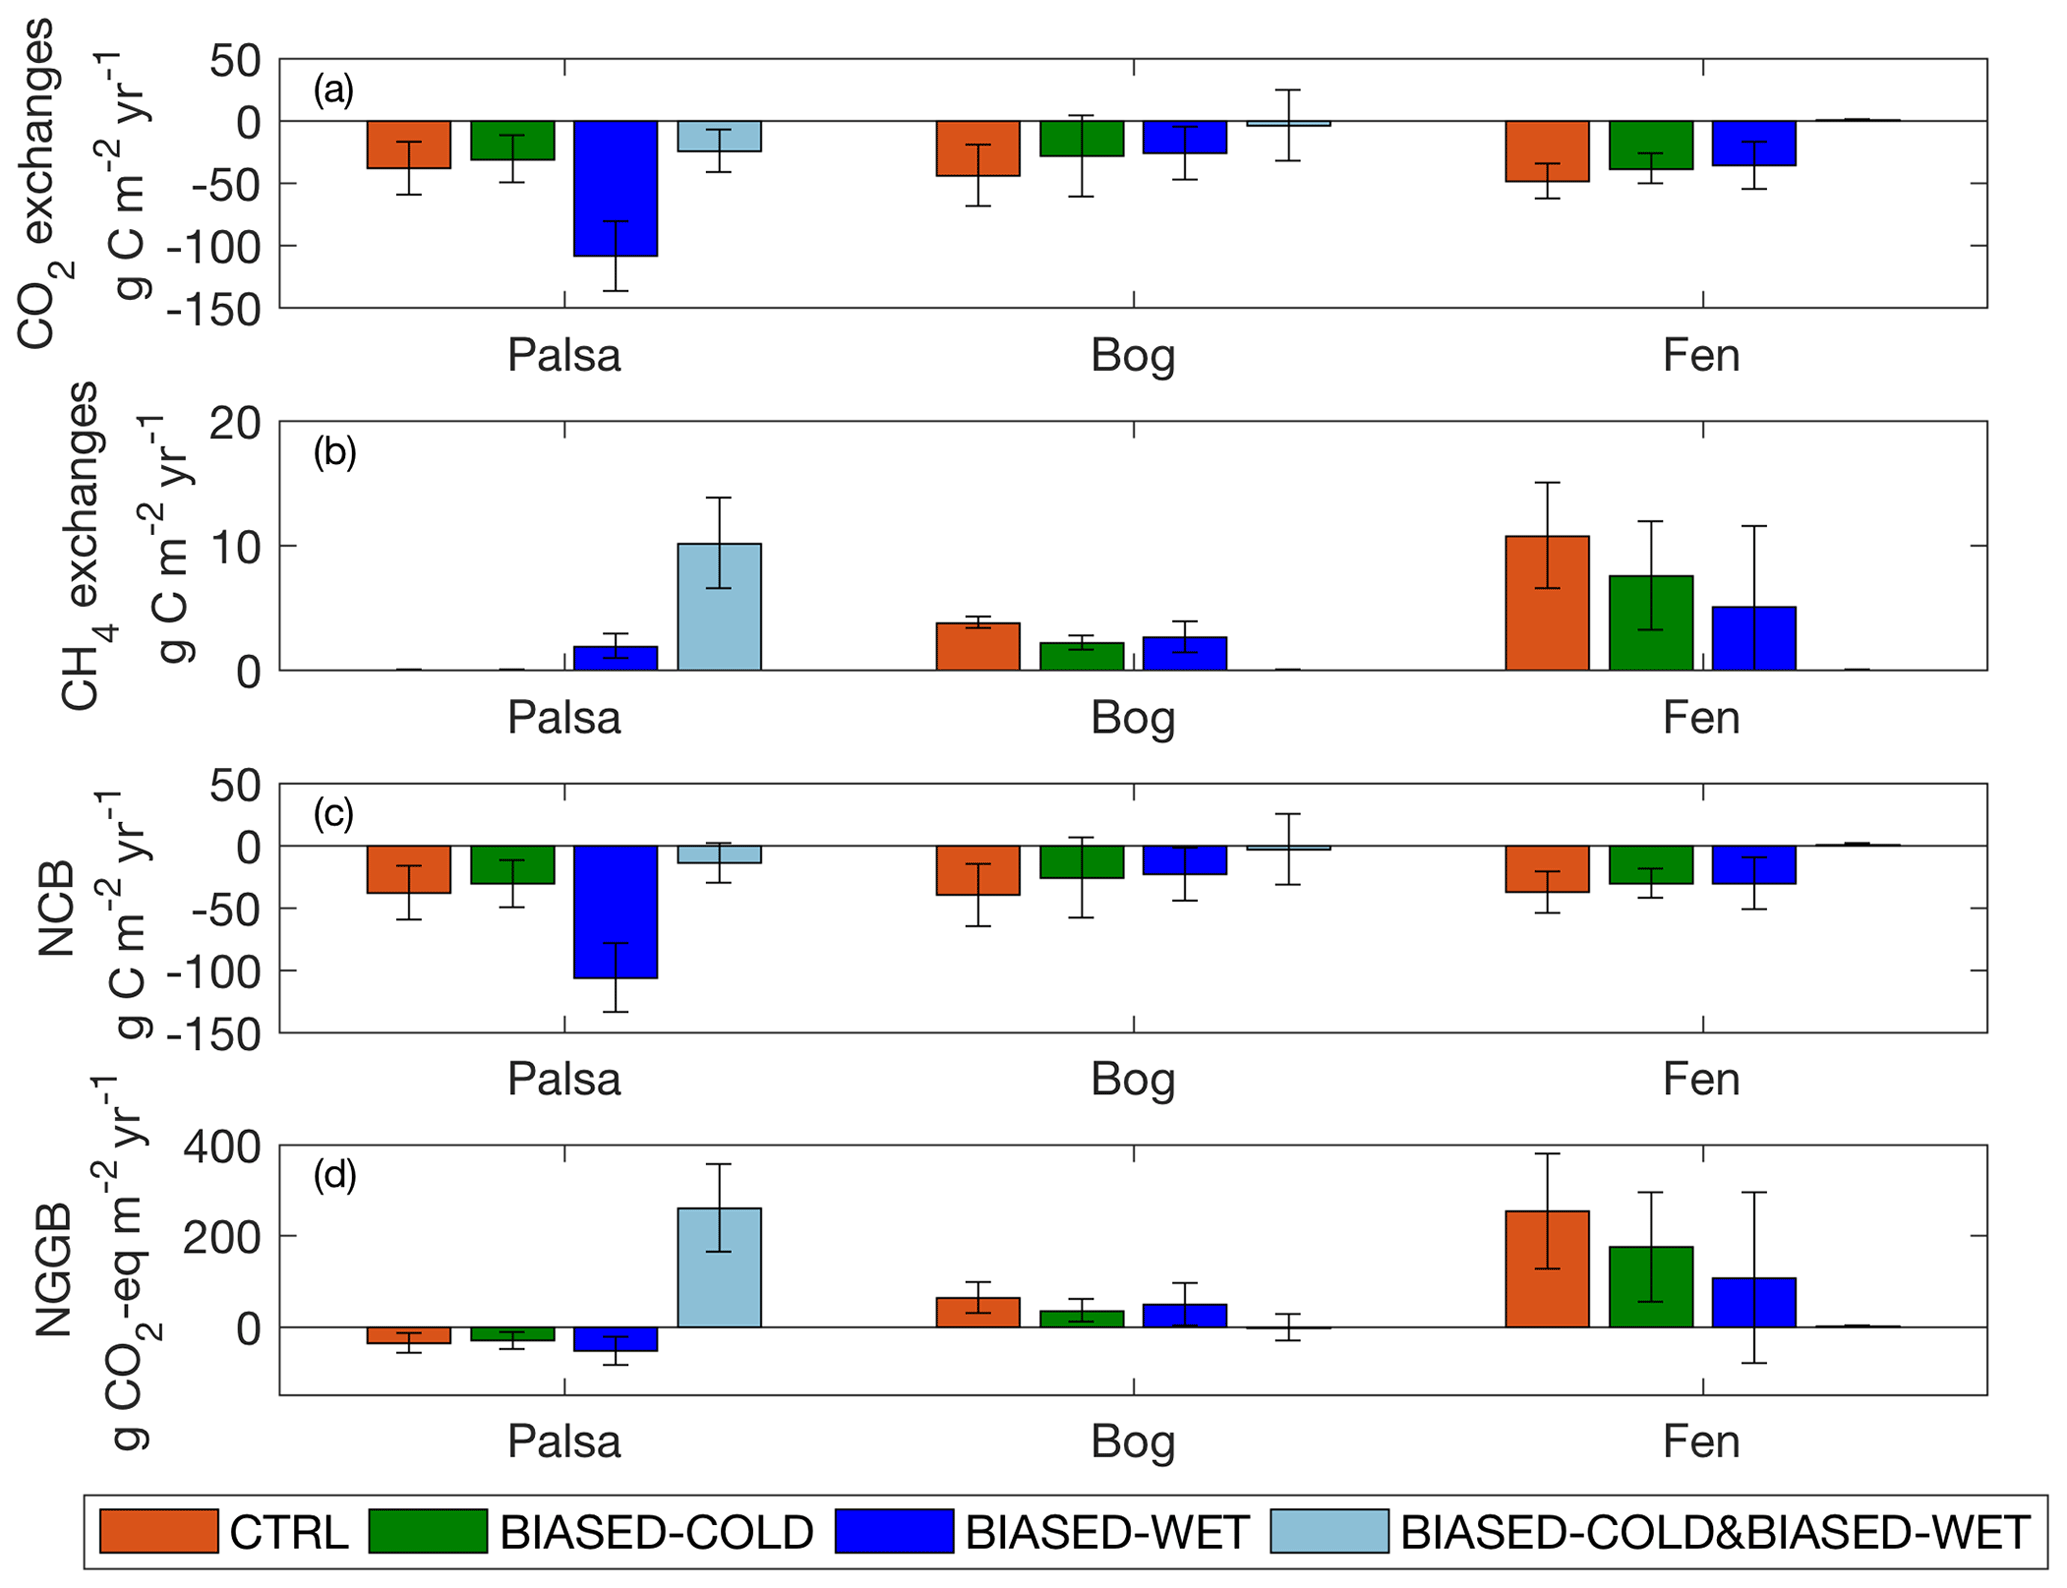
Figure 9Annual CO2 exchanges (a), CH4 exchanges (b), net carbon balance (c), and net greenhouse gas balance (d) simulated in the palsa, bog, and fen, under each set of simulations. Bars and error bars are the means and standard deviations calculated from 2003 to 2007, respectively. Positive and negative values indicate effluxes from and influxes to the site, respectively.
With bias-corrected precipitation, increased air temperature (CTRL vs. BIASED-COLD) leads to stronger CO2 uptake and greater CH4 emissions in all the examined peatland types (Fig. 9a, b), mainly because enhanced sedge growth facilitates carbon cycling under a warmer environment (results not shown). This air temperature sensitivity affects CO2 and CH4 exchanges within the same peatland type without significantly changing ALD (Fig. 8). For both experiments, CO2 uptake and CH4 emissions are greatest in the fen and lowest in the palsa, consistent with the measurements reported in Bäckstrand et al. (2010) for the same period. Based on the Coupled Model Intercomparison Project Phase 5 (CMIP5) ESM simulations, arctic annual mean surface air temperature is projected to increase by 8.5±2.1 ∘C over the 21st century (Bintanja and Andry, 2017). This projected air temperature increase is more than double the air temperature difference between site-observed and GSWP3 temperatures, which could significantly enhance CH4 emissions regardless of palsa degradation into bog and fen.
On the other hand, wet biases (BIASED-WET and BIASED-COLD&BIASED-WET) increase CH4 emissions in the palsa; wetter and colder conditions result in as much CH4 release as the current fen, while wetter conditions alone drive palsa emissions comparable to the current bog (Fig. 9b). The large precipitation sensitivity found in palsa CH4 emissions could have strong effects on palsa carbon cycling because arctic precipitation is projected to increase by 50 %–60 % towards the end of the 21st century (based on CMIP5 estimates; Bintanja and Andry, 2017). The comparison between experiments BIASED-WET and BIASED-COLD&BIASED-WET shows that in the palsa, increased air temperature strengthens CO2 uptake and weakens CH4 emissions. This shift is primarily driven in the model by increased shrub and moss productivity under the warmer environment, which facilitate CO2 uptake while drying out the soil and reducing CH4 emissions (results not shown). In the bog and fen sites, increased air temperature under wet bias strengthens both the simulated CO2 uptake and CH4 emissions (BIASED-WET vs. BIASED-COLD&BIASED-WET), due to enhanced sedge growth under the warmer environment that facilitates carbon cycling in the experiment BIASED-WET. The low CH4 emissions in bog and fen simulated in experiment BIASED-COLD&BIASED-WET are driven by increased temperature and oxygen stresses that greatly reduce heterotrophic respiration (CH4 production) and sedge cover (aerenchyma transport).
We assessed the integrated effects of the changes in CO2 and CH4 exchanges identified in the full suite of simulations in terms of the net carbon balance (NCB) and net emissions of greenhouse gases expressed as CO2 equivalents (net greenhouse gas balance, NGGB). NCB was defined as the sum of the annual total CO2 and CH4 exchanges. NGGB was defined in a similar fashion as the NCB but considers the greater radiative forcing potential of CH4 than CO2 (28 times over a 100-year horizon; Myhre et al., 2013) when calculating the annual total. The calculated NCB values are mostly negative because the stronger CO2 uptake dominates the weaker CH4 emissions (Fig. 9c). The results suggest that all the examined peatland types serve as net carbon sinks under current climate (CTRL), consistent with the estimates reported in Deng et al. (2014) and Lundin et al. (2016). We find a 24, 36, and 38 g C m−2 yr−1 underestimation of NCB simulated in the palsa, bog, and fen sites, respectively, due to the cold and wet biases in the GSWP3 climate reanalysis dataset (BIASED-COLD&BIASED-WET vs. CTRL). NGGB is affected more strongly by CH4 emissions (Fig. 9d) due to its larger radiative forcing potential. NGGB values are positive over the bog and fen, suggesting that these sites have positive radiative forcing impacts despite being net carbon sinks. NGGB simulated in the palsa is generally negative (i.e., a net sink from the atmosphere) due to lower CH4 emissions, except for the simulation conducted without any climate bias correction (correcting only air-temperature-increased CH4 emissions but not enough to compensate for the significantly higher CO2 sink). Our results indicate that the simulated NGGB would be biased by 298, −66, and −252 g CO2 eq. m−2 yr−1 in the palsa, bog, and fen, respectively, without proper bias correction for the GSWP3 climate reanalysis dataset (BIASED-COLD&BIASED-WET vs. CTRL). Using the GSWP3 products directly thus effectively eliminates the positive radiative forcing from the expanding bog and fen while creating a potentially dramatically inaccurate positive radiative forcing from the shrinking palsa.
3.4.3 Climate sensitivity vs. landscape heterogeneity
Climate sensitivity and landscape heterogeneity are defined here as variability across the four climate forcing datasets for a single peatland type and variability across three peatland types with bias-corrected climate (CTRL), respectively. We estimated carbon cycle variability associated with climate sensitivity and landscape heterogeneity to quantify the corresponding uncertainty in our annual carbon cycle assessments from 2003 to 2007. Our results indicate that differences in simulated annual mean CO2 exchanges and NCB from climate sensitivity are greater than that from landscape heterogeneity (Fig. 9a, c); i.e., annual CO2 uptake strength is more sensitive to climate forcing uncertainty than to peatland type representation. In terms of the simulated annual mean CH4 emissions and NGGB, our results indicate that variability from climate sensitivity is comparable to those from landscape heterogeneity (Fig. 9b, d). Therefore, bias-corrected climate and realistic peatland characterization are both necessary to reduce the uncertainty in representing carbon cycling dynamics and their radiative forcing effects.
In addition to their effects on carbon cycle predictions, changes in climate conditions also affect permafrost degradation and thus induce changes in areal cover of peatland types. Malmer et al. (2005) showed that there were −0.95, 0.24, and 0.62 ha areal cover changes (−10.3 %, 4.0 %, and 46.3 % percentage changes) from 1970 to 2000 in the palsa, bog, and fen, respectively, at the Stordalen Mire. By applying the annual mean CO2 and CH4 exchanges simulated with bias-corrected climate from 2003 to 2007, the areal cover changes from 1970 to 2000 alone would lead to −44 kg C yr−1, 76 kg C yr−1, and 2076 kg CO2 eq. yr−1 changes in annual mean CO2 exchanges, CH4 exchanges, and NGGB, respectively, at the Stordalen Mire. The changes in landscape-scale carbon cycle dynamics indicate that the radiative warming impact of increased CH4 emissions is large enough to offset the radiative cooling impact of increased CO2 uptake at the Stordalen Mire, consistent with the estimates reported in Deng et al. (2014). The areal cover changes across peatland types could persist or accelerate under the projected warming and wetting trends in the Arctic (Collins et al., 2013; Bintanja and Andry, 2017), which could stimulate CH4 emissions and produce a stronger radiative warming impact.
We evaluated the climate bias in a widely used atmospheric reanalysis product (GSWP3) at our northern Sweden Stordalen Mire site. We then applied a comprehensive biogeochemistry model, ecosys, to estimate the effects of these biases on active layer development and carbon cycling across a thaw gradient at the site. Our results show that ecosys reasonably represented measured hydrological, thermal, and biogeochemical cycle processes in the intact permafrost palsa, partly thawed bog, and fen. We found that the cold and wet biases in the GSWP3 climate reanalysis dataset significantly alter model simulations, leading to biases in simulated active layer depths, net carbon balance, and net greenhouse gas balance by up to 28.6 %, 38 g C m−2 yr−1, and 298 g CO2 eq. m−2 yr−1, respectively. The net carbon balance simulated with bias-corrected climate suggests that all the examined peatland types are currently net carbon sinks from the atmosphere, although the bog and fen sites can have positive radiative forcing impacts due to their higher CH4 emissions.
Our results indicate that the annual means of active layer depth, CO2 uptake, and CH4 emissions generally increase along the permafrost thaw gradient at the Stordalen Mire under current climate, consistent with previous studies in this region. Our analysis suggests that the palsa, bog, and fen differ strongly in their carbon cycling dynamics and have different responses to climate forcing biases. Differences in simulated CO2 and CH4 exchanges driven by uncertainty from climate forcing are as large as those from landscape heterogeneity across the examined permafrost thaw gradient. Model simulations demonstrate that the palsa site exhibits the strongest sensitivity to biases in air temperature and precipitation. The wet bias in GSWP3 could erroneously increase predicted CH4 emissions from the palsa site to a magnitude comparable to emissions currently measured in the bog and fen sites. These results also show that increased precipitation projected for high-latitude regions could strongly accelerate CH4 emissions from the palsa area, even without degradation of palsa into bog and fen. Future studies should thus recognize the effects of climate forcing uncertainty on carbon cycling in addition to tracking changes in carbon budgets associated with areal changes in permafrost degradation.
The data presented in this study are available at the IsoGenie Database (https://isogenie-db.asc.ohio-state.edu/datasources\#modeling, last access: 15 February 2019). The ecosys executable program can be obtained from the Ecosys Modelling Project (https://ecosys.ualberta.ca/download-instructions-2, last access: 15 February 2019). The ecosys source code is available at https://github.com/jinyun1tang/ECOSYS (last access: 15 February 2019).
The supplement related to this article is available online at: https://doi.org/10.5194/tc-13-647-2019-supplement.
KYC and WJR designed the study. PMC synthesized field measurements and RFG developed the ecosys model. KYC performed the analyses and led the writing of the paper. All authors contributed thoughtful discussions and insights to the study, and all authors contributed to the editing of the paper.
The authors declare that they have no conflict of interest.
This study was funded by the Genomic Science Program of the United States
Department of Energy Office of Biological and Environmental Research under
the ISOGENIE project, grant DE-SC0016440, to Lawrence Berkeley Laboratory
under contract DE-AC02-05CH11231, and by support from the Swedish Research
Council (VR) to Patrick M. Crill. We thank the Abisko Scientific Research
Station of the Swedish Polar Research Secretariat for providing the
meteorological data. We are furthermore thankful to the two anonymous
reviewers who provided constructive comments that improved the
manuscript.
Edited by: Peter Morse
Reviewed by: two anonymous referees
Ahlström, A., Schurgers, G., and Smith, B.: The large influence of climate model bias on terrestrial carbon cycle simulations, Environ. Res. Lett., 12, 014004, https://doi.org/10.1088/1748-9326/12/1/014004, 2017.
Åkerman, H. J. and Johansson, M.: Thawing permafrost and thicker active layers in sub-arctic Sweden, Permafrost Periglac., 19, 279–292, https://doi.org/10.1002/ppp.626, 2008.
Anav, A., Friedlingstein, P., Kidston, M., Bopp, L., Ciais, P., Cox, P., Jones, C., Jung, M., Myneni, R., and Zhu, Z.: Evaluating the Land and Ocean Components of the Global Carbon Cycle in the CMIP5 Earth System Models, J. Climate, 26, 6801–6843, https://doi.org/10.1175/JCLI-D-12-00417.1, 2013.
Arneth, A., Sitch, S., Pongratz, J., Stocker, B. D., Ciais, P., Poulter, B., Bayer, A. D., Bondeau, A., Calle, L., Chini, L. P., Gasser, T., Fader, M., Friedlingstein, P., Kato, E., Li, W., Lindeskog, M., Nabel, J. E. M. S., Pugh, T. A. M., Robertson, E., Viovy, N., Yue, C., and Zaehle, S.: Historical carbon dioxide emissions caused by land-use changes are possibly larger than assumed, Nat. Geosci., 10, 79–84, https://doi.org/10.1038/ngeo2882, 2017.
Bäckstrand, K., Crill, P. M., Mastepanov, M., Christensen, T. R., and Bastviken, D.: Non-methane volatile organic compound flux from a subarctic mire in Northern Sweden, Tellus B, 60, 226–237, https://doi.org/10.1111/j.1600-0889.2007.00331.x, 2008a.
Bäckstrand, K., Crill, P. M., Mastepanov, M., Christensen, T. R., and Bastviken, D.: Total hydrocarbon flux dynamics at a subarctic mire in northern Sweden, J. Geophys. Res., 113, G03026, https://doi.org/10.1029/2008JG000703, 2008b.
Bäckstrand, K., Crill, P. M., Jackowicz-Korczyñski, M., Mastepanov, M., Christensen, T. R., and Bastviken, D.: Annual carbon gas budget for a subarctic peatland, Northern Sweden, Biogeosciences, 7, 95–108, https://doi.org/10.5194/bg-7-95-2010, 2010.
Berrisford, P., Dee, D., Poli, P., Brugge, R., Fielding, K., Fuentes, M., Kållberg, P., Kobayashi, S., Uppala, S. and Simmons, A.: The ERA-Interim archive, version 2.0, ERA report series, 1. Technical Report, ECMWF, 23 pp., available at: https://www.ecmwf.int/node/8174 (last access: 15 February 2019), 2011.
Bintanja, R. and Andry, O.: Towards a rain-dominated Arctic, Nat. Clim. Change, 7, 263–267, https://doi.org/10.1038/nclimate3240, 2017.
Callaghan, T. V., Bergholm, F., Christensen, T. R., Jonasson, C., Kokfelt, U., and Johansson, M.: A new climate era in the sub-Arctic: Accelerating climate changes and multiple impacts, Geophys. Res. Lett., 37, L14705, https://doi.org/10.1029/2009GL042064, 2010.
Chang, K.-Y., Paw U, K. T., and Chen, S.-H.: The importance of carbon-nitrogen biogeochemistry on water vapor and carbon fluxes as elucidated by a multiple canopy layer higher order closure land surface model, Agr. Forest Meteorol., 259, 60–74, https://doi.org/10.1016/j.agrformet.2018.04.009, 2018.
Christensen, T. R., Johansson, T., Åkerman, H. J., Mastepanov, M., Malmer, N., Friborg, T., Crill, P., and Svensson, B. H.: Thawing sub-arctic permafrost: Effects on vegetation and methane emissions, Geophys. Res. Lett., 31, L04501, https://doi.org/10.1029/2003GL018680, 2004.
Collins, M., Knutti, R., Arblaster, J., Dufresne, J.-L., Fichefet, T., Friedlingstein, P., Gao, X., Gutowski, W. J., Johns, T., Krinner, G., Shongwe, M., Tebaldi, C., Weaver, A. J., and Wehner, M.: Long-term Climate Change: Projections, Commitments and Irreversibility. Climate Change 2013: The Physical Science Basis. Contribution of Working Group I to the Fifth Assessment Report of the Intergovernmental Panel on Climate Change, edited by: Stocker, T. F., Qin, D., Plattner, G.-K., Tignor, M., Allen, S. K., Boschung, J., Nauels, A., Xia, Y., Bex, V., and Midgley, P. M., Cambridge University Press, Cambridge, United Kingdom and New York, NY, USA, 1029–1136, https://doi.org/10.1017/CBO9781107415324.024, 2013.
Compo, G. P., Whitaker, J. S., Sardeshmukh, P. D., Matsui, N., Allan, R. J., Yin, X., Gleason, B. E., Vose, R. S., Rutledge, G., Bessemoulin, P., Brönnimann, S., Brunet, M., Crouthamel, R. I., Grant, A. N., Groisman, P. Y., Jones, P. D., Kruk, M. C., Kruger, A. C., Marshall, G. J., Maugeri, M., Mok, H. Y., Nordli, Ø., Ross, T. F., Trigo, R. M., Wang, X. L., Woodruff, S. D., and Worley, S. J.: The Twentieth Century Reanalysis Project, Q. J. Roy. Meteor. Soc., 137, 1–28, https://doi.org/10.1002/qj.776, 2011.
Cooper, M. D. A., Estop-Aragonés, C., Fisher, J. P., Thierry, A., Garnett, M. H., Charman, D. J., Murton, J. B., Phoenix, G. K., Treharne, R., Kokelj, S. V., Wolfe, S. A., Lewkowicz, A. G., Williams, M., and Hartley, I. P.: Limited contribution of permafrost carbon to methane release from thawing peatlands, Nat. Clim. Change, 7, 507–511, https://doi.org/10.1038/nclimate3328, 2017.
Cox, P. M., Betts, R. A., Jones, C. D., Spall, S. A., and Totterdell, I. J.: Acceleration of global warming due to carbon-cycle feedbacks in a coupled climate model, Nature, 408, 184–187, 2000.
Deng, J., Li, C., Frolking, S., Zhang, Y., Bäckstrand, K., and Crill, P.: Assessing effects of permafrost thaw on C fluxes based on multiyear modeling across a permafrost thaw gradient at Stordalen, Sweden, Biogeosciences, 11, 4753–4770, https://doi.org/10.5194/bg-11-4753-2014, 2014.
Dimitrov, D. D., Grant, R. F., Lafleur, P. M., and Humphreys, E. R.: Modeling the effects of hydrology on gross primary productivity and net ecosystem productivity at Mer Bleue bog, J. Geophys. Res., 116, G04010, https://doi.org/10.1029/2010JG001586, 2011.
Dimitrov, D. D., Bhatti, J. S., and Grant, R. F.: The transition zones (ecotone) between boreal forests and peatlands: Ecological controls on ecosystem productivity along a transition zone between upland black spruce forest and a poor forested fen in central Saskatchewan, Ecol. Model., 291, 96–108, https://doi.org/10.1016/j.ecolmodel.2014.07.020, 2014.
Dirmeyer, P. A.: A History and Review of the Global Soil Wetness Project (GSWP), J. Hydrometeorol., 12, 729–749, https://doi.org/10.1175/JHM-D-10-05010.1, 2011.
Friedlingstein, P., Cox, P., Betts, R., Bopp, L., von Bloh, W., Brovkin, V., Cadule, P., Doney, S., Eby, M., Fung, I., Bala, G., John, J., Jones, C., Joos, F., Kato, T., Kawamiya, M., Knorr, W., Lindsay, K., Matthews, H. D., Raddatz, T., Rayner, P., Reick, C., Roeckner, E., Schnitzler, K.-G., Schnur, R., Strassmann, K., Weaver, A. J., Yoshikawa, C., and Zeng, N.: Climate–Carbon Cycle Feedback Analysis: Results from the C4 MIP Model Intercomparison, J. Climate, 19, 3337–3353, https://doi.org/10.1175/JCLI3800.1, 2006.
Friedlingstein, P., Meinshausen, M., Arora, V. K., Jones, C. D., Anav, A., Liddicoat, S. K., and Knutti, R.: Uncertainties in CMIP5 Climate Projections due to Carbon Cycle Feedbacks, J. Climate, 27, 511–526, https://doi.org/10.1175/JCLI-D-12-00579.1, 2014.
Ghimire, B., Riley, W. J., Koven, C. D., Mu, M., and Randerson, J. T.: Representing leaf and root physiological traits in CLM improves global carbon and nitrogen cycling predictions, J. Adv. Model. Earth Syst., 8, 598–613, https://doi.org/10.1002/2015MS000538, 2016.
Grant, R. F.: Modelling changes in nitrogen cycling to sustain increases in forest productivity under elevated atmospheric CO2 and contrasting site conditions, Biogeosciences, 10, 7703–7721, https://doi.org/10.5194/bg-10-7703-2013, 2013.
Grant, R. F.: Nitrogen mineralization drives the response of forest productivity to soil warming: Modelling in ecosys vs. measurements from the Harvard soil heating experiment, Ecol. Model., 288, 38–46, https://doi.org/10.1016/j.ecolmodel.2014.05.015, 2014.
Grant, R. F.: Ecosystem CO2 and CH4 exchange in a mixed tundra and a fen within a hydrologically diverse Arctic landscape: 2. Modeled impacts of climate change, J. Geophys. Res.-Biogeo., 120, 1388–1406, https://doi.org/10.1002/2014JG002889, 2015.
Grant R. F. and Flanagan L. B.: Modeling stomatal and nonstomatal effects of water deficits on CO2 fixation in a semiarid grassland, J. Geophys. Res., 112, G03011, https://doi.org/10.1029/2006JG000302, 2007.
Grant, R. F. and Roulet, N. T.: Methane efflux from boreal wetlands: Theory and testing of the ecosystem model Ecosys with chamber and tower flux measurements, Global Biogeochem. Cy., 16, 1054, https://doi.org/10.1029/2001GB001702, 2002.
Grant, R. F., Oechel, W. C., and Ping, C.-L.: Modelling carbon balances of coastal arctic tundra under changing climate, Glob. Change Biol., 9, 16–36, https://doi.org/10.1046/j.1365-2486.2003.00549.x, 2003.
Grant, R. F., Black, T. A., Humphreys, E. R., and Morgenstern, K.: Changes in net ecosystem productivity with forest age following clearcutting of a coastal Douglas-fir forest: testing a mathematical model with eddy covariance measurements along a forest chronosequence, Tree Physiol., 27, 115–131, 2007a.
Grant, R. F., Arkebauer, T. J., Dobermann, A., Hubbard, K. G., Schimelfenig, T. T., Suyker, A. E., Verma, S. B., and Walters, D. T.: Net Biome Productivity of Irrigated and Rainfed Maize–Soybean Rotations: Modeling vs. Measurements, Agron. J., 99, 1404, https://doi.org/10.2134/agronj2006.0308, 2007b.
Grant, R. F., Barr, A. G., Black, T. A., Gaumont-Guay, D., Iwashita, H., Kidson, J., McCAUGHEY, H., Morgenstern, K., Murayama, S., Nesic, Z., Saigusa, N., Shashkov, A., and Zha, T.: Net ecosystem productivity of boreal jack pine stands regenerating from clearcutting under current and future climates, Glob. Change Biol., 13, 1423–1440, https://doi.org/10.1111/j.1365-2486.2007.01363.x, 2007c.
Grant, R. F., Margolis, H. A., Barr, A. G., Black, T. A., Dunn, A. L., Bernier, P. Y., and Bergeron, O.: Changes in net ecosystem productivity of boreal black spruce stands in response to changes in temperature at diurnal and seasonal time scales, Tree Physiol., 29, 1–17, https://doi.org/10.1093/treephys/tpn004, 2009a.
Grant, R. F., Barr, A. G., Black, T. A., Margolis, H. A., Dunn, A. L., Metsaranta, J., Wang, S., McCaughey, J. H., and Bourque, C. A.: Interannual variation in net ecosystem productivity of Canadian forests as affected by regional weather patterns – A Fluxnet-Canada synthesis, Agr. Forest Meteorol., 149, 2022–2039, https://doi.org/10.1016/j.agrformet.2009.07.010, 2009b.
Grant, R. F., Hutyra, L. R., Oliveira, R. C., Munger, J. W., Saleska, S. R., and Wofsy, S. C.: Modeling the carbon balance of Amazonian rain forests: resolving ecological controls on net ecosystem productivity, Ecol. Monogr., 79, 445–463, https://doi.org/10.1890/08-0074.1, 2009c.
Grant, R. F., Barr, A. G., Black, T. A., Margolis, H. A., Mccaughey, J. H., and Trofymow, J. A.: Net ecosystem productivity of temperate and boreal forests after clearcutting – a Fluxnet-Canada measurement and modelling synthesis, Tellus B, 62, 475–496, https://doi.org/10.1111/j.1600-0889.2010.00500.x, 2010.
Grant, R. F., Kimball, B. A., Conley, M. M., White, J. W., Wall, G. W., and Ottman, M. J.: Controlled Warming Effects on Wheat Growth and Yield: Field Measurements and Modeling, Agron. J., 103, 1742–1754, https://doi.org/10.2134/agronj2011.0158, 2011a.
Grant, R. F., Humphreys, E. R., Lafleur, P. M., and Dimitrov, D. D.: Ecological controls on net ecosystem productivity of a mesic arctic tundra under current and future climates, J. Geophys. Res., 116, G01031, https://doi.org/10.1029/2010JG001555, 2011b.
Grant, R. F., Baldocchi, D. D., and Ma, S.: Ecological controls on net ecosystem productivity of a seasonally dry annual grassland under current and future climates: Modelling with ecosys, Agr. Forest Meteorol., 152, 189–200, https://doi.org/10.1016/j.agrformet.2011.09.012, 2012a.
Grant, R. F., Desai, A. R., and Sulman, B. N.: Modelling contrasting responses of wetland productivity to changes in water table depth, Biogeosciences, 9, 4215–4231, https://doi.org/10.5194/bg-9-4215-2012, 2012b.
Grant R. F., Humphreys E. R., and Lafleur P. M.: Ecosystem CO2 and CH4 exchange in a mixed tundra and a fen within a hydrologically diverse Arctic landscape: 1. Modeling versus measurements, J. Geophys. Res.-Biogeo., 120, 1366–1387, https://doi.org/10.1002/2014JG002888, 2015.
Grant, R. F., Mekonnen, Z. A., Riley, W. J., Wainwright, H. M., Graham, D. and Torn, M. S.: Mathematical Modelling of Arctic Polygonal Tundra with Ecosys: 1. Microtopography Determines How Active Layer Depths Respond to Changes in Temperature and Precipitation, J. Geophys. Res.-Biogeo., 122, 3161–3173, https://doi.org/10.1002/2017JG004035, 2017a.
Grant, R. F., Mekonnen, Z. A., Riley, W. J., Arora, B., and Torn, M. S.: Mathematical Modelling of Arctic Polygonal Tundra with Ecosys: 2. Microtopography Determines How CO2 and CH4 Exchange Responds to Changes in Temperature and Precipitation: GHG Exchange in Arctic Polygonal Tundra, J. Geophys. Res.-Biogeo., 122, 3174–3187, https://doi.org/10.1002/2017JG004037, 2017b.
Guo, D., Wang, H., and Wang, A.: Sensitivity of Historical Simulation of the Permafrost to Different Atmospheric Forcing Data Sets from 1979 to 2009, J. Geophys. Res.-Atmos., 122, 12269–12284, https://doi.org/10.1002/2017JD027477, 2017.
Harris, I., Jones, P. D., Osborn, T. J., and Lister, D. H.: Updated high-resolution grids of monthly climatic observations – the CRU TS3.10 Dataset, Int. J. Climatol., 34, 623–642, https://doi.org/10.1002/joc.3711, 2014.
Hodgkins, S. B., Tfaily, M. M., McCalley, C. K., Logan, T. A., Crill, P. M., Saleska, S. R., Rich, V. I., and Chanton, J. P.: Changes in peat chemistry associated with permafrost thaw increase greenhouse gas production, P. Natl. Acad. Sci. USA, 111, 5819–5824, https://doi.org/10.1073/pnas.1314641111, 2014.
Hugelius, G., Strauss, J., Zubrzycki, S., Harden, J. W., Schuur, E. A. G., Ping, C.-L., Schirrmeister, L., Grosse, G., Michaelson, G. J., Koven, C. D., O'Donnell, J. A., Elberling, B., Mishra, U., Camill, P., Yu, Z., Palmtag, J., and Kuhry, P.: Estimated stocks of circumpolar permafrost carbon with quantified uncertainty ranges and identified data gaps, Biogeosciences, 11, 6573–6593, https://doi.org/10.5194/bg-11-6573-2014, 2014.
IPCC: Climate Change 2014: Synthesis Report. Contribution of Working Groups I, II and III to the Fifth Assessment Report of the Intergovernmental Panel on Climate Change, edited by: Core Writing Team, Pachauri, R. K., and Meyer, L. A., IPCC, Geneva, Switzerland, 151 pp., 2014.
Johansson, T., Malmer, N., Crill, P. M., Friborg, T., Åkerman, J. H., Mastepanov, M., and Christensen, T. R.: Decadal vegetation changes in a northern peatland, greenhouse gas fluxes and net radiative forcing, Glob. Change Biol., 12, 2352–2369, https://doi.org/10.1111/j.1365-2486.2006.01267.x, 2006.
Johansson, M., Callaghan, T. V., Bosiö, J., Åkerman, H. J., Jackowicz-Korczynski, M., and Christensen, T. R.: Rapid responses of permafrost and vegetation to experimentally increased snow cover in sub-arctic Sweden, Environ. Res. Lett., 8, 035025, https://doi.org/10.1088/1748-9326/8/3/035025, 2013.
Jones, M. C., Harden, J., O'Donnell, J., Manies, K., Jorgenson, T., Treat, C., and Ewing, S.: Rapid carbon loss and slow recovery following permafrost thaw in boreal peatlands, Glob. Change Biol., 23, 1109–1127, https://doi.org/10.1111/gcb.13403, 2017.
Kalnay, E., Kanamitsu, M., Kistler, R., Collins, W., Deaven, D., Gandin, L., Iredell, M., Saha, S., White, G., Woollen, J., Zhu, Y., Chelliah, M., Ebisuzaki, W., Higgins, W., Janowiak, J., Mo, K. C., Ropelewski, C., Wang, J., Leetmaa, A., Reynolds, R., Jenne, R., and Joseph, D.: The NCEP/NCAR 40-Year Reanalysis Project, B. Am. Meteorol. Soc., 77, 437–472, https://doi.org/10.1175/1520-0477(1996)077<0437:TNYRP>2.0.CO;2, 1996.
Kanamitsu, M., Ebisuzaki, W., Woollen, J., Yang, S.-K., Hnilo, J. J., Fiorino, M., and Potter, G. L.: NCEP–DOE AMIP-II Reanalysis (R-2), B. Am. Meteorol. Soc., 83, 1631–1644, https://doi.org/10.1175/BAMS-83-11-1631, 2002.
Kokfelt, U., Reuss, N., Struyf, E., Sonesson, M., Rundgren, M., Skog, G., Rosen, P., and Hammarlund, D.: Wetland development, permafrost history and nutrient cycling inferred from late Holocene peat and lake sediment records in subarctic Sweden, J. Paleolimn., 44, 327–342, https://doi.org/10.1007/s10933-010-9406-8, 2010.
Lundin, E. J., Klaminder, J., Giesler, R., Persson, A., Olefeldt, D., Heliasz, M., Christensen, T. R., and Karlsson, J.: Is the subarctic landscape still a carbon sink? Evidence from a detailed catchment balance, Geophys. Res. Lett., 43, 1988–1995, https://doi.org/10.1002/2015GL066970, 2016.
Malmer, N., Johansson, T., Olsrud, M., and Christensen, T. R.: Vegetation, climatic changes and net carbon sequestration in a North-Scandinavian subarctic mire over 30 years, Glob. Change Biol., 11, 1895–1909, https://doi.org/10.1111/j.1365-2486.2005.01042.x, 2005.
Mastepanov, M., Sigsgaard, C., Dlugokencky, E. J., Houweling, S., Ström, L., Tamstorf, M. P., and Christensen, T. R.: Large tundra methane burst during onset of freezing, Nature, 456, 628–630, https://doi.org/10.1038/nature07464, 2008.
McCalley, C. K., Woodcroft, B. J., Hodgkins, S. B., Wehr, R. A., Kim, E.-H., Mondav, R., Crill, P. M., Chanton, J. P., Rich, V. I., Tyson, G. W., and Saleska, S. R.: Methane dynamics regulated by microbial community response to permafrost thaw, Nature, 514, 478–481, https://doi.org/10.1038/nature13798, 2014.
Mezbahuddin, M., Grant, R. F., and Hirano, T.: Modelling effects of seasonal variation in water table depth on net ecosystem CO2 exchange of a tropical peatland, Biogeosciences, 11, 577–599, https://doi.org/10.5194/bg-11-577-2014, 2014.
Mondav, R., Woodcroft, B. J., Kim, E.-H., McCalley, C. K., Hodgkins, S. B., Crill, P. M., Chanton, J., Hurst, G. B., VerBerkmoes, N. C., Saleska, S. R., Hugenholtz, P., Rich, V. I., and Tyson, G. W.: Discovery of a novel methanogen prevalent in thawing permafrost, Nat. Commun., 5, 3212, https://doi.org/10.1038/ncomms4212, 2014.
Mondav, R., McCalley, C. K., Hodgkins, S. B., Frolking, S., Saleska, S. R., Rich, V. I., Chanton, J. P., and Crill, P. M.: Microbial network, phylogenetic diversity and community membership in the active layer across a permafrost thaw gradient, Environ. Microbiol., 19, 3201–3218, https://doi.org/10.1111/1462-2920.13809, 2017.
Myhre, G., Shindell, D., Bréon, F.-M., Collins, W., Fuglestvedt, J., Huang, J., Koch, D., Lamarque, J.-F., Lee, D., Mendoza, B., Nakajima, T., Robock, A., Stephens, G., Takemura, T., and Zhang, H.: Anthropogenic and Natural Radiative Forcing, in: Climate Change 2013: The Physical Science Basis. Contribution of Working Group I to the Fifth Assessment Report of the Intergovernmental Panel on Climate Change, edited by: Stocker, T. F., Qin, D., Plattner, G.-K., Tignor, M., Allen, S. K., Boschung, J., Nauels, A., Xia, Y., Bex, V., and Midgley, P. M., Cambridge University Press, Cambridge, UK and New York, NY, USA, 659–740, https://doi.org/10.1017/CBO9781107415324.018, 2013.
O'Donnell, J. A., Jorgenson, M. T., Harden, J. W., McGuire, A. D., Kanevskiy, M. Z., and Wickland, K. P.: The Effects of Permafrost Thaw on Soil Hydrologic, Thermal, and Carbon Dynamics in an Alaskan Peatland, Ecosystems, 15, 213–229, https://doi.org/10.1007/s10021-011-9504-0, 2012.
Olefeldt, D. and Roulet, N. T.: Effects of permafrost and hydrology on the composition and transport of dissolved organic carbon in a subarctic peatland complex, J. Geophys. Res., 117, G01005 https://doi.org/10.1029/2011JG001819, 2012.
Raz-Yaseef, N., Torn, M. S., Wu, Y., Billesbach, D. P., Liljedahl, A. K., Kneafsey, T. J., Romanovsky, V. E., Cook, D. R., and Wullschleger, S. D.: Large CO2 and CH4 emissions from polygonal tundra during spring thaw in northern Alaska, Geophys. Res. Lett., 44, 504–513, https://doi.org/10.1002/2016GL071220, 2017.
Rydén B. E. and Kostov, L.: Thawing and freezing in tundra soil, Ecol. Bull., 30, 27–54, 1980.
Rydén, B. E., Fors, L., and Kostov, L.: Physical Properties of the Tundra Soil-Water System at Stordalen, Abisko, Ecol. Bull., 30, 27–54, 1980.
Schuur, E. A. G., McGuire, A. D., Schädel, C., Grosse, G., Harden, J. W., Hayes, D. J., Hugelius, G., Koven, C. D., Kuhry, P., Lawrence, D. M., Natali, S. M., Olefeldt, D., Romanovsky, V. E., Schaefer, K., Turetsky, M. R., Treat, C. C., and Vonk, J. E.: Climate change and the permafrost carbon feedback, Nature, 520, 171–179, https://doi.org/10.1038/nature14338, 2015.
Sonesson, M.: Cryptogams, in: International biological programme – Swedish tundra biome project, Swedish Natural Science Research Council Ecological Research Committee, Technical report No. 9, 18–23, 1972.
Tokida, T., Miyazaki, T., Mizoguchi, M., Nagata, O., Takakai, F., Kagemoto, A., and Hatano, R.: Falling atmospheric pressure as a trigger for methane ebullition from peatland, Global Biogeochem. Cy., 21, GB2003, https://doi.org/10.1029/2006GB002790, 2007.
van den Hurk, B., Kim, H., Krinner, G., Seneviratne, S. I., Derksen, C., Oki, T., Douville, H., Colin, J., Ducharne, A., Cheruy, F., Viovy, N., Puma, M. J., Wada, Y., Li, W., Jia, B., Alessandri, A., Lawrence, D. M., Weedon, G. P., Ellis, R., Hagemann, S., Mao, J., Flanner, M. G., Zampieri, M., Materia, S., Law, R. M., and Sheffield, J.: LS3MIP (v1.0) contribution to CMIP6: the Land Surface, Snow and Soil moisture Model Intercomparison Project – aims, setup and expected outcome, Geosci. Model Dev., 9, 2809–2832, https://doi.org/10.5194/gmd-9-2809-2016, 2016.
Viovy, N.: CRUNCEP Version 7 – Atmospheric Forcing Data for the Community Land Model, Research Data Archive at the National Center for Atmospheric Research, Computational and Information Systems Laboratory, Boulder CO, USA, 2018.
Wickland, K. P., Striegl, R. G., Neff, J. C., and Sachs, T.: Effects of permafrost melting on CO2 and CH4 exchange of a poorly drained black spruce lowland, J. Geophys. Res., 111, G02011, https://doi.org/10.1029/2005JG000099, 2006.
Woodcroft, B. J., Singleton, C. M., Boyd, J. A., Evans, P. N., Emerson, J. B., Zayed, A. A. F., Hoelzle, R. D., Lamberton, T. O., McCalley, C. K., Hodgkins, S. B., Wilson, R. M., Purvine, S. O., Nicora, C. D., Li, C., Frolking, S., Chanton, J. P., Crill, P. M., Saleska, S. R., Rich, V. I., and Tyson, G. W.: Genome-centric view of carbon processing in thawing permafrost, Nature, https://doi.org/10.1038/s41586-018-0338-1, 2018.
Wu, Z., Ahlström, A., Smith, B., Ardö, J., Eklundh, L., Fensholt, R., and Lehsten, V.: Climate data induced uncertainty in model-based estimations of terrestrial primary productivity, Environ. Res. Lett., 12, 064013, https://doi.org/10.1088/1748-9326/aa6fd8, 2017.
Yoshimura, K. and Kanamitsu, M.: Dynamical Global Downscaling of Global Reanalysis, Mon. Weather Rev., 136, 2983–2998, https://doi.org/10.1175/2008MWR2281.1, 2008.
Zaehle, S., Friend, A. D., Friedlingstein, P., Dentener, F., Peylin, P., and Schulz, M.: Carbon and nitrogen cycle dynamics in the O-CN land surface model: 2. Role of the nitrogen cycle in the historical terrestrial carbon balance, Global Biogeochem. Cy., 24, GB1006, https://doi.org/10.1029/2009GB003522, 2010.