the Creative Commons Attribution 4.0 License.
the Creative Commons Attribution 4.0 License.
Changing characteristics of runoff and freshwater export from watersheds draining northern Alaska
Svetlana L. Stuefer
Dmitry Nicolsky
The quantity and quality of river discharge in Arctic regions is influenced by many processes including climate, watershed attributes and, increasingly, hydrological cycle intensification and permafrost thaw. We used a hydrological model to quantify baseline conditions and investigate the changing character of hydrological elements for Arctic watersheds between Utqiagvik (formerly known as Barrow)) and just west of Mackenzie River over the period 1981–2010. A synthesis of measurements and model simulations shows that the region exports 31.9 km3 yr−1 of freshwater via river discharge, with 55.5 % (17.7 km3 yr−1) coming collectively from the Colville, Kuparuk, and Sagavanirktok rivers. The simulations point to significant (p<0.05) increases (134 %–212 % of average) in cold season discharge (CSD) for several large North Slope rivers including the Colville and Kuparuk, and for the region as a whole. A significant increase in the proportion of subsurface runoff to total runoff is noted for the region and for 24 of the 42 study basins, with the change most prevalent across the northern foothills of the Brooks Range. Relatively large increases in simulated active-layer thickness (ALT) suggest a physical connection between warming climate, permafrost degradation, and increasing subsurface flow to streams and rivers. A decline in terrestrial water storage (TWS) is attributed to losses in soil ice that outweigh gains in soil liquid water storage. Over the 30-year period, the timing of peak spring (freshet) discharge shifts earlier by 4.5 d, though the time trend is only marginally (p=0.1) significant. These changing characteristics of Arctic rivers have important implications for water, carbon, and nutrient cycling in coastal environments.
- Article
(9032 KB) - Full-text XML
-
Supplement
(564 KB) - BibTeX
- EndNote
The Arctic water cycle is central to a range of climatic processes and to the transfer of carbon, energy, and other materials from the land mass to coastal waters of the Arctic Ocean. Freshwater export to the Arctic Ocean is high relative to the ocean's area (Shiklomanov et al., 2000), and dominated by river discharge (Serreze et al., 2006), which serves as a conveyance for carbon and heat across the land–ocean boundary. Syntheses of data and models have advanced understanding of key linkages and feedbacks in the Arctic system (Francis et al., 2009), mean freshwater budgets across the land, atmosphere and ocean domains (Serreze et al., 2006), and time trends in observations and model estimates over the later decades of the 20th century (Rawlins et al., 2010).
A warming climate is expected to lead to intensification of the hydrological cycle, including increases in net precipitation (P) at high latitudes, and evidence of broad-scale intensification is emerging (Peterson et al., 2002, 2006; Rawlins et al., 2010; Zhang et al., 2013; Bring et al., 2016). A more vigorous water cycle is related in part to both the amount of moisture air can hold and changes in atmospheric dynamics. Shorter ice duration on lakes and longer seasons for evaporation are also manifestations of warming on the Arctic hydrological cycle. Much of the increase in net P is expected to occur during winter (Kattsov et al., 2007), potentially through intensified local surface evaporation driven by retreating winter sea ice and by enhanced moisture inflow from lower latitudes (Zhang et al., 2013; Bintanja and Selten, 2014). An increase in river discharge from Eurasia to the Arctic Ocean was noted in simulations with the HadCM3 general circulation model (Wu et al., 2005), illustrating the potential for increased winter net P to influence freshwater export. Positive trends in column-integrated precipitable water over the region north of 70∘ N, linked to positive anomalies in air and sea surface temperature and to negative anomalies in end-of-summer sea ice extent (Serreze et al., 2012), support the future model projections. Rivers form a primary conduit for transferring terrestrial materials to the coastal ocean, and these materials exert a strong influence on marine ecosystems and carbon processing.
Permafrost warming and degradation has been observed over parts of Alaska, Russia, and Canada (Brown and Romanovsky, 2008; Romanovsky et al., 2010; Smith et al., 2010). In one study permafrost area is projected to decrease by more than 40 %, assuming climate stabilization at 2 ∘C above pre-industrial levels (Chadburn et al., 2017). Warming and permafrost degradation is expected to cause a shift in Arctic environments from a surface-water-dominated system to a groundwater-dominated system (Frey and McClelland, 2009; Bring et al., 2016). There is increasing evidence of impacts of permafrost degradation on biogeochemical cycles on land and in aquatic systems. Recent reported increases in baseflow in Arctic rivers are suggestive of increased hydrological connectivity due to permafrost thaw (Walvoord and Striegl, 2007; Bense et al., 2009; Walvoord and Kurylyk, 2016; St. Jacques and Sauchyn, 2009). Groundwater processes have a dominant role in controlling carbon export from the land to streams in permafrost terrain (Frey and McClelland, 2009; Neilson et al., 2018). In areas where much of the landscape is defined by the absence of permafrost, runoff generation processes can be much different from areas where permafrost is nearly continuous. Dissolved organic matter (DOM) transported by Arctic rivers contain geochemical signatures of the watersheds they drain, reflecting their unique characteristics (Kaiser et al., 2017). Changes in landscape characteristics and water flow paths, as a result of climatic warming and associated active-layer thickening, have the potential to alter aquatic and riverine biogeochemical fluxes (Frey and McClelland, 2009; Wrona et al., 2016; Wickland et al., 2018). Increased flow through mineral soils has been linked to decreases in DOC export from the Yukon River over recent decades (Striegl et al., 2005). In contrast, areas with deep peat deposits that experience thaw may see increasing DOC mobilization and export as permafrost degrades (Frey and Smith, 2005).
This study presents baseline freshwater flux estimates and examines elements of the hydrological cycle across the North Slope over the period 1981–2010. We use measured data to assess model performance and combine with the simulated estimates to quantify freshwater export from the region. We then use the data and model simulations to investigate time changes in runoff and river discharge, the proportion of groundwater runoff, terrestrial water storage, and the timing of peak daily discharge. Salient results in the context of Arctic change and directions for future research are discussed.
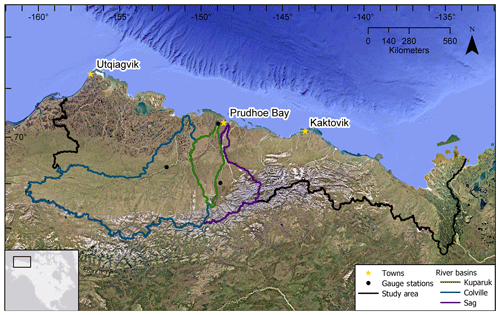
Figure 1Study domain of North Slope of Alaska. Black line delineates the full North Slope drainage basin. This domain includes all land (196 060 km2) which drains to the Beaufort Sea coast. Blue, green, and purple lines mark boundaries for the drainage basins of the Colville, Kuparuk, and Sagavanirktok rivers, respectively. The three dots mark locations where USGS discharge measurements are obtained for each river at, respectively, Umiat, Deadhorse, and Pump Station 3. The 42 individual basins defined by the simulated topological network (STN) are listed in Table S1. Locations shown for population centers Utqiagvik, Prudhoe Bay, and Kaktovik.
The study focuses on the North Slope of Alaska and NW Canada, partitioned by the region's river basins that drain to the Beaufort Sea (Fig. 1). Hereafter we refer to this region as the “North Slope”. The grid is based on the Northern Hemisphere EASE-Grid (Brodzik and Knowles, 2002), with a horizontal resolution of 25 km for each grid cell. The model domain contains 312 grid cells (total area =196 060 km2) that define the North Slope drainage of northern Alaska and NW Canada. It is defined by the drainage basins of rivers (42 total, Table S1 in the Supplement) with an outlet along the coast from just west of the Mackenzie River to Utqiagvik (formerly Barrow) to the west. Hydrologic modeling was performed for the North Slope domain encompassing the 42 watersheds. Many North Slope rivers are oriented roughly north–south, and the region is underlain by continuous permafrost, approximately 250–300 m thick in the Brooks Range and, locally, up to nearly 400 m thick near the coast (Jorgenson et al., 2008).
2.1 Observational data
Observational data used in this study include time series of daily river discharge, end-of-winter snow water equivalent (SWE), and seasonal maximum active-layer thickness (ALT). Historical river discharge data were retrieved from the United States Geological Survey (USGS) for the Kuparuk River (USGS Kuparuk River, 2019) (http://waterdata.usgs.gov/nwis/uv?15896000, last access: 20 January 2019) and Colville River (USGS Colville River, 2019) (https://waterdata.usgs.gov/ak/nwis/uv?15875000, last access: 20 January 2019). Model simulated SWE is evaluated against average end-of-winter SWE from measurements across the Kuparuk River watershed. The measurements from 2000 to 2011 were taken at multiple locations distributed from the Brooks Range to the Beaufort Sea coast to better capture macro-scale SWE variability (Stuefer et al., 2013). The SWE data were collected using depth-integrated density and snow depth measurements across 50 m snow survey transects, with a 1 m sampling interval used along each L-shaped transect. Ten depth measurements were made for each snow depth core measurement.
Simulated ALT from the Permafrost Water Balance Model (PWBM) (Sect. 2.3) is compared with estimates from a high-resolution 1-D heat conduction model (developed by the University of Alaska's Geophysical Institute Permafrost Laboratory, hereafter referred to as GIPL) that incorporated data on ecosystem type and was validated against measured ALT from the Circumpolar Active Layer Monitoring (CALM) program (Nicolsky et al., 2017).
2.2 Reanalysis data
In this study gridded fields of daily surface (2 m) air temperature, precipitation (P), and wind speed are used as model forcings. Obtaining accurate temporally varying P estimates at daily resolution is particular challenging in Arctic environments. Gauge undercatch of solid P is common, the gauge network is sparse, and the number of stations at higher elevation is insufficient (Yang et al., 1998, 2005; Kane and Stuefer, 2015). Meteorological forcings were drawn from the Modern-Era Retrospective Analysis for Research and Applications (MERRA; Rienecker et al., 2011). In a recent intercomparison of P estimates over the Arctic Ocean and its peripheral seas, three reanalyses, ERA-Interim (Dee et al., 2011), MERRA, and NCEP-DOE Reanalysis 2 (NCEP 2) (Kistler et al., 2001), produce realistic magnitudes and temporal agreement with observed P events, while two products (MERRA, version 2 (MERRA-2) and Climate Forecast System Reanalysis (CFSR)) show large, implausible magnitudes in P events (Boisvert et al., 2018). Given a modest low bias in monthly P across the North Slope in MERRA, we derived a new bias corrected daily P time series by scaling the MERRA values by a factor defined using monthly long-term mean P (1981–2010) from MERRA, ERA-Interim, and a data set that blends simulations from ERA-Interim and the polar-optimized Weather Research and Forecast (Polar WRF) model (Cai et al., 2018). Those three data sets exhibit a similar spatial pattern in annual P across the region. Annual P generally ranges from as low as 200 mm yr−1 near the coast to over 400 mm yr−1 over the foothills of the Brooks Range. At each grid cell, the offset ratio was defined as average P from the three data sets divided by the MERRA P amount. The derived daily P (hereafter MERRA*) was then calculated as the daily MERRA P amount multiplied by the offset ratio.
2.3 Hydrological modeling
The regional hydrology is characterized by water fluxes and storages expressed in simulations using a spatially-distributed numerical model. Referenced previously as the Pan-Arctic Water Balance Model (PWBM), the numerical framework encompasses all major elements of the water cycle, including snow storage, sublimation, transpiration, and surface evaporation (Rawlins et al., 2003, 2013). Model input and output fields are resolved at a daily time step. The PWBM simulations are most commonly executed at an implicit daily time step and are often forced with meteorological data. The PWBM has been used to investigate causes behind the record Eurasian discharge in 2007 (Rawlins et al., 2009), to corroborate remote sensing estimates of surface water dynamics (Schroeder et al., 2010), and to quantify present and future water cycle changes in the area of Nome, Alaska (Clilverd et al., 2011). In a comparison against observed river discharge, PWBM-simulated SWE fields compared favorably (Rawlins et al., 2007). Soil temperatures are simulated dynamically through a 1-D nonlinear heat conduction with phase change scheme embedded within the PWBM (Rawlins et al., 2013; Nicolsky et al., 2017). The PWBM includes a multi-layer snow model that accounts for wind compaction, change in density due to fresh snowfall, and depth hoar development with time. Runoff is the sum total of surface (overland) and subsurface flow each day. Subsurface runoff occurs when the amount of water in a soil layer exceeds field capacity.
The model is well suited for application across the North Slope region. Active-layer thickness (ALT) simulated using the PWBM was found to be more similar to in situ observations and airborne radar retrievals in continuous permafrost areas than in lower permafrost probability areas (Yi et al., 2018). The influence of snow cover and soil thermal dynamics on the seasonal and spatial variability in soil CO2 respiration has been quantified by coupling PWBM to a dynamic soil carbon model (Yi et al., 2013, 2015). A key model attribute is its ability to dynamically simulate the direct influence the snowpack exerts on soil temperature (Yi et al., 2019), with deeper snowpacks promoting warmer soils and associated effects, such as enhancement of soil decomposition and respiration from deeper (≥0.5 m) soil layers (Yi et al., 2015). Detailed descriptions of the PWBM can be found in Rawlins et al. (2003, 2013); Yi et al. (2015, 2019) and Appendices within.
In this study we applied an updated version of the model, and given its detailed representation of soil freeze–thaw processes, rename it the “Permafrost Water Balance Model” (hereafter PWBM v3). Recent modifications included the incorporation of new data and parameterizations for surface fractional open water (fw) cover, soil carbon content, and transient ponded surface evaporation and runoff. Updates to the spatial estimates of fw were drawn from a product derived from brightness temperature (Tb) retrievals from the Advanced Microwave Scanning Radiometer for EOS (AMSR-E) (Du et al., 2017) to parameterize the grid cell fraction of open water (annual average) across the model domain. Properties of near surface organic-rich soils strongly control hydrological and thermal dynamics in the seasonally thawed active layer. We used soil organic carbon (SOC) estimates from version 2.2 of the Northern Circumpolar Soil Carbon Database (NCSCD), a digital soil map database linked to extensive field-based SOC storage data (Hugelius et al., 2014). The database contains SOC stocks for the upper 0–1 m and for deeper soils from 1–2 and 2–3 m depth. In the updated PWBM v3 the sum total of SOC in the upper 3 m was used to derive the organic layer thickness as described in Rawlins et al. (2013). The resulting spatially varying parameterizations of soil carbon profiles (% of volume) with depth over the domain (Fig. S1a in the Supplement) influence soil thermal properties and hydrological storages and fluxes. Broad agreement exists in the spatial pattern of the independent soil carbon and soil texture data sets (Fig. S1a, b). Sandy soils and soil carbon thicknesses under 20 cm occur over the Brooks Range, and relatively higher soil carbon thicknesses and loam soils are present across the tundra to the north. Based on analysis of initial model simulations we increased soil carbon amounts by 10 % in areas (24 grid cells) of sandy soils and reassigned the texture to loam, making the parameterizations more consistent with soil textures inferred from high-resolution ALT mapping using the GIPL model that incorporated data on ecosystem type (Nicolsky et al., 2017).
The PWBM was run in a 50-year spinup over the year 1980 to stabilize soil temperature and water storage pools. This spinup was followed by a 30-year transient simulation over the period 1981–2010, the focus of our analysis. Model calibration is performed to adapt the model and optimize its performances in simulating the water cycle across the study domain and involved the surface transient storage pool and river flow velocity. Transient surface storage consists of water connected to the surface flow that is delayed in its transport to stream networks. Parameters controlling evaporation and runoff fluxes from surface storage were modified to better account for delays in water reaching stream channels. We define Ei, Ri, and Si to represent evaporation (or evapotranspiration) (mm d−1), runoff (mm d−1, and storage (mm) in soil layer i, respectively. In turn, E0, R0, S0 are evaporation, runoff, and storage from the model surface layer, (mm d−1). In the updated model c=0.40, reduced from the prior value of 0.75. Evaporation from surface storage is , with g now reduced to one-third of the potential evapotranspiration rate.
To simulate river discharge (Q), model estimated R was routed through a simulated topological network (STN) (Vörösmarty et al., 2000) and expressed as a volume flux at each grid cell including coastal outlets of 42 watersheds defined at the 25 km scale draining from Utqiagvik (formerly known as Barrow) to just west of the Mackenzie River delta. A simple linear routing model was used given the relatively short travel times through the North Slope basins. Water transferred to the downstream grid or exported at the coast is
where Qout (m3 s−1) is grid cell Q flow downstream, v is flow velocity (m s−1), d is the distance between grid cells (m), and S is volume of river water (m3). Miller et al. (1994) suggested a global average of v=0.35 m s−1. Given the relatively flat topography over much of the domain, we set effective velocity at v=0.175. Hereafter in this study, R represents runoff expressed in unit depth and obtained from either a model simulation or measured Q distributed over the respective watershed area. Q represents river discharge (volume), obtained from R propagated through the routing model or USGS-measured data. Model validation includes comparisons of model simulated R against observed data for the Kuparuk River at Deadhorse near the coast, and for the Colville River, observed data for the subbasin defined by the gauge at Umiat (area =36 447 km2). For the Colville at Umiat we derived a “composite” Q by applying a relative bias correction factor, obtained from the ratio of observed and simulated values, to model simulated Q. The bias correction is defined as the observed daily (climatological, 2002–2010) Q divided by simulated Q from the subbasin captured by the gauge at Umiat, Alaska. The composite simulated daily Q was then estimated by multiplying the non-bias corrected simulated Q with the bias correction factor. The volume of freshwater export from the Colville at the Beaufort Sea coast is this Q plus the volume flux derived by applying the bias correction factors to Q from the ungauged lower (northern) subbasin.
An assessment of several model simulated quantities was made using average error and correlation. Model evaluation metrics based on squared values like the root mean square error (RMSE) are known to be biased and highly sensitive to outliers (Willmott and Matsuura, 2005; Willmott et al., 2015). Statistical significance was calculated using the Mann–Kendall test statistic (Hamed and Rao, 1998; Yue et al., 2002), with a 95 % confidence level (p<0.05) designated as statistically significant. Time changes are estimated with a general linear model (GLM). We applied the modified Mann–Kendall test (Hamed and Rao, 1998) for terrestrial water storage (TWS) and its component storages of snow (water equivalent), soil liquid water, and ice amounts. A one or a two-sided test was used depending on whether the direction of change was assumed. For example, we posit null hypotheses that the region is experiencing increasing cold season discharge as a result of increasing ALT.
3.1 Active-layer thickness
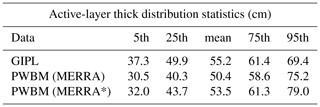
We calculated maximum seasonal ALT from daily soil temperatures in a model simulation with meteorological forcing from bias corrected MERRA reanalysis (MERRA* P) is evaluated alongside ALT predicted from the GIPL model. Area-averaged ALTs from PWBM and from the GIPL are 53.5 and 55.2 cm respectively, a difference of ∼3 % (Fig. S2, Table 1), and this is the smallest difference among average ALT derived from soil temperatures in simulations using alternate meteorological forcings. Simulated ALT exhibits the expected north–south spatial gradient which reflects the gradient in summer (and annual) air temperature (Fig. S3). Agreement between PWBM and GIPL is strongest in coastal areas and differ most near the center of the domain, where PWBM produces relatively smaller ALT compared to GIPL. The differences increase toward the extremes of each field, pointing to higher-spatial variability in the PWBM simulations (Fig. S2). ALT from a simulation forced with non-bias-corrected MERRA P are shallower and less in agreement with the GIPL data.
3.2 Snow water equivalent
In the Kuparuk River basin, maximum end of season SWE typically occurs near the end of April. Simulated end of season SWE is the average of daily values from 24 April to 7 May, averaged across all basin grid cells. Average simulated SWE largely tracks the interannual variations in measured end of season SWE over the period 2000–2010, with an average difference of 5.3 mm or 4.8 % of the average (109.7 mm) of the field measurements (Fig. S4). The Pearson correlation coefficient is r=0.78, with the relationship significant at p<0.01 (Fig. S5).
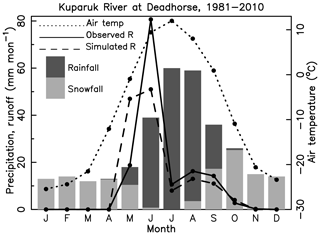
Figure 2Simulated and observed runoff (R, mm month−1) for the Kuparuk River basin 1981–2010. Simulated R expressed in unit depth was calculated from the routed river discharge (Q) volume. Observed R was drawn from the USGS Water Data for the Nation database (USGS Kuparuk River, 2019) (Sect. 2.1). The PWBM simulation was forced with meteorological data from the MERRA reanalysis, with precipitation adjustment (MERRA*) as described in Sect. 2.2. Monthly air temperature is the average over the Kuparuk basin from the MERRA data used in the model simulation. Monthly climatological precipitation (P) shown in totals (mm month−1) for rainfall and snowfall.
3.3 Runoff and river discharge
3.3.1 Spring freshet
Modeled runoff (R) from the simulation forced with MERRA* is evaluated against observed R for the Colville and Kuparuk River watersheds. USGS measurements for the Kuparuk River at Deadhorse over the period 1981–2010 show that an average of 98.3 mm of runoff (R) is exported as discharge during the spring freshet, which we calculate as total R from day of year (DOY) 100 to 180, from mid April through June (Figs. 2, 3b). Across the North Slope this period is dominated by snowmelt runoff. Simulated R over the freshet period totals 98.0 mm. Simulated May R exceeds observed R by 28.2 mm month−1, while simulated June R is 29.7 mm month−1 lower than observed R, resulting in the relatively small error (percent difference +0.3 %) in total R over the freshet period. Simulated R closely tracks observed R in other months of the year with flow (Fig. 2).
The simulated and observed comparison for the Colville River (2002–2010) shows the timing of snowmelt-driven R well captured (Fig. S6a). Simulated R is underestimated in summer, notably in 2004 and 2006. Averaged over the 9-year period, daily climatological composite R following bias correction shows the freshet period generally well captured (Fig. 3a). Average error for the freshet period is 2.6 % (simulated R=132.6 mm yr−1, observed R=129.2 mm yr−1). Applying this correction (Sect. 2.3) helps to ameliorate biases, in part through use of measured data when available (June–September) and model simulated estimates during the remainder of the year. The timing of simulated maximum daily Q closely matches the timing based on the measured data (Fig. 3a). For the Kuparuk River, simulated maximum freshet R leads observed R by approximately 1 week (−7.8 d, Figs. 3b and S6b, c). For this region the flow routing sub-model is relatively insensitive to the specified flow velocity. Two sensitivity simulations using a velocity 33 % lower and 33 % higher than the default velocity (v=0.175 m3 s−1) resulted in errors of −5.4 and −9.0 d respectively. Many of the rivers in this region are shorter in length than the Kuparuk, and flow travel times are relatively brief.
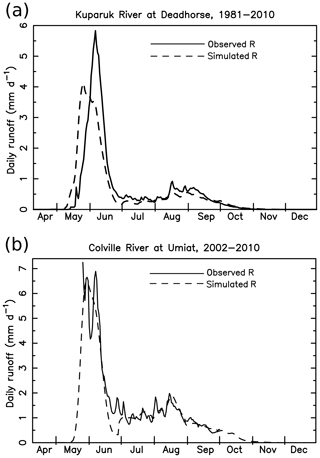
Figure 3Simulated and observed runoff (R, mm d−1) for the (a) Colville River at Umiat, AK and (b) Kuparuk River at Deadhorse AK. Data for the Colville River (USGS Colville River, 2019) is available from May until early October since 2002. Runoff calculated as unit depth as in Fig. 2. Methodology used for deriving simulated composite R for the Colville is described in Sect. 2.3.
3.3.2 Annual runoff
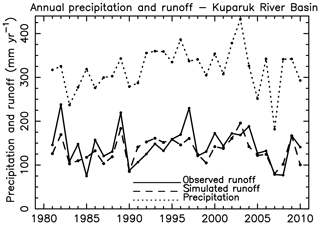
For the Kuparuk River, annual total R as the long-term (30 years) average from USGS observations and from the model simulation is 144 and 134 mm yr−1, respectively (percent difference %) (Fig. 4). Simulated annual R is correlated with observed annual R (Pearson correlation r=0.74, p<0.001, Fig. S7). Observed R varies from 75–238 mm yr−1, while simulated R is more conservative, extending over a range from 90–200 mm yr−1. In other words, the model tends to underestimate R in years when observations are high and overestimate R in years with low flow. For measured R partitioned at R<100, , and R>200 mm yr−1, average errors are +24.5, −1.8, and −52.2 mm yr−1, respectively. It is notable that in both 1996 and 2003 annual R is higher in the year following a peak (within a several year span) in annual P. This lag highlights the role that antecedent storage plays in the region's river discharge regimes, and is consistent with previous research (Bowling et al., 2003; Stuefer et al., 2017).
4.1 Annual precipitation and river discharge
For the period 1981–2010, annual total P averaged across the North Slope drainage basin ranged from 195 (1990) to 383 mm yr−1 (2003) based on the adjusted MERRA* P data. Annual total P over the Kuparuk Basin varied from 182 (2007) to 433 mm yr−1 (2003) (Fig. 4). There is no significant trend in observed or simulated annual P or R for the Kuparuk (Fig. 4), or any other river over the 30 yr period. Much higher annual runoff has been documented for the Kuparuk River in 2013, 2014, and 2015 (Stuefer et al., 2017). The spatial pattern in annual R (Fig. 5a) reflects a similar gradient expressed in annual P from the coast southward into the Brooks Range, as R in this region is largely controlled by variations in snow storage. Annual R averages over 250 mm yr−1 across parts of the Brooks Range, while coastal areas average under 100 mm yr−1.
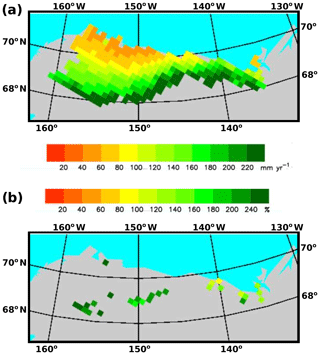
Figure 5(a) Annual total R 1981–2010 (mm yr−1) from the model simulation and (b) grid cells with a statistically significant (p<0.05) change in simulated cold season (November–April) Q over the period 1981–2010. The change is shaded as a percentage of the 30-year average for cold season R for that grid. White outlines are basin boundaries for the (west to east) Colville, Kuparuk, and Sagavanirktok rivers.
Simulated R is routed through the STN and expressed as a volume flux of river discharge (Q) at the Beaufort Sea coast. There is a notable absence of routine monitoring of Q at river outlets near the coast. The Colville, Kuparuk, and Sagavanirktok rivers are the three largest gauged North Slope rivers and occupy 46.2 % of the study domain. Measurements for the Kuparuk River at Deadhorse have been made year round since the 1970s and capture flow from most of the basin. Data for the Colville at Umiat have been available from late May until early October since 2002, but Q from just 56 % of the Colville's total basin area is accounted for at that location. Data for the Sagavanirktok at Pump Station 3 have been available from June through September since 1995. That site is far from the coast and captures Q from only 30 % of the basin. Given these constraints, we estimated baseline Q exports using the measured data for the Kuparuk River, the composite Q for the Colville, and simulated Q for the remainder of the study domain.
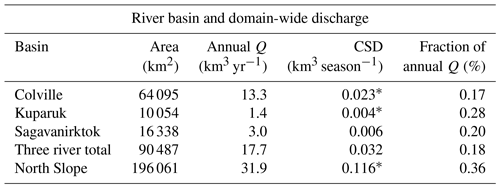
Annual Q (1981–2010) for the Kuparuk River based on the USGS observations is 1.4 km3 yr−1 (144 mm yr−1) (Table 2). The model simulated Q of 1.3 km3 yr−1 closely aligns with the observations and matches the 1.3 km3 yr−1 for 2000–2007 reported by McClelland et al. (2014) based on model simulations using a catchment-based land surface model (CLSM). The bias adjusted data–model composite for the Colville River subbasin defined by the gauge at Umiat (36 447 km2) gives a total Q of 8.7 km3 yr−1. Applying the bias correction to Q for the ungauged lower subbasin (27 648 km2) produces 4.6 km3 yr−1 for that region. With 8.7 km3 yr−1 for the Umiat subbasin, total Q for the entire (64 094 km2) Colville basin is 13.3 km3 yr−1 (Table 2). This compares favorably to the 16 km3 yr−1 described by Arnborg et al. (1966) based on measurements in 1962, and it is lower than the 19.7 km3 yr−1 (2000–2007) from McClelland et al. (2014). PWBM simulated Q (1981–2010) for the Sagavanirktok of 3.0 km3 yr−1 is bracketed by the 1.6 km3 yr−1 for 2000–2007 estimated by McClelland et al. (2014) and the 6.5 km3 yr−1 for 1971–2001 estimated by Rember and Trefry (2004) using USGS data. Our composite estimate for the Colville River (13.3 km3 yr−1), measured Q for the Kuparuk (1.4 km3 yr−1) and modeled Q for the Sagavanirktok (3.0 km3 yr−1) totals to 17.7 km3 yr−1 for the three rivers combined, which is approximately 55.5 % of total annual Q (31.9 km3 yr−1) for the North Slope drainage basin (Table 2).
Table 2River basin area, annual discharge (Q), and cold season discharge (CSD) for the Colville, Kuparuk, and Sagavanirktok rivers and the full North Slope domain. River basins with a significant increase in CSD are indicated with a superscript *. Basin areas are based on the gridded 25 km simulated topological river network.
4.2 Cold season discharge (CSD)
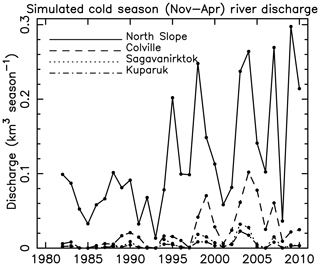
Over the period 1981–2010, simulated cold season (November–April) discharge (CSD), averaged across the study region, is 0.116 km3 season−1, 0.4 % of annual total Q. It is approximately 0.2 %–0.3 % of annual Q for the Colville, Kuparuk, and Sagavanirktok rivers, respectively. Much of the CSD occurs in November and December, with little flow thereafter until spring thaw. CSD averaged across the North Slope drainage basin, and both the Colville and Kuparuk rivers, increased significantly (Mann–Kendall test, p<0.05, Table 2, Fig. 6). The CSD increase for the Colville is 215 % of the long-term average. For the full North Slope basin CSD increased 134 % of the long-term average. Increasing CSD is noted across 9.0 % of the domain, and 28.4 % of the Colville basin, primarily in headwater catchments of the foothills of the Brooks Range (Fig. 5b). In total the affected terrain covers 88 601 km2 or 45 % of the North Slope drainage basin.
4.3 Fraction of subsurface runoff
We examine variations in simulated surface and subsurface R through the year to better understand how warming is altering the hydrological flow regime. For the region as a whole the fraction of subsurface runoff to total runoff (hereafter, Fsub) increased 4.4 % (p<0.01), a 31 % change relative to the 30-year average of 14 %. Both the Colville and Sagavanirktok rivers show statistically significant (p<0.05) increases in Fsub, as do 20 of the 40 remaining basins. Significant increases are noted during several months, most widespread in September (58 of 312 grid cells, 18.6 % of domain) (Fig. 7). Conversely, July shows a decrease in Fsub, although over less total area (5.4 % of domain). For June and September, the grid cell change in the Fsub averages 34.8 % and 40.2 %, respectively, for the total change over the period. For July the average is −38.3 %, with 17 grids showing a decrease and 2 grids an increase. At the annual timescale the increase in Fsub is significant for 24.7 % of the study domain, most notably across the northern foothills of the Brooks Range from the western part of the region (Colville Basin) eastward and toward the coast (Fig. 8). Fsub is consistently 100 % of total runoff after October. Areas with increasing Fsub are co-located with the areas experiencing increasing CSD.
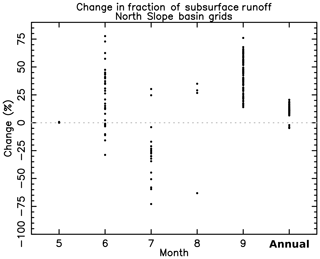
Figure 7(a) Grid cell change in fraction of subsurface R (Fsub) for warm season months May–September and for annual total Fsub and R. Fsub changes are not defined for other months due to Fsub being consistently at 100 %, or the grid cell having no runoff for that month in more than 50 % (15 of 30) of the data years. Change is expressed with respect to the long-term average. Dots represent grid cells that show a significant change at p<0.05. Average for grids with a significant change at the annual scale is +11.0 %.
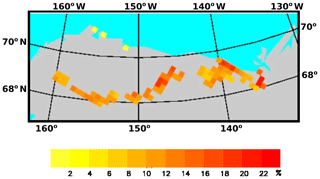
Figure 8Change in Fsub (%) over the period 1981–2010. Mapped grids show a significant change at p<0.05 based on a two-sided test.
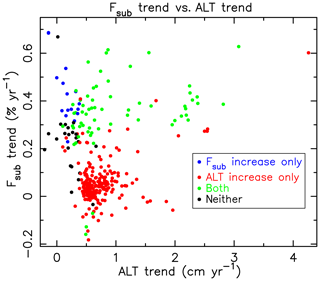
Increasing Fsub is noted in areas with a significant increase in active-layer thickness (ALT), primarily across parts of the northern foothills of the Brooks Range and the smaller watersheds near 140∘ W longitude (Fig. 9). Statistically significant increases in ALT are widespread, noted across two-thirds (66.7 %) of the region. The simulation shows that one-fifth (20.2 %) of the region experienced a significant increase in both Fsub and ALT (p<0.05, Table 3). A fraction of the foothills region (5.1 % of domain) is characterized by a positive trend in Fsub only. The ALT trend average for grid cells with a significant increase in Fsub only, a significant increase in ALT only, and a significant increase in both are 0.17, 0.75, and 1.00 cm yr−1, respectively (Fig. 10, Table 3). These relatively large ALT increases in areas of significant Fsub increase indicate a connection between enhanced permafrost thaw and subsurface water flow in those areas.
Table 3Number of grid cells, associated area fraction of domain, and average ALT and Fsub for each category shown. Study domain consists of 312 grid cells spanning an area of 196 060 km2 (Fig. 1).

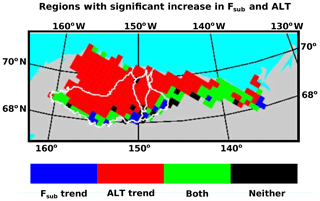
Figure 9Spatial extent of regions showing a significant increase in annual Fsub only (blue), a significant increase in active-layer thickness (ALT) only (red), significant increases in both (green), and neither (black). The number of grid cells, area fraction impacted, and average Fsub and ALT increase for each category are shown in Table 3.
4.4 Terrestrial water storage
Terrestrial water storage (TWS) over a given time interval is defined by the total amount of water stored in snow, soil liquid water, and soil ice as estimated by the model simulation. Over the 1981–2010 period annual, average TWS (all 312 domain grids) exhibits a negative trend of approximately −2 mm yr−1 (p<0.001, Fig. 11). Declines in annual minimum (−1.7 mm yr−1) and maximum TWS (−2.3 mm yr−1) are also significant. Among the component storages there is no significant change in SWE over the 30-year period (Fig. S8). Increases in regionally averaged maximum and minimum soil liquid water, and decreases in soil ice amounts, are significant (p<0.01, modified Mann–Kendall test). The −2 mm yr−1 decrease in TWS reflects a decrease in soil ice storage of −2.5 mm yr−1, a decrease in SWE of −0.16 mm yr−1, and an increase in soil water storage of 0.61 mm yr−1.
4.5 Timing of maximum daily discharge
Warming and associated changes in snowmelt are expected to shift the timing of peak discharge (Q) during the spring freshet period. Maximum daily Q was computed for each of the 42 North Slope domain rivers from the respective routed daily Q. Three of the 42 basins exhibit a significant (p<0.05) shift to earlier maximum daily Q over the 1981–2010 period (Fig. S9). None show a significant shift to later. While many rivers show simulated peak discharge shifting 1 week or more earlier, high interannual variability renders most of the changes insignificant. The average date of maximum daily Q across the 42 basin advanced by approximately 4.5 d (Fig. 12), though the change is only marginally significant (p=0.1). As a regional average, maximum daily Q occurs around DOY 150 (end of May), though this estimate may be biased given the comparison between simulated and observed R for the Kuparuk River (Sect. 3.3).
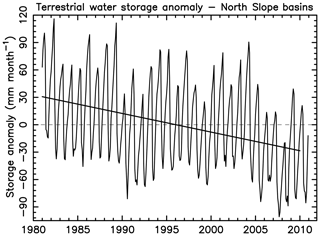
Figure 11Terrestrial water storage (TWS) anomaly (mm month−1) as an average across the North Slope drainage basin. Anomaly calculated with respect to the long-term 1981–2010 average. In the PWBM, TWS includes soil liquid water, ice, and snow storage. It does not include water stored in permanent water bodies such as ponds and lakes.
Recent studies have investigated how hydrological cycle intensification and permafrost thaw may alter terrestrial hydrological fluxes and, in turn, materials export to coastal zones (Walvoord and Striegl, 2007; Frey and McClelland, 2009; Rawlins et al., 2010; Spencer et al., 2015; Vonk et al., 2015). Changes unfolding across high-latitude watersheds have the potential to significantly alter water, carbon, and other constituent fluxes, with implications for nearshore Arctic biogeochemical and ecological processes.
Our synthesis of measured data and model simulations reveals that approximately 32 km3 yr−1 of freshwater is exported by the region's rivers, with 55.5 % of the total originating from the Colville, Kuparuk, and Sagavanirktok rivers. Simulated runoff for the Kuparuk River shows maximum daily spring discharge that exhibits a systematic bias of approximately 8 d early relative to gauge data. Timing is well estimated for the Colville River. The timing bias for the Kuparuk is at most partially attributable to the specification of river flow velocity in the routing scheme and likely due to errors in air temperature forcing or modeled snowmelt processes (warm bias) that lead to early snowpack thaw. Insufficient surface storages in the model tend to delay the transfer of water to stream network and may also be a factor. Simulated R timing may improve by better accounting for these lags in snowmelt runoff. Future studies should investigate whether dynamic surface inundation data obtained from microwave and radar remote sensing (Schroeder et al., 2010; Du et al., 2016) can be used to constrain surface water storage, its partitioning to runoff and evaporation, and flow direction in areas of low topographic relief. The lag in annual runoff for the Kuparuk River in 1996 and 2003 highlight how precipitation and antecedent storage conditions can influence the following year's runoff (Bowling et al., 2003; Stuefer et al., 2017).
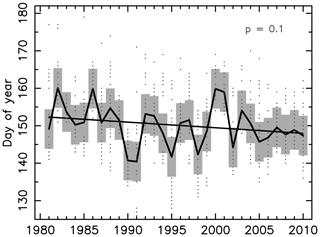
Figure 12Date of maximum daily Q 1981–2010 for all 42 North Slope rivers. Gray bar shows the 1σ range around the average date (solid line). Dots indicate the date for each river. Linear least squares trend shown. Significance of linear trend (GLM) is approximately p=0.1.
The quantity and quality of freshwater land–ocean export is expected to change significantly as the Arctic hydrological cycle intensifies and the system transitions toward increasing groundwater water flows (Frey et al., 2007; Frey and McClelland, 2009). In this study evidence of change is evident in cold season discharge from the North Slope region over the 30-year (1981–2010) study period. There is no significant trend in annual total discharge for the region or its rivers. However, we note that the Kuparuk and nearby Putuligayuk River experienced high annual runoff in 2013, 2014, and 2015 (Stuefer et al., 2017) consistent with expectations under an intensifying Arctic hydrological cycle (Wu et al., 2005; Rawlins et al., 2010). Climate models project a future increase in Arctic precipitation that is generally greatest in autumn and winter and smallest in summer, and greatest over the higher latitudes of Eurasia and North America (ACIA, 2005; Kattsov et al., 2007). Higher winter snowfall across the North Slope would likely lead to increased freshwater export. The model simulation shows increases in cold season discharge of 134 % and 215 % of the long-term average for the North Slope (domain total) and Colville River, respectively. Basins showing a significant increase in cold season discharge cover 45 % of the region. Within the Colville Basin, the changes are greatest in headwater catchments of the northern foothills of the Brooks Range (Fig. 5b). Landscape conditions in those areas strongly influence the quality of water exported during the first half of winter, including the solubility, chemical character, and biodegradability of carbon, nitrogen and other nutrients (Wickland et al., 2018). Effects of permafrost thaw on soil infiltration, flow-path length, and subsurface water movement has been identified in the observed rise in low flows in parts of the Arctic (St. Jacques and Sauchyn, 2009; Smith et al., 2007; Walvoord and Striegl, 2007). The controls permafrost exerts have been implicated in the observed increase in the ratio of maximum to minimum monthly discharge in the continuous permafrost regions of the middle and lower Lena River basin (Gautier et al., 2018), linked with increased CSD from 1935 to 1999 (Yang et al., 2002). More broadly, cold-season low-flow is increasing over most of the pan-Arctic (Rennermalm et al., 2010).
Our results also show changes in the proportion of subsurface runoff for the region as a whole, and individually the Colville, Sagavanirktok, and 22 of the other 40 river basins. As with cold season discharge, the simulation points to increases across the foothills and higher elevations of the northern Brooks Range. The growing subsurface flows are contributing to the increasing cold season discharge amounts, with the most significant changes in both quantities found across headwaters of several of the larger basins (Colville and Sagavanirktok), as well as areas near the coast east of approximately 140∘ W. Increases in both subsurface runoff and cold season discharge are expected manifestations of climate warming in this region, as active-layer thaw depths are highly responsive to warming air temperatures (Hinkel and Nelson, 2003). Approximately 20 % of the region, the Brooks Range foothills and smaller watersheds near 140∘ W, shows significant increases in both the fraction of subsurface runoff and active-layer thickness. The active-layer increase is greatest in those areas experiencing growing subsurface runoff contributions. This result illustrates the connection between thawing soils and changing subsurface flows.
A deepening active layer associated with climate warming will likely lead to a longer unfrozen period in deeper soils (Yi et al., 2019), enhancing subsurface runoff flow. A deeper active layer delays the soil freeze up and increases the amount of liquid pore water. A larger thawed zone permits additional water storage that supports runoff in late autumn, before soils freeze completely. The changes captured in the modeling are consistent with the notion that permafrost thaw enhances hydrogeologic connectivity and increases low flows in permafrost regions (Bense et al., 2009, 2012; Bring et al., 2016; Lamontagne-Hallé et al., 2018). Observational and modeling studies suggest that permafrost thaw can lead to increased subsurface runoff and cold season discharge, as increasing thickness of the thawed zone and shallow aquifer provide a conduit for flow to rivers (Walvoord and Striegl, 2007; Bense et al., 2009; Walvoord and Kurylyk, 2016; Lamontagne-Hallé et al., 2018). Alternatively, changes within continuous permafrost zones can also arise where permafrost is locally discontinuous, or through flow from unfrozen surface water bodies. Permafrost thaw is enhancing deeper flow path and contributing to the development of taliks, unfrozen material formed by hydrothermal and thermal processes near and beneath the ground surface within permafrost, which produce flow paths that allow subsurface runoff to emerge as streamflow. The development of new taliks has been hypothesized as the primary mechanism contributing to increased groundwater storage across the Alaskan Arctic coastal plain (Muskett and Romanovsky, 2011).
Evidence of permafrost thaw and increasing groundwater flow has been reported in studies using measurements from Arctic rivers. Recent increases in nitrate concentrations and export from the Kuparuk River are consistent with permafrost degradation and deepening flow paths (McClelland et al., 2007). “Old” carbon measured in Arctic rivers indicates mobilization of pre-industrial organic matter and subsequent transfer to rivers (Schuur et al., 2009; Mann et al., 2015; Dean et al., 2018). St. Jacques and Sauchyn (2009) concluded that increases in winter baseflow and mean annual streamflow in the Northwest territories, Canada, were caused predominately by climate warming via permafrost thawing that enhances infiltration and deeper flow paths and hydrological cycle intensification (Frey and McClelland, 2009; Bring et al., 2016). The magnitude of subsurface runoff change in our study should be viewed with caution given the intrinsic resolution of model parameterizations for soil texture, organic layer thickness, and other landscape properties. Our results, however, do point to a close correspondence between active-layer thickness and subsurface runoff increases across the foothills of the Brooks Range. The enhanced changes there suggest that the relatively thin surface organic layer and sandy soils in the foothills areas may be seeing a relative larger impact from warming on soil thaw. Our results thus lend additional support to findings in other recent studies which have pointed to more substantial impacts of warming on permafrost thaw in areas with relatively low vegetation and low soil organic content (Yi et al., 2019; Jones et al., 2019). For example, Yi et al. (2019) used soil temperature estimates from the PWBM to show that ALT deepening across much of the Brooks Range has been greater than in the tundra to the north (Yi et al., 2018).
Consistent with recent warming and associated ALT increases, our results suggest an overall decline (−2 mm yr2) in terrestrial water storage across the North Slope drainage basin over the 1981–2010 period. This decrease is driven by losses in soil ice, with an increase in liquid water storage which does not fully offset the ice losses. With continued warming it is likely that the timing of snowmelt will advance, with impacts to the timing of peak (maximum daily) spring discharge. Averaged across all 42 basins, the date of daily maximum discharge advanced 4.5 d over the 1981–2010 period, though the change is only marginally significant (p=0.1) at the 95 % confidence level. Individual river basins show larger shifts to earlier peak discharge.
Modeling studies of the impacts of climate warming on permafrost thaw and groundwater discharge are key to our understanding of lateral hydrological flows and associated constituent exports. The underestimate in summer runoff for the Colville River is likely attributable to errors in the meteorological forcings and the model simulation of fluxes including snow sublimation and evapotranspiration. Solid precipitation observations in this region are highly uncertain (Scaff et al., 2015), and this lack of information hinders verification of reanalysis precipitation products and associated studies of changes in seasonal precipitation, which may be playing a role in the hydrological alterations. Results of this study should be corroborated through evaluation of simulations produced with alternate forcings and through parameter sensitivity analysis. The good agreement for the Kuparuk River and the underestimate in simulated summer discharge for the Colville River point to the need for improved estimates of precipitation across higher elevations of the Brooks Range. A fuller understanding of the extent of water cycle alterations in this region will require new observations of river discharge, precipitation, snow storage, soil moisture, and other key variables needed to parameterize and validate numerical models, including those which capture the important role ground ice plays in runoff generating processes. Measurements of river discharge and dissolved organic carbon at multiple locations along the coast are critical to an improved understanding of land–ocean carbon exports. Regarding linkages with biogeochemical fluxes, water samples from the mouths of major Arctic rivers show that dissolved organic carbon in those rivers is sourced primarily from fresh vegetation during the 2 months of spring freshet and from older, soil-, peat-, and wetland-derived DOC during groundwater-dominated low flow conditions (Amon et al., 2012). Stable isotope data obtained from river water samples can be used to partition surface and groundwater water flows and better understand how soil drainage and soil moisture redistribution will change with future permafrost thaw and ALT deepening (Walvoord and Kurylyk, 2016).
High-performance computing is helping to provide insights into hydrological flows and biogeochemical cycling in Arctic environments (Lamontagne-Hallé et al., 2018; Neilson et al., 2018). Improvements in numerical model simulations of groundwater flow regimes in permafrost areas have provided insights on the important roles that microtopography and soil properties play in groundwater runoff regimes. Model calibration and validation for simulations at finer spatial scales is dependent on new field measurements of parameters such as water table height, active-layer thickness, and soil organic carbon content with depth. Simulations for future conditions in the region should take into account processes directly influenced by permafrost thaw (Bense et al., 2012; Lamontagne-Hallé et al., 2018). To overcome challenges in deriving parameterization from multiple disparate data sets, high-resolution ecosystem maps of the Alaska North Slope can provide a convenient upscaling mechanism to parameterize ground soil properties across the region (Nicolsky et al., 2017). Given its considerable effect on soil thermal and hydraulic properties, modeling efforts will benefit from improved mapping of soil organic matter.
Model outputs are available through the Long Term Ecological Research (LTER) Network Data Portal at https://doi.org/10.6073/pasta/2c1cd0c1d3f0f257d9dac659314bc777 (Rawlins, 2019a). Source code is available from https://blogs.umass.edu/csrc/pwbm (Rawlins, 2019b). Observed river discharge data are available from the USGS (https://waterdata.usgs.gov/usa/nwis/uv?15896000, USGS Kuparuk River, 2019 and https://waterdata.usgs.gov/ak/nwis/uv?15875000, USGS Colville River, 2019). Other data will be made available upon request.
The supplement related to this article is available online at: https://doi.org/10.5194/tc-13-3337-2019-supplement.
MAR led the conceptualization, data curation, formal analysis, funding acquisition, investigation, methodology, resources, software, validation, visualization, and writing. LC, SLS, and DN supported data curation and writing.
The authors declare that they have no conflict of interest.
We thank the editor and three anonymous reviewers for comments which helped to improve the paper. We thank Jinyang Du for assistance with the surface fractional open water product and Raymond Bradley, John Kimball, and James McClelland for insightful comments on an earlier version of the paper.
This research has been supported by the Beaufort Lagoon Ecosystems Long Term Ecological Research program (BLE LTER) under the National Science Foundation, Division of Polar Programs (grant no. NSF-OPP-1656026), the National Aeronautics and Space Administration (grant no. 80NSSC19K0649), the U.S. Department of Energy, Office of Biological and Environmental Research (grant no. DE-SC0019462 and Next Generation Ecosystem Experiment (NGEE-Arctic) project), and the State of Alaska.
This paper was edited by Philip Marsh and reviewed by three anonymous referees.
ACIA: Arctic Climate Impact Assessment, Cambridge University Press, New York, 1042 pp., 2005. a
Amon, R., Rinehart, A., Duan, S., Louchouarn, P., Prokushkin, A., Guggenberger, G., Bauch, D., Stedmon, C., Raymond, P., Holmes, R., McClelland, J. W., Peterson, B. Walker, S. A., and Zhulidovk, V.: Dissolved organic matter sources in large Arctic rivers, Geochim. Cosmochim. Ac., 94, 217–237, https://doi.org/10.1016/j.gca.2012.07.015, 2012. a
Arnborg, L., Walker, H. J., and Peippo, J.: Water discharge in the Colville River, 1962, Geogr. Ann. A, 48, 195–210, 1966. a
Bense, V., Ferguson, G., and Kooi, H.: Evolution of shallow groundwater flow systems in areas of degrading permafrost, Geophys. Res. Lett., 36, L22401, https://doi.org/10.1029/2009GL039225, 2009. a, b, c
Bense, V. F., Kooi, H., Ferguson, G., and Read, T.: Permafrost degradation as a control on hydrogeological regime shifts in a warming climate, J. Geophys. Res.-Earth, 117, F03036, https://doi.org/10.1029/2011JF002143, 2012. a, b
Bintanja, R. and Selten, F. M.: Future increases in Arctic precipitation linked to local evaporation and sea-ice retreat, Nature, 509, 479–482, 2014. a
Boisvert, L. N., Webster, M. A., Petty, A. A., Markus, T., Bromwich, D. H., and Cullather, R. I.: Intercomparison of Precipitation Estimates over the Arctic Ocean and Its Peripheral Seas from Reanalyses, J. Climate, 31, 8441–8462, https://doi.org/10.1175/JCLI-D-18-0125.1, 2018. a
Bowling, L. C., Kane, D. L., Gieck, R. E., Hinzman, L. D., and Lettenmaier, D. P.: The role of surface storage in a low-gradient Arctic watershed, Water Resour. Res., 39, , 1087, https://doi.org/10.1029/2002WR001466, 2003. a, b
Bring, A., Fedorova, I., Dibike, Y., Hinzman, L., Mård, J., Mernild, S., Prowse, T., Semenova, O., Stuefer, S. L., and Woo, M.-K.: Arctic terrestrial hydrology: A synthesis of processes, regional effects, and research challenges, J. Geophys. Res.-Biogeo., 121, 621–649, https://doi.org/10.1002/2015JG003131, 2016. a, b, c, d
Brodzik, M. J. and Knowles, K.: EASE-Grid: A Versatile Set of Equal-Area Projections and Grids, in: Discrete Global Grids, Santa Barbara, edited by: Goodchild, M., CA, USA, National Center for Geographic Information and Analysis, 2002. a
Brown, J. and Romanovsky, V. E.: Report from the International Permafrost Association: State of permafrost in the first decade of the 21st century, Permafrost Periglac., 19, 255–260, 2008. a
Cai, L., Alexeev, V. A., Arp, C. D., Jones, B. M., Liljedahl, A. K., and Gädeke, A.: The Polar WRF Downscaled Historical and Projected Twenty-First Century Climate for the Coast and Foothills of Arctic Alaska, Front. Earth Sci., 5, 111, https://doi.org/10.3389/feart.2017.00111, 2018. a
Chadburn, S., Burke, E., Cox, P., Friedlingstein, P., Hugelius, G., and Westermann, S.: An observation-based constraint on permafrost loss as a function of global warming, Nat. Clim. Change, 7, 340–344, https://doi.org/10.1038/nclimate3262, 2017. a
Clilverd, H. M., White, D. M., Tidwell, A. C., and Rawlins, M. A.: The Sensitivity of Northern Groundwater Recharge to Climate Change: A Case Study in Northwest Alaska, J. Am. Water Resour. As., 47, 1228–1240, https://doi.org/10.1111/j.1752-1688.2011.00569.x, 2011. a
Dean, J., van der Velde, Y., Garnett, M. H., Dinsmore, K. J., Baxter, R., Lessels, J. S., Smith, P., Street, L. E., Subke, J.-A., Tetzlaff, D., Washbourne, I., Wookey, P. A., and Billett, M. F.: Abundant pre-industrial carbon detected in Canadian Arctic headwaters: implications for the permafrost carbon feedback, Environ. Res. Lett., 13, 034024, https://doi.org/10.1088/1748-9326/aaa1fe, 2018. a
Dee, D. P., Uppala, S. M., Simmons, A., Berrisford, P., Poli, P., Kobayashi, S., Andrae, U., Balmaseda, M., Balsamo, G., Bauer, D. P., Beljaars, A. C. M., van de Berg, L., Bidlot, J., Bormann, N., Delsol, C., Dragani, R., Fuentes, M., Geer, A. J., Haimberger, L., Healy, S. B., Hersbach, H., Hólm, E. V., Isaksen, L., Kållberg, P., Köhler, M., Matricardi, M., McNally, A. P., Monge‐Sanz, B. M., Morcrette, J. J., Park, B. K., Peubey, P. de., Tavolato, C., Thépaut, J. N., and Vitart, F.: The ERA-Interim reanalysis: Configuration and performance of the data assimilation system, Q. J. Roy. Meteor. Soc., 137, 553–597, https://doi.org/10.1002/qj.828, 2011. a
Du, J., Kimball, J. S., Jones, L., and Watts, J. D.: Implementation of satellite based fractional water cover indices in the pan-Arctic region using AMSR-E and MODIS, Remote Sens. Environ., 184, 469–481, 2016. a
Du, J., Kimball, J. S., Duguay, C., Kim, Y., and Watts, J. D.: Satellite microwave assessment of Northern Hemisphere lake ice phenology from 2002 to 2015, The Cryosphere, 11, 47–63, https://doi.org/10.5194/tc-11-47-2017, 2017. a
Food and Agriculture Organization/UNESCO: Digital Soil Map of the World and Derived Properties, version 3.5, November, 1995, Original scale 1:5 000 000, UNESCO, Paris, France, 1995.
Francis, J. A., Cassano, J. J., Gutowski Jr., W. J., Hinzman, L. D., Holland, M. M., Steele, M. A., White, D. M., and Vörösmarty, C. J.: An Arctic Hydrologic System in Transition: Feedbacks and Impacts on Terrestrial, Marine, and Human Life, J. Geophys. Res.-Biogeo., 114, G04019, https://doi.org/10.1029/2008JG000902, 2009. a
Frey, K. E. and McClelland, J. W.: Impacts of permafrost degradation on arctic river biogeochemistry, Hydrol. Process., 23, 169–182, https://doi.org/10.1002/hyp.7196, 2009. a, b, c, d, e, f
Frey, K. E. and Smith, L. C.: Amplified carbon release from vast West Siberian peatlands by 2100, Geophys. Res. Lett., 32, L09401, https://doi.org/10.1029/2004GL022025, 2005. a
Frey, K. E., McClelland, J. W., Holmes, R. M., and Smith, L. C.: Impacts of climate warming and permafrost thaw on the riverine transport of nitrogen and phosphorus to the Kara Sea, J. Geophys. Res.-Biogeo., 112, G04S58, https://doi.org/10.1029/2006JG000369, 2007. a
Gautier, E., Dépret, T., Costard, F., Virmoux, C., Fedorov, A., Grancher, D., Konstantinov, P., and Brunstein, D.: Going with the flow: Hydrologic response of middle Lena River (Siberia) to the climate variability and change, J. Hydrol., 557, 475–488, https://doi.org/10.1016/j.jhydrol.2017.12.034, 2018. a
Hamed, K. H. and Rao, A. R.: A modified Mann-Kendall trend test for autocorrelated data, J. Hydrol., 204, 182–196, 1998. a, b
Hinkel, K. and Nelson, F.: Spatial and temporal patterns of active layer thickness at Circumpolar Active Layer Monitoring (CALM) sites in northern Alaska, 1995–2000, J. Geophys. Res.-Atmos., 108, , 8168, https://doi.org/10.1029/2001JD000927, 2003. a
Hugelius, G., Strauss, J., Zubrzycki, S., Harden, J. W., Schuur, E. A. G., Ping, C.-L., Schirrmeister, L., Grosse, G., Michaelson, G. J., Koven, C. D., O'Donnell, J. A., Elberling, B., Mishra, U., Camill, P., Yu, Z., Palmtag, J., and Kuhry, P.: Estimated stocks of circumpolar permafrost carbon with quantified uncertainty ranges and identified data gaps, Biogeosciences, 11, 6573–6593, https://doi.org/10.5194/bg-11-6573-2014, 2014. a
Jones, M. K. W., Pollard, W. H., and Jones, B. M.: Rapid initialization of retrogressive thaw slumps in the Canadian high Arctic and their response to climate and terrain factors, Environ. Res. Lett., 14, 055006, https://doi.org/10.1088/1748-9326/ab12fd, 2019. a
Jorgenson, M., Yoshikawa, K., Kanevskiy, M., Shur, Y., Romanovsky, V., Marchenko, S., Grosse, G., Brown, J., and Jones, B.: Permafrost characteristics of Alaska, in: Proceedings of the Ninth International Conference on Permafrost, 3, University of Alaska, Fairbanks, 121–122, 2008. a
Kaiser, K., Canedo-Oropeza, M., McMahon, R., and Amon, R. M.: Origins and transformations of dissolved organic matter in large Arctic rivers, Sci. Rep.-UK, 7, 13064, https://doi.org/10.1038/s41598-017-12729-1, 2017. a
Kane, D. and Stuefer, S.: Reflecting on the status of precipitation data collection in Alaska: a case study, Hydrol. Res., 46, 478–493, https://doi.org/10.2166/nh.2014.023, 2015. a
Kattsov, V. M., Walsh, J. E., Chapman, W. L., Govorkova, V. A., Pavlova, T. V., and Zhang, X.: Simulation and Projection of Arctic Freshwater Budget Components by the IPCC AR4 Global Climate Models, J. Hydrometeorol., 8, 571–589, https://doi.org/10.1175/JHM575.1, 2007. a, b
Kistler, R., Kalnay, E., Collins, W., Saha, S., White, G., Woolen, J., Chelliah, M., Ebisuzaki, W., Kanamitsu, M., Kousky, V., van den Dool, H., Jenne, R., and Fiorino, M.: The NCEP-NCAR 50-year reanalysis: Monthly means CD-ROM and documentation, B. Am. Meteorol. Soc., 82, 247–267, https://doi.org/10.1175/1520-0477(2001)082<0247:TNNYRM>2.3.CO;2, 2001. a
Lamontagne-Hallé, P., McKenzie, J. M., Kurylyk, B. L., and Zipper, S. C.: Changing groundwater discharge dynamics in permafrost regions, Environ. Res. Lett., 13, 084017, https://doi.org/10.1088/1748-9326/aad404, 2018. a, b, c, d
Mann, P. J., Eglinton, T. I., McIntyre, C. P., Zimov, N., Davydova, A., Vonk, J. E., Holmes, R. M., and Spencer, R. G.: Utilization of ancient permafrost carbon in headwaters of Arctic fluvial networks, Nat. Commun., 6, 6, 7856, https://doi.org/10.1038/ncomms8856, 2015. a
McClelland, J. W., Stieglitz, M., Pan, F., Holmes, R. M., and Peterson, B. J.: Recent changes in nitrate and dissolved organic carbon export from the upper Kuparuk River, J. Geophys. Res.-Biogeo., 112, g04S60, https://doi.org/10.1029/2006JG000371, 2007. a
McClelland, J. W., Townsend-Small, A., Holmes, R. M., Pan, F., Stieglitz, M., Khosh, M., and Peterson, B. J.: River export of nutrients and organic matter from the North Slope of Alaska to the Beaufort Sea, Water Resour. Res., 50, 1823–1839, https://doi.org/10.1002/2013WR014722, 2014. a, b, c
Miller, J. R., Russell, G. L., and Caliri, G.: Continental-scale river flow in climate models, J. Climate, 7, 914–928, https://doi.org/10.1175/1520-0442(1994)007<0914:CSRFIC>2.0.CO;2, 1994. a
Muskett, R. and Romanovsky, V.: Alaskan permafrost groundwater storage changes derived from GRACE and ground measurements, Remote Sens., 3, 378–397, https://doi.org/10.3390/rs3020378, 2011. a
Neilson, B. T., Cardenas, M. B., O'Connor, M. T., Rasmussen, M. T., King, T. V., and Kling, G. W.: Groundwater Flow and Exchange Across the Land Surface Explain Carbon Export Patterns in Continuous Permafrost Watersheds, Geophys. Res. Lett., 15, 7596–7605, https://doi.org/10.1029/2018GL078140, 2018. a, b
Nicolsky, D. J., Romanovsky, V., Panda, S., Marchenko, S., and Muskett, R.: Applicability of the ecosystem type approach to model permafrost dynamics across the Alaska North Slope, J. Geophys. Res.-Earth, 122, 50–75, https://doi.org/10.1002/2016JF003852, 2017. a, b, c, d
Peterson, B. J., Holmes, R. M., McClelland, J. W., Vörösmarty, C. J., Lammers, R. B., Shiklomanov, A. I., Shiklomanov, I. A., and Rahmstorf, S.: Increasing river discharge to the Arctic Ocean, Science, 298, 2171–2173, https://doi.org/10.1126/science.1077445, 2002. a
Peterson, B. J., McClelland, J., Curry, R., Holmes, R. M., Walsh, J. E., and Aagaard, K.: Trajectory shifts in the Arctic and sub-Arctic freshwater cycle, Science, 313, 1061–1066, https://doi.org/10.1126/science.1122593, 2006. a
Rawlins, M. A.: Beaufort Lagoon Ecosystems LTER, Model simulated hydrological estimates for the North Slope drainage basin, Alaska, 1980–2010, Environmental Data Initiative, https://doi.org/10.6073/pasta/2c1cd0c1d3f0f257d9dac659314bc777, 2019. a
Rawlins, M. A.: Permafrost Water Balance Model, v3 source code, available at: https://blogs.umass.edu/csrc/pwbm, last access: 14 December 2019. a
Rawlins, M., Nicolsky, D., McDonald, K., and Romanovsky, V.: Simulating soil freeze/thaw dynamics with an improved pan-Arctic water balance model, J. Adv. Model. Earth Sy., 5, 659–675, https://doi.org/10.1002/jame.20045, 2013. a, b, c, d
Rawlins, M. A., Lammers, R. B., Frolking, S., Fekete, B. M., and Vörösmarty, C. J.: Simulating Pan-Arctic Runoff with a Macro-Scale Terrestrial Water Balance Model, Hydrol. Process., 17, 2521–2539, https://doi.org/10.1002/hyp.1271, 2003. a, b
Rawlins, M. A., Fahnestock, M., Frolking, S., and Vörösmarty, C. J.: On the Evaluation of Snow Water Equivalent Estimates over the Terrestrial Arctic Drainage Basin, Hydrol. Process., 21, 1616–1623, https://doi.org/10.1002/hyp.6724, 2007. a
Rawlins, M. A., Serreze, M. C., Schroeder, R., Zhang, X., and McDonald, K. C.: Diagnosis of the Record Discharge of Arctic-Draining Eurasian Rivers in 2007, Environ. Res. Lett., 4, 045011, https://doi.org/10.1088/1748-9326/4/4/045011, 2009. a
Rawlins, M. A., Steele, M., Holland, M. M., Adam, J. C., Cherry, J. E., Francis, J. A., Groisman, P. Y., Hinzman, L. D., Huntington, T. G., Kane, D. L., Kmball, J. S., Kwok, R., Lammers, R. B., Lee, C. M. Lettenmaier, D. P., McDonald, K. C., Podest, E., Pundsack, J. W., Rudels, B., Serreze, M. C., Shiklomanov, A., Skagseth, Ø., Troy, T. J., Vörösmarty, C. J., Wensnahan, M., Wood, E. F., Woodgate, R., Yang, D., Zhang, K., and Zhang, T.: Analysis of the Arctic System for Freshwater Cycle Intensification: Observations and Expectations, J. Climate, 23, 5715–5737, https://doi.org/10.1175/2010JCLI3421.1, 2010. a, b, c, d
Rember, R. D. and Trefry, J. H.: Increased concentrations of dissolved trace metals and organic carbon during snowmelt in rivers of the Alaskan Arctic, Geochim. Cosmochim. Ac., 68, 477–489, https://doi.org/10.1016/S0016-7037(03)00458-7, 2004 a
Rennermalm, A. K., Wood, E. F., and Troy, T. J.: Observed changes in pan-arctic cold-season minimum monthly river discharge, Clim. Dynam., 35, 923–939, https://doi.org/10.1007/s00382-009-0730-5, 2010. a
Rienecker, M., Suarez, M., Gelaro, R., Todling, R., Bacmeister, J., Liu, E., Bosilovich, M., Schubert, S., Takacs, L., Kim, G., Bloom, S., Chen, J., Collins, D., Conaty, A., da Silva, A., Gu, W., Joiner, J., Koster, R. D., Lucchesi, R., Molod, A., Owens, T., Pawson, S., Pegion, P., Redder, C. Reichle, R., Robertson, F. R., Ruddick, A. G., Sienkiewicz, M., and Woollen, J.: MERRA-NASA's Modern-Era Retrospective Analysis for Research and Applications, J. Climate, 24, 3624–3648, https://doi.org/10.1175/JCLI-D-11-00015.1, 2011. a
Romanovsky, V. E., Smith, S. L., and Christiansen, H. H.: Permafrost thermal state in the polar Northern Hemisphere during the international polar year 2007–2009: a synthesis, Permafrost Periglac., 21, 106–116, https://doi.org/10.1002/ppp.689, 2010. a
Scaff, L., Yang, D., Li, Y., and Mekis, E.: Inconsistency in precipitation measurements across the Alaska–Yukon border, The Cryosphere, 9, 2417–2428, https://doi.org/10.5194/tc-9-2417-2015, 2015. a
Schroeder, R., McDonald, K. C., Zimmerman, R., Podest, E., and Rawlins, M.: North Eurasian Inundation Mapping with Passive and Active Microwave Remote Sensing, Environ. Res. Lett., 5, 015003, https://doi.org/10.1088/1748-9326/5/1/015003, 2010. a, b
Schuur, E., Vogel, J. G., Crummer, K. G., Lee, H., Sickman, J. O., and Osterkamp, T. E.: The effect of permafrost thaw on old carbon release and net carbon exchange from tundra, Nature, 459, 556–559, https://doi.org/10.1038/nature08031, 2009. a
Serreze, M. C., Barrett, A. P., Slater, A. G., Woodgate, R. A., Aagaard, K., Lammers, R. B., Steele, M., Moritz, R., Meredith, M., and Lee, C. M.: The large-scale freshwater cycle of the Arctic, J. Geophys. Res.-Oceans, 111, C11010, https://doi.org/10.1029/2005JC003424, 2006. a, b
Serreze, M. C., Barrett, A. P., and Stroeve, J.: Recent changes in tropospheric water vapor over the Arctic as assessed from radiosondes and atmospheric reanalyses, J. Geophys. Res.-Atmos., 117, D10104, https://doi.org/10.1029/2011JD017421, 2012. a
Shiklomanov, I. A., Shiklomanov, A. I., Lammers, R. B., Peterson, B. J., and Vörösmarty, C. J.: The dynamics of river water inflow to the Arctic Ocean, Kluwer Academic Press, Dordrecht, in: The Freshwater Budget of the Arctic Ocean, edited by: Lewis, E. I., Jones, E. P., Lemke, P., Prowse, T. D., and Wadhams, P., 281–296, 2000. a
Smith, L. C., Pavelsky, T. M., MacDonald, G. M., Shiklomanov, A. I., and Lammers, R. B.: Rising minimum daily flows in northern Eurasian rivers: A growing influence of groundwater in the high-latitude hydrologic cycle, J. Geophys. Res.-Biogeo., 112, G04S47, https://doi.org/10.1029/2006JG000327, 2007. a
Smith, S., Romanovsky, V., Lewkowicz, A., Burn, C., Allard, M., Clow, G., Yoshikawa, K., and Throop, J.: Thermal state of permafrost in North America: a contribution to the international polar year, Permafrost Periglac., 21, 117–135, https://doi.org/10.1002/ppp.690, 2010. a
Spencer, R. G., Mann, P. J., Dittmar, T., Eglinton, T. I., McIntyre, C., Holmes, R. M., Zimov, N., and Stubbins, A.: Detecting the signature of permafrost thaw in Arctic rivers, Geophys. Res. Lett., 42, 2830–2835, https://doi.org/10.1002/2015GL063498, 2015. a
St. Jacques, J. M. and Sauchyn, D. J.: Increasing winter baseflow and mean annual streamflow from possible permafrost thawing in the Northwest Territories, Canada, Geophys. Res. Lett., 36, L01401, https://doi.org/10.1029/2008GL035822, 2009. a, b, c
Striegl, R. G., Aiken, G. R., Dornblaser, M. M., Raymond, P. A., and Wickland, K. P.: A decrease in discharge-normalized DOC export by the Yukon River during summer through autumn, Geophys. Res. Lett., 32, L21413, https://doi.org/10.1029/2005GL024413, 2005. a
Stuefer, S., Kane, D. L., and Liston, G. E.: In situ snow water equivalent observations in the US Arctic, Hydrol. Res., 44, 21–34, https://doi.org/10.2166/nh.2012.177, 2013. a
Stuefer, S. L., Arp, C. D., Kane, D. L., and Liljedahl, A. K.: Recent Extreme Runoff Observations From Coastal Arctic Watersheds in Alaska, Water Resour. Res., 53, 9145–9163, https://doi.org/10.1002/2017WR020567, 2017. a, b, c, d
USGS Kuparuk River: U.S. Geological Survey, 2019, Water Data for the Nation, USGS 15896000, Kuparuk River, available at: https://waterdata.usgs.gov/usa/nwis/uv?15896000, last access: 20 January 2019. a, b, c
USGS Colville River: U.S. Geological Survey, 2019, Water Data for the Nation, USGS 15875000 Coville River at Umiat AK, available at: https://waterdata.usgs.gov/ak/nwis/uv?15875000, last access: 20 January 2019. a, b, c
Vonk, J. E., Tank, S. E., Mann, P. J., Spencer, R. G. M., Treat, C. C., Striegl, R. G., Abbott, B. W., and Wickland, K. P.: Biodegradability of dissolved organic carbon in permafrost soils and aquatic systems: a meta-analysis, Biogeosciences, 12, 6915–6930, https://doi.org/10.5194/bg-12-6915-2015, 2015. a
Vörösmarty, C. J., Fekete, B. M., Maybeck, M., and Lammers, R. B.: Gloabl System of Rivers: Its Role in Organizing Continental Land Mass and Defining Land-to-Ocean Linkages, Global Biogeochem. Cy., 14, 599–621, https://doi.org/10.1029/1999GB900092, 2000. a
Walvoord, M. A. and Kurylyk, B. L.: Hydrologic impacts of thawing permafrost – A review, Vadose Zone J., 15, https://doi.org/10.2136/vzj2016.01.0010, 2016. a, b, c
Walvoord, M. A. and Striegl, R. G.: Increased groundwater to stream discharge from permafrost thawing in the Yukon River basin: Potential impacts on lateral export of carbon and nitrogen, Geophys. Res. Lett., 34, L12402, https://doi.org/10.1029/2007GL030216, 2007. a, b, c, d
Wickland, K. P., Waldrop, M. P., Aiken, G. R., Koch, J. C., Jorgenson, M. T., and Striegl, R. G.: Dissolved organic carbon and nitrogen release from boreal Holocene permafrost and seasonally frozen soils of Alaska, Environ. Res. Lett., 13, 065011, https://doi.org/10.1088/1748-9326/aac4ad, 2018. a, b
Willmott, C. J. and Matsuura, K.: Advantages of the mean absolute error (MAE) over the root mean square error (RMSE) in assessing average model performance, Clim. Res., 30, 79–82, 2005. a
Willmott, C. J., Robeson, S. M., Matsuura, K., and Ficklin, D. L.: Assessment of three dimensionless measures of model performance, Environ. Modell. Softw., 73, 167–174, https://doi.org/10.1016/j.envsoft.2015.08.012, 2015. a
Wrona, F. J., Johansson, M., Culp, J. M., Jenkins, A., Mård, J., Myers-Smith, I. H., Prowse, T. D., Vincent, W. F., and Wookey, P. A.: Transitions in Arctic ecosystems: Ecological implications of a changing hydrological regime, J. Geophys. Res.-Biogeo., 121, 650–674, https://doi.org/10.1002/2015JG003133, 2016. a
Wu, P., Wood, R., and Stott, P.: Human influence on increasing Arctic river discharges, Geophys. Res. Lett., 32, L02703, https://doi.org/10.1029/2004GL021570, 2005. a, b
Yang, D., Goodison, B. E., Ishida, S., and Benson, C. S.: Adjustment of Daily Precipitation Data at 10 Stations in Alaska: Application of World Meteorological Organization Intercomparison Results, Water Resour. Res., 34, 241–256, https://doi.org/10.1029/97WR02681, 1998. a
Yang, D., Kane, D. L., Hinzman, L. D., Zhang, X., Zhang, T., and Ye, H.: Siberian Lena River hydrologic regime and recent change, J. Geophys. Res.-Atmos., 107, 4694, https://doi.org/10.1029/2002JD002542, 2002. a
Yang, D., Kane, D., Zhang, Z., Legates, D., and Goodison, B.: Bias corrections of long-term (1973–2004) daily precipitation data over the northern regions, Geophys. Res. Lett., 32, L19501, https://doi.org/10.1029/2005GL024057, 2005. a
Yi, Y., Kimball, J. S., Jones, L. A., Reichle, R. H., Nemani, R., and Margolis, H. A.: Recent climate and fire disturbance impacts on boreal and arctic ecosystem productivity estimated using a satellite-based terrestrial carbon flux model, J. Geophys. Res.-Biogeo., 118, 606–622, https://doi.org/10.1002/jgrg.20053, 2013. a
Yi, Y., Kimball, J. S., Rawlins, M. A., Moghaddam, M., and Euskirchen, E. S.: The role of snow cover affecting boreal-arctic soil freeze–thaw and carbon dynamics, Biogeosciences, 12, 5811–5829, https://doi.org/10.5194/bg-12-5811-2015, 2015. a, b, c
Yi, Y., Kimball, J. S., Chen, R. H., Moghaddam, M., Reichle, R. H., Mishra, U., Zona, D., and Oechel, W. C.: Characterizing permafrost active layer dynamics and sensitivity to landscape spatial heterogeneity in Alaska, The Cryosphere, 12, 145–161, https://doi.org/10.5194/tc-12-145-2018, 2018. a, b
Yi, Y., Kimball, J. S., Chen, R. H., Moghaddam, M., and Miller, C. E.: Sensitivity of active-layer freezing process to snow cover in Arctic Alaska, The Cryosphere, 13, 197–218, https://doi.org/10.5194/tc-13-197-2019, 2019. a, b, c, d, e
Yue, S., Pilon, P., and Cavadias, G.: Power of the Mann–Kendall and Spearman's rho tests for detecting monotonic trends in hydrological series, J. Hydrol., 259, 254–271, https://doi.org/10.1016/S0022-1694(01)00594-7, 2002. a
Zhang, X., He, J., Zhang, J., Polyakov, I., Gerdes, R., Inoue, J., and Wu, P.: Enhanced poleward moisture transport and amplified northern high-latitude wetting trend, Nat. Clim. Change., 3, 47–51, https://doi.org/10.1038/nclimate1631, 2013. a, b


