the Creative Commons Attribution 4.0 License.
the Creative Commons Attribution 4.0 License.
 | 28 Jun 2019
Apparent discrepancy of Tibetan ice core δ18O records may be attributed to misinterpretation of chronology
Wangbin Zhang
Hongxi Pang
Shuang-Ye Wu
Theo M. Jenk
Margit Schwikowski
Yetang Wang
Ice cores from the Tibetan Plateau (TP) are widely used for reconstructing past climatic and environmental conditions that extend beyond the instrumental period. However, challenges in dating and interpreting ice core records often lead to inconsistent results. The Guliya ice core drilled from the northwestern TP suggested a cooling trend during the mid-Holocene based on its decreasing δ18O values, which is not observed in other Tibetan ice cores. Here we present a new high-resolution δ18O record of the Chongce ice cores drilled to bedrock ∼30 km away from the Guliya ice cap. Our record shows a warming trend during the mid-Holocene. Based on our results as well as previously published ice core data, we suggest that the apparent discrepancy between the Holocene δ18O records of the Guliya and the Chongce ice cores may be attributed to a possible misinterpretation of the Guliya ice core chronology.


Global climate models simulate a warming trend during the Holocene epoch, typically attributed to retreating ice sheets and rising atmospheric greenhouse gases, while global cooling was inferred from proxy reconstructions obtained mainly from the analysis of marine sediment cores (Marcott et al., 2013). The apparent discrepancy is often referred to as the Holocene temperature conundrum, possibly due to the potentially significant biases resulted from both the seasonality of the proxy data and the high sensitivities of current climate models (Liu et al., 2014). Marsicek et al. (2018) recently presented temperature reconstructions derived from sub-fossil pollen across North America and Europe. These records show a general long-term warming trend for the Holocene until ∼2 ka BP (thousand years before present; present measured from 1950 AD), and records with cooling trends are largely limited to the North Atlantic, implying varied regional climate responses to global drivers.
Given the significantly positive correlation between air temperature and δ18O in precipitation over the central and the northern Tibetan Plateau (TP; Yao et al., 1996, 2013), the stable isotopic records of ice cores recovered from this area were widely used as a temperature indicator (Tian et al., 2006; An et al., 2016). Among all the published Tibetan ice cores, the Guliya ice core drilled to bedrock (308.6 m) from the northwestern TP (Fig. S1 in the Supplement) is unique due to the exceptional length of its temporal coverage, estimated to be >500 ka below the depth of 290 m (i.e., 18.6 m above the ice–bedrock interface) or up to ∼760 ka at the ice–bedrock interface based on 36Cl dead ice in the bottom section (Thompson et al., 1997). This makes it the oldest nonpolar ice core up to now (Thompson, 2017). The Guliya record has been widely used to provide a climate context for numerous studies (e.g., Fang et al., 1999; Rahaman et al., 2009; Sun et al., 2012; Hou et al., 2016; Li et al., 2017; Saini et al., 2017; Sanwal et al., 2019). Its stable isotopic record suggests a cooling mid-Holocene based on its decreasing δ18O values during that period. However, this cooling mid-Holocene is not found in other Tibetan ice core records available so far. For instance, the Puruogangri ice core drilled from the central TP (Fig. S1) shows high δ18O values during the period of ∼4.8–4.0 ka BP (Thompson et al., 2006), and the Dunde ice core drilled from the Qilian Mountains (Thompson et al., 1989; Fig. S1) shows a high stand of δ18O values during the period of ∼5–2 ka BP based on its updated chronology (Thompson et al., 2005). In order to investigate this apparent discrepancy between the Tibetan δ18O records, we present a new δ18O record of the Chongce ice cores that were recently drilled to bedrock at the Chongce ice cap on the northwestern TP, ∼30 km away from the Guliya ice cap (Hou et al., 2018; Fig. S1).
In 2012, we drilled two ice cores to bedrock with the length of 133.8 m (Core 1) and 135.8 m (Core 2; 35∘14′ N, 81∘7′ E) and a shallow ice core (Core 3) of 58.8 m at an altitude of 6010 m above sea level (a.s.l.) from the Chongce ice cap (Fig. 1). The distance between the drilling sites of Core 2 and Core 3 is ∼2 m. In 2013, two more ice cores to bedrock were recovered from the same ice cap with lengths of 216.6 m (Core 4; 35∘15′ N, 81∘5′ E) and 208.6 m (Core 5) at an altitude of 6100 m a.s.l. (Fig. 1). More details about these ice cores can be found in Hou et al. (2018). For this study, measurements of stable isotopes were performed on Core 2 and Core 3. In a cold room (−20 ∘C), Core 2 was cut into 1301 samples from the depth of 13.2 m to the bottom with a resolution of ∼10 cm per sample. The bottom ∼0.2 m above the ice–bedrock contact consists of a mixture of ice and sediment (Zhang et al., 2018) and is not analyzed for stable isotopes. The results were combined with the isotopic measurements of the top 13.2 m of Core 3 from An et al. (2016) to form a single profile as the two drilling sites are only ∼2 m apart. Core 3 has a sampling resolution of 2–3 cm per sample. The samples were measured by a Picarro Wavelength Scanned Cavity Ring-Down Spectrometer (WS-CRDS, model: L2120-i) at Nanjing University. The stable isotopic ratio was calculated as
where R is the ratio of the composition of the heavier to lighter isotopes in water (18O∕16O for δ18O), and the reference is the Vienna Standard Mean Ocean Water (V-SMOW). Each sample was measured eight times, with the first five measurements discarded in order to eliminate the effect of memory. The mean value of the last three measurements was taken as the measurement result. The analytical uncertainty is less than 0.1 ‰ for δ18O (Tang et al., 2015).

Figure 1Map showing the topography (red contour lines) and ice thickness (blue color ramp) of the Chongce ice cap with the drilling sites (black dots). The black arrows show the ice flow direction. The effects of the Chongce Glacier surging on the mass balance of the Chongce ice cap are limited, if any (Wang et al., 2018), because the ice flows from the Chongce ice cap into the Chongce Glacier, and the surged area is confined within the Chongce Glacier (Yasuda and Furuya, 2015).
The δ18O profile by depth of the Chongce ice core is shown in Fig. 2. For comparison, we also include the depth δ18O profiles of the Guliya (Thompson et al., 1997), Puruogangri (Thompson et al., 2006) and Dunde (Thompson et al., 1989) ice cores. It is worth noting that the resolution of the δ18O profiles varies from one ice core to another. The sampling resolution is ∼10 cm per sample for the Chongce Core 2, and 2–3 cm per sample for the Chongce Core 3 (An et al., 2016). The 308.6 m Guliya ice core was cut into 12 628 samples (∼2.4 cm per sample) for δ18O measurements (Thompson et al., 1997). However, the original Guliya data were not available. Instead, the Guliya data from the NOAA online repository have average resolutions of 10, 5, 3, 1 and 0.6 m for depths of 0–100, 100–150, 150–252, 252–308 and 308–308.6 m respectively. The 214.7 m Puruogangri ice core was cut into 6303 samples (∼3.4 cm per sample) for δ18O measurements (Thompson et al., 2006), but its data from the NOAA online repository have an average resolution of 1 m for most of the core except the very top (0–1.05 m) and bottom (214.02–214.7 m) sections. The 139.8 m Dunde ice core was cut into 3585 samples (∼3.9 cm per sample) for δ18O measurements (Thompson et al., 1989), but its data from the NOAA online repository have an average resolution of ∼1 m for the depth of 0–120 m and ∼0.5 m below 120 m.
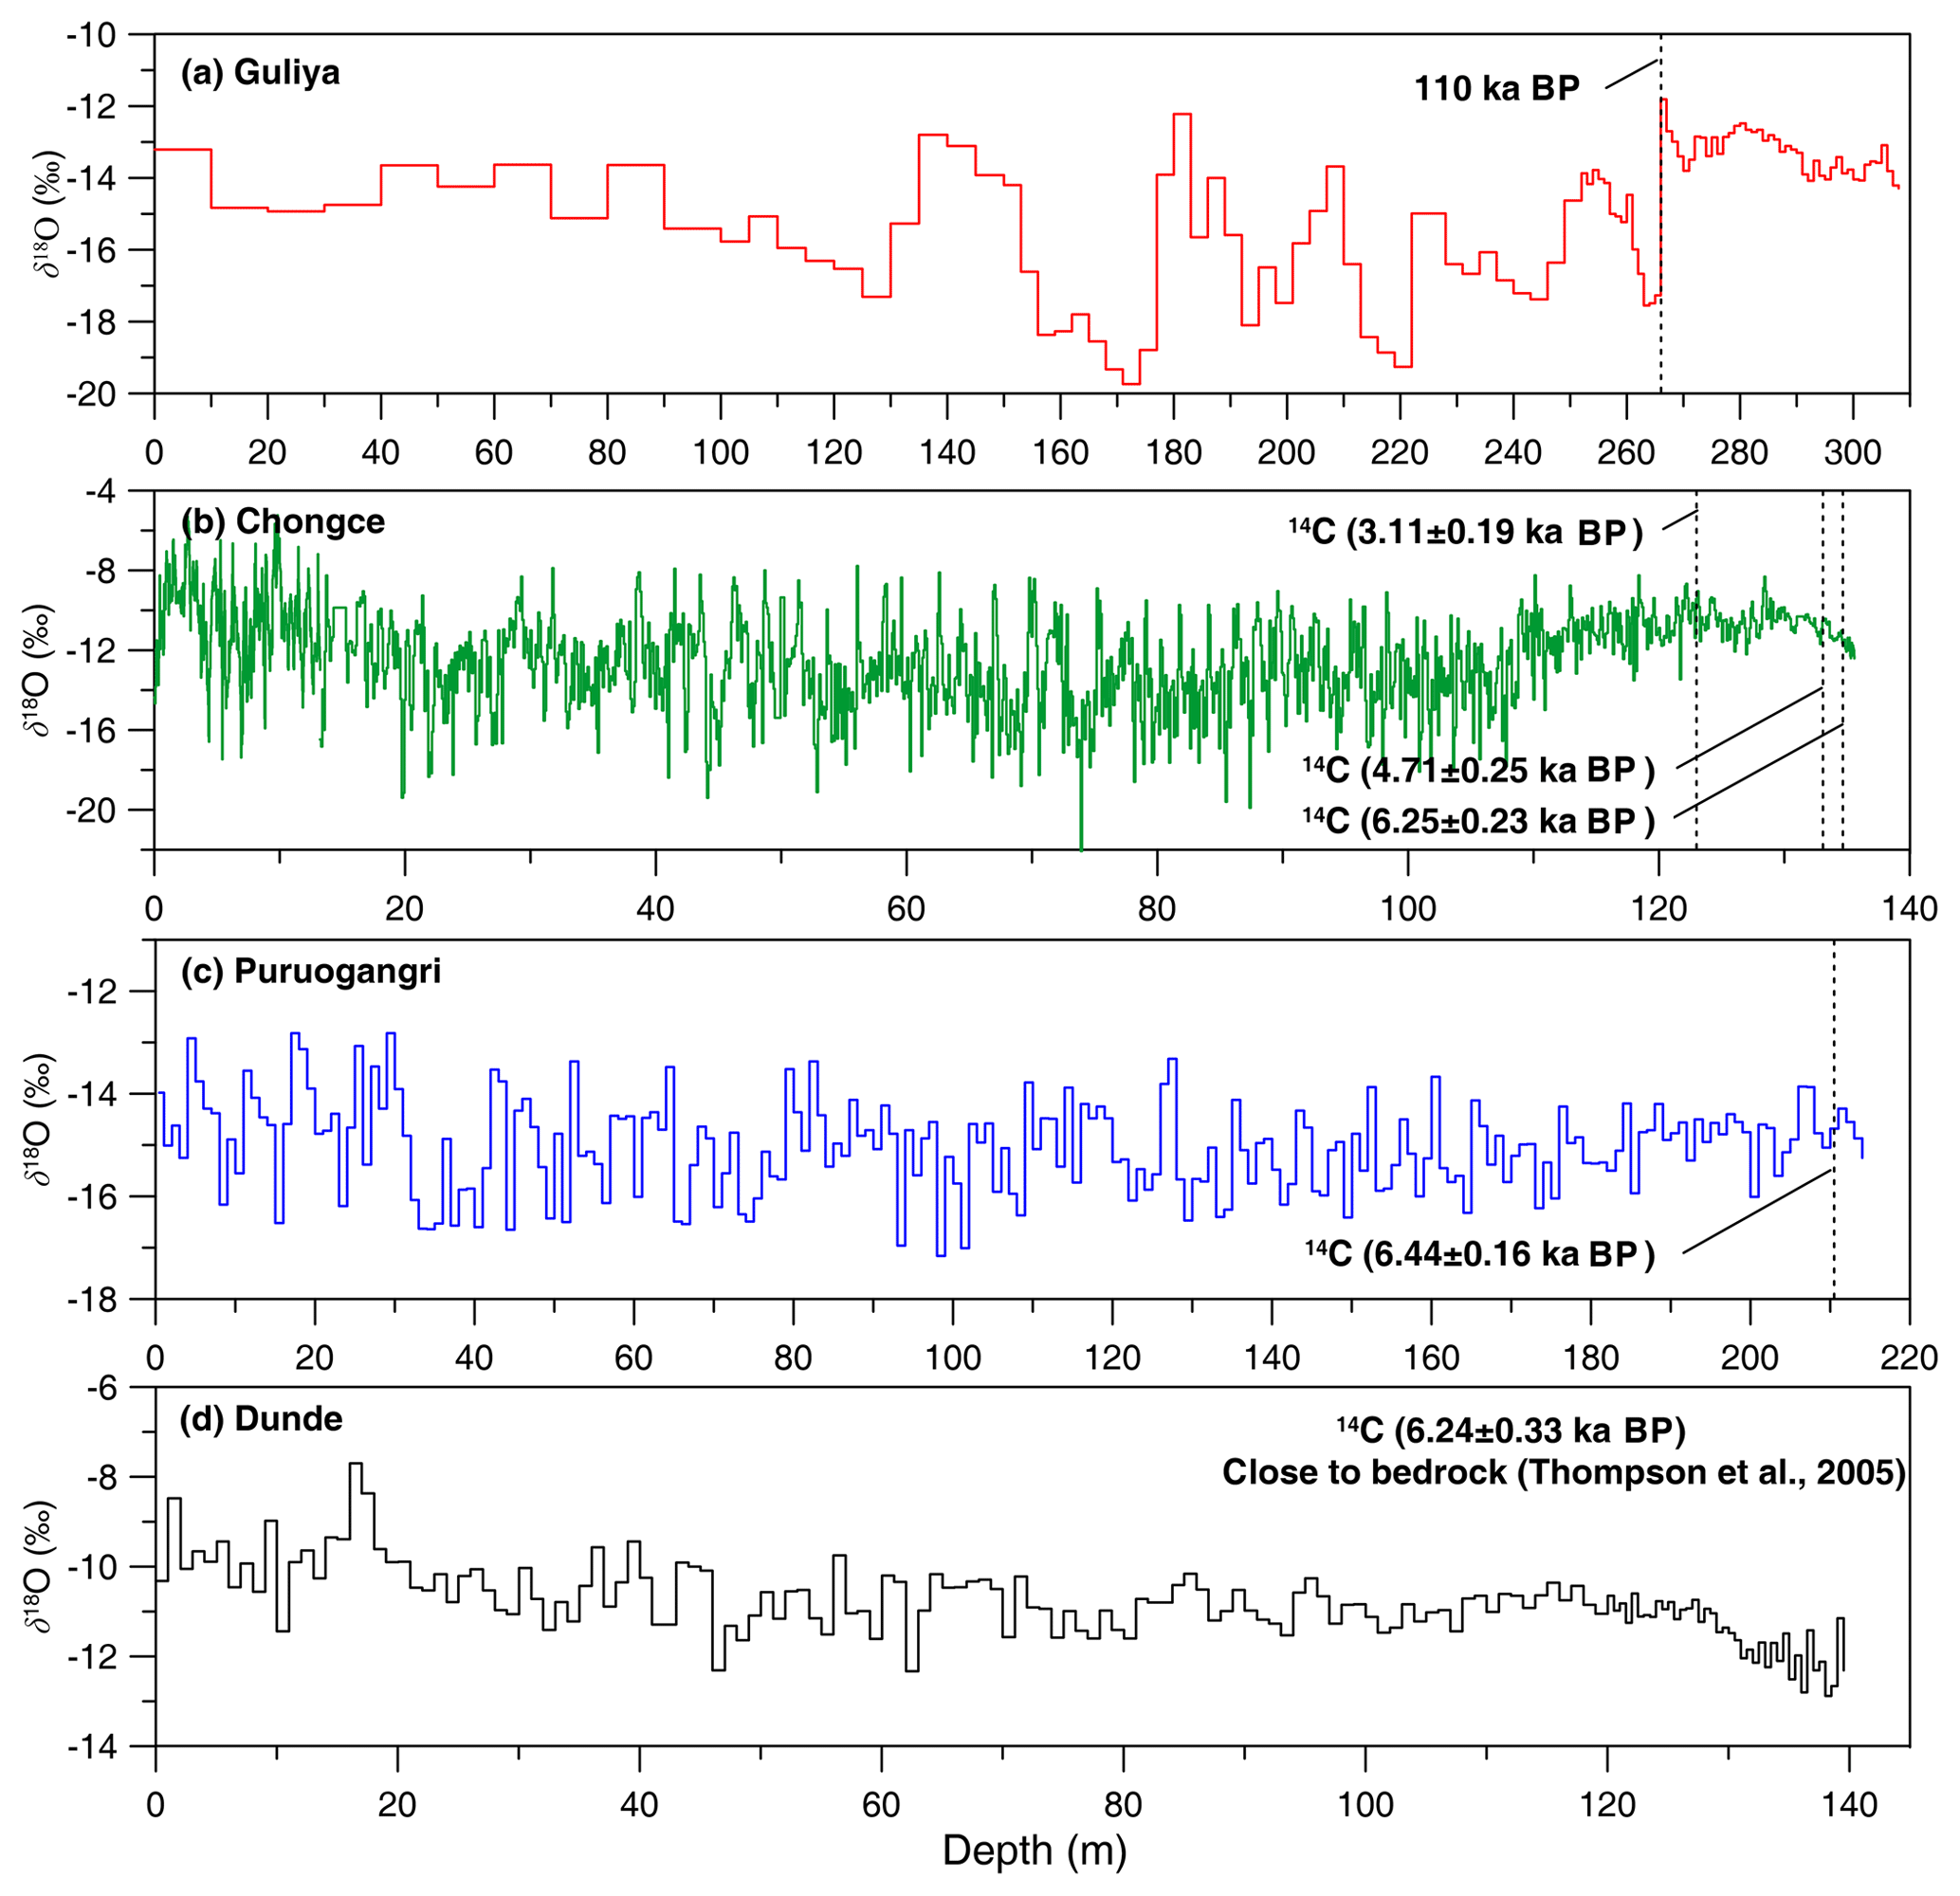
Figure 2The δ18O profiles of the ice cores against each respective depth. The age of 110 ka BP at the depth 266 m of the Guliya ice core is from Thompson et al. (1997). The top 13.2 m of Chongce Core 3 profile (An et al., 2016) is combined with Core 2 to form a single profile because the distance between their drilling sites is only ∼2 m (Fig. 1). Data of Guliya and Puruogangri were obtained from the NOAA online repository, and the data of Dunde were extracted from the Fig. 3 in Thompson et al. (1989) using GetData graph digitizer software.
The Chongce ice cap has been stable throughout the Holocene; hence it provides an ideal location for retrieving ice cores used to reconstruct past climate. The ice flows from the Chongce ice cap into the Chongce Glacier (Fig. 1). Although the Chongce Glacier was suggested to surge between 1992 and 2014 (Yasuda and Furuya, 2015), it is clear that the surged area is confined within the Chongce Glacier and did not affect the Chongce ice cap (Fig. 3 of Yasuda and Furuya, 2015). Several other studies have also confirmed the recent stability of the Chongce ice cap (Lin et al., 2017; Wang et al., 2018; Zhou et al., 2018). In addition, Wang et al. (2018) found similar mass changes for surge-type and non-surge-type glaciers over the western Kunlun Mountains, suggesting that the flow instabilities seem to have little effect on the glacier-wide mass balance. Therefore, the impact of glacial surge on the stratigraphy of the Chongce ice cap is minimal, especially in its accumulation zone where our Chongce ice cores were drilled. Over the longer timescale, Jiao et al. (2000) studied the evolution of glaciers in the west Kunlun Mountains during the past 32 kyr. They found that the present terminus of the Chongce ice cap was very close to its maximum position during the last glacial maximum (LGM), similar to the Guliya ice cap. This confirms the stability of the Chongce ice cap since the LGM.
Many studies have shown a significant positive correlation between local temperature and isotopic composition in precipitation in the northern Tibetan Plateau (e.g., Yao et al., 1996; Tian et al., 2003). This positive correlation is also observed between local temperature from instrumental records and isotopic composition in ice cores from the Tibetan Plateau (e.g., Tian et al., 2006; Kang et al., 2007; An et al., 2016). Specifically, An et al. (2016) established a statistically significant correlation between annual δ18O of the Chongce ice core and the annual temperature record at Shiquanhe (the nearest climate station). Although changes in moisture source (e.g., Liu et al., 2015) or large-scale atmospheric circulation (e.g., Shao et al., 2017) could influence precipitation isotopic composition in the Tibetan Plateau, such changes often lead to concurrent temperature change with the same effect on the precipitation isotopes. Therefore, we suggest that the isotopic variations of the Chongce ice core primarily reflect local temperature signals. There is still uncertainty in the interpretation of the δ18O data of Tibetan ice cores solely as a temperature proxy across the entire Holocene period. In addition to local temperature, the precipitation δ18O could be affected by other factors on longer timescales such as changes in the regional circulation patterns and moisture sources and shifts in seasonal distribution of precipitation (Cheng et al., 2016; Ren et al., 2017). Therefore, more studies are needed to further examine the validity of using ice core δ18O as a temperature proxy on the TP. Nevertheless, simulations by the isotopic general circulation model (LMDZiso) indicate that a strong positive correlation exists between the local temperature and precipitation isotope, and it has persisted during the Holocene (Risi et al., 2010).
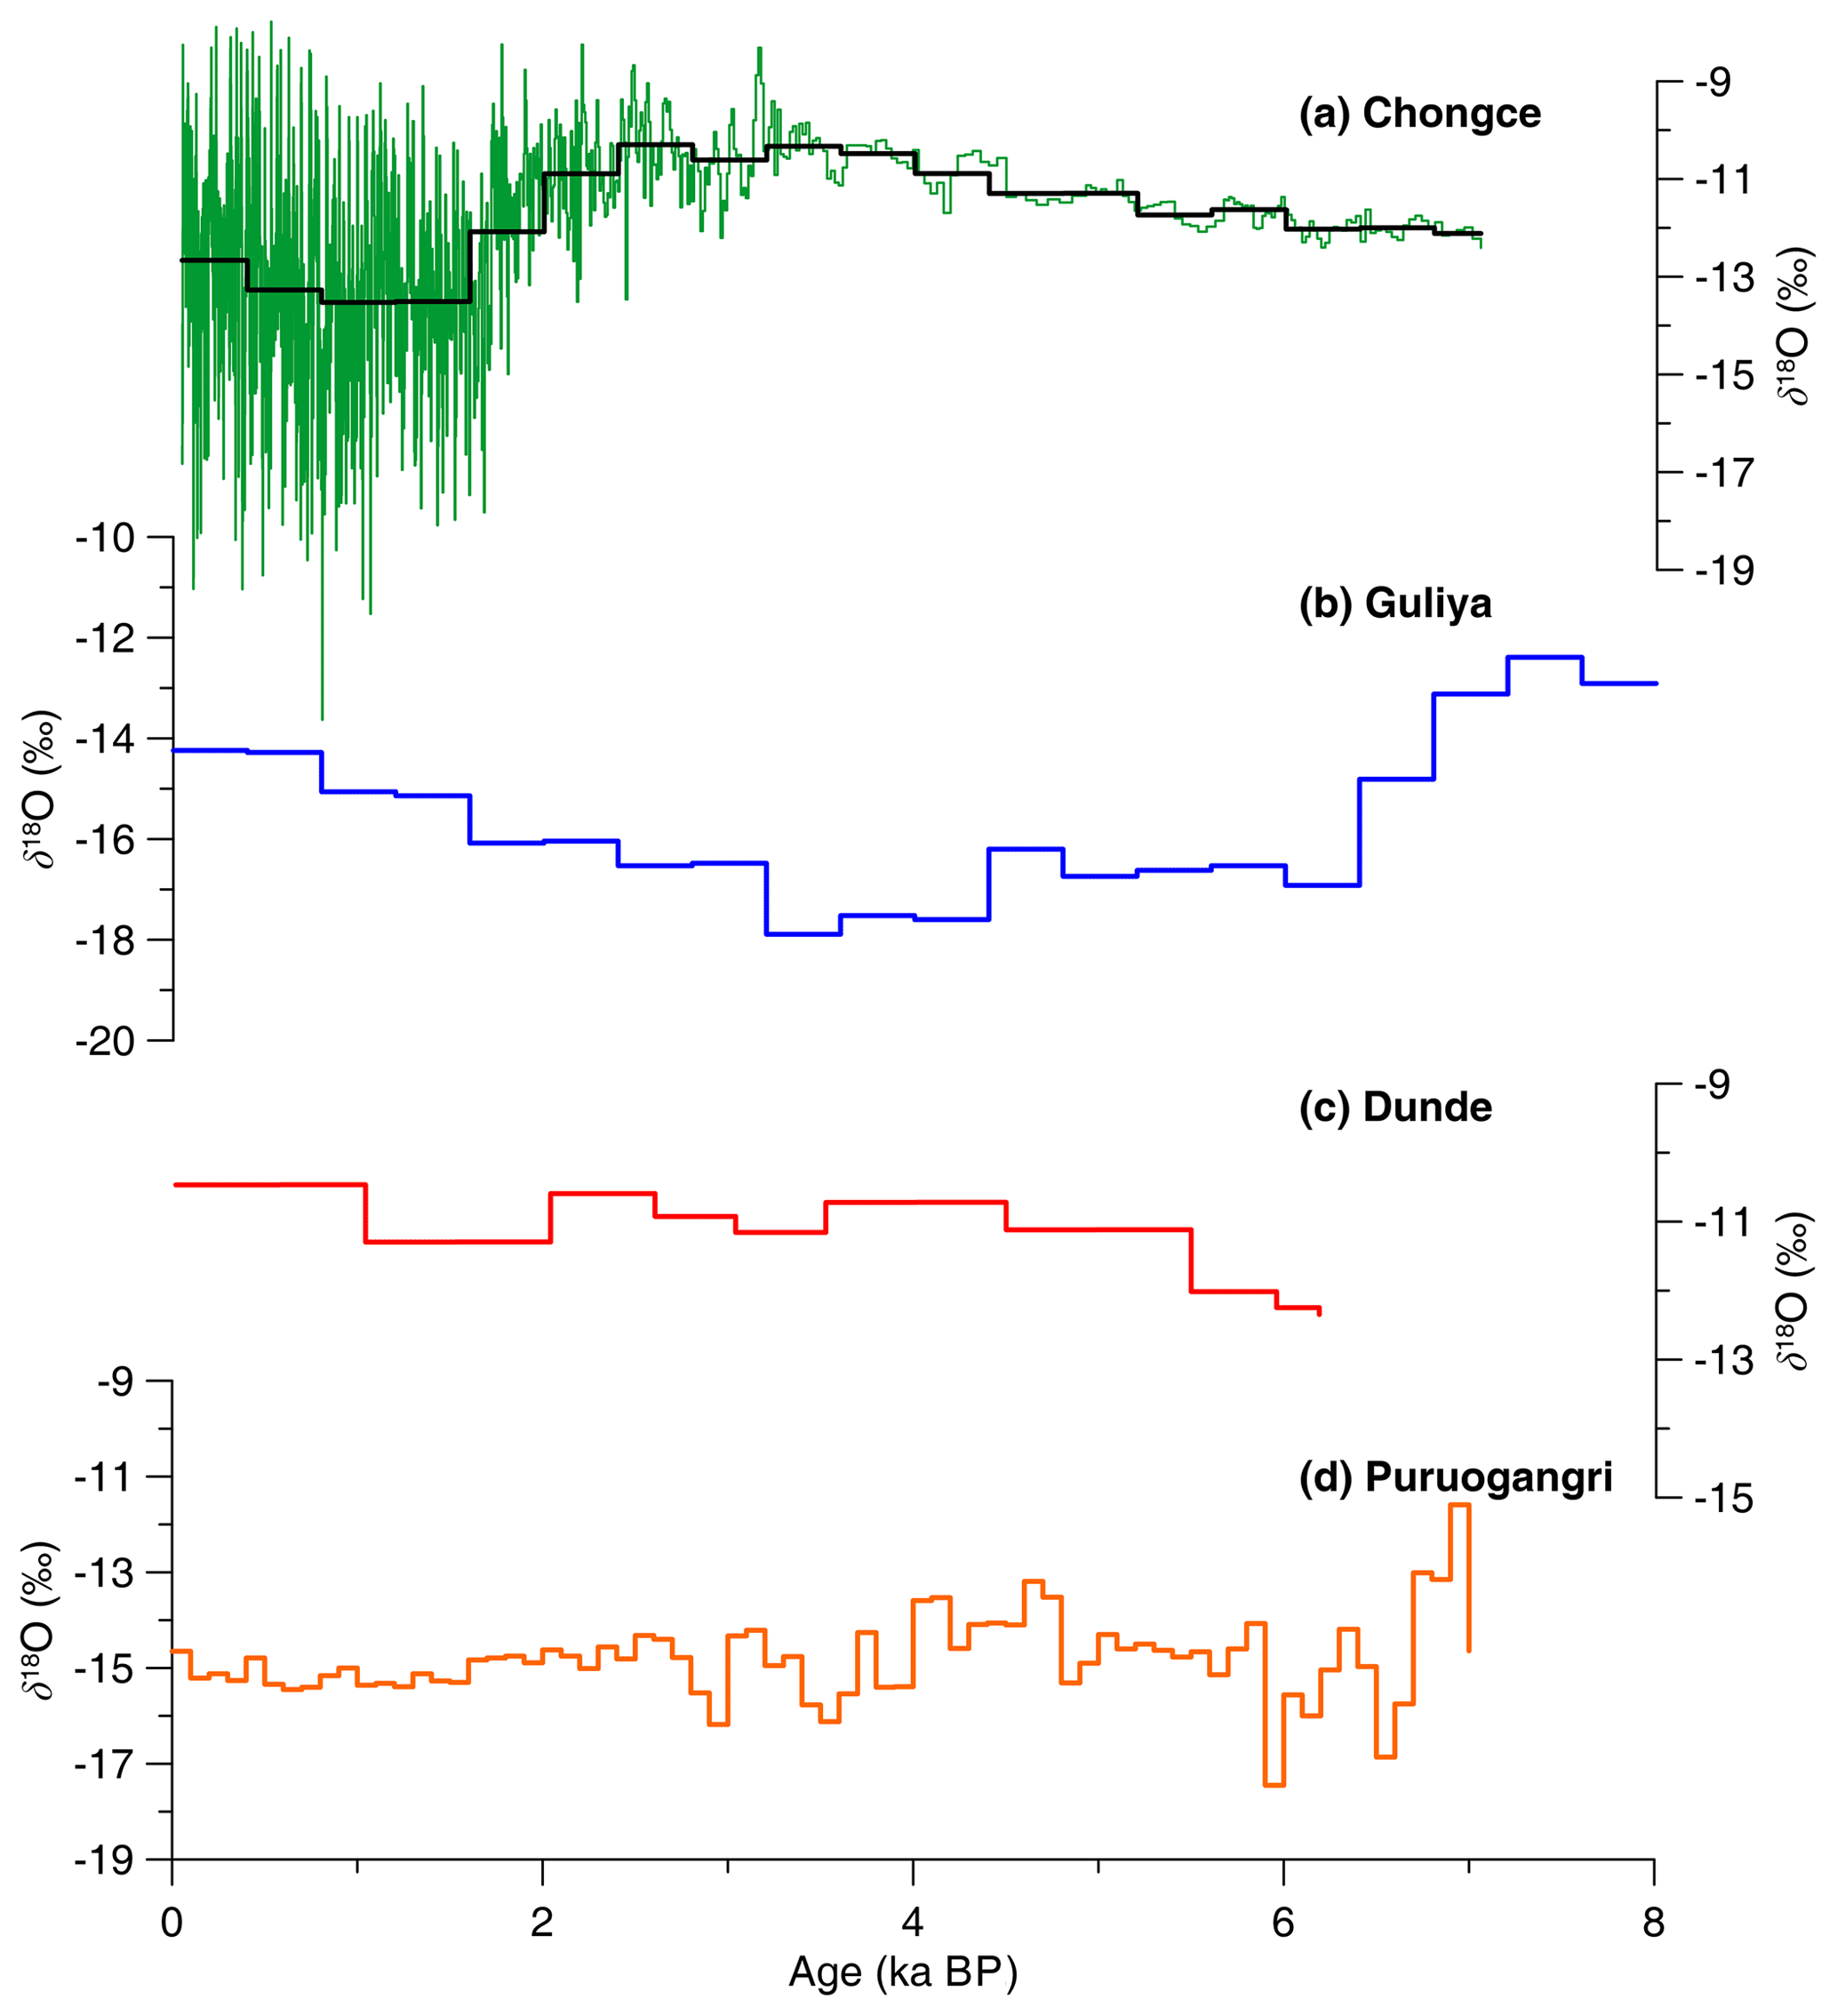
Figure 3The δ18O profiles of the Chongce (a), Guliya (b), Dunde (c) and Puruogangri (d) ice cores by age. We combined the δ18O profiles of Core 2 and Core 3 into a single time series. The black line of the Chongce δ18O profile represents 400-year averages to match the temporal resolution of the Guliya ice core data that are available from the NOAA online repository. The 100-year averages of the Puruogangri ice core are also available from the NOAA online repository, but the multi-centurial averages of the Dunde ice core were extracted from Fig. 3 of Thompson et al. (2005), plotted based on its updated chronology instead of its original chronology (Thompson et al., 1989).
Large amplitudes of δ18O variations are often observed in the Tibetan ice cores during the Holocene, such as ∼8 ‰ for the Guliya ice core (Fig. 5) (or ∼6 ‰ based on its original chronology, Fig. 3), ∼6.5 ‰ for the Chongce ice core (Fig. 5) and ∼6 ‰ for the Puruogangri ice core (Fig. 3). This is largely attributed to the elevation dependency of temperature change observed in many studies; i.e., high-altitude regions experience larger temperature changes than low-elevation regions (Beniston et al., 1997; Liu and Chen, 2000; Mountain Research Initiative EDW Working Group, 2015). In addition, prominent changes in water vapor sources associated with northward and southward shifts of the westerly circulation from multi-millennial to orbital timescales (Cheng et al., 2016) may also contribute to the large amplitude of δ18O variation in ice cores on the TP. However, a sound understanding of the large amplitudes of δ18O variations requires comprehensive future work.
A direct comparison of the Tibetan ice core δ18O records could only be made based on a common timescale. The chronology of the Chongce, Guliya and Puruogangri ice cores was established by Hou et al. (2018) and Thompson et al. (1997, 2006) respectively. The Dunde ice core was originally dated to be 40 ka BP at the depth of 5 m above the ice–bedrock interface and was suggested to be potentially >100 ka BP at the ice–bedrock interface (Thompson et al., 1989). This chronology was subsequently revised to be within the Holocene (see details in Thompson et al., 2005).
The temporal δ18O profiles of the Tibetan ice cores are shown in Fig. 3. The δ18O profiles of the Chongce and Dunde ice cores show an increasing trend from 6–7 to ∼2.5 ka BP, while the Guliya δ18O profile shows a decreasing trend from 7 to ∼3 ka BP. The δ18O profile of the Puruogangri core shows an increasing trend from ∼6.5 to ∼4 ka BP and remains relatively stable from ∼4 ka BP. In addition, the Grigoriev ice core drilled from the western Tien Shan (see Fig. S1 for location) also shows a rapid increasing trend of δ18O from ∼8 ka BP (Takeuchi et al., 2014). Recently, Rao et al. (2019) compiled climatic reconstructions from lake sediments, loess, sand dunes and peats in the Xinjiang and surrounding region of northwestern China, including northern parts of the TP, and brought to attention the disagreement between the Guliya ice core and other records. Their reconstructed records suggest a long-term warming trend during the Holocene. By comparison, it seems that the δ18O profile of the Guliya ice core, especially for the period of 6–7 to ∼3 ka BP, is at odds with this warming trend during the mid-Holocene. It is possible that this anomaly is not caused by the dramatic difference in local climate conditions but linked to the equally anomalous length of Guliya's temporal coverage, which is over 1 order of magnitude greater than that of the surrounding ice cores (Hou et al., 2018). We are aware of studies suggesting a mid-Holocene cooling trend on the TP and surrounding regions, as argued by Thompson (2019, and references therein). Meanwhile, other recent studies show a warming trend (e.g., Rao et al., 2019), similar to our results. Therefore, more research is needed to reach a more definitive conclusion on the Tibetan mid-Holocene climate variations.
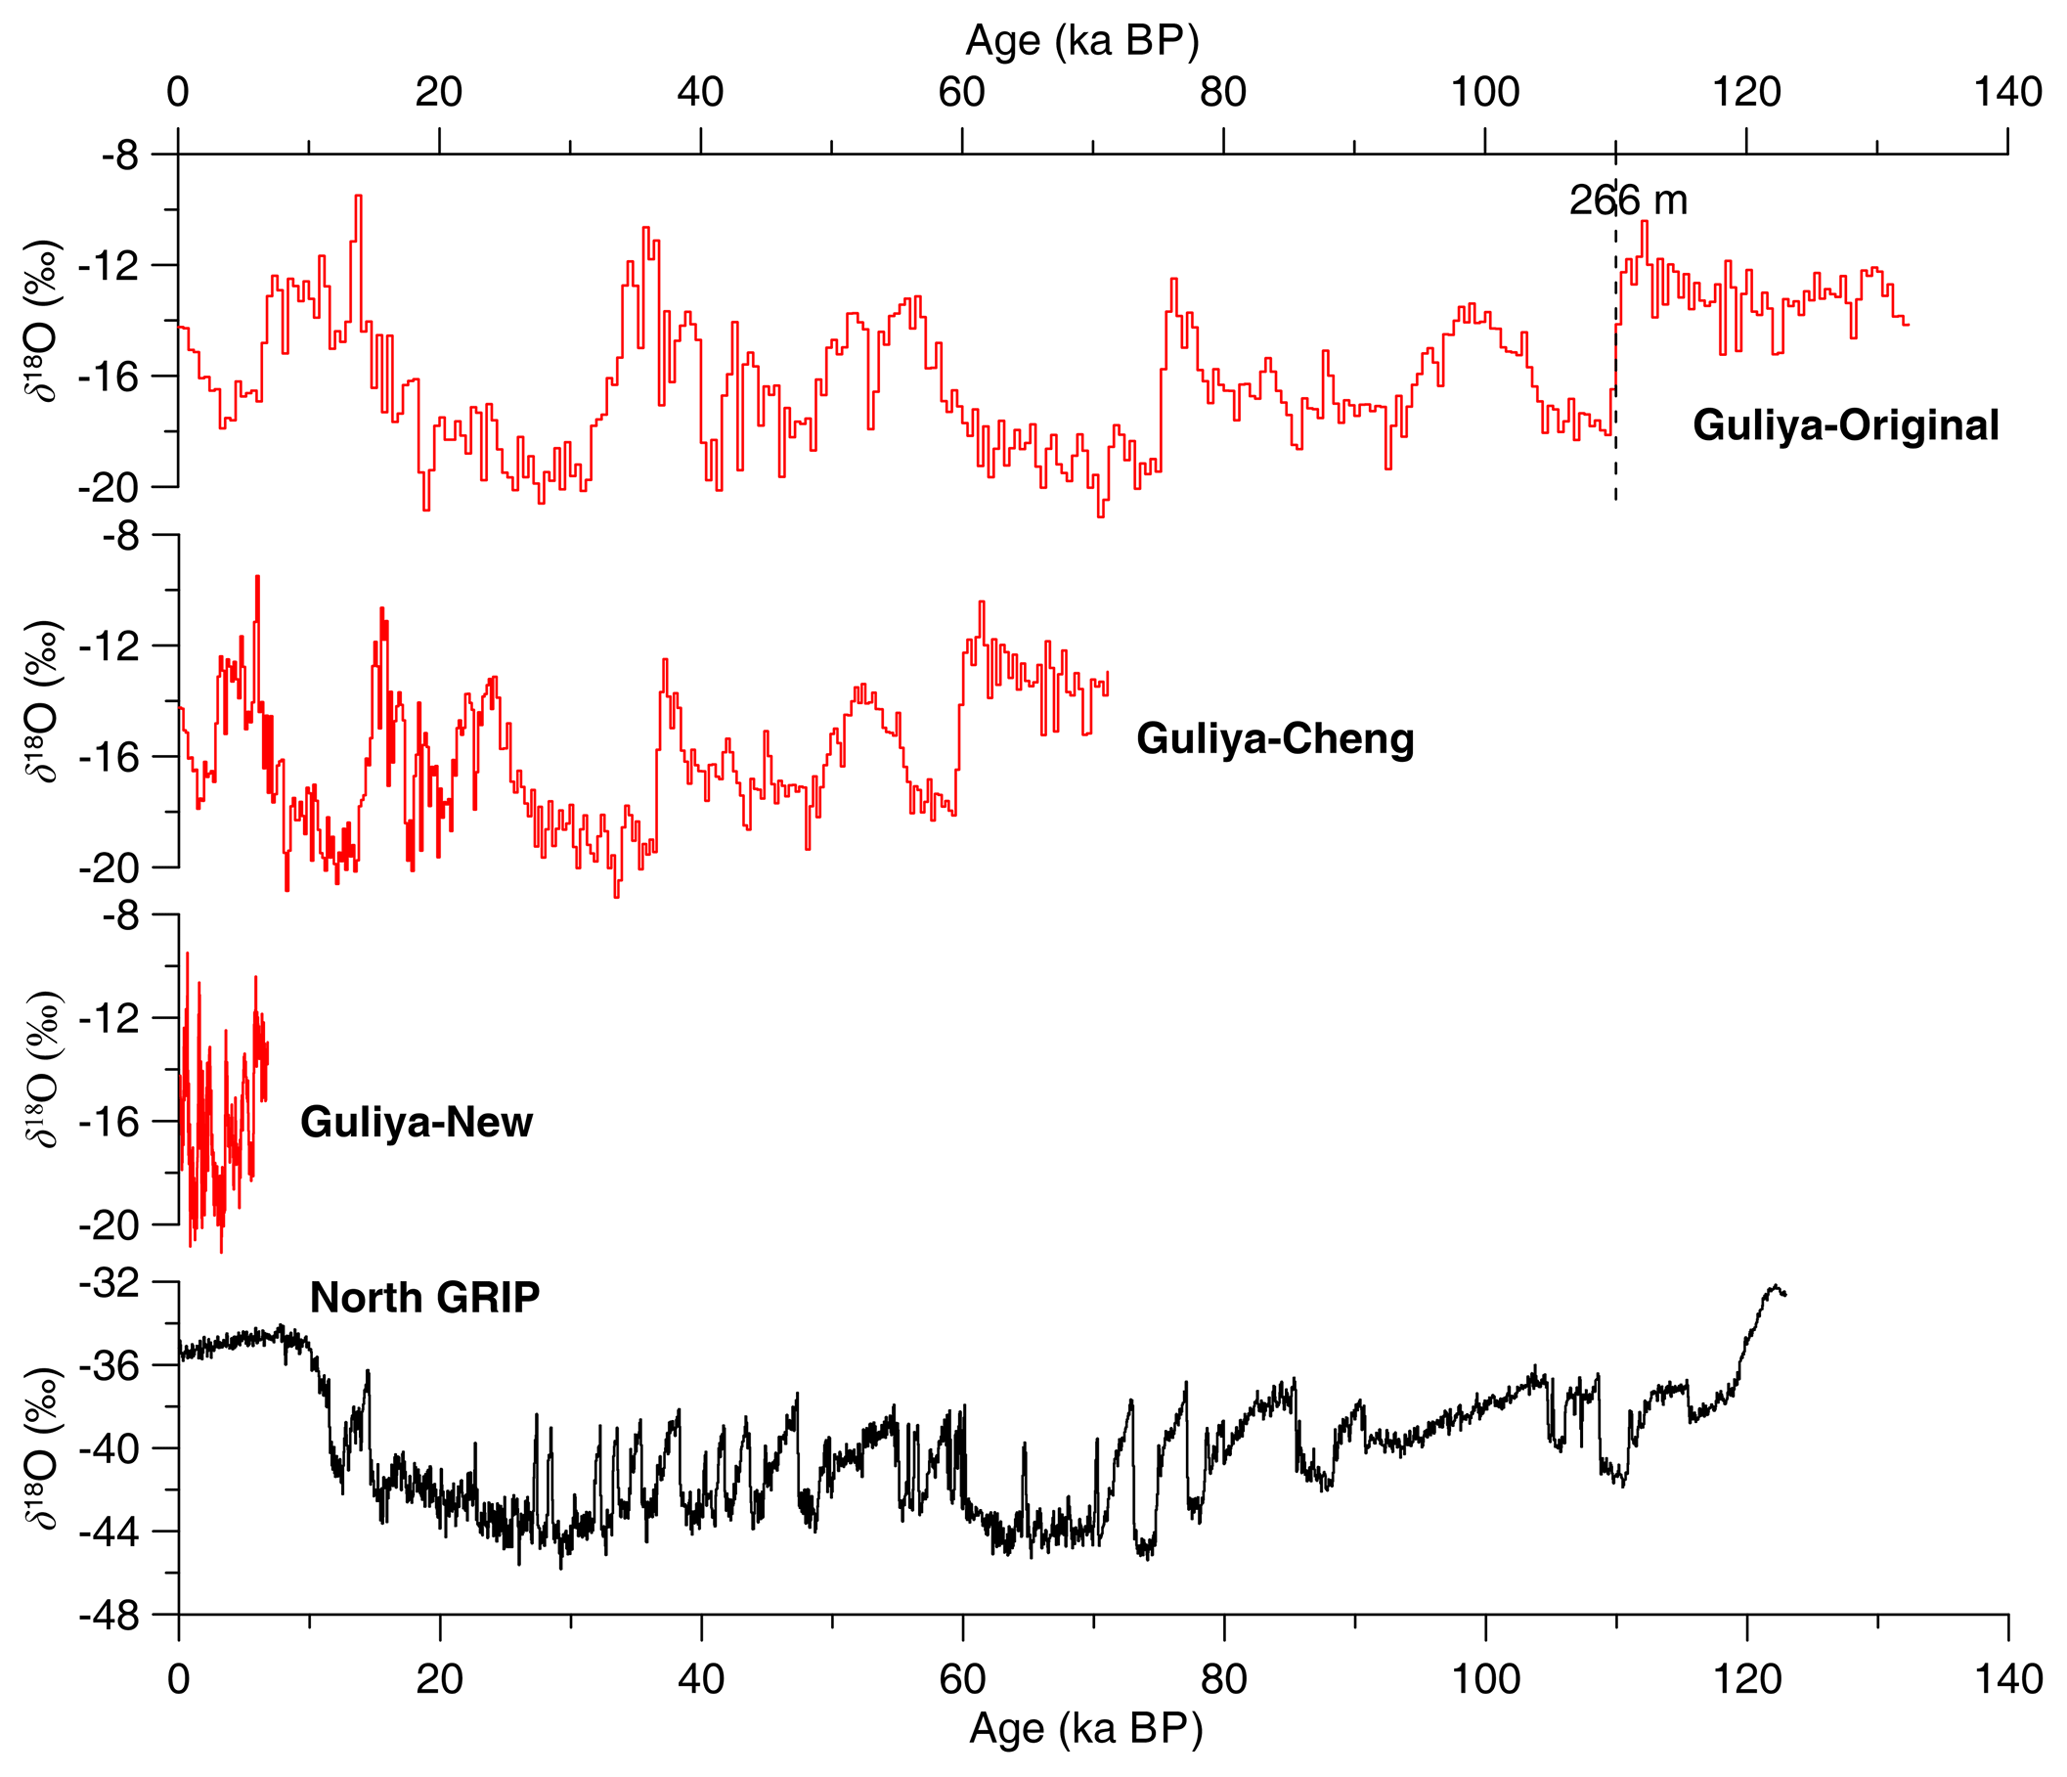
Figure 4The δ18O profiles of the Guliya and North Greenland Ice Core Project (GRIP) ice cores. The Guliya-Original profile is plotted on its original chronology (Thompson et al., 1997). The Guliya-Cheng profile is the original Guliya record linearly compressed by a factor of 2, as suggested in Cheng et al. (2012). The Guliya-New profile is the original Guliya record further compressed linearly so that the high δ18O values fall within the warm Holocene.
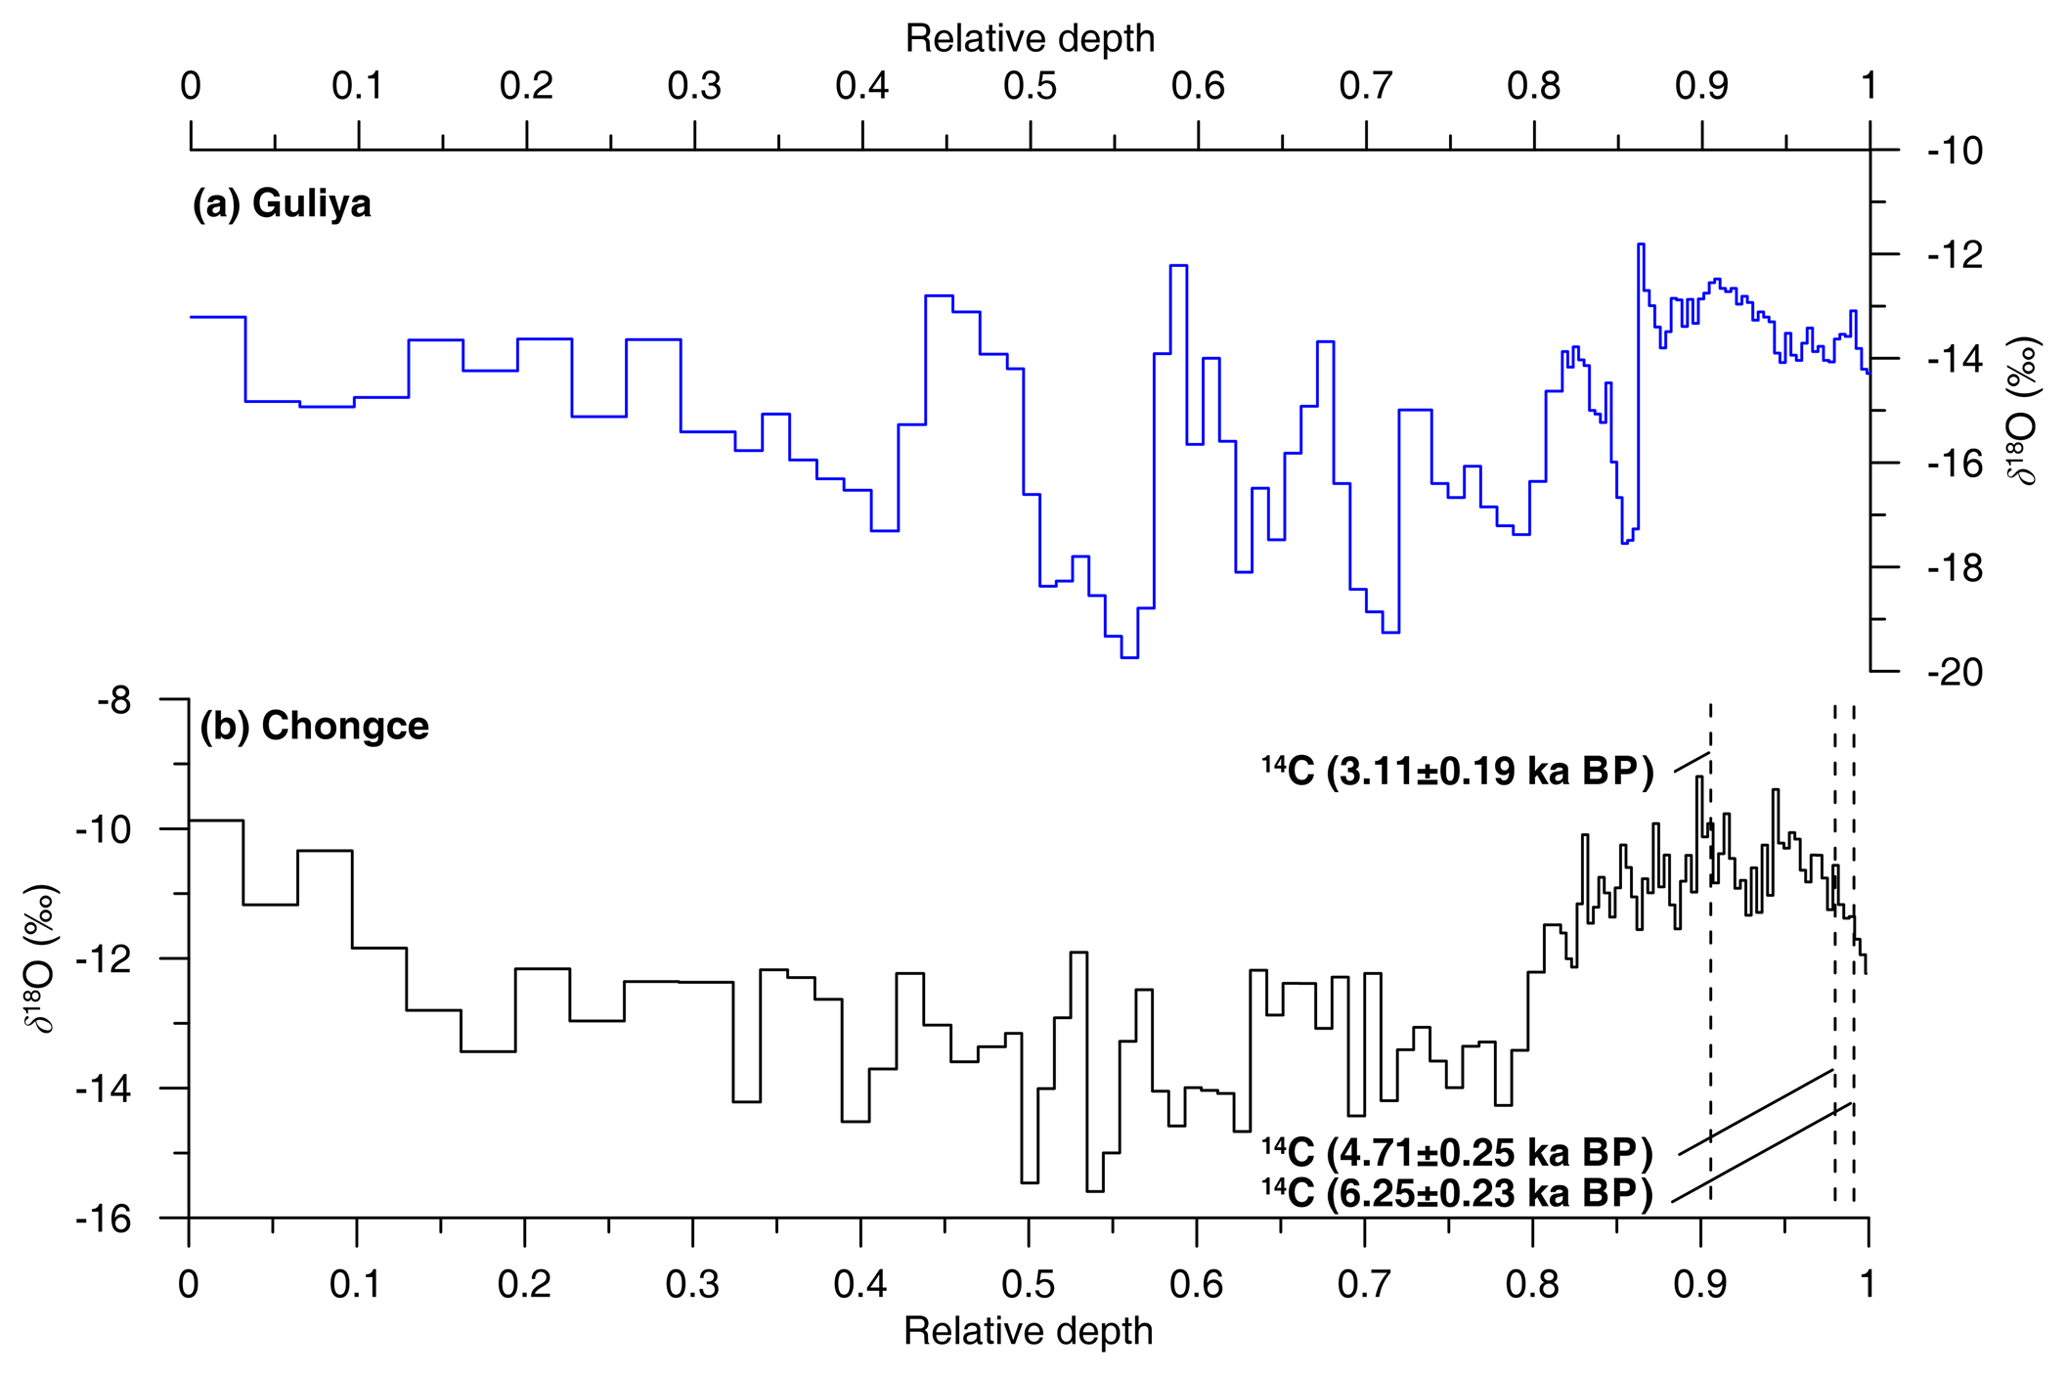
Figure 5The δ18O profiles of the Guliya (a) and Chongce (b) ice cores, plotted against their relative depth. The Chongce profile was averaged to match the temporal resolution of the published Guliya record, as shown in Fig. 2a (Thompson et al., 1997).
Cheng et al. (2012) were one of the first groups of researchers to question the chronology of the Guliya ice core and argued that it should be shortened by a factor of 2 (Fig. 4) in order to reconcile the difference in the δ18O variations between the Guliya ice core and the Kesang stalagmite records (see Fig. S1 for location). However, if compressed linearly by a factor of 2, the revised chronology (“Guliya-Cheng” in Fig. 4) would place the high Guliya δ18O values below the depth of 266 m (i.e., 110 ka BP in Fig. 2) in the cold glacial period (North Greenland Ice Core Project members, 2004). This is very unlikely, given the significantly positive relationship between temperature and δ18O in precipitation over the northwestern TP (Yao et al., 2013; An et al., 2016). We believe the Guliya chronology needs to be further compressed until the high δ18O values below the depth of 266 m (i.e., 110 ka BP in Fig. 2) fall within a warm period (“Guliya-New” in Fig. 4), which is likely to be the mid-Holocene based on the age range of surrounding ice cores (Hou et al., 2018). Since the complete dataset of the Guliya core, as well as its detailed depth–age relationship, is not made available, a detailed comparison between the Guliya and Chongce ice cores is difficult. Therefore, we attempt to make a direct comparison between the depth–δ18O profiles of the Guliya and Chongce ice cores. We first divided the depths of each δ18O data point by the total core length to get the relative depths and compared the δ18O profiles of the Guliya and the Chongce ice cores based on their same relative depth (Fig. 5). The Chongce δ18O profile has much higher sampling resolution than the publicly available Guliya record. In order to account for this difference, we averaged Chongce δ18O values based on the same relative depth intervals of the Guliya record, as shown in Fig. 2a. After averaging, the Guliya and Chongce δ18O profiles share much similarity (Fig. 5) and have a highly significant positive correlation (r=0.57, n=110, p=0.00), whereas their correlation is significantly negative (, n=16, p=0.00) based on Guliya's original chronology (Fig. 3b). Correlations between the δ18O profiles of Chongce–“Guliya-Original” and other Tibetan ice cores during their common period (i.e., 0–6 ka BP) are largely nonsignificant (Table 1). Although a more definitive conclusion would require detailed comparison with the original Guliya dataset (unavailable at the moment) and addition evidence from other Tibetan ice cores, the highly significant correlation between the Guliya and Chongce δ18O profiles based on their relative depth suggests the possibility that the Guliya core covers a similar time span as the Chongce core, which is reasonable given their close proximity (∼30 km in direct distance). Consequently, the apparent discrepancy between the δ18O records of the Guliya and other Tibetan ice cores (Fig. 3) may be attributed to a possible misinterpretation of the Guliya ice core chronology. Although the synchronicity of glaciation on the TP is beyond the scope of the current work, our new understanding of the Guliya ice core chronology would cast doubt on using the Guliya record based on its original chronology as supporting evidence for asynchronous glaciation on the TP on Milankovitch timescales (Thompson et al., 2005).
Table 1Correlation coefficients (n=16) between the δ18O profiles of the Tibetan ice cores.
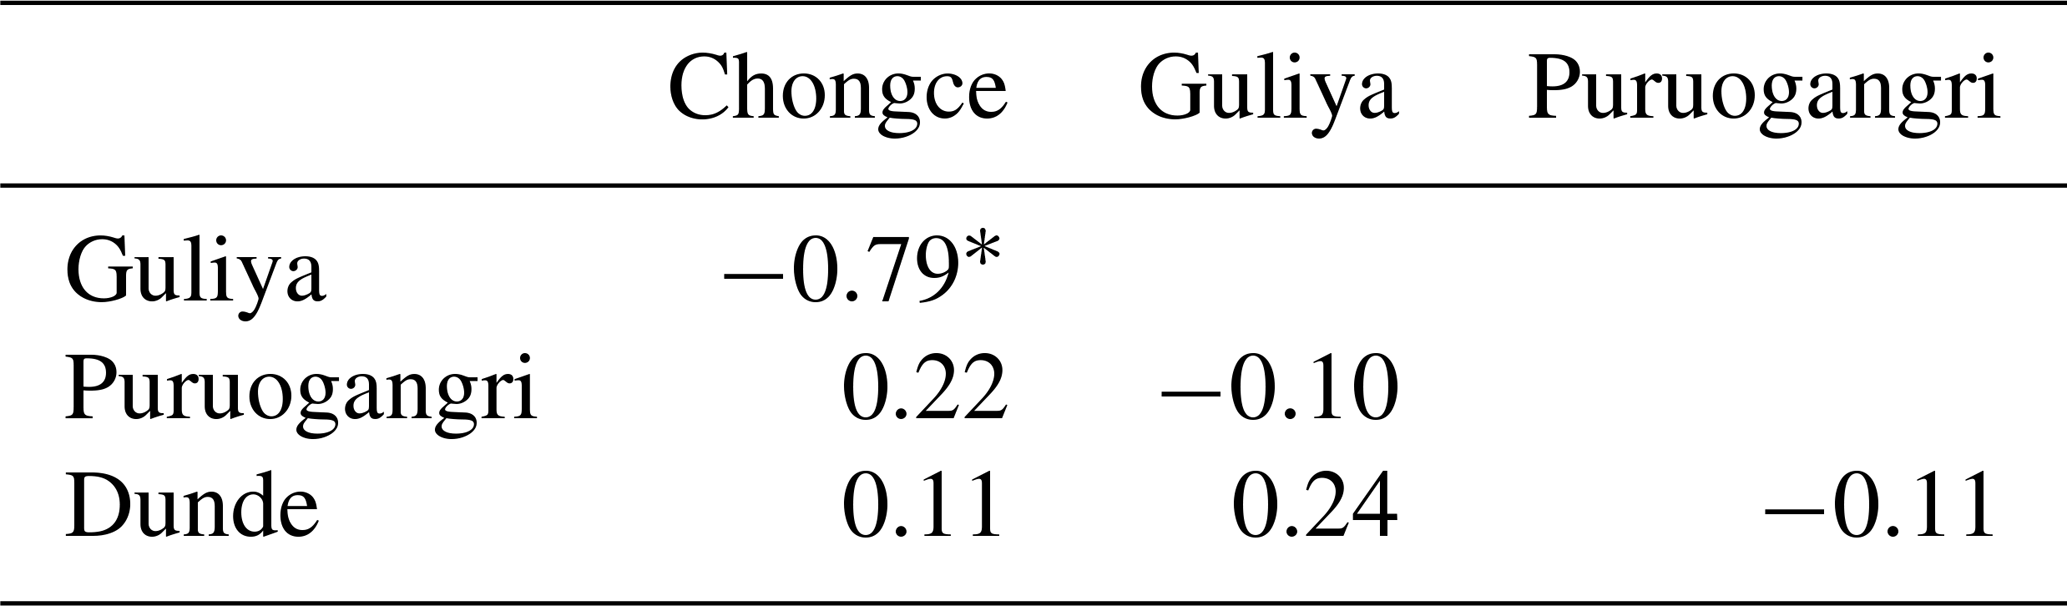
∗ p<0.001.
Recently, Tian et al. (2019) applied 81Kr dating, with the updated laser-based detection method of Atom Trap Trace Analysis (ATTA), to the bottom ice samples collected at the terminal of the Guliya ice cap. The 81Kr data yield upper age limits in the range of 15–74 ka BP (90 % confidence level). In fact, the exact age is likely to be even younger than the upper age limits because they lie at the low limit of the ATTA method. The 81Kr samples collected at three different sites yielded remarkably consistent results (Tian et al., 2019), and all the 81Kr dating results are more than an order of magnitude younger than the original chronology of the 1992 Guliya ice core (Thompson et al., 1997) and roughly in line with the age ranges of the other Tibetan ice cores (Zhang et al., 2018; Hou et al., 2018).
From September to October of 2015, several new ice cores were recovered from the Guliya ice cap, including a core to bedrock (309.73 m) and a shallow core (72.40 m) adjacent to the 1992 Guliya core drilling site, as well as three cores to bedrock (50.72, 51.38, 50.86 m) from the summit (35∘17′ N, 81∘29′ E; ∼6700 m a.s.l.) of the Guliya ice cap (Thompson et al., 2018). The Guliya summit 50.80 m ice core (note that the depth 50.80 m is given in Zhong et al., 2018, which is slightly different from 50.86 m given in Thompson et al., 2018) was dated to be ∼ 20 ka BP at the depth of 41.10–41.84 m and ∼30 ka BP at the depth of 49.51 to 49.90 m by matching the δ18O values with those from the 1992 Guliya ice core (Zhong et al., 2018). We made use of the two age points above, as well as the density profile of the 2015 Guliya summit core (Kutuzov et al., 2018), to estimate the basal age of the Guliya summit core by applying a two-parameter flow model (2p model; Bolzan, 1985), and obtained 76.6, 48.6 and 42.1 ka BP at the depth of 1, 20 and 40 cm w.e. respectively above the ice–bedrock contact (Fig. S2). Although these estimates have great uncertainty due to limited data, the results are still 1 order of magnitude younger than the original chronology of the 1992 Guliya ice core (Thompson et al., 1997) despite the fact that the two age points (i.e., ∼20 and ∼30 ka BP) used by the 2p model are deduced from the original chronology of the 1992 Guliya ice core (Zhong et al., 2018). This casts further doubt on the original Guliya chronology.
In this study, we provided a new high-resolution δ18O record of the Chongce ice cores drilled from the northwestern TP. Our results show a warming trend for the mid-Holocene on the TP, which is largely consistent with the Dunde and, to a lesser degree, Puruogangri ice cores but much different from the Guliya ice core. It is possible that the cooling mid-Holocene derived from the Guliya δ18O record resulted from its erroneous chronology, rather than the unique boundary conditions on the TP as previously suggested, such as decreasing summer insolation and a weakened Indian monsoon (Hou et al., 2016; Li et al., 2017). Our study highlighted the urgent need for more ice core records with reliable chronologies, especially results from the 309.73 m Guliya ice core drilled in 2015 close to the 1992 Guliya core drilling site (Thompson et al., 2018) to verify past temperature variation on the TP, which serves as important baseline information for many other studies, and based on which various scientific hypotheses such as asynchronous glaciation on Milankovitch timescales (Thompson et al., 2005) could be further tested.
The δ18O data of the Chongce ice core are provided in the Supplement.
The supplement related to this article is available online at: https://doi.org/10.5194/tc-13-1743-2019-supplement.
SH conceived this study, drilled the Chongce ice cores and wrote the paper. YW and WZ drilled the Chongce ice cores. WZ performed the δ18O measurements. All authors contributed to discussion of the results.
The authors declare that they have no conflict of interest.
Thanks are due to many scientists, technicians, graduate students and porters, especially to Yongliang Zhang, Hao Xu and Yaping Liu, for their great efforts in the high elevations, to Guocai Zhu for providing the ground-penetrating radar results of the Chongce ice cap and to Lonnie Thompson and Ellen Mosley-Thompson for sharing the Dunde ice core data.
This research has been supported by the National Natural Science Foundation of China (grant nos. 91837102, 41830644, 41711530148, 41330526).
This paper was edited by Carlos Martin and reviewed by Lonnie Thompson and one anonymous referee.
An, W., Hou, S., Zhang, W., Wu, S., Xu, H., Pang, H., Wang, Y., and Liu, Y.: Possible recent warming hiatus on the northwestern Tibetan Plateau derived from ice core records, Sci. Rep., 6, 32813, https://doi.org/10.1038/srep32813, 2016.
Beniston, M., Diaz, H. F., and Bradley, R. S.: Climatic change at high elevation sites: an overview, Clim. Change, 36, 233–251, https://doi.org/10.1023/A:1005380714349, 1997.
Bolzan, J.: Ice flow at the Dome C ice divide based on a deep temperature profile, J. Geophys. Res., 90, 8111–8124, 1985.
Cheng, H., Zhang, P., Spötl, C., Edwards, R., Cai, Y., Zhang, D., Sang, W., Tan, M., and An, Z.: The climatic cyclicity in semiarid-arid central Asia over the past 500,000 years, Geophys. Res. Lett. 39, L01705, https://doi.org/10.1029/2011gl050202, 2012.
Cheng, H., Spötl, C., Breitenbach, S. F. M., Sinha, A., Wassenburg, J. A., Jochum, K. P., Scholz, D., Li, X., Yi, L., Peng, Y., Lv, Y., Zhang, P., Votintseva, A., Loginov, V., Ning, Y., Kathayat, G., and Edwards, R. L.: Climate variations of central Asia on orbital to millennial timescales, Sci. Rep., 6, 36975, https://doi.org/10.1038/srep36975, 2016.
Fang, X., Li, J., and van der Voo, R.: Rock magnetic and grain size evidence for intensified Asian atmospheric circulation since 800,000 years BP related to Tibetan uplift, Earth Planet. Sc. Lett., 165, 129–144, https://doi.org/10.1016/S0012-821X(98)00259-3, 1999.
Hou, J., Huang, Y., Zhao, J., Liu, Z., Colman, S., and An, Z.: Large Holocene summer temperature oscillations and impact on the peopling of the northeastern Tibetan Plateau, Geophys. Res. Lett., 43, 1323–1330, https://doi.org/10.1002/2015GL067317, 2016.
Hou, S., Jenk, T. M., Zhang, W., Wang, C., Wu, S., Wang, Y., Pang, H., and Schwikowski, M.: Age ranges of the Tibetan ice cores with emphasis on the Chongce ice cores, western Kunlun Mountains, The Cryosphere, 12, 2341–2348, https://doi.org/10.5194/tc-12-2341-2018, 2018.
Jiao, K., Yao, T., and Li, S.: Evolution of glaciers and environment in the West Kunlun Mountains during the past 32 ka, J. Glacio. Geocryo., 22, 250–256, 2000 (in Chinese with English abstract).
Kang, S., Zhang, Y., Qin, D., Ren, J., Zhang, Q., Grigholm, B., and Mayewski, P.: Recent temperature increase recorded in an ice core in the source region of Yangtze River, Chin. Sci. Bull., 52, 825–831, https://doi.org/10.1007/s11434-007-0140-1, 2007.
Kutuzov, S., Thompson, L. G., Lavrentiev, I., and Tian, L. D.: Ice thickness measurements of Guliya ice cap, western Kunlun Mountains (Tibetan Plateau), China, J. Glaciol., 64, 977–989, https://doi.org/10.1017/jog.2018.91, 2018.
Li, X., Wang, M., Zhang, Y., Li, L., and Hou, J.: Holocene climatic and environmental change on the western Tibetan Plateau revealed by glycerol dialkyl glycerol tetraethers and leaf wax deuterium-to-hydrogen ratios at Aweng Co, Quaternary Res., 87, 455–467, https://doi.org/10.1017/qua.2017.9, 2017.
Lin, H., Li, G., Cuo, L., Hooper, A., and Ye, Q.: A decreasing glacier mass balance gradient from the edge of the Upper Tarim Basin to the Karakoram during 2000–2014, Sci. Rep., 7, 6712, https://doi.org/10.1038/s41598-017-07133-8, 2017.
Liu, X. and Chen, B.: Climatic warming in the Tibetan Plateau during recent decades, Int. J. Climol. 20, 1729–1742, 2000.
Liu, X., Rao, Z., Zhang, X., Huang, W., Chen, J., and Chen, F.: Variations in the oxygen isotopic composition of precipitation in the Tianshan Mountains region and their significance for the Westerly circulation, J. Geogr. Sci. 25, 801–816, https://doi.org/10.1007/s11442-015-1203-x, 2015.
Liu, Z., Zhu, J., Rosenthal, Y., Zhang, X., Otto-Bliesner, B., Timmermann, A., Smith, R., Lohmann, G., Zheng, W., and Timm, O.: The Holocene temperature conundrum, P. Natl Acad. Sci. USA, 111, E3501–E3505, https://doi.org/10.1073/pnas.1407229111, 2014.
Marcott, S., Shakun, J., Clark, P., and Mix, A.: A reconstruction of regional and global temperature for the past 11,300 years, Science, 339, 1198–1201, https://doi.org/10.1126/science.1228026, 2013.
Marsicek, J., Shuman, B., Bartlein, P., Shafer, S., and Brewer, S.: Reconciling divergent trends and millennial variations in Holocene temperatures, Nature, 554, 92–96, https://doi.org/10.1038/nature25464, 2018.
Mountain Research Initiative EDW Working Group: Elevation-dependent warming in mountain regions of the world, Nat. Clim. Change, 5, 424–430, https://doi.org/10.1038/nclimate2563, 2015.
North Greenland Ice Core Project members: High-resolution record of northern Hemisphere climate extending into the last interglacial period, Nature, 431, 147–151, https://doi.org/10.1038/nature02805, 2004.
Rahaman, W., Singh, S., Sinha, R., and Tandon, S.: Climate control on erosion distribution over the Himalaya during the past ∼100 ka, Geology, 37, 559–562, https://doi.org/10.1130/G25425A.1, 2009.
Rao, Z., Wu, D., Shi, F., Guo, H., Cao, J., and Chen, F.: Reconciling the “westerlies” and “monsoon” models: A new hypothesis for the Holocene moisture evolution of the Xinjiang region, NW China, Earth-Sci. Rev., 191, 263–272, https://doi.org/10.1016/j.earscirev.2019.03.002, 2019.
Ren, W., Yao, T., Xie, S., and He, Y.: Controls on the stable isotopes in precipitation and surface waters across the southeastern Tibetan Plateau, J. Hydrol., 545, 276–287, https://doi.org/10.1016/j.jhydrol.2016.12.034, 2017.
Risi, C., Bony, S., Vimeux, F., and Jouzel, J.: Water stable isotopes in the LMDZ4 General Circulation Model: Model evaluation for present day and past climates and applications to climatic interpretation of tropical isotopic records, J. Geophys. Res., 115, D12118, https://doi.org/10.1029/2009jd013255, 2010.
Saini, J., Günther, F., Aichner, B., Mischke, S., Herzschuh, U., Zhang, C., Mäusbacher, R., and Gleixner, G.: Climate variability in the past yr in NE Tibetan Plateau inferred from biomarker and stable isotope records of Lake Donggi Cona, Quaternary Sci. Rev., 157, 129–140, https://doi.org/10.1016/j.quascirev.2016.12.023, 2017.
Sanwal, J., Rajendran, C. P., and Sheshshayee, M. S.: Reconstruction of late quaternary climate from a paleo-lacustrine profile in the central (Kumaun) Himalaya: viewing the results in a regional context, Front. Earth Sci., 7, https://doi.org/10.3389/feart.2019.00002, 2019.
Shao, L., Tian, L., Cai, Z., Cui, J., Zhu, D., Chen, Y., and Palcsu, L.: Driver of the interannual variations of isotope in ice core from the middle of Tibetan Plateau, Atmos. Res., 188, 48–54, https://doi.org/10.1016/j.atmosres.2017.01.006, 2017.
Sun, Y., Clemens, S., Morrill, C., Lin, X., Wang, X., and An, Z.: Influence of Atlantic meridional overturning circulation on the East Asian winter monsoon, Nat. Geosci., 5, 46–49, https://doi.org/10.1038/ngeo1326, 2012.
Takeuchi, N., Fujita, K., Aizen, V., Narama, C., Yokoyama, Y., Okamoto, S., Naoki, K., and Kubota, J.: The disappearance of glaciers in the Tien Shan Mountains in Central Asia at the end of Pleistocene, Quaternary Sci. Rev., 103, 26–33, https://doi.org/10.1016/j.quascirev.2014.09.006, 2014.
Tang, Y., Pang, H., Zhang, W., Li, Y., Wu, S., and Hou, S.: Effects of changes in moisture source and the upstream rainout on stable isotopes in precipitation – a case study in Nanjing, eastern China, Hydrol. Earth Syst. Sci., 19, 4293–4306, https://doi.org/10.5194/hess-19-4293-2015, 2015.
Thompson, L. G.: Past, present, and future of glacier archives from the world's highest mountains, P. Am. Philos. Soc., 161, 226–243, 2017.
Thompson, L. G.: Interactive comment on “Apparent discrepancy of Tibetan ice core δ18O records may be attributed to misinterpretation of chronology” by Shugui Hou et al., The Cryosphere Discuss., https://doi.org/10.5194/tc-2018-295-RC2, 2019.
Thompson, L. G., Mosley-Thompson, E., Davis, M., Bolzan, J., Dai, J., Klein, L., Yao, T., Wu, X., Xie, Z., and Gundestrup, N.: Holocene-late pleistocene climatic ice core records from Qinghai-Tibetan Plateau, Science, 246, 474–477, https://doi.org/10.1126/science.246.4929.474, 1989.
Thompson, L. G., Yao, T., Davis, M. E., Henderson, K. A., Mosley-Thompson, E., Lin, P.-N., Beer, J., Synal, H.-A., Cole-Dai, J., and Bolzan, J. F.: Tropical climate instability: the last glacial cycle from a Qinghai-Tibetan ice core, Science, 276, 1821–1825, https://doi.org/10.1126/science.276.5320.1821, 1997.
Thompson, L. G., Davis, M., Mosley-Thompson, E., Lin, P., Henderson, K., and Mashiotta, T.: Tropical ice core records: evidence for asynchronous glaciation on Milankovitch timescales, J. Quaternary Sci., 20, 723–733, https://doi.org/10.1002/jqs.972, 2005.
Thompson, L. G., Yao, T., Davis, M., Mosley-Thompson, E., Mashiotta, T., Lin, P., Mikhalenko, V., and Zagorodnov, V.: Holocene climate variability archived in the Puruogangri ice cap on the central Tibetan Plateau, Ann. Glaciol., 43, 61–69, https://doi.org/10.3189/172756406781812357, 2006.
Thompson, L. G., Yao, T., Davis, M., Mosley-Thompson, E., Wu, G., Porter, S., Xu, B., Lin, P., Wang, N., Beaudon, E., Duan, K., Sierra-Hernández, M., and Kenny, D.: Ice core records of climate variability on the Third Pole with emphasis on the Guliya ice cap, western Kunlun Mountains, Quaternary Sci. Rev., 188, 1–14, https://doi.org/10.1016/j.quascirev.2018.03.003, 2018.
Tian, L., Yao, T., Schuster, P. F., White, J. W. C., Ichiyanagi, K., Pendall, E., Pu, J., and Yu, W.: Oxygen-18 concentrations in recent precipitation and ice cores on the Tibetan Plateau, J. Geophys. Res., 108, 4293, https://doi.org/10.1029/2002JD002173, 2003.
Tian, L., Yao, T., Li, Z., MacClune, K., Wu, G., Xu, B., Li, Y., Lu, A., and Shen, Y.: Recent rapid warming trend revealed from the isotopic record in Muztagata ice core, eastern Pamirs, J. Geophys. Res., 111, D13103, https://doi.org/10.1029/2005JD006249, 2006.
Tian, L., Ritterbusch, F., Gu, J., Hu, S., Jiang, W., Lu, Z., Wang, D., and Yang, G.: 81Kr dating of the Guliya ice cap, Tibetan Plateau, Geophys. Res. Lett., 46, https://doi.org/10.1029/2019GL082464, 2019.
Wang, Y., Hou, S., Huai, B., An, W., Pang, H., and Liu, Y.: Glacier anomaly over the Western Kunlun Mountains, northwestern Tibetan Plateau, since the 1970s, J. Glaciol., 64, 624–636, https://doi.org/10.1017/jog.2018.53, 2018.
Yao, T., Thompson, L. G., Mosley-Thompson, E., Yang, Z., Zhang, X., and Lin, P.: Climatological significance of δ18O in north Tibetan ice cores, J. Geophys. Res., 101, 29531–29537, https://doi.org/10.1029/96JD02683, 1996.
Yao, T., Masson-Delmotte, V., Gao, J., Yu, W., Yang, X., Risi, C., Sturm, C., Werner, M., Zhao, H., He, Y., Ren, W., Tian, L., Shi, C., and Hou, S.: A review of climatic controls on δ18O in precipitation over the Tibetan Plateau: Observations and simulations, Rev. Geophys., 51, 525–548, https://doi.org/10.1002/rog.20023, 2013.
Yasuda, T. and Furuya, M.: Dynamics of surge-type glaciers in West Kunlun Shan, Northwestern Tibet, J. Geophys. Res., 120, 2393–2405, https://doi.org/10.1002/2015JF003511, 2015.
Zhang, Z., Hou, S., and Yi, S.: The first luminescence dating of Tibetan glacier basal sediment, The Cryosphere, 12, 163–168, https://doi.org/10.5194/tc-12-163-2018, 2018.
Zhong, Z. P., Solonenko, N.E., Gazitúa, M. C., Kenny, D. V., Mosley-Thompson, E., Rich, V. I., Van Etten, J. L., Thompson, L. G., and Sullivan, M. B.: Clean low-biomass procedures and their application to ancient ice core microorganisms, Front. Microbiol., 9, 1–15, https://doi.org/10.3389/fmicb.2018.01094, 2018.
Zhou, Y., Li, Z., Li, J., Zhao, R., and Ding, X.: Glacier mass balance in the Qinghai–Tibet Plateau and its surroundings from the mid-1970s to 2000 based on Hexagon KH-9 and SRTM DEMs, Remote Sens. Environ., 210, 96–112, https://doi.org/10.1016/j.rse.2018.03.020, 2018.
- Article
(1982 KB) - Full-text XML