the Creative Commons Attribution 4.0 License.
the Creative Commons Attribution 4.0 License.
 | 03 May 2018
Observations and simulations of the seasonal evolution of snowpack cold content and its relation to snowmelt and the snowpack energy budget
Keith S. Jennings
Timothy G. F. Kittel
Noah P. Molotch
Cold content is a measure of a snowpack's energy deficit and is a linear function of snowpack mass and temperature. Positive energy fluxes into a snowpack must first satisfy the remaining energy deficit before snowmelt runoff begins, making cold content a key component of the snowpack energy budget. Nevertheless, uncertainty surrounds cold content development and its relationship to snowmelt, likely because of a lack of direct observations. This work clarifies the controls exerted by air temperature, precipitation, and negative energy fluxes on cold content development and quantifies the relationship between cold content and snowmelt timing and rate at daily to seasonal timescales. The analysis presented herein leverages a unique long-term snow pit record along with validated output from the SNOWPACK model forced with 23 water years (1991–2013) of quality controlled, infilled hourly meteorological data from an alpine and subalpine site in the Colorado Rocky Mountains. The results indicated that precipitation exerted the primary control on cold content development at our two sites with snowfall responsible for 84.4 and 73.0 % of simulated daily gains in the alpine and subalpine, respectively. A negative surface energy balance – primarily driven by sublimation and longwave radiation emission from the snowpack – during days without snowfall provided a secondary pathway for cold content development, and was responsible for the remaining 15.6 and 27.0 % of cold content additions. Non-zero cold content values were associated with reduced snowmelt rates and delayed snowmelt onset at daily to sub-seasonal timescales, while peak cold content magnitude had no significant relationship to seasonal snowmelt timing. These results suggest that the information provided by cold content observations and/or simulations is most relevant to snowmelt processes at shorter timescales, and may help water resource managers to better predict melt onset and rate.
- Article
(11063 KB) - Full-text XML
-
Supplement
(380 KB) - BibTeX
- EndNote


Cold content is a key component of the snowpack energy budget as it represents the internal energy deficit that must be overcome before snowmelt runoff can begin. It is a linear function of snowpack temperature and snow water equivalent (SWE), whereby colder snowpacks with greater SWE have increased energy deficits. Until cold content is satisfied, positive energy fluxes go towards raising the internal snowpack temperature to an isothermal 0 ∘C and any surface melt that is produced may be refrozen in the colder lower layers of the snowpack. In this regard, cold content influences the timing and rate of snowmelt runoff, which is of critical importance to various ecohydrologic and cryospheric processes, including streamflow generation (Barnhart et al., 2016; Regonda et al., 2005), water resources availability (Barnett et al., 2005; Christensen et al., 2004; Mankin et al., 2015; Stewart, 2009), water uptake by vegetation (Winchell et al., 2016), soil moisture (Harpold and Molotch, 2015), flooding (Jennings and Jones, 2015; Kampf and Lefsky, 2016), and land surface albedo (Déry and Brown, 2007), among others.
Cold content can be estimated using at least one of three primary methods: (1) as an empirical function of air temperature (e.g., Anderson, 1976; DeWalle and Rango, 2008; Seligman et al., 2014; United States Army Corps of Engineers, 1956); (2) as a function of precipitation and air temperature (e.g., Cherkauer et al., 2003; Lehning et al., 2002b; Wigmosta et al., 1994) or wet bulb temperature (Anderson, 1968) during precipitation; and (3) as a residual of the snowpack energy balance (e.g., Andreadis et al., 2009; Cline, 1997; Lehning et al., 2002b; Marks and Winstral, 2001). In general, simple temperature-index models employ method (1), while both (2) and (3) are utilized in physics-based snow models. These methods suggest that cold content develops through both meteorological and energy balance processes, but few direct comparisons to observed cold content exist. This is likely due to the inherent difficulty in measuring cold content, which requires either time-intensive snow pits or co-located snow depth, density, and temperature measurements (Burns et al., 2014; Helgason and Pomeroy, 2011; Marks et al., 1992; Molotch et al., 2016). The lack of validation data introduces significant uncertainty into the dominant process by which cold content develops. Thus, it is not known whether cold content development is primarily a function of air temperature (method 1), snowfall (method 2), or a negative surface energy balance (method 3).
Early work from California's Sierra Nevada mountains indicated cold content developed in the snowpack mainly through a negative surface energy balance. The reported monthly change in snowpack internal energy (i.e., change in cold content) ranged from −34 to −61 W m−2 from November through April at an exposed site and −8 to −66 W m−2 from November through February at a sheltered site (Marks and Dozier, 1992). However, such negative fluxes would result in physically unrealistic internal snowpack temperature changes. Even persistent slightly negative flux values, as reported elsewhere in the literature (Armstrong and Brun, 2008), would result in implausibly low snowpack temperatures. It can be inferred that any process producing anomalously low snowpack temperatures either misidentifies or overestimates the importance of a particular meteorological or energy balance mechanism.
Furthermore, the degree to which wintertime cold content magnitude controls snowmelt timing and rate at daily to seasonal timescales is relatively uncertain. Work from the southwestern United States suggests increased cold content may delay seasonal melt timing (Molotch et al., 2009) and the inclusion of cold content generally improves meltwater outflow predictions in point and distributed snowmelt models of varying degrees of physical complexity (Bengtsson, 1982; Jepsen et al., 2012; Livneh et al., 2010; Mosier et al., 2016; Obled and Rosse, 1977). However, two empirical studies indicated that the energy required to satisfy cold content may be relatively small in comparison to the energy required to melt enough snow to fulfill the irreducible water content of an already isothermal snowpack (Bengtsson, 1982; Seligman et al., 2014).
Given the above unknowns, we aim to improve understanding of the processes controlling cold content development and the relationship between cold content and snowmelt timing and rate at a continental, mid-latitude alpine and subalpine site in the Colorado Rocky Mountains. Our research utilizes observations from a long-term snow pit record and simulation output from a physics-based snow model forced with a quality controlled, serially complete meteorological dataset. Analyses performed on the observations and simulation data are focused on answering the following research questions:
- 1.
What are the meteorological and energy balance controls on cold content development at an alpine and subalpine site in the Colorado Rocky Mountains?
- 2.
How does cold content affect snowmelt timing and rate on seasonal, sub-seasonal, and daily timescales?

Figure 1The location of the Niwot Ridge LTER within the western United States (a) and a topographical map showing the meteorological stations and snow pit sites. The dashed line in the LTER inset (b) represents the approximate treeline (3400 m) and the thin, solid lines are 100 m contours. The snow study focused on the alpine (c) and subalpine sites (d), the two locations which have co-located snow pit observations and meteorological stations. The high alpine site was used as an additional station in the meteorological data infilling protocol and the Niwot SNOTEL was used for model validation.
The Niwot Ridge Long Term Ecological Research site (LTER) is located on the eastern slope of the Continental Divide in the Rocky Mountains of Colorado, USA (Fig. 1). The entirety of the LTER is situated above 3000 m with treeline occurring at approximately 3400 m (Williams et al., 1998). Dominant vegetation in the subalpine is lodgepole pine, aspen, Engelmann spruce, subalpine fir, and limber pine (Burns et al., 2014). The alpine is characterized by several tundra vegetation communities of grasses, forbs, and shrubs, whose distribution is linked to patterns of snow depth and soil moisture (Walker et al., 1993, 1994).
There are multiple meteorological stations within the boundaries of the Niwot Ridge LTER, but this work focuses on the two sites with long-term snow pit records: alpine (3528 m) and subalpine (3022 m), named Saddle and C1, respectively (Fig. 1). We employed an additional high alpine station (D1, 3739 m) in the meteorological data infilling procedure (Appendix A), but did not perform model simulations there due to a lack of snow pit validation data. From 2008 to 2012, annual precipitation in the alpine and subalpine averaged 1071 and 752 mm, respectively (Knowles et al., 2015) and the ratio between above- and below-treeline precipitation varies annually as a function of upper-air flow regimes (Kittel et al., 2015). The majority of annual precipitation is snow, with estimates of the proportion of snowfall ranging from 63 to 80 % of total precipitation (Caine, 1996; Knowles et al., 2015). Over our study period, December, January, and February mean air temperature was −10.3 ∘C in the alpine and −6.2 ∘C in the subalpine. Dominant wind direction is westerly, but the subalpine site also experiences easterly flow during intermittent upslope events (Blanken et al., 2009; Burns et al., 2014). Elevated wind speeds in the alpine, averaging 10 to 13 m s−1 in winter, exert a primary control on patterns of snow erosion and deposition with snow depth being highly variable as a result (Erickson et al., 2005; Jepsen et al., 2012; Litaor et al., 2008). Snow depths in the alpine can range from 0 m over wind-scoured tundra to upwards of 5 m in drifts on the lee side of terrain features or in gullies. Additionally, blowing snow occurs frequently during winter months in the alpine due to high winds, reaching a maximum in January (Berg, 1986).
Regular snow pit measurements began in 1995 in the alpine and 2007 in the subalpine, and were taken at weekly to monthly intervals from the middle of January through the end of May in most snow seasons (Williams, 2016). A total of 292 alpine and 147 subalpine snow pit records were used in this study (Table S1 in the Supplement). The alpine snow pit represents conditions typical of the above-treeline snowpack as it is not in an area of pronounced snow erosion or deposition. The subalpine snow pit is located in a stand of lodgepole pine, typical of vegetation conditions in the below-treeline areas. Measurement protocol follows Williams et al. (1999): snow density is measured for each 10 cm layer using a wedge-shaped 1 L density cutter (10 cm × 10 cm × 20 cm) and snow temperature is recorded every 10 cm with dial-stem thermometers. Snow pit measurements enable per-layer and depth-weighted calculations of SWE and cold content:
where ρs and ρw are the density of snow and liquid water, respectively (kg m−3), ds is snow depth (m), CC is cold content (MJ m−2), ci is the specific heat of ice ( MJ kg−1 ∘C−1), Ts is the snow temperature (∘C), and Tm is the melting temperature of snow (0 ∘C). Snow pit analyses focused on water years (WY, 1 October from the previous calendar year through 30 September) 2007 through 2013, the period for which overlapping snow pit data were available. The full period of record in the alpine (WY1995–WY2013) was used for model validation.
Hourly meteorological data have been collected at the LTER since 1990, but the record suffers from quality control issues and periods of missing data. Recent research has shown the quality of snow model output depends on having accurate forcing data (e.g., Förster et al., 2014; Lapo et al., 2015; Raleigh et al., 2015, 2016; Schmucki et al., 2014). Measurements were therefore subjected to an extensive quality control and infilling protocol (Appendix A) to produce a serially complete, hourly dataset with observations of air temperature, relative humidity, incoming solar radiation, wind speed, and precipitation. The dataset also includes hourly estimates of downwelling longwave radiation based on air temperature, relative humidity, and incoming solar radiation using the methods of Angström (1915), Crawford and Duchon (1999) and Dilley and O'Brien (1998) as described in Flerchinger et al. (2009).
Observations from the Niwot Ridge LTER snow pit record and validated output data from physics-based snow model simulations were employed to answer the two research questions. We assessed the meteorological controls on cold content development using measurements of cumulative precipitation and the cumulative mean of air temperature for the full period of record at both sites. We focused the analysis on snow pit observations and simulations between 1 December and the date of peak cold content, the main period of cold content development. We then tested whether persistent large negative energy fluxes could be responsible for cold content development by calculating the rate of change in internal energy between pit observations and using the snow model simulations to calculate the snowpack energy budget. Model output was also used to assess the effect of cold content magnitude and timing on snowmelt rate and timing at daily to seasonal timescales. Additionally, we note that in this paper an ”increase” or ”gain” in cold content refers to the value increasing in magnitude and becoming more negative (i.e., the energy deficit is becoming greater). A ”decrease” or ”loss” of cold content occurs when the value becomes less negative and approaches 0 MJ m−2.
3.1 Snow pit analysis
Mean characteristics of and differences between the alpine and subalpine snow pits were quantified using data from WY2007–WY2013, the 7 years for which there were overlapping observations. To assess the control each meteorological quantity exerted on cold content, we used the cumulative mean of air temperature and cumulative precipitation as the independent variables with observed cold content acting as the dependent variable in ordinary least squares regression. The strength of the relationship was quantified using the coefficient of determination, r2, while the p-value of the regression slope indicated statistical significance. Additionally, in order to evaluate whether large persistent negative energy balances were consistent with patterns of cold content development, we calculated the rate of change in internal energy between snow pit observations:
where is the pit-observed rate of change in internal energy (W m−2), ΔCC is the change in cold content (J m−2) between snow pit observations, 86 400 is the conversion factor between days and seconds (s d−1), and Δt is the number of days between snow pit observations (days). Snow pit cold content in this context integrates the effects of incoming and outgoing fluxes, plus the cold content added by precipitation, by providing a measure of the change in the internal energy of the snowpack independent of any surface flux measurements or estimations.
3.2 Snow model simulations
3.2.1 Model description
In order to evaluate cold content development processes at a finer temporal resolution and quantify components of the energy budget, we employed the complex, physics-based, multi-layer, one-dimensional SNOWPACK model (Bartelt and Lehning, 2002; Lehning et al., 2002a, b). This model was selected because previous studies have shown complex, multi-layer models more accurately partition the snowpack energy budget and better represent internal processes (Blöschl and Kirnbauer, 1991; Boone and Etchevers, 2001; Essery et al., 2013; Etchevers et al., 2004). Additionally, SNOWPACK was utilized in previous work to simulate the snowpack energy budget at the Niwot Ridge LTER (Meromy et al., 2015) and it has been validated in the Rocky Mountains of Montana (Lundy et al., 2001). SNOWPACK is forced with air temperature, relative humidity, wind speed, incoming solar radiation, incoming longwave radiation, and precipitation at an hourly or higher temporal resolution. The model discretizes the snowpack into a variable number of layers that change with the addition of new snow, mass loss through snowmelt and sublimation, and densification via compaction. Each layer is composed of water in liquid, solid, and gas phases, all of which are assumed to have the same temperature. SNOWPACK is governed by four differential equations that account for the conservation of energy, mass, and momentum. Explicit routines are included for heat transfer, water transport, and phase changes. In addition, the model features quasi-physical estimations of snow microstructure and snow grain metamorphism. These properties, in turn, control the rate of heat conduction and settling within the snowpack. SNOWPACK also models the penetration of shortwave radiation and wind pumping in the upper layers of the snowpack.
We increased the standard SNOWPACK rain–snow air temperature threshold from 1.2 to 2.5 ∘C to better represent precipitation phase partitioning at our high-elevation continental sites. In general, the Rocky Mountains have some of the warmest rain–snow air temperature thresholds in the Northern Hemisphere (Jennings et al., 2018). To test the effect of our threshold selection, we compared the mean annual snow frequency using the 2.5 ∘C threshold (alpine = 76.4 %; subalpine = 61.5 %) to a bivariate binary logistic regression phase prediction model (alpine = 76.7 %; subalpine = 62.8 %). This model predicts precipitation phase as a function of relative humidity and air temperature, and it was shown to be the best precipitation phase method in a Northern Hemisphere comparison (Jennings et al., 2018).
The bulk Richardson number stability correction was used for computing turbulent fluxes in both the alpine and subalpine. Although Monin–Obukhov similarity theory options were available, these stability corrections generally performed worse relative to the bulk Richardson number in our preliminary simulations as well as in the work of others (Essery et al., 2013). Ground heat flux was simulated using the SNOWPACK-default constant soil temperature of 0.0 ∘C because no long-term soil surface temperature data were available.
Additionally, the SNOWPACK canopy module was activated for the subalpine site given its location in a stand of lodgepole pine. Parameters for the canopy module were calibrated using a series of 100 Monte Carlo simulations with parameter ranges bounded by representative estimates of leaf area index, vegetation height, direct canopy throughfall, and wind speed reduction (Table S2). Modeled SWE in the subalpine proved most sensitive to the wind speed reduction parameter, likely due to the siting of the anemometer as noted in Appendix A. Using uncorrected observed wind speed as a model input led to a physically unrealistic amount of snow sublimation.
3.2.2 Model simulations, validation, and analysis
SNOWPACK simulations were performed in the alpine and subalpine for WY1991–WY2013 and forced with the quality controlled, infilled hourly meteorological data detailed in Appendix A. This time range included the lowest (WY2002: 178 mm) and second highest (WY1996: 523 mm) peak SWE observations in the period of record (WY1981–WY2017) at the Niwot Snowpack Telemetry (SNOTEL) station (3020 m), which is located within the Niwot Ridge LTER boundary, less than 1 km from the subalpine snow pit and meteorological tower. Thus, the analysis covered a wide range of feasible snowpack conditions, from pronounced snow drought to peak SWE values greater than 150 % of average, according to the SNOTEL observations.
To ensure the simulation output was suitable for in-depth analysis, we validated model SWE, snowpack temperature, and cold content values on the snow pit observations. We pursued this multi-validation approach because our work focuses on the internal energy of the snowpack and recent research has shown the output from snow model simulations (e.g., energy balance partitioning, SWE) is more reliable when several variables are used in model evaluation (Lapo et al., 2015). Modeled subalpine SWE estimates were also evaluated using observed SWE at the Niwot SNOTEL site. For each quantity of interest, we assessed model performance using the coefficient of determination and mean bias. To improve model output, we corrected precipitation measurements relative to snow pit and SNOTEL SWE observations (Appendix A) and optimized the canopy parameters for subalpine simulations (Sect. 3.2.1). Additionally, there were several times per winter when the simulated cold content spiked rapidly down (ΔCC < −0.3 MJ m−2 h−1), then back up. These data points, which represented less than 0.2 % of the simulation hours, were filtered from the analysis.
We then used the validated output from SNOWPACK to quantify the controls on cold content development and snowmelt processes at a finer temporal resolution than the weekly to monthly snow pit observations. To evaluate the meteorological processes controlling cold content development, we used the same methods employed in the snow pit observations outlined above (Sect. 3.1). Additionally, we quantified the contributions of the simulated snowpack energy balance to cold content development:
where is the simulated rate of change in internal snowpack energy, QM is the energy available for melt (once cold content equals 0.0 MJ,m−2), QSW is net shortwave radiation, QLW is net longwave radiation, QH is sensible heat flux, QLE is latent heat flux, QG is ground heat flux, and QR is the heat advected by precipitation (all W m−2). This work focuses primarily on QSW, QLW, QH, QLE, and QG, which we will refer to as Qnet throughout the remainder of this paper. QR is typically negligible because significant rain-on-snow events are rare at the Niwot Ridge LTER.
Simulation results were also used to quantify the control cold content exerts on snowmelt timing and rate at multiple timescales. At the seasonal timescale, we set snowmelt onset to correspond to the date of peak SWE and snowmelt rate to the ablation slope, which is the average daily snowmelt rate between the date of peak SWE and the date at which SWE first equals 0 mm (e.g., Barnhart et al., 2016; Trujillo and Molotch, 2014). At sub-seasonal timescales, we calculated snowmelt timing and rate in time windows from 1 to 30 days, with a corresponding cold content value at day zero. Finally, we used the cold content at 06:00 Mountain Standard Time (MST; CC06:00 AM) to evaluate the effect of cold content on snowmelt timing and rate at daily timescales. For the sub-seasonal and daily timescales above, we set snowmelt timing to be the first instance of simulated snowmelt runoff and snowmelt rate to be the mean rate for the time window.
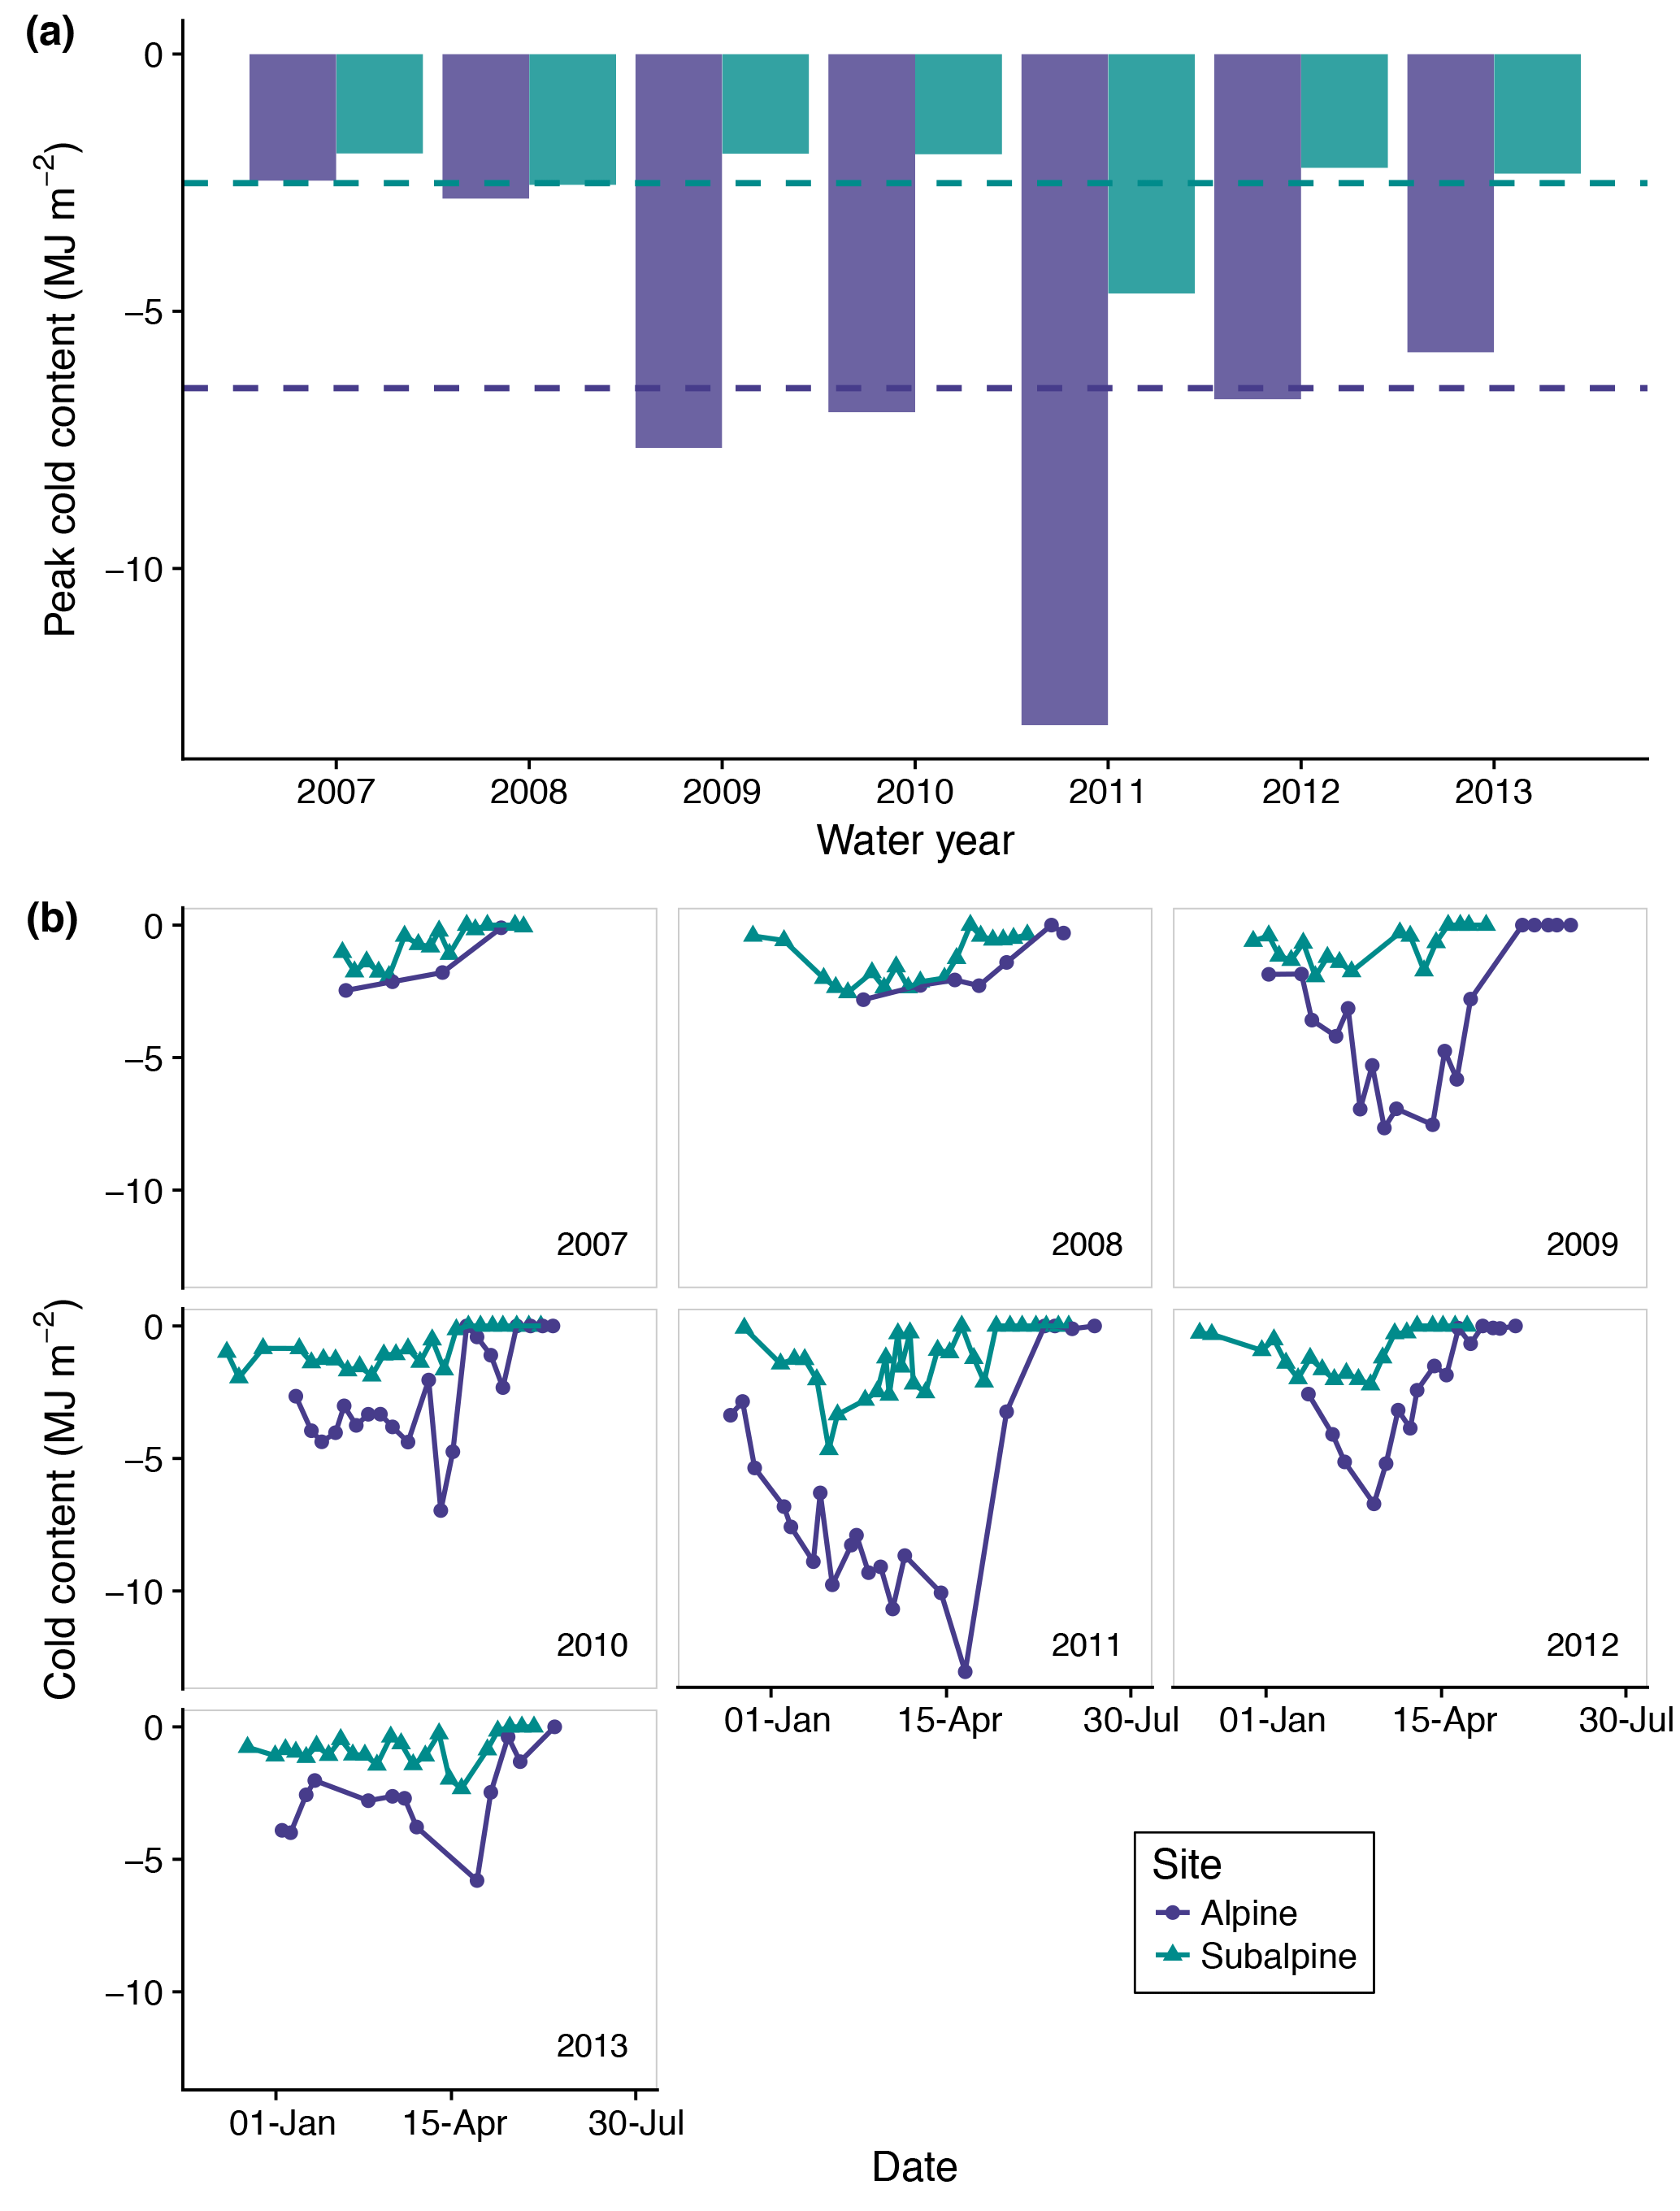
Figure 2Peak annual cold content (a) and individual snow pit observations of cold content (b) for the alpine and subalpine from WY2007–WY2013. The dashed horizontal lines in (a) represent the mean peak annual cold content values for the two sites.
4.1 Snow pit observations of cold content
Snow pit observations showed daily and peak annual snowpack cold content were consistently greater in the alpine than subalpine (Fig. 2). From WY2007–WY2013, mean peak cold content was 2.6 times greater in the alpine than subalpine, while mean peak SWE was 2.1 times greater in the alpine (Table 1). On average, peak cold content and peak SWE occurred 33 and 10 days later in the alpine than subalpine, respectively. The average temporal gap between peak cold content and peak SWE was also 23 days shorter in the alpine, indicating greater energy exchange between the snow and atmosphere at this site during the main time of snowpack ripening. Mean for this period, as estimated using Eq. (3), was 1.2 W and 0.4 W m−2 in the alpine and subalpine, respectively.
Table 1Mean quantities for the alpine and subalpine snow pits from WY2007 to WY2013.
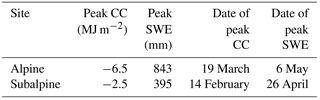
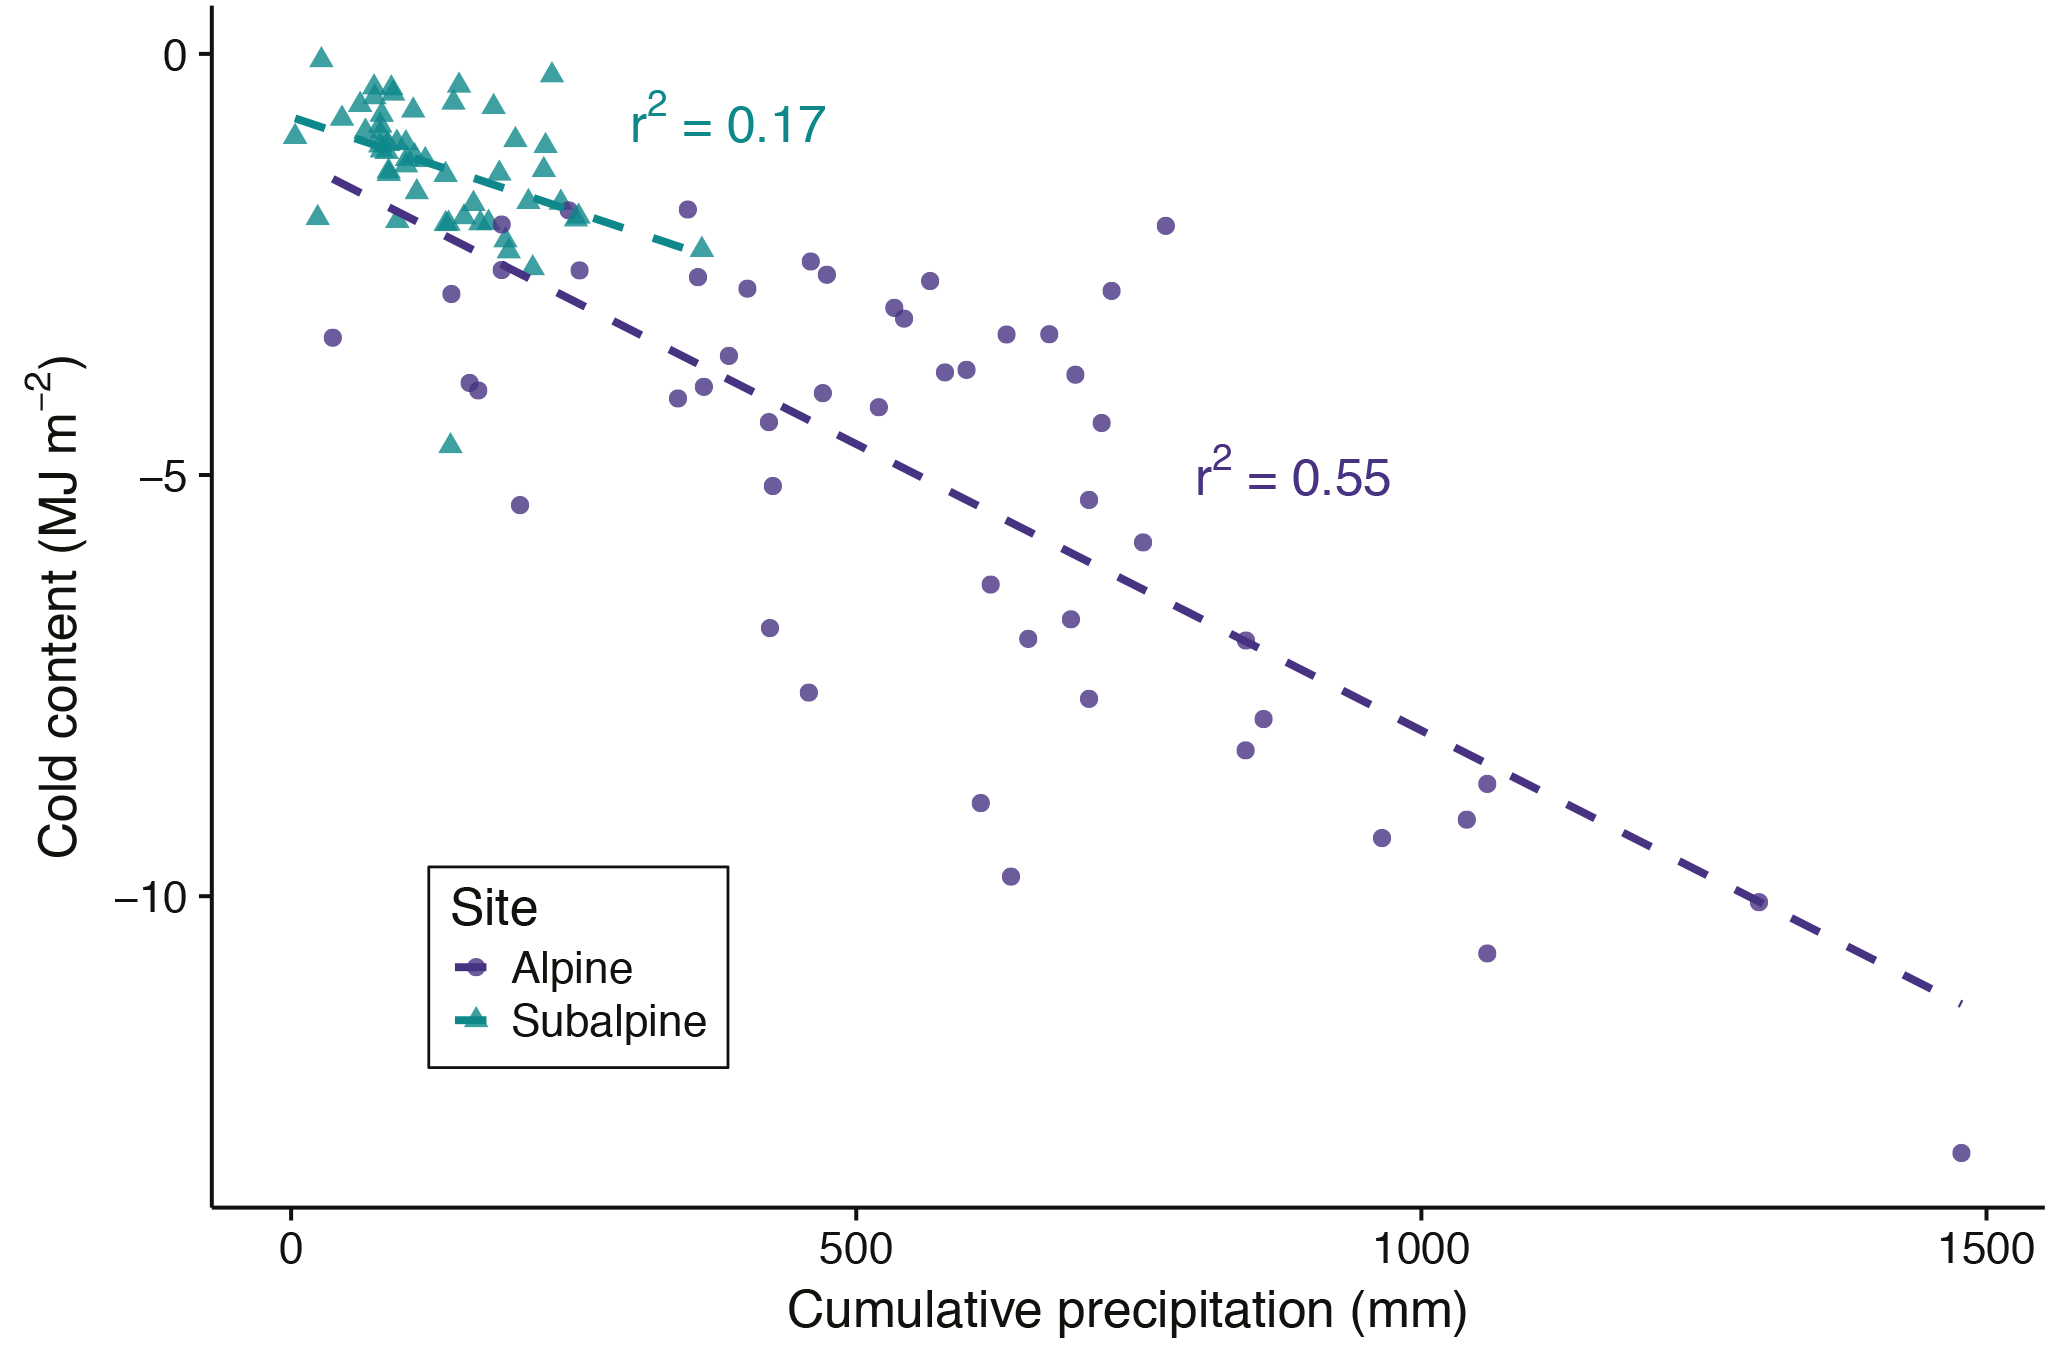
Figure 3Cold content plotted against cumulative precipitation from 1 December to the date of snow pit observation for the alpine and subalpine for the snow season up to and including the date of peak cold content from WY2007 to WY2013. The dashed lines of best fit were calculated using ordinary least squares linear regression.
From 1 December to the date of snow pit observation, increased cumulative precipitation was associated with increased cold content at both sites (Fig. 3). Cumulative precipitation explained 55 and 17 % of the variance in cold content in the alpine and subalpine, respectively. The relationship was statistically significant at the 99 % level at both sites despite the low coefficient of determination in the subalpine. Conversely, the cumulative mean of air temperature had no statistically significant relationship to snowpack cold content, explaining less than 1 % of the variance at both sites (not shown). Although there may be snowpack energy losses during periods of cold air temperature, these results indicate that, of the two meteorological quantities evaluated here, snowfall exerts the primary control on cold content development. This is likely due to the higher variability of winter precipitation, the coefficient of variation of which is 2.9 and 2.7 times greater than that of air temperature in the alpine and subalpine, respectively. Furthermore, the difference in r2 values between the two sites suggests that precipitation plays a more important role in the alpine than subalpine in terms of cold content development.
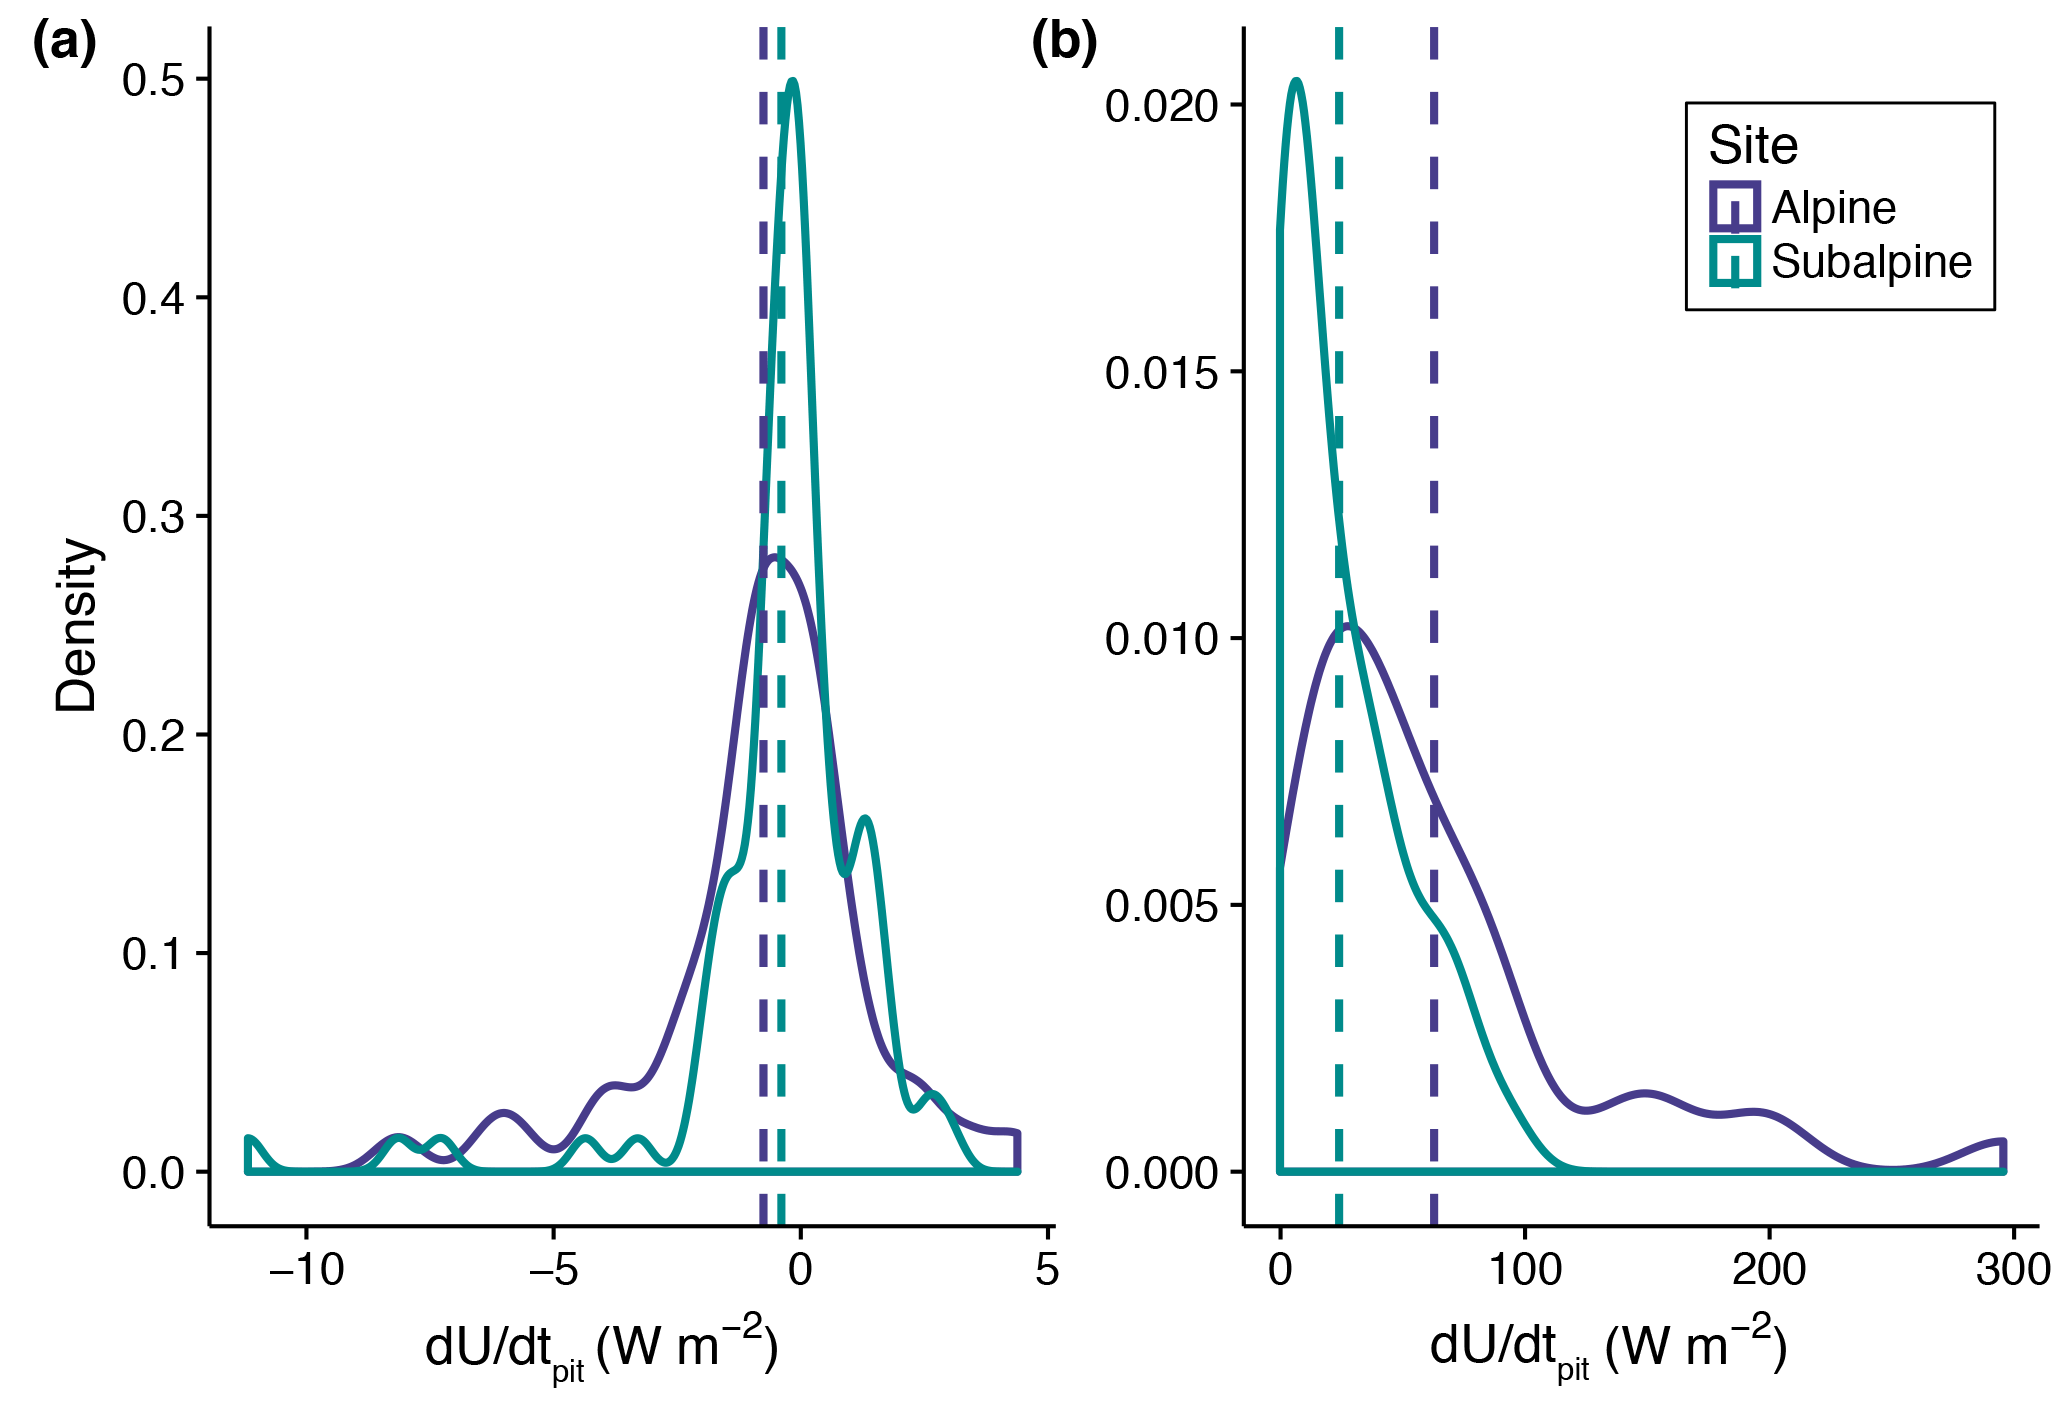
Figure 4Kernel density estimates of distributions as calculated from snow pit observations for periods with SWE gain (a) and loss (b) in the alpine and subalpine for WY2007–WY2013. The dashed vertical lines represent the mean for the alpine (a: −0.8 W m−2; b: 62.8 W m−2) and subalpine (a: −0.4 W m−2; b: 23.9 W m−2).
Snow pit observations were also used to calculate by quantifying the change in cold content between two points in time (Eq. 3). During periods of SWE accumulation, was typically near 0.0 W m−2 (Fig. 4a), indicating a large negative energy balance was not responsible for cold content development at our two sites. The average flux in the alpine (−0.8 W m−2) was greater in magnitude during this period than in the subalpine (−0.4 W m−2), and both distributions were left-skewed as the energy balance was typically negative from snowfall- and/or flux-driven cold content increases. Changing the analysis to snow pit observations when melt occurred (Fig. 4b) led to a pronounced right-skew in the flux distribution with values again of a higher magnitude in the alpine. Thus, we found no evidence for highly negative internal energy changes at our sites with values only being large in magnitude during snowmelt.
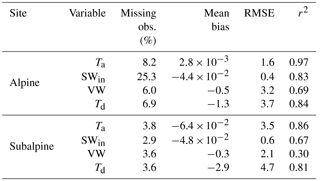
Table 2Statistics for SNOWPACK simulations relative to daily and annual observations from the snow pits in the alpine and subalpine, and Niwot SNOTEL in the subalpine. There is no SNOTEL station in the alpine and SNOTEL does not observe cold content and snowpack temperature. Comparisons are for the water years listed in the second column.
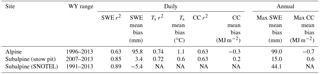
NA: not available.
4.2 Model SWE, snowpack temperature, and cold content validation
SNOWPACK simulations reproduced observed snow pit SWE patterns at both sites, with a higher coefficient of determination and lower bias in the subalpine than alpine (Fig. 5a, b; Table 2). Subalpine simulations were also in line with daily SWE observations from the Niwot SNOTEL (Table 2). Simulated depth-weighted snowpack temperature had a slight warm bias of 1.1 ∘C in the alpine and 0.6 ∘C in the subalpine (Fig. 5c, d, Table 2), while cold content was overpredicted in the alpine and underpredicted in the subalpine (Fig. 5e, f, Table 2). In this regard, simulated cold content errors integrated the SWE and snowpack temperature biases. Overprediction in the alpine was a result of the positive SWE bias having a greater effect on simulated cold content than the warm temperature bias. Conversely, underprediction of snowpack cold content in the subalpine was primarily due to the warm temperature bias.
Modeled annual peak SWE and peak cold content were also similar to the previously reported pit values for WY2007 through WY2013 (Table 2). Additionally, simulated LTER subalpine peak cold content values were within the range of those reported in a simulation of a subalpine snowpack (−2.2 to −1.7 MJ m−2) at the nearby Fraser Experimental Forest during NASA's Cold Land Processes Experiment (Marks et al., 2008). Direct observations of snow surface sublimation were not available for comparison, but modeled sublimation rates were in line with other values reported in the literature for alpine and subalpine areas in the Colorado Rocky Mountains (Berg, 1986; Hood et al., 1999; Knowles et al., 2012; Molotch et al., 2007; Sexstone et al., 2016). On average, simulated snow-surface sublimation represented 28.8 % (383 mm) and 11.4 % (53 mm) of snow-season precipitation in the alpine and subalpine, respectively.
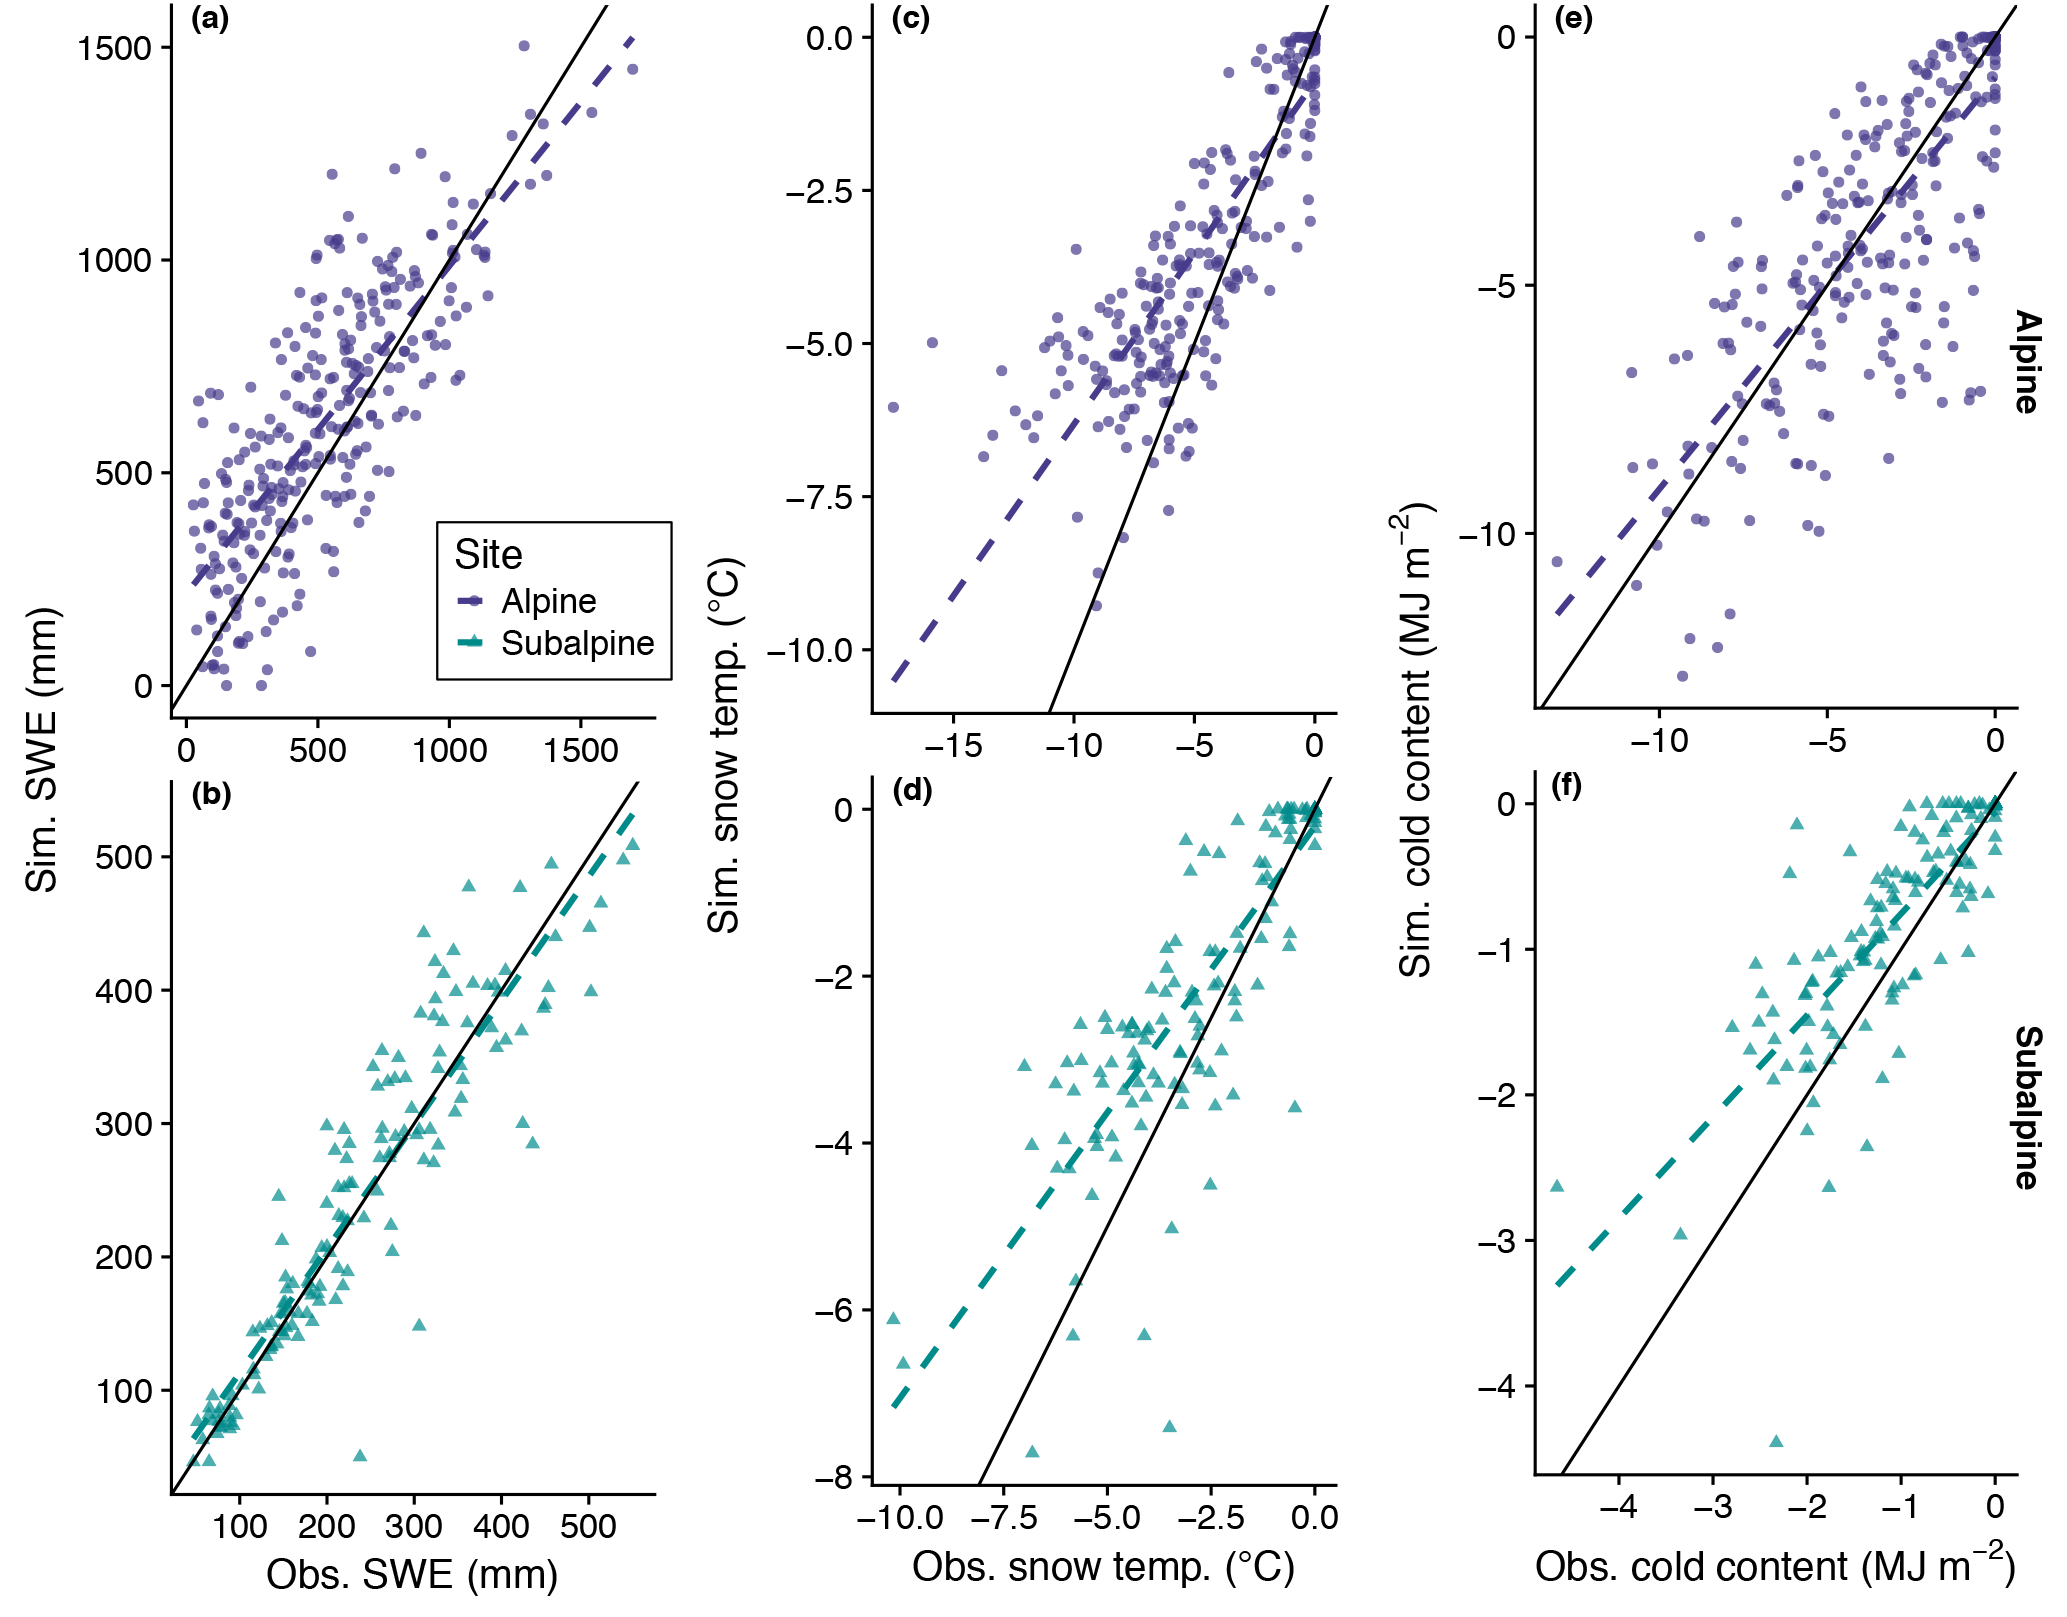
Figure 5Plots of simulated versus snow-pit observed SWE (a, b), snowpack temperature (c, d), and cold content (e, f) in the alpine (top, WY1995–WY2013) and subalpine (bottom, WY2007–WY2013). The solid black line is the 1 : 1 line and the dashed lines are the lines of best fit as determined by ordinary least squares linear regression. Simulation error metrics are presented in Table 1.
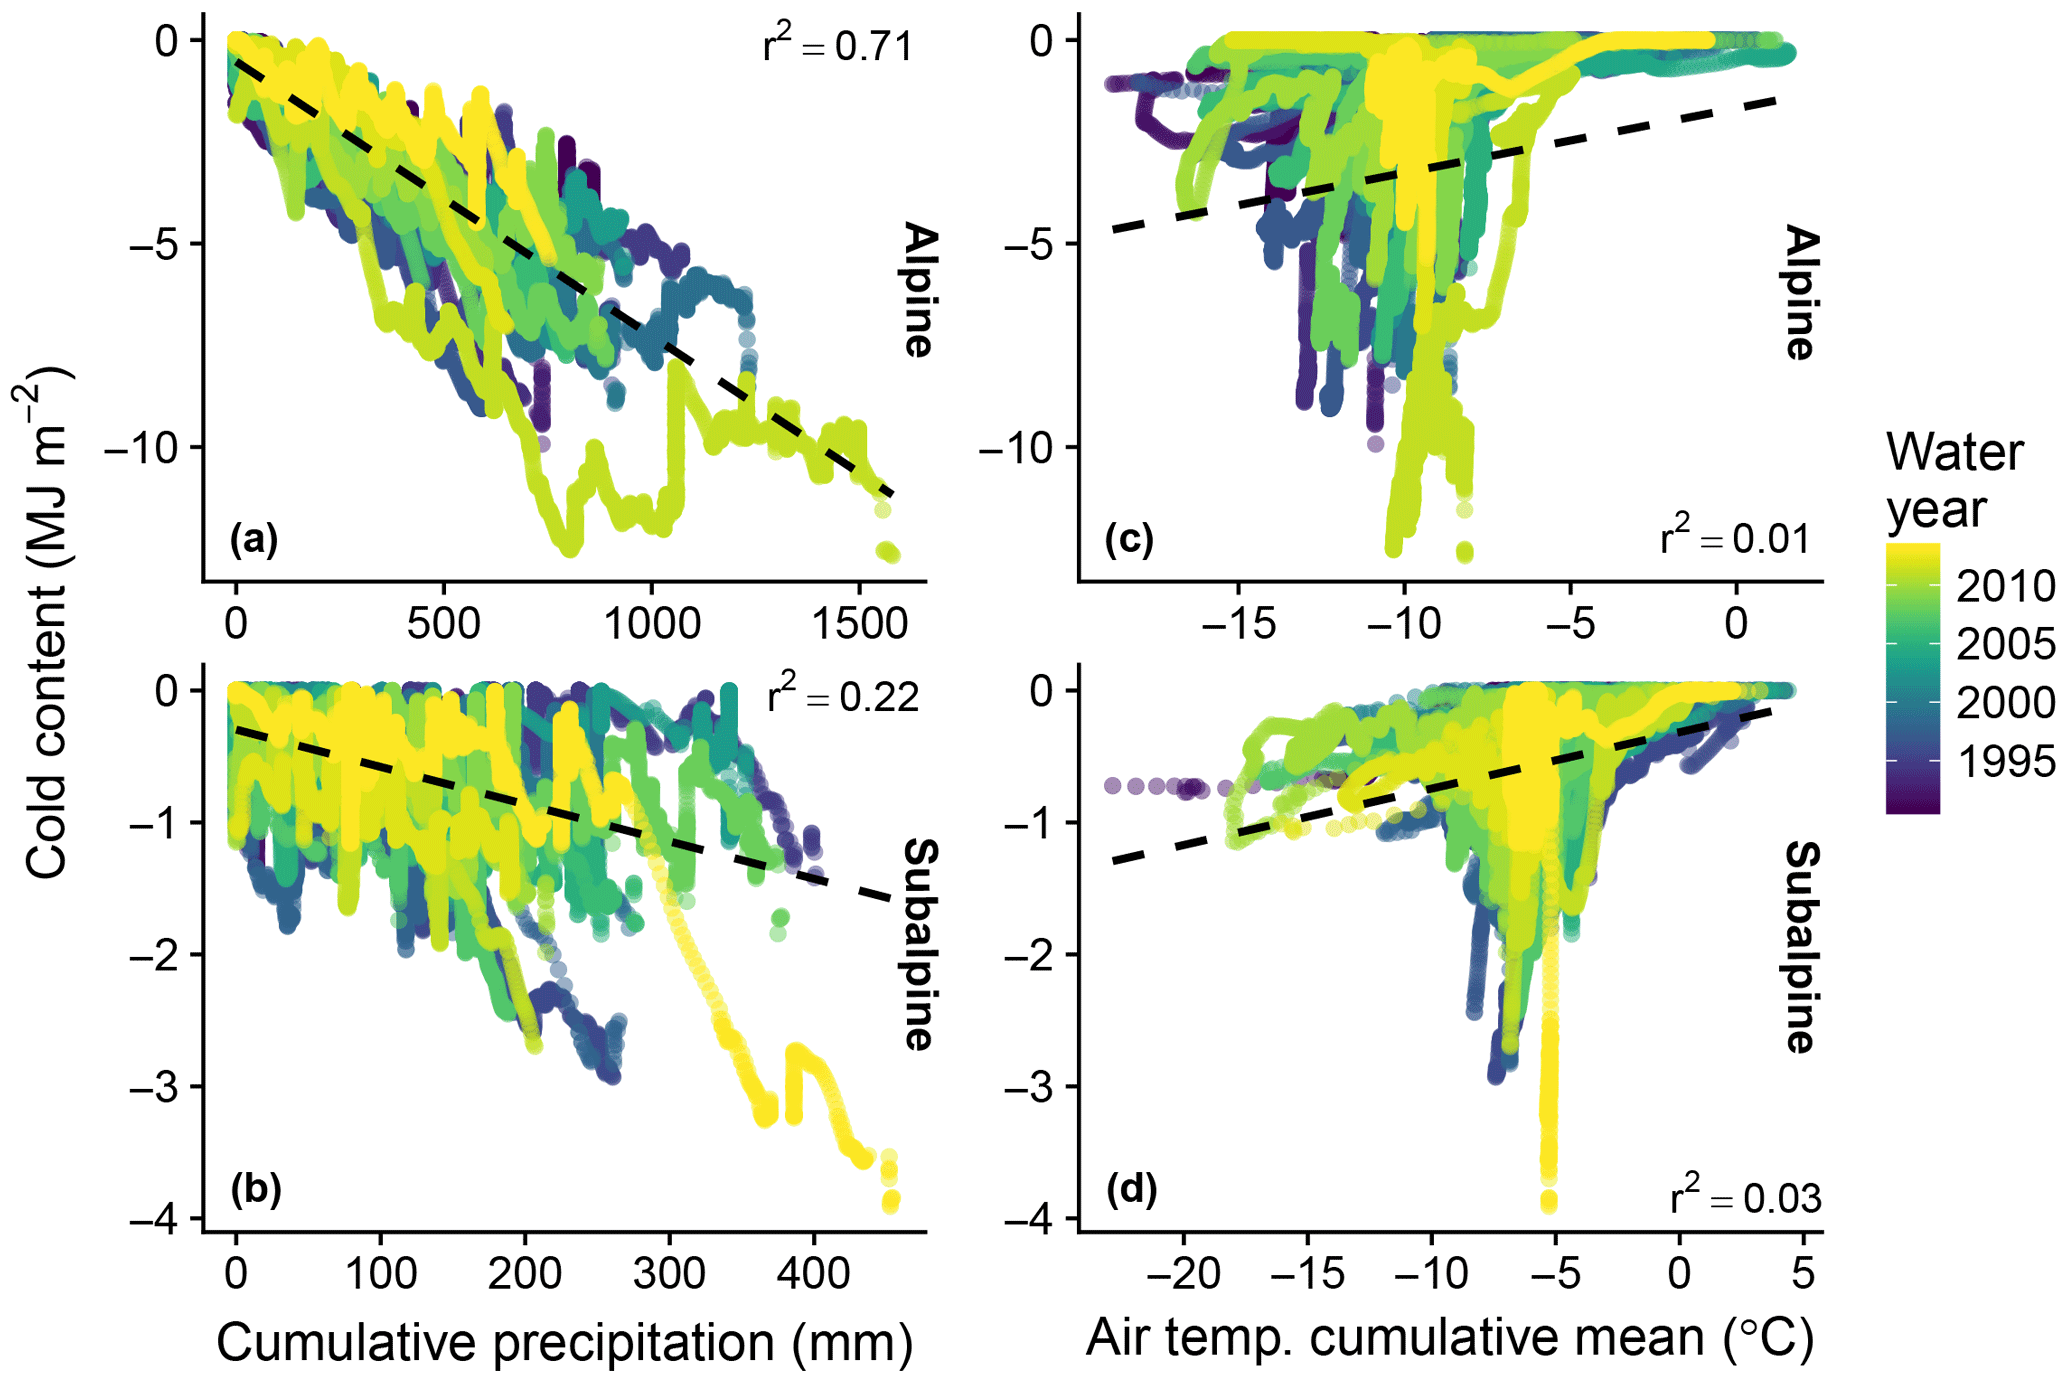
Figure 6Simulated cold content plotted against cumulative precipitation in the alpine (a) and subalpine (b), and the cumulative mean of air temperature in the alpine (c) and subalpine (d). Shading denotes the corresponding water year.
Figure 7Simulated cold content gain and loss per month in the alpine and subalpine for days without precipitation (a) and days with precipitation (b). Values above the zero line correspond to a loss of cold content (i.e., cold content approaches zero), while values below correspond to a gain of cold content.
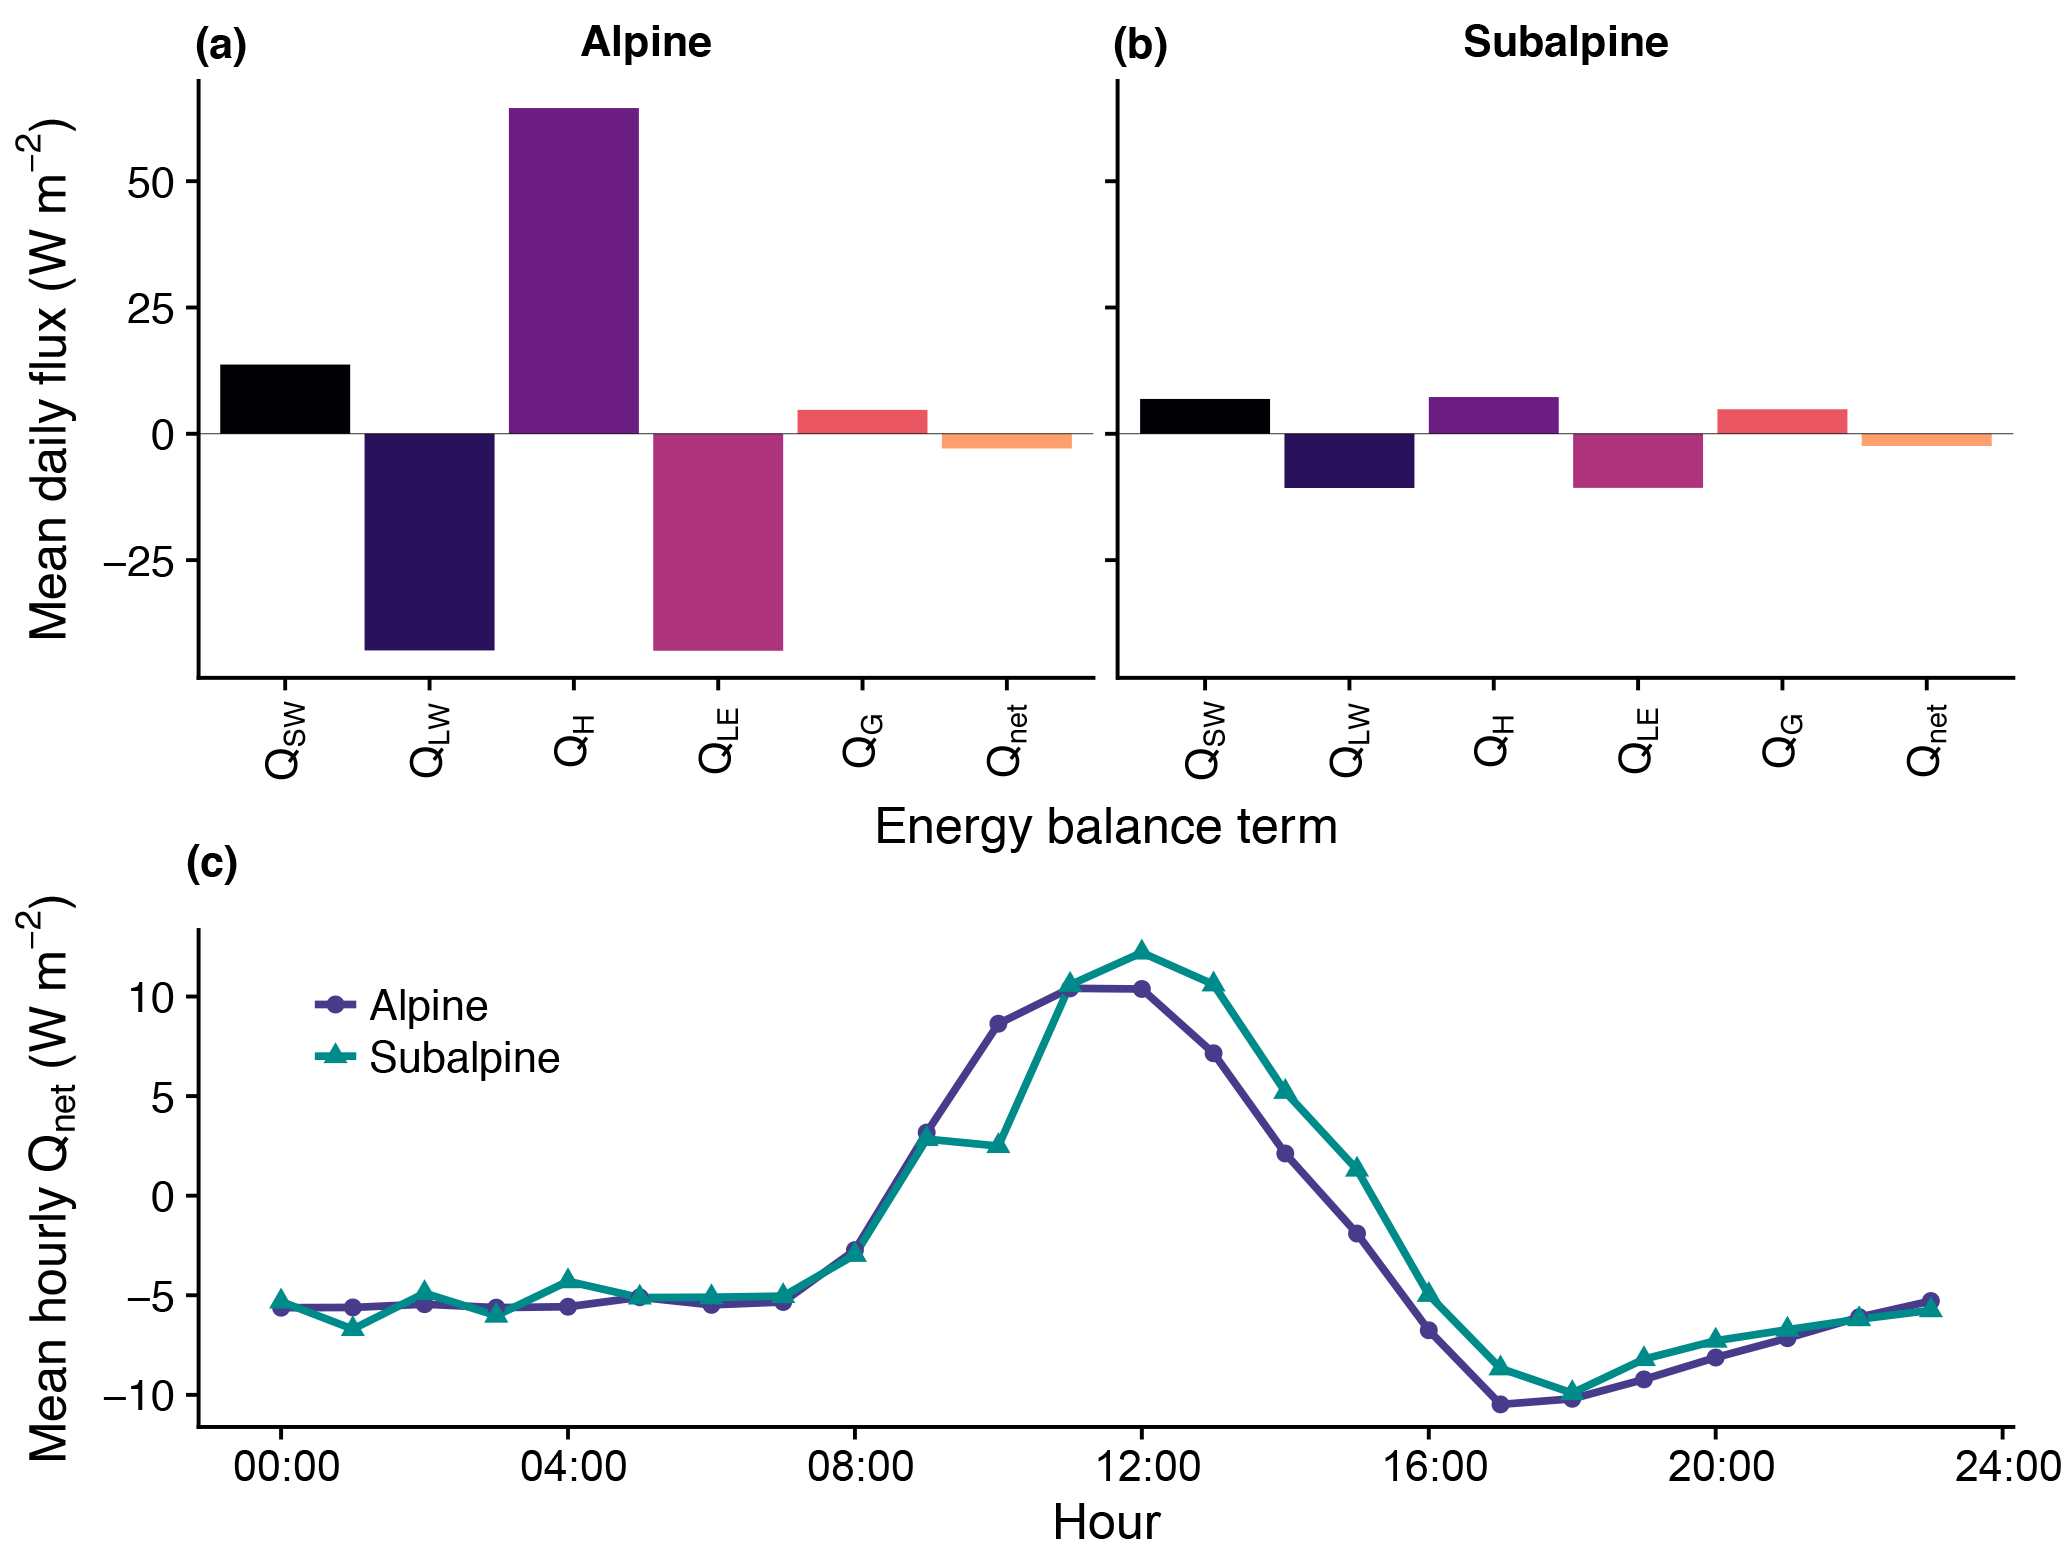
Figure 8Simulated snowpack energy balance in the alpine (a) and subalpine (b), plus mean hourly Qnet (c) for days of cold content gain without precipitation.
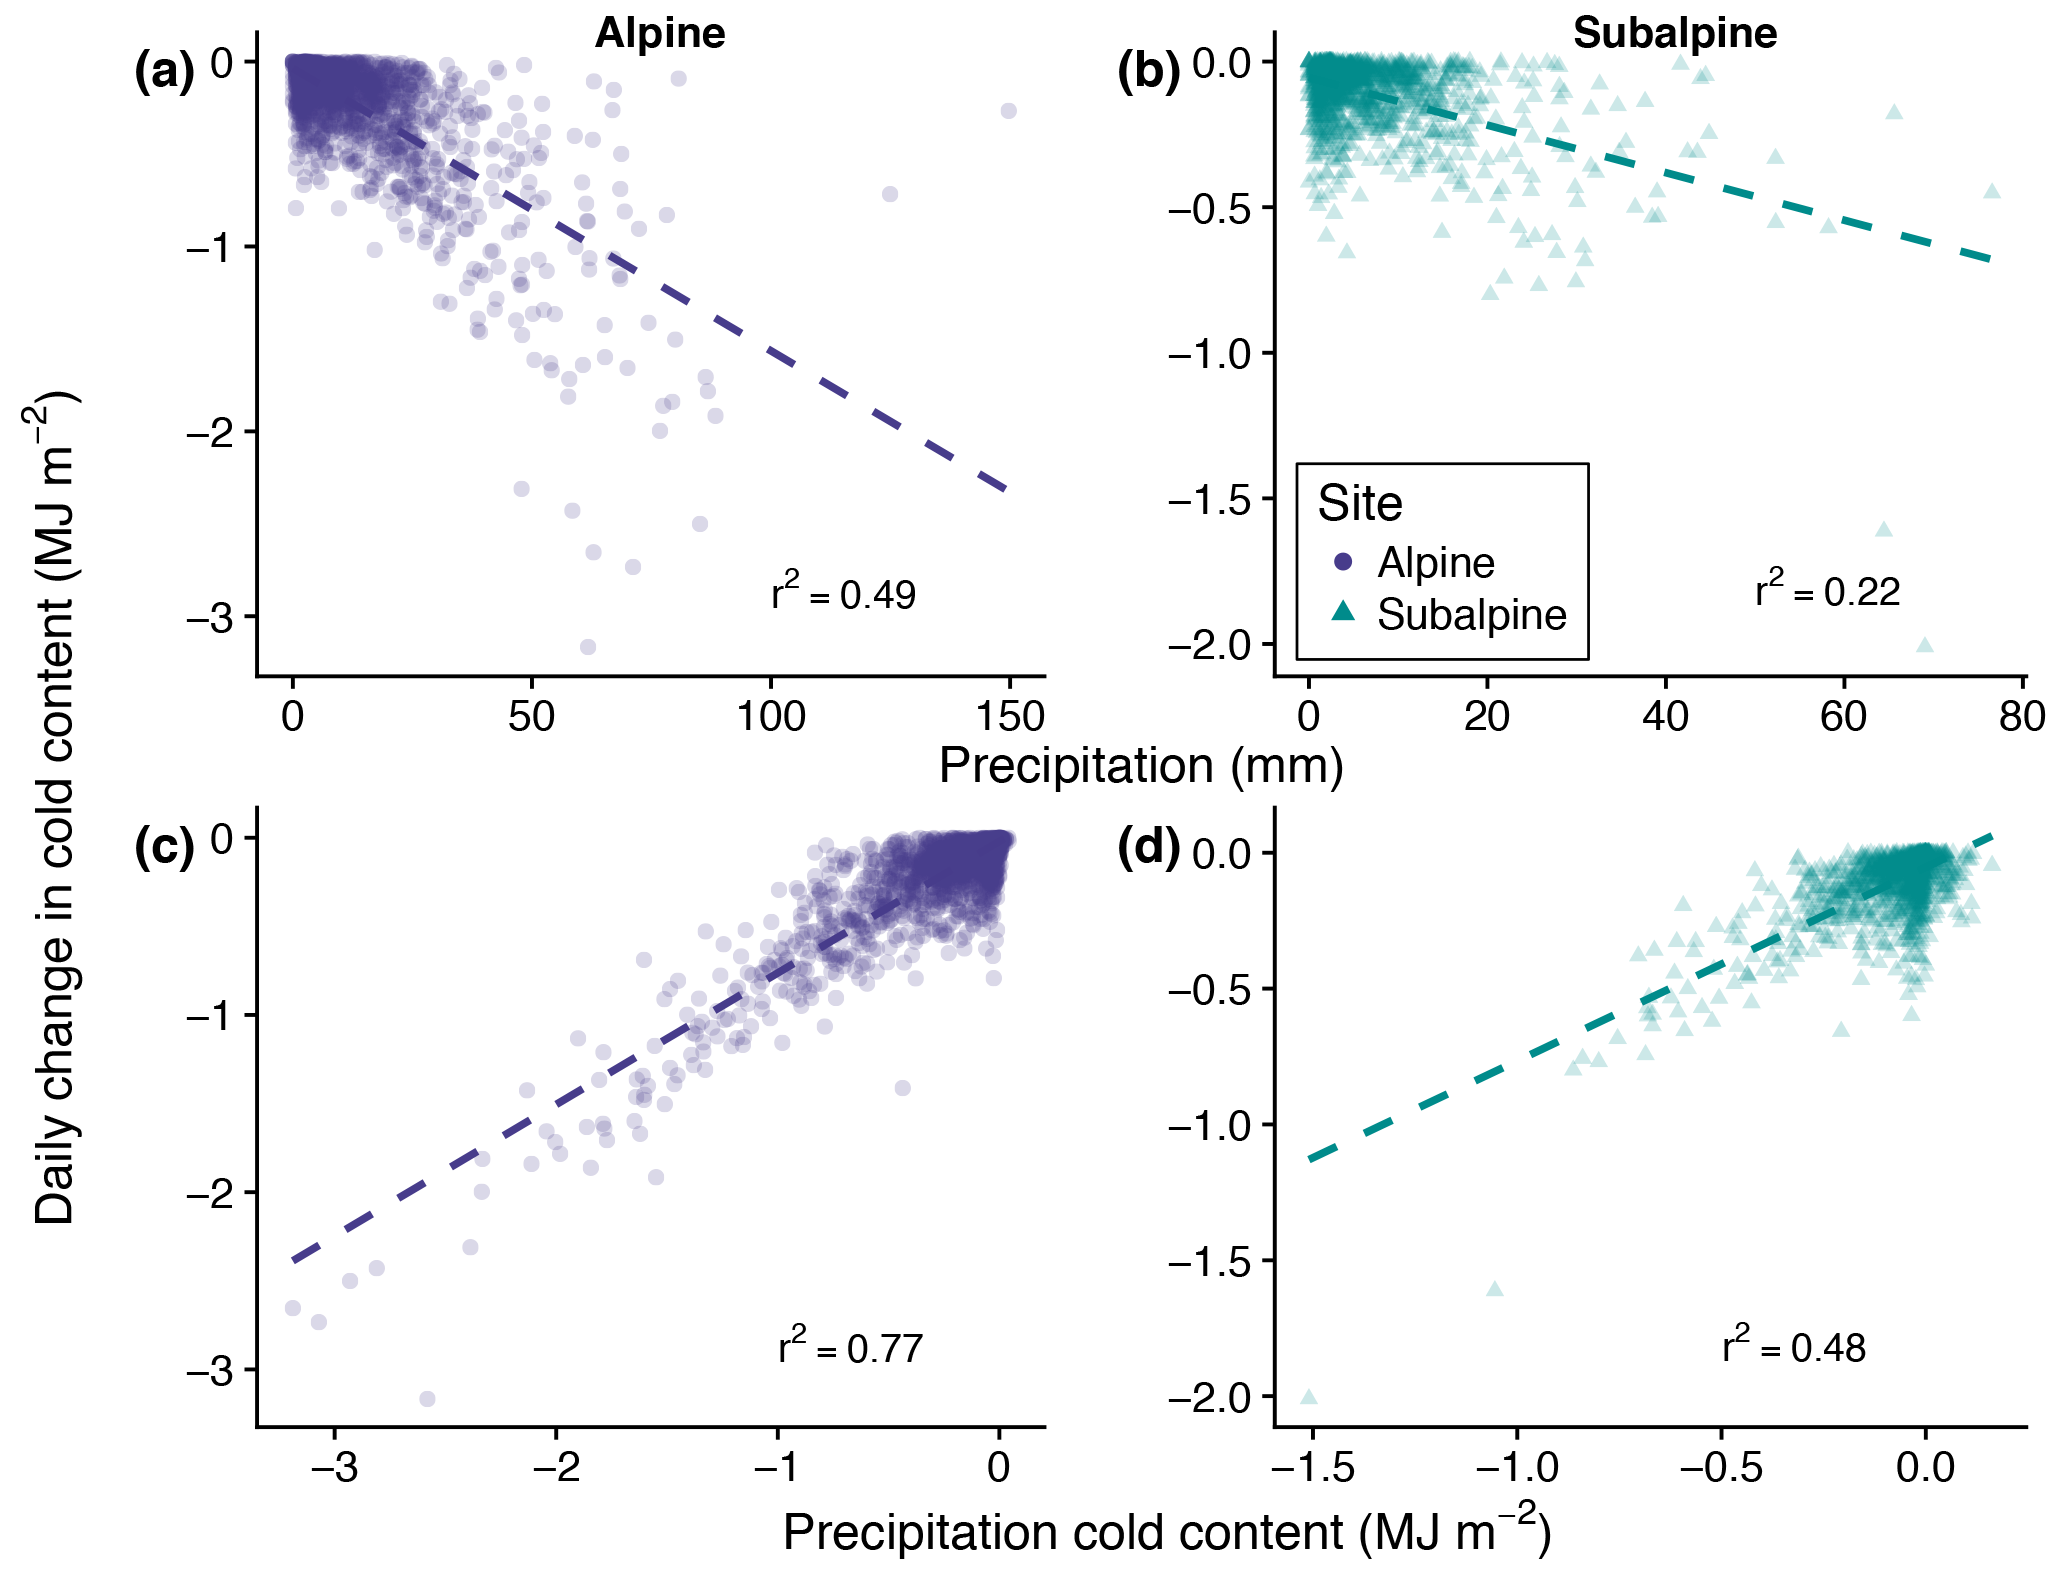
Figure 9Simulated daily change in cold content plotted against daily precipitation in the alpine (a) and subalpine (b), and cold content from precipitation in the alpine (c) and subalpine (d).

Figure 10Annual melt onset as predicted by peak cold content timing and spring precipitation in the alpine (a) and subalpine (b). The background gradient in each plot displays the predicted melt onset date as calculated by a multiple linear regression, while the shading within each point represents the actual melt onset simulated in a given water year at its peak cold content date and spring precipitation value.
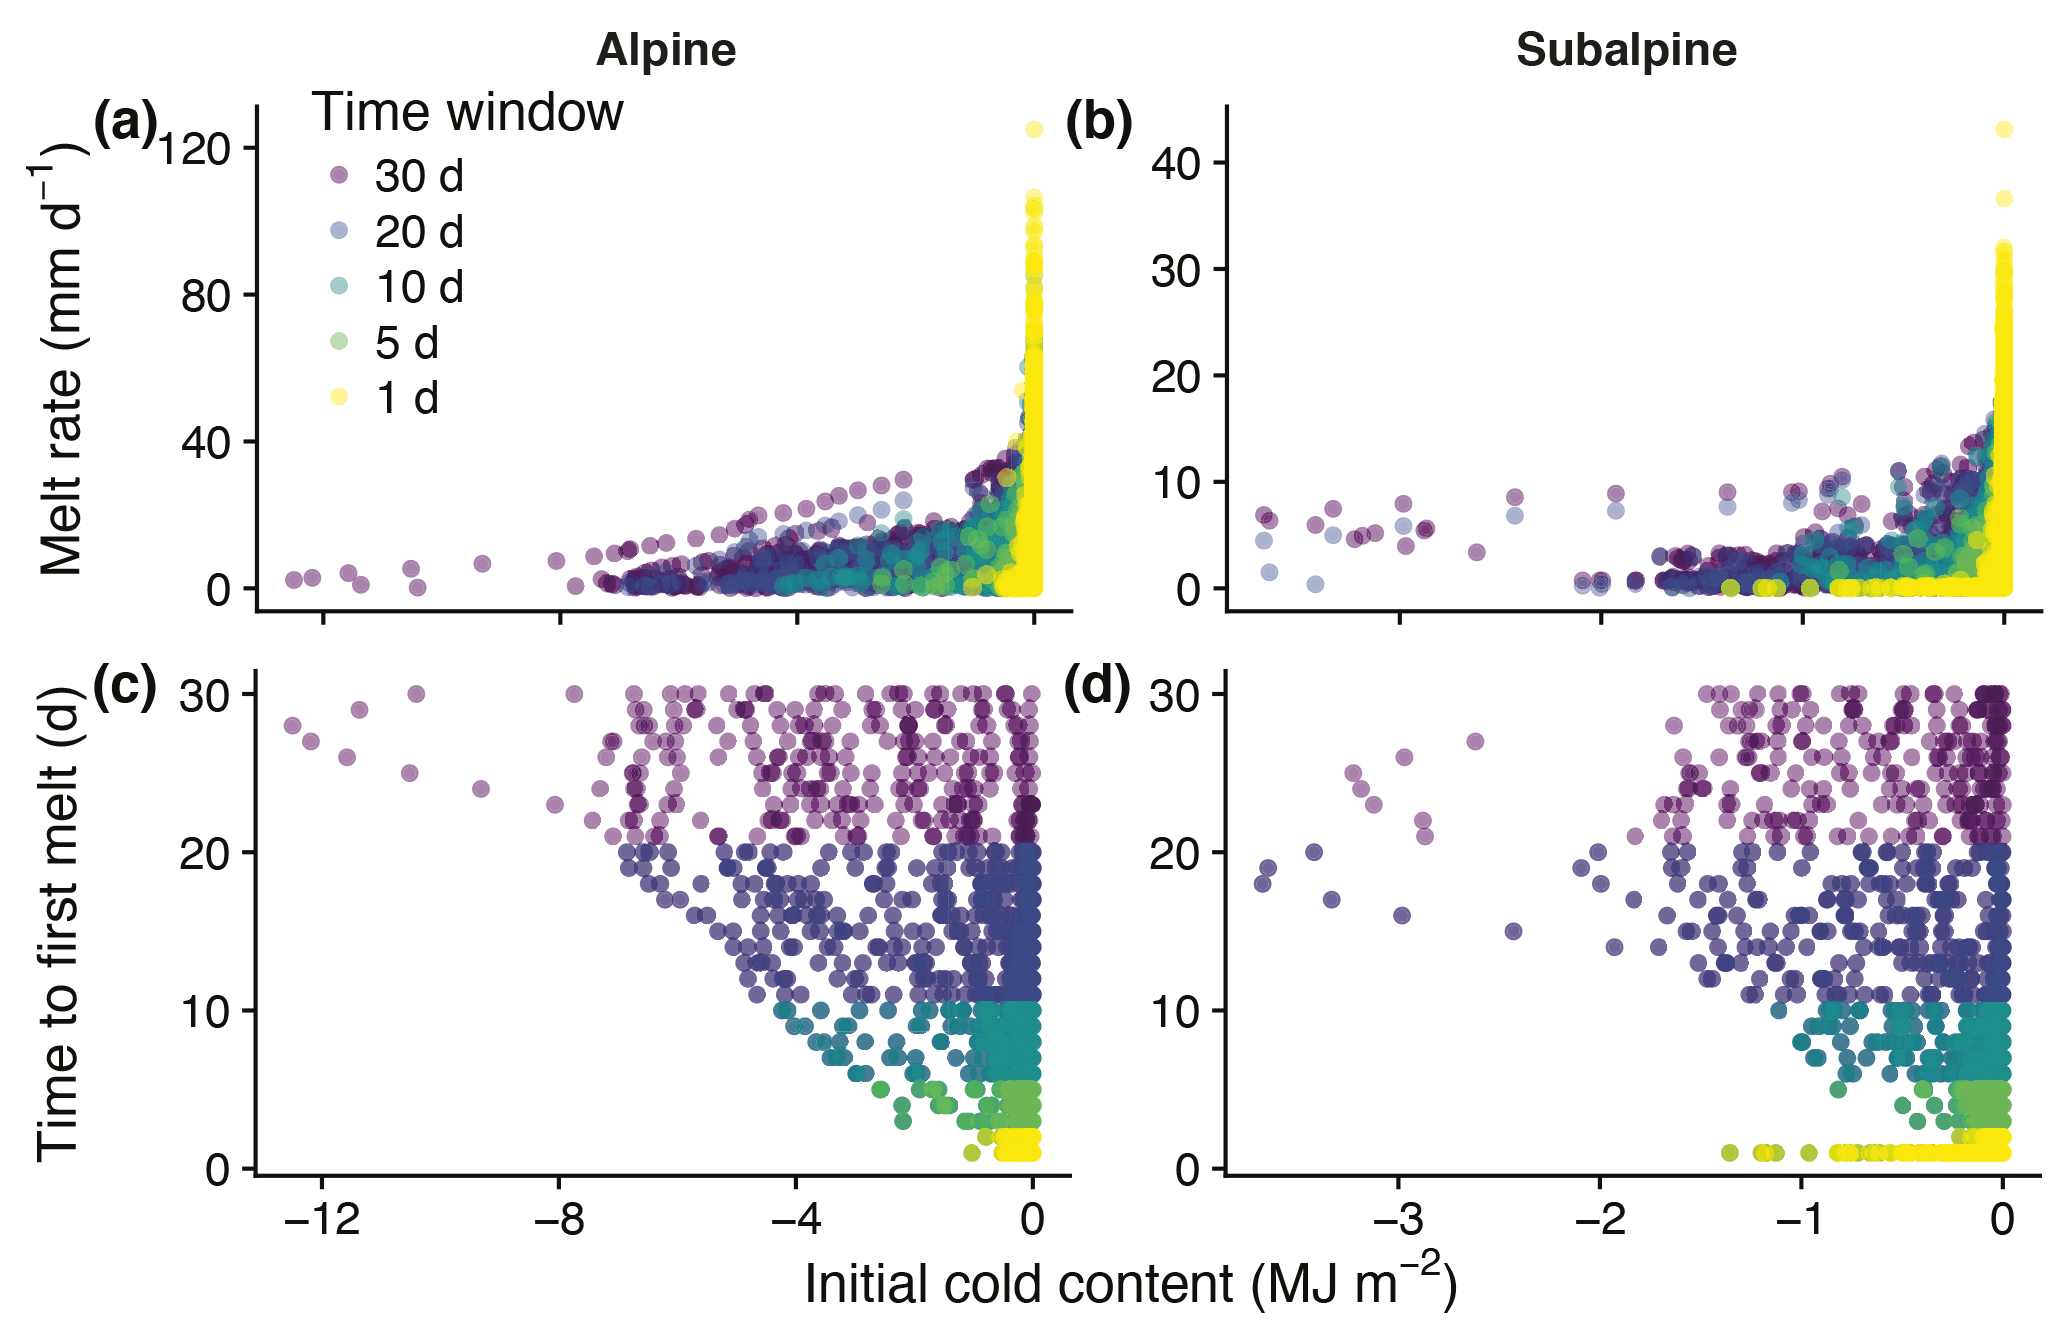
Figure 11Simulated sub-seasonal snowmelt rate plotted against initial cold content in the alpine (a) and subalpine (b), and time to first melt plotted against initial cold content in the alpine (c) and subalpine (d) for time windows from 1 to 30 days.
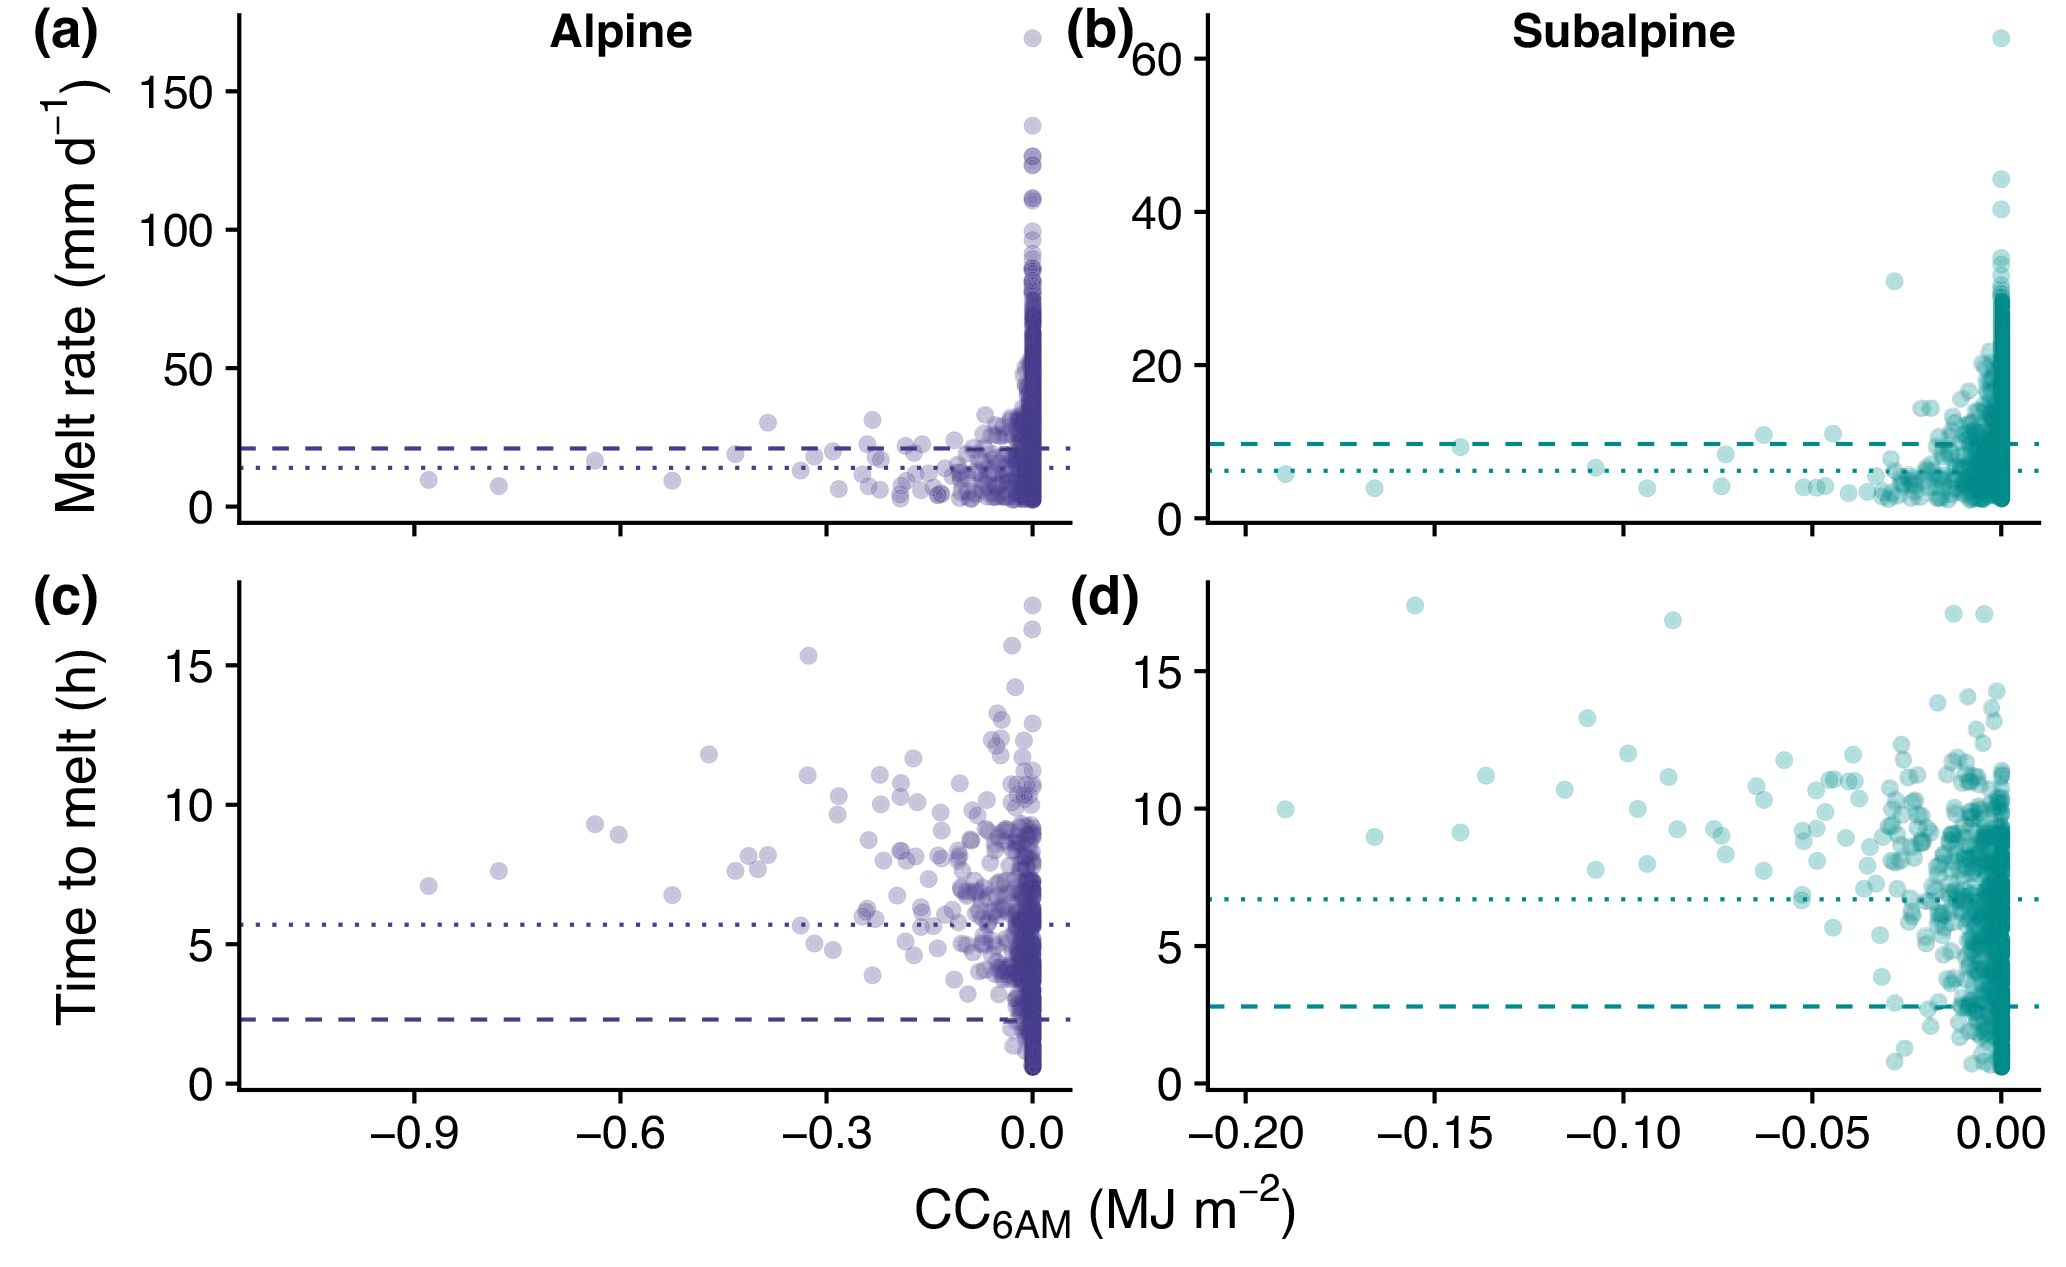
Figure 12Simulated daily melt rates in the alpine (a) and subalpine (b) and time to snowmelt in the alpine (c) and subalpine (d) as a function of CC06:00 AM. The dashed line in each figure represents the mean melt rate (a, b) and time to melt (c, d) for days when CC MJ m−2 and the dotted line represents those quantities for days when CC MJ m−2.
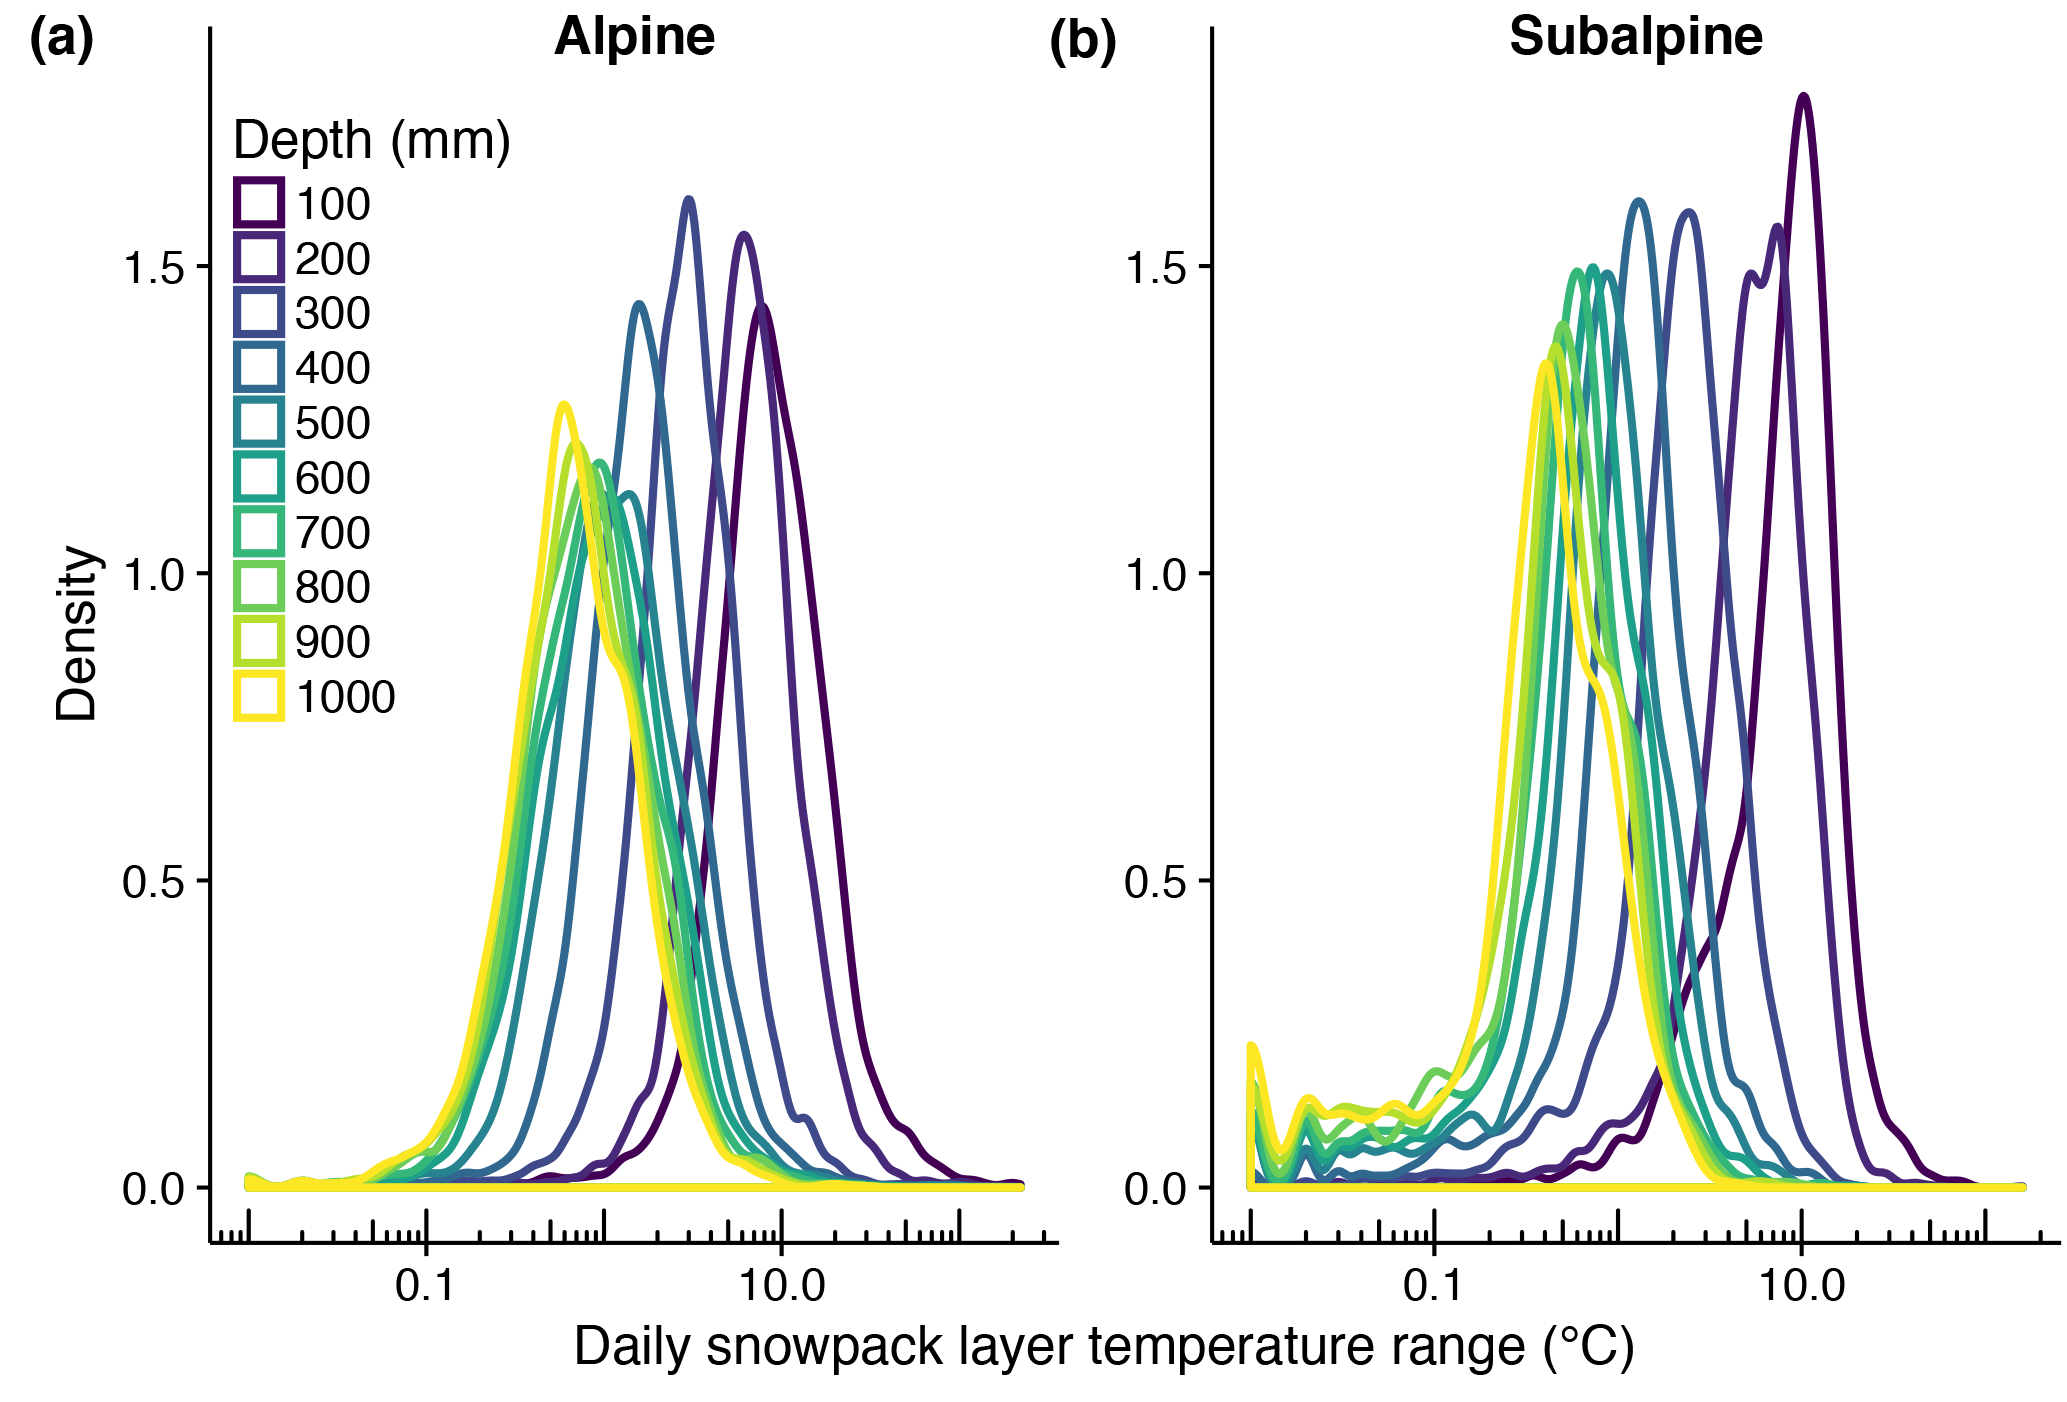
Figure 13Kernel density estimates of simulated daily snowpack layer temperature ranges in the alpine (a) and subalpine (b). Line shading represents the bottom depth of the layer with layers near the top of the snowpack in purple and blue and lower layers in green and yellow.
4.3 Meteorological and energy balance controls on cold content development: simulation results
4.3.1 Primary control: snowfall
Similar to the snow pit observations, simulated cold content was strongly related to cumulative precipitation in the alpine, indicating cold content developed primarily through the addition of new snowfall (Fig. 6a). The subalpine snowpack, however, frequently approached an isothermal state in the winter with cold content fluctuating between gains during snowfall and losses during dry periods (Fig. 6b). Due to this effect, cumulative precipitation in the subalpine explained less of the variance in cold content than in the alpine. Additionally, the cumulative mean of air temperature explained little of the variance in simulated cold content at both sites (Fig. 6c, d). In general, decreases in air temperature did not produce large increases in cold content, meaning periods of below-average air temperature did not significantly contribute to cold content development. These simulations support the results of the snow pit observations, namely that of the two main meteorological quantities, precipitation exerts the primary control on cold content development.
Discretizing snow season days into those with and those without precipitation further clarifies the relationship between cold content development and snowfall. Figure 7 shows the monthly differences between days with and without precipitation in the alpine and subalpine in terms of cold content gains and losses. Precipitation days were commonly associated with cold content gains, particularly in December, January, and February when precipitation was coincident with low air temperatures. Days without precipitation, conversely, were associated with decreases in snowpack cold content, indicating a positive surface energy balance warmed the snowpack between snowfall events. Magnitudes were typically greater in the alpine where colder temperatures and increased precipitation led to greater cold content gains on snowfall days, while higher wind speeds facilitated increased rates of energy transfer and cold content losses on days without precipitation.
4.3.2 Secondary control: negative surface energy balance
Although non-snowfall days were typically associated with cold content losses, flux-driven gains did sometimes occur on days without precipitation. On these days, Qnet was slightly negative, averaging −2.9 W m−2 in the alpine and −2.4 W m−2 in the subalpine, with QLE and QLW the primary negative energy balance terms at both sites (Fig. 8a, b). QH, QG, and QSW were typically positive, adding energy to the snowpack even during periods of increasing cold content. The majority of flux-driven cold content additions took place at night (18:00 through 06:00), while daytime hours were commonly associated with cold content losses (Fig. 8c). Cold content gains between 09:00 and 14:00 accounted for less than 5 % of total gains at both sites (Fig. S1 in the Supplement). In total, nighttime cold content additions outnumbered daytime additions by a 2.7 : 1 ratio in the alpine and 3.7 : 1 in the subalpine.
4.3.3 Comparing the relative importance of cold content development processes
Overall, snowfall contributed more cold content to the snowpacks at each site than negative energy fluxes, while air temperature showed little relationship to cold content development. The number of snowfall days with cold content increases exceeded the number of non-snowfall days with increases in the alpine by a 4.2 : 1 ratio, with snowfall days responsible for 438 % more cold content additions than non-snowfall days. On an average annual basis in the alpine, snowfall days contributed −12.5 MJ m−2 to cold content development and non-snowfall days −2.3 MJ m−2. As previously noted, the effect of precipitation was smaller in the subalpine in terms of both the variance explained by cumulative precipitation and the ratio of snowfall-to-non-snowfall cold content gains. Snowfall days in the subalpine were responsible for 166 % more cold content gains than non-snowfall days, generating −4.1 and −1.5 MJ m−2 of cold content development on an annual basis, respectively.
Although cumulative mean air temperature had little effect on seasonal cold content development, air temperature did influence the amount of cold content added to the snowpack per snowfall day. Figure 9 shows the daily change in cold content in the alpine and subalpine relative to daily total precipitation (a, b), and cold content from precipitation (c, d) on days with snowfall. Here the cold content from precipitation was calculated as in Eq. (2) but Ts was replaced with air temperature and dS was replaced by the depth of precipitation. At both sites, the cold content from precipitation explained more of the variance in daily change in cold content than daily total precipitation alone, showing air temperature provides a secondary control on cold content development during snowfall events. Confirming previous results, the control exerted by precipitation on cold content development was stronger in the alpine than subalpine.
4.4 The effect of cold content on snowmelt rate and timing
On seasonal timescales, increased annual peak cold content magnitude had a delaying, but statistically non-significant effect on snowmelt onset, according to both observations and simulations (not shown). However, using the 23 years of snowpack simulations, we found the date of peak cold content and spring precipitation – defined here as the total precipitation between the date of peak cold content and peak SWE – accurately predicted melt onset. A multiple linear regression (MLR) using the date of peak cold content and spring precipitation as the predictor variables explained 84.7 and 61.4 % of the variance in snowmelt onset in the alpine and subalpine, respectively (Fig. 10). At both sites, later peak cold content and increased spring precipitation delayed melt onset. In the alpine, the MLR predicted a 1-day delay in snowmelt timing per 1.6 days later in peak cold content timing or 8.8 mm extra spring precipitation. These values shifted to 2.3 days and 5.9 mm, respectively, in the subalpine. Furthermore, we found cold content exerted no statistically significant control on the seasonal snowmelt rate. Rather, statistically significant increases in the ablation slope were associated with later peak SWE timing and increased peak SWE magnitude.
While peak cold content magnitude exerted little control on seasonal snowmelt timing and rate, the simulations indicated increased cold content had a damping effect on snowmelt timing and rate at sub-seasonal timescales from 1 to 30 days. Greater initial cold content values were associated with decreased snowmelt rates (Fig. 11a, b) and longer delays between day zero and the day of first snowmelt (Fig. 11c, d). All relationships were significant at the 99 % level, except for the effect of cold content on snowmelt timing for the 1-day time window in the subalpine. Simulated melt rates in the alpine only exceeded 40 mm d−1 when initial cold content was between −0.1 and 0 MJ m−2. The same initial cold content range was responsible for all simulated melt rates greater than 15 mm d−1 in the subalpine. Examining only the 30-day window for snowmelt timing revealed further patterns at the two sites. Initial cold content explained 47.3 % of the variance in time to first melt in the alpine and 37.6 % in the subalpine using ordinary least squares regression. An initial cold content increase of 1.0 MJ m−2 led to a 3.7-day delay in snowmelt in the alpine and 12.1-day delay in the subalpine.
To examine the control of cold content on daily snowmelt rate and timing, we used CC06:00 AM to represent the energy state of the snowpack at time t=0 for each day. Figure 12a, b shows melt rates did not increase until CC06:00 AM neared 0 MJ m−2 in the alpine and subalpine. Both the number of melt days and the daily melt rate were greater when CC MJ m−2. The proportion of daily melt occurring on days when CC MJ m−2 ranged from 75.0 % in the alpine to 79.5 % in the subalpine. Mean melt rates were also greater when there was no energy deficit to satisfy in the alpine (21.1 vs. 14.3 mm d−1) and subalpine (9.7 vs. 6.2 mm d−1). Additionally, non-zero CC06:00 AM values were associated with delayed snowmelt onset (Fig. 12c, d). The mean time between 06:00 and simulated snowmelt onset was 2.3 h in the alpine and 2.8 h in the subalpine when CC MJ m−2. These values shifted to 5.7 and 6.7 h, respectively, when CC MJ m−2. Thus the presence of cold content produced a 3.4 h delay in alpine snowmelt onset and 3.9 h in the subalpine. These data indicate that even small energy deficits had a damping effect on daily snowmelt rate and timing.
5.1 Representation of cold content development processes in snow models
In Sect. 1 we noted the three main methods by which cold content is represented in snow models. Temperature index models typically compute cold content as an empirical function of air temperature (method 1), while physical models estimate cold content as a function of precipitation and the air temperature during precipitation (method 2) and/or as a residual of the snowpack energy balance (method 3). A model comparison is outside of the scope of this work, but the results presented above suggest method (2) was the primary pathway through which cold content developed at our continental, mid-latitude alpine and subalpine sites. We found air temperature had little influence on cold content development except when included as a variable in computing the cold content of new snowfall. Prior work from the subalpine site of the Niwot Ridge LTER showed a weak relationship between cold air temperatures and snowpack cooling and that periods of snowpack cooling were generally coincident with clear skies and longwave emission from the snowpack (Burns et al., 2014). Thus, method (1) would likely misrepresent cold content development processes and incorrectly estimate cold content magnitude at our sites due to the irreplaceable role of snowfall in cold content development.
Based on first principles, method (3) is important in that cold content is an integration of both mass (i.e., snowfall) and energy balance processes. Due to high sublimation rates and a dry, cold climate, the alpine site should have a high potential to gain cold content through QLE and QLW. However, our results showed that daily energy balance cold content gains were small in comparison to those from snowfall. We also found no evidence in either the simulations or observations of consistent, large negative energy balances producing cold content. Rather, the energy balance was typically near zero before peak SWE and only became significantly positive once melt commenced. Days with a negative surface energy balance were generally associated with nighttime cooling from QLE and QLW, with Qnet small in magnitude, averaging > −3.0 W m−2. Marks and Winstral (2001) similarly noted the simulated energy balance in a semi-arid mountain basin was generally near 0 W m−2 until the melt season. Overall, these findings imply snowpack cold content development at our study locations is primarily a function of method (2) and that large flux-driven increases in cold content are unlikely, even in areas where the energy balance plays a larger relative role (e.g., the subalpine site studied here).
5.2 Sources of model uncertainty
Recent years have seen an increase in the number of papers leveraging physics-based models to quantify snowpack processes. To complement such work, researchers have also evaluated sources of snow model errors and biases (Clark et al., 2017; Essery et al., 2013; Lapo et al., 2015; Raleigh et al., 2015, 2016; Rutter et al., 2009). The preceding literature concludes physics-based snow models must (1) have accurate, quality controlled forcing data, (2) be validated on at least one snowpack state variable, but preferably more, and (3) have physics that accurately reflect snowpack processes. This study has followed these practices through (1) a rigorous, hierarchical quality control and infilling forcing data protocol, (2) SWE, cold content, and snowpack temperature validation data from multiple years of snow pit observations, and (3) use of the widely validated, physics-based SNOWPACK model. Despite our adherence to such protocols, there are still significant sources of uncertainty inherent to model-based snow studies.
Snow model intercomparison work has consistently shown there is no one best model and that model performance varies between and within sites and water years (e.g., Boone and Etchevers, 2001; Essery et al., 2013; Etchevers et al., 2004; Rutter et al., 2009; Slater et al., 2001). This body of research acknowledges that all models imperfectly represent snow cover evolution and the snowpack energy balance. One example of a shortcoming of SNOWPACK relevant to the work presented herein is that the temperature of new snow is set to be equal to air temperature despite the fact that hydrometeor temperature is more accurately estimated as a function of the psychrometric energy balance (e.g., Harder and Pomeroy, 2013). Using the psychrometric approach gives snowfall a temperature near the wet bulb temperature, which is lower than air temperature when relative humidity is under 100 % (Harder and Pomeroy, 2013). Thus, the temperature of new snow is likely to be overestimated by SNOWPACK, while cold content additions are underestimated. This means our computation of the total cold content contributed by precipitation is likely on the conservative side as using the wet bulb temperature would lead to increased cold content gains during snowfall.
Another source of uncertainty in our work is the use of an empirical method to estimate incoming longwave radiation as a function of air temperature, relative humidity, and incoming shortwave radiation (Appendix A). Recent research has shown errors in incoming longwave radiation propagate into SWE, snow surface temperature, and energy balance biases (Lapo et al., 2015; Raleigh et al., 2016). We aimed to reduce the error in our incoming longwave radiation estimates by using the recommended clear sky and cloud correction protocols for Niwot Ridge (Flerchinger et al., 2009). At both the alpine and subalpine site, the mean biases were within the instrument range of error when compared to shorter-term observations, indicating the total estimated amount of incoming longwave radiation was acceptable. However, the low r2 of the hourly estimates suggests the sub-daily fluctuations of incoming longwave radiation were not well simulated. Despite these issues, model performance was high in terms of simulated SWE, depth-weighted snowpack temperature, and cold content (Sect. 4.2). This may due to compensatory errors in the model (Etchevers et al., 2004; Kirchner, 2006) or because SNOWPACK is relatively insensitive to the choice of incoming longwave radiation estimate (Schlögl et al., 2016).
Additionally, we had no long-term ground surface temperature data to force the model, so we used the SNOWPACK default value of 0 ∘C. This produced mean QG values of 2.0 and 0.8 W m−2 during periods of SWE > 1 cm in the alpine and subalpine, respectively. Previous work from the Niwot Ridge LTER using a heat flux plate indicated QG in the alpine was negligible (Cline, 1997), while other researchers showed the upper layer of alpine soil could approach temperatures significantly below freezing during periods of shallow snow cover (Brooks and Williams, 1999). Therefore, the SNOWPACK-simulated alpine QG is likely an overestimate. In the subalpine, the soil temperature at 5 cm below the surface is typically between −1 and 0 ∘C during the winter (Burns et al., 2014), meaning the use of the default 0 ∘C ground surface temperature was in reasonable agreement with shorter-term observations.
5.3 Differences between cold content development controls in the alpine and subalpine
Despite only a 506 m elevation difference between the two sites, the role of a negative energy balance in developing cold content in the subalpine was approximately double that of the alpine. Simulations of snowpack temperature indicated the increased sensitivity was likely due to the shallower subalpine snow depth. Diurnal snowpack temperature range generally decreases with depth (e.g., Burns et al., 2014; DeWalle and Rango, 2008; Sturm et al., 1995) and our simulations showed daily fluctuations to be largest in the snowpack's upper layers, converging towards 1.0 ∘C as depth exceeded 500 mm (Fig. 13). This is the same depth at which the insulating effects of snow on soil temperature become marginal (Slater et al., 2017). This is likely because the penetration of incoming shortwave radiation and sensible heat transfer through wind pumping are limited to the top portion of the snowpack (Albert and McGilvary, 1992; Colbeck, 1989a, b; Lehning et al., 2002b), while the low thermal conductivity of snow modulates energy transfer below the active upper layers (Sturm et al., 1997). In this case, proportionally more of the shallower subalpine snowpack was interacting with surface energy exchange, making it more sensitive to positive and negative fluxes. Furthermore, subalpine cold content was consistently lower in magnitude, meaning it took less energy input to drive cold content to zero and relative fluctuations were larger. Therefore, shallower snowpacks with reduced cold content, like those in the subalpine, are more susceptible to relatively rapid changes in internal energy from surface energy fluxes.
5.4 Other controls on seasonal snowmelt timing and rate
Previous research has suggested uncertainty in the degree to which cold content controls snowmelt timing at daily to seasonal timescales. In our research, we found no statistically significant relationship between peak cold content magnitude and seasonal snowmelt onset using data from both observations and simulations. Rather, the majority of the variance in seasonal snowmelt onset was explained by the timing of annual peak cold content and total spring precipitation. Later peak cold content generally occurred due to cold spring storms depositing significant snowfall. If such events were then followed by continued snowfall, then snowmelt timing was delayed. Meanwhile, seasonal snowmelt rate, or the ablation slope, was primarily controlled by peak SWE magnitude and timing, with greater, later peak SWE corresponding to more rapid snowmelt.
These results all suggest later seasonal snowmelt onset and faster snowmelt rates are primarily a function of persistent snowfall. While snowfall events can add significant cold content to the snowpack, they also change other fundamental properties that can delay snowmelt timing, such as increasing surface albedo (Clow et al., 2016) and adding dry pore space that must be saturated (Seligman et al., 2014). Other research shows seasonal snowmelt onset is also related to air temperature (Kapnick and Hall, 2012) and snow surface impurities (Painter et al., 2010; Skiles et al., 2012). Although much work has been done evaluating the empirical controls exerted by snowpack and climatic properties on snowmelt rate and timing across large spatial extents (e.g., Trujillo and Molotch, 2014), relatively little research has been done at such scales on the physical processes (e.g., cold content and the snowpack energy balance). Given the importance of seasonal snowmelt timing to water resources management and various hydrologic processes, future synthesis work should evaluate the effect of physical processes on snowmelt rate and timing across snow-dominated regions globally, leveraging both field observations and physics-based snow model simulations.
5.5 Cold content development processes in other seasonal snow classes and climates
Despite the research presented here, there are still unanswered questions regarding cold content development as well as its effect on snowmelt rate and timing. Firstly, we have only presented results from two sites within a single snow-dominated research catchment. Seasonal snow cover in the western United States spans a large elevational gradient and includes both maritime (e.g., the Cascades and Sierra Nevada) and continental (e.g., the Rocky Mountains) snowpack regimes (Armstrong and Armstrong, 1987; Serreze et al., 1999). Globally, seasonal snow cover includes an even greater number of classes, including the cold, thin snowpacks of the Arctic and the Canadian Prairies (Sturm et al., 1995). Therefore, an avenue for future research is to examine differences in cold content development across seasonally snow covered areas, with a particular focus on disentangling the effects of precipitation and air temperature during snowfall at sites with different snowpack characteristics. For example, snowpacks in California's Sierra Nevada are typically deep, but air temperature is generally near freezing, even during winter storm events. Considering the cold content of precipitation is a linear function of air temperature and precipitation depth (Eq. 2), a given unit of snowfall in the Sierra Nevada should contribute less snowpack cold content than that same unit in the colder Rocky Mountains. Therefore, the control that precipitation exerts on cold content development is likely different between the two locations. Additionally, it is uncertain how our results translate to cold, shallow tundra and taiga snowpacks. In this study, we observed marked differences in cold content development processes between the alpine and subalpine, with the energy balance exerting greater control in the shallower subalpine snowpack. It may be that the energy balance is of even greater importance in tundra and taiga snowpacks, but further work is needed.
Secondly, a large amount of recent literature has shown unequivocally that, due to climate warming, patterns of snow accumulation and melt are changing across the globe with resultant effects on a myriad of hydrologic processes (Barnhart et al., 2016; Berghuijs et al., 2014; Knowles et al., 2006; Mote et al., 2005; Musselman et al., 2017; Pederson et al., 2011; Stewart, 2009). It is uncertain what role, if any, cold content plays in the climate-driven changes on snow processes. In our investigations we found pit-observed SWE was a strong predictor of cold content (alpine r2=0.84; subalpine r2=0.50), with subalpine cold content lower per unit SWE due to warmer depth-weighted snowpack temperatures. Both sites also exhibited a significant positive linear relationship between the cumulative mean of air temperature and snowpack temperature. Therefore, a unit of SWE in a warmer location or climate should correspond to reduced cold content due to increased snowpack temperature. Our work showed that decreased cold content magnitudes corresponded to faster snowmelt rates and earlier snowmelt timing at timescales less than 1 month. Therefore, reductions in snowpack cold content due to climate warming have implications for meltwater timing and availability, which could impact water resources management.
We have presented an analysis of snowpack cold content using data from a long-term snow pit record and 23 years of physics-based snow model simulations at an alpine and subalpine site within the Niwot Ridge LTER. The research questions were designed to fill important missing gaps in the snow hydrology literature, namely the meteorological and energy balance processes behind cold content development and how cold content controls snowmelt rate and timing. Observations and simulations showed new snowfall was the primary pathway for cold content development at our sites, being responsible for 84.4 and 73.0 % of modeled daily cold content gains in the alpine and subalpine, respectively. Snowfall days with cold content gains outnumbered non-snowfall days with gains by a 4.2 : 1 ratio in the alpine and 2.6 : 1 in the subalpine. A negative energy balance – averaging > −3.0 W m−2 in the alpine and subalpine – was responsible for the remainder of cold content gains, primarily due to the cooling effect of sublimation and net longwave emissions. At sub-daily timescales, dry-period cold content increases occurred preferentially at night at both sites. We found no evidence in either the snow pit record or the simulation data for large negative energy fluxes generating significant snowpack cold content. Additionally, air temperature showed little to no relationship to cold content development at either of the sites we studied.
Seasonal snowmelt timing was not significantly correlated with peak cold content magnitude, but rather the timing of peak cold content and total spring precipitation controlled snowmelt onset. Later peak cold content and increased spring precipitation delayed snowmelt in both the alpine and subalpine, explaining 84.7 and 61.4 % of the variance in peak SWE timing. Cold content magnitude did affect sub-seasonal snowmelt in that non-zero initial cold content values corresponded to delayed snowmelt timing and slower snowmelt rates. At daily timescales, the majority of melt events and the fastest melt rates occurred only when CC MJ m−2. Any existing energy deficit at 06:00 damped daily snowmelt rates.
The Niwot Ridge LTER provided the ideal study location for the research presented in this paper. The site's unique long-term snow pit and hourly meteorological records facilitated in-depth analyses into snowpack processes using both observations and physics-based snow model simulations. Lacking either data source would have limited the scope of this paper and added further uncertainty. Therefore, we hope this work underlines the utility of long-term in situ snowpack and meteorological measurements as they allow for robust analyses on the observations themselves and also enable model validation on multiple snowpack properties (e.g., mass, depth-weighted temperature, and cold content), which improves the quality of simulated output.
The quality controlled, infilled meteorological dataset presented in this work is hosted on the Niwot Ridge LTER website (http://niwot.colorado.edu/data/data/infilled-climate-data-for-c1-saddle-d1-1990-2013-hourly, last access: 17 April 2018). Please use this paper as the data citation and contact Keith S. Jennings with questions (keith.jennings@colorado.edu). Snow pit (http://niwot.colorado.edu/index.php/data/data/snow-cover-profile-data-for-niwot-ridge-and-green-lakes-valley, last access: 17 April 2018) and precipitation data (http://niwot.colorado.edu/index.php/data/data/precipitation-data-for-c1-chart-recorder-1952-ongoing, last access: 17 April 2018, and http://niwot.colorado.edu/index.php/data/data/precipitation-data-for-saddle-chart-recorder-1981-ongoing, last access: 17 April 2018) can also be accessed through the Niwot Ridge LTER. Niwot SNOTEL data can be found at https://wcc.sc.egov.usda.gov/nwcc/site?sitenum=663, last access: 17 April 2018. Niwot Ridge AmeriFlux data were provided by PI Peter Blanken and site manager Sean Burns and can be accessed at http://urquell.colorado.edu/data_ameriflux/, last access: 17 April 2018.
A1 Meteorological data quality control and infilling
The quality control routine for all observation types except precipitation followed the three-step procedure outlined in Meek and Hatfield (1994) where observations were flagged for removal if (1) they fell outside of a prescribed minimum-maximum range for that day of year, (2) their hourly rate of change exceeded a given threshold, and/or (3) the same value was recorded in four consecutive time steps, indicating a stuck sensor. A full description of the protocol for each variable falls outside the scope of this paper, but can be viewed in Meek and Hatfield (1994). The only changes made to their schema were applied to better represent climate processes on Niwot Ridge, particularly the high variability in hourly air temperature and wind speed common at dry, high-elevation, mountainous, continental locations. These modifications allowed more valid observations to pass the quality control checks than the original Meek and Hatfield (1994) protocol.
Following the quality control procedure, missing observations were imputed using a hierarchical routine based on the work of Liston and Elder (2006), Kittel (2009), and Henn et al. (2012), where gaps of 72 h and shorter were infilled using temporal techniques and longer gaps were infilled using a multi-station regression. Data gaps of 1 h were filled using a linear interpolation between the observations directly preceding and following the missing value. Gaps between 2 and 24 h were filled using an average of the value recorded 24 h prior and 24 h after the missing observation. Gaps between 25 and 72 h were filled using a forecasted and back-casted autoregressive integrated moving average (ARIMA) model with imputed values linearly weighted by their temporal distance from the beginning/end of gap. Data gaps longer than 72 h, plus shorter gaps that could not be filled using the temporal protocol due to missing data, were infilled with a one- or two-station regression. We pursued this approach because each station collected the same required forcing data for SNOWPACK and the three stations were located within 7 km of one another (Fig. 1). If the two remaining stations were reporting valid observations, then the two-station regression was used. Otherwise, the one-station regression was employed. Regression equations were generated for each variable per month and 3 h time block where a day is divided into eight 3 h periods (e.g., 00:00–03:00, 03:00–06:00, etc.). Although such an approach neglects the spatial variability inherent to meteorologic processes in complex terrain, the values generated by the regressions reproduce changes in conditions due to frontal passages and storm events. For periods when no stations were reporting, data were infilled using the mean value for the given station, variable, month, and 3 h time block.
Table A1Cross-validation statistics for the multi-station regression infilling procedure for air temperature (Ta, ∘C), total incoming solar radiation (SWin, MJ m−2), wind speed (VW, m s−1), and dew point temperature (Td, ∘C). Note: relative humidity values were converted to Td for computing the multi-station regression.
Quality controlled, gap-filled relative humidity, air temperature, and incoming solar radiation measurements were used to generate two estimates of incoming longwave radiation at an hourly time step. The equations presented in Angström (1915) and Dilley and O'Brien (1998) were used to estimate clear sky atmospheric emissivity based on vapor pressure, which was calculated from relative humidity. Flerchinger et al. (2009) noted these two methods performed best at the subalpine site on Niwot Ridge relative to observations from the co-located AmeriFlux tower. Emissivity was then corrected for estimated cloud cover based on the ratio of observed solar radiation to maximum clear sky solar radiation using the approach of Crawford and Duchon (1999). Finally, incoming longwave radiation was calculated using the Stefan–Boltzmann equation:
where LW↓ is incoming longwave radiation (W m−2), ϵ is the estimated atmospheric emissivity (dimensionless, 0 to 1), σ is the Stefan–Boltzmann constant ( W m−2 K−4), and Ta is air temperature (K).
Measuring solid precipitation is inherently difficult, particularly at higher wind speeds (Rasmussen et al., 2012; Yang et al., 1999) and snowpack simulations are reliant on accurate precipitation input to produce reliable output (Raleigh et al., 2015; Schmucki et al., 2014). Thus, any snow modeling project has the compounded problem of requiring accurate precipitation forcings and sensitivity to said forcings. For this study, two primary precipitation data sources were utilized along with site-specific gage corrections as described below.
Alpine precipitation data came from the quality controlled LTER dataset (http://niwot.colorado.edu/index.php/data/data/precipitation-data-for-saddle-chart-recorder-1981-ongoing). While snowfall undercatch is commonly documented in the literature, Williams et al. (1998) showed blowing snow events lead to significant overcatch at the LTER alpine precipitation gage from October to May. To correct the overcatch we created monthly precipitation reduction factors by comparing cumulative precipitation from the date of each snow pit observation to the following snow pit observation to the change in SWE between those observation dates when the change in pit SWE was positive. We found overcatch was greatest in months where Berg (1986) reported the highest frequency of blowing snow events (January, March – average reduction = 0.59) and lowest in months with fewer blowing snow events (December, February, April – average reduction = 0.86).
Subalpine precipitation data came from the quality controlled, gap-filled Kittel et al. (2015) dataset with further corrections applied for snow undercatch relative to the Niwot SNOTEL snow pillow during snowfall events, which averaged 2.1 mm per snowfall day. Air temperature during precipitation events showed the strongest control on undercatch with decreasing air temperature corresponding to increased negative precipitation biases. Notably, wind speed was not correlated with undercatch at the subalpine gage, likely due to the siting of the anemometer. This instrument is located 5 m above ground level in a roadside clearing and is generally unrepresentative of the wind speed magnitude in the dense subalpine forest where the snow pit, LTER precipitation gage, and Niwot SNOTEL station are located. Compared to the subalpine snow pit, accumulated precipitation in the gage was on average 88.3 mm or 32.3 % lower than observed maximum SWE.
Daily precipitation observations from both datasets were temporally disaggregated to the hourly time step of SNOWPACK by dividing the daily total by 24 and equally distributing the values to each hour of the day. Hourly precipitation observations were not available, and therefore a more advanced disaggregation method was not pursued.
A2 Meteorological data infilling validation
Missing observations and measurements failing the quality control checks were more common in the alpine than subalpine (Table A1). The variable with the greatest number of missing values was solar radiation in the alpine due to a long instrument outage period in the 2000s. The multi-station regression was the most utilized infilling technique (temporal infilling accounted for, at most, 3.0 % of the missing data) and cross-validation statistics are presented in Table A1. Generally, infilling performance was greater in the alpine due to the close proximity of the high alpine meteorological station. Of the forcing variables, air temperature exhibited the highest infilling performance and wind speed the lowest.
Estimates of incoming longwave radiation exhibited low biases relative to shorter-term observations taken near the alpine and subalpine meteorological stations. In the alpine, measurements of incoming longwave radiation were taken at the Subnivean laboratory from 1996 to 2008 and intermittently in more recent years. Here, the Dilley and O'Brien (1998) equation produced the best results relative to the observed data with a mean bias of 4.9 W m−2. In the subalpine, the mean bias relative to Ameriflux observations (12 July 1999 through 31 December 2013) was 10.4 W m−2 with the Angström (1915) estimate providing the best match. The positive biases in the alpine and subalpine represented 2.0 and 4.1 %, respectively, of the average hourly observed incoming longwave radiation, values which were within the manufacturer-reported precision range of ±10 % for the Kipp & Zonen CG2 net pyrgeometer at the Subnivean laboratory and the CNR1 net radiometer at the AmeriFlux tower. The coefficient of determination for hourly and daily incoming longwave values were 0.51 and 0.72, respectively, in the alpine and 0.44 and 0.60 in the subalpine.
The supplement related to this article is available online at: https://doi.org/10.5194/tc-12-1595-2018-supplement.
KSJ, TGK, and NPM designed the study. KSJ performed the analyses and wrote the manuscript. TGK and NPM provided feedback and edited the manuscript.
The authors declare that they have no conflict of interest.
Keith S. Jennings was supported by a NASA Earth and Space Science Fellowship
(16-EARTH16F-378). The Niwot Ridge LTER is funded by the United States
National Science Foundation (NSF DEB #1637686). We are grateful to Mark
Williams for creating and sustaining the Niwot Ridge LTER Snow Internship
Program, from which the snow pit data were derived. We also offer our thanks
to Ben Livneh and Andrew Badger who provided feedback on the infilling
procedure, as well as to Hope Humphries and Jennifer Morse who helped track
down missing meteorological data, and to Oliver Wigmore and John Knowles for
providing site photos.
Edited by: Chris Derksen
Reviewed by: two anonymous referees
Albert, M. R. and McGilvary, W. R.: Thermal effects due to air flow and vapor transport in dry snow, J. Glaciol., 38, 273–281, 1992.
Anderson, E. A.: Development and testing of snow pack energy balance equations, Water Resour. Res., 4, 19–37, 1968.
Anderson, E. A.: A point of energy and mass balance model of snow cover, NOAA technical report NWS, 19, 150 pp., 1976.
Andreadis, K. M., Storck, P., and Lettenmaier, D. P.: Modeling snow accumulation and ablation processes in forested environments, Water Resour. Res., 45, W05429, https://doi.org/10.1029/2008WR007042, 2009.
Angström, A. K.: A study of the radiation of the atmosphere: based upon observations of the nocturnal radiation during expeditions to Algeria and to California, Smithsonian Institution, Washington, DC, 159 pp., 1915.
Armstrong, R. L. and Armstrong, B. R.: Snow and avalanche climates of the western United States: a comparison of maritime, intermountain and continental conditions, IAHS Publ., 162, 281–294, 1987.
Armstrong, R. L. and Brun, E.: Snow and climate: physical processes, surface energy exchange and modeling, Cambridge University Press, Cambridge, UK, 2008.
Barnett, T. P., Adam, J. C., and Lettenmaier, D. P.: Potential impacts of a warming climate on water availability in snow-dominated regions, Nature, 438, 303–309, 2005.
Barnhart, T. B., Molotch, N. P., Livneh, B., Harpold, A. A., Knowles, J. F., and Schneider, D.: Snowmelt rate dictates streamflow, Geophys. Res. Lett., 43, 8006–8016, 2016.
Bartelt, P. and Lehning, M.: A physical SNOWPACK model for the Swiss avalanche warning: Part I: numerical model, Cold Reg. Sci. Technol., 35, 123–145, 2002.
Bengtsson, L.: Percolation of meltwater through a snowpack, Cold Reg. Sci. Technol., 6, 73–81, 1982.
Berg, N. H.: Blowing snow at a Colorado alpine site: measurements and implications, Arctic Alpine Res., 18, 147–161, 1986.
Berghuijs, W. R., Woods, R. A., and Hrachowitz, M.: A precipitation shift from snow towards rain leads to a decrease in streamflow, Nat. Clim. Change, 4, 583–586, 2014.
Blanken, P. D., Williams, M. W., Burns, S. P., Monson, R. K., Knowles, J., Chowanski, K., and Ackerman, T.: A comparison of water and carbon dioxide exchange at a windy alpine tundra and subalpine forest site near Niwot Ridge, Colorado, Biogeochemistry, 95, 61–76, 2009.
Blöschl, G. and Kirnbauer, R.: Point snowmelt models with different degrees of complexity – internal processes, J. Hydrol., 129, 127–147, 1991.
Boone, A. and Etchevers, P.: An intercomparison of three snow schemes of varying complexity coupled to the same land surface model: Local-scale evaluation at an Alpine site, J. Hydrometeorol., 2, 374–394, 2001.
Brooks, P. D. and Williams, M. W.: Snowpack controls on nitrogen cycling and export in seasonally snow-covered catchments, Hydrol. Process., 13, 2177–2190, 1999.
Burns, S. P., Molotch, N. P., Williams, M. W., Knowles, J. F., Seok, B., Monson, R. K., Turnipseed, A. A., and Blanken, P. D.: Snow Temperature Changes within a Seasonal Snowpack and Their Relationship to Turbulent Fluxes of Sensible and Latent Heat, J. Hydrometeorol., 15, 117–142, https://doi.org/10.1175/JHM-D-13-026.1, 2014.
Caine, N.: Streamflow patterns in the alpine environment of North Boulder Creek, Colorado Front Range, Z. Geomorphol. Supp., 104, 27–42, 1996.
Cherkauer, K. A., Bowling, L. C., and Lettenmaier, D. P.: Variable infiltration capacity cold land process model updates, Global Planet. Change, 38, 151–159, https://doi.org/10.1016/S0921-8181(03)00025-0, 2003.
Christensen, N. S., Wood, A. W., Voisin, N., Lettenmaier, D. P., and Palmer, R. N.: The effects of climate change on the hydrology and water resources of the Colorado River basin, Clim. Change, 62, 337–363, 2004.
Clark, M. P., Nijssen, B., and Luce, C. H.: An analytical test case for snow models, Water Resour. Res., 53, 909–922, https://doi.org/10.1002/2016WR019672, 2017.
Cline, D. W.: Snow surface energy exchanges and snowmelt at a continental, midlatitude Alpine site, Water Resour. Res., 33, 689–701, 1997.
Clow, D. W., Williams, M. W., and Schuster, P. F.: Increasing aeolian dust deposition to snowpacks in the Rocky Mountains inferred from snowpack, wet deposition, and aerosol chemistry, Atmos. Environ., 146, 183–194, https://doi.org/10.1016/j.atmosenv.2016.06.076, 2016.
Colbeck, S. C.: Air movement in snow due to windpumping, J. Glaciol., 35, 209–213, 1989a.
Colbeck, S. C.: Snow-crystal growth with varying surface temperatures and radiation penetration, J. Glaciol., 35, 23–29, 1989b.
Crawford, T. M. and Duchon, C. E.: An improved parameterization for estimating effective atmospheric emissivity for use in calculating daytime downwelling longwave radiation, J. Appl. Meteorol., 38, 474–480, 1999.
Déry, S. J. and Brown, R. D.: Recent Northern Hemisphere snow cover extent trends and implications for the snow-albedo feedback, Geophys. Res. Lett., 34, L22504, https://doi.org/10.1029/2007GL031474, 2007.
DeWalle, D. R. and Rango, A.: Principles of snow hydrology, Cambridge University Press, Cambridge, UK, 2008.
Dilley, A. C. and O'Brien, D. M.: Estimating downward clear sky long-wave irradiance at the surface from screen temperature and precipitable water, Q. J. Roy. Meteor. Soc., 124, 1391–1401, 1998.
Erickson, T. A., Williams, M. W., and Winstral, A.: Persistence of topographic controls on the spatial distribution of snow in rugged mountain terrain, Colorado, United States, Water Resour. Res., 41, W04014, https://doi.org/10.1029/2003WR002973, 2005.
Essery, R., Morin, S., Lejeune, Y., and Ménard, C. B.: A comparison of 1701 snow models using observations from an alpine site, Adv. Water Resour., 55, 131–148, https://doi.org/10.1016/j.advwatres.2012.07.013, 2013.
Etchevers, P., Martin, E., Brown, R., Fierz, C., Lejeune, Y., Bazile, E., Boone, A., Dai, Y.-J., Essery, R., Fernandez, A. Gusev, Y., Jordan, R., Koren, V., Kowalczyk, E., Nasonova, N. O., Pyles, R. D., Schlosser, A., Shmakin, A. B., Smirnova, T. G., Strasser, U., Verseghy, D., Yamazaki, T., and Yang, Z.-L.: Validation of the energy budget of an alpine snowpack simulated by several snow models (SnowMIP project), Ann. Glaciol., 38, 150–158, 2004.
Flerchinger, G. N., Xaio, W., Marks, D., Sauer, T. J., and Yu, Q.: Comparison of algorithms for incoming atmospheric long-wave radiation, Water Resour. Res., 45, W03423, https://doi.org/10.1029/2008WR007394, 2009.
Förster, K., Meon, G., Marke, T., and Strasser, U.: Effect of meteorological forcing and snow model complexity on hydrological simulations in the Sieber catchment (Harz Mountains, Germany), Hydrol. Earth Syst. Sci., 18, 4703–4720, https://doi.org/10.5194/hess-18-4703-2014, 2014.
Harder, P. and Pomeroy, J.: Estimating precipitation phase using a psychrometric energy balance method, Hydrol. Process., 27, 1901–1914, https://doi.org/10.1002/hyp.9799, 2013.
Harpold, A. A. and Molotch, N. P.: Sensitivity of soil water availability to changing snowmelt timing in the western US, Geophys. Res. Lett., 42, 8011–8020, 2015.
Helgason, W. and Pomeroy, J.: Problems Closing the Energy Balance over a Homogeneous Snow Cover during Midwinter, J. Hydrometeorol., 13, 557–572, https://doi.org/10.1175/JHM-D-11-0135.1, 2011.
Henn, B., Raleigh, M. S., Fisher, A., and Lundquist, J. D.: A Comparison of Methods for Filling Gaps in Hourly Near-Surface Air Temperature Data, J. Hydrometeorol., 14, 929–945, https://doi.org/10.1175/JHM-D-12-027.1, 2012.
Hood, E., Williams, M., and Cline, D.: Sublimation from a seasonal snowpack at a continental, mid-latitude alpine site, Hydrol. Process., 13, 1781–1797, 1999.
Jennings, K. and Jones, J. A.: Precipitation-snowmelt timing and snowmelt augmentation of large peak flow events, western Cascades, Oregon, Water Resour. Res., 51, 7649–7661, https://doi.org/10.1002/2014WR016877, 2015.
Jennings, K. S., Winchell, T. S., Livneh, B., and Molotch, N. P.: Spatial variation of the rain-snow temperature threshold across the Northern Hemisphere, Nat. Commun., 9, 1148, https://doi.org/10.1038/s41467-018-03629-7, 2018.
Jepsen, S. M., Molotch, N. P., Williams, M. W., Rittger, K. E., and Sickman, J. O.: Interannual variability of snowmelt in the Sierra Nevada and Rocky Mountains, United States: Examples from two alpine watersheds, Water Resour. Res., 48, W02529, https://doi.org/10.1029/2011WR011006, 2012.
Kampf, S. K. and Lefsky, M. A.: Transition of dominant peak flow source from snowmelt to rainfall along the Colorado Front Range: Historical patterns, trends, and lessons from the 2013 Colorado Front Range floods, Water Resour. Res., 52, 407–422, 2016.
Kapnick, S. and Hall, A.: Causes of recent changes in western North American snowpack, Clim. Dynam., 38, 1885–1899, 2012.
Kirchner, J. W.: Getting the right answers for the right reasons: Linking measurements, analyses, and models to advance the science of hydrology, Water Resour. Res., 42, W03S04, https://doi.org/10.1029/2005WR004362, 2006.
Kittel, T.: The Development and Analysis of Climate Datasets for National Park Science and Management: A Guide to Methods for Making Climate Records Useful and Tools to Explore Critical Questions, available at: https://irma.nps.gov/DataStore/Reference/Profile/2169763 (last access: 6 March 2018), 2009.
Kittel, T. G. F., Williams, M. W., Chowanski, K., Hartman, M., Ackerman, T., Losleben, M., and Blanken, P. D.: Contrasting long-term alpine and subalpine precipitation trends in a mid-latitude North American mountain system, Colorado Front Range, USA, Plant Ecol. Divers., 8, 607–624, https://doi.org/10.1080/17550874.2016.1143536, 2015.
Knowles, J. F., Blanken, P. D., Williams, M. W., and Chowanski, K. M.: Energy and surface moisture seasonally limit evaporation and sublimation from snow-free alpine tundra, Agr. Forest Meteorol., 157, 106–115, https://doi.org/10.1016/j.agrformet.2012.01.017, 2012.
Knowles, J. F., Harpold, A. A., Cowie, R., Zeliff, M., Barnard, H. R., Burns, S. P., Blanken, P. D., Morse, J. F., and Williams, M. W.: The relative contributions of alpine and subalpine ecosystems to the water balance of a mountainous, headwater catchment, Hydrol. Process., 29, 4794–4808, https://doi.org/10.1002/hyp.10526, 2015.
Knowles, N., Dettinger, M. D., and Cayan, D. R.: Trends in snowfall versus rainfall in the western United States, J. Climate, 19, 4545–4559, 2006.
Lapo, K. E., Hinkelman, L. M., Raleigh, M. S., and Lundquist, J. D.: Impact of errors in the downwelling irradiances on simulations of snow water equivalent, snow surface temperature, and the snow energy balance, Water Resour. Res., 51, 1649–1670, 2015.
Lehning, M., Bartelt, P., Brown, B., Fierz, C., and Satyawali, P.: A physical SNOWPACK model for the Swiss avalanche warning: Part II. Snow microstructure, Cold Reg. Sci. Technol., 35, 147–167, 2002a.
Lehning, M., Bartelt, P., Brown, B., and Fierz, C.: A physical SNOWPACK model for the Swiss avalanche warning: Part III: Meteorological forcing, thin layer formation and evaluation, Cold Reg. Sci. Technol., 35, 169–184, 2002b.
Liston, G. E. and Elder, K.: A meteorological distribution system for high-resolution terrestrial modeling (MicroMet), J. Hydrometeorol., 7, 217–234, 2006.
Litaor, M. I., Williams, M., and Seastedt, T. R.: Topographic controls on snow distribution, soil moisture, and species diversity of herbaceous alpine vegetation, Niwot Ridge, Colorado, J. Geophys. Res., 113, G02008, https://doi.org/10.1029/2007JG000419, 2008.
Livneh, B., Xia, Y., Mitchell, K. E., Ek, M. B., and Lettenmaier, D. P.: Noah LSM Snow Model Diagnostics and Enhancements, J. Hydrometeorol., 11, 721–738, https://doi.org/10.1175/2009JHM1174.1, 2010.
Lundy, C. C., Brown, R. L., Adams, E. E., Birkeland, K. W., and Lehning, M.: A statistical validation of the SNOWPACK model in a Montana climate, Cold Reg. Sci. Technol., 33, 237–246, 2001.
Mankin, J. S., Viviroli, D., Singh, D., Hoekstra, A. Y., and Diffenbaugh, N. S.: The potential for snow to supply human water demand in the present and future, Environ. Res. Lett., 10, 114016, https://doi.org/10.1088/1748-9326/10/11/114016, 2015.
Marks, D. and Dozier, J.: Climate and energy exchange at the snow surface in the alpine region of the Sierra Nevada: 2. Snow cover energy balance, Water Resour. Res., 28, 3043–3054, 1992.
Marks, D. and Winstral, A.: Comparison of snow deposition, the snow cover energy balance, and snowmelt at two sites in a semiarid mountain basin, J. Hydrometeorol., 2, 213–227, 2001.
Marks, D., Dozier, J., and Davis, R. E.: Climate and Energy Exchange at the Snow Surface in the Alpine Region of the Sierra Nevada 1. Meteorological Measurements and Monitoring, Water Resour. Res., 28, 3029–3042, 1992.
Marks, D., Winstral, A., Flerchinger, G., Reba, M., Pomeroy, J., Link, T., and Elder, K.: Comparing simulated and measured sensible and latent heat fluxes over snow under a pine canopy to improve an energy balance snowmelt model, J. Hydrometeorol., 9, 1506–1522, 2008.
Meek, D. W. and Hatfield, J. L.: Data quality checking for single station meteorological databases, Agr. Forest Meteorol., 69, 85–109, 1994.
Meromy, L., Molotch, N. P., Williams, M. W., Musselman, K. N., and Kueppers, L. M.: Snowpack-climate manipulation using infrared heaters in subalpine forests of the Southern Rocky Mountains, USA, Agr. Forest Meteorol., 203, 142–157, https://doi.org/10.1016/j.agrformet.2014.12.015, 2015.
Molotch, N. P., Blanken, P. D., Williams, M. W., Turnipseed, A. A., Monson, R. K., and Margulis, S. A.: Estimating sublimation of intercepted and sub-canopy snow using eddy covariance systems, Hydrol. Process., 21, 1567–1575, 2007.
Molotch, N. P., Brooks, P. D., Burns, S. P., Litvak, M., Monson, R. K., McConnell, J. R., and Musselman, K.: Ecohydrological controls on snowmelt partitioning in mixed-conifer sub-alpine forests, Ecohydrology, 2, 129–142, 2009.
Molotch, N. P., Barnard, D. M., Burns, S. P., and Painter, T. H.: Measuring spatiotemporal variation in snow optical grain size under a subalpine forest canopy using contact spectroscopy, Water Resour. Res., 52, 7513–7522, https://doi.org/10.1002/2016WR018954, 2016.
Mosier, T. M., Hill, D. F., and Sharp, K. V.: How much cryosphere model complexity is just right? Exploration using the conceptual cryosphere hydrology framework, The Cryosphere, 10, 2147–2171, https://doi.org/10.5194/tc-10-2147-2016, 2016.
Mote, P. W., Hamlet, A. F., Clark, M. P., and Lettenmaier, D. P.: Declining mountain snowpack in western North America*, B. Am. Meteorol. Soc., 86, 39–49, 2005.
Musselman, K. N., Clark, M. P., Liu, C., Ikeda, K., and Rasmussen, R.: Slower snowmelt in a warmer world, Nat. Clim. Change, 7, 214–219, https://doi.org/10.1038/nclimate3225, 2017.
Obled, C. and Rosse, B.: Mathematical models of a melting snowpack at an index plot, J. Hydrol., 32, 139–163, https://doi.org/10.1016/0022-1694(77)90123-8, 1977.
Painter, T. H., Deems, J. S., Belnap, J., Hamlet, A. F., Landry, C. C., and Udall, B.: Response of Colorado River runoff to dust radiative forcing in snow, P. Natl. Acad. Sci. USA, 107, 17125–17130, 2010.
Pederson, G. T., Gray, S. T., Woodhouse, C. A., Betancourt, J. L., Fagre, D. B., Littell, J. S., Watson, E., Luckman, B. H., and Graumlich, L. J.: The unusual nature of recent snowpack declines in the North American Cordillera, Science, 333, 332–335, 2011.
Raleigh, M. S., Lundquist, J. D., and Clark, M. P.: Exploring the impact of forcing error characteristics on physically based snow simulations within a global sensitivity analysis framework, Hydrol. Earth Syst. Sci., 19, 3153–3179, https://doi.org/10.5194/hess-19-3153-2015, 2015.
Raleigh, M. S., Livneh, B., Lapo, K., and Lundquist, J. D.: How Does Availability of Meteorological Forcing Data Impact Physically Based Snowpack Simulations?, J. Hydrometeorol., 17, 99–120, https://doi.org/10.1175/JHM-D-14-0235.1, 2016.
Rasmussen, R., Baker, B., Kochendorfer, J., Meyers, T., Landolt, S., Fischer, A. P., Black, J., Thériault, J. M., Kucera, P., Gochis, D., Smith, C., Nitu, R., Hall, M., Ikeda, K., and Gutmann, E.: How well are we measuring snow: The NOAA/FAA/NCAR winter precipitation test bed, B. Am. Meteorol. Soc., 93, 811–829, 2012.
Regonda, S. K., Rajagopalan, B., Clark, M., and Pitlick, J.: Seasonal cycle shifts in hydroclimatology over the western United States, J. Climate, 18, 372–384, 2005.
Rutter, N., Essery, R., Pomeroy, J., et al.: Evaluation of forest snow processes models (SnowMIP2), J. Geophys. Res., 114, D06111, https://doi.org/10.1029/2008JD011063, 2009.
Schlögl, S., Marty, C., Bavay, M., and Lehning, M.: Sensitivity of Alpine3D modeled snow cover to modifications in DEM resolution, station coverage and meteorological input quantities, Environ. Model. Softw., 83, 387–396, https://doi.org/10.1016/j.envsoft.2016.02.017, 2016.
Schmucki, E., Marty, C., Fierz, C., and Lehning, M.: Evaluation of modelled snow depth and snow water equivalent at three contrasting sites in Switzerland using SNOWPACK simulations driven by different meteorological data input, Cold Reg. Sci. Technol., 99, 27–37, 2014.
Seligman, Z. M., Harper, J. T., and Maneta, M. P.: Changes to Snowpack Energy State from Spring Storm Events, Columbia River Headwaters, Montana, J. Hydrometeorol., 15, 159–170, https://doi.org/10.1175/JHM-D-12-078.1, 2014.
Serreze, M. C., Clark, M. P., Armstrong, R. L., McGinnis, D. A., and Pulwarty, R. S.: Characteristics of the western United States snowpack from snowpack telemetry (SNOTEL) data, Water Resour. Res., 35, 2145–2160, 1999.
Sexstone, G. A., Clow, D. W., Stannard, D. I., and Fassnacht, S. R.: Comparison of methods for quantifying surface sublimation over seasonally snow-covered terrain, Hydrol. Process., 30, 3373–3389, https://doi.org/10.1002/hyp.10864, 2016.
Skiles, S. M., Painter, T. H., Deems, J. S., Bryant, A. C., and Landry, C. C.: Dust radiative forcing in snow of the Upper Colorado River Basin: 2. Interannual variability in radiative forcing and snowmelt rates, Water Resour. Res., 48, W07522, https://doi.org/10.1029/2012WR011986, 2012.
Slater, A. G., Schlosser, C. A., Desborough, C. E., et al.: The representation of snow in land surface schemes: Results from PILPS 2(d), J. Hydrometeorol., 2, 7–25, 2001.
Slater, A. G., Lawrence, D. M., and Koven, C. D.: Process-level model evaluation: a snow and heat transfer metric, The Cryosphere, 11, 989–996, https://doi.org/10.5194/tc-11-989-2017, 2017.
Stewart, I. T.: Changes in snowpack and snowmelt runoff for key mountain regions, Hydrol. Process., 23, 78–94, 2009.
Sturm, M., Holmgren, J., and Liston, G. E.: A seasonal snow cover classification system for local to global applications, J. Climate, 8, 1261–1283, 1995.
Sturm, M., Holmgren, J., König, M., and Morris, K.: The thermal conductivity of seasonal snow, J. Glaciol., 43, 26–41, 1997.
Trujillo, E. and Molotch, N. P.: Snowpack regimes of the Western United States, Water Resour. Res., 50, 5611–5623, https://doi.org/10.1002/2013WR014753, 2014.
United States Army Corps of Engineers: Snow hydrology, North Pacific Division, Corps of Engineers, U.S. Army, Portland, Or., 1956.
Walker, D. A., Halfpenny, J. C., Walker, M. D., and Wessman, C. A.: Long-term studies of snow-vegetation interactions, BioScience, 43, 287–301, 1993.
Walker, M. D., Webber, P. J., Arnold, E. H., and Ebert-May, D.: Effects of interannual climate variation on aboveground phytomass in alpine vegetation, Ecology, 75, 393–408, 1994.
Wigmosta, M. S., Vail, L. W., and Lettenmaier, D. P.: A distributed hydrology-vegetation model for complex terrain, Water Resour. Res., 30, 1665–1679, 1994.
Williams, M.: Snow cover profile data for Niwot Ridge, Green Lakes Valley from 1993/2/26 – ongoing, weekly to biweekly, available at: http://niwot.colorado.edu/index.php/data/data/snow-cover-profile-data-for-niwot-ridge-and-green-lakes-valley- - -1993-ongoi (last access: 17 April 2018), 2016.
Williams, M. W., Bardsley, T., and Rikkers, M.: Overestimation of snow depth and inorganic nitrogen wetfall using NADP data, Niwot Ridge, Colorado, Atmos. Environ., 32, 3827–3833, 1998.
Williams, M. W., Cline, D., Hartman, M., and Bardsley, T.: Data for snowmelt model development, calibration, and verification at an alpine site, Colorado Front Range, Water Resour. Res., 35, 3205–3209, 1999.
Winchell, T. S., Barnard, D. M., Monson, R. K., Burns, S. P., and Molotch, N. P.: Earlier snowmelt reduces atmospheric carbon uptake in midlatitude subalpine forests, Geophys. Res. Lett., 43, 8160–8168, 2016.
Yang, D., Goodison, B. E., Metcalfe, J. R., Louie, P., Leavesley, G., Emerson, D., Hanson, C. L., Golubev, V. S., Elomaa, E., Gunther, T., and others: Quantification of precipitation measurement discontinuity induced by wind shields on national gauges, Water Resour. Res., 35, 491–508, 1999.