
the Creative Commons Attribution 4.0 License.
the Creative Commons Attribution 4.0 License.
 | 19 Nov 2026
Post-depositional geochemical transformations of aerosol impurities in EPICA Dome C ice core: dissolution, mineral neoformation, and immobilization revealed by CFA-sp-ICP-TOFMS

Tobias Erhardt
Piers Larkman
Chantal Zeppenfeld
Sarah Jackson
Jochen Schmitt
Barbara Delmonte
Giovanni Baccolo
Catherine Ritz
Frank Wilhelms
Dorthe Dahl-Jensen
Kevin Michael Nikolaus
Pascal Bohleber
Hubertus Fischer
Aerosol-derived impurities in deep Antarctic ice cores provide high-resolution records of past climate and atmospheric variability. However, post-depositional englacial geochemical processes driven by impurity remobilization through ice metamorphism can perturb the originally deposited signals, challenging the interpretation of deep ice records. To address this, we investigate englacial mineral alterations by analyzing the elemental composition of 18 ice-core sections of the EPICA Dome C (EDC) ice core (ranging from 281.6–3137.1 m depth) using single-particle inductively coupled plasma time-of-flight mass spectrometry (sp-ICP-TOFMS) coupled to a continuous flow analysis (CFA) system. This reveals a deep-ice environment dominated by pervasive acid dissolution, leaving behind more dissolution-resistant mineral phases. We document the progressive neoformation of potassium-rich alunite-supergroup minerals (jarosite, alunite, and mixed phases) and the probable formation of Fe-(oxyhydr)oxide coatings. These secondary phases concurrently immobilize trace elements (iodine, arsenic, lead) via surface adsorption and structural substitution. These transformations occur within highly localized microenvironments and are accelerated by increasing in situ temperatures with depth. They are further enabled by the old age of deep ice, which provides hundreds of thousands of years for these reactions to occur. These findings underscore the importance of accounting for the effects of post-depositional geochemical transformation when interpreting impurity records from EDC and other old ice cores. The colder thermal regime of the Beyond EPICA Little Dome C is expected to lead to slower geochemical transformation, potentially providing a higher-fidelity impurity record for the epochs currently covered by EDC.
- Article
(7895 KB) - Full-text XML
- BibTeX
- EndNote


Ice cores from polar regions provide high-resolution records of past climate variability. In particular, the European Project for Ice Coring in Antarctica (EPICA) Dome C (EDC) ice core provides the longest continuous ice-core climate record so far, preserving the last eight glacial-interglacial cycles and extending back to 800 kyr (EPICA community members, 2004). Among the proxies preserved in ice, mineral dust is one of the most sensitive indicators of climate and environmental change, with concentrations varying by several orders of magnitude between glacial and interglacial periods (Delmonte et al., 2002, 2007; Fischer et al., 2007). This variability reflects changes in dust emission, atmospheric transport, and deposition, thereby providing key constraints on past atmospheric circulation, wind speed, aridity, and surface conditions in the dust source region.
Extending ice-core records beyond 800 kyr has become one of the central goals in paleoclimatology, particularly for addressing the Mid-Pleistocene Transition (MPT; 900–1200 kyr), when glacial–interglacial periodicity shifted from 41 to 100 kyr (Lisiecki and Raymo, 2005; Elderfield et al., 2012). Deep ice cores are among the most promising archives for resolving MPT mechanisms, the origin of which remains debated, driving the search for the oldest and deepest ice (Fischer et al., 2013). Such efforts culminated in the successful drilling within the Beyond EPICA project at Little Dome C (BELDC), capturing ice records that span the MPT (Barbante and Beyond EPICA Team, 2025). However, as ice age and depth increase, the potential for post-depositional processes to modify primary climate signals increases correspondingly. A thorough understanding of these processes is thus essential for reliably interpreting climate proxies, yet detailed investigations of englacial geochemical transformations remain limited.
Among these processes, the post-depositional modification of impurities poses a major challenge for interpreting deep ice-core records, as both physical redistribution and chemical transformation of aerosol-derived material can occur during ice metamorphism. Early evidence for post-depositional modifications came from the discovery of unusually large dust aggregates (several micrometers up to a few millimeters) in the deepest sections of the EDC ice core, below ∼2900 m (Delmonte, 2003; Lambert et al., 2008; Tison et al., 2015). These aggregates demonstrate that mineral dust is not inert but undergoes substantial post-depositional evolution at depth.
Subsequent studies have identified a suite of englacial geochemical processes that drive dust aggregation and mineral transformation. These processes include (i) dissolution of primary minerals, notably carbonates and aluminosilicates (e.g., hornblende and muscovite), as well as Na-sulfates and Fe-bearing phases (Baccolo et al., 2018, 2021a; Ohno et al., 2006; Eichler et al., 2019), (ii) neoformation of secondary sulfate and carbonate minerals (de Angelis et al., 2013; Ohno et al., 2006; Baccolo et al., 2018, 2021a; Eichler et al., 2019; Lanci et al., 2026; Traversi et al., 2009; Iizuka et al., 2008; Ohno et al., 2014), and (iii) redox reactions affecting iron-bearing components (Baccolo et al., 2018, 2021a). Such alterations have been documented at multiple Antarctic sites, likely indicating that they are a widespread feature of deep Antarctic ice (Table A1).
Among secondary phases, sulfate minerals are particularly prominent. Gypsum, a well-known secondary mineral, has been frequently reported, together with magnesium sulfates and other sulfate species (de Angelis et al., 2013; Ohno et al., 2006; Eichler et al., 2019; Iizuka et al., 2008; Baccolo et al., 2021a; Ohno et al., 2014; Traversi et al., 2009). Of special interest is potassium iron(III) sulfate hydroxide (jarosite), which has been identified in deep Antarctic ice cores and is interpreted as a cementing agent promoting dust aggregation (Baccolo et al., 2018; Eichler et al., 2019; Baccolo et al., 2021a; Lanci et al., 2026). The neoformation of jarosite implies the development of localized acidic (pH ∼2–3) and oxidizing microenvironments, which may be intensified by neoformation of Fe-oxyhydroxides and other secondary minerals, and, potentially, by acid production during pyrite (FeS2) oxidation (Long et al., 1992a, b; Papike et al., 2006; Baccolo et al., 2021a; de Angelis et al., 2013; Eichler et al., 2019). However, the presence of intact pyrite at a remote site warrants caution, given the challenges of long-range aeolian transport from potential source regions (Baccolo et al., 2021a). A synthesis of the geochemical processes in deep Antarctic ice and analog environments is provided in Table A1.
The development of such reactions is facilitated by the heterogeneous localized distribution of impurities at the microscale. Acidic species can be concentrated along grain boundaries, at triple junctions, and within micro-inclusions in the ice matrix, creating localized low-pH environments that strongly differ from bulk ice conditions (Wolff and Paren, 1984; Mulvaney et al., 1988; Fukazawa et al., 1998; Baccolo et al., 2021a; Bohleber et al., 2025). While bulk meltwater typically maintains a pH above 5 under non-volcanic Holocene background conditions (Kjær et al., 2016), direct cryo measurements on µm2-scale cross-sections of triple junctions in deep ice suggest that local acidity can reach strongly acidic values, up to several mol L−1 of acid species such as sulfuric and nitric acid (Mulvaney et al., 1988; Fukazawa et al., 1998). In addition, premelting (a thermodynamic melting process at the micro-scale) at these impurity-rich sites generates thin liquid-like films and confined liquid phases at subfreezing bulk temperatures, locally approaching eutectic conditions (Pincock, 1969; Nye, 1989; Mader, 1992; Dash et al., 2006). These impurity-rich liquid phases provide a reactive medium that promotes dissolution, diffusion, and precipitation of mineral phases, thereby accelerating post-depositional geochemical alteration (de Angelis et al., 2013; Rempel et al., 2001; Dash et al., 2006; Stoll et al., 2021).
Despite these advances, important knowledge gaps remain in inner Antarctica, where impurity composition and ice metamorphism are quite different from previous study sites. For instance, jarosite has not yet been identified in the Dome Concordia region of the East Antarctic Plateau, which hosts the oldest continuous ice core retrieved to date. Moreover, while early studies focusing on the deepest ice-core sections (de Angelis et al., 2013; Tison et al., 2015) have offered limited insight into how post-depositional processes develop with increasing depth and age, more recent depth-resolved studies (Baccolo et al., 2021a; Lanci et al., 2026) have significantly advanced our understanding. Nonetheless, the reliance on electron microscopy and X-ray-based techniques – primarily suited for micron-sized individual particles or bulk samples – still limits the ability to resolve the fine-scale onset and evolution of these processes or to achieve statistically robust conclusions (Kutuzov et al., 2026; Stoll et al., 2026).
Here, we address these gaps by investigating post-depositional geochemical processes across a broad depth interval of the EDC ice core. We analyze the elemental composition of 18 ice-core sections sampled at depths between 281.6 and 3137.1 m using single-particle inductively coupled plasma time-of-flight mass spectrometry (sp-ICP-TOFMS) coupled to the Bern continuous flow analysis (CFA) system. We use a new particle size classification approach based on time bin count data from sp-ICP-TOFMS, termed bin count analysis (BCA). This approach enables us to track depth-dependent changes in the elemental composition and size of millions of individual particles and the dissolved-phase composition of meltwater samples, thereby providing new robust constraints on the onset, progression, and mechanisms of englacial geochemical alteration.
2.1 Experimental setup
2.1.1 EDC ice-core samples
The EDC ice-core drilling site is located on the East Antarctic Plateau (75°06′ S, 123°21′ E) at an elevation of 3233 m above sea level. Owing to its long and continuous stratigraphic record, the EDC region is a key target for efforts to recover the oldest Antarctic ice. Improving our understanding of englacial post-depositional geochemical processes in this region is therefore essential for interpreting existing deep ice records and for addressing challenges associated with the interpretation of million-year-old ice currently being recovered from East Antarctica.
For this study, we selected eighteen 55 cm ice-core sections (; hereafter referred to as “bags”) distributed across depths ranging from 281.6 to 3171.1 m, covering 10 distinct climatic periods. The selection was guided by two aims: to cover the full range of dust concentrations recorded in the ice, and to include both shallow ice, unaffected by post-depositional dissolution and neoformation, and deep ice. The final choice was further constrained by the availability of sufficiently large EDC ice sections, as this core has been extensively sampled in the past. The selected samples encompass a wide range of ages and impurity regimes representative of major climatic states. A complete overview of the samples, including depth, age, and previously reported temperature- and dust-related information, is provided in Table 1. For clarity, each sample is labelled based on the climatic period to which it belongs. However, these do not necessarily correspond to the exact climatic peak conditions nor an average of the respective glacial or interglacial stages.
Ice-core processing was conducted in the −20 °C cold laboratory at the University of Bern. The samples were cut using a bandsaw, and the sample fronts and ends were subsequently planed along guide rails to obtain clean ice sticks with a well-defined transition between neighboring bags. The planing was performed in a laminar flow bench (FMS 93, SPETEC, Germany) inside the cold laboratory to minimize potential contamination.
Table 1List of the 18 EDC ice-core bags analyzed in this study. Each sample represents a specific climatic period and typically consists of two consecutive or near-consecutive ice-core bags selected based on stratigraphic and climatic criteria. For each bag, depth, ice age, δD, Ca2+ concentration, and dust particle number concentration are reported. Ice ages were obtained by linear interpolation of the AICC2023 timescale (Bouchet et al., 2023). Values of δD, Ca2+, and dust concentration were averaged over the depth interval of each bag using published datasets (Lambert et al., 2012b; Landais and Stenni, 2021). Missing values are indicated by “–”.
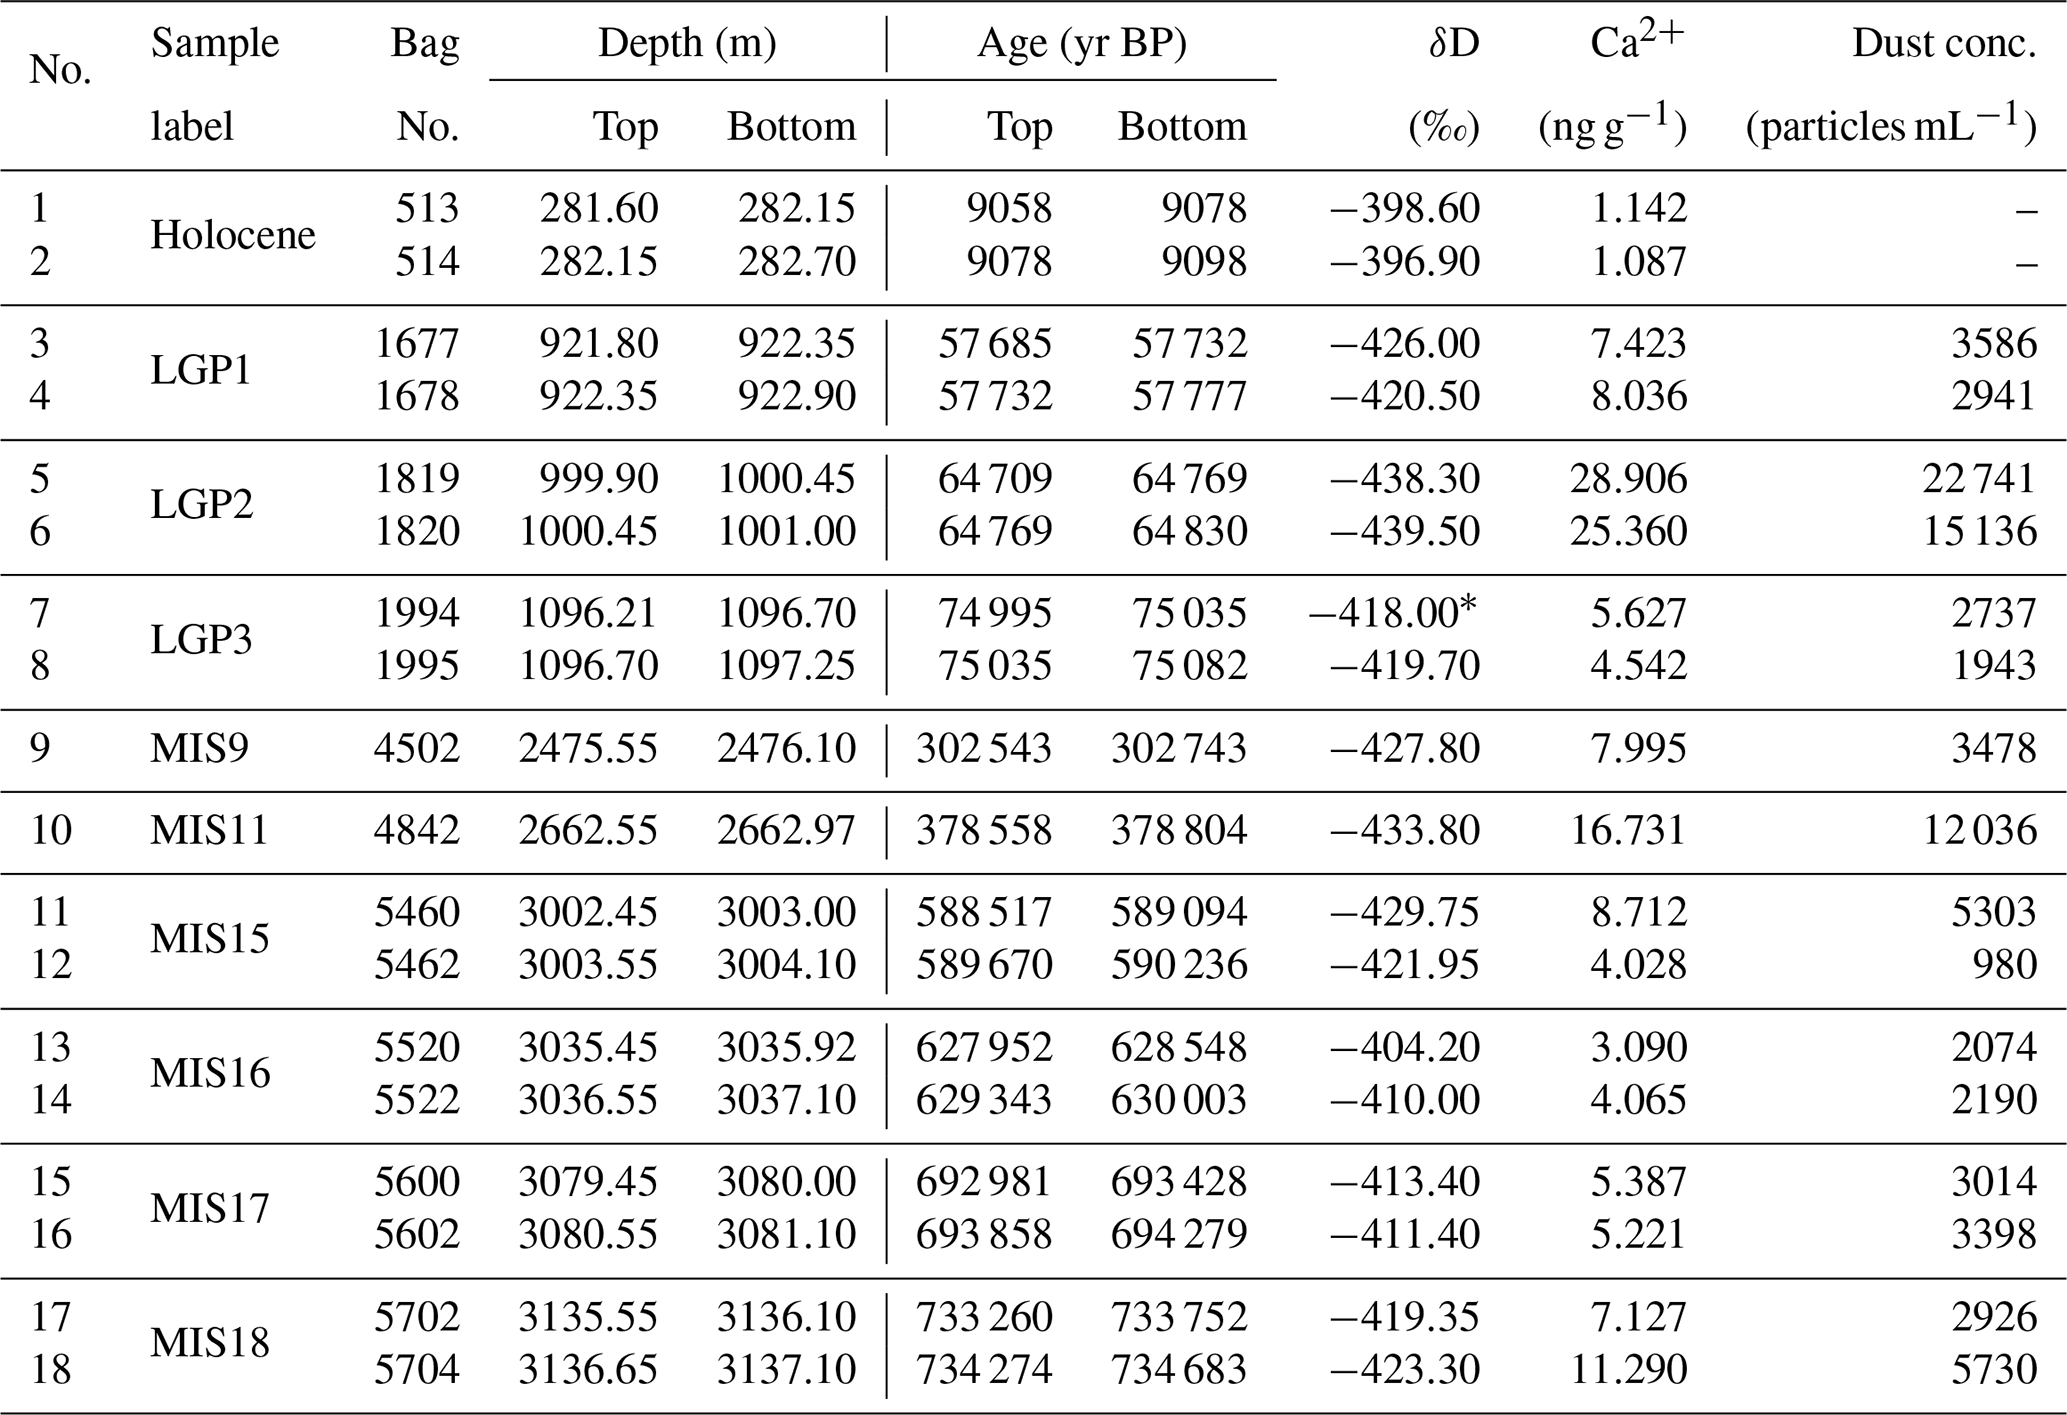
∗ The δD value for bag 1994 corresponds to the nearest available depth (1096.150 m) due to the absence of data at its exact depth. Abbreviations: BP, before present; LGP, Last Glacial Period; MIS, Marine Isotope Stage; AICC, Antarctic Ice-Core Chronology.
2.1.2 CFA system
Melting system and wet-chemistry analysis
The processed 3.4 cm×3.4 cm ice-core sticks were decontaminated using a square gold-coated copper melter head, where only the inner 2.6 cm×2.6 cm are used for trace analysis, the design of which is detailed in Bigler et al. (2011). The volume of ice melted from the clean portion was 18.3 cm3 min−1, which resulted in a meltwater production rate of 16.8 mL min−1. Of this sample flow, 15.5 mL min−1 was delivered via peristaltic pumps to the analytical systems: 1.0 mL min−1 to the sp-ICP-TOFMS and 14.5 mL min−1 to the so-called wet-chemistry system, following the experimental setup described previously (Erhardt et al., 2019, 2022, 2023). A streamlined wet-chemistry system was operated, as a full CFA analysis had already been conducted for the corresponding ice-core depths (Lambert et al., 2008, 2012a; Wolff et al., 2006, 2010; EPICA community members, 2004; Bigler et al., 2010). This setup included two lines: a Ca2+ analysis line operating at 0.9, and a 2.1 mL min−1 line equipped with a laser particle attenuation sensor (Abakus with LDS-12/25 sensor, Klotz, Germany). The fluorescence method for Ca2+ analysis was calibrated using three standard solutions (ranging from 8.3 to 65.6 ppb Ca) prepared from a certified stock (Certipur, Supelco, Germany). The Abakus sensor had not been recalibrated since the last calibration, so this record should be interpreted in terms of relative changes only. Standard solution analysis was performed approximately every 2.5 h (before and after each CFA measurement run) for both Ca2+ fluorescence method and sp-ICP-TOFMS (see below). Detailed descriptions of the analytical modules of the Bern CFA system are available in Kaufmann et al. (2008).
CFA-sp-ICP-TOFMS
A clean meltwater sample containing ∼10 % air was delivered to a tailor-made PTFE micro-volume debubbler via a peristaltic pump (Reglo Analog ISM795, ISMATEC, Switzerland) at a flow rate of 1.0 mL min−1. From there, 320 µL min−1 of the debubbled sample was transported by another peristaltic pump to the sp-ICP-TOFMS (icpTOF R, TOFWERK AG, Switzerland). To minimize dispersion and possible alteration of impurities (e.g., partial dissolution or adsorptive loss) during continuous sample introduction, the tubing configuration was optimized to a total transit time of only ∼115 s between the melter head and the nebulizer.
Before introduction into the sp-ICP-TOFMS through a PFA nebulizer (ES-2040-73, Elemental Scientific, USA), the sample was mixed online at a T-piece with a 5 % () HNO3 internal standard solution containing 2.5 ppb Rh (ISTD). The internal standard solution was prepared from a 1000 ppm Rh stock solution in 2.5 % () HNO3 (Inorganic Ventures, USA) and high-purity nitric acid (Optima grade, Fisher Scientific, USA), and delivered at a flow rate of 80 µL min−1. This resulted in slight acidification for approximately 10 s (yielding a final 1 % () nitric acid solution) and produced a sample containing 0.5 ppb Rh internal standard, which was then introduced into the spray chamber. The addition of the Rh ISTD accounts for instrument-induced signal drift, ensuring greater measurement precision. Additional details on the analytical method of continuous sp-ICP-TOFMS are provided in Erhardt et al. (2019, 2023).
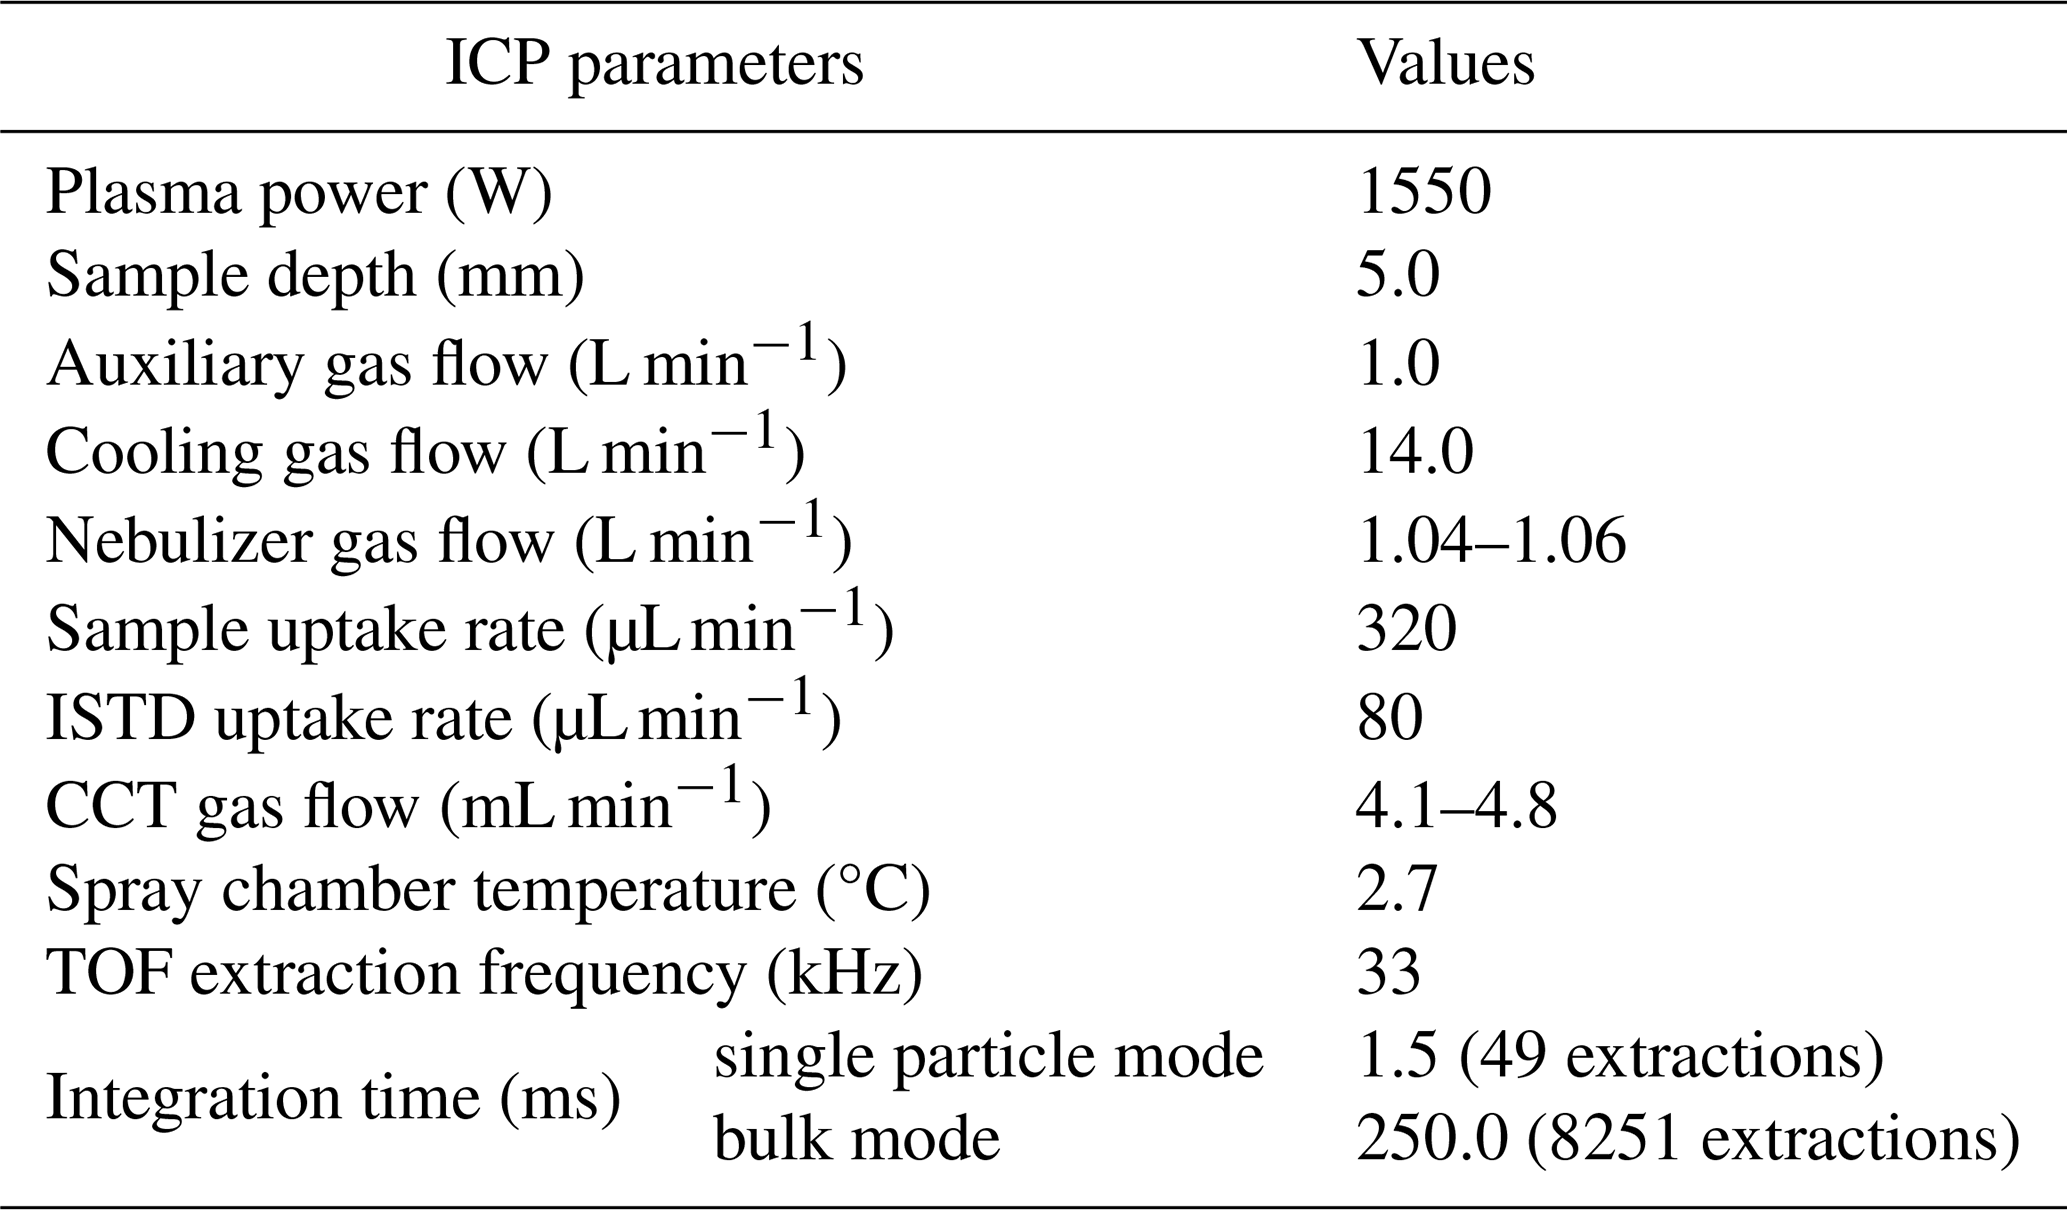
All sp-ICP-TOFMS measurements followed a standardized daily startup and tuning procedure. This included a 30 min stabilization phase during which the ICP-MS system was continuously flushed with a 2 % () HNO3 carrier solution to minimize background signals within the online sample introduction system. After stabilization, time-of-flight mass calibration was performed using a tuning solution (THERMO-4AREV, Thermo Scientific, Germany) containing 59Co, 115In, 140Ce, and 238U as analytes. These isotopes were selected for their broad mass coverage and reproducible response. An integration time of 1.5 ms was used for single-particle data acquisition. The ICP-TOFMS parameters used are detailed in Table 2.
All calibration standard materials were gravimetrically prepared using an analytical balance (ABS 220-4N, KERN & Sohn GmbH, Germany) under a laminar flow bench. Calibration standard details can be found in Sect. B.
Table 2Instrumental parameters used for ICP-TOFMS measurements.
2.2 sp-ICP-TOFMS data processing
Building on the analytical framework developed by Erhardt et al. (2019, 2023), we utilized the sp-ICP-TOFMS integrated into the Bern CFA system to quantify various impurities, including both soluble and insoluble fractions. Our data processing scheme follows a three-stage evaluation: (i) an assessment of elemental mass fraction between particulate and dissolved phases to identify depth-dependent dissolution or precipitation trends; (ii) bin count analysis (see the Sect. 2.2.5) to track relative particle size distributions as evidence for mineral consumption or secondary mineral neoformation; and (iii) a stoichiometric analysis of co-detected elements within the single particle (SP) data to infer specific mineralogical groups.
2.2.1 Single particle (SP) detection
A simplified Poisson distribution-based threshold was applied to distinguish SP signals from dissolved/background signals. The threshold was calculated as , where μbkg represents the mean intensity of the background signal within each window. A detection sensitivity coefficient of a=3.29 (2×k, where k=1.645 corresponds to a one-sided 95 % confidence level) and an offset correction coefficient of b=2.71 (k2) were used, accounting for both false positive (α=0.05) and false negative (β=0.05) errors in threshold-based detection (Currie, 1968). A sliding window approach was implemented using 1000 data points (equivalent to ∼1.5 s), whereby the threshold was calculated dynamically across the time-resolved signal.
The SP detection process was iteratively repeated up to 100 times within the same time window until no further SP signals were detected. After each iteration, the intensities of identified SP signals were excluded from the calculation of the mean background intensity (μbkg) to progressively refine the background estimation. Furthermore, a split-event (SE) correction was applied so that consecutive data points originating from a single SP event were counted as a single particle signal. The maximum bin number for SP SEs was set to five data points to account for natural variability in the shape and size of mineral particles in ice-core samples. While engineered nanoparticles have well-defined, uniform properties and shorter signal durations, natural particles with irregular shapes and polydisperse sizes can produce extended signals that require a higher bin threshold to capture.
Previous studies have demonstrated that incorporating single-ion signal distributions – such as compound Poisson models that account for detector gain statistics – can further enhance the accuracy of SP detection (Gundlach-Graham et al., 2018; Hendriks et al., 2019). Although the full integration of these advanced statistical models remains a subject for future work, the simplified Poisson-based threshold employed here provides sufficient robustness and adequately serves the primary objectives of the present study.
2.2.2 Quantification
Calibration
Classified signals – both particle and dissolved background – were calibrated using liquid calibration standards, as described in Gundlach-Graham (2021). Dissolved signals were converted from counts per second (cps) to concentration values in parts per billion (ppb) based on the liquid sample sensitivity, Sliq, defined in Eq. (1).
where I is the signal intensity and CM is the mass concentration of the analyte element in the sample. Particle signals were translated into mass per particle, expressed in femtograms (fg particle−1), using the absolute sensitivity, Sabs, as described in Eq. (2).
where qplasma is the mass flux of the elemental analyte reaching the plasma, which is largely controlled by the loss of the larger aerosol spray droplets in the spray chamber. This mass flux was determined using the sample transport efficiency, which was estimated by analyzing a gold nanoparticle standard (60 nm Gold Nanospheres, nanoComposix, US) according to the particle frequency method described by Pace et al. (2011).
Internal standardization
Calibration standards measured immediately before and after each ICP run were used to account for slow instrumental drift. For each analyte, time-dependent calibration parameters (sensitivity and baseline) were obtained by linear interpolation between the parameters derived from the bracketing standards. The interpolation weight, fcal(t), was determined using the internal standard signal (103Rh+), which serves as a proxy for the temporal drifts in instrumental state.
If the relative change in the internal standard intensity (IISTD) between bracketing standards was negligible (≤ 0.1 %), fcal(t) was defined as a simple linear function of time. Otherwise, fcal(t) was computed from the low-pass filtered internal standard signal of the ICP run (), normalized by the reference intensities:
This factor was used to calculate time-dependent sensitivities (S(t)) according to:
The baseline offset was estimated identically. However, the internal standard signal remained highly stable (typically within ±3 %) and was used for both calibration and post hoc quality control.
Detector saturation correction
Detector saturation in SP signals was corrected using a multi-isotope calibration approach (Karkee and Gundlach-Graham, 2023). Particle events with simultaneous detection of multiple stable isotopes were evaluated for saturation by comparing measured isotope ratios with their natural abundances (e.g., 54Fe, 56Fe, and 57Fe).
A saturation threshold of 7500 counts per acquisition bin (1.5 ms, ∼ 5 million counts per second) was experimentally defined; below this, no deviation from natural isotopic abundances was observed. Although this threshold is somewhat conservative compared to the saturation limits (∼ 20 million counts per second) reported in previous studies (Harycki and Gundlach-Graham, 2023; Karkee and Gundlach-Graham, 2023), it ensures a strictly linear detector response by accounting for the fact that actual single-particle transient signals are significantly shorter than the acquisition bin, resulting in much higher instantaneous signal densities at the peak apex. For events exceeding this threshold, quantification was performed sequentially using co-detected, lower-abundance stable isotopes until a non-saturated signal was obtained. This correction was applied exclusively to Fe and Ba SP signals where detector saturation was identified in the most intense SP events.
2.2.3 Quality control
Evaluation of detection limits
The limits of detection (LODs) for bulk elemental concentrations at 2.2 s resolution (equivalent to ∼1 mm depth) were determined using the formula , where σblank represents the standard deviation of intensity from 20 s matrix blank measurements. This formula assumes normally distributed ion count rates with a significance level of 0.05 for both false-positive and false-negative errors. This normality assumption is justified by averaging the raw 0.0015 s acquisition data into 2.2 s intervals (each comprising ∼1482 acquisitions), such that the mean ion count rates converge to normality via the Central Limit Theorem. The resulting LODs, alongside representative bulk concentrations for the cleanest (Holocene) and the dustiest (LGP2) ice-core samples, are presented in Fig. C1. Most major crustal elements (e.g., Al, Fe, Ca, Na) consistently remain above the LODs, even in the cleanest samples. In contrast, concentrations of minor elements frequently fall below the LODs in the Holocene samples, but not in dusty glacial samples. Note, however, that these elements may still remain detectable via SP analysis if their particulate signals exceed the SP detection threshold (ThresPoisson) as defined in Sect. 2.2.1.
Signal artifact removal
Interferences related to ice-core quality, such as mechanical breaks or transitions between sample bags, were manually identified and removed. Air bubble formation and sudden flow shifts within the sample transport line due to dust accumulation or mechanical instabilities were cross-checked against measurement logs. Spurious signals caused by instrumental disturbances were excluded.
2.2.4 Inference of mineralogical alterations
Particle mineralogy was inferred primarily from the stoichiometry of candidate mineral formulas. Stoichiometric matches alone, however, cannot unambiguously identify the mineralogy of individual particles, for three reasons: (i) different minerals share common elemental ratios; (ii) elemental substitution within mineral structures scatters elemental signatures; and (iii) sp-ICP-TOFMS does not resolve the full elemental composition of each particle, since SP detection limits are element-specific and additionally depend on the dissolved background and its variability. Definite mineralogical identities were therefore not assigned to individual particles. Instead, changes in particle mineralogy across the 10 climatic intervals were inferred by testing whether the populations of particles co-detected with elemental combinations diagnostic of specific mineral phases changed systematically with depth. In particular, the shallow section (<1100 m) allows climatic and depth-related influences to be separated, as it contains both low-dust Holocene and high-dust Last Glacial samples that differ substantially in dust provenance and mineralogy while spanning only a narrow depth range. Any post-depositional dust alteration would therefore be expected to affect both populations comparably, and to be limited in magnitude at these shallow depths, as reported evidence for such alteration comes from considerably greater depths (Lanci et al., 2020; Lambert et al., 2008). On this basis, we test whether the differences between these two intervals are smaller than the systematic changes observed with increasing depth, which would indicate that depth, rather than climatically driven variability in primary particle composition, governs the observed compositional differences. Stoichiometric constraints were interpreted alongside mineralogical compositions reported for other Antarctic ice cores and geochemically analogous environments, and alongside complementary evidence from particle number concentrations, particle size classification (Sect. 2.2.5), and elemental partitioning between particulate and dissolved phases (Sect. 2.2.6). Combining these independent lines of evidence provides a multi-angle basis for inferring mineralogical alteration (e.g. dissolution and neoformation) in the deep sections of the core.
Qualitative determination of silicate minerals
Given that silicate minerals dominate the Earth's crust, distinguishing silicate from non-silicate particles is essential. However, reliable quantification of Si using sp-ICP-TOFMS with our current setup is hindered by elevated background signals affecting the channel (e.g., from HNO3 and quartz glassware).
We implemented a qualitative identification scheme based on Si SP signal detection. The Poisson-based threshold, described in Sect. 2.2.1, was applied to the 28Si channel, and particles generating transient signals above the statistical background were classified as Si-bearing. This assumes that particles containing sufficient silicon produce detectable signals despite baseline noise. Non-detection does not definitively exclude silicon, making this classification conservative but sufficient for extracting meaningful mineralogical information for those particles in which Si could be detected.
Stoichiometric analysis
Elemental signals of individual particles were converted to molar units and processed with a custom Python pipeline. All pairwise molar ratios among the 22 quantifiable elements (Sect. B) were screened against the stoichiometric compositions of minerals compiled from the Mindat database (Ralph et al., 2025), progressively narrowing the candidate phases. This bottom-up, non-targeted approach avoids restricting the search to previously reported minerals. Particles were binned into the 10 climatic intervals to obtain sufficient counts per bin. Within each bin, all particles containing the relevant elements were retained, irrespective of their proximity to the theoretical stoichiometric line derived from the mineral formula (e.g. Fe:K of 3:1 for jarosite). Intervals above 1100 m were used as the baseline for these comparisons, as post-depositional alteration is not expected to be significant at these depths. Dissolution was inferred where a particle population clustered around the theoretical ratio in the baseline interval became sparser or was no longer discernible at greater depth. Neoformation or preservation of minerals was inferred where the root-mean-square error (RMSE) between measured particle compositions and the theoretical line decreased substantially relative to the baseline, indicating convergence towards the stoichiometric ratio. Because the absolute RMSE depends both on the background composition, which varies between climatic intervals, and on the element pair considered, no fixed RMSE threshold was applied; only the relative change with depth was evaluated. Convergence towards the theoretical line indicates the presence of a compositionally well-defined particle population at that depth, consistent with neoformation of the phase and/or its preservation. Candidate signatures were then tested by co-detection of the remaining elements of the corresponding formula (e.g. Si, Al, Fe and Ca for ferro-hornblende, ) and interpreted alongside the complementary evidence and reported mineralogy introduced at the start of this section. Table 3 lists the targeted minerals and their diagnostic criteria.
Table 3Mineralogical phases targeted in stoichiometric analysis of single-particle elemental compositions. For each phase, the diagnostic elemental ratio, the criterion applied (loss of a particle population around the theoretical ratio for dissolution; reduction in root-mean-square error relative to the theoretical stoichiometric line for neoformation and preservation), and the additional elements used for co-detection verification are listed.

2.2.5 Bin count analysis (BCA)
Standard sp-ICP-MS size estimations assume non-porous, spherical particle geometry and uniform density (Gundlach-Graham, 2021), assumptions that are not totally fulfilled for natural mineral dust (Potenza et al., 2016; Simonsen et al., 2018; Nousiainen and Kandler, 2015). To circumvent this limitation, we introduce BCA as a relative size classification approach that utilizes the number of consecutive acquisition time bins (i.e., consecutive 1.5 ms time slices in the time series) over which individual particle signals are distributed.
The fundamental principle of BCA is that the duration of an isotopic ion signal increases with particle size. This relationship has been confirmed for gold nanoparticles of varying diameters measured by microsecond dwell time sp-ICP-MS under controlled ICP conditions (Fuchs et al., 2018), though signal duration can also vary with plasma thermodynamics (Bogaerts and Aghaei, 2017). Matrices of meltwater from Antarctic inland ice cores are overall very clean (except during extreme stratigraphic events such as volcanic eruptions) yielding stable plasma conditions throughout continuous measurements. Consequently, particle mineralogy and particle size remain the principal determinants of SP signal duration.
The proportions of different bin counts – hereafter referred to as bin-count profiles – were evaluated across depth intervals. The depth-dependent trends observed in elemental number concentrations and particulate mass fractions, including signatures attributable to mineral dissolution and precipitation (see Sect. 3.2), are closely mirrored in the bin-count profiles observed in this study. This strong consistency across analytical parameters suggests that particle size – rather than mineralogical composition – is likely the dominant control on signal duration variability across depth intervals. Accordingly, SP signal duration for each element was used as a proxy for differences in particle size, with mineralogy treated as a secondary source of variability.
Although determining the absolute size of individual particles remains challenging due to multiple influencing factors, analyzing a sufficiently large particle population enables statistically robust evaluation of particle size differences. This size information can be evaluated alongside elemental composition, uniquely bridging high-throughput chemical analysis and morphological interpretation within the same analytical run for the exact same SPs. This capability is particularly valuable for identifying changes in aggregation state, surface adsorption, or substantial particle modification resulting from processes such as partial dissolution or elemental precipitation. BCA thus provides a complementary means of assessing particle characteristics beyond elemental mass alone (code available; see Code and data Availability).
Despite some advantages of BCA, several analytical caveats regarding particle size distribution preservation and element-specific dispersion within the mass spectrometer should be considered. Although factors such as physical losses in the spray chamber, incomplete plasma ionization of large particles, and instrumental diffusion introduce non-linearities, previous literature and theoretical considerations suggest these effects do not compromise the comparative evaluation of particle size differences (Ho et al., 2013; Olesik and Gray, 2012; Fuchs et al., 2018; Lee and Chan, 2015; Lomax-Vogt et al., 2025).
2.2.6 Particulate-to-dissolved mass ratio anomaly analysis
To quantify depth-dependent changes in elemental partitioning between the particulate and dissolved phases, particulate-to-dissolved elemental mass ratios were computed at 9 cm depth intervals by converting ion counts of particulate and dissolved analytes into mass using the absolute sensitivity (Eq. 2). For each element e at depth interval d, the mass ratio Re,d is defined as:
where and denote the particulate and dissolved mass of element e at depth interval d, respectively.
To distinguish anomalous phase partitioning from background geochemical variability, each ratio was normalized to the median ratio estimated from shallow ice-core sections (depth <1100 m). These shallow sections span both glacial and interglacial periods and are assumed to represent a geochemical baseline unaffected by significant post-depositional modification. The resulting anomaly index Ae,d is expressed as:
where is the median of Re,d over all reference depth intervals. A value of indicates no deviation from the reference state; values exceeding 1 denote relative enrichment in the particulate phase, whereas values below 1 indicate relative enrichment in the dissolved phase.
2.3 Wet-chemistry data processing
CFA wet-chemistry data were processed in four steps: (i) processing calibration standards, (ii) calibrating measurements, (iii) assigning depth to time-series data, and (iv) performing quality control. Calcium data underwent all four steps, whereas laser particle sensor data were processed only for depth assignment and quality control as they tracked relative variability. Consistent Ca2+ calibration curves demonstrated robust and highly reproducible measurements (R2≈1). Detailed processes including calibration and depth assignment can be found in Kaufmann et al. (2008) and Erhardt et al. (2019, 2022, 2023).
3.1 Particulate dust and its englacial changes
3.1.1 Climate-driven dust
We examined average particle number concentrations (PNCs) and their relationship with reconstructed temperature (Jouzel and Masson-Delmotte, 2007) across 10 representative climate intervals. Elements were ranked by their particle count, hereafter referred to as abundance, among detectable crustal elements as determined by sp-ICP-TOFMS. The eight most dominant elements were Fe, Si, Al, K, Mn, Na, Mg, and Ca, in order of decreasing abundance. For each element, we compared its elemental PNC with optically measured PNCs from a laser particle sensor (Abakus) and with corresponding temperature data (top panel, Fig. 1). As expected from dust particle number counts (Lambert et al., 2008, 2012a), the results show a strong inverse correlation between elemental PNCs and temperature anomaly ( and −0.95 for log-transformed Fe-and Si-bearing PNCs, respectively; p<0.001, n=10), with higher PNCs occurring during colder periods, consistent with previous findings (Kutuzov et al., 2026). The high mean pairwise correlation coefficient among the PNCs of the eight elements (r=0.95) suggests a shared source, consistent with enhanced dust emission, transport, and deposition during colder, drier climatic phases (Delmonte et al., 2002, 2007; Fischer et al., 2007; Kutuzov et al., 2026). Log-transformed PNCs measured by the Abakus sensor also show an inverse correlation with temperature anomaly (), consistent with our elemental PNC measurements, though the correlation is notably weaker. This discrepancy is mainly attributable to two deep samples below 3000 m depth (MIS 16 and MIS 18), which uniquely exhibit the largest vertical offsets exceeding a 2.5-fold deviation () from the general trend (top panel, Fig. 1). Upon excluding these two samples, the correlation coefficient between the temperature anomaly and log-transformed optical dust PNCs strengthens to −0.85 (p=0.007), more closely matching the elemental PNC records. Furthermore, under the same exclusion, log-transformed optical dust PNCs are also strongly correlated with log-transformed Fe-, Si-, and Al-bearing PNCs (r≈0.9). These observations suggest that in the deepest ice layers, optical PNCs diverge from the robust temperature–dust inverse relationship observed in shallower sections, implying the involvement of non-climatic factors. Given that sp-ICP-TOFMS has limited detection efficiency for particles larger than ∼2 µm (Ebdon et al., 1990; Goodall et al., 1993; Laborda et al., 2023; Lomax-Vogt et al., 2025) (due to poor transport efficiency and incomplete ionization) and that these deviations are only observed in deep samples, this pattern is likely the result of post-depositional particle aggregation, which becomes noticeable below 2900 m depth (Delmonte, 2003; Lambert et al., 2008). Along the same lines, the elevated dust concentrations detected by the laser sensor in deep glacial ice stem from englacial alteration, whereby originally sub-detection-threshold species evolve into detectable particulate sizes (>1 µm) via processes such as aggregation or precipitation. This process artificially inflates dust concentrations in deep ice, thereby weakening the expected dust–temperature correlation (top panel, Fig. 1). This phenomenon, previously noted in EDC CFA records (Lambert et al., 2008), is reconfirmed by our study.
3.1.2 Source-driven elemental composition
The elemental compositions of the identified particles reflect the varying dust sources contributing to the atmospheric dust load over the drilling site at the time of deposition. The eight most predominant elements by number in our ICP data (Fe, Si, Al, K, Mn, Na, Mg, and Ca) are all major components of the Earth's crust, regardless of the climatic period. This confirms that, as commonly found in Antarctic ice cores, the vast majority of insoluble impurities have a crustal source (Ghermandi et al., 2003; Delmonte et al., 2002; Fischer et al., 2007). It is important to note that the relative elemental abundances in detected particles can differ from bulk continental crust abundances due to the varying sensitivities, background noises, dissolved background concentrations, and natural isotopic abundances inherent to sp-ICP-TOFMS, as well as the natural variability in elemental composition of dust. For example, Fe-bearing particles appear more predominant by number than Si- or Al-bearing particles in our data due to the lower dissolved background for 56Fe (typically sub-ppb) and its significantly greater analytical sensitivity (∼30 counts fg−1) compared to 28Si (which is subject to elevated background noise as described in Sect. 2.2.10) and 27Al (background ∼ several ppb; ∼1.2 counts fg−1). Nonetheless, because these instrumental detection capabilities remain consistent, the relative particle detection frequencies can reliably serve as fingerprints to track shifts in dust provenance, consistent with other dust provenance studies using elemental signature (Gabrielli et al., 2005, 2010; Marino et al., 2008; Wegner et al., 2012).
Interestingly, we observe a depth-dependent shift in particle mineralogy. In the bottom panel of Fig. 1, the relative counts of K-bearing particles (pink triangles) to the total particles identified in the eight major elements increase significantly with depth, while those of Al-bearing particles (green squares) exhibit a concurrent decline. Below ∼2400 m, the counts of K-bearing particles outweigh those of Al-bearing particles, marking a distinct shift in the deep-ice dust composition. This shift in the composition of major crustal elements cannot be interpreted as a primary climate signal; elements like Al and K are too ubiquitous across potential source regions (e.g., South America and Australia) to fractionate atmospherically to the extent that K becomes more predominant than Al. In contrast, this shift is likely driven by englacial geochemical processes – specifically, the dissolution of Al-bearing phases and the precipitation of K-bearing phases. This hypothesis is supported by the increasing trend in the dissolved elemental mass ratio of Al to K (inverted triangles in middle panel, Fig. 1).
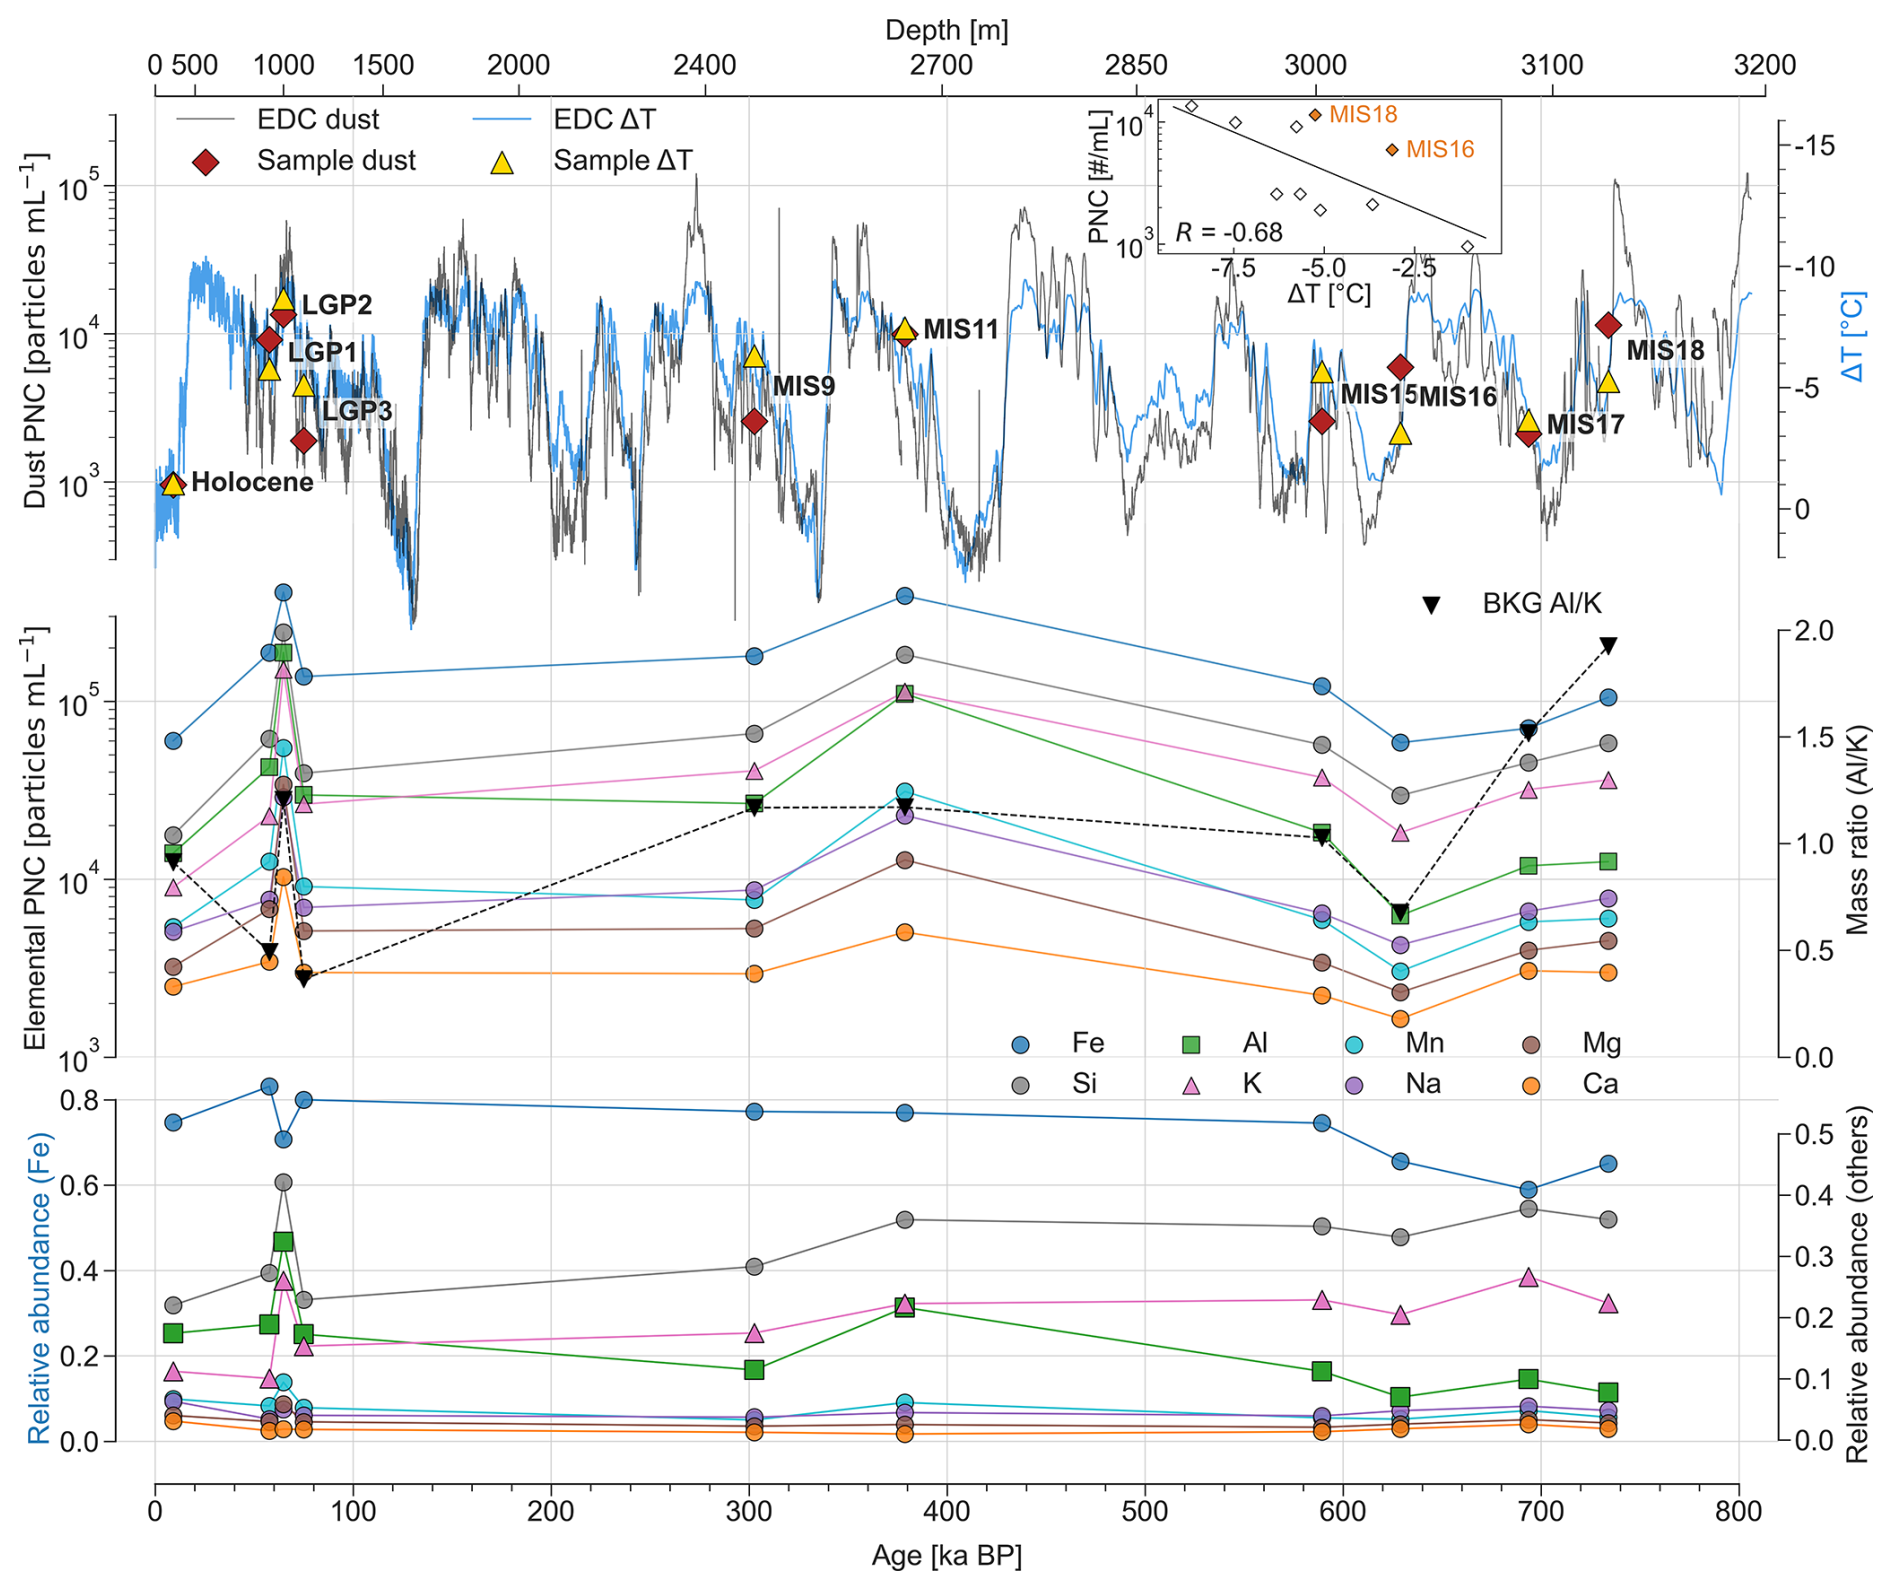
Figure 1Particle number concentrations (PNCs) of super-micron dust (top panel) and major element-bearing predominantly sub-micron dust particles (middle panel), and their relative abundance (bottom panel) across selected climatic intervals from the EPICA Dome C (EDC) ice core. Top: Super-micron dust PNCs measured with the Abakus laser sensor (red diamonds) agree well with the continuous EDC CFA dust record measured more than 20 years ago with the same instrument (black line; Lambert et al., 2012b). The EDC temperature anomaly record relative to the past millennium average (Jouzel and Masson-Delmotte, 2007) is shown in blue with the temperature anomaly for each sample highlighed by yellow triangles. Sample ages were determined by linear interpolation of the AICC2023 age–depth relationship (Bouchet et al., 2023) to the midpoint of each sampled interval, and sample temperature anomalies were calculated as interval means from the continuous temperature record. For comparison, the continuous temperature and dust records were smoothed to an effective 110 cm resolution using centered sliding mean and median filters, respectively. Middle: PNCs of eight major element-bearing particle types (Fe, Si, Al, K, Mn, Na, Mg, and Ca), measured by sp-ICP-TOFMS, are shown as colored symbols, together with the background mass ratio (black inverted triangles; dashed line). Bottom: The relative abundance follows the same color scheme and was calculated by dividing each elemental PNC by the total particle detections across all eight elements. The lower x axis shows age on the AICC2023 timescale, and the upper x axis shows stratigraphic depth. The inset in the top panel shows the linear relationship between temperature anomaly (ΔT) and logarithmic super-micron dust PNC for the ten samples analysed in this study (r=−0.68). The deepest intervals (MIS16 and MIS18; orange diamonds) deviate from the general trend, likely indicating dust alteration in the deep ice. Abbreviations: LGP, Last Glacial Period; MIS, Marine Isotope Stage; BKG, background; BP, Before Present.
3.2 Post-depositional geochemical alteration in deep ice
The depth-dependent shifts in the relative abundances of major crustal elements between the particulate and dissolved phases provide strong evidence of post-depositional alteration within the ice. In this section, we thoroughly investigate this englacial mineral alteration leveraging the unique capabilities of sp-ICP-TOFMS, which allows for both quantitative (number, size, and mass) and qualitative (mineral identification based on elemental stoichiometry) evaluation of individual particles.
3.2.1 Dissolution of mineral phases
Analysis of particulate-to-dissolved mass-ratio anomalies reveals pervasive dissolution for most analytes below 2400 m, with the notable exception of elements such as Fe, I, As, and Pb, which exhibit enrichment in the particulate phase (Fig. 2). Within this general dissolution trend, elements exhibit varying degrees of enrichment in the dissolved phase. For example, Al shows high enrichment in the dissolved phase (indicated by blue hues in Fig. 2) in deep ice, whereas K shows comparatively low dissolved enrichment. This differential dissolution explains the shift in particle relative abundance noted in Fig. 1: while both Al and K in dust particles undergo net dissolution, K is lost to a lesser extent, resulting in a relative increase in K-bearing particles. A specific interval at ∼2662.6 m shown in Fig. 2 exhibits high particulate mass ratios for Na, Mg, Al, and K against the broader dissolution trend; this is a “cloudy band” driven by localized, specific chemical conditions (Gow and Williamson, 1976; Faria et al., 2014; Lunga et al., 2014; Stoll et al., 2021, 2023). Note also in Fig. 2 that the depth-dependent particle loss pattern is also prevalent among trace elements, including the rare Earth elements (REEs).
This wide-ranging dissolution is further corroborated by particle size comparisons derived from bin-count profiles, as indicated by BCA results (Fig. 3). For most elements (e.g., Al, Ca, Na), which show a particle depletion in Fig. 2, the proportion of large particles spanning more than two acquisition bins (Bin 2+) decreases with depth, while the proportion of small particles (Bin 1) increases. Furthermore, the proportion of medium-sized Al-bearing particles (Bin 2) drops by a factor of 1.7 between shallow (<1100 m) and deep (>3000 m) sections (16.8 % to 9.7 %). However, the proportion of medium-sized Ca particles drops dramatically from 7.2 % to nearly zero in deep ice. This suggests that elements experiencing less extreme dissolution (like Al) may retain a small population of larger particles.
To confirm the dissolution of primary aluminosilicates (e.g., hornblende), as previously reported in the Talos Dome ice core (TALDICE) (Baccolo et al., 2021a), we conducted a mineral-specific stoichiometric investigation. Aluminosilicate particles co-detected with Al, Fe, Ca, and Si are presented in 2D histograms mapping molar against for each depth (Fig. 4). In shallow sections (<1100 m), these particles are widely distributed across Al:Ca ratios of 1:3 to over 3:1, with a dominant cluster at 3:1 (totaling hundreds to thousands of particles depending on the climate period). In deep sections (>3000 m), this dominant Al-rich cluster nearly vanishes, and the number of co-detected Al–Ca–Fe particles plummets to a few tens, representing a roughly 0.1 % fraction of the total number of silicate dust particles (Fig. 4). This marked reduction confirms that hornblende-like silicate minerals undergo signficant dissolution in the deeper EDC sections. The same pattern emerges when particles are selected on Al–Ca–Si alone, without requiring Fe co-detection (Fig. D1), corroborating the previously reported dissolution of Ca-plagioclase (Eichler et al., 2019; Table A1). Note that Fe is detected in most particles, so this selection is only partly independent of that in Fig. 4. The inferred initial compositions (Al:Ca molar ratios of ∼3) are broadly consistent with the Upper Continental Crust (UCC), which has an average molar ratio of ∼2.9 (Lide, 2006). This supports the interpretation that long-range transported dust initially reflects UCC signatures before undergoing severe dissolution in deep ice.
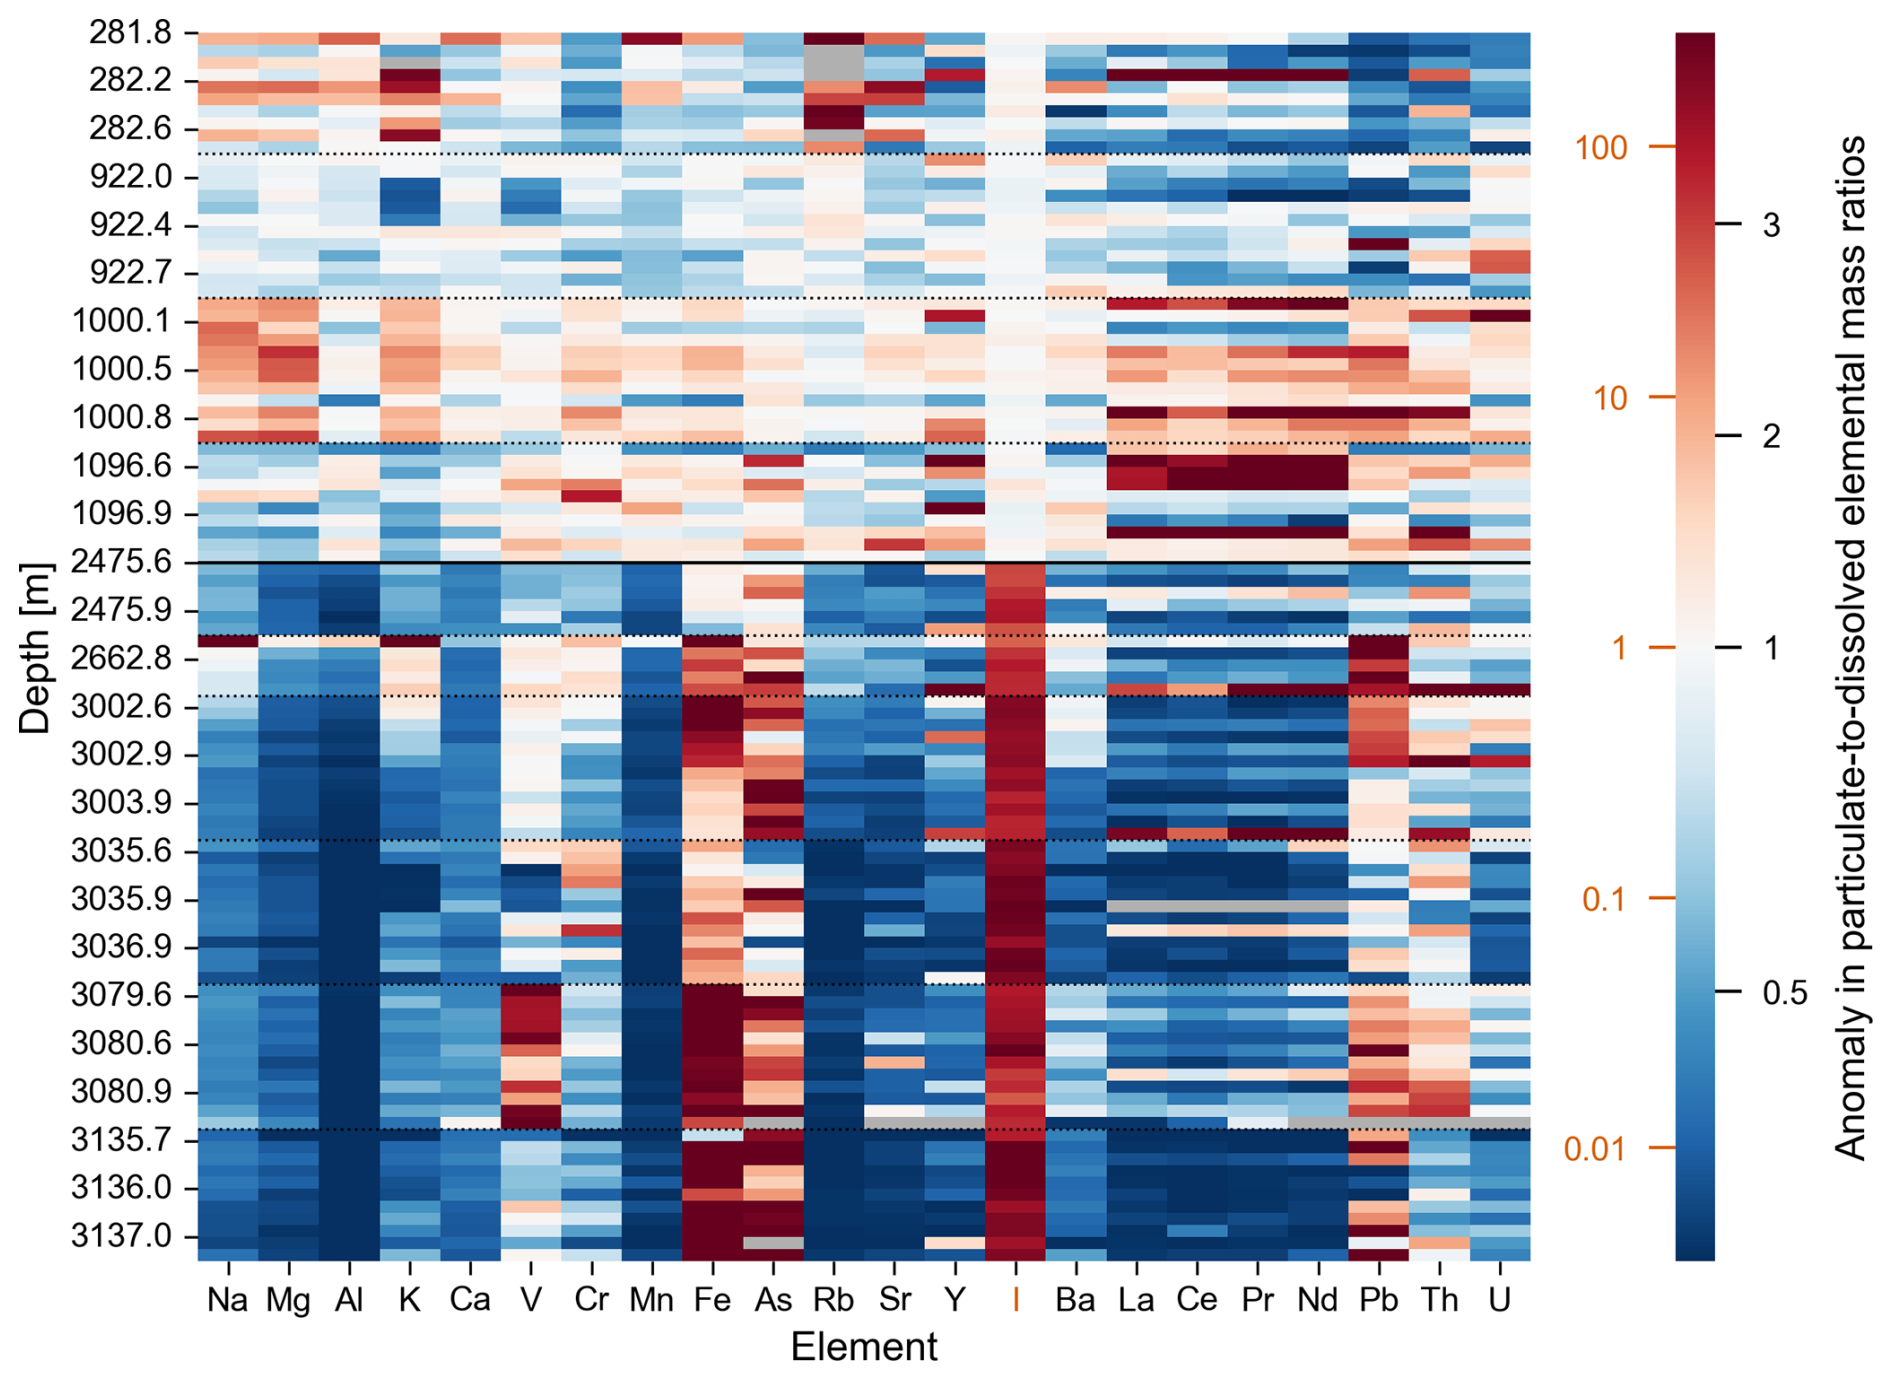
Figure 2Anomalies in particulate-to-dissolved elemental mass ratios, resolved at 9 cm depth intervals and normalized to the median mass ratios of shallow ice bags (<1100 m). Values of 1 (white) denote no anomaly; values exceeding 1 (reds) indicate enrichment in the particulate phase; and values below 1 (blues) indicate enrichment in the dissolved phase. The iodine color scale is displayed on a logarithmic scale indicated by the orange numbers attached to the color bar. The depth axis represents discrete ice-core bag intervals (separated by horizontal lines: dotted for each climatic period; solid for the 1100 m shallow–deep transition) rather than a continuous depth record. Missing values are indicated in grey.
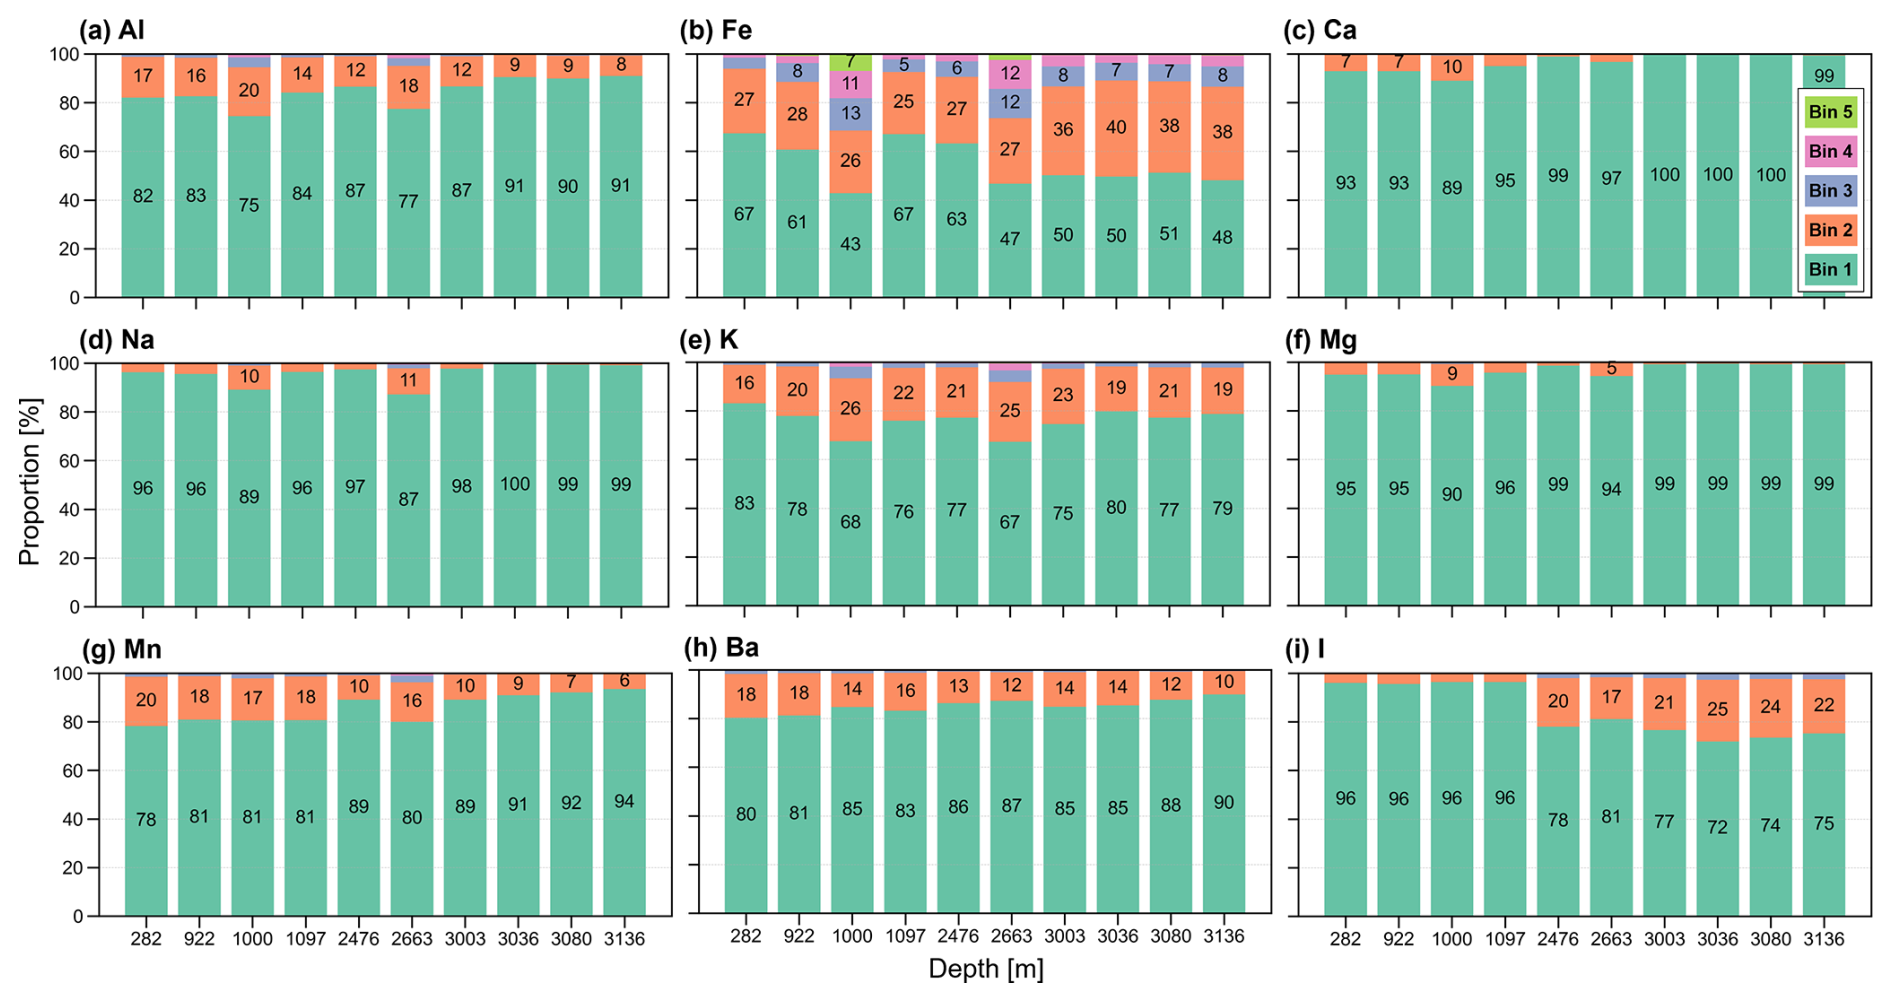
Figure 3Bin-count profiles of (a–h) particles of major crustal elements (Al, Fe, Ca, Na, K, Mg, Mn, and Ba) and (i) iodine-bearing particles with depth. Each stacked bar shows the proportion of particles classified by the number of TOF acquisition bins occupied by their single-particle transient signals during sp-ICP-TOFMS analysis, where bin count serves as a proxy for signal duration. Reported depths correspond to the mean depth of the selected interval(s), rounded to the nearest integer.
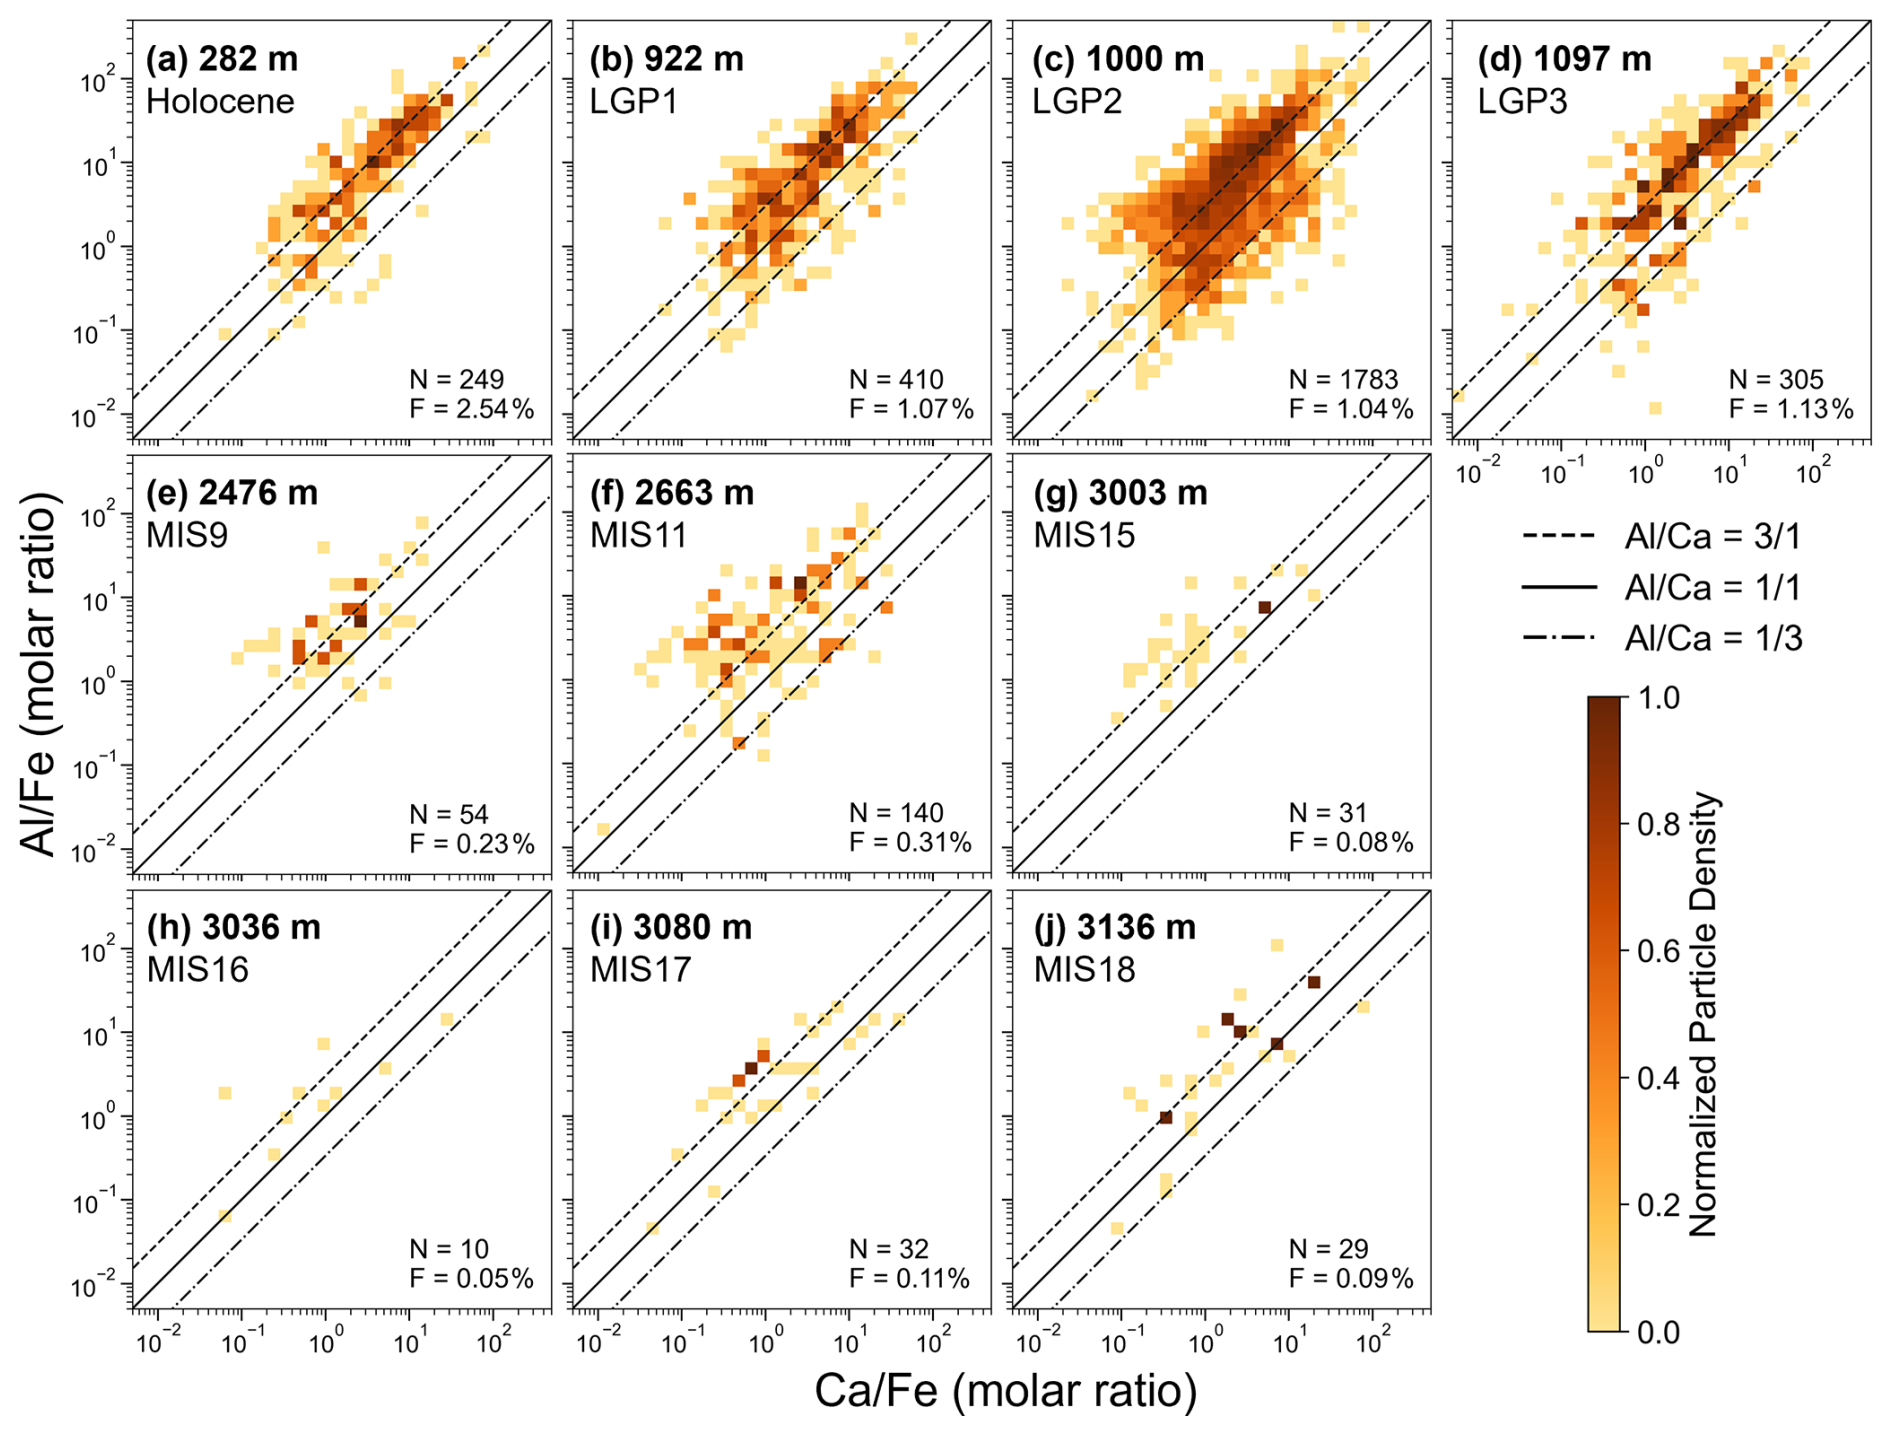
Figure 4Elemental molar ratios of versus of silicate dust particles found across 10 climate intervals (a–j), ranging from 282 to 3137 m in the EDC ice core. Each interval corresponds to the rounded mean depth of two consecutive ice-core bags or a single bag, indicating its stratigraphic position. The three reference lines denote Al:Ca molar ratios of 3:1, 1:1, and 1:3. The color of each pixel represents the normalized particle number density (number of Al–Ca–Fe co-detected silicate particles per bin maximum value per bin). The total number of co-detected particles (N) and their number fraction relative to the total number of silicate dust particles (F) are shown at the bottom of each panel.
3.2.2 Neoformation of secondary minerals and formation of aggregates
While most elements display trends well explained by dissolution processes, several (Fe, K, I, As, and Pb) exhibit distinct behaviors (Figs. 1, 2, and 3), which are compatible with participation in the englacial precipitation of secondary minerals. Based on elemental mass ratio anomalies (Fig. 2), iron, iodine, and possibly arsenic and lead consistently exhibit enrichment in the particulate phase (net precipitation) below 2400 m. Furthermore, the bin-count profiles (Fig. 3) show clear size increases for particles containing iron or iodine. Interestingly, K-bearing particles – which experienced net mass dissolution – show neither a clear decrease nor an obvious increase in BCA size. This suggests that while primary K-bearing phases dissolve, a stable proportion of large K-bearing particles is maintained through secondary mineral neoformation.
Jarosite () has been proposed as a cementing agent driving dust aggregation in the TALDICE ice core (Baccolo et al., 2021a). Jarosite has not yet been identified in interior East Antarctic before, however, our BCA results (showing the conservation of large K-bearing particles) support the hypothesis that it acts as a cementing agent also in the EDC core. We investigated jarosite neoformation using the reliably quantifiable 3:1 molar ratio of Fe to K according to the jarosite stoichiometry. Figure 5a reveals a progressive clustering of individual particles along this 3:1 ratio with increasing depth. In shallow sections (<1100 m, purple data points), particles are scattered across a wide range of Fe:K ratios, reflecting diverse primary mineralogies. However, as depth increases, particles increasingly align along the 3:1 stoichiometric line. This convergence is supported by a 45 % reduction in RMSE between individual particle compositions and the 3:1 stoichiometric line for ice deeper than 3000 m compared to ice shallower than 1100 m. This indicates that diverse Fe- and K-bearing minerals are progressively transformed into jarosite via englacial dissolution and subsequent precipitation.
Because jarosite is part of the alunite supergroup (AB3(TO4)2(OH)6) and shares close crystal-chemical affinities with alunite (KAl3(SO4)2(OH)6), these phases frequently co-occur in acidic, sulfate-rich environments such as acid sulfate soil, acid mine drainage, hypersaline lakes, and Martian terrain (Grigg et al., 2024; Jambor, 1999; Buriti et al., 2025; Ehlmann et al., 2016). Stoichiometric analysis of alunite () reveals a similar gradual formation of alunite particles with depth (Fig. 5b) and supports the morphological suggestion proposed by Lanci et al. (2026).
Recognizing their likely co-existence as mixed cementing agents (Keith et al., 1980; Long et al., 1992a, b; Papike et al., 2006), we further investigated particles co-detected with K, Al, and Fe using the stoichiometry of a jarosite–alunite assemblage (). Evaluation of this mixed stoichiometry (Fig. 5c) substantially reduces the excess potassium scatter observed in the individual jarosite and alunite plots (Fig. 5a, b), bringing the data into much closer agreement with the theoretical 3:1 reference line. This is reflected in a 39 % reduction in RMSE between individual particles and the stoichiometric line in the deep ice-core datasets compared to that in the shallow datasets. This suggests that a substantial fraction of the neoformed phases comprise both jarosite and alunite components rather than a pure end-member composition. High inter-element co-detection rates further support this: below 2400 m, 93 % of alunite-like particles contain a particulate Fe signal, and 32 % of jarosite-like particles contain a particulate Al signal (the relatively low Al co-detection is likely due to its ∼25-fold lower instrumental sensitivity and higher dissolved background concentration compared to Fe as discussed in Sect. 3.1.2). Importantly, 73.8 % of these mixed alunite–jarosite-like particles also contain a particulate Si signal, demonstrating their role in agglomerating remaining silicate particles. Si-bearing particles remain the second most abundant elemental group (after Fe-bearing) across all samples (bottom panel, Fig. 1), indicating that a substantial silicate population persists and remains available for agglomeration.
However, we cannot completely rule out the contribution of primary or secondary aluminosilicate minerals with an Al:K ratio of , such as illite and muscovite (KAl2(AlSi3O10)(OH)2). Illite exhibits high chemical stability even under strongly acidic, low-temperature conditions (Köhler et al., 2003), and muscovite is one of the most weathering-resistant common silicates, surpassed only by quartz (Goldich, 1938). This exceptional stability stems from the absence of oxidizable structural transition metals (e.g., Fe2+), the oxidation of which typically destabilizes the mineral lattice. Accordingly, under strongly acidic conditions (pH ∼1 to 4), illite dissolves only ∼10 % at 5 °C (Köhler et al., 2003), and muscovite dissolves approximately two orders of magnitude more slowly than Fe- and Mg-bearing trioctahedral micas (Wilson, 2004). This interpretation is supported by our observation that the relative detection frequency of Si-bearing particles, expressed as a fraction of the total particle population, increases in the deeper section (lower panel, Fig. 1), as would be expected if such resistant phases persisted while more labile constituents were removed. It should be noted, however, that this comparison most strictly applies to Fe-poor aluminosilicates; Fe-bearing compositions may be more susceptible to oxidative acidic alteration, because structural Fe can act as a redox-active site that promotes lattice destabilization, as described in Baccolo et al. (2021a). Furthermore, illite and muscovite are thermodynamically linked to alunite through equilibrium reactions in the K–Al–Si–SO4 system (Stoffregen et al., 2000), indicating that those phases may coexist under certain conditions. Therefore, residual or authigenic Fe-poor aluminosilicates incorporated within these aggregates may also contribute to the observed stoichiometric signature. Although the strong depth-dependent convergence, the frequent co-occurrence of jarosite and alunite in geochemically analogous environments, and the morphological evidence suggestive of alunite within a dust aggregate from another Antarctic ice core (Roosevelt Island Climate Evolution project (RICE) ice core; Lanci et al., 2026) – but without co-identified jarosite – collectively support the interpretation of secondary jarosite–alunite co-precipitation, this does not represent a definitive identification. The inherent compositional complexity of dust aggregation complicates identification based solely on stoichiometric relationships, even at the single-particle level. These inferences should therefore ultimately be validated by direct micro-analytical measurements such as micro-Raman spectroscopy, X-ray diffraction (XRD), and synchrotron spectroscopy (Svensson et al., 2000; Stoll et al., 2022; Baccolo et al., 2021b).
An anomalous observation in the BCA data is that, among the elements involved in alunite–jarosite neoformation, only Fe exhibits significant size growth, whereas Al and K do not. If secondary sulfate neoformation were the sole driver of size growth, Al and K should mirror the Fe trend. Instead, we hypothesize that surface coating by secondary iron (oxyhydr)oxides is, at least in part, responsible for the growth in Fe particle size. Despite their distinct thermodynamic stability fields, ferric (oxyhydr)oxides and jarosite commonly co-occur in acidic, oxidative environments (Papike et al., 2006; Baccolo et al., 2021b; Long et al., 1992a, b; Keith et al., 1980; Lanci et al., 2026). Indeed, needle-like goethite crystals coating micron-sized aggregates have been identified in EDC bottom ice (>3200 m) through microscopic observation and diffraction analysis (de Angelis et al., 2013), as subsequently confirmed by Lanci et al. (2026). Nonetheless, we cannot completely rule out a significant contribution of residual Fe-(oxyhydr)oxides agglomerated into aggregates to the observed size anomaly in the BCA data, although no pronounced excess Fe was identified in Fig. 5.
Within individual grains, the coexistence of jarosite and ferric (oxyhydr)oxides records a fluid chemistry that changed over time, and thus constrains the chemical conditions of englacial fluids (Lanci et al., 2026). Jarosite neoformation requires highly acidic (pH ∼2–3) and oxidizing conditions, whereas ferric (oxyhydr)oxides become stable once the fluid is neutralized above pH ∼4 (Stoffregen et al., 2000; Elwood Madden et al., 2004, 2012). The presence of both phases therefore implies that the pH traversed spanned at least the interval from ∼2–3 to above ∼4, and possibly a wider range, without fixing the direction of the path. Whether this interval is traversed in time or spanned in space depends on how uniform the englacial microenvironments are. Sulfur is distributed unevenly at the micro-scale in polar ice, from early cryo-SEM–EDX and Raman observations to recent LA-ICP-MS imaging (Mulvaney et al., 1988; Wolff et al., 1988; Cullen and Baker, 2000; Bohleber et al., 2025), so neighboring grains are unlikely to share a common fluid composition or to sit at the same point of the cycle in Fig. 6 at any given time. Taken together, the grains are thus better read as a population of grains distributed across that cycle than as a single fluid evolving in step, placing the bracketed pH interval across space as well as time. Our particle-scale observations therefore extend the picture of chemical heterogeneity from solutes to the mineral phases themselves, although in situ characterization remains necessary to constrain the actual pH values involved.
Iodine-bearing particles also exhibit a pronounced increase in both particulate mass ratio and particle size between 1097.3 and 2475.6 m, indicating a major shift in iodine partitioning. This shift is best explained by the adsorption of dissolved iodine species. In polar ice, iodine occurs predominantly as soluble iodide (I−) and iodate (), depending on redox conditions (Spolaor et al., 2013a; Frassati et al., 2024; Brown et al., 2025). Because iodate adsorbs strongly onto Fe- and Al-(oxyhydr)oxide surfaces, and iodide can also adsorb under acidic conditions (Kaplan et al., 2000; Nagata et al., 2009; Nagata and Fukushi, 2010; Li et al., 2017; Wang et al., 2019), the acidic environment of deep ice likely promotes iodine uptake by secondary minerals. Under these conditions, protonation of both oxygenated and hydroxylated mineral surfaces generates positively charged sites, consistent with the high points of zero charge (PZC) of goethite (8.4), magnetite (6.6), hematite (7.2), and jarosite (7.8) (Kosmulski, 2009; Gao et al., 2020), while oxidative conditions may further promote iodine uptake by converting iodide to triiodide (Kim et al., 2016, 2019).
We therefore propose that soluble iodine species adsorb onto secondary minerals, such as jarosite, alunite, and iron (oxyhydr)oxides, in deep ice. This interpretation is supported by experimental evidence regarding the freeze concentration effect, a process mechanistically analogous to the localized concentration during ice crystal growth in ice cores. Previous studies have shown that this effect accelerates the abiotic oxidation of halides (Kim et al., 2016; Ahn et al., 2025) and enhances the adsorption of iodine species onto iron oxide surfaces (Kim et al., 2019). The resulting oxidized iodine species, together with any remaining iodide and iodate, can be immobilized on mineral surfaces through electrostatic attraction and surface complexation, a process widely observed in groundwater systems (Wang et al., 2019; Li et al., 2017). This mechanism directly explains the high co-detection frequencies of iodine with jarosite-like (52 %), alunite-like (39 %), and mixed (41 %) particles, indicating that mineral–surface interactions drive the transformation of soluble iodine into stable particulate phases within this depth interval.
Finally, the apparent tendency of arsenic and lead to slightly increase in the particulate phase (Fig. 2; average bag-mean particulate mass fractions increased from 67 % and 50 % below 1100 m to 74 % and 54 % above 2400 m, respectively) likely reflects the well-documented scavenging capacity of the alunite–jarosite group. Minerals such as beudantite (PbFe3AsO4SO4(OH)6) and plumbojarosite (PbFe6(SO4)4(OH)12) readily form under similar acidic, sulfate-rich, and oxidizing conditions (Stoffregen et al., 2000; Cruells and Roca, 2022; Bari et al., 2024), and this immobilization mechanism is widely exploited in industrial hydrometallurgy (Aguilar-Carrillo et al., 2018; Buriti et al., 2025; Grigg et al., 2024). Thus, reactive As and Pb released in acidic micro-zones were likely sequestered during secondary mineral neoformation.
This complex phase partitioning has important implications for paleoenvironmental reconstructions based on elemental analysis on deep ice cores. Because elements like iron, iodine, and arsenic shift between dissolved and particulate phases depending on depth and redox state, analytical recoveries (e.g., ICP ionization efficiencies and spray chamber transport efficiencies) can change substantially, thereby complicating accurate quantification of total element and fractions for each phase (Gaspari et al., 2006; Rhodes et al., 2011; Koffman et al., 2014; Flores et al., 2020; Humphrey et al., 2018; Oliveira et al., 2010). Careful methodological adjustments are required to ensure consistent recovery when analyzing these trace elements in deep ice. We acknowledge that similar phase-dependent analytical biases may also affect our dataset; however, given the consistent analytical protocol, these effects are unlikely to be large enough to alter the main patterns observed here.
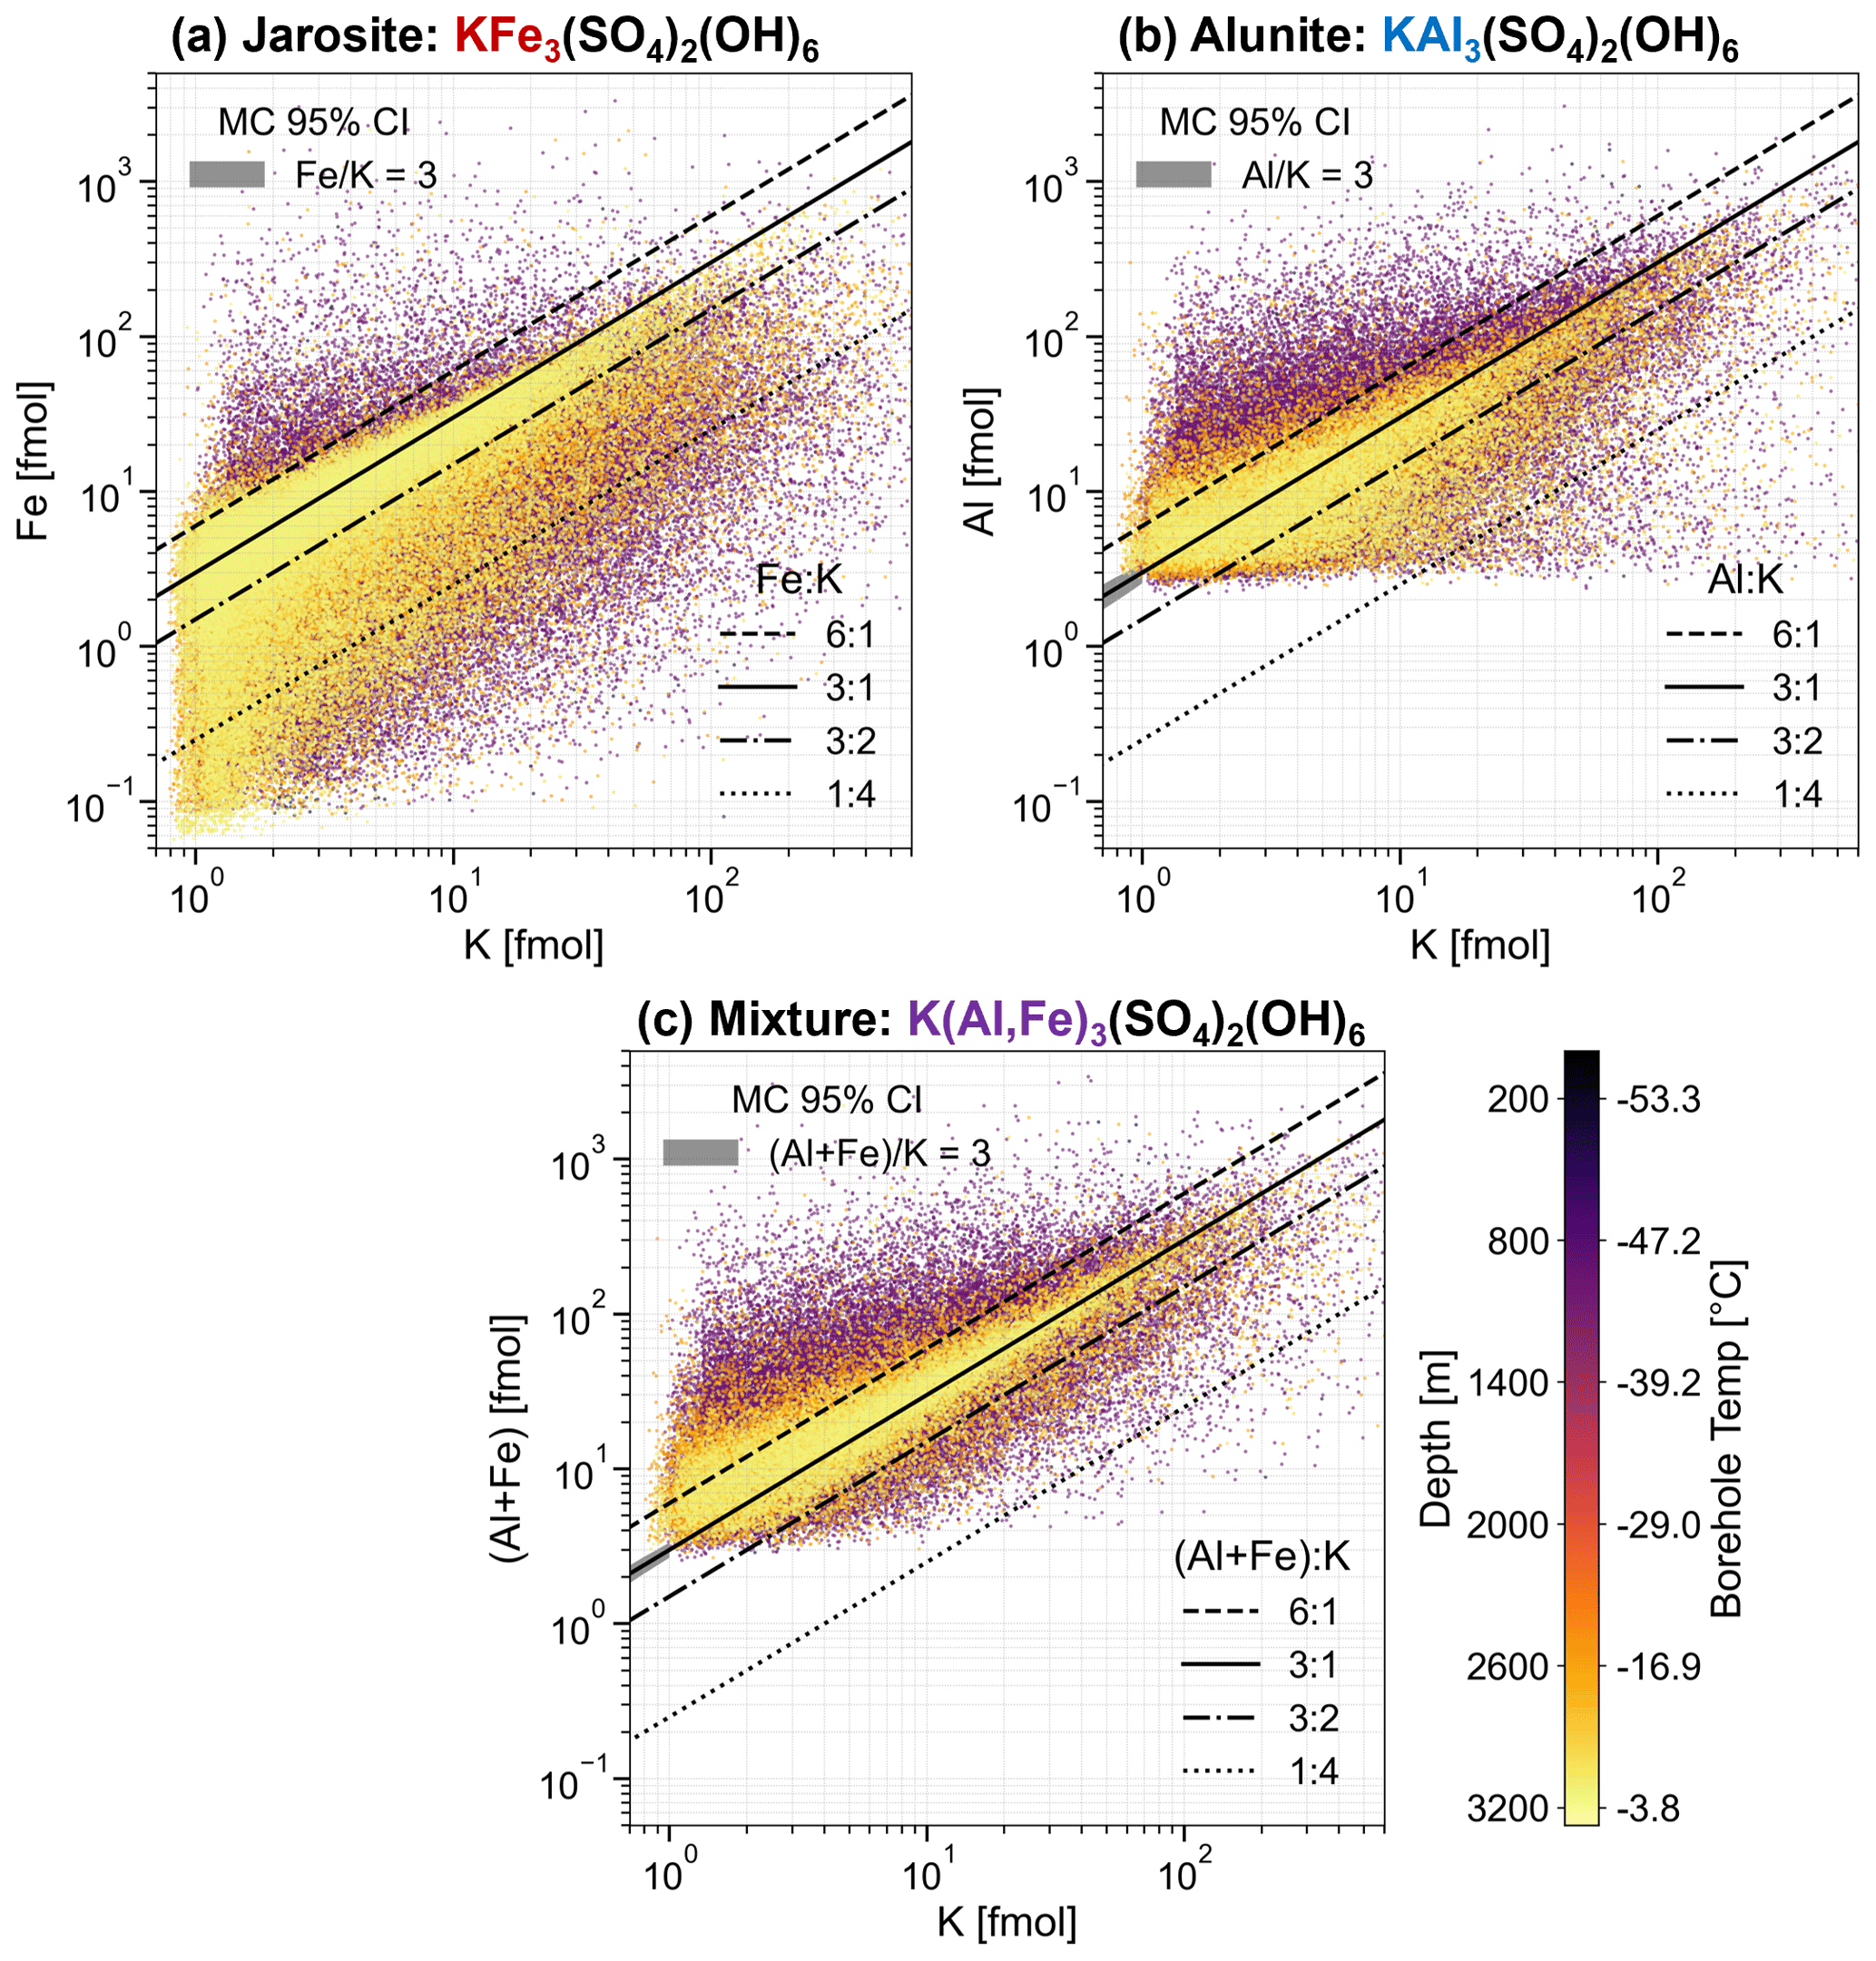
Figure 5Elemental molar ratios of K versus (a) Fe (jarosite), (b) Al (alunite), and (c) Al+Fe (mixed jarosite–alunite) for total (silicate and non-silicate) particles across the 282–3137 m depth interval of the EDC ice core. Key elements within the chemical formulas are color-coded by mineral phase. Each point represents an individual particle in which K was co-detected with the corresponding element(s). Reference lines denote Fe:K, Al:K, or molar ratios of 6:1, 3:1, 3:2, and 1:4. Colors encode both depth and the corresponding borehole temperature (Lecavalier et al., 2023) of the ice samples. Gray bands show the 95 % confidence interval (CI) derived from Poisson-based Monte Carlo (MC) uncertainties associated with TOFMS signal acquisition, following Szakas and Gundlach-Graham (2024). Note that the 95 % CI band is negligibly narrow throughout all panels, becoming only faintly visible near the left end of the 3:1 line in (b) and (c) before being obscured by data points elsewhere.
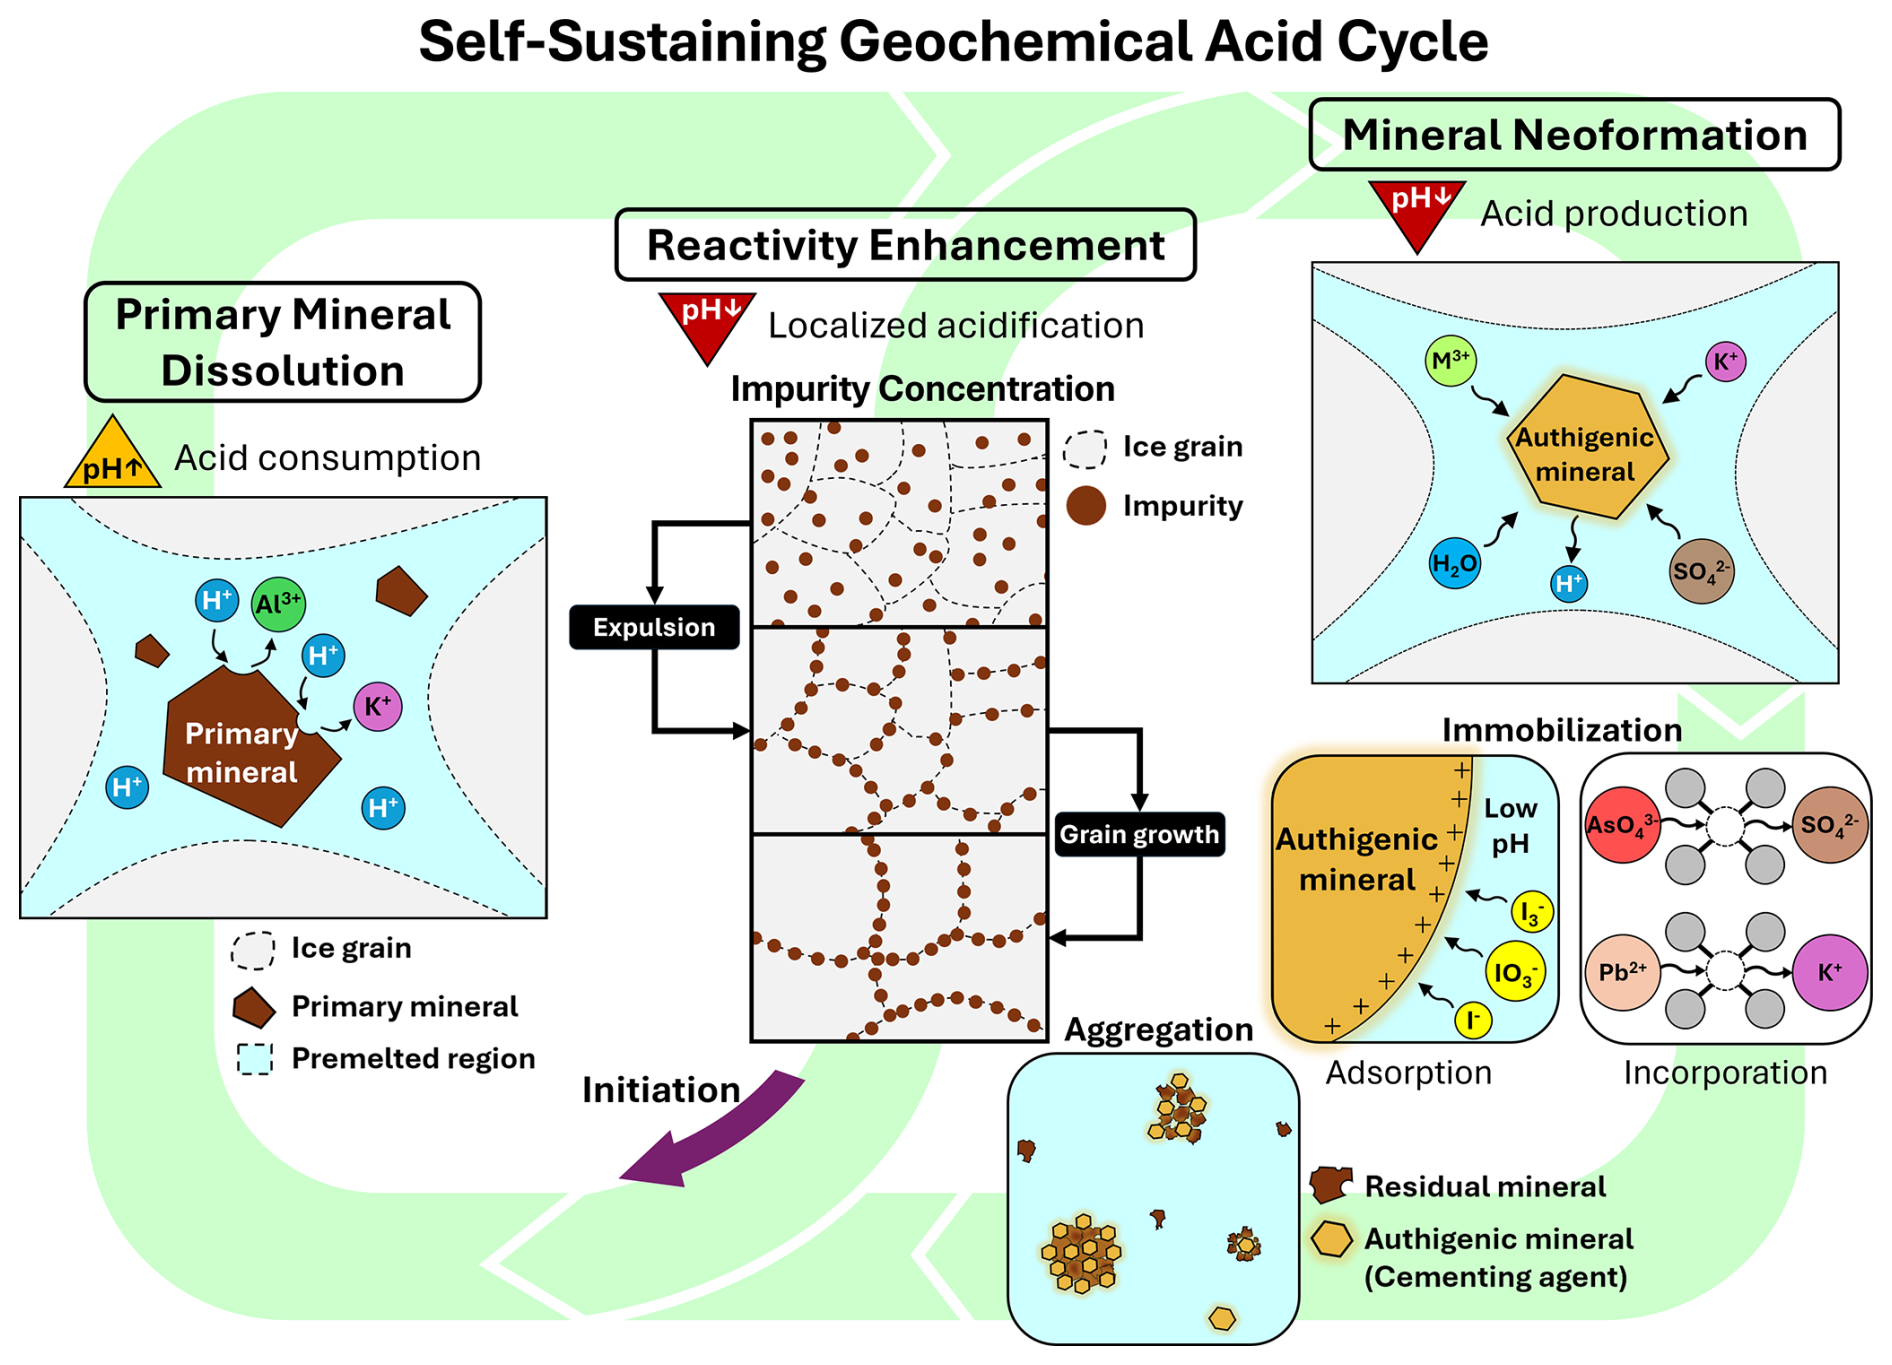
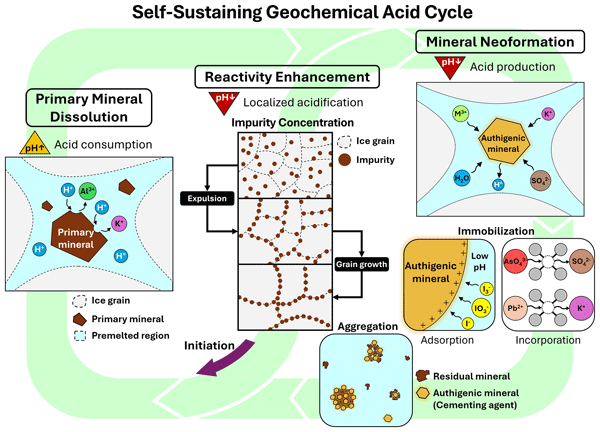
Figure 6Self-sustaining geochemical acid cycle in Antarctic deep ice. The cycle is initiated by reactivity enhancement (center, purple arrow), which drives primary mineral dissolution (left) and mineral neoformation (right). Ice metamorphism drives the localized concentration of impurities within microenvironments, promoting chemical reactions under elevated acidity. For visual clarity, impurity expulsion and grain growth are presented sequentially here, though they occur concurrently in nature. While omitted from the diagram for simplicity, the reactivity-enhancement effect may occur also within micro-inclusions. Acidic dissolution of mineral dust particles consumes protons, whereas neoformation of secondary minerals produces protons. These opposing reactions are continuously fueled by the lasting reactivity-enhancement effect during ice metamorphism, irrespective of the stage. The cycle ultimately drives the aggregation of residual and neoformed minerals and the immobilization of trace elements (e.g., I, As, Pb) via adsorption onto and incorporation into authigenic minerals. It should be noted that all reactions are schematic and stoichiometrically unbalanced. Beyond these core mechanisms, increasing temperature with depth can accelerate reaction kinetics, whereas in very deep ice, complex interactions between decreasing grain size and a thickening premelted layer could also dilute impurities and promote alkalization (see main text for full discussion).
3.2.3 Icy geochemical reactor: insights from Arrhenius-type rate laws
The geochemical alterations documented here are substantially more extensive than previously recognized within the “Icy Geochemical Reactor” framework (Dash et al., 2006; Baccolo et al., 2021a; Lanci et al., 2026). The reactivity of this reactor progressively intensifies with burial and ice metamorphism through the following mechanisms (Fig. 6):
-
Preferential exclusion of aerosol-derived impurities from the ice crystal lattice into intergranular regions and micro-inclusions, driven by crystallographic incompatibility during ice metamorphism.
-
Localized acidification of microenvironments as acidic species become concentrated.
-
Increased availability of dissolved reactants through mineral dissolution within localized liquid-like microenvironments.
-
Progressive solute enrichment as ice crystal grain growth reduces the total intergranular area.
-
Reinforcement of chemical reactivity driven by increasing in situ temperatures with depth.
Collectively, these processes accelerate geochemical reaction rates (v), which can be approximated by Arrhenius-type rate laws:
where k(T) is the temperature-dependent rate constant, T is absolute temperature, and n and m are reaction orders. The localized concentrations of reactants ([X] and [Y]) increase through expulsion, acid dissolution, and concentration during ice grain growth. Assuming a constant grain-boundary thickness and approximate conservation of impurity mass, the decrease in total intergranular volume with grain growth leads to a corresponding enrichment of impurities within grain boundaries. As illustrated in Figs. 6 and 7, this effect may increase local impurity concentrations by a factor of up to ∼7, representing a first-order estimate based on geometric contraction alone. Although the actual increase in reactant availability is likely greater because impurity expulsion and acid-driven dissolution further supply potential reactive species, this estimate may also be partially offset if grain-boundary thickness increases with temperature and depth. The reaction rate constant, k(T), is described by the Arrhenius equation:
Here, A denotes the pre-exponential factor, Ea the activation energy, and R the universal gas constant. According to Arrhenius scaling, a temperature increase from −50 to −10 °C – similar to that observed down the EDC borehole (Fig. 7) – would enhance dissolution rates for hornblende, hematite, K-feldspar, and muscovite by a factor of roughly 2300, 230, 27, and 6, respectively, corresponding to their activation energies (Ea≈94.4, 66.2, 40, and 22 kJ mol−1; Palandri and Kharaka, 2004). This demonstrates that dissolution rates of numerous minerals reported in the EDC ice core (Delmonte, 2019; Paleari et al., 2019) are significantly accelerated with depth, albeit to markedly different extents. In deep glacial ice, this thermal acceleration is compounded by long residence times (hundreds of thousands of years) and solute enrichment, substantially amplifying cumulative reaction progress.
Together, impurity relocation, localized acidification, solute concentration, and thermal acceleration define a micro-reactor system that promotes progressive geochemical transformation in deep ice (Fig. 6). Comparable intensification of acidification processes may occur in other ice-core sites and in analogous environments, including hypersaline lakes and terrestrial systems considered relevant to Mars (Baccolo et al., 2021a; Lanci et al., 2026; Macumber, 1991; Long et al., 1992a, b; Papike et al., 2006). These natural analogues provide additional mechanistic constraints on mineral stability and secondary phase neoformation under cold, acidic, and solute-rich conditions.
The precipitation of sulfate hydroxides (alunite and jarosite) represents a major proton source:
where M3+ is Al3+ or Fe3+. While the dissolution of Fe- and Al-bearing minerals consumes H+ to generate M3+ ions, the subsequent re-precipitation of these ions as sulfate hydroxides releases an equivalent amount of H+, forming a self-sustaining geochemical loop (Fig. 6). Although this cycle yields no net proton addition in a closed system, it prevents the progressive neutralization of acidity by alkaline dust species, effectively maintaining microenvironmental acidity over extended timescales. Localized net acidification may further arise where spatial separation between dissolution and precipitation sites breaks the closed-system assumption – a mechanism broadly analogous to positive feedback processes proposed for hypersaline lacustrine systems (Long et al., 1992a), but operating at the micro-scale of ice grain interfaces and inclusions. As ice recrystallizes and grains grow, dissolved species are expelled into intergranular regions, spatially decoupling their re-precipitation from the original dissolution sites. This separation may inhibit the net-neutralization of released protons, driving local acidity in these microenvironments beyond the levels predicted by a stoichiometric bulk-system analysis. Through such spatial decoupling, the self-sustaining geochemical cycle may evolve into a self-reinforcing acidification loop at the micro-scale. It should be noted, however, that this pathway is unlikely to represent a static or generalized condition. Rather, these microenvironments may result from a net effect of localized chemical reactions (proton-consuming dissolution and proton-producing precipitation) and physicothermal shifts (e.g., metamorphic grain-size evolution and premelting-layer thickness changes, both modulated by temperature and local impurity concentration).
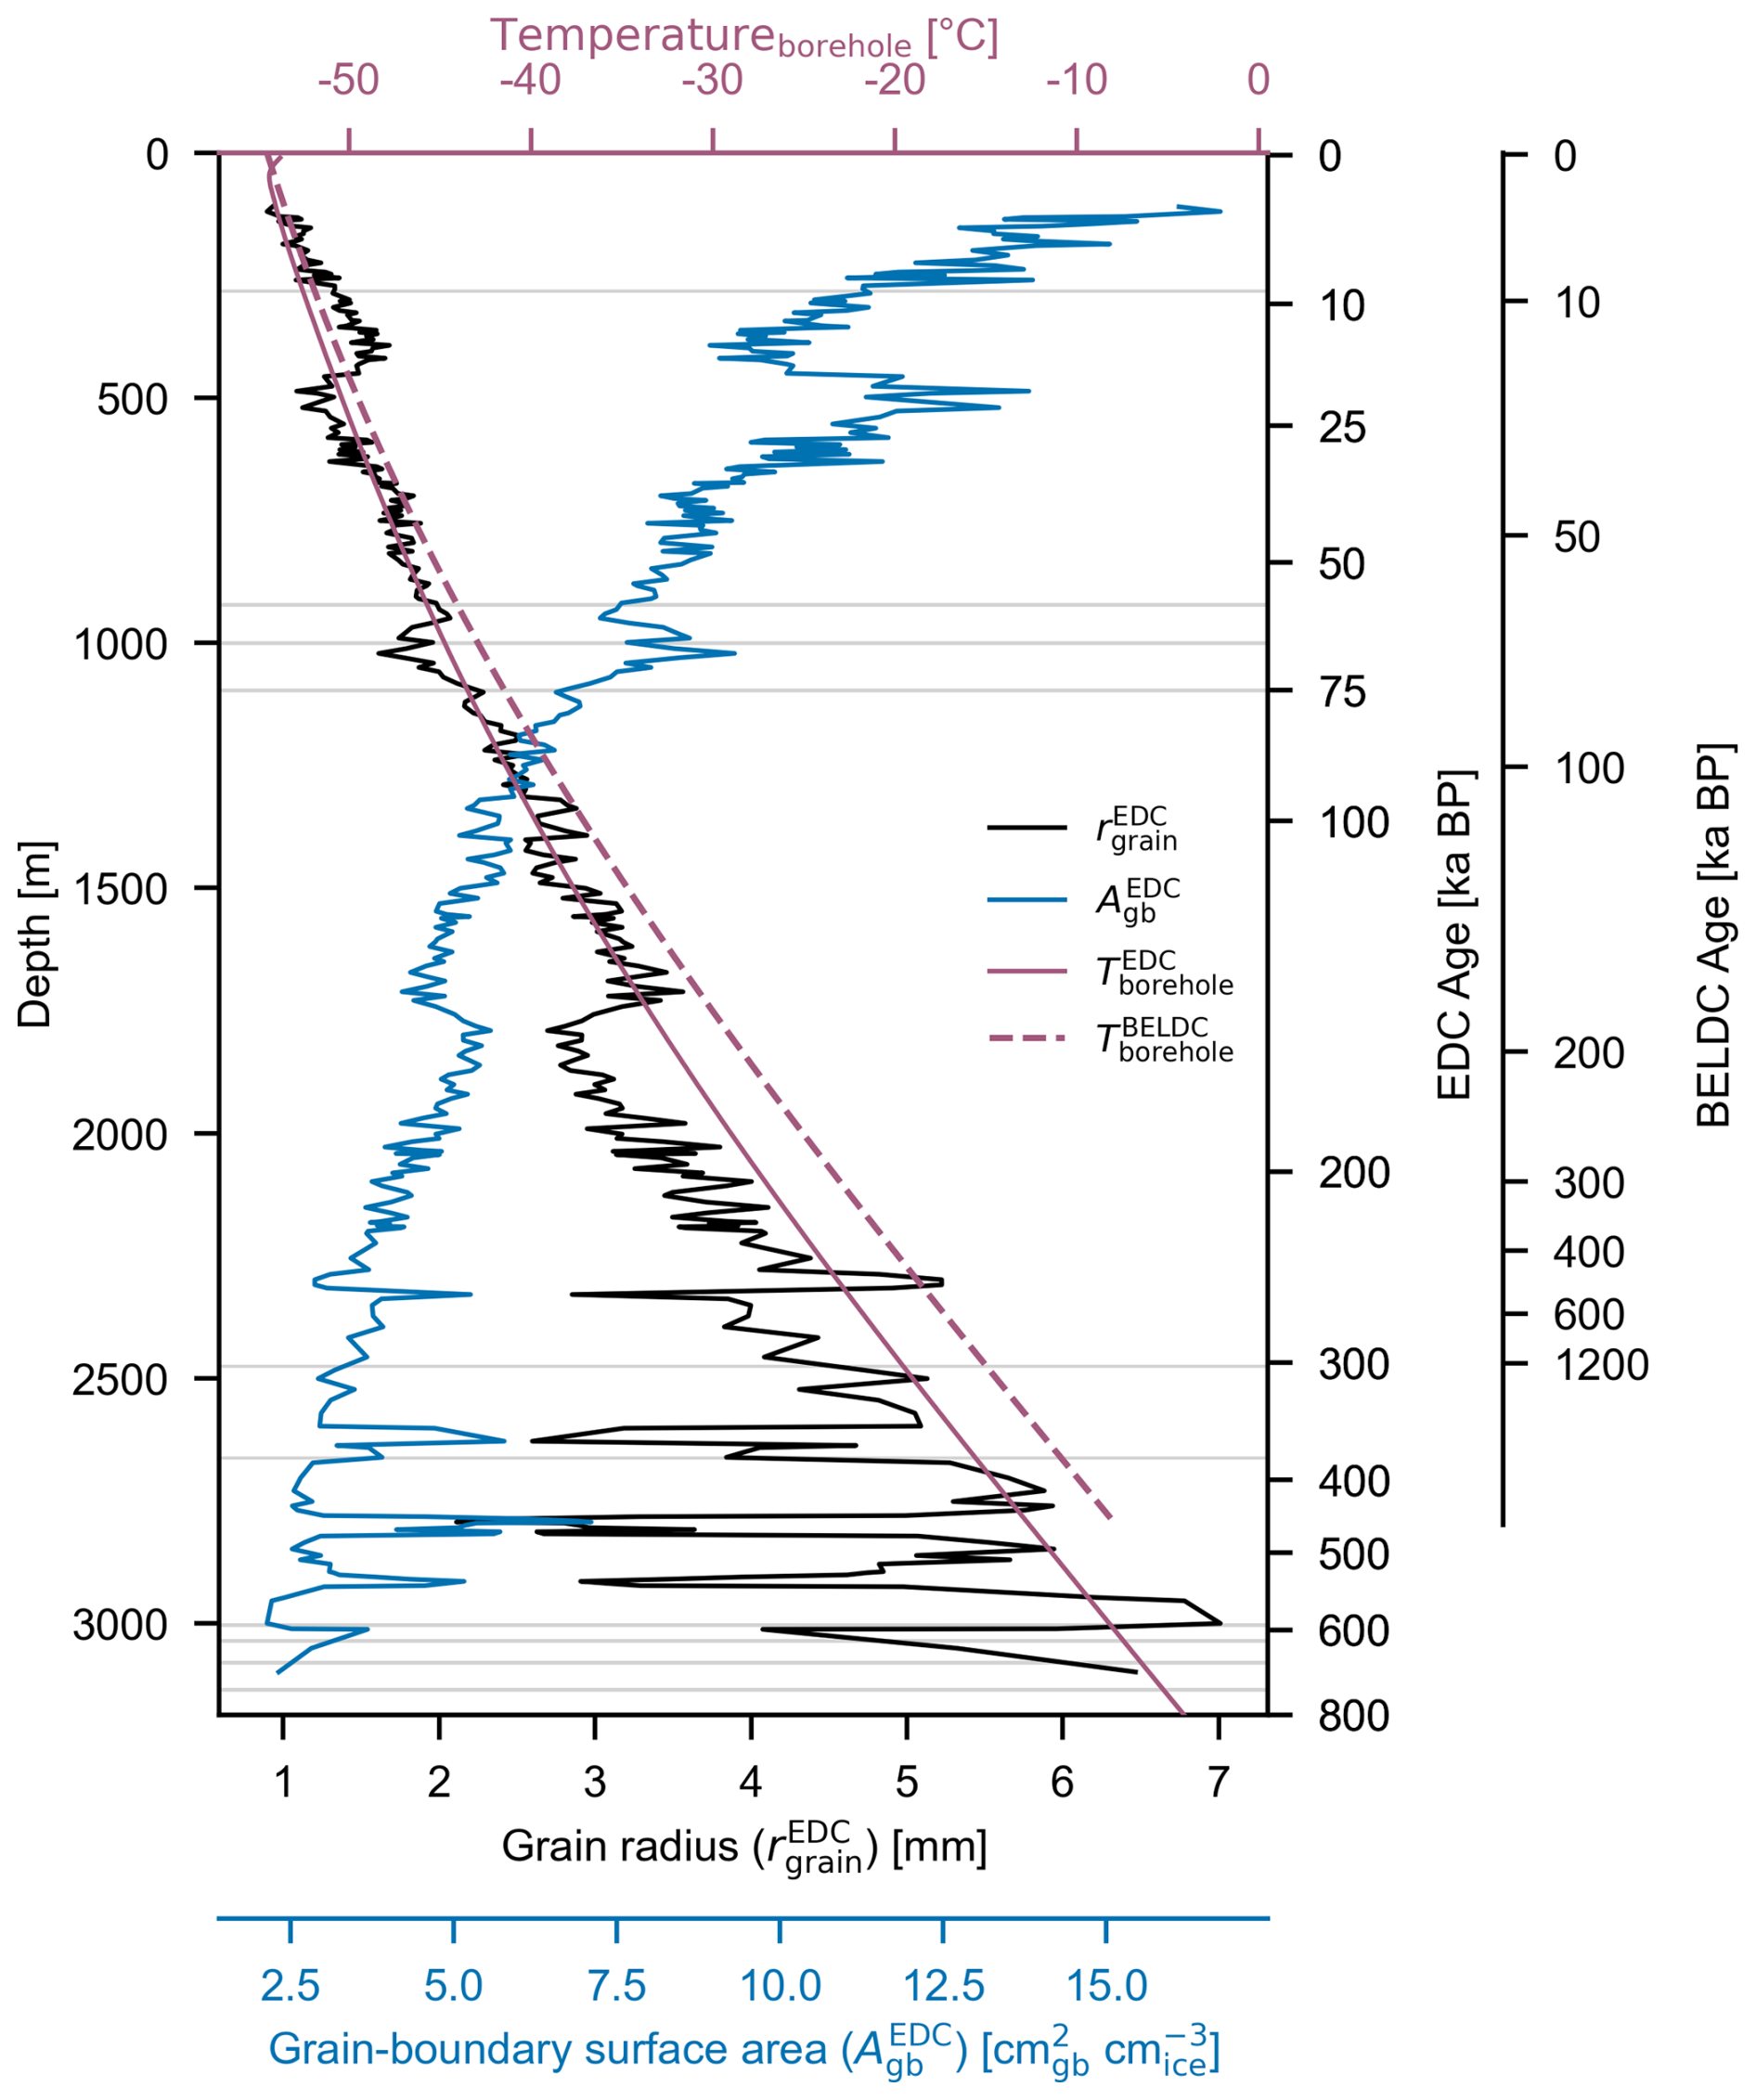
Figure 7Depth profiles of EDC grain properties and borehole temperatures at EDC and BELDC sites. The plot displays grain radius (, black line; EPICA community members, 2004), estimated grain-boundary surface area (, blue line), and borehole temperature for the EDC ice core (, solid magenta line; Lecavalier et al., 2023), alongside borehole temperature for the BELDC site (, dashed magenta line; F. Wilhelms, unpublished data). Data for EDC grain radius and temperature, as well as EDC age (Bouchet et al., 2023), were interpolated on a common depth scale. The BELDC borehole temperature profile is presented together with the depth–age data from Chung et al. (2025). Gray horizontal bands indicate the intervals analyzed in this study. Grain-boundary surface area () was approximated by dividing a unit volume of ice by the volume of a single spherical grain () to determine the number of grains per unit volume (), multiplying this number by the single-grain surface area (4πr2), and finally halving the total surface area () to account for interfaces shared between adjacent grains (). This idealized estimate is intended for relative comparison only, due to the simplified assumptions of uniform, ideal spherical shapes and a void-free structure.
Driven by the enhanced reactivity and prolonged reaction times (hundreds of thousands to millions of years), the deep icy geochemical reactor promotes the neoformation of secondary minerals such as jarosite, alunite, and likely iron (oxyhydr)oxides. These minerals drive a self-sustaining acidification loop, where localized secondary mineral neoformation from ions released during acid-consuming dissolution reacidifies the system (Fig. 6), replicating the extreme environments observed in hypersaline lacustrine, acid mine drainage, and Martian surface analogues. Due to their cementing properties, these secondary minerals drive aggregation by agglomerating residual primary grains and weathered dust with neoformed minerals. Although these geochemical alterations appear ubiquitous across deep Antarctic ice cores rather than being site-specific, their progression depends heavily on factors controlling ice metamorphism and bulk chemical composition. For example, high dust concentrations can inhibit and suppress ice recrystallization and thus grain growth through Zener pinning or impurity drag within the ice matrix (Durand et al., 2006; Stoll et al., 2021). However, this pinning effect alone cannot completely prevent alteration. Because intergranular regions and micro-inclusions act as localized, acidic micro-reactors, the dust is inevitably subjected to intense chemical alteration once it is swept into them. Consequently, both dusty and relatively clean ice samples undergo significant geochemical modification at depth.
A critical variable governing this process is the geothermal heat flux from the bottom upward through the ice, which dictates the temperature profile at depth and, according to Arrhenius kinetics, controls the temperature-dependent rates of grain growth (Duval, 1985; Durand et al., 2006) and geochemical reactions. Colder ice undergoes much slower grain growth, extending the preservation time of primary climatic dust records through reduced ice deformation and recrystallization. Given that BELDC ice is significantly colder than EDC ice of comparable age – e.g. bottom borehole temperatures of −7.83 °C at BELDC (Frank Wilhelms, unpublished data; cf. Westhoff et al., 2026, reporting °C) versus −2.18 °C at EDC (Lecavalier et al., 2023; Fig. 7) – despite containing similar dust concentrations, the BELDC record should experience slower geochemical alteration. Therefore, the BELDC core will not only extend the climate record across the MPT but may also provide higher-fidelity, less-altered dust records for the epochs currently covered by the EDC core.
Despite the comprehensive picture provided by these findings, important gaps remain for future study. First, the depth intervals between selected samples could be reduced to more closely track the englacial geochemical evolution. We observed that major transformations develop between 1097.25 and 2475.55 m; higher-resolution sampling across this transitional zone would more precisely constrain the onset and progression of these alterations. Second, sp-ICP-TOFMS analysis is inherently restricted to the finer particle fraction due to limited transport efficiency in the sample introduction system and incomplete ionization of larger particles () in the plasma. This size fractionation may yield particle distributions that differ from those obtained via other particle-sizing techniques (e.g., microscopy, laser-based methods, or Coulter counters), which typically capture larger particles and aggregates spanning from hundreds of nanometers to tens of micrometers. Caution must therefore be exercised regarding the size-fractionation biases inherent to different analytical methods. Finally, while the stoichiometric identification of a large number of single particles provides robust statistical evidence for secondary mineral neoformation, these findings should be corroborated by complementary techniques. Direct micro-analytical measurements (e.g., electron microscopy, single-grain Raman spectroscopy, XRD, and synchrotron-based techniques, performed on either cryo-preserved ice or filtered particles) are necessary to validate the physicochemical states inferred from our multi-proxy ICP data. Specifically, these techniques will be crucial for constraining the role of residual (alumino)silicate minerals in the composition of the dust aggregates, confirming the surface adsorption of oxidized iodine, verifying the physical presence of Fe-(oxyhydr)oxide coatings, and resolving the exact structural nature (i.e., solid solution versus mechanical mixture) of the jarosite–alunite mixtures and other aggregate components. Beyond the identification of mineral phases, the direct determination of elemental speciation, which we here infer from elemental abundances alone, represents a further promising direction. Synchrotron-based X-ray absorption techniques could resolve the overall oxidation and coordination states of elements in dust samples (Baccolo et al., 2021a, b), and would be particularly informative for Fe and As, while dissolved anionic species such as iodide, iodate, and arsenate could be targeted by ion chromatography coupled to ICP-MS (Spolaor et al., 2013b; Vallelonga et al., 2021; Frassati et al., 2024). Such measurements would provide direct evidence for the redox and complexation processes that we propose to operate in the ice, and would further constrain the significance of chemical reactions proceeding within the frozen matrix.
In this study, 18 EDC ice-core bags distributed across depths ranging from 281.6 to 3137.1 m and representing 10 distinct climatic periods were analyzed using CFA-sp-ICP-TOFMS. Our aim was to investigate englacial geochemical mineral dust alteration processes deep within the Antarctic ice sheet. By fully leveraging the capabilities of sp-ICP-TOFMS, we evaluated these geochemical transformations quantitatively (tracking particle number concentration, mass fraction, and relative size among particles) and qualitatively (inferring mineralogy via stoichiometry). Our elemental particle number concentrations confirmed the well-established robust relationship between high dust concentrations and temperature anomalies, supported by a strong inverse correlation across the 10 climatic periods. However, this linear relationship weakened in the deepest ice sections, particularly for larger PNCs as previously observed, signaling significant post-depositional dust aggregation. Crucially, our analyses of particulate mass fractions and relative particle sizing revealed the minerallogically extensive dissolution of primary mineral dust in deep ice. This pervasive, but element-specific, dissolution drives a massive shift in the bulk chemical and mineralogical composition of the preserved dust in deep ice sections compared to shallow ice. Yet, superimposed on this net dissolution and size reduction, specific elements – namely iron, silicon, potassium, iodine, and tentatively arsenic and lead – were notably retained in, or re-precipitated into, the particulate phase. Stoichiometric evaluation of the single particle data indicated significant neoformation of K-alunite group minerals (jarosite, alunite, and their mixed phases), marking the first time these phases have been identified in the EDC region. Consistent with observations in analogous acidic, sulfate-rich environments (e.g., acid mine drainage, hypersaline lakes, and the Martian surface), these secondary phases likely act as cementing agents driving dust aggregation. The concurrent net precipitation of trace elements like iodine, arsenic, and lead is likely linked to the strong immobilization and scavenging capacity of these alunite–jarosite minerals via anion adsorption or heavy-metal substitution under acidic conditions. Because these depth-related changes in elemental partitioning can complicate quantification of each phase and total element concentrations, such methodological challenges should be explicitly accounted for when using deep ice-core records for paleoenvironmental reconstructions.
These highly reactive transformations are governed by “Icy Geochemical Reactors”, in which impurities expelled from the recrystallizing ice lattice concentrate into acidic, oxidative quasi-liquid microenvironments at grain boundaries and micro-inclusions, driving dissolution, hydrolysis, and precipitation as a net effect controlled by localized neutralization and ambient acidification. In deep ice, this reactivity is compounded by geothermal heating, leading to higher in situ temperatures with depth; following Arrhenius-type kinetics, the higher temperature of deep ice exponentially accelerates reaction rates within these micro-reactors. Because BELDC ice is significantly colder than EDC ice of equivalent age, it will likely provide a less geochemically altered, higher-fidelity dust record for ice of similar age than in the EDC ice core.
Table A1Compilation of reported mineralogical alterations and inferred geochemical pathways in deep Antarctic ice and jarosite-bearing analog environments (Lake Tyrrell and Martian settings), distinguishing reactant consumption from (potential) product formation.
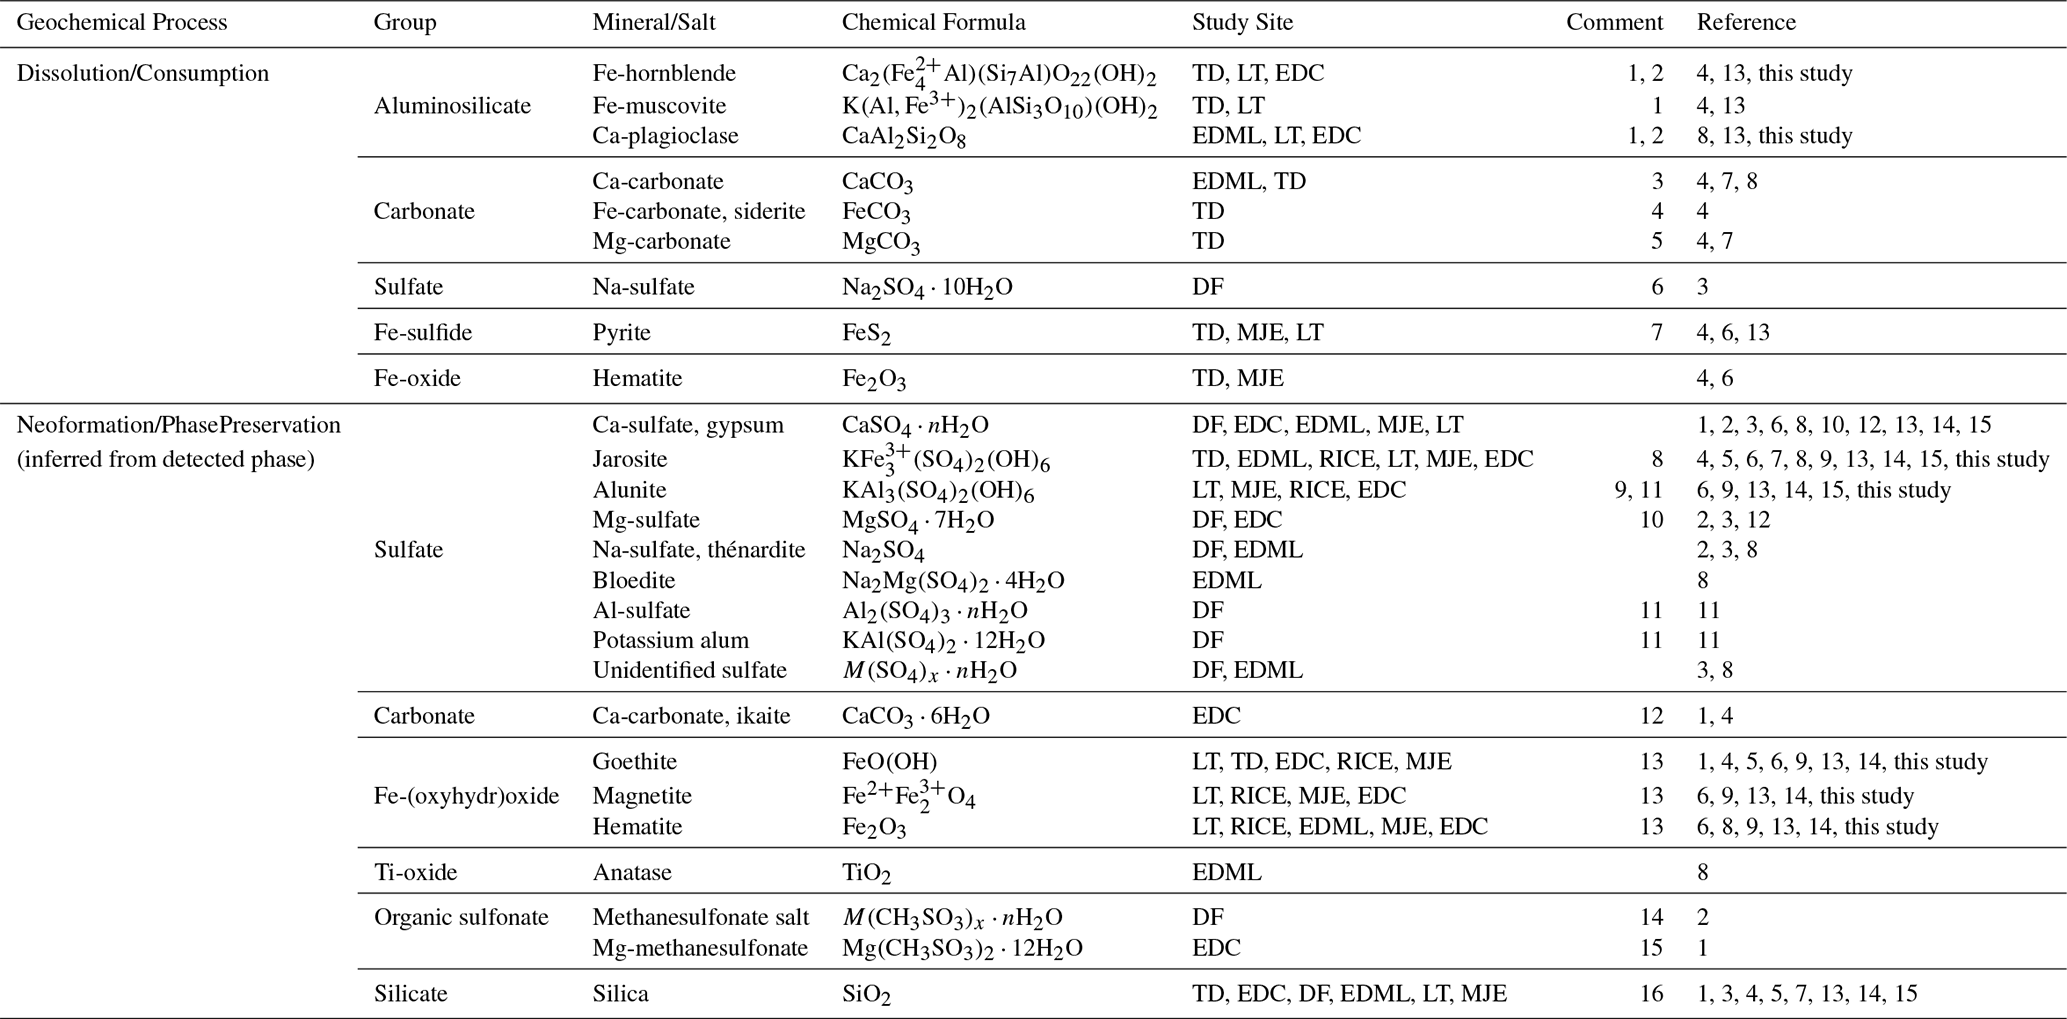
Sites: EDC: European Project for Ice Coring in Antarctica (EPICA) Dome C, Antarctica; TD: Talos Dome, Antarctica; EDML: EPICA Dronning Maud Land, Antarctica; DF: Dome Fuji, Antarctica; MJE: Martian jarosite environments; LT: Lake Tyrrell, Australia; RICE: Roosevelt Island Climate Evolution, Antarctica.
Comments: 1. General dissolution of clays and aluminosilicates in Lake Tyrrell; 2. Pervasive dissolution of Al–Ca-bearing silicate particles in this study; 3. Ca supply potentially associated with formation of Ca-sulfate (gypsum) or Ca-carbonate (ikaite); 4. Ferrous iron dissolution potentially associated with ferric mineral formation; 5. Mg supply potentially associated with Mg-sulfate formation; 6. Solid–solid phase transition (e.g. (de)hydration), not dissolution; 7. Oxidation and acidification, sulfuric acid generation; 8. Cementing agent, mechanical mixture with alunite; 9. Cementing agent, mechanical mixture with jarosite, stoichiometrically confirming the previous microscopic inference in ice cores in this study; 10. Neutralization via binding of conjugate base to Mg2+; 11. Potential Al supply by aluminosilicate dissolution; 12. Large Ca-rich particles (several tens of µm) with gypsum coating, suggestive of acid-consuming reactions in microenvironments; 13. Cementing agent, coating, unspecified Fe-(oxyhydr)oxides in this study; 14. Identification in shallow core; 15. Neutralization, potentially related to biological activity; 16. Possibly newly formed or residual after elemental leaching, often with detectable Al.
References: 1. de Angelis et al. (2013); 2. Ohno et al. (2005); 3. Ohno et al. (2006); 4. Baccolo et al. (2021a); 5. Baccolo et al. (2021b); 6. Papike et al. (2006); 7. Baccolo et al. (2018); 8. Eichler et al. (2019); 9. Lanci et al. (2026); 10. Iizuka et al. (2008); 11. Ohno et al. (2014); 12. Traversi et al. (2009); 13. Long et al. (1992a); 14. Long et al. (1992b); 15. Ehlmann et al. (2016).
To ensure optimal storage stability and prevent precipitation, the calibration standards were categorized into two distinct groups based on their solvent matrix compatibility:
-
Multi-elemental group (nitric acid matrix): This group encompasses 54 elements (including the 21 elements analyzed in this study). Six working standards were prepared by combining six certified reference materials into intermediate mixtures, followed by a final dilution in 2 % () HNO3. The constituent stock solutions comprised an aluminum standard (Fluka Analytical, USA), an iron standard (Sigma-Aldrich, USA), IV-STOCK-1673 (Inorganic Ventures, USA), Periodic Table Mix 3 (Sigma-Aldrich, USA), CGTH1 (Inorganic Ventures, USA), and CGU1 (Inorganic Ventures, USA).
-
Halogen group (triethylamine and water base): Elements stable in water or triethylamine were prepared by mixing and diluting iodine (CGICI1, Inorganic Ventures, USA) and bromine (CGICBR1, Inorganic Ventures, USA) to obtain six final standards. Note that bromine data are not presented in this study due to its high detection limit.
Table B1Elemental concentrations in the calibration standards for ICP–TOFMS used in this study. Additional mass numbers for Fe and Ba were included to correct for detector saturation, following the multi-isotope calibration strategy described in Sect. 2.2.2.
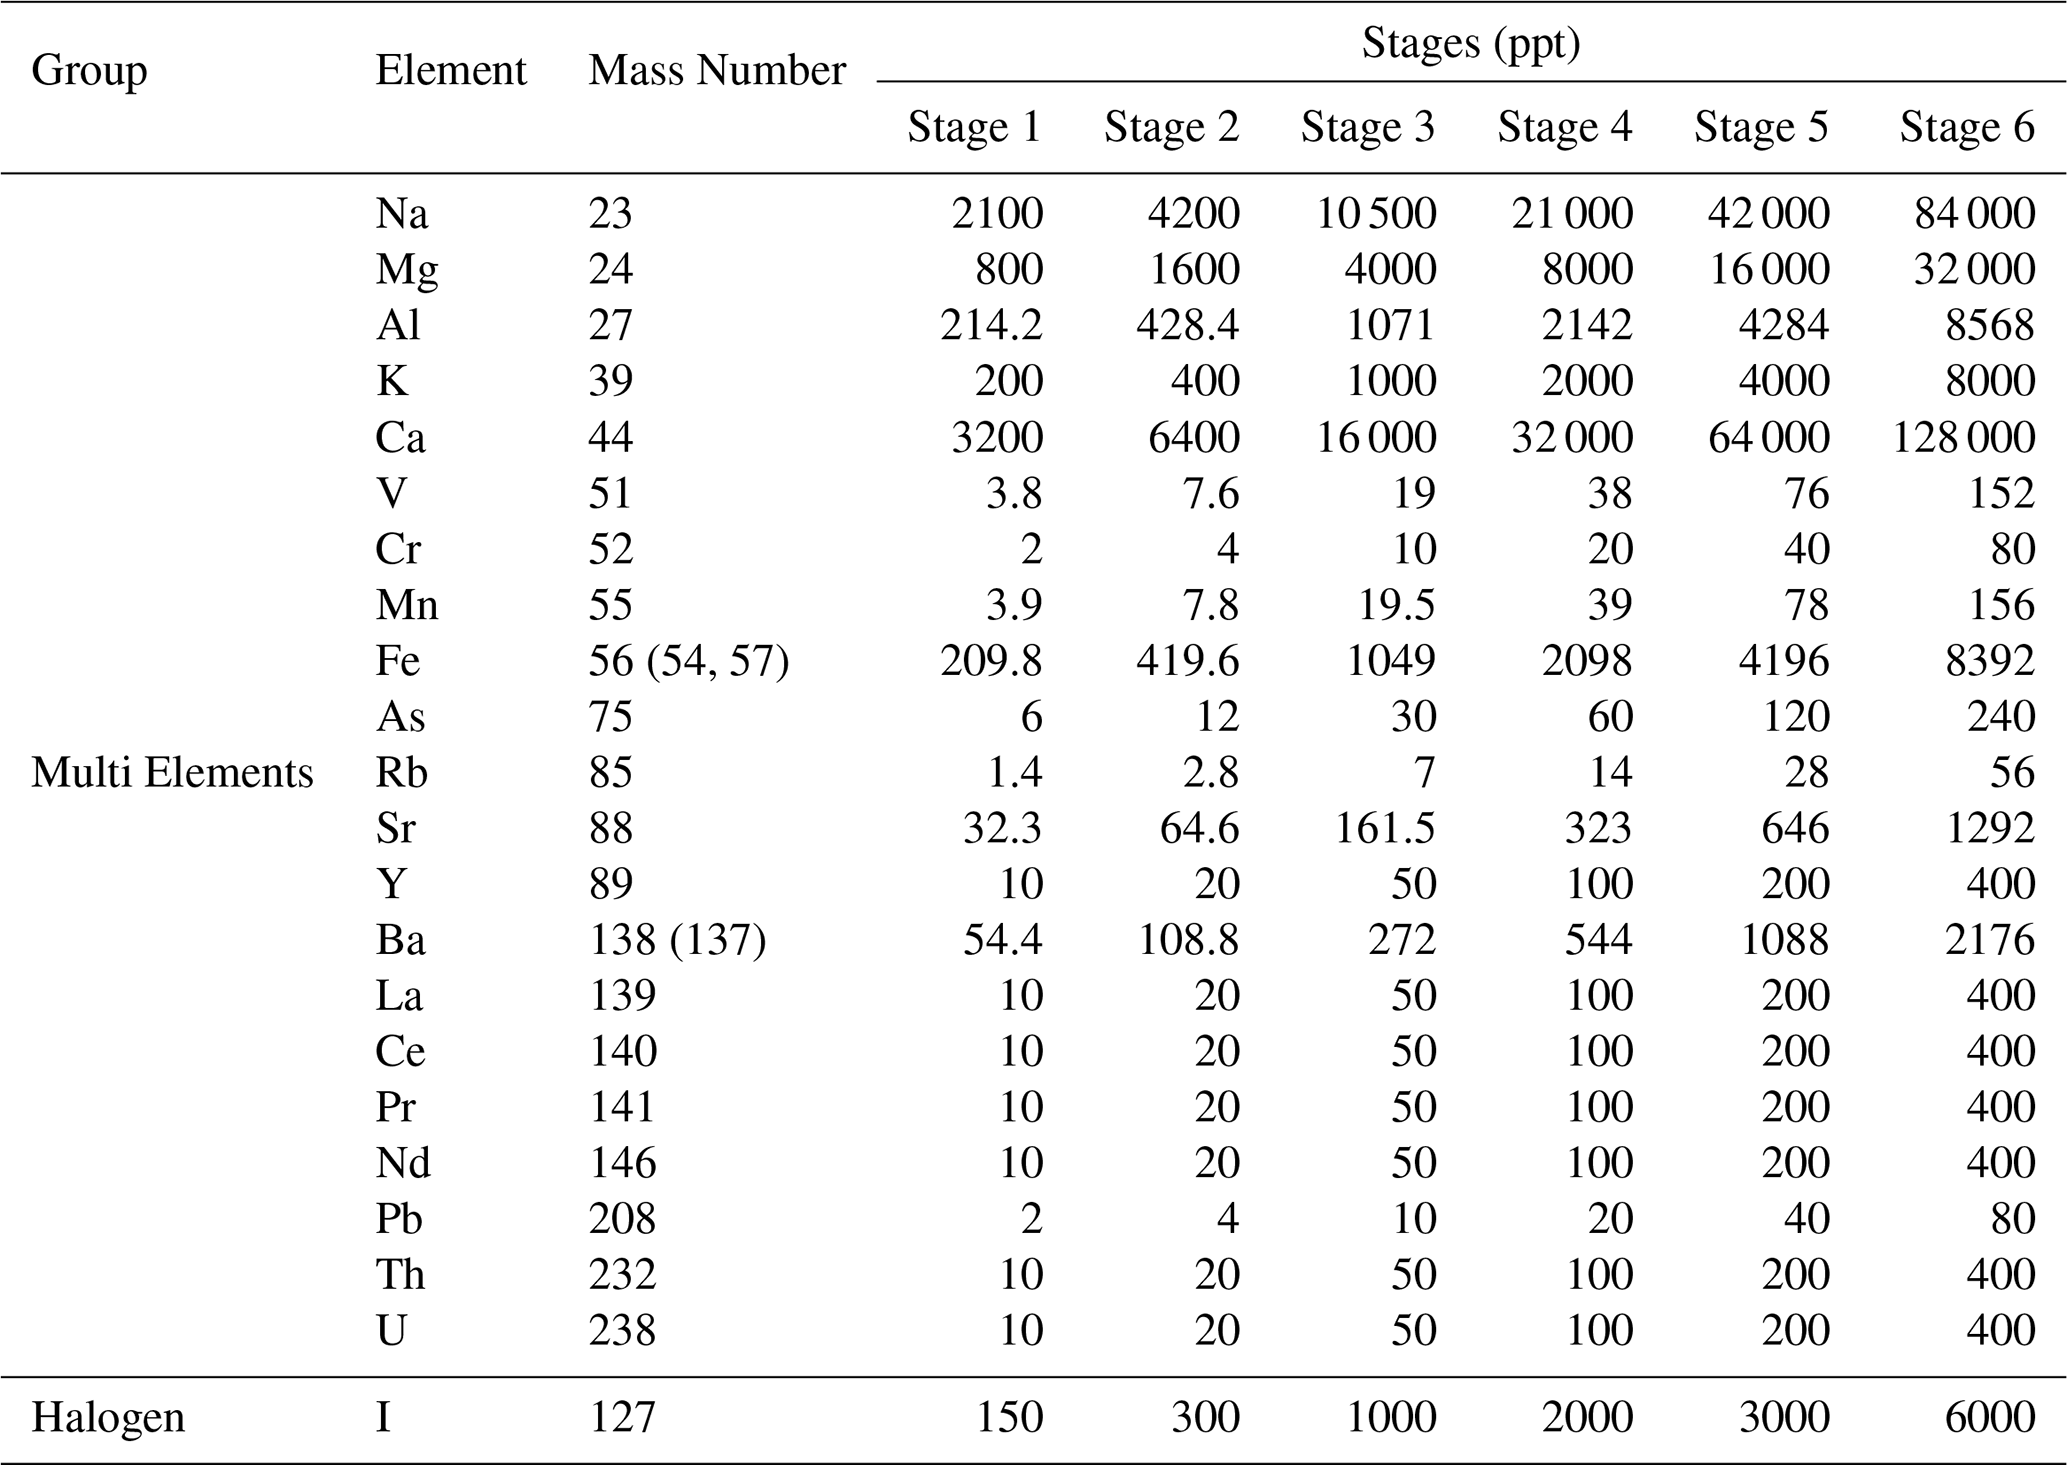
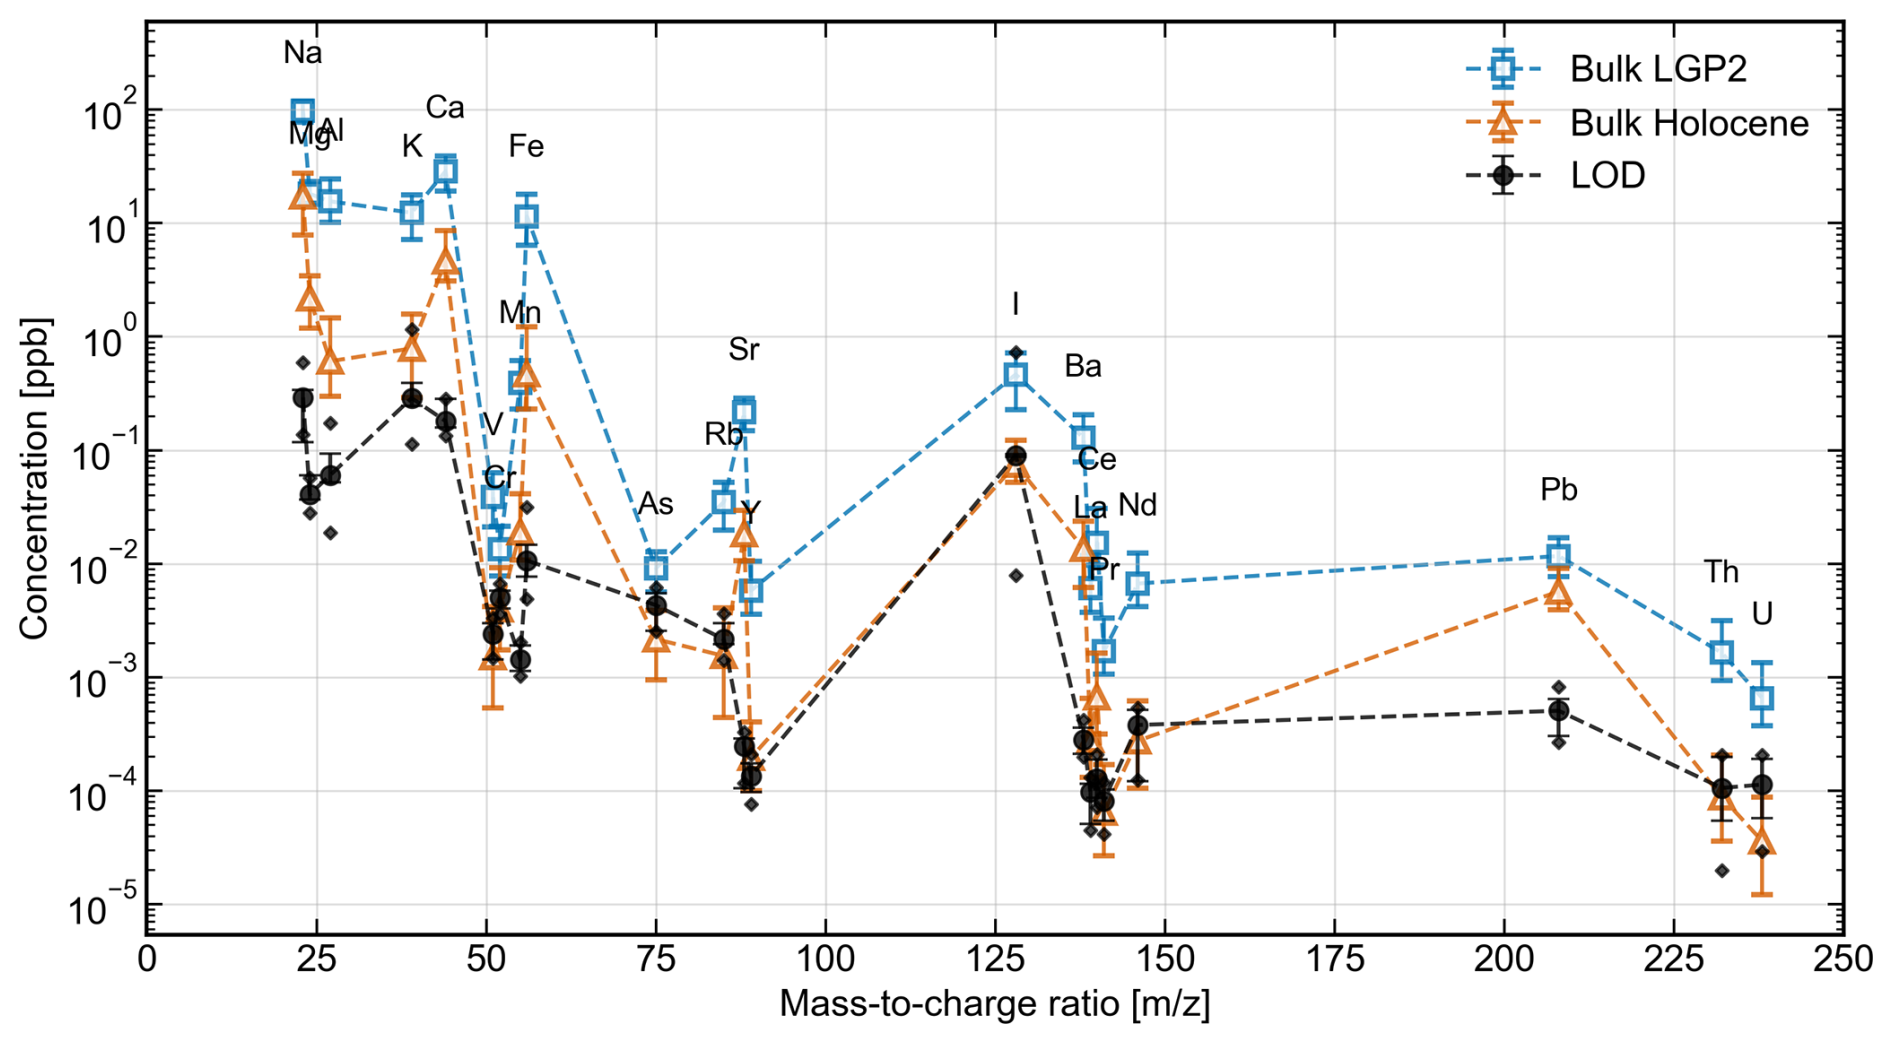
Figure C1LODs and bulk concentrations for 22 elemental analytes; bulk concentrations are shown for the cleanest (Holocene, orange) and the dustiest (LGP2, blue) ice-core samples. LODs were determined from nine calibration standard runs as described in Sect. 2.2.7. Each marker represents the median LOD and median bulk concentration at 2.2 s resolution (∼1 mm depth). Error bars for LODs denote the 2nd maximum and minimum values across the nine calibration runs (diamonds: absolute min/max), while those for bulk concentrations indicate the 10th and 90th percentiles. Major crustal elements consistently exceed the LOD even in the cleanest Holocene ice, whereas minor and rare earth elements (REEs) frequently fall below the LOD in the Holocene samples. Note that these LODs apply specifically to 2.2 s resolution bulk analysis; because particulate signals can exceed the ThresPoisson threshold even when the dissolved phase is below the LOD, SP detectability – utilizing the high-frequency 0.0015 s resolution data – must be evaluated independently.
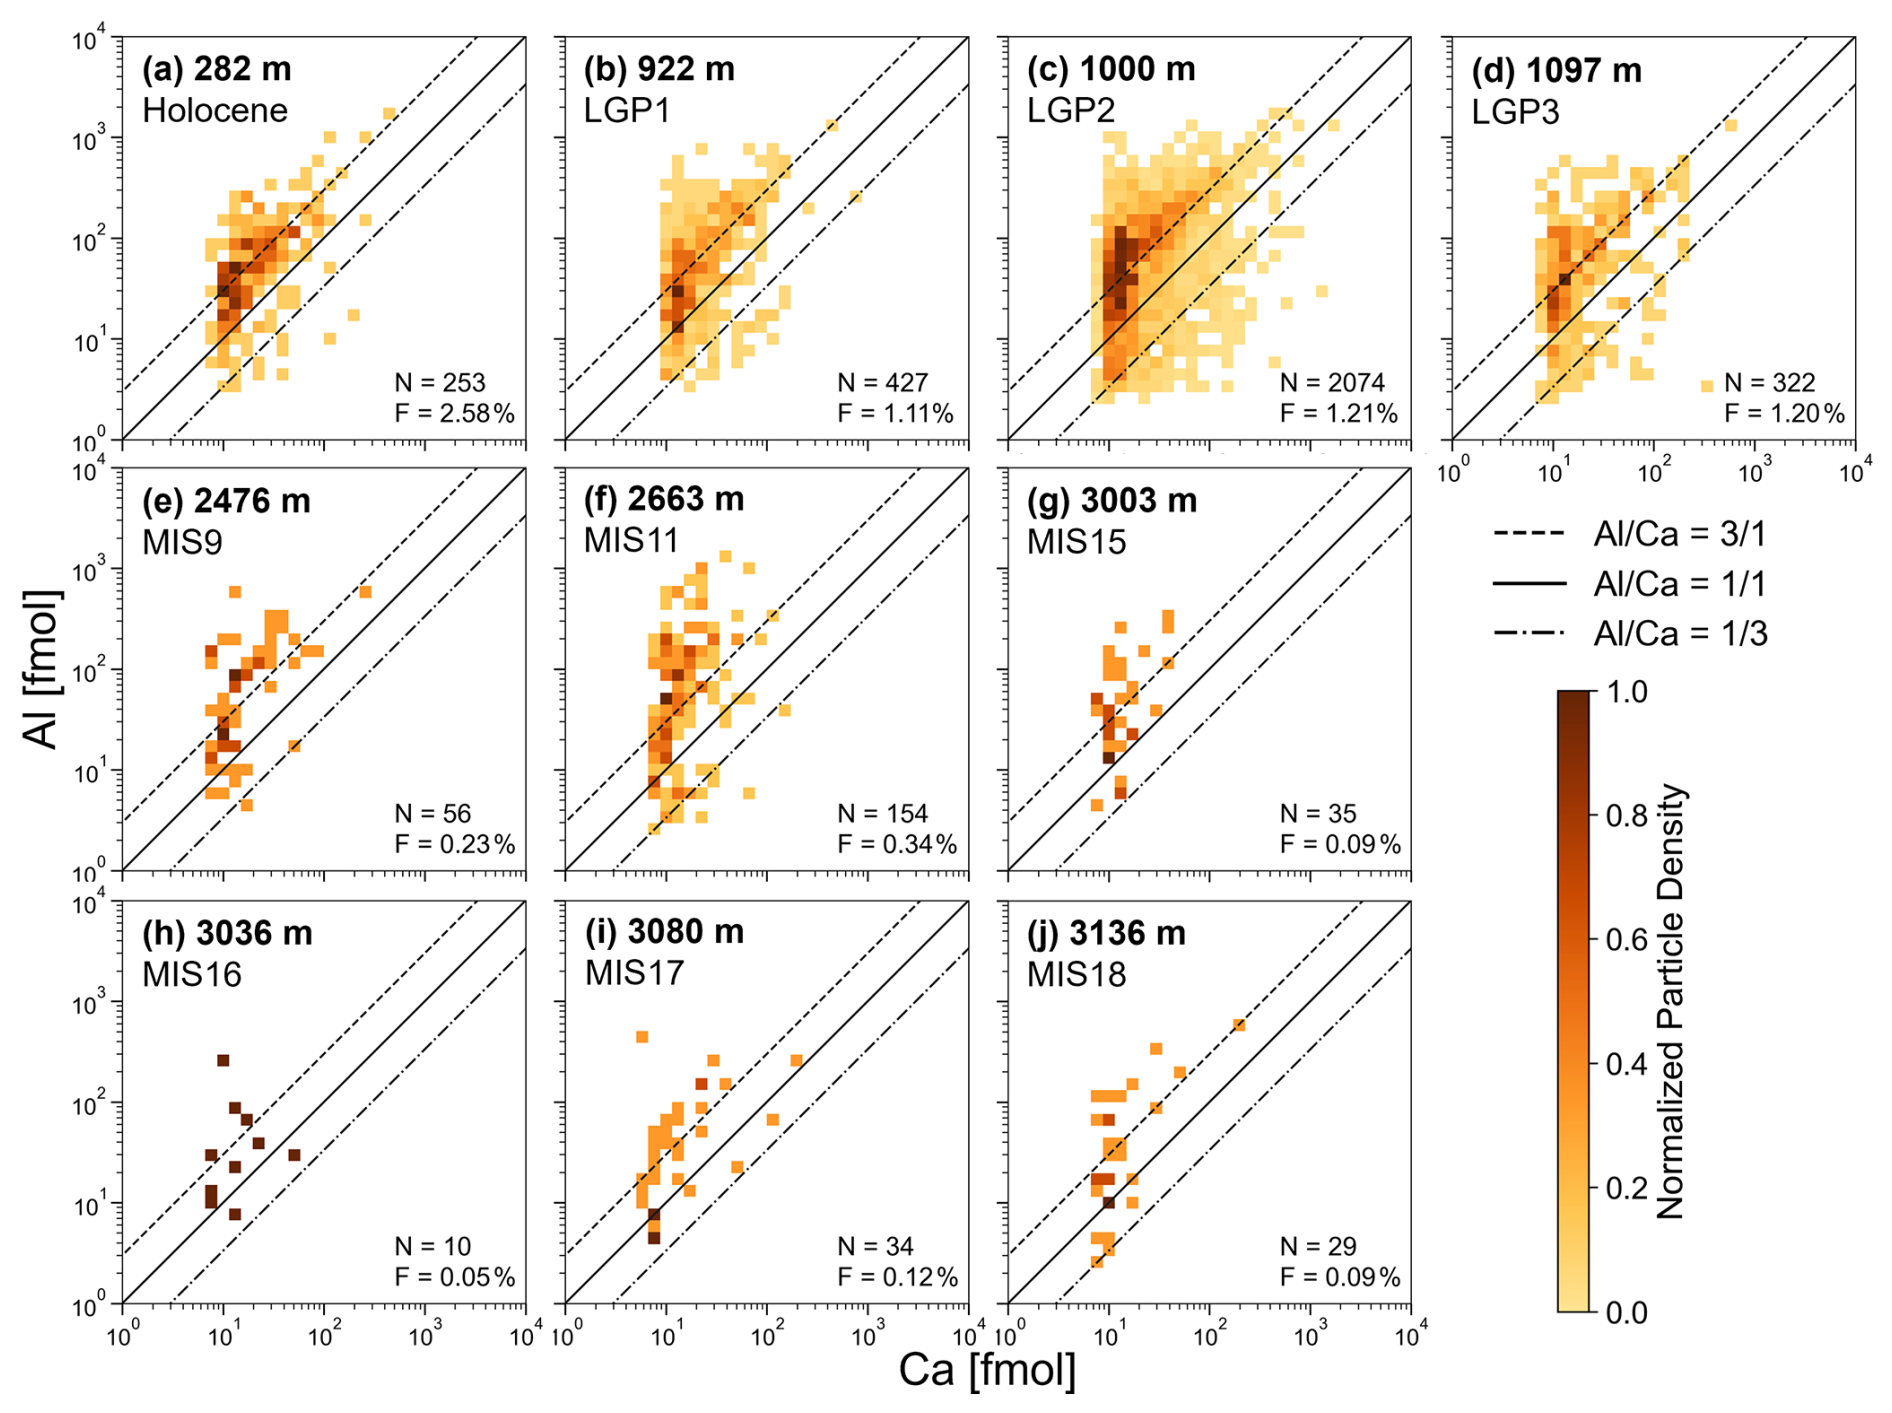
Figure D1Moles of elemental Ca versus Al of silicate dust particles found across 10 climate intervals (a–j), ranging from 282 to 3137 m in the EDC ice core. Each interval corresponds to the rounded mean depth of two consecutive ice-core bags or a single bag, indicating its stratigraphic position. The three reference lines denote Al:Ca molar ratios of 3:1, 1:1, and 1:3. The color of each pixel represents the normalized particle number density (number of Al–Ca co-detected silicate particles per bin maximum value per bin). The total number of co-detected particles (N) and their number fraction relative to the total number of silicate dust particles (F) are shown at the bottom of each panel.
The Python implementation of the bin-count extraction and split-event correction is archived at Zenodo (https://doi.org/10.5281/zenodo.22208733; Lee, 2026) under the MIT licence, and is developed at https://github.com/Learner-2021/sp-icptof-bin-counts (last access: 12 November 2026). The data are archived at Zenodo (https://doi.org/10.5281/zenodo.21510434; Lee et al., 2026) and will be made openly accessible upon publication of this article.
GL, PL, PB, and HF conceptualized the study and obtained approval from the EPICA Science Steering Committee to use EDC ice-core samples. GL and PL collected and processed the ice-core samples. The CFA campaign was conducted by GL, PL, and CZ. The sp-ICP-TOFMS data were processed by GL with support from TE, and the wet-chemistry data were processed by PL and CZ. TE, CZ, SJ, JS, BD, GB, and HF contributed to the discussion and interpretation of the results. GL wrote and revised the manuscript with contributions from all co-authors.
The contact author has declared that none of the authors has any competing interests.
Publisher's note: Copernicus Publications remains neutral with regard to jurisdictional claims made in the text, published maps, institutional affiliations, or any other geographical representation in this paper. The authors bear the ultimate responsibility for providing appropriate place names. Views expressed in the text are those of the authors and do not necessarily reflect the views of the publisher.
This publication was generated within the framework of the DEEPICE project, which has received funding from the European Union's Horizon 2020 research and innovation programme under the Marie Skłodowska-Curie grant agreement no. 955750. This work is a contribution to the European Project for Ice Coring in Antarctica (EPICA), a joint European Science Foundation/European Commission scientific programme, funded by the EU (EPICA-MIS) and by national contributions from Belgium, Denmark, France, Germany, Italy, the Netherlands, Norway, Sweden, Switzerland and the UK. The main logistic support was provided by Institut Polaire Français Paul-Émile Victor and Programma Nazionale di Ricerche in Antartide (at Dome C) and Alfred-Wegener-Institut, Helmholtz-Zentrum für Polar- und Meeresforschung (at Dronning Maud Land). This is EPICA publication no. 328. H.F. gratefully acknowledges the long-term financial support by the Swiss National Science Foundation. We are also grateful to Andrea Burke for fruitful discussions, and to Gregory Teste for his valuable support with ice-core collection. In addition, we would like to thank Lyndsey Hendriks and Martin Tanner (TOFWERK AG, Thun, Switzerland) for their excellent technical assistance. We are grateful to the two anonymous reviewers for their exceptionally thoughtful and constructive reviews, which considerably improved both the clarity and the rigor of this work.
This research has been supported by the Marie Skłodowska-Curie (grant agreement no. 955750) and the Swiss National Science Foundation (grant nos. 200020-172506 and 200020B-200328, and 200021-236426).
This paper was edited by Yuzhen Yan and reviewed by two anonymous referees.
Aguilar-Carrillo, J., Villalobos, M., Pi-Puig, T., Escobar-Quiroz, I. N., and Romero, F. M.: Synergistic Arsenic(V) and Lead(II) Retention on Synthetic Jarosite. I. Simultaneous Structural Incorporation Behaviour and Mechanism, Environ. Sci. Process. Impacts, 20, 354–369, https://doi.org/10.1039/C7EM00426E, 2018. a
Ahn, Y.-Y., Nguyen, Q. A., Spolaor, A., Frassati, S., Barbaro, E., Cozzi, G., Turetta, C., Oh, H., Lee, J., and Kim, K.: Bromide Oxidation by Bromate in a Frozen Solution and Reactive Bromine Species Production, Water Res., 285, 124127, https://doi.org/10.1016/j.watres.2025.124127, 2025. a
Baccolo, G., Cibin, G., Delmonte, B., Hampai, D., Marcelli, A., Di Stefano, E., Macis, S., and Maggi, V.: The Contribution of Synchrotron Light for the Characterization of Atmospheric Mineral Dust in Deep Ice Cores: Preliminary Results from the Talos Dome Ice Core (East Antarctica), Condens. Matter, 3, https://doi.org/10.3390/condmat3030025, 2018. a, b, c, d, e
Baccolo, G., Delmonte, B., Di Stefano, E., Cibin, G., Crotti, I., Frezzotti, M., Hampai, D., Iizuka, Y., Marcelli, A., and Maggi, V.: Deep ice as a geochemical reactor: insights from iron speciation and mineralogy of dust in the Talos Dome ice core (East Antarctica), The Cryosphere, 15, 4807–4822, https://doi.org/10.5194/tc-15-4807-2021, 2021a. a, b, c, d, e, f, g, h, i, j, k, l, m, n, o, p
Baccolo, G., Delmonte, B., Niles, P. B., Cibin, G., Di Stefano, E., Hampai, D., Keller, L., Maggi, V., Marcelli, A., Michalski, J., Snead, C., and Frezzotti, M.: Jarosite Formation in Deep Antarctic Ice Provides a Window into Acidic, Water-Limited Weathering on Mars, Nat. Commun., 12, 436, https://doi.org/10.1038/s41467-020-20705-z, 2021b. a, b, c, d
Barbante, C. and the Beyond EPICA Team: Beyond EPICA – Oldest Ice Core: Insights from a 1.2-Million-Year-Old Climate Record, EGU General Assembly 2025, Vienna, Austria, 27 Apr–2 May 2025, EGU25-10358, https://doi.org/10.5194/egusphere-egu25-10358, 2025. a
Bari, A. S. M. F., Choppala, G., Lamb, D., Hamilton, J. L., Sathish, C. I., Rahman, M. M., Naidu, R., Aughterson, R., and Burton, E. D.: Is Beudantite a Stable Host Phase of Arsenic and Lead? New Insights from Molecular-Scale Kinetic Analyses, J. Hazard. Mater., 480, 136382, https://doi.org/10.1016/j.jhazmat.2024.136382, 2024. a
Bigler, M., Röthlisberger, R., Lambert, F., Wolff, E. W., Castellano, E., Udisti, R., Stocker, T. F., and Fischer, H.: Atmospheric Decadal Variability from High-Resolution Dome C Ice Core Records of Aerosol Constituents beyond the Last Interglacial, Quat. Sci. Rev., 29, 324–337, https://doi.org/10.1016/j.quascirev.2009.09.009, 2010. a
Bigler, M., Svensson, A., Kettner, E., Vallelonga, P., Nielsen, M. E., and Steffensen, J. P.: Optimization of High-Resolution Continuous Flow Analysis for Transient Climate Signals in Ice Cores, Environ. Sci. Technol., 45, 4483–4489, https://doi.org/10.1021/es200118j, 2011. a
Bogaerts, A. and Aghaei, M.: Inductively Coupled Plasma-Mass Spectrometry: Insights through Computer Modeling, J. Anal. At. Spectrom., 32, 233–261, https://doi.org/10.1039/C6JA00408C, 2017. a
Bohleber, P., Stoll, N., Larkman, P., Rhodes, R. H., and Clases, D.: New evidence on the microstructural localization of sulfur and chlorine in polar ice cores with implications for impurity diffusion, The Cryosphere, 19, 5485–5498, https://doi.org/10.5194/tc-19-5485-2025, 2025. a, b
Bouchet, M., Landais, A., Grisart, A., Parrenin, F., Prié, F., Jacob, R., Fourré, E., Capron, E., Raynaud, D., Lipenkov, V. Y., Loutre, M.-F., Extier, T., Svensson, A. M., Martinerie, P., Leuenberger, M. C., Jiang, W., Ritterbusch, F., Lu, Z.-T., and Yang, G.-M.: AICC2023, EDC, PANGAEA [data set], https://doi.org/10.1594/PANGAEA.961018, 2023. a, b, c
Brown, L. V., Pound, R. J., Jones, M. R., Rowlinson, M. J., Chance, R., Jacobi, H.-W., Frey, M. M., Archer, S. D., Arndt, S., Barten, J. G. M., Blomquist, B. W., Dadic, R., Ganzeveld, L. N., Hannula, H.-R., Helmig, D., Jaggi, M., Krampe, D., Macfarlane, A. R., Miller, S., Schneebeli, M., and Carpenter, L. J.: Iodine Speciation in Snow during the MOSAiC Expedition and Its Implications for Arctic Iodine Emissions, Faraday Discuss., 258, 441–472, https://doi.org/10.1039/D4FD00178H, 2025. a
Buriti, M. D. S., Cézac, P., and Casás, L.: Dissolution and Precipitation of Jarosite-Type Compounds: State of the Art and Future Perspectives, Comptes Rendus Chim., 27, 81–109, https://doi.org/10.5802/crchim.321, 2025. a, b
Chung, A., Parrenin, F., Mulvaney, R., Vittuari, L., Frezzotti, M., Zanutta, A., Lilien, D. A., Cavitte, M. G. P., and Eisen, O.: Age, thinning and spatial origin of the Beyond EPICA ice from a 2.5D ice flow model, The Cryosphere, 19, 4125–4140, https://doi.org/10.5194/tc-19-4125-2025, 2025. a
Cruells, M. and Roca, A.: Jarosites: Formation, Structure, Reactivity and Environmental, Metals, 12, 802, https://doi.org/10.3390/met12050802, 2022. a
Cullen, D. and Baker, I.: The Chemistry of Grain Boundaries in Greenland Ice, J. Glaciol., 46, 703–706, https://doi.org/10.3189/S0022143000212756, 2000. a
Currie, L. A.: Limits for Qualitative Detection and Quantitative Determination. Application to Radiochemistry, Anal. Chem., 40, 586–593, https://doi.org/10.1021/ac60259a007, 1968. a
Dash, J. G., Rempel, A. W., and Wettlaufer, J. S.: The Physics of Premelted Ice and Its Geophysical Consequences, Rev. Mod. Phys., 78, 695–741, https://doi.org/10.1103/RevModPhys.78.695, 2006. a, b, c
de Angelis, M., Tison, J.-L., Morel-Fourcade, M.-C., and Susini, J.: Micro-Investigation of EPICA Dome C Bottom Ice: Evidence of Long Term in Situ Processes Involving Acid–Salt Interactions, Mineral Dust, and Organic Matter, Quat. Sci. Rev., 78, 248–265, https://doi.org/10.1016/j.quascirev.2013.08.012, 2013. a, b, c, d, e, f, g
Delmonte, B.: Quaternary Variations and Origin of Continental Dust in East Antarctica, Ph.D. thesis, Università degli studi di Milano-Bicocca, 2003. a, b
Delmonte, B.: Single-Grain Mineralogical Data from Two Antarctic Ice Cores (Dome B, Dome C), PANGAEA [data set], https://doi.org/10.1594/PANGAEA.904601, 2019. a
Delmonte, B., Petit, J., and Maggi, V.: Glacial to Holocene Implications of the New 27000-Year Dust Record from the EPICA Dome C (East Antarctica) Ice Core, Clim. Dynam., 18, 647–660, https://doi.org/10.1007/s00382-001-0193-9, 2002. a, b, c
Delmonte, B., Petit, J. R., Basile-Doelsch, I., Jagoutz, E., and Maggi, V.: Late Quaternary Interglacials in East Antarctica from Ice-Core Dust Records, in: The Climate of Past Interglacials, edited by: Sirocko, F., Claussen, M., Goñi, M. F. S., and Litt, T., vol. 7 of Developments in Quaternary Sciences, 53–73, Elsevier, https://doi.org/10.1016/S1571-0866(07)80031-5, 2007. a, b
Durand, G., Weiss, J., Lipenkov, V., Barnola, J. M., Krinner, G., Parrenin, F., Delmonte, B., Ritz, C., Duval, P., Röthlisberger, R., and Bigler, M.: Effect of Impurities on Grain Growth in Cold Ice Sheets, J. Geophys. Res.-Earth Surf., 111, https://doi.org/10.1029/2005JF000320, 2006. a, b
Duval, P.: Grain Growth and Mechanical Behaviour of Polar Ice, Ann. Glaciol., 6, 79–82, https://doi.org/10.3189/1985AoG6-1-79-82, 1985. a
Ebdon, L., Foulkes, M. E., and Hill, S.: Direct Atomic Spectrometric Analysis by Slurry Atomisation. Part 9. Fundamental Studies of Refractory Samples, J. Anal. At. Spectrom., 5, 67–73, https://doi.org/10.1039/JA9900500067, 1990. a
Ehlmann, B. L., Swayze, G. A., Milliken, R. E., Mustard, J. F., Clark, R. N., Murchie, S. L., Breit, G. N., Wray, J. J., Gondet, B., Poulet, F., Carter, J., Calvin, W. M., Benzel, W. M., and Seelos, K. D.: Discovery of Alunite in Cross Crater, Terra Sirenum, Mars: Evidence for Acidic, Sulfurous Waters, Am. Mineralogist., 101, 1527–1542, https://doi.org/10.2138/am-2016-5574, 2016. a, b
Eichler, J., Weikusat, C., Wegner, A., Twarloh, B., Behrens, M., Fischer, H., Hörhold, M., Jansen, D., Kipfstuhl, S., Ruth, U., Wilhelms, F., and Weikusat, I.: Impurity Analysis and Microstructure Along the Climatic Transition From MIS 6 Into 5e in the EDML Ice Core Using Cryo-Raman Microscopy, Front. Earth Sci., 7, https://doi.org/10.3389/feart.2019.00020, 2019. a, b, c, d, e, f, g
Elderfield, H., Ferretti, P., Greaves, M., Crowhurst, S., McCave, I. N., Hodell, D., and Piotrowski, A. M.: Evolution of Ocean Temperature and Ice Volume Through the Mid-Pleistocene Climate Transition, Science, 337, 704–709, https://doi.org/10.1126/science.1221294, 2012. a
Elwood Madden, M. E., Bodnar, R. J., and Rimstidt, J. D.: Jarosite as an Indicator of Water-Limited Chemical Weathering on Mars, Nature, 431, 821–823, https://doi.org/10.1038/nature02971, 2004. a
Elwood Madden, M. E., Madden, A. S., Rimstidt, J. D., Zahrai, S., Kendall, M. R., and Miller, M. A.: Jarosite Dissolution Rates and Nanoscale Mineralogy, Geochim. Cosmochim. Ac., 91, 306–321, https://doi.org/10.1016/j.gca.2012.05.001, 2012. a
EPICA community members: Eight Glacial Cycles from an Antarctic Ice Core, Nature, 429, 623–628, https://doi.org/10.1038/nature02599, 2004. a, b, c
Erhardt, T., Jensen, C. M., Borovinskaya, O., and Fischer, H.: Single Particle Characterization and Total Elemental Concentration Measurements in Polar Ice Using Continuous Flow Analysis-Inductively Coupled Plasma Time-of-Flight Mass Spectrometry, Environ. Sci. Technol., 53, 13275–13283, https://doi.org/10.1021/acs.est.9b03886, 2019. a, b, c, d
Erhardt, T., Bigler, M., Federer, U., Gfeller, G., Leuenberger, D., Stowasser, O., Röthlisberger, R., Schüpbach, S., Ruth, U., Twarloh, B., Wegner, A., Goto-Azuma, K., Kuramoto, T., Kjær, H. A., Vallelonga, P. T., Siggaard-Andersen, M.-L., Hansson, M. E., Benton, A. K., Fleet, L. G., Mulvaney, R., Thomas, E. R., Abram, N., Stocker, T. F., and Fischer, H.: High-resolution aerosol concentration data from the Greenland NorthGRIP and NEEM deep ice cores, Earth Syst. Sci. Data, 14, 1215–1231, https://doi.org/10.5194/essd-14-1215-2022, 2022. a, b
Erhardt, T., Jensen, C. M., Adolphi, F., Kjær, H. A., Dallmayr, R., Twarloh, B., Behrens, M., Hirabayashi, M., Fukuda, K., Ogata, J., Burgay, F., Scoto, F., Crotti, I., Spagnesi, A., Maffezzoli, N., Segato, D., Paleari, C., Mekhaldi, F., Muscheler, R., Darfeuil, S., and Fischer, H.: High-resolution aerosol data from the top 3.8 kyr of the East Greenland Ice coring Project (EGRIP) ice core, Earth Syst. Sci. Data, 15, 5079–5091, https://doi.org/10.5194/essd-15-5079-2023, 2023. a, b, c, d
Faria, S. H., Weikusat, I., and Azuma, N.: The Microstructure of Polar Ice. Part I: Highlights from Ice Core Research, J. Struct. Geol., 61, 2–20, https://doi.org/10.1016/j.jsg.2013.09.010, 2014. a
Fischer, H., Siggaard-Andersen, M.-L., Ruth, U., Röthlisberger, R., and Wolff, E.: Glacial/Interglacial Changes in Mineral Dust and Sea-Salt Records in Polar Ice Cores: Sources, Transport, and Deposition, Rev. Geophys., 45, https://doi.org/10.1029/2005RG000192, 2007. a, b, c
Fischer, H., Severinghaus, J., Brook, E., Wolff, E., Albert, M., Alemany, O., Arthern, R., Bentley, C., Blankenship, D., Chappellaz, J., Creyts, T., Dahl-Jensen, D., Dinn, M., Frezzotti, M., Fujita, S., Gallee, H., Hindmarsh, R., Hudspeth, D., Jugie, G., Kawamura, K., Lipenkov, V., Miller, H., Mulvaney, R., Parrenin, F., Pattyn, F., Ritz, C., Schwander, J., Steinhage, D., van Ommen, T., and Wilhelms, F.: Where to find 1.5 million yr old ice for the IPICS “Oldest-Ice” ice core, Clim. Past, 9, 2489–2505, https://doi.org/10.5194/cp-9-2489-2013, 2013. a
Flores, E. M., Mello, P. A., Krzyzaniak, S. R., Cauduro, V. H., and Picoloto, R. S.: Challenges and Trends for Halogen Determination by Inductively Coupled Plasma Mass Spectrometry: A Review, Rapid Commun. Mass Spectrom., 34, e8727, https://doi.org/10.1002/rcm.8727, 2020. a
Frassati, S., Barbaro, E., Rossetti, C., Cozzi, G., Turetta, C., Scoto, F., Roman, M., Feltracco, M., Kim, K., Barbante, C., Gambaro, A., and Spolaor, A.: Inorganic Iodine and Bromine Speciation in Arctic Snow at Picogram-per-Grams Levels by IC-ICP-MS, J. Anal. Sci. Technol., 15, 49, https://doi.org/10.1186/s40543-024-00462-0, 2024. a, b
Fuchs, J., Aghaei, M., Schachel, T. D., Sperling, M., Bogaerts, A., and Karst, U.: Impact of the Particle Diameter on Ion Cloud Formation from Gold Nanoparticles in ICPMS, Anal. Chem., 90, 10271–10278, https://doi.org/10.1021/acs.analchem.8b02007, 2018. a, b
Fukazawa, H., Sugiyama, K., Mae, S., Narita, H., and Hondoh, T.: Acid Ions at Triple Junction of Antarctic Ice Observed by Raman Scattering, Geophys. Res. Lett., 25, 2845–2848, https://doi.org/10.1029/98GL02178, 1998. a, b
Gabrielli, P., Barbante, C., Boutron, C., Cozzi, G., Gaspari, V., Planchon, F., Ferrari, C., Turetta, C., Hong, S., and Cescon, P.: Variations in Atmospheric Trace Elements in Dome C (East Antarctica) Ice over the Last Two Climatic Cycles, Atmos. Environ., 39, 6420–6429, https://doi.org/10.1016/j.atmosenv.2005.07.025, 2005. a
Gabrielli, P., Wegner, A., Petit, J. R., Delmonte, B., De Deckker, P., Gaspari, V., Fischer, H., Ruth, U., Kriews, M., Boutron, C., Cescon, P., and Barbante, C.: A Major Glacial-Interglacial Change in Aeolian Dust Composition Inferred from Rare Earth Elements in Antarctic Ice, Quat. Sci. Rev., 29, 265–273, https://doi.org/10.1016/j.quascirev.2009.09.002, 2010. a
Gao, K., Hu, Y., Guo, C., Ke, C., He, C., Hao, X., Lu, G., and Dang, Z.: Effects of Adsorbed Phosphate on Jarosite Reduction by a Sulfate Reducing Bacterium and Associated Mineralogical Transformation, Ecotoxicol. Environ. Saf., 202, 110921, https://doi.org/10.1016/j.ecoenv.2020.110921, 2020. a
Gaspari, V., Barbante, C., Cozzi, G., Cescon, P., Boutron, C. F., Gabrielli, P., Capodaglio, G., Ferrari, C., Petit, J. R., and Delmonte, B.: Atmospheric Iron Fluxes over the Last Deglaciation: Climatic Implications, Geophys. Res. Lett., 33, https://doi.org/10.1029/2005GL024352, 2006. a
Ghermandi, G., Cecchi, R., Capotosto, M., and Marino, F.: Elemental Composition Determined by PIXE Analysis of the Insoluble Aerosol Particles in EPICA-Dome C Ice Core Samples Representing the Last 27000 Years, Geophys. Res. Lett., 30, https://doi.org/10.1029/2003GL018169, 2003. a
Goldich, S. S.: A Study in Rock-Weathering, J. Geol., 46, 17–58, 1938. a
Goodall, P., Foulkes, M. E., and Ebdon, L.: Slurry Nebulization Inductively Coupled Plasma Spectrometry-the Fundamental Parameters Discussed, Spectrochim. Acta Part B, 48, 1563–1577, https://doi.org/10.1016/0584-8547(93)80143-I, 1993. a
Gow, A. J. and Williamson, T.: Rheological Implications of the Internal Structure and Crystal Fabrics of the West Antarctic Ice Sheet as Revealed by Deep Core Drilling at Byrd Station, GSA Bull., 87, 1665–1677, https://doi.org/10.1130/0016-7606(1976)87<1665:RIOTIS>2.0.CO;2, 1976. a
Grigg, A. R. C., Wisawapipat, W., Barmettler, K., Schulz, K., Notini, L., ThomasArrigo, L. K., and Kretzschmar, R.: Stability and Transformation of Jarosite and Al-substituted Jarosite in an Acid Sulfate Paddy Soil under Laboratory and Field Conditions, Geochim. Cosmochim. Ac., 382, 128–141, https://doi.org/10.1016/j.gca.2024.07.026, 2024. a, b
Gundlach-Graham, A.: Chapter Three – Multiplexed and Multi-Metal Single-Particle Characterization with ICP-TOFMS, in: Analysis and Characterisation of Metal-Based Nanomaterials, edited by: Milačič, R., Ščančar, J., Goenaga-Infante, H., and Vidmar, J., vol. 93 of Comprehensive Analytical Chemistry, 69–101, Elsevier, https://doi.org/10.1016/bs.coac.2021.01.008, 2021. a, b
Gundlach-Graham, A., Hendriks, L., Mehrabi, K., and Günther, D.: Monte Carlo Simulation of Low-Count Signals in Time-of-Flight Mass Spectrometry and Its Application to Single-Particle Detection, Anal. Chem., 90, 11847–11855, https://doi.org/10.1021/acs.analchem.8b01551, 2018. a
Harycki, S. and Gundlach-Graham, A.: Characterization of a High-Sensitivity ICP-TOFMS Instrument for Microdroplet, Nanoparticle, and Microplastic Analyses, J. Anal. At. Spectrom., 38, 111–120, https://doi.org/10.1039/D2JA00295G, 2023. a
Hendriks, L., Gundlach-Graham, A., and Günther, D.: Performance of Sp-ICP-TOFMS with Signal Distributions Fitted to a Compound Poisson Model, J. Anal. At. Spectrom., 34, 1900–1909, https://doi.org/10.1039/C9JA00186G, 2019. a
Ho, K.-S., Lui, K.-O., Lee, K.-H., and Chan, W.-T.: Considerations of Particle Vaporization and Analyte Diffusion in Single-Particle Inductively Coupled Plasma-Mass Spectrometry, Spectrochim. Acta Part B, 89, 30–39, https://doi.org/10.1016/j.sab.2013.08.012, 2013. a
Humphrey, O. S., Young, S. D., Bailey, E. H., Crout, N. M. J., Ander, E. L., and Watts, M. J.: Iodine Soil Dynamics and Methods of Measurement: A Review, Environ. Sci. Process. Impacts, 20, 288–310, https://doi.org/10.1039/C7EM00491E, 2018. a
Iizuka, Y., Horikawa, S., Sakurai, T., Johnson, S., Dahl-Jensen, D., Steffensen, J. P., and Hondoh, T.: A Relationship between Ion Balance and the Chemical Compounds of Salt Inclusions Found in the Greenland Ice Core Project and Dome Fuji Ice Cores, J. Geophys. Res.-Atmos., 113, https://doi.org/10.1029/2007JD009018, 2008. a, b, c
Jambor, J. L.: Nomenclature of the Alunite Supergroup, Can. Mineralogist., 37, 1323–1341, 1999. a
Jouzel, J. and Masson-Delmotte, V.: EPICA Dome C Ice Core 800KYr Deuterium Data and Temperature Estimates, PANGAEA [data set], https://doi.org/10.1594/PANGAEA.683655, 2007. a, b
Kaplan, D. I., Serne, R. J., Parker, K. E., and Kutnyakov, I. V.: Iodide Sorption to Subsurface Sediments and Illitic Minerals, Environ. Sci. Technol., 34, 399–405, https://doi.org/10.1021/es990220g, 2000. a
Karkee, H. and Gundlach-Graham, A.: Characterization and Quantification of Natural and Anthropogenic Titanium-Containing Particles Using Single-Particle ICP-TOFMS, Environ. Sci. Technol., 57, 14058–14070, https://doi.org/10.1021/acs.est.3c04473, 2023. a, b
Kaufmann, P. R., Federer, U., Hutterli, M. A., Bigler, M., Schüpbach, S., Ruth, U., Schmitt, J., and Stocker, T. F.: An Improved Continuous Flow Analysis System for High-Resolution Field Measurements on Ice Cores, Environ. Sci. Technol., 42, 8044–8050, https://doi.org/10.1021/es8007722, 2008. a, b
Keith, W. J., Calk, L., and Ashley, R. P.: Crystals of Coexisting Alunite and Jarosite, Goldfield, Nevada, Tech. Rep. 1124-C, U.S. Geological Survey, ISSN 2330-7102, https://doi.org/10.3133/pp1124C, 1980. a, b
Kim, K., Yabushita, A., Okumura, M., Saiz-Lopez, A., Cuevas, C. A., Blaszczak-Boxe, C. S., Min, D. W., Yoon, H.-I., and Choi, W.: Production of Molecular Iodine and Tri-iodide in the Frozen Solution of Iodide: Implication for Polar Atmosphere, Environ. Sci. Technol., 50, 1280–1287, https://doi.org/10.1021/acs.est.5b05148, 2016. a, b
Kim, K., Menacherry, S. P. M., Kim, J., Chung, H. Y., Jeong, D., Saiz-Lopez, A., and Choi, W.: Simultaneous and Synergic Production of Bioavailable Iron and Reactive Iodine Species in Ice, Environ. Sci. Technol., 53, 7355–7362, https://doi.org/10.1021/acs.est.8b06659, 2019. a, b
Kjær, H. A., Vallelonga, P., Svensson, A., Elleskov L. Kristensen, M., Tibuleac, C., Winstrup, M., and Kipfstuhl, S.: An Optical Dye Method for Continuous Determination of Acidity in Ice Cores, Environ. Sci. Technol., 50, 10485–10493, https://doi.org/10.1021/acs.est.6b00026, 2016. a
Koffman, B. G., Handley, M. J., Osterberg, E. C., Wells, M. L., and Kreutz, K. J.: Dependence of Ice-Core Relative Trace-Element Concentration on Acidification, J. Glaciol., 60, 103–112, https://doi.org/10.3189/2014JoG13J137, 2014. a
Köhler, S. J., Dufaud, F., and Oelkers, E. H.: An Experimental Study of Illite Dissolution Kinetics as a Function of Ph from 1.4 to 12.4 and Temperature from 5 to 50 °C, Geochim. Cosmochim. Ac., 67, 3583–3594, https://doi.org/10.1016/S0016-7037(03)00163-7, 2003. a, b
Kosmulski, M.: Compilation of PZC and IEP of Sparingly Soluble Metal Oxides and Hydroxides from Literature, Adv. Colloid Interface Sci., 152, 14–25, https://doi.org/10.1016/j.cis.2009.08.003, 2009. a
Kutuzov, S., Olesik, J. W., Lomax-Vogt, M. C., Carter, L. M., Lowry, G. V., Bland, G. D., Wielinski, J., Sullivan, R. C., and Gabrielli, P.: Geochemical Characterization of Millions of Individual Atmospheric Particles Entrapped in Antarctic Ice across the Last Glacial-Interglacial Transition, Sci. Rep., 16, 10556, https://doi.org/10.1038/s41598-026-45260-3, 2026. a, b, c
Laborda, F., Abad-Álvaro, I., Jiménez, M. S., and Bolea, E.: Catching Particles by Atomic Spectrometry: Benefits and Limitations of Single Particle – Inductively Coupled Plasma Mass Spectrometry, Spectrochim. Acta Part B, 199, 106570, https://doi.org/10.1016/j.sab.2022.106570, 2023. a
Lambert, F., Delmonte, B., Petit, J. R., Bigler, M., Kaufmann, P. R., Hutterli, M. A., Stocker, T. F., Ruth, U., Steffensen, J. P., and Maggi, V.: Dust-Climate Couplings over the Past 800,000 Years from the EPICA Dome C Ice Core, Nature, 452, 616–619, https://doi.org/10.1038/nature06763, 2008. a, b, c, d, e, f
Lambert, F., Bigler, M., Steffensen, J. P., Hutterli, M., and Fischer, H.: Centennial mineral dust variability in high-resolution ice core data from Dome C, Antarctica, Clim. Past, 8, 609–623, https://doi.org/10.5194/cp-8-609-2012, 2012a. a, b
Lambert, F., Bigler, M., Steffensen, J. P., Hutterli, M. A., and Fischer, H.: EDC Calcium and Dust Concentrations, PANGAEA [data set], https://doi.org/10.1594/PANGAEA.780540, 2012b. a, b
Lanci, L., Delmonte, B., Salvatore, M. C., and Baroni, C.: Insight Into Provenance and Variability of Atmospheric Dust in Antarctic Ice Cores During the Late Pleistocene From Magnetic Measurements, Front. Earth Sci., 8, https://doi.org/10.3389/feart.2020.00258, 2020. a
Lanci, L., Delmonte, B., Mattioli, M., Valentini, L., Baccolo, G., Niles, P. B., Di Stefano, E., Maggi, V., and Bertler, N.: Englacial Authigenesis in Deep Antarctic Ice: Implications for Martian Dust Oxidation, Commun. Earth Environ., https://doi.org/10.1038/s43247-026-04076-9, 2026. a, b, c, d, e, f, g, h, i, j, k
Landais, A. and Stenni, B.: Water Stable Isotopes (dD, d18O) from EPICA Dome C Ice Core (Antarctica) (0–800 Ka), PANGAEA [data set], https://doi.org/10.1594/PANGAEA.934094, 2021. a
Lecavalier, B. S., Tarasov, L., Balco, G., Spector, P., Hillenbrand, C.-D., Buizert, C., Ritz, C., Leduc-Leballeur, M., Mulvaney, R., Whitehouse, P. L., Bentley, M. J., and Bamber, J.: Antarctic Ice Sheet paleo-constraint database, Earth Syst. Sci. Data, 15, 3573–3596, https://doi.org/10.5194/essd-15-3573-2023, 2023. a, b, c
Lee, G.: Bin-count extraction and split-event correction for single-particle ICP-TOF-MS ice-core data (v1.0.0) (Version v1.0.0), Zenodo [software], https://doi.org/10.5281/zenodo.22208733, 2026. a
Lee, G., Erhardt, T., Larkman, P., Zeppenfeld, C., Jackson, S., and Fischer, H.: Single-particle elemental composition datasets and ice grain information of EPICA Dome C ice core, Zenodo [data set], https://doi.org/10.5281/zenodo.21510434, 2026. a
Lee, W.-W. and Chan, W.-T.: Calibration of Single-Particle Inductively Coupled Plasma-Mass Spectrometry (SP-ICP-MS), J. Anal. At. Spectrom., 30, 1245–1254, https://doi.org/10.1039/C4JA00408F, 2015. a
Li, J., Zhou, H., Wang, Y., Xie, X., and Qian, K.: Sorption and Speciation of Iodine in Groundwater System: The Roles of Organic Matter and Organic-Mineral Complexes, J. Contam. Hydrol., 201, 39–47, https://doi.org/10.1016/j.jconhyd.2017.04.008, 2017. a, b
Lide, D. R., ed.: CRC Handbook of Chemistry and Physics, vol. 128, CRC Press/Taylor & Francis Group, Boca Raton, FL, 86th edn., ISBN 0-8493-0486-5, https://doi.org/10.1021/ja059868l, 2006. a
Lisiecki, L. E. and Raymo, M. E.: A Pliocene-Pleistocene Stack of 57 Globally Distributed Benthic δ18O Records, Paleoceanography, 20, https://doi.org/10.1029/2004PA001071, 2005. a
Lomax-Vogt, M., Carter, L. M., Wielinski, J., Kutuzov, S., Lowry, G. V., Sullivan, R., Gabrielli, P., and Olesik, J. W.: Challenges in Measuring Nanoparticles and Microparticles by Single Particle ICP-QMS and ICP-TOFMS: Size-Dependent Transport Efficiency and Limited Linear Dynamic Range, J. Anal. At. Spectrom., 40, 848–859, https://doi.org/10.1039/D4JA00425F, 2025. a, b
Long, D. T., Fegan, N. E., Lyons, W. B., Hines, M. E., Macumber, P. G., and Giblin, A. M.: Geochemistry of Acid Brines: Lake Tyrrell, Victoria, Australia, Chem. Geol., 96, 33–52, https://doi.org/10.1016/0009-2541(92)90120-T, 1992a. a, b, c, d, e, f
Long, D. T., Fegan, N. E., McKee, J. D., Lyons, W. B., Hines, M. E., and Macumber, P. G.: Formation of Alunite, Jarosite and Hydrous Iron Oxides in a Hypersaline System: Lake Tyrrell, Victoria, Australia, Chem. Geol., 96, 183–202, https://doi.org/10.1016/0009-2541(92)90128-R, 1992b. a, b, c, d, e
Lunga, D. D., Müller, W., Rasmussen, S. O., and Svensson, A.: Location of Cation Impurities in NGRIP Deep Ice Revealed by Cryo-Cell UV-laser-ablation ICPMS, J. Glaciol., 60, 970–988, https://doi.org/10.3189/2014JoG13J199, 2014. a
Macumber, P. G.: Interaction between Groundwater and Surface Systems in Northern Victoria, Department of Conservation and Environment, 1991. a
Mader, H. M.: Observations of the Water-Vein System in Polycrystalline Ice, J. Glaciol., 38, 333–347, https://doi.org/10.3189/S0022143000002227, 1992. a
Marino, F., Castellano, E., Ceccato, D., De Deckker, P., Delmonte, B., Ghermandi, G., Maggi, V., Petit, J. R., Revel-Rolland, M., and Udisti, R.: Defining the Geochemical Composition of the EPICA Dome C Ice Core Dust during the Last Glacial-Interglacial Cycle, Geochem. Geophys. Geosystems, 9, https://doi.org/10.1029/2008GC002023, 2008. a
Mulvaney, R., Wolff, E. W., and Oates, K.: Sulphuric Acid at Grain Boundaries in Antarctic Ice, Nature, 331, 247–249, https://doi.org/10.1038/331247a0, 1988. a, b, c
Nagata, T. and Fukushi, K.: Prediction of Iodate Adsorption and Surface Speciation on Oxides by Surface Complexation Modeling, Geochim. Cosmochim. Ac., 74, 6000–6013, https://doi.org/10.1016/j.gca.2010.08.002, 2010. a
Nagata, T., Fukushi, K., and Takahashi, Y.: Prediction of Iodide Adsorption on Oxides by Surface Complexation Modeling with Spectroscopic Confirmation, J. Colloid Interface Sci., 332, 309–316, https://doi.org/10.1016/j.jcis.2008.12.037, 2009. a
Nousiainen, T. and Kandler, K.: Light Scattering by Atmospheric Mineral Dust Particles, in: Light Scattering Reviews 9: Light Scattering and Radiative Transfer, edited by: Kokhanovsky, A. A., 3–52, Springer, Berlin, Heidelberg, ISBN 978-3-642-37985-7, https://doi.org/10.1007/978-3-642-37985-7_1, 2015. a
Nye, J. F.: The Geometry of Water Veins and Nodes in Polycrystalline Ice, J. Glaciol., 35, 17–22, https://doi.org/10.3189/002214389793701437, 1989. a
Ohno, H., Igarashi, M., and Hondoh, T.: Salt Inclusions in Polar Ice Core: Location and Chemical Form of Water-Soluble Impurities, Earth Planet. Sci. Lett., 232, 171–178, https://doi.org/10.1016/j.epsl.2005.01.001, 2005. a
Ohno, H., Igarashi, M., and Hondoh, T.: Characteristics of Salt Inclusions in Polar Ice from Dome Fuji, East Antarctica, Geophys. Res. Lett., 33, https://doi.org/10.1029/2006GL025774, 2006. a, b, c, d
Ohno, H., Iizuka, Y., Horikawa, S., Sakurai, T., Hondoh, T., and Motoyama, H.: Potassium Alum and Aluminum Sulfate Micro-Inclusions in Polar Ice from Dome Fuji, East Antarctica, Polar Sci., 8, 1–9, https://doi.org/10.1016/j.polar.2013.11.003, 2014. a, b, c
Olesik, J. W. and Gray, P. J.: Considerations for Measurement of Individual Nanoparticles or Microparticles by ICP-MS: Determination of the Number of Particles and the Analyte Mass in Each Particle, J. Anal. At. Spectrom., 27, 1143–1155, https://doi.org/10.1039/C2JA30073G, 2012. a
Oliveira, A. A., Trevizan, L. C., and Nóbrega, J. A.: REVIEW: Iodine Determination by Inductively Coupled Plasma Spectrometry, Appl. Spectrosc. Rev., 45, 447–473, https://doi.org/10.1080/05704928.2010.502207, 2010. a
Pace, H. E., Rogers, N. J., Jarolimek, C., Coleman, V. A., Higgins, C. P., and Ranville, J. F.: Determining Transport Efficiency for the Purpose of Counting and Sizing Nanoparticles via Single Particle Inductively Coupled Plasma Mass Spectrometry, Anal. Chem., 83, 9361–9369, https://doi.org/10.1021/ac201952t, 2011. a
Palandri, J. L. and Kharaka, Y. K.: A Compilation of Rate Parameters of Water-Mineral Interaction Kinetics for Application to Geochemical Modeling, Tech. Rep. 2004-1068, U.S. Geological Survey, ISSN 2331-1258, https://doi.org/10.3133/ofr20041068, 2004. a
Paleari, C. I., Delmonte, B., Andò, S., Garzanti, E., Petit, J. R., and Maggi, V.: Aeolian Dust Provenance in Central East Antarctica During the Holocene: Environmental Constraints From Single-Grain Raman Spectroscopy, Geophys. Res. Lett., 46, 9968–9979, https://doi.org/10.1029/2019GL083402, 2019. a
Papike, J. J., Karner, J. M., and Shearer, C. K.: Comparative Planetary Mineralogy: Implications of Martian and Terrestrial Jarosite. A Crystal Chemical Perspective, Geochim. Cosmochim. Ac., 70, 1309–1321, https://doi.org/10.1016/j.gca.2005.11.004, 2006. a, b, c, d, e
Pincock, R. E.: Reactions in Frozen Systems, Acc. Chem. Res., 2, 97–103, https://doi.org/10.1021/ar50016a001, 1969. a
Potenza, M. a. C., Albani, S., Delmonte, B., Villa, S., Sanvito, T., Paroli, B., Pullia, A., Baccolo, G., Mahowald, N., and Maggi, V.: Shape and Size Constraints on Dust Optical Properties from the Dome C Ice Core, Antarctica, Sci. Rep., 6, 28162, https://doi.org/10.1038/srep28162, 2016. a
Ralph, J., Von Bargen, D., Martynov, P., Zhang, J., Que, X., Prabhu, A., Morrison, S. M., Li, W., Chen, W., and Ma, X.: Mindat.Org: The Open Access Mineralogy Database to Accelerate Data-Intensive Geoscience Research, Am. Mineralogist., 110, 833–844, https://doi.org/10.2138/am-2024-9486, 2025. a
Rempel, A. W., Waddington, E. D., Wettlaufer, J. S., and Worster, M. G.: Possible Displacement of the Climate Signal in Ancient Ice by Premelting and Anomalous Diffusion, Nature, 411, 568–571, https://doi.org/10.1038/35079043, 2001. a
Rhodes, R. H., Baker, J. A., Millet, M.-A., and Bertler, N. A. N.: Experimental Investigation of the Effects of Mineral Dust on the Reproducibility and Accuracy of Ice Core Trace Element Analyses, Chem. Geol., 286, 207–221, https://doi.org/10.1016/j.chemgeo.2011.05.006, 2011. a
Simonsen, M. F., Cremonesi, L., Baccolo, G., Bosch, S., Delmonte, B., Erhardt, T., Kjær, H. A., Potenza, M., Svensson, A., and Vallelonga, P.: Particle shape accounts for instrumental discrepancy in ice core dust size distributions, Clim. Past, 14, 601–608, https://doi.org/10.5194/cp-14-601-2018, 2018. a
Spolaor, A., Vallelonga, P., Gabrieli, J., Kehrwald, N., Turetta, C., Cozzi, G., Poto, L., Plane, J. M. C., Boutron, C., and Barbante, C.: Speciation Analysis of Iodine and Bromine at Picogram-per-Gram Levels in Polar Ice, Anal. Bioanal. Chem., 405, 647–654, https://doi.org/10.1007/s00216-012-5806-0, 2013a. a
Spolaor, A., Vallelonga, P., Plane, J. M. C., Kehrwald, N., Gabrieli, J., Varin, C., Turetta, C., Cozzi, G., Kumar, R., Boutron, C., and Barbante, C.: Halogen species record Antarctic sea ice extent over glacial–interglacial periods, Atmos. Chem. Phys., 13, 6623–6635, https://doi.org/10.5194/acp-13-6623-2013, 2013b. a
Stoffregen, R. E., Alpers, C. N., and Jambor, J. L.: Alunite-Jarosite Crystallography, Thermodynamics, and Geochronology, Rev. Mineral. Geochem., 40, 453–479, https://doi.org/10.2138/rmg.2000.40.9, 2000. a, b, c
Stoll, N., Eichler, J., Hörhold, M., Shigeyama, W., and Weikusat, I.: A Review of the Microstructural Location of Impurities in Polar Ice and Their Impacts on Deformation, Front. Earth Sci., 8, https://doi.org/10.3389/feart.2020.615613, 2021. a, b, c
Stoll, N., Hörhold, M., Erhardt, T., Eichler, J., Jensen, C., and Weikusat, I.: Microstructure, micro-inclusions, and mineralogy along the EGRIP (East Greenland Ice Core Project) ice core – Part 2: Implications for palaeo-mineralogy, The Cryosphere, 16, 667–688, https://doi.org/10.5194/tc-16-667-2022, 2022. a
Stoll, N., Westhoff, J., Bohleber, P., Svensson, A., Dahl-Jensen, D., Barbante, C., and Weikusat, I.: Chemical and visual characterisation of EGRIP glacial ice and cloudy bands within, The Cryosphere, 17, 2021–2043, https://doi.org/10.5194/tc-17-2021-2023, 2023. a
Stoll, N., Clases, D., Gonzalez de Vega, R., Elinkmann, M., Larkman, P., and Bohleber, P.: Single particle ICP-TOFMS on previously characterised EGRIP ice core samples: new approaches, limitations, and challenges, The Cryosphere, 20, 663–682, https://doi.org/10.5194/tc-20-663-2026, 2026. a
Svensson, A., Biscaye, P. E., and Grousset, F. E.: Characterization of Late Glacial Continental Dust in the Greenland Ice Core Project Ice Core, J. Geophys. Res.-Atmos., 105, 4637–4656, https://doi.org/10.1029/1999JD901093, 2000. a
Szakas, S. E. and Gundlach-Graham, A.: Isotopic Ratio Analysis of Individual Sub-Micron Particles via spICP-TOFMS, J. Anal. At. Spectrom., 39, 1874–1884, https://doi.org/10.1039/D4JA00121D, 2024. a
Tison, J.-L., de Angelis, M., Littot, G., Wolff, E., Fischer, H., Hansson, M., Bigler, M., Udisti, R., Wegner, A., Jouzel, J., Stenni, B., Johnsen, S., Masson-Delmotte, V., Landais, A., Lipenkov, V., Loulergue, L., Barnola, J.-M., Petit, J.-R., Delmonte, B., Dreyfus, G., Dahl-Jensen, D., Durand, G., Bereiter, B., Schilt, A., Spahni, R., Pol, K., Lorrain, R., Souchez, R., and Samyn, D.: Retrieving the paleoclimatic signal from the deeper part of the EPICA Dome C ice core, The Cryosphere, 9, 1633–1648, https://doi.org/10.5194/tc-9-1633-2015, 2015. a, b
Traversi, R., Becagli, S., Castellano, E., Marino, F., Rugi, F., Severi, M., de Angelis, M., Fischer, H., Hansson, M., Stauffer, B., Steffensen, J. P., Bigler, M., and Udisti, R.: Sulfate Spikes in the Deep Layers of EPICA-Dome C Ice Core: Evidence of Glaciological Artifacts, Environ. Sci. Technol., 43, 8737–8743, https://doi.org/10.1021/es901426y, 2009. a, b, c
Vallelonga, P., Maffezzoli, N., Saiz-Lopez, A., Scoto, F., Kjær, H. A., and Spolaor, A.: Sea-Ice Reconstructions from Bromine and Iodine in Ice Cores, Quat. Sci. Rev., 269, 107133, https://doi.org/10.1016/j.quascirev.2021.107133, 2021. a
Wang, G., Qafoku, N. P., Szecsody, J. E., Strickland, C. E., Brown, C. F., and Freedman, V. L.: Time-Dependent Iodate and Iodide Adsorption to Fe Oxides, ACS Earth Space Chem., 3, 2415–2420, https://doi.org/10.1021/acsearthspacechem.9b00145, 2019. a, b
Wegner, A., Gabrielli, P., Wilhelms-Dick, D., Ruth, U., Kriews, M., De Deckker, P., Barbante, C., Cozzi, G., Delmonte, B., and Fischer, H.: Change in dust variability in the Atlantic sector of Antarctica at the end of the last deglaciation, Clim. Past, 8, 135–147, https://doi.org/10.5194/cp-8-135-2012, 2012. a
Westhoff, J., Ardoin, L., Weikusat, I., Blard, P. H., Fripiat, F., Seth, B., Soussaintjean, L., Krebs, M., Bouchet, M., Chung, A., Scoto, F., Lemburg, J., Lawer, G., Hüther, M., Stoll, N., Rathmann, N., Morici, L. C., Tison, J.-L., Eisen, O., Lilien, D., Mulvaney, R., Stocker, T., Koldtoft, I., Boeckmann, G., Hansen, S., Parrenin, F., Pattyn, F., Isaksson, E., Hansson, M., van de Wal, R., Fischer, H., Landais, A., Barbante, C., Dahl-Jensen, D., and Wilhelms, F.: 316 m of Ice beyond the Stratified Sections of the Beyond EPICA Little Dome C Ice Core, Research Square [preprint], https://doi.org/10.21203/rs.3.rs-9883712/v1, 2026. a
Wilson, M. J.: Weathering of the Primary Rock-Forming Minerals: Processes, Products and Rates, Clay Miner., 39, 233–266, https://doi.org/10.1180/0009855043930133, 2004. a
Wolff, E. W. and Paren, J. G.: A Two-Phase Model of Electrical Conduction in Polar Ice Sheets, J. Geophys. Res.-Sol. Ea., 89, 9433–9438, https://doi.org/10.1029/JB089iB11p09433, 1984. a
Wolff, E. W., Mulvaney, R., and Oates, K.: The Location of Impurities in Antarctic Ice, Ann. Glaciol., 11, 194–197, https://doi.org/10.3189/S026030550003528X, 1988. a
Wolff, E. W., Fischer, H., Fundel, F., Ruth, U., Twarloh, B., Littot, G. C., Mulvaney, R., Röthlisberger, R., de Angelis, M., Boutron, C. F., Hansson, M., Jonsell, U., Hutterli, M. A., Lambert, F., Kaufmann, P., Stauffer, B., Stocker, T. F., Steffensen, J. P., Bigler, M., Siggaard-Andersen, M. L., Udisti, R., Becagli, S., Castellano, E., Severi, M., Wagenbach, D., Barbante, C., Gabrielli, P., and Gaspari, V.: Southern Ocean Sea-Ice Extent, Productivity and Iron Flux over the Past Eight Glacial Cycles, Nature, 440, 491–496, https://doi.org/10.1038/nature04614, 2006. a
Wolff, E. W., Barbante, C., Becagli, S., Bigler, M., Boutron, C. F., Castellano, E., de Angelis, M., Federer, U., Fischer, H., Fundel, F., Hansson, M., Hutterli, M., Jonsell, U., Karlin, T., Kaufmann, P., Lambert, F., Littot, G. C., Mulvaney, R., Röthlisberger, R., Ruth, U., Severi, M., Siggaard-Andersen, M. L., Sime, L. C., Steffensen, J. P., Stocker, T. F., Traversi, R., Twarloh, B., Udisti, R., Wagenbach, D., and Wegner, A.: Changes in Environment over the Last 800,000 Years from Chemical Analysis of the EPICA Dome C Ice Core, Quat. Sci. Rev., 29, 285–295, https://doi.org/10.1016/j.quascirev.2009.06.013, 2010. a
- Abstract
- Introduction
- Method
- Results and discussion
- Conclusions
- Appendix A: Geochemical alteration process
- Appendix B: Calibration standards
- Appendix C: Limit of detection (LOD)
- Appendix D: Dissolution of Al–Ca-bearing silicate particles
- Code and data availability
- Author contributions
- Competing interests
- Disclaimer
- Acknowledgements
- Financial support
- Review statement
- References
- Abstract
- Introduction
- Method
- Results and discussion
- Conclusions
- Appendix A: Geochemical alteration process
- Appendix B: Calibration standards
- Appendix C: Limit of detection (LOD)
- Appendix D: Dissolution of Al–Ca-bearing silicate particles
- Code and data availability
- Author contributions
- Competing interests
- Disclaimer
- Acknowledgements
- Financial support
- Review statement
- References