
the Creative Commons Attribution 4.0 License.
the Creative Commons Attribution 4.0 License.
 | 10 Nov 2026
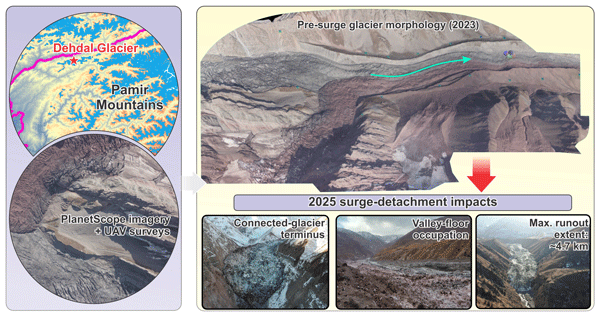
A surge-detachment sequence at Dehdal Glacier in the Pamir Mountains, revealed by daily PlanetScope imagery
Mustafo Safarov
Junli Li

Evan Miles
Majid Gulayozov
Ruonan Li
Ali Fazylov
Kamoliddin Nazirzoda
Firdavs Vosidov
Murodkhudzha Murodov
Hofiz Navruzshoev
Ardamehr Halimov
Surge-type behaviour and low-angle glacier detachment are distinct but potentially linked forms of dynamic instability that remain insufficiently documented in small debris-covered mountain glaciers. This study investigates the 2025–2026 event at Dehdal Glacier in the northwestern Pamirs, which we interpret as a surge-detachment sequence, using daily PlanetScope imagery. Multi-epoch uncrewed aerial vehicle (UAV) orthomosaics and digital elevation model (DEM) differencing from 2019 to 2023 reveal pre-event mass redistribution, evidenced by surface thickening of the central tongue and surface lowering in both the upper glacier and the distal tongue, indicating pre-surge ice mass redistribution. Daily PlanetScope imagery documents visible surface deformation before the first detachment, renewed advance of the dynamically connected glacier tongue following the first detachment, and widespread acceleration coincident with the second detachment. Together, these observations support a surge–detachment sequence rather than an isolated glacier detachment. Two low-angle detachments displaced ice up to 4.7 km down-valley, depositing an estimated 4–5×10⁶ m3 of ice on the valley floor. By 12 January 2026, the glacier had largely stabilized, with the primary glacier tongue covering approximately 1.83 km2 and a detached ice mass of about 0.26 km2 persisting farther downstream, resulting in a total ice area of roughly 2.09 km2. Notably, the recurrence interval of 9–10 years since the previous surge is substantially shorter than the earlier intervals of approximately 20–45 years. This shortened interval is unlikely to reflect complete reservoir regeneration, and no clear seismic trigger was identified. The event occurred during warmer, drier conditions than the 1981–2010 baseline, with mean monthly temperature anomalies reaching +1.11 °C. These findings provide new insights into glacier flow instabilities in High Mountain Asia and highlight the geomorphic impacts of surge-related acceleration followed by localized mechanical detachment in small debris-affected mountain glaciers.
- Article
(17507 KB) - Full-text XML
-
Supplement
(824 KB) - BibTeX
- EndNote


Surge-type glaciers represent a distinct class of dynamic ice mass characterized by quasi-cyclic transitions between prolonged quiescent phases and short-lived episodes of rapid flow (Meier and Post, 1969; Sevestre and Benn, 2015; Farinotti et al., 2020). During these surge phases, glacier velocities can increase by one to two orders of magnitude, leading to significant glacier advances, intense crevassing, and rapid redistribution of ice and debris onto valley floors (Raymond, 1987; Jiskoot, 2011). Such events can have a pronounced impact on downstream hydrology, temporarily block river channels, and trigger secondary geomorphic hazards (Muhammad et al., 2021; Murodov et al., 2024; Lovell et al., 2026).
Despite decades of research, the coupled mechanical-hydrological processes governing the initiation, propagation, and termination of glacier surges remain incompletely understood (Kamb et al., 1985; Clarke, 1987; Fowler et al., 2001; Sevestre and Benn, 2015; Benn et al., 2019; Lovell et al., 2026), especially in steep, debris-covered mountain glaciers, where factors such as basal drainage efficiency, enthalpy conditions, and valley confinement interact (Benn et al., 2012; Faillettaz et al., 2015; Gilbert et al., 2018). Various thermal, hydrological, and mechanical mechanisms have been proposed to account for surge behaviour, including transitions between cold-based and temperate basal regimes (Fowler et al., 2001; Sevestre et al., 2015), pressurization of subglacial drainage systems, and stress redistribution within debris-covered tongues (Ravier et al., 2023; Sevestre and Benn, 2015). Within the enthalpy-balance framework, surge onset may occur when changes in glacier mass and enthalpy conditions drive the glacier toward a critical dynamic state associated with surge activation (Benn et al., 2019). However, most reconstructions rely on annual to multi-annual satellite observations (Quincey et al., 2011; Goerlich et al., 2020; Guillet et al., 2022), which are insufficient for capturing short-term kinematic transitions during surge onset, internally propagating stress fronts, or multi-phase detachments (Lovell et al., 2026).
Recent research in High Mountain Asia has identified instances of glacier detachment and large-scale ice failures in association with glacier surging (Leinss et al., 2021; Zou et al., 2023; Kääb et al., 2026), but the transition from progressive surge acceleration to large-scale ice detachment remains poorly documented. Here, we distinguish glacier surging, defined as rapid, internally propagating acceleration and mass redistribution within a dynamically connected glacier, from glacier detachment, which involves mechanical separation and subsequent independent displacement of an ice mass. Although these processes share mechanical similarities, such as basal decoupling and rapid mass displacement (Kääb et al., 2021), they are typically treated separately in the literature (Faillettaz et al., 2015; Zhang et al., 2023). The potential connection between classical surge behaviour and low-angle glacier detachment has not been thoroughly explored, especially in the context of small debris-covered glaciers in confined valleys (Leinss et al., 2021; Zhang et al., 2023).
Globally, surge-type glaciers are not randomly distributed but occur in distinct geographical clusters, including Alaska, the Yukon, Svalbard, Iceland, the Karakoram, and the Pamirs (Bhambri et al., 2017; Altena et al., 2019; Lovell et al., 2026; Strozzi et al., 2026; Safarov et al., 2026). Their distribution is thought to reflect a combination of climatic, topographic, and basal conditions, particularly the interaction between precipitation regime, thermal conditions, glacier hypsometry, and subglacial hydrology, which together favour surge behaviour (Sevestre and Benn, 2015). The Pamir Mountains host one of the highest concentrations of surge-type glaciers globally (Osipova et al., 1998; Goerlich et al., 2020; Guillet et al., 2022; Guo et al., 2023). Historical and recent studies have documented numerous surge events and their downstream impacts in this region (Lv et al., 2019; Wang et al., 2023; Safarov et al., 2024a). Many glaciers in the Pamirs are located in narrow, steep, debris-covered valleys, which enhance longitudinal stress transmission and strong glacier–valley coupling (Sevestre and Benn, 2015; Guillet et al., 2022; Feroz et al., 2025).
Although recent regional inventories have improved our understanding of the spatial distribution of surge-type glaciers across High Mountain Asia (HMA) (Goerlich et al., 2020; Guillet et al., 2022; Guo et al., 2023; Beraud et al., 2025), studies documenting the full surge sequence at daily to weekly temporal resolution remain rare. Observations capturing the sequence from surge initiation through glacier detachment to post-detachment stabilization remain exceptionally rare. This observational gap limits understanding of how internal glacier reorganization leads to downstream geomorphic impacts.
This study aims to: (I) quantify the glacier surface-elevation changes and associated mass redistribution during the most recent quiescent period using multi-epoch UAV observations; (II) document the multi-stage 2025–2026 event and evaluate the evidence distinguishing surge propagation from two low-angle detachments; (III) evaluate potential climatic, geometric, and seismic factors that may have influenced this behaviour; (IV) outline a research agenda for future investigations into similar surge-detachment-related hazards. To achieve these aims, we combined daily satellite imagery with multi-epoch UAV orthomosaics and DEM differencing to reconstruct the observed evolution of the surge-detachment sequence at Dehdal Glacier.
Dehdal Glacier (formerly Didal) (38°59′20′′ N, 70°43′04′′ E) is located in the northwestern Pamir Mountains, Tajikistan, within the Surkhob River Basin, a major headwater tributary of the Vakhsh River that drains into the Amu Darya system (Fig. 1a–b). The glacier descends from the northern slopes of the Peter I Range (Peak Kaudal, 4775 m a.s.l.) and terminates in the upper Dara River valley (Safarov and Fazylov, 2023). The glacier covers approximately 1.6 km2 in its quiescent state, and its tongue is confined within a narrow, steep valley, forming a predominantly debris-covered lower reach that directly interacts with the fluvial system and adjacent valley slopes (Fig. 1d). The Peter I Range is known for glacier detachments and rock-ice avalanche activity, and hosts several surge-type glaciers (Leinss et al., 2021; Kääb et al., 2021). The glacier and adjacent valley slopes are mantled by heterogeneous debris. Regional geological mapping indicates mixed sedimentary lithologies, including both coarse- and fine-grained units (Narzikulov and Stanyukovich, 1968), whereas the composition and spatial continuity of subglacial materials beneath Dehdal Glacier remain unknown.
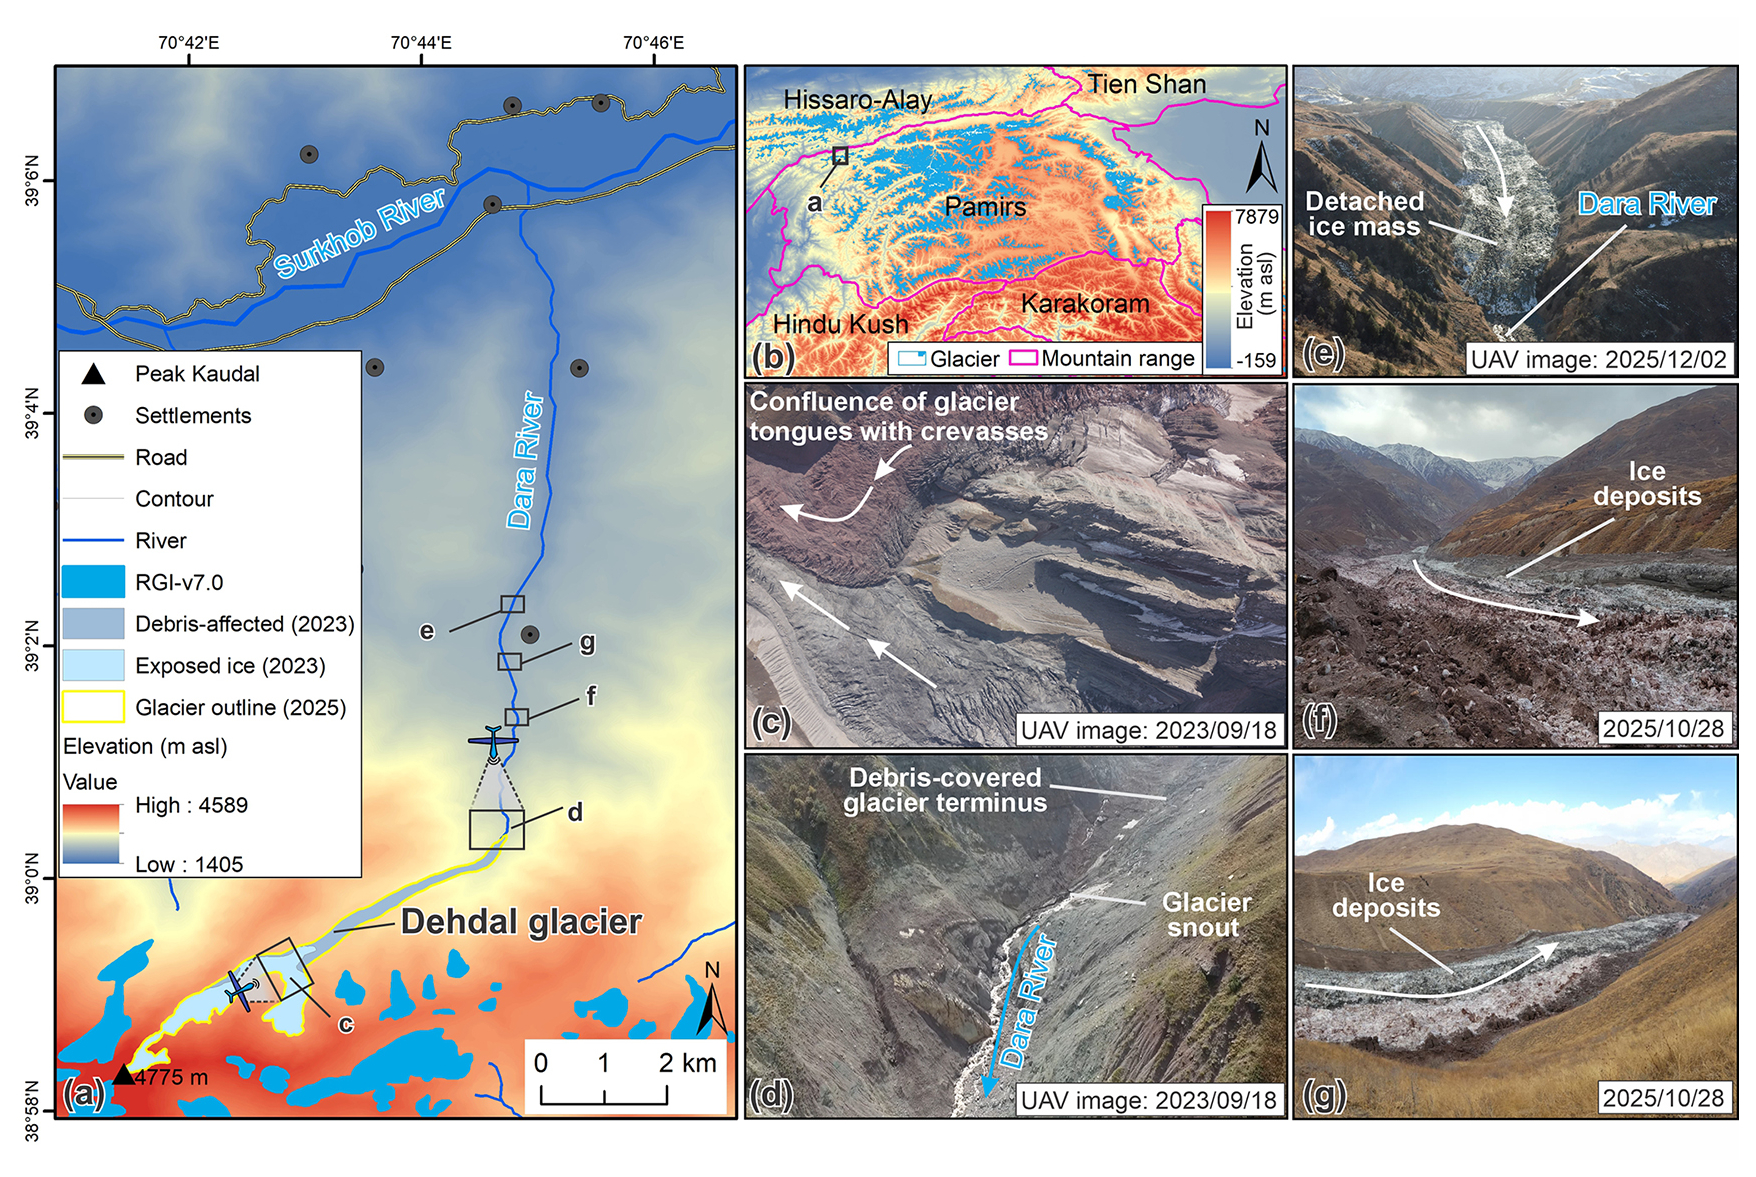
Figure 1Location and geomorphological setting of Dehdal Glacier, northwestern Pamirs, Tajikistan. (a) Study area showing Dehdal Glacier and its drainage basin within the Dara and Surkhob river systems, with surrounding glaciers from the Randolph Glacier Inventory (RGI v7.0), the exposed-ice and debris-affected surface classes of Dehdal Glacier mapped using August 2023 PlanetScope imagery and a UAV-derived orthomosaic, and the Dehdal Glacier outline mapped on 20 August 2025. (b) Regional setting within High Mountain Asia. The topographic backgrounds in panels (a)–(b) were derived from the AW3D30 digital surface model (© JAXA), accessed via OpenTopography. (c) UAV images showing crevasse and compressional structures in the upper glacier. (d) Debris-covered glacier terminus and its interaction with the Dara River. (e) Detached ice mass extending along the valley floor. (f–g) Detached ice deposits and the down-valley extent of detached glacier material after the 2025 detachment events (photos: Kabutov Khusrav).
Based on August 2023 PlanetScope imagery and a UAV-derived orthomosaic, the glacier surface was approximately classified into exposed ice (1.137 km2) and debris-affected ice (0.636 km2). The debris-covered lower tongue dominates the debris-affected surface, while the upper and central glacier sections mainly consist of exposed ice with localized thin avalanche-derived debris, mixed ice-debris surfaces, and temporarily debris-covered areas. Thus, the area of debris-covered surface does not represent a continuous thick moraine mantle, but rather a combination of debris-covered ice and partially debris-influenced glacier surfaces. Based on the UAV-derived DEM acquired on 18 September 2023, the lower glacier tongue had a mean longitudinal slope of approximately 13.9°, with surface elevations increasing from 2820.2 to 3080.4 m along a 1.05 km flowline extending upstream from the 2023 terminus. Evidence from published historical expedition accounts, glaciological literature, historical aerial photographs, and satellite imagery collectively indicates surge activity in 1890, 1974, 1995–1997, and 2015–2016 (Lipskiy, 1902; Rototaev, 1974; Suslov, 1974; Uskov and Kvachev, 1979; Desinov, 1984; Kotlyakov et al., 2020; Desinov, 2021). The glaciological literature suggests a possible surge in either 1929 or 1939, although the timing remains uncertain (Suslov, 1974; Desinov, 1984). The analysis of Landsat TM imagery confirms a surge between 1995 and 1997. These records indicate variable multi-decadal recurrence intervals, generally ranging from approximately 20 to 45 years before the 2025–2026 event.
During the surge from 2015 to 2016, the glacier advanced down-valley by about 1950 m at an average rate of approximately 7.2 m d−1, with no large-scale glacier tongue detachment reported during this event (Rototaev, 1974; Kotlyakov et al., 2020; Desinov, 2021). The surge sequence in 2025–2026 occurred approximately 9–10 years after the 2015–2016 event. This represents the shortest interval between documented surge events in the available historical record and involves two episodes of glacier tongue detachment, followed by downstream movement of the detached ice masses. The 9–10-year interval is shorter than the previously documented recurrence intervals of approximately 20–45 years at Dehdal Glacier and falls toward the shorter end of globally reported surge recurrence intervals, although similarly short or shorter intervals have been documented elsewhere (Lovell et al., 2026).
Dehdal Glacier terminates within the Dara River valley, which hosts several dwellings and a local road downstream (Fig. 1a). This setting increases downstream exposure of communities and infrastructure to surge- and detachment-related impacts, including rapid terminus advance, enhanced sediment delivery, short-term river-channel reorganization, and associated geomorphic impacts.
3.1 Remote sensing datasets
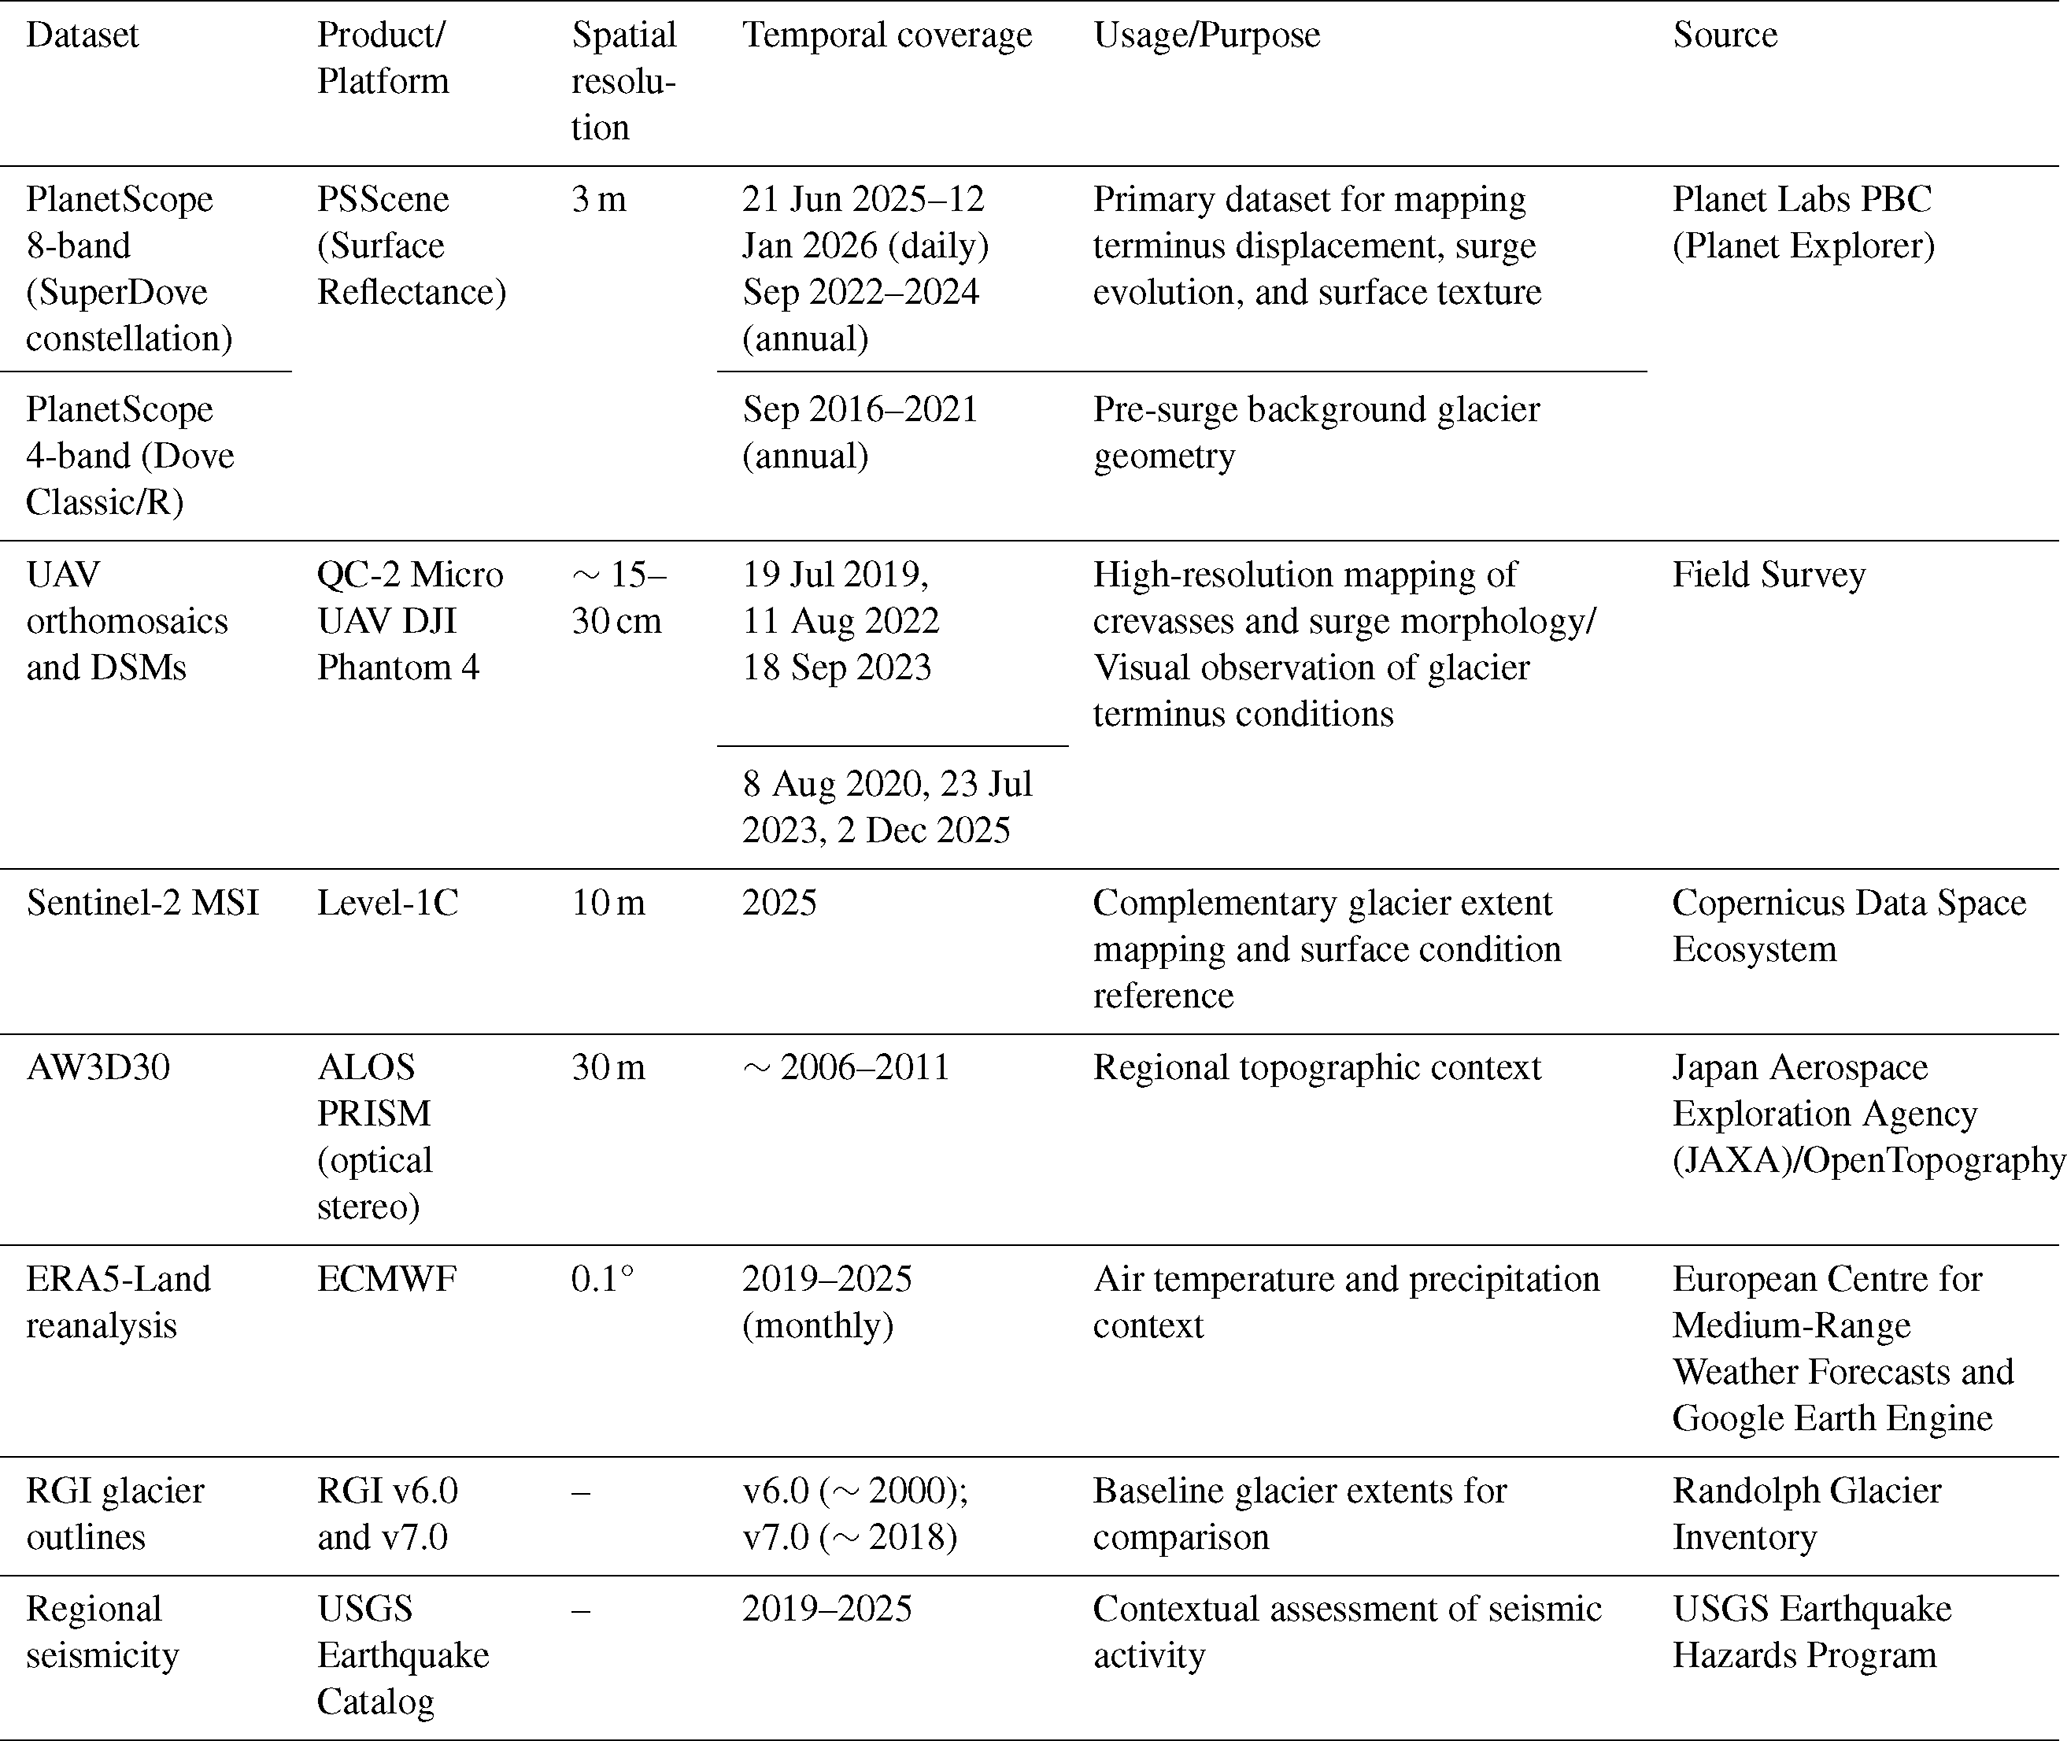
PlanetScope satellite imagery has a spatial resolution of approximately 3 m, and includes four-band Dove Classic/R products (blue, green, red, and near-infrared) before 2021 and eight-band surface-reflectance products (coastal blue, blue, green I, green, yellow, red, red edge, and near-infrared) after 2021 (Planet Labs PBC, 2026). We used PlanetScope satellite images to delineate glacier outlines, quantify terminus displacement, and track internal segmental motion along a central flowline, enabling reconstruction of observed glacier acceleration, internal motion, and late-phase evolution. To monitor the event, dense time-series PlanetScope imagery was used to reconstruct the evolution of Dehdal Glacier between 21 June 2025 and 12 January 2026 (Table 1). A total of 128 cloud-free PlanetScope images were selected during the active 2025–2026 event to track changes in the connected-glacier terminus, internal surge-front propagation, and the downstream extent of detached ice, providing temporal resolution needed for quantitative analysis. Additionally, we selected September scenes from 2016 to 2024 to establish pre-surge reference conditions. We also used Sentinel-2 Level-1C imagery (10 m spatial resolution) to complement PlanetScope observations during periods of incomplete coverage and to provide additional reference imagery for both pre-surge and surge conditions.
Table 1Summary of remote sensing, field, and auxiliary datasets used to monitor Dehdal Glacier in the northwestern Pamirs, Tajikistan.
To document the fine-scale surface structures and terminus morphology following the second detachment event, a high-resolution image from the Luojia3-02 (Wuhan-1) satellite, provided by Wuhan University (China), was utilized. This image was captured on 9 November 2025, and has a spatial resolution of 0.5 m. Additionally, digital elevation data from the AW3D30 global digital elevation model (30 m spatial resolution), derived from ALOS PRISM stereo imagery and accessed via OpenTopography, was used to provide topographic context and support analysis of glacier geometry and valley morphology.
Multi-epoch UAV surveys conducted on 19 July 2019, 11 August 2022, and 18 September 2023 were used to generate centimetre-scale orthomosaics and digital elevation models (DEMs) (Fig. S1 in the Supplement) to characterise the geomorphological structure of the glacier tongue and the upper confluence zone (Mishra et al., 2023). The 18 September 2023 UAV-derived DEM was also used to calculate the pre-surge longitudinal slope of the lower glacier tongue. An elevation profile was extracted along the central flowline for approximately 1.05 km upstream from the 2023 glacier terminus. These UAV-derived products reveal crevasses, compressional ridges, and debris-affected ice morphology and serve as key reference information for interpreting pre-surge surface deformation patterns. Additionally, field-based visual observations of the glacier terminus were conducted on 8 August 2020, 23 July 2023, and 2 December 2025 to provide qualitative ground reference for terminus position and post-surge surface conditions.
To quantify pre-surge mass redistribution, a principal reservoir zone and a lower-tongue receiving zone were manually delineated based on the persistent spatial pattern of elevation changes observed in the 2019–2022, 2022–2023, and 2019–2023 UAV DEM differences. Because the UAV DEMs do not cover the entire glacier, this analysis was restricted to the UAV-surveyed area. Quantitative analyses were restricted to elevation changes exceeding the estimated DEM vertical uncertainty ( m). Mean elevation changes and corresponding ice-volume gain and loss were calculated separately for each zone.
The volume of the detached ice deposit was estimated using cross-sectional thickness measurements derived from the UAV-based three-dimensional terrain model acquired on 2 December 2025. Cross-valley profiles oriented approximately perpendicular to the valley axis were extracted to estimate local deposit thickness using elevation differences between the post-detachment ice surface and reconstructed pre-event valley surface reference elevation. Because a complete pre-event DEM covering the entire detachment area was unavailable, representative pre-event valley elevations were estimated from multiple stable reference points and cross-checked with available topographic information. Mean thickness derived from multiple cross-valley profiles was combined with the mapped deposit area to obtain a first-order estimate of detached ice volume. This volume estimate should be considered a first-order approximation because uncertainties arise from incomplete pre-event topographic information, DEM noise, and spatial variability in deposit thickness.
3.2 Surface velocity estimation
Surface velocity fields were derived from PlanetScope satellite imagery using feature-tracking via normalized cross-correlation (NCC) implemented in a custom MATLAB workflow. Image pairs were selected for late ablation-season conditions (September–September intervals) to minimize seasonal variability and ensure consistent interannual comparisons. Before estimating displacements, the image pairs were co-registered using a translation-based image registration method to reduce geometric offsets between scenes. Surface displacements were calculated by applying NCC template matching within predefined search windows to track stable surface features, which is a well-established method for estimating glacier motion from optical satellite imagery (Scambos et al., 1992; Kääb, 2005; Heid and Kääb, 2012; Dehecq et al., 2015). Displacement vectors were transformed into surface velocities using the time interval between image pairs, and low-correlation matches were filtered out before interpolating the velocity field to full image resolution.
For each grid node, a template window of 96×96 pixels (approximately 288×288 m) from the reference image was matched within a search window of 384×384 pixels (about 1152×1152 m) in the target image. These window sizes were selected to balance spatial resolution and displacement detectability while maintaining stable correlations over debris-covered glacier surfaces, following commonly applied optical feature-tracking approaches. Displacements were calculated on a regular grid with a step size of 48 pixels (about 144 m). Windows with insufficient surface texture were excluded using a minimum standard deviation threshold of 0.01, and windows containing more than 20 % missing data were discarded. The location of the NCC peak provided horizontal offsets (Δx, Δy) in pixel units. The offsets were converted to metres using the PlanetScope pixel size of 3 m. Velocities were calculated by dividing the displacement by the acquisition interval and expressed in m yr−1 for annual comparisons. Velocity uncertainty was estimated using apparent displacements measured over stable off-glacier terrain. Because the image resolution and feature-tracking parameters were consistent for all image pairs, a representative uncertainty estimate derived from stable terrain was assumed to apply to all velocity fields.
Velocity fields were generated for eight consecutive annual intervals, spanning from 2016–2017 to 2023–2024. A fixed visualization range of 0–800 m yr−1 was applied to all maps to facilitate direct interannual comparison. To represent the interannual background state for the period from 24 September 2024, to 20 August 2025, a long-term baseline of ∼330 d was used to obtain interval-averaged surface velocities, expressed in m d−1 for comparison with the subsequent velocity fields in Fig. 7. Short-term surge dynamics were examined using sequential PlanetScope image pairs spanning 8–32 d during August to December 2025. For these short-term intervals, displacement vectors were converted to velocities expressed in m d−1. Low-confidence matches were eliminated using a correlation threshold of , ensuring that only displacement vectors with robust correlation scores were retained. To ensure comparability across event periods, a fixed velocity range of 0–60 m d−1 was applied to all six panels of Fig. 7. Low-correlation pixels and shadow-affected regions were masked prior to analysis. Winter scenes with extensive fresh snow cover were excluded due to reduced feature-tracking reliability. Despite the quality-control efforts for our velocity data, automated velocity retrievals are not always reliable for long-duration intervals, and the extreme dynamics of a surge and detachment sequence may compromise robust velocity retrievals (Zhang et al., 2026). For Fig. 7, the connected-glacier boundary was mapped at the end of each observation interval and displayed as a magenta outline. Velocity fields were clipped to the corresponding mapped connected-glacier extent to distinguish glacier motion from downstream detached ice. The mapped end-date boundaries provide a consistent spatial reference, although intervals spanning detachment events may contain motion that occurred before mechanical separation.
Two central flowlines were digitized following the principal glacier flow paths. Flowline A follows the right tributary branch and continues along the downstream trunk, whereas Flowline B traces the left tributary of the glacier. Surface velocities were sampled at regular intervals along each flowline to construct longitudinal velocity profiles for the 2016–2024 interannual period and for the 2025–2026 surge phase. This approach enables the identification of branch-scale asymmetry, spatial localization of acceleration, and multi-year patterns of glacier flow evolution.
3.3 Climatic and auxiliary data
Near-surface air temperature and precipitation were derived from the ERA5-Land reanalysis (ECMWF) using Google Earth Engine (GEE). We used the ERA5-Land Monthly Aggregated product (ECMWF/ERA5_LAND/MONTHLY_AGGR) at 0.1°×0.1° spatial resolution (Hersbach et al., 2020). Monthly values were extracted for the grid cell containing Dehdal Glacier and analysed for the period 2016–2025 to characterise climate variability during the most recent decade. For baseline comparison, we computed the monthly climatology for 1981–2010 and expressed anomalies for 2016–2025 as differences relative to this baseline.
ERA5-Land monthly series were compared with observations from the Tojikobod meteorological station (39.1148° N, 70.8366° E; 1589 m a.s.l.; ∼15 km from the glacier), operated by the Agency for Hydrometeorology of Tajikistan, for the period with overlapping records (available from 2020 onward). This comparison was used as a consistency check of the reanalysis background climate signal, while recognising elevation and representativeness differences between the low-elevation station and the glacier environment.
Regional seismicity was assessed using the USGS Earthquake Catalogue. All earthquakes with magnitudes ≥3.5 within 60 km of Dehdal Glacier during 2019–2025 were extracted to evaluate possible temporal coincidence with glacier acceleration and the 2025–2026 event. Historical glacier outlines were obtained from the Randolph Glacier Inventory (RGI v6.0 and v7.0) provided by the National Snow and Ice Data Center (RGI Consortium, 2017; RGI Consortium, 2023) and used as standardized baseline references to compare long-term glacier geometry with PlanetScope-derived outlines.
3.4 Flowline definition and surge quantification
A central flowline representing the principal ice-flow axis of Dehdal Glacier was manually digitized using PlanetScope imagery acquired during the 2025–2026 event. All distances were referenced to the terminus position on 20 August 2025, which served as the baseline zero point. Terminus displacement was quantified by projecting successive positions of the connected-glacier terminus, internal surge front, and downstream front of detached ice onto the central flowline and measuring their longitudinal positions relative to the zero point. This produced time series distinguishing internal surge-front propagation, changes in the connected-glacier terminus, and downstream movement of detached ice.
Internal surge-front positions were identified from changes in surface morphology and the progression of deformation features. Positive and negative longitudinal positions indicate locations downstream and upstream of the 20 August 2025 reference terminus, respectively. Abrupt upstream shifts of the connected-glacier terminus associated with detachment were distinguished from gradual terminus retreat.
3.5 Uncertainty assessment
Surface velocity uncertainty was assessed empirically using apparent velocities measured over stable off-glacier terrain. Three manually delineated stable reference polygons on bedrock slopes adjacent to the glacier were used to extract velocity data outside the glacier area. The residual bias was quantified using the median apparent velocity, while measurement uncertainty was estimated with the normalized median absolute deviation (NMAD). Horizontal displacement uncertainty is controlled primarily by PlanetScope geolocation accuracy and manual delineation uncertainty and was estimated as a nominal spatial uncertainty equivalent to approximately ±1 pixel (3 m), following Paul et al. (2017) and Tarca et al. (2023). Temporal uncertainty is controlled by image acquisition frequency. During the 2025–2026 event, observation intervals ranged from 1–7 d, constraining surge phase transitions within ±3 d.
Photogrammetric processing of UAV images was performed in Pix4Dmapper using standard structure-from-motion workflows, with manual tie points (MTPs) introduced during the bundle adjustment stage (Safarov et al., 2024b). DEM co-registration between UAV resurveys was evaluated using established off-glacier stability approaches outlined by Immerzeel et al. (2014), Xue et al. (2021), and Safarov et al. (2024b). Several stable, non-glaciated reference zones were delineated around the glacier tongue (Fig. S2). Elevation differences were extracted within these zones and used to quantify co-registration accuracy (Immerzeel et al., 2014; Lamsters et al., 2022). The distribution of elevation differences over stable off-glacier reference areas indicates a residual vertical uncertainty of approximately ±0.5 m between UAV DEMs (Fig. S2d). Additional uncertainty arises from UAV positioning accuracy, GPS measurement limitations, lens distortion effects, flight altitude variability, and illumination differences between surveys (Wheaton et al., 2010; Clapuyt et al., 2017). These factors may introduce local geometric distortions and affect the precision of derived elevation products.
4.1 Pre-surge geometry and baseline conditions
PlanetScope imagery indicates that Dehdal Glacier remained comparatively stable during 2016–2024, with no evidence of terminus advance. This pre-surge configuration provides the baseline against which the abrupt dynamic reorganisation in 2025 is distinguished. In August 2025, Dehdal Glacier exhibited two zones with contrasting surface characteristics: an active ice zone extending across the upper and central glacier sections, characterized by extensive crevassing, and a localized retreat zone near the glacier terminus, characterized by a comparatively smooth surface (Fig. 2b).
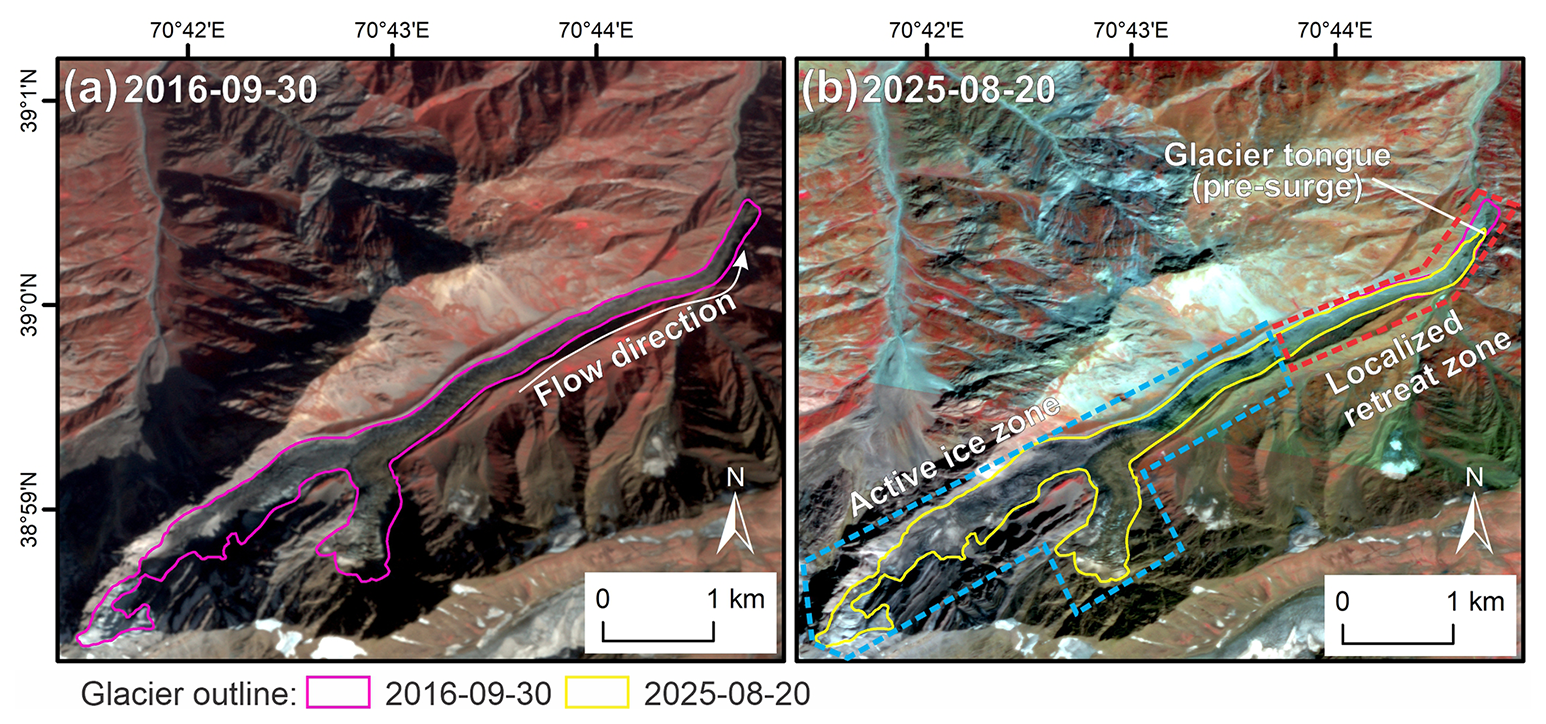
Figure 2Glacier configuration after the 2016 surge (30 September 2016) and before the 2025–2026 surge (20 August 2025). Solid outlines indicate glacier margins at the respective dates. Dashed polygons mark the approximate locations of the active ice zone and localized retreat zone observed in August 2025. Arrows denote the general ice-flow direction. Images © 2016 and 2025 Planet Labs PBC.
High-resolution UAV surveys conducted from 2019 to 2023, prior to the 2025–2026 surge, reveal that the glacier's lower tongue is heavily debris-covered, a feature typical of quiescent surge-type glaciers in the region. This tongue features complex surface structures, including crevasses and compressional ridges (Fig. 1c–d), indicating a dynamically active and structurally complex tongue before the 2025 event. Importantly, the UAV-derived DEMs reveal pronounced surface-elevation changes in the years preceding the 2025–2026 surge, with distinct spatial patterns of thickening and thinning. DEM differencing for the periods 2019–2022, 2022–2023, and 2019–2023 shows marked and persistent surface thickening in the central part of the glacier, reaching several tens of metres locally (Fig. 3a–c). This build-up is particularly evident along the debris-covered tongue and adjacent lateral moraines, consistent with ice-mass accumulation visible in the UAV orthomosaics and contemporaneous PlanetScope imagery. At the same time, the lowermost downstream tongue exhibits net surface lowering over the same intervals (Fig. 3a1–c1), indicating progressive thinning and retreat in the distal part of the glacier. Central thickening combined with thinning in both the upper glacier and the distal tongue indicates strong spatial variability in surface-elevation change, reflecting the redistribution of ice within the glacier prior to the 2025–2026 surge. This pattern is consistent with reservoir-receiving zone mass transfer commonly observed prior to surge activation in surge-type glaciers (e.g., Sevestre and Benn, 2015; Goerlich et al., 2020; Murodov et al., 2024).
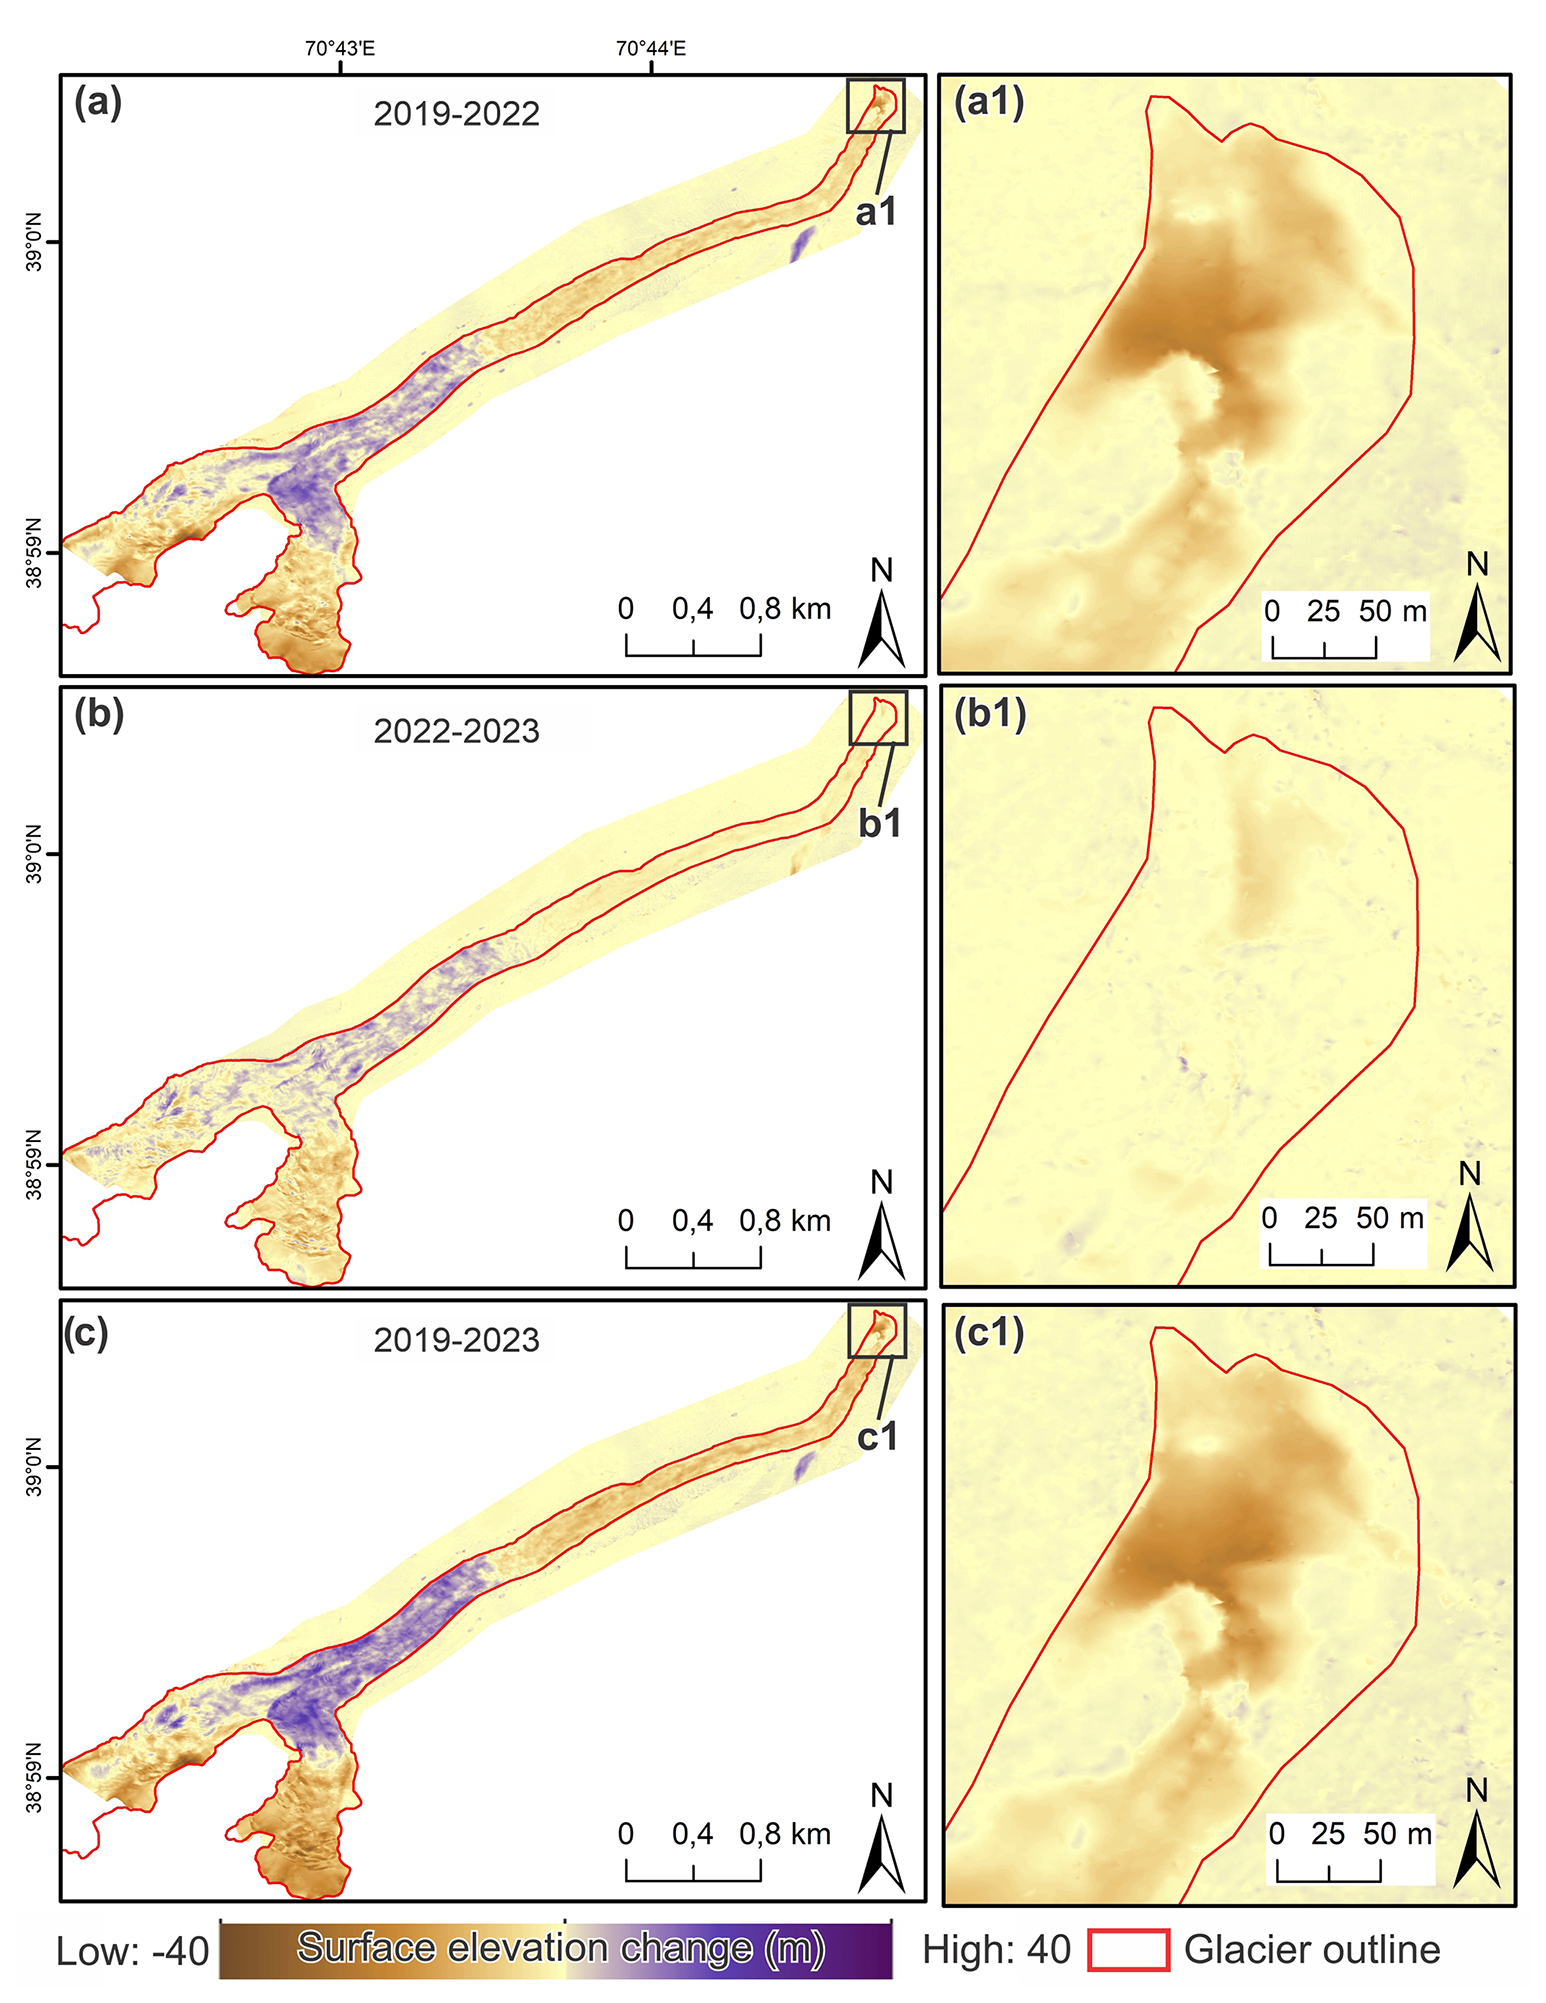
Figure 3Glacier surface elevation changes derived from UAV DEM differencing for the periods 2019–2022 (a), 2022–2023 (b), and 2019–2023 (c). Panels (a1)–(c1) show zoomed views of the lower tongue. Positive values indicate surface thickening (m), while negative values indicate surface lowering (m).
To quantify this redistribution, we analysed the principal reservoir and tongue receiving zones separately (Table 2). Between 2019 and 2022, the reservoir zone experienced a mean surface elevation increase of +6.44 m, corresponding to an estimated ice-volume gain of approximately 0.33×10⁶ m3, whereas the receiving zone underwent a mean lowering of −5.23 m and an estimated ice-volume loss of approximately 0.17×10⁶ m3. During 2022–2023, additional thickening occurred within the reservoir zone (+4.00 m; m3), while the receiving zone continued to thin (−2.01 m; m3). Over the full 2019–2023 observation period, cumulative thickening reached +9.01 m within the reservoir zone ( m3), whereas cumulative lowering in the receiving zone averaged −6.62 m ( m3). These results demonstrate progressive internal redistribution of glacier mass prior to the 2025 surge, consistent with sustained mass build-up in the central glacier trunk and simultaneous depletion of the lower tongue.
Table 2Quantitative evolution of the principal reservoir zone and lower-tongue receiving zone derived from UAV DEM differences. Only elevation changes exceeding the estimated DEM uncertainty ( m) were included in the calculations.

Annual surface velocities remained low and spatially uniform between 2016 and 2018, with maximum values generally below ∼50 m yr−1 along both flowlines (Fig. 4). A first localized acceleration developed in 2018–2019, with velocities exceeding 400 m yr−1 in the lower portion of the upper basin. This episode was spatially confined and did not propagate throughout the glacier trunk. In 2019–2020, the glacier exhibited a sharp and localized velocity maximum of ∼600 m yr−1 centered near 4.0–4.3 km.
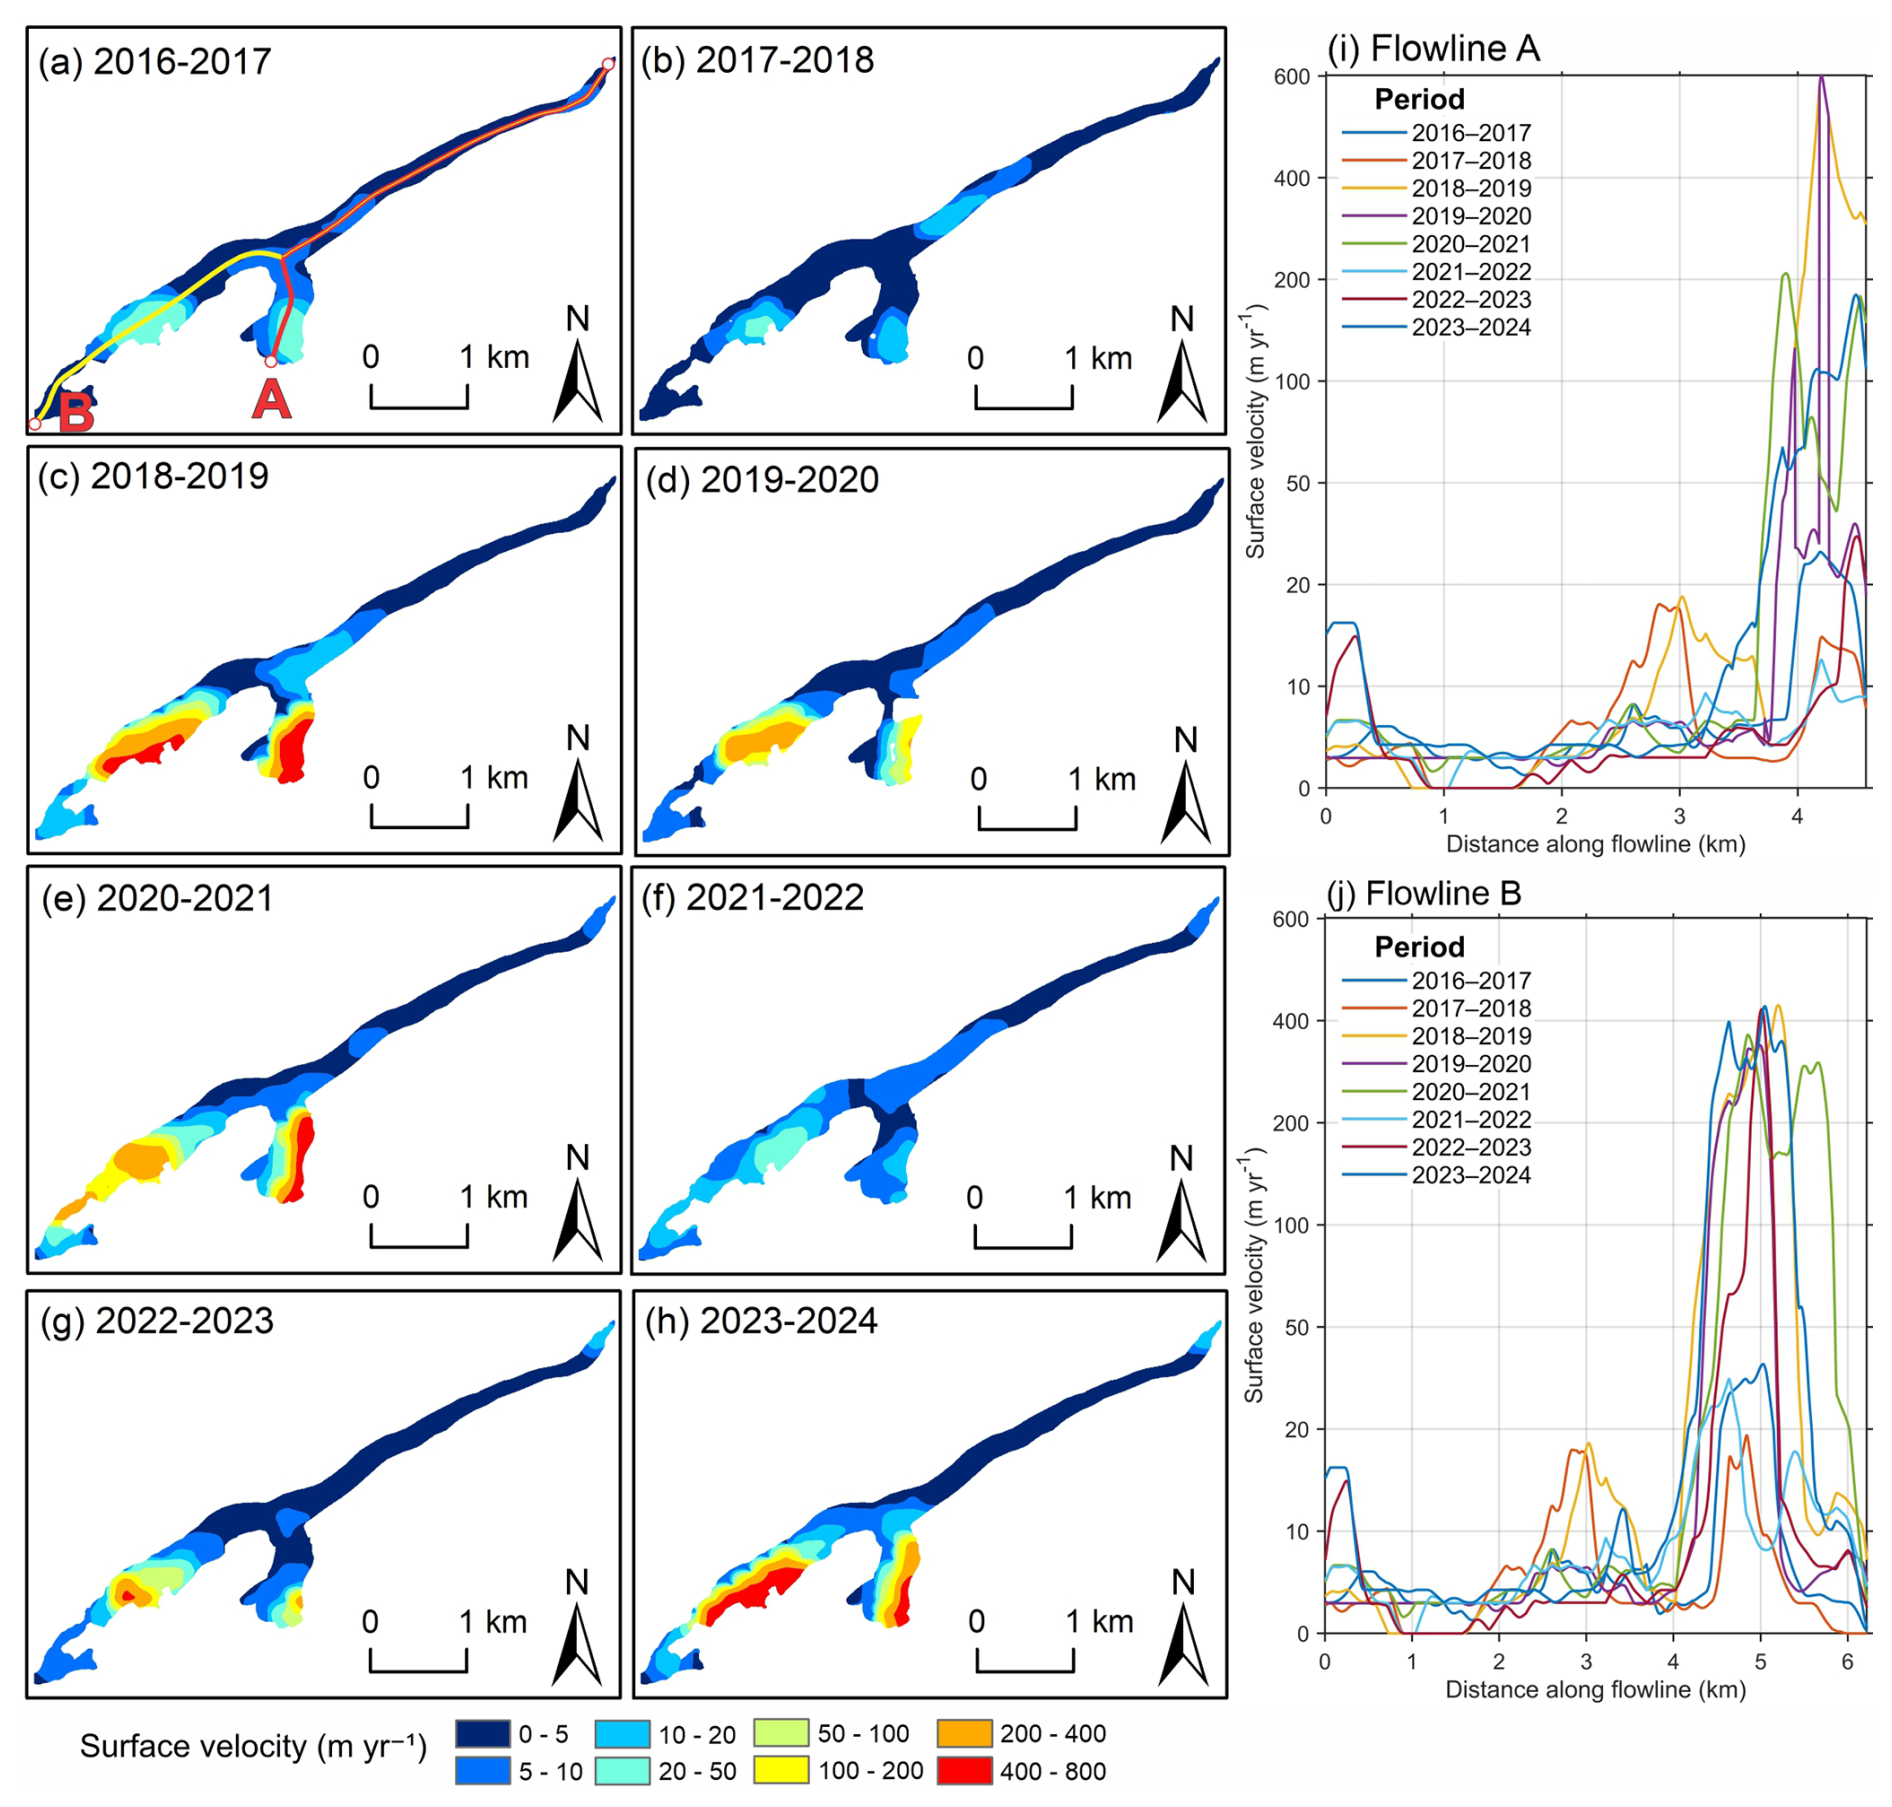
Figure 4Interannual surface velocity evolution and longitudinal flowline profiles (2016–2024). (a–h) Annual September-to-September surface velocity fields based on PlanetScope satellite imagery. Velocities are shown on a fixed scale (0–800 m yr−1) to allow direct interannual comparison. Flowlines A (right tributary and trunk) and B (left tributary) are indicated in panel (a). (i) Longitudinal velocity profiles along Flowline A. (j) Longitudinal velocity profiles along Flowline B.
However, our results indicate that this acceleration was transient and followed by partial deceleration in 2021–2022. From 2022 onward, renewed acceleration developed along Flowline A. In 2023–2024, velocities exceeded 400 m yr−1 and were concentrated between approximately 4.5 and 5.2 km along the right tributary. These results suggest that the 2025–2026 surge-detachment sequence was preceded by several years of spatially localized velocity changes, including periods of acceleration and partial deceleration, with the strongest renewed acceleration observed along the right tributary in 2023–2024.
Velocity uncertainty was evaluated using apparent velocities measured over stable off-glacier terrain. The stable-terrain analysis reveals a residual bias of 3.17 m yr−1 and an NMAD uncertainty of 0.28 m yr−1 for the annual velocity data. For the short-term velocity fields, the median apparent velocity over stable terrain is 0.17 m d−1, with an NMAD of 0.13 m d−1. These uncertainty values are significantly smaller than the glacier velocities observed during the surge phase.
4.2 Surge evolution and glacier tongue detachments
The 2025–2026 event at Dehdal Glacier exhibited a multi-phase evolution punctuated by two low-angle detachment events, during which ice masses separated from the lower glacier tongue and moved downstream independently of the connected glacier (Figs. 5–7). The detachments caused abrupt upstream shifts in the positions of the connected-glacier terminus, followed by renewed downstream advance, whereas the separated ice masses continued moving farther down the valley. From 21 June to 17 September 2025, the glacier front remained confined and did not extend beyond the defined 0-point baseline (20 August 2025). During this period, crevasses became apparent across the glacier's tongue, despite the debris layer; these were first visible around on 21 June 2025, crevassed zones expanded markedly by 20 August, and surface crevassing became widespread by 17 September, accompanied by increasingly pronounced surface deformation across the upper and central glacier sections (Fig. 5). An approximate internal surge front was interpreted from the spatial transition between strongly deformed ice and comparatively less disturbed ice farther down-glacier, at approximately 1.9 km upstream of the 20 August 2025 reference terminus position. By 17 September 2025, glacier-wide arcuate deformation features were visible, with locally apparent block-like surface structures near the location of the subsequent detachment (Fig. 5c1–c2). The progressive development of surface deformation and crevassing is further illustrated in a PlanetScope time-lapse sequence (https://www.planet.com/stories/dehal-collapse-2025-full-sequence-APKnM3KDg, last access: 18 October 2026).
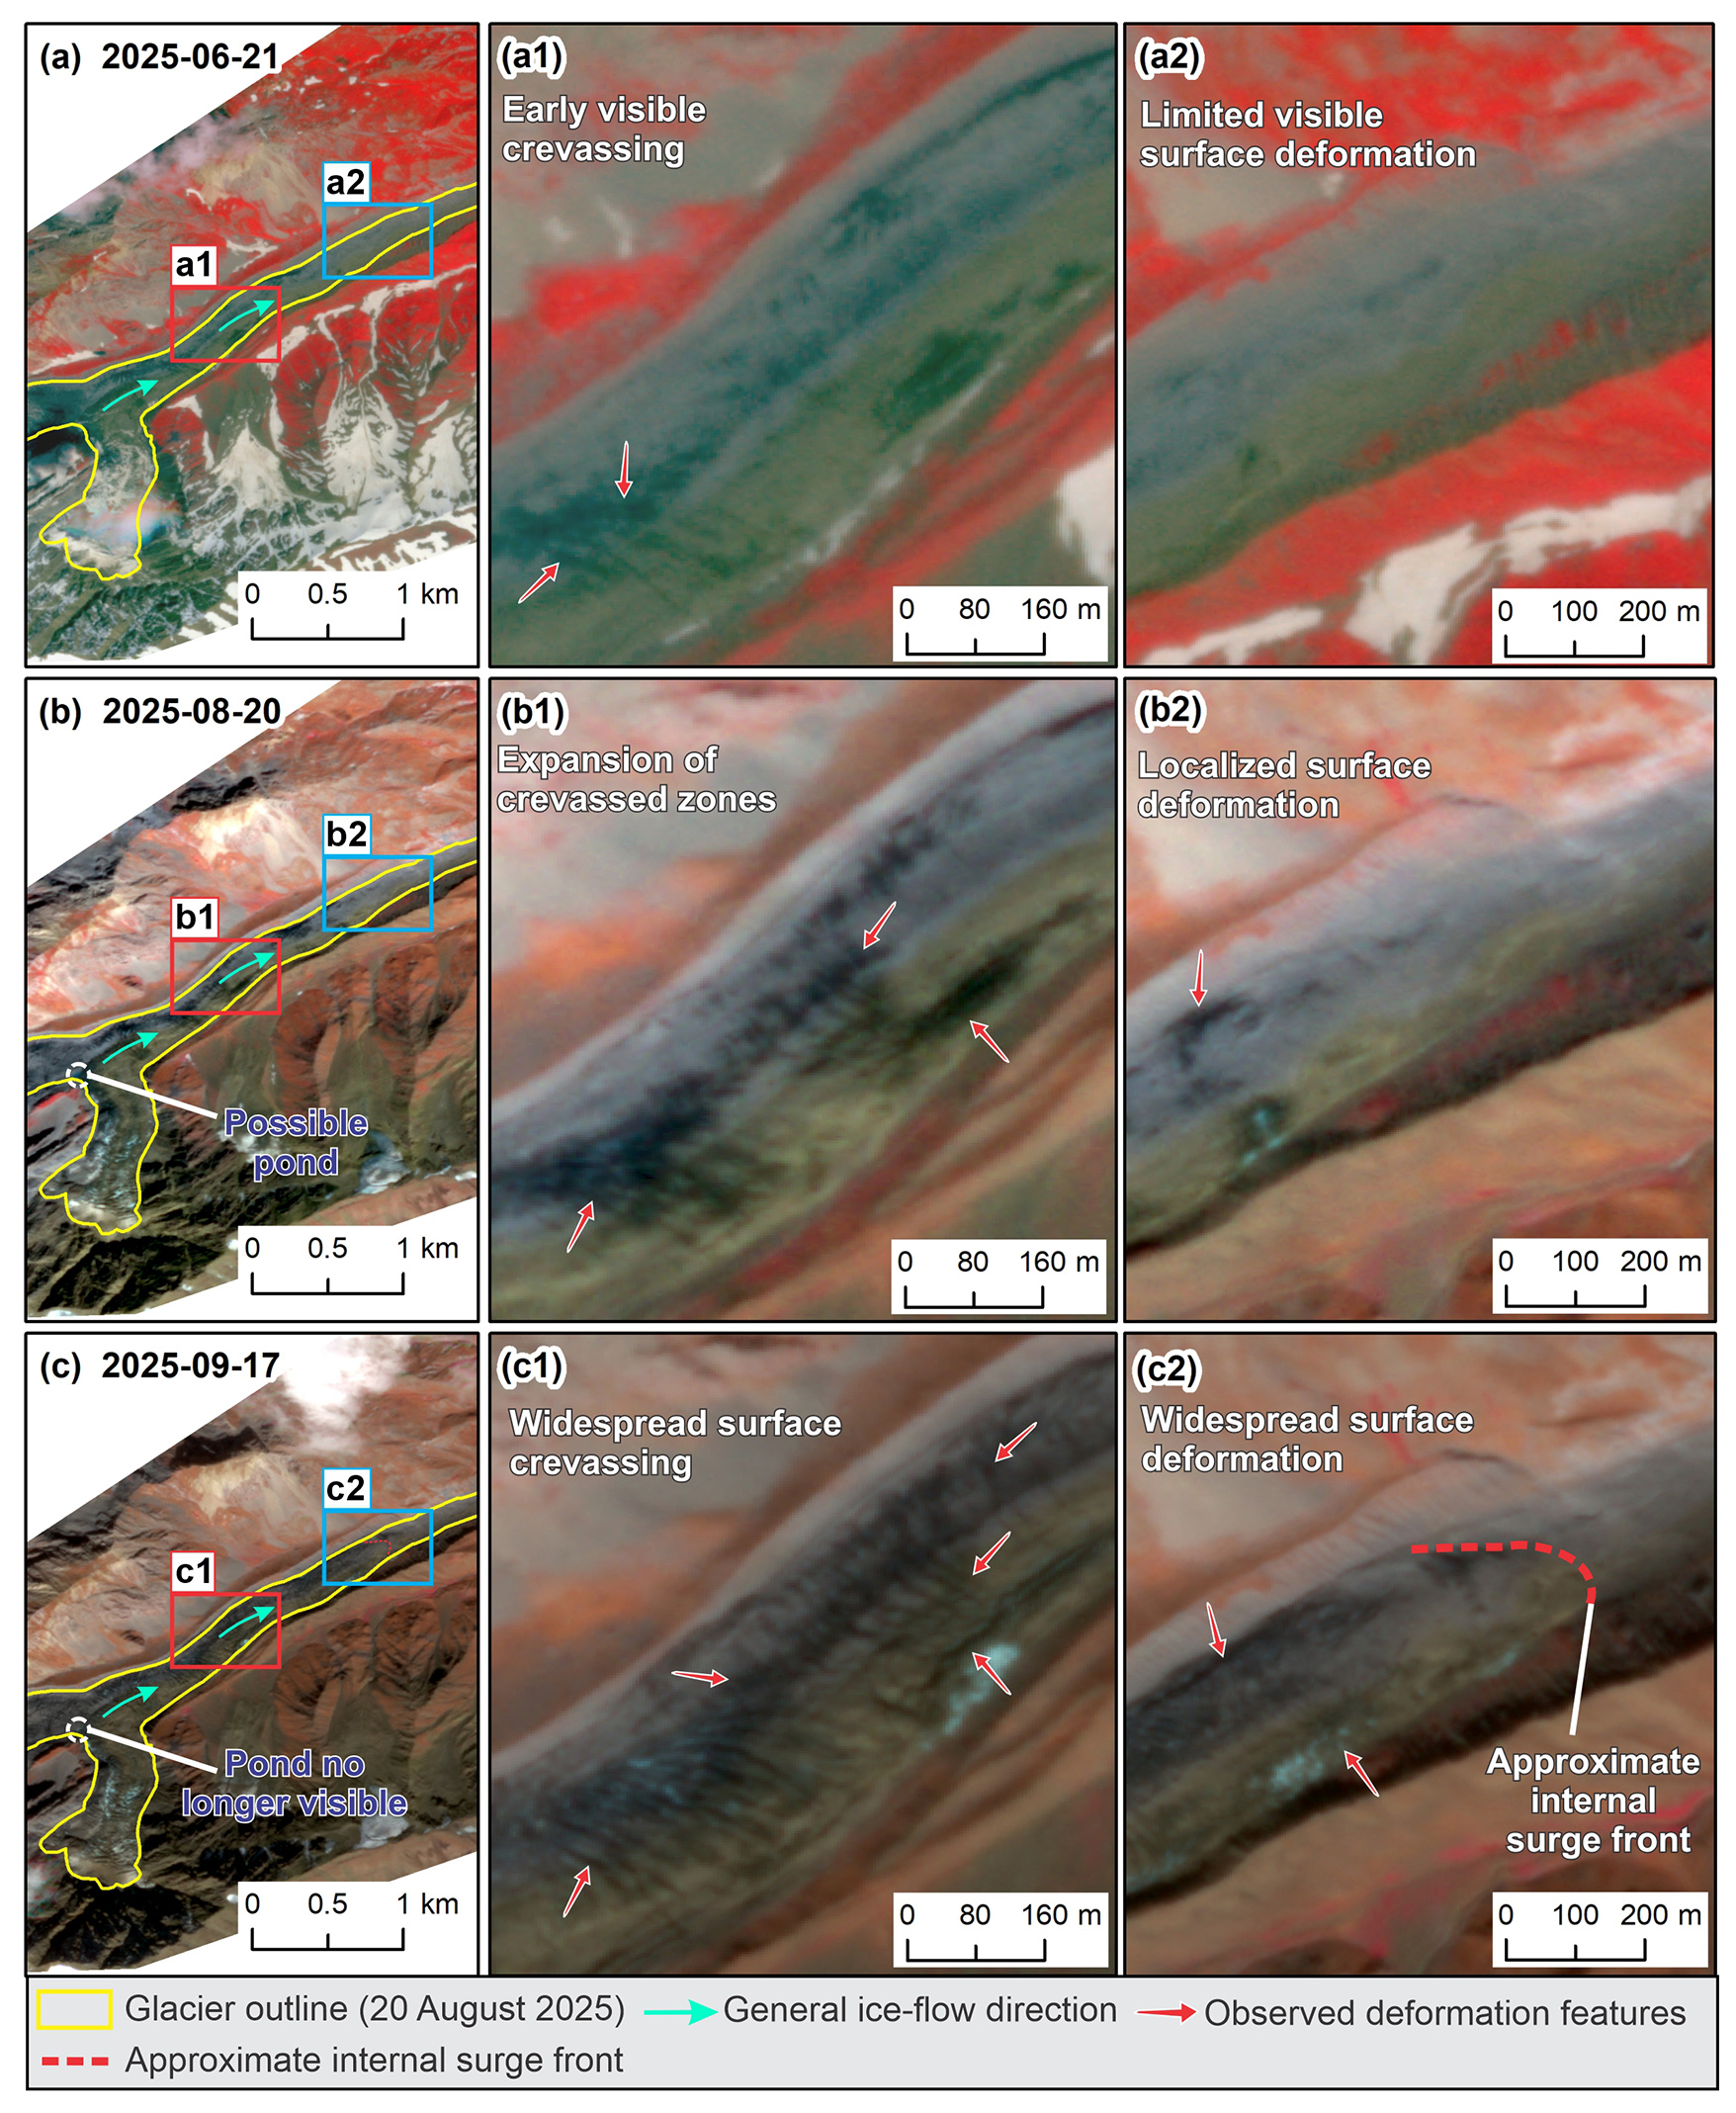
Figure 5Progressive surface deformation and crevasse development at Dehdal Glacier prior to detachment, based on PlanetScope imagery (3 m resolution): (a) 21 June 2025, (b) 20 August 2025, and (c) 17 September 2025. Panels (a1)–(c1) illustrate the evolution from crevasse initial appearance to expanded and widespread crevassed zones, while panels (a2)–(c2) show changes in surface deformation and the development of an approximate internal surge front by 17 September 2025. Red and blue boxes indicate the locations of the corresponding enlarged panels. Images © 2025 Planet Labs PBC.
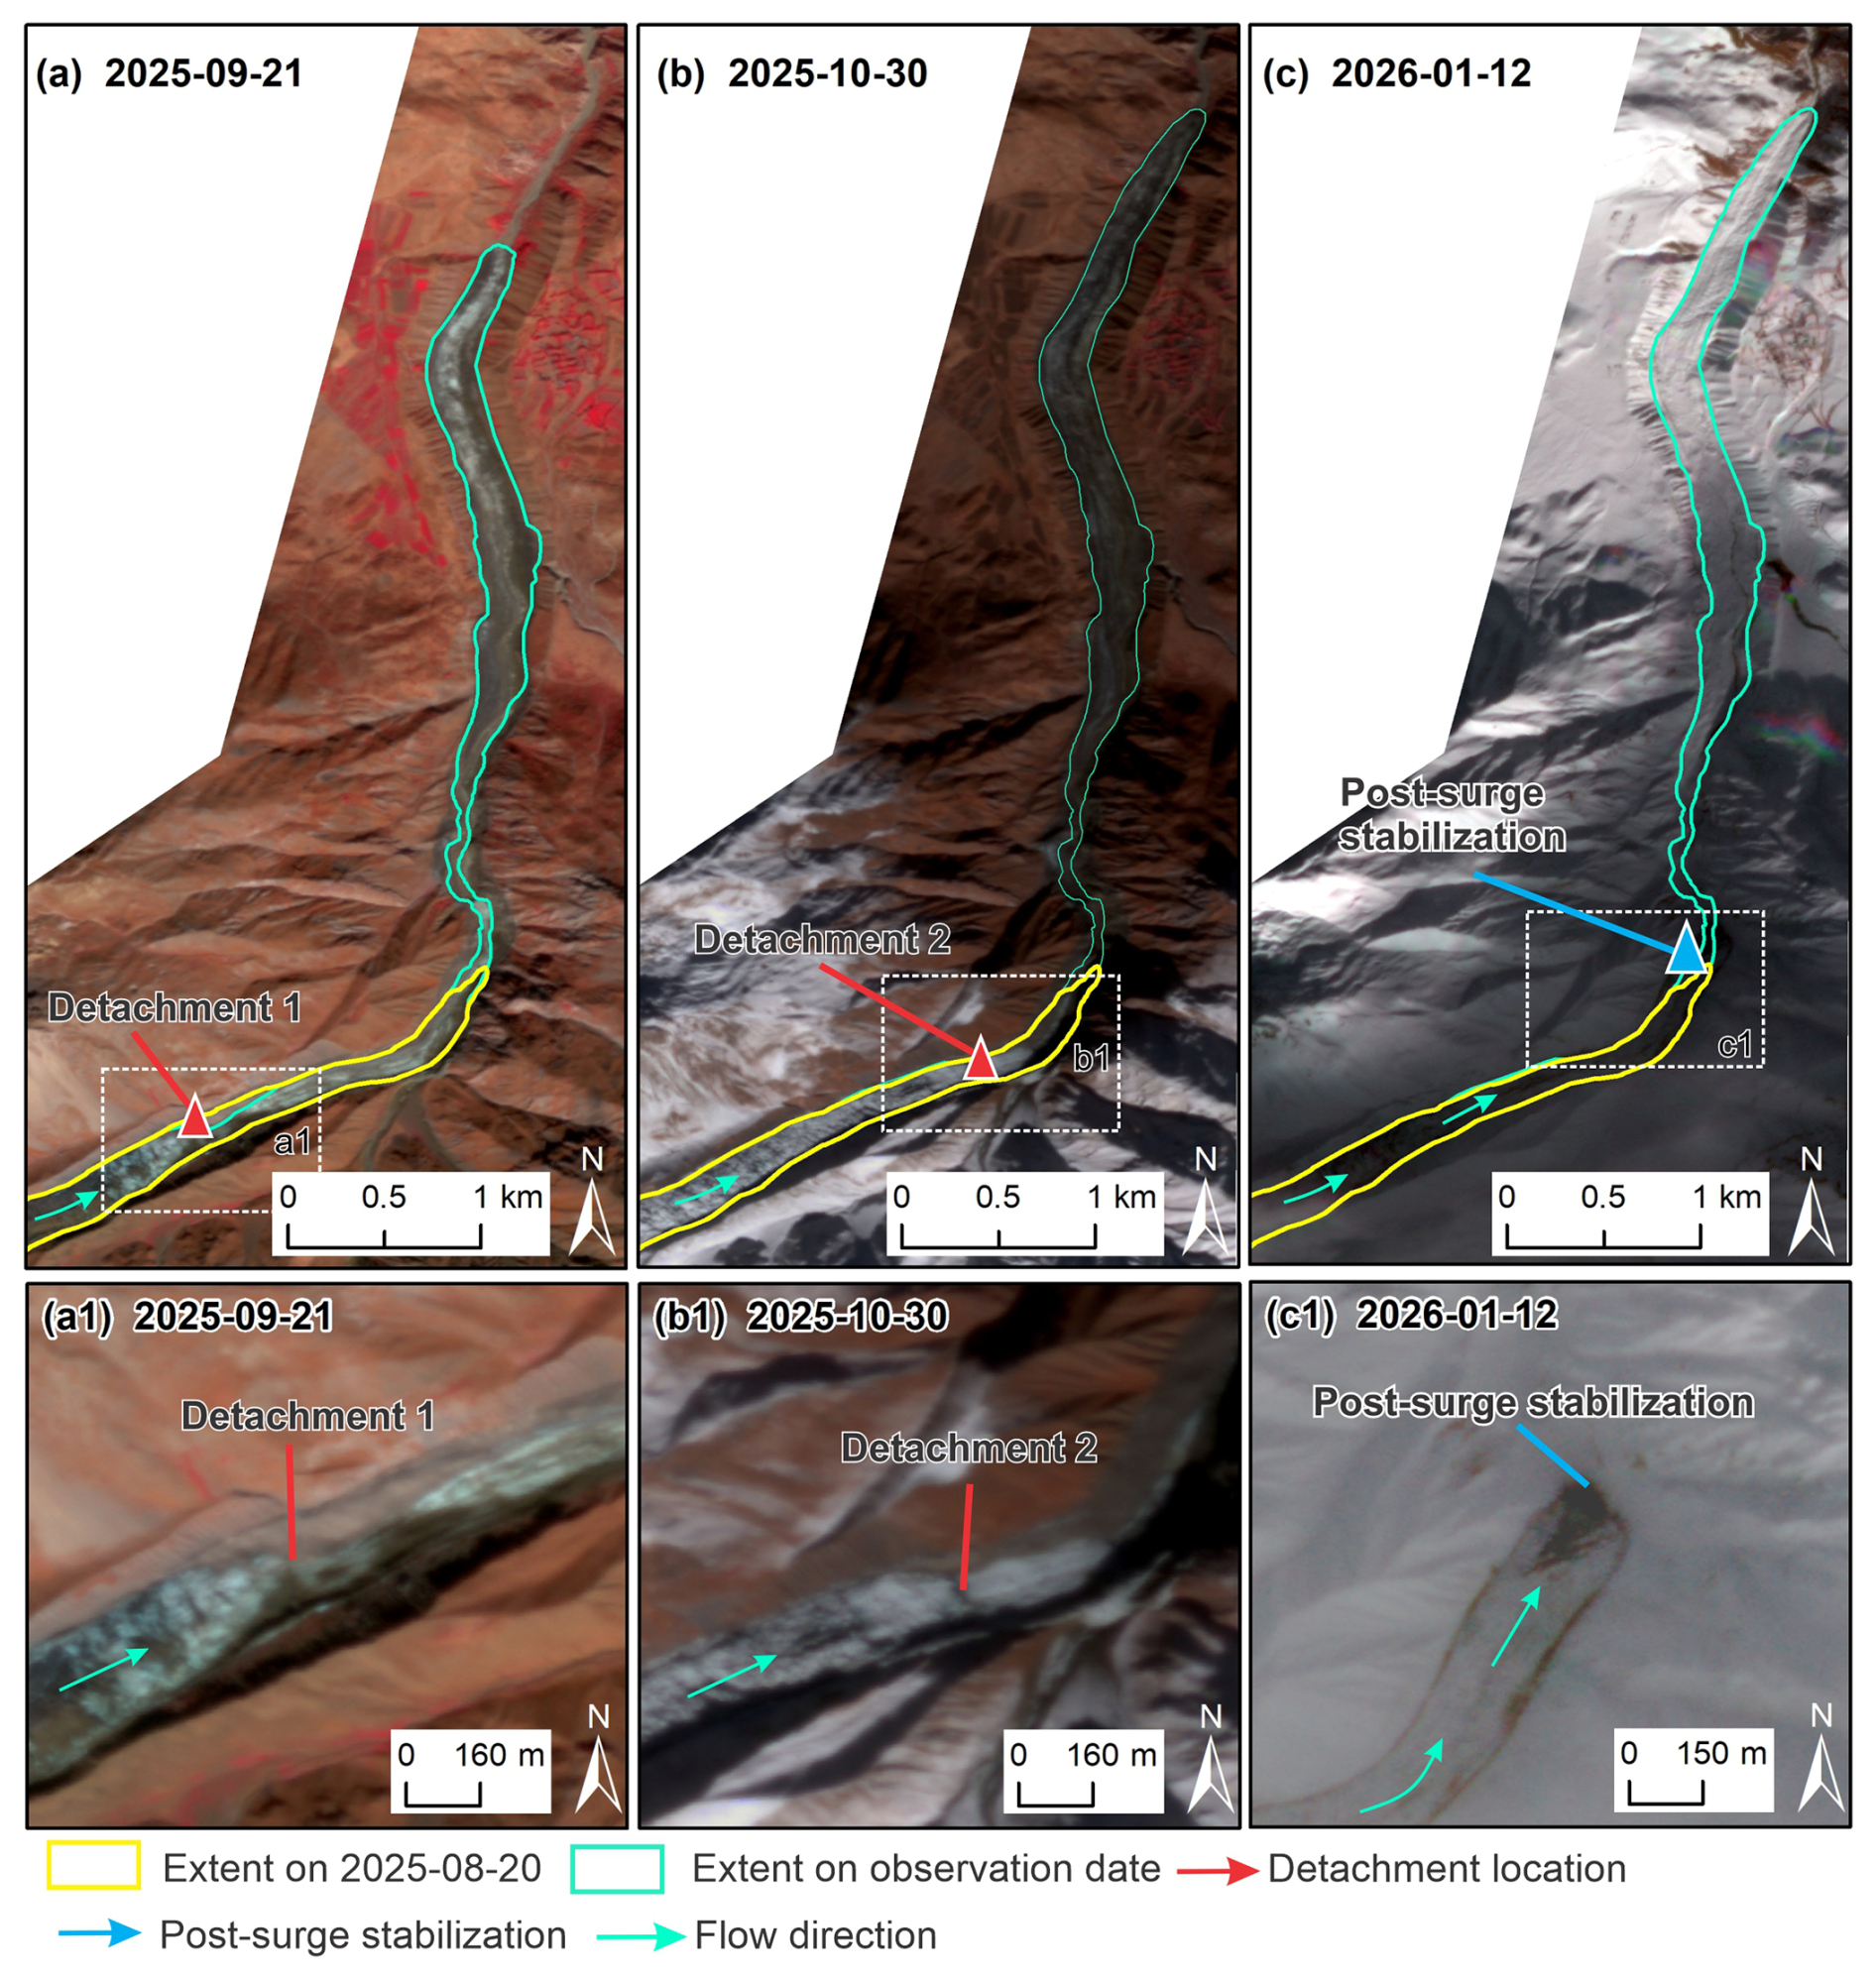
Figure 6Detachment sequence and subsequent evolution of Dehdal Glacier during the 2025–2026 surge derived from PlanetScope imagery (3 m resolution): (a) first detachment documented on 21 September 2025, involving separation of the stagnant debris-covered tongue; (b) second detachment reported on 25 October 2025, and documented in satellite imagery acquired on 30 October 2025, showing the resulting configuration of detached ice; (c) glacier configuration on 12 January 2026. Panels (a1)–(c1) provide enlarged views to facilitate identification of the detachment events and subsequent glacier changes. Yellow outlines show the glacier extent on 20 August 2025 (reference), and cyan outlines indicate glacier margins at each observation date. Red arrows indicate detachment locations, blue arrows indicate the area of subsequent glacier change, and cyan arrows indicate ice-flow direction. Images © 2025 and 2026 Planet Labs PBC.
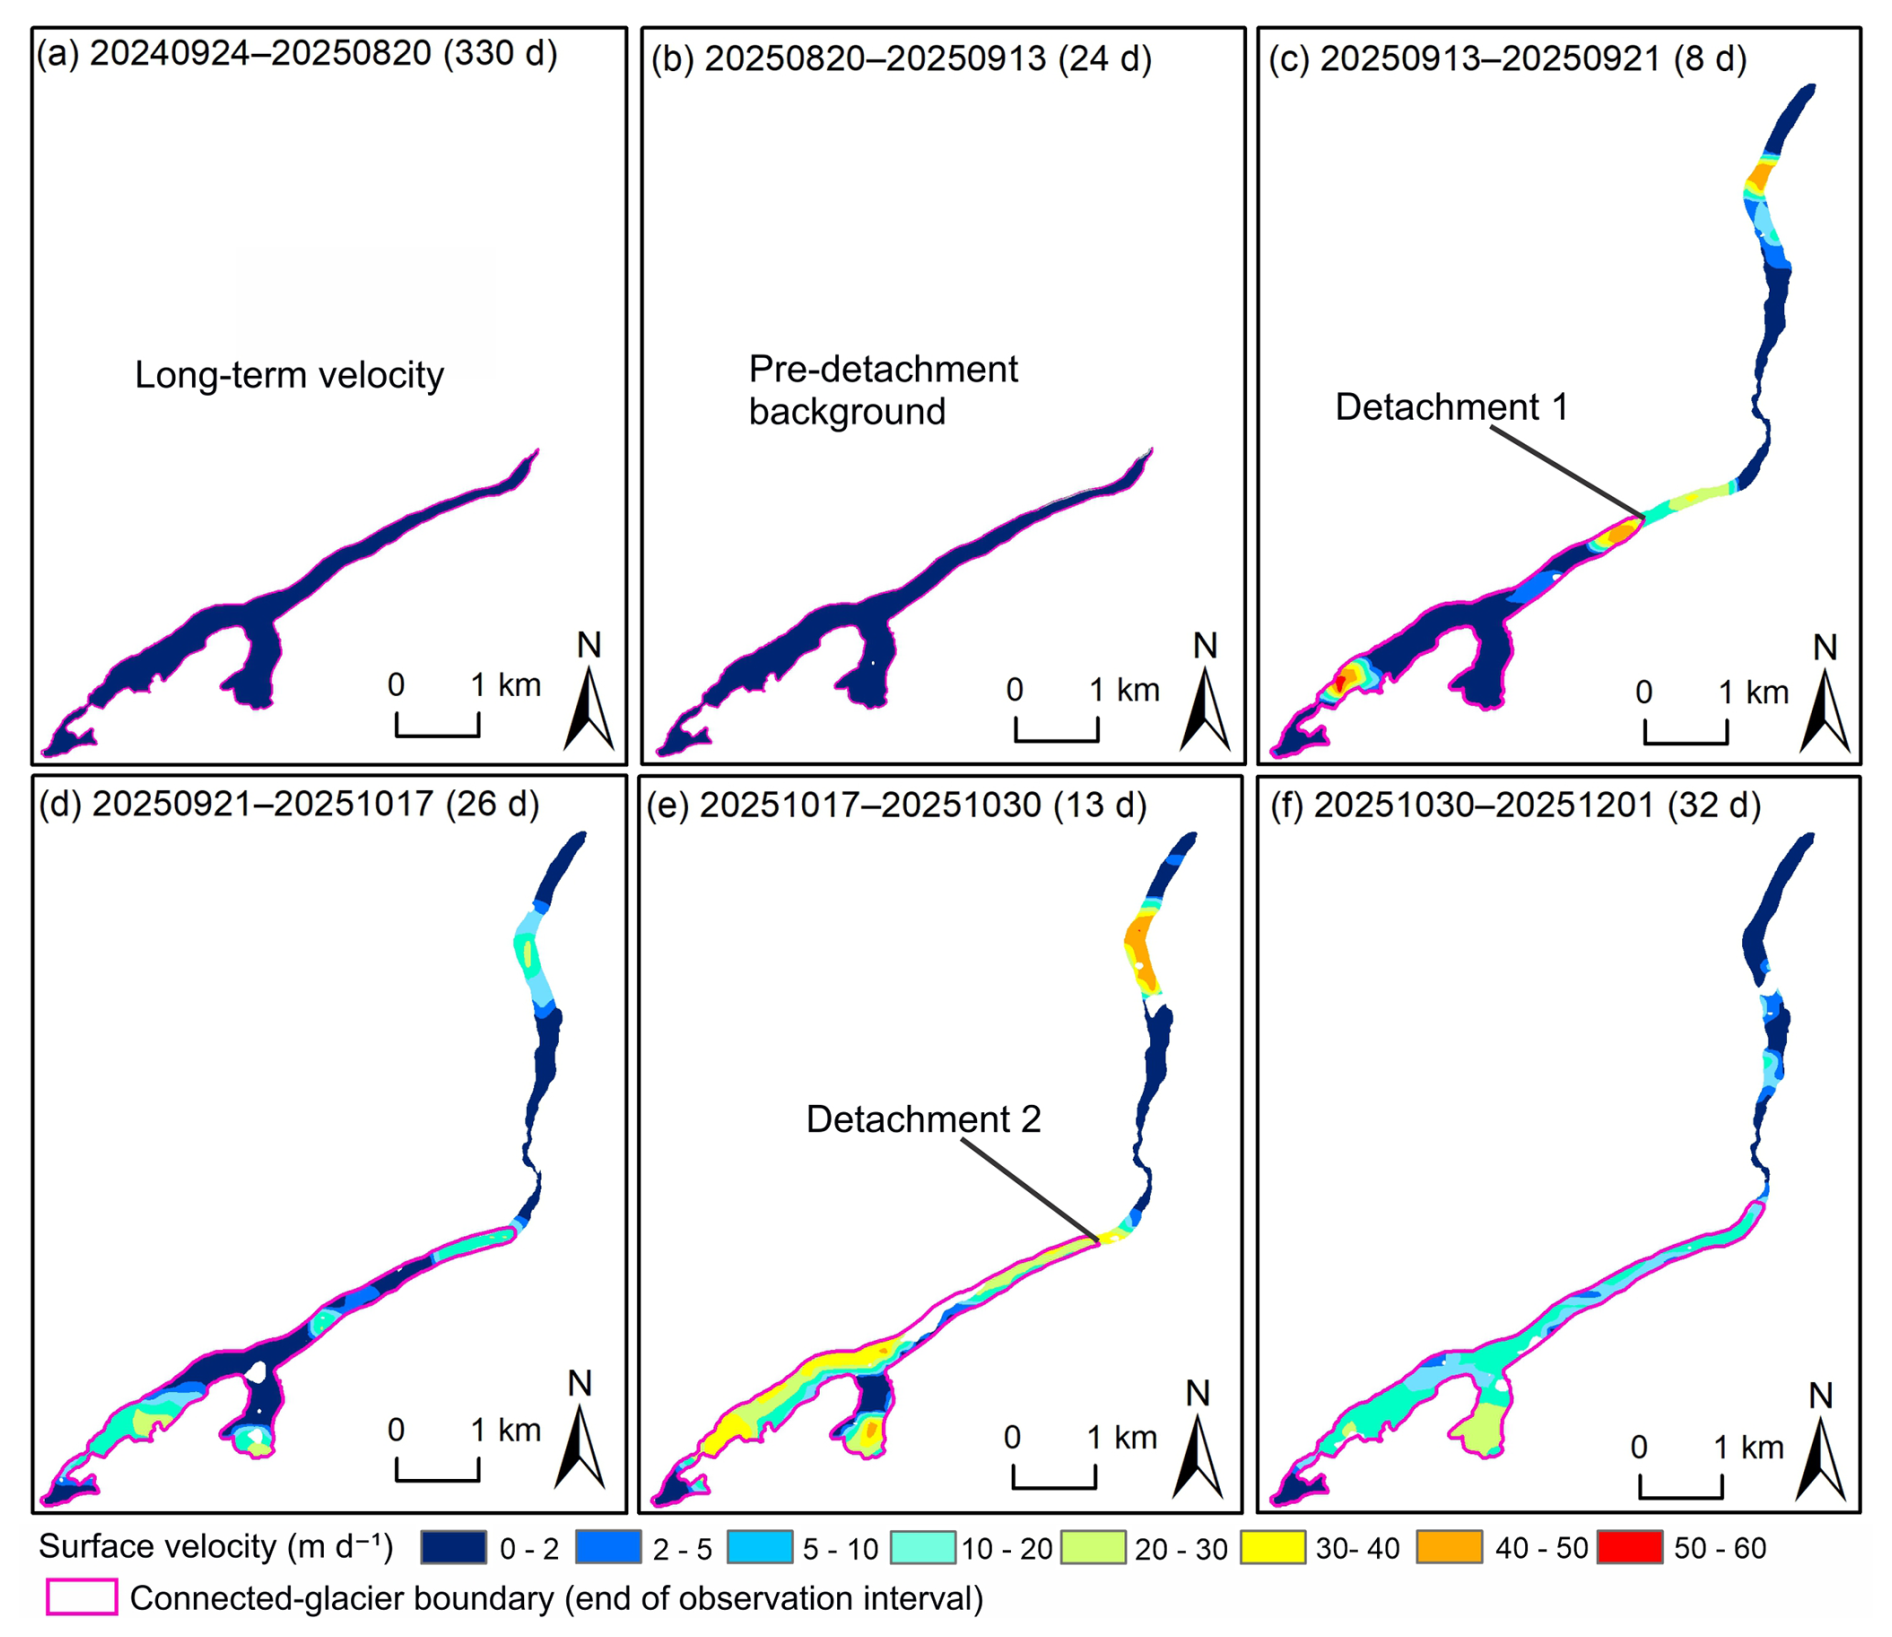
Figure 7Surface velocity evolution during the 2025 Dehdal Glacier surge-detachment sequence. (a–f) Interval-averaged surface velocities derived from successive PlanetScope image pairs between September 2024 and December 2025. All panels use the same velocity units (m d−1) and colour scale (0–60 m d−1). Magenta outlines indicate the connected-glacier boundary mapped at the end of each observation interval.
Between 17 and 21 September 2025, the glacier experienced detachment of its stagnant, debris-covered terminal sector. The detached ice was transported approximately 3.9 km down-valley relative to the 0-point, leaving a valley-blocking ice deposit near Safedob village (Fig. 6a). Because no satellite acquisitions were available within this interval, this downstream extent was determined from the first available post-detachment satellite image, while the movement of the ice mass during 17–21 September 2025 could not be resolved. This event represents the first documented detachment phase within the observed surge-detachment sequence. Following this detachment, the connected-glacier terminus was located approximately 1.54 km upstream of the 20 August 2025 reference position (0-point) on 21 September 2025, reflecting the separation of the lower tongue.
Following this initial detachment, the down-valley ice deposit remained quasi-stable until late October. During this period, surface deformation extended farther down-glacier toward the 20 August 2025 reference terminus position (0-point). A second glacier detachment was reported on 25 October 2025 (Agency for Hydrometeorology, 2025), affecting the lower glacier tongue. The detached ice flowed onto the previously deposited ice, extending a further ∼0.8 km downstream. Because clouds obscured the middle and upper glacier, the first cloud-free satellite image documenting this configuration was acquired on 30 October 2025. On 30 October 2025, the connected-glacier terminus was located approximately 0.79 km upstream of the 20 August 2025 reference position (0-point), following the second detachment. The maximum downstream extent of detached ice following the two detachment events reached approximately 4.7 km from the 20 August 2025 reference terminus position by 9 November 2025 (Figs. 9 and 10).
The October 2025 detachment-related runout was also recorded by local residents and subsequently reported by Tajik media (Asia-Plus, 2025). The footage shows a debris-rich ice mass moving downstream along the Dara River valley, consistent with the detached ice runout reconstructed from satellite imagery. An approximate estimate based on the passage of the runout front between two identifiable landmarks (a road and an erosion gully) suggests a displacement of ∼206 m over 13 s, corresponding to a mean front speed of ∼15.8 m s−1 (∼57 km h−1). This estimate represents the motion of the detached ice runout front as it approached its final position, and may underestimate the average speed of the runout. The estimate is also subject to uncertainty in landmark identification, distance measurement, and video timing. Subsequently, the detached ice mass extended into previously ice-free sections of the valley floor. UAV imagery acquired on 2 December 2025, reveals a clear spatial separation between the connected-glacier terminus and downstream detached ice deposits (Figs. 10 and 11g–h). The connected-glacier terminus reached and surpassed the 0-point baseline in early November 2025 and continued to advance thereafter. By 12 January 2026, the terminus was located approximately 0.25 km down-valley from the reference position (Fig. 9).
The long-term reference velocity field (Fig. 7a), calculated for the period 24 September 2024–20 August 2025, indicates generally low flow speeds across most of the glacier tongue, with a mean surface velocity of approximately 0.2 m d−1. Localized zones of slightly elevated velocities occur near the confluence of tributary branches and along the lower trunk near locations A and B (Fig. 7a), indicating spatial variability in glacier motion.
During the first observation interval (20 August–13 September 2025; Fig. 7b), the glacier remained relatively slow-moving, with a mean surface velocity of approximately 0.37 m d−1, compared with 0.20 m d−1 during the preceding longer-term reference interval. The subsequent short interval (13–21 September 2025; Fig. 7c) reveals localized zones of elevated surface velocity associated with the first detachment event.
The zone of elevated glacier motion expanded upglacier during the period 21 September–17 October 2025 (Fig. 7d). Elevated velocities expanded along the central trunk of the glacier, while the tributary confluence region remained highly active. The following interval (17–30 October 2025; Fig. 7e) marks a period with pronounced acceleration, characterized by widespread acceleration across much of the glacier tongue and coinciding with Detachment 2. Within the mapped connected-glacier extent on 30 October 2025, the mean and maximum interval-averaged surface velocities were approximately 19.6 and 44.2 m d−1, respectively.
During the final observation period (30 October–1 December 2025; Fig. 7f), glacier motion began to decelerate. Although elevated velocities persisted in several sections of the lower trunk, overall speeds decreased substantially from the surge peak, suggesting that the glacier was transitioning back toward quiescent flow conditions.
During the approximately four-month surge episode (September 2025–January 2026), Dehdal Glacier underwent rapid acceleration and two glacier tongue detachments, during which detached ice masses moved downstream along the Dara River valley. The maximum interval-averaged surface velocity within the connected glacier reached approximately 44.2 m d−1 during 17–30 October 2025. The event, therefore, involved both rapid glacier acceleration and two episodes of glacier tongue detachment followed by downstream movement of detached ice masses, resulting in temporary occupation of previously ice-free downstream valley terrain.
4.3 Upper-glacier localization and branch-scale structural evolution
Multi-temporal satellite imagery and UAV orthomosaics acquired between 2019 and 2023 reveal pronounced changes in surface morphology in the upper glacier before the 2025–2026 surge (Figs. 3 and S1–S2). The glacier is divided into two main branches exhibiting strongly asymmetric pre-surge behaviour. The right branch displayed progressive changes in debris distribution, surface texture, and visible crevasse patterns between 2019 and 2023 (Fig. 8a–c), suggesting localized surface deformation. In contrast, the left branch showed less conspicuous morphological change in the available imagery. By November 2025, the right branch exhibited a visibly disturbed surface, characterized by irregular ice and debris patterns within the highlighted area (Fig. 8d), consistent with structural modification during the 2025 surge–detachment sequence.

Figure 8Structural evolution of the upper Dehdal Glacier between 2019 and 2025. (a–c) UAV-derived orthomosaics acquired during the authors' field surveys on 19 July 2019, 11 August 2022, and 18 September 2023, respectively. (d) Luojia3-02 (Wuhan-1) satellite imagery acquired on 9 November 2025, provided by Wuhan University (China). Panels (a1)–(d1) show the left branch of the upper glacier, and panels (a2)–(d2) show the right branch. Close-up views illustrate changes in surface texture, debris cover, crevasse patterns, and exposed bedrock. Red dashed outlines highlight areas of surface disturbance, including changes in debris distribution and crevasse patterns. Panel (d2) illustrates post-event surface disturbance in the right branch following the 2025 surge–detachment sequence.
4.4 Downstream valley occupation and geomorphic impact
Pre-surge imagery from 2019–2023 shows that the lower Dara River valley was ice-free prior to the 2025–2026 surge (Fig. 9b–f). By 9 November 2025, glacier ice and detached ice masses occupied the valley floor below Safedob village along a downstream reach exceeding ∼4 km measured from the 20 August 2025, reference terminus (0-point) along the central flowline (Fig. 9b–c). The pre-surge glacier area on 20 August 2025, was 1.77 km2. Following the first detachment on 21 September 2025, a detached ice mass occupied approximately 0.21 km2 of the downstream region. Following the second detachment inferred around 25 October 2025, the total area of detached ice deposits increased to approximately 0.26 km2. The resulting glacier configuration is first clearly visible in the cloud-free PlanetScope image acquired on 30 October 2025, indicating additional ice emplacement farther downstream. By 12 January 2026, the system had largely stabilized (Fig. 10). The primary glacier tongue covered approximately 1.83 km2, while a detached ice mass (∼0.26 km2) persisted farther downstream on the valley floor, separated from the main glacier by an active river channel. Based on the mean thickness derived from multiple cross-sectional profiles and reconstructed pre-event valley-surface reference elevations, the first-order estimate of deposited ice volume is approximately 4–5×10⁶ m3. The combined mapped ice-covered area of the main glacier and detached ice bodies therefore reached approximately 2.09 km2.
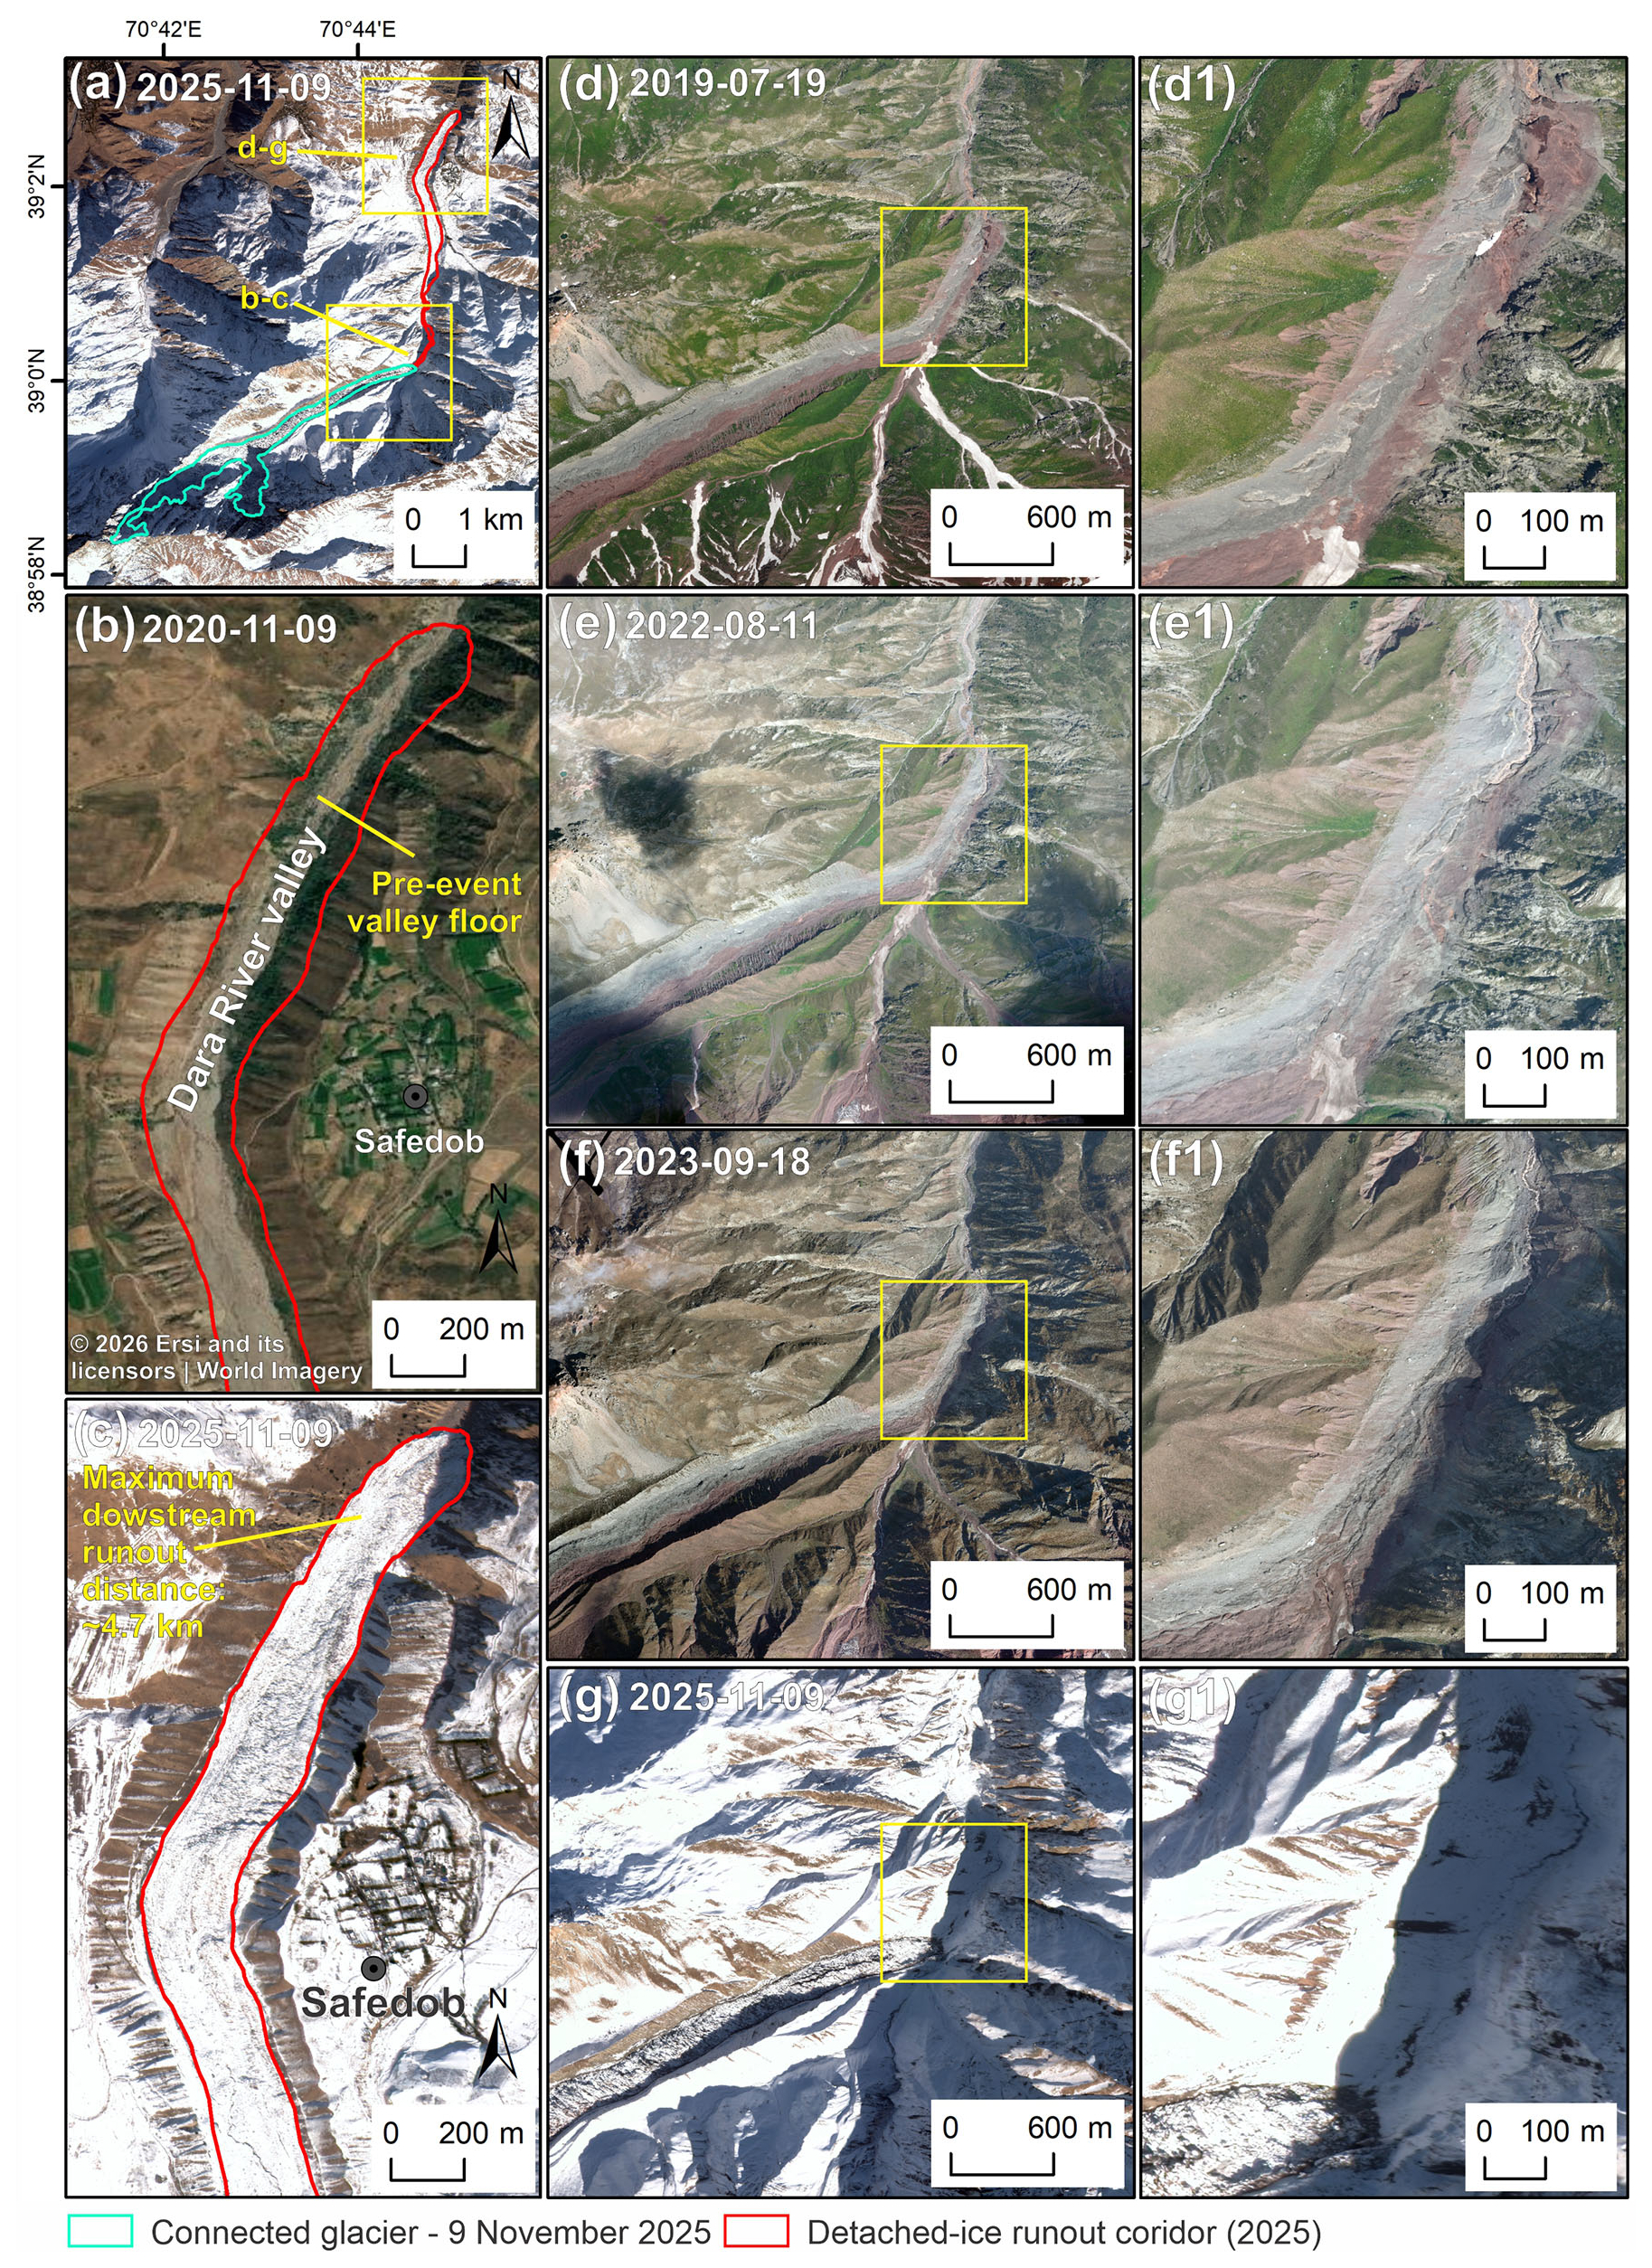
Figure 9Downstream evolution of Dehdal Glacier before and after the 2025–2026 surge-detachment sequence. (a) Overview of the glacier on 9 November 2025, showing the spatial extent of connected glacier and detached-ice runout corridor within the Dara River valley. (b) Pre-event Dara River valley on 9 November 2020, based on Esri World Imagery | Powered by Esri. (c) Downstream detached-ice runout extent (∼4.7 km from the 20 August 2025 glacier terminus) on 9 November 2025. (d–f) Pre-event conditions in 2019, 2022, and 2023. (g) Downstream conditions on 9 November 2025. (d1–g1) Enlarged views of panels (d)–(g). Panels (a), (c), (g), and (g1) are based on Luojia3-02 (Wuhan-1) imagery provided by Wuhan University, whereas panels (d)–(f) and (d1)–(f1) are based on the authors' UAV surveys.
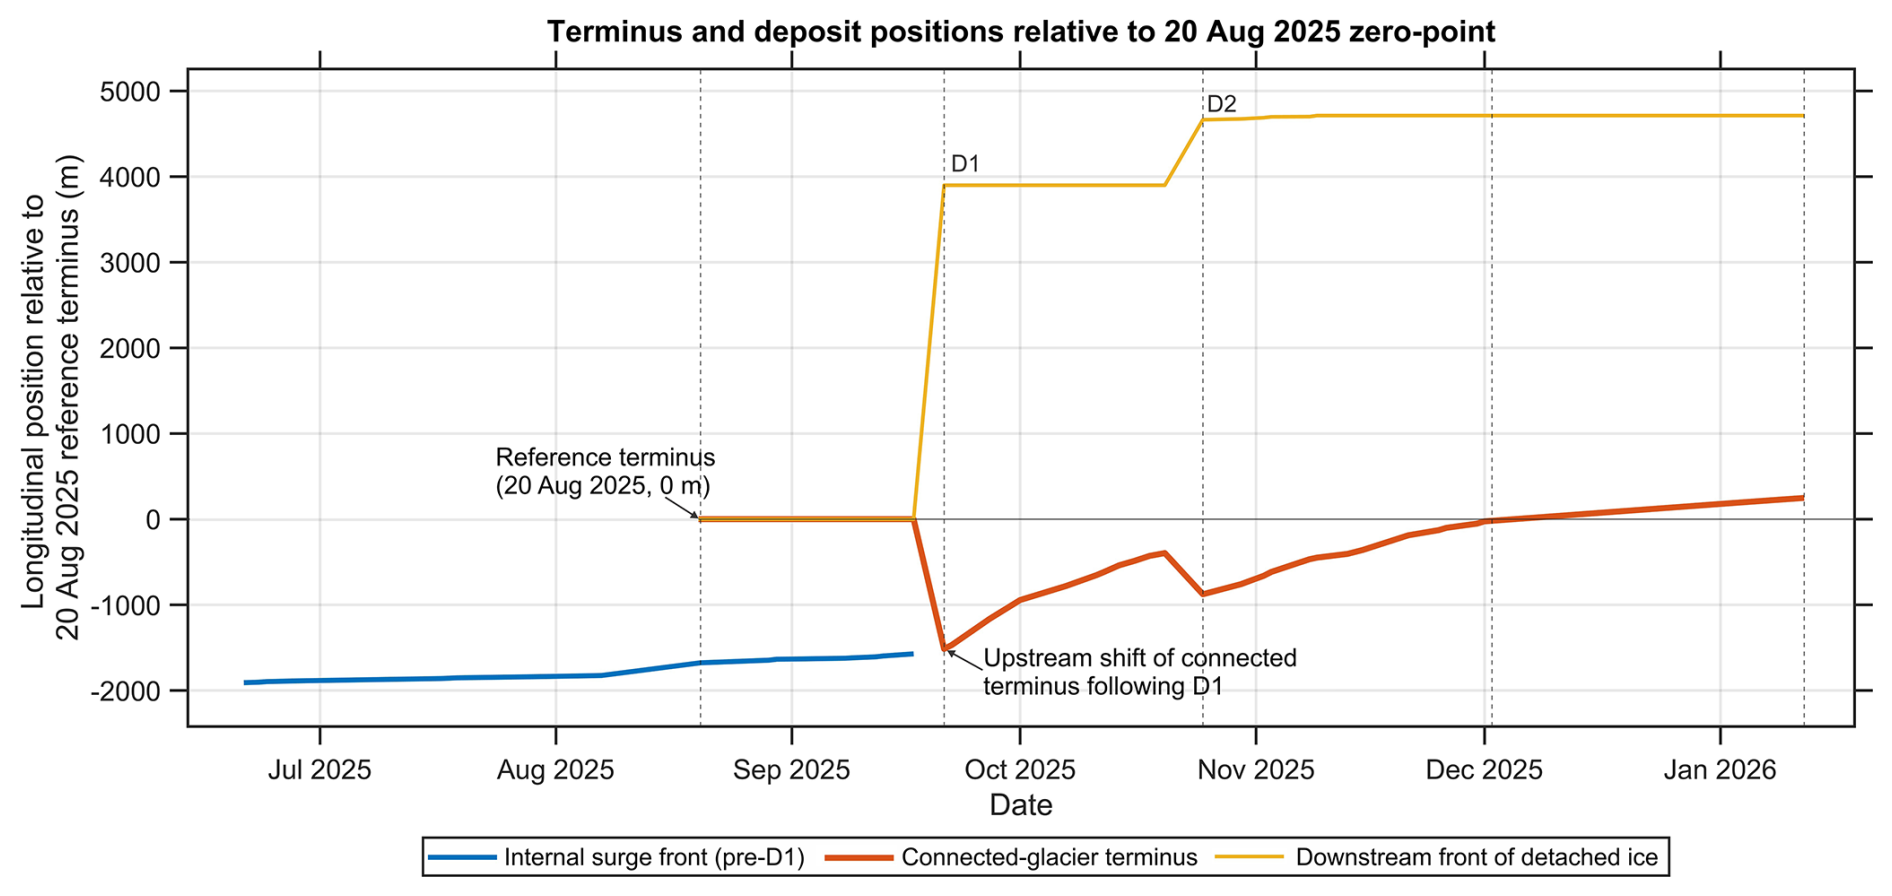
Figure 10Flowline-projected longitudinal positions of the internal surge front, connected-glacier terminus, and downstream front of detached ice at Dehdal Glacier relative to the 20 August 2025, reference terminus (0 m). Positive values indicate positions downstream of the reference terminus, whereas negative values denote positions upstream of the reference terminus. The abrupt upstream shift of the connected-glacier terminus associated with the first detachment (D1, 17–21 September 2025) reflects the mechanical separation of the lower tongue rather than gradual glacier retreat. The second detachment (D2, October 2025) further extended the downstream deposit of detached ice.
The newly emplaced ice substantially modified valley-floor morphology and channel geometry, indicating that the event resulted not only in internal glacier reorganisation but also in significant reoccupation of downstream terrain that had remained ice-free for several decades prior to the event. UAV observations independently confirm post-surge occupation of the lower Dara valley by both the primary glacier tongue and detached ice masses (Fig. 11g–h).

Figure 11UAV field validation of valley conditions before and after the 2025 surge-related detachments of Dehdal Glacier. (a) Luojia3-02 (Wuhan-1) image (0.5 m; 9 November 2025), provided by Wuhan University, showing the Dara valley and locations of UAV observations (b–h). (b–e) UAV orthomosaics (nadir view) acquired in 2019, 2020, 2022, and 2023 show that the valley floor was ice-free before the detachments. (f) Oblique UAV photograph showing pre-surge valley morphology. (g–h) Oblique UAV photographs acquired on 2 December 2025, showing the connected-glacier terminus and downstream detached-ice deposit, respectively.
4.5 Seismicity and climate as supporting context
Regional earthquake records indicate persistent moderate seismic activity within a 60 km radius of Dehdal Glacier during 2019–2025 (Fig. 12a). Earthquake magnitudes during this period generally ranged between Mw 4.0 and 5.0, with the largest event reaching Mw 5.8 on 13 April 2025 (Fig. 12b). No clear clustering of seismic events is observed immediately prior to the onset of rapid glacier acceleration in mid-2025. However, background tectonic activity remained continuous throughout the monitoring period. These observations indicate that the glacier is situated within an actively deforming tectonic environment, but do not demonstrate a temporally coincident seismic trigger.

Figure 12Regional seismicity surrounding Dehdal Glacier (2019–2025). (a) Spatial distribution of earthquakes (Mw ≥3.5) within 60 km of the glacier; (b) Temporal distribution of earthquake magnitudes relative to the 2025 surge window.
Monthly ERA5-Land data for 2016–2025 indicate a positive but statistically insignificant trend in annual mean air temperature of approximately +0.14 °C yr−1 (R2=0.003; p=0.57; Fig. 13a). Seasonal warming is most pronounced during late spring and summer months (Fig. 13c), with mean monthly anomalies relative to the 1981–2010 baseline reaching +1.11 °C (Fig. 14b). The largest positive temperature anomalies occur during May–September, corresponding to the ablation season.

Figure 13Climate variability and ERA5-Land validation for the Dehdal Glacier region (2016–2025). (a) Annual mean air temperature with linear trend. (b) Regression between the monthly station and ERA5-Land temperature. (c) Linear temperature trends for individual calendar months. (d) Annual total precipitation with linear trend. (e) Regression between the monthly station and ERA5-Land precipitation. (f) Linear precipitation trends for individual calendar months.

Figure 14Comparison of ERA5-Land monthly air temperature and total precipitation between the baseline (1981–2010) and 2016–2025 at the Dehdal Glacier grid cell. (a) Mean monthly temperature. (b) Temperature anomalies (2016–2025 minus 1981–2010). (c) Mean monthly precipitation totals. (d) Precipitation anomalies, with the strongest reductions during May–September.
Precipitation over 2016–2025 exhibits a weak negative linear trend (−1.55 mm yr−1; R2=0.017; p=0.159; Fig. 13d), which is also statistically insignificant. Comparison with the 1981–2010 baseline indicates reduced precipitation during the warm season (May–September), with mean monthly anomalies of −26.4 mm and the strongest deficits occurring in mid-summer (Fig. 14d). No sustained increase in precipitation is observed during the decade preceding the surge. A recent study based on measurements at the Surkhob (Kyzylsu) Glacier, 62 km to the east of Dehdal and at a similar altitude, also highlighted reduced precipitation as a major factor contributing to reduced glacier mass balances during the past decade (Jouberton et al., 2025).
ERA5-Land temperature shows strong agreement with available Tojikobod station data (2020–2025) (R2=0.972; Fig. 13b), while precipitation agreement is moderate (R2=0.728; Fig. 13e), reflecting local variability and elevation differences between the station (1590 m a.s.l.) and glacier grid cell (2620 m a.s.l.). Collectively, these climatic and seismic data provide a regional background context for the 2025–2026 event. The recent decade is characterised by warmer-than-baseline conditions and reduced precipitation, particularly during the ablation season. However, neither the monthly climatic trends nor the temporal distribution of regional seismic events demonstrates a clear temporal triggering relationship with the surge-collapse sequence.
5.1 Distinguishing surge propagation from glacier detachment
The 2025–2026 event at Dehdal Glacier represents an unusual case linking surge-related glacier behaviour with low-angle detachment of the glacier tongue. We interpret it as a surge–detachment sequence rather than an isolated detachment because multi-year mass redistribution and branch-scale acceleration preceded the 2025 failures, while the connected-glacier terminus subsequently advanced following detachment-related displacement of its lower tongue. Typically, surge-type glaciers are characterised by rapid acceleration followed by sustained frontal advance over periods of months to years (Meier and Post, 1969; Benn et al., 2019). In contrast, the 2025 event at Dehdal Glacier comprised two sequential but mechanically distinct processes. The first component was an internally propagating surge-related acceleration phase, characterized by the development of surface crevasses and deformation features in the upper glacier, acceleration of the glacier trunk, and development of an internal surge front (Figs. 4, 5, and 7). The second component consisted of two localized low-angle detachment events (Fig. 6), during which sections of the glacier tongue separated from the dynamically connected glacier and rapidly displaced downslope. Following separation, the detached ice masses behaved as dynamically independent ice-debris bodies rather than as a continuously flowing glacier terminus. We therefore use the term “surge–detachment sequence” to describe two linked but mechanically distinct processes, rather than proposing a new hybrid process class. Further investigations will be needed to determine the mechanistic link between these events.
This behaviour shares characteristics with recently documented glacier instability and detachment events in high mountain environments (Faillettaz et al., 2015; Gilbert et al., 2018; Kääb et al., 2021). These studies show that rapid basal decoupling and mechanical weakening can trigger sudden glacier break-off or collapse, producing large ice-debris masses that travel several kilometers downstream. The Dehdal event, therefore, illustrates that surge-driven acceleration may transition into mechanical detachment of a debris-covered glacier tongue; in Dehdal's case, two detachments occurred. The Dehdal event showed spatially localized surge initiation within a single tributary branch. Multi-year velocity observations reveal that the right tributary experienced progressive acceleration beginning several years prior to the 2025 event, whereas the left tributary remained comparatively stable. This branch-scale acceleration provides evidence of dynamic reorganization within the glacier system before the detachments and is difficult to reconcile with an isolated terminal failure alone.
The pre-surge velocity fields and longitudinal profiles indicate that acceleration was concentrated within the right tributary between approximately 4 and 5 km upstream from the terminus (Fig. 4). This spatial pattern suggests that dynamic preconditioning developed within a confined tributary source region before the rapid 2025 activation of the lower glacier trunk. Similar tributary-scale surge initiation has been documented in several surge-type glaciers in High Mountain Asia, where localized stress accumulation or hydrological reorganization can trigger surge activation within specific glacier sectors (Copland et al., 2011; Sevestre and Benn, 2015; Lv et al., 2019; Li et al., 2023). Comparable spatially localized activation patterns have also been reported from Svalbard (Murray et al., 2003; Strozzi et al., 2026).
Structural observations from multi-temporal satellite imagery and UAV data further support this interpretation. Progressive crevasse widening, debris displacement, and changes in surface fracture patterns in the right tributary between 2019 and 2023 suggest localized surface deformation prior to the surge, consistent with observations linking crevasse formation to glacier acceleration (Nanni et al., 2025). These structural changes closely match the velocity anomalies observed along the right tributary of the glacier and suggest that dynamic preconditioning preceded the 2025 acceleration phase through localized weakening of the glacier structure within the tributary confluence zone.
The first detachment was preceded by multi-year mass redistribution and surface deformation, but the absence of satellite imagery between 17 and 21 September prevents us from determining whether rapid acceleration immediately preceded or coincided with rupture. The detachments coincided with widespread acceleration of the dynamically connected glacier tongue, although the automated velocity retrievals during the most dynamic phase of the event should be interpreted with caution. This temporal and kinematic sequence favors a surge–detachment interpretation over an isolated detachment, although it does not demonstrate that surge acceleration directly triggered the first failure. Although longitudinal strain-rate analysis could provide additional insight into the transition from surge propagation to mechanical detachment, we do not quantify longitudinal strain rates here because the available automated velocity retrievals are least reliable during the most dynamic phases of the event. Similar glacier detachments and rock-ice avalanche processes have been documented elsewhere in the Peter I Range of Tajikistan (Leinss et al., 2021), indicating that valley confinement, glacier geometry, and local geological conditions may promote mechanically unstable glacier behaviour in this region.
5.2 Topographic and mechanical controls on the detachment of the glacier tongue
The detachment of the Dehdal Glacier tongue during the 2025–2026 event may have resulted from the interaction between surge-related acceleration and local topographic and mechanical conditions within the lower glacier valley. Glacier detachments typically occur where rapid glacier acceleration coincides with weak basal coupling, strong longitudinal stress gradients, and gravitational forcing along steep valley slopes (Faillettaz et al., 2015; Kääb et al., 2021).
One important factor is the confined valley geometry of the lower Dehdal Glacier. The glacier tongue occupies a narrow valley that strongly constrains lateral spreading and promotes efficient transmission of longitudinal stress during periods of rapid flow. Such geometric confinement can amplify compressional and extensional stress fields within the glacier tongue, increasing the likelihood of mechanical rupture during surge acceleration. Similar behaviour has been observed in confined valley glaciers where surge propagation produces strong stress concentration near the glacier terminus (Sevestre and Benn, 2015; Lovell et al., 2026).
The debris-covered character of the lower glacier tongue may have contributed to mechanical instability. Extensive supraglacial debris cover modifies the surface energy balance and can locally suppress ablation, allowing ice to accumulate and thicken during the quiescent phase (Benn et al., 2012; Gilbert et al., 2018). During surge acceleration, this stored mass can increase longitudinal stress gradients within the glacier tongue (Sevestre and Benn, 2015; Faillettaz et al., 2015). Debris-covered glacier tongues are known to develop complex internal stress regimes and structural weaknesses that can favour mechanical failure under rapid dynamic forcing (Benn et al., 2012; Gilbert et al., 2018; Kääb et al., 2021). Furthermore, debris-covered areas of glaciers are indicative of subglacial till accumulation (Delaney and Anderson, 2022), providing soft-bedded material facilitating ice flow hysteresis.
The rapid acceleration observed in September–October 2025 is consistent with, but does not demonstrate, a role for changes in basal hydrological conditions. Increased meltwater production during recent warm summers may have enhanced basal lubrication beneath the glacier tongue; elevated temperatures were also implicated in the 1974 event at Dehdal (Suslov, 1974). Elevated basal water pressure can reduce effective normal stress at the glacier bed and promote rapid basal sliding, a process widely invoked in surge-type glacier dynamics (Clarke, 1987; Sevestre and Benn, 2015; Benn et al., 2019). Basal water pressure and drainage efficiency were not measured, so their contribution to the Dehdal event cannot be directly evaluated. Although regional geological mapping indicates that fine-grained lithologies are widespread in the northern Peter I Range (Leinss et al., 2021), the composition and spatial continuity of subglacial sediments beneath Dehdal Glacier remain unknown. Therefore, we cannot assume that the entire glacier is underlain by fine-grained material. However, if clay-rich sediments are locally present beneath Dehdal Glacier, they may reduce basal shear strength and facilitate mechanical decoupling under high water pressure conditions, a mechanism proposed for several recent glacier detachment events (Jacquemart et al., 2020; Kääb et al., 2021; Leinss et al., 2021).
The enthalpy-balance model provides a potentially relevant framework for interpreting the unusually short recurrence interval and renewed acceleration at the glacier (Benn et al., 2019). Within this framework, changes in ice thickness, basal thermal conditions, and water availability may move a glacier towards a critical state for surge activation. The observed pre-event thickening, internal mass redistribution, and multi-year acceleration are consistent with such an evolution. However, because basal temperature, water pressure, drainage efficiency, and englacial water content were not measured, we cannot determine whether Dehdal Glacier crossed a specific enthalpy threshold.
The slope of the lower glacier tongue may have further facilitated rapid down-valley displacement once detachment occurred. Elevation profiles indicate that the lowermost ∼1 km of the glacier tongue has a mean slope of approximately 13.9°. Slopes within this range have been associated with several documented glacier detachment events in high mountain environments, where gravitational driving stresses become sufficiently large to promote rapid sliding or collapse (Kääb et al., 2021).
Taken together, these observations suggest that the 2025–2026 Dehdal Glacier event was associated with surge-related acceleration, debris-tongue dynamics, and strong valley-scale geometric confinement, while basal hydrological weakening remains a plausible but untested contribution. Once mechanical decoupling occurred, gravitational driving stresses likely facilitated rapid down-valley displacement of the detached ice mass, producing the large displacement observed during the two detachment events.
5.3 Geomorphic impacts and hazard implications of surge-detachment events
The 2025–2026 surge-detachment sequence at Dehdal Glacier demonstrates that even relatively small debris-covered mountain glaciers can produce substantial geomorphic disturbance when surge acceleration is accompanied by glacier tongue detachment. The two detachment events transported large volumes of glacier ice several kilometres downstream, rapidly occupying previously ice-free sections of the Dara River valley. Such rapid redistribution of ice and debris can substantially modify valley-floor morphology, alter river channels, and enhance sediment delivery to downstream fluvial systems (Gilbert et al., 2018; Muhammad et al., 2021; Meng et al., 2023; Lovell et al., 2026).
Prior to the surge, satellite and UAV imagery indicate that the lower Dara River valley remained largely ice-free between 2019 and 2023. Following the detachment events, however, detached ice masses occupied more than 4 km of the valley floor downstream of the pre-surge glacier terminus. This rapid emplacement of ice represents a major geomorphic perturbation that temporarily altered the valley-floor landscape. Similar valley-floor reoccupation has been documented following large glacier detachments and ice-debris avalanches in other high mountain regions, where rapid ice displacement reshapes valley morphology and modifies river networks (Gilbert et al., 2018; Kääb et al., 2021).
Rapid glacier advance or detachment-driven displacement can temporarily obstruct river channels, increase sediment flux, or trigger secondary processes such as debris flows and debris floods in mountain catchments (Haeberli et al., 2017; Baggio et al., 2024; Murodov et al., 2024). In confined mountain valleys, these processes can propagate downstream, affecting settlements or transportation routes along river corridors. Although no catastrophic flooding occurred during the Dehdal event of 2025, the presence of detached ice masses and altered river channels indicates that surge-detachment events may represent a previously under-recognized cryospheric hazard in the Pamir Mountains. The 1974 Dehdal event was reported to be accompanied by numerous outburst floods during the active phase. The estimated detached ice volume of ∼4–5×10⁶ m3 is smaller than the largest glacier detachment documented in the Petra Pervogo Range (8.8×10⁶ m3; Leinss et al., 2021) but remains within the same order of magnitude as previously reported glacier detachments in the region. This suggests that the Dehdal Glacier event represents another example of large-scale glacier instability typical of the Pamir Mountains.
The Dehdal event also highlights the importance of high-frequency satellite monitoring for detecting and analysing rapid glacier instabilities. The daily PlanetScope observations used in this study allowed the main phases of the surge and detachment sequence to be reconstructed at high temporal resolution. Many historical surge events in High Mountain Asia have been reconstructed from annual or multi-annual satellite imagery, which limits the ability to resolve short-lived dynamic processes such as detachment events or rapid surge pulses (Goerlich et al., 2020). High-frequency observations, therefore, provide critical new insights into the short-term kinematics of glacier instabilities.
More broadly, the observations presented here suggest that surge-type behaviour in small debris-covered glaciers may produce geomorphic impacts that extend well beyond the glacier terminus. In steep, confined mountain valleys such as those of the Pamir region, surge-associated detachments may allow glacier ice to rapidly advance into downstream terrain that has remained ice-free for decades. These processes highlight the need for improved monitoring of dynamically unstable glaciers and for greater integration of glacier surge behaviour into regional assessments of cryospheric hazards in High Mountain Asia. These observations indicate that small debris-covered glaciers in steep mountain environments should be included in regional monitoring frameworks, as surge-detachment cascades may occur rapidly and produce significant geomorphic disturbance even in relatively small glacier systems.
5.4 Implications for surge dynamics in small debris-covered glaciers
The observations presented here indicate that surge behaviour in small debris-covered glaciers may evolve along dynamic pathways that include mechanical detachment as well as glacier advance, consistent with previously documented surge-related detachments (Leinss et al., 2021; Zou et al., 2023). In the case of Dehdal Glacier, the event was preceded by multi-year changes in surface velocity, including renewed acceleration concentrated in the right tributary, followed by a rapid phase of glacier acceleration and two localized detachments. These observations suggest that surge acceleration may, under certain geometric and mechanical conditions, be associated with structural failure of the glacier tongue rather than sustained frontal advance. In classical surge-type glaciers, accelerated ice typically remains dynamically connected to the glacier trunk and produces sustained frontal advance (Meier and Post, 1969; Benn et al., 2019), whereas at Dehdal Glacier, surge acceleration was accompanied by the mechanical separation of the glacier tongue.
While classical surge theory assumes that accelerated ice remains dynamically connected to the glacier trunk, the observations presented here suggest that surge-related stress transfer may contribute to mechanical separation of the terminal glacier tongue. After detachment, the displaced ice mass moved rapidly down-valley under the force of gravity. This interpretation is consistent with the sequential observations presented in Figs. 4, 6, and 7. Progressive upper-glacier deformation and branch-scale acceleration preceded the first detachment, whereas widespread glacier acceleration coincided with the second detachment. Both detachments were characterized by localized mechanical separation followed by rapid gravitational displacement of the detached ice masses. Similar detachment mechanisms have been documented in several recent glacier collapse events in High Mountain Asia (Gilbert et al., 2018; Kääb et al., 2021), consistent with the interpretation of glacier detachment as a possible end-member of surge dynamics in steep mountain environments (Lovell et al., 2026).
These findings highlight the importance of glacier hypsometry, lower-tongue geometry, and valley confinement in controlling surge expression (Sevestre and Benn, 2015; Lovell et al., 2026). In narrow valleys with relatively steep lower tongues, surge-induced acceleration may generate sufficiently large longitudinal stress gradients to promote structural rupture within the glacier tongue. Under such conditions, surge propagation may transition into detachment-driven displacement rather than continuous glacier advance. This mechanism may be particularly relevant for small debris-covered glaciers, where strong topographic control and heterogeneous ice thickness can produce localized mechanical instabilities (Benn et al., 2012).
The daily PlanetScope observations used in this study provide rare high-temporal-resolution insight into the short-term evolution of surge-driven glacier instabilities. High-frequency satellite observations therefore offer new opportunities to investigate the short-term processes governing glacier instabilities and surge behaviour in remote mountain regions.
The Dehdal Glacier observations provide further evidence of the diverse dynamic behaviour of surge-type glaciers in steep mountain environments, consistent with previous studies (Lovell et al., 2026). In particular, surge-related acceleration may be followed by glacier tongue detachment, producing rapid downstream displacement of glacier ice. The Dehdal event provides a further documented example of this surge-detachment sequence in small debris-covered glaciers occupying a steep, confined valley. Similar geometric and mechanical conditions occur widely across High Mountain Asia (Leinss et al., 2021; Kääb et al., 2021; Zou et al., 2023; Guo et al., 2023), suggesting that comparable surge-driven detachment processes may be more common than previously documented. Recognizing this surge-detachment transition is therefore important for improving understanding of glacier instability processes and for assessing cryospheric hazards associated with dynamically unstable mountain glaciers.
5.5 Research priorities for surge-detachment events
Several unresolved questions emerging from the Dehdal Glacier event define priorities for future investigation of surge–detachment cascades in steep mountain glaciers:
Climate influence and shortened surge recurrence: The ∼9–10-year interval between the 2015–2016 and 2025–2026 events is considerably shorter than the multi-decadal cycles previously documented at this site. Although ERA5-Land data indicate warmer-than-baseline conditions during the preceding decade, the mechanisms linking climate forcing to shortened surge recurrence remain unclear. Future work should examine whether increased meltwater generation and longer ablation seasons could accelerate basal hydrological reorganization and trigger earlier surge activation before full reservoir regeneration. The enthalpy-balance model of surging (Benn et al., 2019) provides a useful framework for testing whether Dehdal Glacier approached a critical dynamic state before the 2025 event. However, evaluating this hypothesis requires knowledge of, or estimation for, ice thickness, basal thermal conditions, water pressure, and drainage efficiency.
Role of basal materials and debris composition: The mechanical behaviour of the glacier tongue may depend strongly on the properties of basal sediments. If present, fine-grained or clay-rich subglacial materials may reduce basal shear strength and promote rapid decoupling under elevated water pressures (Jacquemart et al., 2020; Kääb et al., 2021; Leinss et al., 2021). Field sampling of debris and valley-floor deposits, combined with grain-size and geotechnical analyses, could help determine whether weak basal sediments contributed to the low-angle detachments observed at Dehdal Glacier.
Fracture mechanics and stress evolution preceding detachment: The first detachment involved separation of the stagnant, debris-covered lower tongue, with detached ice extending approximately 3.9 km downstream from the reference terminus position. During the second event, additional ice from the lower glacier tongue moved onto the previously deposited ice, extending the downstream deposit by approximately 0.8 km. These differences in the observed detachment and runout configurations warrant further investigation of the associated failure processes. Although the present dataset allows reconstruction of the surge-detachment sequence, robust estimation of driving stress, longitudinal strain-rate evolution, and pre-existing basal shear zones requires additional information on glacier thickness and basal geometry. Future studies integrating these datasets with high-frequency velocity fields would allow a more complete mechanical assessment of surge-driven detachment.
Controls on surge versus surge-detachment behaviour: Historical observations indicate that Dehdal Glacier has experienced surges with varying frontal responses, ranging from conventional advance to detachment-driven displacement. Understanding why some surges produce only advance while others culminate in glacier tongue collapse requires comparison of glacier geometry, valley confinement, debris thickness, and basal hydrology across different surge cycles. Systematic comparison of the 1974, 2015–2016, and 2025–2026 events may help identify thresholds controlling the transition from classical surge behaviour to surge-detachment cascades.
Taken together, the observations from Dehdal Glacier indicate that surge-type behaviour in small debris-covered glaciers may evolve through a dynamic cascade involving localized dynamic preconditioning, rapid glacier acceleration, and mechanical detachment of the glacier tongue. This sequence adds to previous observations of surge-related glacier detachment by documenting two successive detachments and the subsequent evolution of the connected glacier and detached ice. Such surge-detachment transitions may therefore represent an important but poorly documented component of glacier instability in High Mountain Asia.
This study documents a surge-detachment sequence at Dehdal Glacier in the northwestern Pamirs using daily PlanetScope imagery, UAV surveys, and multi-year velocity analysis. The results provide new insights into the dynamics of surge-type glaciers in steep mountain environments.
- I.
The event was preceded by multi-year variations in surface velocity, including renewed acceleration concentrated in the right tributary and pre-surge ice mass redistribution indicated by UAV-derived elevation changes. Visible surface deformation, including crevasse development, was observed before the first detachment. The dynamically connected glacier tongue continued to advance thereafter, and widespread acceleration coincided with the second detachment. These observations favour a surge–detachment interpretation over an isolated glacier detachment.
- II.
The detachments were associated with surge-related acceleration and local topographic and mechanical controls. Valley confinement and debris-covered tongue dynamics may have promoted mechanical failure, whereas basal hydrological weakening remains a plausible but untested contribution.
- III.
The surge-detachment sequence produced substantial geomorphic disturbance in the lower Dara River valley. Detached ice masses occupied more than 4 km of previously ice-free valley floor, demonstrating that even small debris-covered glaciers can rapidly modify downstream landscapes during surge-detachment events.
- VI.
These observations provide further evidence of the previously documented connection between glacier surging and detachment processes. Surge acceleration in steep, confined valleys may, under certain conditions, be associated with structural failure of the glacier tongue rather than sustained frontal advance.
- V.
High-frequency satellite observations are critical for resolving short-term glacier instabilities. The daily PlanetScope imagery used in this study enabled reconstruction of the main phases of glacier acceleration, detachment, and subsequent stabilization at high temporal resolution, providing new opportunities to investigate rapidly evolving glacier hazards in High Mountain Asia.
Collectively, these findings show that small debris-covered glaciers can generate complex surge-detachment sequences with significant geomorphic and hazard implications. This highlights the importance of systematic high-frequency monitoring of dynamically unstable glaciers to improve understanding of glacier instability processes and associated cryospheric hazards across High Mountain Asia.
The datasets supporting this study are publicly available at Zenodo: https://doi.org/10.5281/zenodo.19052839 (Safarov, 2026).
The supplement related to this article is available online at https://doi.org/10.5194/tc-20-6375-2026-supplement.
Mustafo Safarov: Writing – review and editing, Writing – original draft, Visualization, Validation, Software, Formal analysis, Data curation, Methodology, Conceptualization. Junli Li: Writing – review and editing, Writing – original draft, Methodology, Investigation, Data curation, Conceptualization, Funding acquisition, Supervision, Project administration. Evan Miles: Writing – review and editing, Validation, Methodology, Formal analysis. Majid Gulayozov: Methodology, Investigation. Ruonan Li: Methodology, Validation, Data curation. Ali Fazylov: Investigation, Data curation. Kamoliddin Nazirzoda: Investigation, Data curation. Firdavs Vosidov: Investigation, Data curation. Murodkhudzha Murodov: Investigation, Data curation, Software. Hofiz Navruzshoev: Investigation and data curation. Ardamehr Halimov: Investigation, Software. All authors have read and agreed to the published version of the manuscript.
The contact author has declared that none of the authors has any competing interests.
Publisher's note: Copernicus Publications remains neutral with regard to jurisdictional claims made in the text, published maps, institutional affiliations, or any other geographical representation in this paper. The authors bear the ultimate responsibility for providing appropriate place names. Views expressed in the text are those of the authors and do not necessarily reflect the views of the publisher.
We thank Planet Labs PBC for providing PlanetScope satellite imagery through the Planet Education and Research Program, and Wuhan University (China) for providing the high-resolution Luojia3-02 (Wuhan-1) satellite image used in this study. Sentinel satellite data provided by the Copernicus Programme and the AW3D30 digital elevation model produced by the Japan Aerospace Exploration Agency (JAXA) were also used in this study. We are grateful to local collaborators and field assistants for their assistance during fieldwork in the Dara River valley.
This research was supported by the Natural Science Foundation of Xinjiang Uygur Autonomous Region (grant no. 2023D01E18) and the National Natural Science Foundation of China (grant no. U2003201). E. Miles acknowledges the SPI Flagship Initiative “From ice to microorganisms and humans: Toward an interdisciplinary understanding of climate change impacts on the Third Pole (PAMIR)” (grant no. {SPIFLAG-2021-001}) funded by the Swiss Polar Institute.
This paper was edited by Sheng Fan and reviewed by Harold Lovell and two anonymous referees.
Agency for Hydrometeorology: Press conference with representatives of national television and radio on the pulsation of the Dehdal (Didal) Glacier, Committee for Environmental Protection under the Government of the Republic of Tajikistan, https://www.meteo.tj/en/news/2025/10/31/-301 (last access: 19 October 2026), 2025.
Altena, B., Scambos, T., Fahnestock, M., and Kääb, A.: Extracting recent short-term glacier velocity evolution over southern Alaska and the Yukon from a large collection of Landsat data, The Cryosphere, 13, 795–814, https://doi.org/10.5194/tc-13-795-2019, 2019.
Asia-Plus: A large section of a glacier in the Ismoili Somoni mountain range has detached in Tojikobod, Facebook video, https://www.facebook.com/watch/?v=24908973212120451, 28 October 2025.
Baggio, T., Martini, M., Bettella, F., and D'Agostino, V.: Debris flow and debris flood hazard assessment in mountain catchments, Catena, 245, 108338, https://doi.org/10.1016/j.catena.2024.108338, 2024.
Benn, D. I., Bolch, T., Hands, K., Gulley, J., Luckman, A., Nicholson, L. I., Quincey, D., Thompson, S., Toumi, R., and Wiseman, S.: Response of debris-covered glaciers in the Mount Everest region to recent warming and implications for outburst flood hazards, Earth-Sci. Rev., 114, 156–174, https://doi.org/10.1016/j.earscirev.2012.03.008, 2012.
Benn, D. I., Fowler, A. C., Hewitt, I., and Sevestre, H.: A general theory of glacier surges, J. Glaciol., 65, 701–716, https://doi.org/10.1017/jog.2019.62, 2019.
Beraud, L., Brun, F., Dehecq, A., Hugonnet, R., and Shekhar, P.: Glacier surge monitoring from temporally dense elevation time series: application to an ASTER dataset over the Karakoram region, The Cryosphere, 19, 5075–5094, https://doi.org/10.5194/tc-19-5075-2025, 2025.
Bhambri, R., Hewitt, K., Kawishwar, P., and Pratap B.: Surge-type and surge-modified glaciers in the Karakoram, Sci. Rep., 7, 15391, https://doi.org/10.1038/s41598-017-15473-8, 2017.
Clapuyt, F., Vanacker, V., Schlunegger, F., and Van Oost, K.: Unravelling earth flow dynamics with 3-D time series derived from UAV-SfM models, Earth Surf. Dynam., 5, 791–806, https://doi.org/10.5194/esurf-5-791-2017, 2017.
Clarke, G. K. C.: Fast glacier flow: ice streams, surging, and tidewater glaciers, J. Geophys. Res., 92, 8835–8841, https://doi.org/10.1029/JB092iB09p08835, 1987.
Copland, L., Sylvestre, T., Bishop, M. P., Shroder, J. F., Seong, Y. B., Owen, L. A., and Kamp, U.: Expanded and recently increased glacier surging in the Karakoram, Arct. Antarct. Alp. Res., 43, 503–516, https://doi.org/10.1657/1938-4246-43.4.503, 2011.
Dehecq, A., Gourmelen, N., and Trouve, E.: Deriving large-scale glacier velocities from a complete satellite archive: application to the Pamir–Karakoram–Himalaya, Remote Sens. Environ., 162, 55–66, https://doi.org/10.1016/j.rse.2015.01.031, 2015.
Delaney, I. and Anderson, L. S.: Debris cover limits subglacial erosion and promotes till accumulation, Geophys. Res. Lett., 49, e2022GL099049, https://doi.org/10.1029/2022GL099049, 2022.
Desinov, L. V.: Above the Glaciers of the Pamirs: Following the Route of V. I. Lipskiy's Expedition, Priroda, 2, 53–65, 1984.
Desinov, S. L.: Recent glacier movements in the western part of the Peter the Great Ridge (Pamir), Earth's Cryosphere, 25, 47–56, https://doi.org/10.15372/KZ20210405, 2021.
Faillettaz, J., Funk, M., and Vincent, C. : Avalanching glacier instabilities: a review of processes and early warning perspectives, Rev. Geophys., 53, 203–224, https://doi.org/10.1002/2014RG000466, 2015.
Farinotti, D., Immerzeel, W. W., de Kok, R. J., Quincey, D. J., and Dehecq, A.: Manifestations and mechanisms of the Karakoram glacier anomaly, Nat. Geosci., 13, 8–16, https://doi.org/10.1038/s41561-019-0513-5, 2020.
Feroz, A., Liang, S., Li, G., Li, X., Rahman, Z. U., and Yang, B.: Debris-covered glaciers mapping based on machine learning and multi-source satellite images over Eastern Pamir, Big Earth Data, 9, 265–297, https://doi.org/10.1080/20964471.2025.2463726, 2025.
Fowler, A. C., Murray, T., and Ng, F. S. L.: Thermally controlled glacier surging. J. Glaciol., 47, 527–538, https://doi.org/10.3189/172756501781831792, 2001.
Gilbert, A., Leinss, S., Kargel, J., Kääb, A., Gascoin, S., Leonard, G., Berthier, E., Karki, A., and Yao, T.: Mechanisms leading to the 2016 giant twin glacier collapses, Aru Range, Tibet, The Cryosphere, 12, 2883–2900, https://doi.org/10.5194/tc-12-2883-2018, 2018.
Goerlich, F., Bolch, T., and Paul, F.: More dynamic than expected: an updated survey of surging glaciers in the Pamir, Earth Syst. Sci. Data, 12, 3161–3176, https://doi.org/10.5194/essd-12-3161-2020, 2020.
Guillet, G., King, O., Lv, M., Ghuffar, S., Benn, D., Quincey, D., and Bolch, T.: A regionally resolved inventory of High Mountain Asia surge-type glaciers, derived from a multi-factor remote sensing approach, The Cryosphere, 16, 603–623, https://doi.org/10.5194/tc-16-603-2022, 2022.
Guo, L., Li, J., Dehecq, A., Li, Z., Li, X., and Zhu, J.: A new inventory of High Mountain Asia surging glaciers derived from multiple elevation datasets since the 1970s, Earth Syst. Sci. Data, 15, 2841–2861, https://doi.org/10.5194/essd-15-2841-2023, 2023.
Haeberli, W., Schaub, Y., and Huggel, C.: Increasing risks related to landslides from degrading permafrost into new lakes in deglaciating mountain ranges, Geomorphology, 293, 405–417, https://doi.org/10.1016/j.geomorph.2016.02.009, 2017.
Heid, T. and Kääb, A.: Evaluation of existing image matching methods for deriving glacier surface displacements globally from optical satellite imagery, Remote Sens. Environ., 118, 339–355, https://doi.org/10.1016/j.rse.2011.11.024, 2012.
Hersbach, H., Bell, B., Berrisford, P., Hirahara, S., Horányi, A., Muñoz Sabater, J., Nicolas, J., Peubey, C., Radu, R., Schepers, D., Simmons, A., Soci, C., Abdalla, S., Abellan, X., Balsamo, G., Bechtold, P., Biavati, G., Bidlot, J., Bonavita, M., De Chiara, G., Dahlgren, P., Dee, D., Diamantakis, M., Dragani, R., Flemming, J., Forbes, R., Fuentes, M., Geer, A., Haimberger, L., Healy, S., Hogan, R. J., Hólm, E., Janisková, M., Keeley, S., Laloyaux, P., Lopez, P., Lupu, C., Radnoti, G., Rosnay, P., Rozum, I., Vamborg, F., Villaume, S., and Thépaut, J.-N.: The ERA5 global reanalysis, Q. J. Roy. Meteor. Soc., 146, 1999–2049, https://doi.org/10.1002/qj.3803, 2020.
Immerzeel, W. W., Kraaijenbrink, P. D., Shea, J. M., Shrestha, A. B., Pellicciotti, F., Bierkens, M. F., and de Jong, S. M.: High-resolution monitoring of Himalayan glacier dynamics using unmanned aerial vehicles, Remote Sens. Environ., 150, 93–103, https://doi.org/10.1016/j.rse.2014.04.025, 2014.
Jacquemart, M., Loso, M., Leopold, M., Welty, E., Berthier, E., Hansen, J. S., Sykes J., and Tiampo, K.: What drives large-scale glacier detachments? Insights from Flat Creek glacier, St. Elias mountains, Alaska, Geology, 48, 703–707, https://doi.org/10.1130/G47211.1, 2020.
Jiskoot, H.: Glacier surging, in: Encyclopaedia of Snow, Ice and Glaciers, edited by: Singh, V. P., Singh, P., and Haritashya, U. K., Springer, Heidelberg, 415–428, https://doi.org/10.1007/978-90-481-2642-2_559, 2011.
Jouberton, A., Shaw, T. E., Miles, E., Kneib, M., Fugger, S., Buri, P., McCarthy, M., Kayumov, A., Navruzshoev, H., Halimov, A., Kabutov, K., Homidov, F., and Pellicciotti, F.: Snowfall decrease in recent years undermines glacier health and meltwater resources in the Northwestern Pamirs, Commun. Earth Environ., 6, 691, https://doi.org/10.1038/s43247-025-02611-8, 2025.
Kääb, A.: Remote sensing of mountain glaciers and permafrost creep, University of Zürich, Phys. Geogr. Ser., 48, ISBN 978-3-85543-244-8, 2005.
Kääb, A., Jacquemart, M., Gilbert, A., Leinss, S., Girod, L., Huggel, C., Falaschi, D., Ugalde, F., Petrakov, D., Chernomorets, S., Dokukin, M., Paul, F., Gascoin, S., Berthier, E., and Kargel, J. S.: Sudden large-volume detachments of low-angle mountain glaciers – more frequent than thought?, The Cryosphere, 15, 1751–1785, https://doi.org/10.5194/tc-15-1751-2021, 2021.
Kääb, A., Aga, J., Treichler, D., Girod, L., and Chao, W.-A.: Recent giant detachment of a glacier on the Tibetan plateau provoked by its frozen tongue, Communications Earth & Environment, 7, 74, https://doi.org/10.1038/s43247-025-03125-z, 2026.
Kamb, B., Raymond, C. F., Harrison, W. D., Engelhardt, H., Echelmeyer, K. A., Humphrey, N., Brugman, M. M., and Pfeffer, T.: Glacier surge mechanism: 1982–1983 surge of Variegated Glacier, Alaska, Science, 227, 469–479, https://doi.org/10.1126/science.227.4686.469, 1985.
Kotlyakov, V. M., Desinov, L. V., Desinov, S. L., and Rudakov V. A.: Surges of the Pamir glaciers in the first 20 years of the 21st century, Dokl. Earth Sci., 495, 854–857, https://doi.org/10.1134/S1028334X20110082, 2020.
Lamsters, K., Ješkins, J., Sobota, I., Karušs, J., and Džeriņš, P.: Surface characteristics, elevation change, and velocity of high-Arctic valley glacier from repeated high-resolution UAV photogrammetry, Remote Sens., 14, 1029, https://doi.org/10.3390/rs14041029, 2022.
Leinss, S., Bernardini, E., Jacquemart, M., and Dokukin, M.: Glacier detachments and rock-ice avalanches in the Petra Pervogo range, Tajikistan (1973–2019), Nat. Hazards Earth Syst. Sci., 21, 1409–1429, https://doi.org/10.5194/nhess-21-1409-2021, 2021.
Li, G., Lv, M., Quincey, D. J., Taylor, L. S., Li, X., Yan, S., Sun, Y., and Guo, H.: Characterizing the surge behaviour and associated ice-dammed lake evolution of the Kyagar Glacier in the Karakoram, The Cryosphere, 17, 2891–2907, https://doi.org/10.5194/tc-17-2891-2023, 2023.
Lipskiy, V. I.: Mountainous Bukhara: results of three-year journeys to Central Asia in 1896, 1897 and 1899. Part 2: Gissar, Peter the Great Ridge, Alay, St. Petersburg, https://books.google.co.in/books?id=bsZFAQAAMAAJ&redir_esc=y (last access: 13 October 2026), 1902.
Lovell, H., Benn, D. I., Jiskoot, H., Stokes, C. R., Flowers, G. E., Guillet, G., Mannerfelt, E. S., Falaschi, D., Kääb, A., King, O., Benediktsson, Í. Ö., Bhambri, R., Lv, M., Muhammad, S., and Luckman, A.: Glacier surging and surge-related hazards in a changing climate, Nat. Rev. Earth Environ., https://doi.org/10.1038/s43017-025-00757-9, 2026.
Lv, M., Guo, H., Lu, X., Liu, G., Yan, S., Ruan, Z., Ding, Y., and Quincey, D. J.: Characterizing the behaviour of surge- and non-surge-type glaciers in the Kingata Mountains, eastern Pamir, from 1999 to 2016, The Cryosphere, 13, 219–236, https://doi.org/10.5194/tc-13-219-2019, 2019.
Meier, M. F. and Post, A.: What are glacier surges?, Can. J. Earth Sci., 6, 807–817, https://doi.org/10.1139/e69-081, 1969.
Meng, Z., Lyu, L., Xu, M., Yu, G., Ma, C., Wang, Z., and Stoffel, M.: Effects of frequent debris flows on barrier lake formation, sedimentation and vegetation disturbance, Palongzangbo River, Tibetan Plateau, Catena, 220, 106697, https://doi.org/10.1016/j.catena.2022.106697, 2023.
Mishra, A., Nainwal, H. C., Bolch, T., Shah, S. S., and Shankar, R.: Glacier inventory and glacier changes (1994–2020) in the Upper Alaknanda Basin, Central Himalaya, J. Glaciol., 69, 591–606, https://doi.org/10.1017/jog.2022.87, 2023.
Muhammad, S., Li, J., Steiner, J. F., Shrestha, F., Shah, G. M., Berthier, E., and Tian, L.: A holistic view of Shisper Glacier surge and outburst floods: from physical processes to downstream impacts, Geomat. Nat. Haz. Risk, 12, 2755–2775, https://doi.org/10.1080/19475705.2021.1975833, 2021.
Murodov, M., Li, L., Safarov, M., Lv, M., Murodov, A., Gulakhmadov, A., Khusrav, K., and Qiu, Y.: A comprehensive examination of the Medvezhiy Glacier's surges in West Pamir (1968–2023), Remote Sens., 16, 1730, https://doi.org/10.3390/rs16101730, 2024.
Murray, T., Strozzi, T., Luckman, A., Jiskoot, H., and Christakos, P.: Is there a single surge mechanism? Contrasts in dynamics between glacier surges in Svalbard and other regions, J. Geophys. Res., 108, 2237, https://doi.org/10.1029/2002JB001906, 2003.
Nanni, U., Bouchayer, C., Akesson, H., Lefeuvre, P.-M., Mannerfelt, E. S., Köhler, A., Gagliardini, O., Kohler, J., Schmidt, L. S., Hult, J., Renard, F., and Schuler, T. V.: Observed positive feedback between surface ablation and crevasse formation drives glacier acceleration and potential surge, Nat. Commun., 16, 11227, https://doi.org/10.1038/s41467-025-66349-9, 2025.
Narzikulov, I. K. and Stanyukovich, K. V. (Eds.): Atlas of the Tadzhik Soviet Socialist Republic, GUGK, Dushanbe and Moscow, https://search.rsl.ru/ru/record/01009927785 (last access: 23 July 2026), 1968.
Osipova, G., Tchetinnikov, A., and Rudak, M.: Catalogue of surging glaciers of Pamir, Mater. Glyatsiol. Issled., 85, 3–136, 1998.
Paul, F., Bolch, T., Briggs, K., Kääb, A., McMillan, M., McNabb, R., Nagler, T., Nuth, C., Rastner, P., Strozzi, T., and Wuite, J.: Error sources and guidelines for quality assessment of glacier area, elevation change, and velocity products derived from satellite data in the Glaciers_cci project, Remote Sens. Environ., 203, 256–275, https://doi.org/10.1016/j.rse.2017.08.038, 2017.
Planet Labs PBC: PlanetScope imagery product documentation, https://docs.planet.com/data/imagery/planetscope/ (last access: 20 January 2026), 2026.
Quincey, D. J., Braun, M., Glasser, N. F., Bishop, M. P., Hewitt, K., and Luckman, A.: Karakoram glacier surge dynamics, Geophys. Res. Lett., 38, L18504, https://doi.org/10.1029/2011GL049004, 2011.
Ravier, É., Lelandais, T., Vérité, J., and Bourgeois, O.: Variations in hydraulic efficiency of the subglacial drainage landsystem control surging and streaming regimes of outlet glaciers, J. Glaciol., 69, 860–878, https://doi.org/10.1017/jog.2022.107, 2023.
Raymond, C. F.: How do glaciers surge? A review., J. Geophys. Res., 92, 9121–9134, https://doi.org/10.1029/JB092iB09p09121, 1987.
RGI Consortium: Randolph Glacier Inventory – a dataset of global glacier outlines, version 6, NSIDC [data set], Boulder, CO, USA, https://doi.org/10.7265/4m1f-gd79, 2017.
RGI Consortium: Randolph Glacier Inventory – a dataset of global glacier outlines, version 7, NSIDC [data set], Boulder, CO, USA, https://doi.org/10.5067/F6JMOVY5NAVZ, 2023.
Rototaev, K. P.: Nastupaniye lednika Didal' na Pamire [Advance of Lednik Didal' in the Pamir], Materialy Glatsiologicheskikh Issledovanii, 24, 188, http://geolibrary.ru/sites/default/files/2020-11/24.pdf (last access: 19 October 2026), 1974.
Safarov, M.: Derived datasets for the 2025–2026 surge of Dehdal Glacier (Pamir Mountains, Tajikistan), Zenodo [data set], https://doi.org/10.5281/zenodo.19052839, 2026.
Safarov, M., Kang, S., Murodov, M., Banerjee, A., Navruzshoev, H., Gulayozov, M., Fazylov, A., and Vosidov, F.: Quantifying glacier surging and associated lake dynamics in Amu Darya River basin using UAV and remote sensing data, J. Mt. Sci., 21, 2967–2985, https://doi.org/10.1007/s11629-023-8538-z, 2024a.
Safarov, M., Kang, S., Fazylov, A., Gulayozov, M., Banerjee, A., Navruzshoev, H., Chen, P., Xue, Y., and Murodov, M.: Estimating glacier dynamics and supraglacial lakes together with associated regional hazards using high-resolution datasets in the Pamir, J. Mt. Sci., 21, 3767–3788, https://doi.org/10.1007/s11629-024-8936-x, 2024b.
Safarov, M., Li, J., Gulayozov, M., Fazylov, A., Banerjee, A., Li, R., Halimov, A., Ahmad, Z., and Murodov, M.: Surge-type glacier activity in the Tajik Pamirs from 2000 to 2024, Global Planet. Change, 263, 105543, https://doi.org/10.1016/j.gloplacha.2026.105543, 2026.
Safarov, M. S. and Fazylov, A. R.: Remote sensing and monitoring of mudflow-prone areas in the mountainous territories of Tajikistan, Promexpo, Dushanbe, 192 pp., 2023.
Scambos, T. A., Dutkiewicz, M. J., Wilson, J. C., and Bindschadler, R. A.: Application of image cross-correlation to the measurement of glacier velocity using satellite image data, Remote Sens. Environ., 42, 177–186, https://doi.org/10.1016/0034-4257(92)90101-O, 1992.
Sevestre, H. and Benn, D. I.: Climatic and geometric controls on the global distribution of surge-type glaciers: implications for a unifying model of surging, J. Glaciol., 61, 646–662, https://doi.org/10.3189/2015JoG14J136, 2015.
Sevestre, H., Benn, D. I., Hulton, N. R. J., and Bælum, K.: Thermal structure of Svalbard glaciers and implications for thermal switch models of glacier surging, J. Geophys. Res.-Earth Surf., 120, 2220–2236, https://doi.org/10.1002/2015JF003517, 2015.
Strozzi, T., Mannerfelt, E. S., Cartus, O., Santoro, M., Schellenberger, T., and Kääb, A.: Glacier surge activity over Svalbard from 1992 to 2025 interpreted using heritage satellite radar missions and Sentinel-1, The Cryosphere, 20, 1679–1697, https://doi.org/10.5194/tc-20-1679-2026, 2026.
Suslov, V. F.: Surges and collapses of Didal' Glacier in 1974, Materialy Glatsiologicheskikh Issledovanii, 24, 189–191, 1974.
Tarca, G., Hoelzle, M., and Guglielmin, M.: Using PlanetScope images to investigate the evolution of small glaciers in the Alps, Remote Sens. Appl. Soc. Environ., 32, 101013, https://doi.org/10.1016/j.rsase.2023.101013, 2023.
Uskov, Yu. S. and Kvachev, V. I.: Surge-type Didal' Glacier, Materialy Glatsiologicheskikh Issledovanii, 36, 170–175, 1979.
Wang, Z., Jiang, Z., Wu, K., Liu, S., Zhang, Y., Wang, X., Zhang, Z., and Wei, J.: Characteristics of glaciers surging in the western Pamirs, Remote Sens., 15, 1319, https://doi.org/10.3390/rs15051319, 2023.
Wheaton, J. M., Brasington, J., Darby, S. E., and Sear, D. A.: Accounting for uncertainty in DEMs from repeat topographic surveys: improved sediment budgets, Earth Surf. Process. Landf., 35, 136–156, https://doi.org/10.1002/esp.1886, 2010.
Xue, Y., Jing, Z., Kang, S., He, X., and Li, C.: Combining UAV and Landsat data to assess glacier changes on the central Tibetan Plateau, J. Glaciol., 67, 862–874, https://doi.org/10.1017/jog.2021.37, 2021.
Zhang, J., Lei, Y., Charrier, L., Dehecq, A., Gardner, A. S., Copland, L., and Dow, C.: Validation of ITS_LIVE v2.0 mountain glacier velocities using in-situ GNSS data, EGUsphere [preprint], https://doi.org/10.5194/egusphere-2026-2541, 2026.
Zhang, T., Wang, W., Shen, Z., Zhan, N., Wang, Z., and An, B.: Understanding the 2004 glacier detachment in the Amney Machen Mountains, northeastern Tibetan Plateau, via multi-phase modeling, Landslides, 20, 315–330, https://doi.org/10.1007/s10346-022-01989-2, 2023.
Zou, C., Jansen, J. D., Carling, P. A., Dou, X., Wei, Z., and Fan, X.: Triggers for multiple glacier detachments from a low-angle valley glacier in the Amney Machen Range, eastern Tibetan Plateau, Geomorphology, 440, 108867, https://doi.org/10.1016/j.geomorph.2023.108867, 2023.