
the Creative Commons Attribution 4.0 License.
the Creative Commons Attribution 4.0 License.
 | 12 Oct 2026
Temperature sensitivity of snow viscoplasticity: Evidence from controlled creep experiments

Marius Brun
Mathis Bozon
Benoit Laurent
Pascal Hagenmuller
Snow is a warm, porous material whose densification under its own weight is highly temperature-dependent. Despite decades of research, reported activation energies for snow viscoplasticity remain highly scattered, ranging from 40–600 kJ mol−1. We quantified the temperature dependence of snow viscoplasticity using in-tomograph creep experiments with a newly developed thermo-mechanical cell. This design allows accurate load and temperature control, micrometric displacement measurement, and microstructural evolution monitoring via X-ray tomography. To disentangle microstructural evolution and temperature effects on the compression rate, we used a state-of-the-art viscoplastic model. We conducted five experiments on centimetre-scale samples of decomposing and fragmented precipitation particles with initial densities ranging from 278–320 kg m−3 under an applied stress of 1.25 kPa. Each experiment comprised five temperature steps from −6 to −18 °C, each lasting one day, and resulted in a mean final vertical strain of 4 %. We show that the viscoplastic response is consistent with a two-regime Arrhenius law, with apparent activation energies for temperatures above and below. This temperature sensitivity matches that reported for polycrystalline ice but is greater than that used in detailed snowpack models.
- Article
(7585 KB) - Full-text XML
- BibTeX
- EndNote


Snow is a porous material with a wide range of densities, from approximately 50 kg m−3 for new snow to about 500 kg m−3 at the end of the winter season in mid-latitude regions. On Earth, it exists close to its melting point, making it highly sensitive to temperature. Snow continuously undergoes metamorphism, including substantial compaction over time through viscoplastic deformation. This viscoplastic creep is strongly temperature dependent, varying by approximately two orders of magnitude between −45 and 0 °C (Yosida, 1955). Therefore, quantifying the temperature dependence of snow viscoplasticity is essential for accurately predicting snowpack evolution (Lehning et al., 2002; Vionnet et al., 2012; Simson et al., 2021), with direct implications for avalanche forecasting (Morin et al., 2020), hydrology (Barnett et al., 2008; DeBeer and Pomeroy, 2017), and palaeoclimatology (Barnola et al., 1987). Knowledge of this temperature sensitivity is also critical for extrapolating laboratory-derived densification laws (Brun et al., 1992; Védrine and Hagenmuller, 2025) to the wide range of natural conditions encountered on Earth, from warm seasonal snow (Lejeune et al., 2019) to cold perennial snow with seasonal temperature variations of up to 40 °C (Morris and Wingham, 2014).
Dry snow can be regarded as a two-phase material composed of sintered ice crystals and air (Bader, 1939). Its compaction results from the slow viscoplastic deformation of the ice skeleton and the associated reduction in pore volume (e.g., Yosida, 1955). Consequently, snow densification depends strongly on the spatial arrangement of ice crystals and on the mechanisms by which they deform. The temperature dependence of snow compaction thus stems from these underlying mechanisms. Védrine et al. (2024) showed that ice in snow does not deform in the same way as polycrystalline ice because of pore accommodation, and that snow creep is mainly driven by basal glide. It therefore remains unclear whether the temperature sensitivity of snow viscoplasticity is the same as that of polycrystalline ice, which has been studied far more extensively than snow.
The viscoplasticity of isotropic ice (secondary creep) or snow is commonly described by a power law of the form:
where σ0 is the reference stress, n is the stress exponent and is the temperature-dependent prefactor. For isotropic polycrystalline ice, this relation corresponds to Glen's law (Glen, 1955). The temperature dependence of is generally assumed to follow an Arrhenius relationship (e.g., Yosida, 1955; Glen, 1955):
where Q is the activation energy, is the universal gas constant, and T is the absolute temperature in Kelvin. Quantifying the temperature sensitivity of creep, therefore, primarily amounts to determining the activation energy Q.
Numerous studies have investigated the activation energy Q associated with the creep of polycrystalline ice, reporting values ranging from 45–167 kJ mol−1 (e.g., Glen, 1955; Mellor and Smith, 1966; Mellor and Testa, 1969a; Ramseier, 1975) (Fig. 1). An increase in activation energy at warmer temperatures, typically above −10 °C, is commonly reported (e.g., Budd and Jacka, 1989; Morgan, 1991). For example, Mellor and Testa (1969a) identified an activation energy of 68.8 kJ mol−1 between −60 and −10 °C, but did not identify a consistent Arrhenius law above −10 °C, noting a stronger temperature dependence in this warmer range. Similarly, Kirchner et al. (2001) reported above −8 °C and below this threshold. Other studies have reported similar trends, with activation energies of approximately 60 kJ mol−1 below −10 °C and 130 kJ mol−1 above (Steinemann, 1954; Glen, 1955; Barnes et al., 1971).
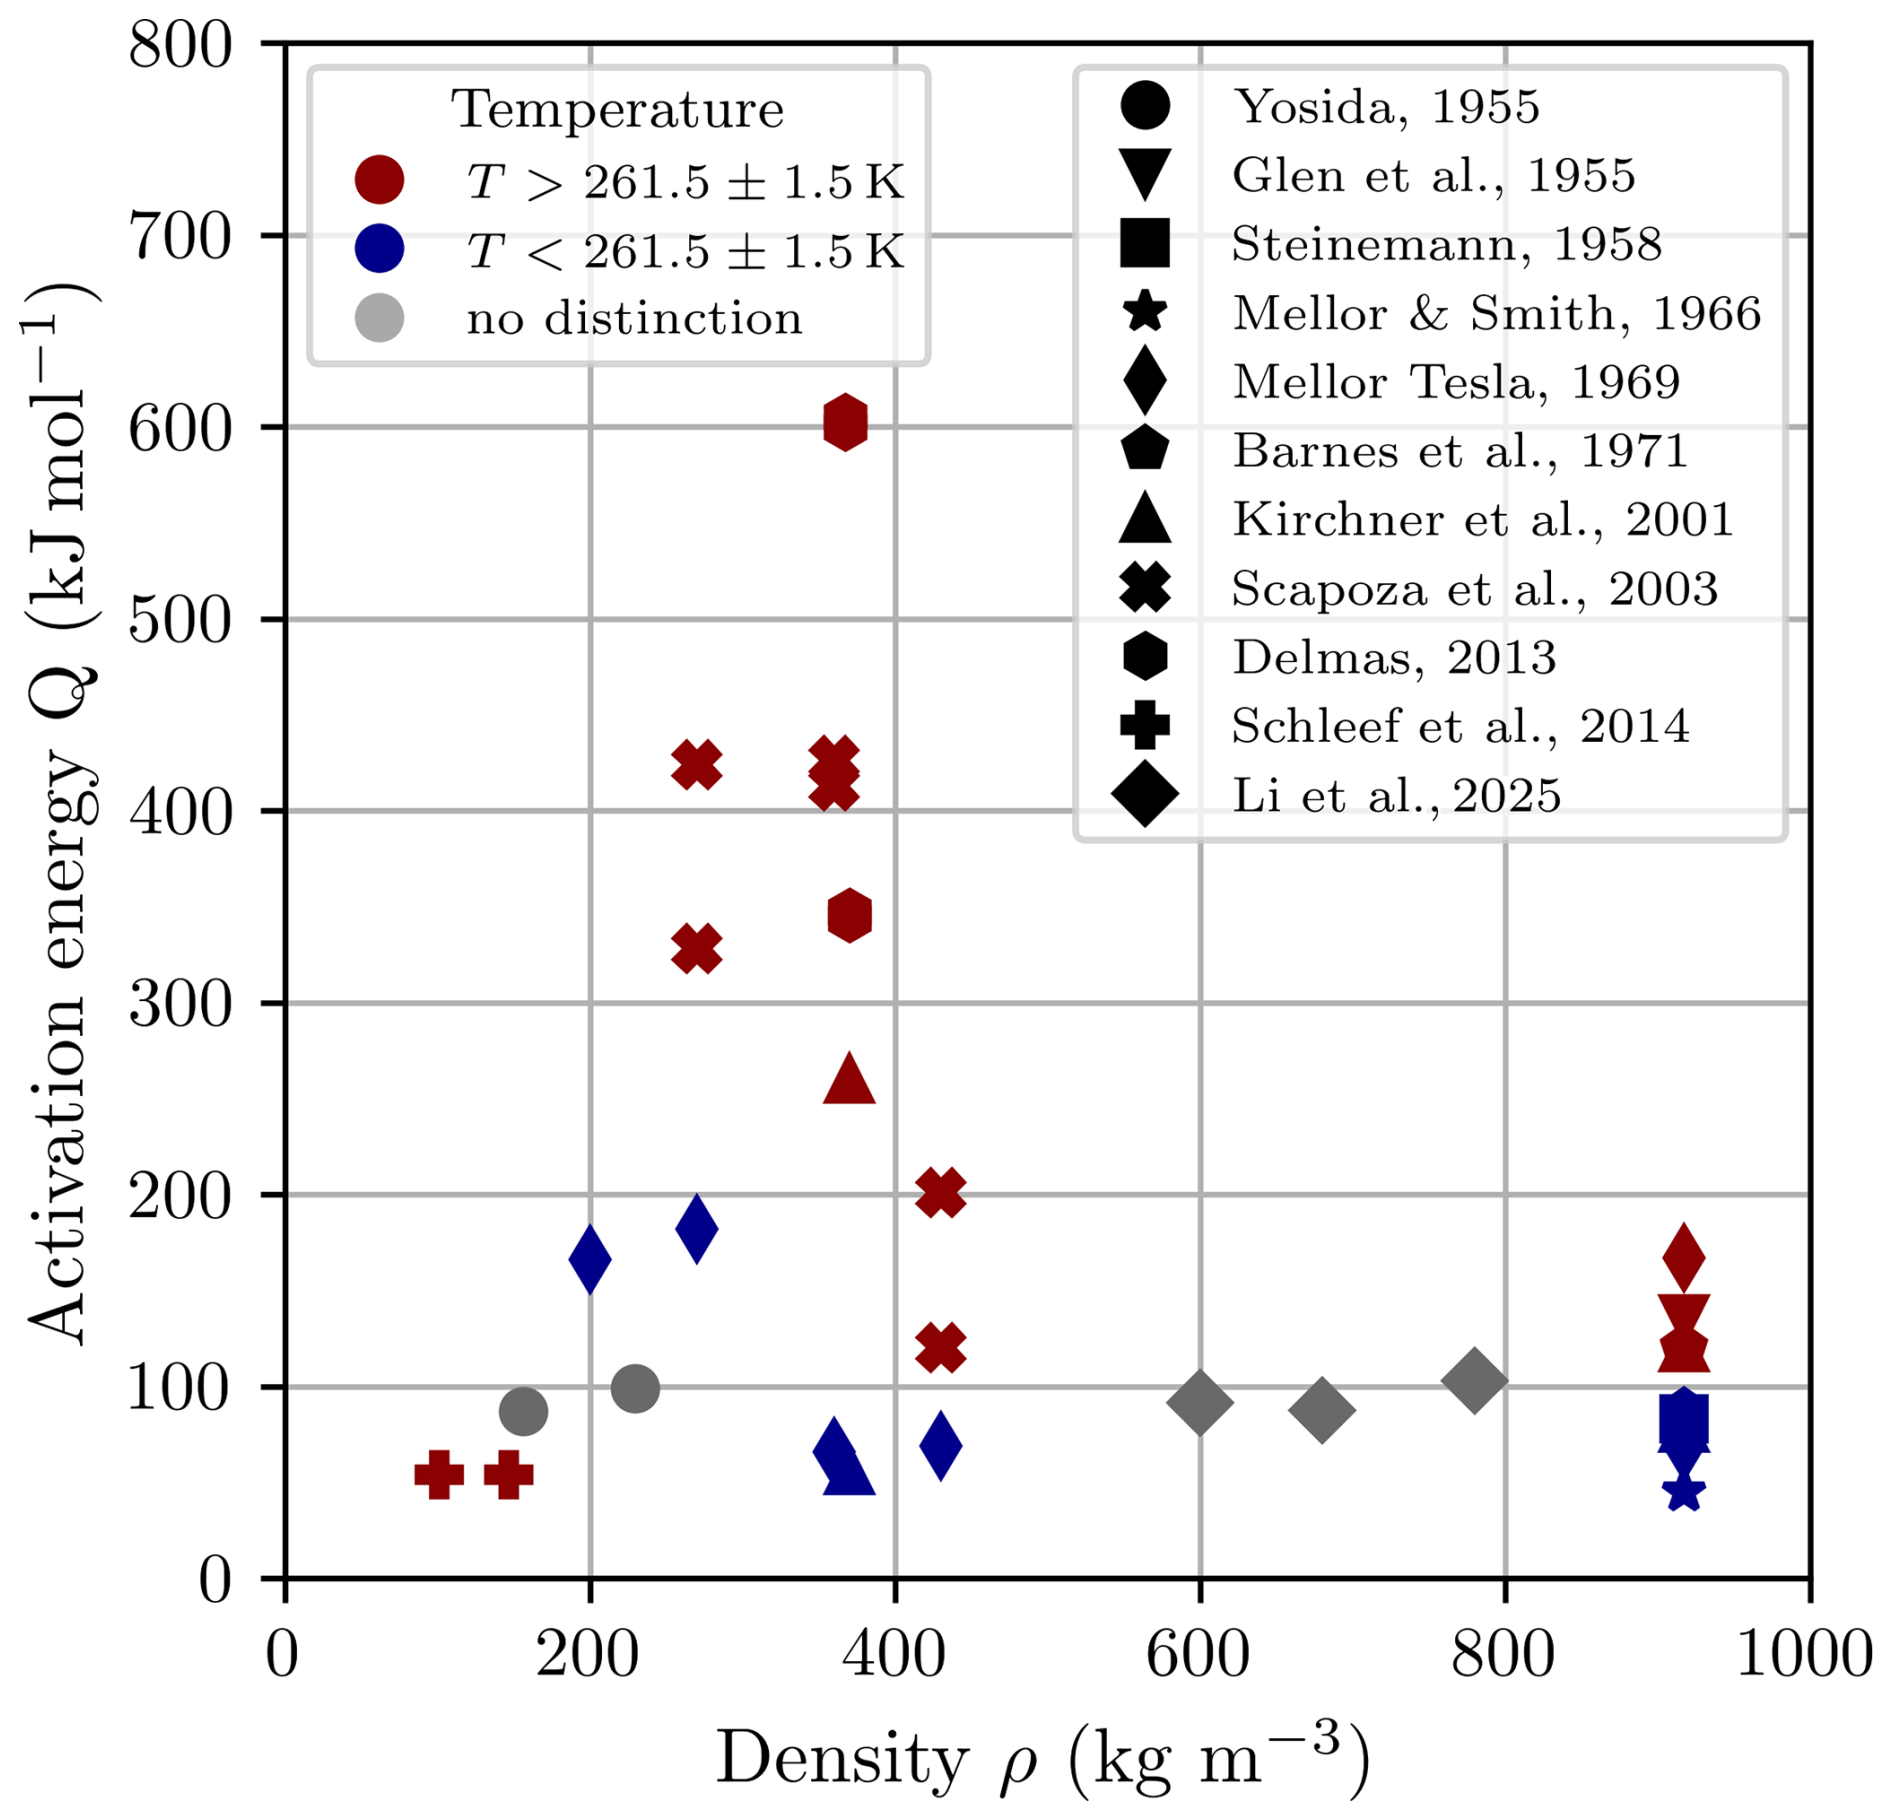
Figure 1Reported activation energies of the viscoplastic behaviour of the snow-firn-ice continuum as a function of density and temperature regime.
Several experimental studies have also investigated the influence of temperature on snow creep (Bucher, 1948; Yosida, 1955; Kirchner et al., 2001; Scapozza and Bartelt, 2003; Delmas, 2013; Schleef et al., 2014b; Li et al., 2024; Horlings et al., 2025) (Fig. 1). Yosida (1955) reported activation energies of 87 and 99 kJ mol−1 for densities of 156 kg m−3 and 230 kg m−3, respectively, independent of temperature over the range from −20 to 0 °C. Kirchner et al. (2001) derived a transition in the activation energy near −6 °C, with below this threshold and above. They associated this transition with that observed for polycrystalline ice (see above). Scapozza and Bartelt (2003) reported activation energies ranging from 66–426 kJ mol−1, depending on temperature and sample density. They noted a general increase in Q with both temperature and porosity. Using a similar protocol, Delmas (2013) performed creep tests at two temperatures (−5 and −15 °C) on two grain types (rounded grains, RG; faceted crystals, FC), and reported activation energies of 341.5 and 602 kJ mol−1. Schleef et al. (2014b) investigated temperature sensitivity during compaction experiments monitored by X-ray microtomography and obtained an activation energy of 54 kJ mol−1. More recently, Li et al. (2024) determined activation energies from mechanical compression tests performed on firn at −5, −18, and −30 °C. They reported activation energies of 61.4, 87.3, and 102.8 kJ mol−1 for densities of 596, 679, and 779 kg m−3, respectively.
Overall, two well-defined temperature regimes are consistently observed in polycrystalline ice. In contrast, activation energies in snow show substantial variability. This variability may primarily arise from the experimental protocols. Indeed, accurately characterising the temperature dependence of viscoplastic behaviour requires experiments in which temperature is the only varying parameter. In previous studies, different samples with similar characteristics were tested at different temperatures, with thermal regulation applied only at the cold-room scale. However, in practice, reproducing identical snow samples in terms of density and microstructure is extremely challenging. Védrine and Hagenmuller (2025) demonstrated that even a 5 % increase in density between two samples – which is common in practice (e.g. for firn Li et al., 2024) – can lead to a relative difference in strain rate of approximately 50 %. Such a change in strain rate corresponds to a temperature difference of about 4 °C, assuming an activation energy of . In addition, typical temperature fluctuations in cold rooms, caused by heat exchanger defrost cycles and heating from X-ray sources, reach up to ±0.6 and ±0.5 °C, respectively (Schleef et al., 2014b). These fluctuations further contribute to substantial uncertainty in the experimental quantification of the temperature dependence of snow viscoplasticity.
To address these limitations, we propose a new experimental protocol designed to tightly control both temperature and microstructure in order to quantify the temperature sensitivity of snow viscoplasticity. Quantifying the influence of temperature on strain rate requires measurable deformation, which induces densification and viscoplastic hardening. We developed a thermo-mechanical cell that enables precise control of sample temperature and allows temperature to be varied during creep tests. Sample deformation is monitored using laser displacement measurements, which provide sufficient accuracy without requiring large strains, thereby limiting microstructural evolution. Microstructural changes are further monitored using X-ray tomography. In addition, geometric hardening during the experiments is accounted for in the identification procedure using a state-of-the-art snow creep model (Védrine and Hagenmuller, 2025). This approach allows us to isolate the temperature dependence of the viscoplastic response from microstructural effects. Applying this protocol to five samples subjected to five temperature steps, we derive a two-regime Arrhenius law relationship between strain rate and temperature. Finally, we compare the resulting parametrisation with settlement laws implemented in snowpack models and discuss the implications for snowpack modelling.
2.1 Experimental setup of the sample environment
The thermo-mechanical cell was designed for micro-CT measurements of snow settlement under controlled load and temperature conditions. To this end, we drew inspiration from the Snowbreeder 5 cell developed at the WSL-SLF (Wiese and Schneebeli, 2017) and adapted the setup of Dick et al. (2026) for settlement analysis. In particular, we controlled the sample temperature independently of the cold-room temperature, and we monitored the applied load to ensure that it remained constant throughout the tests.
The thermo-mechanical cell (Fig. 2) consists of an aluminium cylindrical tube with a diameter of 20 mm and a height of 90 mm. The wall thickness of the aluminium cell (0.5 mm) was chosen to allow X-rays to penetrate the cell and image the sample. A piston transmits the load to the sample. The mass of the piston and crown alone is m=28.79 g. Because the piston is hollow, additional mass can be added to increase the applied load.
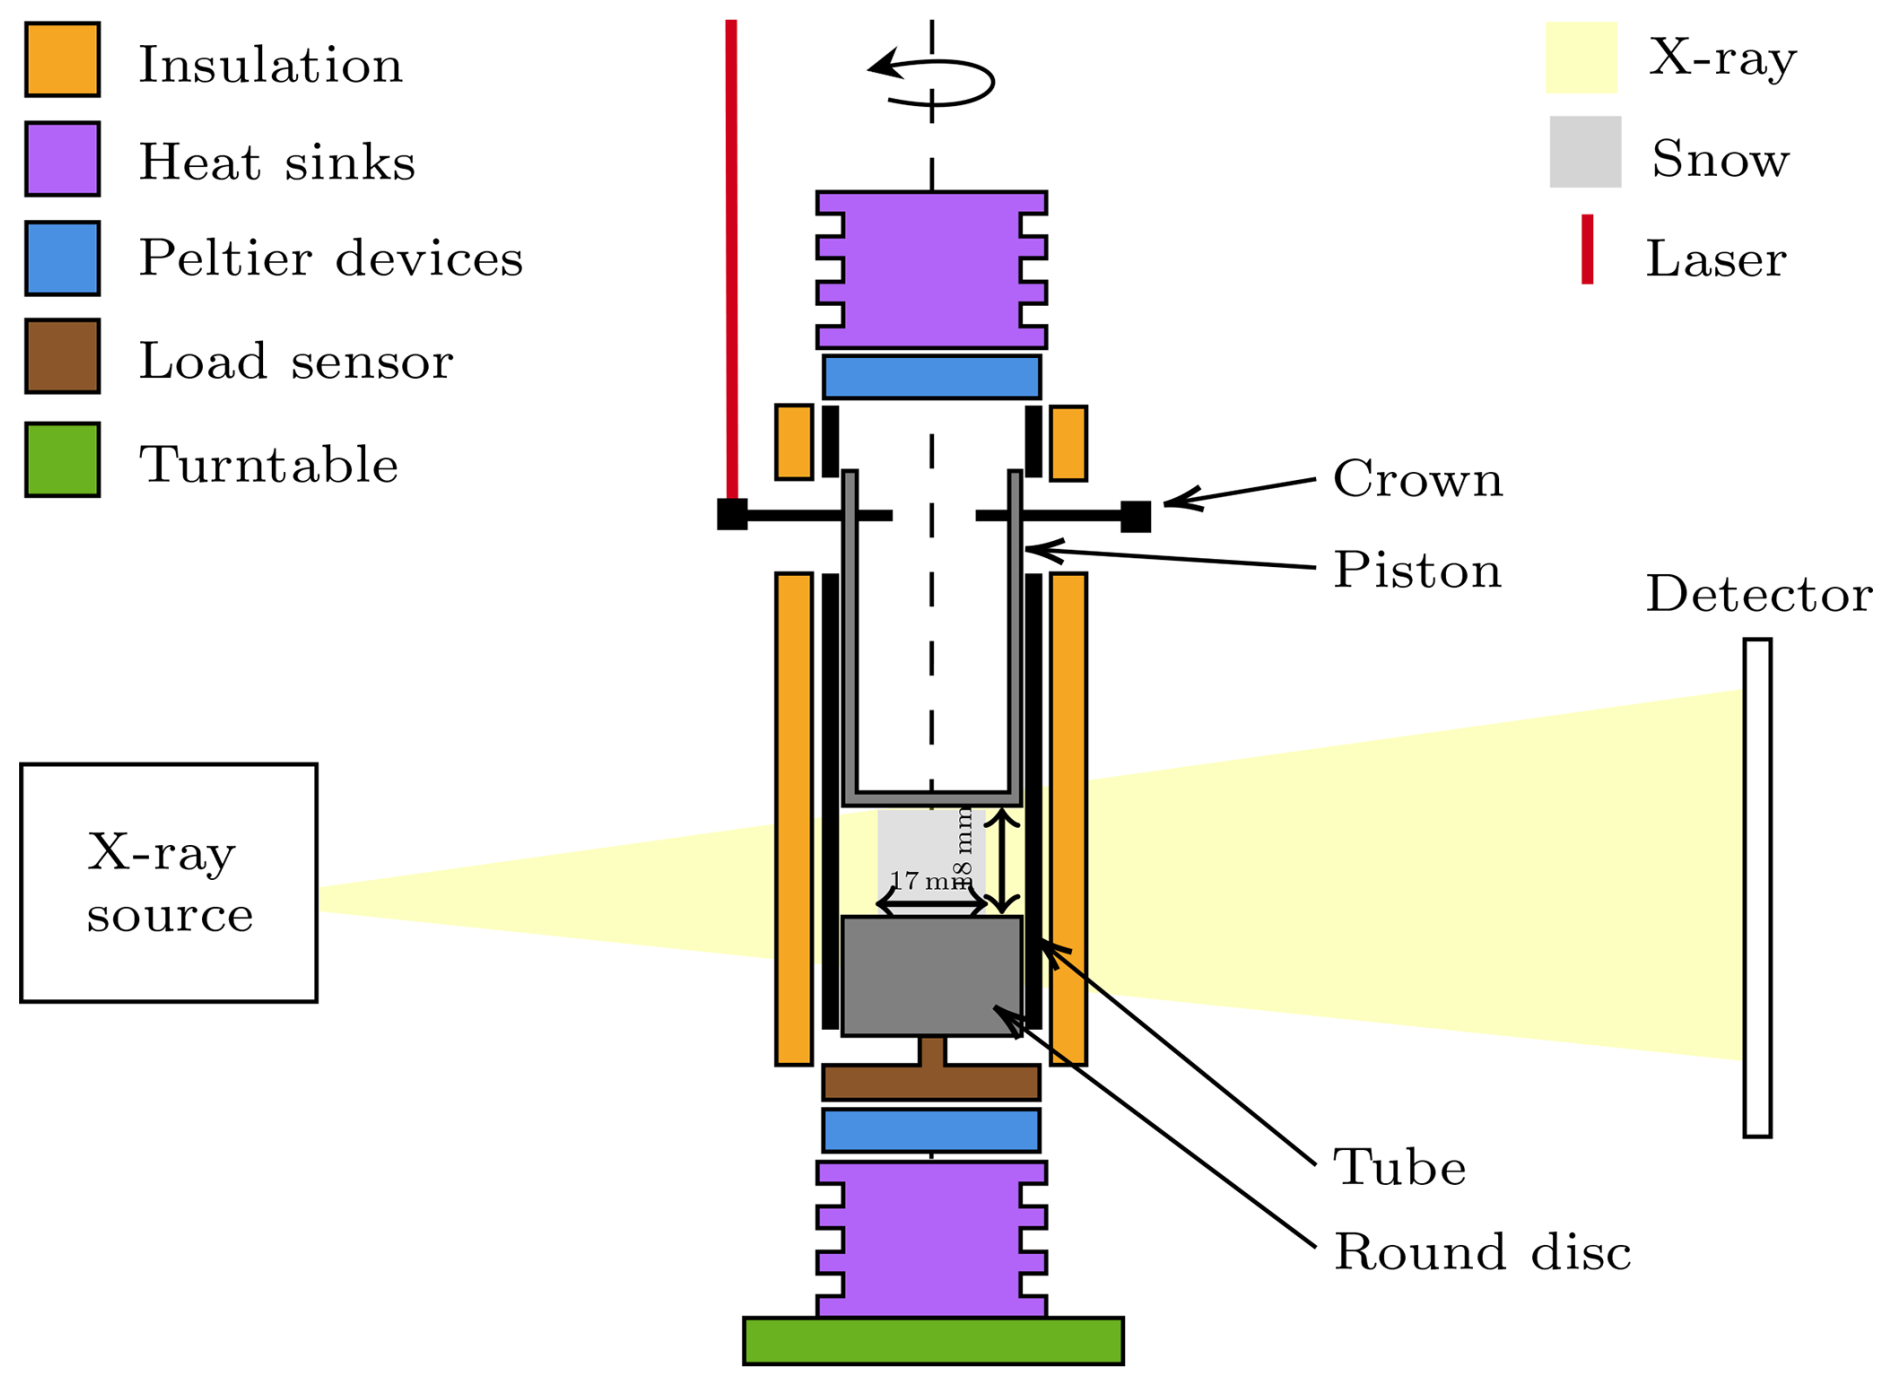
Two Peltier thermoelectric modules (TEC-14,7-3,9-34,0-70-30/0-R from Arctic TEC), referred to simply as Peltier units, are placed at the lower and upper ends of the cell, providing precise control of the sample temperature (Fig. 2). The Peltier modules are driven by a controller unit (TEC-1161-4A from MEERSTETTER). These Peltier modules ensure that temperature differences within the cell remain on the order of 10−3 K and provide an absolute temperature accuracy better than ±0.5 K. Heat sinks and fans dissipate the heat produced by the Peltier units. The cell can be operated at temperatures up to ±10 K relative to the ambient temperature. A thick insulating styrofoam ring is added around the cell to ensure isothermal conditions. The Peltier units maintain temperature control during the experiment and prevent sample heating during scans. Temperature is measured at each Peltier module at 0.5 Hz.
Two additional measurements are integrated into the system:
-
Sample top displacement: A laser sensor (OM30-P0100.HV.YUN from Baumer) mounted on the supporting frame measures the distance to a crown fixed to the piston applying the load to the snow sample. It is used to track the vertical displacement of the top of the snow sample. The crown design enables displacement tracking regardless of the cell orientation. The laser signal is transmitted via a 16-bit ADC acquisition card (MCCUSB234 from Digilent) to a computer located outside the cold room. The displacement data are recorded at a frequency of 0.2 Hz, with a measurement range of 15 mm and a resolution of 1 µm. The vertical strain εzz is defined as:
where L is the sample height, and h and hi are the current and initial laser distances, respectively.
-
Force measurement: A miniature bottom load cell (LLB130 from FUTEK) is placed beneath the snow sample through a washer, allowing the force transmitted to the sample to be measured. It is used to ensure that a constant force is applied and to verify that the piston moves without frictional resistance. A driver (SM18-gage) amplifies the signal from the strain gauges, which is then sent to the same acquisition card as the laser displacement measurement. This sensor has a resolution of 0.1 g and, like the laser measurement, is recorded at a frequency of 0.2 Hz.
Because the cell rotates during tomographic acquisition, data are transmitted via a slip ring.
2.2 X-ray tomography
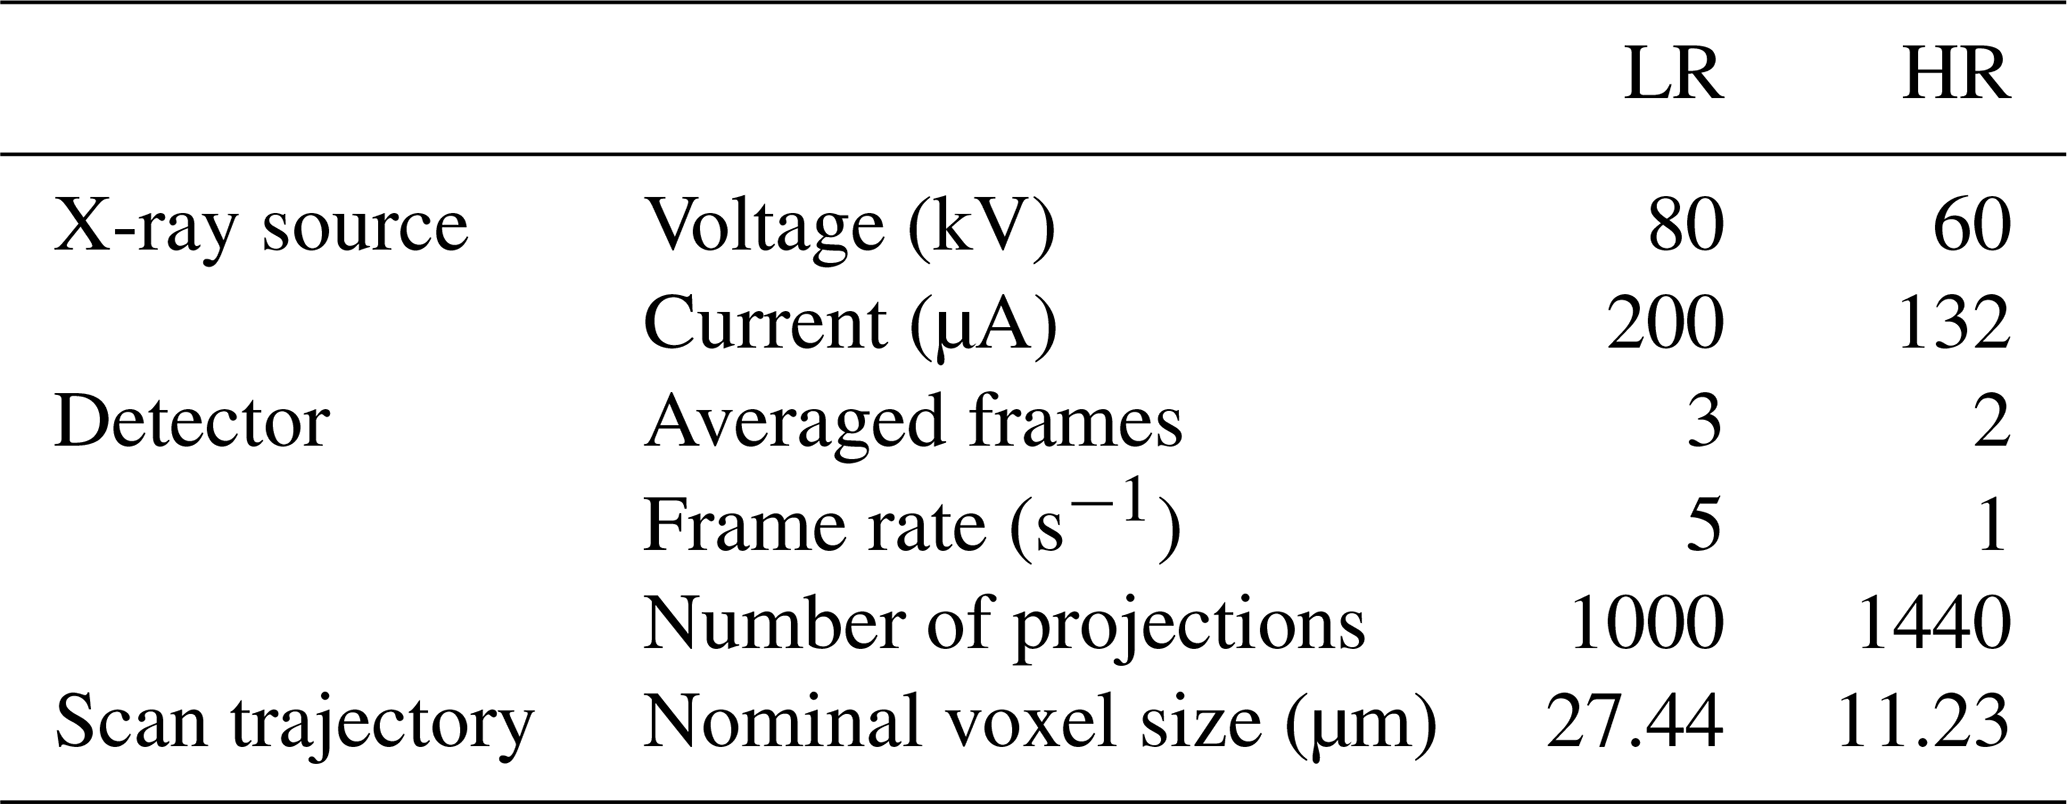
The evolution of the snow microstructure was monitored during the compression tests using an X-ray tomograph (DeskTom130, RX Solutions). Every 8 h, a series of scans was acquired; each series consisted of one high-resolution scan (HR) and one low-resolution scan (LR). The HR scans captured an inner region (diameter of 10 mm and height of 10 mm) with a nominal voxel size of 11.23 µm, and the LR scans covered the whole sample at a nominal voxel size of 27.44 µm. The scan settings for the different modalities are summarized in Table 1. The greyscale attenuation images were segmented into pore space and a continuous ice matrix (Hagenmuller et al., 2013).
To assess the consistency between the bulk deformation measured by laser and the deformation within the sample, axial strain was computed using Digital Volume Correlation (DVC) (Stamati et al., 2020) applied to low-resolution (LR) images. The analysis was conducted over a single region of interest (ROI) with dimensions of .
2.3 Experimental protocol
Snow samples were prepared as follows. Natural snow was collected in the field and stored in styrofoam boxes in a cold room at a constant temperature of −20 °C for several months, where it evolved into Decomposing and Fragmented precipitation particles (DF) through isothermal metamorphism. The snow particles were then sieved into a sample holder using a 1.6 mm sieve. The sample holder was cylindrical, with a diameter of 17 mm and a height of 17 mm, and was used to mould the snow samples. The diameter of the sample holder, 17 mm, was smaller than the 20 mm diameter of the cell tube, thereby creating unconfined conditions during the creep test and avoiding uncontrolled sidewall friction (Fig. 3). The samples were left to sinter for at least two weeks at −18 °C before being placed into the cell tube.
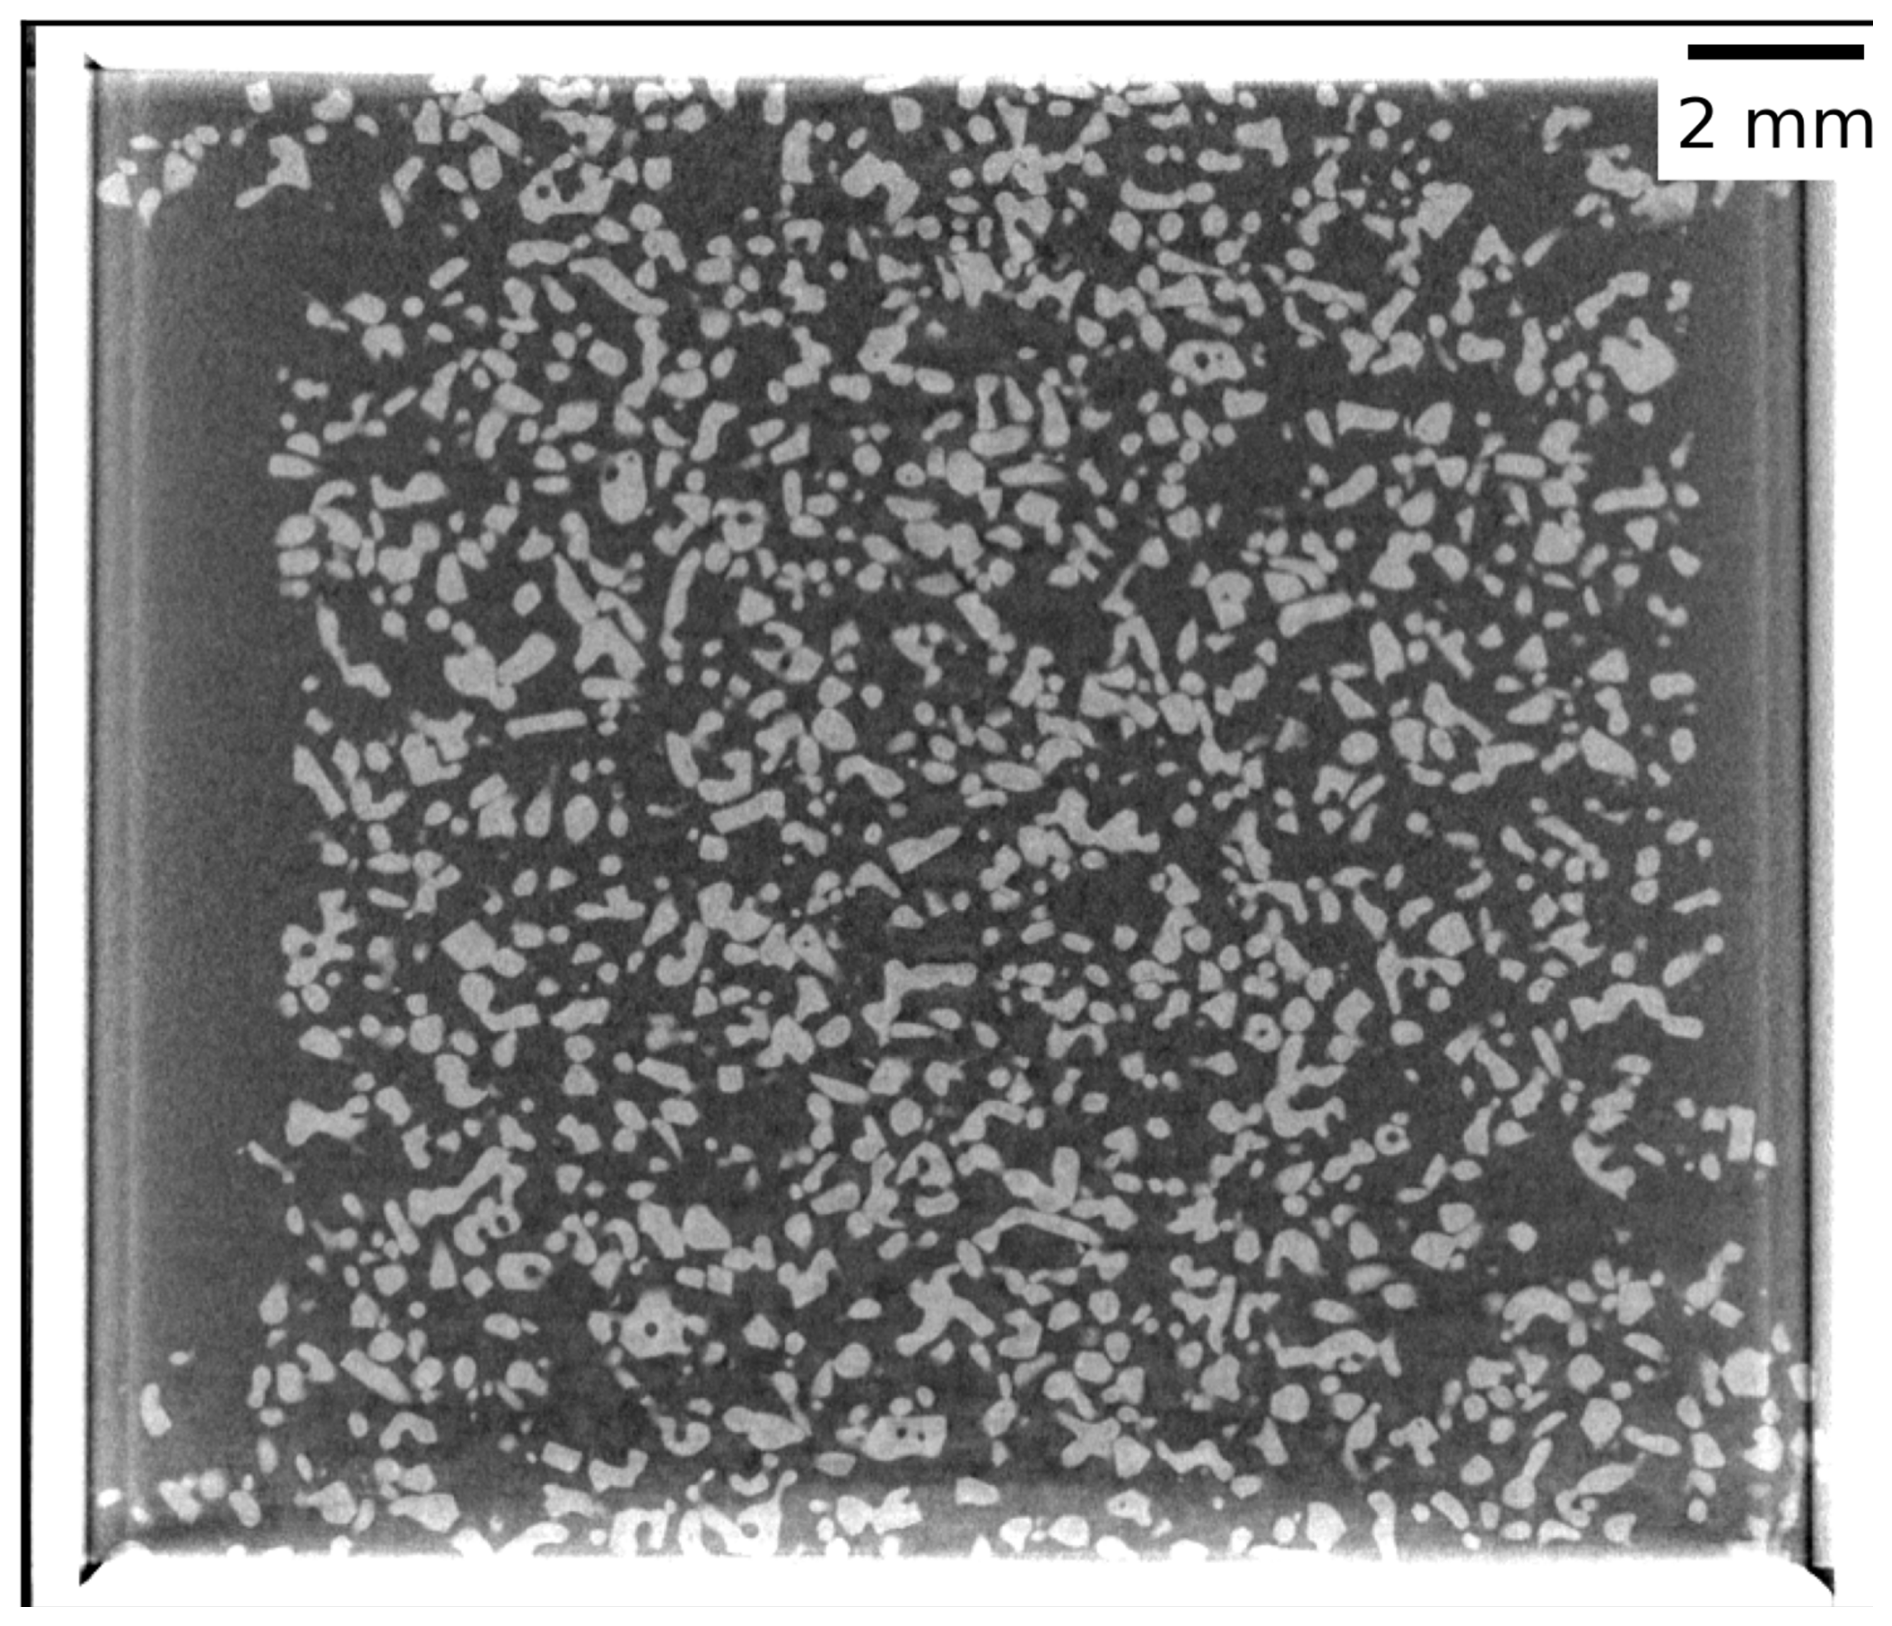
Figure 3Vertical slice of the snow sample imaged in the thermo-mechanical cell using LR scans. The image is shown in grayscale.
We conducted creep tests with stepwise temperature variations to determine the temperature sensitivity of snow viscoplasticity. Temperature control was achieved using the Peltier modules. A stress of 1.25 kPa was applied to the snow sample, corresponding to the overburden stress exerted by a 0.45 m thick snow layer at the density used in the experiment. To limit lateral heat transfer, the cold room temperature was set to the average temperature of the experimental series. Each experiment lasted 5 d and consisted of 5 temperature steps, each lasting 1 d, with temperatures ranging from −6 to −18 °C in 3 °C increments. The first 8 h of each experiment, corresponding to sample stabilisation (i.e., densification of the layer at the sample-piston interface and the establishment of steady-state conditions), were excluded from the analysis. This protocol was repeated on five snow samples with initial densities ranging from 278–320 kg m−31.
2.4 Snow viscoplastic model
The temporal evolution of the thickness e of a layer subjected to an overburden stress σ is related to the vertical strain rate through (taken to be positive in compression). In its generic form (Védrine and Hagenmuller, 2025), the densification law can be expressed as a function of the solid fraction , where ρ is the snow density and is the density of ice:
where Sν is the boundary condition prefactor, equal to 1 here for free boundary conditions, n is the stress exponent, m is the solid-fraction exponent characterising the microstructure, and is the temperature-dependent prefactor. The latter is set to 1 s−1 at the reference temperature T0=263.15 K, for which the reference stress of ice is (Jacka and Maccagnan, 1984). The stress exponent was set to n=2.2 and the solid-fraction exponent to m=4, based on experimental and modelling studies (Scapozza and Bartelt, 2003; Schleef et al., 2014a; Védrine and Hagenmuller, 2025).
The objective of the present study is to determine the temperature dependence of the prefactor . To quantify the influence of temperature on strain rate, the sample must undergo measurable deformation; this inevitably induces densification and thus geometric hardening, i.e., an increase in the reference stress . As a result, even at constant temperature, the strain rate decreases during the test. To minimise geometric hardening, we apply a low overburden stress so that the microstructure remains only weakly deformed. Moreover, we use Eq. (4) to isolate the temperature prefactor by dividing the measured vertical strain rate by its mechanical component f(σ,Φ).
3.1 Exemplary creep test
We first show the results obtained on one sample (sample 1). The corresponding data for the other experimental series are provided in Appendix A1.
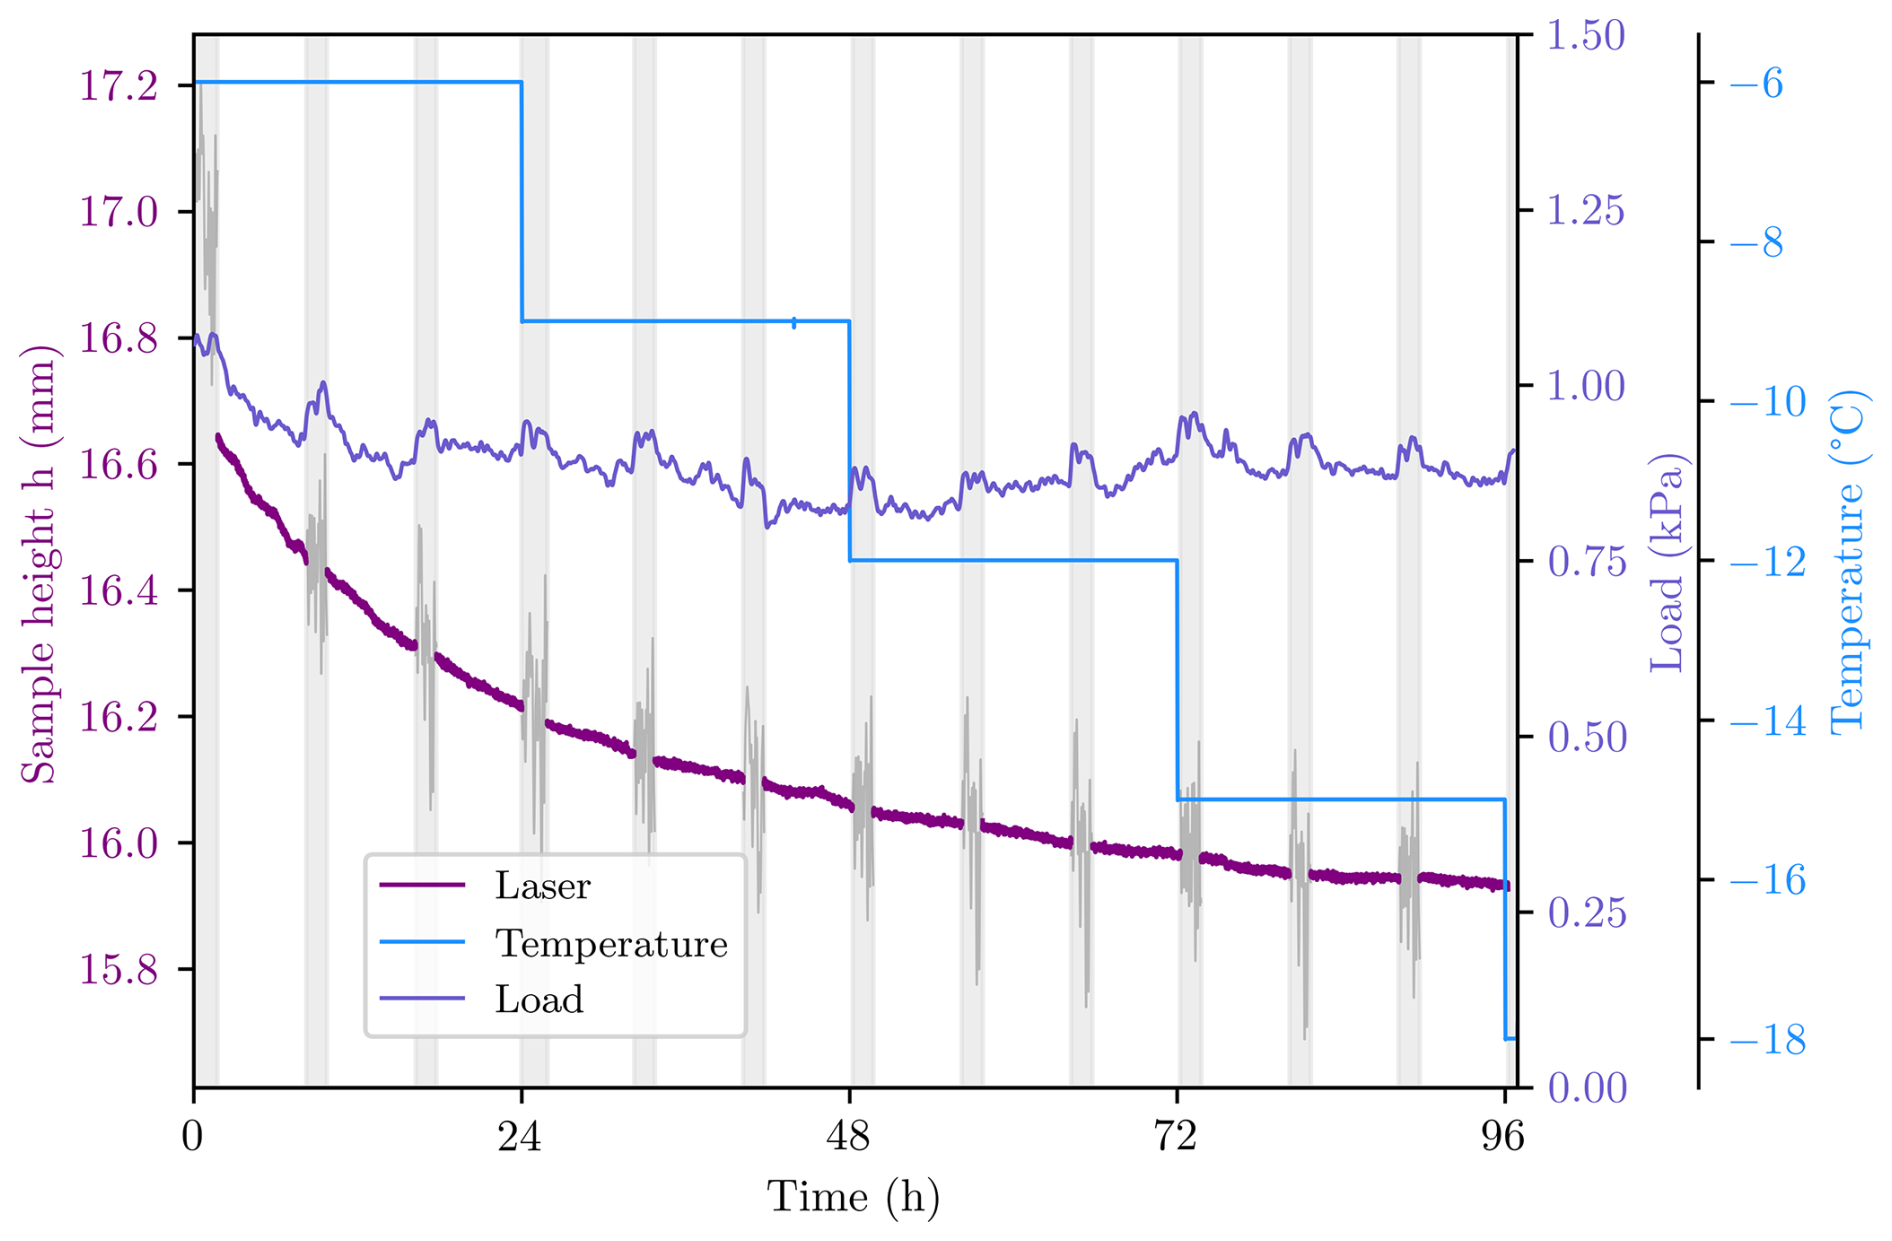
Figure 4Temporal evolution of the sample height, the applied load, and the sample temperature for sample 1. Grey shaded areas indicate time intervals affected by X-ray tomographic scans.
Figure 4 shows the temporal evolution of the sample height, applied load, and temperature. At each temperature step, an apparent change in the slope of the displacement curve is observed, reflecting a change in the strain rate. In addition, small displacement jumps occur at temperature transitions and are attributed to thermal expansion of the experimental cell. These jumps do not affect the subsequent analysis, as their magnitude is small and the analysis focuses on the derivative of the displacement (strain rate) obtained outside the scan periods. Because the applied load is small compared with the sensor measurement range (0–1 kg), the transmitted signal is weak and highly sensitive to the contact quality in the slip ring as well as to external perturbations. Nevertheless, we observe that the applied load remains nearly constant throughout the experiment, varying by less than 0.17 kPa, and is close to the nominal imposed load, which indicates that parasitic friction from the piston or the washer is negligible. In the remainder of this study, the load applied to the sample is therefore assumed to be constant at 1.25 kPa (mass of the piston and crown divided by the sample cross-section).
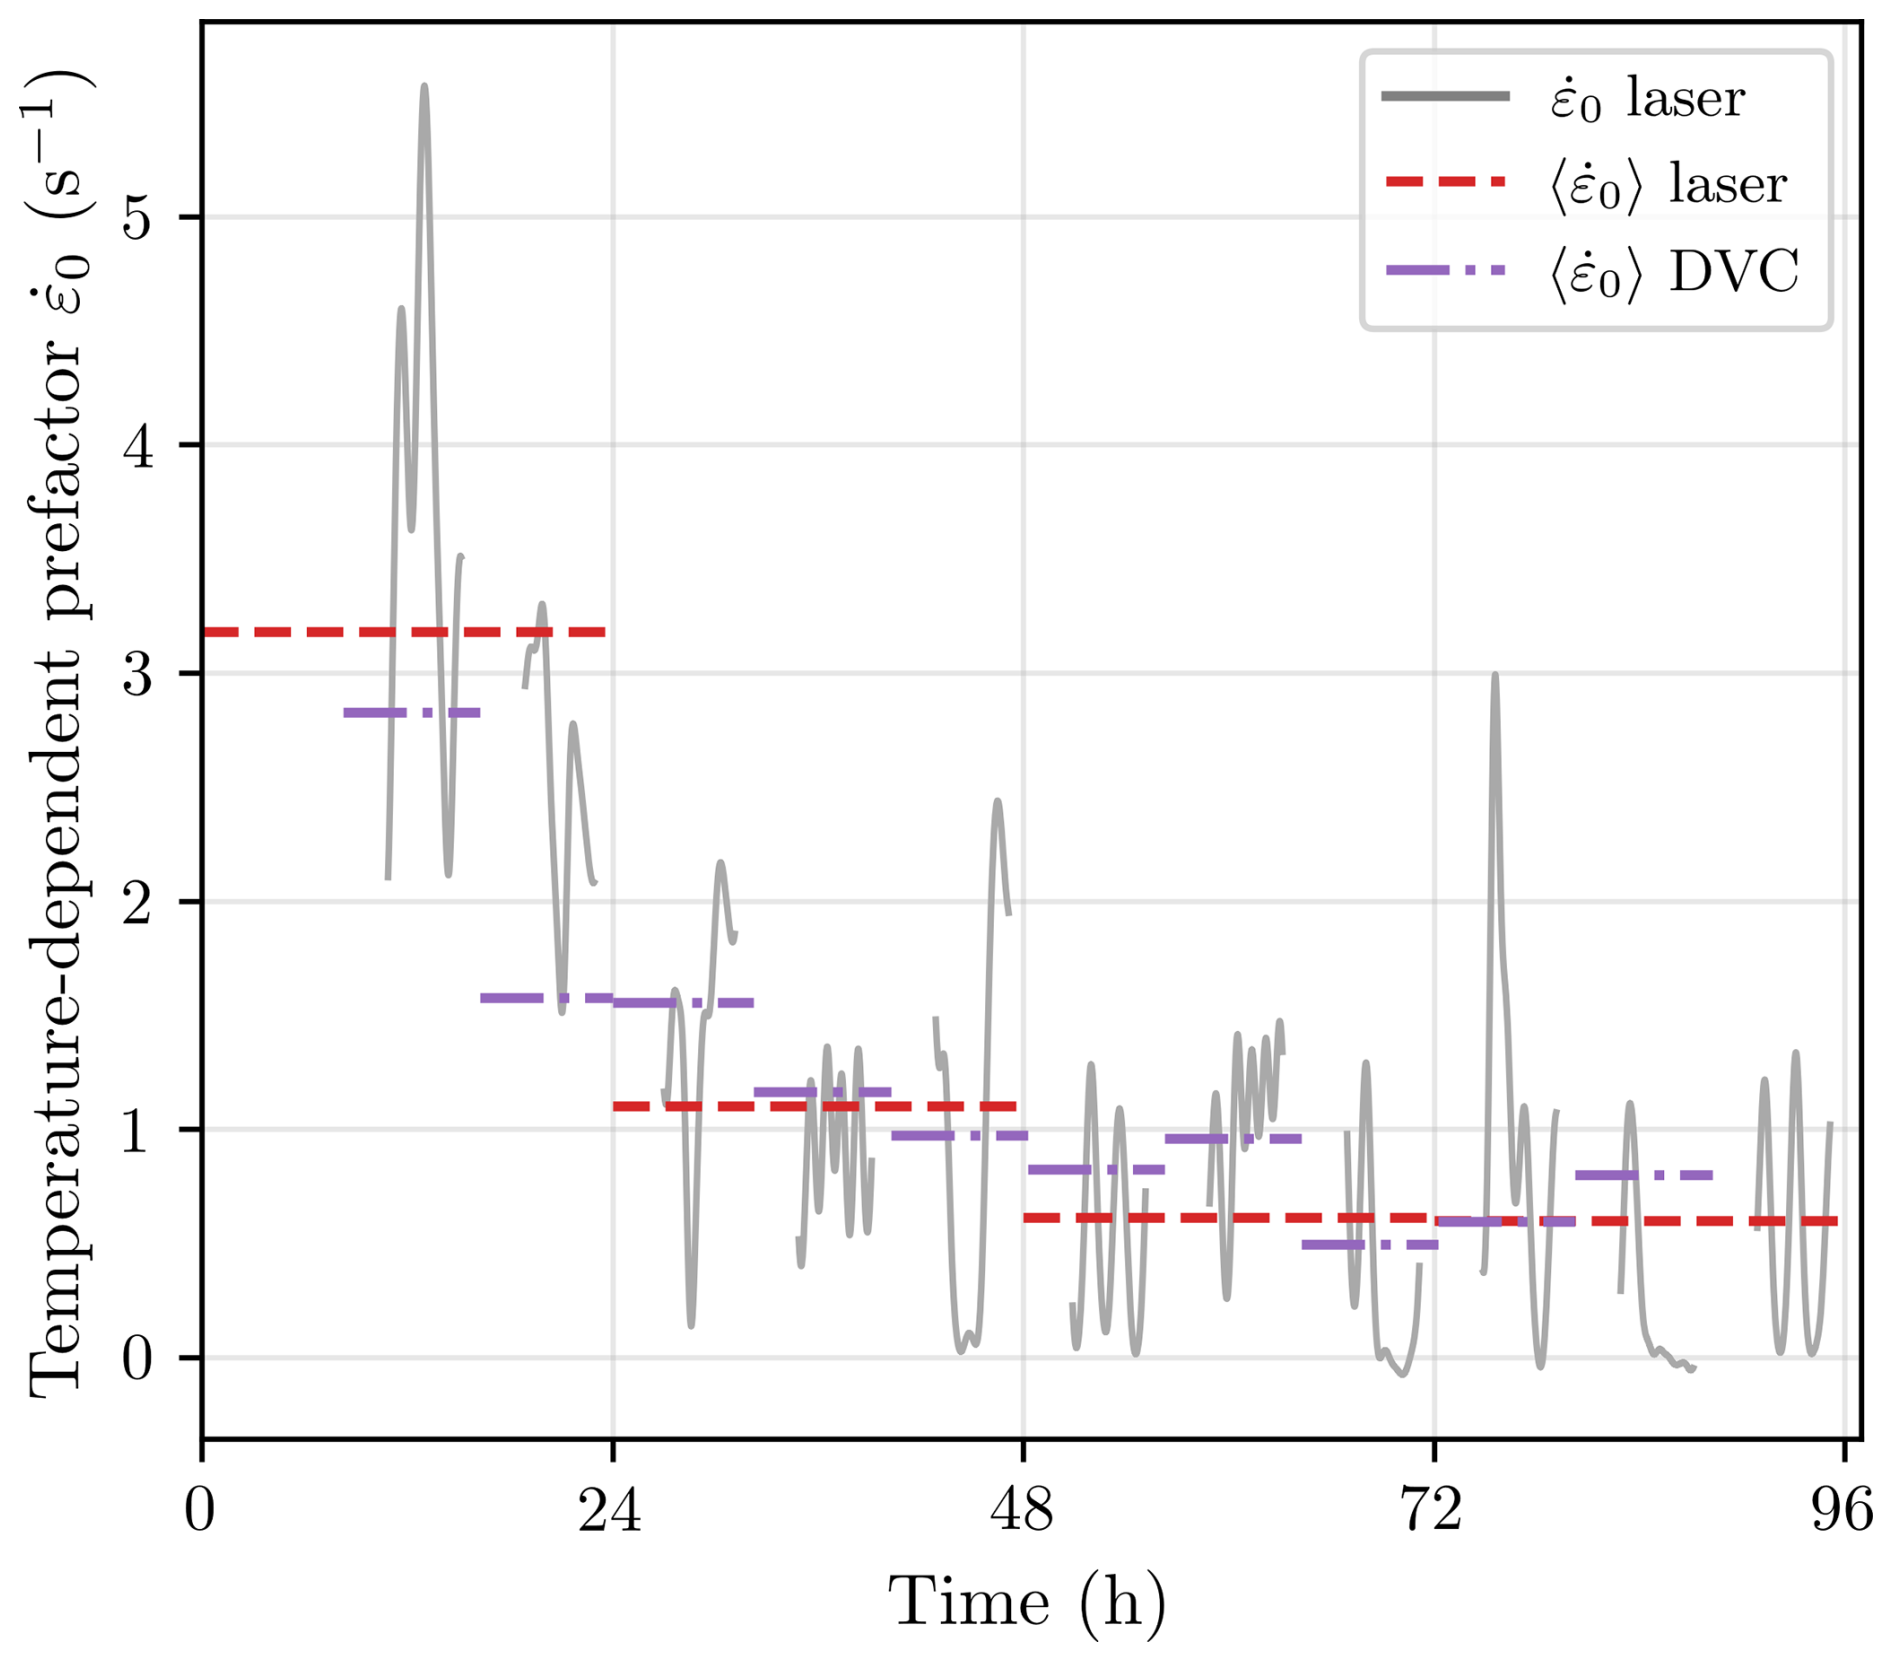
Figure 5Temporal evolution of the strain rate prefactor , computed from laser displacement measurements and digital volume correlation (DVC).
To quantify the observed slope changes, the effects of densification and geometric hardening are first removed to isolate the temperature dependence of the deformation rate. Starting from the measured strain rate , the temperature-dependent prefactor is computed and shown in Fig. 5. Despite significant fluctuations associated with experimental measurement noise, a systematic decrease in is observed at each temperature step. Figures 5 and A4 show the temporal evolution of the strain rate prefactor , computed from both laser displacement measurements and DVC for all samples. The measurements are consistent with each other, indicating that the laser-based deformation accurately reflects the sample response despite the sample heterogeneities.
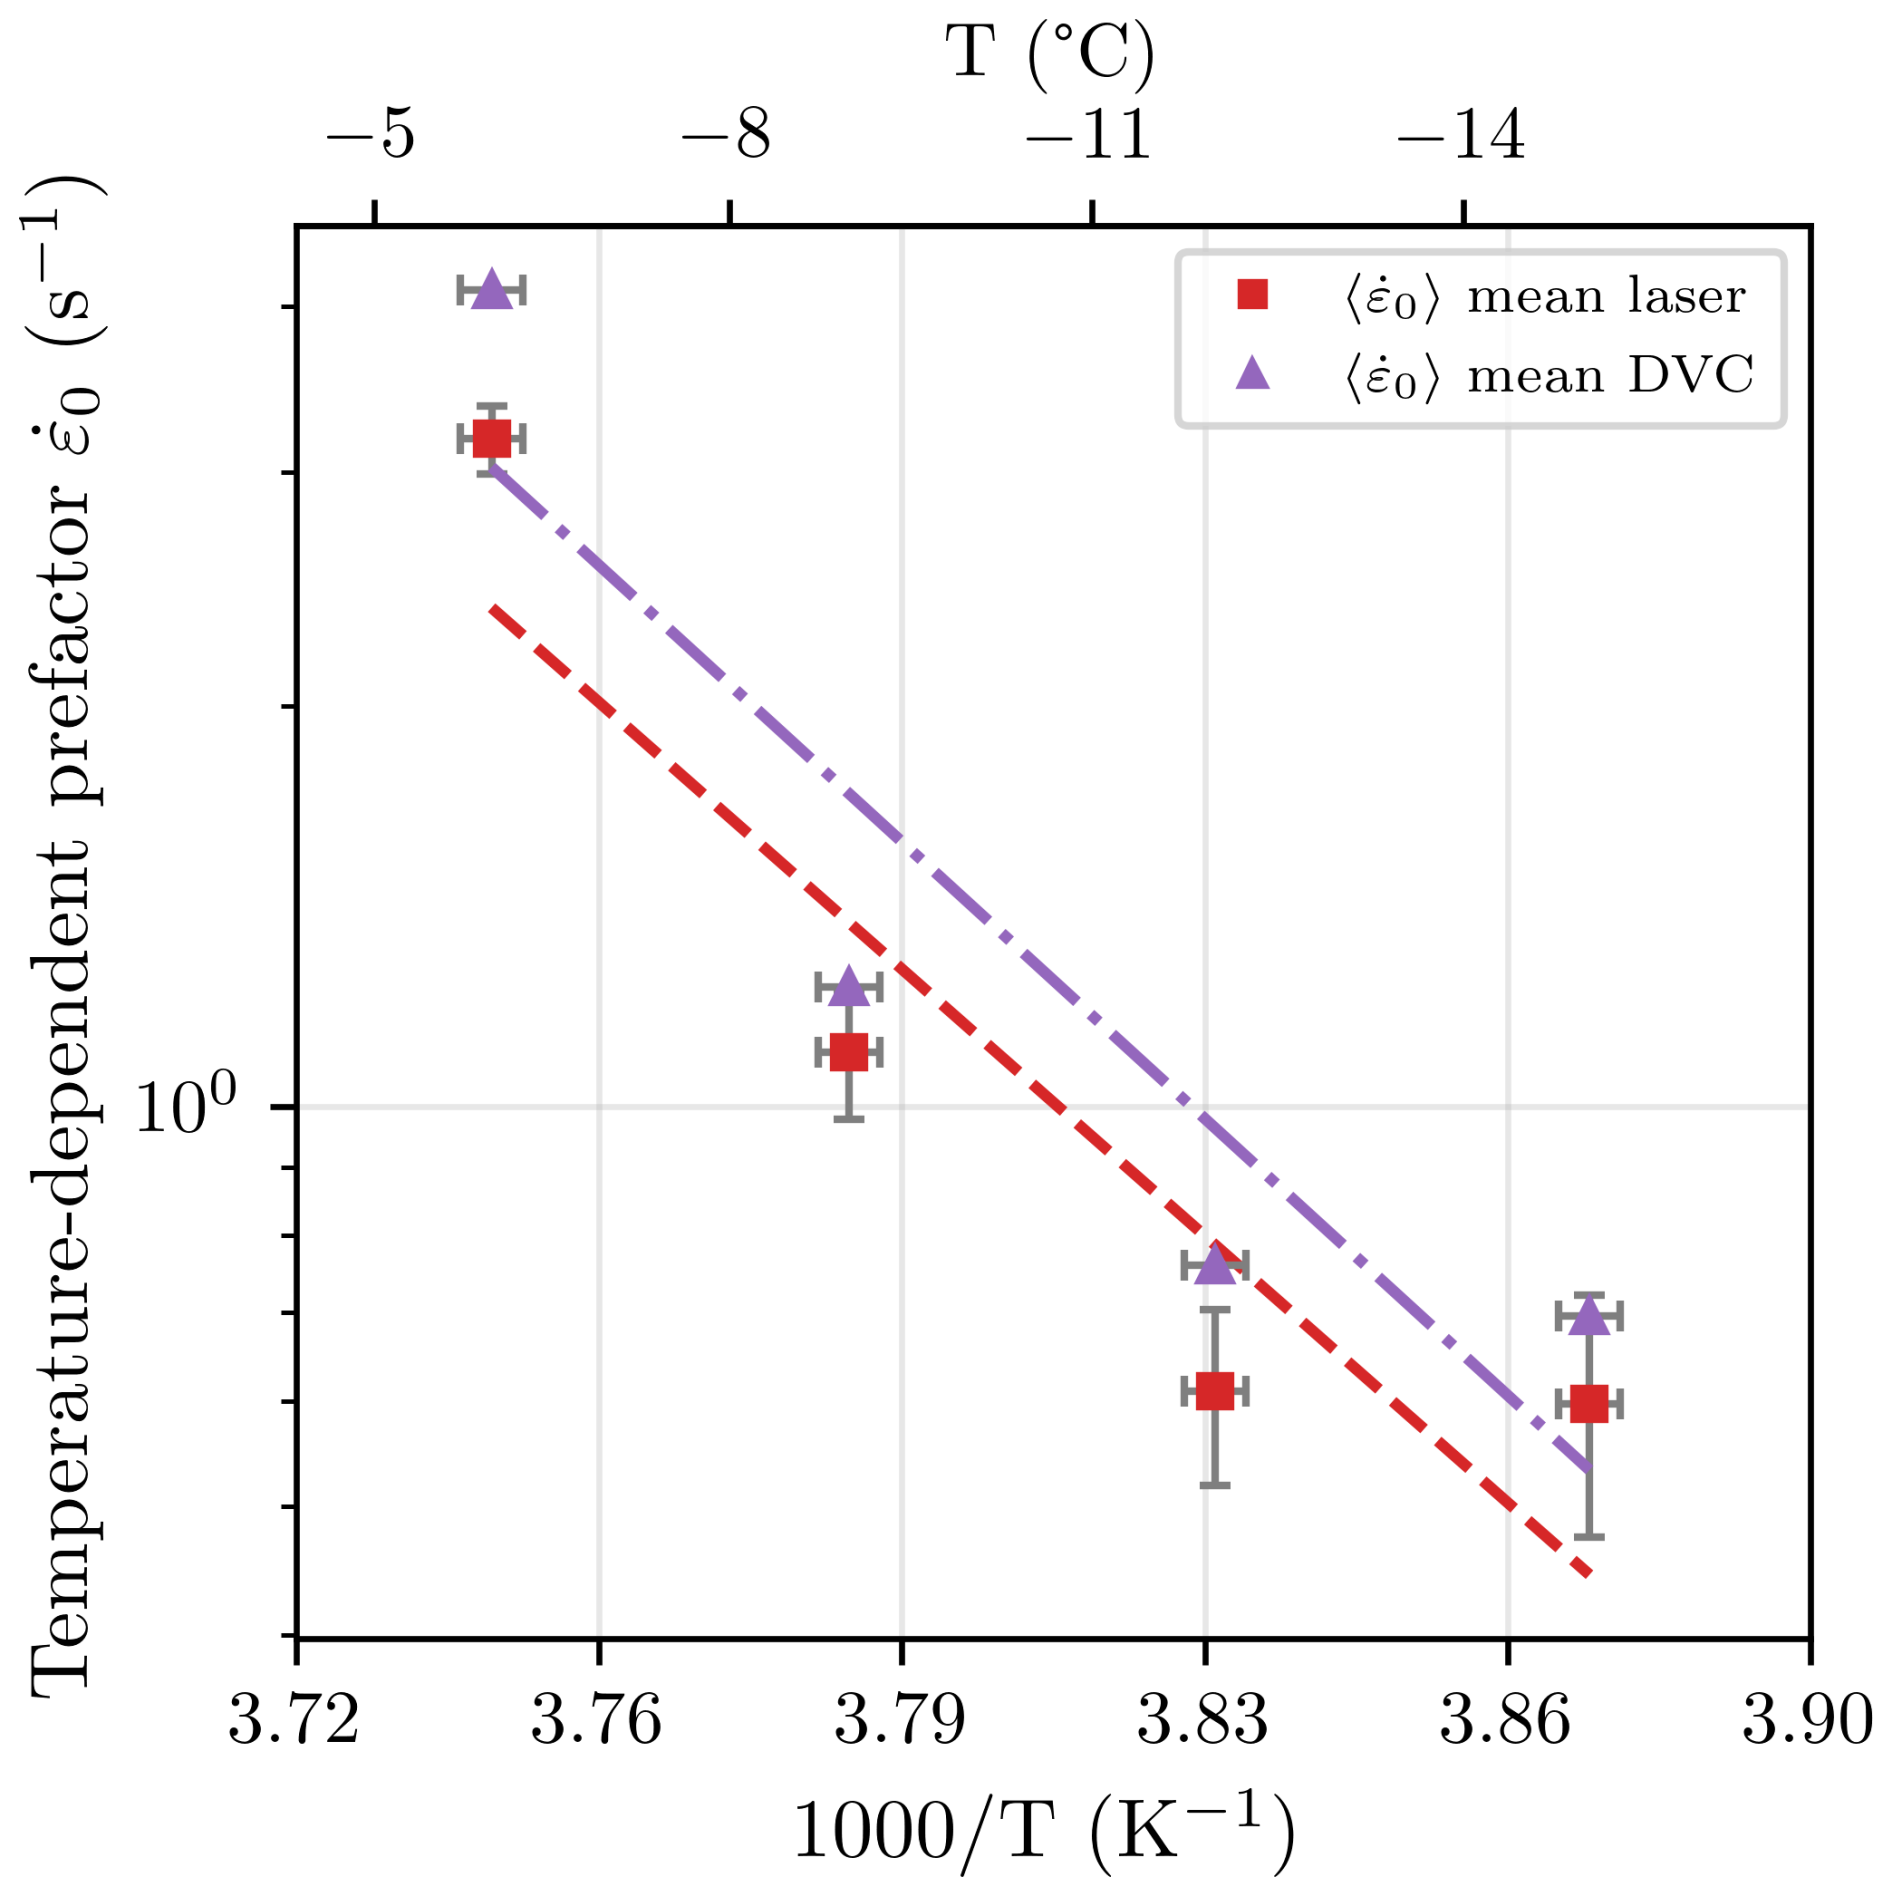
Figure 6Mean values of the strain rate prefactor as a function of temperature. The strain rate was computed from laser displacement measurements and digital volume correlation (DVC). Uncertainties in strain rate correspond to the standard deviation of the laser-derived measurements around the mean value shown in Fig. 5. Temperature uncertainty was estimated at ±0.5 °C.
For each temperature plateau, the mean value of is calculated and plotted as a function of inverse temperature (Fig. 6). On a logarithmic scale, exhibits a linear dependence on , consistent with an Arrhenius-type relationship, for which the slope equals . The apparent activation energy of sample 1 is thus estimated to be . Uncertainties here represent one standard deviation (68 % confidence interval) derived from the covariance matrix, assuming Gaussian uncertainties in both temperature and strain rate.
We can compare the densification model (Eq. 4) with the measured vertical deformations using the previously calculated apparent activation energy (Fig. 7). If temperature variations are neglected and the temperature is assumed to remain constant at its initial value, the deformation decreases more slowly and deviates from the experimental measurements. This comparison shows that the slowdown in deformation rate is primarily due to the decrease in temperature, as geometric hardening alone cannot account for the observed behaviour.
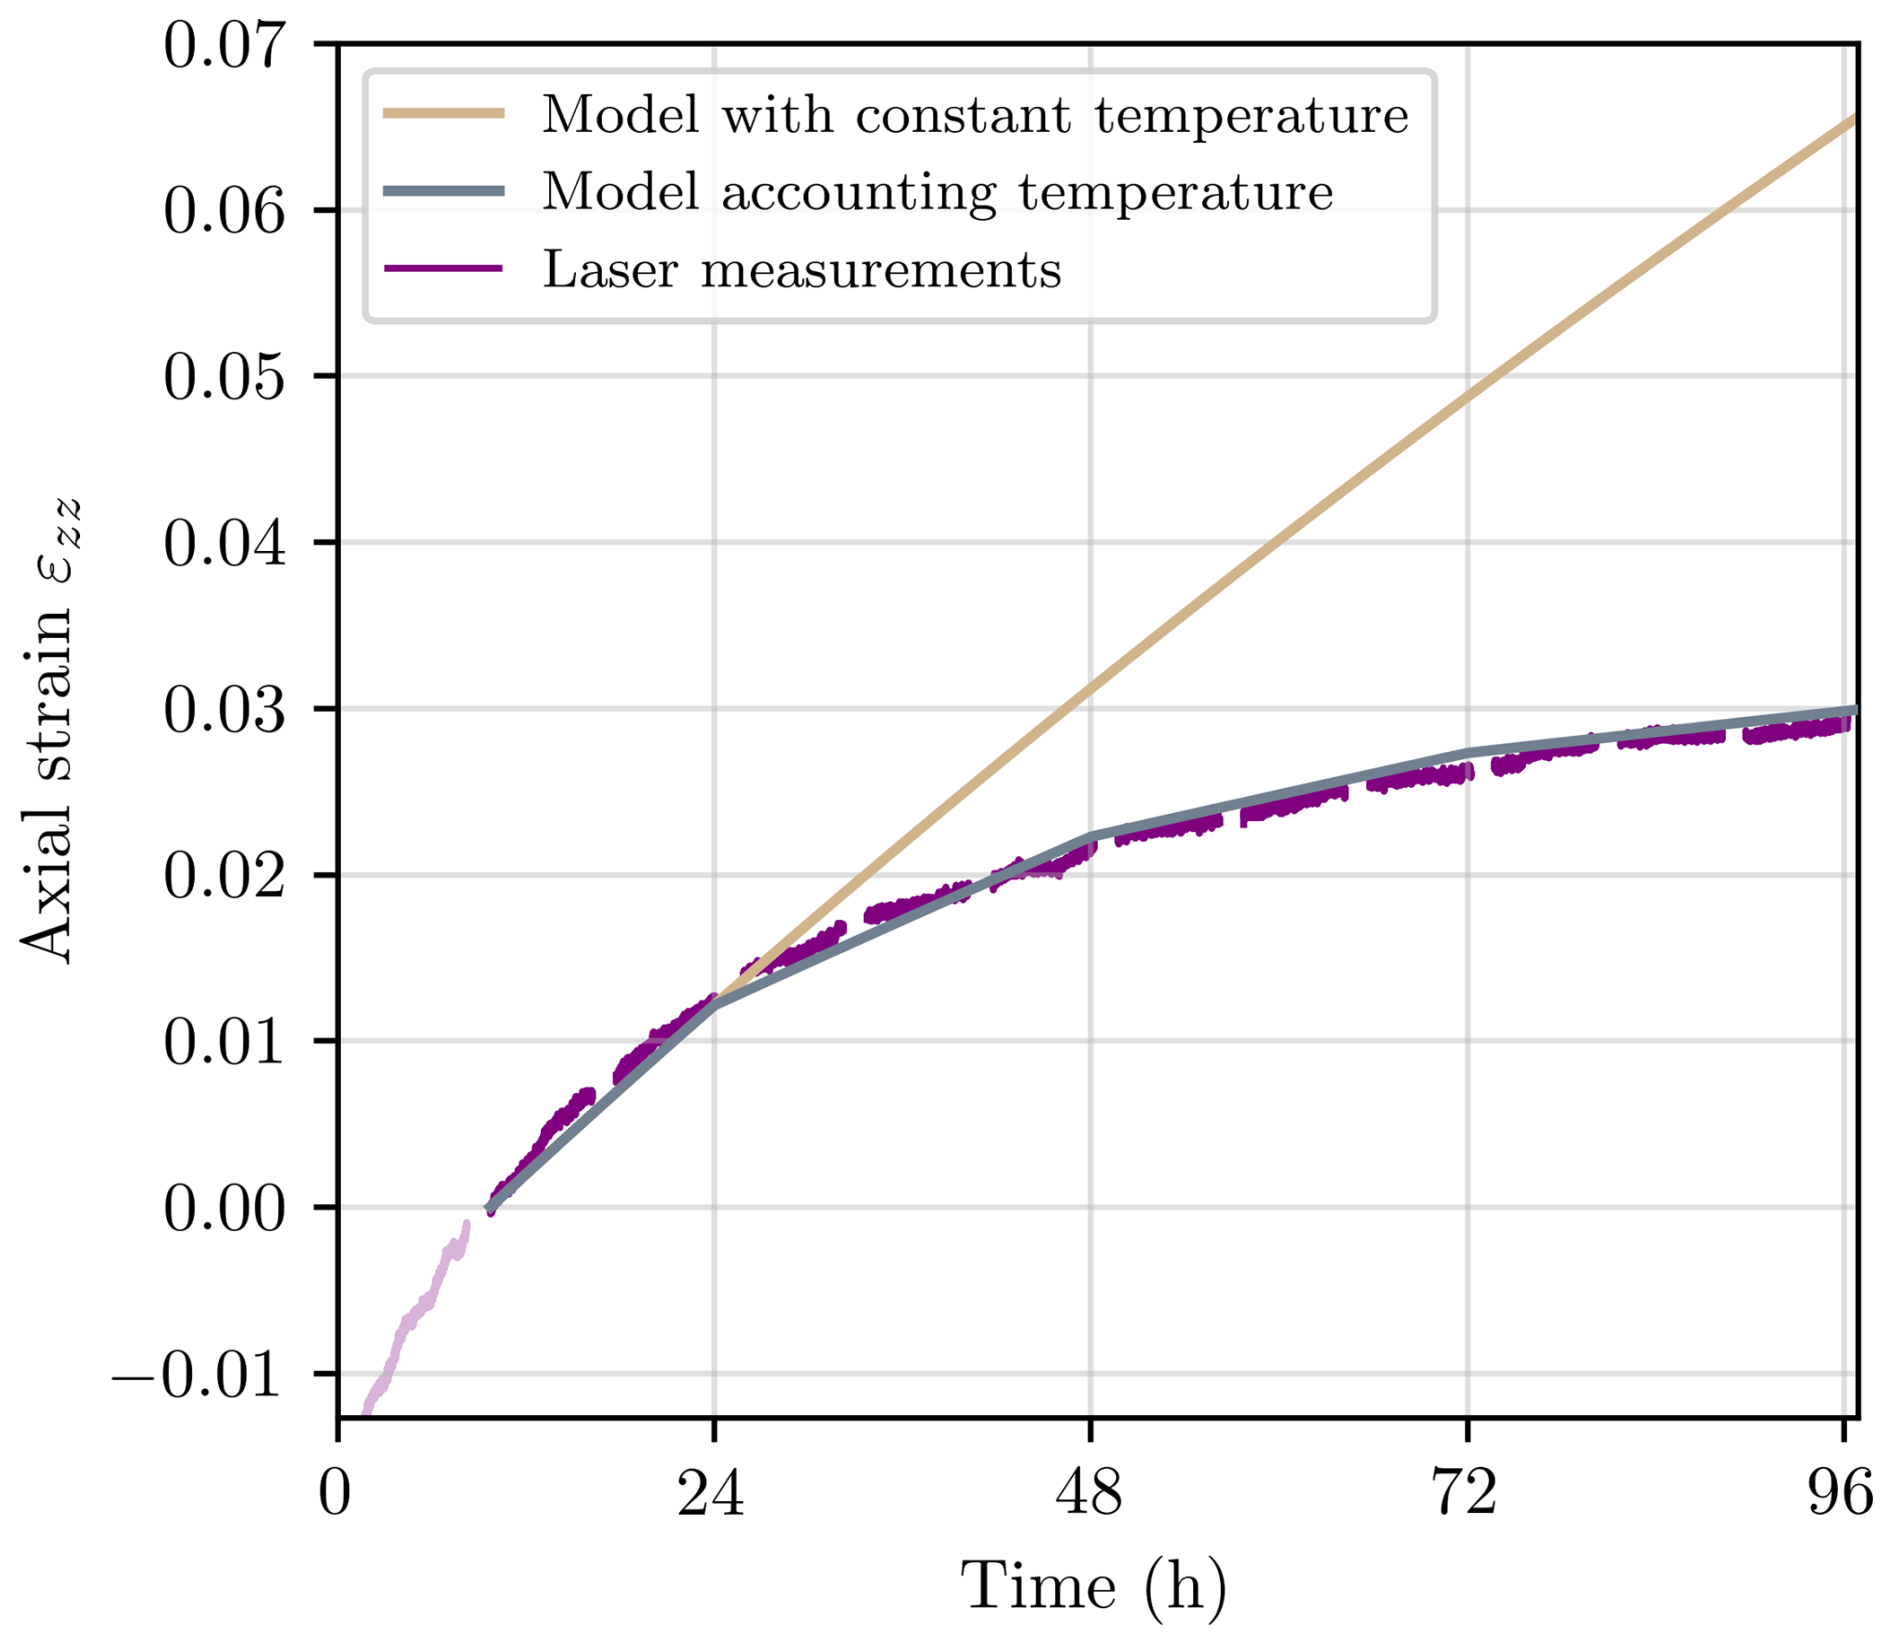
Figure 7Strain versus time measured by the laser and predicted with the model Eq. (4) considering the measured temperature and a constant temperature equal to the initial temperature. The offset of the temperature prefactor is calibrated on the first temperature step. The first 8 h (grey area) are excluded from the analysis.
3.2 Results for all experimental series
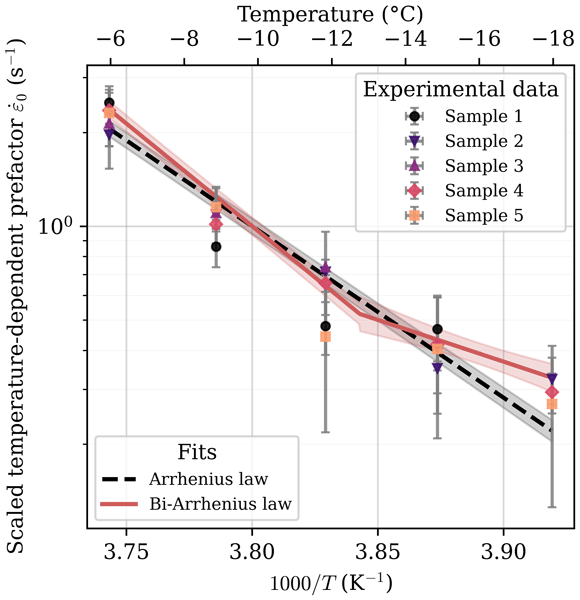
In this section, we analyse the full set of experimental results. At a given temperature, the temperature prefactor varies by approximately 40 % across the different experimental samples (Fig. A2). This dispersion is likely due to differences in second-order microstructural features that the mechanical model does not explicitly capture. In particular, samples 3 and 5 consistently exhibit higher values of across the entire temperature range, whereas samples 1 and 4 show systematically lower values. Since our focus is on the temperature dependence, each sample series was first corrected for these second-order microstructural effects by subtracting the mean offset. Figure 8 shows the corrected scaled strain-rate prefactor as a function of inverse temperature for each sample. The data collapse onto a single master curve, indicating that all samples share a similar temperature dependence. We therefore use the complete dataset to characterise the viscoplastic response, accounting for the associated uncertainties.
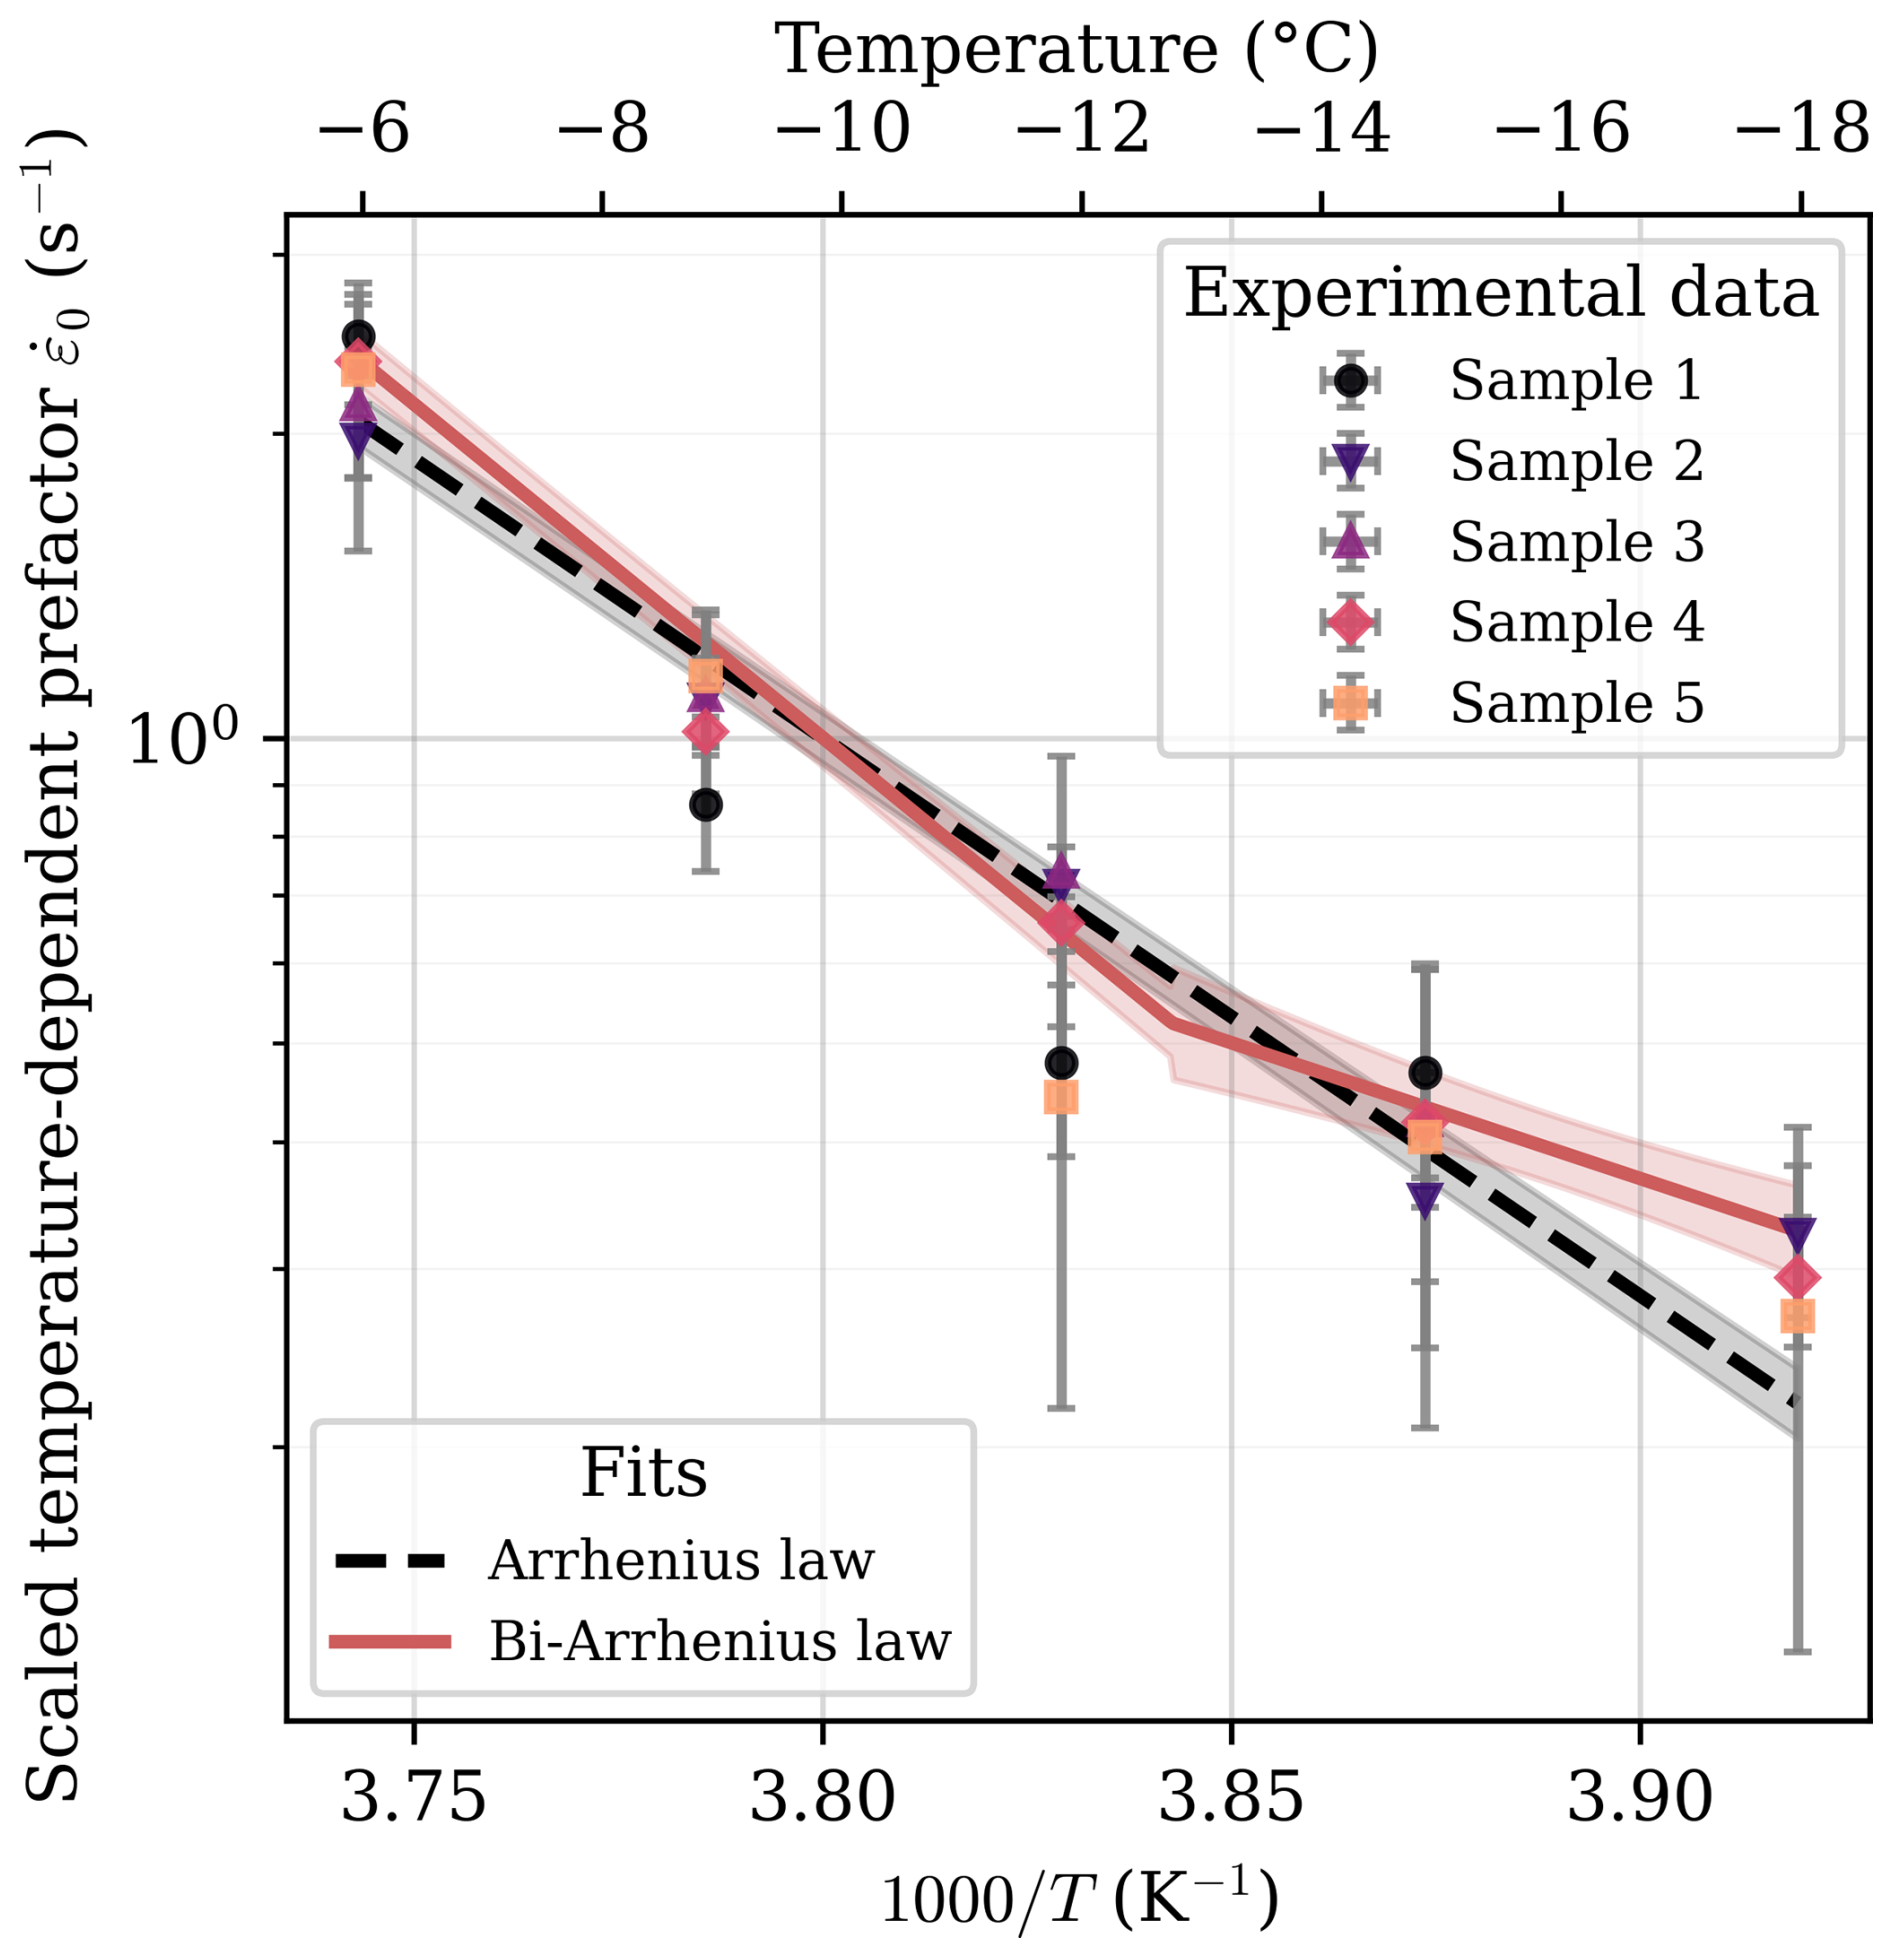
Figure 8Scaled strain rate prefactor as a function of inverse temperature for all studied samples, corrected for second-order microstructural effects.
Fitting a single Arrhenius law to all data yields an apparent activation energy of . However, a simple Arrhenius formulation fails to capture the change in slope observed around −12 °C, particularly for series 4 and 5. By fitting a two-regime Arrhenius law (Eq. 5) to the data, two apparent activation energies are identified: and , with a transition temperature of . The apparent activation energy associated with the low-temperature regime is subject to substantial uncertainty, owing to the large experimental scatter at low temperatures, where deformation rates are low. The two-regime Arrhenius law is statistically preferred according to the Akaike Information Criterion (), indicating that the data support a transition between two temperature-dependent regimes.
3.3 Analysis of the evolution of microstructural properties and spatial heterogeneity
Tomographic scans were performed every 8 h during the tests to monitor the evolution of the microstructure. Figure 9 shows the evolution of the density and specific surface area (SSA) calculated over a volume. An increase in density was observed, whereas the SSA showed only a slight decrease. The microstructural variations are minimal during the experiment, with relative changes in density below 4 % (less than 10 kg m−3) and in SSA below 7 % (less than 1.4 m2 kg−1). The observed variation of the SSA is within the margin of error of tomographic image analysis (e.g., Hagenmuller et al., 2016). It confirms that the microstructure remained essentially unchanged during the compression tests, indicating a minimal effect on the mechanical properties.
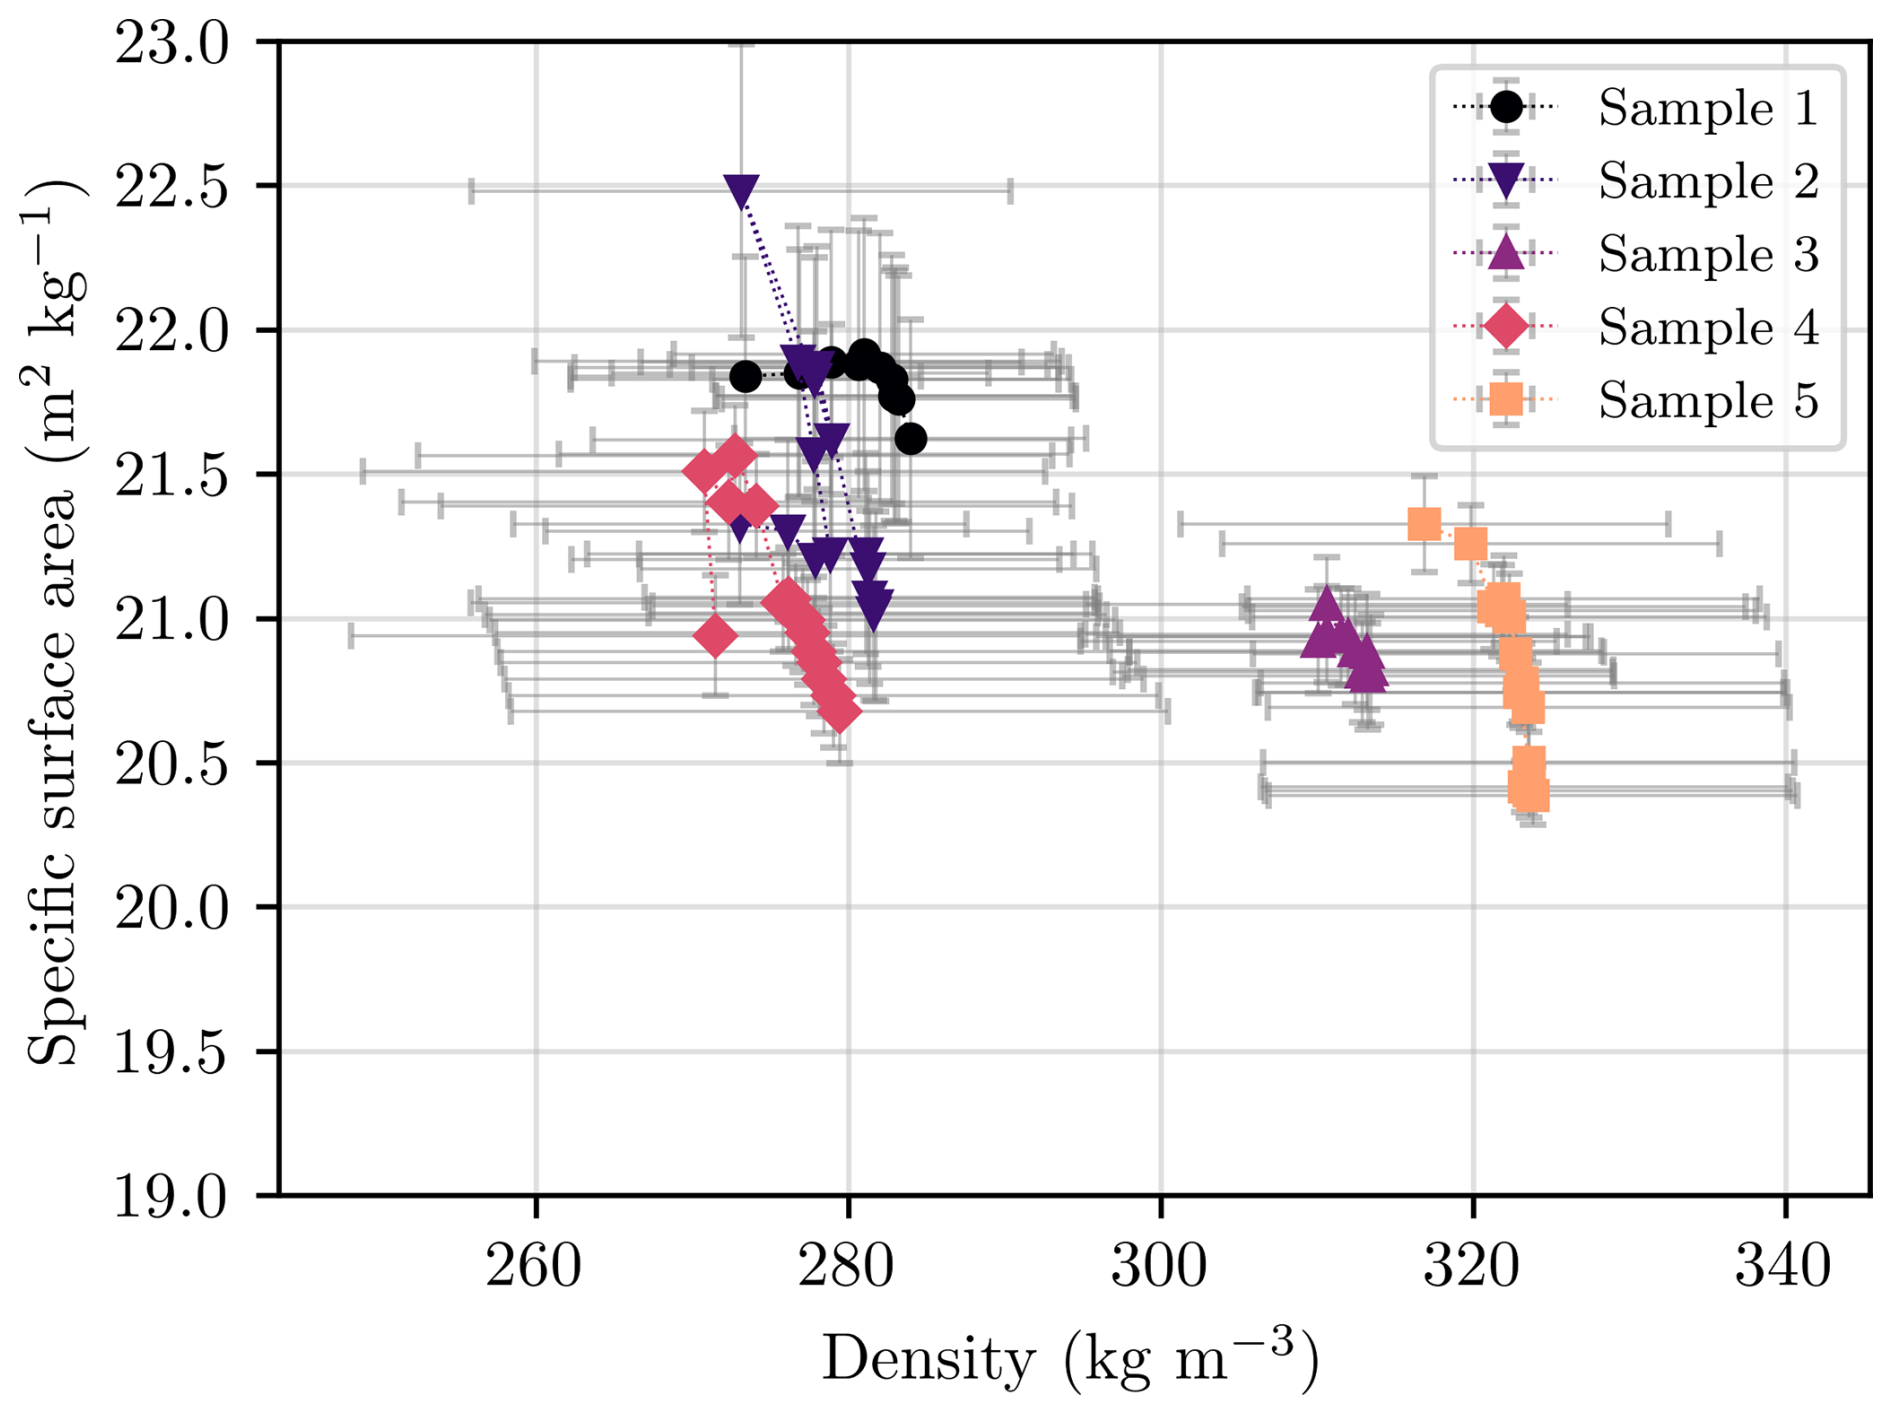
Figure 9Evolution of specific surface area and density during the tests. Error bars represent the spatial heterogeneity within one sample (standard deviation between horizontal slices).
4.1 Robust identification of the temperature sensitivity of snow viscoplasticity
In this study, we isolated the effect of temperature on the viscoplastic response by (i) using the same snow sample throughout each test, (ii) limiting microstructural variations across temperature steps, and (iii) accounting for geometric hardening using the model proposed by Védrine and Hagenmuller (2025). This procedure enables robust identification of the temperature sensitivity of snow viscoplasticity and disentangles it from microstructural effects. We discuss here how the choice of geometric hardening model and sample heterogeneity may affect the results.
Figure 10 illustrates the sensitivity of the identified apparent activation energy to the parameters of the constitutive law. If the apparent activation energy were estimated without accounting for geometric hardening (n=0 and m=0), a value of would be obtained, corresponding to a deviation of approximately 10 %. This deviation remains relatively small because microstructural changes are intentionally limited. Nevertheless, it highlights the importance of decoupling the effects of geometric hardening and temperature. Furthermore, within the range of n and m typically reported for snow (Scapozza and Bartelt, 2003; Schleef et al., 2014a; Védrine et al., 2025), the sensitivity of Q to these parameters is low, resulting in a maximum deviation of 3 %.
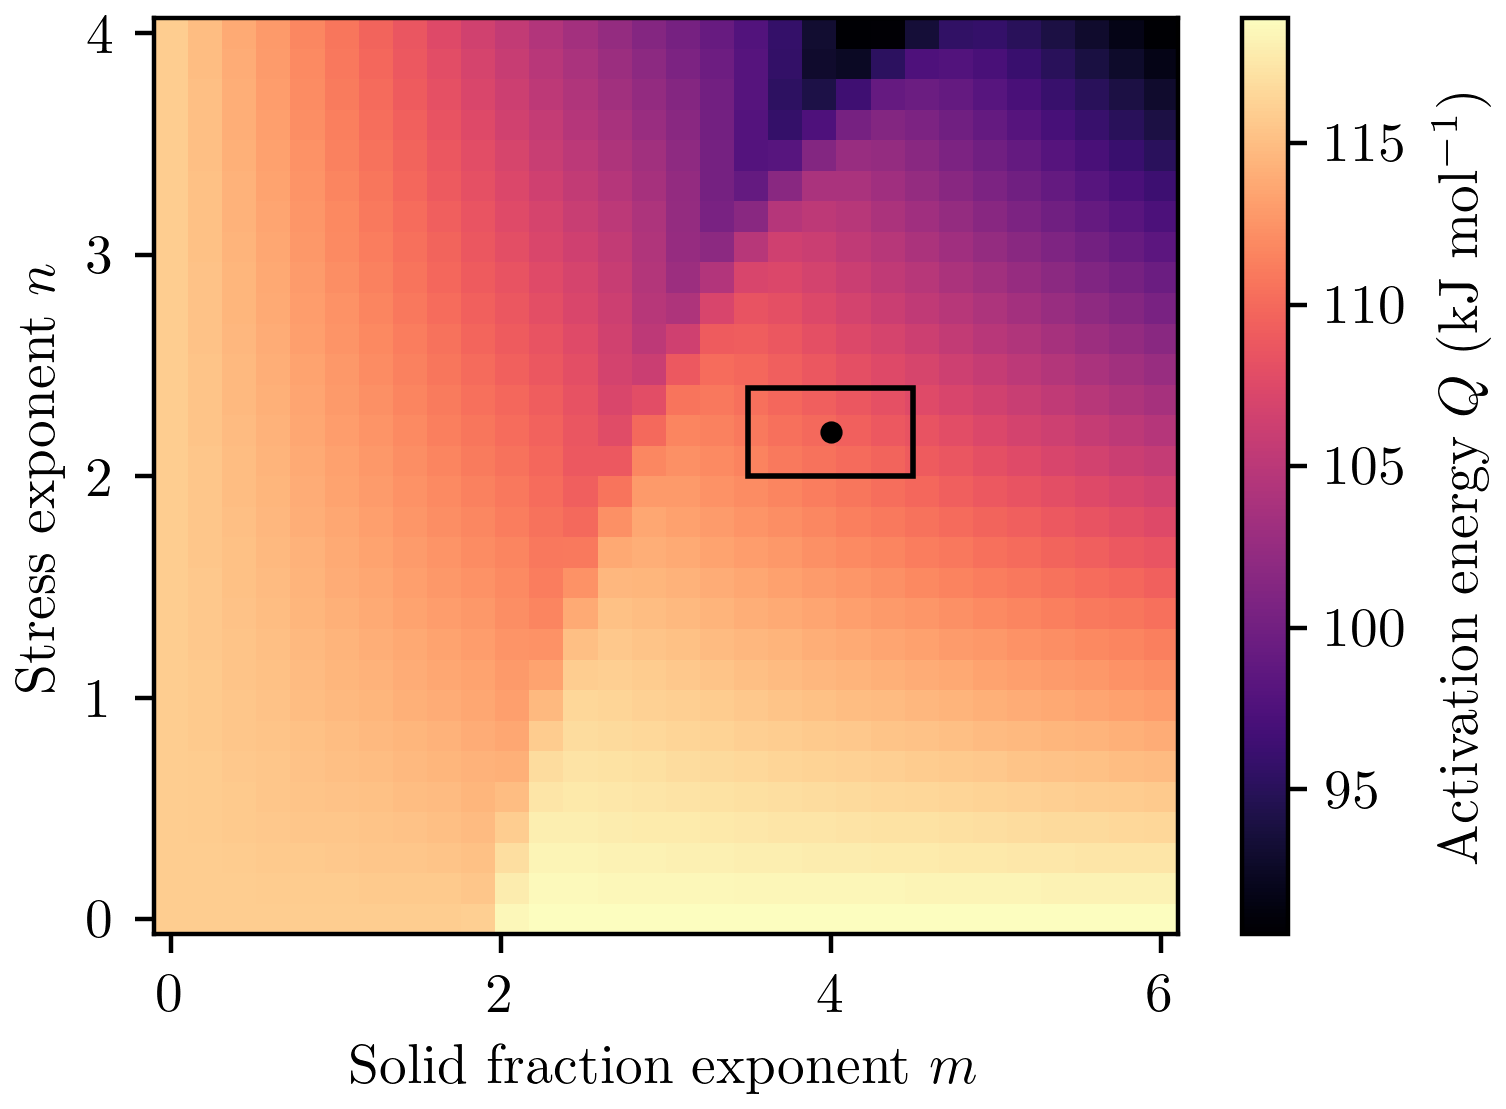
Figure 10Apparent activation energy estimated from the experimental measurements as a function of the model parameters m and n. The rectangle indicates the range of physically meaningful parameters ( and ).
In our model, each sample was assumed homogeneous and characterised by its mean density. However, the tomographic scans reveal spatial heterogeneities within the samples (Fig. 9), which can lead to stress concentrations and higher strain rates (Fig. 8). Differences in microstructural heterogeneity between samples, as well as second-order microstructural parameters (Fig. 9), affect the mean strain-rate but not its temperature dependence. These effects can therefore be readily accounted for, allowing the influence of temperature to be isolated (Fig. 8). These results clearly demonstrate the necessity of using the same snow sample to identify the temperature sensitivity of snow viscoplasticity. If different samples are used at each temperature step, microstructural effects can no longer be disentangled from temperature dependence (e.g., Scapozza and Bartelt, 2003; Delmas, 2013; Li et al., 2024).
4.2 Comparison of the temperature dependence of snow viscoplasticity with previous studies
Our results ( above and below) fall within the wide range of activation energies reported in the literature (Fig. 1) and confirm previous reports of two temperature regimes in snow (Kirchner et al., 2001; Scapozza and Bartelt, 2003). For example, Kirchner et al. (2001) observed an activation-energy transition near −6 °C, with below this threshold and above. Scapozza and Bartelt (2003) reported an increase in apparent activation energy from approximately 69 kJ mol−1 between −18 and −11 °C to about 120 kJ mol−1 between −12 and −5 °C for snow with a density of 430 kg m−3. However, our apparent activation energy estimates are substantially higher than those reported by Schleef et al. (2014b), who found an apparent activation energy of between −13 and −3 °C. The very high apparent activation energy values reported by Scapozza and Bartelt (2003) and Delmas (2013) are likely due to microstructural variability, because only two temperatures were used to determine the apparent activation energy, which makes the estimated activation energy highly sensitive to differences in microstructure between samples.
4.3 A signature of microscale deformation mechanisms?
At first glance, the viscoplastic response of snow exhibits a temperature sensitivity similar to that reported for polycrystalline ice. In particular, the bilinear temperature dependence inferred from our data yields apparent activation energies consistent with commonly reported values for ice creep. The high-temperature regime is characterised by an apparent activation energy of , in good agreement with values reported for polycrystalline ice, typically around 130 kJ mol−1 (e.g., Glen, 1955; Steinemann, 1954; Mellor and Testa, 1969b; Barnes et al., 1971). At lower temperatures, a second regime is observed, with , close to the commonly used value of 68.8 kJ mol−1 for polycrystalline ice below −10 °C (Mellor and Testa, 1969b).
However, this apparent similarity should be interpreted with caution. Védrine et al. (2024) demonstrated that deformation in snow is primarily governed by basal slip in the ice matrix. This result suggests that the temperature sensitivity of snow viscoplasticity may primarily be inherited from that of basal slip. Yet, the temperature sensitivity of basal slip at the single-crystal scale remains poorly constrained. The apparent activation energy associated with basal slip has been reported to lie in the range (Okada et al., 1999; Meyssonnier et al., 2009) at low temperatures (). Jones and Brunet (1978) investigated the temperature sensitivity of ice single crystals over the range −20 to −0.2 °C and reported an activation energy of , independent of temperature. However, they observed that the stress exponent of basal slip, nb, varied linearly with temperature, decreasing from nb=2.07 at −20 °C to nb=1.95 at −0.2 °C. Such temperature dependence of the stress exponent is commonly reported in single crystals (e.g., Spitzig and Keh, 1970; Wollgramm et al., 2016).
In our model, n was fixed at 2.2. However, when this relative temperature dependence of the exponent is taken into account, using the temperature dependence of n reported for basal slip and normalizing its value at −10 °C to recover the stress exponent of 2.2 used for snow, we obtained . This yields a single effective activation energy of (Fig. A3) over the full temperature range. This value is consistent with the activation energy for basal slip determined by Jones and Brunet (1978). This result suggests that part of the apparent bilinear temperature dependence observed at the macroscopic scale may not reflect a true transition in activation energy, but rather the effect of a temperature-dependent stress exponent. These results highlight the need for dedicated experimental and modelling studies to better constrain the temperature dependence of the stress exponent and its contribution to the apparent macroscopic temperature sensitivity of snow viscoplasticity.
In this study, we did not investigate the behaviour of snow above −6 °C. Additional experiments in this temperature range could provide further insight into the active deformation mechanisms. In polycrystalline ice, a strongly nonlinear increase in creep rate as the melting point is approached has often been reported, with grain-boundary processes suggested as a possible explanation (e.g., Jacka and Maccagnan, 1984; Morgan, 1991). In contrast, Jones and Brunet (1978) showed that a system deforming predominantly by basal slip, as may be the case for snow (Védrine et al., 2024), does not necessarily exhibit such an acceleration of creep close to the melting point. Whether the temperature dependence observed here persists at higher temperatures or whether additional mechanisms lead to a nonlinear increase in creep rate therefore remains an open question.
4.4 Impact on snowpack model
We compare our model with the parametrisation of Brun et al. (1992) (BR92), implemented in the detailed snowpack model Crocus, and with the parametrisation of Kojima (1975) (K75) for fresh snow, implemented in the snowpack model Snowpack (Lehning et al., 2002). In the BR92 parametrisation, the temperature dependence is expressed as , with , where Tm is the melting temperature and T is the snow temperature in °C. This expression corresponds to the first-order expansion (close to 0 °C) of the Arrhenius law with an apparent activation energy of 62 kJ mol−1, which is close to the value obtained for the low temperature regime but significantly lower than that obtained for the high temperature regime. In the K75 parametrisation, the effects of density and temperature are coupled through a power law in the expression of the compactive viscosity, where ρ is the snow density and T is the temperature in °C.
Figure 11 shows the strain rate predicted by the detailed snowpack models and our parametrisation for different densities: 100, 200, and 400 kg m−3. The BR92 model exhibits the weakest temperature sensitivity. At low densities, the K75 model is close to BR92, whereas at a density of 400 kg m−3 it shows a variation in strain rate between −30 and 0 °C that is similar to our parametrisation. Finally, only our parametrisation exhibits two distinct temperature regimes.
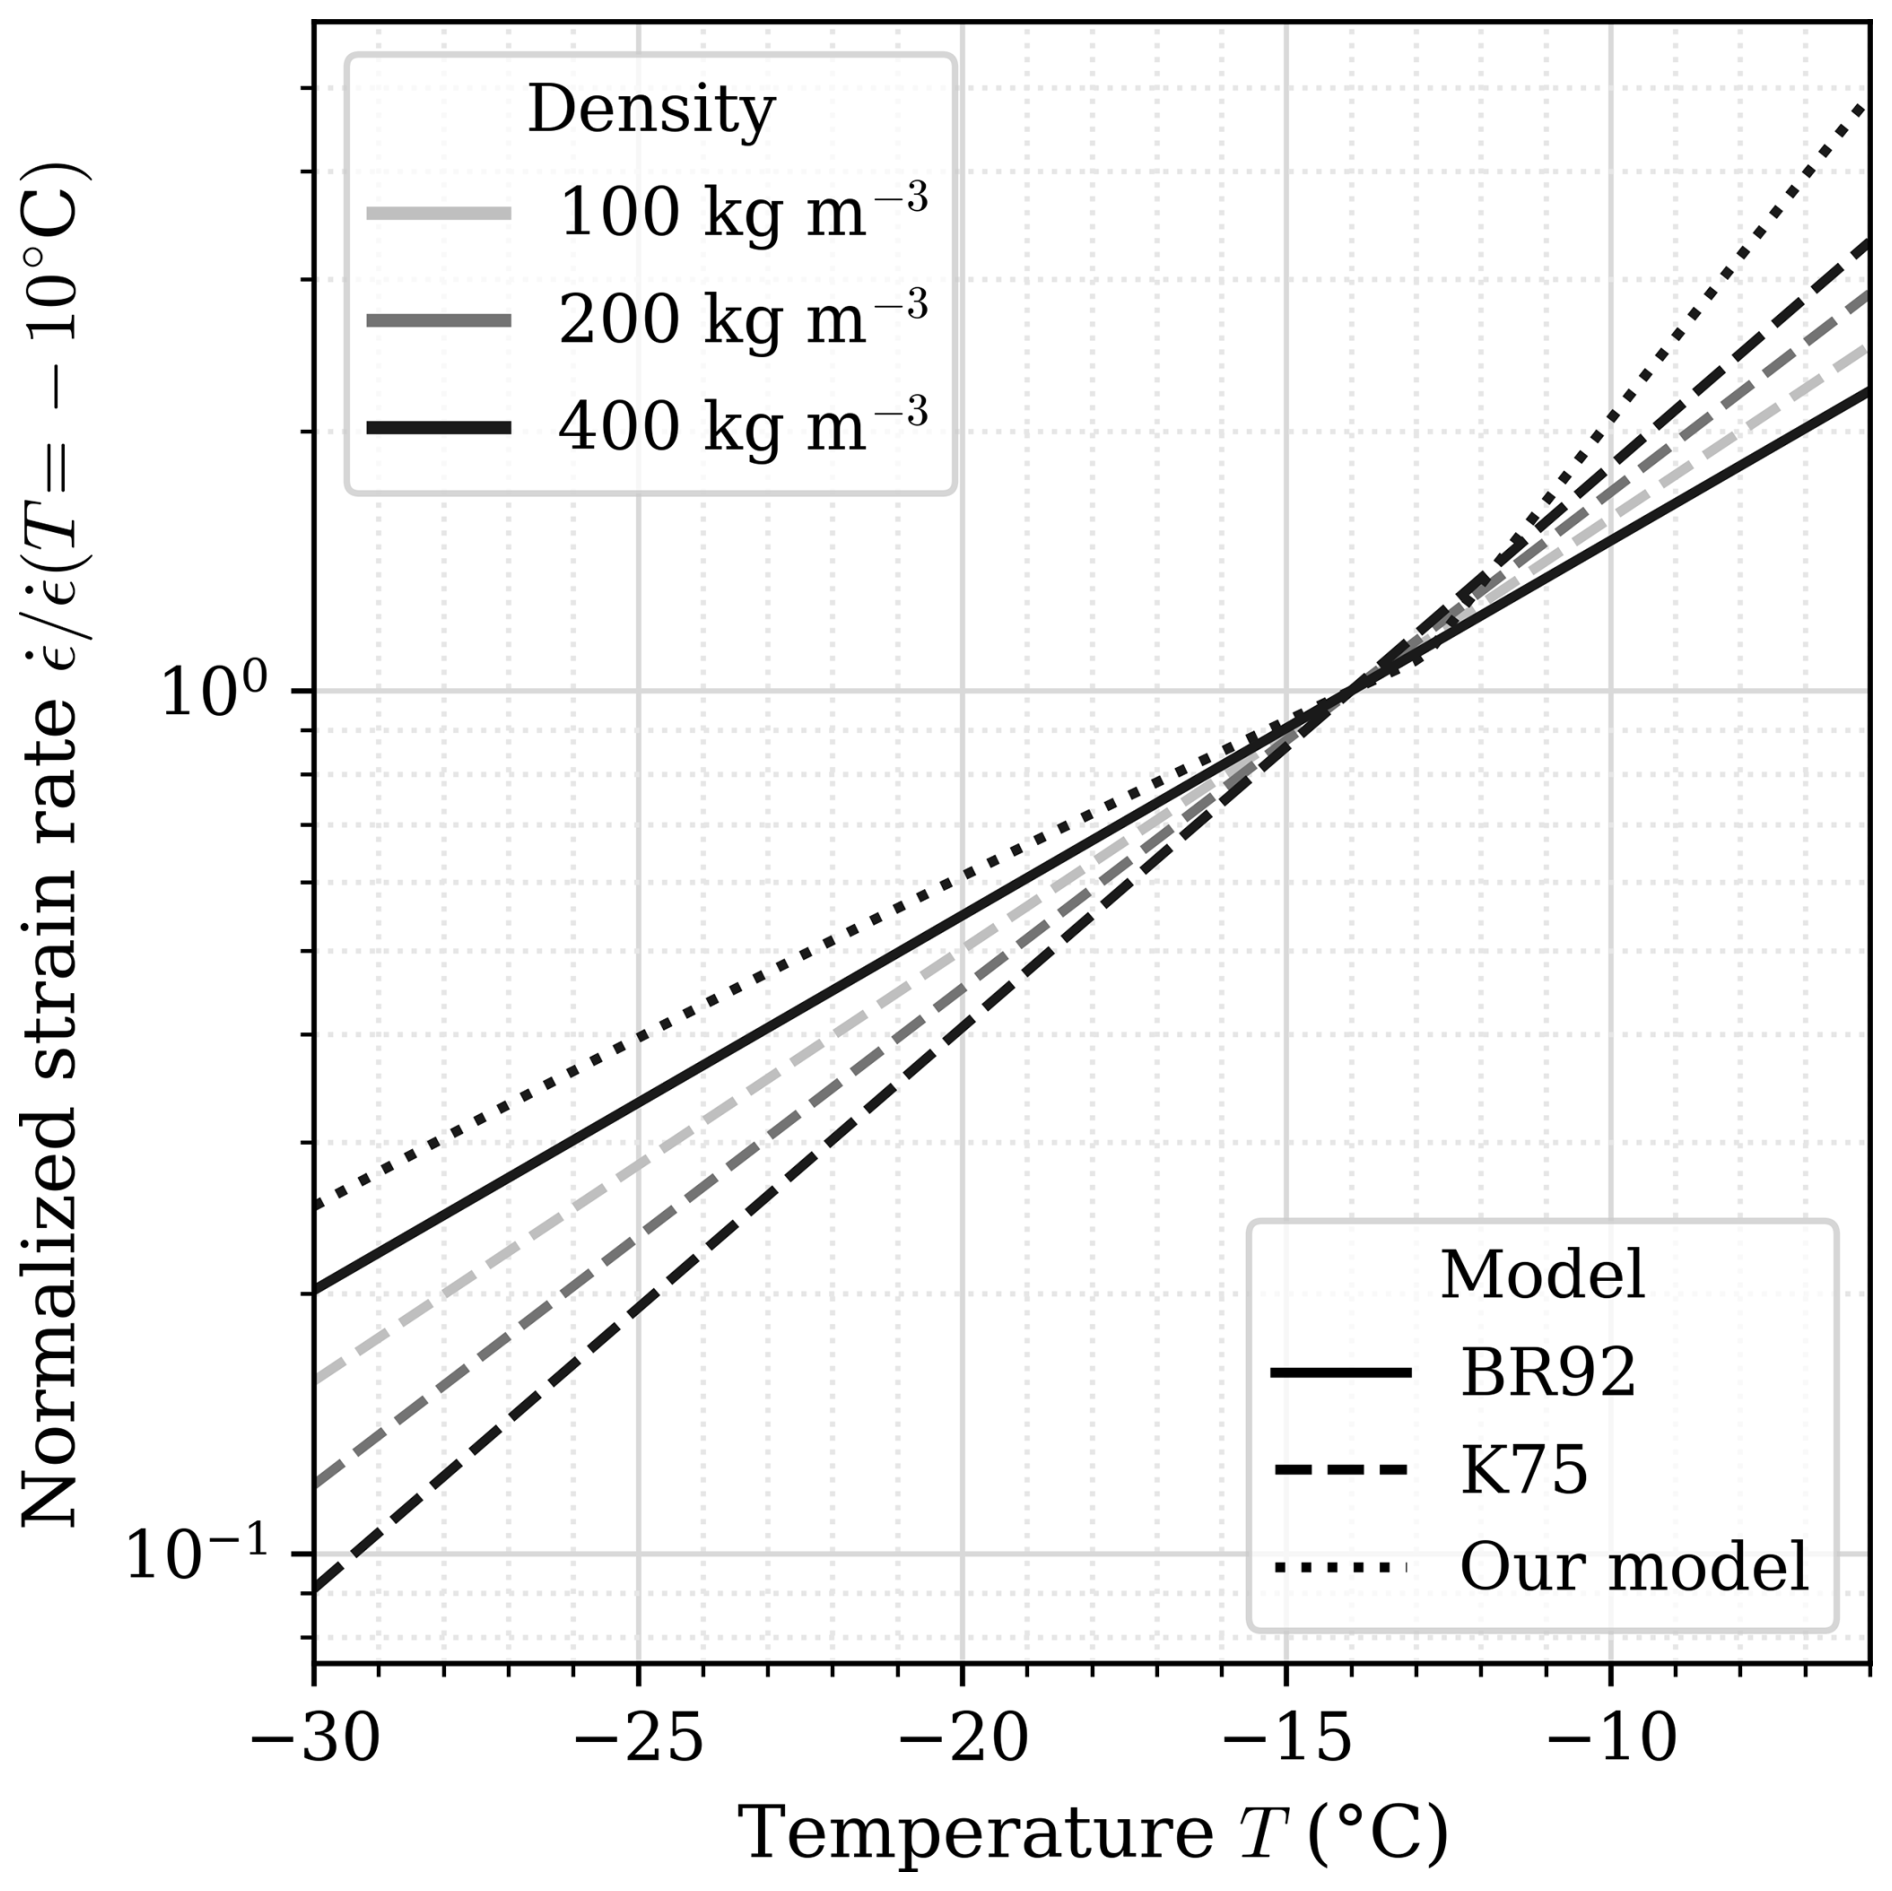
Figure 11Normalized strain rate at -10 °C predicted by the model of Brun et al. (1992) (BR92), Kojima (1975) (K75), and our parametrisation incorporating the two-regime Arrhenius law (Eq. 5) as a function of temperature for different snow densities.
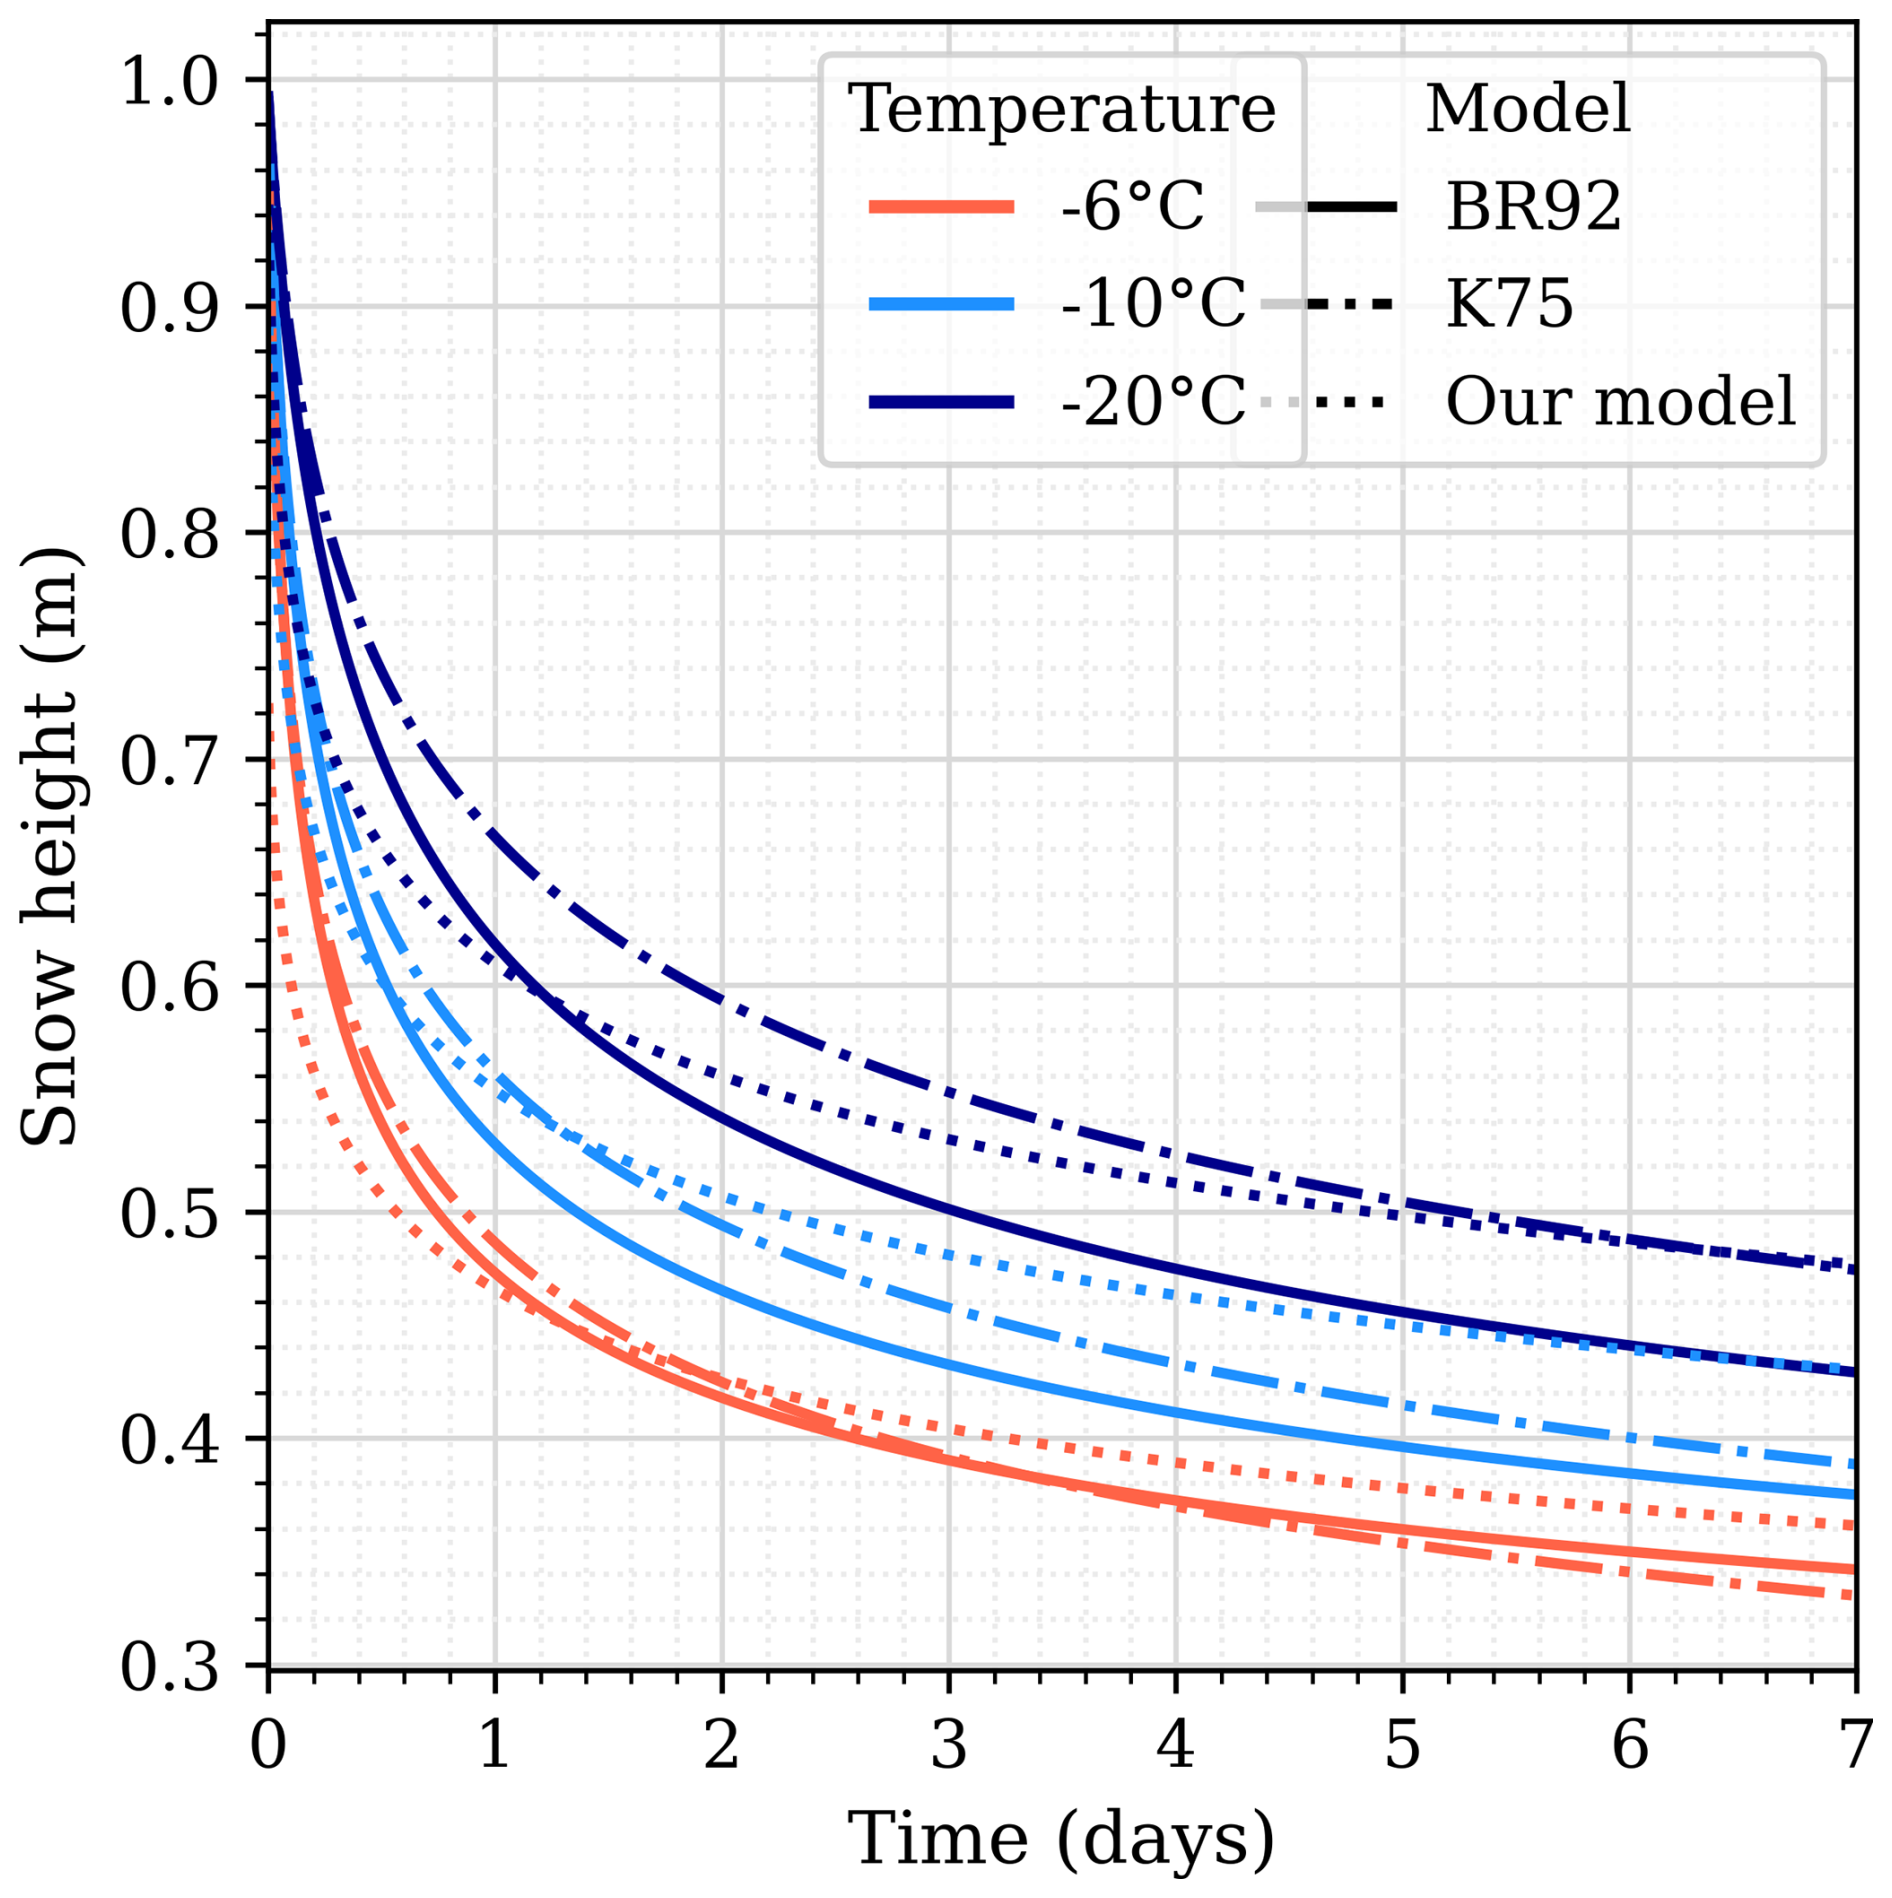
Let us consider an isothermal snowpack 1 m thick with an initial density of . Figure 12 shows the evolution of snow height predicted by the different models at different temperatures. At low density and across all temperatures, our model predicts significantly higher strain rates than those obtained with the BR92 and K75 parametrisations, which yield nearly identical results in this regime. This behaviour is consistent with the commonly reported limitations of the BR92 formulation for fresh snow (Quéno et al., 2016). A clear sensitivity of snow compaction to temperature also emerges. After one hour, compared to a snowpack at −6 °C, the snow height at −20 °C decreases by 21 %, 23 %, and 21 % for the BR92, K75, and our parametrisation, respectively. After one day, the influence of temperature and the differences in temperature sensitivity among the models become less pronounced. Overall, temperature mainly affects the characteristic timescale of compaction and, to a lesser extent, the long-term snowpack height. For example, after seven days, an isothermal snowpack at −20 °C exhibits a snow height that is 20 %, 34 %, and 27 % higher than that predicted at −6 °C for the BR92, K75, and our parametrisation, respectively. These results underline that accurately capturing the temperature sensitivity of snow viscoplasticity is essential for predicting snowpack evolution.
We developed a new thermo-mechanical cell that enables precise temperature control during in-tomograph snow-creep experiments and allows the sample temperature to be varied during creep tests. Using this device, we performed five series of experiments on samples with initial densities ranging from 278–320 kg m−3, each subjected to five temperature steps between −6 and −18 °C. By tracking the response of a single sample across successive temperature steps, we isolated the temperature dependence of snow viscoplasticity from microstructural variability by accounting for geometric hardening. Assuming a constant stress exponent with temperature, the measured response is well described by a two-regime Arrhenius law, with a characteristic temperature of , a high-temperature activation energy of , and a low-temperature apparent activation energy of . Although the densification measured during the tests intentionally remained small (<4 %), neglecting geometric hardening would lead to an apparent activation energy of , corresponding to an error of about 10 %.
These results provide a robust basis for extending snow densification laws over a wide temperature range and show that accurately capturing temperature sensitivity is essential for predicting snowpack evolution. Assuming a constant stress exponent, the identified behaviour closely resembles that reported for polycrystalline ice. However, when the temperature dependence of the stress exponent is taken into account, following the trend reported for basal slip by Jones and Brunet (1978), the data can also be described by a single effective activation energy of , consistent with basal-slip creep. This suggests that part of the apparent bilinear temperature dependence observed at the macroscopic scale may reflect a temperature-dependent stress exponent rather than a true transition in activation energy. Dedicated experiments and modelling analyses are therefore still needed to better constrain the temperature dependence of the stress exponent and to clarify the respective roles of microscale deformation mechanisms in the macroscopic viscoplastic response of snow.
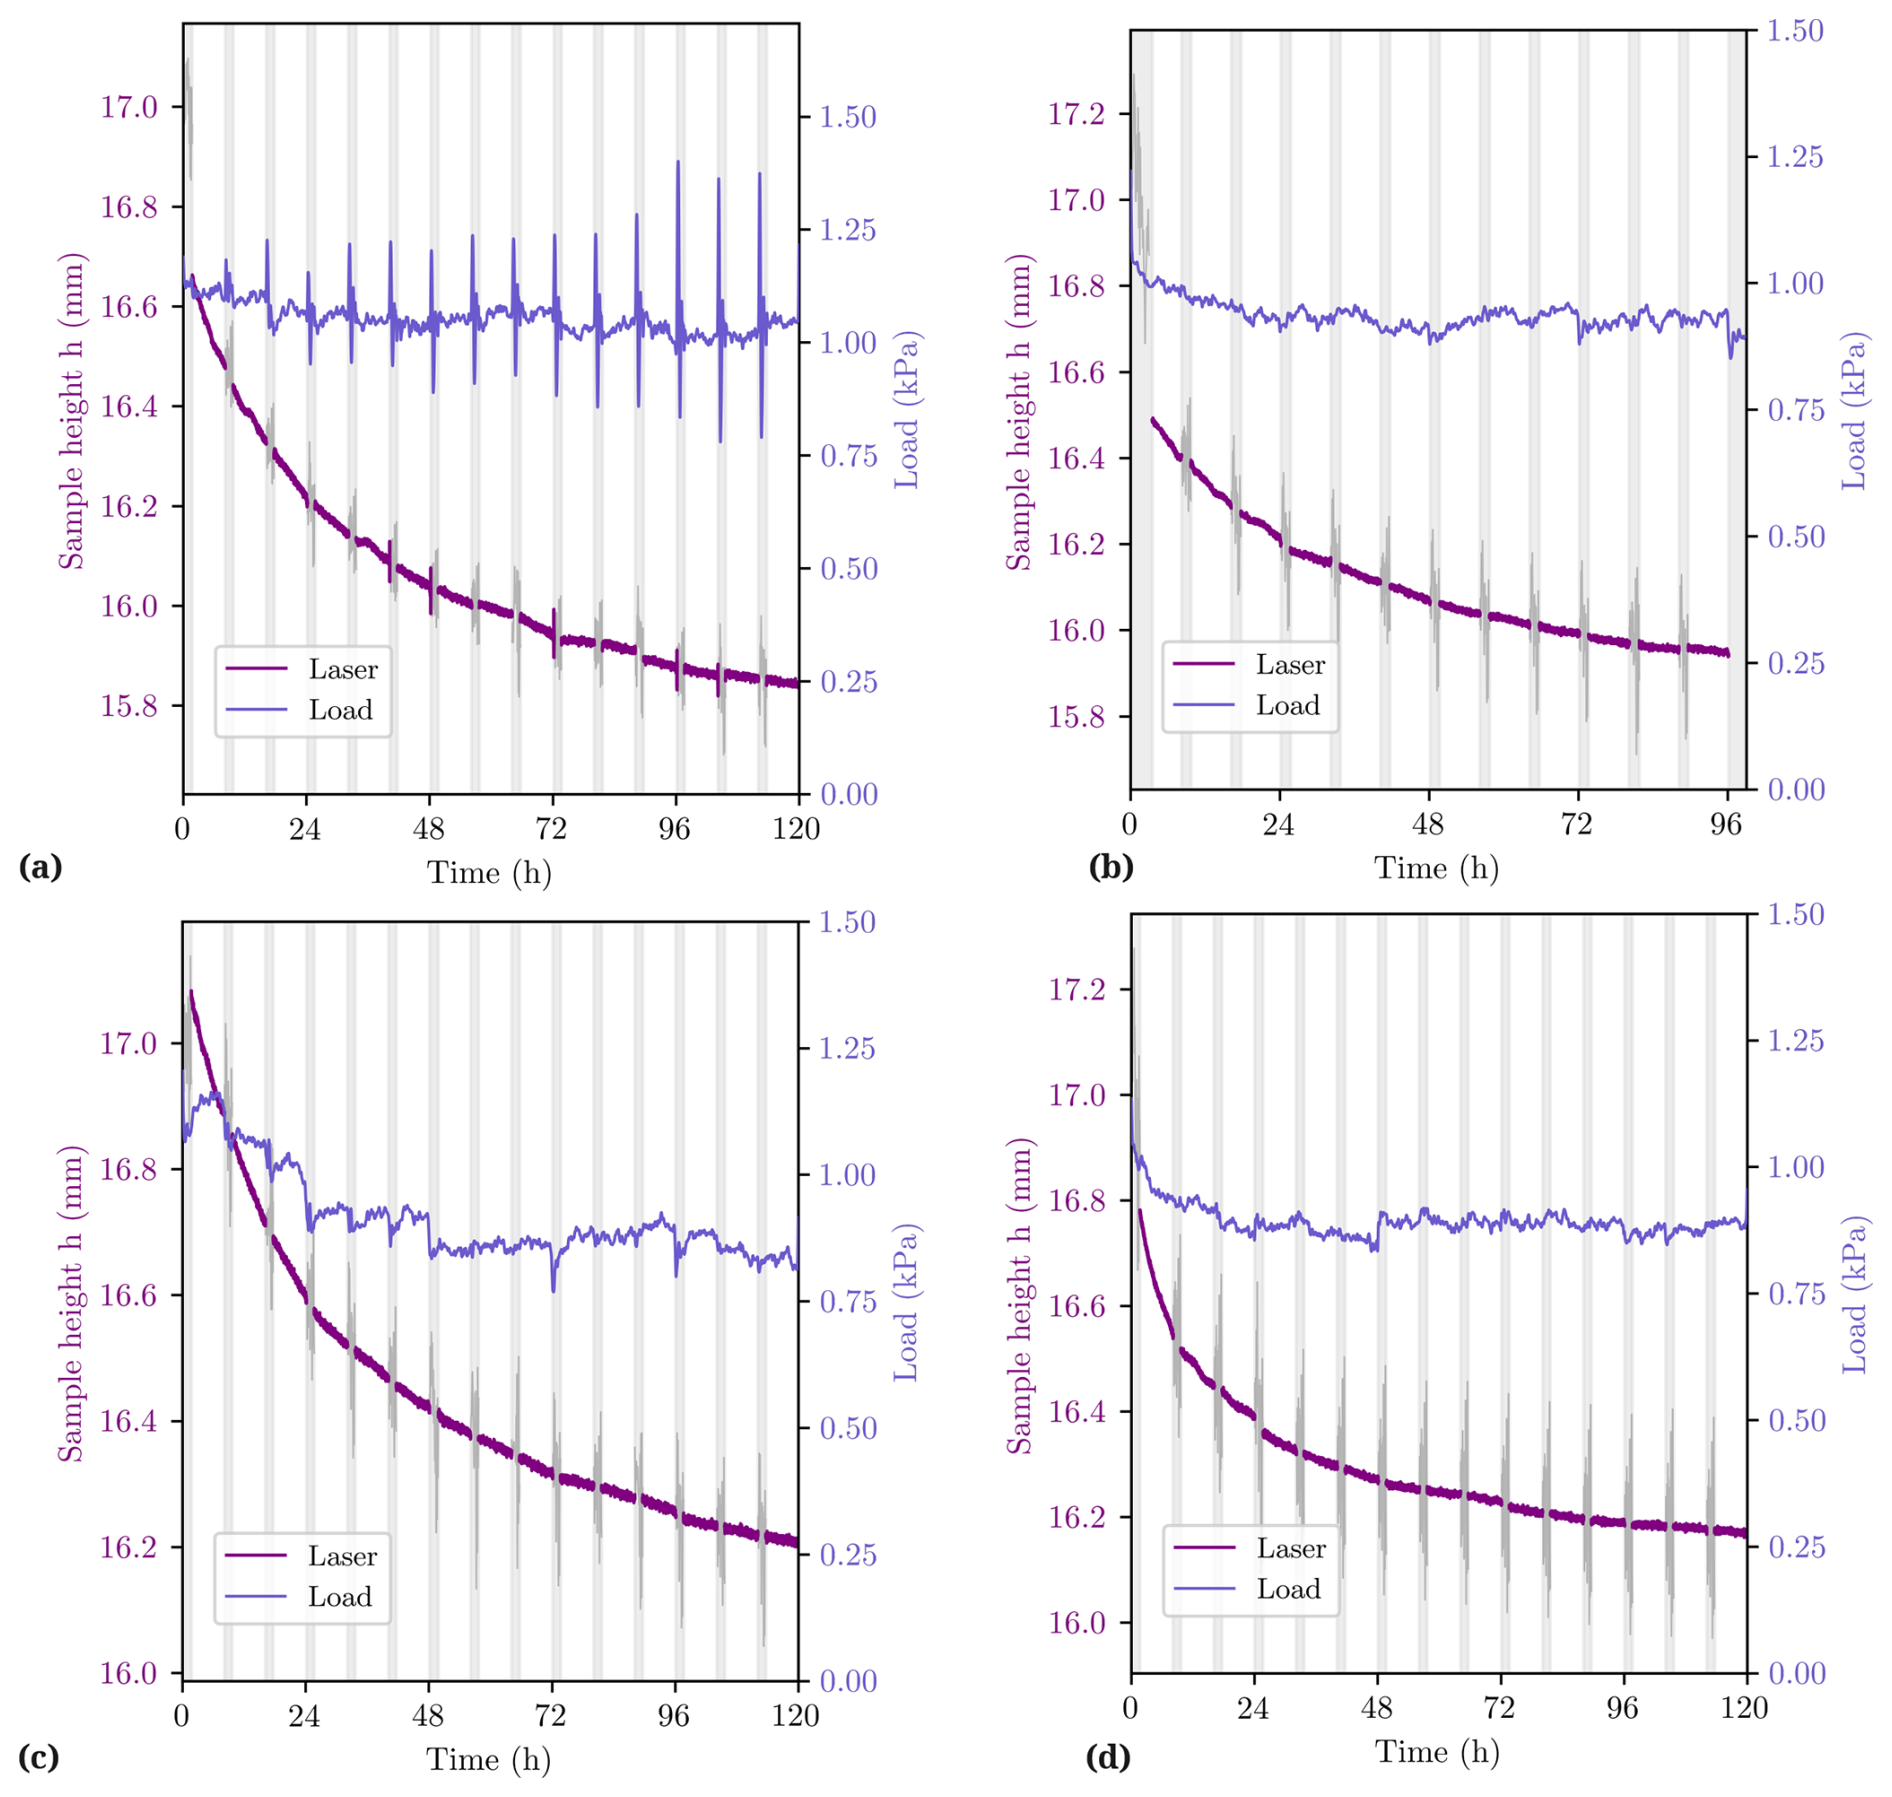
A1 Displacement and load
Figure A1 shows the temporal evolution of the sample displacement and applied load for the Samples 2–5.
A2 Raw strain rate prefactor for all series
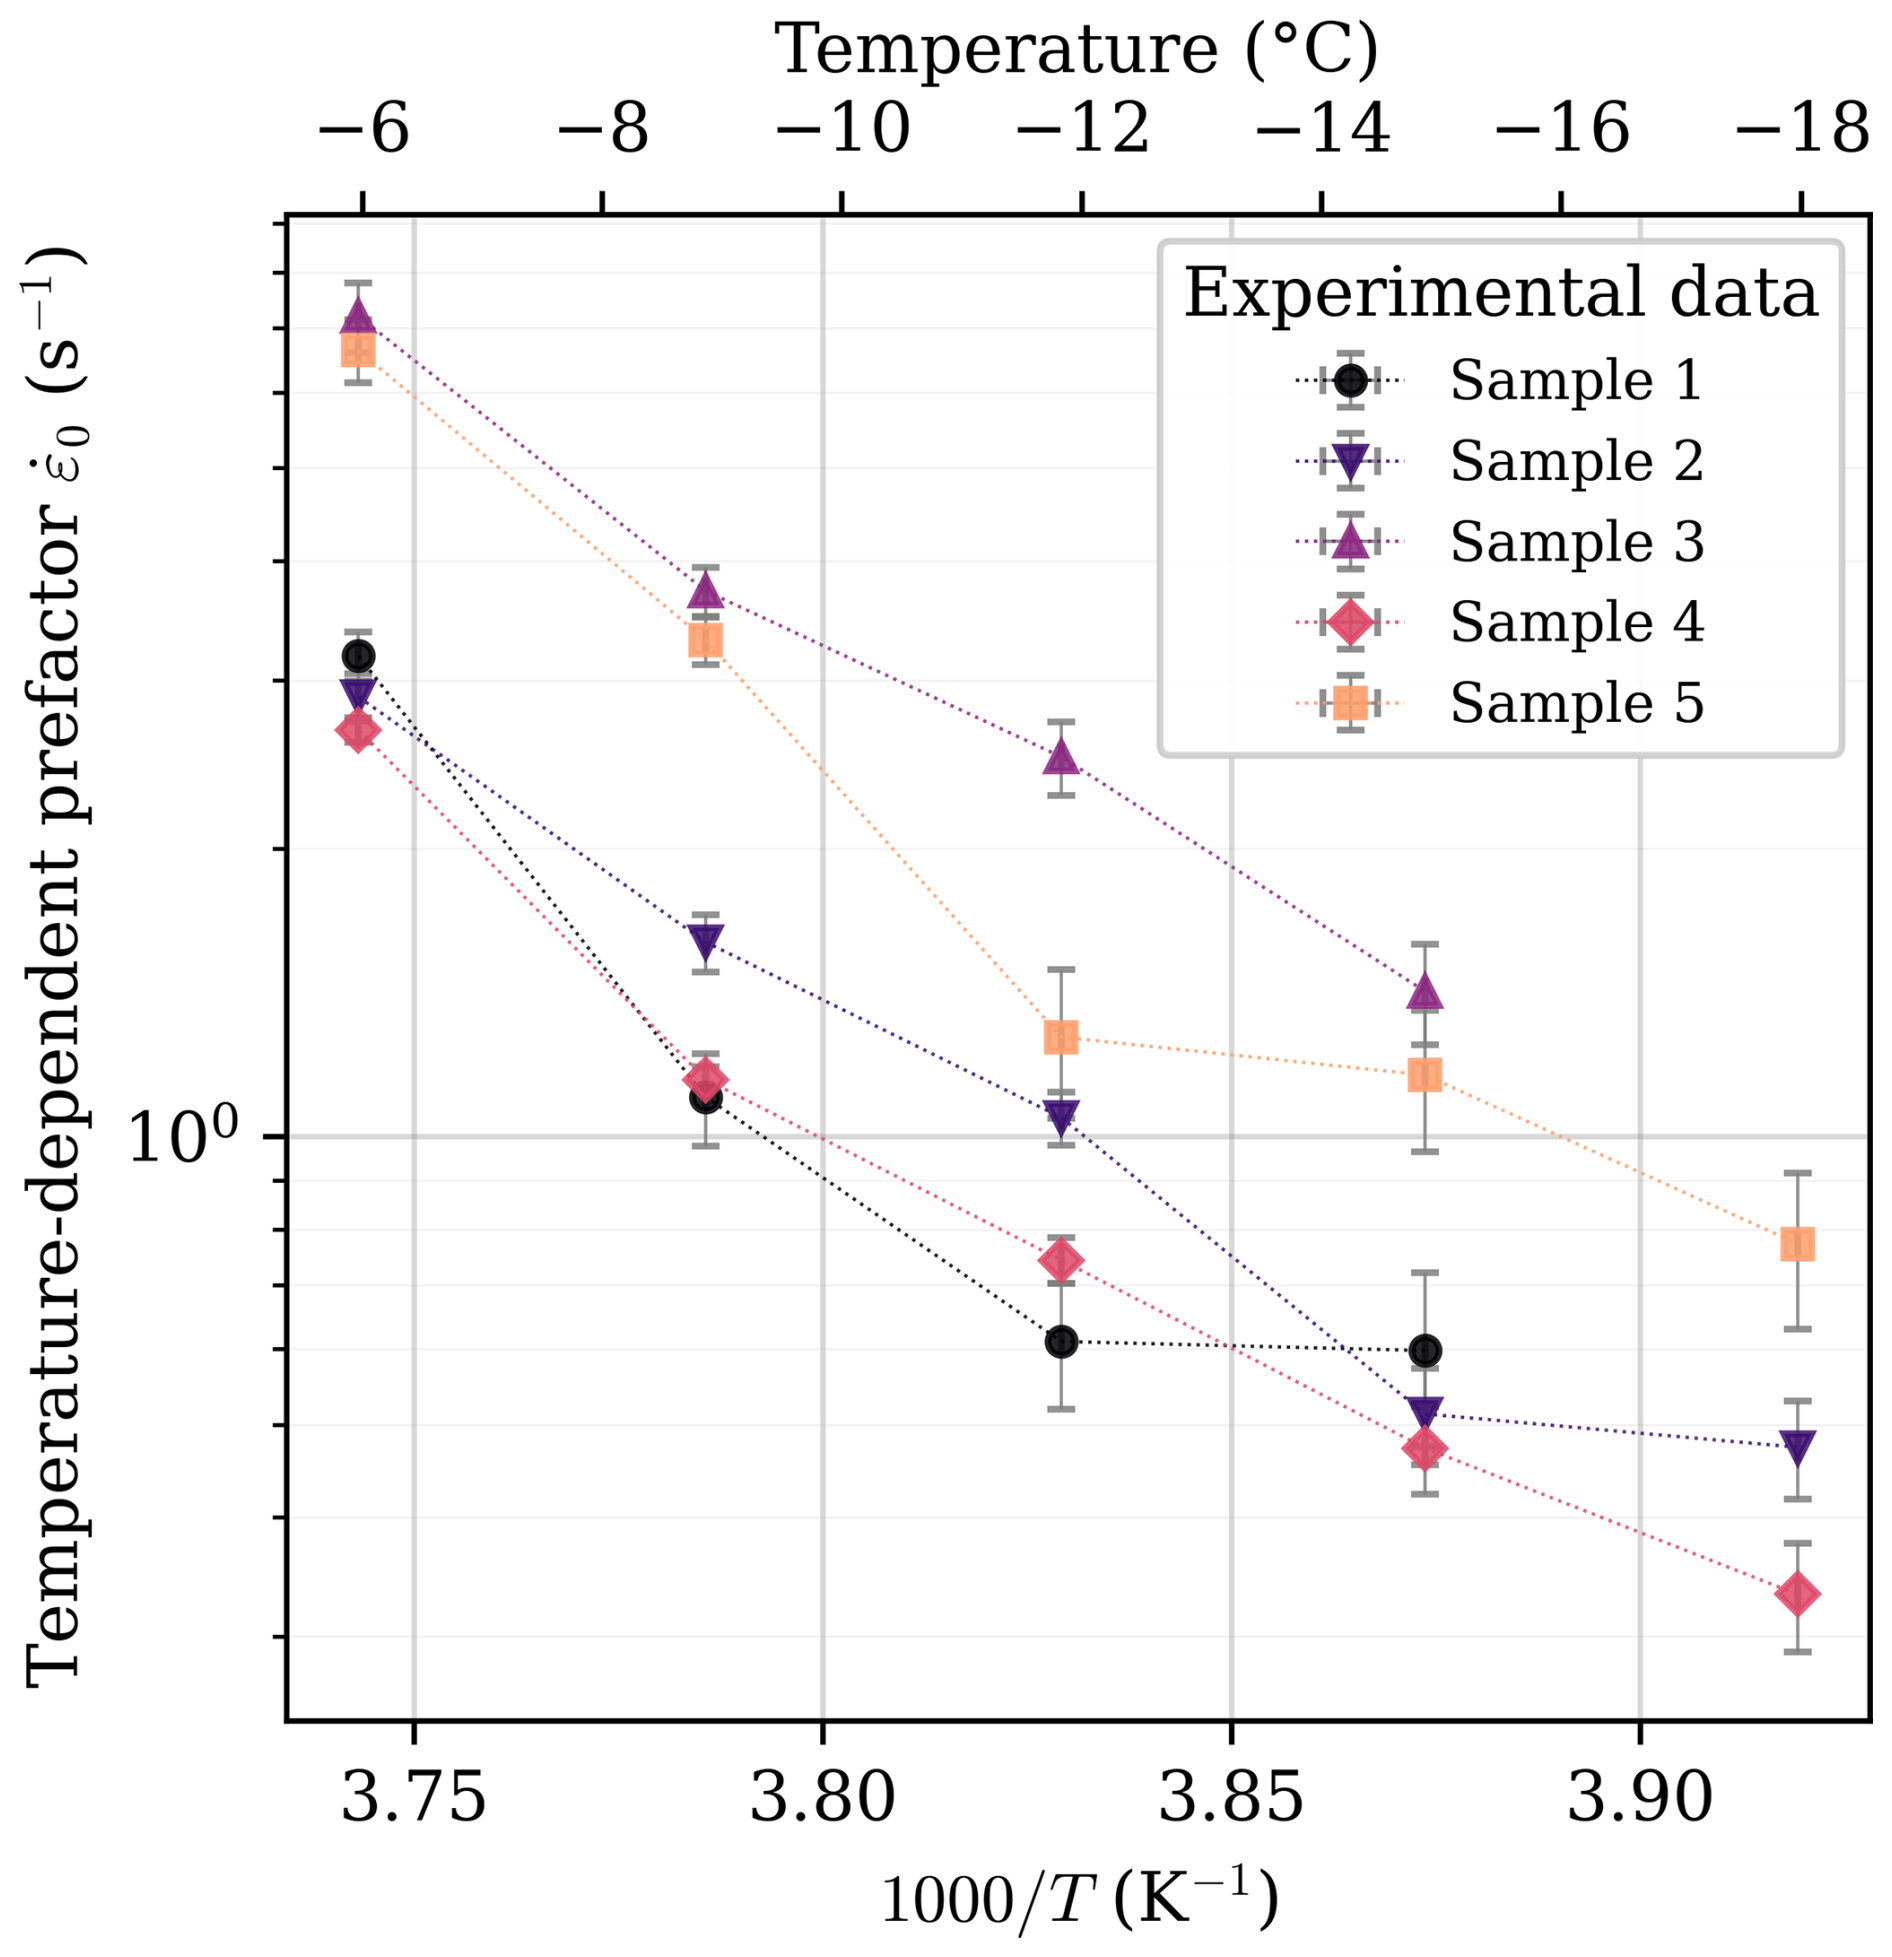
Figure A2Strain rate prefactor as a function of inverse temperature for all studied samples.
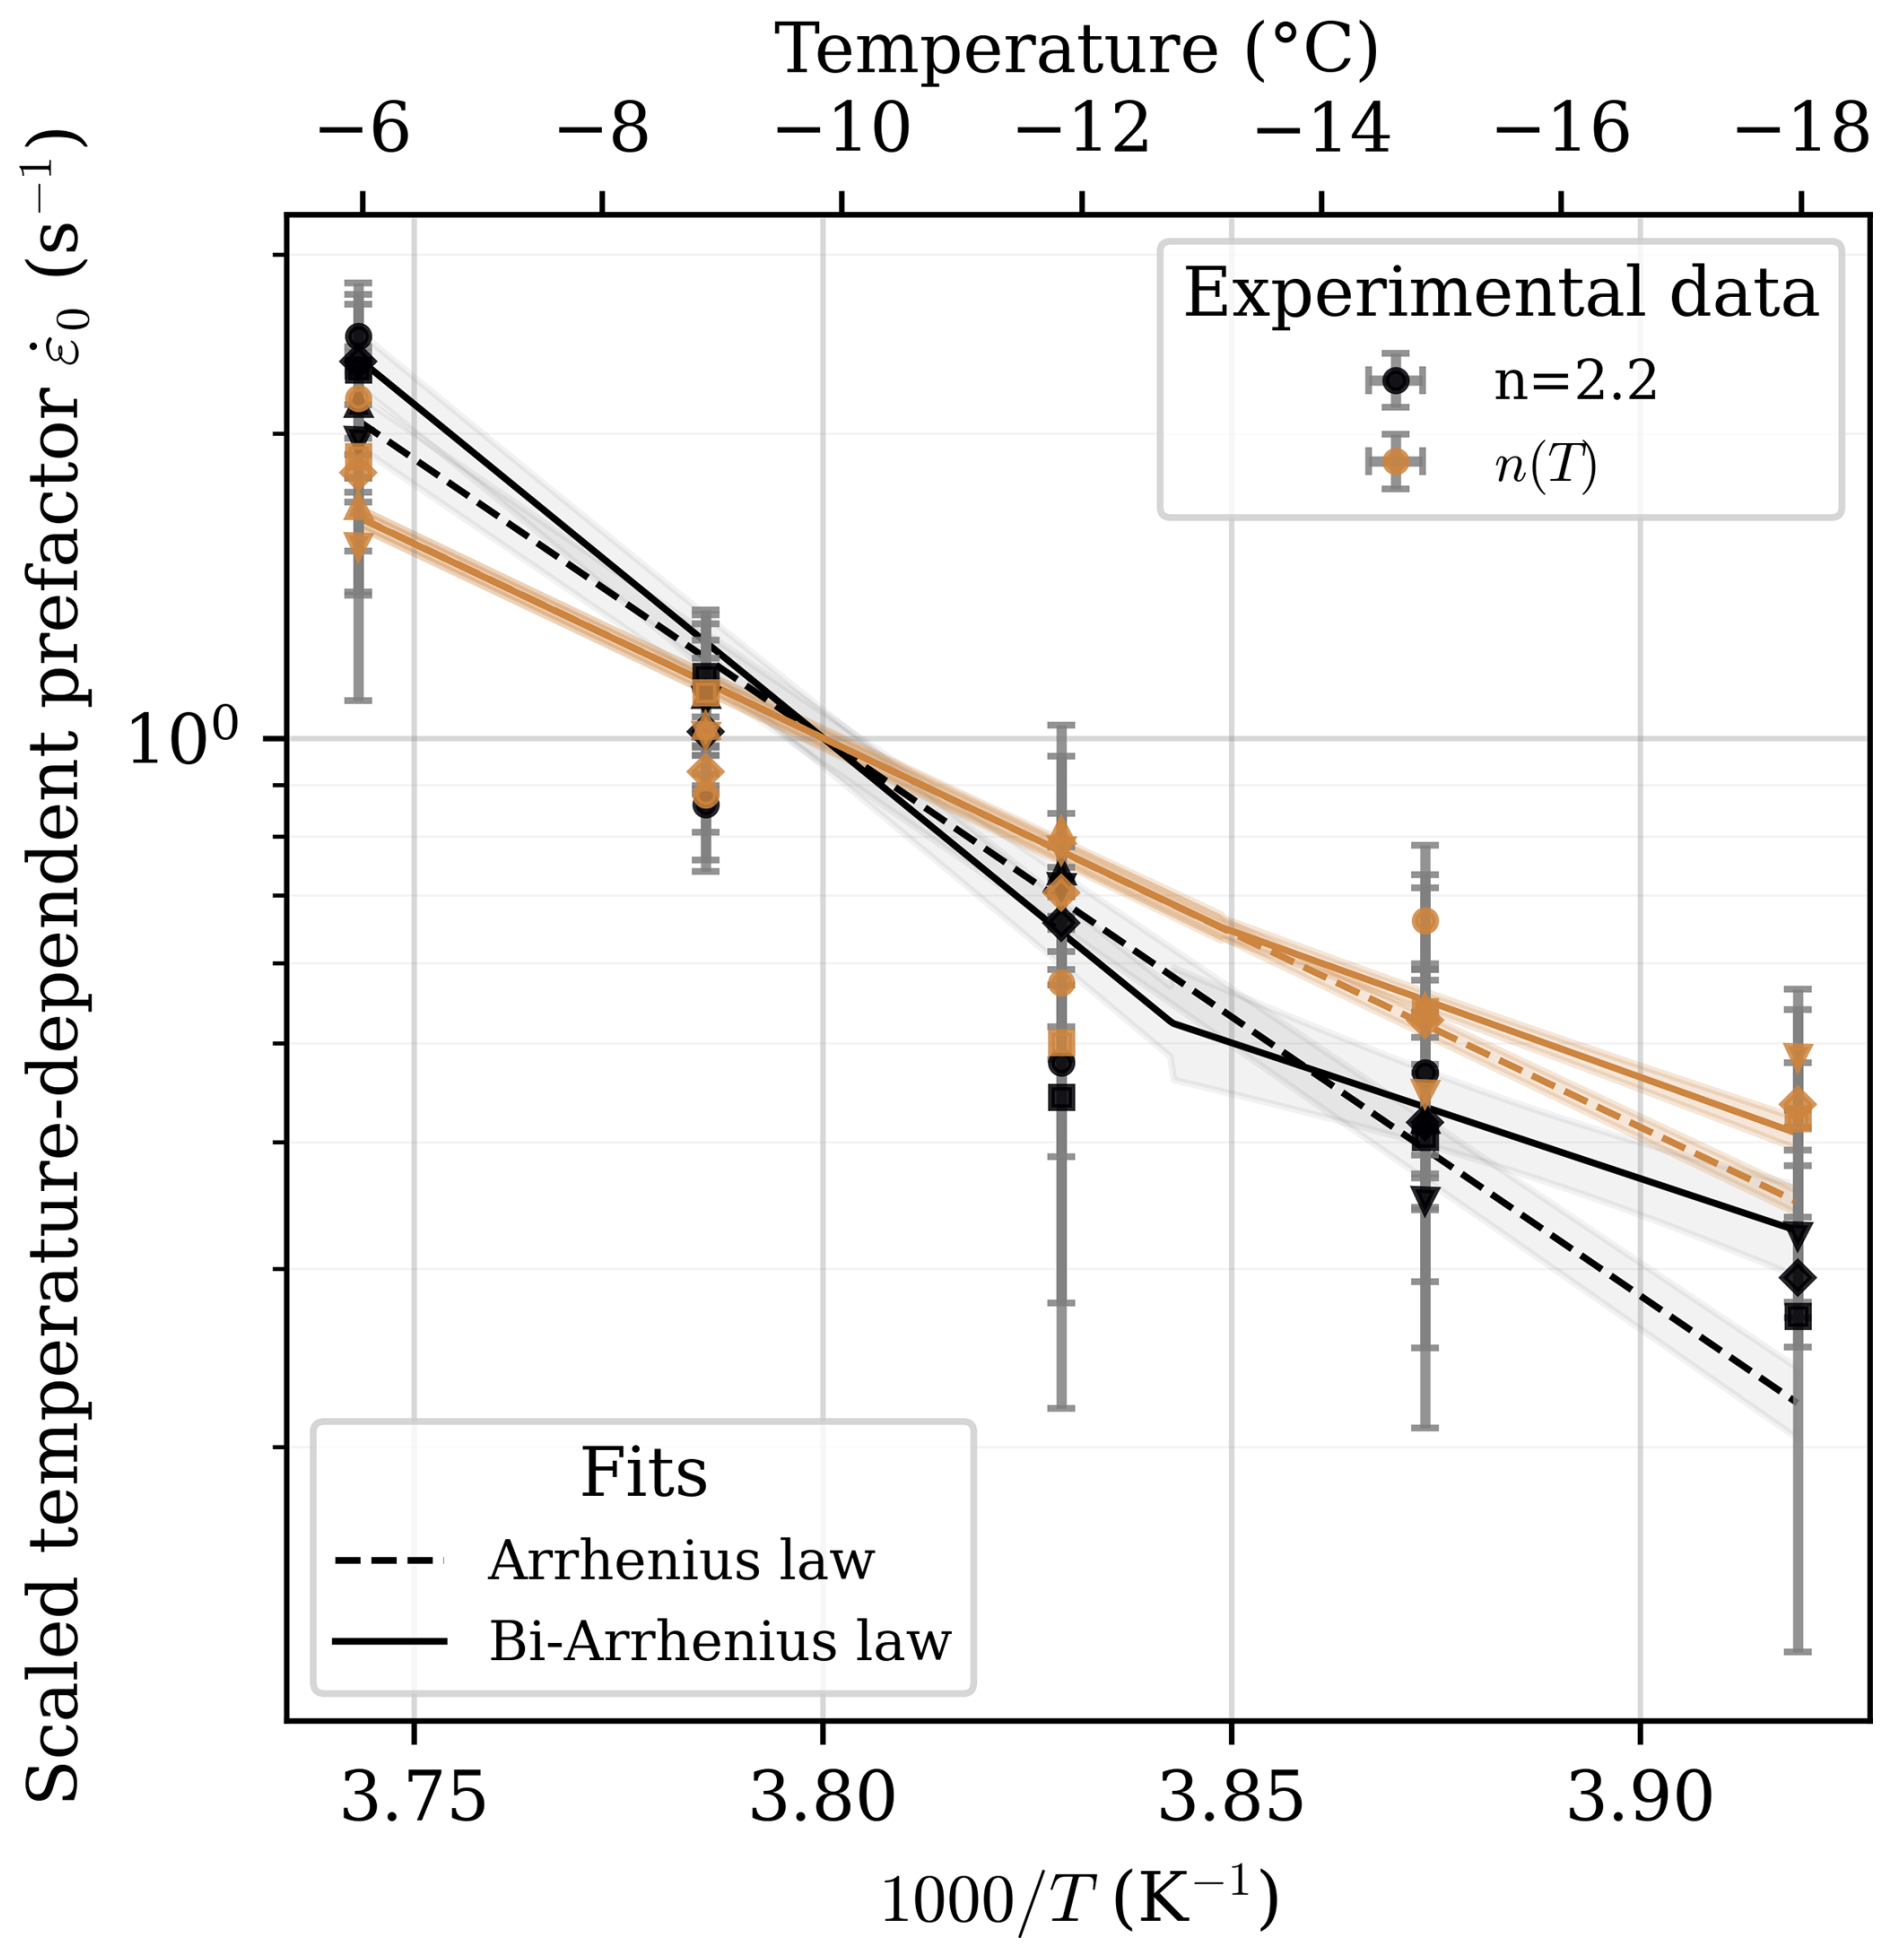
Figure A3Scaled strain rate prefactor as a function of inverse temperature for all studied samples considering a constant stress exponent and the stress exponent temperature sensitivity proposed by Jones and Brunet (1978).
A3 Temporal evolution of the strain rate prefactor
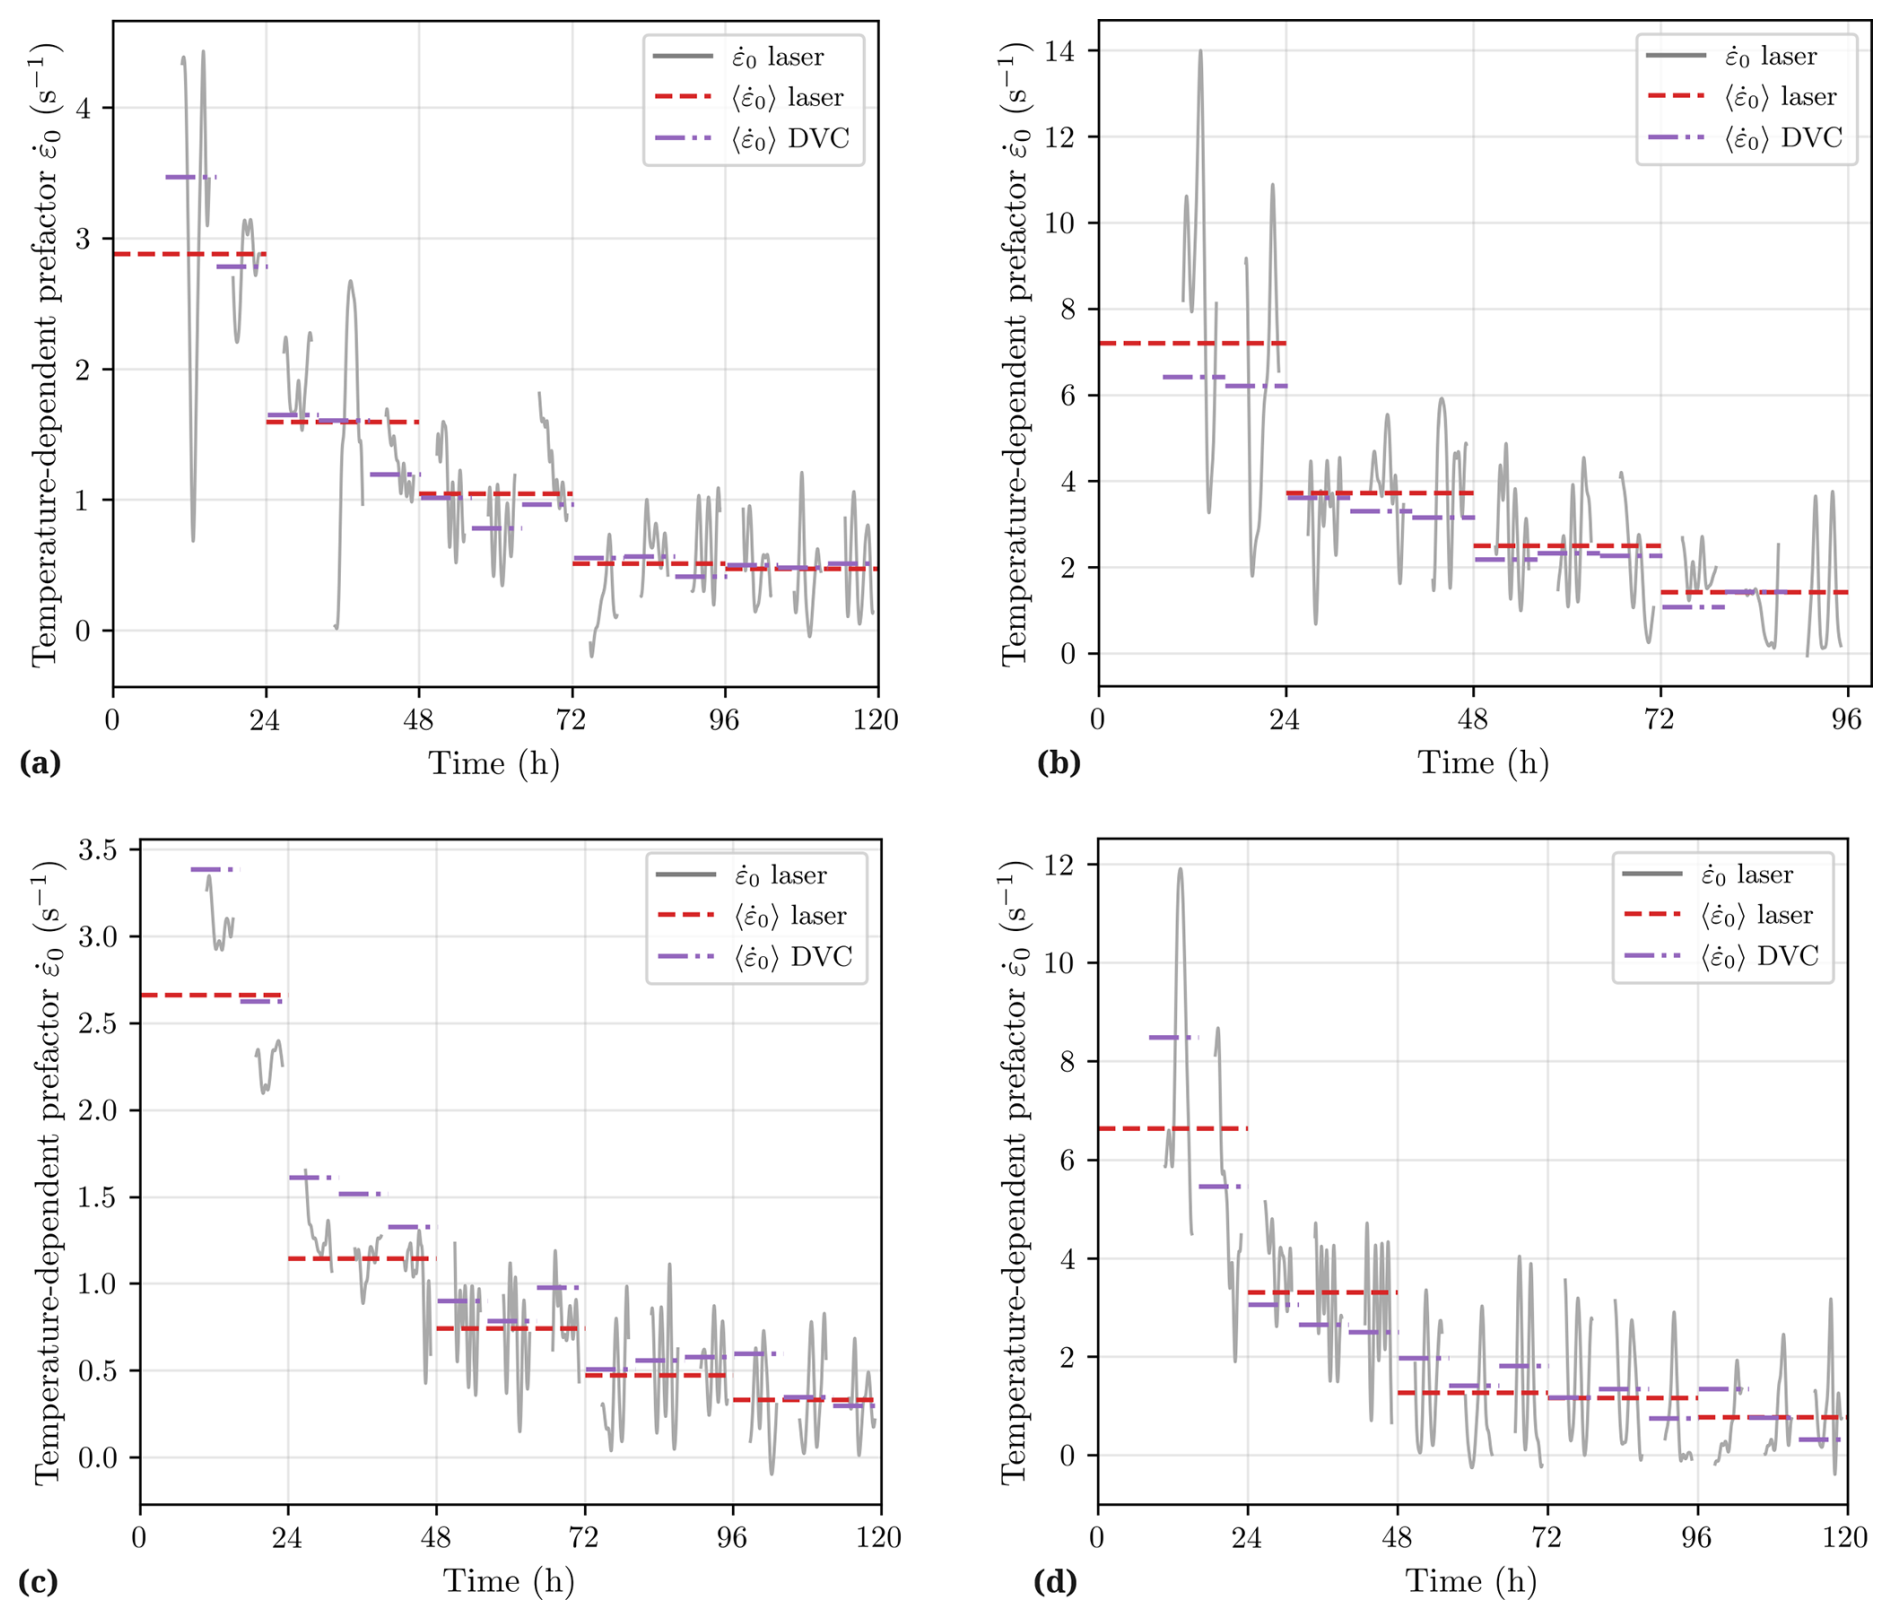
Figure A4Temporal evolution of the strain rate prefactor , computed from laser displacement measurements and DVC. (a) Sample 2, (b) Sample 3, (b) Sample 4, (d) Sample 5.
All measurements are available at https://doi.org/10.5281/zenodo.18824418 (Védrine et al., 2026), the tomographic data are available on request.
Videos of the compression experiments are available at https://doi.org/10.5281/zenodo.18824418 (Védrine et al., 2026).
BL, LV and PH developed the thermo-mechanical cell “CellCold”. MarB, MatB, LV and BL conducted the experiments and the data processing. LV and PH interpreted the results and wrote the paper with the input from all co-authors. PH and LV designed the study.
The contact author has declared that none of the authors has any competing interests.
Publisher's note: Copernicus Publications remains neutral with regard to jurisdictional claims made in the text, published maps, institutional affiliations, or any other geographical representation in this paper. The authors bear the ultimate responsibility for providing appropriate place names. Views expressed in the text are those of the authors and do not necessarily reflect the views of the publisher.
The authors would like to thank the whole Col de Porte team for their warm welcome. We thank K. Fourteau and O. Dick for fruitful discussions.
CEN is part of LabEx OSUG@2020 (ANR-15-IDEX-02). The tomography apparatus (TomoCold) was funded by INSU-LEFE, Labex OSUG (Investissements d’avenir – ANR10 LABX56) and CNRM. The laser sensor was funded by Région Auvergne-Rhône-Alpes under the CPER MECASNOW program.
This paper was edited by Sheng Fan and reviewed by Travis Hager and one anonymous referee.
Bader, H.: Der Schnee und seine Metamorphose, vol. 3, Kommissionsverlag Kummerly & Frey, Druck von Aschmann & Scheller AG, Zurich, 1939. a
Barnes, P., Tabor, D., and Walker, J. C. F.: The Friction and Creep of Polycrystalline Ice, P. Roy. Soc. Lond. A Mat., 324, 127–155, https://www.jstor.org/stable/77933, 1971. a, b
Barnett, T. P., Pierce, D. W., Hidalgo, H. G., Bonfils, C., Santer, B. D., Das, T., Bala, G., Wood, A. W., Nozawa, T., Mirin, A. A., Cayan, D. R., and Dettinger, M. D.: Human-Induced Changes in the Hydrology of the Western United States, Science, 319, 1080–1083, https://doi.org/10.1126/science.1152538, 2008. a
Barnola, J. M., Raynaud, D., Korotkevich, Y. S., and Lorius, C.: Vostok ice core provides 160 000-year record of atmospheric CO2, Nature, 329, 408–414, https://doi.org/10.1038/329408a0, 1987. a
Brun, E., David, P., Sudul, M., and Brunot, G.: A numerical model to simulate snow-cover stratigraphy for operational avalanche forecasting, J. Glaciol., 38, 13–22, https://doi.org/10.3189/S0022143000009552, 1992. a, b, c, d
Bucher, E.: Beitrag zu den theoretischen Grundlagen des Lawinenverbaus, PhD thesis, ETH Zürich, https://doi.org/10.3929/ethz-a-000103484, 1948. a
Budd, W. F. and Jacka, T. H.: A review of ice rheology for ice sheet modelling, Cold Reg. Sci. Technol., 16, 107–144, https://doi.org/10.1016/0165-232X(89)90014-1, 1989. a
DeBeer, C. M. and Pomeroy, J. W.: Influence of snowpack and melt energy heterogeneity on snow cover depletion and snowmelt runoff simulation in a cold mountain environment, J. Hydrol., 553, 199–213, https://doi.org/10.1016/j.jhydrol.2017.07.051, 2017. a
Delmas, L.: Influence of snow type and temperature on snow viscosity, J. Glaciol., 59, 87–92, https://doi.org/10.3189/2013JoG11J231, 2013. a, b, c, d
Dick, O., Calonne, N., Laurent, B., and Hagenmuller, P.: Monitoring dry snow metamorphism using 4D tomography across 20 experimental conditions, Earth Syst. Sci. Data, 18, 2875–2889, https://doi.org/10.5194/essd-18-2875-2026, 2026. a
Glen, J. W.: The Creep of Polycrystalline Ice, P. Roy. Soc. Lond. A Mat., 228, 519–538, https://doi.org/10.1098/rspa.1955.0066, aDS Bibcode: 1955RSPSA.228..519G, 1955. a, b, c, d, e
Hagenmuller, P., Chambon, G., Lesaffre, B., Flin, F., and Naaim, M.: Energy-based binary segmentation of snow microtomographic images, J. Glaciol., 59, 859–873, https://doi.org/10.3189/2013JoG13J035, 2013. a
Hagenmuller, P., Matzl, M., Chambon, G., and Schneebeli, M.: Sensitivity of snow density and specific surface area measured by microtomography to different image processing algorithms, The Cryosphere, 10, 1039–1054, https://doi.org/10.5194/tc-10-1039-2016, 2016. a
Horlings, B. I., Courville, Z., Murdza, A., and Keegan, K. M.: Applicability of two-phase modeling with compression experiments for snow compaction dynamics, Cold Reg. Sci. Technol., 229, 104336, https://doi.org/10.1016/j.coldregions.2024.104336, 2025. a
Jacka, T. H. and Maccagnan, M.: Ice crystallographic and strain rate changes with strain in compression and extension, Cold Reg. Sci. Technol., 8, 269–286, https://doi.org/10.1016/0165-232X(84)90058-2, 1984. a, b
Jones, S. J. and Brunet, J.-G.: Deformation of Ice Single Crystals Close to the Melting Point, J. Glaciol., 21, 445–455, https://doi.org/10.3189/S0022143000033608, 1978. a, b, c, d, e
Kirchner, H. K., Michot, G., Narita, H., and Suzuki, T.: Snow as a foam of ice: Plasticity, fracture and the brittle-to-ductile transition, Philos. Mag. A, 81, 2161–2181, https://doi.org/10.1080/01418610108217141, 2001. a, b, c, d, e
Kojima, K.: A field experiment on the rate of densification of natural snow layers under low stresses, in: Snow Mechanics Symposium, International Conference on Low Temperature Science, I. Conference on Physics of Snow and Ice, II. Conference on Cryobiology, 14–19 August 1966, Sapporo, Japan, https://cir.nii.ac.jp/crid/1570854175146603264 (last access: 13 September 2026), 1975. a, b, c
Lehning, M., Bartelt, P., Brown, B., Fierz, C., and Satyawali, P.: A physical SNOWPACK model for the Swiss avalanche warning: Part II. Snow microstructure, Cold Reg. Sci. Technol., 35, 147–167, https://doi.org/10.1016/S0165-232X(02)00073-3, 2002. a, b
Lejeune, Y., Dumont, M., Panel, J.-M., Lafaysse, M., Lapalus, P., Le Gac, E., Lesaffre, B., and Morin, S.: 57 years (1960–2017) of snow and meteorological observations from a mid-altitude mountain site (Col de Porte, France, 1325 m of altitude), Earth Syst. Sci. Data, 11, 71–88, https://doi.org/10.5194/essd-11-71-2019, 2019. a
Li, Y., Keegan, K., and Baker, I.: Observations of creep of polar firn at different temperatures, The Cryosphere, 20, 981–1000, https://doi.org/10.5194/tc-20-981-2026, 2026. a, b, c, d
Mellor, M. and Smith, J. H.: Strength studies of snow, 168, US Army Materiel Command, Cold Regions Research & Engineering Laboratory, https://books.google.fr/books?hl=fr&lr=&id=lTsMi8AP41gC&oi=fnd&pg=PR4&dq=strength+studies+of+snow+mellor&ots=t_dg-csgQw&sig=OXLUv79KJUoYW5Wce76AXTDSKNc (last access: 8 October 2026), 1966. a
Mellor, M. and Testa, R.: Creep of Ice under Low Stress, J. Glaciol., 8, 147–152, https://doi.org/10.3189/S0022143000020815, 1969a. a, b
Mellor, M. and Testa, R.: Effect of Temperature on the Creep of Ice, J. Glaciol., 8, 131–145, https://doi.org/10.3189/S0022143000020803, 1969b. a, b
Meyssonnier, J., Philip, A., Capolo, L., and Mansuy, P.: Experimental studies of the viscoplasticty of ice and snow, in: Mechanics of Natural Solids, edited by: Kolymbas, D. and Viggiani, G., Springer, Berlin, Heidelberg, 203–221, https://doi.org/10.1007/978-3-642-03578-4_9, 2009. a
Morgan, V. I.: High-temperature ice creep tests, Cold Reg. Sci. Technol., 19, 295–300, https://doi.org/10.1016/0165-232X(91)90044-H, 1991. a, b
Morin, S., Horton, S., Techel, F., Bavay, M., Coléou, C., Fierz, C., Gobiet, A., Hagenmuller, P., Lafaysse, M., Ližar, M., Mitterer, C., Monti, F., Müller, K., Olefs, M., Snook, J. S., van Herwijnen, A., and Vionnet, V.: Application of physical snowpack models in support of operational avalanche hazard forecasting: A status report on current implementations and prospects for the future, Cold Reg. Sci. Technol., 170, 102910, https://doi.org/10.1016/j.coldregions.2019.102910, 2020. a
Morris, E. M. and Wingham, D. J.: Densification of polar snow: Measurements, modeling, and implications for altimetry, J. Geophys. Res.-Earth, 119, 349–365, https://doi.org/10.1002/2013JF002898, 2014. a
Okada, Y., Hondoh, T., and Mae, S.: Basal glide of dislocations in ice observed by synchrotron radiation topography, Philos. Mag. A, 79, 2853–2868, https://doi.org/10.1080/01418619908212028, 1999. a
Quéno, L., Vionnet, V., Dombrowski-Etchevers, I., Lafaysse, M., Dumont, M., and Karbou, F.: Snowpack modelling in the Pyrenees driven by kilometric-resolution meteorological forecasts, The Cryosphere, 10, 1571–1589, https://doi.org/10.5194/tc-10-1571-2016, 2016. a
Ramseier, R. O.: Growth and mechanical properties of river and lake ice, PhD Thesis, éditeur non identifié, l'Université Laval (Québec, Canada), 1975. a
Scapozza, C. and Bartelt, P. A.: The influence of temperature on the small-strain viscous deformation mechanics of snow: a comparison with polycrystalline ice, Ann. Glaciol., 37, 90–96, https://doi.org/10.3189/172756403781815410, 2003. a, b, c, d, e, f, g, h
Schleef, S., Löwe, H., and Schneebeli, M.: Hot-pressure sintering of low-density snow analyzed by X-ray microtomography and in situ microcompression, Acta Mater., 71, 185–194, https://doi.org/10.1016/j.actamat.2014.03.004, 2014a. a, b
Schleef, S., Löwe, H., and Schneebeli, M.: Influence of stress, temperature and crystal morphology on isothermal densification and specific surface area decrease of new snow, The Cryosphere, 8, 1825–1838, https://doi.org/10.5194/tc-8-1825-2014, 2014b. a, b, c, d
Simson, A., Löwe, H., and Kowalski, J.: Elements of future snowpack modeling – Part 2: A modular and extendable Eulerian–Lagrangian numerical scheme for coupled transport, phase changes and settling processes, The Cryosphere, 15, 5423–5445, https://doi.org/10.5194/tc-15-5423-2021, 2021. a
Spitzig, W. A. and Keh, A. S.: Orientation dependence of the strain-rate sensitivity and thermally activated flow in iron single crystals, Acta Metall. Mater, 18, 1021–1033, https://doi.org/10.1016/0001-6160(70)90058-1, 1970. a
Stamati, O., Andò, E., Roubin, E., Cailletaud, R., Wiebicke, M., Pinzon, G., Couture, C., Hurley, R., Caulk, R., Caillerie, D., Matsushima, T., Bésuelle, P., Bertoni, F., Arnaud, T., Laborin, A., Rorato, R., Sun, Y., Tengattini, A., Okubadejo, O., Colliat, J.-B., Saadatfar, M., Garcia, F., Papazoglou, C., Vego, I., Brisard, S., Dijkstra, J., and Birmpilis, G.: spam: Software for Practical Analysis of Materials, Journal of Open Source Software, 5, 2286, https://doi.org/10.21105/joss.02286, 2020. a
Steinemann, S.: Results of Preliminary Experiments on the Plasticity of Ice Crystals, J. Glaciol., 2, 404–416, https://doi.org/10.3189/002214354793702533, 1954. a, b
Vionnet, V., Brun, E., Morin, S., Boone, A., Faroux, S., Le Moigne, P., Martin, E., and Willemet, J.-M.: The detailed snowpack scheme Crocus and its implementation in SURFEX v7.2, Geosci. Model Dev., 5, 773–791, https://doi.org/10.5194/gmd-5-773-2012, 2012. a
Védrine, L. and Hagenmuller, P.: Revisiting snow settlement with microstructural knowledge, The Cryosphere, 20, 1257–1277, https://doi.org/10.5194/tc-20-1257-2026, 2026. a, b, c, d, e, f
Védrine, L., Hagenmuller, P., Gélébart, L., Montagnat, M., and Bernard, A.: Role of Ice Mechanics on Snow Viscoplasticity, Geophys. Res. Lett., 51, e2023GL107676, https://doi.org/10.1029/2023GL107676, 2024. a, b, c
Védrine, L., Hagenmuller, P., Gélébart, L., Montagnat, M., and Löwe, H.: Sensitivity of the viscoplasticity of polycrystals to porosity and pore-to-crystal size ratio, Acta Mater., 301, 121507, https://doi.org/10.1016/j.actamat.2025.121507, 2025. a
Védrine, L., Brun, M., Bozon, M., Laurent, B., and Hagenmuller, P.: Dataset for: Sensitivity of snow viscoplasticity to temperature: evidence from controlled creep experiments, Zenodo [data set and video], https://doi.org/10.5281/zenodo.18824419, 2026. a, b
Wiese, M. and Schneebeli, M.: Snowbreeder 5: a Micro-CT device for measuring the snow-microstructure evolution under the simultaneous influence of a temperature gradient and compaction, J. Glaciol., 63, 355–360, https://doi.org/10.1017/jog.2016.143, 2017. a
Wollgramm, P., Bürger, D., Parsa, A. B., Neuking, K., and Eggeler, G.: The effect of stress, temperature and loading direction on the creep behaviour of Ni-base single crystal superalloy miniature tensile specimens, Mater. High Temp., 33, 346–360, https://doi.org/10.1080/09603409.2016.1186414, 2016. a
Yosida, Z.: Physical studies on deposited snow thermal properties, Contributions from the Institute of Low Temperature Science A, 7, 19–74, https://cir.nii.ac.jp/crid/1570009749325699456, 1955. a, b, c, d, e
Note that, due to a technical issue, samples 1 and 3 do not include a temperature step at −18 °C.