
the Creative Commons Attribution 4.0 License.
the Creative Commons Attribution 4.0 License.
 | 07 Oct 2026
Temperature dependence of grain size in Tibetan ice core
Zhengqiang He
Baiqing Xu

Grain size in ice cores can not only reflect the glacial strain processes but also be linked to climate change. However, the variation of grain size along ice cores in mountain glaciers remains largely unexplored. Here, we continuously measured the ice grain areas along two deep ice cores drilled from the Tibetan Plateau, and found that the two ice cores exhibit vertical grain area differentiation at the hundred-meter scale, analogous to polar ice-core profiles. Relatively higher temperatures significantly accelerate grain growth and result in larger grain areas. Refreezing under warm conditions gives rise to abrupt increases in grain area within melt-refrozen layers, whereas impurities result in abrupt decreases in grain area within impurity layers. Together, these two factors drive centimeter-scale fluctuations in grain area. Even so, we also found that grain area exhibits a significant correlation with δ18O in ice layers where Rotation Recrystallization (RRX)-induced refinement is negligible, indicating that the grain size of mountain glacier ice cores can retain temperature signals.
- Article
(11869 KB) - Full-text XML
- BibTeX
- EndNote


As a critical component of the Earth's climate system, glaciers not only dynamically feedback to global climate patterns but also enable systematic reconstruction of past glacial evolution and climatic history through the physical and chemical records in ice cores. Ice microstructure represents a key physical property widely studied in ice core research. Pioneering work on ice microstructure was first carried out by Perutz and Seligman (1939) on the Great Aletsch Glacier. Since then, systematic studies have been conducted on mountain glacier surface ice and deep polar ice cores (Rigsby, 1951, 1960; Kamb, 1959; Gow, 1969; Gow et al., 1997; Faria et al., 2014a). These studies show that grain size can reflect glacial strain processes (Gow and Williamson, 1976; Alley et al., 1986a, b; Hellmann et al., 2021) and retain signals of climate change. Specifically, grain size is smaller in ice layers dating to cold periods and larger in those from warm periods (Svensson et al., 2003; Durand et al., 2007; Fitzpatrick et al., 2014).
After decades of research, the polar ice core “three-stage model” has been widely adopted to describe grain size variation profiles and to clarify grain growth/recrystallization mechanisms (Alley et al., 1986a, b; Faria et al., 2014a). However, high-resolution studies have revealed limitations in this classic model, especially for short-scale ice crystal variations and multi-factor interactions, stimulating ongoing refinements and scientific debates (Kipfstuhl et al., 2006, 2009; Weikusat et al., 2009; Faria et al., 2014b; Kerch, 2016).
Compared with polar glaciers, ice crystal evolution is far more complex in mountain glaciers, which typically feature higher temperatures, greater accumulation rates, and faster flow velocities (Clavette, 2020; Hellmann et al., 2021; Jennings and Hambrey, 2021; Li et al., 2026). These characteristics drive rapid changes in crystal size and fabric, and even induce significant centimeter-scale fluctuations in ice microstructures (Tison and Hubbard, 2000; Kerch, 2016; Hellmann et al., 2021; Hruby et al., 2020; Monz et al., 2021; González-Santacruz et al., 2023).
The Tibetan Plateau constitutes the core of High Mountain Asia (HMA), widely recognized as the Third Pole, and hosts numerous typical mountain glaciers. These glaciers are particularly sensitive to climate change (Bolch et al., 2012; Yao et al., 2012; Sakai and Fujita, 2017). Diverse climatic and topographic conditions across the plateau (Nie et al., 2021) lead to distinct ice formation processes and different microstructural characteristics (Zhang et al., 1993; Li et al., 2017, 2026). However, systematic investigations of ice crystal evolution, recrystallization, and their responses to thermal conditions remain very limited in this region.
This study is thus based on two ice cores recovered using an electromechanical drill from the accumulation zones of mountain glaciers on the Tibetan Plateau: Animaqing (ANMQ) and Bugyai Kangri (BJGR) (Fig. 1a). Using a Microstructure Mapping system following established protocols (Kipfstuhl et al., 2006; Fegyveresi, 2015; Kerch, 2016), we successfully obtained continuous longitudinal microstructure images spanning from the firn to the base of both ice cores. We present the first continuous ice grain area profiles for mountain glacier ice cores. This dataset compensates for the centimeter-scale microstructural variations missed by traditional discrete sampling.
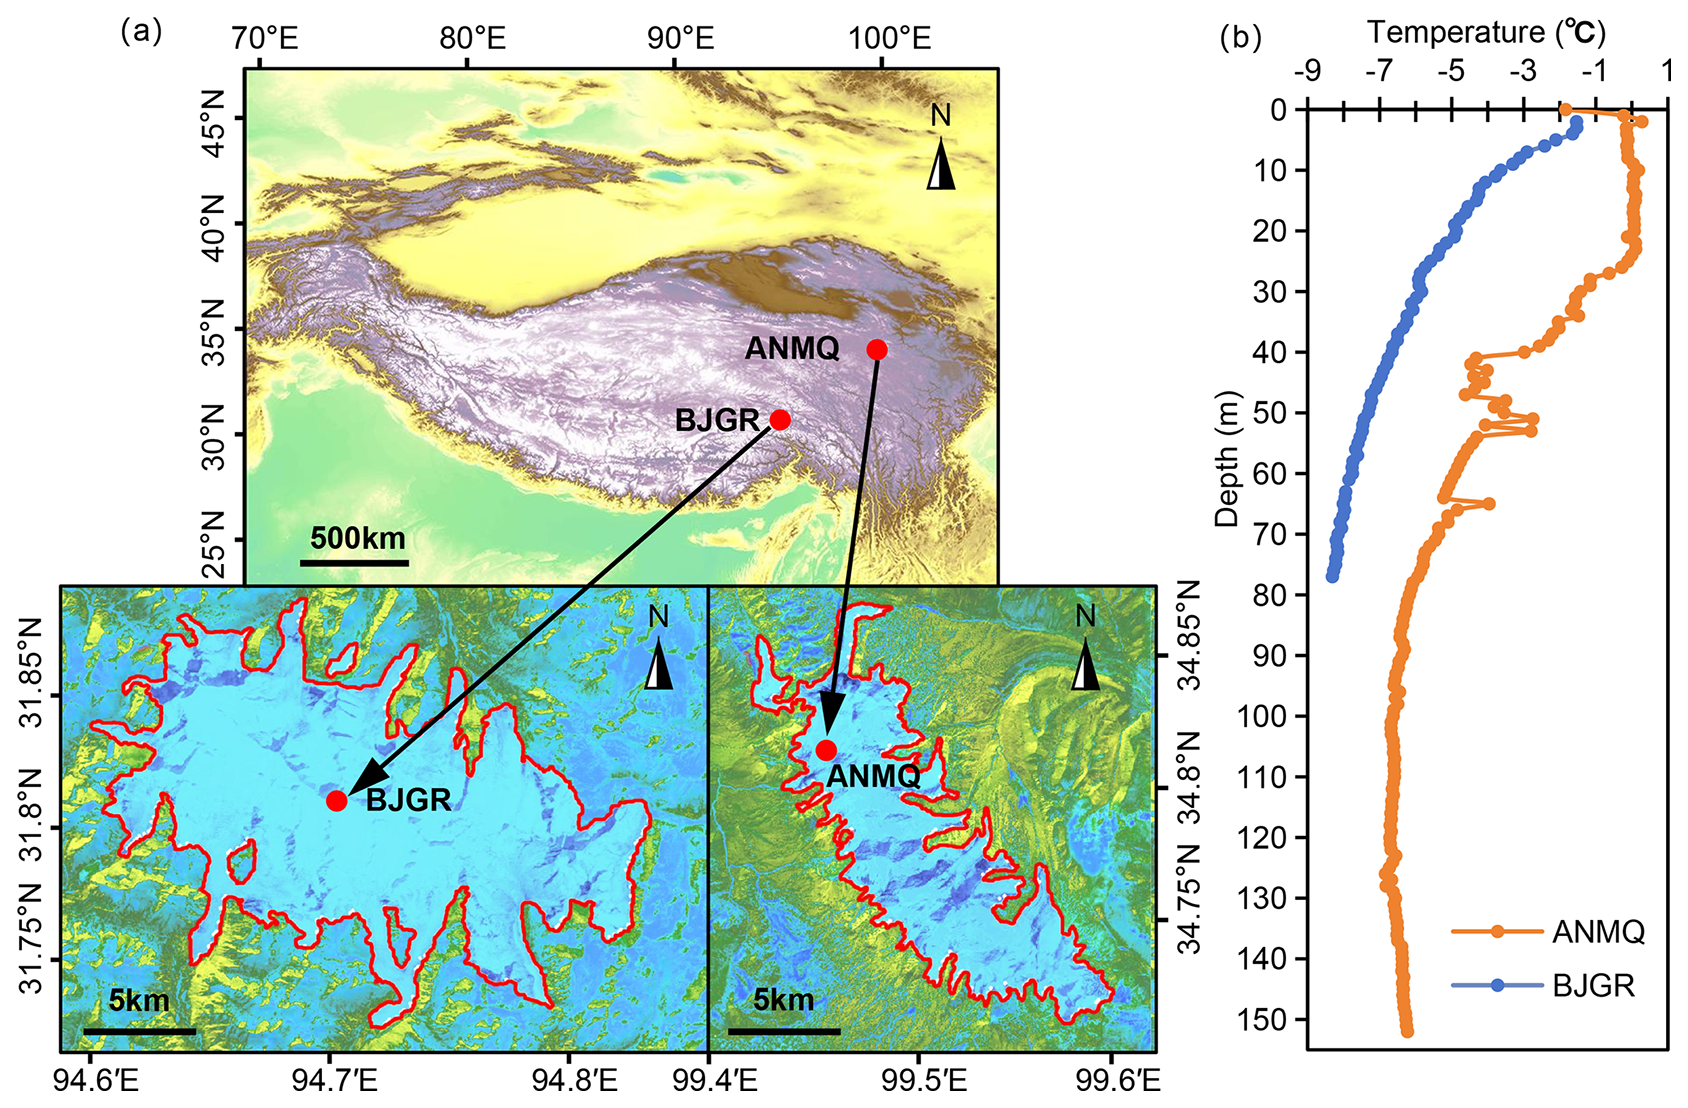
Figure 1(a) Drilling sites of the ANMQ and BJGR ice cores. The base map is derived from the NASA SRTM 30 m DEM data. The enlarged maps of the ANMQ and BJGR sites are based on Jilin-1 satellite imagery (Chang Guang Satellite Technology Co., Ltd.); (b) Borehole temperatures, measured using a 150 m resistance temperature sensor cable with an accuracy of ±0.02 °C. Temperatures below 150 m in the ANMQ ice core were not measured.
This study aims to address three key questions: (1) What are the vertical variations in grain size and recrystallization mechanisms in mountain glacier ice cores under high-temperature conditions? (2) How do impurities and refreezing processes affect centimeter-scale fluctuations? (3) Can grain size in mountain ice cores retain information about climate change? By providing new microscopic evidence, this study advances the fundamental understanding of grain size variation and recrystallization mechanisms in mountain glacier ice cores and offers a new perspective for exploring the responses of Tibetan Plateau mountain glaciers to climate change.
In November 2020, a full-depth ice core was drilled from the summit accumulation zone of the Weigeledangxiong Glacier, Mount Animaqing, eastern Kunlun Mountains (ANMQ: 169.45 m length, 9.4 cm diameter, 99.45° E, 34.81° N, 5750 m a.s.l.). This glacier has a total length of ∼10 km and an area of 12.53 km2, making it one of only three glaciers exceeding 10 km2 in the region (Liu et al., 2015). In November 2022, another full-depth ice core was drilled from the summit accumulation zone on the southern slope of Mount Bugyai Kangri, eastern Tanggula Mountains (BJGR: 77.6 m length, 8.2 cm diameter, 94.7094° E, 31.8118° N, 6180 m a.s.l.). This glacier stretches 10.6 km with an area of 22.27 km2. Climate in both regions is dominated by the Asian monsoon. The annual precipitation and average temperature near the ELA (BJGR: 5300–5400 m a.s.l., ANMQ: 4900–5190 m a.s.l.) are 600–700 mm and −6 °C for the BJGR region, and 700–900 mm and −9.4 °C for the ANMQ region (Liu et al., 2016; Jiang et al., 2018). Over recent decades, these two regions have experienced a significant warming trend, with precipitation showing a fluctuating increase and concentrated in summer. Both glaciers have been retreating in recent decades.
Ice core drilling was initiated from excavated snow pits at depths of 1.5 m (ANMQ) and 1.4 m (BJGR) using an electromechanical drill. The recovered ice cores were sealed in clean polyethylene bags, placed in insulated hard-core barrels, transported by refrigerated truck, and stored in the −20 °C ice core laboratory at the Institute of Tibetan Plateau Research, Chinese Academy of Sciences (ITPCAS). The density of each ice core section was calculated from its measured length, diameter, and mass in this laboratory. While the density of each ice slice was deduced using the formula: slice (Kerch, 2016). In Fig. A3b, we present the slice density profiles. The borehole temperatures were measured with a 152 m-long cable (Cable No. 16BX-XBQ-1A) equipped with 15 platinum RTD sensors at 1 m intervals, with a measurement accuracy of ±0.02 °C. At each depth, sensors were stabilized for at least 30 min to ensure thermal equilibrium between borehole air and the surrounding ice. Temperatures below 150 m were not measured in the ANMQ ice core. Based on the positive linear temperature trend from 130 m (−6.56 °C) to 152 m (−6.23 °C) (R2=0.93), the basal temperature at 170 m depth is estimated to be approximately −5.94 °C.
We prepared vertical ice slices following standard microtoming procedures (Fig. 2a; Kipfstuhl et al., 2006; Fegyveresi, 2015; Kerch, 2016). First, continuous ice slabs were cut longitudinally along the ice core using a band saw. These slabs were then cut into smaller pieces 6–10 cm in length, ∼4.5 cm in width, and ∼7 mm in thickness. For the BJGR ice core, sampling started at 22.30 m and continued downward to the base, yielding a total of 560 slices (covering 71 % of the total length). For the ANMQ ice core, sampling started at 14.94 m and continued downward to the base, yielding 1890 slices (covering 91 % of the total length). The upper firn section of both ice cores was not sampled, as they were too porous and unconsolidated to prepare thin sections. The slices were then frozen onto microtome glass plates using a ∼1 % ethanol solution, and were microtomed to a flat surface with a Leica SM2000R microtome (Fig. A1). Finally, the slices were placed in a lidded foam box and sublimated at −20 °C for approximately 15 h until their surfaces were smooth and grain boundaries were clearly visible.
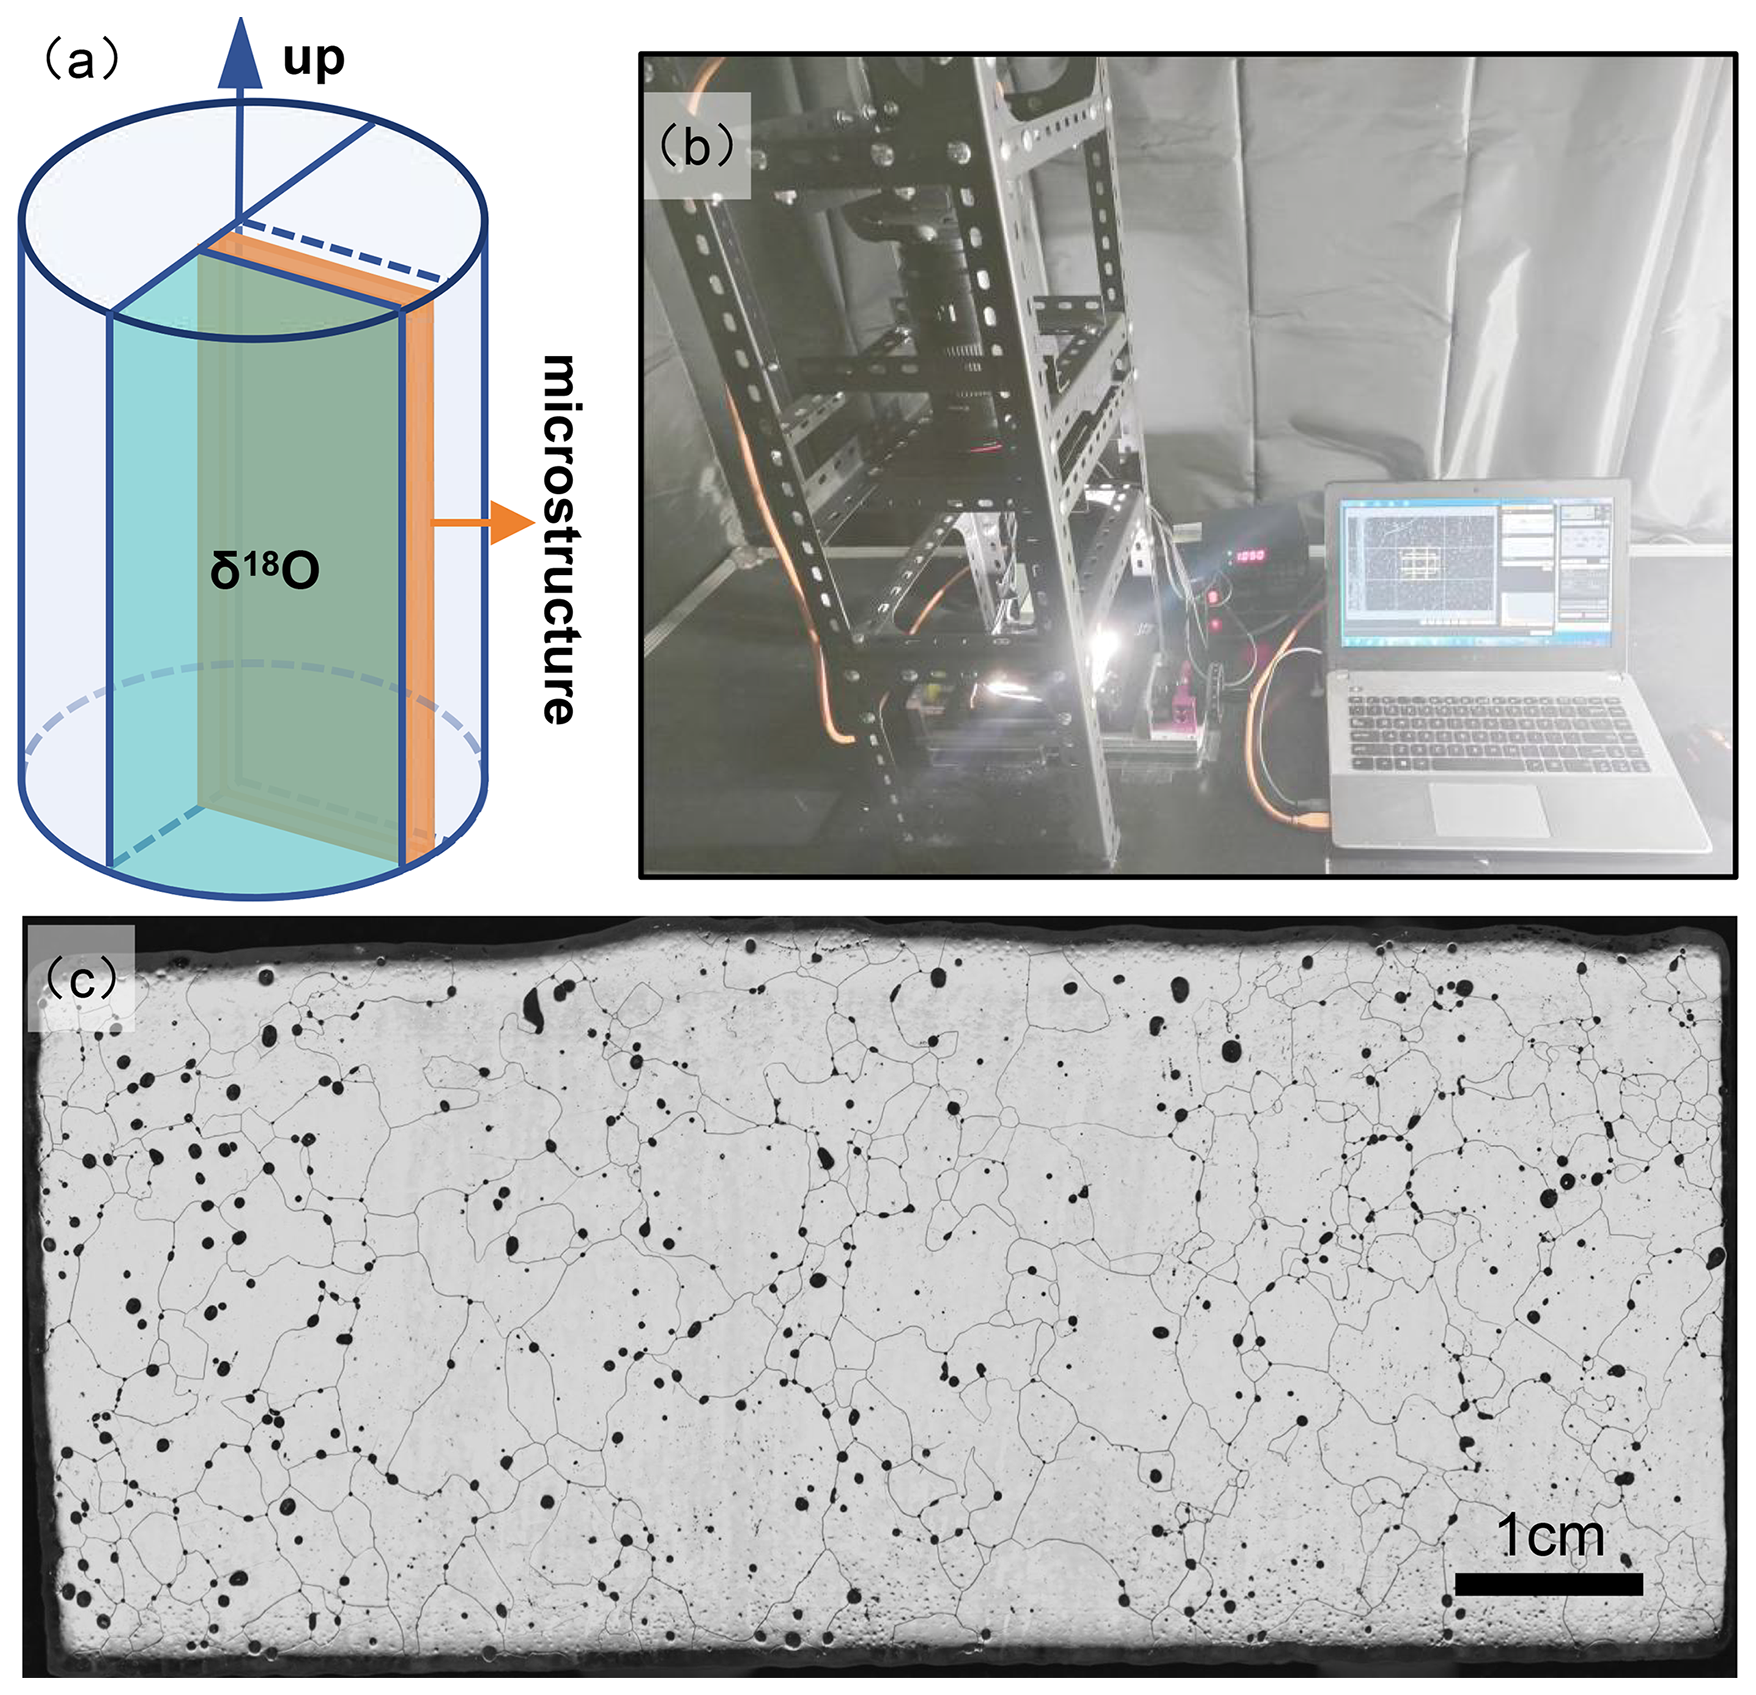
Figure 2(a) Schematic diagram of ice slice cutting; the orange section represents a slice with approximate dimensions: ; (b) Photograph of the microstructure mapping system; (c) Seamlessly stitched panoramic image of a slice, generated from 5 consecutive photos.
We used a Microstructure Mapping system to acquire microstructural images, following protocols described in previous studies (Fig. 2b; Kipfstuhl et al., 2006; Fegyveresi, 2015; Kerch, 2016). The system comprises an imaging module (a Canon EOS 5D Mark IV camera with an 180 mm macro lens), an illumination module (a vertical coaxial light and controller), and a manual x axis translation stage. Photographic parameters, autofocus, and image capture were controlled using Canon Camera Connect software.
Each ice slice was placed on a black sponge background and illuminated under vertical coaxial light. Under this lighting, air bubbles and grain boundaries appear dark, while subgrain boundaries appear gray. Each panoramic slice image, with a resolution of ∼8 µm per pixel, was automatically and seamlessly stitched from 5 consecutive photographs using the Photomerge function in Adobe Photoshop (Fig. 2c). The irregular edges of each panoramic slice image were cropped, and interfering features (e.g., scratches and cracks) were manually removed. Binary segmentation was performed using the U-Net neural network (Ronneberger et al., 2015), and grain boundary maps were generated using ImageJ software with its MorphoLibJ plugin (Fig. 2a–c; Legland et al., 2016). After scale calibration, grain and bubble areas, positions, and shapes were automatically extracted into a .CSV file using the Particle Analysis function in ImageJ. These results were then combined with depth data for statistical analysis. Grains with an area smaller than 0.04 mm2 and bubbles with an area smaller than 0.006 mm2 were excluded from the analysis (Fegyveresi, 2015; Kerch, 2016).
3.1 Grain area profile and recrystallization mechanism
Fresh snow crystals (∼1 mm2) evolve continuously with increasing depth and time, adapting to temperature and stress conditions via deformation and recrystallization (Gow, 1969). This evolutionary process can be characterized by microstructural images and grain size statistical data. In this study, we observed that the vertical profiles of grain area, porosity, and density in the ANMQ and BJGR ice cores exhibit hundred-meter-scale differentiation patterns analogous to polar ice cores profiles (Figs. 4 and A2; Faria et al., 2014a). Based on this observation – specifically, the firn density and inflection points in average grain area trends, together with the occurrence of impurity layers and abundant subgrain boundaries – we classified their grain area profiles into distinct layers and analyzed the dominant recrystallization mechanisms. These efforts aim to establish a foundational understanding of grain size variation in Tibetan Plateau mountain glacier ice cores.
3.1.1 Firn layer (ANMQ: 0–35 m; BJGR: 0–35 m)
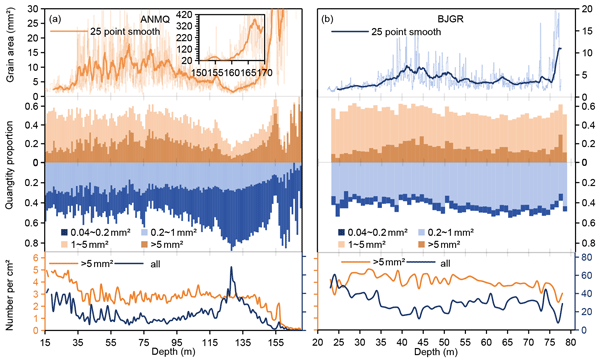
In this layer, as depth increases, numerous irregularly shaped unclosed pores are progressively compressed, leading to an increase in density. Both ice cores reached the critical density of 0.830 g cm−3 for pore closure at ∼35 m depth (Fig. A3b; Dadic et al., 2019). Based on these observations, we define the 0–35 m interval as the firn layer, with the boundary rounded to 35 m (34–36 m) for consistency between the two cores – a convention also adopted for the 45 m (44–46 m) boundary. The average grain area of both ice cores is less than 2 mm2 and increases slowly with depth (ANMQ: 1.96 ± 0.11–11.19 ± 2.65 mm2; BJGR: 1.32 ± 0.04–3.90 ± 0.43 mm2, mean ± SEM). For both ice cores, grains>1 mm2 and those ≤1 mm2 each account for ∼50 % of the total. Within the >1 mm2 fraction, grains >5 mm2 account for ∼10 % of all grains (Fig. 4).
3.1.2 Coarsening layer (ANMQ: 35–45 m; BJGR: 35–45 m)
In this layer, pores become isolated from the free atmosphere, with ∼10 % of the original air volume eventually trapped as enclosed bubbles and gradually compressed into ellipsoidal shapes (Schaller et al., 2017). The firn transforms into ice, and the average grain area of both ice cores increases rapidly with fluctuations (ANMQ: 11.19 ± 2.65–18.00 ± 5.52 mm2; BJGR: 3.90 ± 0.43–8.06 ± 1.16 mm2). The grain size becomes heterogeneous, and grain boundaries begin to curve. Based on these observations, we define the 35–45 m interval as the coarsening layer.
Notably, the firn layer and coarsening layer exhibit consistent evolutionary trends (these two layers are often classified as a single unit in polar ice core studies). The average grain area increases (ANMQ: 1.96 ± 0.11–18.00 ± 5.52 mm2; BJGR: 1.32 ± 0.04–8.06 ± 1.16 mm2) while the total grain number decreases (ANMQ: 47.64–11.58 cm−2; BJGR: 46.30–23.65 cm−2). The average grain area and proportion of grains >5 mm2 increase (ANMQ: 9.20 ± 0.65–39.63 ± 6.82 mm2, 11.5 %–25.4 %; BJGR: 6.81 ± 0.18–17.77 ± 1.66 mm2, 9.1 %–19.8 %, Figs. 4 and A3a). This indicates that grain growth primarily results from larger grains consuming smaller ones. The average grain area and proportion of small grains (≤1 mm2) remain relatively stable (Fig. 4), as they are continuously replenished by larger grains shrinking into this size class. Additionally, typical “foam” textures formed by Normal Grain Growth (NGG) are observable in microstructure images (Fig. 3d) (Svensson et al., 2005; Kipfstuhl et al., 2009).
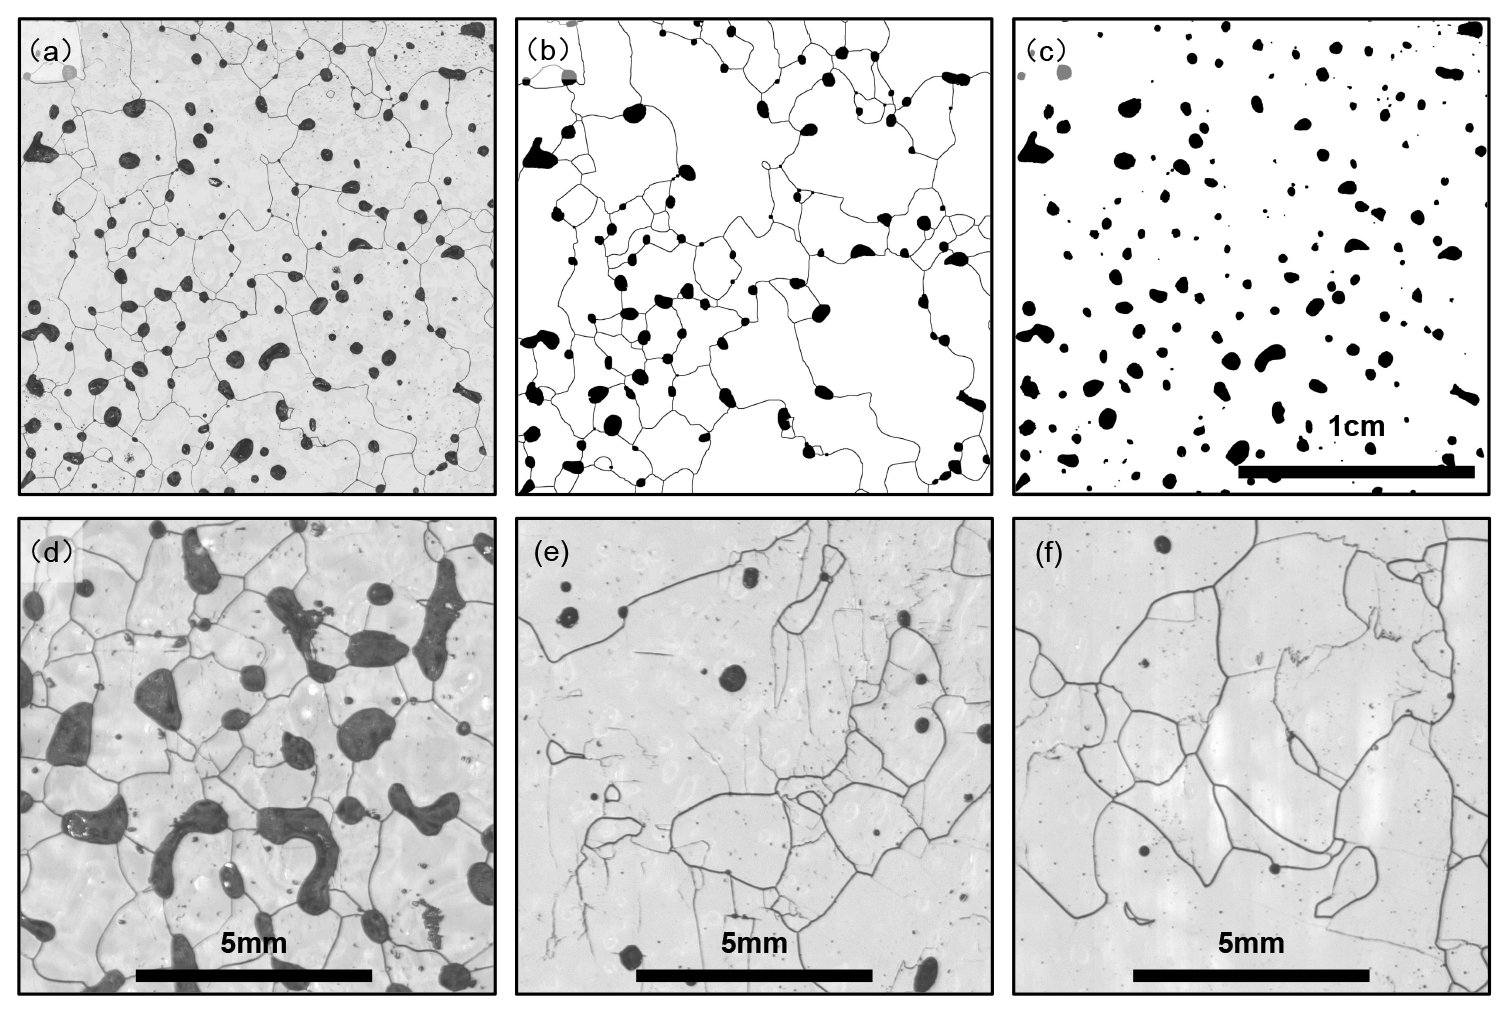
Figure 3Microstructural images and processed maps for ice core samples: (a) Raw micrograph from sample ANMQ T49B15; (b) Corresponding grain boundary map generated from panel (a); (c) Corresponding pore and bubble map generated from panel (a); (d–f) Independent microstructural images from three distinct sections of the BJGR ice core: (d) Straight grain boundaries and triple junctions within the firn layer (BJGR T38B3); (e) Abundant subgrain boundaries in the RRX layer (BJGR T93B5); (f) Coexisting subgrain boundaries and highly curved grain boundaries in the SIBM layer (BJGR T121B8).
These observations indicate that grain size in these two layers is significantly influenced by NGG, which is primarily regulated by temperature (Gow, 1969). Generally, higher temperatures tend to promote the formation of larger ice crystals (Cuffey and Paterson, 2010). Consistent with this relationship, the ANMQ ice core, with a temperature range of −0.22 to −4.09 °C (warmer than the BJGR core at −1.54 to −7.04 °C; Fig. 1b), exhibits a larger grain area compared to that of the BJGR core.
3.1.3 RRX layer (ANMQ: 45–140 m; BJGR: 45–73 m)
In this layer, the average grain area stabilizes and declines to below 5 mm2. Both the average grain area and proportions of grains >5 mm2 gradually decrease (ANMQ: 39.63 ± 6.82–24.60 ± 2.93 mm2, 25.4 %–14.6 %; BJGR: 17.77 ± 1.66–11.88 ± 0.86 mm2, 19.8 %–14.8 %, Figs. 4 and A3a), while the small-grain proportions and total grain number increase (ANMQ: 43.6 %–67.0 %, 11.58–19.1 cm−2; BJGR: 40.3 %–52.9 %, 23.65–44.56 cm−2, Fig. 4). In microstructure images, abundant subgrain boundaries are observed (Fig. 3e). This indicates that the average grain area decline primarily results from large grains splitting into smaller ones. Based on these observations – inflection points in grain-area trends and impurity-layer distributions – we define these intervals as the RRX layer.
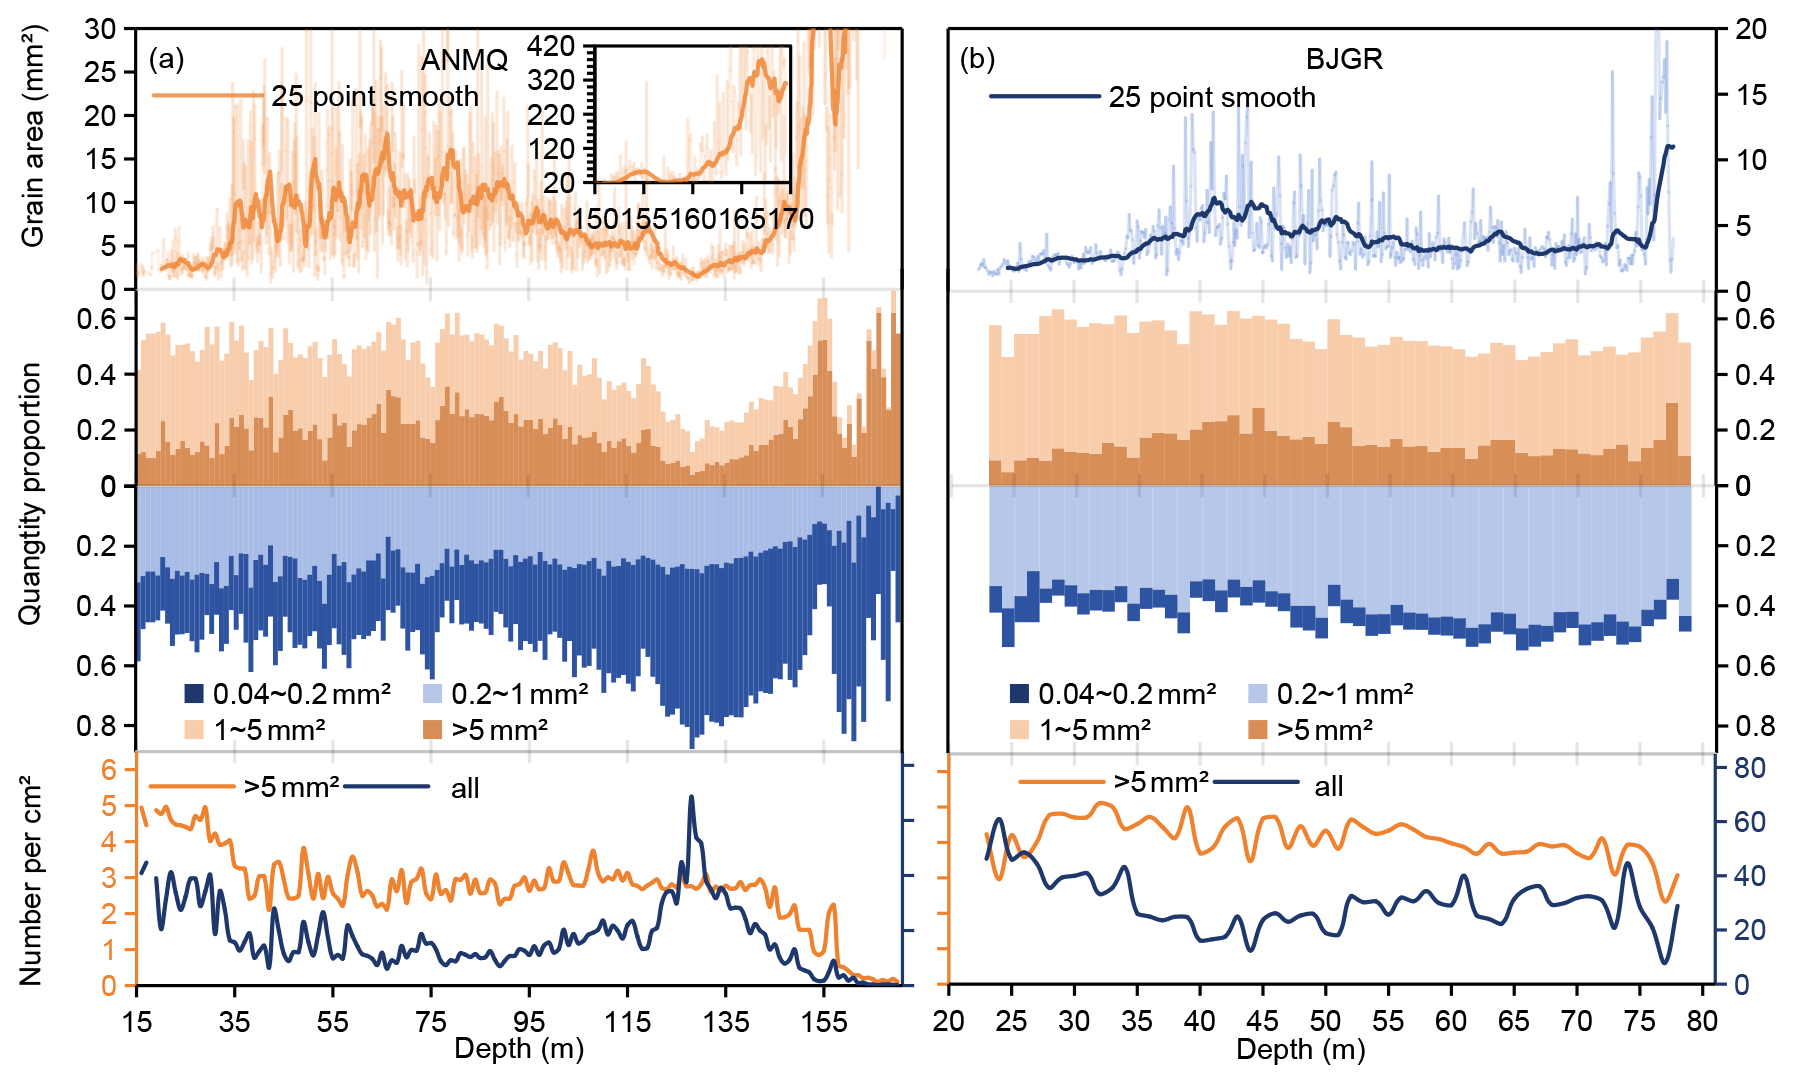
Figure 4Profiles of average grain area and proportion of grain quantities across different size ranges: (a) For the ANMQ ice core; the inset depicts rapid grain growth, with the grain area reaching ∼400 mm2 near the base of the core; (b) For the BJGR ice core. The thin lines represent original data, while bold lines represent 25 point smoothed data. The number of grains in different size grades was statistically analyzed on a per meter basis.
These observations indicate that this layer is primarily influenced by RRX. Under stress conditions, subgrain boundaries form inside grains and gradually develop into grain boundaries, splitting large grains into smaller ones (Kipfstuhl et al., 2009; Weikusat et al., 2009, 2017). This stress-induced grain refinement restricts the growth of large grains (Duval and Castelnau, 1995). Grain size in the RRX layer thus represents a dynamic balance between stress-driven refinement and temperature-driven growth, consistent with previous polar ice core studies (Alley et al., 1986a, b; Faria et al., 2014a, b; Weikusat et al., 2017). Notably, even under greater vertical stress, the average grain area in the deeper, warmer section of the ANMQ (−4.09 to −6.37 °C) remains larger than that in the shallower, colder section of the BJGR (−7.04 to −8.17 °C). For instance, at ANMQ 100 m (−6.63 °C), the grain area is 11.68 ± 2.24 mm2, whereas at BJGR 70 m (−8.15 °C) – despite lower stress – it is only 3.73 ± 0.30 mm2. This contrast suggests that higher temperatures enhance grain growth, yielding a larger equilibrium grain size, and temperature exerts a more dominant control on grain size than stress in this comparison (Gow, 1969; Cuffey and Paterson, 2010; Montagnat et al., 2014).
3.1.4 SIBM layer (ANMQ: 140–169.5 m; BJGR: 73–77.6 m)
This layer is located at the bottom of the ice core. The average grain area increases rapidly with drastic fluctuations. The growth rate of grains >5 mm2 is approximately 10 times higher than that in the coarsening layer (Fig. A4), with their proportion rising rapidly (Fig. 4). In microstructure images, large grains exhibit interlocked structures, accompanied by the connection between subgrain boundaries and highly curved grain boundaries (Fig. 3f). These observations are consistent with rapid grain boundary migration dominated by Strain-Induced Boundary Migration (SIBM), which tends to occur when ice temperatures are above −10 °C (Duval and Castelnau, 1995; Faria et al., 2014b). The basal temperatures of both ice cores satisfy this criterion (BJGR: −8.31– −8.17 °C, ANMQ °C). Based on these observations, we define these intervals as the SIBM layer.
Notably, in the ANMQ ice core, ice temperature reaches its minimum of −6.84 °C at 126 m depth, where grain area is also minimized <5 mm2. Below 126 m, the temperature trend reverses from decreasing with depth to increasing, and grain size increases accordingly. Below 150 m ( °C), grains grow rapidly, accompanied by abnormally large grains (>400 mm2) and a 5 m-thick basal bubble-free ice layer. However, some oversized grains frequently extend beyond the sample boundaries, preventing the acquisition of reliable grain-area data (Fig. A6). These observations indicate that increasing basal temperature also influences grain size in this SIBM layer.
3.2 Temperature, melt-refreezing, and impurity effects on grain size
The above results indicate that temperature influences grain size by regulating recrystallization across all layers. Furthermore, temperature differences have also contributed to variations in ice formation processes between the two ice cores.
The BJGR ice core, with relatively lower temperatures, exhibits lower firn density and smaller grain size. Firn density and grain area increase gradually and steadily with minimal fluctuations, and melt-refrozen ice is rarely observed, consistent with the typical Cold-type Ice Genesis (i.e., ice formation without meltwater involvement; Gow, 1969; Cuffey and Paterson, 2010; Kerch, 2016). Before pore closure, the higher surface energy of smaller grains tends to drive sublimation, some water molecules condense on larger grains with lower surface energy, while others diffuse into the free atmosphere. After pore closure, large grains grow rapidly by consuming smaller ones.
The ANMQ ice core, with relatively higher temperatures and surface temperature approaching 0 °C, contains numerous centimeter-scale melt-refrozen ice layers in its firn layer (Fig. 5a). Firn density and grain area exhibit substantial fluctuations, consistent with typical Warm-type Ice Genesis (i.e., ice formation involving meltwater percolation; Gow, 1969; Cuffey and Paterson, 2010; Kerch, 2016). Meltwater percolation and liquid-mediated recrystallization drive accelerated densification and larger grain size (Wilson et al., 2023), with both the average grain area and growth rate exceeding those of BJGR. Additionally, these high-temperature-induced melt-refrozen ice layers lead to abrupt increases in average grain area and serve as a critical factor driving centimeter-scale average grain area fluctuations.
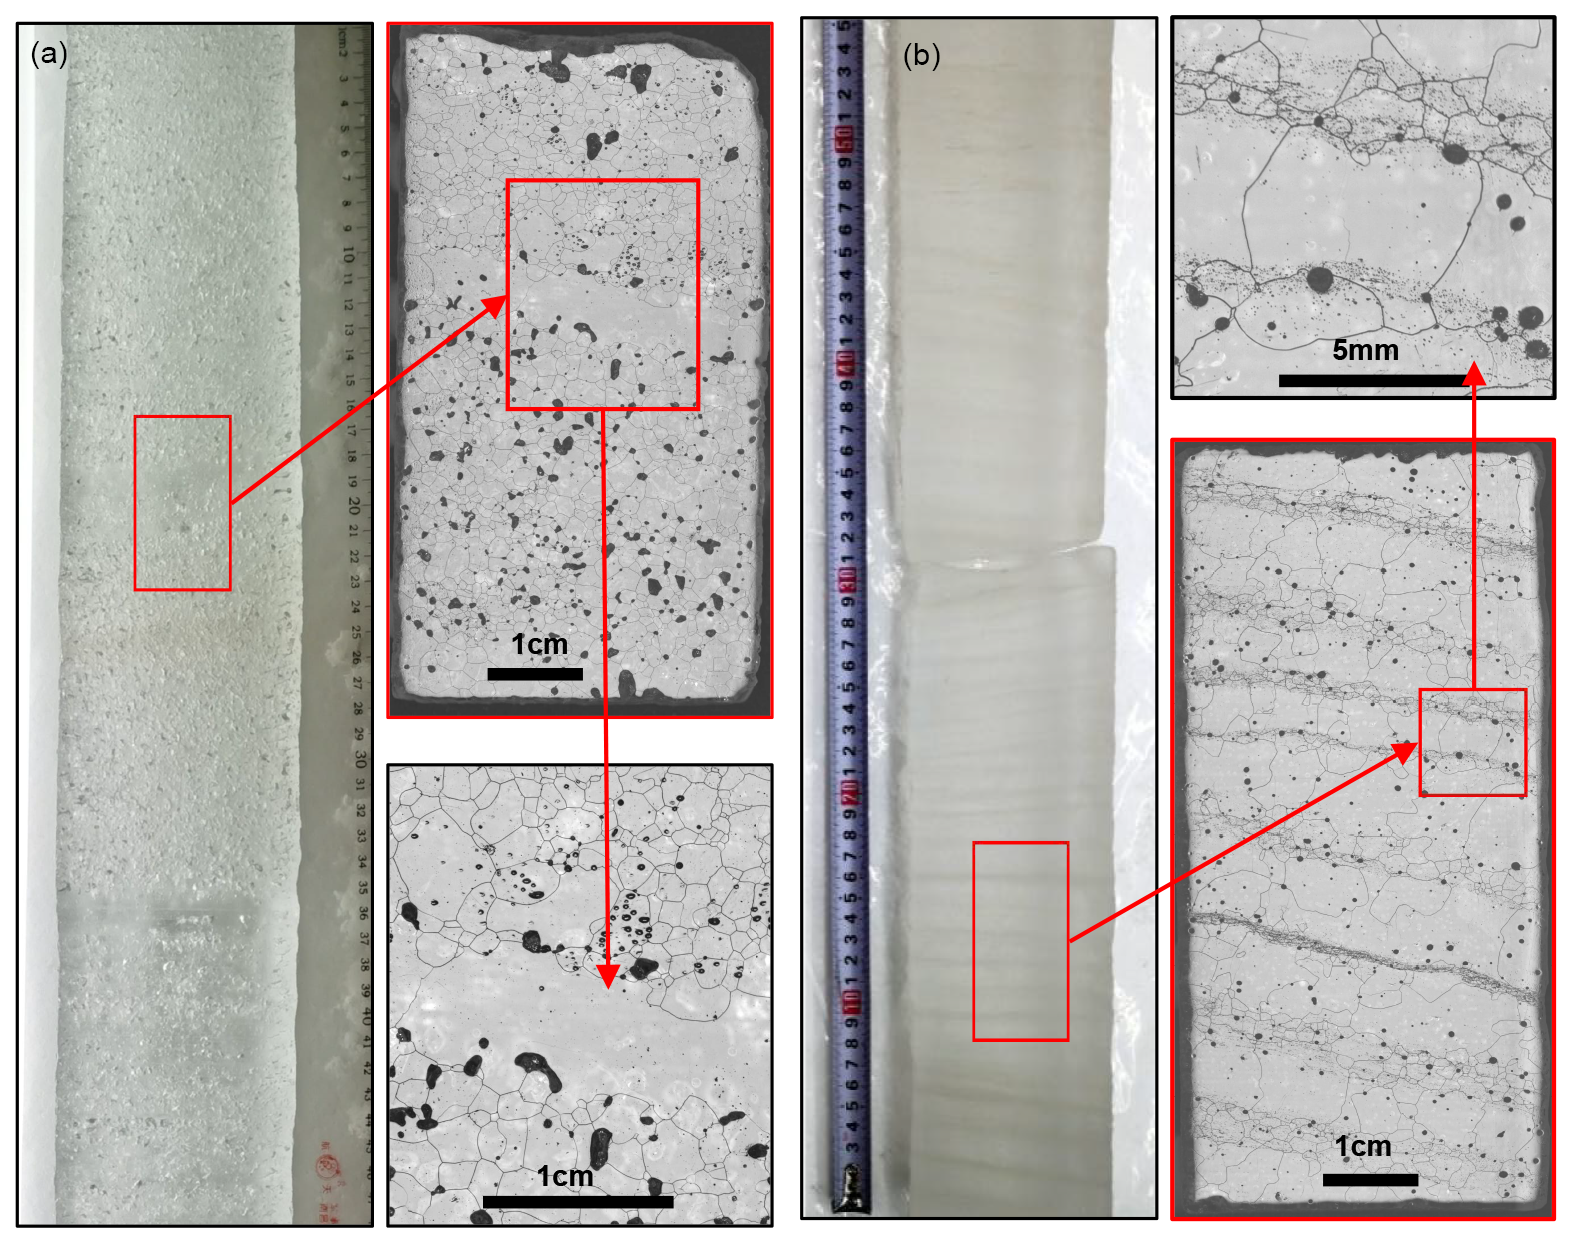
Figure 5Illustrations of centimeter-scale fluctuations in the ANMQ ice core: (a) Photograph of a melt-refrozen layer in the firn layer, with a magnified inset showing abrupt enlargement of grain area; (b) Photograph of a dense zone of impurity layers, with a magnified inset displaying clustering of small grains.
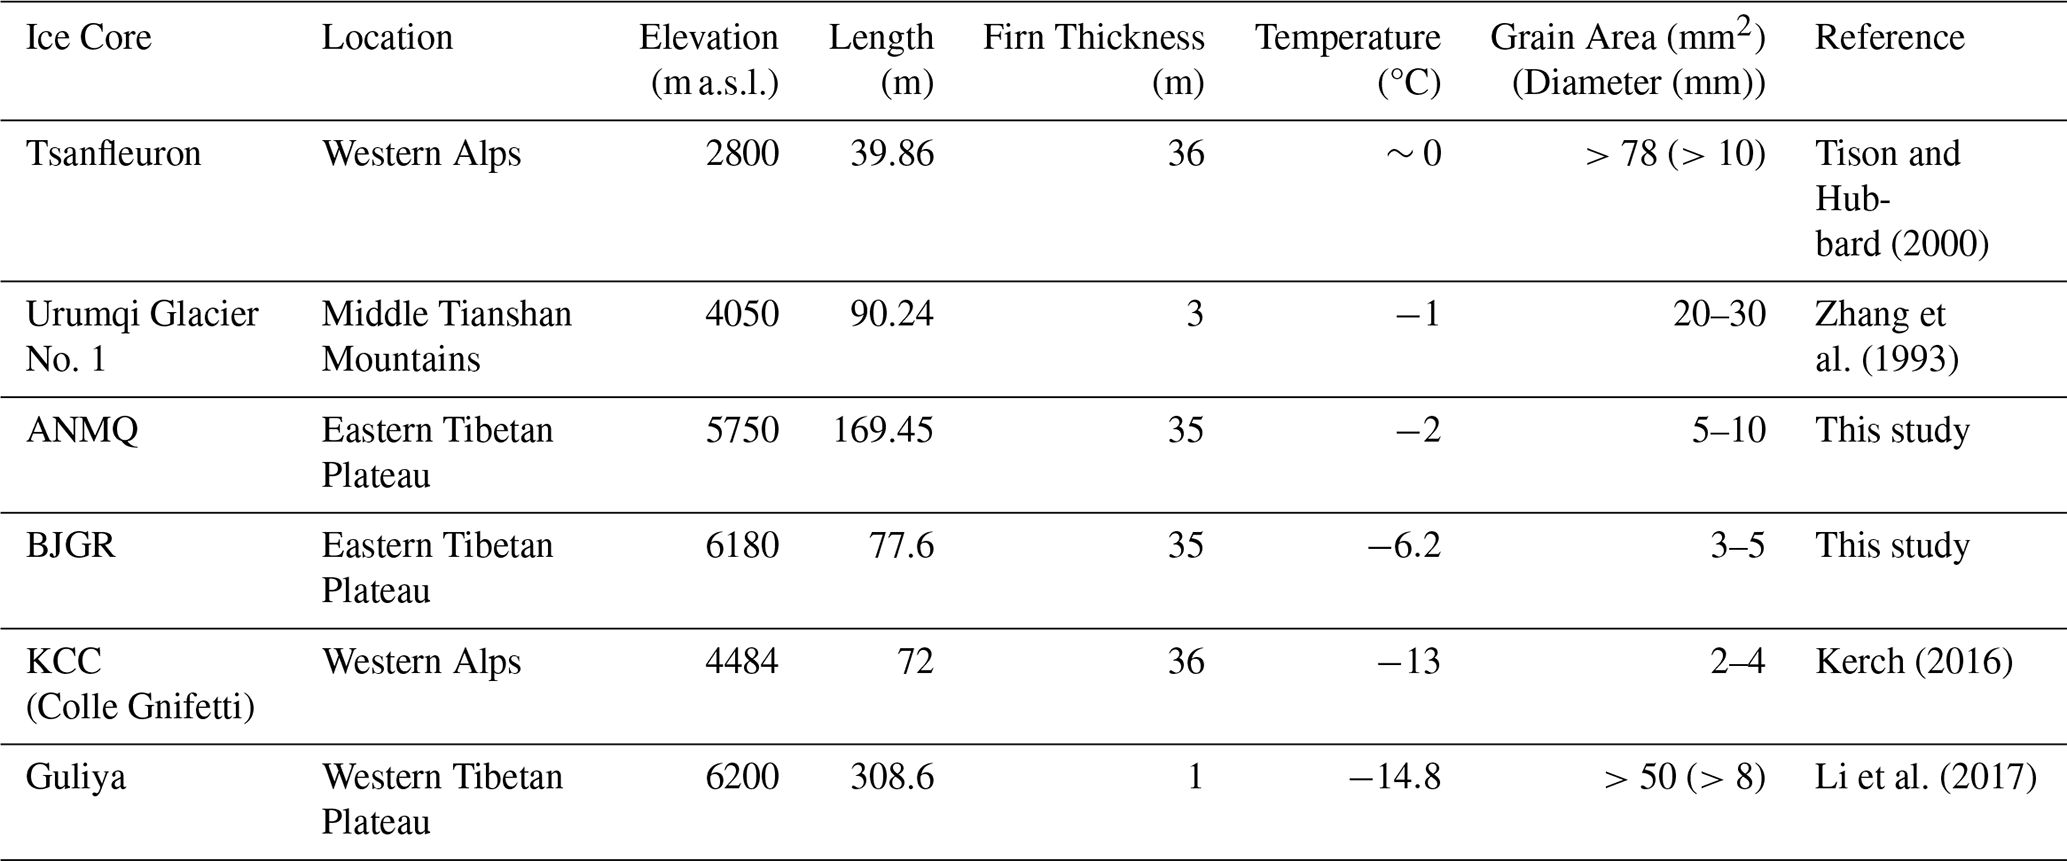
We compared the two ice cores with four additional ice cores from mountain glaciers in the eastern Tibetan Plateau, Tianshan Mountains, and European Alps (Table 1; Zhang et al., 1993; Tison and Hubbard, 2000; Kerch, 2016; Li et al., 2017). At a depth of ∼35 m, where vertical pressures are broadly comparable among these sites, we observed a pronounced disparity in grain size. The grain size ranking at this depth (Guliya > Urumqi Glacier No. 1 > ANMQ > BJGR > KCC) is broadly consistent with the ice temperature ranking (Tsanfleuron > Urumqi Glacier No. 1 > ANMQ > BJGR > KCC > Guliya). These comparisons further suggest that temperature is the dominant factor controlling grain growth in these mountain glaciers. Note that the grain areas of the Tsanfleuron and Guliya ice cores were measured using the linear intercept method (Eicken, 1993), which tends to overestimate the average grain area.
Table 1Ice temperature and grain size at ∼35 m depth in different mountain glaciers.
We also observed numerous impurity layers (mm to cm scale) in both ice cores (Fig. 5b). Within these layers, abundant small grains (typically <2 mm2) form multiple small-grain walls, leading to abrupt decreases in average grain area. Generally, the cumulative thickness of all impurity layers within one meter of ice is <20 cm (Fig. A5). However, in the ANMQ ice core, a dense zone of impurity layers occurs at 120–140 m depth, where the cumulative thickness of impurity layers within one meter reaches up to 90 cm. This thickness shows a strong negative correlation with average grain area (, p<0.01; Fig. A5). A less prominent dense zone of impurity layers is also observed in the BJGR ice core at 66–75 m depth, where an inverse correspondence between impurity layer thickness and grain size is also evident (, p=0.86). The lack of statistical significance is likely due to the considerably lower cumulative thickness and weaker contamination of impurity layers within this interval, which impose only modest constraints on grain area evolution. This indicates that, in these two ice cores, impurity-induced grain growth restriction is another critical factor driving centimeter-scale average grain area fluctuations.
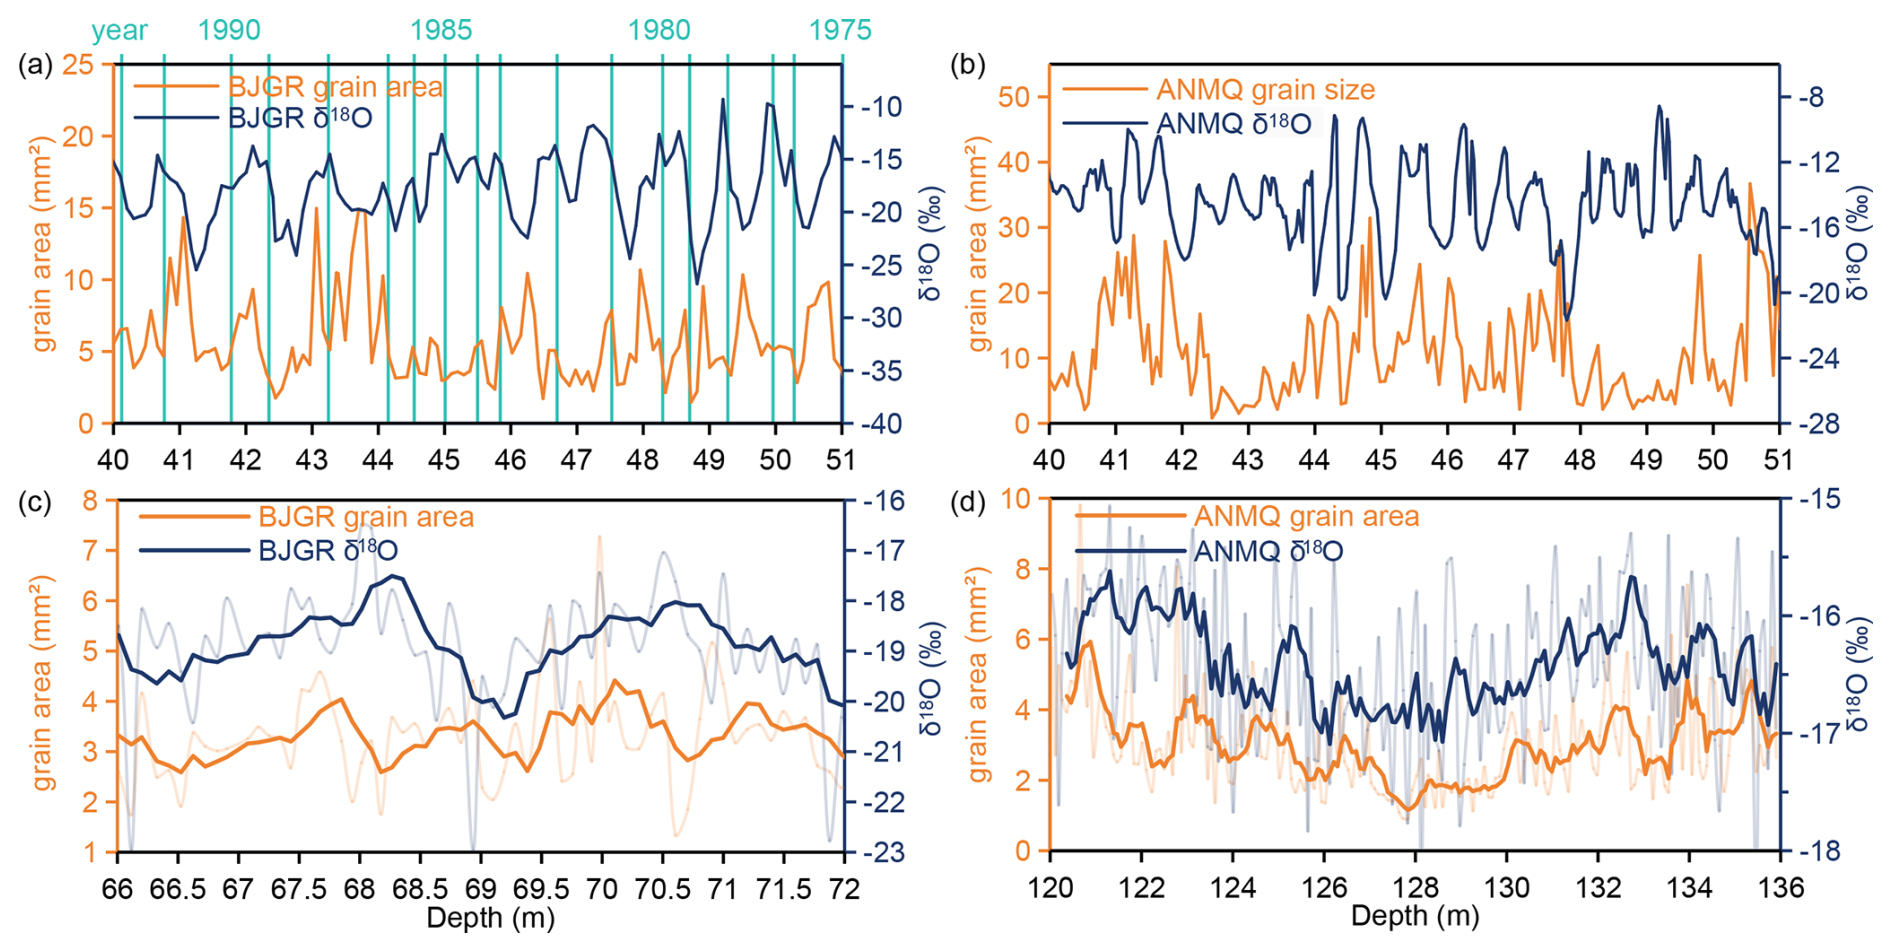
Figure 6Comparison of average grain area and δ18O values. (a) BJGR, 40–51 m interval (for 45–51 m: , p<0.01). (b) ANMQ, 40–51 m interval. In the 40–51 m interval, both records exhibit inverse fluctuations, which are attributed to the “amount effect” (i.e., lower δ18O values in summer and higher values in winter; Yang, unpublished doctoral dissertation, 2024). (c) and (d) show similar fluctuations within the dense zones of impurity layers (for ANMQ, 45–51 m: r=0.205, p<0.01); The thin lines represent original data, the bold lines represent the 5 point smooth.
A similar inverse relationship between impurity content and grain size has also been documented in a study of the Monte Perdido Glacier in the Pyrenees (González-Santacruz et al., 2023). Polar ice core research also shows grain size in impurity layers is typically smaller and negatively correlated with impurity concentration (Alley and Woods 1996; Svensson et al., 2005). This is generally interpreted as impurities inhibiting grain boundary migration by reducing migration rates and “pinning” grain boundaries, thereby restricting grain growth (Weiss et al., 2002; Durand et al., 2006; Faria et al., 2010; González-Santacruz et al., 2023). In our samples, grain boundary pinning features are visible in the micrographs from both ice cores, but the exact nature of the pinning particles cannot be fully resolved owing to resolution limits. Notably, some studies have suggested that impurities will change ice properties by influencing grain internal strain (Eichler et al., 2017, 2019; Stoll et al., 2021). The exact pinning mechanism and the potential role of soluble impurities in modifying grain-boundary mobility remain unclear and merit future microchemical analyses.
Among the multiple factors affecting grain size, temperature is the primary driver of the observed hundred-meter-scale grain-area variations. A full mechanistic understanding of the processes related to stress, melt-refreezing, and impurities, however, is beyond the current scope and therefore awaits further investigation.
3.3 The link between grain size and climate change
Grain size is significantly influenced by ice temperature, which is modulated by air temperature. Theoretically, grain size can preserve climate change information. Studies on polar ice cores (e.g., NGRIP, EDC, WAIS) indicate that grain size is typically linked to climate history: average grain area usually correlates with other climate proxies (e.g., δ18O), and its abrupt changes often correspond to cold-warm transitions or paleoclimatic cold/hot events (Svensson et al., 2003; Durand et al., 2007; Fitzpatrick et al., 2014). However, the grain size of these two ice cores is influenced by high temperatures, melt-refrozen ice layers, and impurities – can it still retain climate information amid these multiple influences?
In studies of Tibetan Plateau ice cores, δ18O have been widely used to reconstruct climate change history (Thompson et al., 1997). We compared the average grain area with δ18O of these two ice cores and found that, at 45–51 m depth in both ice cores, their average grain area and δ18O show comparable fluctuation: the BJGR ice core show a significant negative correlation (, p<0.01; Fig. 6a and b), while the correlation is insignificant in the ANMQ due to strong refreezing interference. According to the dating results, the age ranges corresponding to this depth interval are 1975–1985 for BJGR and 1957–1969 for ANMQ, respectively. Although no prominent decadal-scale climatic shifts occurred during these periods, the anti-phase correlation between grain area and δ18O suggests that grain size may temporarily retain signals of short-term climate variations.
Additionally, average grain area and δ18O also show comparable fluctuation in the dense zone of impurity layers: the ANMQ ice core shows a significant correlation (r=0.205, p<0.01; Fig. 6c and d), while the correlation is insignificant in the BJGR due to lower impurity layers density. The low δ18O values in the dense zone of impurity layers indicate cold climatic periods (no definitive age constraints are available for this depth interval; however, it is inferred to be on the centennial scale), which aligns with previous studies demonstrating that densified impurity layers and elevated dust concentrations typically occur during cold periods (Ram et al., 1997; Mahowald et al., 1999; Overpeck et al., 1996).
At 45–51 m depth, RRX-induced grain refinement is minimal since low vertical pressures, and grain growth dominated by temperature-dependent NGG. In the dense zone of impurity layers, low temperatures and impurity-induced restriction result in smaller grain size and limited strain accumulation, thereby inhibiting RRX-induced grain refinement. This allows grain size to retain temperature-sensitive signals in both intervals. This lays the groundwork for further exploring the connections between the physical characteristics – such as bubble number density – of mountain glacier ice cores and climate change (Spencer et al., 2006; Fegyveresi et al., 2016; Lipenkov, 2018).
This study presents the first continuous profiles of ice grain area spanning from the firn to the base of two deep mountain glacier ice cores from the Tibetan Plateau, revealing vertical differentiation in grain area at the hundred-meter scale, analogous to polar ice core profiles. Temperature is the primary factor controlling the hundred-meter-scale grain-size variations. Relatively higher temperatures significantly enhance grain growth, thus resulting in a larger equilibrium grain area. Refreezing under warm conditions gives rise to abrupt increases in grain area within melt-refrozen layers, whereas impurities result in abrupt decreases in grain area within impurity layers. Together, these two factors drive centimeter-scale fluctuations in grain area. Notably, in layers where RRX-induced refinement is negligible, grain area exhibits a significant correlation with δ18O, indicating that grain size in mountain glacier ice cores can still retain temperature signals despite multiple influencing factors.
The ice core slice density was deduced using the formula: slice (Kerch, 2016). Due to the fragility of loose firn slice samples in the upper part of the ANMQ ice core, combined with the retention of many melt-refrozen ice layer samples, this sampling error caused abnormally high density values and a downward trend above 35 m in the ANMQ ice core.
Below 156 m depth in the ANMQ ice core, the growth rate of grains >5 mm2 reaches up to 80 mm2 m−1. At the base, grain areas exceed 3000 mm2, with grain boundaries extending beyond ice slice edges. Concurrently, impurity layers vanish, and the ice core approximates transparent pure ice. We infer that the grains at this depth underwent intense refreezing: excessive temperatures caused extensive melting, and prolonged high temperatures induced repeated freeze-thaw cycles, ultimately generating exceptionally large grains. High-temperature-induced melt-refrozen ice layers are a primary driver of the abrupt grain area increase at the ANMQ core base.
Elevated RSE in the ANMQ core arises from two primary factors: larger grain sizes reduce the number of complete grains captured per thin section and are accompanied by broader dispersion in grain size. This effect is amplified below 140 m, where oversized grains frequently extend beyond the sample boundaries, yielding an average RSE of 39.73 % for depths >140 m.
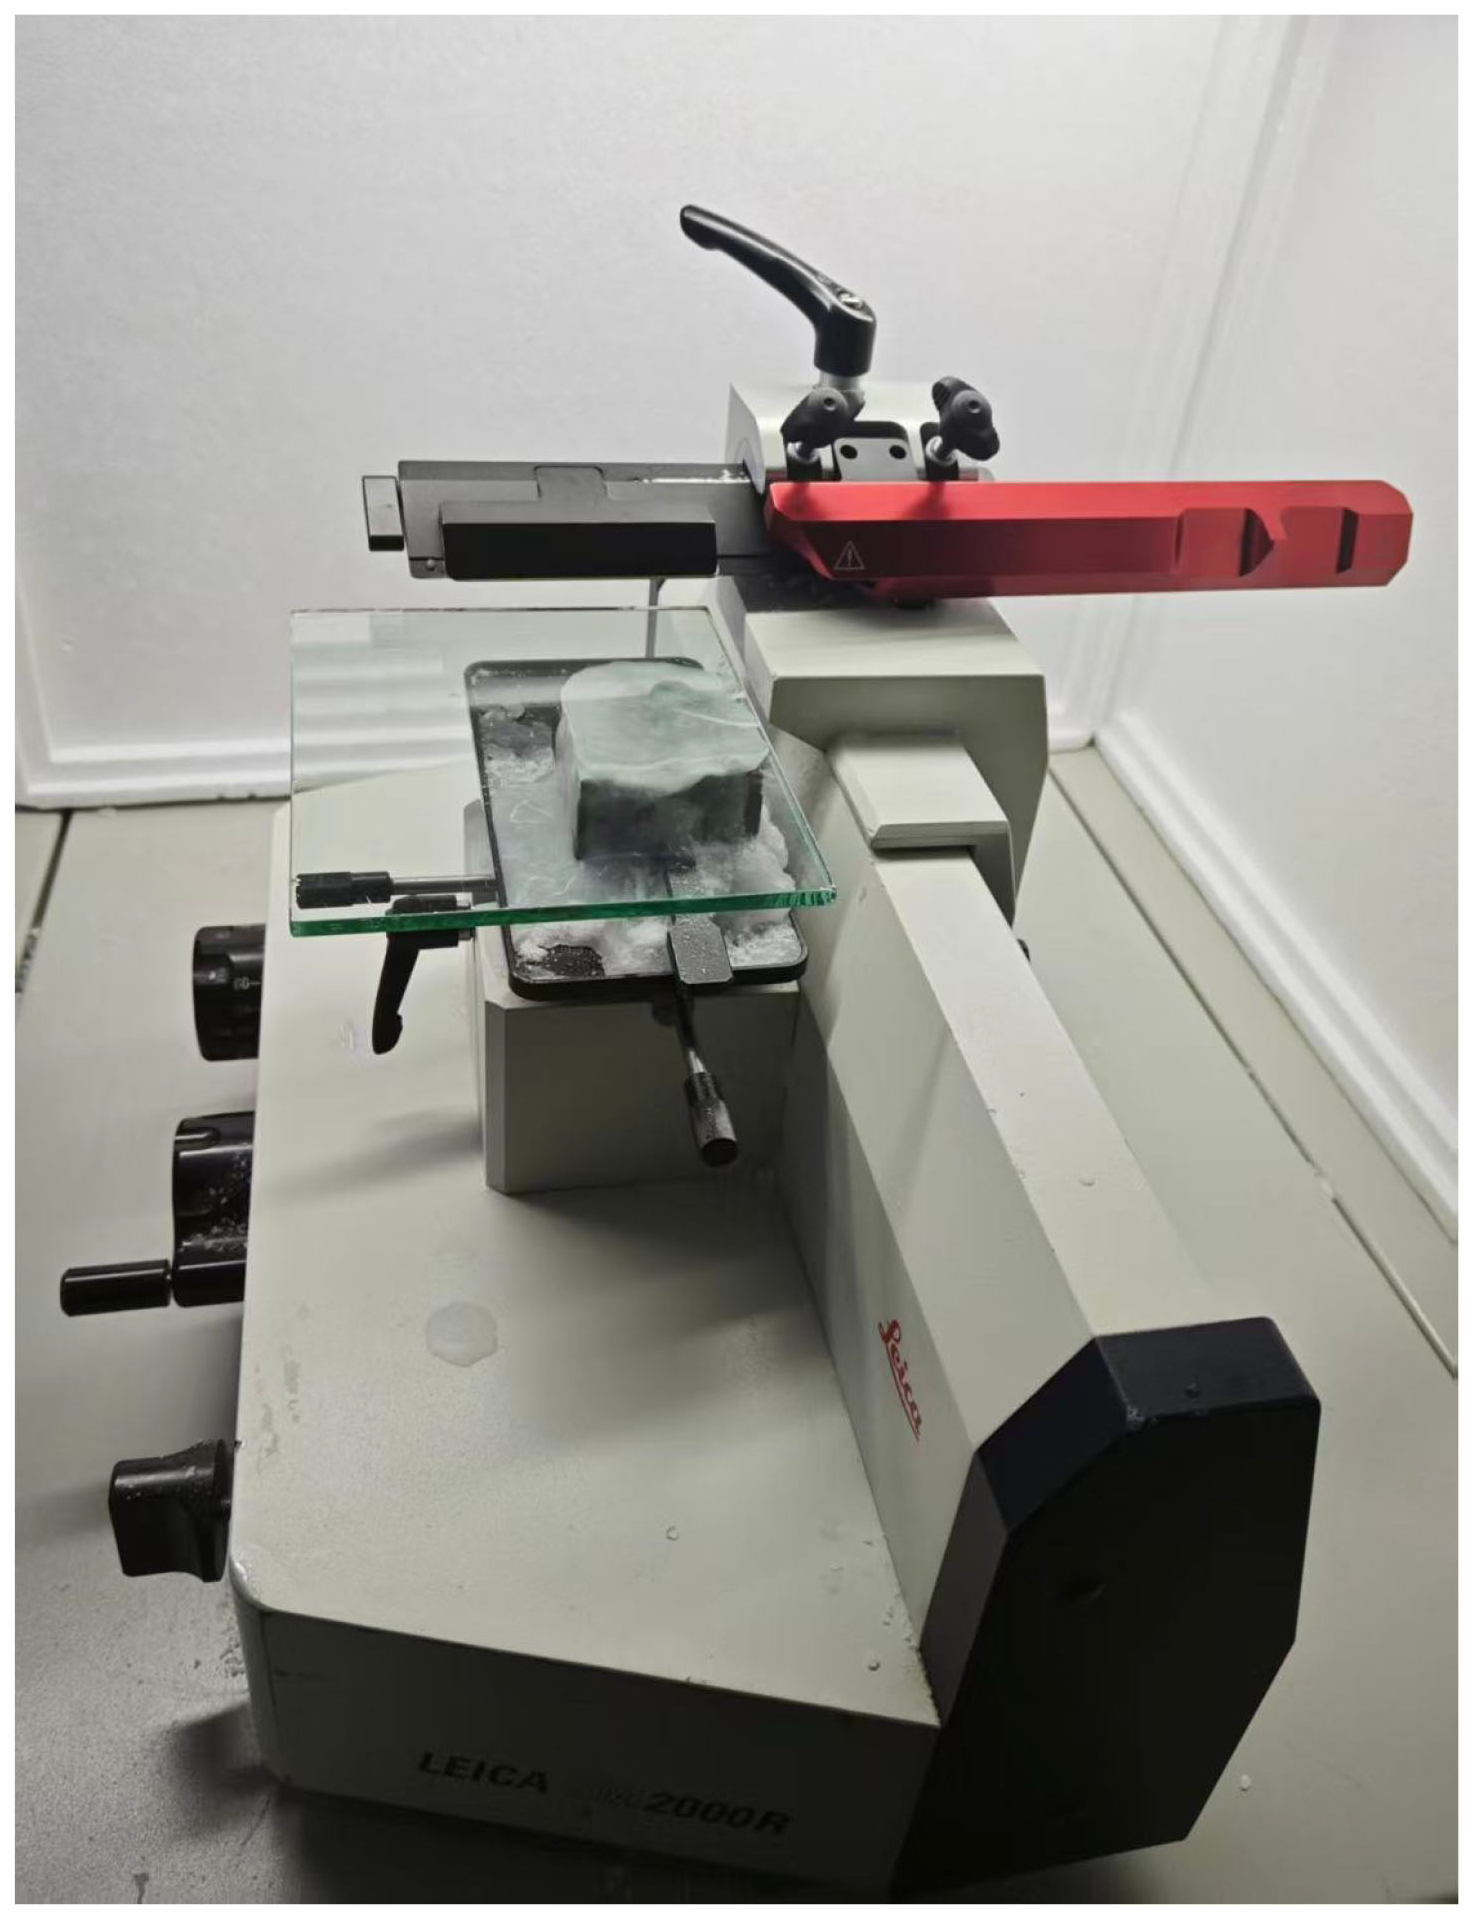
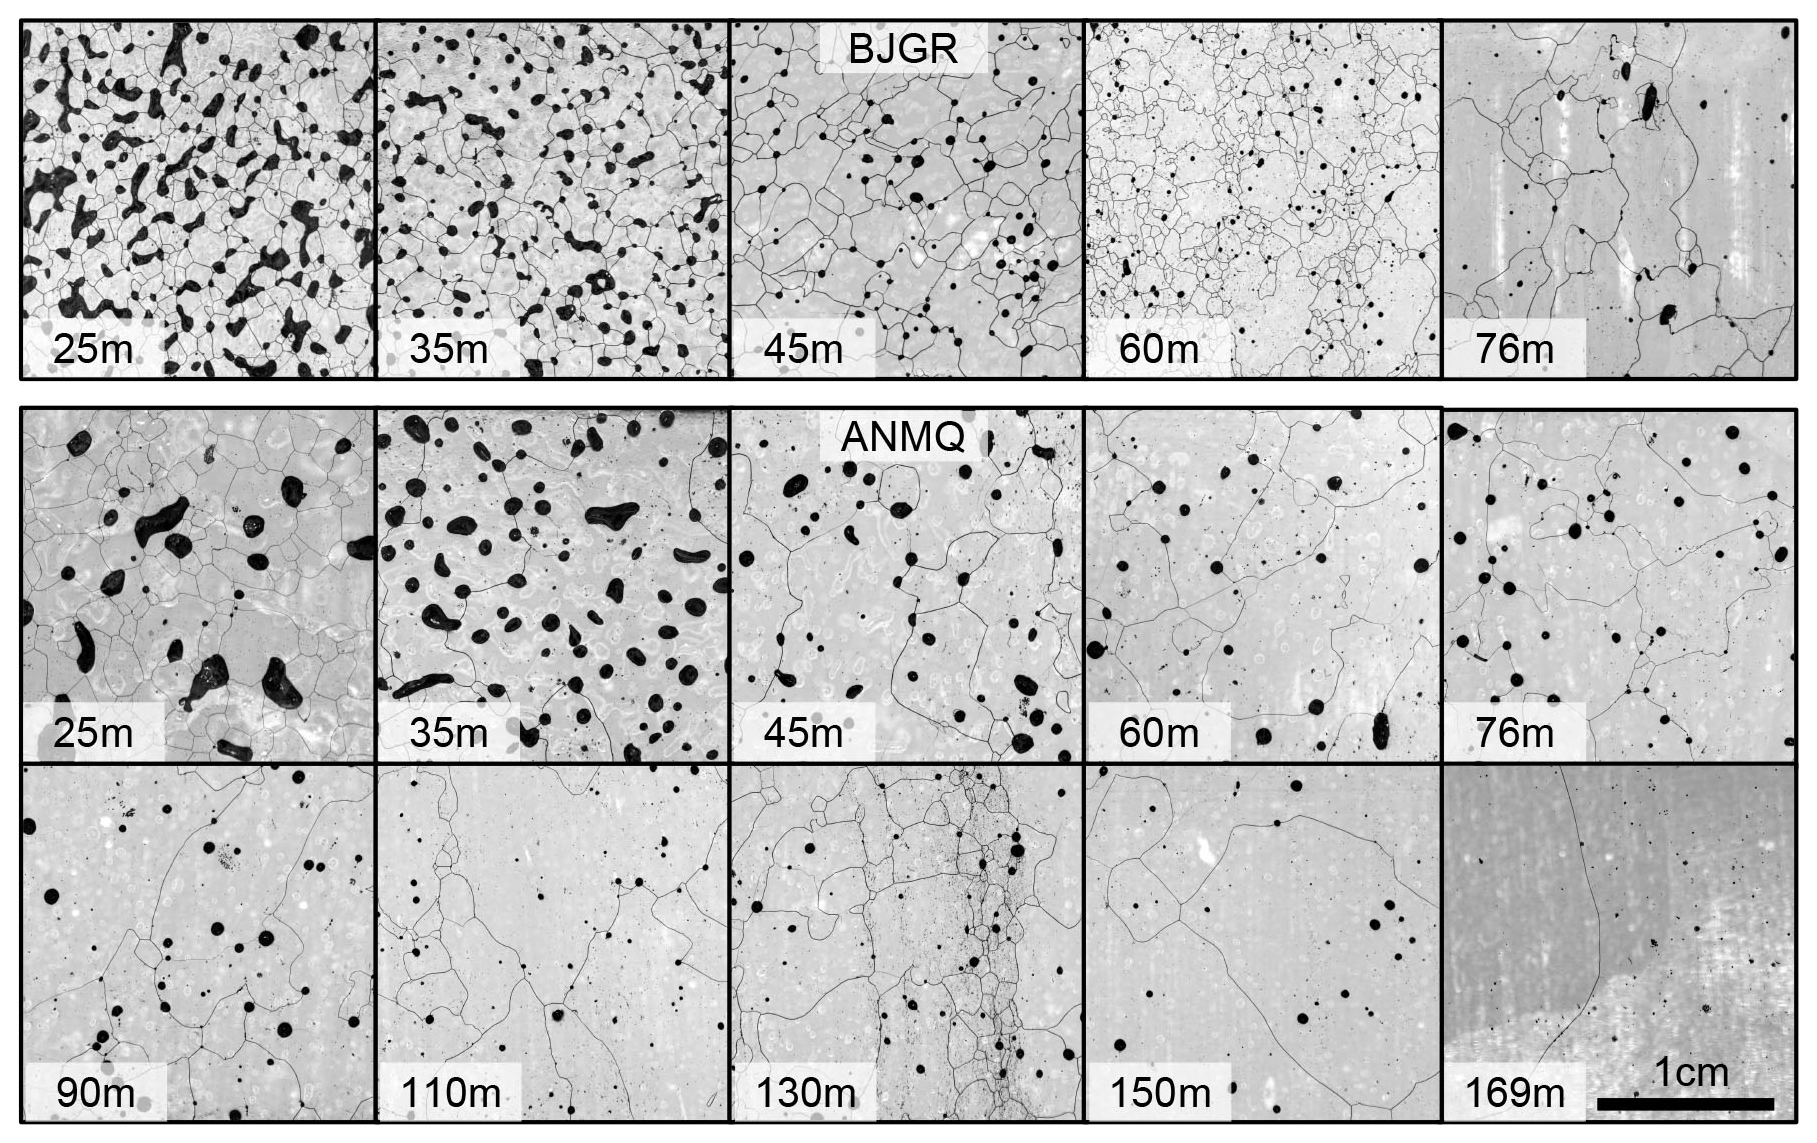
Figure A2Example microstructure images of BJGR and ANMQ ice cores; Microstructure images at different depths are selected, showing significant variations in grain area and bubbles.
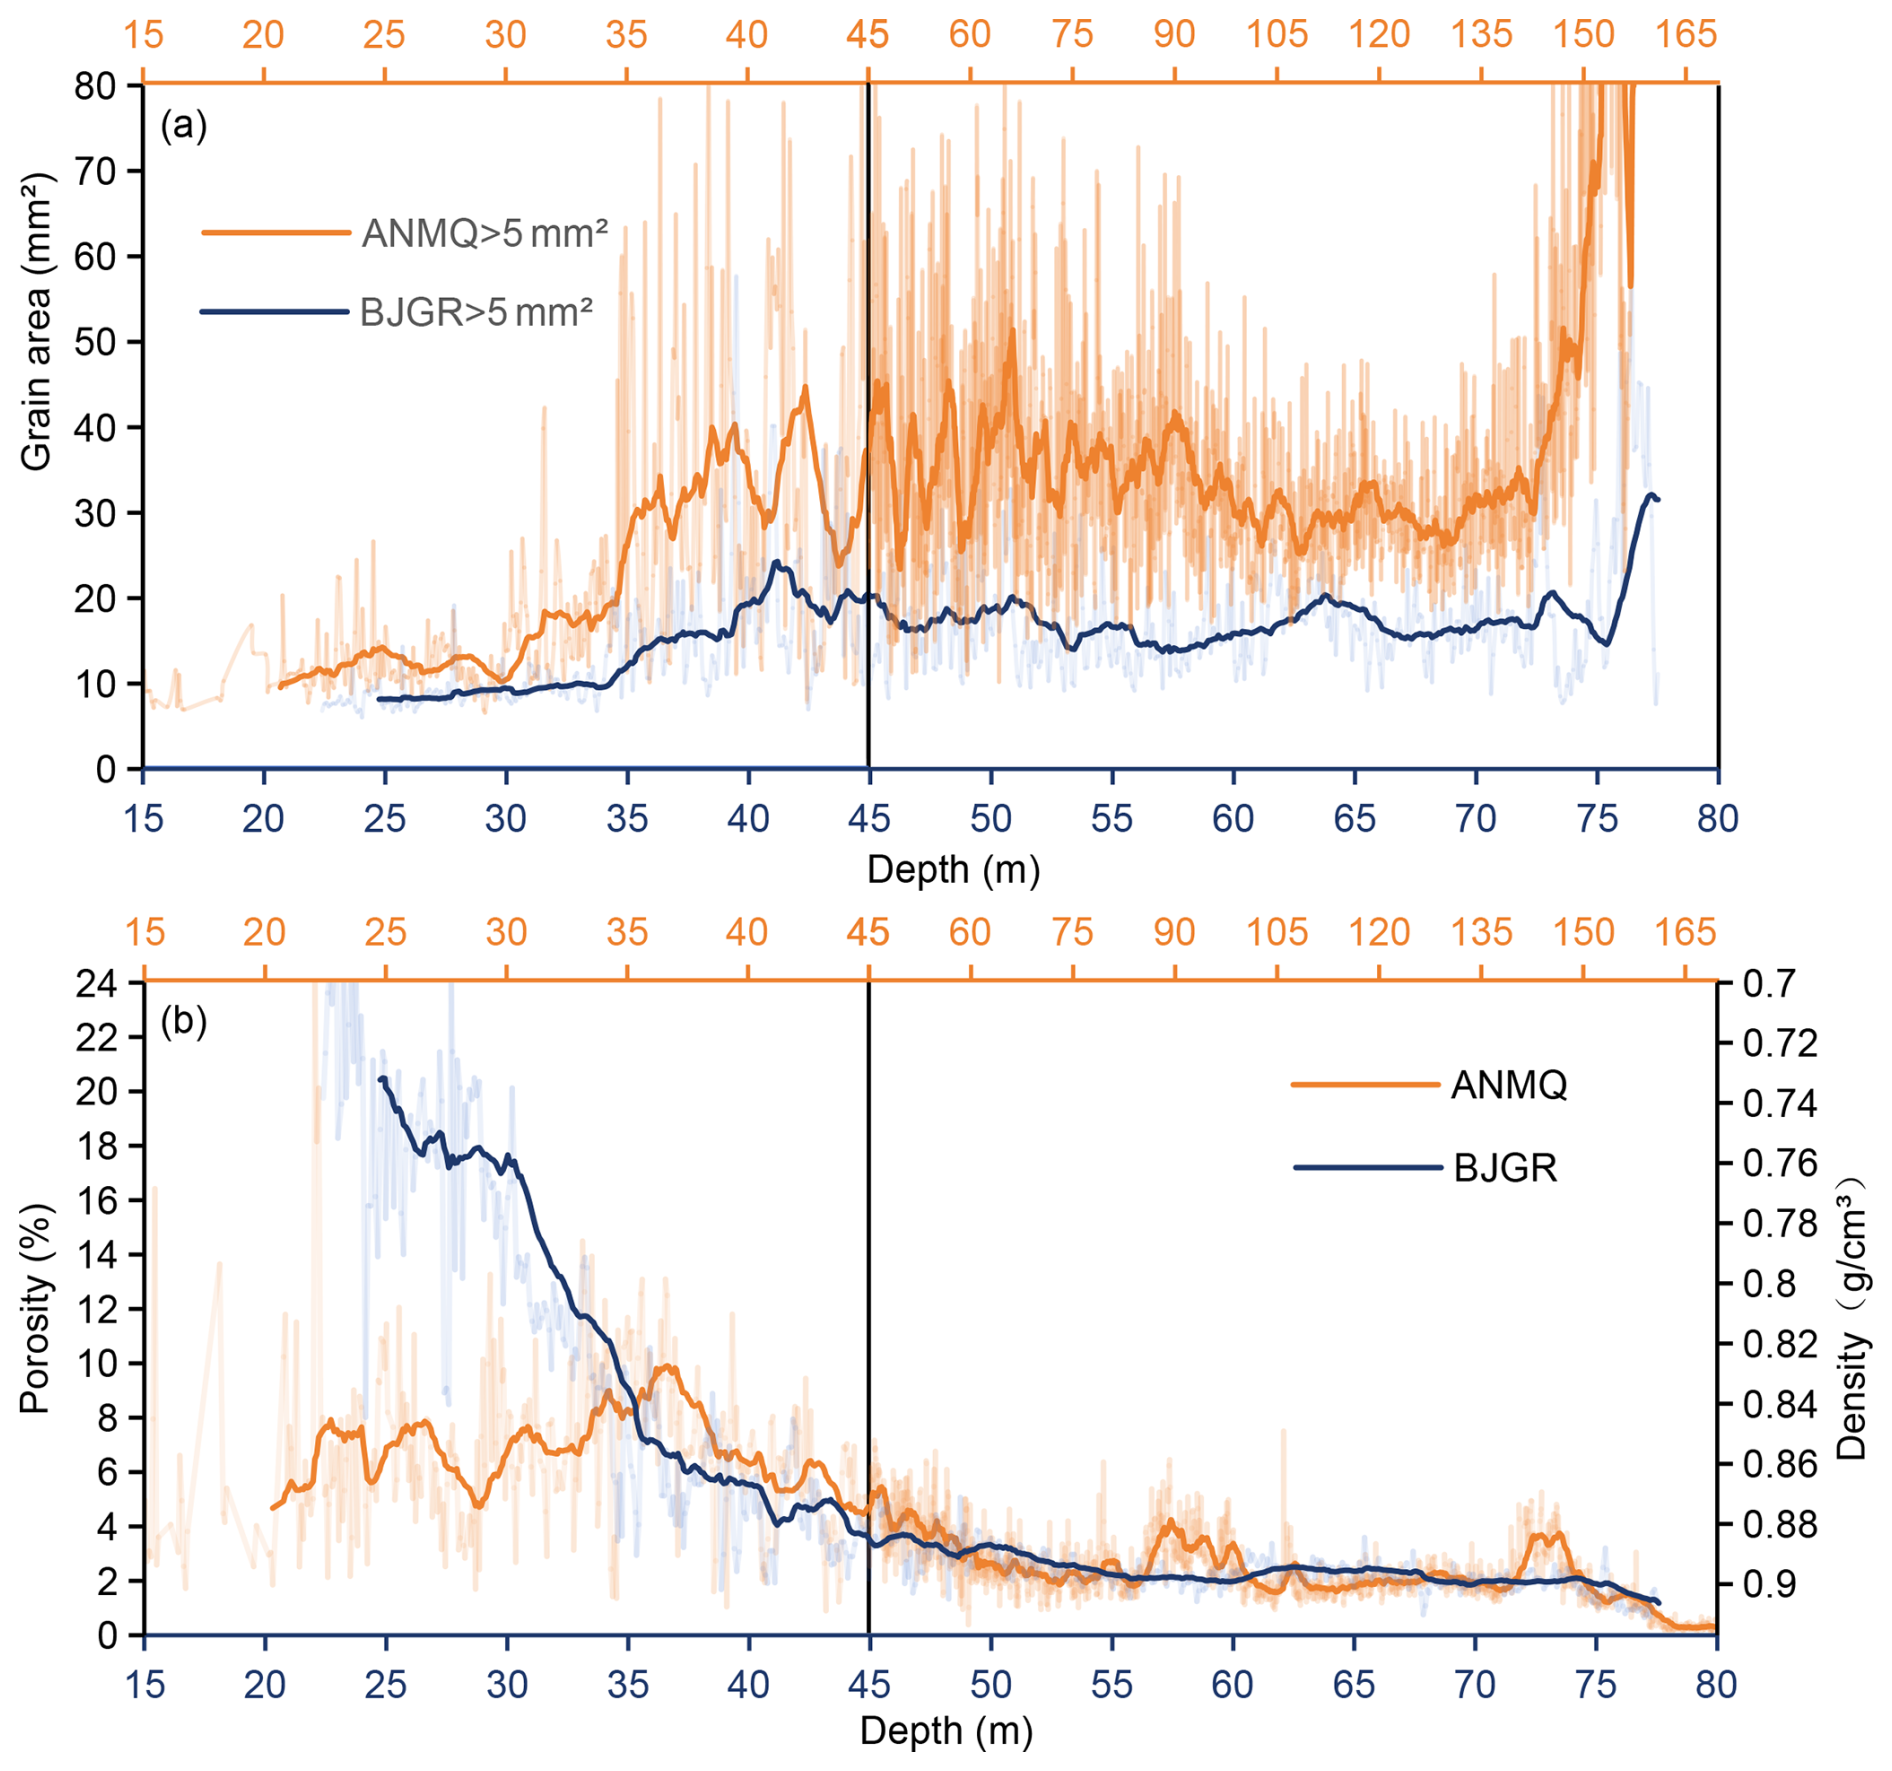
Figure A3(a) Average area of grains >5 mm2 profiles of ANMQ and BJGR ice cores. The average area of all grains is significantly correlated with the average area of grains >5 mm2 (ANMQ: r=0.847, p<0.01; BJGR: r=0.909, p<0.01); (b) The porosity and slice density profiles of ANMQ and BJGR ice cores; The thin lines represent original data, the bold lines represent the 25 point smooth.
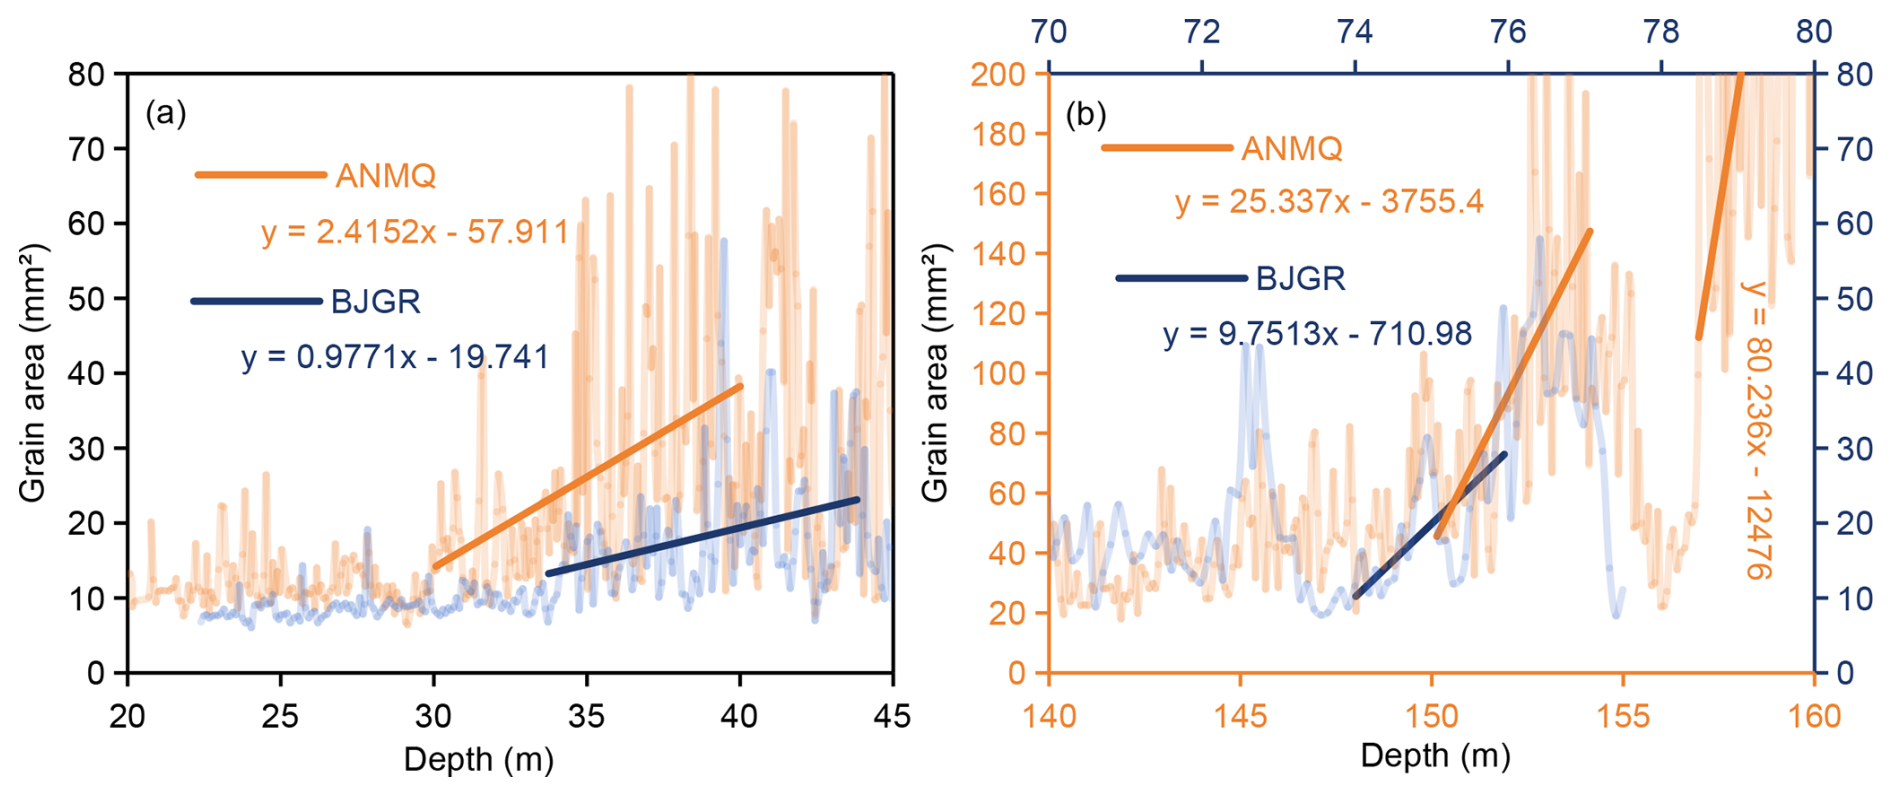
Figure A4Growth rate of grains >5 mm2: (a) Coarsening layer; (b) SIBM layer; The thin lines represent original data, the bold lines represent linear fitting results.
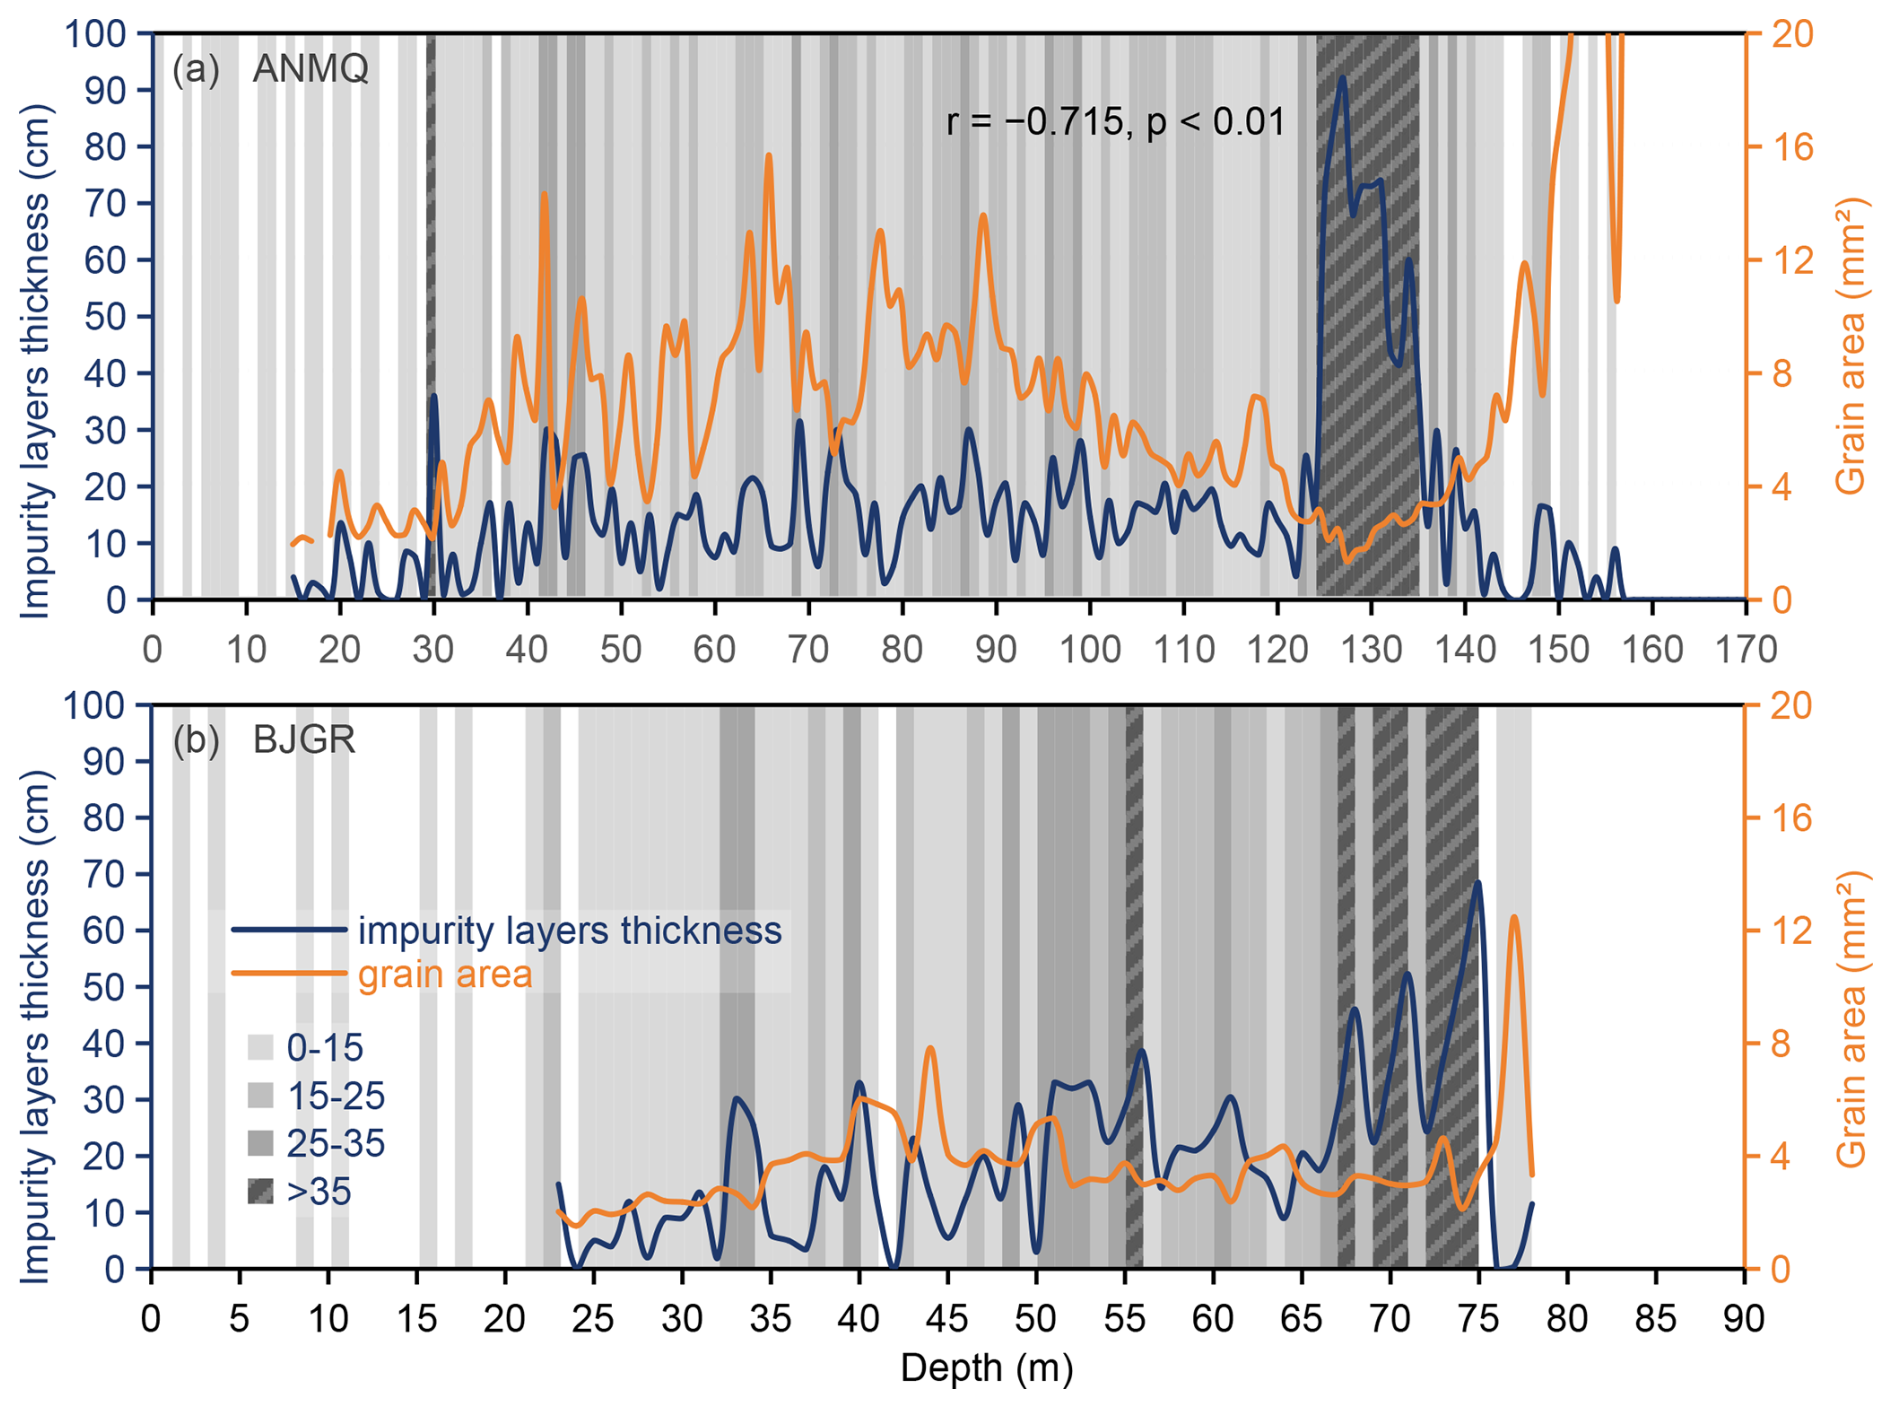
Figure A5Vertical variations in total impurity layer thickness and mean grain area along depth. (a) ANMQ ice core: A significant negative correlation exists between impurity layer thickness and grain area within the 120–140 m depth interval (, p<0.01). (b) BJGR ice core: (, p=0.86 for the 66–75 m depth interval). Gray shaded regions denote the total impurity layer thickness (in cm) for each metre depth interval.
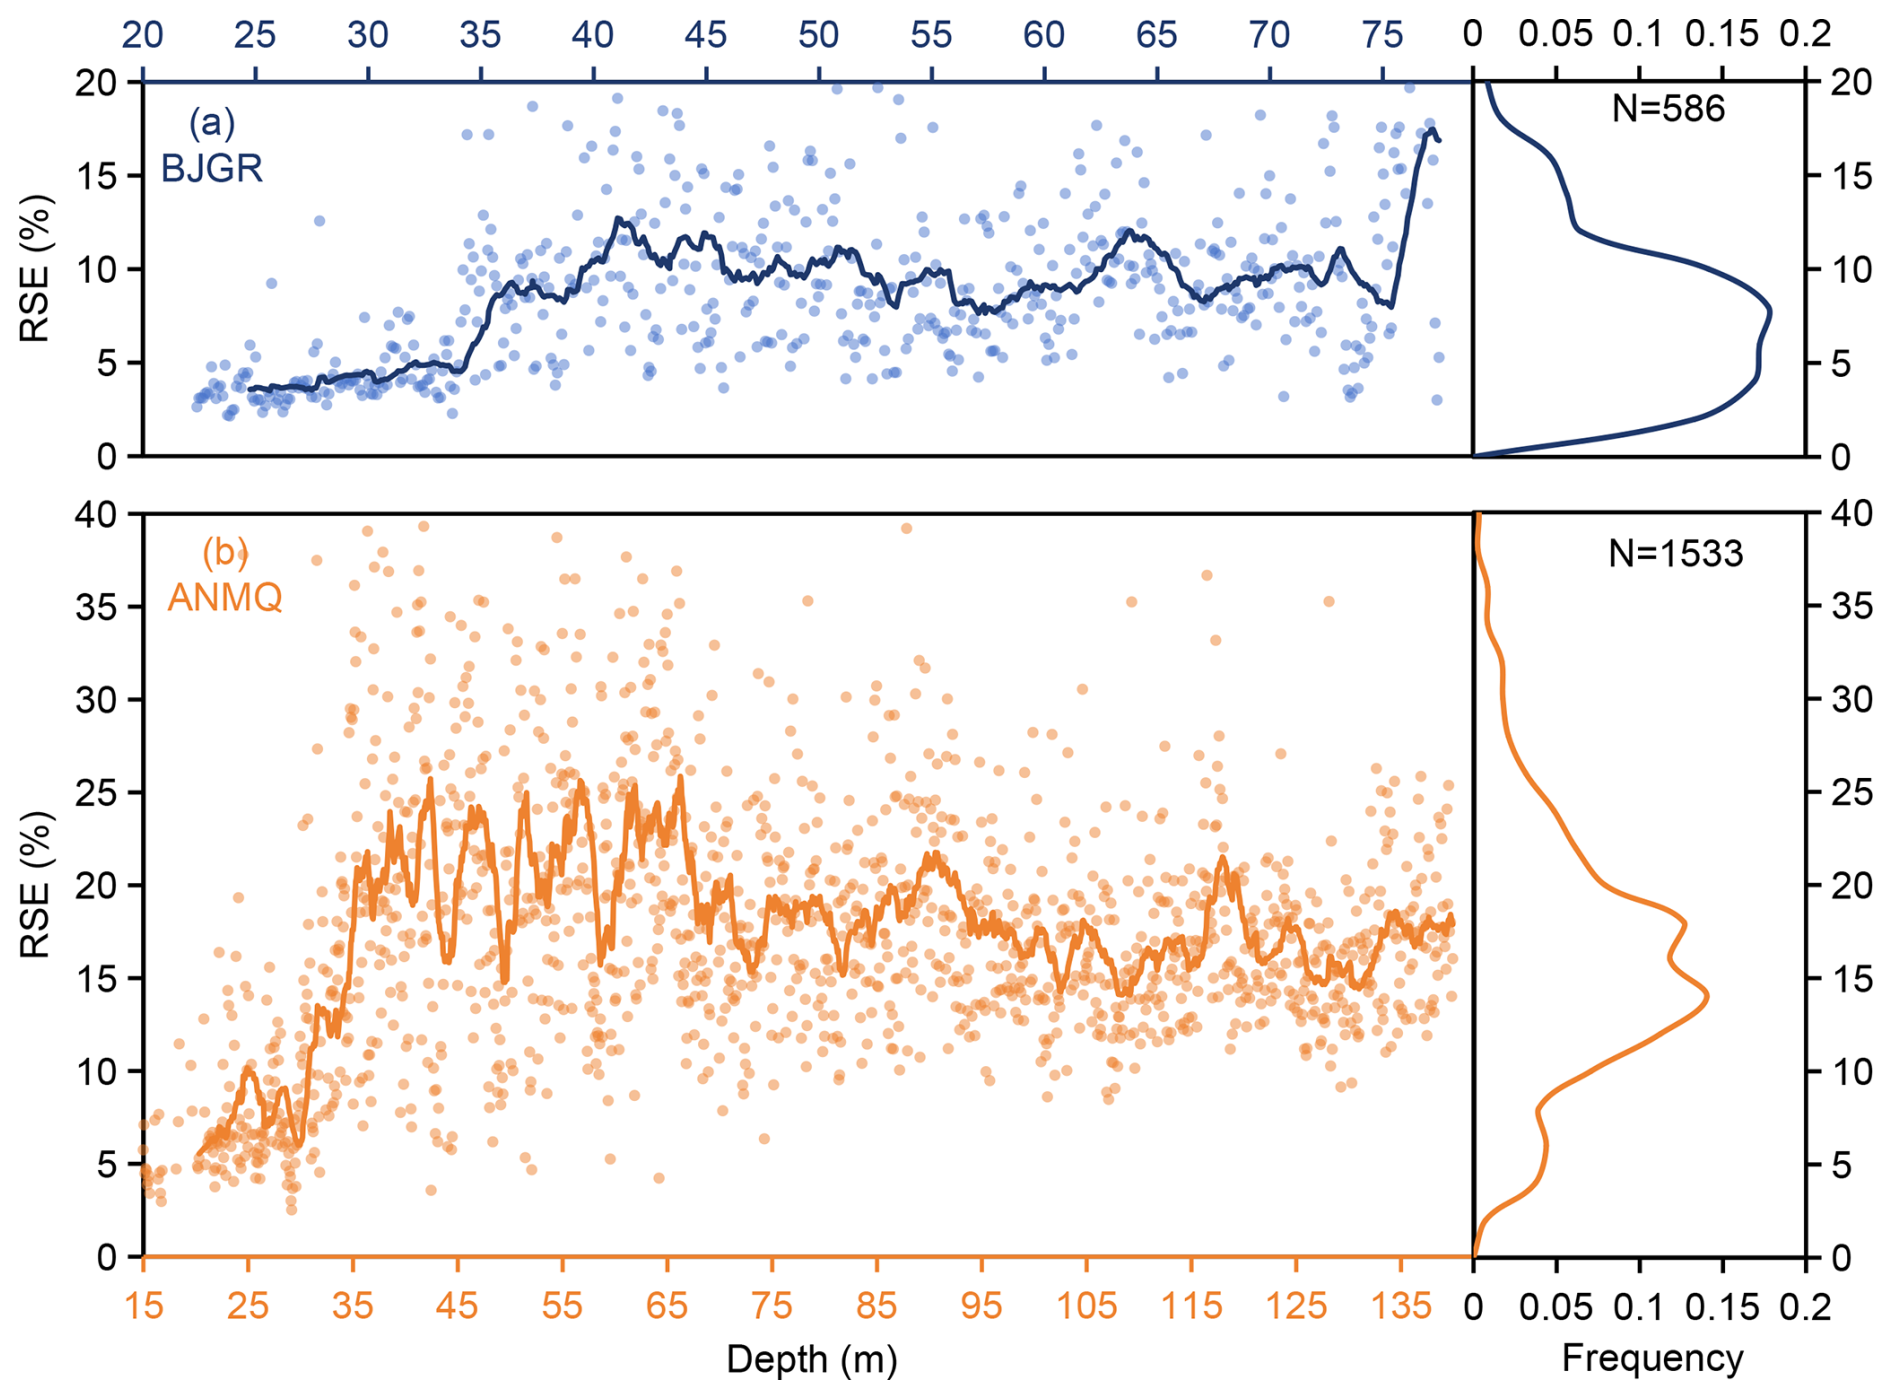
Figure A6Depth profiles of the relative standard error (RSE, %) of mean grain area for each thin section, with frequency distributions of RSE values shown in the right marginal panels. (a) BJGR ice core: RSE values are predominantly below 10 %, with a core-wide average RSE of 8.90 %. (b) ANMQ ice core: For the upper 140 m, most RSE values are less than 20 %, with an average RSE of 17.60 % over this interval; The dot represent original data, the bold lines represent the 25 point smooth.
Microstructure images and raw grain parameter data are available upon request.
Z.H. designed the study, conducted field sampling and laboratory experiments, analyzed the data, and drafted the manuscript; B.X. supervised the research, revised the manuscript critically, and secured funding. All authors have read and agreed to the published version of the manuscript.
The contact author has declared that neither of the authors has any competing interests.
Publisher's note: Copernicus Publications remains neutral with regard to jurisdictional claims made in the text, published maps, institutional affiliations, or any other geographical representation in this paper. The authors bear the ultimate responsibility for providing appropriate place names. Views expressed in the text are those of the authors and do not necessarily reflect the views of the publisher.
We would like to sincerely thank the handling editor Kaitlin Keegan and the anonymous reviewers for their thorough review and constructive comments, which greatly improved this manuscript. We also thank all personnel involved in the drilling of the ANMQ and BJGR ice cores and the associated experiments. Special appreciation is extended to Bo Fang, Siyv Lu, Xiaoxi Zhu, and Jiajia Wang for their valuable assistance and insightful suggestions.
This research was supported by Excellent Research Group Program for Tibetan Plateau Earth System (no. 42588201).
This paper was edited by Kaitlin Keegan and reviewed by three anonymous referees.
Alley, R. B. and Woods, G. A.: Impurity influence on normal grain growth in the GISP2 ice core, Greenland, J. Glaciol., 42, 255–260, https://doi.org/10.3189/S0022143000004111, 1996.
Alley, R. B., Perepezko, J. H., and Bentley, C. R.: Grain growth in polar ice: I. Theory, J. Glaciol., 32, 415–424, https://doi.org/10.3189/S0022143000012120, 1986a.
Alley, R. B., Perepezko, J. H., and Bentley, C. R.: Grain growth in polar ice: II. Application, J. Glaciol., 32, 425–433, https://doi.org/10.3189/S0022143000012132, 1986b.
Bolch, T., Kulkarni, A., Kääb, A., Huggel, C., Paul, F., Cogley, J. G., Frey, H., Georgiadi, S., and Stoffel, M.: The state and fate of Himalayan glaciers, Science, 336, 310–314, https://doi.org/10.1126/science.1215828, 2012.
Clavette, R.: The Microstructural Heterogeneity of Ice in Jarvis Glacier, Alaska, Honors thesis, University of Maine, Orono, ME, USA, 2020.
Cuffey, K. M. and Paterson, W. S. B.: The physics of glaciers, 4th edn., Butterworth-Heinemann, Burlington, MA, USA, ISBN 978-0-12-369461-4, 2010.
Dadic, R., Schneebeli, M., Wiese, M., Bertler, N. A. N., Salamatin, A. N., Theile, T. C., Freitag, J., and Lipenkov, V. Y.: Temperature-driven bubble migration as proxy for internal bubble pressures and bubble trapping function in ice cores, J. Geophys. Res.-Atmos., 124, 10264–10282, https://doi.org/10.1029/2019JD030891, 2019.
Durand, G., Weiss, J., Lipenkov, V., Barnola, J. M., Krinner, G., Parrenin, F., Delmonte, B., Ritz, C., Duval, P., Röthlisberger, R., and Bigler, M.: Effect of impurities on grain growth in cold ice sheets, J. Geophys. Res.-Earth, 111, https://doi.org/10.1029/2005JF000320, 2006.
Durand, G., Gillet-Chaulet, F., Svensson, A., Gagliardini, O., Kipfstuhl, S., Meyssonnier, J., Parrenin, F., Duval, P., and Dahl-Jensen, D.: Change in ice rheology during climate variations – implications for ice flow modelling and dating of the EPICA Dome C core, Clim. Past, 3, 155–167, https://doi.org/10.5194/cp-3-155-2007, 2007.
Duval, P. and Castelnau, O.: Dynamic recrystallization of ice in polar ice sheets, J. Phys. IV, 5, C3-197, https://doi.org/10.1051/jp4:1995317, 1995.
Eichler, J., Kleitz, I., Bayer-Giraldi, M., Jansen, D., Kipfstuhl, S., Shigeyama, W., Weikusat, C., and Weikusat, I.: Location and distribution of micro-inclusions in the EDML and NEEM ice cores using optical microscopy and in situ Raman spectroscopy, The Cryosphere, 11, 1075–1090, https://doi.org/10.5194/tc-11-1075-2017, 2017.
Eichler, J., Weikusat, C., Wegner, A., Twarloh, B., Behrens, M., Fischer, H., Kipfstuhl, S., and Weikusat, I.: Impurity analysis and microstructure along the climatic transition from MIS 6 into 5e in the EDML ice core using cryo-Raman microscopy, Front. Earth Sci., 7, 20, https://doi.org/10.3389/feart.2019.00020, 2019.
Eicken, H.: Automated image analysis of ice thin sections – instrumentation, methods and extraction of stereological and textural parameters, J. Glaciol., 39, 341–352, https://doi.org/10.3189/S0022143000016002, 1993.
Faria, S. H., Freitag, J., and Kipfstuhl, S.: Polar ice structure and the integrity of ice-core paleoclimate records, Quaternary Sci. Rev., 29, 338–351, https://doi.org/10.1016/j.quascirev.2009.10.016, 2010.
Faria, S. H., Weikusat, I., and Azuma, N.: The microstructure of polar ice. Part I: Highlights from ice core research, J. Struct. Geol., 61, 2–20, https://doi.org/10.1016/j.jsg.2013.09.010, 2014a.
Faria, S. H., Weikusat, I., and Azuma, N.: The microstructure of polar ice. Part II: State of the art, J. Struct. Geol., 61, 21–49, https://doi.org/10.1016/j.jsg.2013.11.003, 2014b.
Fegyveresi, J. M.: Physical properties of the West Antarctic Ice Sheet (WAIS) Divide deep core: Development, evolution, and interpretation, Ph.D. dissertation, The Pennsylvania State University, State College, PA, USA, https://www.proquest.com/openview/1dff82beeec93b710e202ffe245cc89b/1?pq-origsite=gscholar&cbl=18750 (last access: 3 October 2026), 2015.
Fegyveresi, J. M., Alley, R. B., Fitzpatrick, J. J., Cuffey, K. M., McConnell, J. R., Voigt, D. E., Spencer, M. K., and Stevens, N. T.: Five millennia of surface temperatures and ice core bubble characteristics from the WAIS Divide deep core, West Antarctica, Paleoceanography, 31, 416–433, https://doi.org/10.1002/2015PA002851, 2016.
Fitzpatrick, J. J., Voigt, D. E., Fegyveresi, J. M., Stevens, N. T., Spencer, M. K., Cole-Dai, J., and McConnell, J. R.: Physical properties of the WAIS Divide ice core, J. Glaciol., 60, 1181–1198, https://doi.org/10.3189/2014JoG14J100, 2014.
González-Santacruz, N., Muñoz-Marzagon, P., Bartolomé, M., Moreno, A., Huidobro, J., and Faria, S. H.: Effects of impurities on the ice microstructure of Monte Perdido Glacier, Central Pyrenees, NE Spain, Ann. Glaciol., 64, 107–120, https://doi.org/10.1017/aog.2023.66, 2023.
Gow, A. J.: On the rates of growth of grains and crystals in South Polar firn, J. Glaciol., 8, 241–252, https://doi.org/10.3189/S0022143000031233, 1969.
Gow, A. J. and Williamson, T.: Rheological implications of the internal structure and crystal fabrics of the West Antarctic ice sheet as revealed by deep core drilling at Byrd Station, Geol. Soc. Am. Bull., 87, 1665–1677, https://doi.org/10.1130/0016-7606(1976)87<1665:RIOTIS>2.0.CO;2, 1976.
Gow, A. J., Meese, D. A., Alley, R. B., Fitzpatrick, J. J., Anandakrishnan, S., and Woods, G. A.: Physical and structural properties of the Greenland Ice Sheet Project 2 ice cores: a review, J. Geophys. Res., 102, 26559–26575, https://doi.org/10.1029/97JC00165, 1997.
Hellmann, S., Kerch, J., Weikusat, I., Bauder, A., Grab, M., Jouvet, G., Schwikowski, M., and Maurer, H.: Crystallographic analysis of temperate ice on Rhonegletscher, Swiss Alps, The Cryosphere, 15, 677–694, https://doi.org/10.5194/tc-15-677-2021, 2021.
Hruby, K., Gerbi, C., Koons, P., Campbell, S., Martín, C., and Hawley, R.: The impact of temperature and crystal orientation fabric on the dynamics of mountain glaciers and ice streams, J. Glaciol., 66, 755–765, https://doi.org/10.1017/jog.2020.44, 2020.
Jiang, Z. L., Liu, S. Y., Guo, W. Q., Li, J., Long, S. C., Wang, X., and Wu, K. P.: Recent changes in the surface elevation of typical glaciers in the Animaqing Mountains in the Yellow River source area, Journal of Glaciology and Geocryology, 40, 231–237, 2018.
Jennings, S. J. A. and Hambrey, M. J.: Structures and deformation in glaciers and ice sheets, Rev. Geophys., 59, e2021RG000743, https://doi.org/10.1029/2021RG000743, 2021.
Kamb, W. B.: Ice petrofabric observations from Blue Glacier, Washington, in relation to theory and experiment, J. Geophys. Res., 64, 1891–1909, https://doi.org/10.1029/JZ064i011p01891, 1959.
Kerch, J. K.: Crystal-orientation fabric variations on the cm-scale in cold Alpine ice: Interaction with paleo-climate proxies under deformation and implications for the interpretation of seismic velocities, Ph.D. thesis, Universität Heidelberg, https://hdl.handle.net/10013/epic.49379 (last access: 3 October 2026), 2016.
Kipfstuhl, S., Hamann, I., Lambrecht, A., Freitag, J., Faria, S. H., Grigoriev, D., and Azuma, N.: Microstructure mapping: a new method for imaging deformation-induced microstructural features of ice on the grain scale, J. Glaciol., 52, 398–406, https://doi.org/10.3189/172756506781828647, 2006.
Kipfstuhl, S., Faria, S. H., Azuma, N., Freitag, J., Hamann, I., Kaufmann, P., Weikusat, I., and Wilhelms, F.: Evidence of dynamic recrystallization in polar firn, J. Geophys. Res.-Sol. Ea., 114, B05204, https://doi.org/10.1029/2008JB005583, 2009.
Legland, D., Arganda-Carreras, I., and Andrey, P.: MorphoLibJ: integrated library and plugins for mathematical morphology with ImageJ, Bioinformatics, 32, 3532–3534, https://doi.org/10.1093/bioinformatics/btw413, 2016.
Li, Y., Kipfstuhl, S., and Huang, M.: Ice microstructure and fabric of Guliya ice cap in Tibetan plateau, and comparisons with Vostok 3G-1, EPICA DML, and North GRIP, Crystals, 7, 97, https://doi.org/10.3390/cryst7040097, 2017.
Li, Y., Keegan, K., and Baker, I.: Observations of creep of polar firn at different temperatures, The Cryosphere, 20, 981–1000, https://doi.org/10.5194/tc-20-981-2026, 2026.
Lipenkov, V. Y.: How air bubbles form in polar ice, Earth's Cryosphere, 22, 16–28, https://earthcryosphere.ru/archive/2018_2/eng_2018_2/02.Lipenkov_2_2018_eng.pdf (last access: 3 October 2026), 2018.
Liu, Q., Guo, W. Q., Nie, Y., Liu, S. Y., and Xu, J. L.: Recent glacier and glacial lake changes and their interactions in the Bugyai Kangri, southeast Tibet, Ann. Glaciol., 57, 61–69, https://doi.org/10.3189/2016AoG71A415, 2016.
Liu, S., Yao, X., Guo, W., Xu, J., Shangguan, D., Wei, J., Bao, W., and Wu, L.: The contemporary glaciers in China based on the Second Chinese Glacier Inventory, Acta Geographica Sinica, 70, 3–16, https://doi.org/10.11821/dlxb201501001, 2015.
Mahowald, N., Kohfeld, K., Hansson, M., Balkanski, Y., Harrison, S. P., Prentice, I. C., Schulz, M., and Rodhe, H.: Dust sources and deposition during the last glacial maximum and current climate: A comparison of model results with paleodata from ice cores and marine sediments, J. Geophys. Res.-Atmos., 104, 15895–15916, https://doi.org/10.1029/1999JD900084, 1999.
Montagnat, M., Castelnau, O., Bons, P. D., Faria, S. H., Gagliardini, O., Gillet-Chaulet, F., Grenoble, L., and Suquet, P.: Multiscale modeling of ice deformation behavior, J. Struct. Geol., 61, 78–108, https://doi.org/10.1016/j.jsg.2013.05.002, 2014.
Monz, M. E., Hudleston, P. J., Prior, D. J., Michels, Z., Fan, S., Negrini, M., Langhorne, P. J., and Qi, C.: Full crystallographic orientation (c and a axes) of warm, coarse-grained ice in a shear-dominated setting: a case study, Storglaciären, Sweden, The Cryosphere, 15, 303–324, https://doi.org/10.5194/tc-15-303-2021, 2021.
Nie, Y., Pritchard, H. D., Liu, Q., Hennig, T., Wang, W., Wang, X., Liu, S., and Chen, X.: Glacial change and hydrological implications in the Himalaya and Karakoram, Nature Reviews Earth and Environment, 2, 91–106, https://doi.org/10.1038/s43017-020-00124-w, 2021.
Overpeck, J., Rind, D., Lacis, A., and Healy, R.: Possible role of dust-induced regional warming in abrupt climate change during the last glacial period, Nature, 384, 447–449, https://doi.org/10.1038/384447a0, 1996.
Perutz, M. F. and Seligman, G.: A crystallographic investigation of glacier structure and the mechanism of glacier flow, P. Roy. Soc. Lond. A Mat., 172, 335–360, https://doi.org/10.1098/rspa.1939.0108, 1939.
Ram, M., Stolz, M., and Koenig, G.: Eleven year cycle of dust concentration variability observed in the dust profile of the GISP2 ice core from Central Greenland: Possible solar cycle connection, Geophys. Res. Lett., 24, 2359–2362, https://doi.org/10.1029/97GL02521, 1997.
Rigsby, G. P.: Crystal fabric studies on Emmons Glacier, Mount Rainier, Washington, J. Geol., 59, 590–598, https://doi.org/10.1086/625914, 1951.
Rigsby, G. P.: Crystal orientation in glacier and in experimentally deformed ice, J. Glaciol., 3, 589–606, https://doi.org/10.3189/S0022143000023716, 1960.
Ronneberger, O., Fischer, P., and Brox, T.: U-Net: Convolutional Networks for Biomedical Image Segmentation, in: Medical Image Computing and Computer-Assisted Intervention – MICCAI 2015, LNCS 9351, edited by: Navab, N., Hornegger, J., Wells, W., and Frangi, A., Springer, Cham, 234–241, https://doi.org/10.1007/978-3-319-24574-4_28, 2015.
Sakai, A. and Fujita, K.: Contrasting glacier responses to recent climate change in high-mountain Asia, Sci. Rep.-UK, 7, 13717, https://doi.org/10.1038/s41598-017-14256-5, 2017.
Schaller, C. F., Freitag, J., and Eisen, O.: Critical porosity of gas enclosure in polar firn independent of climate, Clim. Past, 13, 1685–1693, https://doi.org/10.5194/cp-13-1685-2017, 2017.
Spencer, M. K., Alley, R. B., and Fitzpatrick, J. J.: Developing a bubble number-density paleoclimatic indicator for glacier ice, J. Glaciol., 52, 358–364, https://doi.org/10.3189/172756506781828638, 2006.
Stoll, N., Eichler, J., Hörhold, M., Shigeyama, W., and Weikusat, I.: A review of the microstructural location of impurities in polar ice and their impacts on deformation, Front. Earth Sci., 8, 615613, https://doi.org/10.3389/feart.2020.615613, 2021.
Svensson, A., Baadsager, P., Persson, A., Hvidberg, C. S., and Siggaard-Andersen, M. L.: Seasonal variability in ice crystal properties at NorthGRIP: a case study around 301 m depth, Ann. Glaciol., 37, 119–122, https://doi.org/10.3189/172756403781815582, 2003.
Svensson, A., Nielsen, S. W., Kipfstuhl, S., Johnsen, S. J., Steffensen, J. P., Bigler, M., Röthlisberger, R., and Fischer, H.: Visual stratigraphy of the North Greenland Ice Core Project (NorthGRIP) ice core during the last glacial period, J. Geophys. Res.-Atmos., 110, D02107, https://doi.org/10.1029/2004JD005134, 2005.
Thompson, L. G., Yao, T., Davis, M. E., Henderson, K. A., Mosley-Thompson, E., Lin, P.-N., Beer, J., Synal, H.-A., Cole-Dai, J., and Bolzan, J. F.: Tropical climate instability: The last glacial cycle from a Qinghai-Tibetan ice core, Science, 276, 1821–1825, https://doi.org/10.1126/science.276.5320.1821, 1997.
Tison, J. L. and Hubbard, B.: Ice crystallographic evolution at a temperate glacier: Glacier de Tsanfleuron, Switzerland, Geological Society, London, Special Publications, 176, 23–38, https://doi.org/10.1144/GSL.SP.2000.176.01.03, 2000.
Weikusat, I., Kipfstuhl, S., Faria, S. H., Azuma, N., and Miyamoto, A.: Subgrain boundaries and related microstructural features in EDML (Antarctica) deep ice core, J. Glaciol., 55, 461–472, https://doi.org/10.3189/002214309788816614, 2009.
Weikusat, I., Kuiper, E.-J. N., Pennock, G. M., Kipfstuhl, S., and Drury, M. R.: EBSD analysis of subgrain boundaries and dislocation slip systems in Antarctic and Greenland ice, Solid Earth, 8, 883–898, https://doi.org/10.5194/se-8-883-2017, 2017.
Weiss, J., Vidot, J., Gay, M., Arnaud, L., Duval, P., and Petit, J. R.: Dome Concordia ice microstructure: impurities effect on grain growth, Ann. Glaciol., 35, 552–558, https://doi.org/10.3189/172756402781816573, 2002.
Wilson, N. J., Vreugdenhil, C. A., Gayen, B., and Hester, E. W.: Double-diffusive layer and meltwater plume effects on ice face scalloping in phase-change simulations, Geophys. Res. Lett., 50, e2023GL104396, https://doi.org/10.1029/2023GL104396, 2023.
Yao, T., Thompson, L., and Yang, W.: Different glacier status with atmospheric circulations in Tibetan Plateau and surroundings, Nat. Clim. Change, 2, 663–667, https://doi.org/10.1038/nclimate1580, 2012.
Zhang, W., Han, J., Xie, Z., Wang, X., Lluberas, A., and Goto-Azuma, K.: A preliminary study of ice texture and fabric on an ice core to the bedrock extracted from Glacier No. 1 at the headwater of Urumqi River, Tianshan, China, Bulletin of Glacier Research, 11, 9–15, 1993.