
the Creative Commons Attribution 4.0 License.
the Creative Commons Attribution 4.0 License.
 | 06 Oct 2026
Mechanisms and patterns of snow depth and land surface temperature interactions in arid mountains: coupling coordination and lagged responses across Xinjiang, China

Xiaolong Bao
Shiqi Lu
Yi Chu
Jun Lu
Mengge Xiao
Xuelei Lei
Snow depth (SD) and land surface temperature (LST) interact through energy and mass exchanges that govern meltwater supply in arid mountain regions, yet the strength, quality, and timing of this interaction remain poorly quantified across topographically complex terrain. Here we develop a diagnostic framework that integrates coupling coordination analysis with time-lagged cross-correlation to simultaneously assess, between SD and LST, the intensity of their systemic association (coupling degree, CD), the harmony of their co-evolution (coupling coordination degree, CCD), and the spatiotemporal scales of their lagged response. Applied across the mountain-basin systems of Xinjiang, China, using long-term remote sensing and reanalysis data, the framework reveals three principal findings. First, SD-LST interactions are organized along a hierarchical environmental gradient: broad climatic setting shapes the north–south potential for coupling, while elevation modulates this pattern in southern ranges and local factors shape east–west variations in lagged responses. Second, a systematic decoupling emerges between interaction strength and system coordination – most notably in the southern Tianshan, where high CD coincides with low and declining CCD, suggesting that strong thermal forcing is no longer matched by sustainable snowpack evolution. Third, response lags exhibit distinct regional signatures: long and stable lags (14–22 d) in the snow-rich Altai reflect high thermal inertia; the Tianshan shows a north–south asymmetry with significant spring lag lengthening on the south slope; and the Kunlun displays elevation-threshold behavior, where coordination improves only above ∼3500 m. These lag patterns serve as empirical indicators of snowpack buffering capacity and its regional variation. As a diagnostic tool, the framework provides quantifiable, spatially explicit metrics for evaluating snow thermal schemes in land surface models and identifying climate-vulnerable zones in water-limited mountain regions.
- Article
(10007 KB) - Full-text XML
- BibTeX
- EndNote


Understanding the interaction between snow depth (SD) and land surface temperature (LST) is critical for predicting hydrological responses and climate feedbacks in snow-dominated regions. Snowpack governs surface energy budgets through its high albedo and low thermal conductivity, while modulating water availability via accumulation and melt (Barnett et al., 2005; Essery, 2013). Snow depth integrates meteorological forcing and snowpack evolution, while LST provides the primary thermal forcing that drives snowmelt (Lehning et al., 2002a, b; Marks and Dozier, 1992; López-Moreno et al., 2013; Male and Gray, 1981). As the direct thermal boundary condition at the snow surface, LST governs energy exchange that drives melt, making the SD-LST relationship critical for understanding snowpack responses to climate forcing (Arias et al., 2021; Musselman et al., 2017). Their co-evolution – rather than either variable in isolation – determines snowmelt timing and magnitude, snow-albedo feedback stability, and water resource vulnerability.
The Xinjiang Uygur Autonomous Region is a hydrologically critical zone in arid Central Asia, encompassing a unique mountain–basin system comprising the Altai, Tianshan, and Kunlun ranges, along with the intervening Junggar and Tarim Basins (Chen et al., 2015). This configuration creates a natural laboratory with pronounced climate, topographic, and snow accumulation gradients (Zhang et al., 2019). The region's water security depends fundamentally on snowmelt from these mountains. However, snowpack responses to thermal forcing across different mountain ranges and elevation zones remain poorly quantified at process-relevant scales. The complex interplay between continental climate and extreme topography generates heterogeneous SD-LST interactions that challenge existing models (Li et al., 2020; Wang et al., 2022).
The SD-LST interaction is inherently complex – exhibiting non-linearities, hysteresis, and strong spatiotemporal heterogeneity (Beniston et al., 2018). Interactions between SD and LST include both immediate thermodynamic adjustments and delayed hydrological feedbacks that vary systematically with elevation, season, and regional climate. For instance, in the Tianshan Mountains, warming has reduced snow duration, delayed accumulation, and accelerated melt (Aizen et al., 2007). The snowpack also possesses a memory effect: the influence of temperature on snow depth persists over time, meaning that the true strength of SD-LST interaction depends on when the thermal forcing occurred; snow can introduce significant lags in thermal responses (Zhang et al., 2021; Li et al., 2016). These elevation-dependent and seasonally variable patterns are widely observed in other mountain ranges as well (Immerzeel et al., 2010; Pepin et al., 2015). Given this complexity, we focus on LST as the primary thermal forcing variable in our diagnostic framework. LST represents the direct boundary condition at the snow surface and is available from the TRIMS dataset as a long-term, gap-free, high-resolution product that can be resampled to match our 500 m snow depth data.
A range of analytical methods have been developed to examine snow–climate relationships, broadly falling into two categories: those that characterize correlation or coherence structures – including correlation analysis, wavelet coherence, and spectral methods (Grinsted et al., 2004; Li et al., 2022) – and those that infer causal or predictive links, such as Granger causality and convergent cross-mapping (Granger, 1969; Sugihara et al., 2012; Kim et al., 2025). These methods have advanced our understanding – for example, by revealing time-lagged responses or directional dependencies – but they differ from a diagnostic framework that jointly assesses interaction intensity, coordination quality, and response timing.
Specifically, the prevailing analytical paradigm relying on statistical correlations harbors two fundamental limitations (Clark et al., 2011; see also Mudelsee, 2019) when applied to snow-climate systems. First, it treats SD and LST as separate variables rather than as an interacting system, and thus does not distinguish whether the system evolves synergistically or fluctuates erratically under stress. A strong negative correlation could arise from either a deep snowpack that buffers temperature fluctuations and melts gradually, or a thin snowpack that collapses rapidly under warming – yet correlation treats these scenarios identically, masking the distinction between coupling intensity and coordination quality. Second, this approach overlooks the temporal dimension of snow-temperature interactions. Heat propagates through the snowpack at a rate determined by its depth, density, and liquid water content; correlation-based methods do not systematically quantify how response times vary across regions, seasons, and elevations – information essential for understanding snowpack thermal inertia and memory effects. While Granger causality and convergent cross-mapping can infer directional influences, they are not designed to evaluate whether a strongly interacting system is evolving in a coordinated, healthy manner or is under stress. This propagation delay – from near-zero in shallow ephemeral snow to weeks in deep, cold snowpacks – highlights the need for a framework that jointly diagnoses coupling strength, coordination quality, and response timescales.
To address these questions, this study proposes an integrated analytical framework combining the Coupling Coordination Degree Model and time-lagged cross-correlation analysis, aiming to answer three key questions: (1) Is the SD-LST system maintaining stable, sustainable co-evolution under warming, or has it shifted toward a maladaptive, unsustainable state? (2) What hierarchical control structure – from macro-scale climate to micro-scale local factors – determines the spatial pattern of snow-temperature coupling strength across mountain ranges? (3) What are the characteristic response timescales of SD to thermal forcing, and how do they vary across seasons, elevations, and mountain ranges?
Building on this framework, we apply it using long-term, high-resolution remote sensing data to systematically investigate SD-LST interactions across Xinjiang, quantifying: (1) the degree of coupling; (2) the coordination level across seasons and topographic settings; and (3) the spatiotemporal patterns of response lags. This investigation makes three primary contributions: it establishes a quantitative understanding of snowpack responses to thermal forcing across Central Asia's most critical region; it introduces an analytical framework combining coupling, coordination, and lag analysis applicable to other snow-dominated regions; and it reveals that these interactions are governed by a hierarchical control system from macro-climate to micro-topography, providing a transferable framework for diagnosing snow-climate vulnerability in other arid mountains.
Critically, the joint use of coupling coordination and time-lag analysis offers diagnostic power that neither metric alone can achieve. Time lags quantify snowpack thermal inertia, while CCD reveals whether that inertia reflects a healthy, well-buffered system or a dysfunctional one under stress. Their combination identifies regions where strong thermal forcing no longer matches sustainable snowpack evolution – an early warning of emerging vulnerability. Applied across Xinjiang's mountain-basin systems, this framework delivers practical outputs: lag and CCD maps help distinguish predictable versus erratic snowmelt, informing forecast lead time adjustments; elevation-dependent CCD thresholds and directional lag changes provide empirical targets for calibrating snow thermal schemes in land surface models (e.g., Noah-MP, VIC); and the decoupling between high CD and low CCD serves as an indicator for targeted monitoring of climatically vulnerable regions. By translating complex snow-climate interactions into measurable, region-specific metrics, this work bridges cryospheric research and operational climate adaptation.
2.1 Study area
The Xinjiang Uygur Autonomous Region (73°40′–96°18′ E, 34°25′–48°10′ N) encompasses approximately 1.66×10⁶ km2 in the arid interior of Eurasia. Its terrain is organized into a distinct sequence of six north–south oriented units: the Altai Mountains (N1), Junggar Basin (N2), northern and southern Tianshan Mountains (N3 and S1), Tarim Basin (S2), and Kunlun Mountains (S3) (Fig. 1). This configuration drives extreme contrasts in climate – from the humid alpine zones of the northern mountains to the hyper-arid Tarim Basin – and creates corresponding gradients in snow accumulation and persistence. The regional snowline elevation reflects this variability, ranging from approximately 3200 m in the Altai to 3230–4290 m in the Tianshan (Hu, 2004). As a region containing roughly one-third of China's snow water resources (Marchane et al., 2015; Xuezhi et al., 2000), Xinjiang provides an ideal setting for examining snow–climate interactions across pronounced environmental gradients.
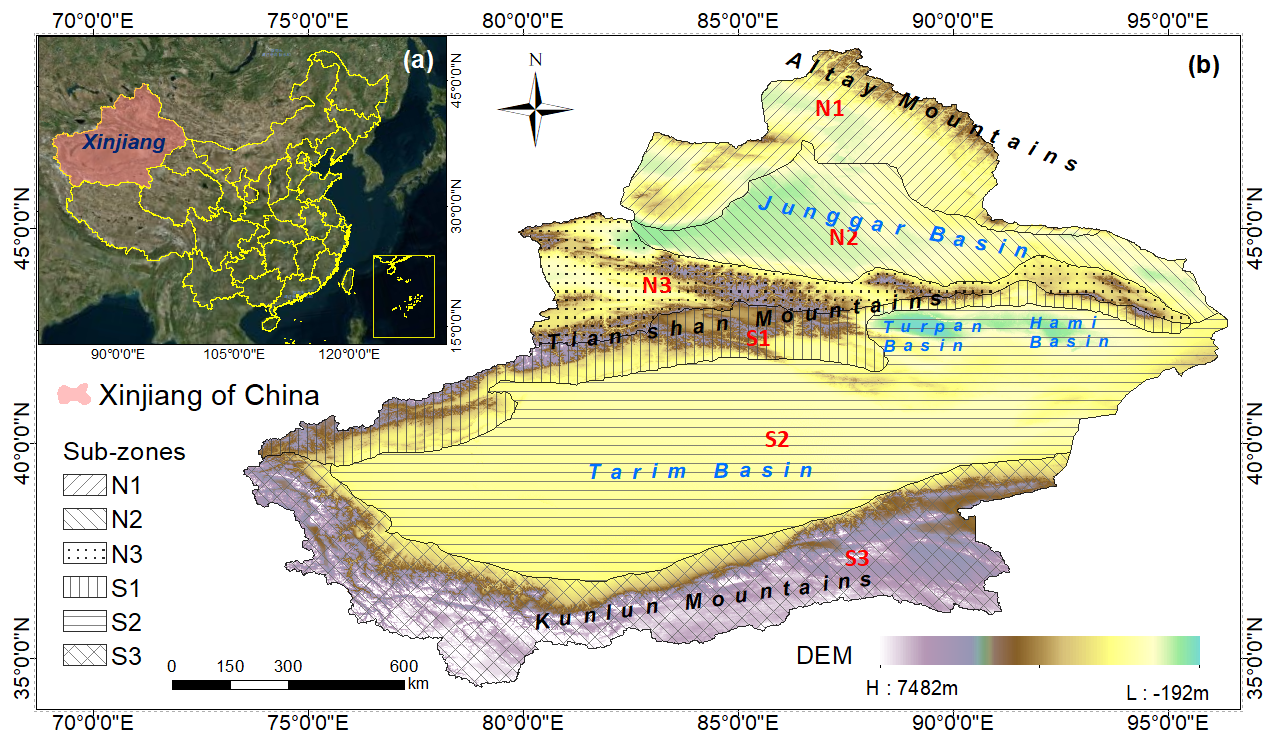
Figure 1Map of the study area. (a) Location of Xinjiang Uygur Autonomous Region in China (satellite base map obtained from Tianditu, National Geospatial Information Service Platform of China). (b) The six sub-regions of Xinjiang that constitute the study area (drawn by the author).
To systematically examine how snow depth (SD) and land surface temperature (LST) respond differently across contrasting climatic and topographic settings, we delineated the Tianshan Mountains into northern and southern slope units based on the mountain ridge line. The northern slope (N3) falls within the mid-temperate arid zone of northern Xinjiang, whereas the southern slope (S1) belongs to the warm-temperate arid zone of southern Xinjiang. This division, combined with the broader regional classification, resulted in six distinct geographical-climatic sub-regions used for subsequent comparative analysis.
2.2 Data source
2.2.1 Downscaled snow depth (SD) dataset
The daily snow depth dataset used in this study is a downscaled product at 500 m spatial resolution over Xinjiang for the period 2000–2020. The dataset was produced using a random forest machine learning approach, integrating multiple source datasets. The primary training target was the 25 km long-term snow depth dataset from the National Tibetan Plateau Data Center (China). Remote sensing inputs included 500 m MODIS daily snow cover data (MOD10A1), 10 km AMSR2 satellite snow water equivalent data, and 4 km IMS snow/ice data. Topographic variables (elevation, slope, aspect, and surface roughness) were derived from SRTM DEM (90 m) via the Geospatial Data Cloud platform. Additional predictor variables included MOD13A1 NDVI data from Earthdata, land surface temperature, and meteorological data. Spatial location and snow cover days were also incorporated as auxiliary predictors. The final product provides daily snow depth at 500 m resolution for the period 2000–2020, with cloud removal applied to minimize data gaps. This 500 m daily product was developed by the authors; detailed methodological descriptions and validation procedures are available in the referenced data repository at the National Cryosphere Desert Data Center of China. The dataset is publicly accessible under the same citation as the original data product.
2.2.2 Land surface temperature (LST) data
Land surface temperature (LST) data were obtained from the Thermal and Reanalysis Integrating Moderate-resolution Spatial-seamless (TRIMS) LST dataset, available through the National Tibetan Plateau Data Center. This dataset integrates Terra/Aqua MODIS LST products and Global Land Data Assimilation System (GLDAS) data, with supplementary variables including satellite-derived vegetation indices and surface albedo. The TRIMS reconstruction method combines high-frequency and low-frequency LST components with spatial correlation information from thermal infrared remote sensing and reanalysis sources to generate a gap-free, all-weather LST product at 1 km spatial resolution and twice-daily temporal resolution. To ensure consistency with the snow depth dataset, daily mean LST values were computed from daytime and nighttime overpasses and spatially resampled to a uniform 500 m grid.
3.1 Coupling Coordination Degree Model
The concept of coupling, derived from physics, describes the phenomenon of mutual influence and interaction between two or more systems (Song et al., 2020). Building upon this, the notion of coupling coordination expands the framework to represent how systems can co-evolve toward a more ordered, synergistic state (Song et al., 2020). This approach has been effectively adapted to investigate interdependent systems across various fields, including ecology, geography, and economics (Lai et al., 2020; Zhao et al., 2025).
The Coupling Coordination Degree Model (CCDM) is an analytical framework that quantifies such relationships through two key metrics: the Coupling Degree (CD) and the Coupling Coordination Degree (CCD) (Huang et al., 2020; Liu et al., 2005). The CD measures the strength of association and mutual influence between systems, while the CCD further assesses the degree to which their development is harmonized. In this study, we apply the CCDM to analyze the interaction between SD and LST. Prior to calculation, both SD and LST time series at each grid cell were normalized to the [0,1] range using min-max normalization to eliminate the effects of differing units and magnitudes. The normalization was performed separately for each grid cell across the 20-year study period to preserve spatial heterogeneity in the relative variability of each variable. The CD is calculated as follows:
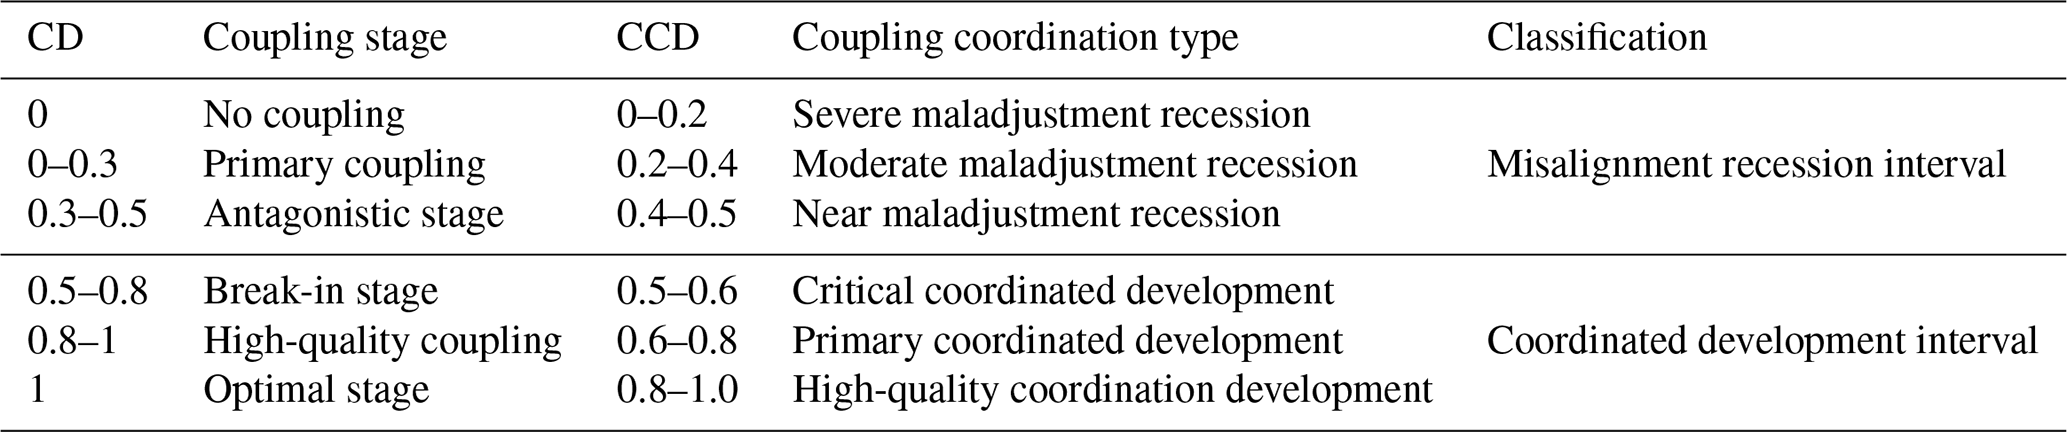
where S and E represent the SD and LST, respectively, and C denotes the coupling degree. In the CCDM framework, CD quantifies the intensity of mutual influence between two subsystems, irrespective of the direction or quality of that exchange; it ranges from 0 to 1, with higher values indicating stronger interdependence. In the context of our SD-LST system, a high CD (>0.8) indicates that temperature changes are closely mirrored by snow depth variations, reflecting efficient energy transfer at the snow surface. A low CD (<0.3) indicates weak or decoupled interaction, where thermal forcing does not translate into detectable snowpack response – either due to snow absence or to other factors overriding the temperature control. However, CD alone does not distinguish whether this interdependence is sustainable or stressful; it only reflects interaction strength.
To assess coordinated development, CCD is introduced, which evaluates both interaction magnitude and mutual promotion/restraint (Huang et al., 2020). In the CCDM framework, CCD assesses the degree of harmonious co-evolution between two subsystems – quantifying not just whether they interact, but whether that interaction is balanced, stable, and mutually adaptive. In our SD-LST system, a high CCD indicates that the snowpack and thermal regime are evolving in a coordinated manner: for example, a deep snowpack that buffers temperature fluctuations and melts gradually under warming, maintaining a stable energy balance. A low CCD indicates maladjustment or system stress – for instance, a thin snowpack that collapses rapidly under thermal forcing, with no buffering capacity remaining to moderate the response. Thus, CCD provides a diagnostic measure of snow-thermal system health that complements the intensity-based information provided by CD. The calculation method is as follows:
where D denotes the CCD, ranging from 0 to 1. T represents the comprehensive evaluation index reflecting subsystem contributions. α and β (both set at 0.5 here) signify subsystem interaction weights. CD and CCD are classified via Meng et al.'s (2024) and Zhang et al.'s (2023) standards (Table 1).
Table 1Classification of coupling degree and coupling coordination degree.
For grid cells where mean snow depth was consistently below 1 cm throughout the study period, these pixels were excluded from the CD, CCD, and lag correlation analyses to avoid spurious results arising from near-zero values. These areas are indicated as snow-free in the relevant figures. For pixels with intermittent snow cover (i.e., snow present in some seasons but not others), the analyses were conducted on a seasonal basis using only the days when snow was present, ensuring that the calculated metrics reflect actual snow-temperature interactions rather than artifacts of snow absence.
3.2 Time-Lagged Cross-Correlation Analysis
To quantify the time-lagged interactions between SD and LST, we employed a time-lagged cross-correlation approach (Wasserman, 2004). This method extends conventional cross-correlation analysis by measuring the linear association between two time series at different temporal offsets (lags), thereby capturing both instantaneous and delayed interactions. The model is applicable in bivariate settings and can be extended to multivariate contexts to account for lagged effects within coupling systems.
In this study, we apply this approach to characterize the dynamic interplay between SD and LST, specifically to identify the time lag at which their correlation is strongest and to evaluate the direction and magnitude of lagged responses. The cross-correlation coefficient R between SD and LST across varying time lags is computed as follows:
where Rk(X,Y) denotes the correlation coefficient sequence between LST (Xi) and SD (Yi) at lag k, where n is the sequence length and (empirically determined). At k=0, SD responds instantaneously to LST, indicating synchronized evolution. The formula for computing the maximum cross-correlation coefficient and corresponding lag time for each k is as follows:
where R1 denotes the maximum correlation coefficient between SD and LST at lag k1, while R2 is the minimum at k2. R and K represent the peak cross-correlation coefficient and corresponding lag time, respectively. Lag time categories are: K=0 (fastest, no delay), (fast), (medium), and (slow). Shorter lags indicate faster SD response to LST, with zero lag implying instantaneous response.
3.3 Trend Analysis
To quantify long-term changes in snow depth (SD), land surface temperature (LST), CD, CCD, and lag times, we applied Sen's slope estimation combined with the Mann–Kendall significance test. Sen's slope estimator calculates the median of all pairwise slopes between data points, providing a robust trend magnitude that is insensitive to outliers and does not assume normality of the data distribution (Sen, 1968). For a time series with n data points, the slope between any two points i and j (i<j) is computed as:
The overall trend slope β is the median of all pairwise slopes:
Statistical significance of the observed trends was assessed using the Mann–Kendall test, a non-parametric test for monotonic trends that does not require normally distributed data (Mann, 1945; Kendall, 1975). The test statistic S is calculated as:
where if xj>xi, 0 if xj=xi, and −1 if xj<xi. For sample sizes n≥8, S is approximately normally distributed, and the standardized test statistic Z is computed to assess significance. A significance level of α=0.05 was used; trends with p<0.05 were considered statistically significant, and p-values between 0.05 and 0.10 were considered marginally significant. All trend analyses were performed on a per-pixel basis and then summarized by sub-region (N1–N3, S1–S3) for reporting.
4.1 Spatial-Temporal Patterns of SD and LST across Xinjiang
Figure 2 shows the interannual variations of annual average SD and LST across six sub-regions of Xinjiang over the 20-year study period. The 20-year mean SD (Fig. 2a) exhibits marked spatial heterogeneity, with deeper snowpacks predominantly located in the northern regions. The mean SD values for the six sub-regions were: N1=5.32 cm, N2=2.89 cm, N3=4.25 cm, S1=2.00 cm, S2=0.06 cm, and S3=1.58 cm. The highest mean SD occurred in N1 (5.32 cm), followed by N3 (4.25 cm) and N2 (2.89 cm), while the lowest was in S2 (0.06 cm). Overall, snow accumulation is most pronounced in the northern zones (N1, N3, N2) and the southern alpine zone (S3), showing a clear north-to-south gradient. Maximum accumulation occurs on the northern slopes of the Tianshan Mountains (N3), while the Tarim Basin (S2) remains largely snow-free throughout most of the year.
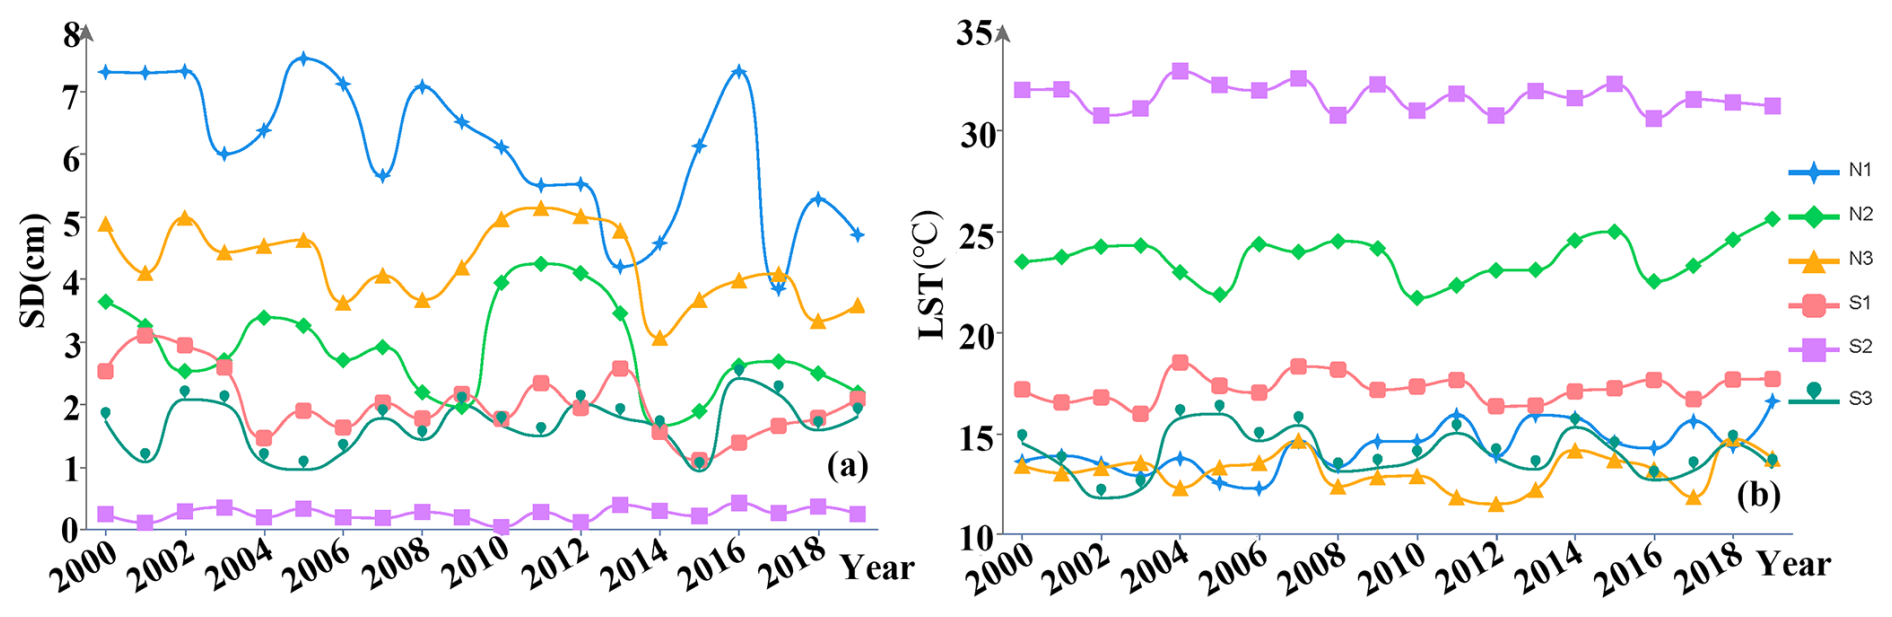
Figure 2Twenty-year trends of SD and LST for each of the six sub-regions. (a) Sub-regional trends of SD; (b) Sub-regional trends of LST.
To statistically verify these visual trends, we applied the Mann–Kendall test combined with Sen's slope estimation (Sect. 3.3). The results show that none of the six sub-regions exhibit statistically significant trends in SD at the 95 % confidence level (p>0.05 for all). Although several regions show directional tendencies – SD declining in N1–N3 and S1–S2 but slightly increasing in S3 – none of these tendencies are statistically robust. The Sen's slopes for SD were −0.039 cm yr−1 (N1), −0.015 cm yr−1 (N2), −0.026 cm yr−1 (N3), −0.031 cm yr−1 (S1), −0.001 cm yr−1 (S2), and +0.016 cm yr−1 (S3), with the largest declining tendency occurring in N1 and the only increasing tendency in S3.
Temporal trends of LST show differentiated variations across the six sub-regions (Fig. 2b). The highest mean annual LST values (>30 °C) occur in the arid Tarim Basin (S2), followed by the Junggar Basin (N2, >25 °C). The remaining mountain-dominated regions (S1, S3, N1, N3) maintain moderate LST regimes ranging between 10 and 18 °C. Temporal analysis indicates a consistent warming trend across all regions except S2, with interannual variability particularly pronounced in the mountainous zones. However, Mann–Kendall test results indicate that none of these LST trends are statistically significant at the 95 % confidence level (p>0.05 for all), with N2,N3,S1 and S2 showing weak increasing tendencies and N1 and S3 showing weak declining tendencies. The Sen's slopes for LST ranged from −0.018 °C yr−1 (S3) to 0.011 °C yr−1 (N3), indicating generally weak thermal trends across the region. The absence of significant trends in both SD and LST underscores the importance of using statistical significance tests rather than visual inspection alone to identify robust changes in these highly variable climate variables.
Scatter plot analyses were conducted to quantify the SD-LST interactions across the six sub-regions (Fig. 3). Each panel displays the scatter distribution, linear regression fit, 95 % confidence interval (shaded band), coefficient of determination (R2), and Spearman's rank correlation coefficient (ρ). In five of the six sub-regions (N1, N2, N3, S1, and S3), both Spearman's ρ and R2 indicate statistically significant negative correlations (p<0.01 for ρ; R2 ranging from 0.49 to 0.76, all p<0.001). The majority of data points fall within the confidence intervals, supporting the robustness of the inverse relationship. In contrast, no significant correlation is observed in S2 (Tarim Basin): (p≈1.0) and R2≈0 (p≈0.98), indicating no linear or monotonic relationship between SD and LST due to limited seasonal snow cover and persistently high LST.
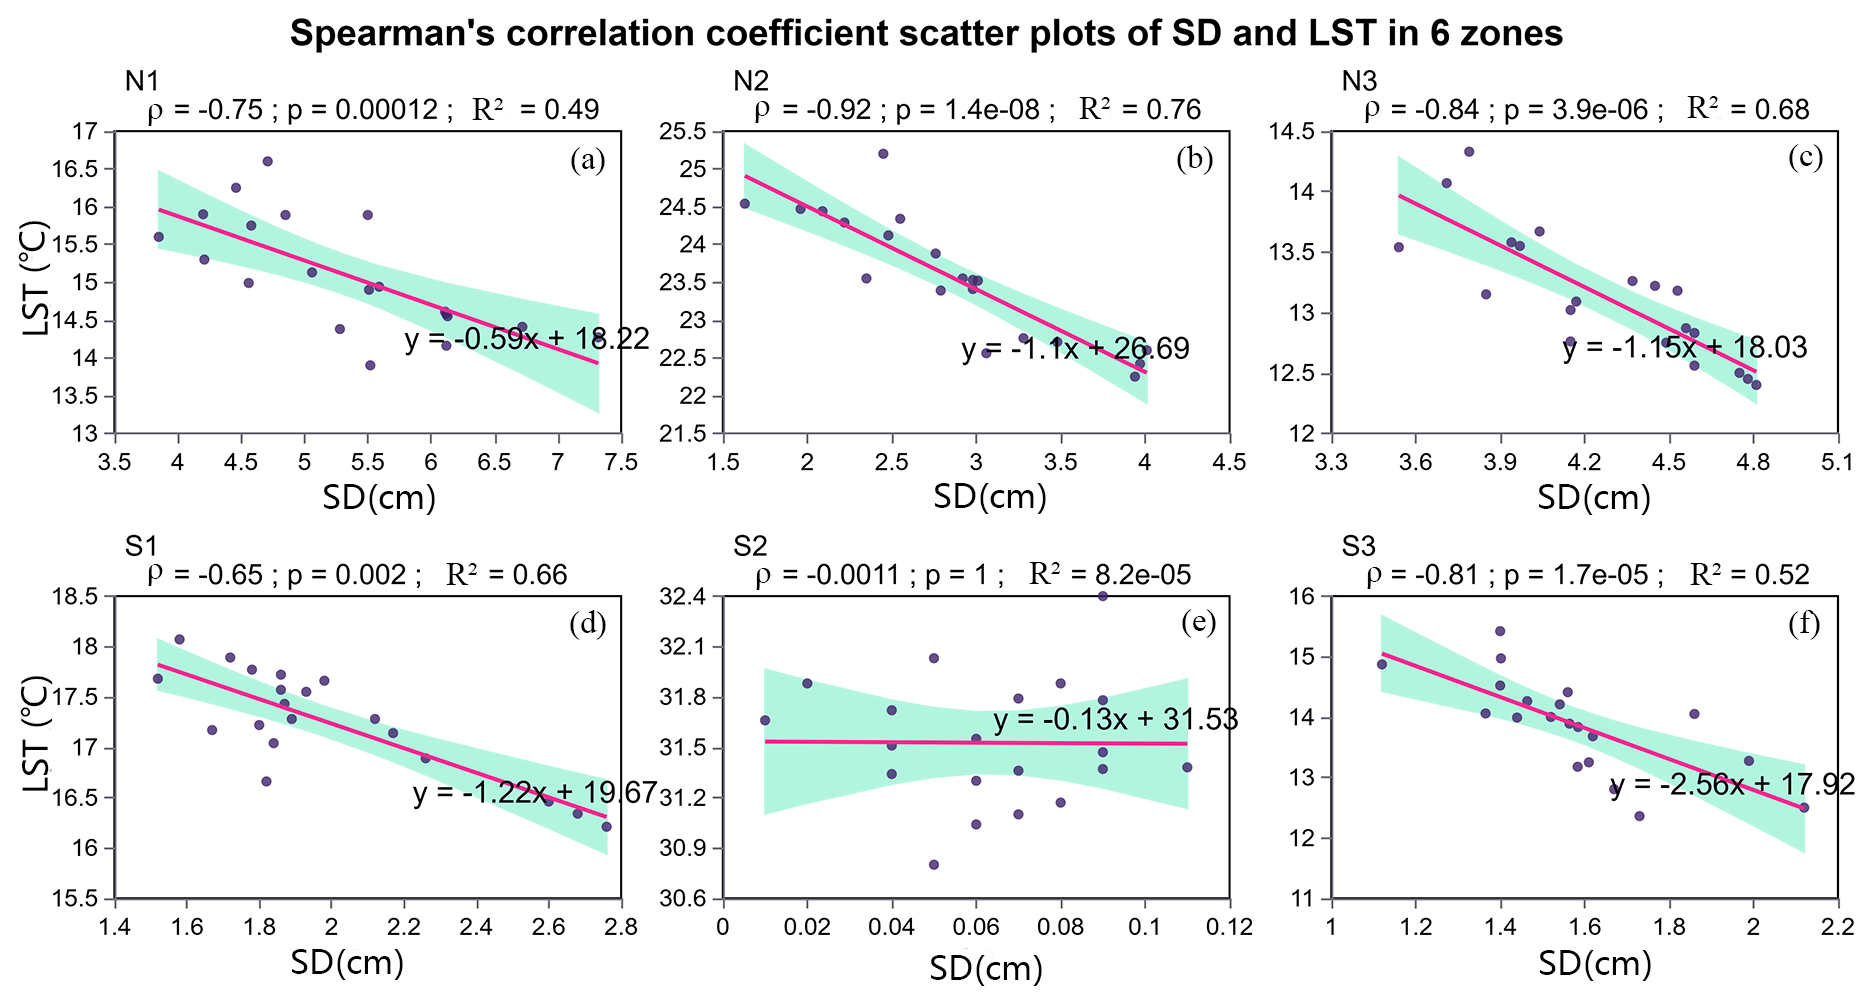
Figure 3Spearman's rank correlation (ρ) and linear regression (R2) between SD and LST for the six sub-regions over 20 years. Each subplot represents one sub-region, with ρ, p-value, and R2 indicated.
These results demonstrate that in snow-abundant regions of Xinjiang, SD is consistently negatively correlated with LST, though the strength of this relationship varies spatially. However, correlation alone does not elucidate the directionality, lagged responses, or synergistic interactions between the two variables. This highlights the necessity of employing more nuanced analytical frameworks – such as coupling coordination and time-lag models – to better characterize the underlying SD–LST interaction mechanisms across different geographical and climatic contexts.
4.2 Coupling and Coordination Characteristics of SD–LST Interactions
4.2.1 Coupling Dynamics Between SD and LST
As illustrated in Fig. 4a, the spatial distribution of SD–LST coupling degree across Xinjiang over the 20-year period can be categorized into four types: Primary, Antagonistic, Break-in, and High-quality coupling. The northern regions (N1, N2, and N3) are predominantly characterized by High-quality coupling and the Break-in stage, reflecting strong snow–temperature interaction. However, the central and eastern parts of N2 and N3 exhibit notably lower coupling degrees, primarily classified as Antagonistic or Primary types. To the east of N2, coupling generally transitions further toward lower levels. In southern Xinjiang, the coupling degree in the S1 and S3 regions exhibits a clear elevational gradient: lower elevation zones are primarily in the Primary or Antagonistic stage, shifting progressively to Break-in and ultimately High-quality coupling with increasing altitude. In contrast, low-elevation zones across all sub-basins consistently show low coupling levels, while most of the arid Tarim Basin (S2) remains in a low-coupling state throughout the study period.

Figure 4(a) Spatial distribution of average annual SD-LST coupling degree (CD) types across Xinjiang (see Table 1 for type definitions). (b) Spatial distribution of the 20-year annual trend in CD (Sen's slope, yr−1). The color scale indicates the magnitude of the trend, with warm colors representing significant increasing CD and cool colors representing significant decreasing CD.
Spatiotemporal trends in CD, quantified by Sen's slope on a per-pixel basis, are shown in Fig. 4b. Over the study period, most regions exhibited weak trends ( yr−1). A declining trend ( yr−1) was observed in the lower-altitude southern slopes of the Altai Mountains (N1), the western Tianshan Mountains (western S1), and localized zones of the S2. In contrast, increasing trends (slope>0.005 yr−1) occurred in scattered patches, primarily in the eastern sectors of N1, N2, S2, and S3, with the most pronounced strengthening (slope>0.01 yr−1) evident in eastern S3. Significance of these trends was assessed using the Mann–Kendall test (Sect. 3.3); only trends with p<0.05 are discussed as statistically significant.
In summary, the spatial coupling between SD and LST weakens from north to south across Xinjiang's mountain systems. The Altai Mountains (N1) maintained a consistently high and stable CD. Within the Tianshan ranges, CD values were significantly higher in the north than in the south, with a clear elevational gradient in the southern Tianshan and Kunlun Mountains, where CD increases with altitude. A notable declining trend ( yr−1) was observed in the western Tianshan, whereas the eastern Kunlun Mountains showed a gradual strengthening of coupling over time (slope>0.005 yr−1).
Figure 5 illustrates the altitudinal variation of CD across the six sub-basins in Xinjiang. In the Altai Mountains (N1), CD remains consistently within the High-quality coupling category across all elevations, exhibiting a non-linear pattern that increases to a peak between 2700 and 3800 m before declining slightly at higher altitudes. Similarly, the Tianshan northern slope region (N3) maintains high CD values, though it displays a subtle decrease at mid-elevations (1600–2700 m), followed by a gradual recovery toward higher elevations.

Figure 5Annual Variations of SD-LST CD Across Different Altitude Over 20 Years. Gray areas indicate elevations where snow cover is absent or insufficient for reliable CD calculation.
The most pronounced altitudinal increases in CD occur in the western Tianshan (S1) and Kunlun Mountains (S3), where values rise steeply from approximately 0.1 at lower elevations to nearly 1.0 in S1 and to around 0.6 in S3. In contrast, the Junggar Basin (N2) shows an inverse pattern, with CD generally ranging between 0.4 and 0.75 but decreasing with elevation. In the snow-scarce Tarim Basin (S2), overall CD remains low; however, a slight yet consistent positive correlation with altitude is observed. These altitudinal profiles highlight that the sensitivity of snow–temperature coupling to elevation varies substantially across different topographic and climatic settings, reinforcing the role of local environmental controls in modulating interaction strength.
4.2.2 Coupling Coordination Dynamics Between SD and LST
The spatial distribution of the 20-year mean CCD for the SD–LST system is shown in Fig. 6a. No regions within Xinjiang were classified under the High-Quality Coordination category during the study period. In northern Xinjiang (N1, N2, N3), CCD values are generally higher, dominated by Primary Coordination and Critical Coordination, though localized zones of Near-Maladjustment and Moderate-Maladjustment are present. In contrast, southern Xinjiang exhibits markedly lower coordination: S1 and S3 are primarily classified as Primary Coordination with interspersed zones of Moderate-Maladjustment, while most of the Tarim Basin (S2) falls under Severe-Maladjustment. Overall, the SD–LST interaction in northern Xinjiang tends toward coordinated states, whereas southern Xinjiang is characterized by varying degrees of maladjustment.
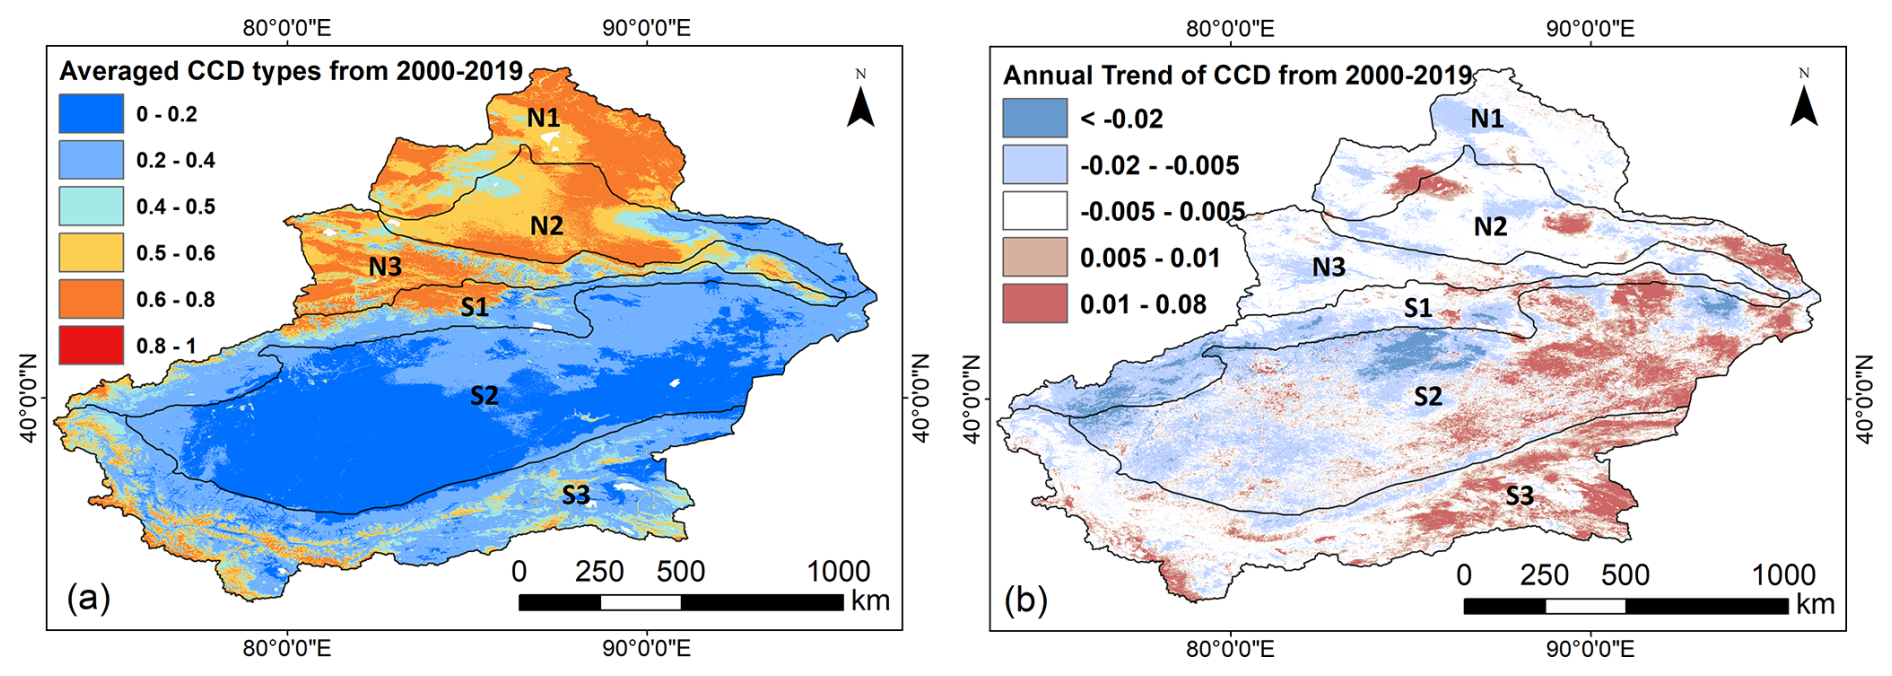
Figure 6(a) Spatial distribution of average annual SD-LST coupling coordination degree (CCD) types across Xinjiang (see Table 1 for type definitions). (b) Spatial distribution of the 20-year annual trend in CCD (Sen's slope, yr−1). The color scale indicates the magnitude of the trend, with warm colors representing significant increasing CCD and cool colors representing significant decreasing CCD.
Spatiotemporal trends in CCD, quantified by Sen's slope on a per-pixel basis, are shown in Fig. 6b. Although regional mean trends are generally weak ( yr−1), notable spatial heterogeneity in CCD change is evident. Within the major mountain systems, distinct patterns emerge: the Altai Mountains (N1) show relatively stable CCD (slope∼0.001 yr−1), whereas significant differences occur between the northern and southern Tianshan ranges. The western subregion of N3 exhibits a statistically significant declining trend ( yr−1, p<0.05), while the Kunlun Mountains (S3) show a pronounced increasing trend (slope>0.005 yr−1, p<0.05). These results indicate that, over the study period, the strongest and most improving coordination occurred in the Kunlun Mountains, followed by the Altai and northern Tianshan regions, whereas the southern and western Tianshan Mountains experienced a tendency toward declining coordination, reflecting spatially divergent SD–LST synergies across Xinjiang's complex topography.
Figure 7 illustrates the 20-year evolution of the SD–LST CCD across elevation gradients in Xinjiang, highlighting significant regional disparities. In the N1 region (Altai Mountains), CCD shows a positive correlation with elevation, peaking between 2700 and 3800 m, while declining gradually in the lower zone (0 to 1600 m). Conversely, in the N2 region (Junggar Basin), where snow is primarily distributed below 2700 m, CCD exhibits a consistent negative relationship with altitude, accompanied by a uniform declining trend across all elevations over the study period. The N3 region (northern Tianshan) follows a U-shaped altitudinal pattern, with CCD decreasing initially before increasing at higher elevations, yet it demonstrates overall temporal stability. In southern Xinjiang (S1, S2, S3), CCD increases markedly with elevation, yet the temporal trends diverge: S1 and S2 display a slight annual decline, while S3 (Kunlun Mountains) shows a gradual strengthening over time. These patterns indicate that although elevation exerts a dominant control on coordination strength in southern Xinjiang, the temporal evolution of SD–LST synergy varies regionally, with the Kunlun Mountains exhibiting the most pronounced buffering capacity against coordination loss.
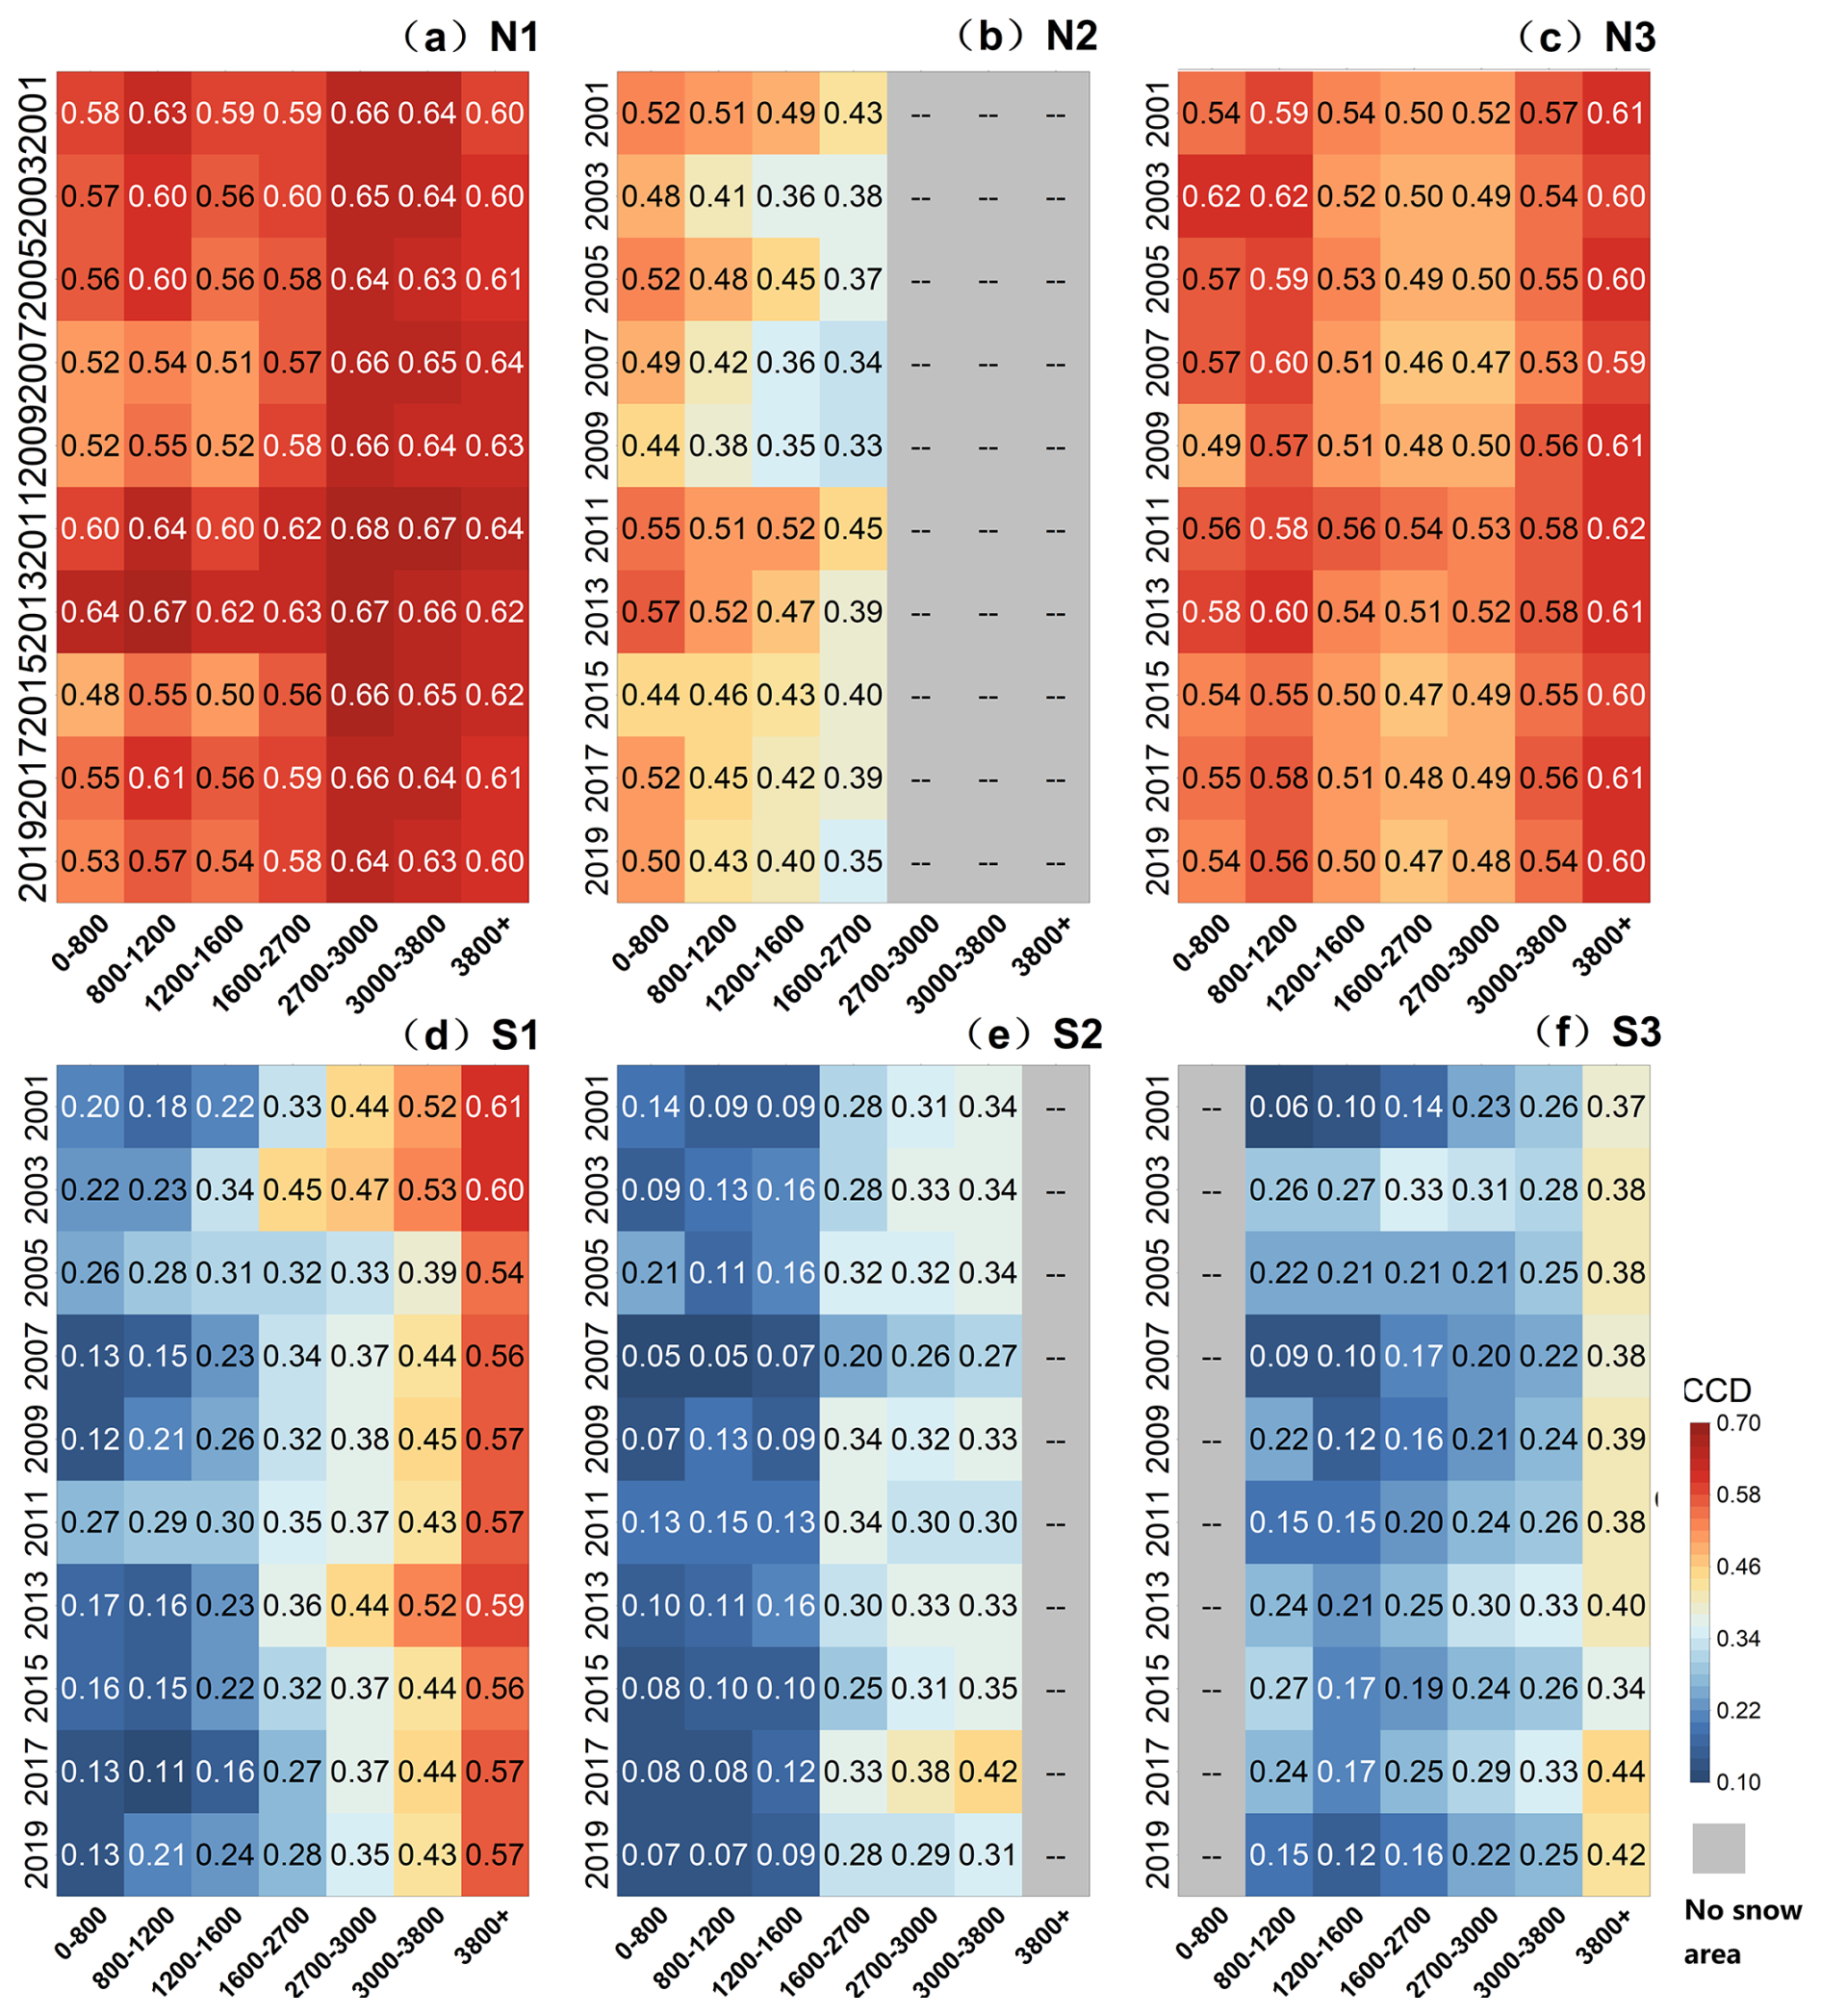
Figure 7Annual Variations of SD-LST CCD Across Different Elevations Over 20 Years. Gray areas indicate elevations where snow cover is absent or insufficient for reliable CCD calculation.
To further characterize the spatial pattern of CD-CCD mismatch, we examined the difference between the two metrics () across sub-regions and elevation zones (Fig. 8). The results reveal that Δ exhibits distinct elevational patterns that vary systematically across regions. In the Altay Mountains (N1), Δ remains stable across all elevations (0.21–0.31), indicating that coupling strength and coordination quality evolve in broad alignment regardless of altitude – suggesting a well-buffered system where snowpack properties and thermal forcing remain relatively synchronized throughout the vertical extent. In the Tianshan system, however, Δ exhibits strong elevational dependence: on the northern slope (N3), Δ is moderate at low elevations (0.20–0.28) but increases steadily above 2700 m, reaching 0.34 at >3800 m; on the southern slope (S1), a more complex pattern emerges, with Δ negative at low elevations (<1600 m, ranging from −0.044 to −0.035), crossing zero between 1600–2700 m, and rising sharply to 0.34 above 2700 m – a threshold-type transition from coordination-dominated at low elevations to coupling-dominated but poorly coordinated at high elevations that is unique to the southern Tianshan. In contrast, the Kunlun Mountains (S3) show a much more modest elevational response, with Δ turning from negative to positive only above 3000 m and reaching a maximum of 0.168, far lower than the Tianshan peaks – likely reflecting the limited snow cover and weaker thermal forcing in this hyper-arid environment. The two basins (N2, S2) exhibit near-zero Δ values throughout their snow-bearing elevations, confirming that the CD-CCD mismatch is primarily a mountain phenomenon. These patterns confirm that the CD-CCD mismatch is not a uniform phenomenon but is concentrated in specific topographic settings – particularly the Tianshan above 2700 m – and that the elevational expression of this mismatch differs fundamentally between regions: the southern Tianshan (S1) shows a threshold-type transition, the northern Tianshan (N3) shows a monotonic increase with altitude, and the Altay (N1) and Kunlun (S3) show either stable or muted responses.
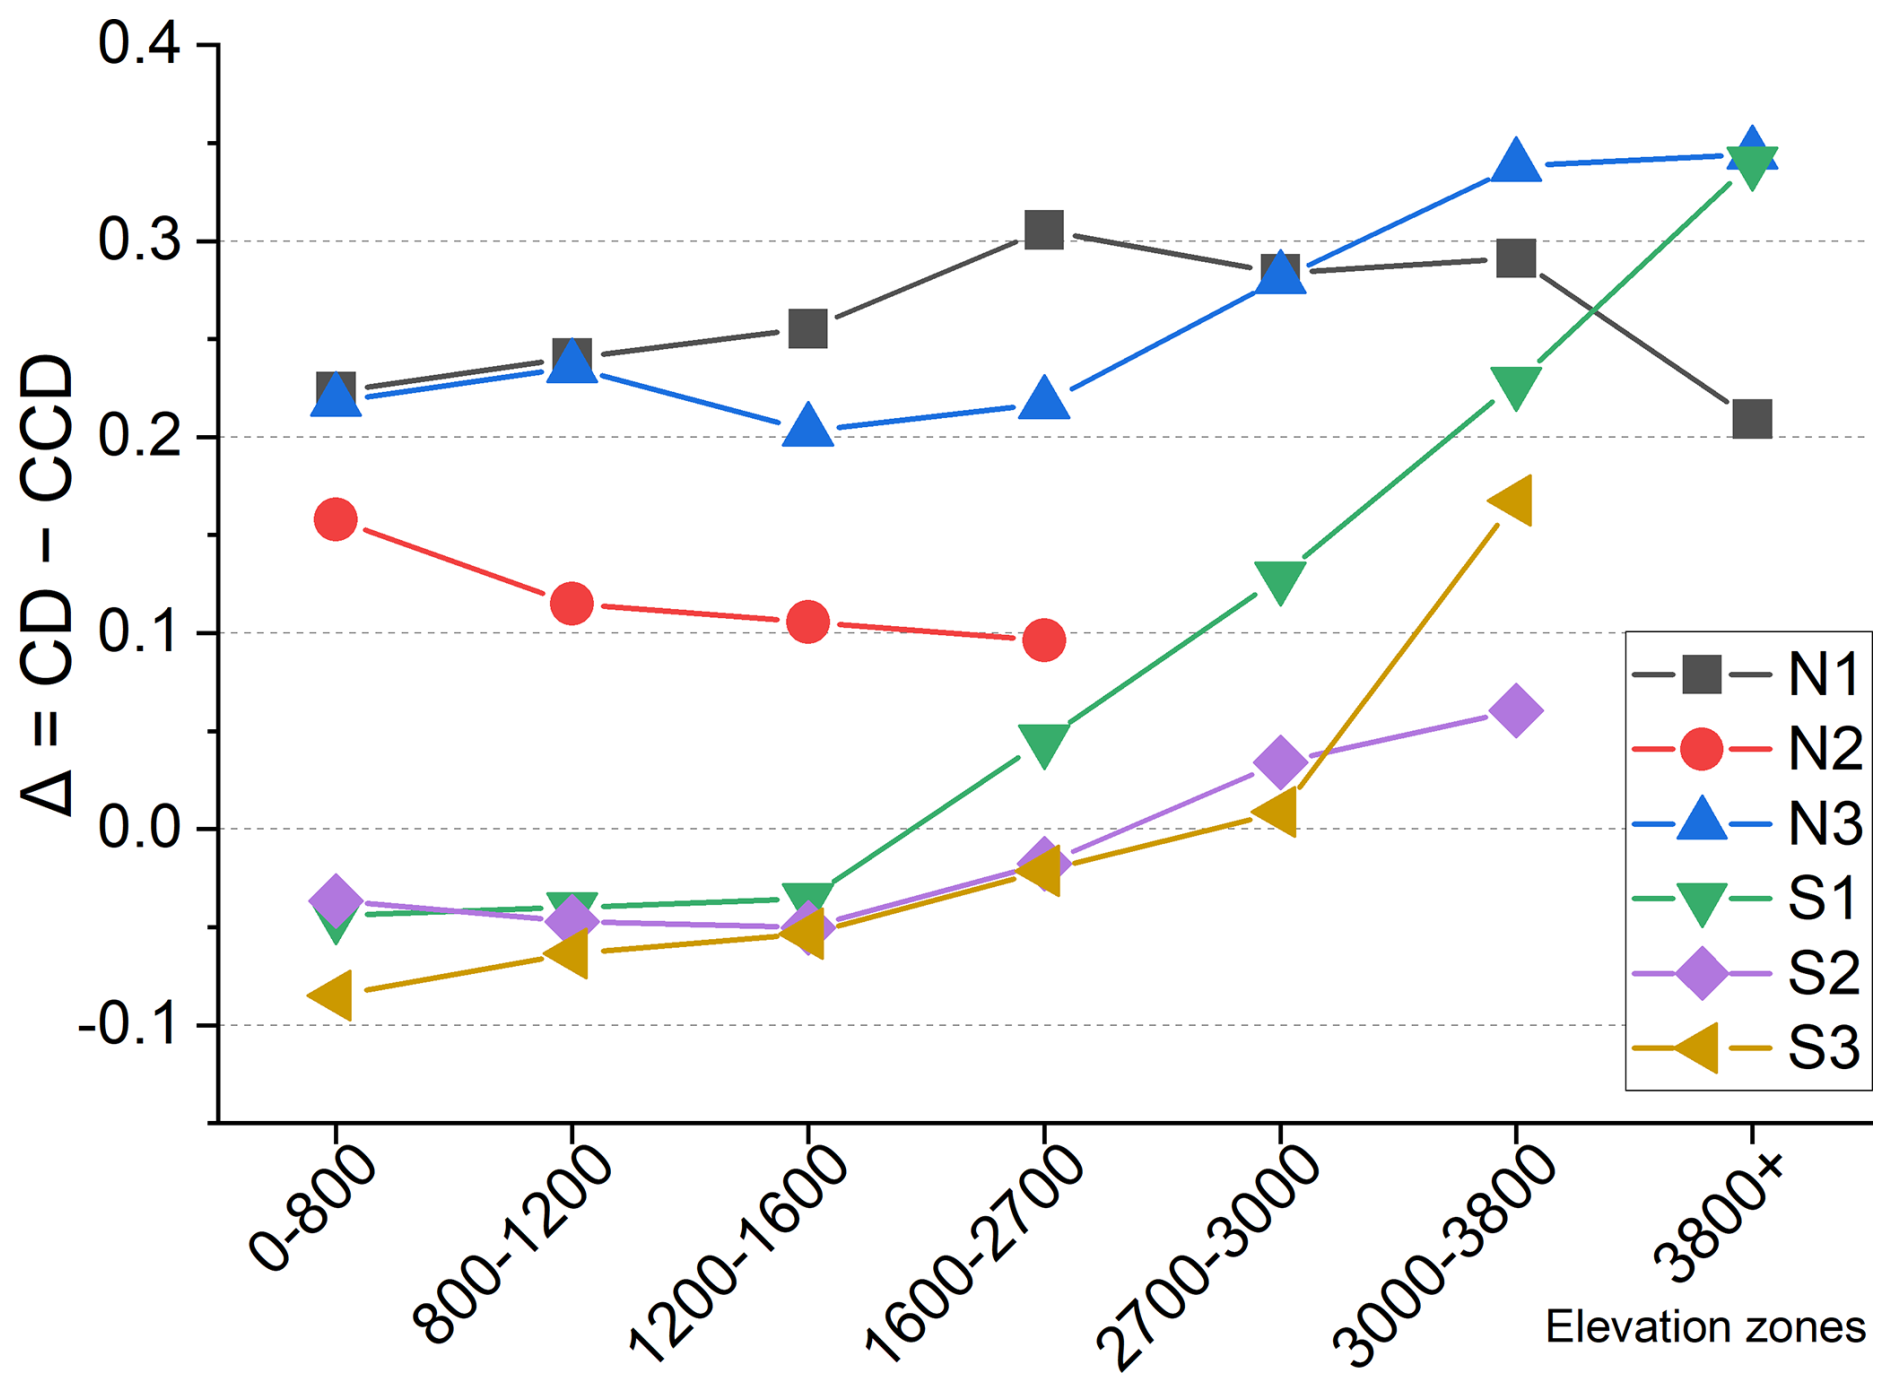
Figure 8Elevation-dependent differences between coupling degree (CD) and coupling coordination degree (CCD) across the six sub-regions ().
4.3 Spatiotemporal Patterns in the Lagged Response of LST to Snow Depth Changes
4.3.1 Overall Characteristics of the SD–LST Lag
The time-lagged correlation between SD and LST was quantified by identifying the specific lag (in days) at which their correlation reached a maximum or minimum. This lag period can be interpreted as an empirical indicator of the response time of SD to LST variation. We interpret these lag patterns as empirical indicators that may reflect differences in snowpack thermal properties, although direct attribution to specific physical processes would require complementary in situ measurements or process-based modeling. A spatial assessment was conducted to examine the distribution of these lag days across seasons, with results categorized and mapped in Fig. 9.
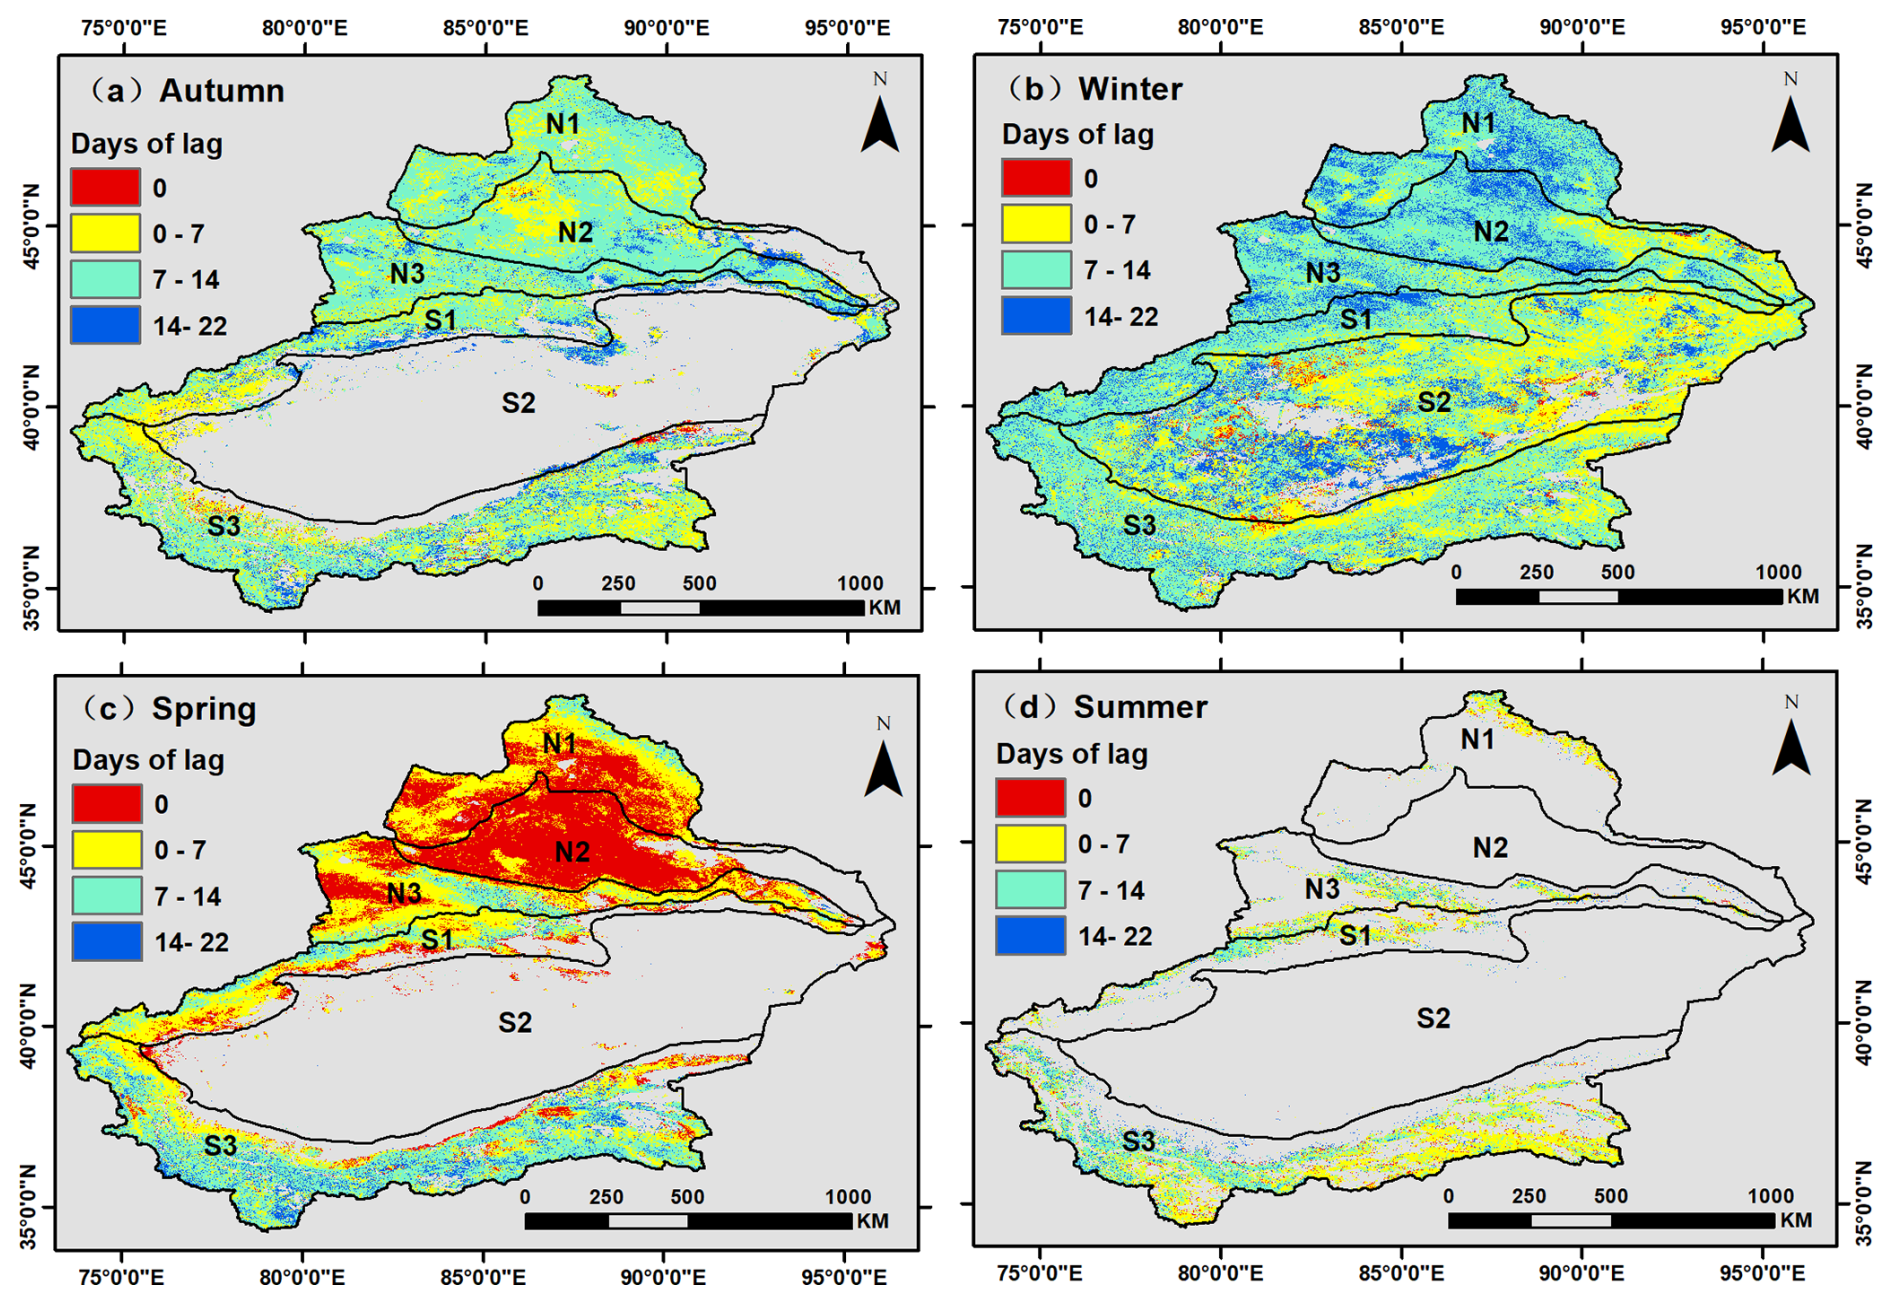
Figure 9Spatial Distribution of Annual Average Lagged Time of SD to LST Across Different Seasons.
Autumn (Fig. 9a): Snow cover was present except in the arid S2 region and eastern N2, where temperatures remain above freezing or wind-driven ablation prevails. The SD–LST lag time was typically 7 to 14 d across most of Xinjiang. Exceptions included: (1) central N2 and western S1, where lags shortened to 0 to 7 d, which may be associated with elevated terrain and shallow snow reducing thermal inertia; (2) southeastern S3, where similarly short lags resulted from enhanced solar radiation and patchy snow cover with lower albedo; and (3) localized areas in northern S3 near the Tarim Basin, which exhibited near-instantaneous (0 d) response under extremely arid, wind-compacted snow conditions.
Winter (Fig. 9b): Lag times increased significantly relative to autumn (mean=12.6 ± 4.3 d), with greater spatial variability (coefficient of variation = 34.2 %). In N1, N2, N3, and S1, a bimodal distribution emerged: 7 to 14 d lags dominated mid-elevations, while 14 to 22 d lags occurred at higher latitudes, consistent with a latitudinal gradient in snowpack thermal inertia. Within S2, lag times varied widely (0 to 22 d), influenced by topographic barriers and cold-air advection. S3 showed predominantly 7 to 14 d lags but exhibited a clear east–west contrast: eastern sectors consistently displayed shorter lags (0 to 7 d), which may be associated with higher afternoon solar radiation and differing synoptic cold-front frequencies.
Spring (Fig. 9c): A pronounced north–south gradient in lag days was observed, except in the largely snow-free S2 region. Lag duration generally increased from north to south. Notable patterns included: near-instantaneous response (0 d lag) across N2; shortening lags from 7–14 d in the north to 0 d in the south within N1 and S1; and an eastward extension of lags from 0 to 7 d to 7 to 14 d in N3. In S3, lags shortened from 7 to 14 d in the south to 0 to 7 d in the north, suggesting possible influences from precipitation or snow density gradients.
Summer (Fig. 9d): Snow persisted only in high-elevation zones of N1, N3, S1, and S3. Lag times within these areas ranged mainly between 0 to 14 d, with minimal latitudinal variation but a distinct longitudinal pattern: eastern sectors exhibited shorter lags (0 to 7 d), while western sectors showed longer delays (7 to 14 d), which may be associated with differences in topography, radiation regimes, or precipitation phase.
4.3.2 Altitudinal and Seasonal Variability of SD–LST Lag Times
For this analysis, seasons are defined as: spring (March–May), summer (June–August), autumn (September–November), and winter (December–February). Figure 10 presents the seasonal statistics of lag duration between SD and LST across elevation zones in each sub-basin. The analysis reveals that both the mean lag and its altitudinal dependence undergo pronounced seasonal reversals and regional contrasts.

Figure 10Seasonal Average Lagged Time of SD to LST in different elevations across sub-basins. (a) Autumn, (b) Winter, (c) Spring, (d) Summer.
Autumn (Fig. 10a) was characterized by spatially homogeneous lag times (mean: 9 ± 1 d) and weak, regionally divergent altitudinal controls. While northern Xinjiang exhibited a unimodal relationship with elevation (peak at approximately 2500 to 3000 m), the southern basins (S1, S2) showed no systematic elevational trend. In contrast, the Kunlun Mountains (S3) displayed a strong, linear altitudinal increase (0.8 to 1.2 d per 1000 m, R2=0.78).
Winter (Fig. 10b) introduced a clear latitudinal gradient in mean lag (north: 11 ± 2 d; south: 9 ± 2.5 d) and a strengthening of average altitudinal variability (+20 % compared to autumn). A fundamental north-south dichotomy emerged: northern basins showed a parabolic altitudinal pattern, whereas southern regions lacked a consistent elevational signal, despite a persistent positive correlation in S3.
Spring (Fig. 10c) exhibited the most extreme spatial heterogeneity. Mean lag spanned an order of magnitude from south to north (1 ± 0.5 to 9 ± 2 d), and altitudinal sensitivity reached its annual maximum (average within-basin variability: 11 ± 3 d). A near-universal positive lag-elevation relationship was observed across all sub-basins (1.5 to 2.5 d per 500 m), steepest in the Tianshan Mountains. The bimodal elevational response in the Altay Mountains (N1) contrasted with the simpler linear patterns elsewhere.
Summer (Fig. 10d), with snow limited to alpine zones, revealed a striking east-west disparity in lag times (east: 0 to 7 d; west: 7 to 14 d) in the absence of a clear latitudinal gradient.
4.3.3 Long-Term Trends in Seasonal Lag Times Across Mountain Regions
All trend slopes and p-values reported in this section are derived from Sen's slope estimation combined with the Mann–Kendall significance test (see Sect. 3.3 for method details). Long-term (2001–2020) trends in seasonal SD–LST lags reveal asynchronous regional trajectories across Xinjiang's mountain regions (Fig. 11). While some regions exhibit significant shifts in specific seasons, others remain stable, indicating distinct climatic and snowpack regimes across mountain ranges.

Figure 11Long-term (2001–2020) trends in seasonal SD–LST response lags across four mountain regions in Xinjiang. (a) Autumn, (b) Winter, (c) Spring, (d) Summer.
Autumn Trends (Fig. 11a): Autumn lag times demonstrated the most pronounced long-term declines in the Tianshan regions. In the North Tianshan (N3), lags decreased from approximately 15 to 6 d ( d yr−1, p<0.001). A similar but less steep decline occurred in the South Tianshan (S1; from 11 to 8 d). The Altay Mountains (N1) showed high interannual variability (5 to 15 d) without a significant trend, while the Kunlun Mountains (S3) remained stable (8 to 10 d).
Winter Trends (Fig. 11b): Winter lag times also exhibited region-specific patterns. The North Tianshan (N3) showed a significant decline from 15 to 11 d ( d yr−1, p<0.01). The South Tianshan (S1) maintained consistently higher lags than autumn (10 to 13 d after 2006) but without a clear trend. The Altay Mountains (N1) exhibited elevated lags during 2010–2015 (8 to 15 d), while the Kunlun Mountains (S3) remained stable (8 to 10 d).
Spring Trends (Fig. 11c): Lag times exhibited clear regional divergence. The Altay Mountains (N1) maintained stable, near-immediate responses (0 to 2 d), with no significant trend detected (slope∼0 d yr−1, p=0.922). In contrast, both the North and South Tianshan (N3, S1) experienced significant lengthening of lags (N3: from approximately 2 to 5 d, d yr−1, p<0.001; S1: from less than 4 to 8 d, d yr−1, p<0.001). The Kunlun Mountains (S3) displayed the highest absolute values (8 to 13 d) but showed a significant declining trend (−0.18 d yr−1, p=0.015).
Summer Trends (Fig. 11d): Summer lag times showed moderate interannual variability without strong directional trends. The Altay (N1) and North Tianshan (N3) regions exhibited relative stability (N1: 4 to 8 d; N3: 7 to 11 d). The South Tianshan (S1) displayed greater fluctuation (6 to 10 d) and a slight overall decline (−0.03 d yr−1, p=0.12). In the Kunlun Mountains (S3), summer lags were the most stable (7 to 9 d). The increased variability in N1 after 2010 suggests a possible shift in late-season snowpack stability or ablation energy sources.
5.1 Hierarchical Controls on Snow–Temperature Interactions
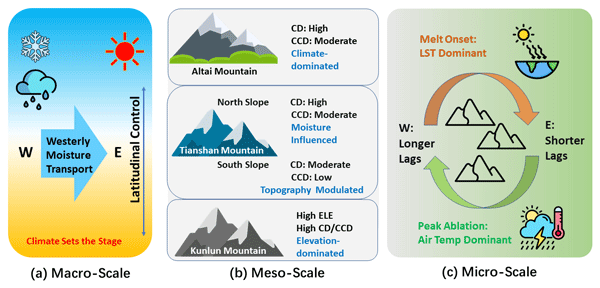
Our analysis reveals that the spatial patterns of snow–temperature interactions across Xinjiang are governed by a coherent hierarchical control framework (Fig. 12), which is distinctly expressed through the unique climatic and cryospheric characteristics of its three major mountain systems: the Altay (N1), Tianshan (N3, S1), and Kunlun (S3). This integration of scale-dependent controls and regional specificity provides an integrated understanding of the observed heterogeneity.

Figure 12Hierarchical Controls on Snow–Temperature Interactions (a) Macro-scale: Climatic gradient setting. (b) Meso-scale: Climate/Topographic/Elevation modulation. (c) Micro-Scale: Seasonal ablation dynamics.
At the macro-scale, the fundamental contrast between the cold-humid north and the hyper-arid south establishes the baseline potential for strong snow–temperature coupling (Sato, 2005). This is most clearly manifested in the Altay Mountains (N1), where abundant snowfall and a long snow season create a deep, persistent snowpack. This system operates under climate-dominated control, resulting in the highest and most stable coupling degrees observed (CD consistently exceeding 0.8 across all elevations, as shown in Fig. 5; Δ=0.21–0.31, indicating well-matched CD and CCD), alongside the longest winter response lags (14–22 d, Sect. 4.3) – a signature of high thermal inertia. The absence of significant elevational gradients in CD and CCD across N1, combined with consistent lag structures across elevations, suggests that the climatic regime – rather than local topographic or elevational factors – is the primary control. In other words, the snowpack response is uniform across the mountain's vertical extent, a pattern expected under a dominant climatic forcing that operates at the basin scale. This pattern aligns with stable seasonal snow–climate feedbacks typical of high-latitude regions.
The meso-scale control of elevation and topography modifies or even overrides the macro-scale template, particularly in the drier southern regions (Pepin et al., 2015). In the Kunlun Mountains (S3), elevation becomes the dominant, overriding control. The robust correlation between altitude and both coupling and coordination degrees (CD rising from <0.3 at low elevations to >0.7 above 3000 m; CCD improving markedly above 3500 m, as shown in Fig. 7) illustrates a strict elevation-gating mechanism: only above a critical altitude (∼3500 m) does a sufficiently persistent snowpack exist to establish a coordinated interaction with temperature. The lag-elevation relationship further supports this control (autumn lag increasing by 0.8–1.2 d per 1000 m, Sect. 4.3), confirming that snowpack thermal properties are systematically modulated by altitude. The strong correlation between elevation and both CD and CCD indicates that elevation exerts a primary control that cannot be explained by the macro-scale climate alone, which is uniformly hyper-arid across the region; rather, it reflects the elevational control on snow accumulation and persistence, where higher elevations capture more precipitation and sustain lower temperatures.
In the Tianshan Mountains, topography manifests as a sharp intra-mountain contrast. The pronounced north–south asymmetry in coupling and coordination is a direct result of the rain-shadow effect and differential solar radiation, making the south slope (S1) a more sensitive and vulnerable subsystem. The rain-shadow effect reduces precipitation on the southern slope, leading to thinner snowpack with lower cold content and reduced thermal buffering capacity. This directly limits the snowpack's ability to absorb and modulate thermal forcing, manifesting as lower CCD values (0.2–0.4) and greater CD-CCD divergence (Δ up to 0.34) compared to the northern slope. Here, topography amplifies the macro-climatic gradient, creating strong internal heterogeneity. This is supported by the contrasting CD and CCD patterns between N3 and S1: the northern slope maintains higher CCD values (0.5–0.6) and more stable Δ (0.20–0.28 at low elevations), whereas the southern slope exhibits lower CCD (0.2–0.4) and the largest CD-CCD divergence above 2700 m (Δ up to 0.34, Sect. 4.2). The greater solar radiation on the south-facing slope accelerates melt and shortens snow duration, increasing sensitivity to temperature fluctuations – as reflected in the significant spring lag lengthening observed on the southern slope (Sect. 4.3). Lag patterns further reinforce this asymmetry: the southern slope shows significant spring lag lengthening, suggesting heightened sensitivity to seasonal transitions, whereas the northern slope maintains more stable seasonal lag structures. The combination of reduced moisture supply and enhanced radiative forcing makes the southern slope particularly vulnerable to warming. Even moderate temperature increases can trigger rapid snow loss, whereas the northern slope – sustained by greater snowfall and lower radiation – maintains more stable snowpack conditions and higher CCD. This vulnerability is further evidenced by the intensification of the CD-CCD mismatch with elevation on the south slope (Δ increasing from 0.13 at 2700–3000 m to 0.34 at >3800 m), confirming that topographic modulation of snowpack properties is the dominant mechanism underlying the north–south asymmetry.
5.2 Decoupling Between Interaction Strength and System Harmony in Xinjiang
A high Coupling Degree (CD) reflects strong statistical interdependence between snow depth (SD) and land surface temperature (LST), indicating efficient energy exchange at the snow–atmosphere interface. This is characteristic of thermally responsive snowpacks, as evidenced by the consistently high CD values in the snow-rich Altay Mountains and the high-elevation Kunlun Mountains.
However, a high CD does not guarantee a high Coupling Coordination Degree (CCD). The CD-CCD decoupling observed in the southern and parts of the northern Tianshan reveals a critical state: strong thermal forcing persists as the dominant driver (hence high CD), but the snowpack has lost sufficient buffering capacity to respond sustainably (hence low CCD). The relationship has shifted from coordinated co-evolution – where snowpack properties such as depth, cold content, and albedo modulate the thermal response – to a forced, maladaptive response, where warming drives snow loss with little modulating feedback. Physically, this decoupling manifests as a progressive loss of buffering capacity: the ability to absorb thermal perturbations diminishes as snow depth decreases and snowpack structure deteriorates. Thus, the CD-CCD discrepancy serves not merely as a descriptive metric but as an early warning indicator of system stress, identifying regions where snowpack buffering capacity is eroding under accelerating warming (Hantel and Hirtl-Wielke, 2007).
This decoupling manifests differently across regions, forming a spectrum of system states as revealed by the Δ analysis in Sect. 4.2. At one end, the Altay Mountains represent a well-coordinated state, where the deep, cold snowpack effectively buffers thermal forcing and maintains synchronized SD-LST evolution. At the opposite end, the southern Tianshan above 2700 m exhibits acute system stress, where a marginal snowpack responds quickly to temperature (high CD) but collapses rather than melts gradually (low CCD) – approaching a critical transition. Between these extremes, the northern Tianshan at high elevations shows incipient system stress: high CD but declining CCD indicates that the snowpack retains thermal inertia but is beginning to lose coordination capacity. In contrast, the Kunlun Mountains occupy a distinct position – limited snow cover and weaker thermal forcing yield weak but balanced interactions, representing a low-energy system where CD-CCD separation is less pronounced. This regional differentiation demonstrates that the same high-CD-low-CCD signature can have different physical meanings depending on the regional snowpack and climatic context.
The lag patterns presented in Sect. 4.3 add a temporal dimension to this diagnostic framework. In the Altay Mountains, long and stable winter lags are consistent with a deep, cold snowpack possessing high thermal inertia. In contrast, shorter lags in the Tianshan low-elevation zones suggest reduced thermal buffering capacity. The long-term trends also exhibit seasonal asymmetry: declining autumn lags – particularly in the Tianshan – may indicate accelerated snowpack establishment under autumn cooling, while declining winter lags in the North Tianshan may reflect snowpack thermal degradation under warming winters. This asymmetric interpretation is supported by concurrent regional trends presented by Chen et al. (2015): autumn cooling rates have accelerated over the study period, while winter warming trends have been documented in the same region. These interpretations are inferential – lag time is a statistical metric, whereas thermal inertia and cold content are physical properties we did not directly measure. Direct attribution would require complementary in situ measurements or process-based modeling.
Several mechanisms may explain the observed patterns. First, loss of buffering capacity is most relevant to the Tianshan, where thinning snowpacks lose thermal inertia and latent heat capacity, triggering rapid ablation rather than gradual melt – shifting snow from a climate moderator to a change amplifier (Shengdi et al., 2023). Second, asynchronous response rates help explain why the Altay maintains stable Δ whereas the Tianshan does not: in the Altay, abundant snowfall sustains a deep snowpack that buffers temperature variability, allowing SD and LST to evolve in synchrony; in the Tianshan, the rate of LST increase outpaces stabilizing feedbacks, with snow-albedo feedback likely exacerbating this asynchrony (Flanner et al., 2011). Third, seasonal shifts in interaction mechanisms help interpret the modest CD-CCD divergence in the Kunlun, where limited snowpack and weaker thermal forcing yield less pronounced separation. Pronounced spring lag lengthening indicates a change in energy processing: early ablation is driven by surface heating (short lags), while peak ablation involves energy storage within the snowpack (Zhang et al., 2014), degrading the synchrony essential for high CCD.
The CD-CCD discrepancy is not an analytical artifact but a meaningful indicator. It moves the assessment beyond whether temperature drives snow changes, to evaluate how healthily the snow-climate system is co-evolving. Regions with this decoupling – particularly the southern Tianshan above 2700 m and high-elevation northern Tianshan – are most vulnerable to rapid, potentially irreversible change under continued warming.
5.3 Lagged Responses as Indicators of Snowpack Thermal Inertia and Regional Heterogeneity
The response lag serves as a direct metric of snowpack thermal inertia, reflecting how efficiently energy perturbations propagate through the snow column. The pronounced spatiotemporal heterogeneity in lag times across Xinjiang is fundamentally shaped by regional differences in snowpack characteristics – governed by distinct climatic regimes – and reveals divergent system vulnerabilities.
In the Altay Mountains region (N1), the cold-humid continental climate coupling with abundant winter snowfall sustains a deep seasonal snowpack characterized by high cold content. This results in the longest and most stable winter response lags observed across the study area (14 to 22 d), serving as a direct manifestation of its strong thermal inertia. The minimal interannual variation in these seasonal lags further indicates that snow depth and cold content remain the dominant controls, effectively buffering the system against abrupt shifts in melt timing. This high-inertia regime corresponds closely with the region's consistently high coupling coordination, reflecting a resilient snow–climate system in which temperature forcing and snow depth response remain in a state of relative equilibrium.
The Tianshan Mountains (N3 and S1) display a pronounced north–south asymmetry in lag patterns, which originates from fundamentally contrasting snowpack regimes (Lie-qun et al., 2013). Influenced by greater moisture availability, the northern slopes maintain a moderately deep and seasonally persistent snowpack, resulting in intermediate yet stable lag times. In contrast, the southern slopes experience a warmer and drier climatic regime, supporting only a shallower, more intermittently distributed snow cover. Notably, the significant lengthening of spring lags observed on the south slope suggests a possible increase in snowpack cold content – potentially linked to enhanced winter accumulation at higher elevations – or a shift in the dominant spring melt energy from sensible to radiative heating, a process that requires more time to offset the snowpack's energy deficit. This evolving dynamic indicates that the south slope is undergoing a regime transition, wherein its already limited snowpack is growing more sensitive to variations in winter precipitation and spring radiative forcing, thereby intensifying the coupling-coordination stress documented across this region.
Under hyper-arid climatic conditions, the snowpack in the Kunlun Mountains (S3) is sparse, shallow, and exhibits strong elevation dependence. At lower elevations, snow cover is transient, resulting in near-zero lag times. Only above approximately 3500 m does a thin yet seasonally persistent snowpack develop, displaying measurable lag responses. The relatively stable seasonal lags, coupling with an observed improvement in coordination, indicate that at these highest elevations the snowpack has attained a fragile yet stable equilibrium with the extreme environment. The existing snow depth is just sufficient to provide the necessary thermal inertia and sustain coordinated thermal exchange; however, any further warming or aridification could push the system below the persistence threshold, leading to rapid decoupling.
These regional patterns underscore that lag dynamics are not merely statistical outcomes but are emergent properties of snowpack structure under specific climatic forcing. The Altay's deep snow provides robust buffering, the Tianshan's asymmetric snowpack leads to divergent sensitivity, and the Kunlun's marginal snow exhibits threshold-dependent behavior. The lengthening spring lags in the Tianshan south slope are particularly telling: they indicate a system where changes in snow accumulation or melt energy are altering the fundamental timing of hydrological response, potentially increasing the risk of abrupt meltwater release. This regional synthesis clarifies that “one-size-fits-all” models of snow–temperature interaction are inadequate; future projections must account for these intrinsically different snowpack regimes and their unique lag-response sensitivities to climate change.
This study offers three diagnostic insights for snow-climate science and water management in arid mountains. First, it distinguishes coupling strength from system state, revealing that a strong correlation between SD and LST can mask underlying system dysfunction – a critical insight for identifying vulnerable regions. Second, it identifies response lag time as a physically meaningful metric of snow thermal inertia, enabling regional-scale diagnosis of buffering capacity. Third, it offers an analytical framework that moves beyond conventional correlation to diagnose system stress in data-scarce, topographically complex regions.
We demonstrate that SD-LST interactions are governed by a three-tiered hierarchical control system involving macro-scale climate gradients, meso-scale topography, and micro-scale local factors. Critically, coupling degree and coordination degree are distinct metrics; their spatial mismatch serves as an early warning of system stress, identifying where rapid warming outpaces snowpack adaptive capacity. Response lag time exhibits region-specific signatures, from long, stable lags in deep, cold snowpacks to elevation-threshold-dependent behavior in marginal snow environments. Long-term trends reveal seasonally differentiated and regionally heterogeneous responses, precluding one-size-fits-all modeling approaches.
The proposed framework is applicable to other snow-dominated mountain regions facing similar data and topographic challenges. For Xinjiang and analogous arid areas, the identified vulnerability and resilience hotspots provide a scientific basis for prioritizing monitoring and climate adaptation. Future research should integrate process-based snowpack modeling to attribute lag patterns to specific energy balance components, and extend this framework to other Central Asian ranges to advance continental-scale understanding of cryosphere-climate-hydrology interactions under accelerating warming. The CD-CCD-lag metrics proposed here may support future model development by providing spatially explicit, empirically based reference targets for evaluating snow thermal schemes – such as thermal conductivity and albedo decay parameterizations – in land surface and hydrological models.
Our snow depth dataset and land surface temperature dataset are available on http://www.ncdc.ac.cn (last access: 20 October 2023) and https://data.tpdc.ac.cn/home (last access: 15 June 2024).
H.L. conceived the main innovative ideas and led the experiments. X.B., S.L., Y.C., and J.L. participated in the experiments and manuscript writing. M.X. and X.L. contributed to the data processing.
The contact author has declared that none of the authors has any competing interests.
Publisher's note: Copernicus Publications remains neutral with regard to jurisdictional claims made in the text, published maps, institutional affiliations, or any other geographical representation in this paper. The authors bear the ultimate responsibility for providing appropriate place names. Views expressed in the text are those of the authors and do not necessarily reflect the views of the publisher.
This article is part of the special issue “Cryospheric ecosystems: climate feedback loops, threatened ecosystems, and consequences of climate change”. It is not associated with a conference.
This research was supported by the Xinjiang Key Laboratory of Water Cycle and Utilization in Arid Zone, Xinjiang Institute of Ecology and Geography, Chinese Academy of Sciences.The authors gratefully acknowledge the financial assistance provided by the laboratory.
This research has been supported by the Xinjiang Key Laboratory of Water Cycle and Utilization in Arid Zone,Xinjiang Institute of Ecology and Geography, Chinese Academy of Sciences (grant no. XJYS0907-2024-yb-03).
This paper was edited by Masashi Niwano and reviewed by Pengfeng Xiao and two anonymous referees.
Aizen, V. B., Aizen, E. M., and Kuzmichonok, V. A.: Glaciers and hydrological changes in the Tien Shan: simulation and prediction, Environ. Res. Lett., 2, 045019, https://doi.org/10.1088/1748-9326/2/4/045019, 2007.
Arias, P., Bellouin, N., Coppola, E., Jones, R., Krinner, G., Marotzke, J., Naik, V., Palmer, M., Plattner, G.-K., and Rogelj, J.: Climate Change 2021: the physical science basis. Contribution of Working Group I to the Sixth Assessment Report of the Intergovernmental Panel on Climate Change, technical summary, https://doi.org/10.1017/9781009157896, 2021.
Barnett, T. P., Adam, J. C., and Lettenmaier, D. P.: Potential impacts of a warming climate on water availability in snow-dominated regions, Nature, 438, 303–309, https://doi.org/10.1038/nature04141, 2005.
Beniston, M., Farinotti, D., Stoffel, M., Andreassen, L. M., Coppola, E., Eckert, N., Fantini, A., Giacona, F., Hauck, C., Huss, M., Huwald, H., Lehning, M., López-Moreno, J.-I., Magnusson, J., Marty, C., Morán-Tejéda, E., Morin, S., Naaim, M., Provenzale, A., Rabatel, A., Six, D., Stötter, J., Strasser, U., Terzago, S., and Vincent, C.: The European mountain cryosphere: a review of its current state, trends, and future challenges, The Cryosphere, 12, 759–794, https://doi.org/10.5194/tc-12-759-2018, 2018.
Chen, Y., Li, Z., Fan, Y., Wang, H., and Deng, H.: Progress and prospects of climate change impacts on hydrology in the arid region of northwest China, Environ. Res., 139, 11–19, https://doi.org/10.1016/j.envres.2014.12.029, 2015.
Clark, M. P., Hendrikx, J., Slater, A. G., Kavetski, D., Anderson, B., Cullen, N. J., Kerr, T., Örn Hreinsson, E., and Woods, R. A.: Representing spatial variability of snow water equivalent in hydrologic and land-surface models: A review, Water Resour. Res., 47, 2011WR010745, https://doi.org/10.1029/2011WR010745, 2011.
Essery, R.: Large-scale simulations of snow albedo masking by forests, Geophys. Res. Lett., 40, 5521–5525, https://doi.org/10.1002/grl.51008, 2013.
Flanner, M. G., Shell, K. M., Barlage, M., Perovich, D. K., and Tschudi, M. A.: Radiative forcing and albedo feedback from the Northern Hemisphere cryosphere between 1979 and 2008, Nat. Geosci., 4, 151–155, https://doi.org/10.1038/ngeo1062, 2011.
Granger, C. W. J.: Investigating Causal Relations by Econometric Models and Cross-spectral Methods, Econometrica, 37, 424–438, https://doi.org/10.2307/1912791, 1969.
Grinsted, A., Moore, J. C., and Jevrejeva, S.: Application of the cross wavelet transform and wavelet coherence to geophysical time series, Nonlin. Processes Geophys., 11, 561–566, https://doi.org/10.5194/npg-11-561-2004, 2004.
Hantel, M. and Hirtl-Wielke, L.: Sensitivity of Alpine snow cover to European temperature, Int. J. Climatol., 27, 1265–1275, https://doi.org/10.1002/joc.1472, 2007.
Hu, R. J.: Physical geography of the Tianshan Mountains in China, China Environ. Sci. Press Beijing, 264–273, ISBN 9787801639516, 2004.
Huang, J., Na, Y., and Guo, Y.: Spatiotemporal characteristics and driving mechanism of the coupling coordination degree of urbanization and ecological environment in Kazakhstan, J. Geogr. Sci., 30, 1802–1824, https://doi.org/10.1007/s11442-020-1813-9, 2020.
Immerzeel, W. W., Van Beek, L. P. H., and Bierkens, M. F. P.: Climate Change Will Affect the Asian Water Towers, Science, 328, 1382–1385, https://doi.org/10.1126/science.1183188, 2010.
Kendall, M. G.: Rank Correlation Methods, 4th edn., Charles Griffin, London, ISBN 9780852641996, 1975.
Kim, H., Fastovich, D., Bhattacharya, T., and Tuttle, S.: Improving predictions of snow resources using midlatitude SSTs with convergent cross mapping, Environ. Res. Clim., 4, 021001, https://doi.org/10.1088/2752-5295/add362, 2025.
Lai, Z., Ge, D., Xia, H., Yue, Y., and Wang, Z.: Coupling coordination between environment, economy and tourism: a case study of China, PLoS One, 15, e0228426, https://doi.org/10.1371/journal.pone.0228426, 2020.
Lehning, M., Bartelt, P., Brown, B., Fierz, C., and Satyawali, P.: A physical SNOWPACK model for the Swiss avalanche warning: Part II. Snow microstructure, Cold Reg. Sci. Technol., 35, 147–167, https://doi.org/10.1016/S0165-232X(02)00073-3, 2002a.
Lehning, M., Bartelt, P., Brown, B., and Fierz, C.: A physical SNOWPACK model for the Swiss avalanche warning: Part III. Meteorological forcing, thin layer formation and evaluation, Cold Reg. Sci. Technol., 35, 169–184, https://doi.org/10.1016/S0165-232X(02)00072-1, 2002b.
Li, H., Liu, J., Lei, X., Ju, Y., Bu, X., and Li, H.: Quantitative determination of environmental factors governing snow melting: a geodetector case study in the central Tienshan Mountains, Sci. Rep.-UK, 12, 11565, https://doi.org/10.1038/s41598-022-15722-5, 2022.
Li, X., Zheng, X., Wu, L., Zhao, K., Jiang, T., and Gu, L.: Effects of snow cover on ground thermal regime: A case study in Heilongjiang Province of China, Chinese Geogr. Sci., 26, 527–538, https://doi.org/10.1007/s11769-016-0825-y, 2016.
Li, Y., Chen, Y., and Li, Z.: Climate and topographic controls on snow phenology dynamics in the Tienshan Mountains, Central Asia, Atmos. Res., 236, 104813, https://doi.org/10.1016/j.atmosres.2019.104813, 2020.
Lie-qun, H. U., Shuai, L., and Feng-chao, L.: Analysis of the variation characteristics of snow covers in Xinjiang region during recent 50 years, J. Glaciol. Geocryol., 35, 793–800, https://doi.org/10.7522/j.issn.1000-0240.2013.0090, 2013 (in Chinese).
Liu, Y. B., Li, R. D., and Song, X. F.: Grey associative analysis of regional urbanization and eco-environment coupling in China, Acta Geogr. Sin., 60, 237–247, https://doi.org/10.11821/xb200502007, 2005.
López-Moreno, J. I., Pomeroy, J. W., Revuelto, J., and Vicente-Serrano, S. M.: Response of snow processes to climate change: spatial variability in a small basin in the Spanish Pyrenees, Hydrol. Process., 27, 2637–2650, https://doi.org/10.1002/hyp.9408, 2013.
Male, D. H. and Gray, D. M.: Handbook of snow: Principles, processes, management & use, Pergamon Press, ISBN 9781932846065, 1981.
Mann, H. B.: Nonparametric Tests Against Trend, Econometrica, 13, 245–259, https://doi.org/10.2307/1907187, 1945.
Marchane, A., Jarlan, L., Hanich, L., Boudhar, A., Gascoin, S., Tavernier, A., Filali, N., Le Page, M., Hagolle, O., and Berjamy, B.: Assessment of daily MODIS snow cover products to monitor snow cover dynamics over the Moroccan Atlas mountain range, Remote Sens. Environ., 160, 72–86, 2015, https://doi.org/10.1016/j.rse.2015.01.002, 2015.
Marks, D. and Dozier, J.: Climate and energy exchange at the snow surface in the alpine region of the Sierra Nevada: 2. Snow cover energy balance, Water Resour. Res., 28, 3043–3054, https://doi.org/10.1029/92WR01483, 1992.
Meng, Q., Pi, H., Nie, Y., and Ma, J.: Research on the coupling and coordinated development of Guangxi's tourism industry, new urbanization and environmental health system in the post-epidemic era, Front. Public Health, 12, 1331765, https://doi.org/10.3389/fpubh.2024.1331765, 2024.
Mudelsee, M.: Trend analysis of climate time series: A review of methods, Earth-Sci. Rev., 190, 310–322, https://doi.org/10.1016/j.earscirev.2018.12.005, 2019.
Musselman, K. N., Clark, M. P., Liu, C., Ikeda, K., and Rasmussen, R.: Slower snowmelt in a warmer world, Nat. Clim. Change, 7, 214–219, https://doi.org/10.1038/nclimate3225, 2017.
Pepin, N., Bradley, R., Diaz, H., Baraer, M., Caceres, E. B., Forsythe, N., Fowler, H., Greenwood, G., Hashmi, M. Z., and Liu, X. D.: Elevation-dependent warming in mountain regions of the world, Nat. Clim. Change, 5, 424–430, https://doi.org/10.1038/nclimate2563, 2015.
Sato, T.: The TianShan rain-shadow influence on the arid climate formation in northwestern China, Sola, 1, 13–16, https://doi.org/10.2151/sola.2005-004, 2005.
Sen, P. K.: Estimates of the Regression Coefficient Based on Kendall's Tau, J. Am. Stat. Assoc., 63, 1379–1389, https://doi.org/10.1080/01621459.1968.10480934, 1968.
Shengdi, W., Bin, C. A. O., Jiansheng, H. A. O., Wen, S. U. N., and Zhiwei, Z.: Effects of seasonal snow cover on ground surface temperature in Xinjiang, J. Glaciol. Geocryol., 45, 435–445, https://doi.org/10.7522/j.issn.1000-0240.2023.0033, 2023.
Song, C. Q., Cheng, C. X., Yang, X. F., Ye, S. J., and Gao, P. C.: Understanding geographic coupling and achieving geographic integration, Acta Geogr. Sin., 75, 3–13, https://doi.org/10.11821/dlxb202001001, 2020.
Sugihara, G., May, R., Ye, H., Hsieh, C., Deyle, E., Fogarty, M., and Munch, S.: Detecting Causality in Complex Ecosystems, Science, 338, 496–500, https://doi.org/10.1126/science.1227079, 2012.
Wang, H., Zhang, X., Xiao, P., Zhang, K., and Wu, S.: Elevation-dependent response of snow phenology to climate change from a remote sensing perspective: A case survey in the central Tianshan Mountains from 2000 to 2019, Int. J. Climatol., 42, 1706–1722, https://doi.org/10.1002/joc.7330, 2022.
Wasserman, L.: All of Statistics: A Concise Course in Statistical Inference, Springer New York, New York, NY, https://doi.org/10.1007/978-0-387-21736-9, 2004.
Xuezhi, F., Wenjun, L. I., and Yanchen, B. A. I.: Research on the methods of obtaining satellite snow cover information, J. Image Graph., 5, 836–839, 2000.
Zhang, H., Yuan, N., Ma, Z., and Huang, Y.: Understanding the Soil Temperature Variability at Different Depths: Effects of Surface Air Temperature, Snow Cover, and the Soil Memory, Adv. Atmos. Sci., 38, 493–503, https://doi.org/10.1007/s00376-020-0074-y, 2021.
Zhang, W., Shen, Y., He, J., He, B., Niu, H., Wu, X., and Wang, G.: Snow properties on different underlying surfaces during the snow-melting period in the Altay Mountains: observation and analysis, J. Glaciol. Geocryol., 36, 491–499, 2014 (in Chinese).
Zhang, X., Li, X., Li, L., Zhang, S., and Qin, Q.: Environmental factors influencing snowfall and snowfall prediction in the Tianshan Mountains, Northwest China, J. Arid Land, 11, 15–28, https://doi.org/10.1007/s40333-018-0110-2, 2019.
Zhang, Y., Fang, Z., and Xie, Z.: Study on the coupling coordination between ecological environment and high-quality economic development in urban agglomerations in the middle reaches of the Yangtze River, Int. J. Env. Res. Pub. He., 20, 3612,https://doi.org/10.3390/ijerph20043612, 2023.
Zhao, W., Ni, Z., Yin, C., Liu, Y., and Pereira, P.: Research framework for integrated geography: composite driving–system evolution–coupling mechanism–synergistic regulation, Geogr. Sustain., 6, 100321, https://doi.org/10.1016/j.geosus.2025.100321, 2025.