
the Creative Commons Attribution 4.0 License.
the Creative Commons Attribution 4.0 License.
 | 05 Oct 2026
Seasonal evolution of suncup roughness describes broadband albedo decay on alpine snow
Francesca Carletti

Nora Helbig
Nander Wever
Loïc Brouet
Mathias Bavay
Benjamin Walter
Michael Lehning
We monitored the formation and seasonal evolution of suncup roughness over three snow ablation seasons at Weissfluhjoch in the Swiss Alps using a terrestrial LiDAR scanner. From high-temporal-resolution digital surface models, we find that suncup onset required three concurrent conditions: sustained daytime surface melting, above-freezing wet-bulb temperatures, and reduced wind speeds. Suncups formed in all three years, but their planar arrangement and geometry varied substantially, controlled by whether radiative or turbulent conditions dominated ablation. Comparing measured broadband albedo to flat-surface TARTES simulations forced by SNOWPACK-modelled snow properties, we find that suncup roughness and surface impurity loading together reduce albedo by 0.03–0.1, depending on illumination geometry and impurity load, consistent with previous work. Isolating the two contributions is complicated by their co-evolution: the same melt processes that deepen suncups also drive surface enrichment and the spatial redistribution of impurities, which are uniformly distributed during early suncup formation but concentrate into the hollows as melt progresses. As a practical alternative, we identify a robust logarithmic relationship between broadband albedo and the aerodynamic roughness length z0 that captures the combined radiative effect of roughness and impurities regardless of their relative contribution. Because broadband albedo decays fastest at the onset of suncup formation, we infer that a uniform early impurity distribution is particularly effective at accelerating albedo loss. Because z0 evolves by one order of magnitude through ablation, yet is kept constant in most snow models, our results call for its explicit, time-varying representation in physics-based snow models, which would improve both the turbulent fluxes z0 governs directly and, through its link to albedo, the roughness–impurity darkening.
- Article
(6076 KB) - Full-text XML
- BibTeX
- EndNote


Snow is the most reflective natural surface on Earth, scattering up to 98 % of incident solar radiation in its pristine state (Wiscombe and Warren, 1980). Therefore, even marginal decreases in albedo substantially increase the proportion of absorbed solar energy. Because seasonal snow can cover up to 50 % of the Northern Hemisphere each year (Armstrong and Brodzik, 2001), even small albedo reductions strongly affect Earth's energy budget (Flanner et al., 2011). Several factors determine albedo decreases in snow, and they often concur in a complex way: snow metamorphism reducing the specific surface area (SSA) of the grains (Wiscombe and Warren, 1980; Domine et al., 2006), the grain shape (Robledano et al., 2023; Libois et al., 2014, 2013), the presence of liquid water at the surface (Dumont et al., 2017), the incident angle (Warren, 1982), the concentration of light-absorbing particles (LAPs; Skiles et al., 2018), and the presence of surface roughness features (Warren et al., 1998; Zhuravleva and Kokhanovsky, 2011). Surface roughness has received less attention than other albedo drivers, partly because it is highly heterogeneous across spatial scales (Fassnacht et al., 2023), making it difficult to identify the scale most relevant to the sensor's radiative footprint. Yet, because snow surfaces are rarely flat, roughness is a key physical factor governing effective albedo (i.e. the ratio of reflected to incident radiation over a rough surface), which can differ substantially from the bihemispherical reflectance measured (or modeled) for a flat surface (Schaepman-Strub et al., 2006). In the context of surface energy balance, the effective albedo is the physically meaningful quantity, because it determines the net shortwave radiation absorbed by the rough snow surface. Pyranometer-based measurements capture effective albedo because they inherently integrate roughness effects into their radiative footprint (Bair et al., 2016, 2015).
In the accumulation phase, macroscopic surface roughness features such as sastrugi, ripples, and dunes often result from snow transport or wind erosion (Sommer et al., 2018; Amory et al., 2017; Filhol and Sturm, 2015). Many studies have shown systematic albedo decreases in the presence of such features (Corbett and Su, 2015; Leroux and Fily, 1998; Carroll, 1982), which can reach several meters in height (Warren et al., 1998). In the ablation phase, at high-elevation, arid environments where snow ablation is driven by sublimation rather than melting, snow penitentes form (Betterton, 2001; Lliboutry, 1954). They appear as snow pillars pointing toward the sun, potentially reaching several meters in height, and can drop apparent albedo by up to 0.4 (Lhermitte et al., 2014; Corripio and Purves, 2005). Penitentes do not form in the Alps under current climatic conditions, where humidity is too high, and melting dominates over sublimation. However, high-Alpine snowfields at mid-latitudes develop characteristic ablation-roughness features in the form of ablation hollows, more commonly called suncups. Suncups appear as a quasi-periodic natural pattern of round, concave dimples that can grow vertically and laterally by more than 10 cm, separated by rounded ridges (Betterton, 2001; Rhodes et al., 1987; Matthes, 1934). According to Betterton (2001) and Lliboutry (1954), suncups are early forms of penitentes and share the same initial instability mechanism: radiation clustering in concavities creates a positive feedback that deepens the hollows.
The albedo decay over a rough snow surface is controlled by two mechanisms that activate under different illumination conditions: (1) the effective-angle effect and (2) multiple reflections in the hollows (Warren et al., 1998). The effective-angle effect refers to the simultaneous influence of surface features facing both the sun and away from the sun. The former receive solar radiation at a smaller incidence angle than the solar zenith angle, causing stronger absorption; the latter are either shadowed or illuminated only at grazing angles and therefore contribute little to the total reflected flux. The insolation-weighted albedo of a rough surface is therefore reduced with respect to that of a flat surface under equivalent illumination conditions (Kokhanovsky and Zege, 2004; Warren et al., 1998; Warren, 1982). This effect varies with the shape and orientation of roughness features (Larue et al., 2020; Lhermitte et al., 2014) and activates only under direct illumination and at larger solar zenith angles (Warren et al., 1998). The multiple-reflections effect activates because, on a rough surface, photons are more likely to become trapped in concavities rather than scattered away than on a flat surface. After each collision with the roughness walls, the probability that light is absorbed rather than reflected increases. This causes a systematic increase in absorption, especially when reflection and absorption are balanced, i.e. for albedo values close to 0.5 in the near-infrared (NIR, 700–1400 nm) (Bair et al., 2022; Larue et al., 2020). This effect is active under both direct and diffuse illumination. Because it operates in the near-infrared and vanishes where snow albedo approaches 1, its broadband imprint is unlikely to be larger under the visible-dominated overcast spectrum than under a clear-sky beam.
As an alpine snowpack melts, its surface is simultaneously rugged by suncup growth and progressively darkened by the enrichment of LAPs such as black carbon or mineral dust. LAPs are fundamental drivers of albedo reductions (Warren and Wiscombe, 1980), both directly, by enhancing solar energy absorption in the visible range (400–700 nm), and indirectly, by accelerating near-surface SSA decrease that further reduces albedo (Skiles and Painter, 2019; Tuzet et al., 2017). Specifically, as snow melts, black carbon and dust are retained at the snow surface because percolating meltwater is generally inefficient at scavenging them (Doherty et al., 2013; Sterle et al., 2013; Flanner et al., 2007; Conway et al., 1996), especially for larger particles like aeolian dust (Tuzet et al., 2017; Yang et al., 2015). This can increase surface concentrations by up to a factor of 5 during extreme melt events, an effect called melt amplification (Doherty et al., 2013; Conway et al., 1996). Moreover, in late spring, algal populations of Sanguina nivaloides can proliferate quickly and form red blooms near the snow surface (Stewart et al., 2021). Algae reduce the albedo of snow surfaces similarly to LAPs, but unlike LAPs, their proliferation depends on specific environmental conditions, and it is not a systematic feature of snowmelt. Recently, Roussel et al. (2024) demonstrated that proliferation of S. nivaloides requires a snowmelt duration exceeding 46 d and is unlikely when the ground beneath the snowpack is frozen. Nutrients supplied by aeolian dust deposition may also drive algal blooms.
Isolating the effect of suncups on albedo is therefore not straightforward, particularly as the environmental conditions governing suncup development, melt amplification, and algal proliferation vary between seasons, complicating the derivation of general conclusions. In experiments with artificially modified snow surface roughness, Larue et al. (2020) disentangled and quantified the effective-angle and multiple-reflections effects, introduced above. They found that roughness reduced albedo by up to 0.1 at 1000 nm, that both effects are amplified when SSA is low (<10 m2 kg−1), and that the effective-angle effect enhances rapidly at large solar zenith angles. Manninen et al. (2021) and Bair et al. (2022) validated Larue et al. (2020) 's framework on natural snow roughness: a surface that, in the case of suncups, would be almost impossible to replicate artificially. Importantly, Larue et al. (2020) did not account for the concomitant effect of LAPs. Manninen et al. (2021) monitored roughness, broadband albedo, and spectral reflectance in Finnish Lapland for 3 months over two years. They showed that centimeter-scale surface roughness, comparable to that of suncups, decreased the broadband albedo by 0.1 during the late melting season, especially at smaller solar zenith angles and lower bulk albedo values. To date, the most temporally extensive study was carried out by Bair et al. (2022) in Sierra Nevada: the surface was tracked for roughly 100 d with a LiDAR system and field spectroradiometry to simultaneously track suncup growth, resolve grain size and impurity content, and quantify the resulting albedo reduction (0.05 in the broadband). Moreover, Bair et al. (2022) identified a major challenge with multispectral sensors: because pixels containing mixed fractions of pristine and dirty snow are spectrally inseparable from pixels containing only dirty snow, surface roughness effects on albedo cannot be separated from impurity effects unless the snow is relatively dirty. Similar conclusions were reached by Warren (2013). With suncup roughness driving differential dirt concentrations among hollows, ridges, and walls (Rhodes et al., 1987; Takahashi, 1978; Jahn and Kłapa, 1968; Richardson and Harper, 1957), a suncup field presents a spatially heterogeneous mix of clean and dirty snow at the sub-pixel scale, potentially rendering all pixels mixed for a multispectral sensor.
Spectral albedo measurements provide richer information than broadband, as they enable the attribution of surface albedo changes, i.e. the reflectivity of the snow surface, to snow microstructure (Libois et al., 2013), liquid water (Dumont et al., 2017), impurities (Tuzet et al., 2019; Skiles et al., 2018), or algae (Roussel et al., 2024; Painter et al., 2001). However, spectral measurements require expensive instrumentation and are particularly labor-intensive (e.g. Donahue et al., 2022), making them impractical for unsupervised, continuous deployment at high-elevation sites; consequently, they are carried out sporadically. Broadband pyranometers, conversely, are simpler, more robust, and better suited for long-term unattended deployment in harsh environments, enabling continuous monitoring at high temporal resolution across multiple melt seasons. This makes broadband measurements better suited for capturing inter-annual variability in surface conditions. Furthermore, most physically based snowpack models rely on broadband albedo, so clarifying how surface roughness affects it is directly relevant to snowmelt modeling. Recent work shows that Sentinel-1 backscatter is particularly sensitive to the early development of surface roughness on wet snow (Carletti et al., 2025b; Marin et al., 2020); characterizing its relationship with broadband albedo would therefore be valuable for future assimilation-scheme design.
Here, we present the first three-season survey of suncup roughness on high-elevation alpine snow during the ablation phase. We characterize the conditions governing suncup onset and the interannual variability in planar arrangement and geometric properties as functions of measurable snow state variables and meteorological forcings. We then compare broadband albedo measurements with smooth-surface TARTES simulations under pristine and impurity-loaded conditions, using impurity-content scenarios based on existing alpine surveys, and apply the effective albedo parametrization of Löwe and Helbig (2012) to account for suncup-induced albedo reductions. We address the challenge posed by the co-evolution of suncup growth and progressive impurity concentration and clustering at the snow surface, which complicates separating their individual contributions to albedo decay, and propose a practical way forward based on the empirical relationship between measured broadband albedo and aerodynamic roughness length. Together, these results motivate and assist the explicit representation of ablation-driven surface roughness in snow energy balance models.
2.1 Surface microtopography from terrestrial LiDAR
Terrestrial LiDAR is an established, effective technique for monitoring surface roughness (Bair et al., 2022; Lacroix et al., 2008) and a wide variety of snow processes (e.g. Ruttner et al., 2025). A fixed, automated, high-resolution 3D Terrestrial Laser Scanner (TLS; FARO® Focus3D S120) scanned a delimited area of about 300 m2 in the immediate proximity of the Weissfluhjoch research station (2536 , Davos, Switzerland), at hourly resolution and over three snow seasons. The TLS occasionally required restarting or relocation, resulting in mostly minor data gaps; the largest occurred in 2023, when the TLS only became operational in April, with no acquisitions made beforehand. Overall, less than 2 % of the scans were discarded due to acquisition instabilities caused by wind gusts or heavy snowfall. Because the scanned area is large and contains obstacles such as instruments and fences, and because point density decreases with distance from the scanner as incidence angles become increasingly grazing, we reduced the point clouds to a region of interest (ROI) of approximately 10 m×5 m. During ablation, snow generally disappears earlier in the south-eastern part of the domain; therefore, to track suncup evolution over a longer period, we defined a smaller 5 m×5 m sub-domain within the north-western area of the ROI. We then project the ROI onto the horizontal plane. To remove points not belonging to the snow surface (be it snowflakes from snowfall or blowing snow, or random noise) which would disturb the interpolation, we applied the well-established cloth simulation filtering algorithm of Zhang et al. (2016), with a cloth resolution of 30 cm, a classification threshold of 10 cm, and maximum rigidness, as recommended for flat terrains. On average, we filtered out 1 % of points per scan. We then interpolated the filtered point clouds to a regular 5 mm grid using bilinear interpolation to produce digital surface models (DSMs). Finally, we removed the slope trend using Gaussian filtering (e.g. Fassnacht et al., 2009), revealing microtopographic reliefs and concavities. The result is a time series of microtopographic DSMs, suitable for estimating surface roughness indices using raster-based approaches (Fassnacht et al., 2009).
2.2 Descriptors of snow surface roughness
We computed snow surface roughness descriptors across two complementary scales. Vertical descriptors characterize the amplitude of surface relief; we parameterize them using the aerodynamic roughness length (z0). z0 is the theoretical height above a surface at which the mean wind-speed logarithmic profile extrapolates to zero. We estimated z0 from our Gaussian-detrended LiDAR DSMs using the geometric method of Lettau (1969), adapting it to raster grids. First, we smoothed the interpolated DSMs from their native resolution of 5 mm to 1 cm, to reduce computational load and remove grain-scale roughness. Then, drawing conceptual inspiration from Neville et al. (2025), we identified roughness elements as individual obstacles. While Neville et al. (2025) identify individual roughness elements using an innovative watershed segmentation approach, we chose a simplified method to reduce computational costs, given the need to process nearly 10 000 DSMs. We used the 75th percentile of the elevation distribution to classify cells as obstacles, and merged neighboring obstacle cells into single roughness elements. A percentile threshold, rather than a fixed height, provides a measure independent of the surface amplitude, which varies throughout the season. This threshold identifies individual suncups as obstacles and avoids aggressively merging multiple suncups. We also set a minimum threshold of 20 neighboring cells (i.e. 20 cm2) to identify an obstacle element. Physically, the resulting obstacles correspond to the suncup walls, which produce most of the drag. We assume the hollows between them are mostly sheltered from the wind and therefore do not enter the calculation. Then, for each obstacle i, we computed the maximum height hi above the mean detrended surface, the horizontal footprint area Si, and the vertical area si,wd facing each cardinal wind direction , where a cell counts as wind-facing if it is higher than its immediate upwind neighbor. For each wind direction, the aerodynamic roughness length of the whole ROI is:
Where Cd=0.5 is Lettau's drag coefficient and n is the total number of obstacles. Unlike Neville et al. (2025), we summed the areas first, giving larger elements more relative weight. Each scan thus yielded four directional z0 values, which we averaged to obtain the time series shown in Fig. 2a–c. The median spread of the four directional z0 values across all scans is less than 3 %, meaning there is almost no directional z0 anisotropy at our study plot.
Horizontal descriptors characterize the lateral scale of surface relief. To represent this scale, we use the correlation length (CL), which expresses the horizontal distance over which surface height fluctuations remain statistically correlated (Manninen, 2003, 1997; Huang, 1998). We computed CL separately across (CLx) and along (CLy) the TLS beam direction. The TLS is facing north; therefore, the y axis is along the dominant wind direction. We define the anisotropy between CLx and CLy:
The ratio aCL describes surface directionality: anisotropic, preferentially oriented reliefs exhibit large values, whereas aCL≃1 (i.e. CLx≃CLy) indicates isotropy. The vertical and horizontal descriptors provide complementary information about the snow surface state. A ripple field exhibits large horizontal and moderate-to-low vertical descriptors: its reliefs are spatially extended, widely spaced, and strongly directional, giving large aCL. Suncups, conversely, show smaller horizontal and larger vertical descriptors, since reliefs of similar amplitude arrange periodically over short distances with generally no preferential direction: the surface tends towards isotropy, giving aCL→1.
Moreover, we computed raster-based descriptors of suncup formation and growth through image analysis of the DSMs, such as the number of features with a negative height, the suncup area, the suncup maximum depth, and the 2D equivalent of the roughness coverage fraction η used in Larue et al. (2020). Unlike in Larue et al. (2020), the non-concave portions of our natural surfaces are not flat, so we include ridges in the calculation.
2.3 Simulation and validation of snowpack state variables
Snow metamorphism decreases albedo by altering snow density, liquid water content, and SSA. We simulated the evolution of these snowpack properties with the 1D multi-layer, physics-based SNOWPACK model (Bartelt and Lehning, 2002). SNOWPACK describes the driving processes impacting the snow energy balance, such as metamorphism and microstructure (Vionnet et al., 2012; Lehning et al., 2002), phase changes, liquid water transport and preferential flow (Würzer et al., 2017; Wever et al., 2016, 2014), and turbulent kinetic exchanges at the surface (Schlögl et al., 2018), among others. We applied the snow surface temperature as a Dirichlet upper boundary condition while the snow surface was sub-freezing, and used calculated energy fluxes as Neumann boundary conditions during melt. We forced SNOWPACK simulations with quality-controlled measurements from advanced meteorological sensors at the research station and its immediate surroundings (Bavay and Theile, 2026). The SNOWPACK output includes energy fluxes and multilayer profiles of snow temperature, density, liquid water content, and optical grain size, among other properties. We analyzed surface energy fluxes at hourly resolution and multi-layer snow profiles at 3 h intervals (00:00, 03:00, …, 21:00 UTC) to improve computational efficiency.
The ability of SNOWPACK to reproduce the SSA and density of individual layers was thoroughly investigated at Weissfluhjoch (Calonne et al., 2020). Over one winter season, the authors report overall underestimations of SSA by SNOWPACK, with the magnitude of the deviations depending on the measurement technique used for comparison. Regarding density, Calonne et al. (2020) found that SNOWPACK overestimates the densification rate of lower snowpack layers and, conversely, underestimates the density of surface layers evolving from fresh snow to rounded grains. The comparison between our SNOWPACK simulations and the detailed surface measurements from Carletti et al. (2025a) confirms the above observations (Fig. 4k–l and n–o).
2.4 TARTES flat-surface simulations of broadband albedo
We used the Two-streAm Radiative TransfEr in Snow (TARTES; Picard and Libois, 2024) to simulate the spectral albedo (350–2200 nm) of a flat snowpack, with density and optical grain size prescribed by SNOWPACK. Because incident light is either absorbed or scattered away by snow grains within 10–20 cm from the snow surface (Kokhanovsky, 2022; Libois et al., 2013), we prescribed numerical layers 1 cm thick for the top 10 cm, and a single layer of weighted-average properties below. For each layer, we specified the impurity type and concentration.
As impurity content measurements were unavailable at our site, we designed five scenarios (Table 1) building upon the existing monitoring campaigns in the Alps, assuming that LAPs absorption is only attributable to black carbon and dust (Tuzet et al., 2020), which systematically co-exist in the Central Swiss Alps (Gabbi et al., 2015), although at strongly varying ratios. Specifically, dust dominates radiative forcing in dust-event years, while black carbon dominates otherwise (Réveillet et al., 2022). Therefore, we divided our scenarios into two families: mixed scenarios, in which black carbon and dust co-exist at comparable levels, and dominated scenarios, in which one species clearly outweighs the other.
Table 1Impurity concentration scenarios. Black carbon ranges follow Kau et al. (2026), Tuzet et al. (2020), and Gabbi et al. (2015) and are amplified according to Doherty et al. (2013). Dust ranges follow Di Mauro et al. (2019). The concentration of red snow algae, S. Nivaloides, are estimated from Roussel et al. (2024) and Chevrollier et al. (2023).
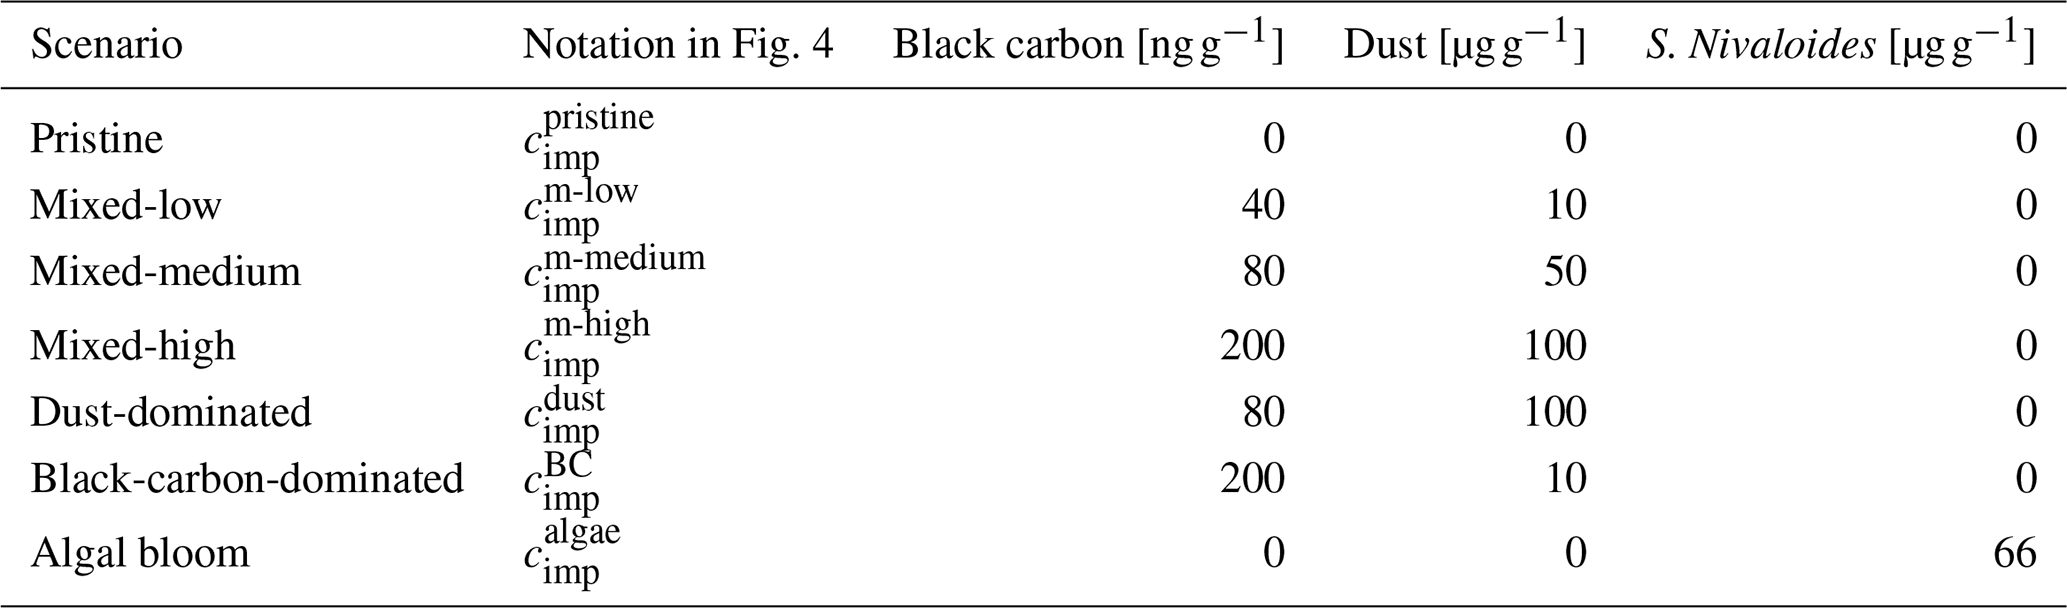
Our medium black carbon scenario matches the observed maxima in the two-year campaign of Tuzet et al. (2020) and is consistent with several previous assessments (Kau et al., 2026; Gabbi et al., 2015; Doherty et al., 2013). Our high black carbon scenario reflects extreme melt events in which surface concentration can multiply up to a factor of 5 via melt amplification (Doherty et al., 2013). Our dust scenarios are based on measurements and simulations from Di Mauro et al. (2019), which considers Algeria as the main source area of Saharan dust (PM2.5) reaching Europe. The two scenarios in which either black carbon or dust dominates (Réveillet et al., 2022) are based on the same literature mentioned above. TARTES computes the mass absorption efficiency of impurities, assuming the optical properties of black carbon (Bond and Bergstrom, 2006) and dust (Caponi et al., 2017).
The current version of TARTES does not implement the optical properties of red snow algae. Therefore, we incorporated them as a custom light-absorbing impurity using the empirical in vivo properties measured by Chevrollier et al. (2023). For the algal bloom scenario, we estimated a mass mixing ratio from the minimum cell concentration detectable by Sentinel-2 (∼20 000 cells mL−1; Roussel et al., 2024), representing bloom intensities with a measurable impact on the surface reflectance; a cell dry mass of 10−12 kg cell−1 derived from the mean snow algal biovolume and dry density reported in Chevrollier et al. (2023), and the mean modelled snow surface density during the melt season (300 kg m−3); yielding a mass mixing ratio of 66 µg g−1.
We ran TARTES simulations under diffuse (overcast-sky) and direct (clear-sky) conditions and compared the results with measurements from Kipp and Zonen CM21 broadband pyranometer. We discarded measurements with grazing solar zenith angles (below 25° and above 65°) to avoid errors arising from the pyranometer's cosine response (Grenfell et al., 1994). In the absence of a dedicated diffuse-radiation sensor, we obtained the diffuse fraction by decomposing the measured global radiation using the formulations of Reindl et al. (1990), Helbig et al. (2010), and Tapakis et al. (2015) implemented in MeteoIO (Bavay and Egger, 2014), the meteorological pre-processing library of SNOWPACK. Following Picard et al. (2020), we then computed the ratio rλ between incoming diffuse and global horizontal irradiance and classified timesteps with rλ≤0.20 as direct-dominated and rλ≥0.90 as diffuse-dominated. The deliberately wide gap between the two thresholds excludes mixed illumination, so that each group represents a quasi-pure illumination condition.
We obtain modeled broadband albedo values for both illumination conditions by weighting the TARTES spectral albedo with modeled incident solar spectra computed with libRadtran 2.0.6 (Emde et al., 2016): direct-beam irradiance under clear sky for the direct class, and global downwelling irradiance under overcast sky for the diffuse class. Spectra were generated for the neighboring Totalp site (46.837° N, 9.815° E; 2470 ) on 7 March 2024 at 12:00 UTC (solar zenith angle 52.3°) using the Kurucz solar source (Kurucz, 1994), a midlatitude-summer atmosphere (Anderson et al., 1986), the rural aerosol model of Shettle (1989) scaled via the Ångström relation (α=1.491, β=0.0482). Overcast conditions were represented by a fully overcast water cloud (liquid water content 0.2 g m−3, effective droplet radius 10 µm) between 3000–4500 Both spectra were resampled to 1 nm between 350–2500 nm and normalised to unit integral before weighting.
To determine the effect of suncups on the apparent broadband albedo, we compare measured time series with TARTES simulations in diffuse and direct illumination conditions for all years (Fig. 4a–f). Because TARTES neglects the presence of liquid water, relying on pure-ice refractive indices, we evaluate the quality of the simulations in dry and wet conditions separately (Fig. 4g–i). Wet conditions are initiated when the daily average of the modeled LWC exceeded 1 % in the top 30 cm (2022), or based on direct field measurements through 2023 and 2024 (Carletti et al., 2025a). Because suncups form on a wet snow surface (Carletti et al., 2025b), any misrepresentation of wet-snow metamorphism by SNOWPACK or TARTES must be ruled out for the earlier flat-surface stage. Despite SNOWPACK sometimes underestimating surface SSA and systematically underestimating density (Fig. 4k, l, n, and o), TARTES simulations forced by either SNOWPACK or measured surface properties show mostly negligible differences in broadband albedo (Fig. 1). This indicates that simulated albedo is insensitive to these input biases in the wet phase, before suncup development. We therefore attribute the deviation from measured broadband albedo primarily to TARTES not accounting for the optical effects of liquid water and wet-snow metamorphism on a flat surface. To do so, we define the index as the mean offset between TARTES simulations and broadband albedo measurements, computed separately for each year and illumination condition, over the wet-smooth phase. Therefore, for each year y, the wet-smooth window defines the evaluation set containing pairing broadband albedo values αTARTES(t) and αmeasured(t). The offset is the mean difference over the evaluation set:
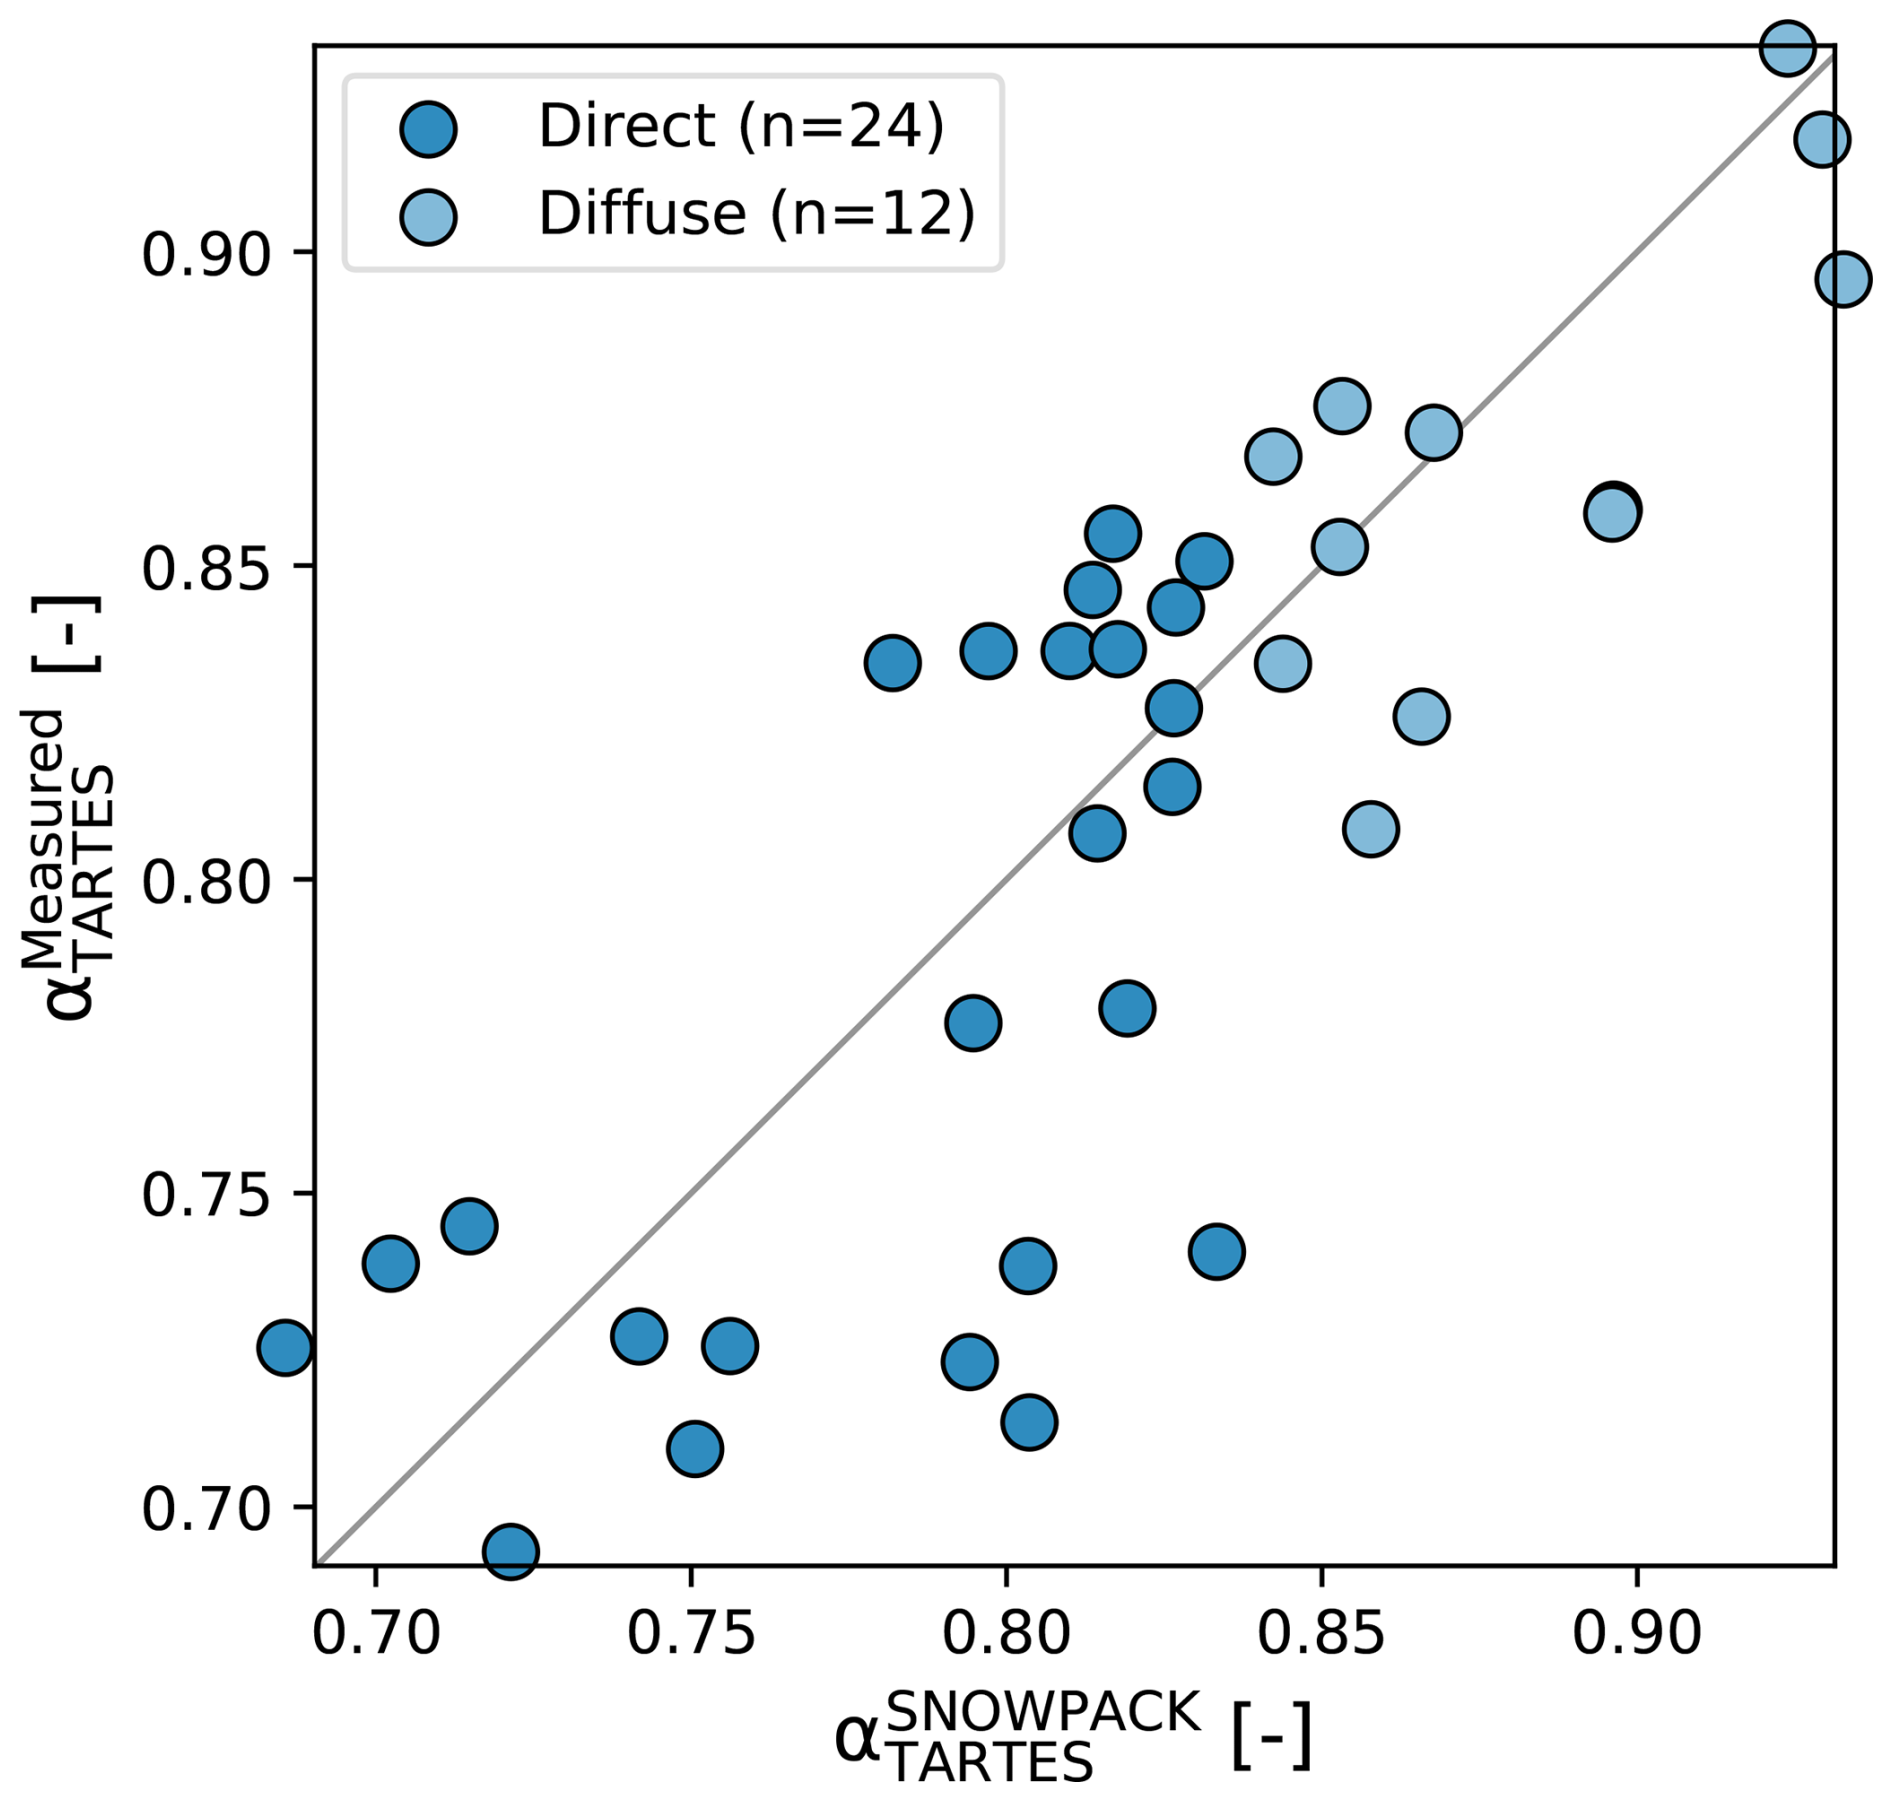
Figure 1TARTES broadband albedo computed from SNOWPACK-modeled surface properties () against TARTES albedo derived from manual measurements (, Carletti et al., 2025a) under direct (opaque, n=13) and diffuse (transparent, n=7) illumination conditions. The grey line indicates the 1:1 reference. Each point represents one measured snow profile, paired with the co-located TARTES run driven by SNOWPACK, using timesteps within ±1 h of profile acquisition. No manual measurements are available in 2022, so the comparison is restricted to 2023 and 2024.
We evaluate this separately for direct and diffuse illumination conditions. Consequently, and similarly, we define as the additional offset that appears once the suncups develop:
By subtracting from albedo residuals in the rough phase, we assume that the systematic errors deriving from wet-snow representation in TARTES are accounted for to the first order, leaving a residual signal that we can attribute solely to the co-evolution of suncup roughness and impurity concentration.
2.5 Effective albedo parametrization
To (partially) account for the effect of suncup roughness on the domain-averaged broadband albedo, we applied the effective albedo parametrization presented in Löwe and Helbig (2012), originally formulated for subgrid topographic shading and terrain reflections in large-scale models, but fully applicable to smaller scales to the first order, provided the surface statistics are described by the same geometric parameters. These parameters are the mean-squared slope μ and the sky-view factor ψ. According to these parameters, this approach modifies the flat-surface albedo computed by TARTES. To avoid propagating the wet-snow bias, this parametrization modifies the flat-surface albedo already corrected for (Eq. 4). Specifically, the direct irradiance is attenuated by a shading factor that accounts for the fraction of the surface in shadow as a function of the solar zenith angle and μ, including partial shadowing at low sun elevations when suncup walls shade adjacent terrain. The diffuse irradiance is reduced in proportion to ψ, whereas the obstructed fraction (1−ψ) adds up the terrain-reflected radiation. We derived both μ and ψ from the LiDAR surface scans.
As the shading factor depends on the solar zenith angle and decreases significantly under diffuse illumination (overcast sky), direct-dominated illumination conditions are those in which shading between suncup walls is the dominant roughness-induced albedo-reduction mechanism (Larue et al., 2020). Under an overcast sky, the remaining roughness-induced albedo reductions are instead governed by the limited sky view factor and single-terrain reflections, both of which the parameterization includes. The parametrization in Löwe and Helbig (2012) does not account for multiple reflections under either condition. This practical compromise is motivated by the need for a quasi-analytical method that can be applied systematically across three seasons of hourly LiDAR roughness acquisitions, for which full 3D ray-tracing would be computationally prohibitive. Neglecting multiple reflections omits the photon-trapping contribution to albedo reduction. Bair et al. (2022) quantified this effect in the field at roughly 5 % of the total roughness-driven albedo decay on average, but found it exceeds the 20 % for late-ablation suncups: a regime our observations fully cover. Its omission therefore likely underestimates the modeled albedo reduction that increases with suncup growth.
3.1 Conditions for suncup formation
Our time series highlight two distinct roughness regimes. The transition between regimes is marked by the onset of monotonically increasing vertical roughness index, occurring on 11 May 2022, 22 May 2023, and 3 June 2024 for the three seasons, respectively (Fig. 2a–c). We refer to the period prior to these thresholds as the smooth (or textured) phase, and to the period after as the rough phase.
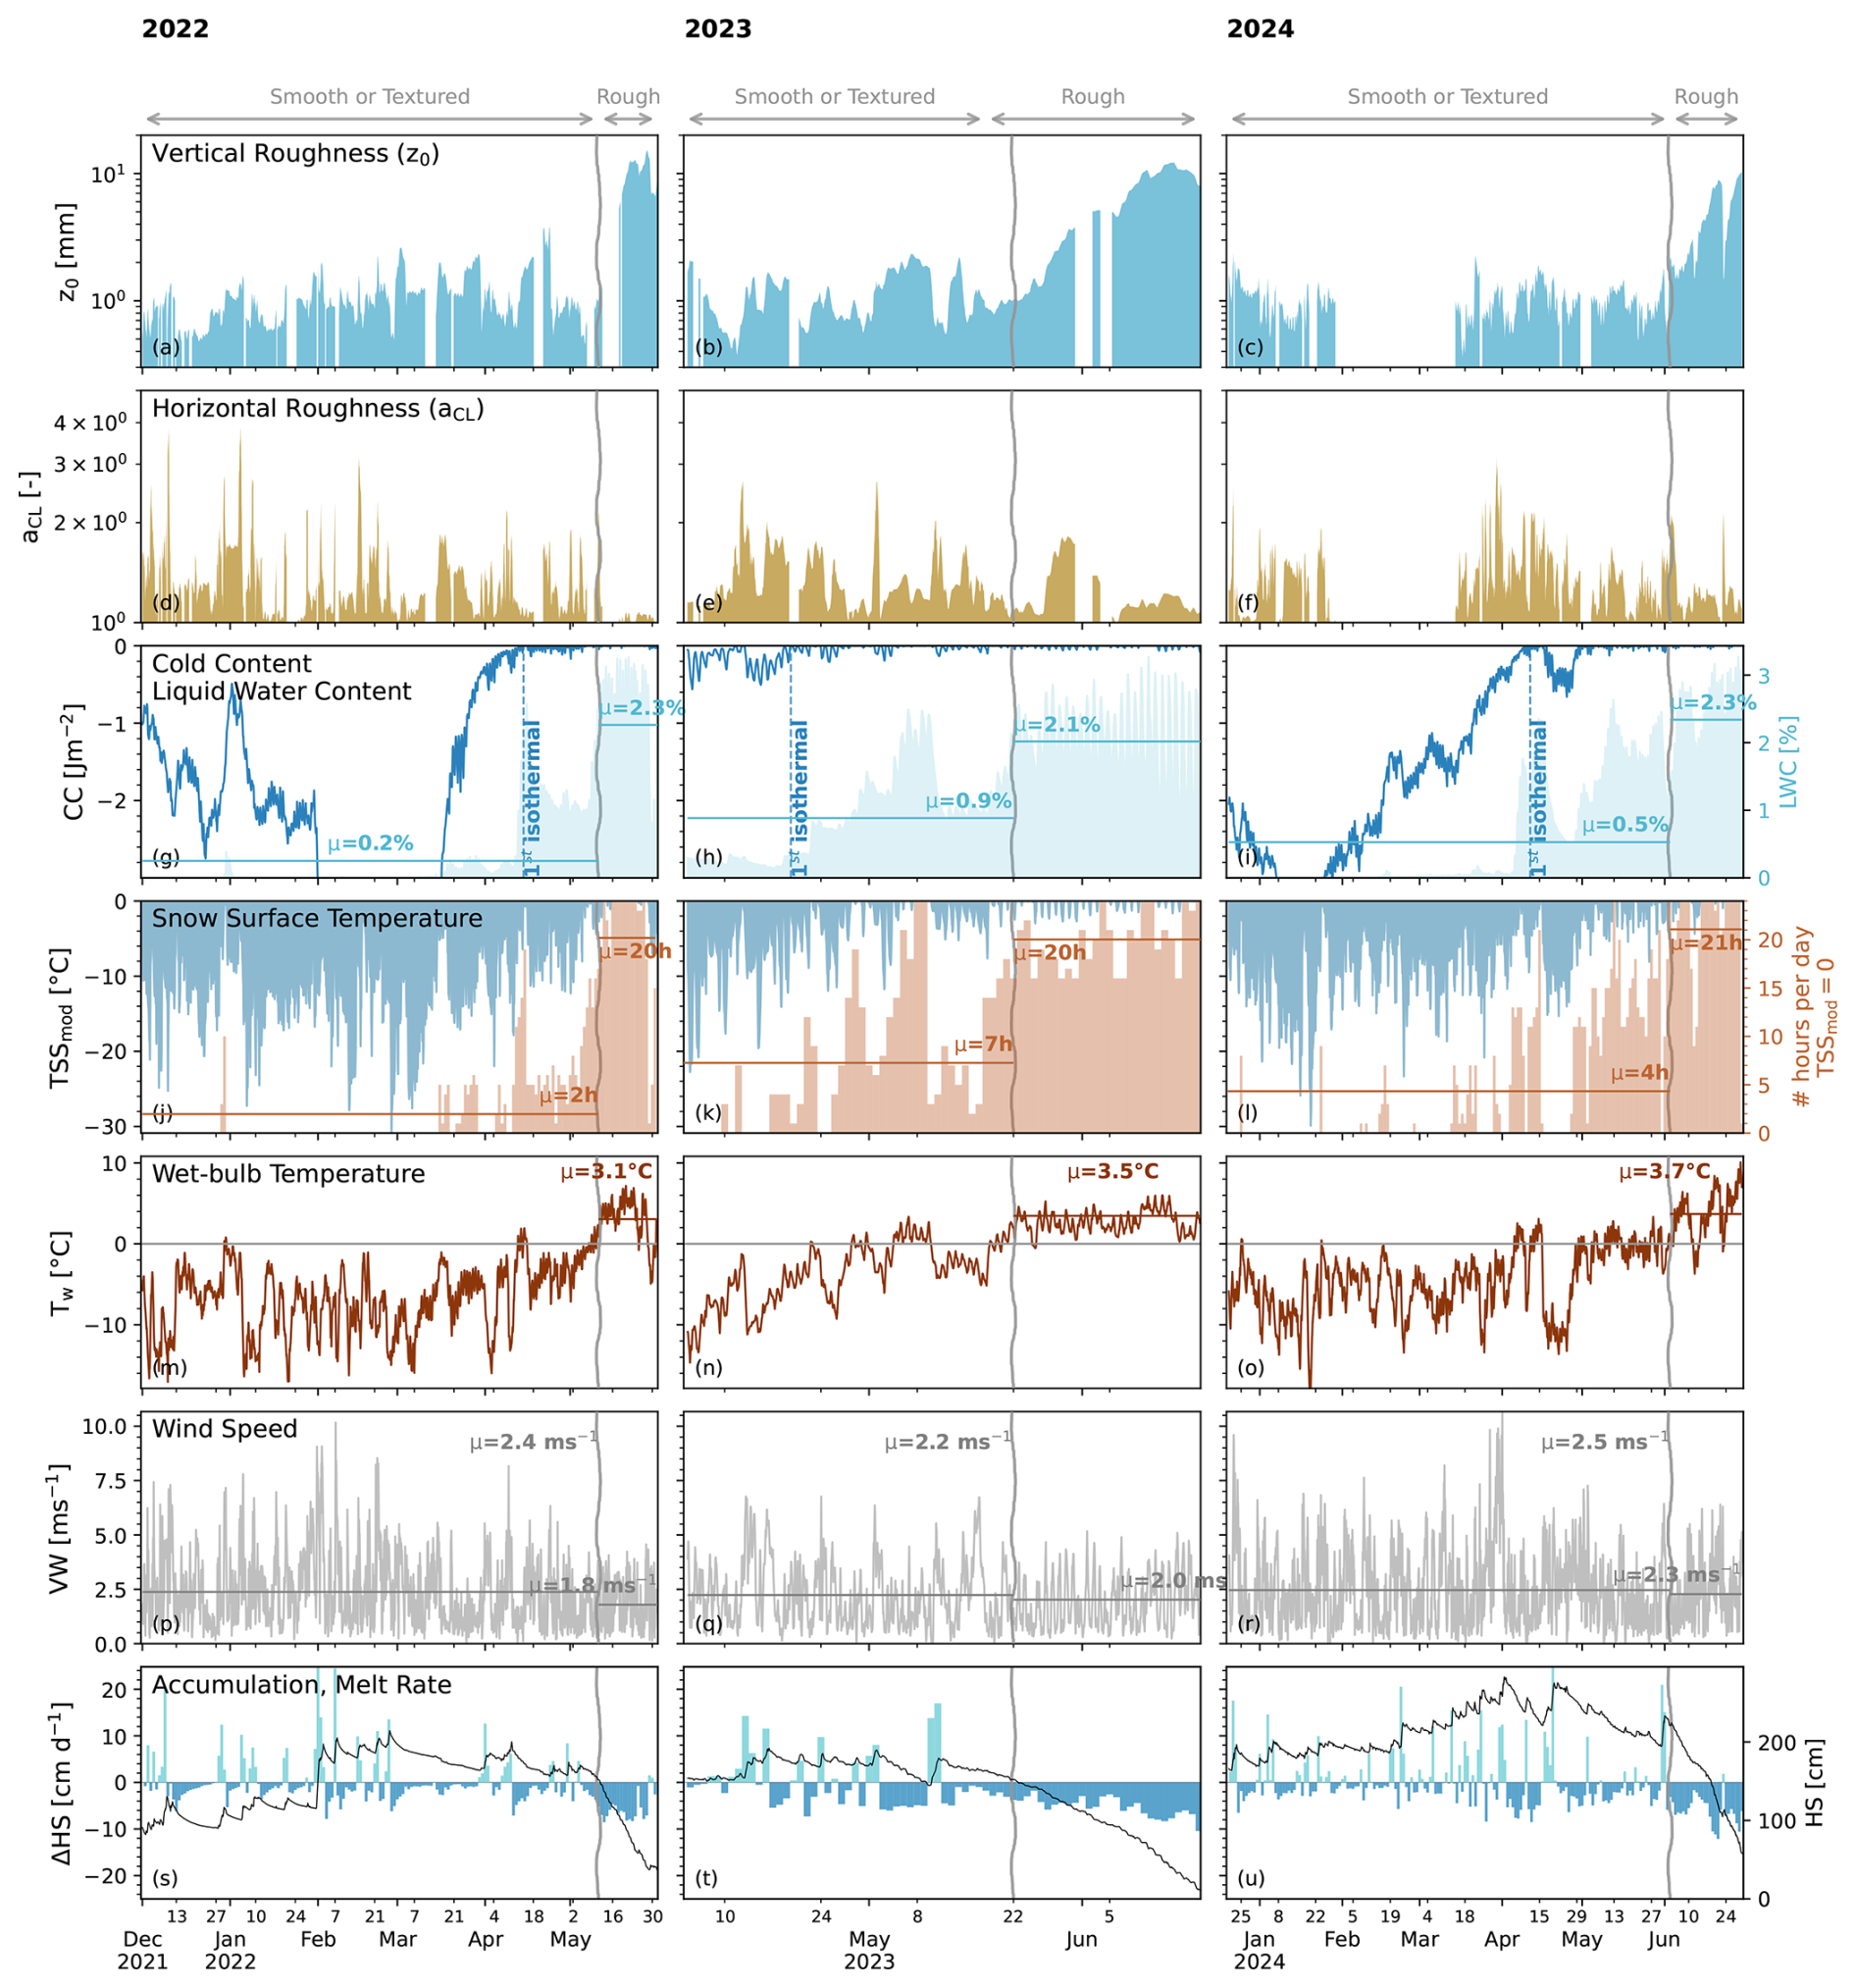
Figure 22022 through 2024: (a–c) Vertical roughness expressed as z0 (12 h average); (d–f) Horizontal roughness index expressed as the anisotropy ratio between correlation lengths aCL (12 h average); (g–i) SNOWPACK-simulated cold content (dark blue, 3 h average) and total liquid water content (light blue, 3 h average); (j–l) SNOWPACK-simulated snow surface temperature (blue, 3 h average) and count of isothermal surface occurrences per day (light red); (m–o) Wet-bulb temperature as formulated by Stull (2011) (3 h average); (p–r) Measured wind speeds (3 h average); (s–u) measured snow depths (black, 3 h average) with daily accumulation and melt rates (light and dark blue, respectively).
During the smooth phase, the horizontal roughness index (aCL) varies widely, while the vertical roughness index (z0) remains comparatively stable. In detail, aCL peaks up to 4, whereas z0 changes by no more than 4 mm above the 1 mm smooth baseline across all years (Fig. 2a–f). Here, isolated peaks in aCL are decoupled from any vertical roughness signal and are often correlated with wind gusts (Fig. 2p–r). This suggests that wind-driven (dry) snow redistribution processes, such as surface erosion or deposition, significantly alter the snow surface roughness. Zheng et al. (2026), Amory et al. (2017) reported similar findings, albeit in Antarctic snowfields, where sastrugi can form. During the rough phase, this pattern reverses. Vertical roughness increases steeply, reaching values one order of magnitude above the smooth baseline. Across all years, z0 changes by up to 15 mm. Conversely, the horizontal roughness signal becomes highly isotropic, with aCL shrinking towards 1. The absence of a wind signature in aCL during this phase suggests that suncup development, rather than wind redistribution, governs the evolution of surface roughness: the surface is mostly a melt-refreeze crust and therefore relatively insensitive to wind redistribution processes. In the following, we focus on the rough phase, which coincides with the snow ablation season (Fig. 2s–u) and where suncup growth is the dominant surface degradation mechanism at our site.
We define conditions for the onset of suncup growth by combining roughness time series with meteorological forcings and snowpack state variables. The disappearance of cold content provides the first signal for roughness-prone conditions (Fig. 2g–i). Once the cold content reaches zero for the first time, the snowpack is isothermal and can then melt and refreeze, initiating the first melt-related surface reliefs such as melt-refreeze crusts and ice layers. After several melt-refreeze cycles, the wetting front propagates until the bottom of the snowpack, with increasing average liquid water content (LWC, Fig. 2g–i). The average daily snow surface temperature (TSS) progressively increases, together with the number of isothermal surface hours per day (Fig. 2j–l). Across all years, the transition from a smooth to a rough regime consistently occurs when TSS remains at 0 °C for approximately 20 h d−1, with an average snowpack LWC of around 2 %. This suggests that the persistence of melt-prone conditions, rather than their episodic occurrence, is the key threshold for suncup growth. Moreover, in all years, the suncup growth onset closely coincides with wet-bulb temperatures consistently above zero (with average values of around 3 °C over the entire period – Fig. 2m–o) and reduced wind speeds relative to the smooth phase (Fig. 2s–u). The warming reflects the seasonal shift in thermal conditions. With above-freezing air temperatures and high wind speeds, more heat likely reaches the suncup ridges than the hollows, reducing deepening. Together, these indicators mark favorable conditions for the onset of suncup growth: (1) a snowpack that has reached an isothermal state, (2) near-continuous daily surface melt, (3) close to constantly positive wet-bulb temperatures, and (4) reduced wind speeds. As noted above, the smooth phase corresponds predominantly to the accumulation period, whereas the rough phase coincides with snowpack ablation and higher melt rates (Fig. 2s–u).
3.2 Interannual variability of suncup geometry and its meteorological drivers
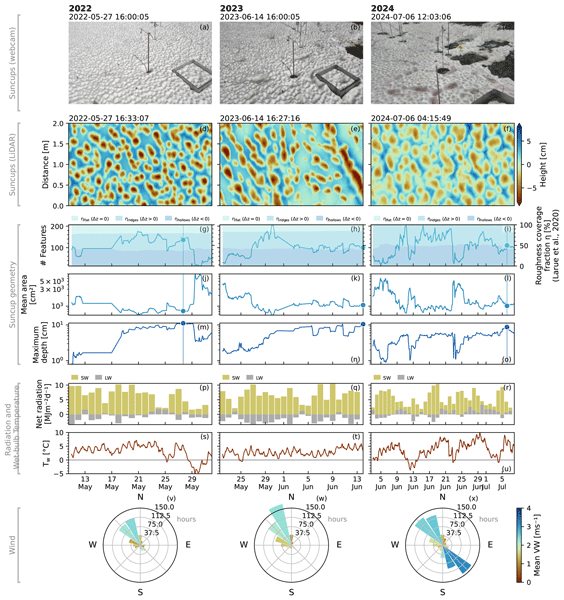
Suncup growth was consistently observed across all ablation seasons on our study plot (Fig. 3a–c), with 170–200 suncups forming each season. Webcam and LiDAR acquisitions (Fig. 3a–f) show that the 2D equivalent of the roughness coverage fraction η used in Larue et al. (2020) approached 100 % under natural conditions: the portions of the sub-domain not occupied by suncup hollows are structured into ridges, leaving little to no flat area. Consequently, η alone cannot describe suncup development under natural conditions, motivating the use of suncup area and maximum depth as additional descriptors.
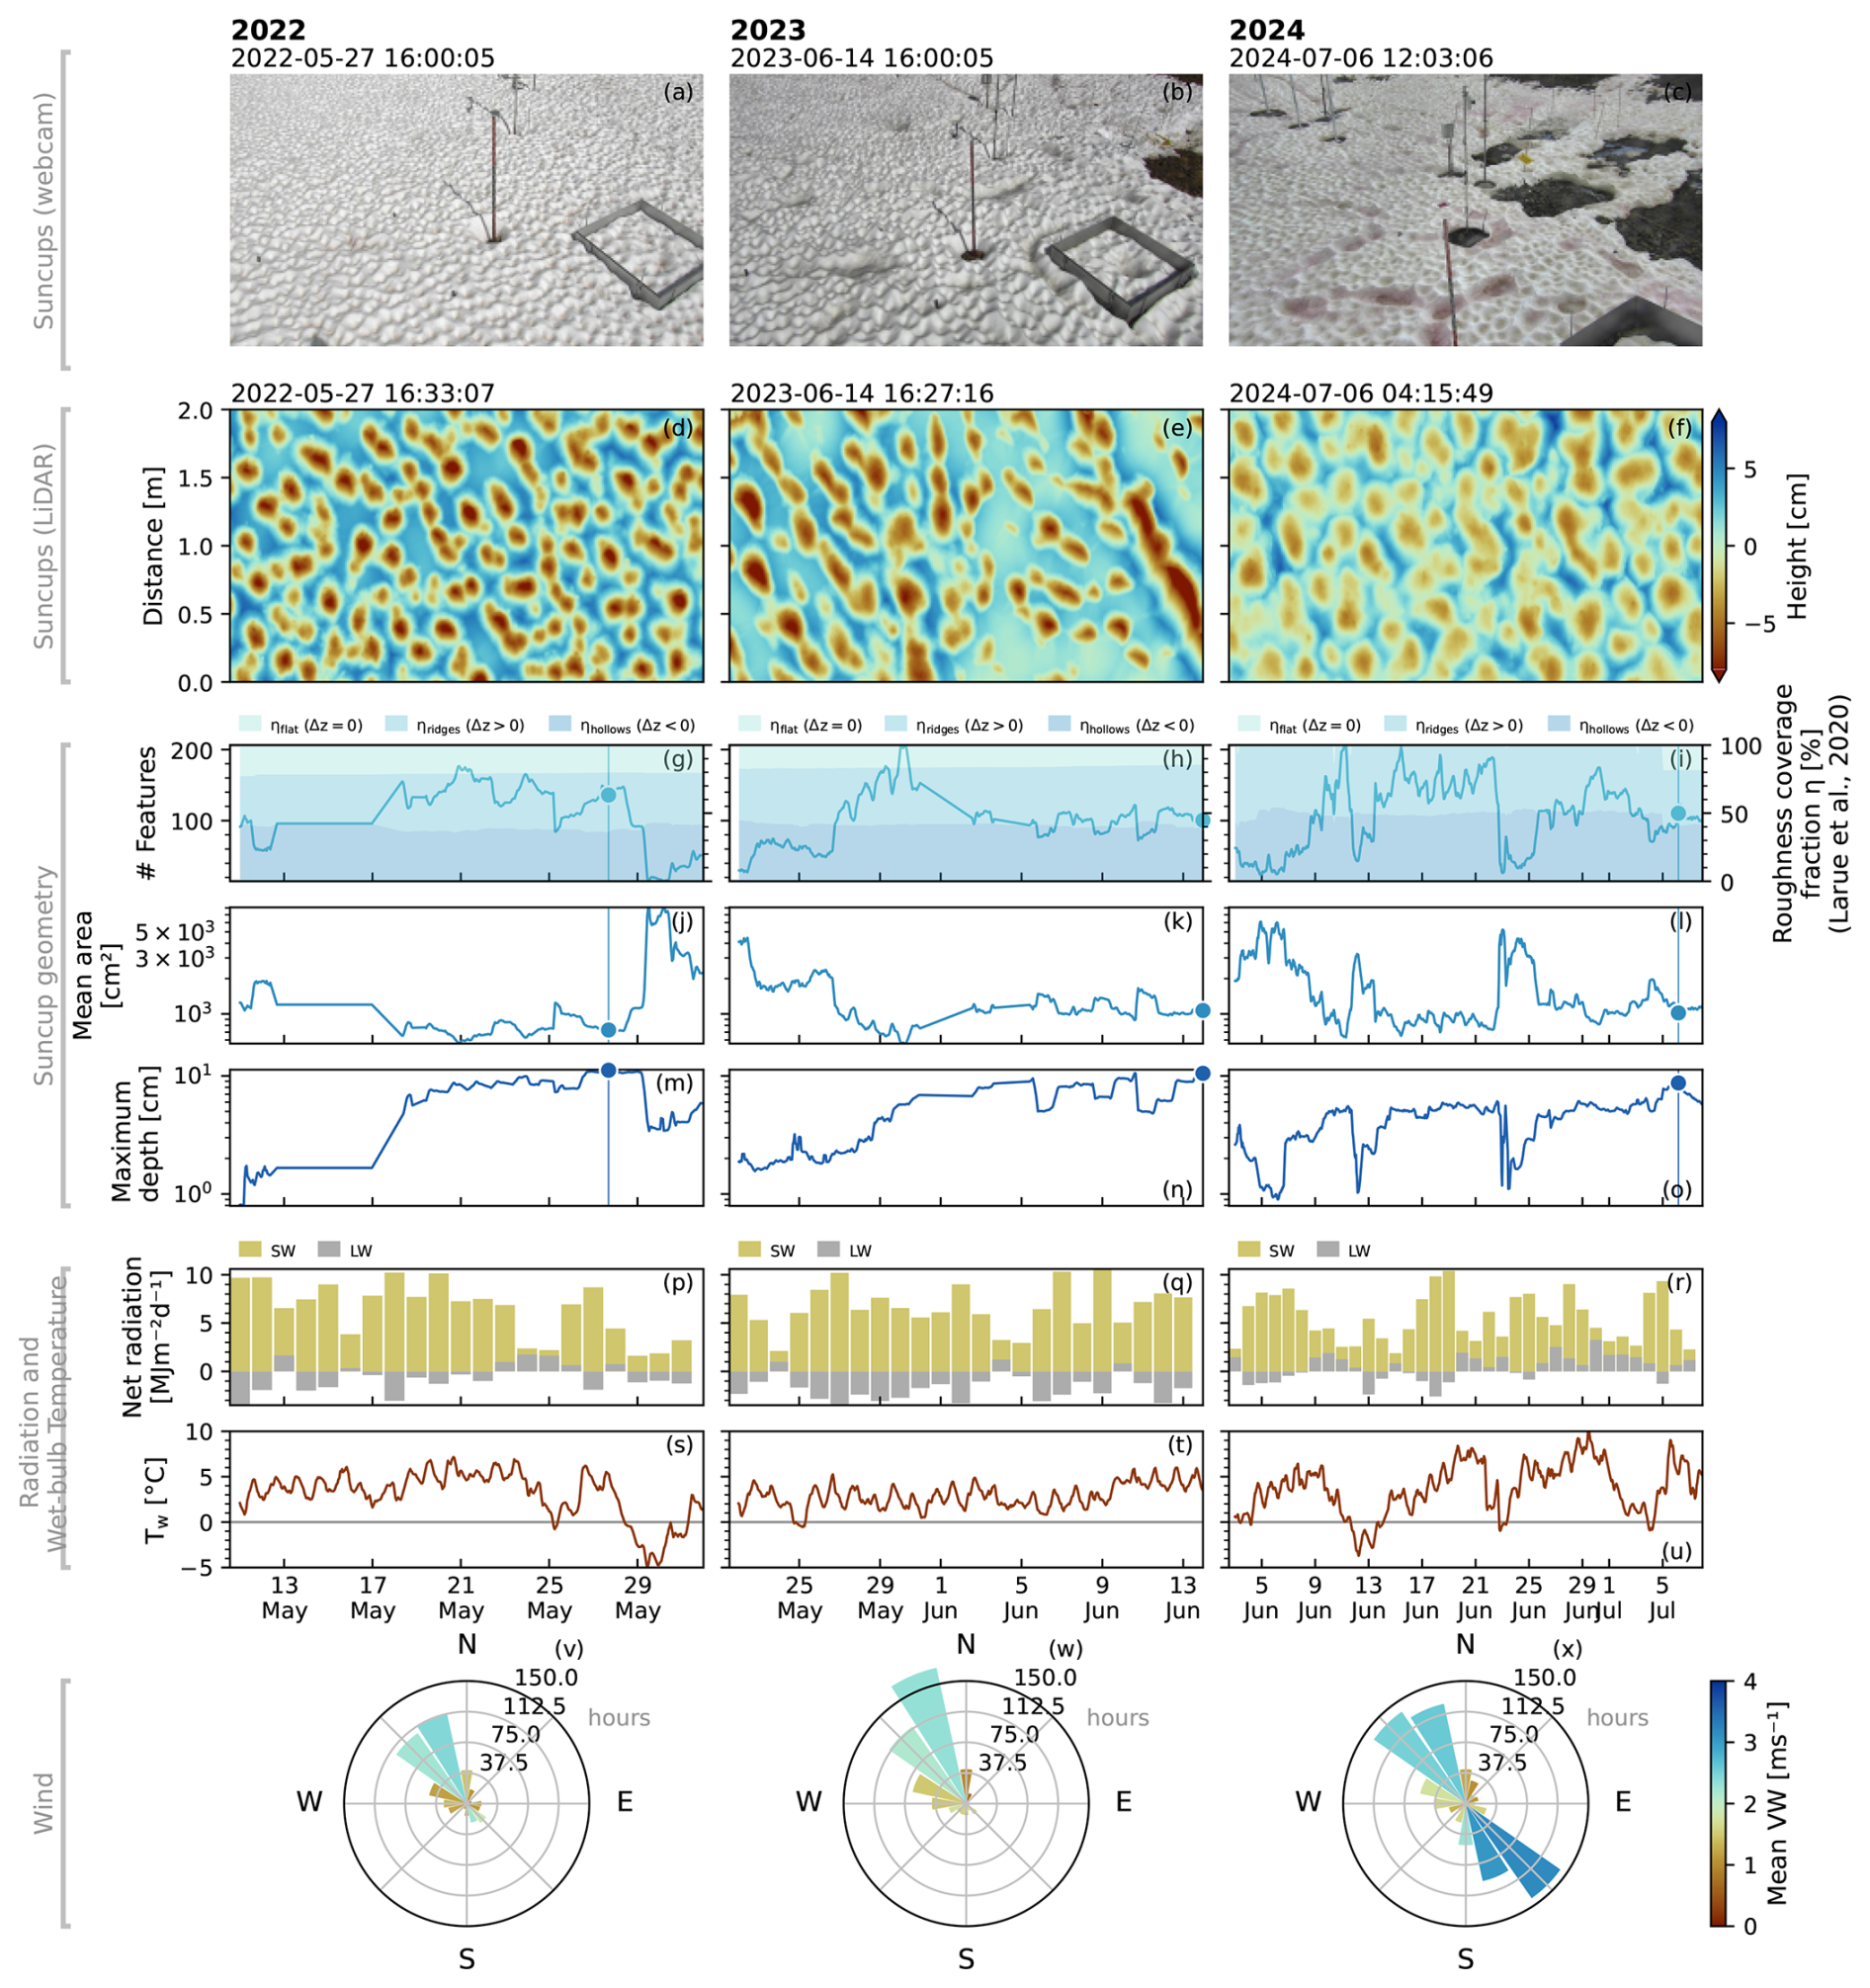
Figure 32022 through 2024: (a–c) Suncups, as seen from the webcam acquisitions in close proximity to the field of view of the LiDAR scanner; (d–f) Suncups, as seen from processed DSMs from LiDAR point clouds acquired at the same time as the webcam snapshots; (g–i) Number of suncup features (blue line) and cover fractions (shaded areas) computed as the 2D equivalent of Larue et al. (2020) (3 h average). Specifically, ηridges, ηhollows, and ηflat denote the areal proportion of each surface type within the control area () and are classified by deviation from mean elevation: ridges (Δz>0), hollows (Δz<0) and flat (Δz=0); (j–l) Suncup mean area; (m–o) Suncup maximum depth. The round point and vertical lines in (g–o) mark the webcam and LiDAR acquisition times in (a–f), corresponding to the timestamp of maximum suncup depth; (p–r) Cumulative daily net radiation, shortwave (yellow) and longwave (grey). (s–u) Relative humidity (dark yellow, 3 h average) and wet-bulb temperature (brown, 3 h average) as formulated by Stull (2011). (v–x) Wind speeds and directions.
We define the suncup growth window as the interval between the onset of the rough phase and reaching maximum depth. Its initial phase is marked by a steady increase in the number of suncups; subsequently, individual features begin to merge, and further growth proceeds through merging and deepening. Spring snowfall events periodically interrupt this progression, temporarily suspending growth by producing abrupt decreases in depth and increases in equivalent diameter. Table 2 summarizes the suncup growth descriptors, the growth-window duration, and the corresponding meteorological and radiative conditions for each season.
(Singer, 1967)Table 2Suncup geometry, meteorological, and radiative conditions averaged over the suncup growth window for all seasons (2022 through 2024). When is indicated, quantities are evaluated at the date of deepest acquisition; otherwise, they are averaged over the growth window of duration dg. We compute wind direction, constancy, and directional variability from speed-weighted vectors following Singer (1967).
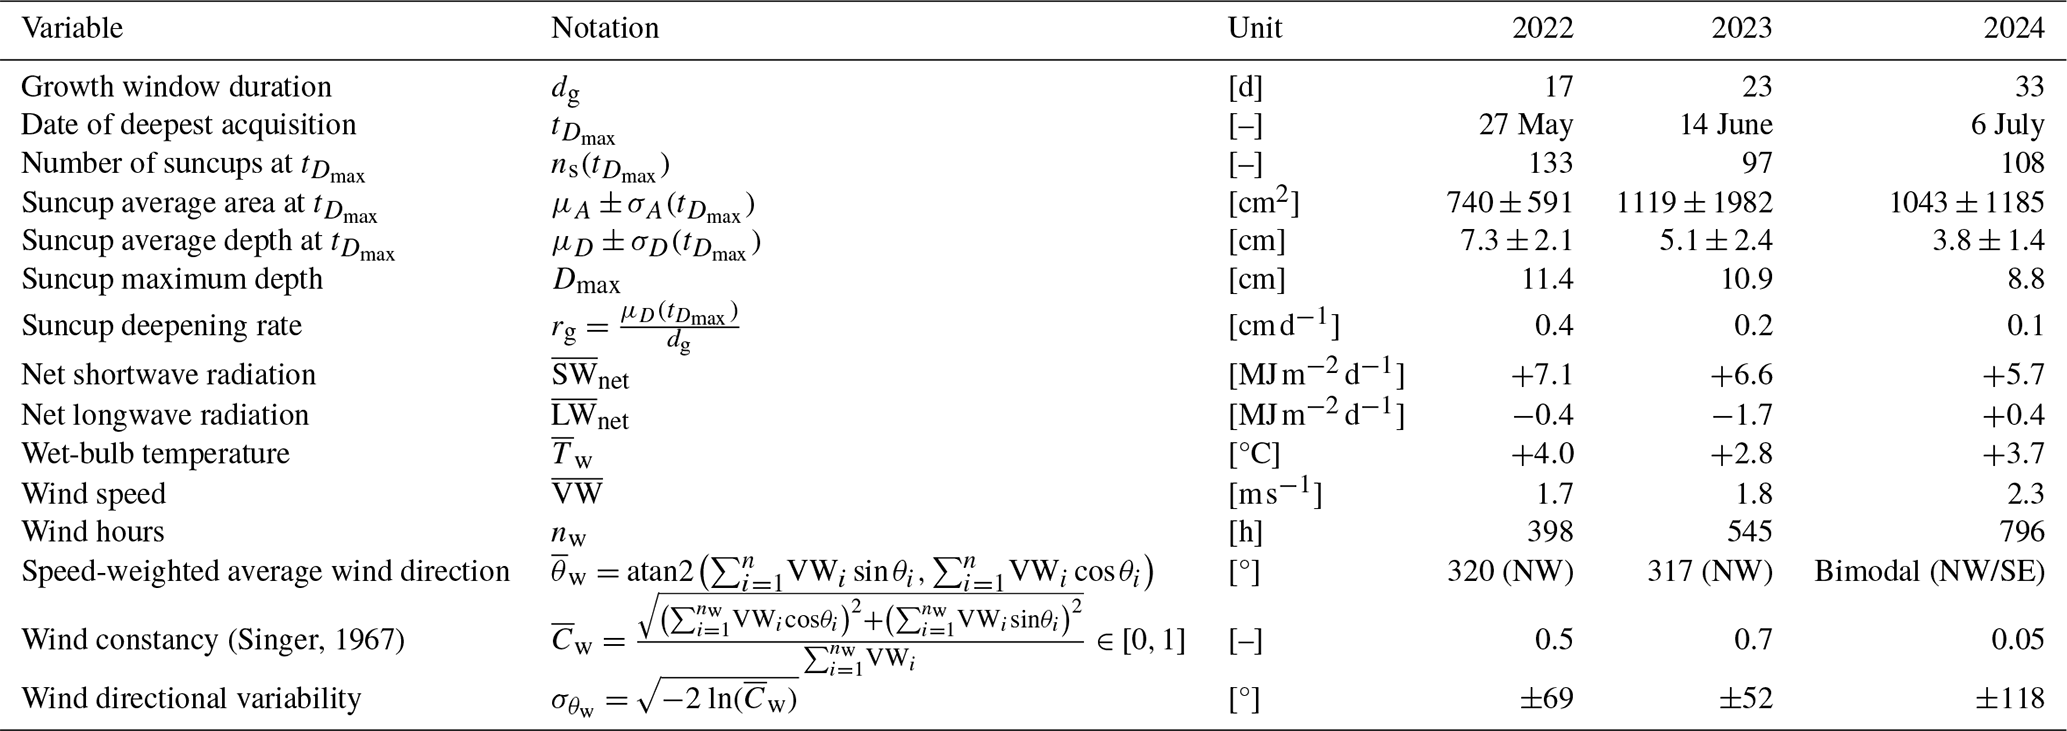
Suncup growth was most pronounced in 2022, which recorded the highest average depth of 7 cm (at least 2 cm greater than in the other seasons) and the narrowest mean suncup areas (Fig. 3g, j, and m). Deepening was also fastest that year (0.4 cm d−1), compressed into a 17-d growth window, 5 and 15 d shorter than in 2023 and 2024, respectively. Despite being the shortest window, it combined extremely favorable radiative and thermal conditions. The net shortwave gains were the highest (+7.1 ; 7 % and 20 % above 2023 and 2024 – Fig. 3p–r), and the wet-bulb temperature the warmest (+4.0 °C – Fig. 3s), and therefore the overall most melt-permissive. Winds were the weakest (1.7 m s−1), showing decent constancy (, Singer, 1967) and relatively low directional variability () around a mean direction from the NW (Fig. 3v). This combination of favorable radiative and thermal conditions produced deep, small, circular, and evenly distributed suncups (Fig. 3a and d).
In 2023, suncups reached comparable maximum depths (11 cm) but were on average 2 cm shallower and 50 % wider than in 2022, developing over a longer 23-d window (Fig. 3h, k, and n). Radiative conditions remained favorable (+6.6 net shortwave), yet this season carried the largest net longwave loss (−1.7 – Fig. 3q) with the overall coolest wet-bulb temperature (+2.8 °C – Fig. 3t) which, whilst still favoring melt, did so least of the three seasons. Despite average wind speeds and directions being comparable to 2022, in 2023 wind showed overall greatest constancy (, Singer, 1967) and lowest directional variability () around the NW direction (Fig. 3w). This produced notably larger, elongated features oriented along the prevailing NW wind direction (Fig. 3b and e), consistent with the large size variability of that season, where the standard deviation of suncup area (σA=1982 cm2) approached twice the mean (μA=1119 cm2).
Radiative conditions in 2024 were the least favorable, with the overall lowest net shortwave gains (+5.7 ), and the highest net longwave gain from frequent cloud cover (+0.4 – Fig. 3r). However, thermal conditions were still favorable: the wet-bulb temperature was the second-highest and exceeded 2023 by nearly 1 °C (Fig. 3u). Winds were the strongest (2.3 m s−1) but also the most variable () around a bimodal NW/SE regime (Fig. 3x). Suncups were 25 % shallower than in 2022 (Fig. 3m and o). The highest directional variability () precluded the development of a preferred morphological axis despite the greatest overall cumulative wind forcing, producing similarly wide but less elongated suncups than in 2023 (Fig. 3b, c, e, f, k, and l).
Together, these results indicate that suncup deepening rate and depth were most closely associated with the radiative energy balance and with melt-permissive (warm, humid) near-surface conditions. In contrast, orientation and elongation were most closely associated with wind speed and directional constancy. Table 2 summarizes all quantitative indices.
3.3 Suncup roughness and impurity signatures in the broadband albedo decay of melting snow
Under smooth, dry conditions, TARTES overestimates and slightly underestimates measured albedo under diffuse and direct illumination conditions, respectively, with biases and −0.01 (Fig. 4a–c and d–f), which may reflect inaccuracies in the input snowpack and model limitations. As the snow wets and SSA decreases, TARTES overestimates albedo under all illumination conditions before suncup growth, with average biases across years of (diffuse) and +0.04 (direct). Despite SNOWPACK systematically underestimating the density of the uppermost layer and, occasionally, its SSA (Fig. 4j–o), this doesn't seem to introduce important biases in SNOWPACK-forced simulations with respect to measurement-forced ones (Fig. 1). Therefore, we attribute to TARTES's misrepresentation of wet-snow metamorphism on a flat surface.
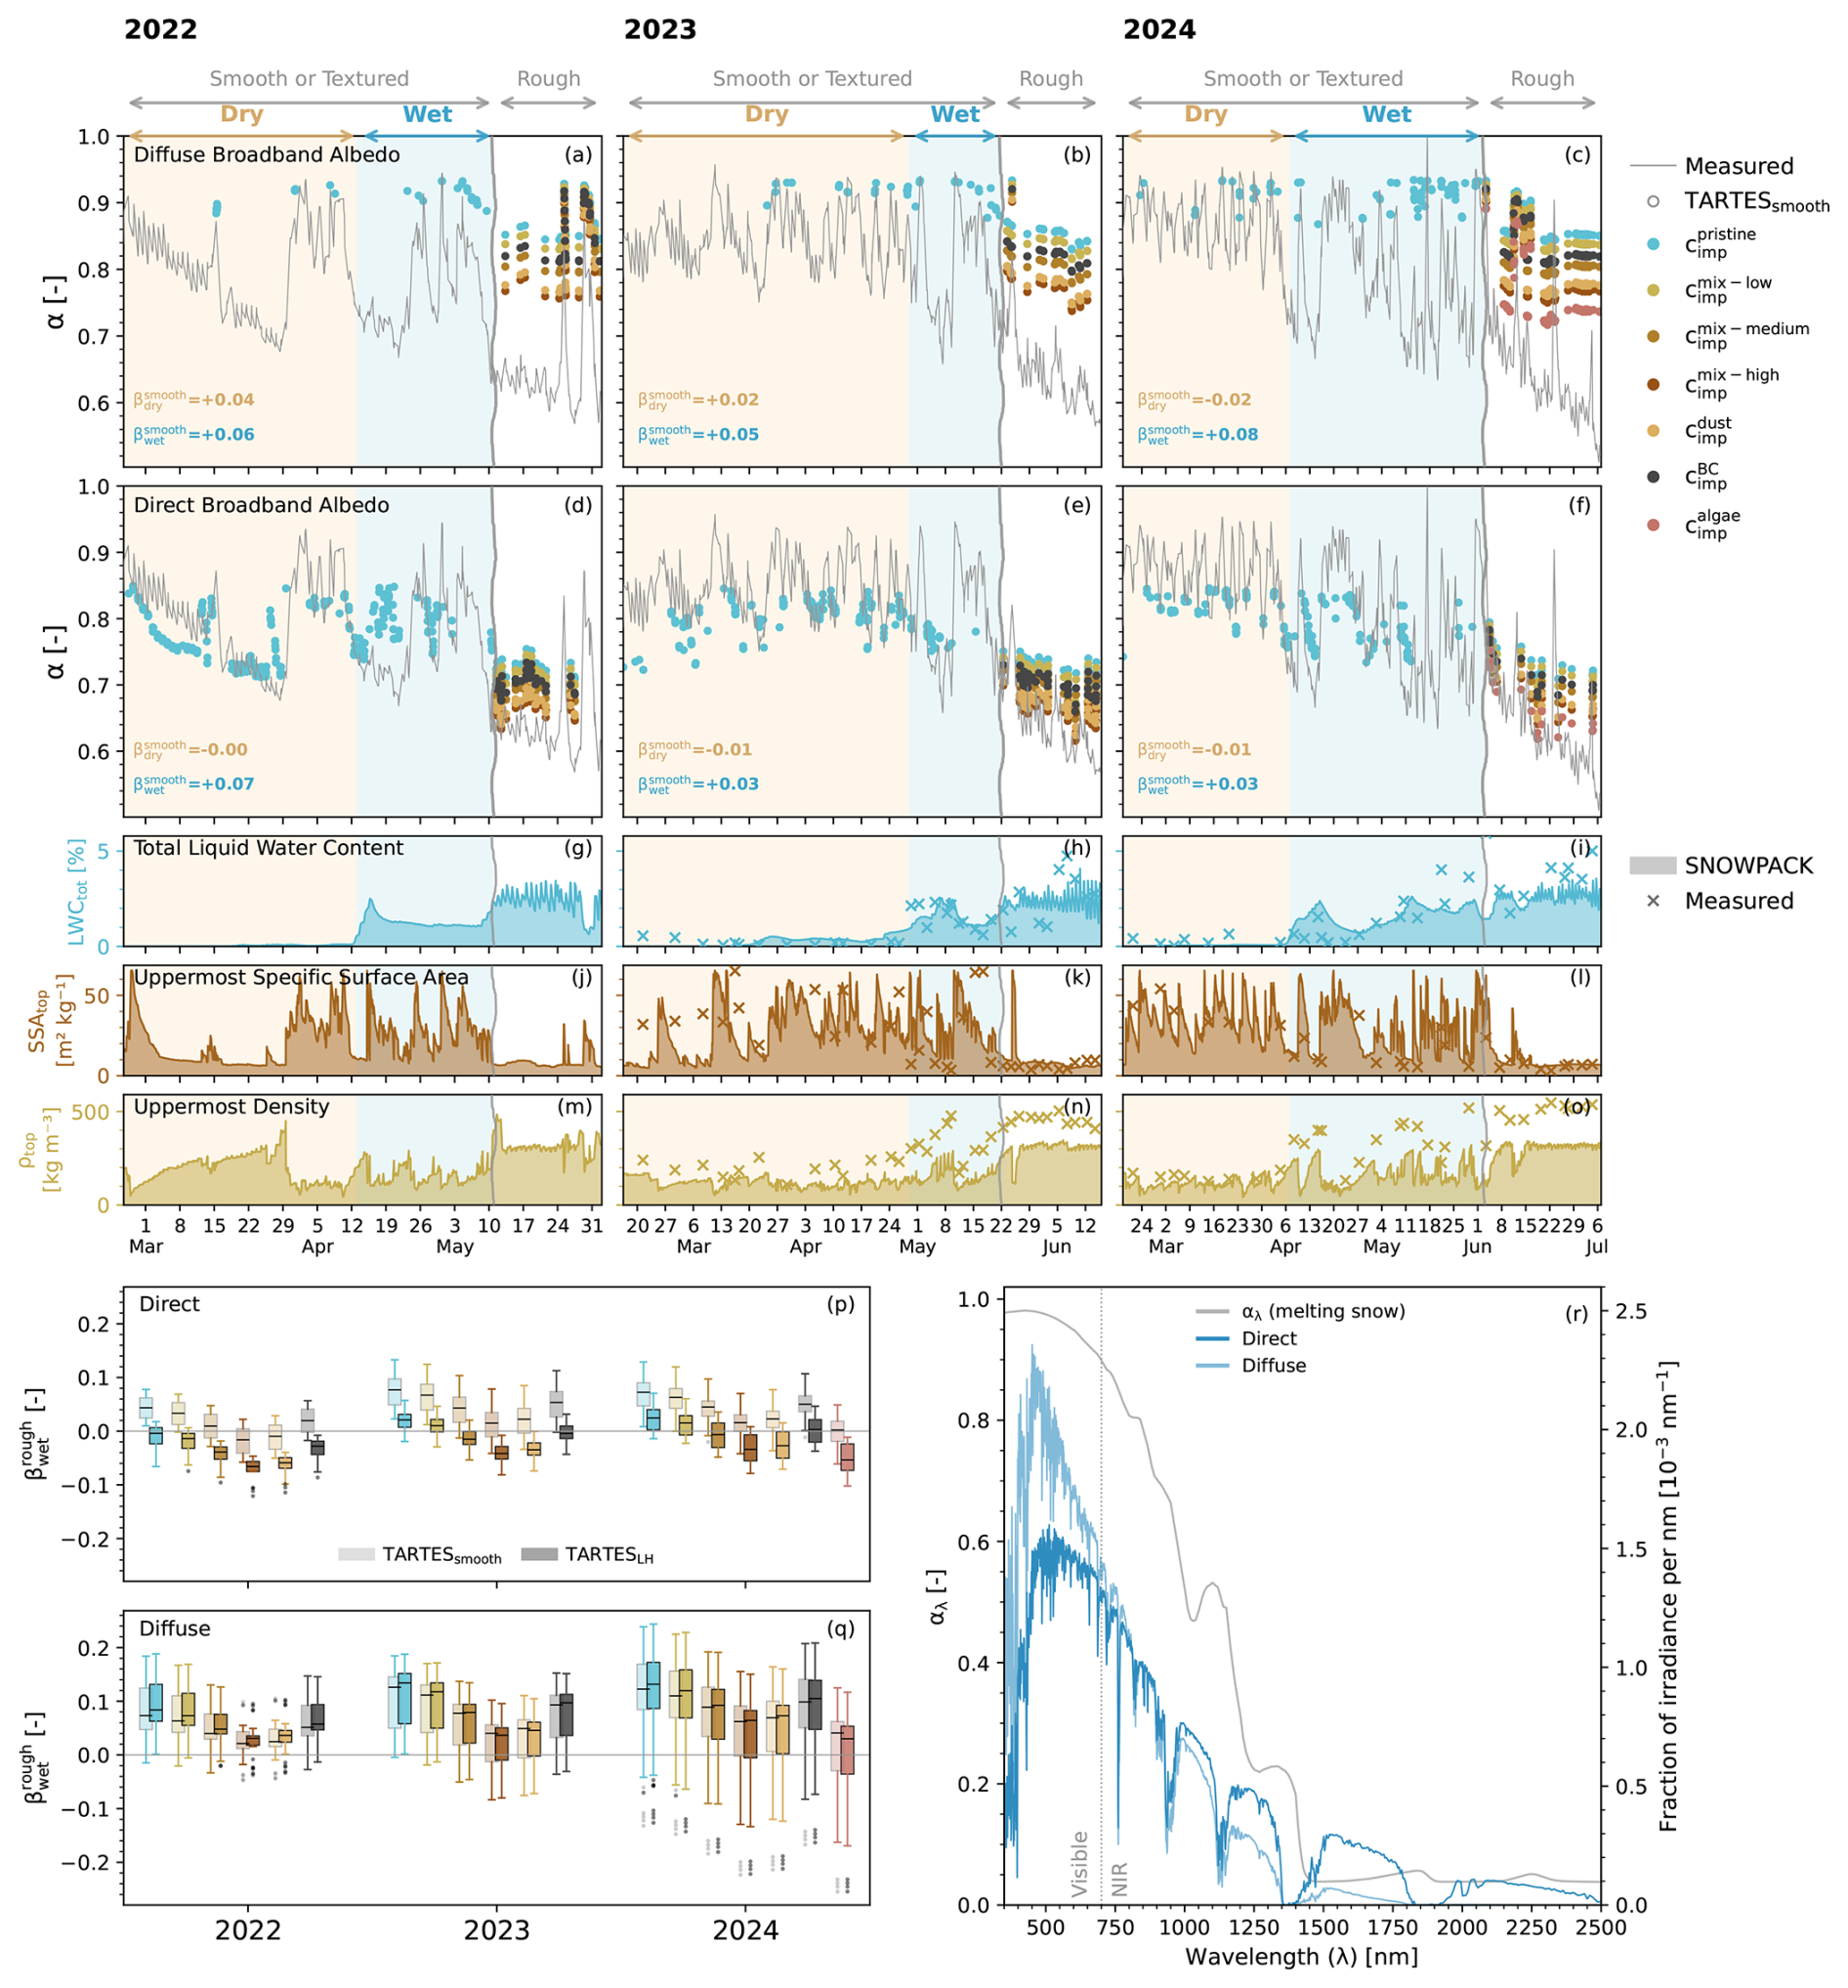
Figure 42022 through 2024: (a–c) Measured and TARTES flat-surface broadband albedo for pristine and impurity-loaded snow under diffuse illumination conditions and (d–f) direct illumination conditions; (g–i) SNOWPACK-modelled total liquid water content (LWC, 3 h averaged); (j–l) SNOWPACK-modelled uppermost specific surface area (SSA, 3 h averaged) over the top 10 cm; (m–o) SNOWPACK-modelled uppermost density (ρ, 3 h averaged) averaged over the top 10 cm. All SNOWPACK simulations in (g–o) are compared to manual measurements from Carletti et al. (2025a) (cross marks); (p–q) Residual roughness signatures under direct and diffuse illumination for pristine and impurity-loaded scenarios, comparing flat-surface TARTES simulations (TARTESsmooth; transparent boxes) and TARTES corrected with the effective-albedo parametrization of Löwe and Helbig (2012) (TARTESLH; opaque boxes); (r) Fraction of irradiance per nm for the clear-sky direct (dark blue) and overcast diffuse (light blue) libRadtran solar spectra used as weighting functions, and TARTES spectral albedo of pristine, wet-metamorphosed snow (, ) at 52° under diffuse conditions.
At the onset of suncup growth, we further partition the contributions to albedo reduction and account for impurities and algae on wet, heavily metamorphosed snow. We quantify the suncup signature, , by subtracting from the residual between measured and TARTES broadband albedo (Eq. 3, Fig. 4p–q). Assuming pristine snow, suncups generate albedo decreases of 0.04–0.07 and 0.08–0.1 for direct and diffuse conditions, respectively. The consistently larger diffuse signature (Fig. 4q), evident across all scenarios, reflects the visible-weighting of the overcast spectrum (Fig. 4r; see below). When assuming mixed, low-to-medium impurity scenarios (or the black-carbon-dominated scenario, which reduces albedo comparably), suncup signatures decrease to 0.01–0.06 and 0.05–0.09 under direct and diffuse conditions, respectively. This suggests that suncup roughness and impurities jointly contribute to the albedo deficit that TARTES cannot reproduce when assuming a flat surface. When assuming mixed-high scenarios (or the dust-dominated scenario, which reduces albedo comparably) and algal bloom scenarios, tends to, and often falls below, zero under direct illumination conditions (Fig. 4p). These impurity scenarios cancel the suncup signature, suggesting that the combined effect of suncups and impurities is comparable to that of the hypothesized impurity content on a flat surface.
is, on average, twice as large under diffuse as under direct illumination (Fig. 4p and q). This asymmetry cannot be attributed to suncup roughness alone. At the visible-NIR boundary, the two insolation weights intersect and cross (Fig. 4r): the diffuse spectrum over-weights in the visible, the direct over-weights in the NIR. However, suncup mechanisms do not favor diffuse illumination: the effective-angle effect activates only under direct illumination, and the multiple-reflections effect activates in the NIR, where the diffuse spectrum carries less weight (Fig. 4r). Moreover, in the highly metamorphosed rough phase, the NIR spectral albedo lies well below the ≃0.5 balance value that maximizes photon trapping (Larue et al., 2020), further limiting its contribution. Therefore, suncup mechanisms cannot produce a larger diffuse signature. The asymmetry instead matches a visible-dominated absorption signature: because the diffuse weight is concentrated in the visible, where LAPs and algae have their strongest influence, any impurity component of the residual is preferentially amplified under diffuse conditions. This explains why the diffuse decreases as the hypothesized impurity concentration increases (and approaches 0 in the 2024 algal bloom scenario), and why it requires higher assumed concentrations to approach zero than the direct residual does. Rather than suncup roughness, the larger diffuse residual likely reflects unaccounted-for impurity darkening.
The effective albedo parametrization of Löwe and Helbig (2012) (TARTESLH) further supports this interpretation, as it lowers residuals relative to the flat-surface assumption (TARTESsmooth) predominantly under direct illumination, when both suncup mechanisms are active. Under diffuse illumination, it only marginally reduces the spread of residuals or converges towards the flat-surface results (Fig. 4q), as expected if the diffuse residual is governed by visible-range impurity darkening that a roughness parametrization cannot capture. We note, however, that we cannot attribute the diffuse residual to impurities with full confidence. Under overcast, smooth-wet conditions, TARTES flat-surface albedos exceed the measurements substantially and decrease little through the season, unlike under clear skies, where they track the seasonal decline. Therefore, part of the residual may reflect flat-albedo bias, inaccuracies in the direct–diffuse partitioning rλ or spectral radiation input, or the influence of the surrounding terrain, rather than impurity loading alone.
Under direct illumination, the effective albedo parametrization of Löwe and Helbig (2012) brings residuals close to, or slightly below, zero across all years and hypothesized scenarios, with averaging −0.02. The mixed, low-to-medium (or black-carbon-dominated) hypothesized concentrations seem the most likely at our site, with the lowest across all years. The mixed-high, dust-dominated, and algal-bloom scenarios yield residuals that fall systematically below zero ( on average). Because is averaged over the entire rough period, this suggests these high impurity concentrations are unrealistic as a whole-phase average, though plausible for the late ablation stage, when surface impurities have become most concentrated.
3.4 Impurity redistribution and suncup growth as interplaying controls on broadband albedo decay
During the rough phase, the measured broadband albedo exhibits a strong logarithmic correlation with the aerodynamic roughness length z0 (, , Fig. 5a). Two categories of events deviate from this relationship: spring new-snow layers depositing on pre-existing suncups, which abruptly increase SSA and raise albedo outside the fitted trend, and exceptionally high impurity loadings, such as the 2024 algal bloom. The logarithmic fit also shows that the rate of albedo decay is steepest at low z0 and progressively relaxes as z0 approaches values characteristic of deep suncups.
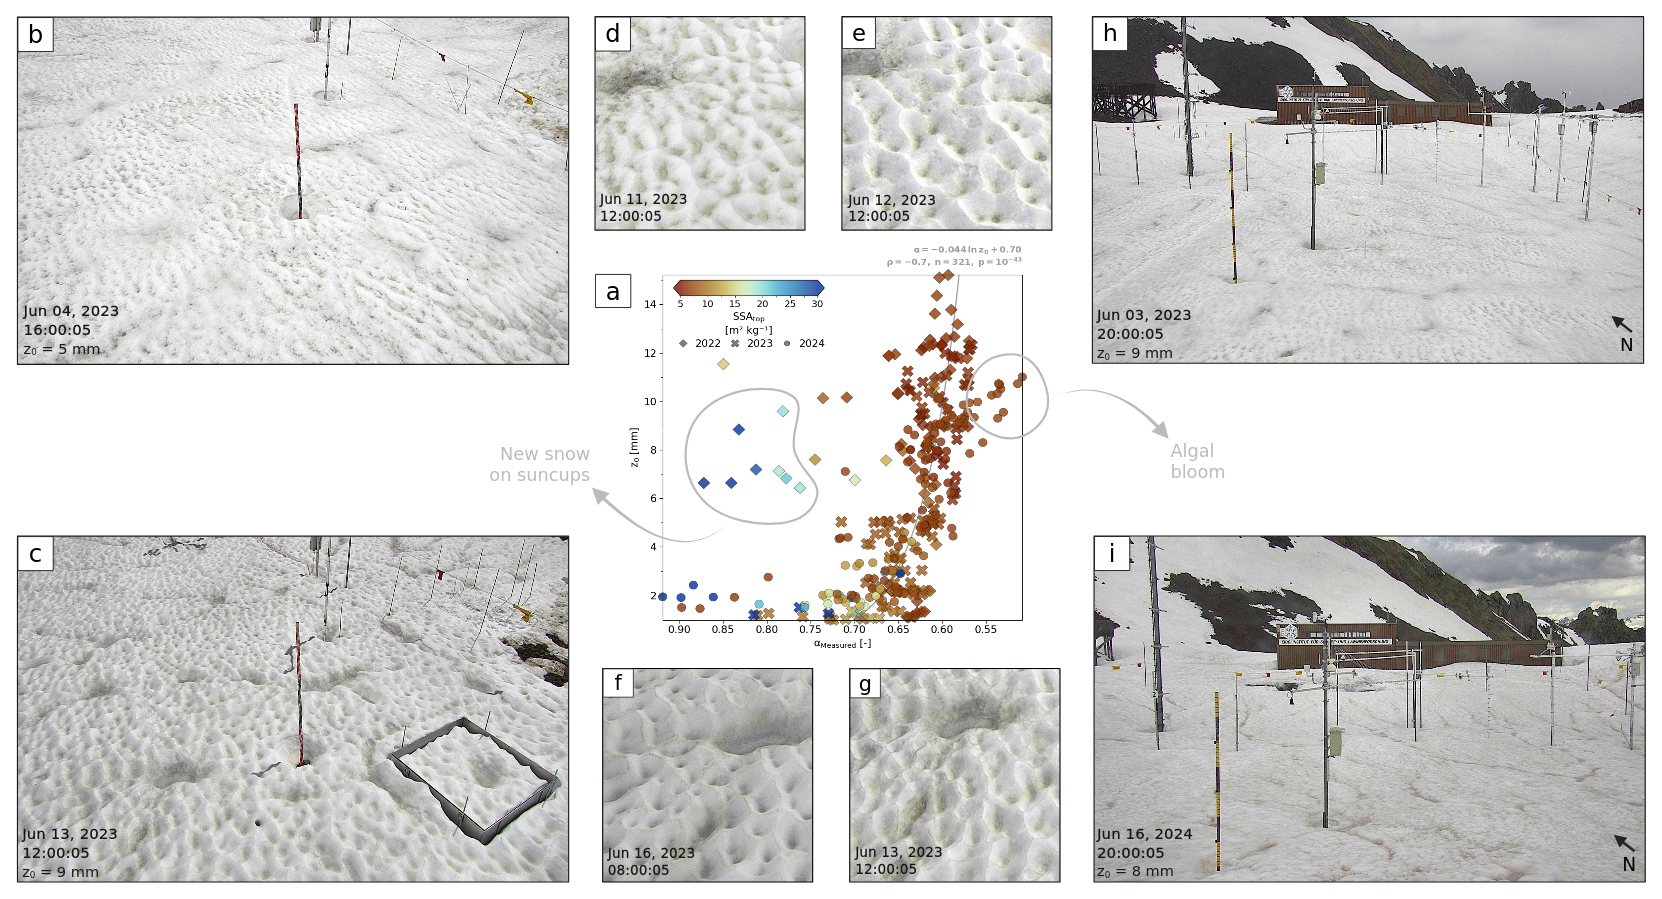
Figure 5(a) KDE-averaged logarithmic correlation between measured broadband albedo αMeasured and aerodynamic roughness length z0 across all years (; n=321; ; ). The hourly data is resampled to a 3 h average. Outliers represent either thin new snow layers on the top of already developed suncups, or exceptionally high surface impurities, such as the 2024 algal bloom. (b) Webcam acquisition of early-stage suncups (June 04th, 2023; z0=5 mm). (c) Webcam acquisition of late-stage suncups (13 June 2023; z0=9 mm). (d, e) Detailed look at the differential distribution of impurities at suncups' hollows. (f, g) Detailed look at the differential distribution of impurities at suncups' ridges. (h) Webcam acquisition (June 03rd, 2023; z0=9 mm; diffuse illumination). Winds over the preceding week predominantly from the NW (speed-weighted mean direction 305°, prevailing for 77 % of the total hours). (i) Webcam acquisition (16 June 2024; z0=8 mm; diffuse illumination). Winds over the preceding week were predominantly from the SE (speed-weighted mean direction 147°, prevailing for 70 % of the total hours).
The shape of the correlation between z0 and the broadband albedo decay suggests a possible link between the evolution of suncup roughness and impurity loading. Webcam acquisitions from our study plot (Fig. 5) point to a spatial redistribution of impurities as suncups deepen. Over early-stage suncups (Fig. 5b), impurities appear homogeneously distributed. At later-stage suncups (Fig. 5c), despite likely higher total concentrations, impurities appear preferentially located in the hollows (Fig. 5d and e) and, to a lesser extent, at the ridges (Fig. 5f and g), leaving the exposed surface apparently cleaner than in the early-stage situation. This redistribution appears to relocate impurities within the suncup topography rather than remove them from the surface. The coupling between suncup growth and impurity loading may therefore be most effective during the early-stage phase, when impurities are more uniformly distributed; as suncups deepen and meltwater concentrates impurities into the hollows, the roughness contribution may grow, while the darkening effect of LAPs, though spatially reorganized, is not necessarily reduced.
Aeolian debris transport also appears to contribute to surface darkening. Figure 5h (June 03rd, 2023; z0=8.7 mm) shows a week when winds blew predominantly from the NW, with a speed-weighted average direction of 305° prevailing for 77 % of the total hours. Dark, rock-like debris is visible on the upwind section of the early-stage suncups. The NW sector of the research field is enclosed by steep rock faces where snow generally disappears well before it does on the field itself, which sits in a slight local terrain depression that allows snow to persist longer. The surface darkening is therefore consistent with rock debris mobilized from the surrounding slopes. Conversely, Fig. 5i (17 June 2024; z0=8.3 mm) corresponds to a week of predominantly SE winds, with a speed-weighted average direction of 147° prevailing for 70 % of the total hours. Although the suncup roughness is nearly identical to that of the previous year, the upwind dark debris is markedly less apparent. Unlike the NW sector, the SE side of the research field opens onto the valley and is not overlooked by steep rock faces, consistent with a reduced local debris supply.
Three seasons of high-resolution LiDAR monitoring of an evolving snow surface allowed us to identify a smooth regime, characterized by dynamic horizontal anisotropy and a relatively stable aerodynamic roughness length (z0), and a rough regime, characterized by an order-of-magnitude increase in z0 and the disappearance of horizontal anisotropy. These results confirm the conclusions of Fassnacht et al. (2023), Fassnacht et al. (2009), which were supported by only six observations over a single season. Our time series show that wind primarily drives anisotropy in the smooth regime. Wind gusts coincide with anisotropy peaks, while z0 remains unchanged (Fig. 2d–f and p–r). This contrasts with wind-driven environments such as Antarctica (Amory et al., 2017), where sastrugi fields develop pronounced vertical relief and can raise z0 by an order of magnitude (Zheng et al., 2026). At our alpine latitude and elevation, suncup growth favored conditions that combined surface melt with low wind speeds. This is consistent with the mechanism described by Lliboutry (1954), in which ablation occurs across the entire suncup surface, including hollows, walls, and ridges. The onset of suncup growth coincides with the daily preponderance of isothermal surface temperatures and above-freezing wet-bulb temperatures. This carries an important implication: because these thresholds are easily detectable by both standard field sensors and snow simulations, they provide a simple diagnostic for detecting the onset of suncups. This opens the way for surface energy balance schemes to explicitly account for the transition from a flat to a rough-surface regime during ablation.
Across all three years, suncup depth and growth rate followed the radiative energy balance, whereas the shift from the clear, calm conditions of 2022 to the overcast, windy conditions of 2024 illustrates how turbulent exchange displaces radiation as the dominant ablation mode. The contrast with 2022 marks 2023 as an intermediate season: shallower suncups, which deepened more slowly, co-occurred with lower net shortwave gains and the largest longwave losses, leaving less energy for melt, consistent with the radiation-driven growth formulation of Mitchell and Tiedje (2010), Post and LaChapelle (2000), and Lliboutry (1954); Matthes (1934). The 2024 case is interesting because suncups formed under the overall least melt-permissive radiative regime across all years: frequent cloud cover suppressed shortwave input, and strong, variable winds favored turbulent over radiative ablation. This outcome is not predicted by the radiation-driven theory alone, unless we consider the framework proposed by Rhodes et al. (1987). According to Rhodes et al. (1987), when turbulent heat exchange dominates, impurities act as thermal insulators in snow, slowing melt locally and allowing hollows to deepen elsewhere. This mechanism was then described as a function of the dirt-layer thickness (Tiedje et al., 2006; Betterton, 2001), though a quantitative threshold in terms of impurity type or concentration has not been established. The exceptional 2024 Saharan dust deposition events (Pons et al., 2025; Cuevas-Agulló et al., 2024), together with prolonged melt and unfrozen soil (Carletti et al., 2025b), likely created favorable conditions for the algal bloom visible in Fig. 3c (Roussel et al., 2024), which could have enhanced the surface concentrations to a sufficient amount to sustain suncup growth despite otherwise unfavorable conditions. This interpretation comes with two caveats. First, Rhodes et al. (1987) assume impurities concentrate on ridges, whereas the algae covered the entire suncup surface; it is therefore unclear whether the insulation feedback operated as formulated. Second, our data cannot separate whether the algal bloom was necessary for suncup growth, or merely enhanced a transition already driven by meteorology. Interestingly, under turbulent conditions, Fassnacht et al. (2009) observed entirely smoothed-out suncups over “red” snow, and reduced suncup amplitude following the deposition of coarse aeolian debris (Fassnacht et al., 2010), suggesting that not only concentration, but also distribution and grain size of impurities may influence how suncup roughness evolves on snow.
To isolate the albedo signal attributable to the co-evolution of suncup roughness and impurities, we first account for biases unrelated to surface morphology. These could arise at two points in the modeling chain: the surface properties from SNOWPACK and the albedo TARTES computes from them. SNOWPACK errors do not propagate into systematic biases in TARTES albedo (Fig. 1). Instead, TARTES shows two systematic biases, both under wet conditions. First, liquid water drives grain-size growth through wet-snow metamorphism and clustering (Brun, 1989); optically, clustered grains behave as larger grains, increasing absorption. Second, TARTES uses ice refractive indices and neglects liquid water: in the NIR, the imaginary part of the refractive index is slightly higher for water than for ice (Green et al., 2006; Warren, 1982; O'Brien et al., 1981): this omission suppresses absorption further (Donahue et al., 2022; Dumont et al., 2017). The net result is a systematic albedo overestimation under wet conditions, independent of surface roughness (Fig. 4d–f), consistent with Manninen et al. (2021). We remove this bias empirically. Using a baseline period when the surface was wet, but suncups had not yet developed, we subtract the wet-smooth bias from the albedo residuals of the rough phase. This corrects the wet-condition error to the first order, leaving a residual attributable to the co-evolution of suncup roughness and impurity concentration.
Suncup roughness and impurities cause broadband albedo decreases of 0.03–0.1 (Fig. 4p), in agreement with Manninen et al. (2021) and slightly higher than the controlled experiments of Larue et al. (2020). The reduction is sharply accentuated below SSA of 10 m2 kg−1 (Fig. 4j–l), as prescribed by Larue et al. (2020). This provides independent field validation of previous experimental results: the albedo reductions Larue et al. (2020) obtained under artificial roughness and a ray-tracing model translate almost directly to natural suncups over multiple alpine ablation seasons. Two of our results, however, warrant discussion.
First, deep alpine suncups reduce albedo comparably to the shallower roughness of the Finnish tundra (Manninen et al., 2021), suggesting that roughness coverage fraction, rather than feature depth, is the primary driver of albedo reduction. The Larue et al. (2020) framework partially reconciles this: increasing coverage at fixed depth reduces albedo, and the reduction is amplified at large solar zenith angles through the effective-angle effect. Manninen et al. (2021) conducted experiments at 20° higher latitudes than the Alps, so the systematically larger solar zenith angles may provide an effective-angle contribution that may compensate for shallower geometry. However, our data cannot resolve whether coverage fraction dominates over suncup depth: this aspect requires dedicated experiments.
Second, the roughness-plus-impurity signal is systematically larger under diffuse than direct illumination (Fig. 4p). This cannot originate from suncup geometry: the effective-angle effect requires direct illumination, and multiple reflections is most effective in the NIR (Larue et al., 2020), where the diffuse spectrum carries little weight (Fig. 4r); in the metamorphosed rough phase, NIR albedo also falls well below the ≃0.5 value that maximizes photon trapping (Larue et al., 2020). The asymmetry, instead, reflects a visible-dominated absorption signature: the diffuse weight is concentrated in the visible, where LAPs and algae dominate, so any impurity component of the residual is preferentially amplified under diffuse conditions. This is corroborated by the TARTESLH parametrization (Löwe and Helbig, 2012), which lowers residuals mainly under direct illumination (where both roughness mechanisms are active) but barely affects the diffuse spread (Fig. 4p and q), as expected if the diffuse residual is impurity darkening that a roughness parametrization cannot capture. The larger diffuse residual is therefore more likely diagnostic of unaccounted impurities, rather than stronger roughness effects. Nevertheless, natural suncups likely do maximize the roughness mechanisms that operate. Unlike the artificial fields of Larue et al. (2020), where flat areas remained and coverage peaked near 60 %, natural suncups are structured into ridges and hollows with essentially no flat surface, pushing coverage toward 100 % and multiple reflections toward their theoretical maximum. Bair et al. (2022) and Warren et al. (1998) both find that the intermediate albedos characteristic of rough ablation phases are dominated by multiple reflections.
The systematic co-evolution of suncups and impurities remains a modeling limitation. SNOWPACK does not account for surface impurities, so it neglects the enhanced decrease in SSA from LAPs-accelerated metamorphism (Skiles and Painter, 2019; Tuzet et al., 2017). Without on-site measurements, our impurity scenarios rely on values whose transferability is uncertain, even though the literature supports them. Dust is the most uncertain: monitoring is scarce (Tuzet et al., 2020), and the large-scale assessment of Dumont et al. (2023) shows deposition skewed toward the western Alps, making our mixed-high and dust-dominated scenarios likely unrealistic for our eastern alpine site. For the algal-bloom scenario, Chevrollier et al. (2023) measured optical properties in the Arctic, where pigmentation, cell size, and packaging may differ, and Roussel et al. (2024) 's Sentinel-2 detection threshold likely overestimates the minimum bloom concentration. We must also assume the mass absorption efficiencies for each impurity type (Tuzet et al., 2019). Despite these uncertainties, our mixed-low and mixed-medium black carbon concentrations bracket the full elemental-carbon range of Manninen et al. (2021), and the resulting roughness-induced albedo reductions match theirs, with a slight low bias attributable to the simultaneous presence of dust in our scenarios.
The progressive surface LAP enrichment monitored by Tuzet et al. (2017) reflects the suncup growth we observed, but, in contrast, it shows no consistent interannual trend and varies significantly across measurement techniques (Dumont et al., 2017). Disentanglement therefore would not depend solely on increasing LAP measurement frequency. Geometry brings further complications: because suncup growth drives differential LAP accumulation between hollows and ridges (Rhodes et al., 1987), partitioning their contributions to albedo decay would require co-registered tracking of surface topography and LAP distribution at the same fine spatial resolution. LiDAR scanners like ours can resolve the spatiotemporal evolution of surface reflectance and have been deployed for this purpose (Walter et al., 2023), but they record backscattered intensity at a single wavelength in a fixed directional geometry and are rarely radiometrically calibrated. At best, they yield a relative single-wavelength directional reflectance rather than the hemispherically and spectrally integrated quantity that albedo represents. Resolving the suncup–LAP problem would thus require instrumentation capable of tracking LAP evolution not only in space, time, and vertical distribution within the surface snow, but also across wavelengths. Even then, spectral resolution alone may not fully separate the two sources; until then, this remains a fundamental obstacle for future work.
The robust logarithmic relationship between broadband albedo and aerodynamic roughness length z0 (Fig. 5a) provides a physically informed proxy that addresses several questions raised above. First, the partial decoupling of albedo decay from suncup growth during the 2024 algal bloom implies that in other years, impurity concentrations either tracked suncup growth closely enough to preserve the correlation or remained too low to independently darken albedo. Second, the logarithmic shape (faster albedo decay at smaller z0) is consistent with how impurities redistribute over the season. Early in ablation, impurities are lower in concentration but evenly spread across shallow suncups (Fig. 5b and c); later, they concentrate into the deepest hollows, leaving only a small fraction on the ridges (Fig. 5d and e). We propose that an even distribution of impurities over early-stage suncups produces a comparatively stronger effect on albedo decay: spread evenly over the surface, absorbing particles raise the absorption probability at each reflection, whereas later redistribution into localized hollows makes the loading spatially heterogeneous, possibly dampening its radiative effect despite higher bulk concentrations. This would also explain why Manninen et al. (2021) measured comparable albedo reductions over shallower tundra suncups, supporting coverage fraction over feature depth as a stronger control on albedo decay. This interpretation frames albedo decay as the interplay of roughness and impurities, but our data cannot isolate the two contributions to confirm it. Bair et al. (2022) identify why this is challenging even with spectral information: in snow composed of mixed pristine and dirty fractions, the darkening from roughness and from impurities remains difficult to separate, and our webcam imagery (Fig. 5) shows the two are coupled from the earliest stages of ablation. Under these conditions, z0 serves as a robust proxy for the combined albedo decay due to surface microtopography and impurity loading, integrating both regardless of their relative contributions at any ablation stage.
These findings open concrete possibilities for improved remote sensing of snow surface properties and their representation in energy balance models. First, suncup coverage is considerably easier to monitor and more spatially homogeneous than impurity concentration. The identified correlation may therefore offer a practical approach to simultaneously correct reflected shortwave radiation for surface-roughness and impurity effects at the pyranometer radiative scale. Second, suncup roughness is not only an optical property governing albedo but also an aerodynamic one, with direct implications for the ablation-season energy balance. Sanow et al. (2024) showed that varying the aerodynamic roughness length in SNOWPACK substantially changes cumulative sublimation, sensible heat, and snow water equivalent. Although dynamic z0 was implemented in SNOWPACK to study the seasonal effect of wind (Amory et al., 2017), it is almost universally kept constant during ablation, site-specific at best. Our results call for a way forward: because C-band backscatter over wet snow is highly sensitive to early suncup development (Carletti et al., 2025b; Marin et al., 2020), a SAR-derived, time-varying z0 could replace this constant in the turbulent-flux scheme, and, in models that parameterize albedo from grain size and age, omitting roughness and impurity darkening, similar empirical and site-specific z0–albedo relationships offer a way to introduce that missing decay. A single, remotely observable roughness signal could thus constrain both the radiative and turbulent components of the surface energy balance during the phase when each evolves fastest.
We monitored the formation and seasonal evolution of suncup roughness over three ablation seasons at the high-elevation alpine site of Weissfluhjoch. Suncup onset required sustained surface melting, above-zero wet-bulb temperatures, and reduced wind speeds. We identify the number of daily isothermal surface hours together with the transition to a positive wet-bulb temperature as a physically based onset indicator, measurable with standard station instrumentation, that models could use to flag the shift from flat- to rough-surface conditions. Suncups formed in all three years but with substantially different arrangements and geometries, which we attribute to meteorological forcing and the formation regimes described in previous work. Comparing TARTES flat-surface simulations against broadband albedo measurements, we quantify the combined albedo decay from suncups and surface impurities at 0.03–0.1. Separating the two contributions is difficult: suncup growth and impurity enrichment follow similar seasonal trends and reinforce one another, generating extreme fine-scale heterogeneity. A clean separation would require simultaneous mapping of geometry and impurity concentration at the same scale. As a practical alternative, we identify a robust logarithmic relationship between broadband albedo and the aerodynamic roughness length z0, which captures the coupled roughness–impurity effect through a single variable that is considerably easier to monitor than fine-scale impurity content. This carries two implications for snow energy-balance modeling. First, z0 evolves strongly through the ablation season and governs both turbulent and, via its link to albedo, radiative surface fluxes; treating it as constant, as nearly all models do, misrepresents the energy balance at its fastest rate of change. Snow cover models should therefore adopt a time-dependent z0 for the ablation season. A time-varying z0 could be derived from weather station measurements, starting from the onset indicators. Alternatively, because C-band radar backscatter over wet snow is highly sensitive to early suncup roughness, time-dependent z0 could be retrieved from SAR data. This could replace the static value used in the turbulent-flux scheme and, in models that parameterize rather than observe albedo, additionally inform the radiative term through the z0–albedo relationship.
The data used in this study are publicly available: https://doi.org/10.16904/envidat.761 (Carletti et al., 2026), and https://doi.org/10.5281/zenodo.22304449 (Bavay and Theile, 2026).
FC: conceptualization, methodology, software, validation, formal analysis, investigation, data curation, visualization, project administration, writing – original draft, review and editing. NH: formal analysis, methodology, writing – review and editing. NW: methodology, writing – review and editing. LB: methodology, data curation. MB: funding acquisition, supervision, writing – review and editing. BW: software, resources, data curation, writing – review and editing. ML: supervision, writing – review and editing.
At least one of the (co-)authors is a member of the editorial board of The Cryosphere. The peer-review process was guided by an independent editor, and the authors also have no other competing interests to declare.
Publisher's note: Copernicus Publications remains neutral with regard to jurisdictional claims made in the text, published maps, institutional affiliations, or any other geographical representation in this paper. The authors bear the ultimate responsibility for providing appropriate place names. Views expressed in the text are those of the authors and do not necessarily reflect the views of the publisher.
The authors thank Anja Mödl for providing the solar spectra used in this study.
This research was supported by a joint project of the Schweizerischer Nationalfonds zur Förderung der Wissenschaftlichen Forschung and the Autonomous Province of Bolzano (grant no. 205190).
This paper was edited by Francesco Avanzi and reviewed by Steven Fassnacht and one anonymous referee.
Amory, C., Gallée, H., Naaim-Bouvet, F., Favier, V., Vignon, E., Picard, G., Trouvilliez, A., Piard, L., Genthon, C., and Bellot, H.: Seasonal variations in drag coefficient over a Sastrugi-covered snowfield in coastal east Antarctica, Bound.-Lay. Meteorol., 164, 107–133, https://doi.org/10.1007/s10546-017-0242-5, 2017. a, b, c, d
Anderson, G. P., Clough, S. A., Kneizys, F. X., Chetwynd, J. H., and Shettle, E. P.: AFGL Atmospheric Constituent Profiles (0–120 km), Environmental Research Papers No. 954 AFGL-TR-86-0110, Air Force Geophysics Lab., Hanscom AFB, MA, USA, DTIC ADA175173, 1986. a
Armstrong, R. L. and Brodzik, M. J.: Recent northern hemisphere snow extent: a comparison of data derived from visible and microwave satellite sensors, Geophys. Res. Lett., 28, 3673–3676, https://doi.org/10.1029/2000GL012556, 2001. a
Bair, E. H., Dozier, J., Davis, R. E., Colee, M. T., and Claffey, K. J.: CUES – a study site for measuring snowpack energy balance in the Sierra Nevada, Front. Earth Sci., 3, https://doi.org/10.3389/feart.2015.00058, 2015. a
Bair, E. H., Rittger, K., Davis, R. E., Painter, T. H., and Dozier, J.: Validating reconstruction of snow water equivalent in California's Sierra Nevada using measurements from the NASA Airborne Snow Observatory, Water Resour. Res., 52, 8437–8460, https://doi.org/10.1002/2016WR018704, 2016. a
Bair, E. H., Dozier, J., Stern, C., LeWinter, A., Rittger, K., Savagian, A., Stillinger, T., and Davis, R. E.: Divergence of apparent and intrinsic snow albedo over a season at a sub-alpine site with implications for remote sensing, The Cryosphere, 16, 1765–1778, https://doi.org/10.5194/tc-16-1765-2022, 2022. a, b, c, d, e, f, g, h
Bartelt, P. and Lehning, M.: A physical SNOWPACK model for the Swiss avalanche warning: Part I: numerical model, Cold Reg. Sci. Technol., 35, 123–145, https://doi.org/10.1016/S0165-232X(02)00074-5, 2002. a
Bavay, M. and Egger, T.: MeteoIO 2.4.2: a preprocessing library for meteorological data, Geosci. Model Dev., 7, 3135–3151, https://doi.org/10.5194/gmd-7-3135-2014, 2014. a
Bavay, M. and Theile, T.: Optimal dataset: combination of AWS data at Weissfluhjoch Versuchsfeld in order to get the best possible forcings for snow cover and snow hydrology modeling (Version 1.0), Zenodo [data set], https://doi.org/10.5281/zenodo.22304449, 2026. a, b
Betterton, M. D.: Theory of structure formation in snowfields motivated by penitentes, suncups, and dirt cones, Phys. Rev. E, 63, 056129, https://doi.org/10.1103/PhysRevE.63.056129, 2001. a, b, c, d
Bond, T. C. and Bergstrom, R. W.: Light absorption by carbonaceous particles: an investigative review, Aerosol Sci. Tech., 40, 27–67, https://doi.org/10.1080/02786820500421521, 2006. a
Brun, E.: Investigation on wet-snow metamorphism in respect of liquid-water content, Ann. Glaciol., 13, 22–26, https://doi.org/10.3189/S0260305500007576, 1989. a
Calonne, N., Richter, B., Löwe, H., Cetti, C., ter Schure, J., Van Herwijnen, A., Fierz, C., Jaggi, M., and Schneebeli, M.: The RHOSSA campaign: multi-resolution monitoring of the seasonal evolution of the structure and mechanical stability of an alpine snowpack, The Cryosphere, 14, 1829–1848, https://doi.org/10.5194/tc-14-1829-2020, 2020. a, b
Caponi, L., Formenti, P., Massabó, D., Di Biagio, C., Cazaunau, M., Pangui, E., Chevaillier, S., Landrot, G., Andreae, M. O., Kandler, K., Piketh, S., Saeed, T., Seibert, D., Williams, E., Balkanski, Y., Prati, P., and Doussin, J.-F.: Spectral- and size-resolved mass absorption efficiency of mineral dust aerosols in the shortwave spectrum: a simulation chamber study, Atmos. Chem. Phys., 17, 7175–7191, https://doi.org/10.5194/acp-17-7175-2017, 2017. a
Carletti, F., Bavay, M., Ghielmini, C., Bonardi, M., Leibersperger, P., Philippe, V. M., Bozzoli, M., Marin, C., Steijn, C., Geiser, M., Bertoldi, G., Grünenfelder, L. N., Premier, V., and Barella, R.: SnowTinel high-temporal-resolution ground truth dataset for SAR remote sensing of snow, EnviDat [data set], https://doi.org/10.16904/envidat.574, 2025a. a, b, c, d
Carletti, F., Marin, C., Ghielmini, C., Bavay, M., and Lehning, M.: Multitemporal analysis of Sentinel-1 backscatter during snowmelt using high-resolution field measurements and radiative transfer modelling, The Cryosphere, 19, 5579–5612, https://doi.org/10.5194/tc-19-5579-2025, 2025b. a, b, c, d
Carletti, F., Walter, B., Bavay, M., Brouet, L., and Allegri, B.: High-elevation alpine snow surface roughness: multi-year manual and LiDAR observations at Weissfluhjoch, EnviDat [data set], https://doi.org/10.16904/envidat.761, 2026. a
Carroll, J. J.: The effect of surface striations on the absorption of shortwave radiation, J. Geophys. Res.-Oceans, 87, 9647–9652, https://doi.org/10.1029/JC087iC12p09647, 1982. a
Chevrollier, L.-A., Cook, J. M., Halbach, L., Jakobsen, H., Benning, L. G., Anesio, A. M., and Tranter, M.: Light absorption and albedo reduction by pigmented microalgae on snow and ice, J. Glaciol., 69, 333–341, https://doi.org/10.1017/jog.2022.64, 2023. a, b, c, d
Conway, H., Gades, A., and Raymond, C.: Albedo of dirty snow during conditions of melt, Water Resour. Res., 32, 1713–1718, 1996. a, b
Corbett, J. and Su, W.: Accounting for the effects of sastrugi in the CERES clear-sky Antarctic shortwave angular distribution models, Atmos. Meas. Tech., 8, 3163–3175, https://doi.org/10.5194/amt-8-3163-2015, 2015. a
Corripio, J. G. and Purves, R. S.: Surface Energy Balance of High Altitude Glaciers in the Central Andes: The Effect of Snow Penitentes, Chap. 3, John Wiley and Sons, Ltd, https://doi.org/10.1002/0470858249.ch3, 15–27, 2005. a
Cuevas-Agulló, E., Barriopedro, D., García, R. D., Alonso-Pérez, S., González-Alemán, J. J., Werner, E., Suárez, D., Bustos, J. J., García-Castrillo, G., García, O., Barreto, Á., and Basart, S.: Sharp increase in Saharan dust intrusions over the western Euro-Mediterranean in February–March 2020–2022 and associated atmospheric circulation, Atmos. Chem. Phys., 24, 4083–4104, https://doi.org/10.5194/acp-24-4083-2024, 2024. a
Di Mauro, B., Garzonio, R., Rossini, M., Filippa, G., Pogliotti, P., Galvagno, M., Morra di Cella, U., Migliavacca, M., Baccolo, G., Clemenza, M., Delmonte, B., Maggi, V., Dumont, M., Tuzet, F., Lafaysse, M., Morin, S., Cremonese, E., and Colombo, R.: Saharan dust events in the European Alps: role in snowmelt and geochemical characterization, The Cryosphere, 13, 1147–1165, https://doi.org/10.5194/tc-13-1147-2019, 2019. a, b
Doherty, S. J., Grenfell, T. C., Forsström, S., Hegg, D. L., Brandt, R. E., and Warren, S. G.: Observed vertical redistribution of black carbon and other insoluble light-absorbing particles in melting snow, J. Geophys. Res.-Atmos., 118, 5553–5569, https://doi.org/10.1002/jgrd.50235, 2013. a, b, c, d, e
Domine, F., Salvatori, R., Legagneux, L., Salzano, R., Fily, M., and Casacchia, R.: Correlation between the specific surface area and the short wave infrared (SWIR) reflectance of snow, Cold Reg. Sci. Technol., 46, 60–68, https://doi.org/10.1016/j.coldregions.2006.06.002, 2006. a
Donahue, C., Skiles, S. M., and Hammonds, K.: Mapping liquid water content in snow at the millimeter scale: an intercomparison of mixed-phase optical property models using hyperspectral imaging and in situ measurements, The Cryosphere, 16, 43–59, https://doi.org/10.5194/tc-16-43-2022, 2022. a, b
Dumont, M., Arnaud, L., Picard, G., Libois, Q., Lejeune, Y., Nabat, P., Voisin, D., and Morin, S.: In situ continuous visible and near-infrared spectroscopy of an alpine snowpack, The Cryosphere, 11, 1091–1110, https://doi.org/10.5194/tc-11-1091-2017, 2017. a, b, c, d
Dumont, M., Gascoin, S., Réveillet, M., Voisin, D., Tuzet, F., Arnaud, L., Bonnefoy, M., Bacardit Peñarroya, M., Carmagnola, C., Deguine, A., Diacre, A., Dürr, L., Evrard, O., Fontaine, F., Frankl, A., Fructus, M., Gandois, L., Gouttevin, I., Gherab, A., Hagenmuller, P., Hansson, S., Herbin, H., Josse, B., Jourdain, B., Lefevre, I., Le Roux, G., Libois, Q., Liger, L., Morin, S., Petitprez, D., Robledano, A., Schneebeli, M., Salze, P., Six, D., Thibert, E., Trachsel, J., Vernay, M., Viallon-Galinier, L., and Voiron, C.: Spatial variability of Saharan dust deposition revealed through a citizen science campaign, Earth Syst. Sci. Data, 15, 3075–3094, https://doi.org/10.5194/essd-15-3075-2023, 2023. a
Emde, C., Buras-Schnell, R., Kylling, A., Mayer, B., Gasteiger, J., Hamann, U., Kylling, J., Richter, B., Pause, C., Dowling, T., and Bugliaro, L.: The libRadtran software package for radiative transfer calculations (version 2.0.1), Geosci. Model Dev., 9, 1647–1672, https://doi.org/10.5194/gmd-9-1647-2016, 2016. a
Fassnacht, S., Williams, M., and Corrao, M.: Changes in the surface roughness of snow from millimetre to metre scales, Ecol. Complex., 6, 221–229, https://doi.org/10.1016/j.ecocom.2009.05.003, 2009. a, b, c, d
Fassnacht, S. R., Toro Velasco, M., Meiman, P. J., and Whitt, Z. C.: The effect of aeolian deposition on the surface roughness of melting snow, Byers Peninsula, Antarctica, Hydrol. Process., 24, 2007–2013, https://doi.org/10.1002/hyp.7661, 2010. a
Fassnacht, S. R., Suzuki, K., Sanow, J. E., Sexstone, G. A., Pfohl, A. K. D., Tedesche, M. E., Simms, B. M., and Thomas, E. S.: Snow surface roughness across spatio-temporal scales, Water-Sui., 15, 2196, https://doi.org/10.3390/w15122196, 2023. a, b
Filhol, S. and Sturm, M.: Snow bedforms: a review, new data, and a formation model, J. Geophys. Res.-Earth, 120, 1645–1669, https://doi.org/10.1002/2015JF003529, 2015. a
Flanner, M. G., Zender, C. S., Randerson, J. T., and Rasch, P. J.: Present-day climate forcing and response from black carbon in snow, J. Geophys. Res.-Atmos., 112, https://doi.org/10.1029/2006JD008003, 2007. a
Flanner, M. G., Shell, K. M., Barlage, M., Perovich, D. K., and Tschudi, M. A.: Radiative forcing and albedo feedback from the Northern Hemisphere cryosphere between 1979 and 2008, Nat. Geosci., 4, 151–155, https://doi.org/10.1038/ngeo1062, 2011. a
Gabbi, J., Huss, M., Bauder, A., Cao, F., and Schwikowski, M.: The impact of Saharan dust and black carbon on albedo and long-term mass balance of an Alpine glacier, The Cryosphere, 9, 1385–1400, https://doi.org/10.5194/tc-9-1385-2015, 2015. a, b, c
Green, R. O., Painter, T. H., Roberts, D. A., and Dozier, J.: Measuring the expressed abundance of the three phases of water with an imaging spectrometer over melting snow, Water Resour. Res., 42, https://doi.org/10.1029/2005WR004509, 2006. a
Grenfell, T. C., Warren, S. G., and Mullen, P. C.: Reflection of solar radiation by the Antarctic snow surface at ultraviolet, visible, and near-infrared wavelengths, J. Geophys. Res.-Atmos., 99, 18669–18684, https://doi.org/10.1029/94JD01484, 1994. a
Helbig, N., Löwe, H., Mayer, B., and Lehning, M.: Explicit validation of a surface shortwave radiation balance model over snow covered complex terrain, J. Geophys. Res.-Atmos., 115, https://doi.org/10.1029/2010jd013970, 2010. a
Huang, C.: Quantification of soil microtopography and surface roughness, in: Fractals in Soil Science, edited by: Baveye, P., Parlange, J.-Y., and Stewart, B. A., Chap. 5, CRC Press, Boca Raton, FL, USA, 153–168, ISBN 978-1-56670-105-1, https://doi.org/10.1201/9781315151052-5, 1998. a
Jahn, A. and Kłapa, M.: On the origin of ablation hollows (polygons) on snow, J. Glaciol., 7, 299–312, https://doi.org/10.3189/S0022143000031063, 1968. a
Kau, D., Greilinger, M., Vukićević, A., Bielecki, J., Kronlachner, L., and Kasper-Giebl, A.: Light-absorbing snow impurities: nine years (2016–2024) of snowpack sampling close to Sonnblick Observatory, Austrian Alps, The Cryosphere, 20, 1619–1633, https://doi.org/10.5194/tc-20-1619-2026, 2026. a, b
Kokhanovsky, A. A.: Light penetration in snow layers, J. Quant. Spectrosc. Ra., 278, 108040, https://doi.org/10.1016/j.jqsrt.2021.108040, 2022. a
Kokhanovsky, A. A. and Zege, E. P.: Scattering optics of snow, Appl. Optics, 43, 1589–1602, https://doi.org/10.1364/AO.43.001589, 2004. a
Kurucz, R. L.: Synthetic infrared spectra, in: Infrared Solar Physics, edited by: Rabin, D. M., Jefferies, J. T., and Lindsey, C., Springer Netherlands, Dordrecht, 523–531, ISBN 978-0-7923-2523-9, https://doi.org/10.1007/978-94-011-1926-9_62, 1994. a
Lacroix, P., Legrésy, B., Langley, K., Hamran, S., Kohler, J., Roques, S., Rémy, F., and Dechambre, M.: In situ measurements of snow surface roughness using a laser profiler, J. Glaciol., 54, 753–762, https://doi.org/10.3189/002214308786570863, 2008. a
Larue, F., Picard, G., Arnaud, L., Ollivier, I., Delcourt, C., Lamare, M., Tuzet, F., Revuelto, J., and Dumont, M.: Snow albedo sensitivity to macroscopic surface roughness using a new ray-tracing model, The Cryosphere, 14, 1651–1672, https://doi.org/10.5194/tc-14-1651-2020, 2020. a, b, c, d, e, f, g, h, i, j, k, l, m, n, o, p, q, r
Lehning, M., Bartelt, P., Brown, B., Fierz, C., and Satyawali, P.: A physical SNOWPACK model for the Swiss avalanche warning: Part II. Snow microstructure, Cold Reg. Sci. Technol., 35, 147–167, https://doi.org/10.1016/S0165-232X(02)00073-3, 2002. a
Leroux, C. and Fily, M.: Modeling the effect of sastrugi on snow reflectance, J. Geophys. Res.-Planet., 103, 25779–25788, https://doi.org/10.1029/98JE00558, 1998. a
Lettau, H.: Note on aerodynamic roughness-parameter estimation on the basis of roughness-element description, J. Appl. Meteorol., 8, 828–832, 1969. a
Lhermitte, S., Abermann, J., and Kinnard, C.: Albedo over rough snow and ice surfaces, The Cryosphere, 8, 1069–1086, https://doi.org/10.5194/tc-8-1069-2014, 2014. a, b
Libois, Q., Picard, G., France, J. L., Arnaud, L., Dumont, M., Carmagnola, C. M., and King, M. D.: Influence of grain shape on light penetration in snow, The Cryosphere, 7, 1803–1818, https://doi.org/10.5194/tc-7-1803-2013, 2013. a, b, c
Libois, Q., Picard, G., Dumont, M., Arnaud, L., Sergent, C., Pougatch, E., Sudul, M., and Vial, D.: Experimental determination of the absorption enhancement parameter of snow, J. Glaciol., 60, 714–724, https://doi.org/10.3189/2014JoG14J015, 2014. a
Lliboutry, L.: The origin of penitents, J. Glaciol., 2, 331–338, 1954. a, b, c, d
Löwe, H. and Helbig, N.: Quasi-analytical treatment of spatially averaged radiation transfer in complex terrain, J. Geophys. Res.-Atmos., 117, https://doi.org/10.1029/2012JD018181, 2012. a, b, c, d, e, f, g
Manninen, A.: Surface roughness of Baltic sea ice, J. Geophys. Res.-Oceans, 102, 1119–1139, 1997. a
Manninen, A.: Multiscale surface roughness description for scattering modelling of bare soil, Physica A, 319, 535–551, https://doi.org/10.1016/S0378-4371(02)01505-4, 2003. a
Manninen, T., Anttila, K., Jæskeläinen, E., Riihelä, A., Peltoniemi, J., Räisänen, P., Lahtinen, P., Siljamo, N., Thölix, L., Meinander, O., Kontu, A., Suokanerva, H., Pirazzini, R., Suomalainen, J., Hakala, T., Kaasalainen, S., Kaartinen, H., Kukko, A., Hautecoeur, O., and Roujean, J.-L.: Effect of small-scale snow surface roughness on snow albedo and reflectance, The Cryosphere, 15, 793–820, https://doi.org/10.5194/tc-15-793-2021, 2021. a, b, c, d, e, f, g, h
Marin, C., Bertoldi, G., Premier, V., Callegari, M., Brida, C., Hürkamp, K., Tschiersch, J., Zebisch, M., and Notarnicola, C.: Use of Sentinel-1 radar observations to evaluate snowmelt dynamics in alpine regions, The Cryosphere, 14, 935–956, https://doi.org/10.5194/tc-14-935-2020, 2020. a, b
Matthes, F. E.: Ablation of snow-fields at high altitudes by radiant solar heat, EOS T. Am. Geophys. Un., 15, 380–385, https://doi.org/10.1029/TR015i002p00380, 1934. a, b
Mitchell, K. A. and Tiedje, T.: Growth and fluctuations of suncups on alpine snowpacks, J. Geophys. Res.-Earth, 115, https://doi.org/10.1029/2010JF001724, 2010. a
Neville, R. A., Shipman, P. D., Fassnacht, S. R., Sanow, J. E., Pasquini, R., and Oprea, I.: A new formulation and code to compute aerodynamic roughness length for gridded geometry – tested on lidar-derived snow surfaces, Remote Sens.-Basel, 17, https://doi.org/10.3390/rs17121984, 2025. a, b, c
O'Brien, H. W., Koh, G., Cold Regions Research and Engineering Laboratory (U. S.), and United States. Army. Corps of Engineers: Near-infrared Reflectance of Snow-covered Substrates, U.S. Army Cold Regions Research and Engineering Laboratory, Hanover, NH, USA, CRREL Report 81-21, 1981. a
Painter, T. H., Duval, B., Thomas, W. H., Mendez, M., Heintzelman, S., and Dozier, J.: Detection and quantification of snow algae with an airborne imaging spectrometer, Appl. Environ. Microb., 67, 5267–5272, https://doi.org/10.1128/AEM.67.11.5267-5272.2001, 2001. a
Picard, G. and Libois, Q.: Simulation of snow albedo and solar irradiance profile with the Two-streAm Radiative TransfEr in Snow (TARTES) v2.0 model, Geosci. Model Dev., 17, 8927–8953, https://doi.org/10.5194/gmd-17-8927-2024, 2024. a
Picard, G., Dumont, M., Lamare, M., Tuzet, F., Larue, F., Pirazzini, R., and Arnaud, L.: Spectral albedo measurements over snow-covered slopes: theory and slope effect corrections, The Cryosphere, 14, 1497–1517, https://doi.org/10.5194/tc-14-1497-2020, 2020. a
Pons, F., Alberti, T., Messori, G., Dulac, F., and Faranda, D.: Assessing climate change impacts on the March 2024 compound floods and Saharan dust outbreak in Europe, J. Geophys. Res.-Atmos., 130, e2024JD042218, https://doi.org/10.1029/2024JD042218, 2025. a
Post, A. and LaChapelle, E. R.: Glacier Ice, University of Washington Press and International Glaciological Society, Seattle, WA, USA, ISBN 0-295-97910-0, 2000. a
Reindl, D., Beckman, W., and Duffie, J.: Diffuse fraction correlations, Sol. Energy, 45, 1–7, https://doi.org/10.1016/0038-092x(90)90060-p, 1990. a
Réveillet, M., Dumont, M., Gascoin, S., Lafaysse, M., Nabat, P., Ribes, A., Nheili, R., Tuzet, F., Ménégoz, M., Morin, S., Picard, G., and Ginoux, P.: Black carbon and dust alter the response of mountain snow cover under climate change, Nat. Commun., 13, 5279, https://doi.org/10.1038/s41467-022-32501-y, 2022. a, b
Rhodes, J. J., Armstrong, R. L., and Warren, S. G.: Mode of formation of “Ablation Hollows” controlled by dirt content of snow, J. Glaciol., 33, 135–139, https://doi.org/10.3189/S0022143000008601, 1987. a, b, c, d, e, f
Richardson, W. E. and Harper, R. D. M.: Ablation polygons on snow – further observations and theories, J. Glaciol., 3, 25–27, https://doi.org/10.3189/S0022143000024667, 1957. a
Robledano, A., Picard, G., Dumont, M., Flin, F., Arnaud, L., and Libois, Q.: Unraveling the optical shape of snow, Nat. Commun., 14, 3955, https://doi.org/10.1038/s41467-023-39671-3, 2023. a
Roussel, L., Dumont, M., Gascoin, S., Monteiro, D., Bavay, M., Nabat, P., Ezzedine, J. A., Fructus, M., Lafaysse, M., Morin, S., and Maréchal, E.: Snowmelt duration controls red algal blooms in the snow of the European Alps, P. Natl. Acad. Sci. USA, 121, https://doi.org/10.1073/pnas.2400362121, 2024. a, b, c, d, e, f
Ruttner, P., Voordendag, A., Hartmann, T., Glaus, J., Wieser, A., and Bühler, Y.: Monitoring snow depth variations in an avalanche release area using low-cost lidar and optical sensors, Nat. Hazards Earth Syst. Sci., 25, 1315–1330, https://doi.org/10.5194/nhess-25-1315-2025, 2025. a
Sanow, J. E., Fassnacht, S. R., and Suzuki, K.: How does a dynamic surface roughness affect snowpack modeling?, Polar Sci., 41, 101110, https://doi.org/10.1016/j.polar.2024.101110, 2024. a
Schaepman-Strub, G., Schaepman, M., Painter, T., Dangel, S., and Martonchik, J.: Reflectance quantities in optical remote sensing – definitions and case studies, Remote Sens. Environ., 103, 27–42, https://doi.org/10.1016/j.rse.2006.03.002, 2006. a
Schlögl, S., Lehning, M., and Mott, R.: How are turbulent sensible heat fluxes and snow melt rates affected by a changing snow cover fraction?, Front. Earth Sci., 6, https://doi.org/10.3389/feart.2018.00154, 2018. a
Shettle, E. P.: Models of Aerosols, Clouds and Precipitation for Atmospheric Propagation Studies, in: Atmospheric Propagation in the UV, Visible, IR and MM-Region and Related System Aspects, no. 454 in AGARD Conference, AGARD Conference Proceedings, Advisory Group for Aerospace Research and Development (AGARD), Neuilly-sur-Seine, France, 15-1–15-13, 1989. a
Singer, I. A.: Steadiness of the wind, J. Appl. Meteorol., 6, 1033–1038, https://doi.org/10.1175/1520-0450(1967)006<1033:SOTW>2.0.CO;2, 1967. a, b, c, d
Skiles, S. M. and Painter, T. H.: Toward understanding direct absorption and grain size feedbacks by dust radiative forcing in snow with coupled snow physical and radiative transfer modeling, Water Resour. Res., 55, 7362–7378, 2019. a, b
Skiles, S. M., Flanner, M., Cook, J. M., Dumont, M., and Painter, T. H.: Radiative forcing by light-absorbing particles in snow, Nat. Clim. Change, 8, 964–971, https://doi.org/10.1038/s41558-018-0296-5, 2018. a, b
Sommer, C. G., Lehning, M., and Fierz, C.: Wind tunnel experiments: influence of erosion and deposition on wind-packing of new snow, Front. Earth Sci., 6, https://doi.org/10.3389/feart.2018.00004, 2018. a
Sterle, K. M., McConnell, J. R., Dozier, J., Edwards, R., and Flanner, M. G.: Retention and radiative forcing of black carbon in eastern Sierra Nevada snow, The Cryosphere, 7, 365–374, https://doi.org/10.5194/tc-7-365-2013, 2013. a
Stewart, A., Rioux, D., Boyer, F., Gielly, L., Pompanon, F., Saillard, A., Thuiller, W., Valay, J.-G., Maréchal, E., and Coissac, E.: Altitudinal zonation of green algae biodiversity in the French Alps, Front. Plant Sci., 12, https://doi.org/10.3389/fpls.2021.679428, 2021. a
Stull, R.: Wet-bulb temperature from relative humidity and air temperature, J. Appl. Meteorol., 50, 2267–2269, https://doi.org/10.1175/JAMC-D-11-0143.1, 2011. a, b
Takahashi, S.: A study on ablation hollows on a melting snow surface, Low Temperature Science Series A, 37, 13–46, 1978. a
Tapakis, R., Charalambides, A., and Michaelides, S.: Influence of solar altitude on diffuse fraction correlations in Cyprus, in: Proceedings of the EuroSun 2014 Conference, EuroSun 2014, International Solar Energy Society, https://doi.org/10.18086/eurosun.2014.08.11, 1–7, 2015. a
Tiedje, T., Mitchell, K. A., Lau, B., Ballestad, A., and Nodwell, E.: Radiation transport model for ablation hollows on snowfields, J. Geophys. Res.-Earth, 111, https://doi.org/10.1029/2005JF000395, 2006. a
Tuzet, F., Dumont, M., Lafaysse, M., Picard, G., Arnaud, L., Voisin, D., Lejeune, Y., Charrois, L., Nabat, P., and Morin, S.: A multilayer physically based snowpack model simulating direct and indirect radiative impacts of light-absorbing impurities in snow, The Cryosphere, 11, 2633–2653, https://doi.org/10.5194/tc-11-2633-2017, 2017. a, b, c, d
Tuzet, F., Dumont, M., Arnaud, L., Voisin, D., Lamare, M., Larue, F., Revuelto, J., and Picard, G.: Influence of light-absorbing particles on snow spectral irradiance profiles, The Cryosphere, 13, 2169–2187, https://doi.org/10.5194/tc-13-2169-2019, 2019. a, b
Tuzet, F., Dumont, M., Picard, G., Lamare, M., Voisin, D., Nabat, P., Lafaysse, M., Larue, F., Revuelto, J., and Arnaud, L.: Quantification of the radiative impact of light-absorbing particles during two contrasted snow seasons at Col du Lautaret (2058 m a.s.l., French Alps), The Cryosphere, 14, 4553–4579, https://doi.org/10.5194/tc-14-4553-2020, 2020. a, b, c, d
Vionnet, V., Brun, E., Morin, S., Boone, A., Faroux, S., Le Moigne, P., Martin, E., and Willemet, J.-M.: The detailed snowpack scheme Crocus and its implementation in SURFEX v7.2, Geosci. Model Dev., 5, 773–791, https://doi.org/10.5194/gmd-5-773-2012, 2012. a
Walter, B., Brouet, L., Jaggi, M., and Löwe, H.: Automated LiDAR remote sensing for measuring the spatial and temporal evolution of surface hoar formation, in: Proceedings of the International Snow Science Workshop (ISSW), Bend, Oregon, USA, https://www.researchgate.net/publication/380104650 (last access: 8 September 2026), 2023. a
Warren, S. G.: Optical properties of snow, Rev. Geophys., 20, 67–89, https://doi.org/10.1029/RG020i001p00067, 1982. a, b, c
Warren, S. G.: Can black carbon in snow be detected by remote sensing?, J. Geophys. Res.-Atmos., 118, 779–786, https://doi.org/10.1029/2012JD018476, 2013. a
Warren, S. G. and Wiscombe, W. J.: A model for the spectral albedo of snow. II: Snow containing atmospheric aerosols, J. Atmos. Sci., 37, 2734–2745, https://doi.org/10.1175/1520-0469(1980)037<2734:AMFTSA>2.0.CO;2, 1980. a
Warren, S. G., Brandt, R. E., and O'Rawe Hinton, P.: Effect of surface roughness on bidirectional reflectance of Antarctic snow, J. Geophys. Res.-Planet., 103, 25789–25807, https://doi.org/10.1029/98JE01898, 1998. a, b, c, d, e, f
Wever, N., Fierz, C., Mitterer, C., Hirashima, H., and Lehning, M.: Solving Richards Equation for snow improves snowpack meltwater runoff estimations in detailed multi-layer snowpack model, The Cryosphere, 8, 257–274, https://doi.org/10.5194/tc-8-257-2014, 2014. a
Wever, N., Würzer, S., Fierz, C., and Lehning, M.: Simulating ice layer formation under the presence of preferential flow in layered snowpacks, The Cryosphere, 10, 2731–2744, https://doi.org/10.5194/tc-10-2731-2016, 2016. a
Wiscombe, W. J. and Warren, S. G.: A model for the spectral albedo of snow. I: Pure snow, J. Atmos. Sci., 37, 2712–2733, https://doi.org/10.1175/1520-0469(1980)037<2712:AMFTSA>2.0.CO;2, 1980. a, b
Würzer, S., Wever, N., Juras, R., Lehning, M., and Jonas, T.: Modelling liquid water transport in snow under rain-on-snow conditions – considering preferential flow, Hydrol. Earth Syst. Sci., 21, 1741–1756, https://doi.org/10.5194/hess-21-1741-2017, 2017. a
Yang, S., Xu, B., Cao, J., Zender, C. S., and Wang, M.: Climate effect of black carbon aerosol in a Tibetan Plateau glacier, Atmos. Environ., 111, 71–78, https://doi.org/10.1016/j.atmosenv.2015.03.016, 2015. a
Zhang, W., Qi, J., Wan, P., Wang, H., Xie, D., Wang, X., and Yan, G.: An easy-to-use airborne LiDAR data filtering method based on cloth simulation, Remote Sens.-Basel, 8, https://doi.org/10.3390/rs8060501, 2016. a
Zheng, Z., Zheng, L., Wang, K., Clow, G. D., and Cheng, X.: UAV oblique imagery reveals order-of-magnitude changes in snow aerodynamic roughness length under shifting meteorological regimes at Qinling Station, East Antarctica, J. Geophys. Res.-Earth, 131, e2025JF008781, https://doi.org/10.1029/2025JF008781, 2026. a, b
Zhuravleva, T. B. and Kokhanovsky, A. A.: Influence of surface roughness on the reflective properties of snow, J. Quant. Spectrosc. Ra., 112, 1353–1368, https://doi.org/10.1016/j.jqsrt.2011.01.004, 2011. a