
the Creative Commons Attribution 4.0 License.
the Creative Commons Attribution 4.0 License.
 | 29 Sep 2026
In-situ tracer percolation experiments to quantify the influence of near-surface melting on Svalbard snow signatures
Dorothea Elisabeth Baur

Andrea Spolaor
Federico Scoto
Elizabeth R. Thomas
The Arctic is at the forefront of global warming. More frequent and intense rain-on-snow events during winter are altering the annual snowpack with its environmental proxy records, so that Svalbard glaciers are not only rapidly losing mass but are endangered as climate archives. In this study, we aim to visualise and better quantify the influence of near-surface melt caused by small-scale rain-on-snow events on stable water isotope signatures in seasonal snow in the vicinity of Ny-Ålesund in Svalbard. To this end, we first introduce a simple in-situ melt tracer experiment approach and subsequently present new insights into structural imprint and stable water isotope alteration gained during field experiments near Ny-Ålesund in March 2023. We document diverse features resulting from meltwater infiltration, including unprecedented observations of internal layering within melt lenses, and discuss the importance of snow temperature and stratigraphy for percolation behaviour, ranging from preferential to matrix flow in the non-ripe snowpack. Comparisons of δ18O and δD signatures before and after each experiment further reveal that percolation-induced stable water isotope changes are localized, i.e. confined to melt structures, so that sub-annual stable water isotope information can be retrieved from unaffected profile parts where annual accumulation is sufficient.
- Article
(9822 KB) - Full-text XML
- BibTeX
- EndNote


Svalbard ice cores have provided invaluable information about past environmental variability and 20th-century climate change (e.g., Divine et al., 2011; Isaksson et al., 2003, 2005; Osmont et al., 2018). However, Svalbard glaciers are now endangered as climate archives, with important ice-core proxy records gradually being lost. This is due to Svalbard mean temperatures having increased by 3–5 °C from 1971 until 2017 (Hanssen-Bauer et al., 2019) and temperatures rising especially during winter (Hansen et al., 2014; Vikhamar-Schuler et al., 2016), so that the number of positive-degree-day (PDD) and rain-on-snow (ROS) events leading to melting is growing (Sobota et al., 2020). As these trends are expected to continue (Geyman et al., 2022; Hanssen-Bauer et al., 2019), Svalbard glaciers are increasingly vulnerable to surface melt events, turning from cold to temperate, and aquifers are reported on the ice caps Holtedahlfonna (Christianson et al., 2015), Lomonosovfonna (van den Akker et al., 2025; Hawrylak and Nilsson, 2019), and Austfonna (Innanen et al., 2025).
In this increasingly melt-prone environment, climate proxy records like seasonal major ions and stable water isotopes (SWI) are rapidly deteriorating in glaciers like in Austre Brøggerbreen (Spolaor et al., 2021) and Holtedahlfonna (Spolaor et al., 2024), similar to melt-induced loss of SWI as a climate archive in the high-altitude Corbassière glacier, Switzerland (Huber et al., 2024). This is caused by melting, which generally leads to δ18O enrichment, mixing, and smoothing of neighbouring SWI signatures in snow (e.g. Beria et al., 2018; Moser et al., 2024). The fact that melt aquifers are now being faced at higher elevations before the onset of spring, e.g. during a drilling project on Holtedahlfonna in March 2023 (collaboration of the Ice Memory Foundation, 2023, with the SENTINEL project by the Italian Institute of Polar Sciences of the National Research Council of Italy, CNR-ISP), together with spreading melt-induced loss of SWI climate signatures, highlights how Svalbard's glaciers are acutely experiencing the impacts of climate change.
Against this backdrop, it is crucial for ice-core researchers to better understand the process and impact of melting, percolation, and refreezing on Svalbard snow signatures to accurately interpret the regional ice-core proxy records. In-situ studies that integrate structural and chemical information before and after melt events (Moran and Marshall, 2009) are especially helpful to this aim, because they aid a more holistic understanding.
More specifically, assessing the local usability of widely recognised ice-core SWI records is of high importance here. Beyond widely melt-induced smoothing of SWI signatures (e.g. Thompson et al., 2021), small-scale SWI anomalies also have been previously documented in melt-affected ice cores (e.g. Moser et al., 2021; Westhoff, 2021), and melt-affected SWI preservation sometimes appears to be more nuanced (e.g. Moran et al., 2011, and references therein). A deeper understanding of the factors shaping the melt–freeze process is needed to enable corrections for melt-induced SWI alterations and to reliably extract environmental information from this and other melt-affected proxy records.
In addition, by capturing the entire melt–freeze process, in-situ tracer percolation experiments can help to interpret the diverse net melt effects visible in firn core profiles (MacDonell et al., 2021; Moser, 2025; Moser et al., 2024). Such experiments enable linking the melt–freeze imprint in snow to known formation conditions and disentangling the factors that shape melt structures. This in turn could help to develop melt features as an integrated proxy of the ice–air boundary conditions.
In this study, we aim to study melt percolation caused by potential small-scale ROS events to assess the role of pre-existing snow characteristics for the structurally diverse melt–freeze imprint and evaluate its impact on SWI signatures at Ny-Ålesund. For this purpose, we (1) introduce a simple approach of in-situ melt tracer percolation experiments that mirror short ROS events, (2) present new insights into melt structures and SWI alteration gained during field experiments near Ny-Ålesund in March 2023, and (3) discuss those results in the context of nivometric data, multiple linear regression analysis, and literature to identify key constraining factors for flow behaviour.
2.1 Study region and site selection
Ny-Ålesund is located at the southern coast of Kongsfjord on Brøggerhalvøya, a peninsula on the northwest coast of Spitsbergen (78.9° N, 11.9° E), the largest island of the high Arctic Svalbard Archipelago, Norway (Fig. 1a). Located in the North Atlantic sector of the Arctic, the island's climate with a mean annual air temperature of −8.7 °C over land areas (Sval-Imp 1971–2000, based on Schuler, 2018, in Hanssen-Bauer et al., 2019) is comparatively mild due to the influence of ocean and atmospheric circulation patterns like Gulf Stream and Arctic Oscillation that facilitate the advection of warm-moist air masses and rapid weather changes (Maturilli and Kayser, 2017; Yeo et al., 2018).
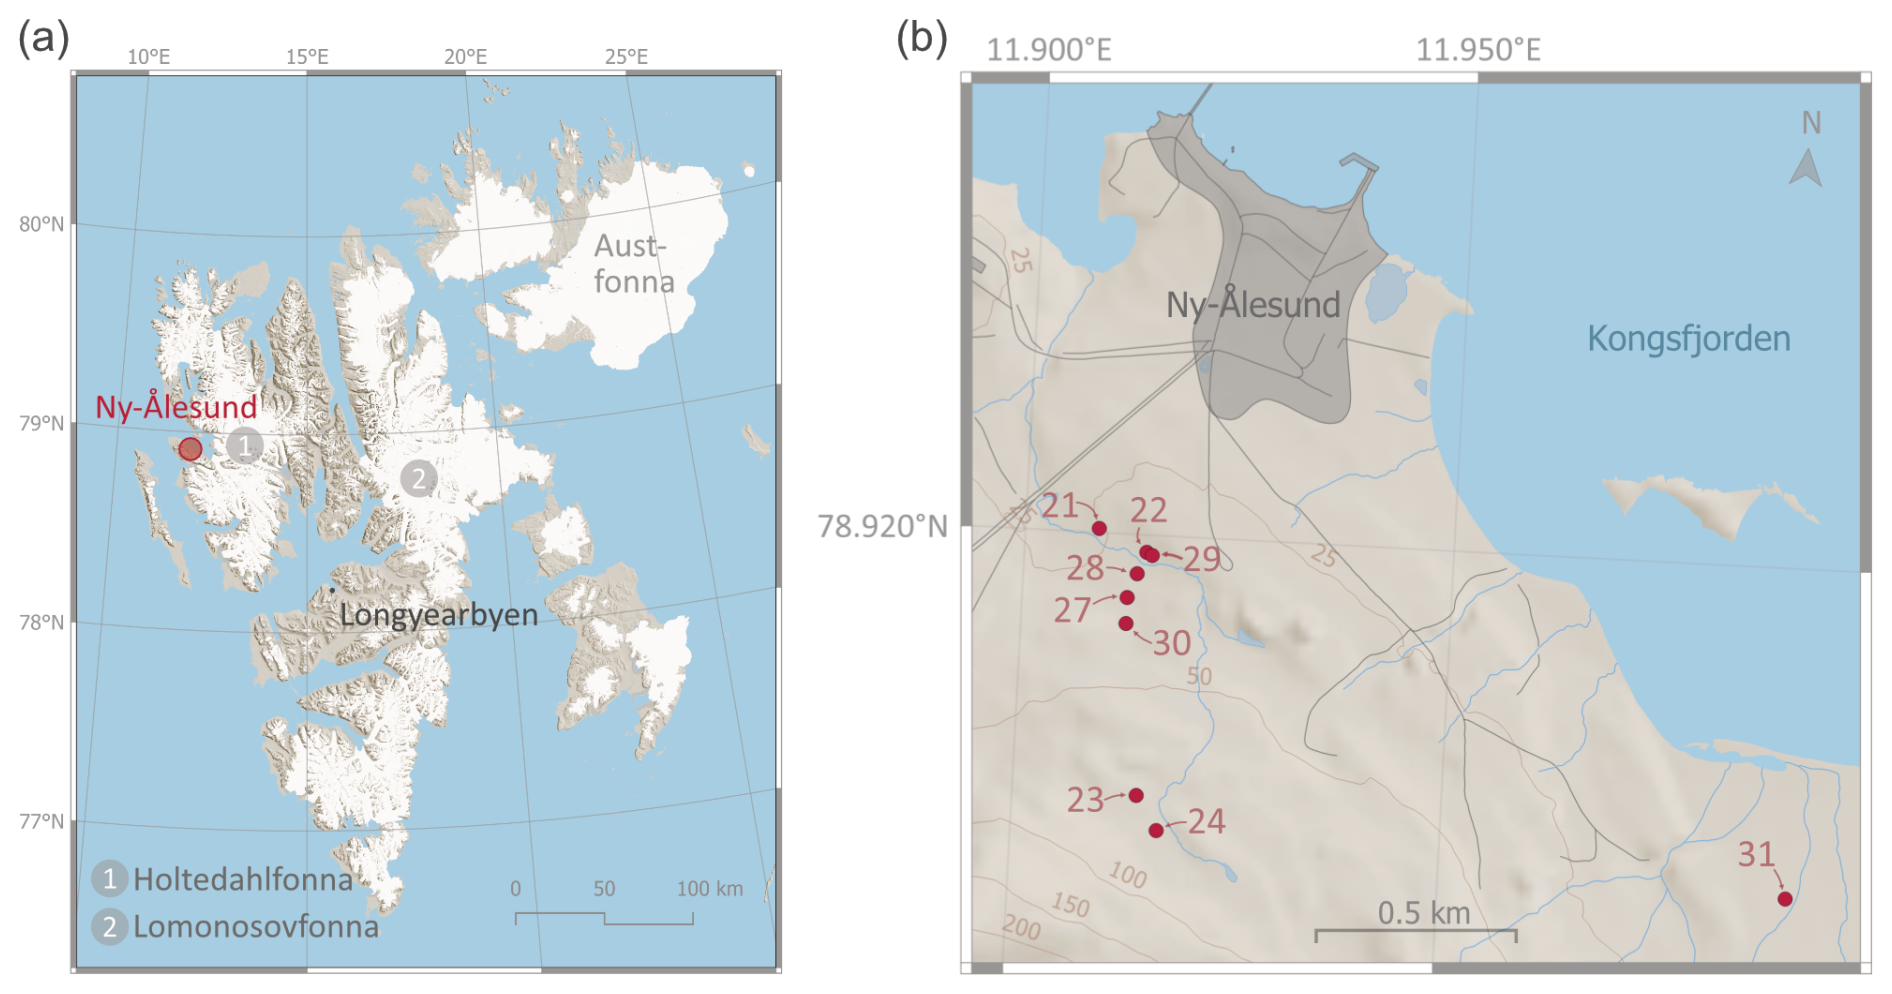
Figure 1Overview of study region: (a) Svalbard with the study location Ny-Ålesund (red circle), the largest settlement Longyearbyen (grey dot), and selected ice caps (Austfonna, Holtedahlfonna, and Lomonosovfonna) highlighted; (b) snow pit study sites near sea level in the vicinity of Ny-Ålesund, numbering corresponds to sampling dates in March 2023; maps based on Norwegian Polar Institute (2014a, b).
Ny-Ålesund is particularly interesting for investigating melt effects in snow and firn, because its coastal Arctic climate is changing dramatically. Annual mean air temperature has risen by 0.71 °C per decade since 1971, and winters warmed at even higher rates (+1.35 °C per decade, 1971–2017, Hanssen-Bauer et al., 2019). This has generally led to shorter winters (Pedersen et al., 2022) and earlier starts of the melting season in Svalbard, but also more frequent rainfall (Peeters et al., 2019), severe ROS (Vikhamar-Schuler et al., 2016) and melt events during winter (Graham et al., 2017). Consequently, the seasonal snowpack adding up to 40 % to the ∼60 % spatial glacier coverage of Svalbard through the annual cycle (Gallet et al., 2019) is changing. The Arctic snow period is shortening 2–4 d per decade, and heightened ice layer formation in the snowpack due to ROS events (Brown et al., 2017) is an urgent issue for the local fauna, as their access to sub-snow grasses and moss as essential food source is diminishing.
In this context of rapid environmental and snowpack changes, the topography of Brøggerhalvøya and glaciers near Ny-Ålesund offers a well-suited study region that allows study of the influence of ROS-induced melt events on an Arctic snowpack at a range of elevation (from sea level to ) and temperature conditions with easy site access. Year-round international scientific research at the Ny-Ålesund Research Station (https://nyalesundresearch.no/, last access: 27 September 2026) further facilitates interdisciplinary collaboration and continuous observational records (Maturilli et al., 2019; Pedersen et al., 2022), including, e.g., meteorology and physical snow properties (Scoto et al., 2023).
By integrating structural and chemical snow measurements in a new experimental melt study, this collaboration of British Antarctic Survey (BAS), Norwegian Polar Institute (NPI) and the Italian Institute of Polar Sciences of the National Research Council of Italy (CNR-ISP) addresses current knowledge gaps regarding the melt effects for the cycling of snow contaminants in Svalbard (Gallet et al., 2019). Hosted by the UK's Natural Environment Research Council (NERC) Arctic Station, this project feeds into the Glaciology flagship, i.e. one of the four priority programmes for research and monitoring at the Ny-Ålesund Research Station (https://nyalesundresearch.no/research-and-monitoring/glaciology/, last access: 27 September 2026). Percolation experiments are unprecedented at this polar site and have the potential to provide insights into meltwater percolation in cold polar firn that are relevant for interpreting ice cores from Svalbard and the polar regions more widely.
To investigate the structural and chemical imprint of ROS-induced melt events on the Svalbard snowpack before the major onset of the melting season, we conducted a series of 17 in-situ percolation tracer experiments in 9 snow pits near Ny-Ålesund from 21 until 31 March 2023 (Fig. 1b). The field campaign was initiated with an overview of avalanche-probe-based total snow thickness measurements (±0.5 cm accuracy, provided as snow height above ground) on the local slopes near sea level on 18 March 2023, which informed the subsequent snow pit and experiment site selection near the Gruvebadet Atmospheric Laboratory approximately one kilometre south of Ny-Ålesund (Fig. 3a). To ensure sampling of the unaltered local snowpack, we chose study sites with pristine snow surfaces away from snowmobile tracks and traffic routes. In addition, aiming to identify a locally representative study site each day, we took >25 snow thickness measurements on a 10 m×5 m grid and dug the snow pit at a position with average snow height within this grid.
2.2 Experiment setup
The in-situ experiments provided a comprehensive picture of the pre- and post-melt preservation including the percolation process near Ny-Ålesund. They are based on a combination of visual, structural, temperature and chemical measurements conducted before (Sect. 2.2.1), during (Sect. 2.2.2), and after tracer application (Sect. 2.2.3). To be applicable in environmentally protected areas like Brøggerhalvøya, the concept only draws upon natural substances, and to not interfere with other ongoing observations in the area, we only apply Bluetooth-/Wifi-free measurement techniques. To ensure methodological consistency, all experimental procedures and analytical steps were conducted by the same individual.
2.2.1 Pre-melt snow pit assessment
To establish the thermo-stratigraphic context of snowpack characteristics prior to melting, we first conducted an in-depth snow pit assessment (Fig. 2). For this, we started with a snow temperature (Tsnow) profile over the full vertical extent of the snow pit wall at 5 cm resolution using digital thermometers (Salter 544A HBBKCR and Salter 518 WHCR, 0.1 °C precision). Secondly, we created a snow stratigraphy profile by visually and tactilely identifying any layers within the snowpack and subsequently describing them in terms of average and maximum grain size, grain shape, and layer hardness based on the International Classification for Seasonal Snow (Fierz et al., 2009). This was supplemented by a vertical density profile based on stainless-steel box density cutter measurements (volume=99 cm3, ) with a spring balance at 4.5 cm intervals (, RS Pro, 5g resolution). All snow pits were dug to the ground to cover the full annual snowpack, and we assessed a snow pit wall that was permanently in the shadow and downwind to prevent artefacts through incoming solar radiation or snow re-deposition. The obtained results have been visualised using the open-source niViz software (https://niviz.org/, last access: 27 September 2026). Lastly, we sampled 6 profiles (23–24 March 2023 and 27–30 March 2023) for SWI measurements at approximately 5 cm resolution (). This was done by pushing sterilized dry 50 mL polypropylene centrifuge tubes (BIOFIL®) 5 cm horizontally into the snow pit front, which was freshly cut using a stainless-steel hand saw (STANLEY®). Thus, the chemical signal is generally integrated over the sampling tube dimensions (i.e. 2.5 cm tube diameter × 5 cm horizontal penetration depth), except in cases of preferential flow paths (PFPs), where we specifically targeted blue-coloured PFP material for sampling.
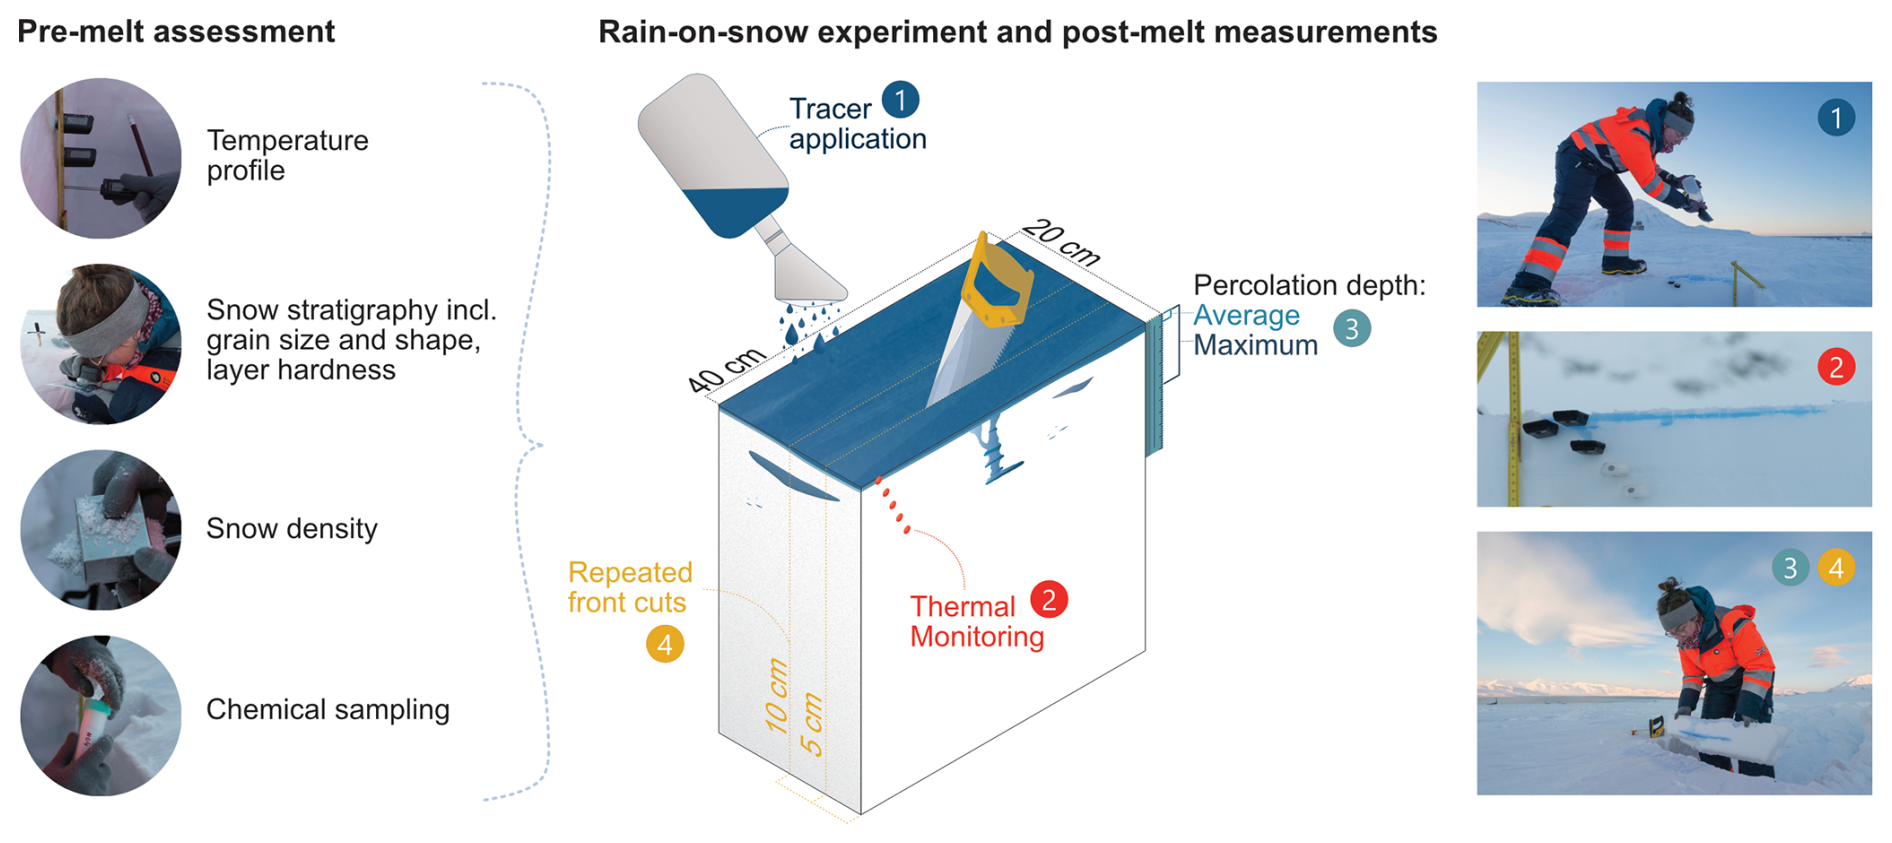
Figure 2Overview of methodological steps before, during and after rain-on-snow experiments conducted near Ny-Ålesund in March 2023; left: photos of the pre-melt assessment steps; centre: schematic visualisation of tracer experiment snow pit setup and post-melt measurements as discussed in Sect. 2.2.2; right: photos of tracer application, temperature monitoring and percolation assessment on repeated front cuts obtained during fieldwork, credit for all photos: Iain Rudkin.
2.2.2 In-situ percolation tracer experiment
Subsequently, we conducted in-situ melt experiments that have been designed to mirror short ROS-induced melt events and to trace percolation via visual features corresponding to structural imprint, thermal changes and SWI alteration of the snowpack. The melt tracer is based on ultrapure (Milli-Q) water mixed with deuterium oxide (D2O) as prepared in two steps according to the procedure laid out in Appendix A. A deuterium-enriched tracer was chosen because the imposed changes to the snowpack are entirely harmless, SWI is a fundamental climate proxy, and the tracer approach allows for simultaneous assessment of other chemical impurities. During the second stage of preparation at the NERC Arctic Station, 7 mL of blue food dye were added to each litre of tracer liquid. This enables visually tracing percolation and identifying areas with potential SWI signature alteration by their blue colouring, so that they can selectively be sampled for non-/melt-affected chemistry. Of each diluted tracer, a small sample was kept for SWI measurements (Sect. 2.3). The average SWI signatures (±2σ) of the tracer solutions were and for δ18O and δD, respectively.
This percolation tracer of known composition was applied to a defined surface area (40 cm×20 cm, Fig. 2) of the already assessed snow pit (Sect. 2.2.1) to ensure comparable experimental conditions. The prepared tracer volume (Vliq) was known, ranging between 250 and 2000 mL (median=500 mL, equalling 6.25 mm water equivalent [w.eq.] on the experiment area, Appendix B), and liquid temperature (Tliq) was measured immediately before it was evenly distributed onto the snow surface using a sprinkler attached to the tracer bottle opening (Fig. 2). The sprinkler rose was 10 cm in diameter with 1 mm holes allowing for the release of droplets every 5 mm. Tliq averaged +11.7 °C, ranging from +0.0 to +20.1 °C among experiments, to compensate for extreme cold fieldwork conditions (Appendix B and Sect. 3.1–3.2). A full overview of tracer characteristics applied during the experiments is given in Appendix B. By controlling the experiment area and tracer signature and documenting snow layering and temperature, we aimed to define the pre-existing context for meltwater flow and investigate the role of Tsnow, stratigraphic boundaries and grain characteristics, Tliq, and Vliq for meltwater flow behaviour.
Temperature evolution of the near-surface snow during the percolation experiment was monitored with depth using 2–5 digital thermometers (Salter 544A HBBKCR and Salter 518 WHCR, 0.1 °C precision), which were placed in regular intervals below the surface, e.g. every 2 cm in the top 10 cm (Fig. 2) and recorded at 30 s intervals throughout the percolation observation period. Experiments were concluded when temperatures in the affected snowpack as reflected by the top thermometer started to drop, thereby indicating the predominance of refreezing.
2.2.3 Post-melt snow pit assessment and analysis
Upon completion of the percolation experiment, we used the blue colour of the tracer to measure average percolation depth as well as the vertical and lateral extent of preferential flow paths (PFPs) and melt lenses visible on the snow pit front. These measurements were repeated on two new snow pit fronts that were cut 5 and 10 cm into the experiment area to evaluate and ensure representativity. Average percolation depth is the surface melt layer thickness on the respective front and is identified through the depth reached by blue dye during an experiment (Fig. 2). Darker shades of blue within the snow are interpreted as a higher degree of melt saturation in the affected section, and lighter blue colouring as under-/less saturated snow. Potential surface lowering through the experiment-induced melting of the snowpack is recorded and taken into account when calculating percolation depth estimates. Multiple linear regression analysis (MLRA) is conducted to identify constraining factors of percolation. We considered average percolation depth to be the dependent variable and the following independent variables: surface snow temperature, depth of the first hard layer, grain size difference at the first and second stratigraphic boundaries, liquid temperature, and liquid volume.
2.3 Discrete stable water isotope measurements
To investigate stable water isotope signatures in the snowpack before versus after ROS-induced melting, we sampled at least one of the fresh snow pit fronts in several affected (blue) and unaffected dry (white) parts using 50 mL polypropylene centrifuge tubes with strong screw caps. Sampling generally included the near-surface melt layer and snow underneath but also addressed more complex cases including PFPs and discontinuous melt lenses. For example, samples were taken 1.5 cm to the left and right of a PFP as well as within (23 March 2023). Based on the already decreasing temperatures in the snow pit, we thereby assume that meltwater movement in the snowpack has ceased, and the sampling conditions capture the post-percolation steady state. This combination allows us to assess SWI alteration of near-surface snow layers in the context of pre- and post-melt structural features.
The discrete snow samples taken before and after melt experiments for SWI evaluation were stored in a freezer at the NERC Arctic Station until shipment to the British Antarctic Survey in Cambridge, UK, on 4–5 April 2023, where they were kept at −25 °C until analysis. To prevent cross-contamination between samples during transport, all screw tops were sealed using Parafilm, sample tubes double-bagged in batches of 10 and kept upright within the transport box. While leakage was observed in ∼15 % of the samples despite these measures, we expect the material remaining within sample tubes to be unaffected.
The SWI measurements of oxygen (δ18O) and hydrogen (δD) were conducted using a Picarro L2130-i setup based on cavity ring-down spectroscopy (Gkinis et al., 2011; Gupta et al., 2009) located at BAS in June 2023. For every sample, seven injections were measured, of which the first three were removed for memory effects and the average of the last four makes up the respective SWI signature. δ18O comes at an instrument accuracy of 0.2 ‰ and δD at 0.6 ‰. The measurements are presented in relation to the Vienna Standard Mean Ocean Water (V-SMOW), and average 1σ precision of the here conducted measurements lies at 0.1 ‰ for δ18O and 0.3 ‰ for δD. All mean values in this study are reported including standard deviation (±2σ).
When comparing δ18O signatures before and after experiments, the alteration due to melt percolation and refreezing has been identified based on the variance defined by nearest-neighbour pairs. To ensure a direct comparison is appropriate, only post-experiment samples taken ±1 cm of the corresponding pre-melting SWI sample have been considered here.
2.4 Meteorological and nivometric data
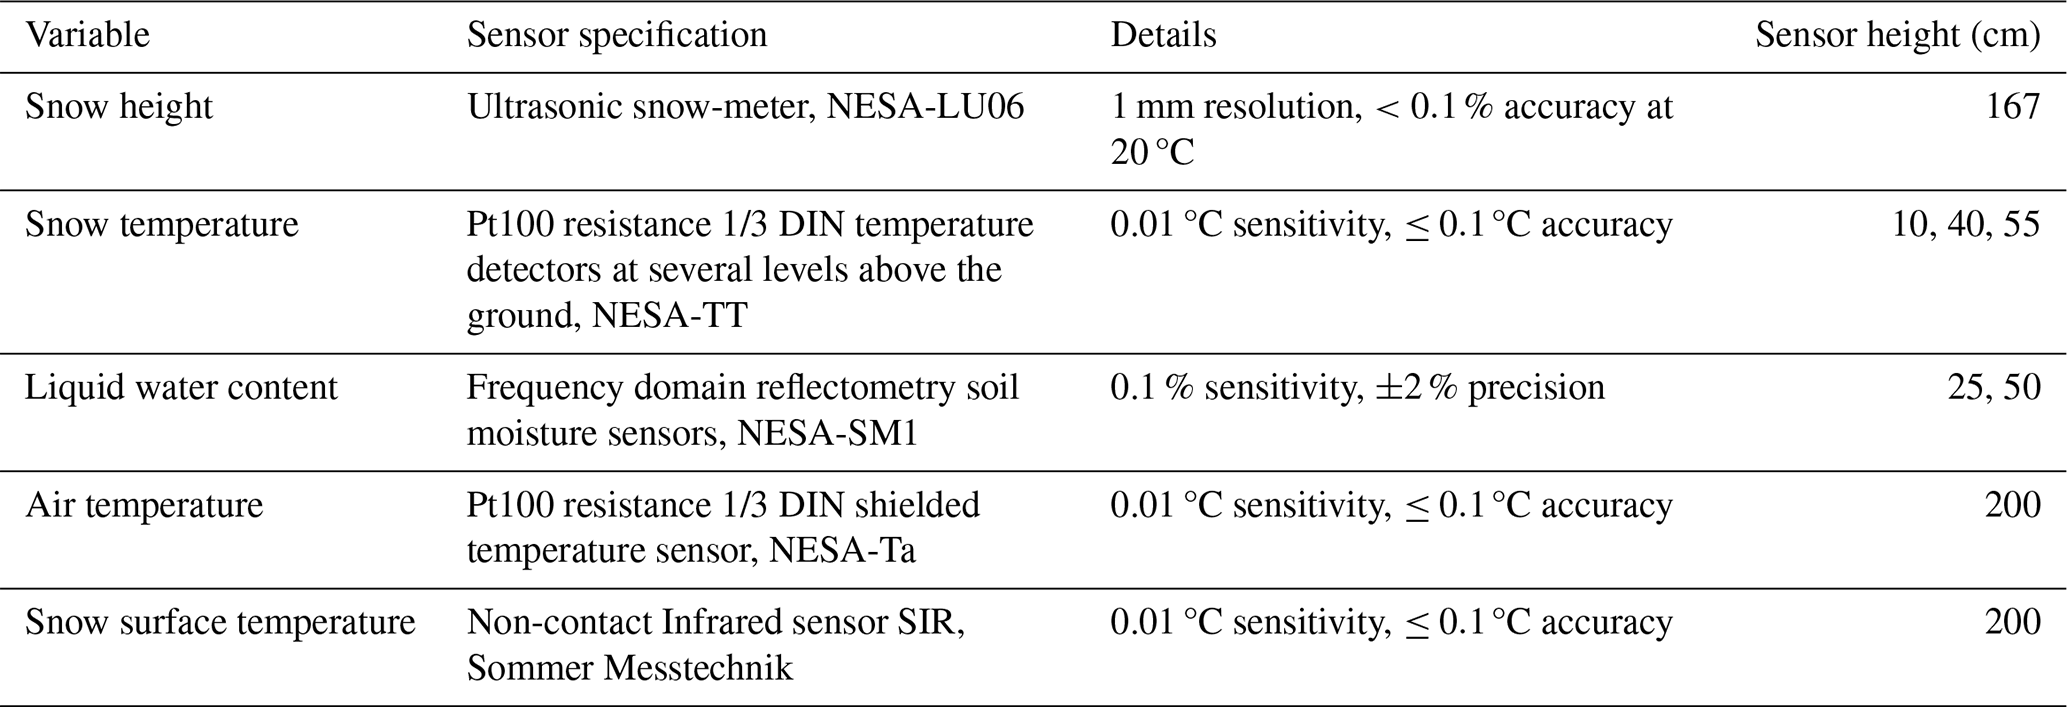
To validate the in-situ observations, we use a set of automated nivometric station (ANS) measurements at Gruvebadet (78.917° N, 11.895° E). Scoto et al. (2023) have provided a detailed introduction to the ANS setup, which among other sensors includes total snow thickness (provided as snow height above ground), liquid water content (LWC), 2 m air temperature, snow temperature at 10, 40 and 55 cm above ground, and the snow surface temperature (Table 1). Here, we focus on the named records over the period 13–31 March 2023 at 10 min resolution.
Table 1Overview of meteorological and nivometric sensor specifications used in this study, based on Scoto et al. (2023).
3.1 Snow characteristics before melting
The preliminary snow thickness sampling in the Ny-Ålesund area on 18 March 2023 indicated an average snow height of 68.3 cm (80 measurements, ≥1 m apart, ±75.6 cm standard deviation). The more detailed 251 snow thickness measurements taken during the selection of snow pit sites average 59.0±24.3 cm, covering the range 36.0–95.0 cm (Fig. 3). These conditions are represented by the nine snow pits of this study, which average 55.7±22.3 cm in snow height (43.0–72.5 cm).
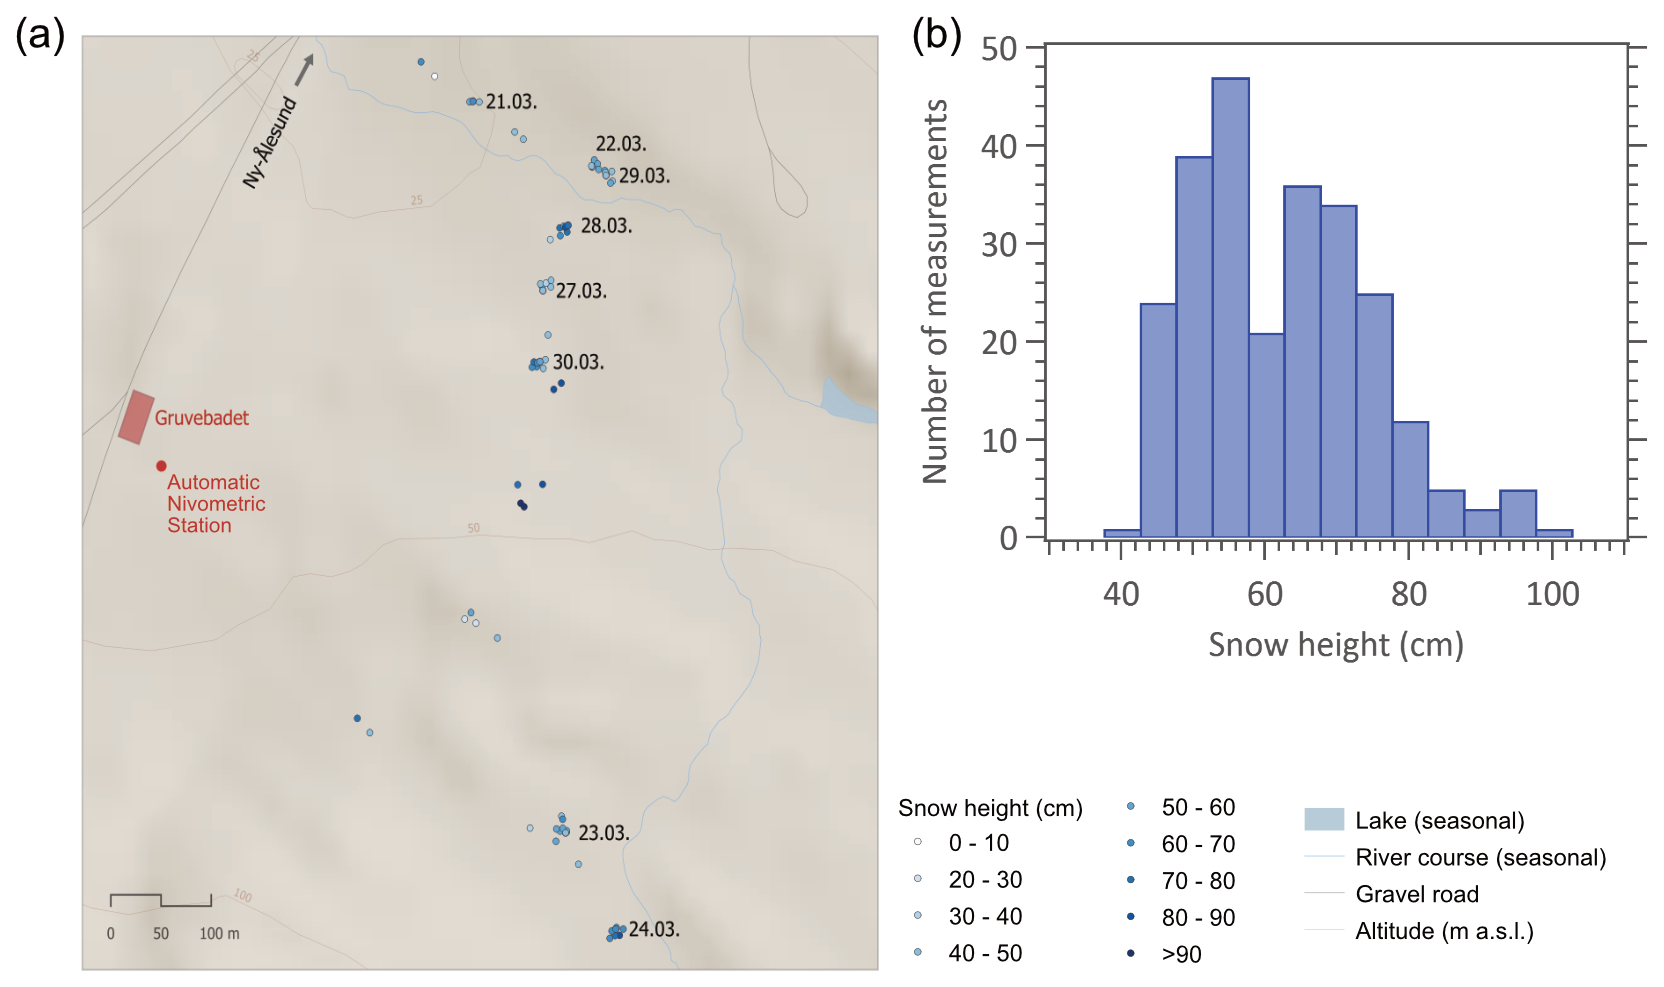
Figure 3Snow thickness distribution near the Gruvebadet Atmospheric Laboratory in March 2023: (a) map of the sampling area, referred to as Gruvebadet slope in the main text, with automatic nivometric station (red dot) and related infrastructure shown, the labels adjacent to measurement clusters indicate the sampling date of a snow pit, map based on Norwegian Polar Institute (2014a, b); (b) corresponding snow thickness histogram, provided as snow height above the ground, based on snow stake measurements.
Snow temperatures before the experiments range from −29.0 °C to −4.1 °C and average −12.1 °C. The daily mean snowpack temperature lies at −12.2 °C, warming from −13.3 °C to −8.0 °C during the field campaign. At the start of fieldwork, the vertical temperature profile exhibits a strong temperature difference (ΔT) between the top and bottom 10 cm ( on 21 March 2023), which is erased at the end ( on 31 March 2023, Fig. 4a). All the while, the bottom snow temperature (0–5 cm snow height) remains largely constant, averaging (Fig. 4a).
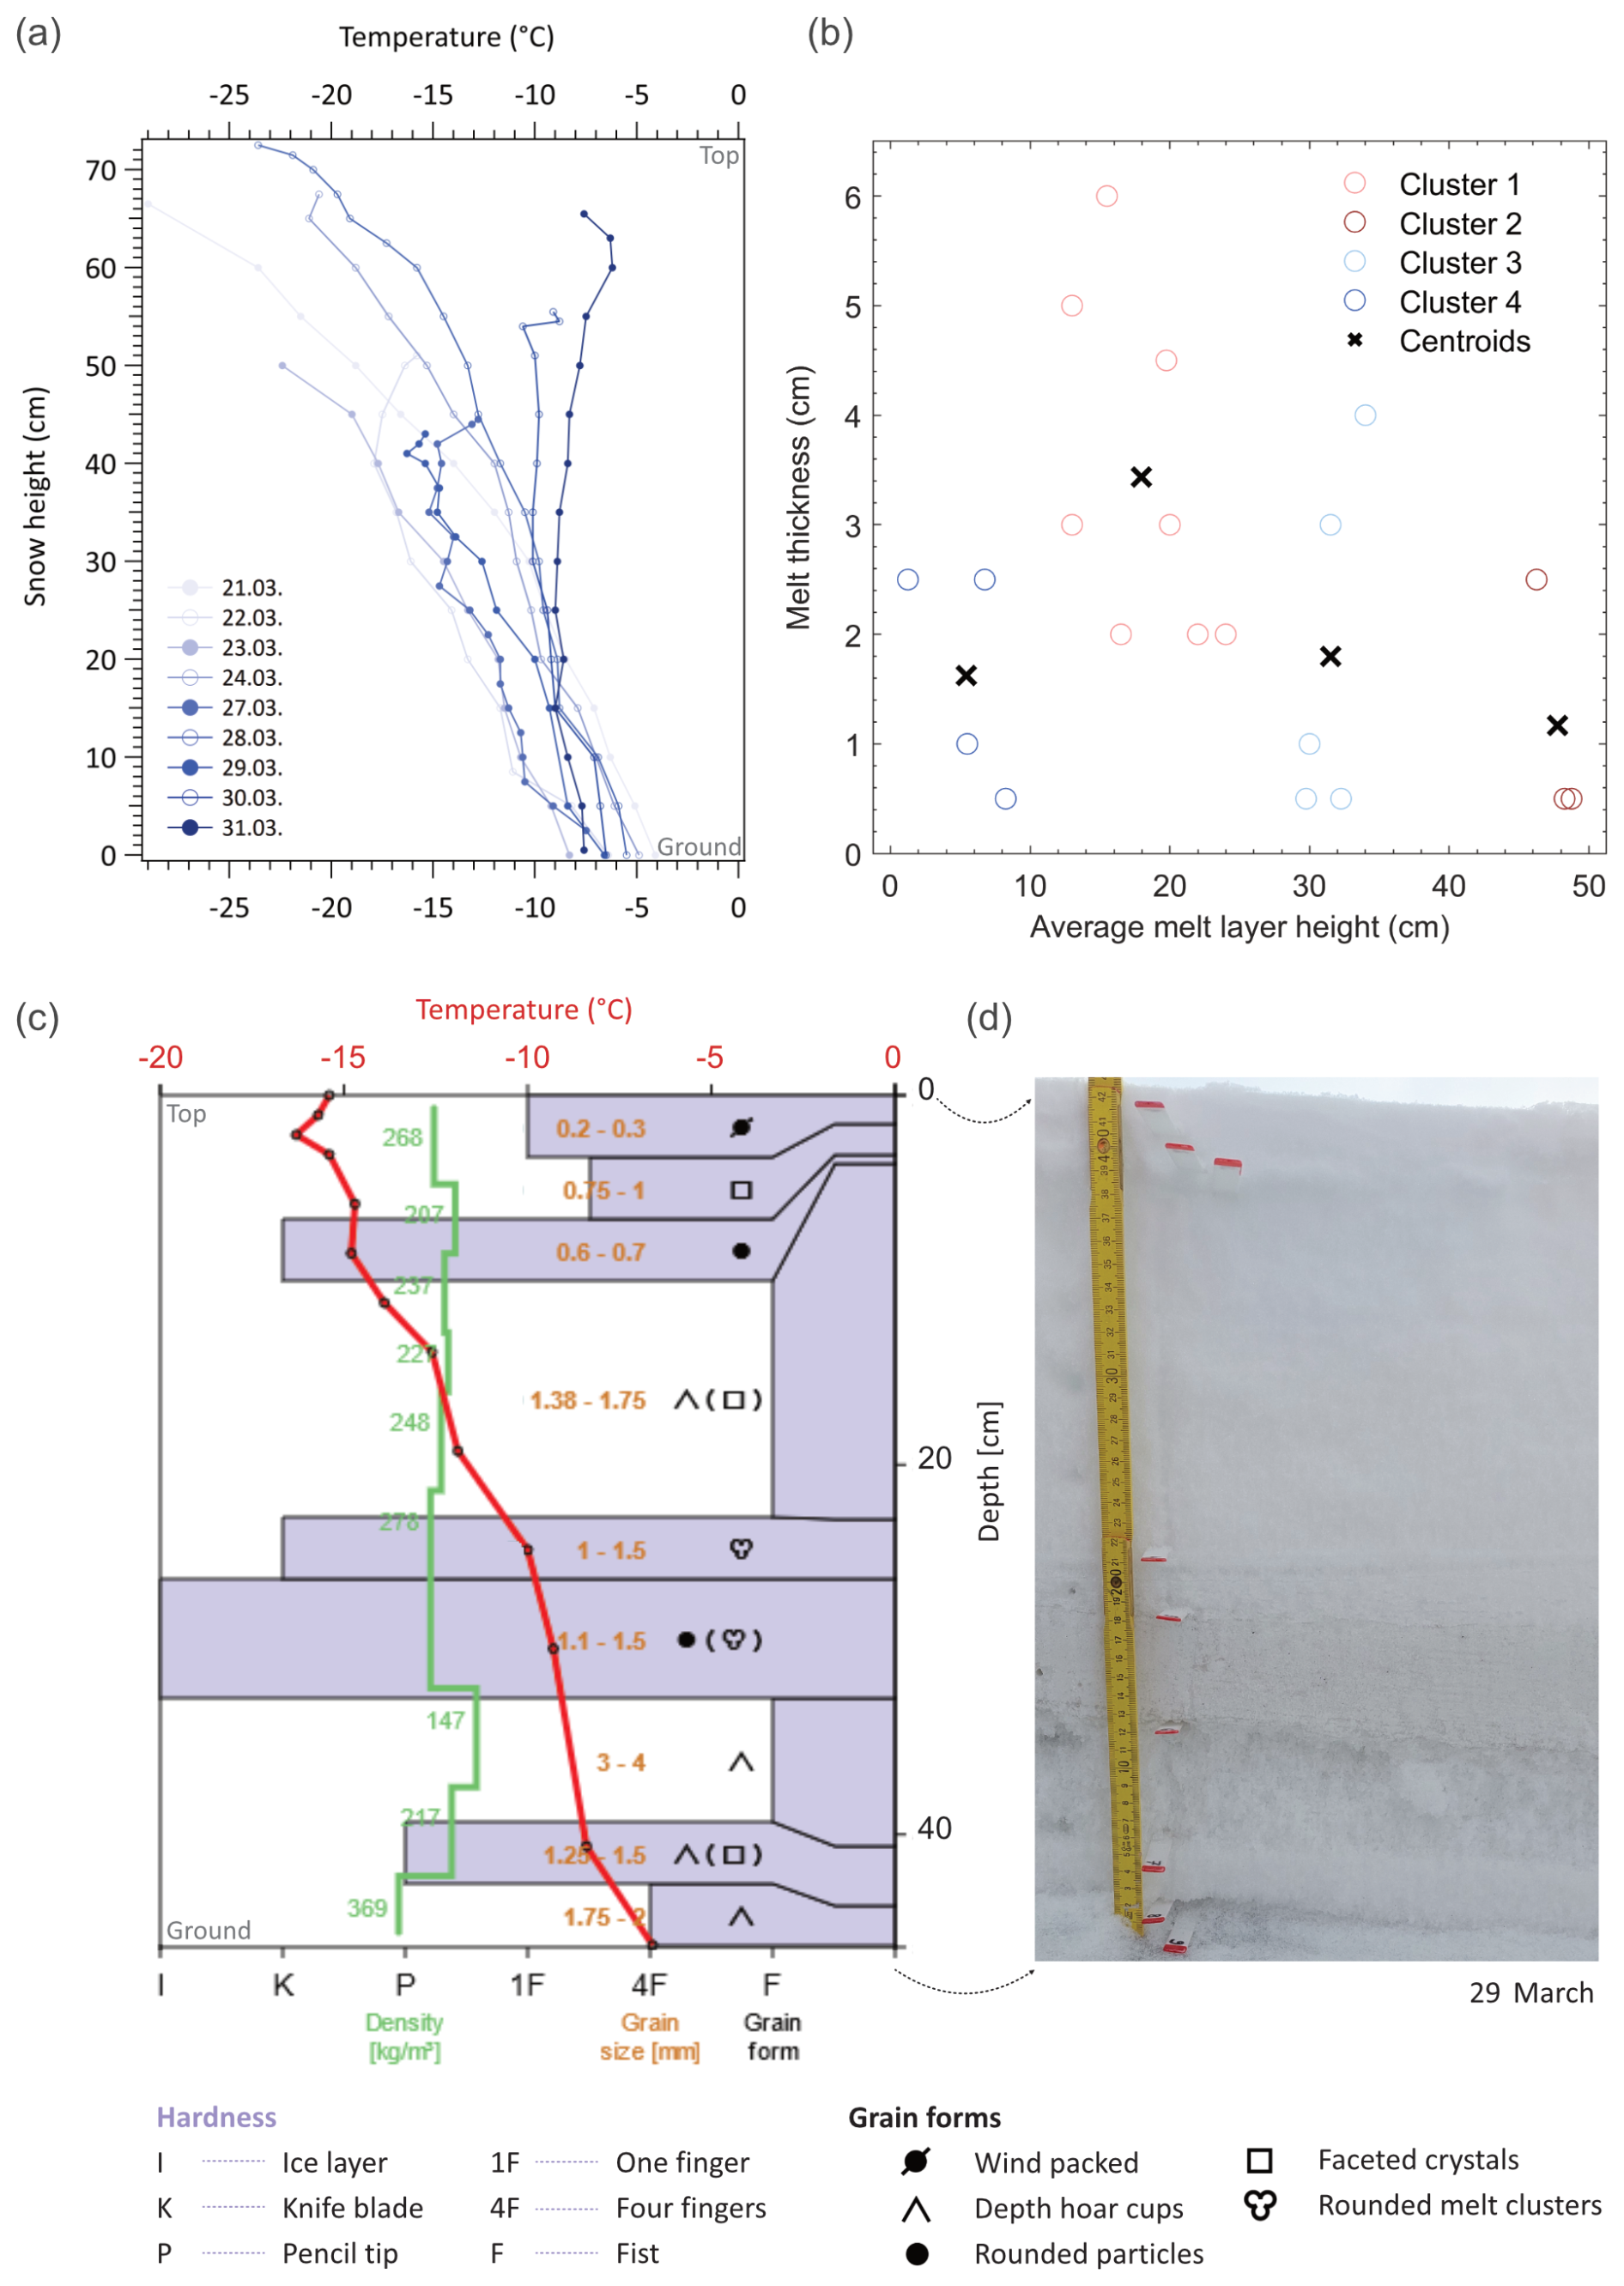
Figure 4Snowpack characteristics as assessed prior to tracer percolation experiments: (a) temperature profiles plotted versus snow height above ground; (b) K-means based clustering of melt layers in the local snowpack based on their thickness and height above ground across all snow pits; (c–d) snow pit example of 29 March 2023: (c) snow stratigraphy with depth (niViz plot), including temperature, hardness, density, grain size and grain shape, symbols based on Fierz et al. (2009) explained in legend below, with (d) corresponding digital photo of snow pit wall with red markers for each layer boundary.
The assessments of snow stratigraphy reveal an average of 10±2 layers in the current seasonal snowpack near Ny-Ålesund in March 2023. A detailed depiction of all snow pits is given in Appendix C. In many profiles, dense wind slabs with fine rounded grains alternate with coarser-grained faceted and hoar crystals, which are especially dominant in the lower parts of the snowpack (Fig. 4c).
Furthermore, eight out of nine snow pits already contain melt-affected layers like melt-cluster grains, melt–freeze crusts or cohesive ice layers prior to the experiments (, e.g. Fig. 4c and d). These 20 melt-affected layers are clustered slightly at 4–5 depth horizons (Fig. 4b), of which the upper ones at ∼30–34 and ∼47 cm snow height are most distinct (Fig. 4b). Snow density measurements range 106–470 kg m−3 and average when considering all snow pits, and densification trends with depth are weak to insignificant (Appendix C).
3.2 Automatic nivometric data
Snow thickness measurements by the ANS show stable conditions during the field campaign (21–31 March 2023) with surface snow height at approximately 69.5±8.8 cm and two snowfall events on 22–23 March 2023 (∼5 cm snow) and 30–31 March 2023 (∼13 cm snow). During the same period, 2 m air temperature ranged from −24.7 to −2.8 °C (). Starting with a cold spell below −22 °C on 20 March 2023, the temperature fluctuates from −18 to −12 °C until 29 March 2023 and then quickly rises to −3 °C on 31 March 2023 (Fig. 5).
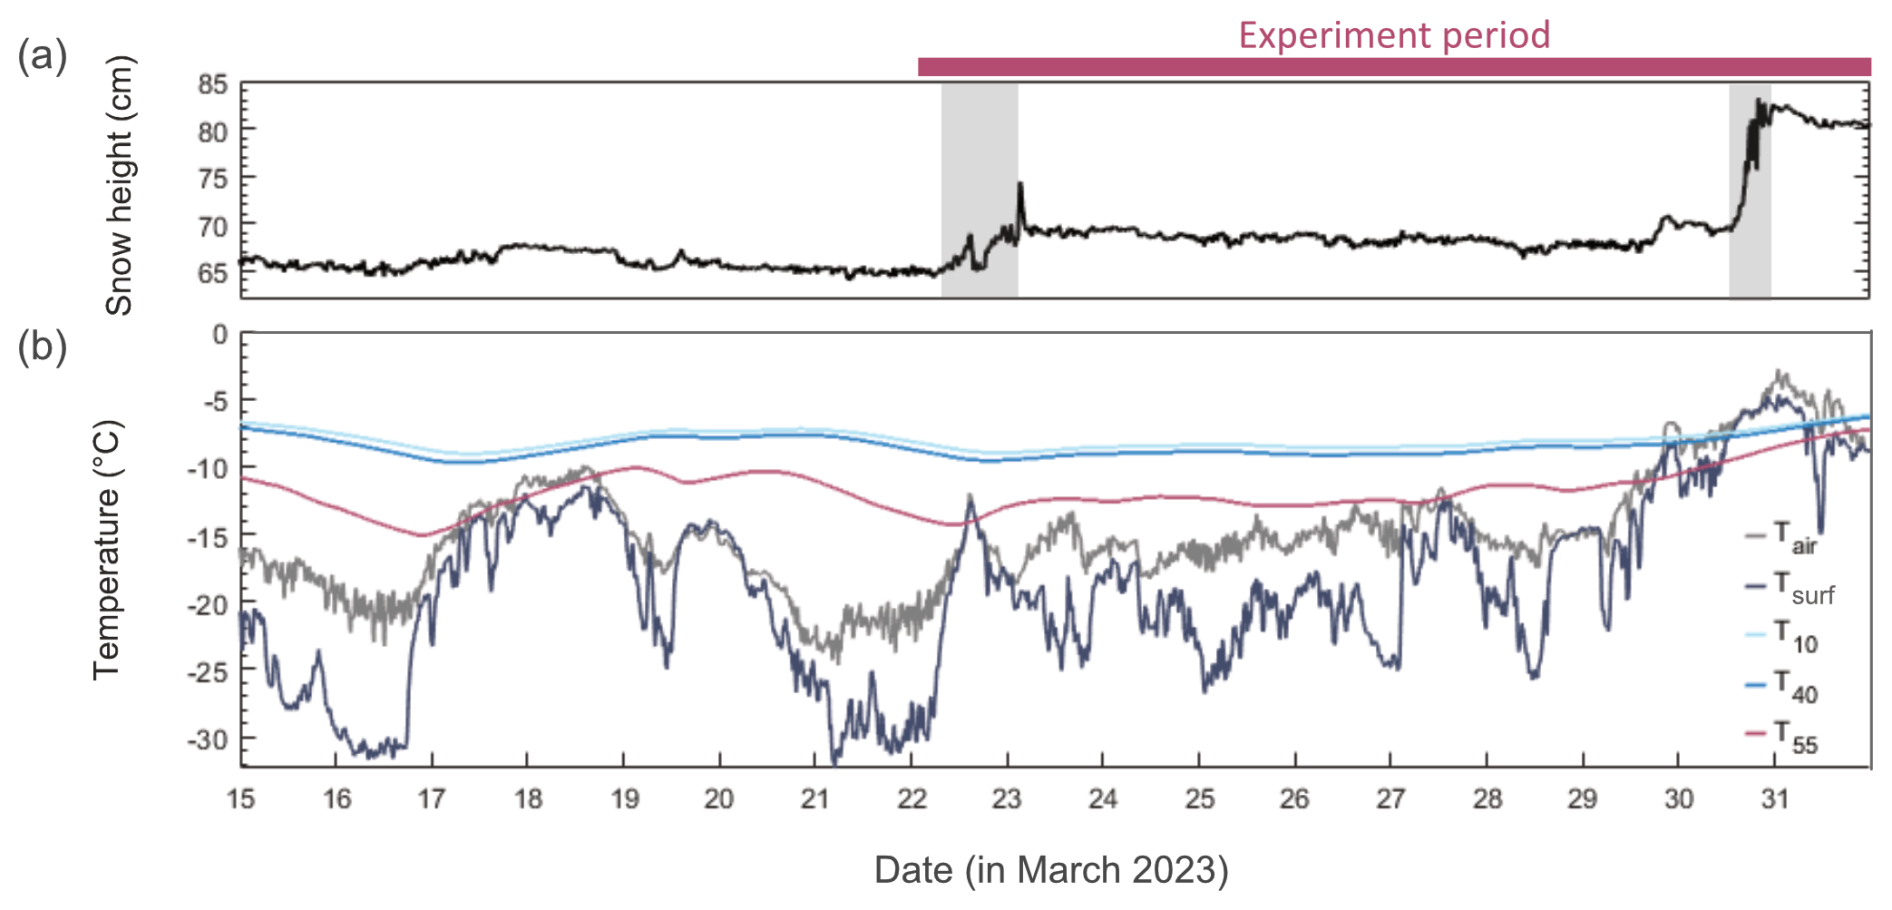
Figure 5Automatically obtained nivometric and meteorological data near Gruvebadet from 15 March until 31 March 2023, based on Scoto et al. (2023): (a) evolution of snow height above ground, period of in-situ experiments highlighted as red bar at the top, grey bands indicate snowfall events; (b) temperatures of air (grey), snow surface (Tsurf, dark blue); and within the snowpack at 10 cm (T10, light blue), 40 cm (T40, medium blue), 55 cm (T55, red) above ground.
The temperature profile of the snowpack recorded by the ANS shows large gradients between the snow surface and lower parts of the profile, especially during cold spells like 20–21 March 2023, when snow surface temperature dropped distinctly below air temperature. However, the snowpack reaches almost isothermal conditions (−7.5 °C) on 30 March 2023. The liquid water content (LWC, Appendix C) is generally low in this dry snowpack and within the range of residual water content (3 %–6 %, Fierz et al., 2009). The highest LWC of 5 % is registered 10 cm above ground, while the near-surface snow 60 cm above ground holds <0.5 % LWC at maximum during cold conditions. In the lead up to the fieldwork campaign during February 2023, air temperature reached values above freezing on at least three occasions (T>0 °C: 5–6, 14–15, and 25–26 February 2023), and two sub-zero yet warm periods (: 21–24 February and 1–2 March 2023) could have also enabled changes to the snow structure.
3.3 Melt experiment results
3.3.1 Structural imprint
Based on 9 snow pits, 17 tracer experiments, and 51 front cuts, the average percolation depth is 4.6±8.4 cm, ranging from 1 to 12.5 cm. An overview of the experiment conditions and outcomes is presented in Appendix E. Thereby, we have documented a diversity of melt structures (Fig. 6), including refrozen surface melt, melt lenses at greater depth, and PFPs, which vary in saturation, air content and can be heterogeneous over small distances (mm–cm). While the central parts of melt lenses are generally intense blue and saturated, their rims sometimes appear in lighter blue, interpreted as undersaturated wet snow (e.g., Fig. 6d). Furthermore, we observed internal layering and remnants of the pre-experiment snow structure visible within the melt-affected parts of the snowpack (Fig. 6h and i). Eight PFPs have been documented on front cuts until 27 March 2023 (e.g., Fig. 6e), with their diameters 0.8–5.5 cm. During the later experiments, areas of enhanced flow are not as clearly delineated but are surrounded by undersaturated, wet snow.
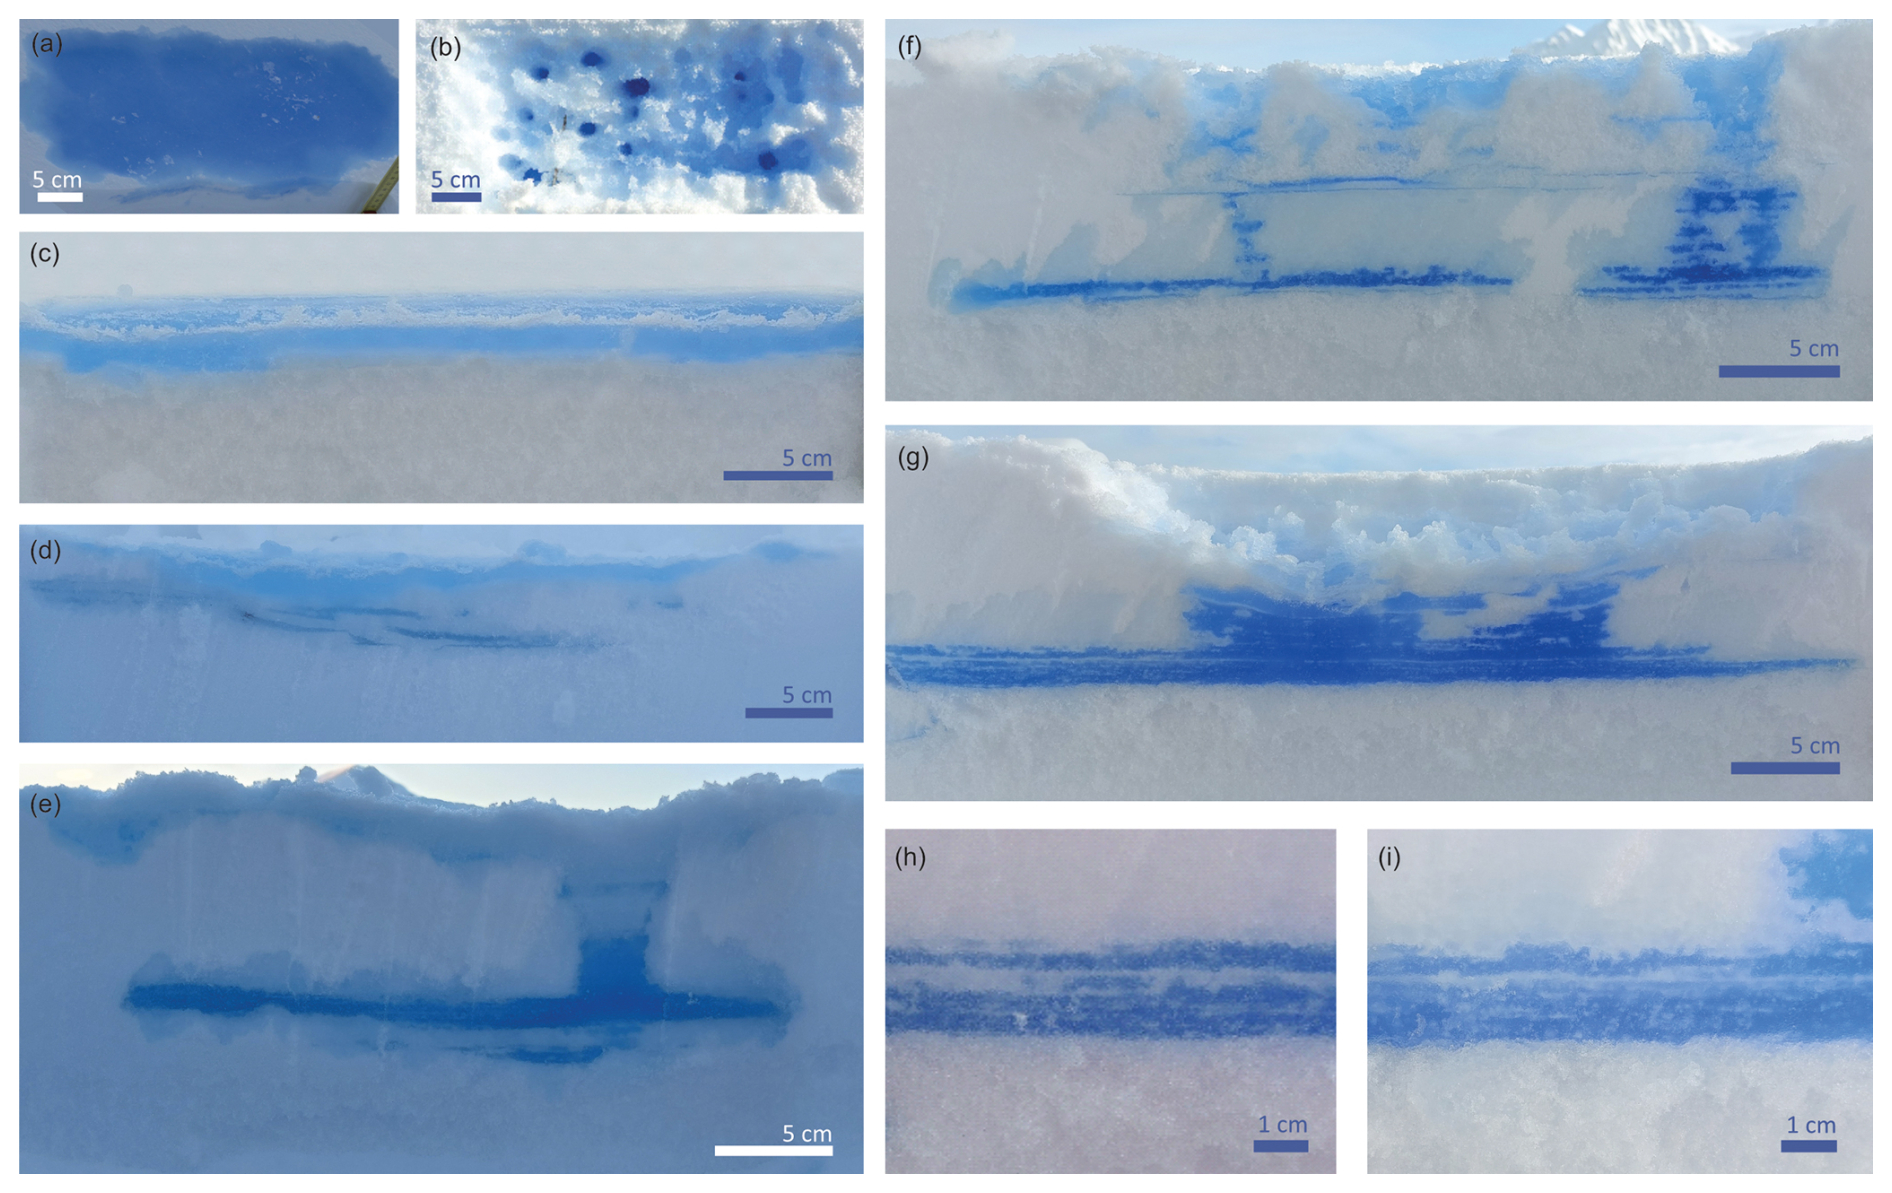
Figure 6Diverse structural imprint of melting and refreezing observed during in-situ percolation experiments in March 2023, feature extent and characteristics have been identified based on blue tracer colour; (a, b) surface melt layer appearance in the affected 40 cm×20 cm area, which was photographed from above, differs between (a) cold snow on 21 March 2023 and (b) warmer snow on 31 March 2023; percolation leads to a range of features, which are pictured from the side here: (c) laterally uniform melt lenses confined to a stratigraphic unit of the snowpack on 29 March 2023; (d) grouping of sub-horizontal melt lenses adjacent to the primary surface melt layer on 27 March 2023; (e) vertical preferential flow path connecting a refrozen surface melt layer to a melt lens at greater depth within the snowpack, which exhibits saturated (dark blue) central parts and undersaturated (lighter blue) rims on 23 March 2023; (f) wider-spread wetting of snow (light blue) with locally saturated vertical flow and horizontal ponding areas, including localized surface lowering instead of a refrozen surface on 31 March 2023; (g) widespread lowering of the snow surface, saturation and compaction of the snowpack on 31 March 2023; (h, i) internal layering on a millimetre scale with snow remnants (white) evident between melt-saturated (blue) segments on 31 March 2023; scale bars show the resolution along both vertical and horizontal axis for each panel; digital photos: Dorothea Baur.
Also, the appearance of a distinct, homogeneous, and bubble-free refrozen melt layer at the surface on 21 March 2023 differs strongly from the widespread, partly cryoconite-like percolation and lack of a refrozen surface melt on 31 March 2023 (Fig. 6a and b). While the surface snow height above ground remains unaltered in the former conditions, snow surfaces are significantly lowered (by 4–8 cm) and stratigraphic units visibly compacted in the latter experiments (31 March 2023, Fig. 6f and g).
3.3.2 Stable water isotopes before and after melting
SWI signatures in the seasonal snowpack near Ny-Ålesund before percolation experiments average for δ18O and for δD across all individual measurements. The relatively large spread reflects natural variability within and between snow pits. When SWI signatures are first averaged within each snow pit and then across the study sites, the pit-level means cluster more tightly: δ18O shows a mean of , ranging from −13 ‰ to −16 ‰, and δD averages , ranging from −88 ‰ to −111 ‰. These ranges reflect differences in SWI signatures across the Gruvebadet slope. The consistency between both mean estimates indicates that the individual snow pits sampled here are representative of the broader δ18O and δD variability encountered in the seasonal snowpack up to March 2023.
Within the respective snow pits, SWI signatures often correspond to the stratigraphic layering in the snowpack and carry a distinct deposit signature (Appendix D). In some cases, specific depositional units are traceable across snow pits. Furthermore, secondary effects of melt phases earlier in the season are already visible. For example, the δ18O signature of a distinct melt layer appears enriched in 18O () in comparison to the adjacent snow layers on 30 March 2023 (Appendix D: Fig. D1f). SWI signatures above and below refrozen melt layers occasionally reveal a step-change, e.g. showing δ18O values of −13 ‰ above and −19 ‰ below an ice layer on 24 March 2023 (Appendix D: Fig. D1b).
When examining δ18O signatures after the percolation experiments, samples categorized as unaffected generally exhibited values similar to the pre-melt profile, i.e. the mean δ18O difference is , while melt-affected samples tend to show δ18O values enriched by . Proper visual distinction and sampling of un-/affected samples is corroborated by δD. The average pre- versus post-melt difference for δD is positive by in tracer-affected samples, while signatures outside of the visible percolation areas had unaltered δD values (mean ).
4.1 Contextualisation of the methodological approach
The presented ROS experiments are of urgent relevance, as Svalbard holds key Arctic ice-core drilling sites and ROS-driven melt events are already becoming more frequent in its coastal region up to a few hundred meters of altitude, so that a deeper understanding of their impact on polar snow and firn, including SWI climate signatures, is needed. Our experiment approach seizes various elements from previous field studies: working in situ, using a SWI-tracer, and comparing before and after ROS percolation (Juras et al., 2016, 2017; Wong et al., 2013). At the same time, we kept ROS tracer application in the field simple to facilitate experiments with limited logistical, financial or technological capabilities. Moure et al. (2023) have recently reiterated the need for well-controlled experiments including in-depth assessments of snowpack properties, i.e. snow temperature, grain type, and melt-flux rates, to further improve modelling of meltwater flow through porous snow. We agree that laboratory experiments are irreplaceable to ensure repeatable ambient conditions and reproducibility of percolation behaviour.
In this context, our field-based experiments with detailed structural and chemical analyses pre- and post-experiment can serve as an analogue counterpart. Simulating the percolation process in situ bears the large advantage that the stratigraphic layering of the snowpack under investigation remains unchanged. Thus, its influence on local percolation depth can be quantified more reliably, e.g. by including depths, hardness and grain-size differences between stratigraphic units as independent variables during MLRA. There are some studies dealing with melt-induced chemical alteration or structural changes through melt (e.g. Katsushima et al., 2013, 2020; Lee et al., 2010a, b; Spolaor et al., 2021), but this study is one of only few to investigate percolation within the most recent annual snow layer visually, structurally, and chemically at the same time (Juras et al., 2016; Waldner et al., 2004; Wong et al., 2013).
Following, we briefly discuss (1) environmental conditions, (2) ROS setup, and (3) ROS intensity to delineate the transferability of the here obtained experiment results.
-
Aiming to capture warming snow conditions prior to the onset of the annual snowmelt, the fieldwork campaign has been timed for mid-to-end March. Successful in conducting the percolation experiments before a severely snowpack-depleting melt event in spring 2023, cold ambient temperatures during fieldwork mainly depict a non-ripe snowpack (21–29 March 2023) and less of the ripe snow conditions typical of spring (30–31 March 2023). The cold had to be compensated for by warming the tracer liquid () to prevent freezing within the sprinkler. To monitor the impact of this heat source on flow progression, tracer temperature was recorded immediately before application and included as an independent factor for percolation depth during regression analysis. Future studies should aim to repeat the in-situ percolation tracer experiments over a longer period including warmer conditions to assess the range of melt effects as previously conducted in alpine snow (Juras et al., 2017). Further, keeping liquid temperature steady would reduce the number of changing parameters.
-
The tracer was applied by moving a sprinkler continuously to ensure equal distribution over the experiment area, and we assume that tracer application is uniform at the surface in the experiments. Considering the regulatory context and scope of this case study, the used setup effectively achieved its intended objective. At the same time, studies by Juras et al. (2017) and Clerx et al. (2022) point to the potential of advanced sprinkler setups to further improve controlled, homogeneous ROS simulation in future studies.
-
Our study setup further represents minor ROS events rather than insolation-driven melt events. The tracer volume used in our experiments ranges from 250–2000 mL (median=500 mL), equalling 6.25 mm w.e. on the 40 cm×20 cm area. They capture the range of smaller ROS events in Svalbard during winter (Sobota et al., 2020; Vickers et al., 2024) but are not comparable to documented extreme rainfall events in Ny-Ålesund like on 23–24 March 2007 (67.3 mm; Peeters et al., 2019; Stephen Warren, personal communication, 2026) and 30 January 2012 (98 mm; Hansen et al., 2014). Structural and SWI alterations as they occur without the input of a signature- and energy-carrying liquid (Lee et al., 2010a; Spolaor et al., 2021) have been simulated in heat-plate melt experiments by, e.g., Harrington et al. (1996), and comparing the impact of ROS and insolation-driven melt requires further investigation beyond the scope of this study.
4.2 Pre-melt snowpack characteristics in the nivometric context
To examine whether snow characteristics before the tracer experiments are typical and representative of the Arctic snowpack in March 2023, we discuss the measured snow properties in the nivometric context. While individually matching melt-affected layers with meteorological events is beyond the scope of this study, the number of melt events is similar to and therefore expected to explain the stratigraphic clusters of melt horizons in the Ny-Ålesund snowpack. More specifically, the melt phases mid- and end-February appear to correlate with melt-affected layers around 30–34 and 47 cm depth. Layers of faceted and hoar crystals have developed through constructive metamorphism within the snow, facilitated by the strong temperature gradient between permafrost and near-surface snow exposed to variable ambient temperatures. This is corroborated by the density profiles, in which the lack of densification can be attributed to de-densifying temperature gradient metamorphism. Together with the observed fine-grained wind slabs, the snow profiles show typical characteristics of a high Arctic maritime snowpack (Eckerstorfer and Christiansen, 2011). Furthermore, the quick warming of seasonal snow and change to isothermal conditions towards the end of this study is an example of rapid temperature transitions, which occur frequently around Ny-Ålesund (Yeo et al., 2018). Comparing pre-experiment surface snow height in the vicinity of Ny-Ålesund (59.0±24.3 cm) and the surface snow height recorded by the automatic nivometric station at Gruvebadet (69.5±8.8 cm) during the fieldwork period, our measurements indicate slightly less seasonal accumulation on the Gruvebadet slope than at the nivometric station. Given that wind-driven redistribution is known to cause short-distance snow height variability, we nevertheless consider the sampling conditions representative of the Ny-Ålesund snowpack in March 2023.
4.3 Diversity of in-situ melt structures
The in-situ experiments show a range of melt features with structural heterogeneities on a millimetre-to-decimetre scale (Sect. 3.3.1), revealing complex modulations of the percolation process. The experiments clearly illustrate how various characteristics can result from single events. Saturated centres of melt lenses are often surrounded by undersaturated wet snow (Fig. 6e), and an example experiment time-lapse video (31 March 2023, Moser et al., 2025c) shows how this could result from stepwise advances of meltwater along the thermo-hydrological percolation front.
In addition, we for the first time report internal layering of melt lenses in situ on a millimetre scale as a consequence of a single percolation experiment (Fig. 6h and i). Lab experiments and modelling of percolation by Avanzi et al. (2016) showed spatial heterogeneities on a centimetre scale and highlighted the role of capillary boundaries for preferential flow, but to our knowledge, this study is the first to show millimetre-scale heterogeneities developing in situ. Such internal layering confirms that not all of the snow properties are eradicated through melt infiltration, but remnants of pre-experiment snow structure can remain within melt-affected sections. This finding is in agreement with 3D ice μCT scans revealing firn remnants within melt sections (Moser, 2025). Therefore, it needs to be re-emphasized that high-resolution measurements of snow and firn structure are crucial in supplementing meltwater flow modelling to improve our understanding of melt feature formation.
The spatial heterogeneities of melt lenses and PFPs on a centimetre-to-decimetre scale and internal layering on a millimetre scale (Fig. 6) also demonstrate how challenging it is to structurally differentiate individual melt events or melt-intensive seasons in firn and ice cores (e.g., Moser et al., 2024). Some melt features lack both lateral continuity and vertical homogeneity, which limits the ability to extrapolate melt conditions from a single 9 cm diameter profile. Moreover, the number of ice layers in the snowpack will not necessarily be equal to the number of ROS events that have occurred during the season (e.g., Pfeffer and Humphrey, 1998). Repeated percolation experiments at firn core drilling sites could help to create a site-specific framework of expected melt structures and substantiate their environmental interpretation.
4.4 Constraining factors for melt percolation and structures
Here, we use the structural characteristics of melt features and MLRA (Appendix E) to explore the local factors that determine the percolation process and refreezing conditions.
Firstly, multiple linear regression analysis of the experiment results indicates that snow surface temperature, the location of a first hard layer within the snowpack, grain size differences at the first and second stratigraphic boundaries, liquid temperature and volume can explain ∼63 % of average percolation depth variance of all front cuts (adjusted R2=0.629, n=47). More specifically, surface snow temperature (p<0.01), the grain size difference at the first stratigraphic transition (p<0.05) and liquid volume (p<0.01) are positively related to average percolation depth. For the snowpack context, this means that higher snow temperatures allow for deeper meltwater infiltration, fine-to-coarse transitions retard vertical flow, and more intense ROS events reach deeper parts of the annual layer. While quantifying the relative contributions for individual results is hindered due to the multi-dimensional variability of in-situ conditions, the cases discussed here exemplify constraints identified by MLRA.
Already the first imprint of the percolation tracer on surface snow differs visually depending on the snow temperature. In cold snow like on 21 March 2023 (−25 °C), we observe distinct bubble-free surface melt layers as well as confined preferential flow fingers and melt lenses (Fig. 6a and e). In warmer snow like on 31 March 2023 (−7 °C), there is no refrozen surface melt layer but wider-spread, partly undersaturated percolation that causes snow compaction and a lowering of the surface in the 40 cm×20 cm experiment area (Fig. 6b, f, and g). This suggests that there is a shift from preferential, spatially heterogeneous flow to more homogeneous matrix flow, which is dependent on the dynamic evolution and interplay of air and snow temperature. Both of these primary flow regimes have been previously documented (Moser et al., 2024, and references therein), and the experiments in this study highlight the importance of refreezing capacity for percolation behaviour. At the same time, Waldner et al. (2004) conducted a series of percolation experiments at 0 °C, reported both preferential and matrix flow, and showed that stratigraphy and grain size distribution within the snowpack are major factors, too.
Analysing the average percolation depths in the context of near-surface snow stratigraphy shows that the in-situ observations are similarly valuable to explain meltwater progression and retardation here. More specifically, the position, hardness and grain-size difference of stratigraphic boundaries can be strong internal constraints for local percolation depth in the experiments beyond the influence of snow temperature. For example, average snowpack temperature was similar on 29 March 2023 to previous days (24 March 2023: −12.5 °C; 29 March 2023: −12.7 °C) and surface snow comparatively warm (Fig. 4; 24 March ; 29 March ). However, the melt tracer was retained largely within the topmost (1.5 cm), fine-grained (average diameter 0.2 mm) stratigraphic unit during the first 250 mL experiment and above the first hard layer (3 cm depth) during a subsequent 725 mL experiment (Fig. 6c). Instead of progressing vertically, the tracer spread laterally beyond the experiment boundaries. In these cases, stratigraphy seemed to override snow temperature as a constraining factor and partially suppress the influence of liquid volume. Furthermore, they show that vertical flow retardation and ponding occur not only at high-density boundaries (e.g. 22 March 2023) but at fine-to-coarse transitions due to capillarity (e.g. Waldner et al., 2004, and references therein).
Placed in the wider literature context, the identified major percolation constraints snow temperature, stratigraphy and melt rate are consistent with previous experimental, modelling, and geophysical findings. The here reported features partly resemble the spectrum of flow conditions documented by Bøggild (2000) in tracer dye experiments in Greenland's Tasersuaq basin: near-surface non-preferential infiltration, sharply defined flow fingers, and poorly confined flow fingers transitioning to matrix flow. Although not directly comparable, their study also suggests time-dependent components for both thermal and gravitational retention. Pfeffer and Humphrey (1998) numerically modelled percolation and refreezing of melt and point out the joint importance of “initial temperature, grain-size and density contrast across the stratigraphic transition, water-input rate and minimum impermeable-layer thickness”. In addition, ground-penetrating radar measurements in melt-affected Greenland firn by Culberg et al. (2021) generally stress the importance of the regional thermal regime for melt layer prominence but also the modulating effect of more heterogeneous stratigraphy on percolation behaviour.
After all, questions about the shift from preferential, spatially heterogeneous flow to more homogeneous matrix flow have previously been raised for wet snow, e.g., by Hirashima et al. (2019) and Avanzi et al. (2016). The in-situ observations made here reinforce arguments for a snow temperature-driven regime change and that melt features not only reflect positive air temperatures but a dynamic interplay of air and snowpack, thereby agreeing with existing literature (Moser et al., 2024) and diverse melt structures in firn cores (MacDonell et al., 2021). They also underline the great value of detailed and continuous snowpack assessments as designed by Scoto et al. (2023) for reconstructing meltwater flow and quantifying potential alteration of extracted climate records.
4.5 Melt-induced stable water isotope alteration
The fact that SWI signatures before and after experiments differ distinctly shows that the study approach is successful and melt percolation is chemically traceable (Sect. 3.3.2). Moreover, the δ18O enrichment in refrozen melt layers generally aligns with broader literature (e.g. Beria et al., 2018; Moser et al., 2024, and references therein).
Examining the individual percolation experiments as case studies, it becomes evident that SWI changes are highly localised and confined to the melt-affected lenses and percolation features on a centimetre scale (Fig. 7). For example, a PFP (Fig. 7b; 23 March 2023) carries an enriched δ18O signature of −15.8 ‰, but two neighbouring samples taken 1.5 cm left and right of it show pre-experiment values (−19.5 ‰; −19.5 ‰). Similarly, the δ18O signature between the visible surface melt layer and a deeper melt lens remains unaltered (−19.7 ‰).
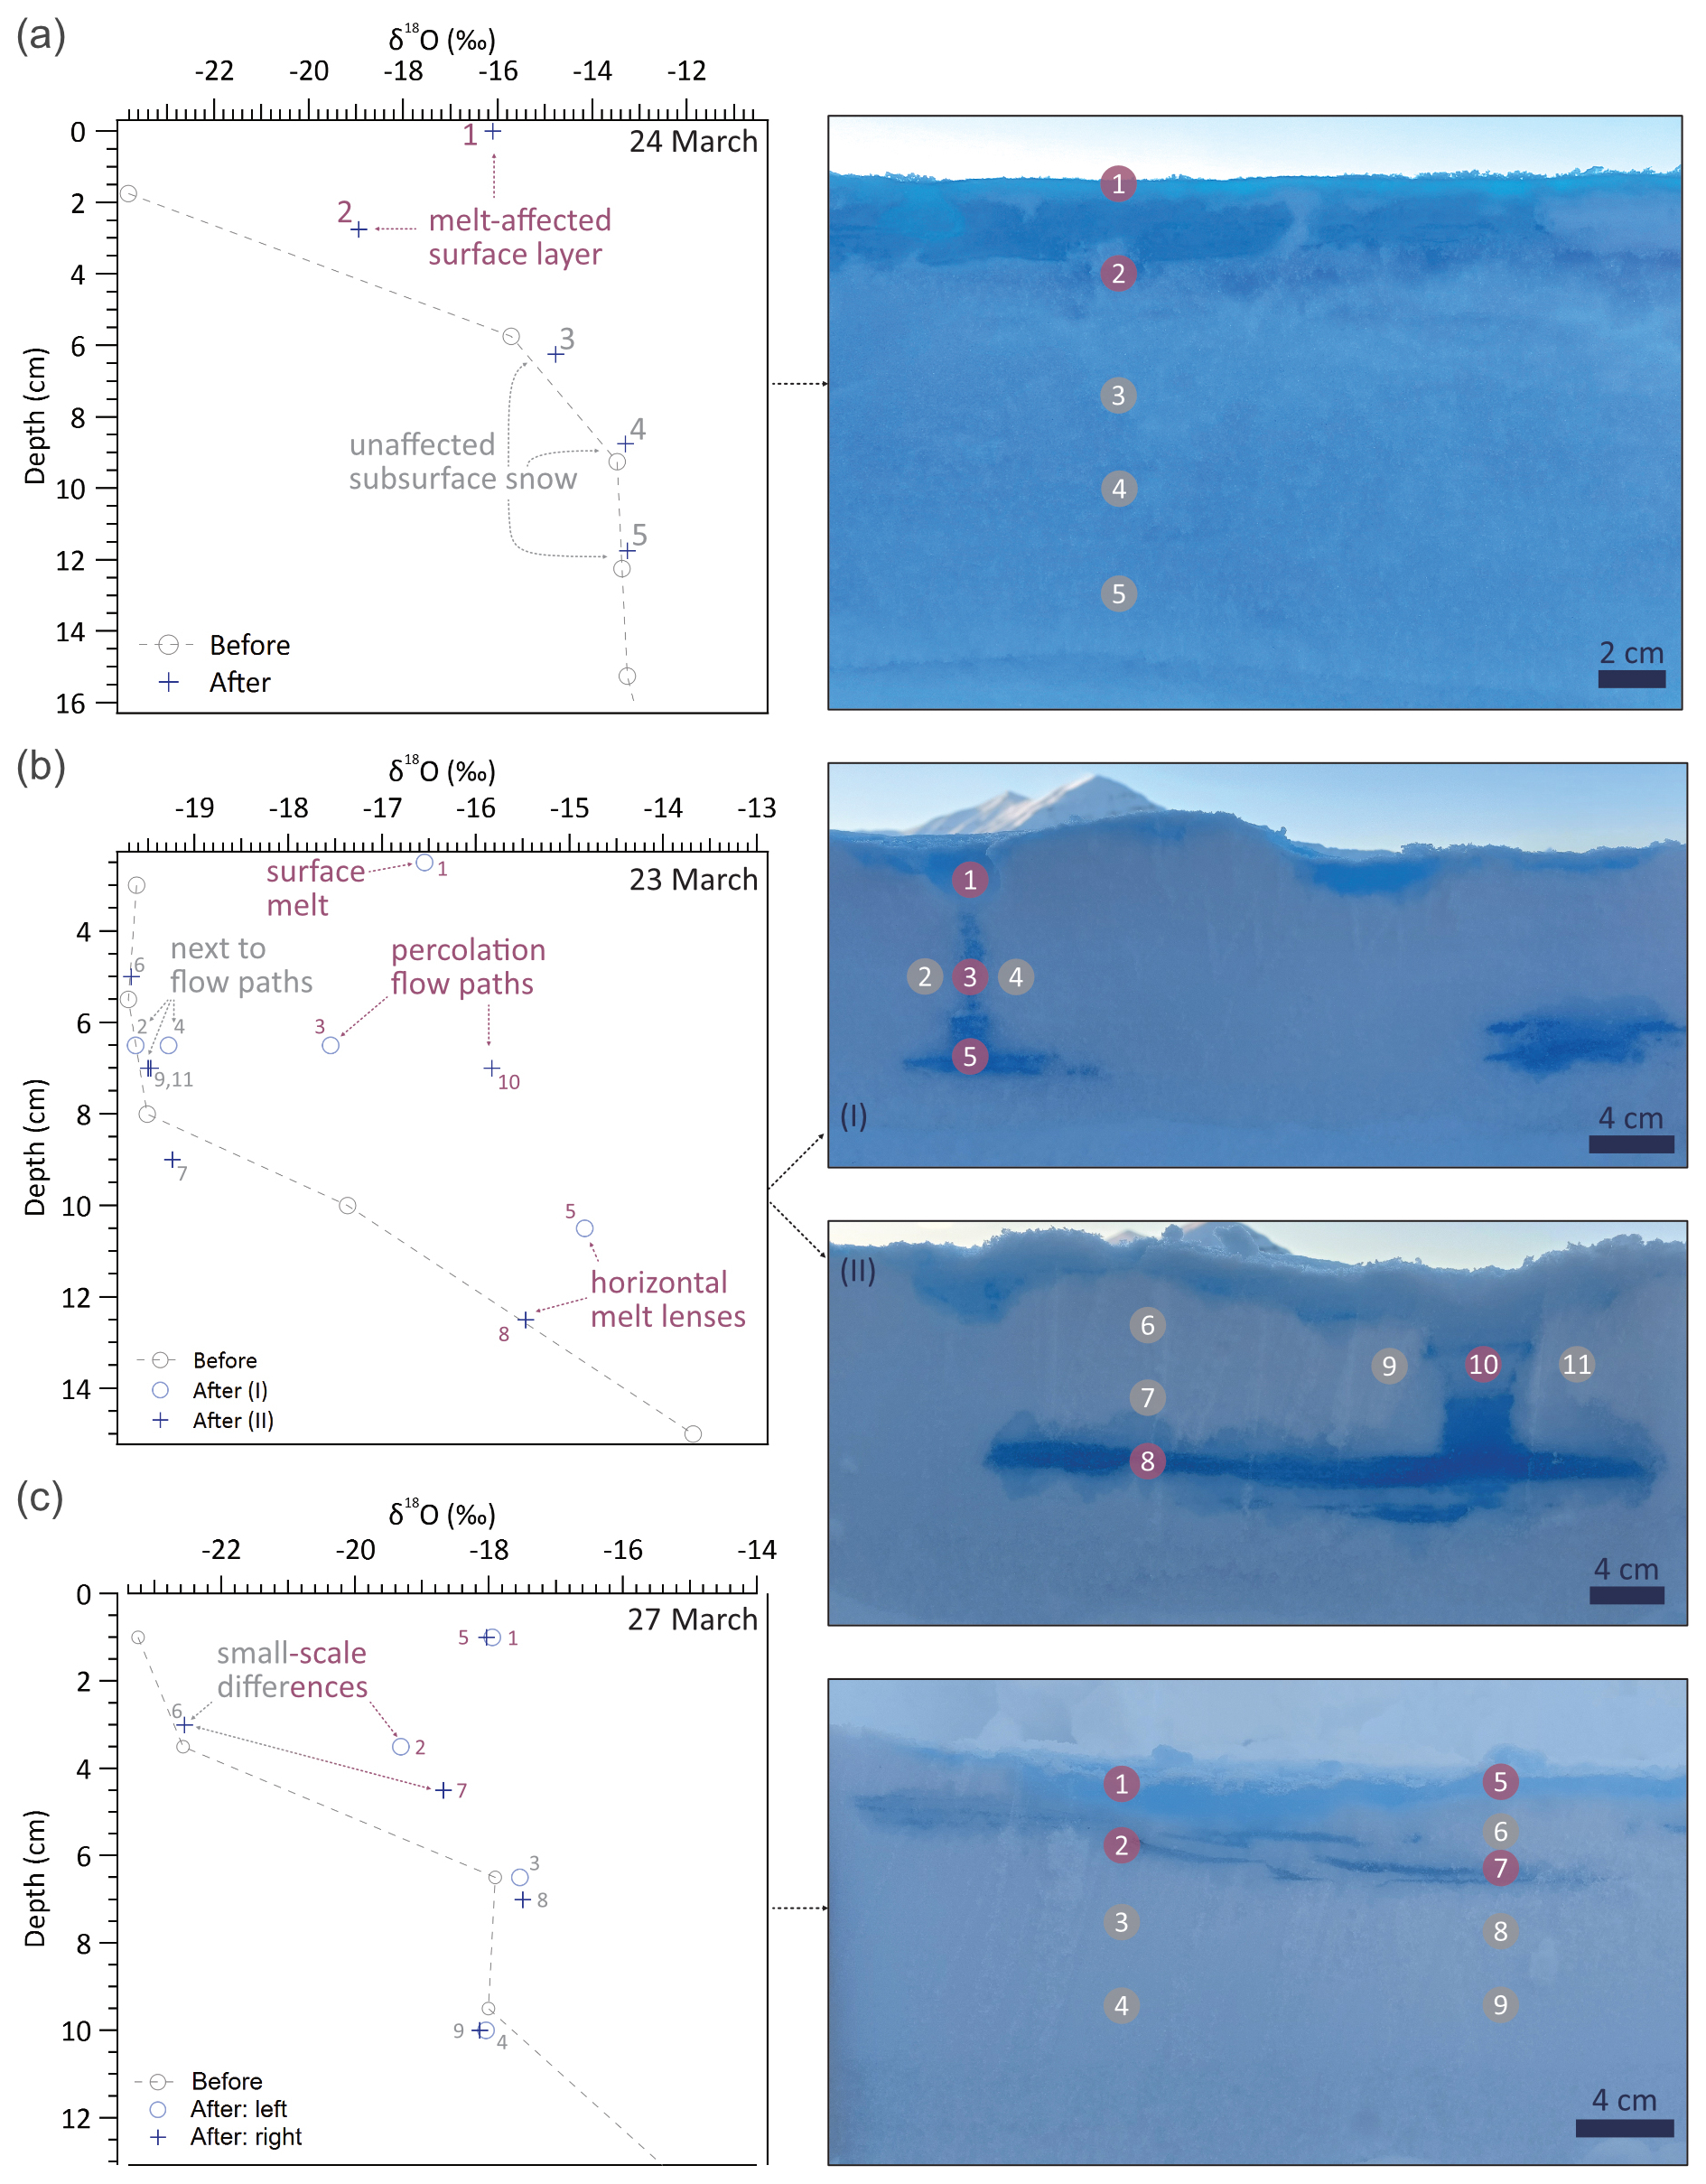
Figure 7Examples of melt-induced stable water isotope alteration, comparing δ18O in the near-surface snow before and after tracer experiments, values in ‰ against V-SMOW; corresponding photos of the snow fronts show the numbered sampling spots in both unaffected (grey marker) and melt-affected (dark rose marker) parts: (a) δ18O enrichment confined to near-surface melt layer on 24 March 2023; (b) repeated experiments corroborate that δ18O changes are limited to visible (blue) percolation flow paths and melt lenses on 23 March 2023; (c) small-scale vertical and horizontal heterogeneities (cm) can occur within single tracer melt events based on structurally complex flow, 27 March 2023.
To further investigate how localized SWI alteration is, SWI samples were taken 1 cm, 3–3.5, 4.5, 6.5–7 and 10 cm below the surface in the left and right part of the experiment area, respectively (Fig. 7c; 27 March 2023). While the effect of melt on δ18O is laterally uniform within the surface melt layer at 1 cm depth, differences are apparent at 3–3.5 cm depth, where the left sample is taken from a melt lens (−19.3 ‰) and the right is unaffected with a δ18O signature similar to pre-experiment background (−22.6 ‰, Fig. 7c). Comparing this with a melt-affected sample on the right at 4.5 cm depth (−18.7 ‰, Fig. 7c) reveals a vertical difference of +3.9 ‰ between non-lens and melt lens sample material. Thus, meltwater percolation not only leads to mixing and SWI enrichment in parts of the snowpack but also introduces small-scale spatial variability (millimetre-to-centimetre), which need to be considered when interpreting SWI records from melt-affected profiles (Fig. 7c).
The presence of distinct SWI signatures above and below ice layers further supports the idea that refrozen melt can temporarily stabilise the surface near Ny-Ålesund. By preventing wind-driven redistribution and mixing, they can foster distinct stratification and improve preservation of the SWI record beneath and between melt horizons. This complements previous studies that mention improved SWI preservation, e.g. Van Der Wel et al. (2011) describing melt layers as diffusion-limiting.
To quantitatively assess how meltwater flow influences SWI signatures, it is crucial to consider whether and how the sampling location within the flow path affects the results. In an experiment on 30 March 2023, both δ18O and δD exhibit a clear tracer imprint in the surface melt at 3 cm depth, indicating active percolation. However, in the lower flow finger and melt lens, tracer presence is evident as a δD increase, while δ18O remains unchanged compared to pre-experiment values. This stability in δ18O suggests that meltwater movement may have slowed or ceased at the percolation front, preventing further isotopic alteration. Consequently, SWI changes appear to occur progressively, with the degree of modification depending on melt intensity and whether the sample is taken from a pick-up zone, a transition or liquid flow area, or a refreezing regime.
Since melt layers influence both the retention and redistribution of isotopic signals, they shape the sub-annual resolution of SWI proxy records. To fully capture these effects, it is essential to link the structural impact of refrozen melt to its chemical imprint (Westhoff, 2021), ensuring a more robust interpretation of melt-affected isotope records. Overall, the spatial variability in SWI alteration underscores the need for careful sampling strategies in melt-affected snow and firn. Melt percolation introduces complexities that must be considered when using SWI records for climate reconstructions.
Svalbard's glaciers are part of the growing number of ice-core climate archives endangered through melting, thus calling for a detailed understanding of site-specific meltwater percolation conditions to evaluate the usability of SWI and other proxies. In this context, our study has contributed to a field- and process-based understanding of the factors constraining melt flow through snow and refrozen feature appearance in snow and firn records.
Drawing on various previous experimental tracing approaches, we developed a simplified in-situ tracer percolation experiment, which mirrors small-scale ROS events and integrates structural and chemical (SWI) snow characteristics before, during and after melting. A series of 17 experiments in 9 snow pits was conducted in the vicinity of Ny-Ålesund in March 2023, thereby successful at visualising structural melt imprint and tracing SWI alteration.
This study points out the structural diversity of melt features previously expected (Moser et al., 2024) but rarely documented in firn cores (MacDonell et al., 2021). This includes unprecedented in-situ observations of internal millimetre-scale layering within melt lenses. A range of flow conditions from preferential flow to matrix infiltration has been documented, and snow temperature, stratigraphy, and meltwater volume identified as key factors constraining meltwater percolation during the field experiments. Structural melt feature appearance can be linked to both thermal and stratigraphic controls, corroborating that the imprint of melting and refreezing is governed by complex nuances of the ice–air–liquid interplay. The relative and site-specific importance of percolation constraints deserves further research.
Percolation-induced SWI changes appear to be highly localized, confined to melt structures. Depending on the flow and refreezing conditions, this implies that (1) small-scale spatial heterogeneities can be introduced to SWI records and (2) SWI information can be retrieved from unaffected profile parts. The extent to which SWI alteration is gradually variable within flow paths remains uncertain, raises the question of whether multiple interaction regimes exist, and requires further investigation.
Taken together, this experimental field study provided new insights into (1) meltwater flow and refreezing processes in the vicinity of Ny-Ålesund, and (2) the informational value of SWI records before and after ROS-induced melt events. Looking ahead, repeating the in-situ tracer experiments both earlier in winter and throughout spring would allow to capture the seasonally changing snow conditions, thereby offering a more comprehensive framework of meltwater percolation under varying circumstances at this location. Similarly, it remains valuable to trace the signatures of natural rain-on-snow events and their associated alterations in situ to corroborate the results of this study. The experimental approach could also be applied to similar research at other melt-affected firn core sites in the polar regions to broaden the understanding of meltwater dynamics across different environments.
The experiments also offer significant value to researchers modelling melt and firn hydrology by quantifying independent flow-constraining variables in terms that can be directly implemented into numerical models. Future interdisciplinary collaborations could evaluate how well simulations replicate observed percolation depths and melt structure characteristics, such as melt saturation, the occurrence of preferential flow paths and small-scale variations of porosity. Such projects would strengthen model validation and extend the application of field-based insights beyond site-specific conditions. The ability of detailed firn melt models to simulate a range of different snowpack and melt–freeze conditions can be used to investigate what drives melt feature appearance going forward.
Finally, this study of melt-induced proxy alterations is a reminder that we urgently need to retrieve the invaluable firn and ice-core climate records from melt-prone locations before the local conditions do not allow for signal preservation anymore.
A1 Ingredients of D2O-enriched dye tracer
-
SWI tracer: D2O – Refer to D2O Safety Data Sheet for detailed handling information.
-
Dye colour: Blue food colouring (based on vegetable glycerine, water, spirulina concentrate)
-
Diluent: Milli-Q water
A2 Stage 1 – Pre-Dilution at BAS, Cambridge
-
Prepare the lab working space and wear protective clothing.
-
Shake D2O ampule (0.75 mL, 99.9 % D2O) to mix thoroughly.
-
Open the ampule:
- 3.1
Tap to settle the liquid.
- 3.2
Clean the ampule exterior with alcohol and let it dry.
- 3.3
Score the ampule if needed, then snap off the top using a wipe. Dispose of the top in sharps waste.
- 3.1
-
Transfer the full 0.75 mL of D2O into a 2000 mL glass bottle with a lid.
-
Add 1000 mL of Milli-Q water and stir until well mixed ().
-
Extract 15 mL aliquots into 15 mL sealable vials. Repeat as needed.
-
Dispose of any remaining pre-diluted tracer according to local waste procedures.
A3 Stage 2 – Final Dilution at the UK NERC Arctic Station, Ny-Ålesund
-
Prepare the lab working space and wear protective clothing.
-
Shake the 15 mL vial of pre-diluted tracer to mix.
-
Transfer the full 15 mL volume into a ≥1000 mL plastic bottle and record its weight.
-
Add 7 g of dye and record total weight.
-
Fill up to 1005 mL with Milli-Q water to produce the final tracer solution.
-
Mix thoroughly.
-
Withdraw a 5 mL subsample to confirm the isotopic signature of the tracer.
-
For smaller-volume experiments (e.g., 500 mL), transfer tracer into separate bottles.
-
Close and label the final tracer bottle for field use. Keep warm until applied in the field.
Table B1Tracer specifications for percolation experiments in this study, including liquid volume, liquid temperature and stable water isotope (SWI) signatures δD and δ18O.
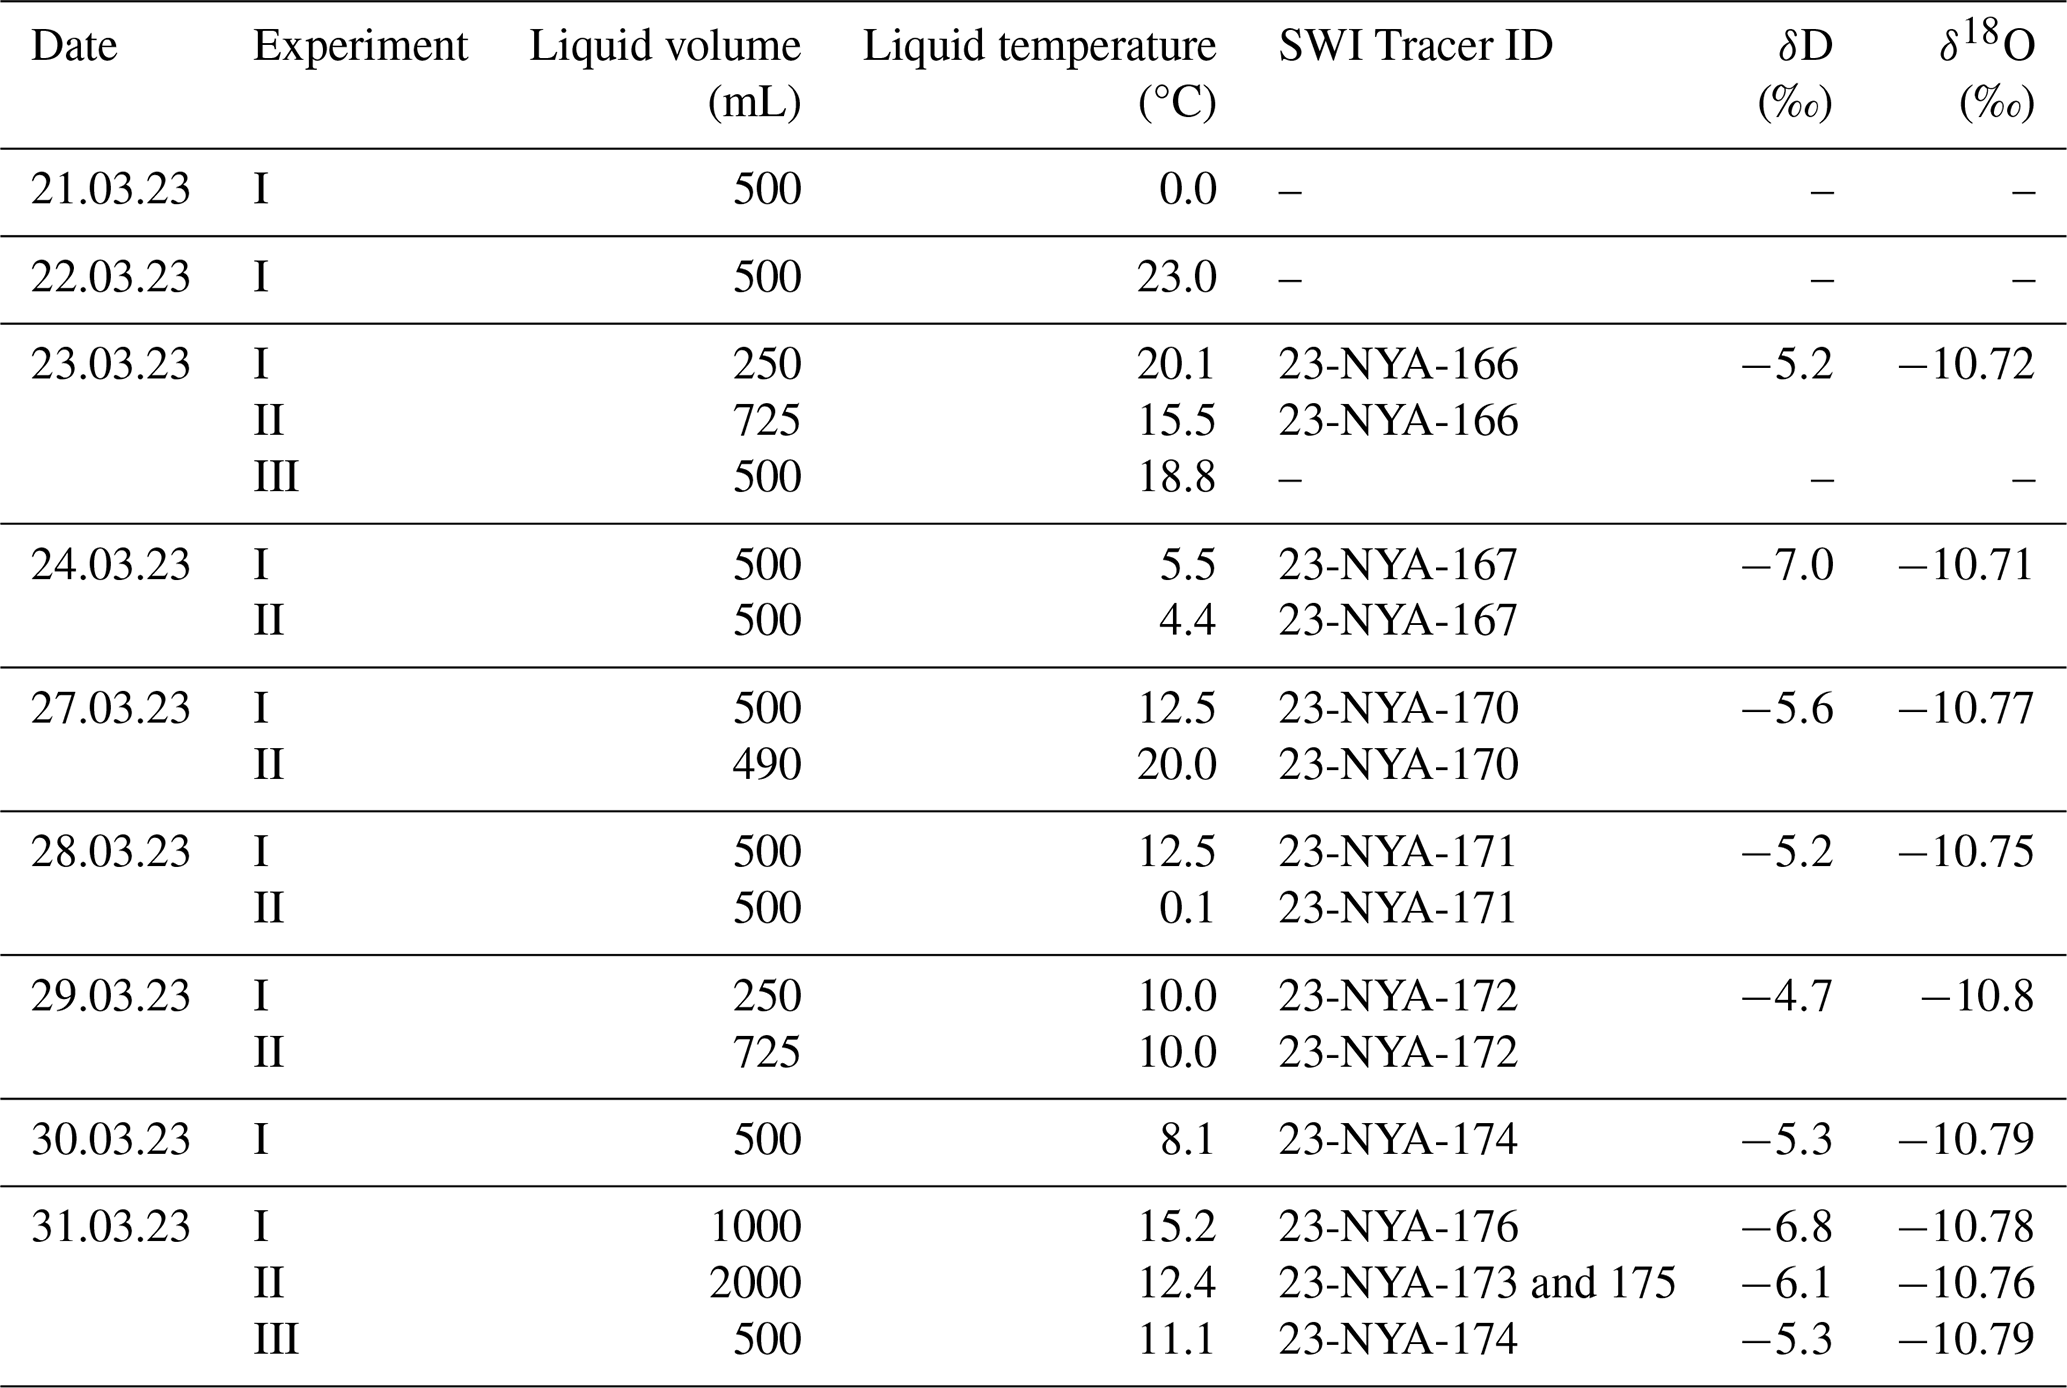
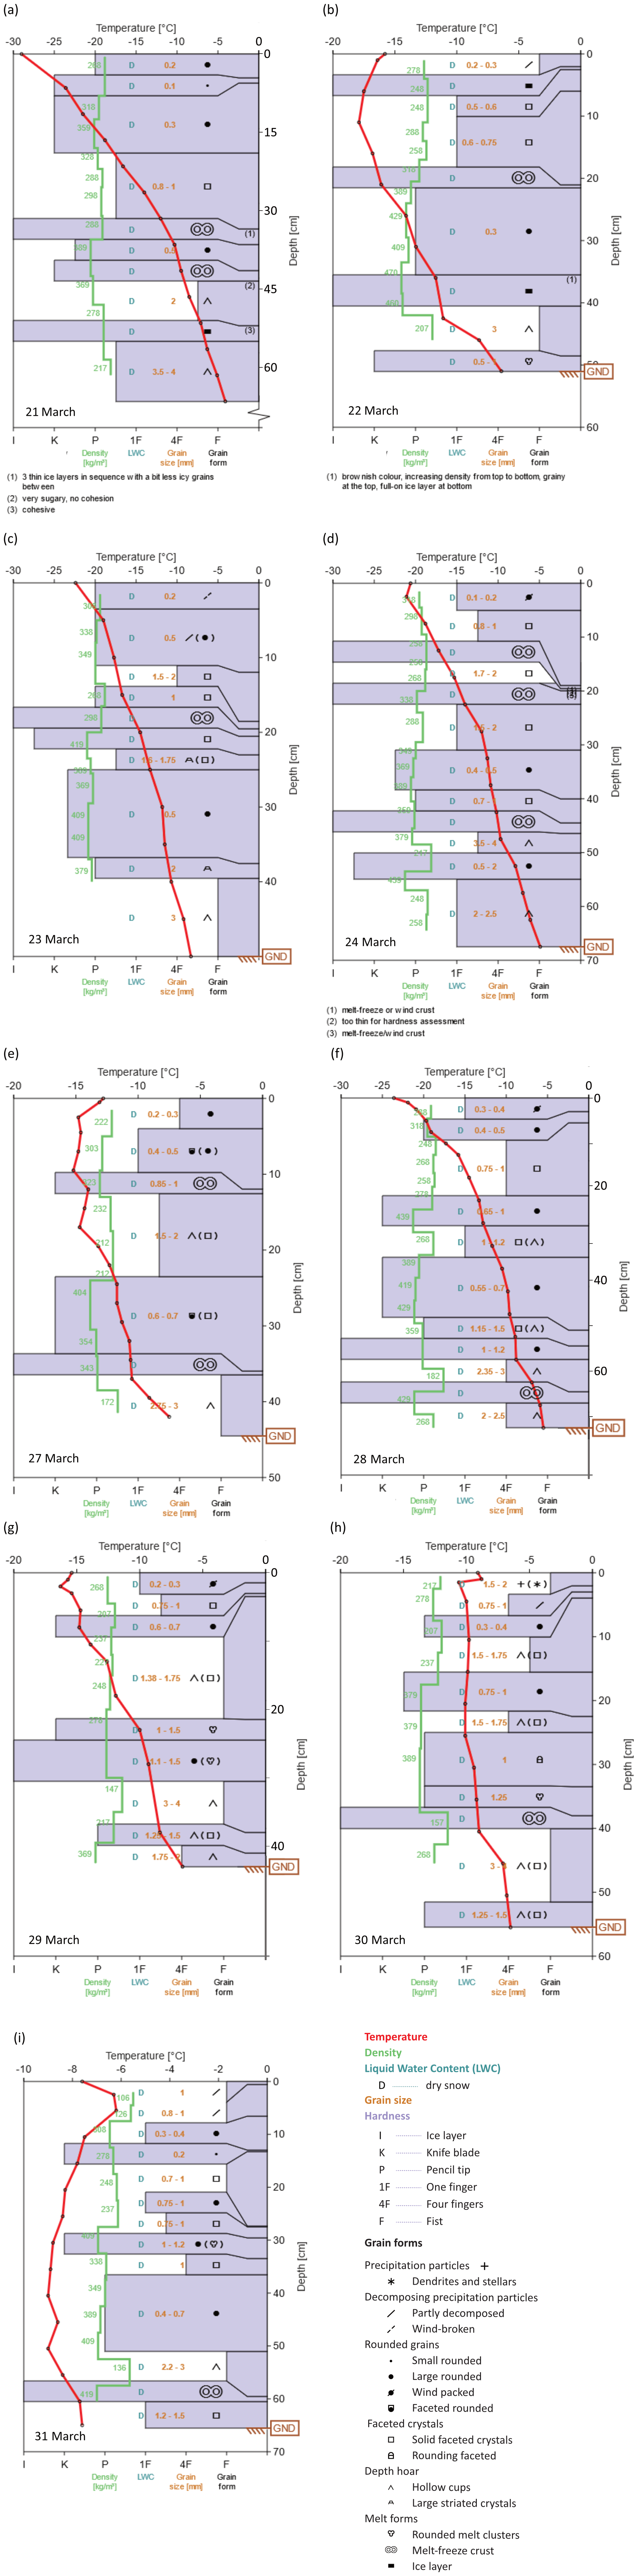
Figure C1Overview of snow profile characteristics prior to melt experiments in March 2023, categories based on Fierz et al. (2009).
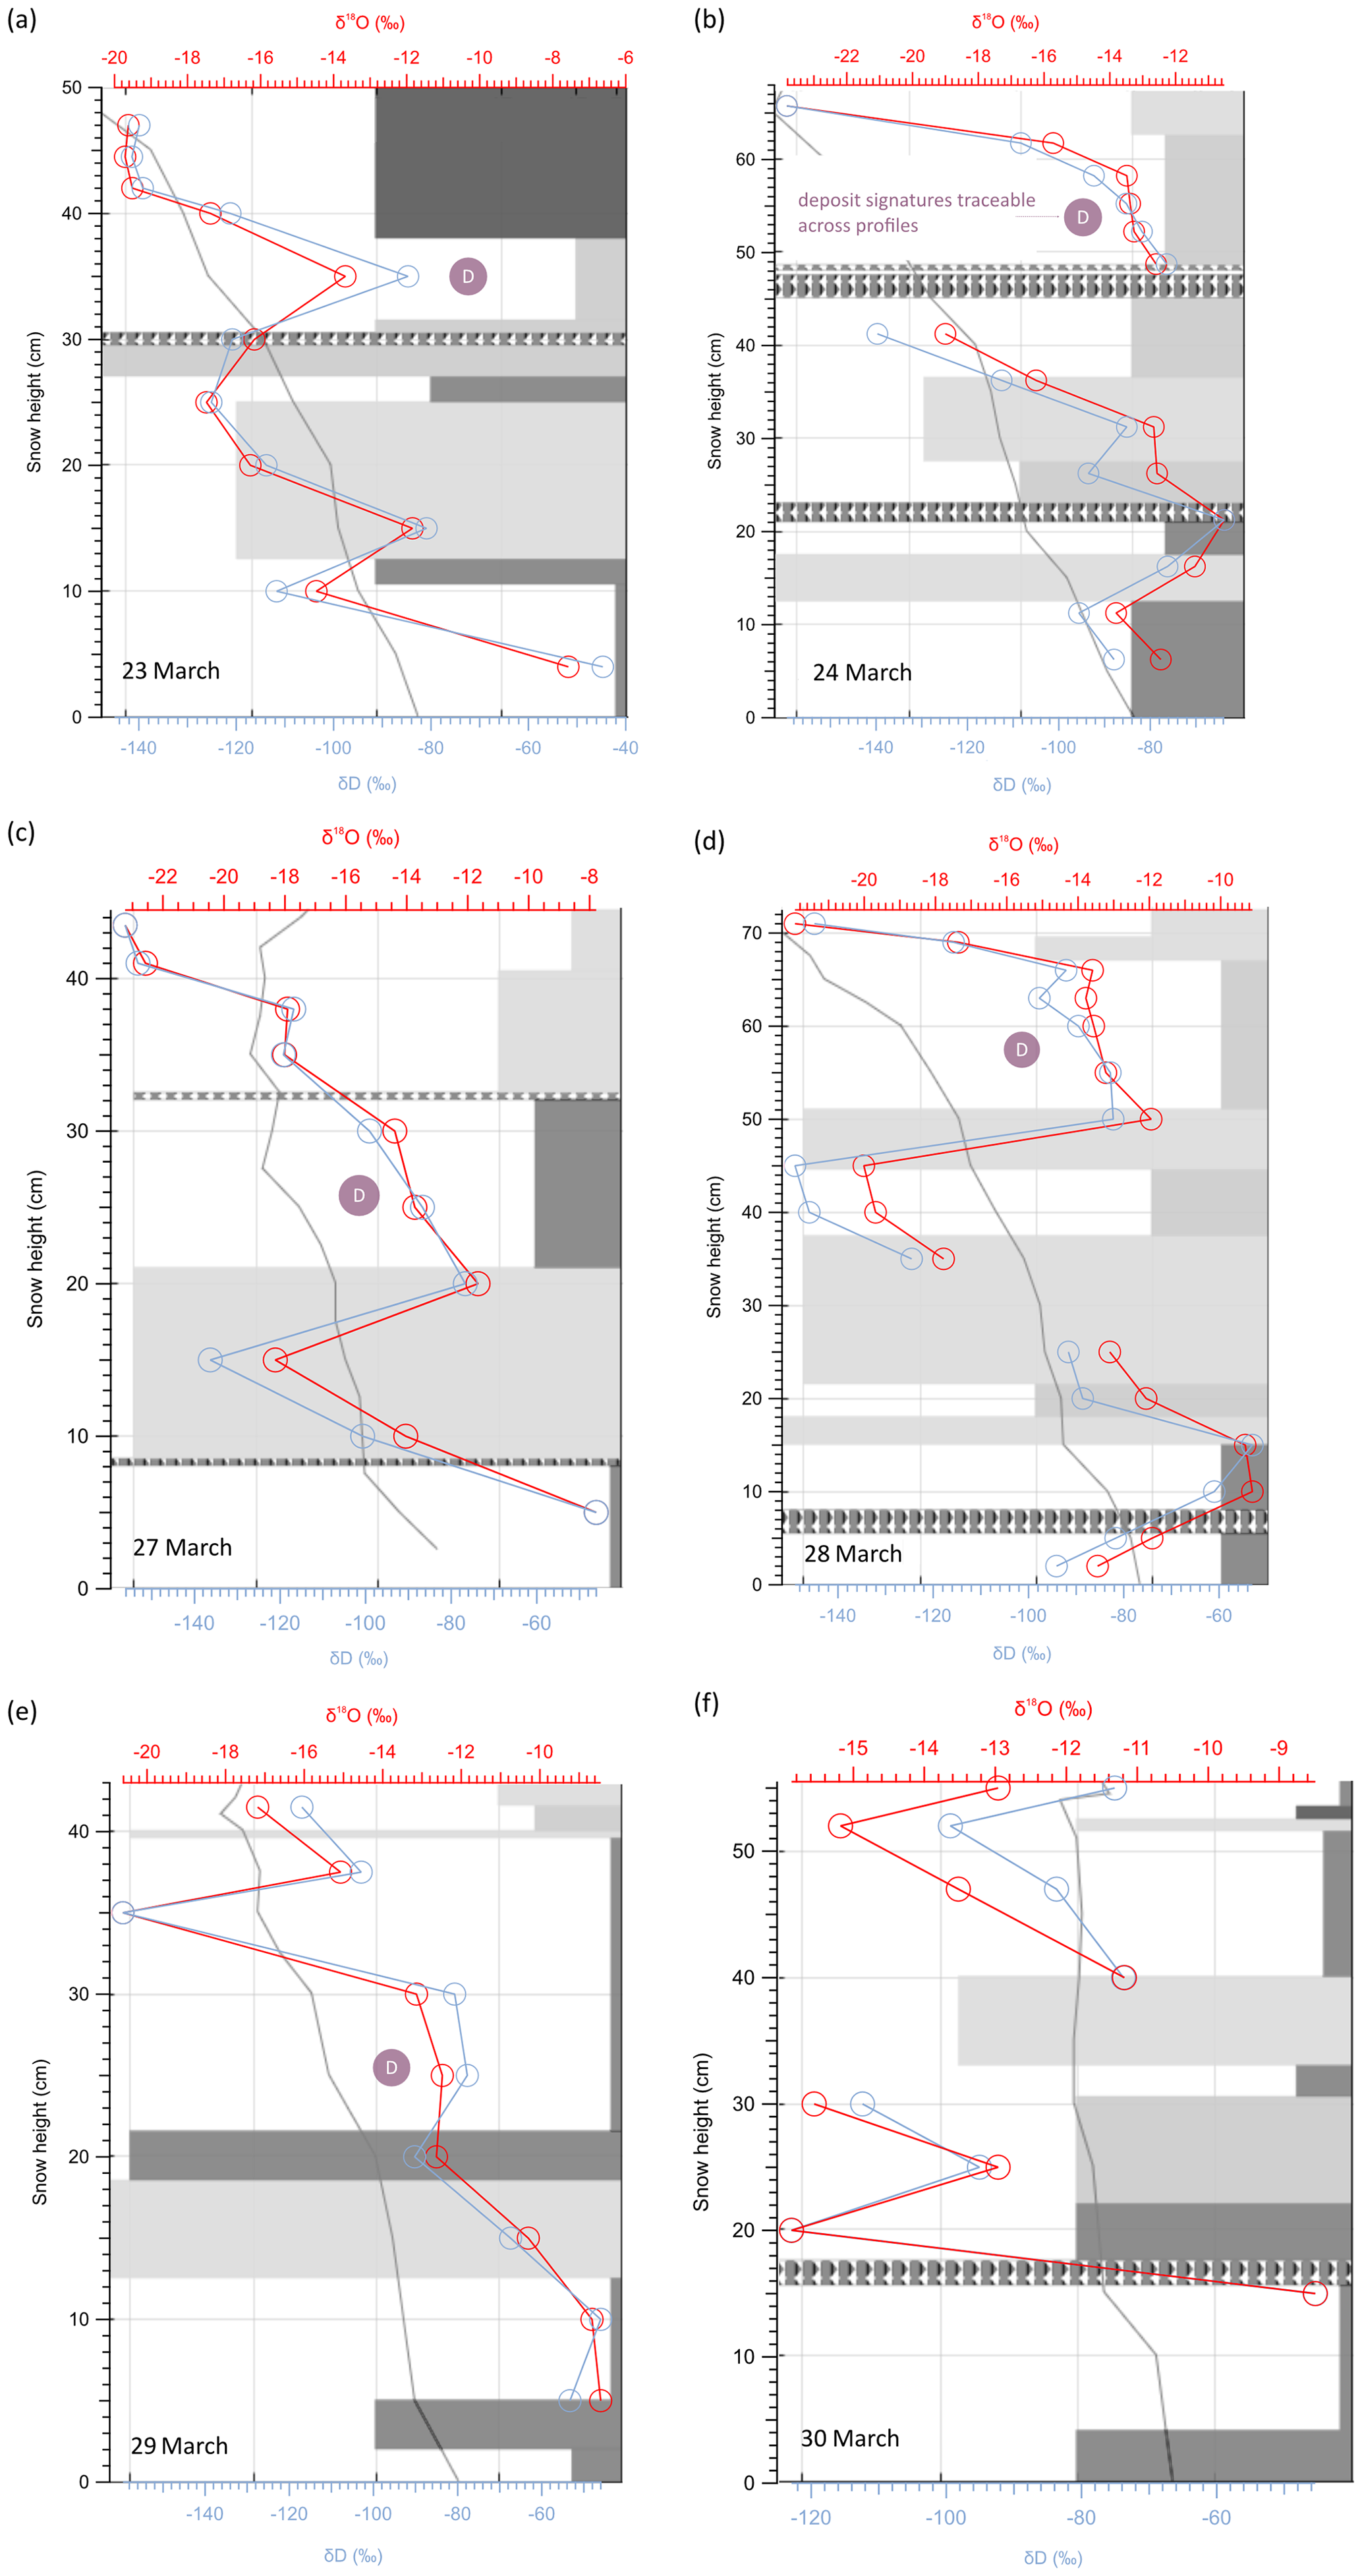
Figure D1Overview of stable water isotope signatures δ18O (red) and δD (blue) with depth prior to melt experiments in March 2023, against the background of grey-coloured stratigraphy based on layer hardness.
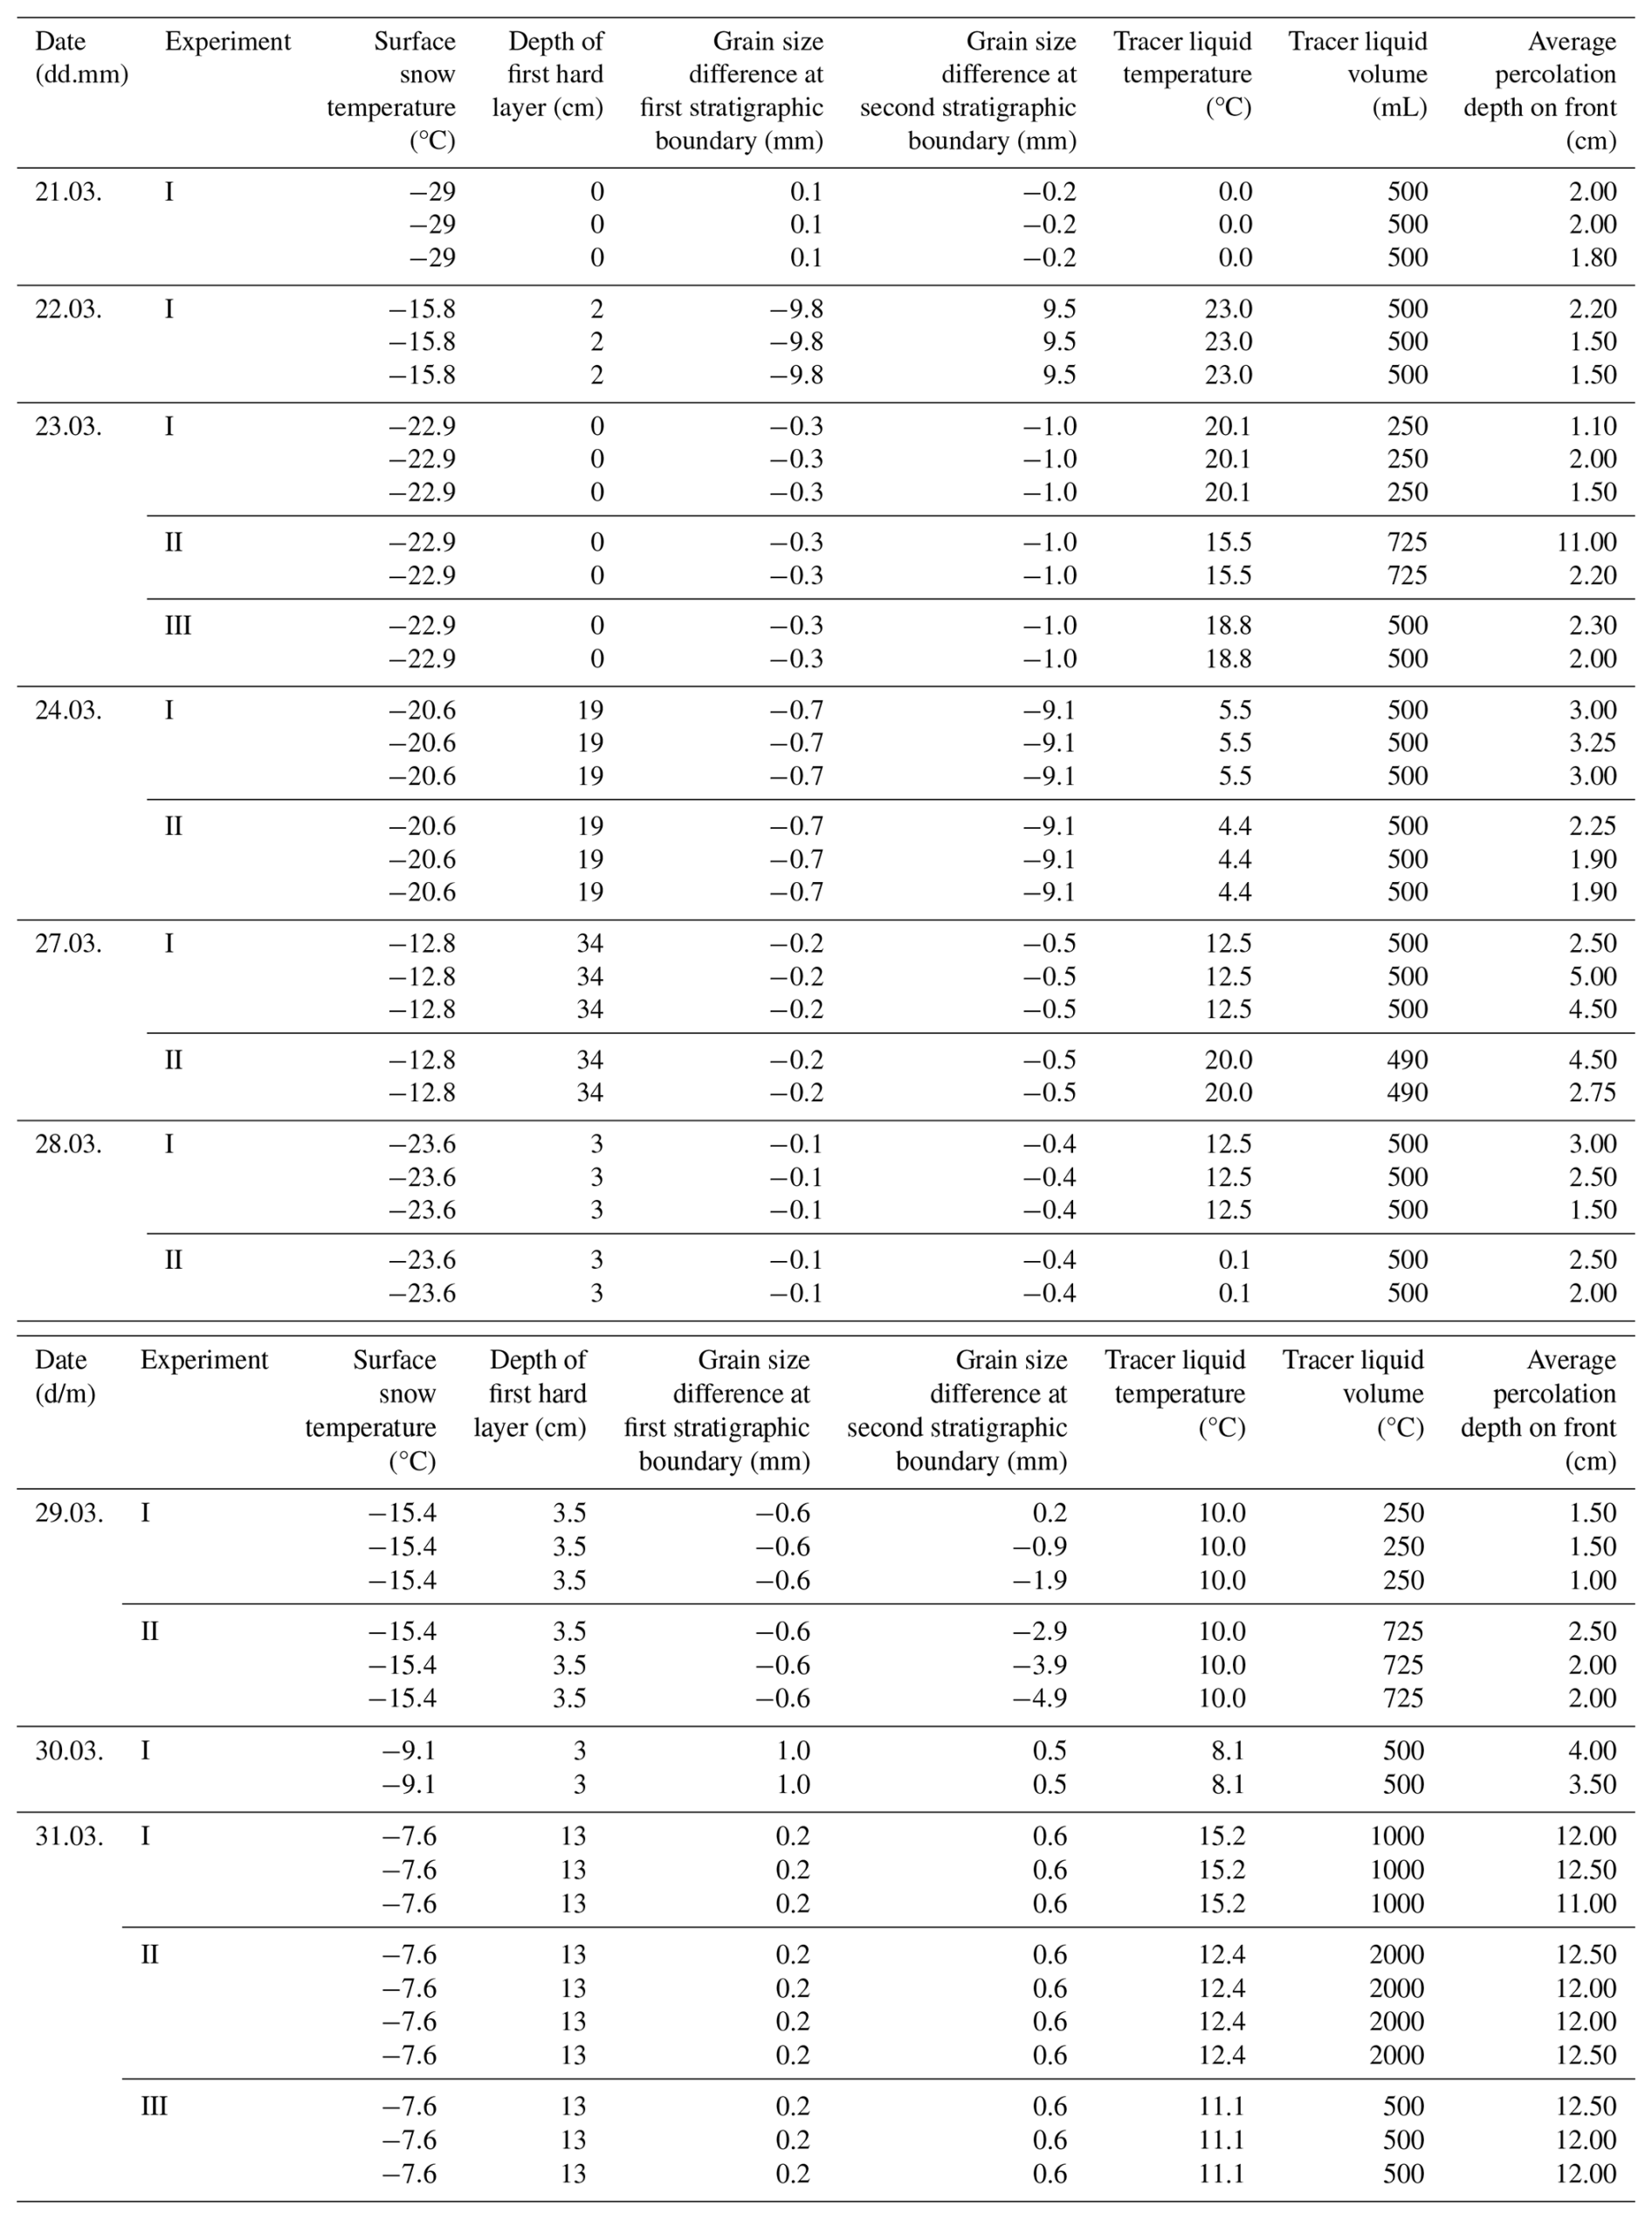
Average percolation depth (dependent variable) was analysed in the light of the following independent variables: surface snow temperature, depth of the first hard layer, grain size differences of adjacent stratigraphic units, as well as temperature and volume of the tracer liquid. First hard layers have been identified based on hardness ≥ pencil. Negative grain size differences indicate fine-to-coarse transitions, positive values correspond to coarse-to-fine transition. The grain size of impenetrable ice layers was defined as 10 mm. Significant variables have been highlighted in bold.
Table E1Summary outcome of the multiple linear regression analysis described in this Appendix E. The factors constraining percolation depth, which have been identified as significant (p<0.05), are highlighted in bold font.
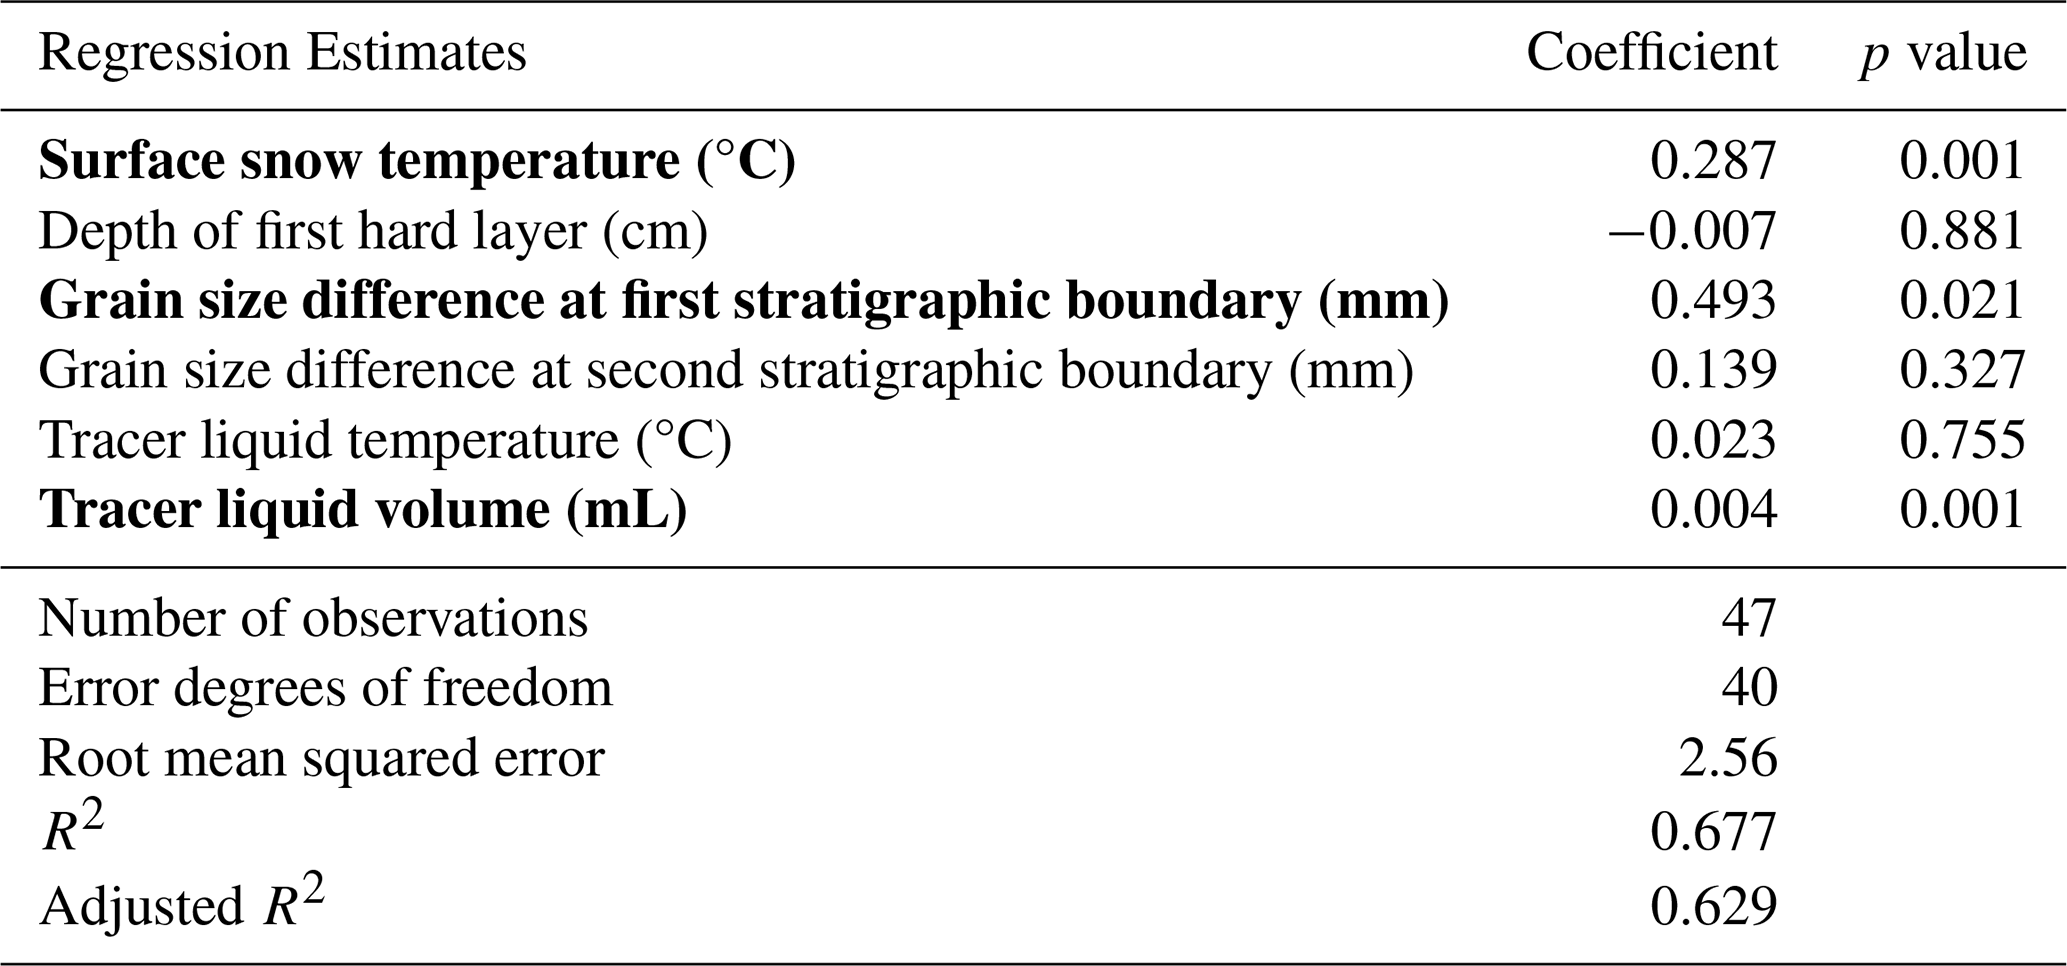
Table E2Tracer percolation experiment information used for the multiple linear regression analysis described in this Appendix E.
The data obtained during the “Wet Fingerprints” field project have been published by Moser et al. (2025a, https://doi.org/10.5285/9cd08043-4498-4688-91d8-bb8a867d9024, b, https://doi.org/10.5285/84bab093-750e-48f5-ae41-1e5824abdecf) and are accessible through the NERC EDS UK Polar Data Centre. Nivometric data used in this study can be obtained upon request from Federico Scoto, CNR-ISP. Figures 1 and 3a contain Svalbard Kartdata (S100) and Svalbard DEM (S0_DTM20) layers by Norwegian Polar Institute (2014a, https://doi.org/10.21334/NPOLAR.2014.645336C7, b, https://doi.org/10.21334/NPOLAR.2014.DCE53A47), licensed under https://creativecommons.org/licenses/by/4.0/ (last access: 27 September 2026).
The time-lapse video obtained as part of the “Wet Fingerprints” field project on 31 March 2023 has been published by Moser et al. (2025c, https://doi.org/10.5285/62b9e5c5-190a-4137-ad95-3565e99395fe) and is accessible through the NERC EDS UK Polar Data Centre.
This study was designed by DEB, ERT, and AS. Tracer percolation experiments were prepared and conducted by DEB. Field operations were supported by ERT, AS, and FS. Long-term snow monitoring data acquired by CNR-ISP using the Automatic Nivometric Station were provided by FS. The stable water isotope measurements in the BAS ice core laboratory, data analysis, interpretation and preparation of the first paper draft were conducted by DEB. All authors contributed to writing and editing the final manuscript.
The contact author has declared that none of the authors has any competing interests.
Publisher's note: Copernicus Publications remains neutral with regard to jurisdictional claims made in the text, published maps, institutional affiliations, or any other geographical representation in this paper. The authors bear the ultimate responsibility for providing appropriate place names. Views expressed in the text are those of the authors and do not necessarily reflect the views of the publisher.
The authors of this study would like to warmly thank Jean-Charles Gallet at the Norwegian Polar Institute for assisting with refining the experiment proposal, preparing fieldwork logistics and managing this project. The authors would also like to thank the NERC Arctic Station team, especially Iain Rudkin and Guy Hillyard, for their persistent hands-on support during this fieldwork campaign. Furthermore, the authors are grateful for the collaboration with staff of Dirigibile during our field campaign. The authors also appreciate the support of: Markus Frey, who provided snow pit measurement equipment; Thomas Bauska, who supervised the preparation of tracer liquids; and Rob Mulvaney, who assisted with the Picarro measurements at BAS. Finally, we would also like to thank Stephen Warren and the anonymous second reviewer for their time and valuable suggestions, which helped to improve the quality of this manuscript.
This research project has been supported financially by an Arctic Field Grant of Norges Forskningsråd (RiS ID 12132, grant no. 342165) and through in-kind support of the NERC Arctic Station. Dorothea Moser further received PhD research funding by BAS and the NERC C-CLEAR Doctoral Training Partnership (grant no. NE/S007164/1). The funders did not influence the study design, data analysis, interpretation of results, or paper preparation.
This paper was edited by Sebastian Gerland and reviewed by Stephen Warren and one anonymous referee.
Avanzi, F., Hirashima, H., Yamaguchi, S., Katsushima, T., and De Michele, C.: Observations of capillary barriers and preferential flow in layered snow during cold laboratory experiments, The Cryosphere, 10, 2013–2026, https://doi.org/10.5194/tc-10-2013-2016, 2016.
Beria, H., Larsen, J. R., Ceperley, N. C., Michelon, A., Vennemann, T., and Schaefli, B.: Understanding snow hydrological processes through the lens of stable water isotopes, Wiley Interdisciplinary Reviews: Water, 5, 1–23, https://doi.org/10.1002/wat2.1311, 2018.
Bøggild, C. E.: Preferential Flow and Melt Water Retention in Cold Snow Packs in West-Greenland, Nord. Hydrol., 31, 287–300, https://doi.org/10.2166/nh.2000.0017, 2000.
Brown, R., Vikhamar Schuler, D., Bulygina, O., Derksen, C., Luojus, K., Mudryk, L., Wang, L., and Yang, D.: Arctic terrestrial snow cover, in: Snow, Water, Ice and Permafrost in the Arctic (SWIPA) 2017, Arctic Monitoring and Assessment Programme (AMAP), Oslo, Norway, 26–55, ISBN 978-82-7971-101-8, 2017.
Christianson, K., Kohler, J., Alley, R. B., Nuth, C., and Van Pelt, W. J. J.: Dynamic perennial firn aquifer on an Arctic glacier, Geophys. Res. Lett., 42, 1418–1426, https://doi.org/10.1002/2014GL062806, 2015.
Clerx, N., Machguth, H., Tedstone, A., Jullien, N., Wever, N., Weingartner, R., and Roessler, O.: In situ measurements of meltwater flow through snow and firn in the accumulation zone of the SW Greenland Ice Sheet, The Cryosphere, 16, 4379–4401, https://doi.org/10.5194/tc-16-4379-2022, 2022.
Culberg, R., Schroeder, D. M., and Chu, W.: Extreme melt season ice layers reduce firn permeability across Greenland, Nat. Commun., 12, 1–9, https://doi.org/10.1038/s41467-021-22656-5, 2021.
Divine, D., Isaksson, E., Martma, T., Meijer, H. A. J., Moore, J., Pohjola, V., van de Wal, R. S. W., and Godtliebsen, F.: Thousand years of winter surface air temperature variations in Svalbard and northern norway reconstructed from ice-core data, Polar Res., 30, https://doi.org/10.3402/polar.v30i0.7379, 2011.
Eckerstorfer, M. and Christiansen, H.: The “high arctic maritime snow climate” in Central svalbard, Arct. Antarct. Alp. Res., 43, 11–21, https://doi.org/10.1657/1938-4246-43.1.11, 2011.
Fierz, C., Armstrong, R., Durand, Y., Etchevers, P., Greene, E., McClung, D., Nishimura, K., Satyawali, P., and Sokratov, S.: The International Classification for Seasonal Snow on the Ground, in: IHP-VII Technical Documents in Hydrology N83, vol. IACS Contribution N1, UNESCO-IHP, Paris, 1–90, https://unesdoc.unesco.org/ark:/48223/pf0000186462 (last access: 27 September 2026), 2009.
Gallet, J.-C., Björkman, M., Borstad, C., Hodson, A., Jacobi, H.-W., Larose, C., Luks, B., Spolaor, A., Urazgildeeva, A., and Zdanowicz, C.: Snow research in Svalbard: current status and knowledge gaps, in: SESS Report 2018, edited by: Orr, E., Hansen, G., Lappalainen, H., Hübner, C., and Lihavainen, H., Svalbard Integrated Arctic Earth Observing System, Longyearbyen, 217, https://doi.org/10.5281/zenodo.4778366, 2019.
Geyman, E. C., van Pelt, W. J. J., Maloof, A. C., Aas, H. F., and Kohler, J.: Historical glacier change on Svalbard predicts doubling of mass loss by 2100, Nature, 601, 374–379, https://doi.org/10.1038/s41586-021-04314-4, 2022.
Gkinis, V., Popp, T. J., Blunier, T., Bigler, M., Schüpbach, S., Kettner, E., and Johnsen, S. J.: Water isotopic ratios from a continuously melted ice core sample, Atmos. Meas. Tech., 4, 2531–2542, https://doi.org/10.5194/amt-4-2531-2011, 2011.
Graham, R. M., Cohen, L., Petty, A. A., Boisvert, L. N., Rinke, A., Hudson, S. R., Nicolaus, M., and Granskog, M. A.: Increasing frequency and duration of Arctic winter warming events, Geophys. Res. Lett., 44, 6974–6983, https://doi.org/10.1002/2017GL073395, 2017.
Gupta, P., Noone, D., Galewsky, J., Sweeney, C., and Vaughn, B. H.: Demonstration of high-precision continuous measurements of water vapor isotopologues in laboratory and remote field deployments using wavelength-scanned cavity ring-down spectroscopy (WS-CRDS) technology, Rapid Commun. Mass Sp., 23, 2534–2542, https://doi.org/10.1002/rcm.4100, 2009.
Hansen, B. B., Isaksen, K., Benestad, R. E., Kohler, J., Pedersen, Å., Loe, L. E., Coulson, S. J., Larsen, J. O., and Varpe, Ø.: Warmer and wetter winters: Characteristics and implications of an extreme weather event in the High Arctic, Environ. Res. Lett., 9, https://doi.org/10.1088/1748-9326/9/11/114021, 2014.
Hanssen-Bauer, I., Førland, E. J., Hisdal, H., Mayer, S., Sandø, A. B., and Sorteberg, A.: Climate in Svalbard 2100 – a knowledge base for climate adaptation, 1–208, Norwegian Centre for Climate Services, ISSN: 2387-3027, https://klimaservicesenter.no/kss/rapporter/klima-pa-svalbard-2100 (last access: 27 September 2026), 2019.
Harrington, R. F., Bales, R. C., and Wagnon, P.: Variability of meltwater and solute fluxes from homogeneous melting snow at the laboratory scale, Hydrol. Process., 10, 945–953, https://doi.org/10.1002/(SICI)1099-1085(199607)10:7<945::AID-HYP349>3.0.CO;2-S, 1996.
Hawrylak, M. and Nilsson, E.: Spatial and Temporal Variations in a Perennial Firn Aquifer on Lomonosovfonna, Svalbard, Bachelor Thesis, Uppsala University, Uppsala, 1–33, https://www.diva-portal.org/smash/get/diva2:1319193/FULLTEXT01.pdf (last access: 27 September 2026), 2019.
Hirashima, H., Avanzi, F., and Wever, N.: Wet-Snow Metamorphism Drives the Transition From Preferential to Matrix Flow in Snow, Geophys. Res. Lett., 46, 14548–14557, https://doi.org/10.1029/2019GL084152, 2019.
Huber, C. J., Eichler, A., Mattea, E., Brütsch, S., Jenk, T. M., Gabrieli, J., Barbante, C., and Schwikowski, M.: High-altitude glacier archives lost due to climate change-related melting, Nat. Geosci., 17, 110–113, https://doi.org/10.1038/s41561-023-01366-1, 2024.
Ice Memory Foundation: 2023. Holtedahlfonna – Svalbard/Norway, https://www.ice-memory.org/collecting-ice-cores/2023-svalbard-norway/ (last access: 27 September 2026), 2023.
Innanen, S., Hock, R., Schmidt, L. S., Schuler, T. V., Covi, F., and Moholdt, G.: Witnessing the transition from cold to temperate firn on Austfonna ice cap, Svalbard, through observations and model simulations, J. Glaciol., 71, https://doi.org/10.1017/jog.2025.10072, 2025.
Isaksson, E., Hermanson, M., Hicks, S., Igarashi, M., Kamiyama, K., Moore, J., Motoyama, H., Muir, D., Pohjola, V., Vaikmäe, R., van de Wal, R. S. W., and Watanabe, O.: Ice cores from Svalbard – Useful archives of past climate and pollution history, Phys. Chem. Earth, 28, 1217–1228, https://doi.org/10.1016/j.pce.2003.08.053, 2003.
Isaksson, E., Kohler, J., Pohjola, V., Moore, J., Igarashi, M., Karlofj, L., Martma, T., Meijer, H., Motoyama, H., Vaikm, R., and Van De Wal7, R. S. W.: Two ice-core d180 records from Svalbard illustrating climate and sea-ice variability over the last 400 years, Holocene, 15, 501–509, https://doi.org/10.1191/0959683605HL820RP, 2005.
Juras, R., Pavlásek, J., Vitvar, T., Šanda, M., Holub, J., Jankovec, J., and Linda, M.: Isotopic tracing of the outflow during artificial rain-on-snow event, J. Hydrol. (Amst.), 541, 1145–1154, https://doi.org/10.1016/j.jhydrol.2016.08.018, 2016.
Juras, R., Würzer, S., Pavlásek, J., Vitvar, T., and Jonas, T.: Rainwater propagation through snowpack during rain-on-snow sprinkling experiments under different snow conditions, Hydrol. Earth Syst. Sci., 21, 4973–4987, https://doi.org/10.5194/hess-21-4973-2017, 2017.
Katsushima, T., Yamaguchi, S., Kumakura, T., and Sato, A.: Experimental analysis of preferential flow in dry snowpack, Cold Reg. Sci. Technol., 85, 206–216, https://doi.org/10.1016/j.coldregions.2012.09.012, 2013.
Katsushima, T., Adachi, S., Yamaguchi, S., Ozeki, T., and Kumakura, T.: Nondestructive three-dimensional observations of flow finger and lateral flow development in dry snow using magnetic resonance imaging, Cold Reg. Sci. Technol., 170, https://doi.org/10.1016/j.coldregions.2019.102956, 2020.
Lee, J., Feng, X., Faiia, A. M., Posmentier, E. S., Kirchner, J. W., Osterhuber, R., and Taylor, S.: Isotopic evolution of a seasonal snowcover and its melt by isotopic exchange between liquid water and ice, Chem. Geol., 270, 126–134, https://doi.org/10.1016/j.chemgeo.2009.11.011, 2010a.
Lee, J., Feng, X., Faiia, A., Posmentier, E., Osterhuber, R., and Kirchner, J.: Isotopic evolution of snowmelt: A new model incorporating mobile and immobile water, Water Resour. Res., 46, 1–12, https://doi.org/10.1029/2009WR008306, 2010b.
MacDonell, S., Fernandoy, F., Villar, P., and Hammann, A.: Stratigraphic Analysis of Firn Cores from an Antarctic Ice Shelf Firn Aquifer, Water (Switzerland), 13, 731, https://doi.org/10.3390/w13050731, 2021.
Maturilli, M. and Kayser, M.: Arctic warming, moisture increase and circulation changes observed in the Ny-Ålesund homogenized radiosonde record, Theor. Appl. Climatol., 130, 1–17, https://doi.org/10.1007/s00704-016-1864-0, 2017.
Maturilli, M., Hanssen-Bauer, I., Neuber, R., Rex, M., and Edvardsen, K.: The Atmosphere Above Ny-Ålesund: Climate and Global Warming, Ozone and Surface UV Radiation, in: The Ecosystem of Kongsfjorden, Svalbard, edited by: Hop, H. and Wiencke, C., Springer International Publishing, Cham, 23–46, https://doi.org/10.1007/978-3-319-46425-1_2, 2019.
Moran, T. and Marshall, S.: The effects of meltwater percolation on the seasonal isotopic signals in an Arctic snowpack, J. Glaciol., 55, 1012–1024, https://doi.org/10.3189/002214309790794896, 2009.
Moran, T., Marshall, S. J., and Sharp, M. J.: Isotope thermometry in melt-affected ice cores, J. Geophys. Res.-Earth, 116, https://doi.org/10.1029/2010JF001738, 2011.
Moser, D. E.: Advances in understanding melt-affected firn and ice cores from the polar regions, Apollo – University of Cambridge Repository, Cambridge, 1–214, https://doi.org/10.17863/CAM.120980, 2025.
Moser, D. E., Jackson, S., Kjær, H. A., Markle, B. R., Ngoumtsa, E., Pedro, J. B., Segato, D., Spolaor, A., Tetzner, D., Vallelonga, P., and Thomas, E. R.: An Age Scale for the First Shallow (Sub-)Antarctic Ice Core from Young Island, Northwest Ross Sea, Geosciences (Basel), 11, 1–18, https://doi.org/10.3390/geosciences11090368, 2021.
Moser, D. E., Thomas, E. R., Nehrbass-Ahles, C., Eichler, A., and Wolff, E.: Review article: Melt-affected ice cores for polar research in a warming world, The Cryosphere, 18, 2691–2718, https://doi.org/10.5194/tc-18-2691-2024, 2024.
Moser, D. E., Gallet, J.-C., Thomas, E., Spolaor, A., and Scoto, F.: In-situ tracer percolation experiments: conditions, results, and alteration of stable water isotope signatures in the seasonal snow near Ny-Alesund, Svalbard, in March 2023 (Version 1.0), NERC EDS UK Polar Data Centre [data set], https://doi.org/10.5285/9cd08043-4498-4688-91d8-bb8a867d9024, 2025a.
Moser, D. E., Gallet, J.-C., Thomas, E., Spolaor, A., and Scoto, F.: Snow temperature, stratigraphy, density, and stable water isotope profiles from the seasonal snowpack near Ny-Alesund, Svalbard, in March 2023 (Version 1.0), NERC EDS UK Polar Data Centre [data set], https://doi.org/10.5285/84bab093-750e-48f5-ae41-1e5824abdecf, 2025b.
Moser, D. E., Gallet, J.-C., Thomas, E. R., Spolaor, A., and Scoto, F.: Time-lapse video of tracer percolation experiment in Svalbard seasonal snowpack, Ny-Alesund March 2023 (Version 1.0), NERC EDS UK Polar Data Centre [video and data set], https://doi.org/10.5285/62b9e5c5-190a-4137-ad95-3565e99395fe, 2025c.
Moure, A., Jones, N., Pawlak, J., Meyer, C., and Fu, X.: A Thermodynamic Nonequilibrium Model for Preferential Infiltration and Refreezing of Melt in Snow, Water Resour. Res., 59, https://doi.org/10.1029/2022WR034035, 2023.
Norwegian Polar Institute: Kartdata Svalbard 1:100 000 (S100 Kartdata)/Map Data, Norwegian Polar Institute [data set], https://doi.org/10.21334/NPOLAR.2014.645336C7, 2014a.
Norwegian Polar Institute: Terrengmodell Svalbard (S0 Terrengmodell), Norwegian Polar Institute [data set], https://doi.org/10.21334/NPOLAR.2014.DCE53A47, 2014b.
Osmont, D., Wendl, I. A., Schmidely, L., Sigl, M., Vega, C. P., Isaksson, E., and Schwikowski, M.: An 800-year high-resolution black carbon ice core record from Lomonosovfonna, Svalbard, Atmos. Chem. Phys., 18, 12777–12795, https://doi.org/10.5194/acp-18-12777-2018, 2018.
Pedersen, Å. Ø., Convey, P., Newsham, K. K., Mosbacher, J. B., Fuglei, E., Ravolainen, V., Hansen, B. B., Jensen, T. C., Augusti, A., Biersma, E. M., Cooper, E. J., Coulson, S. J., Gabrielsen, G. W., Gallet, J. C., Karsten, U., Kristiansen, S. M., Svenning, M. M., Tveit, A. T., Uchida, M., Baneschi, I., Calizza, E., Cannone, N., de Goede, E. M., Doveri, M., Elster, J., Giamberini, M. S., Hayashi, K., Lang, S. I., Lee, Y. K., Nakatsubo, T., Pasquali, V., Paulsen, I. M. G., Pedersen, C., Peng, F., Provenzale, A., Pushkareva, E., Sandström, C. A. M., Sklet, V., Stach, A., Tojo, M., Tytgat, B., Tømmervik, H., Velazquez, D., Verleyen, E., Welker, J. M., Yao, Y. F., and Loonen, M. J. J. E.: Five decades of terrestrial and freshwater research at Ny-Ålesund, Svalbard, https://doi.org/10.33265/polar.v41.6310, 2022.
Peeters, B., Pedersen, Å. Ø., Loe, L. E., Isaksen, K., Veiberg, V., Stien, A., Kohler, J., Gallet, J. C., Aanes, R., and Hansen, B. B.: Spatiotemporal patterns of rain-on-snow and basal ice in high Arctic Svalbard: Detection of a climate-cryosphere regime shift, Environ. Res. Lett., 14, https://doi.org/10.1088/1748-9326/aaefb3, 2019.
Pfeffer, W. T. and Humphrey, N. F.: Formation of ice layers by infiltration and refreezing of meltwater, Ann. Glaciol., 26, 83–91, https://doi.org/10.3189/1998aog26-1-83-91, 1998.
Schuler, T. V: Svalbard impact assessment forcing dataset, version 1, Oslo, 1–119, https://doi.org/10.11582/2018.00006, 2018.
Scoto, F., Pappaccogli, G., Mazzola, M., Donateo, A., Salzano, R., Monzali, M., de Blasi, F., Larose, C., Gallet, J. C., Decesari, S., and Spolaor, A.: Automated observation of physical snowpack properties in Ny-Ålesund, Front. Earth Sci. (Lausanne)., 11, https://doi.org/10.3389/feart.2023.1123981, 2023.
Sobota, I., Weckwerth, P., and Grajewski, T.: Rain-On-Snow (ROS) events and their relations to snowpack and ice layer changes on small glaciers in Svalbard, the high Arctic, J. Hydrol. (Amst.), 590, https://doi.org/10.1016/j.jhydrol.2020.125279, 2020.
Spolaor, A., Varin, C., Pedeli, X., Christille, J. M., Kirchgeorg, T., Giardi, F., Cappelletti, D., Turetta, C., Cairns, W. R. L., Gambaro, A., Bernagozzi, A., Gallet, J. C., Björkman, M. P., and Barbaro, E.: Source, timing and dynamics of ionic species mobility in the Svalbard annual snowpack, Sci. Total Environ., 751, https://doi.org/10.1016/j.scitotenv.2020.141640, 2021.
Spolaor, A., Scoto, F., Larose, C., Barbaro, E., Burgay, F., Bjorkman, M. P., Cappelletti, D., Dallo, F., de Blasi, F., Divine, D., Dreossi, G., Gabrieli, J., Isaksson, E., Kohler, J., Martma, T., Schmidt, L. S., Schuler, T. V., Stenni, B., Turetta, C., Luks, B., Casado, M., and Gallet, J.-C.: Climate change is rapidly deteriorating the climatic signal in Svalbard glaciers, The Cryosphere, 18, 307–320, https://doi.org/10.5194/tc-18-307-2024, 2024.
Thompson, L. G., Davis, M. E., Mosley-Thompson, E., Porter, S. E., Corrales, G. V., Shuman, C. A., and Tucker, C. J.: The impacts of warming on rapidly retreating high-altitude, low-latitude glaciers and ice core-derived climate records, Global Planet. Change, 203, https://doi.org/10.1016/j.gloplacha.2021.103538, 2021.
Vickers, H., Saloranta, T., Køltzow, M., van Pelt, W. J. J., and Malnes, E.: An analysis of winter rain-on-snow climatology in Svalbard, Front. Earth Sci. (Lausanne)., 12, https://doi.org/10.3389/feart.2024.1342731, 2024.
Vikhamar-Schuler, D., Isaksen, K., Haugen, J. E., Tømmervik, H., Luks, B., Schuler, T. V., and Bjerke, J. W.: Changes in winter warming events in the nordic arctic region, J. Climate, 29, 6223–6244, https://doi.org/10.1175/JCLI-D-15-0763.1, 2016.
Waldner, P. A., Schneebeli, M., Schultze-Zimmermann, U., and Flühler, H.: Effect of snow structure on water flow and solute transport, Hydrol. Process., 18, 1271–1290, https://doi.org/10.1002/hyp.1401, 2004.
van den Akker, T., van Pelt, W., Petterson, R., and Pohjola, V. A.: Long-term development of a perennial firn aquifer on the Lomonosovfonna ice cap, Svalbard, The Cryosphere, 19, 1513–1525, https://doi.org/10.5194/tc-19-1513-2025, 2025.
Van Der Wel, L. G., Streurman, H. J., Isaksson, E., Helsen, M. M., Van De Wal, R. S. W., Martma, T., Pohjola, V. A., Moore, J. C., and Meijer, H. A. J.: Using high-resolution tritium profiles to quantify the effects of melt on two Spitsbergen ice cores, J. Glaciol., 57, 1087–1097, https://doi.org/10.3189/002214311798843368, 2011.
Westhoff, J.: Visual Stratigraphy of the EastGRIP Ice Core: Of the Lost Ice Core Orientation, Deformation Structures, Extreme Warm Events, and Trapped Ancient Air, Copenhagen, 1–158, https://nbi.ku.dk/english/theses/phd-theses/julien-westhoff/Westhoff_2021.pdf (last access: 27 September 2026), 2021.
Wong, G. J., Hawley, R. L., Lutz, E. R., and Osterberg, E. C.: Trace-element and physical response to melt percolation in Summit (Greenland) snow, Ann. Glaciol., 54, 52–62, https://doi.org/10.3189/2013AoG63A602, 2013.
Yeo, H., Park, S. J., Kim, B. M., Shiobara, M., Kim, S. W., Kwon, H., Kim, J. H., Jeong, J. H., Park, S. S., and Choi, T.: The observed relationship of cloud to surface longwave radiation and air temperature at Ny-Ålesund, Svalbard, Tellus B, 70, https://doi.org/10.1080/16000889.2018.1450589, 2018.
- Abstract
- Introduction
- Materials and methods
- Results
- Discussion
- Conclusions and outlook
- Appendix A: Instructions for tracer preparation
- Appendix B
- Appendix C:
- Appendix D:
- Appendix E: Multiple linear regression analysis, considering the individual front cuts of the tracer percolation experiments, with the underlying data table on the next page
- Data availability
- Video supplement
- Author contributions
- Competing interests
- Disclaimer
- Acknowledgements
- Financial support
- Review statement
- References
- Abstract
- Introduction
- Materials and methods
- Results
- Discussion
- Conclusions and outlook
- Appendix A: Instructions for tracer preparation
- Appendix B
- Appendix C:
- Appendix D:
- Appendix E: Multiple linear regression analysis, considering the individual front cuts of the tracer percolation experiments, with the underlying data table on the next page
- Data availability
- Video supplement
- Author contributions
- Competing interests
- Disclaimer
- Acknowledgements
- Financial support
- Review statement
- References