the Creative Commons Attribution 4.0 License.
the Creative Commons Attribution 4.0 License.
 | 22 Jan 2026
Dynamics of snow and glacier cover in the Upper Karnali Basin, Nepal: an analysis of its relationship with climatic and topographic parameters
Dibas Shrestha
Raju Chauhan
Amrit Thapa
Til Prasad Pangali Sharma
Krishna Prasad Sharma
Sher Bahadur Gurung
Sundar Devkota
Prabin Bhandari
Sikesh Koirala
Yanhong Wu
Niroj Timalsina
Jeevan Kutu
Snow and glacier cover in the Upper Karnali Basin (UKB) are crucial freshwater reservoirs that support downstream ecosystems and human populations. This study uses remote sensing and GIS data from various sources, including MODIS-derived land surface temperature and ERA5 reanalysis climate datasets, to analyze snow cover dynamics from 2002 to 2024. The results show a significant decrease in snow-covered area (SCA), with an annual decline of approximately 3.99 km2. Seasonal variations indicate the most significant reductions during the monsoon period (July–September), when rising temperatures accelerate snowmelt. The analysis also identifies a strong negative correlation between snow cover and temperature ( to −0.77, p<0.05), with warming trends disproportionately affecting mid- to high-elevation zones (3000–5000 m a.s.l.). Glacier basins exhibit consistent retreat, with the mean glacier area decreasing from 119.05 ha in 2000 to 100.47 ha in 2023, highlighting the impact of climate change. Additionally, snowline analysis shows upward migration, with the 10th-percentile snowline rising at approximately 5.16 m yr−1, indicating progressive snow loss at lower elevations. Given the current warming trends (∼0.0643 °C yr−1 above 5000 m a.s.l.), the UKB could experience a decline in glacier area by 47 %–69 % and snow-covered area by 19 %–30 %. These findings highlight the vulnerability of the UKB's cryosphere to climate change, emphasizing the need for adaptive water resource management strategies to mitigate impacts on hydrology, agriculture, and regional water security.
- Article
(6442 KB) - Full-text XML
-
Supplement
(1122 KB) - BibTeX
- EndNote


Snow and glaciers in the mountains serve as freshwater reservoirs. Their meltwater provides a consistent supply to rivers and downstream ecosystems (Immerzeel et al., 2020; Wester et al., 2019; Pritchard, 2019). The meltwater from Himalayan ice and snow supports the livelihoods of millions across Nepal, India, and China by supplying drinking water, irrigation, hydropower, and ecosystem services (Bolch et al., 2007; Bookhagen and Burbank, 2010). Therefore, a decline in snow and glacier extent threatens water availability, food security, and sustainable development in these regions (Krishnan et al., 2019).
Furthermore, snow and glacial ice regulate regional and global climates by reflecting solar radiation, thereby contributing to the Earth's energy balance and influencing local weather patterns (Xu et al., 2009). Seasonal meltwater sustains ecosystems that provide habitats for numerous animal and plant species in mountainous regions. Consequently, changes in snow cover and glaciers can disrupt these ecosystems entirely (Wester et al., 2019). On both local and regional scales, variations in the amount of snow and ice can contribute to changes in sea level, affecting coastal areas (Forster et al., 2021; Mimura, 2013).
Snow-covered peaks and glaciers are major hubs for adventure, religious, and nature-based tourism (K.C., 2017; Nyaupane and Chhetri, 2009). Being sensitive to climate change, changes in their size and volume not only serve as visible indicators of broader climate trends but also directly threaten the tourism economy they support (Elsasser and Bürki, 2002).
A comprehensive understanding of cryospheric transformations is essential for accurate hydrological forecasting, assessing cryospheric hazards, and developing effective adaptation strategies. Historically, monitoring snow and glacier dynamics in the remote Himalayan regions was limited by a scarcity of in situ observations. Since the 1970s, advances in satellite remote sensing have revolutionized large-scale cryospheric assessments (Kääb et al., 2012; Muhammad and Thapa, 2020). The synergistic integration of satellite-derived data with sophisticated climate models and targeted ground-based measurements has subsequently enabled an improved understanding of snow and glacier mass balance changes, their resultant hydrological impacts, and spatiotemporal variability (Bajracharya et al., 2014; Bolch et al., 2012; Gurung et al., 2017; Kääb et al., 2012; Krishnan et al., 2019; Kulkarni et al., 2021). Collectively, these studies demonstrate substantial snow and glacier loss across the Himalayas, altering river discharge seasonality and water resource availability.
Extensive research on glaciers, glacier lakes, and glacier lake outburst floods (GLOFs) in Nepal has been conducted (Bajracharya and Shrestha, 2011; Hall et al., 2002; Kääb et al., 2005; Shrestha et al., 2012). However, these studies have disproportionately focused on the central and eastern Himalayas. The mid-western and far-western regions remain underrepresented due to their remoteness and limited accessibility (Ghimire et al., 2025a; Khadka et al., 2024). Although global and regional glacier inventories that specifically address high-resolution (≤30 m) glacier cover are limited (Bajracharya et al., 2014; Bolch et al., 2012), analyses of elevation-dependent warming (EDW) and trend assessments are also scarce in the Himalayas (Pepin et al., 2015; Pepin et al., 2022; Desinayak et al., 2022). Furthermore, integrated studies linking glaciers, glacier basins, and snow cover to climate remain underexplored.
Bridging this gap is crucial for understanding cryosphere dynamics and their impacts on hydrology, hazards, and livelihoods in western Nepal. The Karnali Basin, Nepal's largest river basin (approximately 40 780 km2 upstream of the Chisapani gauge station) and home to about 2.5 million people (NSO, 2021), exemplifies this need. Its rivers, fed by snowmelt, provide essential dry-season water for irrigation, drinking, and hydropower. Despite its ecological significance, the basin's cryospheric behavior remains poorly documented.
Findings from studies conducted in the central and eastern Himalayas, the Indian Himalayas, and the Tibetan Plateau cannot be universally applied to the Karnali Basin due to differences in climatic regimes and geographical settings. Understanding the impacts of cryosphere changes on water resources requires research specific to the Karnali Basin. Integrating MODIS data, which offers high temporal resolution, with Landsat data, known for its high spatial resolution, will improve our understanding of snow and glacier changes and their relationships with topography, glacier basins, and climate.
Against this backdrop, the specific objectives of this study are as follows:
-
Quantify the temporal variations in snow and glacier cover in the Upper Karnali Basin from 2000 to 2024 using multi-sensor remote sensing data.
-
Determine the influence of climatic drivers, such as rising temperatures and shifts in precipitation, on the cryospheric dynamics, including the upward migration of the snowline.
The Upper Karnali Basin (UKB) is a transboundary catchment area extending from 28.64 to 30.68° N latitude and 80.64 to 83.54° E longitude, covering 22,577 km2. This region accounts for more than 50 % of the entire Karnali Basin upstream of the Chisapani gauge station (225 m above sea level). It includes about 66 % of the basin's glacierized area (Bajracharya and Shrestha., 2011; Ghimire et al., 2025a). The UKB includes the Humla Karnali (partly within Tibet, China), Mugu Karnali, Kawari, and Tila Nadi sub-basins (see Fig. 1).
The elevation ranges from 340 to 7030 m, with an alpine zone above 4000 m extending across the Middle Mountains, High Mountains, High Himalaya, and the Tibetan Plateau. These regions encompass the geological units known as the Lesser Himalaya, Higher Himalaya, and Tethys Himalaya (LRMP, 1986; Dhital, 2015). This topographic and lithological diversity significantly influences climatic gradients and cryospheric processes.
The climate varies from polar tundra in the glacier regions to subtropical, temperate, and cold climates below 4000 m. Mean annual temperatures range from 27 to −12 °C, while precipitation varies from 250 mm in rain-shadow areas to approximately 1900 mm annually on the rain-bearing slopes. The cryosphere extends across both rainy and rain-shadow regions, influencing the distribution and mass balance of snow and glaciers.
The Upper Karnali Basin features a diverse landscape of snow-covered glaciers, valleys, permafrost, alpine meadows, and forests, supporting a rich variety of flora and fauna. It represents a cultural blend of Khas and Tibetan traditions and is an emerging tourist destination, including a stop on the Kailash Mansarovar pilgrimage route. The basin has an estimated population of approximately 816 941 people, with a density of 36.2 persons per square kilometer, residing in 4395 settlements, primarily below 4000 m in elevation. The Human Development Index in the area is 0.49, which is below the national average.
Due to its climatic, geological, and cryospheric diversity, the Upper Karnali Basin represents the broader Himalayan environment. It serves as an ideal natural laboratory for studying spatial variations in snow- and glacier-covered areas, elevation-dependent warming, and hydro-cryospheric changes across far- and mid-western Nepal.
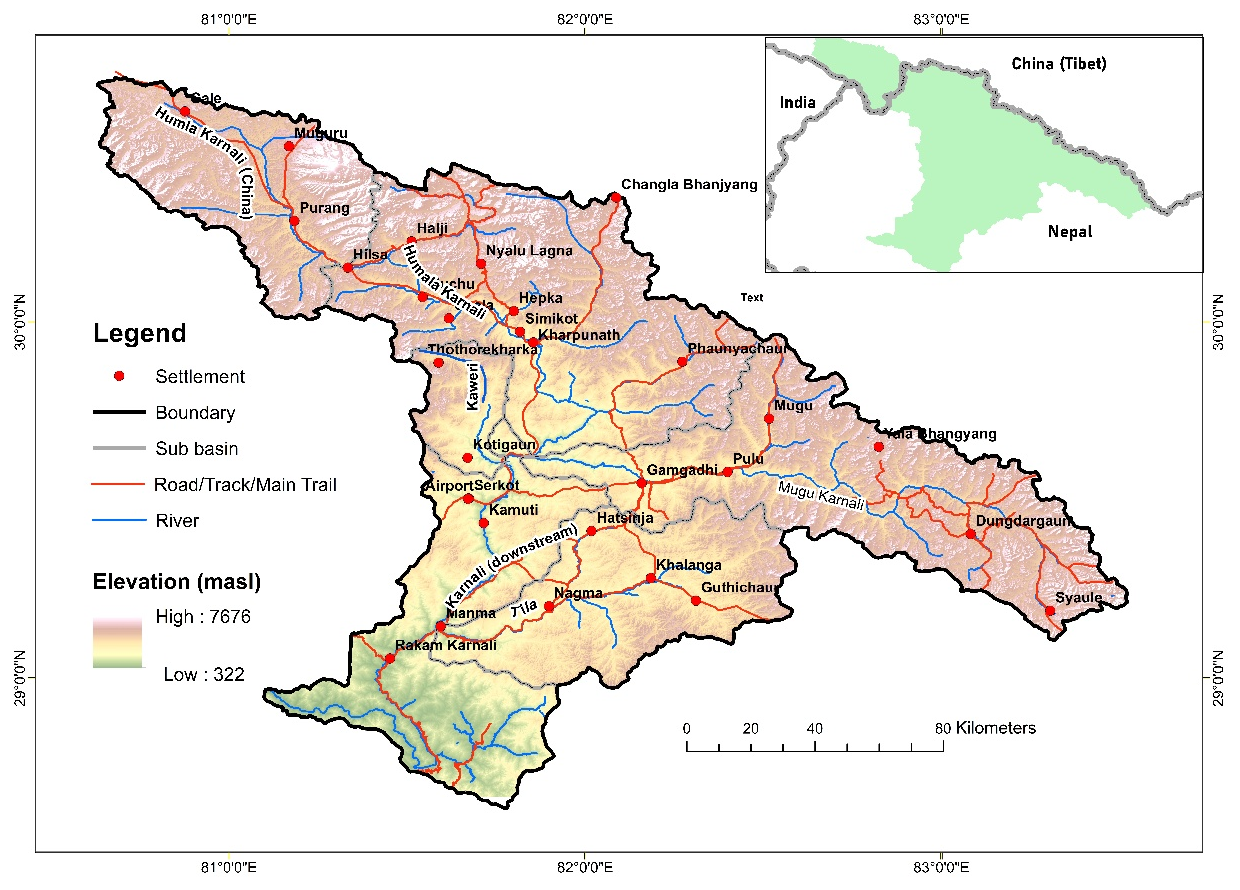
Figure 1Location of the Upper Karnali Basin.
This study treats snow and glacier cover as a unified cryospheric component because of their analogous functional roles. It analyzes cryospheric dynamics using remote sensing techniques. Satellite imagery was processed to generate time-series data on snow and ice cover, derive land surface temperatures, and map glacier basins.
3.1 Snow Cover Mapping
We mapped snow cover in the Upper Karnali Basin using Google Earth Engine (GEE) and imagery from Landsat 5 TM, Landsat 7 ETM+, and Landsat 8 OLI. For the period preceding the Scan Line Corrector (SLC) failure, we used only Landsat 7 ETM+ images (2002–2003). For subsequent years, we utilized data from Landsat 5 TM and Landsat 8 OLI. To ensure high data quality, we selected only scenes with less than 30 % cloud cover see (Sect. S1 and Fig. S1 in the Supplement).
We preprocessed all Landsat images by masking clouds using the Quality Assessment (QA) bands–pixel_qa for Landsat 5 and 7, and QA_PIXEL for Landsat 8. Next, we calculated the Normalized Difference Snow Index (NDSI) using the green and short-wave infrared (SWIR) bands (Hall et al., 2002; Gorelick et al., 2017) and applied a threshold of NDSI >0.4 to identify snow pixels. To reduce confusion between snow and vegetation in mixed or forested terrain, we also calculated the Normalized Difference Vegetation Index (NDVI) and excluded pixels with NDVI >0.2 from the snow classification, following the approach of Rittger et al. (2013). Finally, we exported the resulting snow cover maps as GeoTIFF files for overlay and sub-basin and micro-basin analyses.
To supplement the Landsat observations, we processed MODIS 8 d composite snow-cover products (MOD10A2) using Google Earth Engine (GEE). The MOD10A2 algorithm employs a maximum snow-extent compositing method over each 8 d period (Parajka and Blöschl, 2008), which minimizes cloud contamination and produces a spatially continuous dataset for analyzing seasonal and interannual variability in snow cover. Although this approach loses daily temporal resolution, the 8 d composite effectively smooths out short-lived cloud effects, providing a more stable dataset for trend analysis.
After processing the imagery, we executed a Python script within the Google Earth Engine (GEE) environment to automate the download and organization of snow cover data. The script aggregated MODIS-derived snow extent by season, sub-basin, and elevation band (derived from the SRTM DEM).
The year was divided into four distinct three-month periods: January–March (Peak Accumulation), April–June (Major Ablation), July–September (Monsoon Ablation), and October–December (Early Accumulation). This division was explicitly chosen to capture the hydrological phases of snow accumulation and melting while minimizing cloud contamination during the monsoon season (Hunt et al., 2025; Khatiwada et al., 2016; Kulkarni et al., 2010). The resulting structured snow dataset served as the main input for analyzing snow cover trends, elevation-dependent variability, and hydrological differences among sub-basins.
We describe the methods for spatial resolution harmonization and accuracy assessment between Landsat and MODIS datasets (see Sect. S2 and Tables S1–S3 in the Supplement). Despite these refinements, persistent monsoon cloud cover continues to limit optical remote sensing in the Himalayas, often leading to underestimation of snow-covered areas and uncertainties in seasonal trends.
Elevation bands were defined using the SRTM DEM and categorized into 200 m intervals, ranging from ≤2000 to ≥6500 m. Zonal statistics were applied to extract the frequency of snow cover for each elevation band and sub-basin. The snow-covered area was calculated using a threshold-based binary mask. The results were aggregated into a structured dataset, revealing seasonal snow distribution and variations across elevation zones and watersheds, thereby facilitating hydrological analysis.
3.2 Land Surface Temperature Data and Validation
We also downloaded land surface temperature (LST) data at 1 km resolution from the Application for Extracting and Exploring Analysis Ready Sample (AppEEARS) platform. AppEEARS is a NASA-supported platform developed to facilitate easy access, subset into specified areas, and analysis of climate and environmental data (Wan et al., 2015). MODIS Land Surface Temperature (LST) data have been reliably used to determine surface temperature patterns in areas where ground observations are scarce, particularly in rugged mountainous regions. Several studies have confirmed their accuracy, reporting average biases of less than 1.5 K and high correlations (R2>0.9) with on-site measurements (Duan et al., 2019; Yu et al., 2011; Zhao et al., 2019), demonstrating their appropriateness for analyzing elevation-related warming trends in the Himalayas. We also obtained temperature and precipitation records, including maximum and minimum values, from the Department of Hydrology and Meteorology (DHM), Government of Nepal, as well as from open-access reanalysis datasets such as ERA5. Temperature data (measured at 2 m above ground) were compared with MODIS LST; the results of this comparison are discussed in Sect. 4. Due to the 1 km spatial resolution of the MODIS product, the analysis of time series data reflects area-averaged temperature trends rather than in situ measurements at individual stations.
3.3 Delineation of the Glacier Basin and Glacier Data
The boundaries of glacier basins were delineated to assess changes in glaciers and snow cover fractions within glacier-drained areas. Glacier basins include trunk glaciers, tributary glaciers, and surrounding slopes nourished by moving ice and snow. Their boundaries are topographically defined, with the lower boundary terminating at the terminus of the main glacier. This delineation process involved multiple steps to ensure accuracy.
Initially, the Glacier Inventory map referenced earlier served as a fundamental resource. High-resolution imagery and ESRI's topographic maps in ArcGIS 10 and later versions provided detailed spatial data. A 12.5 m DEM was used to extract drainage networks, produce contour lines, and generate hillshade maps, enhancing the visualization of divides between glacier basins. These components were essential for accurately identifying glacier termini and delineating glacier head basins. This integrated approach, combining topographic analysis, remote sensing, and geospatial techniques, enabled precise delineation of glacier basins for comprehensive evaluations of snow cover fraction.
The time series glacier data compiled by Ghimire et al. (2025a) were included in this study. The lead author of the current manuscript also contributed to that research paper. In summary, we mapped glacier polygons for the years 2000, 2010, and 2023 using high-resolution imagery from Google Earth, Bing Maps, and RapidEye 2023 to maintain temporal consistency. Snow and glaciers were identified based on their bright characteristics, smooth textures, and shadows cast by adjacent terrain. Landsat composites (both true and false color) and the Normalized Difference Snow Index (NDSI) enhanced the visibility of snow and ice, while altitude and topographic data derived from DEM highlighted potential glacier regions. Outlines from the Randolph Glacier Inventory (RGI) (Pfeffer et al., 2014) and ICIMOD (Bajracharya and Shrestha, 2011) served as references, while ground-truth and additional data helped validate the findings. This comprehensive approach ensured precise delineation.
3.4 Limitations and Validation
A key limitation of this research is that optical remote sensing is significantly affected by cloud cover, particularly during the monsoon season (Hall et al., 2002; Gafurov and Bárdossy, 2009). Frequent cloudiness often restricts the availability of clear Landsat images, leading to an underestimation of snow cover and potential inaccuracies in the spatial and seasonal assessment of snow patterns. In this study, cloud-free images were primarily available from January to March and October to December in most Upper Karnali sub-basins. Nevertheless, all four seasons were analyzed for microglacier basins where suitable data were available.
To address these issues, we used MODIS MOD10A2 data, which provide higher temporal resolution (8 d composites at 500 m) compared to Landsat's 16 d revisit cycle and 30 m spatial resolution. This multi-sensor strategy enhances temporal continuity and minimizes data gaps caused by clouds; however, the results should still be interpreted cautiously (Maskey et al., 2011; Parajka and Blöschl, 2008).
The scarcity of high-altitude temperature stations necessitated the use of MODIS land surface temperature (LST) data at a 1 km resolution, representing daytime skin temperature at approximately 10:30 a.m. local time. This skin temperature was compared with in situ air temperature measurements taken at 2 m above ground from four stations: Jumla (2300 m), Simkot (2800 m), Guthi Chaur (3080 m), and Rara (3048 m). Correlations varied by site and season–strongest at Jumla (up to 0.85), moderate at Guthi Chaur, and weakest at high-altitude, snow-covered sites such as Simkot and Rara (−0.18). MODIS LST performs well in clear, snow-free areas but requires adjustments at higher elevations. Differences arise from factors including resolution, spatial averaging, land-cover heterogeneity, and surface–air temperature contrasts.
Validation studies further confirm its reliability for analyzing high-mountain temperatures in regions where in situ data are limited (see Duan et al., 2019; Yu et al., 2011; Zhao et al., 2019).
4.1 Snow or Ice cover Trend and Variability: Annual and Seasonal
The total snow cover across the Upper Karnali Basin (22 546 km2) from 2002 to 2024 averages 872 km2, with a standard deviation of 147 km2, indicating moderate variability (Table 1 and Fig. 2). The minimum recorded snow cover is 514 km2; about 25 % of the observations are at or below 777 km2. The average snow-covered area from January to March is 1528±333 km2, followed by April to June (881±212 km2) and October to December (862±373 km2), respectively. July to September shows the lowest snow cover area, i.e., 169±38.3 km2.
Snow cover data reveal significant year-to-year changes in every quarterly season, with varying directions and magnitudes of trends, as demonstrated by correlation analysis, the Kendall tau test, and Sen's slope estimator. The annual average snow-covered area (SCA) shows a decreasing trend, although it is not statistically significant (p=0.535). Sen's slope estimates a loss of approximately 3.99 km2 yr−1, indicating a gradual decline in snowpack over the past two decades. Seasonally, the July–September period exhibits a gentler trend compared to October–December; however, due to its much lower inter-annual variability, this period exhibits the statistically significant steepest decline in snow cover (Sen's Slope = −2.87, p=0.001) (Table 1). This period is characterized by snow ablation, as the summer monsoon brings warmer temperatures. In mid-latitude regions, precipitation occurs more as rain than snow, resulting in accelerated snowmelt. While January–March shows a decline (Sen's slope = −8.63 km yr−1), it is not statistically significant (p=0.523), suggesting year-to-year winter variability in snowfall or early melt. Similarly, no significant trends were detected from April to June. Interannual variability is evident, with peaks and lows in snow and ice coverage (Fig. 2). Episodic snow coverage was observed in 2015, 2020, and 2022 (January–March); 2015 and 2019 (April–June); and 2009 and 2021 (October–December), indicating anomalous years of heavy episodic snowfall events. However, these anomalies do not offset the long-term declines. Compared to seasonal variability, annual snow coverage shows relatively low interannual variability, with a 16 % coefficient of variation (CoV)–the ratio of the standard deviation to the mean.
Table 1Snow cover descriptors and changes by seasons.
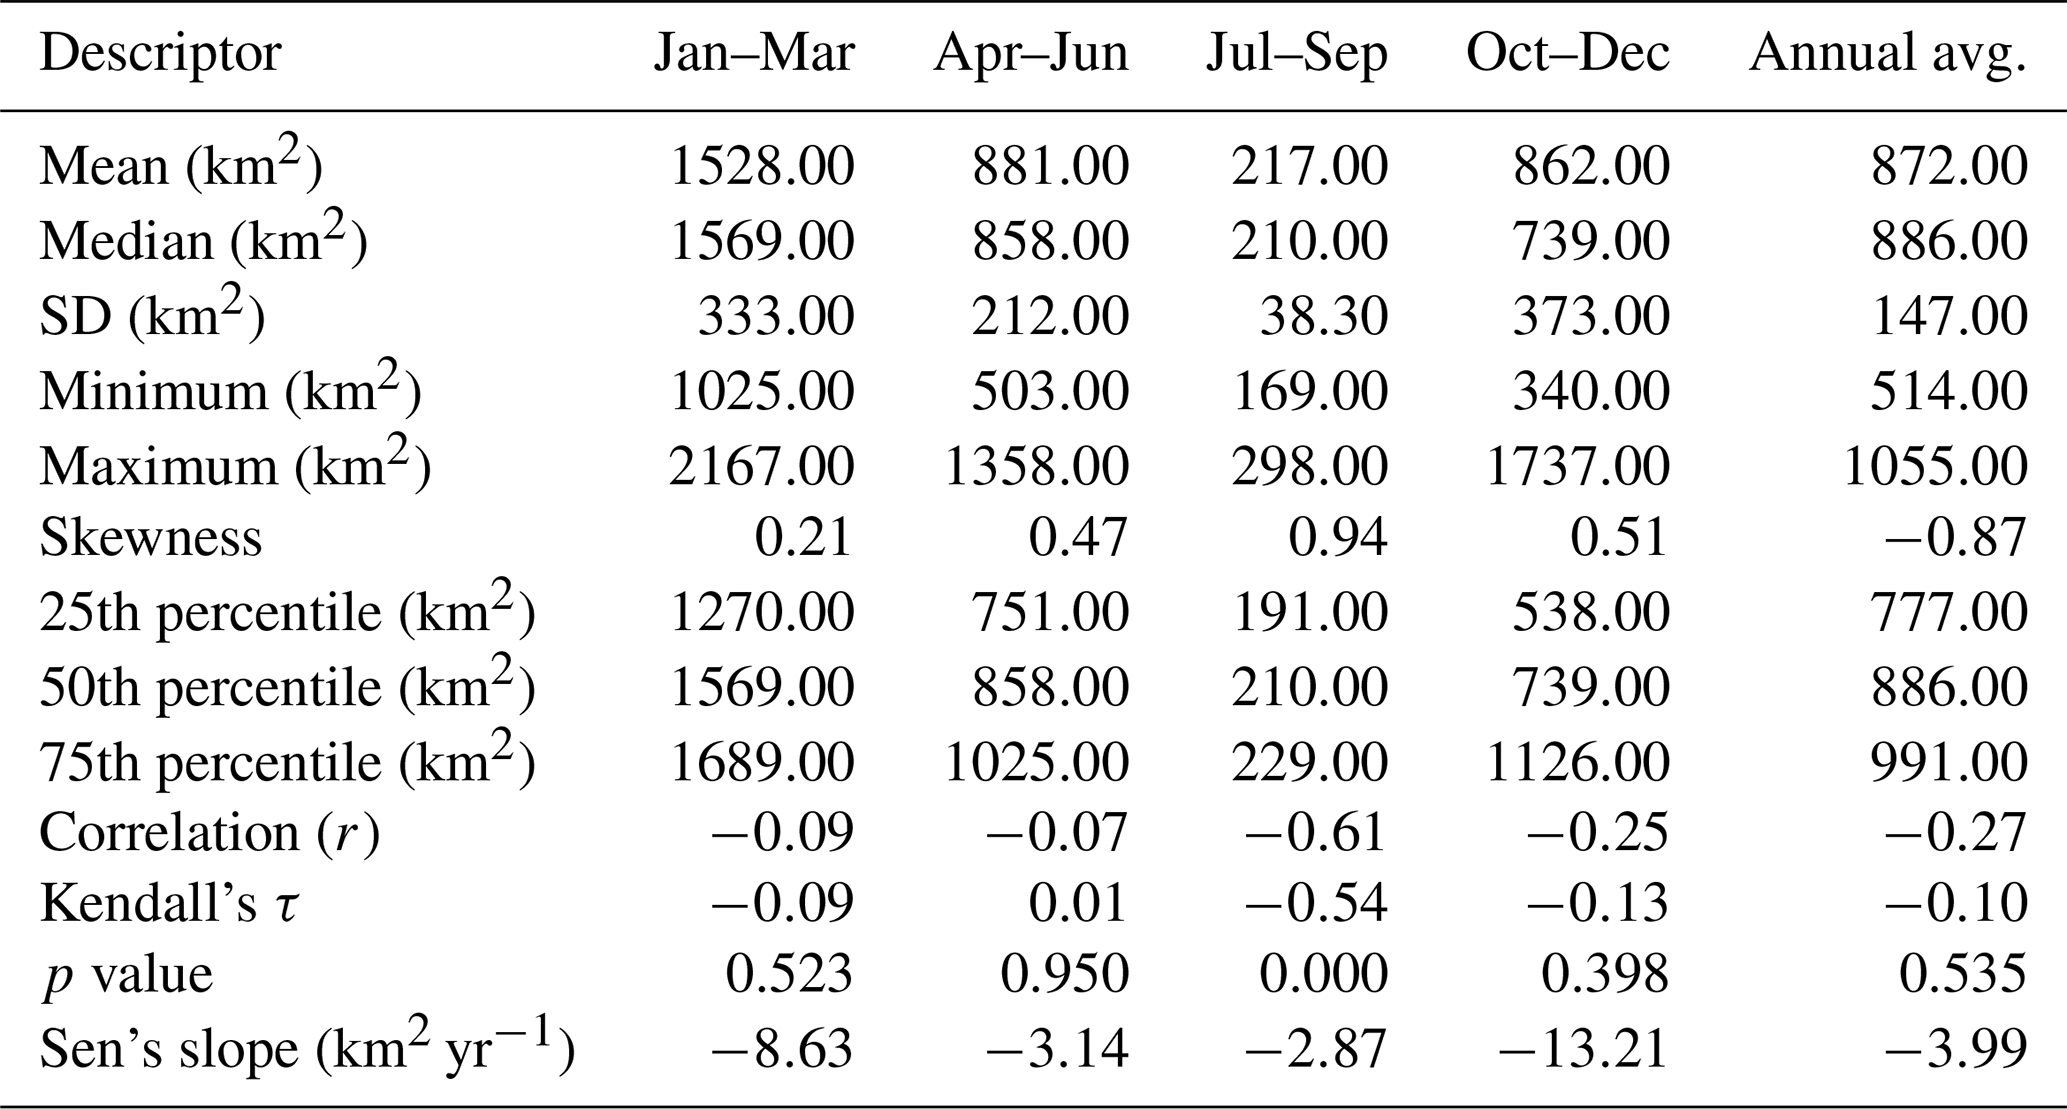
Note: Sen's slope represents the median of all possible pairwise slopes, quantifying the trend (here, snow cover) over time (Sen, 1968). It provides a more reliable long-term estimate of snow cover loss without being skewed by short-term anomalies (Gilbert, 1987; Yue and Wang, 2004).
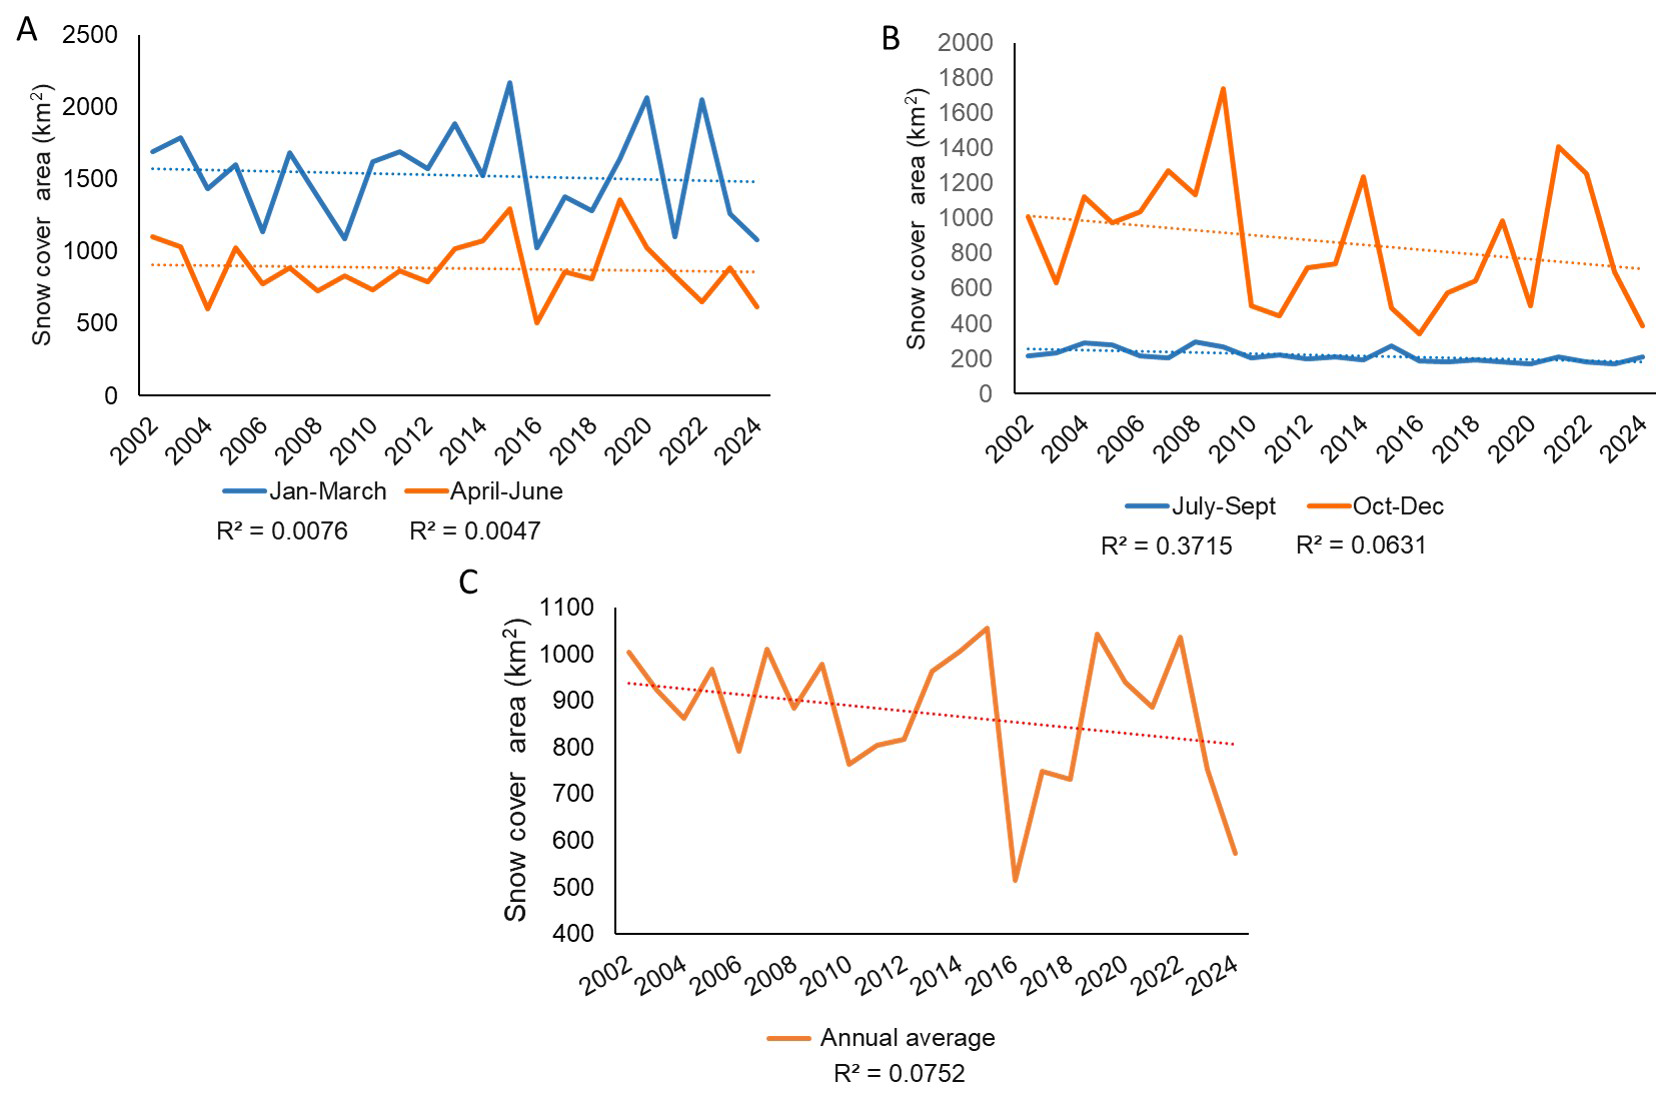
Figure 2Temporal variation and trends in seasonal and annual snow-covered area (SCA) in the Upper Karnali Basin (2002–2024). (a) Time series of SCA for January–March (orange) and April–June (green); (b) SCA for July–September (blue) and October–December (orange); (c) average annual SCA (orange).
4.2 The Relation between Snow Cover, Temperature, and Precipitation
We derived land surface temperature (LST) data for 204 locations from MODIS Terra (MOD11A1) and Aqua (MYD11A2) products at 1 km resolution, processed through AppEEARS. Precipitation data were obtained from the ERA5-Land reanalysis (∼9 km resolution) provided by ECMWF (Hersbach et al., 2020). These datasets, covering four distinct seasons, were used to analyze temperature and precipitation trends, as well as their relationships with snow cover trends (Figs. 3–5).
Using correlation statistics, we found that among the 204 sampled sites, 143 locations (approximately 70 %) exhibit a positive annual temperature trend, indicating a general warming pattern throughout the study region (Fig. 3). However, statistically significant trends (p≤0.1) were identified in only a subset of these sites, highlighting that not all observed warming trends are statistically robust. Moreover, the warming pattern is not consistent across all seasons. Notably, during the April–June interval, the temperature trend tends to be weaker or, in some cases, negative. Several subsites across different seasons also demonstrate negative trends, although the majority of locations show a positive trend (Fig. 3). Elevation-related variability in these trends is further analyzed in Figs. 7–9 and Table 3.
Seasonal rainfall trends from 2000 to 2024 indicate weak to moderate increases across all seasons, except for winter (January–March), which shows a slight downward trend (R2=0.014) (Fig. 4). Pre-monsoon (April–June) rainfall exhibits a slight upward trend (R2=0.0119). All these seasons display high variability, suggesting a limited impact on snow accumulation. Monsoon rainfall (July–September) demonstrates a more noticeable increase (R2=0.0975), primarily contributing to rainfall rather than snowfall. Post-monsoon (October–December) precipitation remains low and stable. Combined with rising temperatures, these trends indicate a shift toward rainfall-dominated precipitation, reduced snowfall, and earlier snowmelt, contributing to declining snow cover and altered hydrological regimes.
The snow-covered area exhibits a strong to moderate negative correlation with temperature across all seasons ( to −0.77, p<0.05) (Fig. 5). Conversely, precipitation shows a positive correlation with snow cover during January–March and October–December (r=0.55 to 0.59, p<0.05), while in the remaining seasons, it demonstrates a moderate negative correlation. Additionally, precipitation and temperature are negatively correlated in winter (October–March) and positively correlated in summer (April–September).
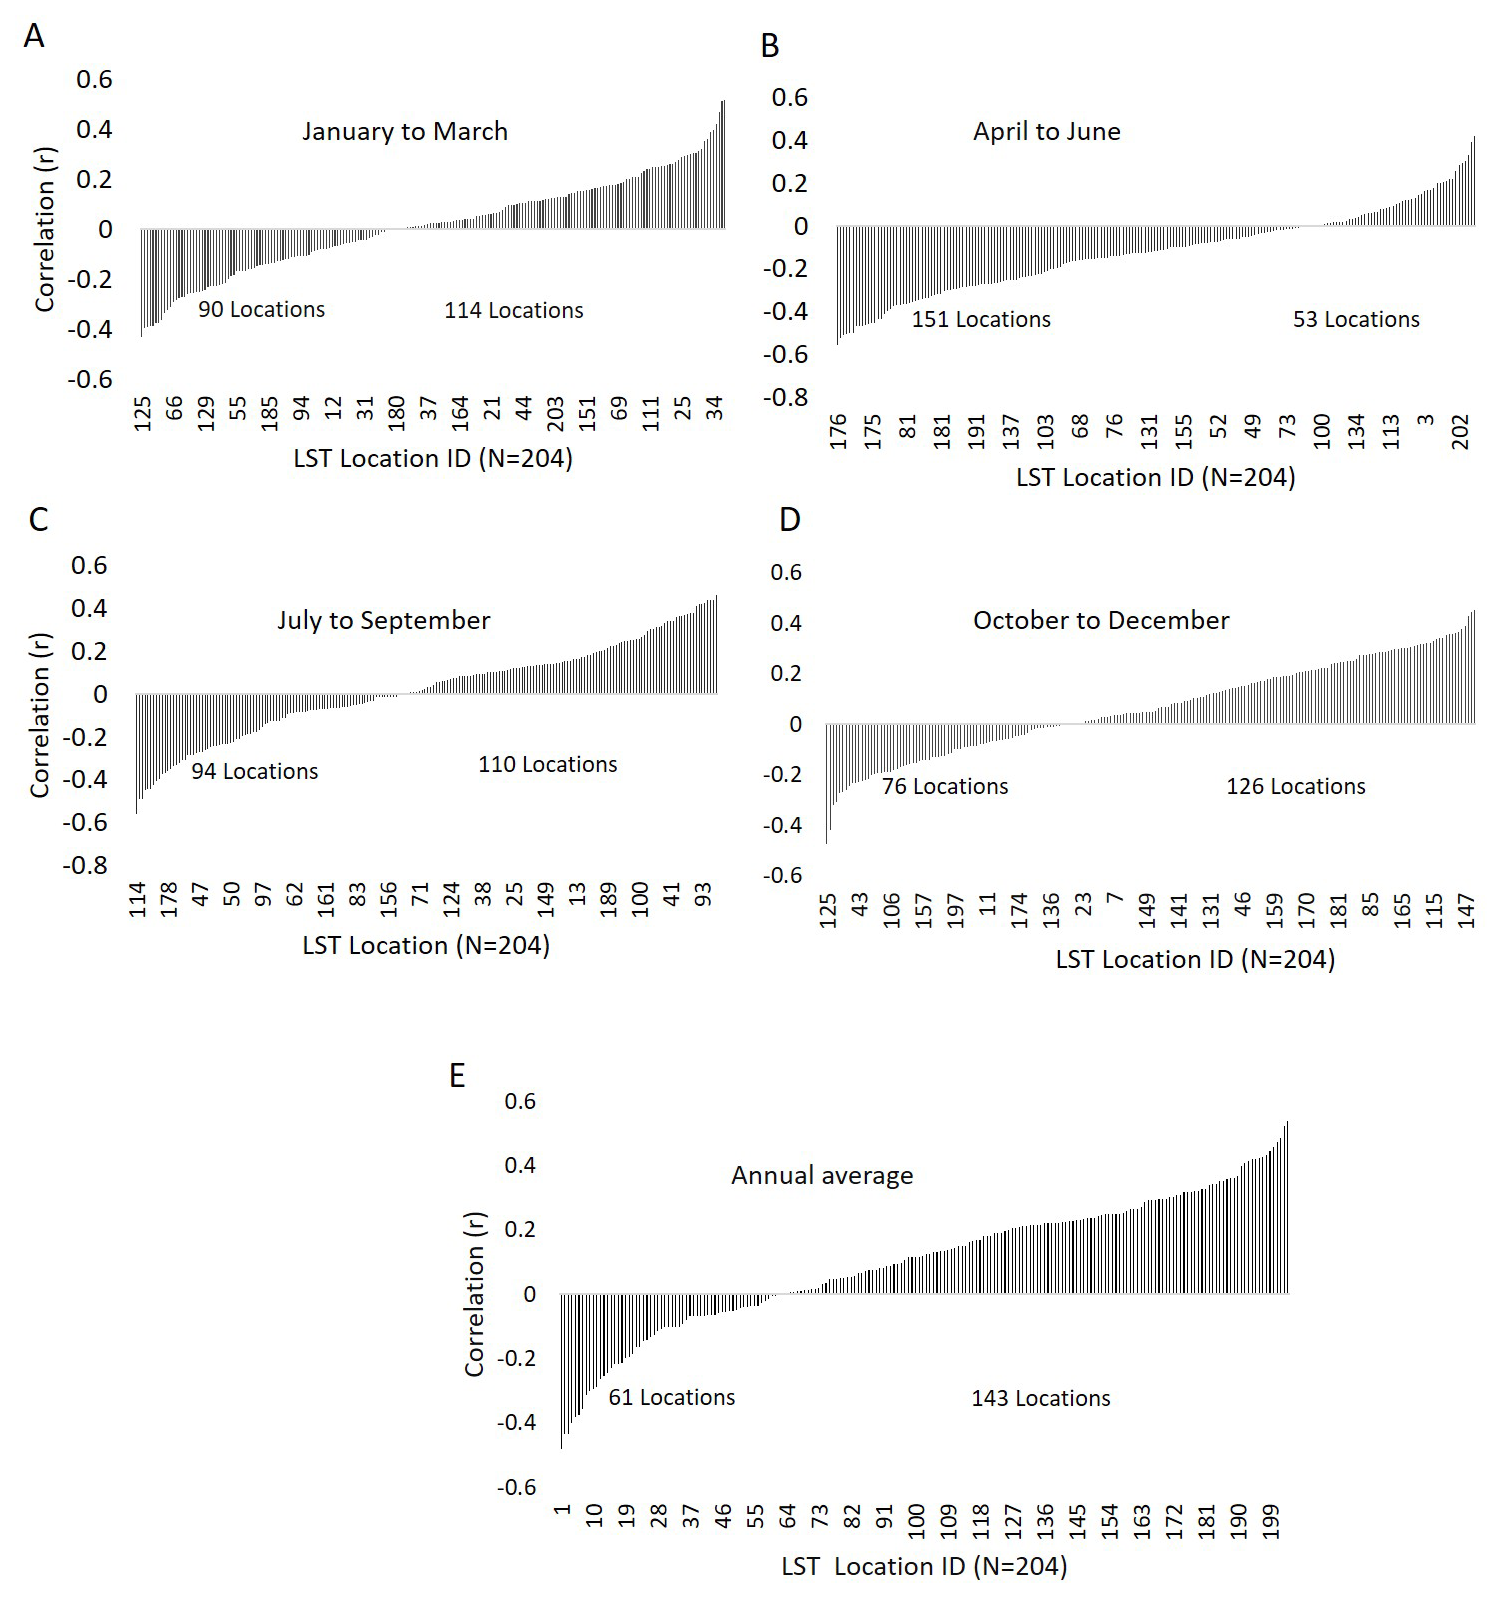
Figure 3The correlation illustrates the seasonal (A–E) temperature trend directions at various sites between 2000 and 2024 (Source: MODIS Terra and Aqua MOD11A2, MYD11A1, AppEEARS). Significant correlations at the 90 % confidence level are observed at .
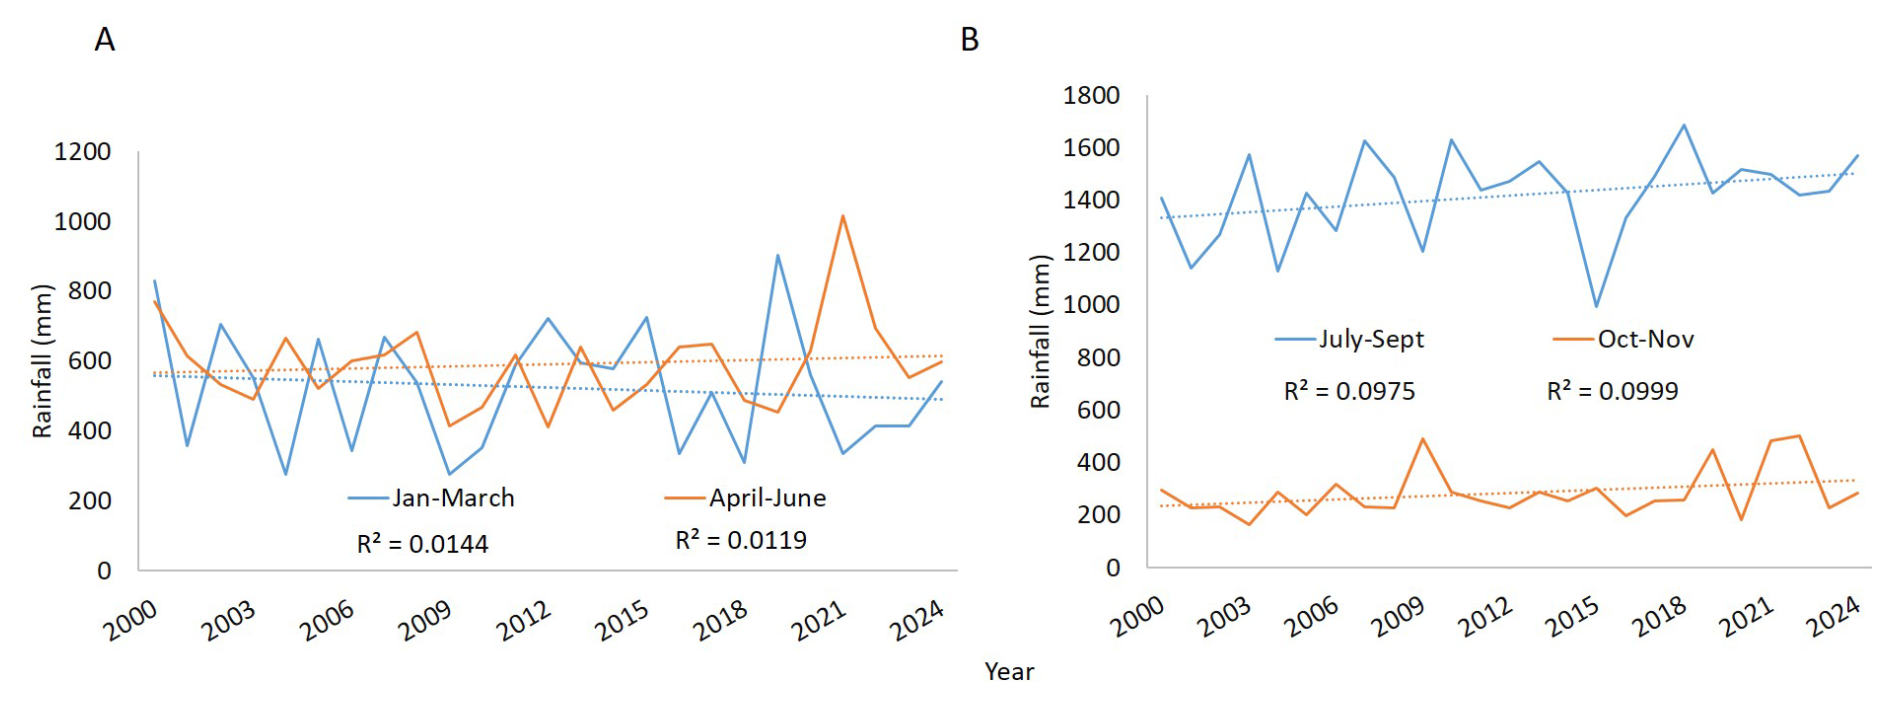
Figure 4Yearly rainfall trends across various periods. Precipitation data were collected from the ERA5-Land reanalysis dataset by ECMWF (Hersbach et al., 2020), covering 204 locations over four distinct time intervals.
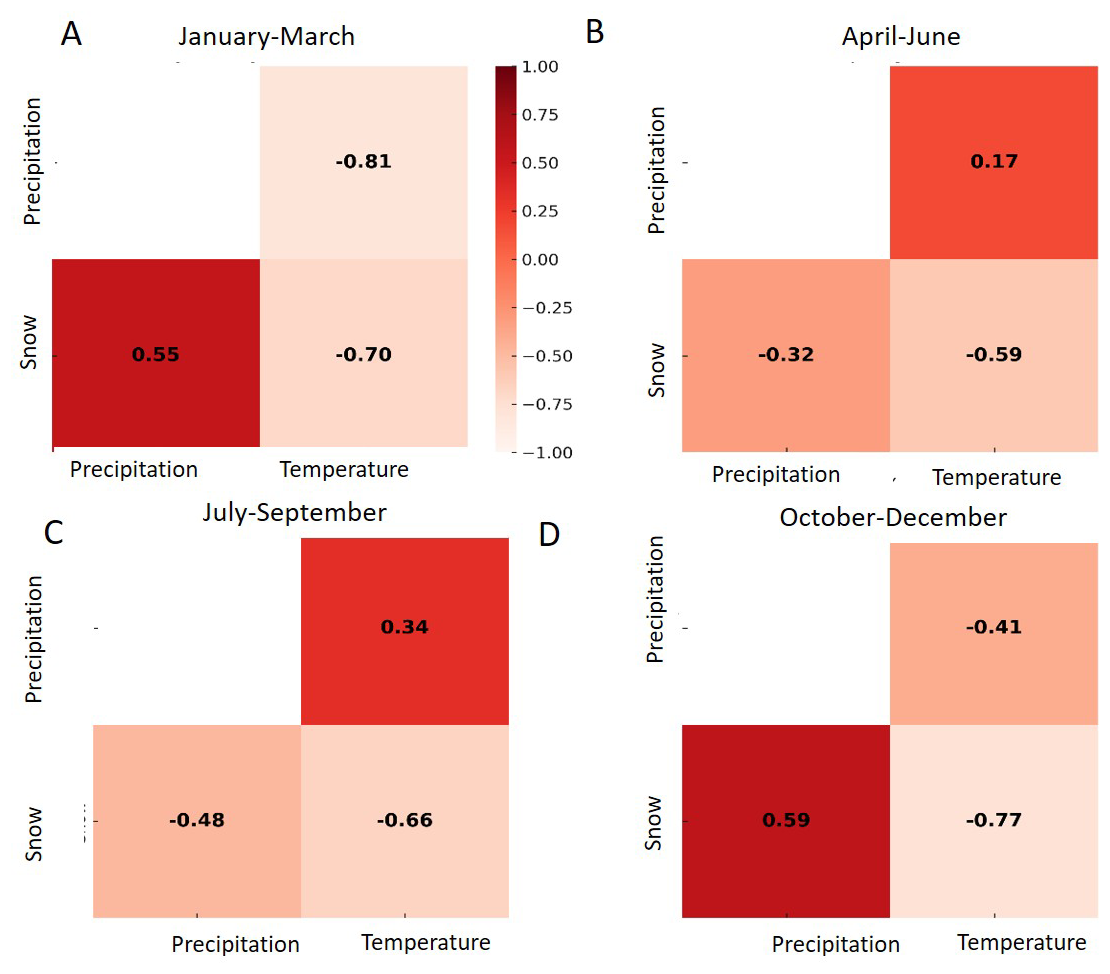
Figure 5Seasonal correlation patterns among snow cover, temperature, and precipitation over a 22-year period, presented separately for each season (A–D).
4.3 Snow Cover Changes in Sub-Basins Using Landsat Series Data
Landsat-derived reliable snow and ice data were unavailable for the pre-monsoon and monsoon seasons due to significant cloud cover (as mentioned in Sect. 3.4). Therefore, only two seasons: January to March and October to December, were considered. These periods are characterized by snowfall as the primary form of precipitation, contributing to snow accumulation.
Examining snow cover patterns in the sub-basins of the Upper Karnali Basin (UKB) across two seasons (January–March and October–December) reveals notable seasonal and spatial differences (Table 2). During January–March, Humla Karnali exhibits the largest average snow cover (3336 km2), followed by Mugu Karnali (1864 km2) and Humla Karnali (China) (1478 km2), while downstream areas such as Tila and Kawari have minimal coverage (less than 350 km2). Significant variability in snow cover trends is observed, particularly in Tila and Downstream Karnali, with a coefficient of variation (CoV) exceeding 50 %. This high CoV indicates inconsistent snow cover from year to year during January–March. Furthermore, this variability is associated with a significant negative correlation, i.e., (p<0.1). Figure 6 graphically illustrates the temporal trends, showing the correlation coefficient (r) and fluctuations in Landsat-derived snow cover for the two seasons mentioned above. The moderately negative skewness of the temporal distribution does not affect the correlation, which is negative for all basins, indicating a declining trend.
Conversely, the October–December season has a lower average snow cover (823 km2) and exhibits significant fluctuations, with a range of 227–1570 km2 and a coefficient of variation (CoV) of 55 %. Strong variability is observed across all basins, particularly in Humla Karnali (China), Tila, and Downstream Karnali. The skewness is moderate for most basins, except for the Downstream Karnali. Correlation values are reliable and indicate a declining trend. Notably, despite high variability, Downstream Karnali shows a statistically significant negative correlation coefficient of −0.47 (p<0.05) (Fig. 6).
Table 2Descriptive statistics of snow cover across sub-basins for two seasons (January–March and October–December), along with the time series correlation from 2002 to 2024.
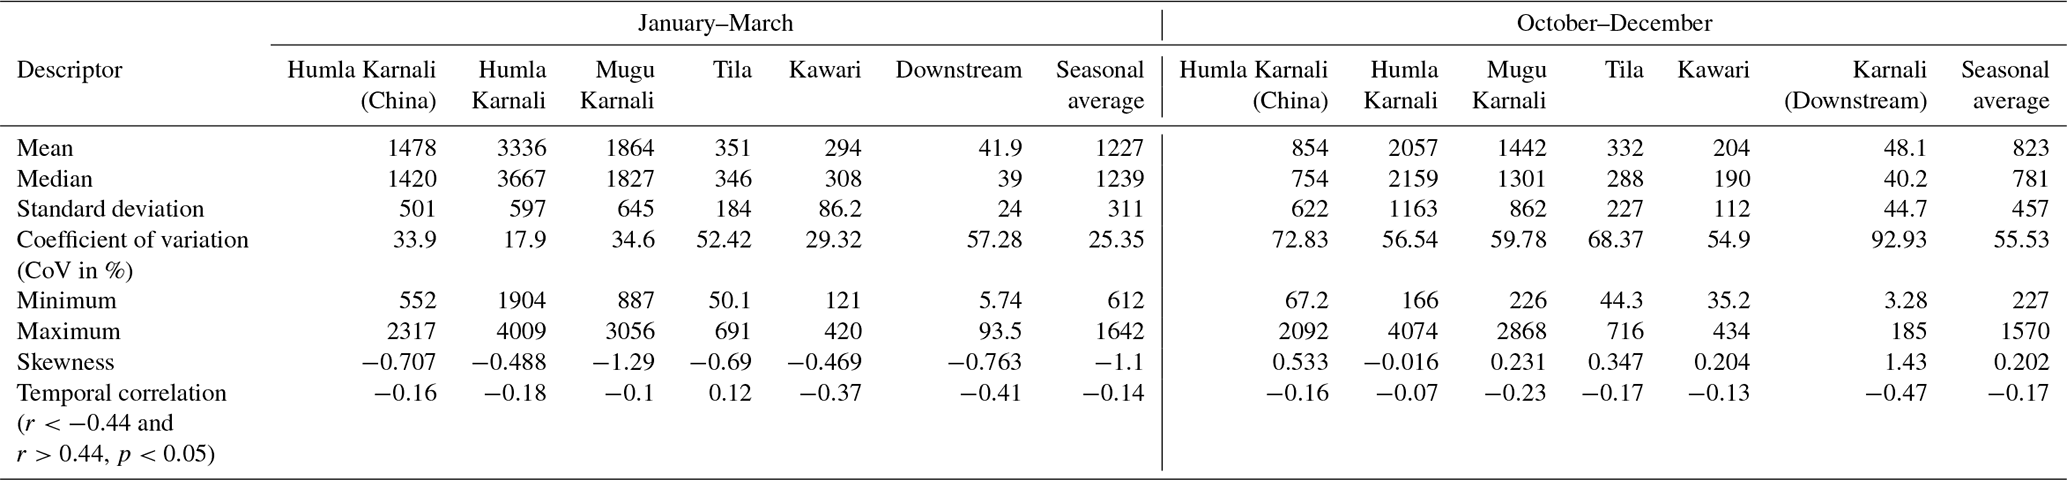
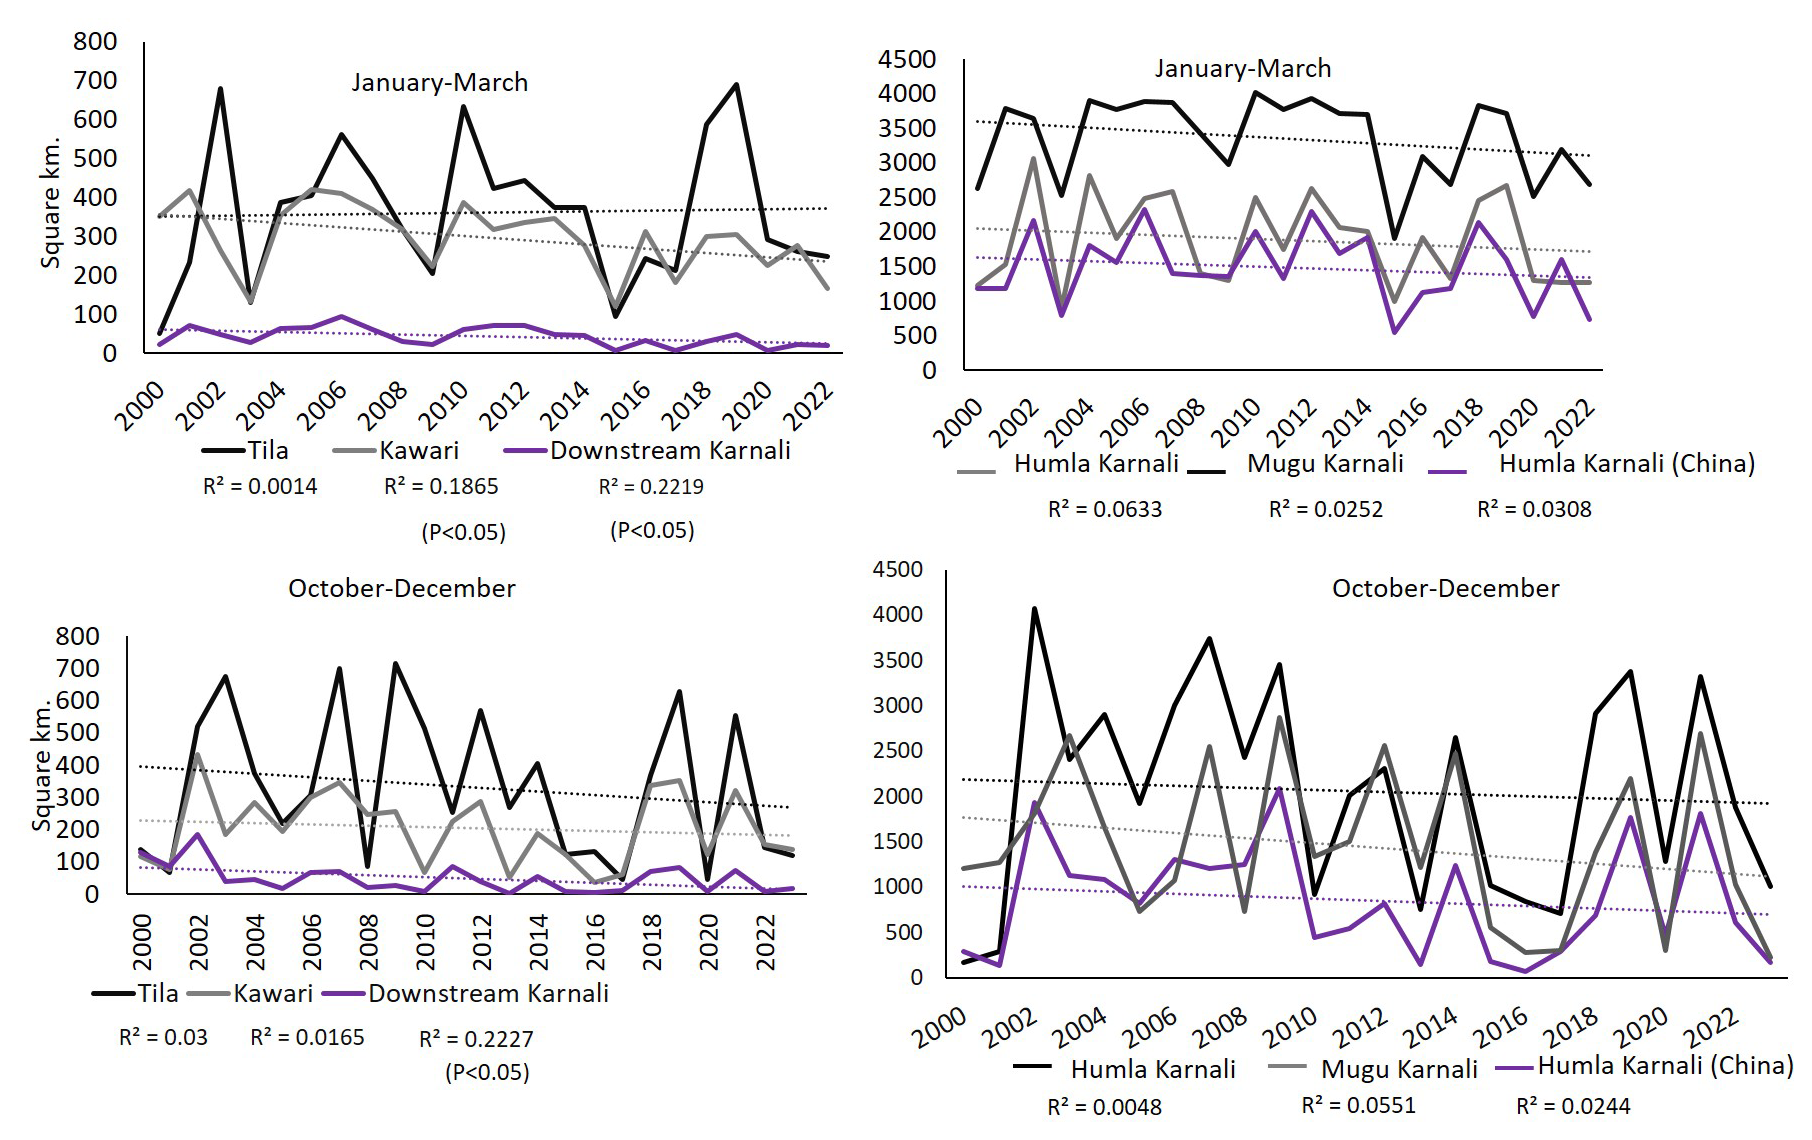
Figure 6The snow cover trend in the Upper Karnali Basin varies across different sub-basins from January–March and from October–December (A–D).
4.4 Snow Cover Dynamics across Elevation Zones
The dynamics of snow cover across elevation zones, categorized in 200 m intervals from ≤2000 to ≥6500 m, reveal remarkable elevation-dependent patterns in correlation and variability over time (2002–2024) (Fig. 7). Snow cover in the lowest elevation zones exhibits a weak positive correlation (0.12–0.43), indicating a slight increase. However, pronounced interannual variability (CoV ∼41 %–43 %) is likely driven by fluctuating temperature and precipitation regimes (Pendergrass, 2020).
Above 2300 m a.s.l., correlations shift to weak negative values (up to 5000 m a.s.l., to −0.17), reaching peak negativity at 6100–6200 m a.s.l. (), indicating a significant decline in snow cover (Fig. 7). This trend aligns with the impacts of global warming, where rising temperatures disproportionately affect higher elevations, accelerating snowmelt and reducing accumulation (Naegeli et al., 2019; Ren et al., 2023; Shen et al., 2021). The mean snow cover increases with elevation, showing a marked rise from 3300 to 6500 m a.s.l. or above, except between 5000 and 5200 m a.s.l., which exhibits a gradual increase in snow cover.
Above this elevation, the mean snow cover area increases sharply, coinciding with glaciers and permanent snow zones. In contrast, the coefficient of variation (CoV) rises with elevation up to 3100 m a.s.l., then declines sharply from 3100 to 6500 m a.s.l. and beyond. This pattern indicates a decrease in interannual variability accompanied by stronger negative correlations. The low interannual variability reinforces the reliability of the observed declining trend in snow cover.
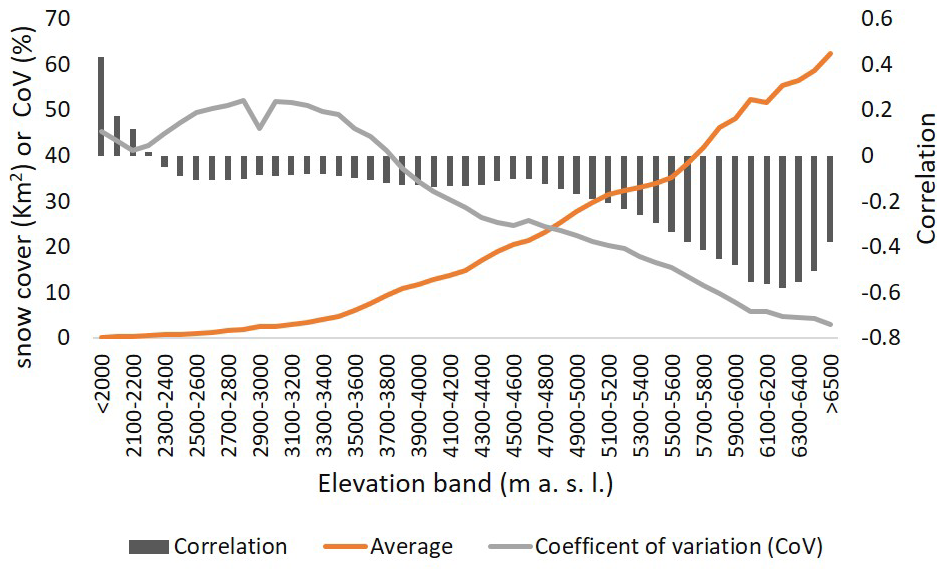
Figure 7The average, coefficient of variation, and correlation of snow cover area across various elevation bands with time (2002–2024). Data sources: MODIS MOD10A2 8 d snow cover product (Hall et al., 2002; NASA NSIDC DAAC) and SRTM DEM (Farr et al., 2007).
To examine the relationship between temperature and snow cover, the elevation bands were regrouped into seven broader categories: <1000, 1000–2000, 2000–3000, 3000–4000, 4000–5000, 5000–5500, 5500–6000, and above 6000 m a.s.l. The temperature trend from 2002 to 2024 across these elevation bands in the Upper Karnali Basin, as indicated by Sen's slope (Fig. 8, Table 3), shows a general increase. The highest rate of change is observed at lower elevations (<1000 m: 0.0765 °C yr−1). Mid-elevations (1000–2000 m: 0.0576 °C yr−1) and high elevations (5000–5500 m: 0.0643 °C yr−1) also exhibit significant warming. However, the statistical significance (P value) weakens at higher elevations. This warming accelerates glacier retreat, reducing snow cover and altering river flow patterns, thereby reducing the glacier-fed water supply in the Upper Karnali Basin.
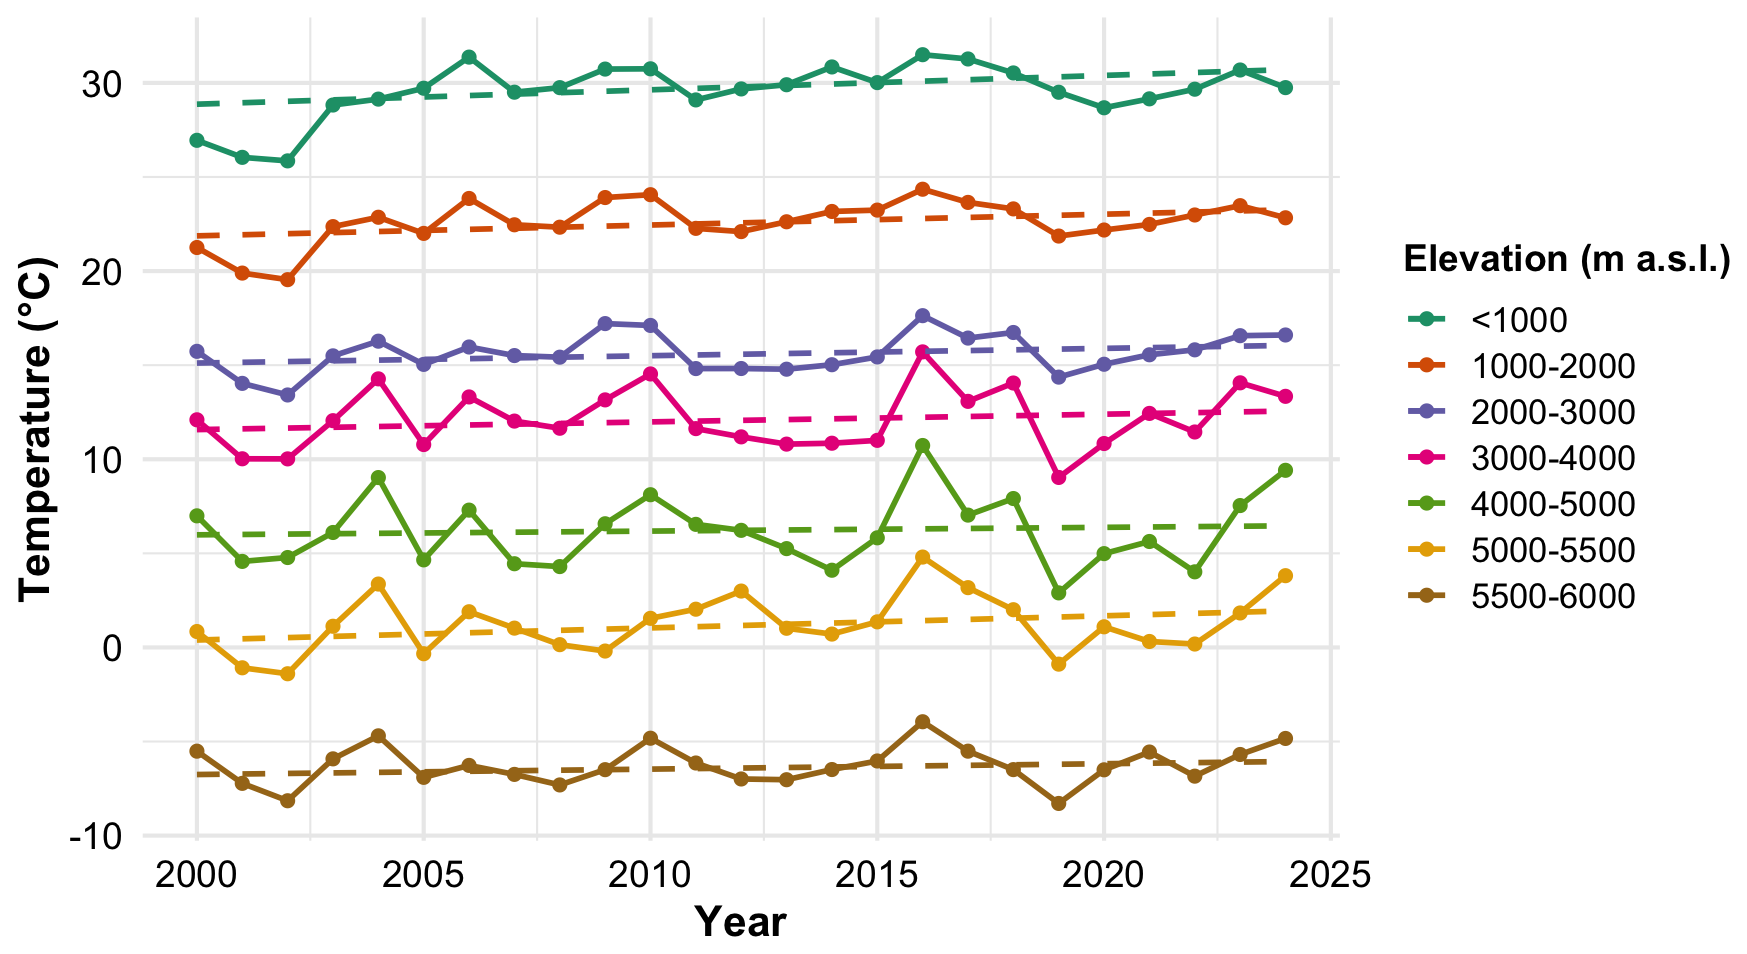
Figure 8Temperature (source: MODIS) trend between 2002 and 2024 for different elevation bands.
Table 3Rate of temperature change in different elevation between 2000–2024.
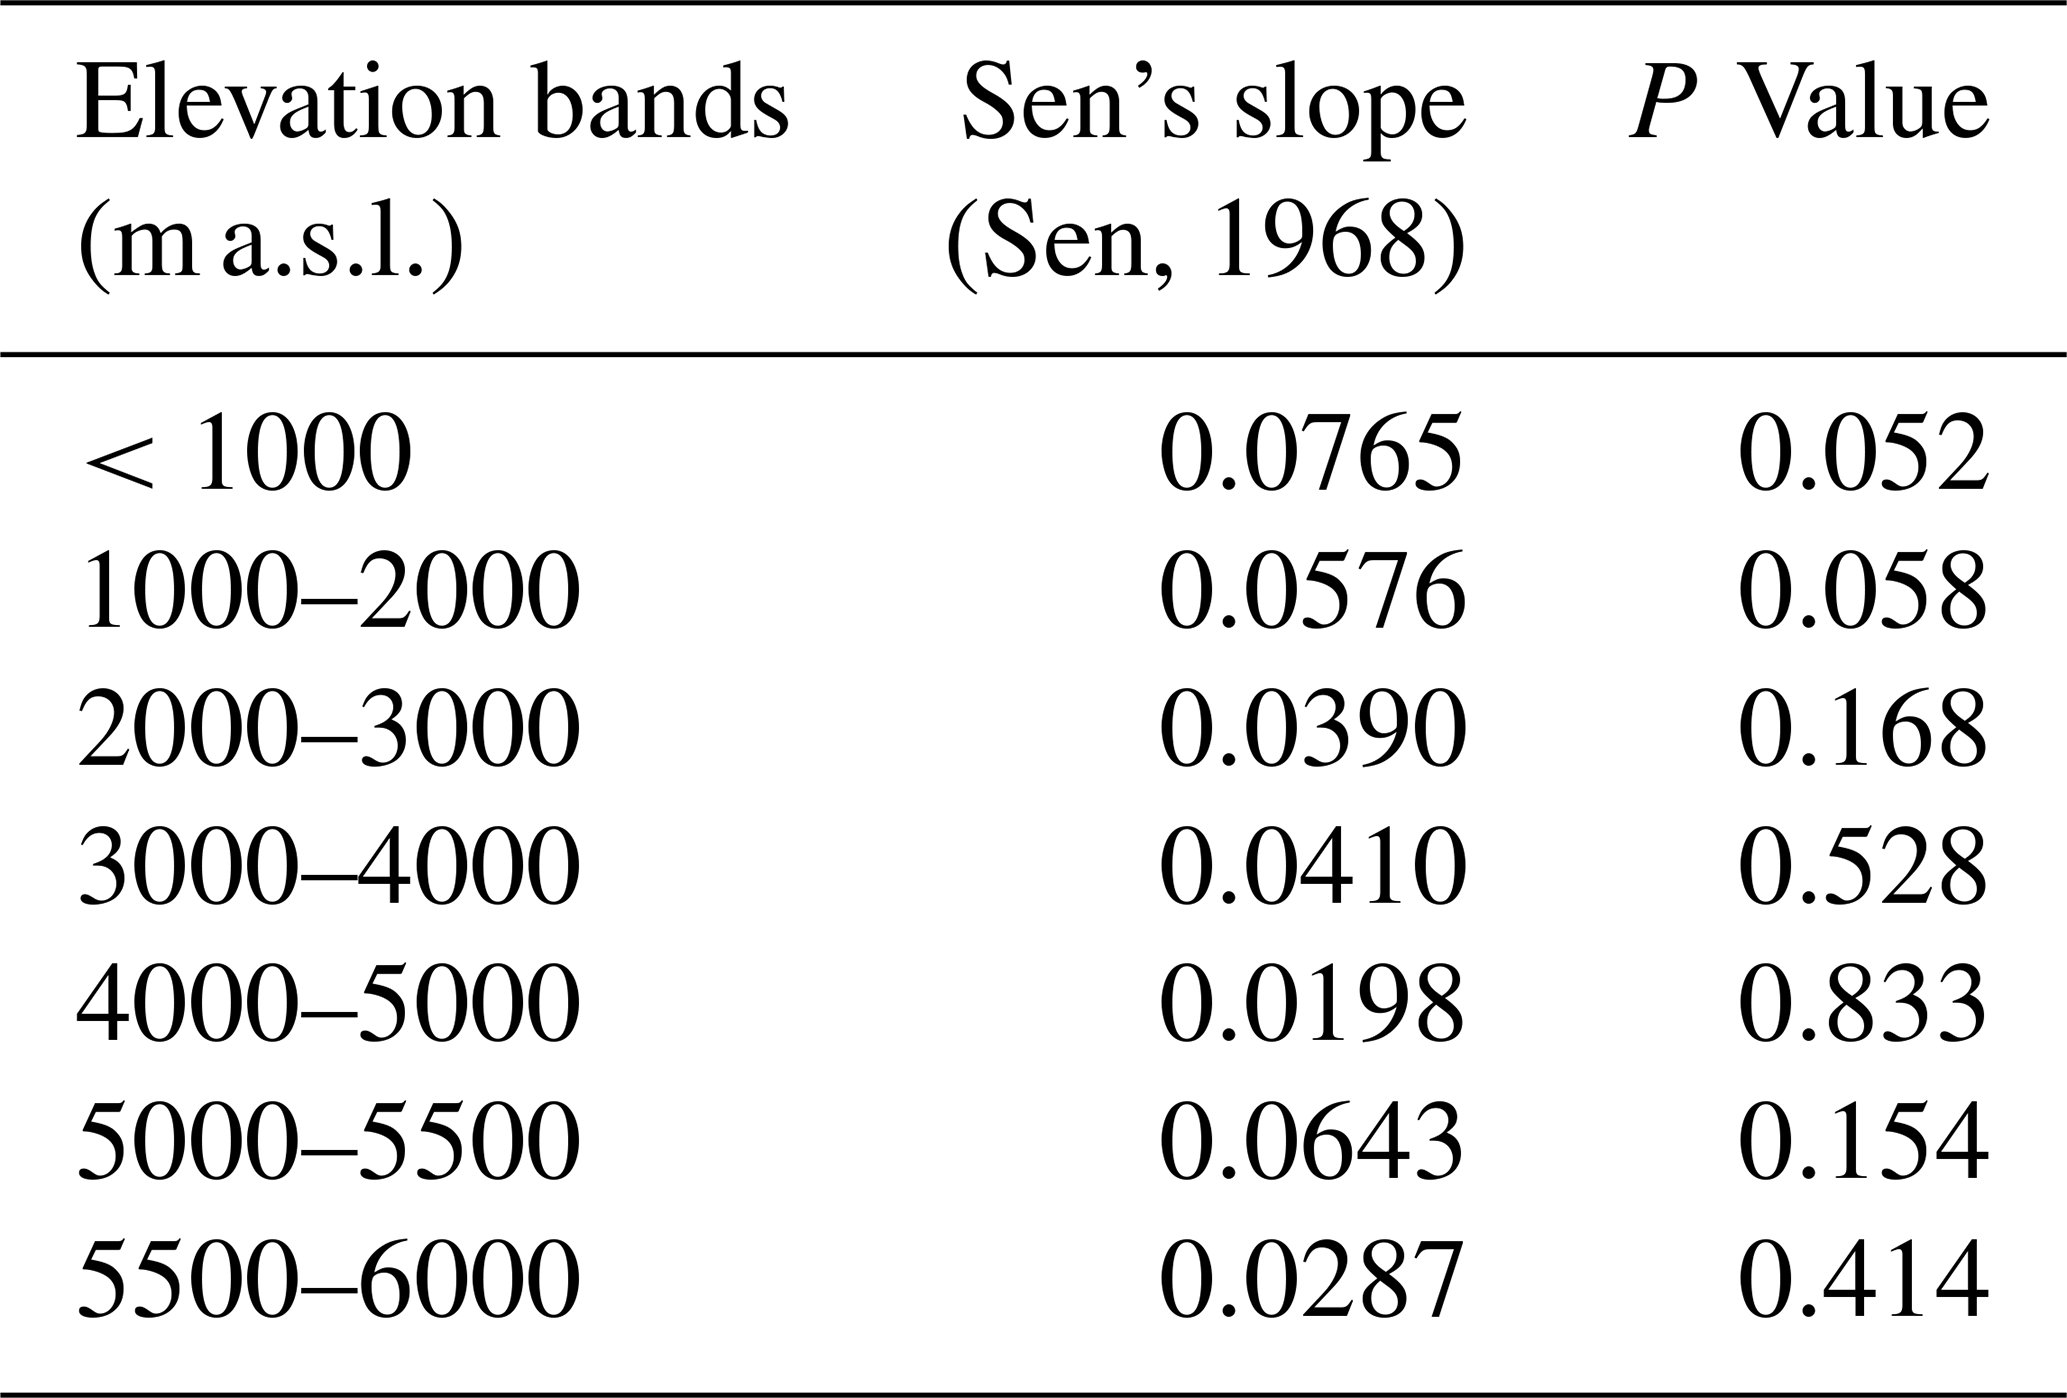
Figure 9 shows a strong negative correlation between land surface temperature and snow cover across elevation bands in the Upper Karnali Basin. Tau values range from −0.43 to −0.79. The correlation is strongest between 3000 and 5000 m a.s.l. (Tau = −0.77 to −0.79) and 5000–5500 m a.s.l. (Tau = −0.75), with all p values <0.01, confirming statistical significance. Even at 5500–6000 m a.s.l. (Tau = −0.43, p=0.00353), snow cover continues to decline. The impact is most severe at mid-to-high elevations, where warming accelerates snowmelt and glacier retreat, highlighting the vulnerability of the Upper Karnali Basin's hydrological balance to climate change.
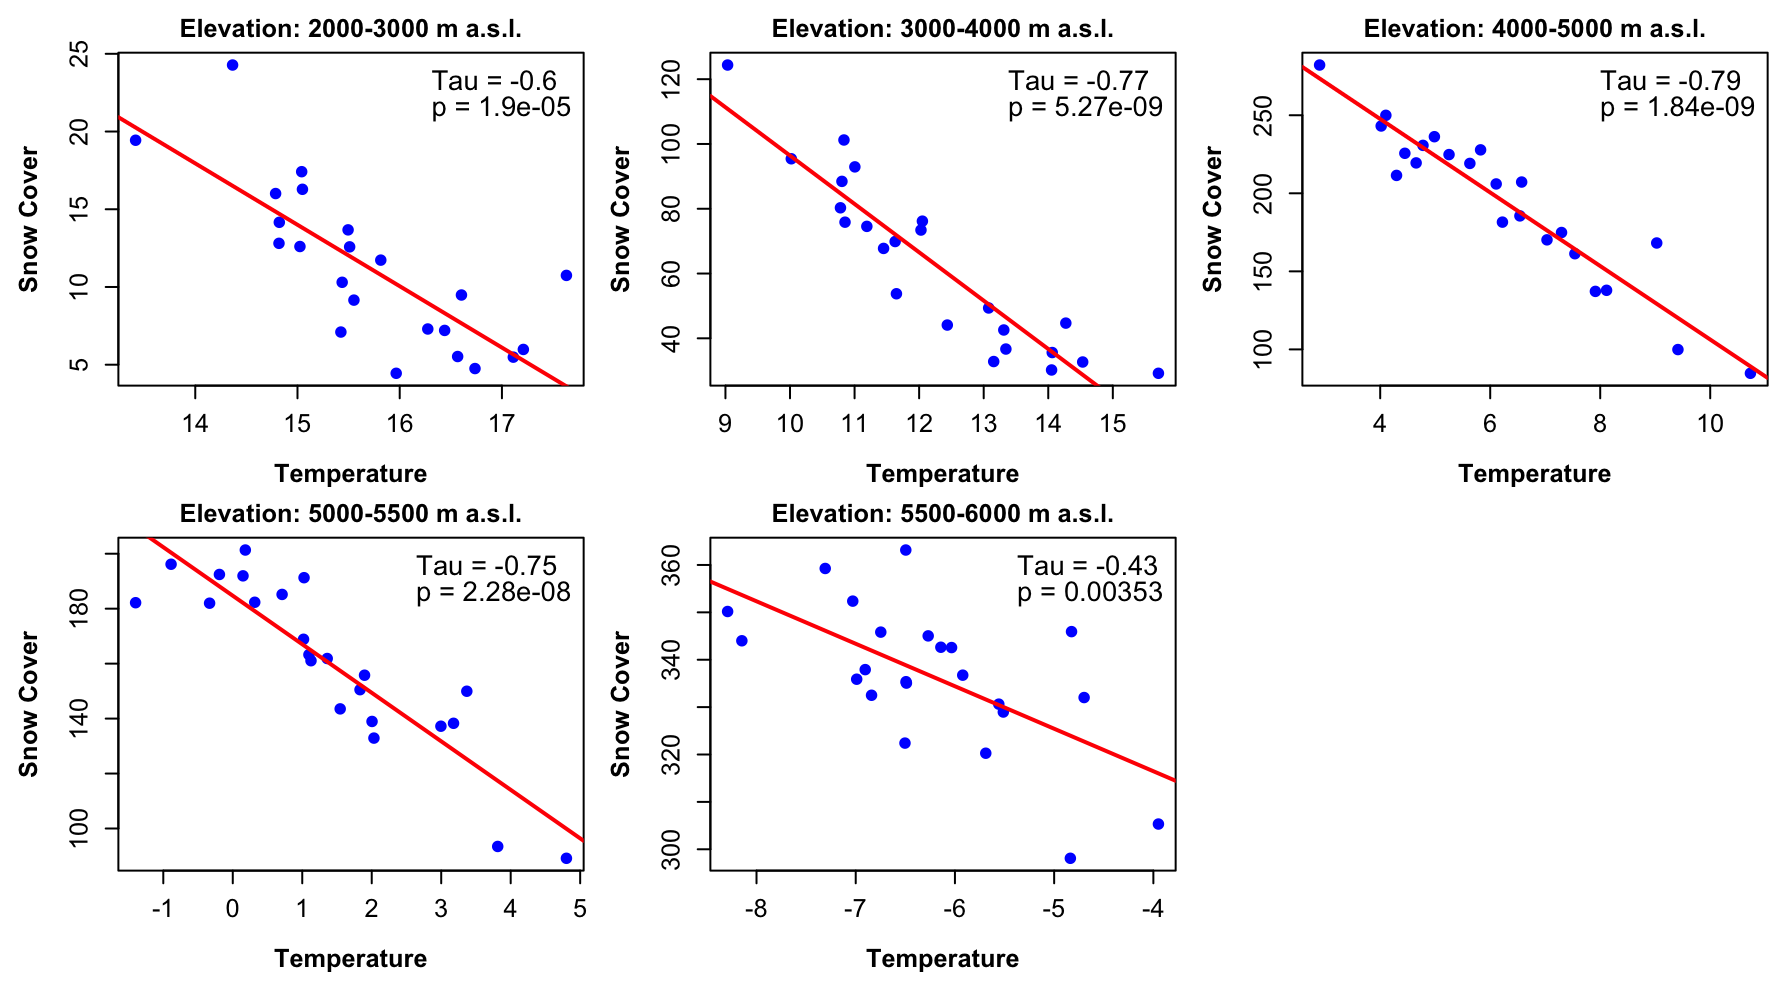
Figure 9Relationship between snow cover and temperature (°C) across elevation zones in the Upper Karnali Basin (2002–2024). The correlation (Kendall's Tau) shows a strong negative association at all elevations, especially between 3000–5500 m a.s.l., where warming has significantly reduced snow cover. Note: Elevation bands below 2000 m are excluded due to minimal snow presence, high interannual variability, and limited data reliability.
4.5 Snow Cover Trend in Glacier Basins (Landsat Data)
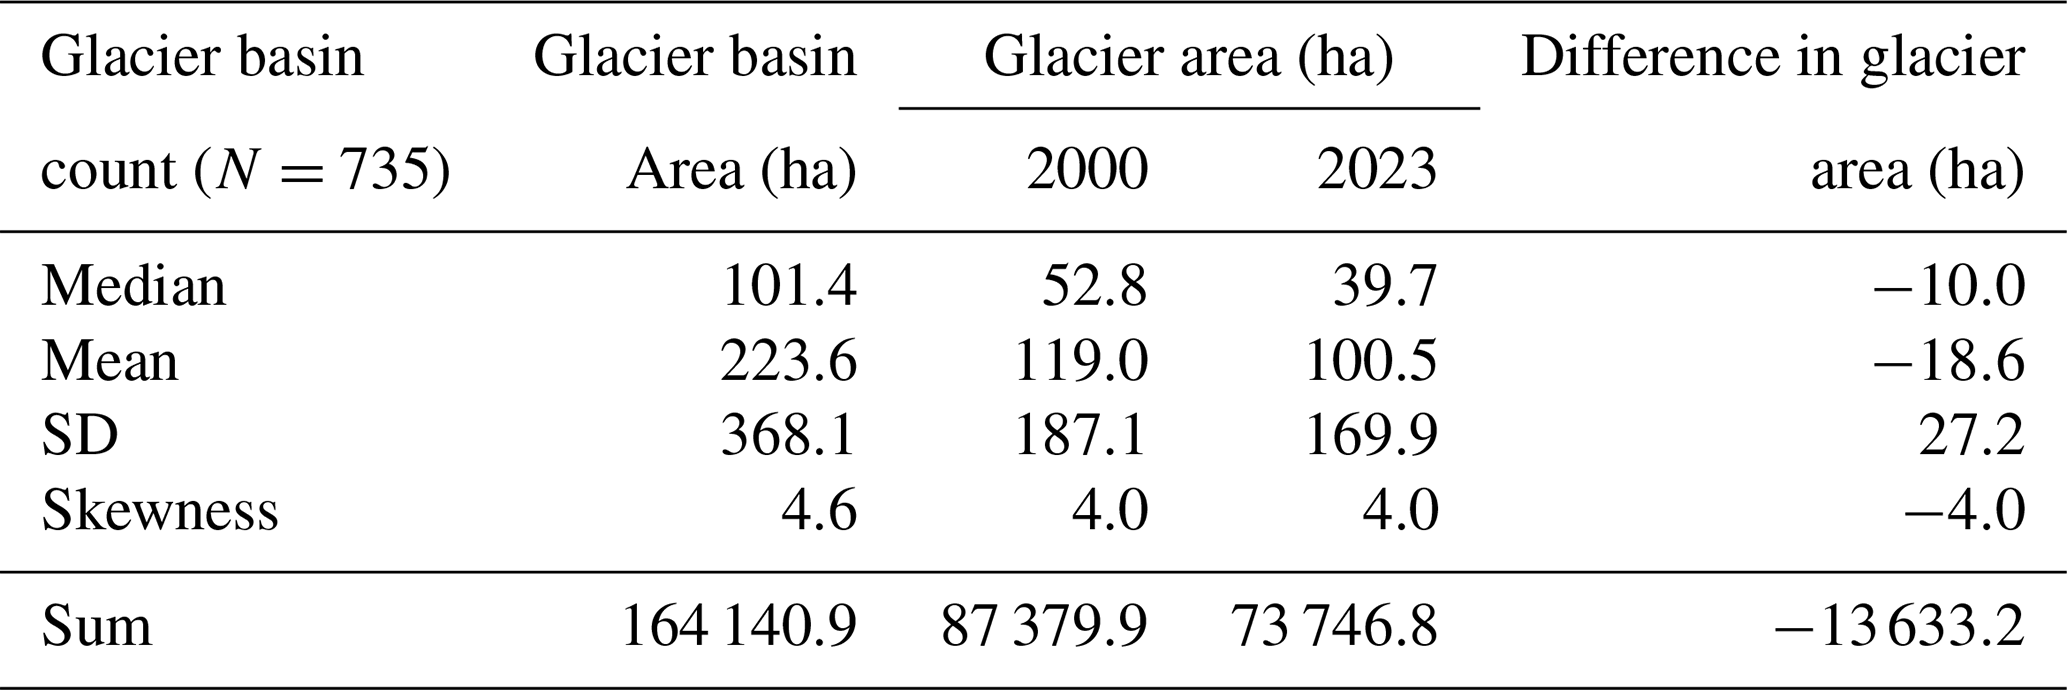
We examined snow cover trends using Landsat data in 735 glacier basins, each containing at least one glacier in 2000 that was greater than 10 ha, which are crucial for assessing glacial status, water security, and climate change impacts (Table 4). The minimum altitude of the glacier basin, where all tributary glaciers converge, was considered the outlet of the glacier basin. In these basins, snowfall replenishes the ice lost to melting, contributing to glacier stability. Reduced snow cover in the glacier basins accelerates negative mass balance, leading to glacier retreat. These glacier basins are located at a minimum altitude above 4000 m a.s.l., with an average altitude of approximately 5100 m a.s.l. Twenty-five and seventy-five percent of the basins lie below 4800 and 5330 m a.s.l., respectively. In addition to other meteorological parameters, current temperature trends and albedo patterns play a critical role in glacier mass balance (Dowson et al., 2020; Ye and Tian, 2022). Higher temperatures directly increase the snowmelt rate, and a decrease in the reflectivity of solar radiation causes more solar energy to be absorbed by the glacier surface, leading to accelerated melting. Declining permanent snow cover in the glacier basin disrupts the glacier mass balance, affecting glacier persistence, altering water availability, and accentuating climate-driven environmental changes.
The data reveal a significant decline in glacier area across 735 glacier basins between 2000 and 2023. The mean glacier area decreased from 119.0 ha in 2000 to 100.5 ha in 2023, reflecting an average loss of 18.6 ha per basin. The total glacier area shrank by 13 633.2 ha, indicating widespread glacier retreat. The percentage of glacier area relative to the total basin area declined from 53.23 % in 2000 to 44.93 % in 2023. Statistical tests show high skewness (>3.9), suggesting that a few large glaciers dominate the dataset. The Shapiro-Wilk test (p<0.001) confirms a non-normal distribution.
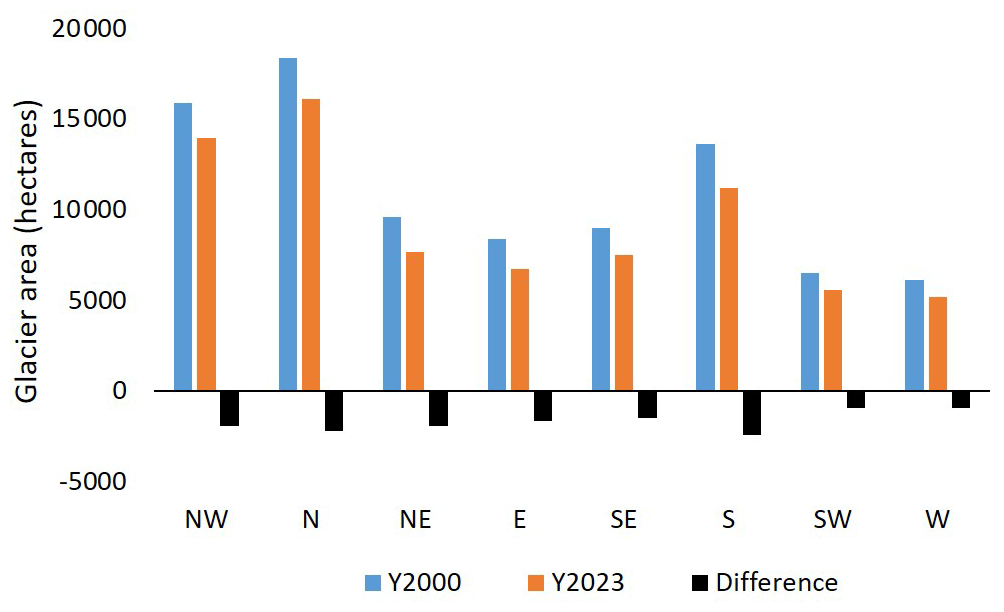
The glacier area has declined significantly across all basin orientations from 2000 to 2023, with basins facing north, northwest, and northeast experiencing the largest losses, totaling 6126.9 ha (Fig. 10). Glaciers on northeast, east, and south-facing slopes exhibit the highest relative percentage loss. This consistent decline across all directions underscores the ongoing impact of climate change on the region's glacier-fed water resources.
Analysis of snow cover trends indicates that approximately 59 % of glacier basins (n=735) exhibit statistically significant negative correlations (p<0.05) from January to March. Among these, basins with a correlation coefficient (r) less than −0.44 account for 16.3 % of the total (Figs. 11, 12, and 13). Basins with moderate negative correlations, ranging from −0.44 to −0.30, represent about 19 % of the total. Additionally, 36 % of basins show positive correlations, with 3 % being statistically significant and 13 % displaying a moderate correlation. The prevalence of glacier basins with negative correlations suggests a broader regional trend of declining winter snow cover (January to March).
Similarly, from May to July, all 15 cloud-free glacier basins exhibit a declining trend in snow cover from 2002 to 2024. Twelve of these basins show a moderate negative correlation (). The snow cover trend during July to September and October to December also indicates a decline. Sixty-two percent of the 70 glacier basins display a statistically significant negative correlation (p<0.05).
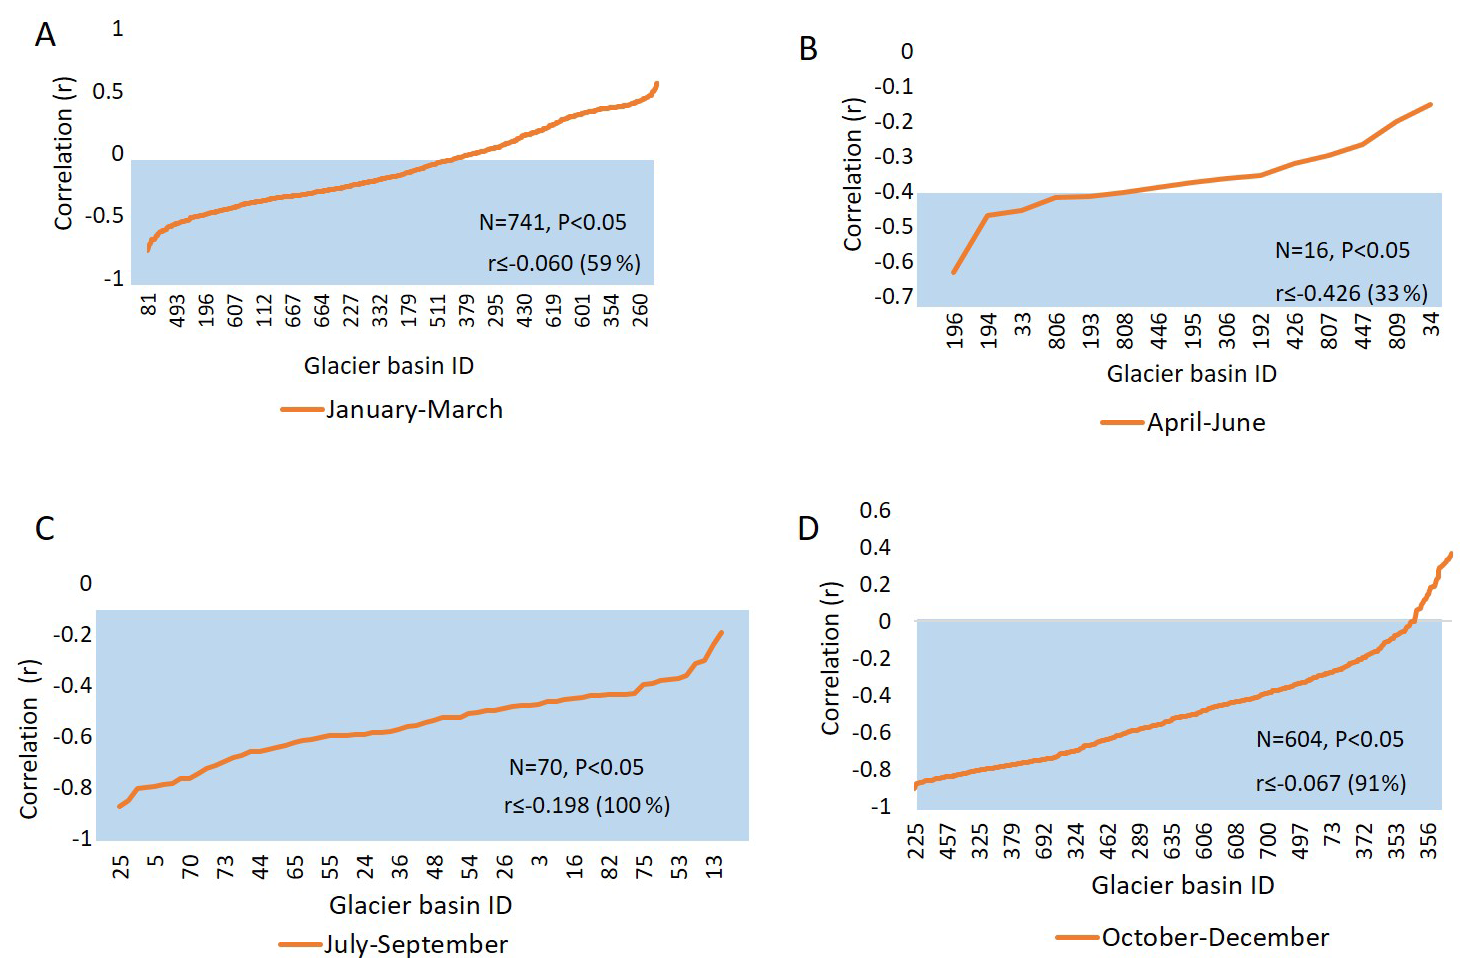
Figure 11The correlation showing the snow cover change between 2002 and 2024 in different glacier basins.
The snow cover trend between July and September and between October and December over 22 years also demonstrated a consistent decline across all glacier basins. Of the 604 basins selected for analysis, approximately 91 % showed a statistically significant negative correlation (p<0.05), and 15 % of the glacier basins exhibited a moderate negative correlation, with r values ranging from −0.47 to −0.30 (Figs. 11–13). The snow cover in the remaining basins showed a weak negative correlation but still indicated a decline over the period.
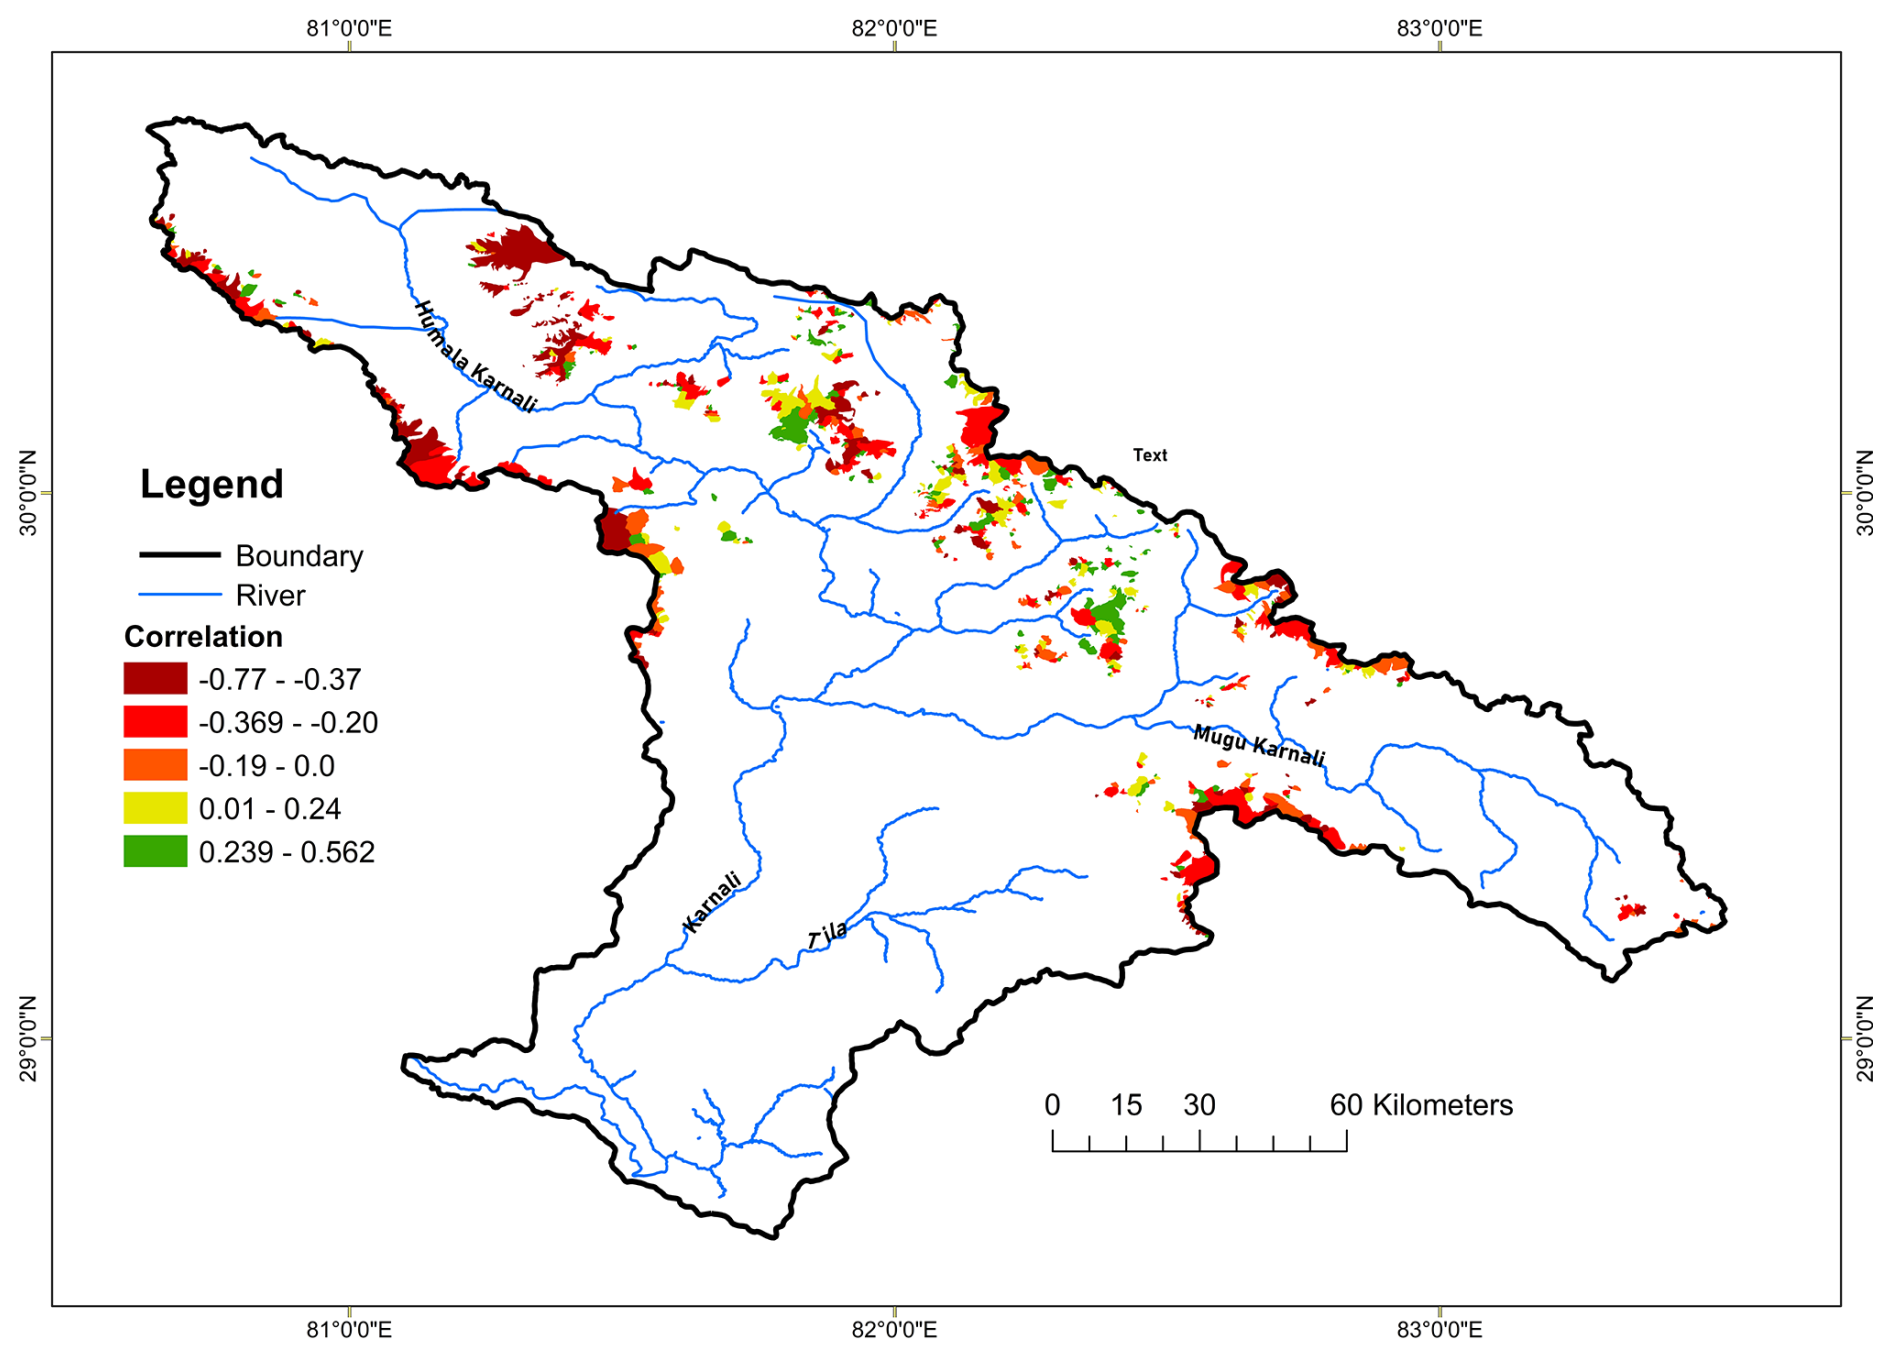
Figure 12Snow cover trend on the Glacier Basins for January–March between 2000–2023 (Landsat 5, 7, and 8).
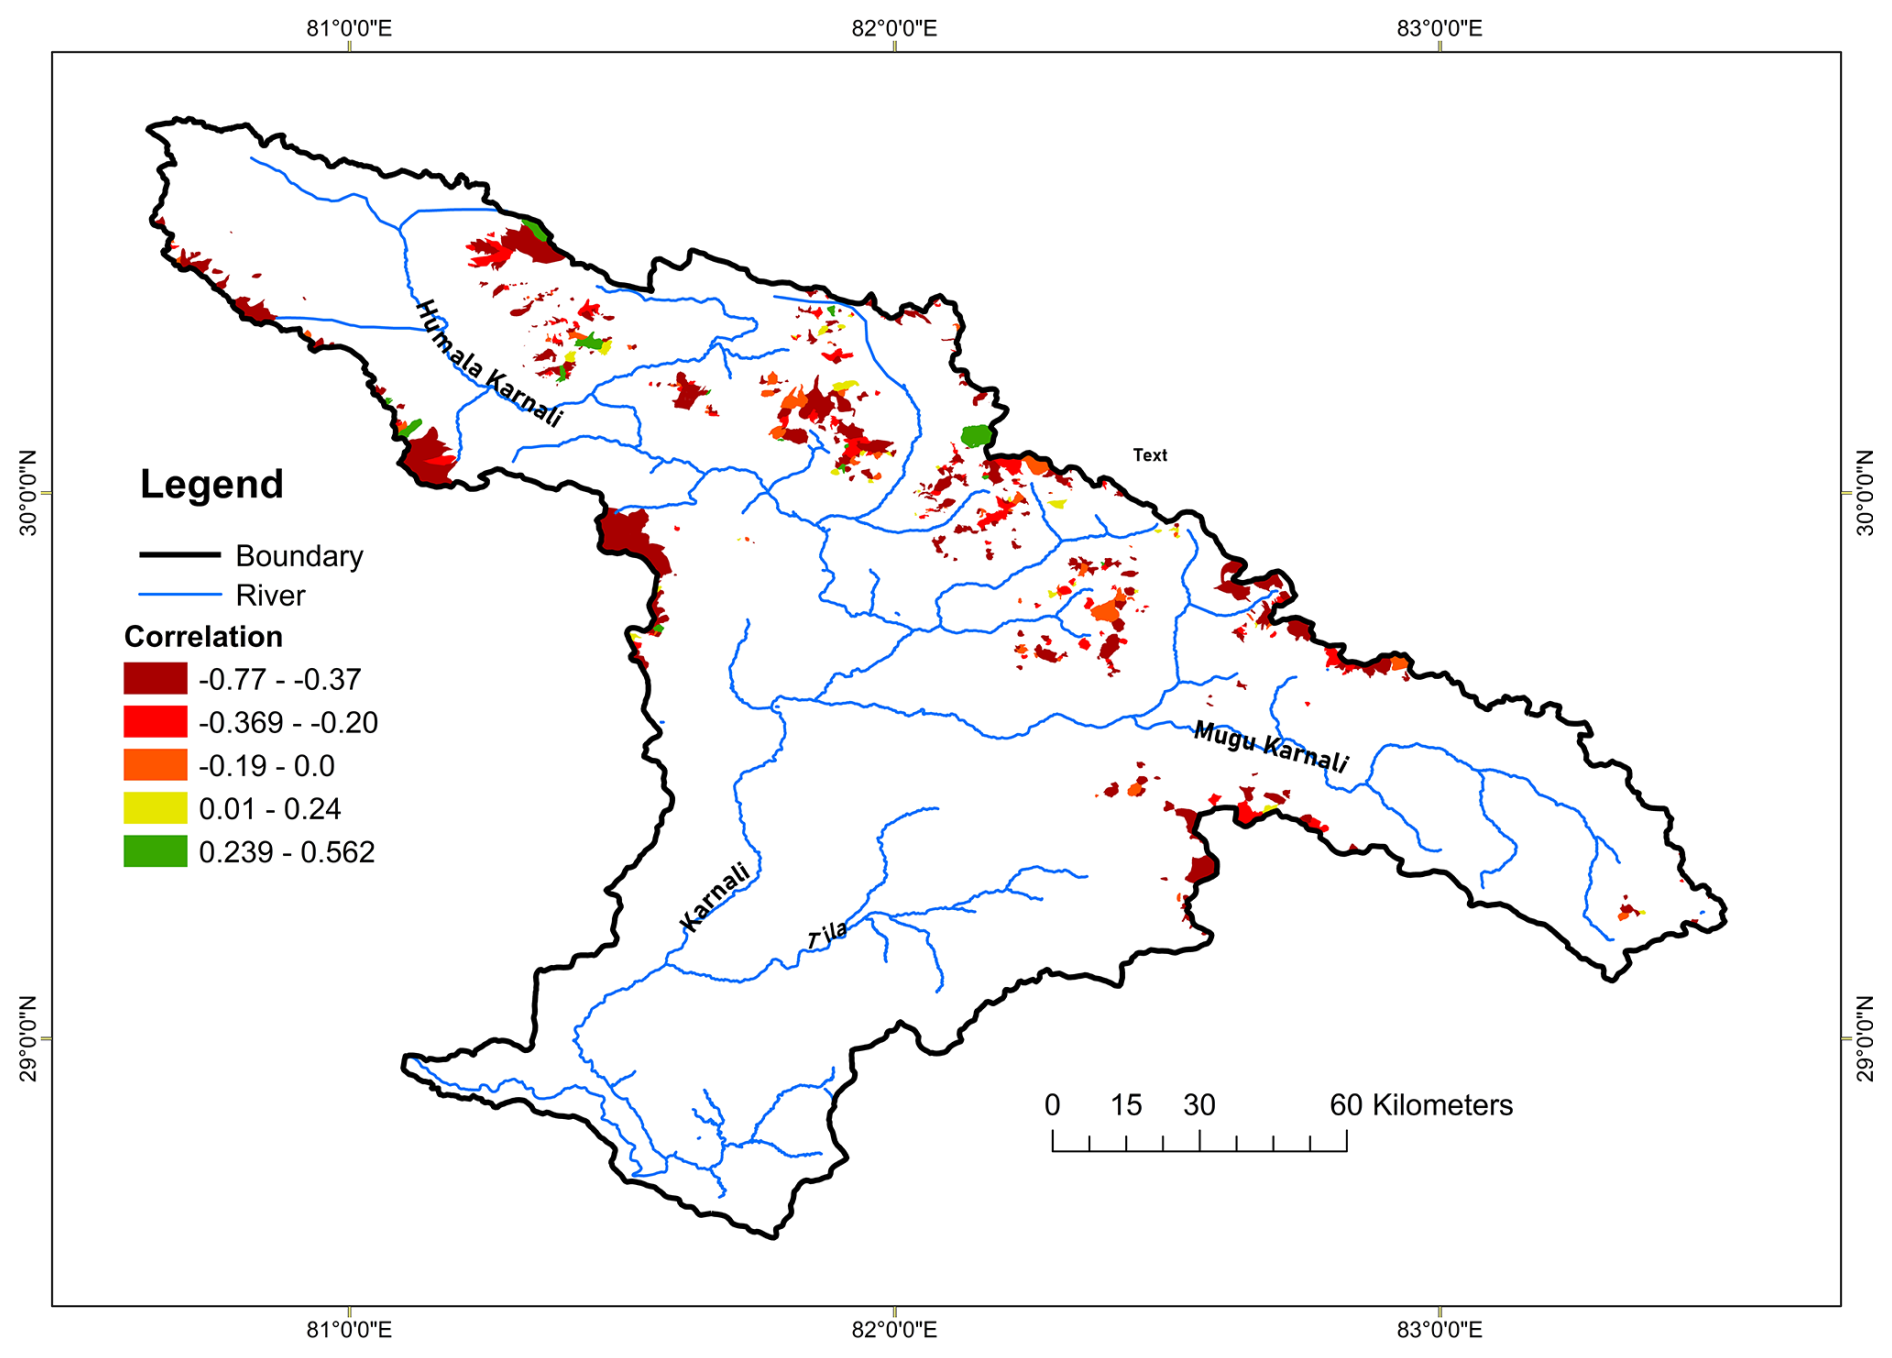
Figure 13Snow cover trend on the glacier basins for October–December between 2000–2023 (Landsat 5, 7, and 8).
4.6 Snowline Shift across Elevations
Snow-covered areas were derived from Landsat 7, 8, and 9 imagery by classifying snow using the Normalized Difference Snow Index (NDSI) algorithm to analyze changes in the snowline. This analysis was performed on the Google Earth Engine (GEE) platform. Snow pixels were detected using an NDSI threshold of >0.4. The elevation-wise distribution of snow pixels was then calculated. To determine the minimum elevation of the snowline and its shift from 2002 to 2024, three statistical thresholds were applied: the 10th, 25th, and 50th percentiles of the snow cover distribution across different elevations.
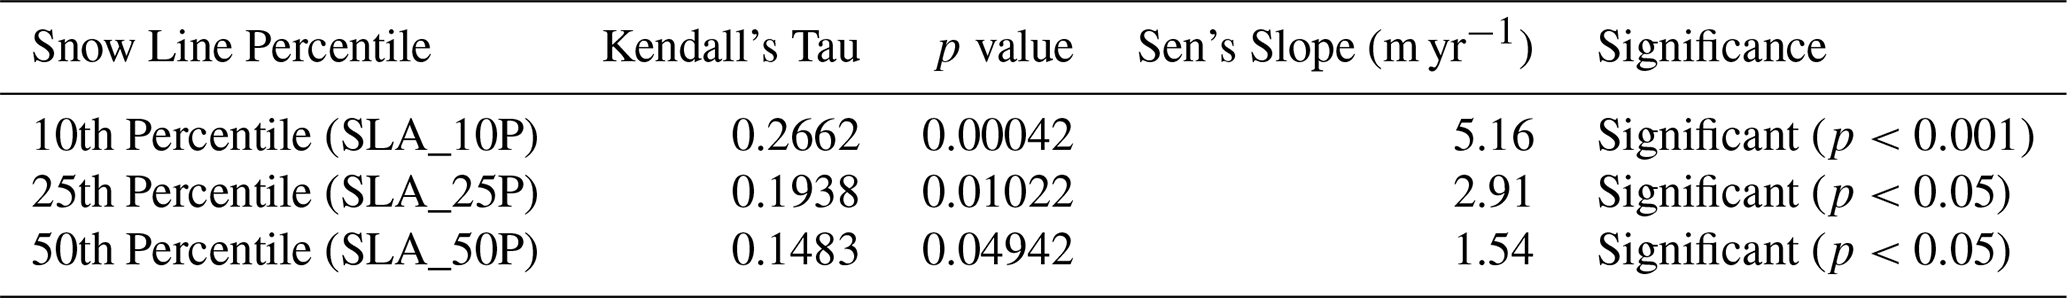
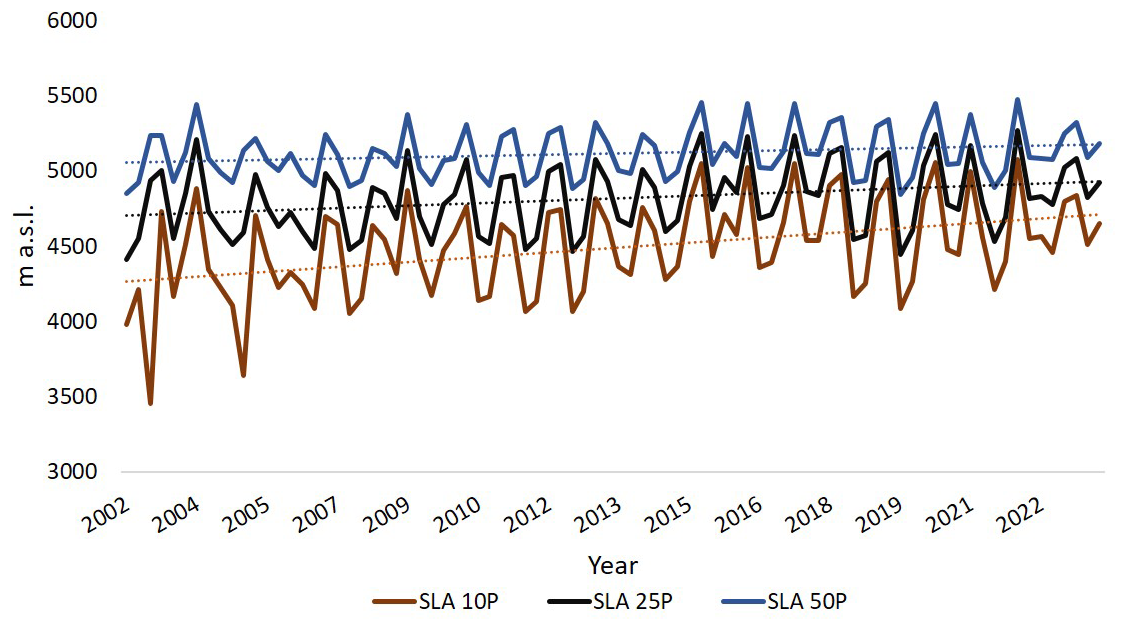
The analysis of snowline altitude data from 2002 to 2024 reveals a significant upward trend across all percentiles (Fig. 14). The 10th percentile shows the most significant increase, with a Kendall's tau of 0.2662 and a Sen's slope of approximately 5.16 m yr−1, indicating that the lower snowline is rising rapidly (Table 5). The 25th percentile presents a moderate yet statistically significant trend, with a Kendall's tau of 0.1938 and a Sen's slope of about 2.91 m yr−1. In contrast, the 50th percentile shows a gentler trend, with a Kendall's tau of 0.1483 and a Sen's slope of around 1.54 m yr−1, both of which remain statistically significant (p<0.05). Collectively, these findings suggest that the snowline is shifting to higher elevations, reflecting broader climatic changes that impact lower elevations more intensely than the median snowline altitude.
Table 5Statistical analysis of snow line altitude trends using Kendall's Tau and Sen's slope.
This study provides valuable insights into the interactions between snow and ice cover in the Upper Karnali Basin (UKB) and the influencing climatic and topographic factors. The results reveal significant trends and variations in snow cover, glacial retreat, and snowline elevation, consistent with broader climate change patterns observed in the Himalayan region. Below, we discuss the key findings in relation to existing literature and their implications for water resources, ecosystems, and local communities.
The study of the Upper Karnali Basin from 2002 to 2024 offers significant insights into the relationship between snow cover area (SCA), temperature, and precipitation. The annual average SCA is 872 km2, with the highest snow cover occurring from January to March (1528±333 km2) and the lowest from July to September (169±38.3 km2). The findings indicate a gradual decline in snow cover across the Upper Karnali Basin (UKB) over this period, with an average loss of approximately 3.99 km2 yr−1.
There is a strong to moderate negative correlation between snow cover and temperature across all seasons ( to −0.77, p<0.05), signifying that higher temperatures result in reduced snow cover. In contrast, precipitation shows a positive correlation with snow cover during winter (January to March and October to December). The reduction in snow cover during the winter months (January–March) suggests a potential shift in precipitation patterns, with more precipitation falling as rain rather than snow. The winter and pre-monsoon snowpack in the western Himalayas is heavily influenced by the Westerly wind system, which is a key source of snowfall in the UKB (Syed et al., 2006; Dimri and Dash, 2012). Consequently, the decline in winter snow cover may be attributed not only to temperature-induced changes in precipitation but also to a possible weakening or alteration of the Westerlies, which warrants further investigation. Such changes could lead to a decrease in overall moisture inflow (Yadav et al., 2009).
This shift is temperature-dependent and, consequently, elevation-dependent, leading to increased snowmelt consistent with global warming trends (Wester et al., 2019). During the summer months (April to September), precipitation negatively correlates with snow cover, as it predominantly falls as rain, further accelerating snowmelt. Notably, the period from July to September shows a statistically significant decrease in snow cover (Sen's Slope = −2.87, p<0.05), primarily driven by warmer temperatures and increased rainfall during the summer monsoon.
Examining snow cover patterns in the UKB sub-basins reveals notable seasonal and spatial variations. The Humla Karnali sub-basin has the largest average snow cover from January to March, while downstream areas such as Tila and Kawari exhibit less snow cover.
The interannual variability in snow cover highlights the sensitivity of the snowpack to changing temperature and precipitation patterns. This variability significantly affects water availability, as the observed reduction in snow cover could exacerbate water scarcity during the dry season, impacting millions who rely on snowmelt for irrigation, drinking water, and hydropower generation (Immerzeel et al., 2020; Pritchard, 2019). The strong negative correlation in downstream Karnali (, p<0.05) further supports the declining trend in snow cover, which threatens water availability and ecosystem services in the region (Wester et al., 2019).
The outcomes highlight the vulnerability of the UKB to climate change, as rising temperatures and changing precipitation patterns result in reduced snow cover. Implementing adaptive water management strategies is essential to mitigate the impacts on water resources and local communities.
The findings on snow cover dynamics across elevation zones in the Upper Karnali Basin reveal significant elevation-dependent patterns, reflecting the influence of temperature fluctuations and global warming. At lower elevations (≤ 2000 m a.s.l.), snow cover exhibits a weak positive correlation (0.12–0.43), likely due to occasional snowfall during brief cold spells and a transition between rain and snow (Pendergrass, 2020). These zones experience high year-to-year variability (CoV ∼41 %–43 %), making trends less reliable and warranting cautious interpretation. Similar elevation-sensitive variability has also been reported in other Himalayan basins (Pepin et al., 2015).
The transition from weak negative correlations between snow cover, elevation, and year above 2300 m a.s.l. to the strongest negative correlation at 6100–6200 m a.s.l. () aligns with evidence of elevation-dependent warming (EDW). In this phenomenon, higher altitudes experience accelerated warming, resulting in reduced snow accumulation and increased melt rates. The sharp increase in mean snow cover above 5000 m a.s.l. corresponds to permanent snow and glacier zones. However, the decline in inter-annual variability (coefficient of variation, CoV) indicates a consistent reduction in snow cover, particularly at mid-to-high elevations (3000–5000 m a.s.l.).
The nonlinear relationship between elevation and inter-annual snow cover variability (CoV) is particularly insightful. At elevations of 3000 m above sea level (a.s.l.) or below, the CoV reaches 41 %–43 %, reflecting transitional zones where slight temperature fluctuations determine the precipitation phase (rain versus snow). Above 3000 m a.s.l., the CoV decreases to 25 %–30 % as conditions remain persistently below freezing; however, the dominant driver shifts to insolation and temperature-modulated melt rates. This observation aligns with Ren et al.'s (2023) findings on Tibetan Plateau glaciers, where albedo feedbacks dominate mass balance above 5000 m a.s.l.
The strong negative correlation between land surface temperature and snow cover (Tau = −0.43 to −0.79) underscores the impact of rising temperatures on the snowpack. The most severe declines occur between 3000 and 5000 m above sea level (m a.s.l.), where warming accelerates snowmelt and glacier retreat, threatening water availability for river flows, agriculture, and hydropower (Immerzeel et al., 2020; Bolch et al., 2012).
Between 2000 and 2023, glacier basins in the Upper Karnali Basin experienced significant ice and snow loss. The mean glacier area per basin declined from 119.04 to 100.47 ha, representing with an average loss of 18.6 ha. While it occurred consistently across all aspects, north-facing basins (N, NW) saw the largest total area decline. This trend, driven by rising temperatures and reduced precipitation, results in a negative mass balance (Pepin et al., 2022; Ren et al., 2024; Ye and Tian, 2022), threatening the persistence of glaciers and altering critical water resources.
Snow cover trends in glacier basins reveal a consistent decline across all seasons. From January to March, a majority (59 %) of the 735 basins analyzed exhibit a statistically significant negative correlation (p<0.05), with 16.3 % of all basins showing a substantial decline (). The trend is even more pronounced during the post-monsoon and ablation seasons (October–December). From July to September, 62 % of basins (n=70) show a significant negative correlation, and in October–December, this figure rises to 91 % (n=604). This widespread reduction in snow cover is linked to rising temperatures, which increase snowmelt rates and reduce albedo, further accelerating glacier retreat (Dowson et al., 2020). These trends underscore the vulnerability of the region's cryosphere to climate change, with profound implications for water security and regional hydrology.
The seasonal snowline in the Upper Karnali Basin is rising steadily at rates of 5.6 m per year (10th percentile), 2.91 m per year (25th percentile), and 1.54 m per year (50th percentile). Although these rates are more conservative than many regional estimates, our findings align with the broader Himalayan trend of snowline elevation. Recent studies report faster increases, such as approximately 6.7–7.3 m per year in the Ganga–Brahmaputra basins (Dixit et al., 2024) and roughly 8–14 m per year in several Nepalese catchments (Sasaki et al., 2024), while the Langtang Basin shows a similar increase of about 2.2 m per year (Pradhananga et al., 2025). This pattern indicates a consistent retreat of seasonal snow cover to higher elevations, reducing the potential for snow accumulation to sustain glacier mass balance.
Feedback mechanisms and future projections
The correlation between temperature and snow cover (τ ranging from −0.43 to −0.79 across different elevations) confirms the presence of a reinforcing snow–albedo feedback in the Upper Karnali Basin (UKB). Increasing land surface temperatures reduce snow cover, lowering surface albedo and increasing the absorption of shortwave radiation. This process causes localized warming of approximately 0.8 to 1.2 °C, as estimated through Sen's slope analysis, further promoting melting and accelerating the feedback loop. Similar snow–albedo feedback mechanisms have been observed across the central and eastern Himalayas (Brun et al., 2015; Bhattacharya et al., 2021; Salerno et al., 2023), underscoring the regional consistency of cryospheric amplification.
In addition to snow cover analysis, glacier change data (Ghimire et al., 2025b) were integrated with long-term temperature and precipitation records to assess cryospheric variability. Relationships among temperature, snow cover, and glacier extent across elevation bands were quantified using Kendall's τ and Sen's slope, providing estimates of warming trends and snowline responsiveness. Future cryospheric conditions were simulated using a degree-day, elevation-band glacio-hydrological model forced with bias-corrected CMIP6 (NEX-GDDP) climate projections under the SSP1-2.6 and SSP2-4.5 scenarios, enabling projections of glacier and snow cover evolution through 2100 (Ghimire et al., 2025b).
Above 5000 m a.s.l., Sen's slope analysis indicates a mean warming rate of +0.064 °C per year, comparable to the rates observed at mid-elevations (approximately +0.058 °C per year between 1000 and 2000 m). This elevation-dependent warming accelerates glacier thinning and shifts the snow–rain boundary upward, thereby reducing accumulation periods and causing earlier melt onset. Similar signs of cryospheric change have been observed in the central Himalaya, with average annual temperature increases of about 0.05–0.07 °C yr−1 since the late 20th century (Shrestha et al., 1999; DHM, 2017) and regional glacier mass losses of roughly 0.2–0.6 m w.e. yr−1 since the early 2000s (Kääb et al., 2012; Bolch et al., 2019).
Under low-emission scenarios such as SSP1-2.6, high-altitude temperatures are projected to increase by approximately 1 °C by 2100. Under the moderate SSP2-4.5 scenario, temperature increases could reach 2 °C or more. Consequently, glacier areas are expected to decrease by 47 %–69 %, and snow-covered areas are projected to decline by 19 %–30 % (Ghimire et al., 2025b). This would transform the basin's hydrology from nival (snowmelt-dominated) to pluvial (rain-dominated), increasing flood risks during monsoons and susceptibility to drought in dry seasons.
These forecasts are consistent with recent studies of Himalayan glacier change, which show basin-scale glacier-area reductions of 40 %–60 % by mid-century under continuing warming (Bhattacharya et al., 2021; Hock et al., 2019). Recent research has also shown that Himalayan glaciers can cause local cooling and drying in their immediate environs, impacting temperature and precipitation patterns and so future mass balance (Salerno et al., 2023). Similar amplification mechanisms are also observed in the Andes and Alps, where rapid glacier retreat and albedo-induced warming reflect trends seen in the Himalayas (Rabatel et al., 2013; Vuille et al., 2018; Dussaillant et al., 2019; Beniston and Stoffel, 2014; Zemp et al., 2019).
The study of snow and glacier cover dynamics in the Upper Karnali Basin from 2002 to 2024 reveals a persistent decline in snow cover, glacier area, and snowline elevation, driven by rising temperatures and changes in precipitation patterns.
The annual snow-covered area (SCA) has decreased by approximately 3.99 km2 yr−1, with the most significant reductions occurring during the July–September monsoon period. This decline in snow cover is statistically correlated with rising temperatures, highlighting the impact of climate change on seasonal snow accumulation and melt cycles. Variability in winter snow cover suggests changes in snowfall patterns rather than a uniform decrease.
Notable seasonal and spatial differences in snow cover patterns are observed in the sub-basins of the UKB during two periods: January–March and October–December. The upstream sub-basins experience more consistent snowfall than the downstream basins. During October–December, snowfall is inconsistent across all basins, with particularly high variability in the China Karnali, Tila, and downstream Karnali basins.
Elevation-dependent trend analysis confirms that snow cover at lower elevations (<2000 m a.s.l.) exhibits high interannual variability, whereas higher elevations (> 3000 m a.s.l.) show a significant long-term decline. The most pronounced reductions occur between 3000 and 5000 m a.s.l., where warming accelerates snowmelt and glacier retreat. The observed negative correlation between snow cover and rising temperatures confirms the climate-driven reduction in snowpack, exacerbating the risk of water shortages.
The study of glacier basins reveals widespread retreat, with the average glacier area decreasing from 119.05 ha in 2000 to 100.47 ha in 2023. Glacier retreat is most pronounced in north-facing basins (N, NW, NE), where melting exceeds accumulation. The continuous decline in snow cover across these basins indicates a persistent negative mass balance, threatening the long-term survival of the glaciers.
Additionally, the snow line is gradually shifting upward, with the 10th, 25th, and 50th percentiles rising by approximately 5.16, 2.91, and 1.54 m per year, respectively. This trend indicates a consistent loss of seasonal snow accumulation.
Given the current warming trends (∼0.0643 °C yr−1 above 5000 m a.s.l.), the Upper Karnali Basin (UKB) could experience a decline in glacier area by 47 %–69 % and a reduction in snow-covered area by 19 %–30 %. This shift would transform the hydrology from snowmelt-dominated (nival) to rainfall-dominated (pluvial), increasing the frequency of extreme weather events and altering regional water security dynamics. These findings underscore the urgent need for proactive water resource management, enhanced climate resilience strategies, and continuous monitoring of cryospheric changes to mitigate future risks. Policymakers must prioritize adaptation measures, such as improved water storage infrastructure and sustainable land-use practices, to ensure long-term water security in the Upper Karnali Basin and beyond.
The MODIS/Terra snow-cover product MOD10A2 (Version 6.1) is available from the NASA National Snow and Ice Data Center Distributed Active Archive Center (NSIDC DAAC) at https://doi.org/10.5067/MODIS/MOD10A2.061 (Hall and Riggs, 2021). The MODIS/Terra land surface temperature product MOD11A2 (Version 6.1) is available from the NASA Land Processes Distributed Active Archive Center (LP DAAC) at https://doi.org/10.5067/MODIS/MOD11A2.061 (Wan et al., 2021a). The MODIS/Aqua land surface temperature product MYD11A2 (Version 6.1) is available from the NASA LP DAAC at https://doi.org/10.5067/MODIS/MYD11A2.061 (Wan et al., 2021b). Landsat Collection 2 Level-2 products are available from the US Geological Survey (USGS): Landsat 4–5 TM Level-2 at https://doi.org/10.5066/P9IAXOVV (EROS, 2020a), Landsat 7 ETM+ Level-2 at https://doi.org/10.5066/P9C7I13B (EROS, 2020b), and Landsat 8–9 OLI/TIRS Level-2 at https://doi.org/10.5066/P9OGBGM6 (EROS, 2020c). The NASA Earth Exchange Global Daily Downscaled Projections (NEX-GDDP) are available from the NASA Center for Climate Simulation (NCCS) at https://www.nccs.nasa.gov/services/data-collections/land-based-products/nex-gddp (last access: 19 October 2025).
RapidEye satellite imagery from 2010 was provided by the Government of Nepal through the Nepal Forest Research and Training Center (FRTC) under a research collaboration agreement. The data are protected by national data sovereignty and licensing restrictions and are not publicly accessible. Access can be requested from FRTC, pending approval by the Government of Nepal and adherence to licensing conditions.
The supplement related to this article is available online at https://doi.org/10.5194/tc-20-551-2026-supplement.
MG conceptualized the research, designed the methodology, conducted fieldwork, analyzed the data, and drafted the manuscript. DS and RC assisted with proposal writing, research design, fieldwork, and data analysis. AT, TPPS, KPS, SBG, and SD contributed to procuring remote sensing and climate data. PB and SK were responsible for procuring and updating MODIS data. WY reviewed the manuscript and provided feedback to enhance its quality. NT and JK assisted with GIS analysis. All authors contributed to revising the manuscript and provided input before submission.
The contact author has declared that none of the authors has any competing interests.
Publisher's note: Copernicus Publications remains neutral with regard to jurisdictional claims made in the text, published maps, institutional affiliations, or any other geographical representation in this paper. The authors bear the ultimate responsibility for providing appropriate place names. Views expressed in the text are those of the authors and do not necessarily reflect the views of the publisher.
This article is part of the special issue “Improving the contribution of land cryosphere to sea level rise projections (TC/GMD/NHESS/OS inter-journal SI)”. It is not associated with a conference.
We express our gratitude to the Director of Tribhuvan University's Research Coordination and Development Council (RCDC) for supporting the project titled “State and Dynamics of the Cryosphere of the Upper Karnali Basin, Associated Hazards, and Implications for Water Resources and Livelihood” (Project Code TU-NPAR-077/78-ERG-15). This paper is a product of that project. We appreciate the Evaluation and Monitoring Committee of RCDC for their insightful feedback and suggestions, which greatly enhanced the manuscript. We also thank the University Grants Commission for providing research funding. The authors sincerely acknowledge the Sichuan Science and Technology Program (grant no. 2024YFHZ0248) for partial support. Additionally, we acknowledge the contributions of Google Earth Engine, ERA5, ESRI, and other open-access resources for providing satellite imagery and data.
This research was funded by the University Grants Commission (UGC), Kathmandu, through Tribhuvan University's Research Coordination and Development Council (RCDC) under the National Policy Area Research program (Project Code TU-NPAR-077/78-ERG-15). Partial funding was also provided by the Sichuan Science and Technology Program (grant no. 2024YFHZ0248).
This paper was edited by Valentina Radic and reviewed by two anonymous referees.
Bajracharya, S. R. and Shrestha, B. (Eds.): The status of glaciers in the Hindu Kush–Himalayan region, International Centre for Integrated Mountain Development (ICIMOD), Kathmandu, Nepal, 127 pp., 2011.
Bajracharya, S. R., Bajracharya, O. R., Baidya, S., Maharjan, S. B., and Shrestha, F.: Climate change impact on glaciers in the Langtang and Imja sub-basins of Nepal from late 70s to 2010, in: AGU Fall Meeting Abstracts, San Francisco, CA, 15–19 December, C31B-0278, 2014.
Beniston, M. and Stoffel, M.: Assessing the impacts of climatic change on mountain water resources, Sci. Total Environ., 493, 1129–1137, https://doi.org/10.1016/j.scitotenv.2013.11.122, 2014.
Bhattacharya, A., Bolch, T., Mukherjee, K., King, O., Menounos, B., Kapitsa, V., Neckel, N., Yao, T., and Li, X.: High Mountain Asian glacier response to climate revealed by multi-temporal satellite observations since the 1960s, Nat. Commun., 12, 4133, https://doi.org/10.1038/s41467-021-24180-y, 2021.
Bolch, T., Buchroithner, M. F., Kunert, A., and Kamp, U.: Automated delineation of debris-covered glaciers based on ASTER data, in: GeoInformation in Europe, edited by: Gomarasca, M. A., Millpress, Rotterdam, 403–410, ISBN 978-90-5966-061-8, 2007.
Bolch, T., Kulkarni, A., Kääb, A., Huggel, C., Paul, F., Cogley, J. G., Frey, H., Kargel, J. S., Fujita, K., Scheel, M., Bajracharya, S., and Stoffel, M.: The state and fate of Himalayan glaciers, Science, 336, 310–314, https://doi.org/10.1126/science.1215828, 2012.
Bolch, T., Shea, J. M., Liu, S., Azam, F. M., Gao, Y., Gruber, S., Immerzeel, W. W., Kulkarni, A., Li, H., Tahir, A. A., Zhang, G., and Zhang, Y.: Status and change of the cryosphere in the extended Hindu Kush Himalaya region, in: The Hindu Kush Himalaya Assessment: Mountains, Climate Change, Sustainability and People, edited by: Wester, P., Mishra, A., Mukherji, A., and Shrestha, A. B., Springer, Cham, 209–255, https://doi.org/10.1007/978-3-319-92288-1_7, 2019.
Bookhagen, B. and Burbank, D. W.: Toward a complete Himalayan hydrological budget: Spatiotemporal distribution of snowmelt and rainfall and their impact on river discharge, J. Geophys. Res.-Earth Surf., 115, F03019, https://doi.org/10.1029/2009JF001426, 2010.
Brun, F., Dumont, M., Wagnon, P., Berthier, E., Azam, M. F., Shea, J. M., Sirguey, P., Rabatel, A., and Ramanathan, Al.: Seasonal changes in surface albedo of Himalayan glaciers from MODIS data and links with the annual mass balance, The Cryosphere, 9, 341–355, https://doi.org/10.5194/tc-9-341-2015, 2015.
Desinayak, N., Prasad, A. K., El-Askary, H., Kafatos, M., and Asrar, G. R.: Snow cover variability and trend over the Hindu Kush Himalayan region using MODIS and SRTM data, Ann. Geophys., 40, 67–82, https://doi.org/10.5194/angeo-40-67-2022, 2022.
Dhital, M. R.: Geology of the Nepal Himalaya: Regional Perspective, Springer International Publishing, Cham, Switzerland, 583 pp., https://doi.org/10.1007/978-3-319-02496-7, 2015.
DHM: Observed Climate Trend Analysis in the Districts and Physiographic Regions of Nepal (1971–2014), Department of Hydrology and Meteorology, Government of Nepal, Kathmandu, Nepal, https://dhm.gov.np/climate-services/climate-publications (last access: 20 September 2025), 2017.
Dimri, A. P. and Dash, S. K.: Wintertime climatic trends in the western Himalayas, Clim. Change, 111, 775–800, https://doi.org/10.1007/s10584-011-0201-y, 2012.
Dixit, A., Goswami, A., Jain, S., and Das, P.: Assessing snow cover patterns in the Indus–Ganga–Brahmaputra River Basins of the Hindu Kush Himalayas using snow persistence and snow line as metrics, Environ. Chall., 14, 100834, https://doi.org/10.1016/j.envc.2023.100834, 2024.
Dowson, A. J., Sirguey, P., and Cullen, N. J.: Variability in glacier albedo and links to annual mass balance for the gardens of Eden and Allah, Southern Alps, New Zealand, The Cryosphere, 14, 3425–3448, https://doi.org/10.5194/tc-14-3425-2020, 2020.
Duan, S.-B., Li, Z.-L., Li, H., Göttsche, F.-M., Wu, H., Zhao, W., Leng, P., Zhang, X., and Coll, C.: Validation of Collection 6 MODIS land surface temperature product using in situ measurements, Remote Sens. Environ., 225, 16–29, https://doi.org/10.1016/j.rse.2019.02.020, 2019.
Dussaillant, I., Berthier, E., Brun, F., Masiokas, M., Hugonnet, R., Favier, V., Rabatel, A., Pitte, P., and Ruiz, L.: Two decades of glacier mass loss along the Andes, Nat. Geosci., 12, 802–808, https://doi.org/10.1038/s41561-019-0432-5, 2019.
EROS – Earth Resources Observation and Science Center: Landsat 4–5 Thematic Mapper Level-2, Collection 2 [dataset], US Geological Survey [data set], https://doi.org/10.5066/P9IAXOVV, 2020a.
EROS – Earth Resources Observation and Science Center: Landsat 7 Enhanced Thematic Mapper Plus Level-2, Collection 2 [dataset], US Geological Survey [data set], https://doi.org/10.5066/P9C7I13B, 2020b.
EROS – Earth Resources Observation and Science Center: Landsat 8–9 Operational Land Imager/Thermal Infrared Sensor Level-2, Collection 2 [dataset], US Geological Survey [data set], https://doi.org/10.5066/P9OGBGM6, 2020c.
Elsasser, H. and Bürki, R.: Climate change as a threat to tourism in the Alps, Clim. Res., 20, 253–257, https://doi.org/10.3354/cr020253, 2002.
Farr, T. G., Rosen, P. A., Caro, E., Crippen, R., Duren, R., Hensley, S., Kobrick, M., Paller, M., Rodriguez, E., Roth, L., Seal, D., Shaffer, S., Shimada, J., Umland, J., Werner, M., Oskin, M., Burbank, D., and Alsdorf, D.: The Shuttle Radar Topography Mission, Rev. Geophys., 45, RG2004, https://doi.org/10.1029/2005RG000183, 2007.
Forster, P., Storelvmo, T., Armour, K., Collins, W., Dufresne, J.-L., Frame, D., Lunt, D. J., Mauritsen, T., Palmer, M. D., Watanabe, M., and Wild, M.: The Earth's Energy Budget, Climate Feedbacks, and Climate Sensitivity, in: Climate Change 2021: The Physical Science Basis. Contribution of Working Group I to the Sixth Assessment Report of the Intergovernmental Panel on Climate Change, edited by: Masson-Delmotte, V., Zhai, P., Pirani, A., Connors, S. L., Péan, C., Berger, S., Caud, N., Chen, Y., Goldfarb, L., Gomis, M. I., Huang, M., Leitzell, K., Lonnoy, E., Matthews, J. B. R., Maycock, T. K., Waterfield, T., Yelekçi, Ö., Yu, R., and Zhou, B., Cambridge University Press, Cambridge, UK and New York, NY, USA, 923–1054, https://doi.org/10.1017/9781009157896.009, 2021.
Gafurov, A. and Bárdossy, A.: Cloud removal methodology from MODIS snow cover product, Hydrol. Earth Syst. Sci., 13, 1361–1373, https://doi.org/10.5194/hess-13-1361-2009, 2009.
Ghimire, M., Pangali Sharma, T. P., Chauhan, R., Gurung, S. B., Devkota, S., Sharma, K. P., Shrestha, D., Wei, Z., and Timalsina, N.: Status and changes in glaciers in the Upper Karnali Basin, West Nepal: Assessing topographic influences on area, fragmentation, and volume, J. Earth Syst. Sci., 134, 215, https://doi.org/10.1007/s12040-025-02664-5, 2025a.
Ghimire, M., Shrestha, D., Zhao, W., Chauhan, R., Gurung, S. B., Pangali Sharma, T. P., Sharma, K. P., Tamang, S., Timalsina, N., Devkota, S., Thapa, A., Koirala, S., Bhandari, P., Subedi, B., Lohani, U., Kutu, J., Rana, D., and Yanhong, W.: State and dynamics of cryosphere of Upper Karnali Basin, associated hazards and implications to water resources and livelihood, Project Code TU-NPAR-077/78-ERG-15, Tribhuvan University, Research Coordination and Development Council (RCDC), Kathmandu, Nepal, unpublished report, 2025b.
Gilbert, R. O.: Statistical Methods for Environmental Pollution Monitoring, Van Nostrand Reinhold, New York, ISBN 978-0-442-23050-0, 1987.
Gorelick, N., Hancher, M., Dixon, M., Ilyushchenko, S., Thau, D., and Moore, R.: Google Earth Engine: Planetary-scale geospatial analysis for everyone, Remote Sens. Environ., 202, 18–27, https://doi.org/10.1016/j.rse.2017.06.031, 2017.
Gurung, D. R., Maharjan, S. B., Shrestha, A. B., Shrestha, M. S., Bajracharya, S. R., and Murthy, M. S. R.: Climate and topographic controls on snow cover dynamics in the Hindu Kush Himalaya, Int. J. Climatol., 37, 3873–3882, https://doi.org/10.1002/joc.4961, 2017.
Hall, D. K. and Riggs, G. A.: MODIS/Terra Snow Cover 8-Day L3 Global 500 m SIN Grid. (MOD10A2, Version 61). [Data Set], NASA National Snow and Ice Data Center Distributed Active Archive Center [data set], https://doi.org/10.5067/MODIS/MOD10A2.061, 2021.
Hall, D. K., Riggs, G. A., Salomonson, V. V., DiGirolamo, N. E., and Bayr, K. J.: MODIS snow-cover products, Remote Sens. Environ., 83, 181–194, https://doi.org/10.1016/S0034-4257(02)00095-0, 2002.
Hersbach, H., Bell, B., Berrisford, P., Hirahara, S., Horányi, A., Muñoz-Sabater, J., Nicolas, J., Peubey, C., Radu, R., Schepers, D., Simmons, A., Soci, C., Abdalla, S., Abellan, X., Balsamo, G., Bechtold, P., Biavati, G., Bidlot, J., Bonavita, M., De Chiara, G., Dahlgren, P., Dee, D., Diamantakis, M., Dragani, R., Flemming, J., Forbes, R., Fuentes, M., Geer, A., Haimberger, L., Healy, S., Hogan, R. J., Hólm, E., Janisková, M., Keeley, S., Laloyaux, P., Lopez, P., Lupu, C., Radnoti, G., de Rosnay, P., Rozum, I., Vamborg, F., Villaume, S., and Thépaut, J.-N.: The ERA5 global reanalysis, Q. J. R. Meteorol. Soc., 146, 1999–2049, https://doi.org/10.1002/qj.3803, 2020.
Hock, R., Rasul, G., Adler, C., Cáceres, B., Gruber, S., Hirabayashi, Y., Jackson, M., Kääb, A., Kang, S., Kutuzov, S., Milner, A., Molau, U., Morin, S., Orlove, B., and Steltzer, H.: High Mountain Areas, in: IPCC Special Report on the Ocean and Cryosphere in a Changing Climate, edited by: Pörtner, H.-O., Roberts, D. C., Masson-Delmotte, V., Zhai, P., Tignor, M., Poloczanska, E., Mintenbeck, K., Alegría, A., Nicolai, M., Okem, A., Petzold, J., Rama, B., and Weyer, N. M., Cambridge University Press, Cambridge, UK and New York, NY, USA, 131–202, https://doi.org/10.1017/9781009157964.004, 2019.
Hunt, K. M. R., Baudouin, J.-P., Turner, A. G., Dimri, A. P., Jeelani, G., Pooja, Chattopadhyay, R., Cannon, F., Arulalan, T., Shekhar, M. S., Sabin, T. P., and Palazzi, E.: Western disturbances and climate variability: a review of recent developments, Weather Clim. Dynam., 6, 43–112, https://doi.org/10.5194/wcd-6-43-2025, 2025.
Immerzeel, W. W., Lutz, A. F., Andrade, M., Bahl, A., Biemans, H., Bolch, T., Hyde, S., Brumby, S., Davies, B. J., Elmore, A. C., Emmer, A., Feng, M., Fernández, A., Haritashya, U., Kargel, J. S., Koppes, M., Kraaijenbrink, P. D. A., Kulkarni, A. V., Mayewski, P. A., Nepaul, S., Pacheco, P., Pak-sok, J., Poulton, C., Pradhan, S., Rangecroft, S., Smeets, S., Suzuki, T., van der Schriek, T., Viviroli, D., Wada, Y., Xiao, C., Yao, T., and Baillie, J. E. M.: Importance and vulnerability of the world's water towers, Nature, 577, 364–369, https://doi.org/10.1038/s41586-019-1822-y, 2020.
Kääb, A., Reynolds, J. M., and Haeberli, W.: Glacier and permafrost hazards in high mountains, in: Global Change and Mountain Regions, edited by: Huber, U. M., Bugmann, H. K. M., and Reasoner, M. A., Springer, Dordrecht, 225–234, https://doi.org/10.1007/1-4020-3508-X_23, 2005.
Kääb, A., Berthier, E., Nuth, C., Gardelle, J., and Arnaud, Y.: Contrasting patterns of early twenty-first-century glacier mass change in the Himalayas, Nature, 488, 495–498, https://doi.org/10.1038/nature11324, 2012.
K.C., A.: Climate change and its impact on tourism in Nepal, J. Tour. Hosp. Educ., 7, 25–43, https://doi.org/10.3126/jthe.v7i0.17688, 2017.
Khadka, N., Li, B., Wu, Q., Shrestha, F., Paudel, L., and Wang, W.: Glacial lake outburst floods threaten China–Nepal transportation corridors, Sci. Total Environ., 927, 172456, https://doi.org/10.1016/j.scitotenv.2024.174701, 2024.
Khatiwada, K. R., Panthi, J., Shrestha, M. L., and Nepal, S.: Hydro-climatic variability in the Karnali River basin of Nepal Himalaya, Climate, 4, 17, https://doi.org/10.3390/cli4020017, 2016.
Krishnan, R., Shrestha, A. B., Ren, G., Rajbhandari, R., Saeed, S., Sanjay, J., Syed, M. A., Vellore, R., Xu, Y., You, Q., and Ren, Y.: Unravelling climate change in the Hindu Kush Himalaya: rapid warming in the mountains and increasing extremes, in: The Hindu Kush Himalaya Assessment: Mountains, Climate Change, Sustainability and People, edited by: Wester, P., Mishra, A., Mukherji, A., and Shrestha, A. B., Springer International Publishing, Cham, 57–97, https://doi.org/10.1007/978-3-319-92288-1_3, 2019.
Kulkarni, A. V., Rathore, B. P., and Singh, S. K.: Distribution of seasonal snow cover in central and western Himalaya, Ann. Glaciol., 51, 125–130, https://doi.org/10.3189/172756410791386445, 2010.
Kulkarni, A. V., Shirsat, T. S., Kulkarni, A., Negi, H. S., Bahuguna, I. M., and Thamban, M.: State of Himalayan cryosphere and implications for water security, Water Security, 14, 100101, https://doi.org/10.1016/j.wasec.2021.100101, 2021.
LRMP: Land Resource Mapping Project (national soils/land-use inventory), Government of Nepal, Kathmandu, Nepal, 1986.
Maskey, S., Uhlenbrook, S., and Ojha, S.: An analysis of snow cover changes in the Himalayan region using MODIS snow products and in-situ temperature data, Clim. Change, 108, 391–400, https://doi.org/10.1007/s10584-011-0181-y, 2011.
Mimura, N.: Sea-level rise caused by climate change and its implications for society, Proc. Jpn. Acad. Ser. B, 89, 281–301, https://doi.org/10.2183/pjab.89.281, 2013.
Muhammad, S. and Thapa, A.: An improved Terra–Aqua MODIS snow cover and Randolph Glacier Inventory 6.0 combined product (MOYDGL06*) for high-mountain Asia between 2002 and 2018, Earth Syst. Sci. Data, 12, 345–356, https://doi.org/10.5194/essd-12-345-2020, 2020.
Naegeli, K., Huss, M., and Hoelzle, M.: Change detection of bare-ice albedo in the Swiss Alps , The Cryosphere, 13, 397–412, https://doi.org/10.5194/tc-13-397-2019, 2019.
NSO – National Statistics Office: National Population and Housing Census 2021 (NPHC 2021) – online tables, Government of Nepal, Kathmandu, Nepal, https://censusnepal.cbs.gov.np/results (last access: 12 December 2025), 2021.
Nyaupane, G. P. and Chhetri, N.: Vulnerability to climate change of nature-based tourism in the Nepalese Himalayas, Tour. Geogr., 11, 95–119, https://doi.org/10.1080/14616680802643359, 2009.
Parajka, J. and Blöschl, G.: Spatio-temporal combination of MODIS images – Potential for snow cover mapping, Water Resour. Res., 44, W03406, https://doi.org/10.1029/2007WR006204, 2008.
Pendergrass, A. G.: Changing degree of convective organization as a mechanism for dynamic changes in extreme precipitation, Curr. Clim. Change Rep., 6, 47–54, https://doi.org/10.1007/s40641-020-00157-9, 2020.
Pepin, N., Bradley, R. S., Diaz, H. F., Baraer, M., Caceres, E. B., Forsythe, N., Fowler, H., Greenwood, G., Hashmi, M. Z., Liu, X. D., Miller, J. R., Ning, L., Ohmura, A., Palazzi, E., Rangwala, I., Schöner, W., Severskiy, I., Shahgedanova, M., Wang, M. B., Williamson, S. N., and Yang, D. Q.: Elevation-dependent warming in mountain regions of the world, Nat. Clim. Change, 5, 424–430, https://doi.org/10.1038/nclimate2563, 2015.
Pepin, N. C., Arnone, E., Gobiet, A., Haslinger, K., Kotlarski, S., Notarnicola, C., Palazzi, E., Seibert, P., Serafin, S., Stocchi, P., and Zebisch, M.: Climate changes and their elevational patterns in the mountains of the world, Rev. Geophys., 60, e2020RG000730, https://doi.org/10.1029/2020RG000730, 2022.
Pfeffer, W. T., Arendt, A. A., Bliss, A., Bolch, T., Cogley, J. G., Gardner, A. S., Hagen, J.-O., Hock, R., Kaser, G., Kienholz, C., Miles, E. S., Moholdt, G., Mölg, N., Paul, F., Radic, V., Rastner, P., Raup, B. H., Rich, J., Sharp, M. J., and the Randolph Consortium: The Randolph Glacier Inventory: a globally complete inventory of glaciers, J. Glaciol., 60, 537–552, https://doi.org/10.3189/2014JoG13J176, 2014.
Pradhananga, D., Adhikary, S., Dhakal, B. N., Dhakal, A., Ghimire, A., Dhital, S., and Manandhar, S.: Cryosphere change in the warming Himalaya: Snow cover and snowline trends in Nepal's Langtang Basin (1988–2024), J. Tourism Himalayan Adv., 7, 14–26, 2025.
Pritchard, H. D.: Asia's shrinking glaciers protect large populations from drought stress, Nature, 569, 649–654, https://doi.org/10.1038/s41586-019-1240-1, 2019.
Rabatel, A., Francou, B., Soruco, A., Gomez, J., Cáceres, B., Ceballos, J. L., Basantes, R., Vuille, M., Sicart, J.-E., Huggel, C., Scheel, M., Lejeune, Y., Arnaud, Y., Collet, M., Condom, T., Consoli, G., Favier, V., Jomelli, V., Galarraga, R., Ginot, P., Maisincho, L., Mendoza, J., Ménégoz, M., Ramirez, E., Ribstein, P., Suarez, W., Villacis, M., and Wagnon, P.: Current state of glaciers in the tropical Andes: a multi-century perspective on glacier evolution and climate change, The Cryosphere, 7, 81–102, https://doi.org/10.5194/tc-7-81-2013, 2013.
Ren, P., Pan, X., Liu, T., Huang, Y., Chen, X., Wang, X., Zhang, Y., and Ling, X.: Glacier changes from 1990 to 2022 in the Aksu River Basin, western Tien Shan, Remote Sens., 16, 1751, https://doi.org/10.3390/rs16101751, 2024.
Ren, S., Jia, L., Menenti, M., and Zhang, J.: Changes in glacier albedo and the driving factors in the Western Nyainqentanglha Mountains from 2001 to 2020, J. Glaciol., 69, 1500–1514, https://doi.org/10.1017/jog.2023.33, 2023.
Rittger, K., Painter, T. H., and Dozier, J.: Assessment of methods for mapping snow cover from MODIS, Adv. Water Resour., 51, 367–380, https://doi.org/10.1016/j.advwatres.2012.03.002, 2013.
Salerno, F., Uccelli, A., Cristofanelli, P., Stocchi, P., Diolaiuti, G., Ma, Y., and Putero, D.: Local cooling and drying induced by Himalayan glaciers, Nat. Geosci., 16, 1120–1127, https://doi.org/10.1038/s41561-023-01331-y, 2023.
Sasaki, O., Miles, E. S., Pellicciotti, F., Sakai, A., and Fujita, K.: Contrasting patterns of change in snowline altitude across five Himalayan catchments, The Cryosphere, 19, 5283–5298, https://doi.org/10.5194/tc-19-5283-2025, 2025.
Sen, P. K.: Estimates of the regression coefficient based on Kendall's tau, J. Am. Stat. Assoc., 63, 1379–1389, https://doi.org/10.1080/01621459.1968.10480934, 1968.
Shen, L., Zhang, Y., Ullah, S., Pepin, N., and Ma, Q.: Changes in snow depth under elevation-dependent warming over the Tibetan Plateau, Atmos. Sci. Lett., 22, e1041, https://doi.org/10.1002/asl.1041, 2021.
Shrestha, A. B., Wake, C. P., Dibb, J. E., and Mayewski, P. A.: Maximum temperature trends in the Himalaya and its vicinity: an analysis based on temperature records from Nepal for the period 1971–94, J. Climate, 12, 2775–2786, https://doi.org/10.1175/1520-0442(1999)012<2775:MTTITH>2.0.CO;2, 1999.
Shrestha, M., Wang, L., Koike, T., Xue, Y., and Hirabayashi, Y.: Modeling the spatial distribution of snow cover in the Dudhkoshi region of the Nepal Himalayas, J. Hydrometeorol., 13, 204–222, https://doi.org/10.1175/JHM-D-10-05027.1, 2012.
Syed, F. S., Giorgi, F., Pal, J. S., and King, M. P.: Effect of remote forcings on the winter precipitation of central southwest Asia part 1: observations, Theor. Appl. Climatol., 86, 147–160, https://doi.org/10.1007/s00704-005-0217-1, 2006.
Vuille, M., Carey, M., Huggel, C., Buytaert, W., Rabatel, A., Jacobsen, D., Soruco, A., Villacis, M., Yarleque, C., Elison Timm, O., Condom, T., Salzmann, N., and Sicart, J. E.: Rapid decline of snow and ice in the tropical Andes – Impacts, uncertainties and challenges ahead, Earth-Sci. Rev., 176, 195–213, https://doi.org/10.1016/j.earscirev.2017.09.019, 2018.
Wan, Z., Hook, S., and Hulley, G.: MODIS/Aqua Land Surface Temperature/Emissivity Daily L3 Global 1 km SIN Grid, Version 6, NASA EOSDIS Land Processes DAAC [data set], https://doi.org/10.5067/MODIS/MYD11A1.006, 2015.
Wan, Z., Hook, S., and Hulley, G.: MODIS/Terra Land Surface Temperature/Emissivity 8-Day L3 Global 1 km SIN Grid V061 [Data set], NASA Land Processes Distributed Active Archive Center [data set], https://doi.org/10.5067/MODIS/MOD11A2.061, 2021a.
Wan, Z., Hook, S., and Hulley, G.: MODIS/Aqua Land Surface Temperature/Emissivity 8-Day L3 Global 1 km SIN Grid V061 [Data set], NASA Land Processes Distributed Active Archive Center [data set], https://doi.org/10.5067/MODIS/MYD11A2.061, 2021b.
Wester, P., Mishra, A., Mukherji, A., and Shrestha, A. B. (Eds.): The Hindu Kush Himalaya Assessment: Mountains, Climate Change, Sustainability and People, Springer Nature, Cham, Switzerland, 627 pp., https://doi.org/10.1007/978-3-319-92288-1, 2019.
Xu, J., Grumbine, R. E., Shrestha, A., Eriksson, M., Yang, X., Wang, Y., and Wilkes, A.: The melting Himalayas: cascading effects of climate change on water, biodiversity, and livelihoods, Conserv. Biol., 23, 520–530, https://doi.org/10.1111/j.1523-1739.2009.01237.x, 2009.
Yadav, R. K., Rupa Kumar, K., and Rajeevan, M.: Increasing influence of ENSO and decreasing influence of AO/NAO in the recent decades over northwest India winter precipitation, J. Geophys. Res.-Atmos., 114, D12112, https://doi.org/10.1029/2008JD011318, 2009.
Ye, Y. and Tian, Y.: INTERPRETING CHANGES IN ALBEDO AND MASS BALANCE AT WHITE GLACIER, CANADIAN ARCTIC ARCHIPELAGO, Int. Arch. Photogramm. Remote Sens. Spatial Inf. Sci., XLIII-B3-2022, 793–798, https://doi.org/10.5194/isprs-archives-XLIII-B3-2022-793-2022, 2022.
Yu, W., Ma, M., Wang, X., Geng, L., Tan, J., and Shi, J.: Validation of MODIS land surface temperature products using ground-based longwave radiation observations in the Heihe River Basin, Proc. SPIE, 8174, 81741G, https://doi.org/10.1117/12.897571, 2011.
Yue, S. and Wang, C. Y.: The Mann–Kendall test modified by effective sample size to detect trend in serially correlated hydrological series, Water Resour. Manag., 18, 201–218, https://doi.org/10.1023/B:WARM.0000043140.61082.60, 2004.
Zemp, M., Huss, M., Thibert, E., Eckert, N., McNabb, R., Huber, J., Barandun, M., Machguth, H., Nussbaumer, S. U., Gärtner-Roer, I., Thomson, L., Paul, F., Maussion, F., Kutuzov, S., and Cogley, J. G.: Global glacier mass changes and their contributions to sea-level rise from 1961 to 2016, Nature, 568, 382–386, https://doi.org/10.1038/s41586-019-1071-0, 2019.
Zhao, W., He, J., Wu, Y., Xiong, D., Wen, F., and Li, A.: An analysis of land surface temperature trends in the central Himalayan region based on MODIS products, Remote Sens., 11, 900, https://doi.org/10.3390/rs11080900, 2019.