
the Creative Commons Attribution 4.0 License.
the Creative Commons Attribution 4.0 License.
 | 01 Sep 2026
Annual changes in firn density and compaction under Alpine Climate conditions: first multi-year CMP radar observations from the Grosser Aletschgletscher
Akash M. Patil

Christoph Mayer
Theo M. Jenk
Astrid Lambrecht
Thorsten Seehaus
Alexander R. Groos
Michelle Worek
The glacier mass balance is driven by primary processes such as snowfall and surface melt. Secondary processes, like firn pack warming, percolation, and refreezing, are becoming more important even in high-elevation basins, which are triggered by warming Alpine regions. All these processes are functionally related to temporal changes in the firn pack, predominantly its density structure. Here, we provide a detailed assessment of annual changes in firn density, stratigraphy, and compaction rate at different locations of the glacier accumulation area, using multi-year common-midpoint (CMP) radar measurements, representing the first such analysis for a glacier in the European Alps. To achieve this, we combined repeat geophysical observations, predominantly ground-penetrating radar (GPR)-based common-midpoint (CMP) surveys, with direct firn-core investigations from the accumulation area of the Grosser Aletschgletscher, Switzerland. We estimated temporal changes in firn density and compaction rates within the identified 8–9 annual layers using internal reflection horizons (IRHs) from repeat CMP measurements. In addition, we analysed relationships between firn-core-derived chemical impurities and stable isotopes. Our results suggest that the annual changes in firn density decrease with depth and age, with the largest change (∼ 130 kg m−3 yr−1) occurring at the near-surface annual layers (∼ 7–8 m depth) at a low-lying accumulation area where the summer surface melt is more significant than at the higher elevations. Similarly, the estimated compaction rate (maximum ∼ 0.3 m yr−1 at ∼ 7–8 m depth) decreases with depth and age. The CMP-derived density–depth profile agrees with the firn-core results, demonstrating that CMP measurements are a valuable alternative for increasing the spatial distribution of observations and complementing invasive, labour-intensive glaciological measurements. We also estimated spatial changes in firn density and accumulation along a GPR transect and traced the spatial extent of the firn body. The secondary results, obtained by comparing GPR observations from winter 2024 and 2025, suggest that glacier dynamics may influence firn stratigraphy that requires further investigation in future studies. Our results demonstrate that the combination of multi-year GPR profiles, CMP analyses, and firn-core observations can quantify temporal changes in firn density, stratigraphy, and compaction rate, thereby contributing to the future calibration of firn-densification models and improving glacier mass-balance estimates.
- Article
(9412 KB) - Full-text XML
-
Supplement
(13457 KB) - BibTeX
- EndNote


Firn is essentially snow that has survived at least one summer or melt season without densifying into glacier ice, which can be found in accumulation areas of ice caps, ice sheets, and glaciers (Cogley et al., 2011). Most firn studies on mountain glaciers focus on understanding firn properties and processes (e.g. densification, meltwater percolation and refreezing, snow metamorphism, and compaction), predominantly density evolution, which determines surface meltwater hydrology and also plays a role in accurately estimating glacier mass balance from geodetically measured volume changes (Huss, 2013; Stevens et al., 2024). Further detailed study of firn processes helps interpret ice-core data, which provide distinct regional climate records of the high-Alpine glaciers (e.g. Arnaud et al., 2000; Fisher et al., 2006; Miller et al., 2021). There is clear evidence that a changing climate is warming the firn columns and altering snow and firn structure and chemical composition, thereby compromising climate records (Bezeau et al., 2013; Samimi and Marshall, 2017; Ochwat et al., 2021; Horlings et al., 2022). Williamson et al. (2020) and Huber et al. (2024) studies suggest that increased snow accumulation and melt at high Alpine glaciers (St. Elias Range) increase the chances of a firn aquifer by insulating the underlying firn.
The basic understanding of firn processes, particularly influencing firn density, is well established under cold polar conditions (e.g., Herron and Langway, 1980; Arthern and Wingham, 1998; Li and Zwally, 2004; Reeh, 2008; Ligtenberg et al., 2011). However, there are few studies of firn densification in Alpine glaciers, where densification rates are higher than in cold polar regions (Kawashima and Yamada, 1997; Cuffey and Paterson, 2010). Processes such as refreezing increase the presence of meltwater in pore spaces, whereas winter conditions in high Alpine glaciers cool uppermost firn layers, influencing firn densification (Hooke et al., 1983; Schneider and Jansson, 2004). The emphasis on Alpine firn, particularly on understanding firn stratigraphy, densification, and processes that determine firn structures, is important, and efforts are made through direct observations, geophysical methods, and modelling approaches (Ambach and Eisner, 1966; Schotterer et al., 1977; Alean et al., 1983; Blatter and Hutter, 1991; Fountain and Walder, 1998; Lüthi and Funk, 2000; Huss, 2013; Sold et al., 2015).
Long-term repeat measurements of firn properties are limited in Alpine conditions. However, studies such as Stevens et al. (2024) present the evolution of firn density derived from repeat firn core measurements at Wolverine Glacier, Alaska. The study demonstrates the importance role of firn properties and processes in glacier mass-balance estimates. Similarly, Kindstedt et al. (2025) documents ongoing firn warming at the Eclipse Icefield, Yukon, using firn core, borehole temperature, and GPR transects along with firn modelling, but without repeat measurements. In contrast Sold et al. (2015, 2016) studies highlight the importance of repeat helicopter-borne fixed-offset GPR observations to unlock the firn annual water equivalent and accumulation distribution on Findelengletscher, a valley glacier in Switzerland. However, these studies do not consider the importance of radar velocity in determining IRH depths instead they rely on simple firn densification models. Additionally, Patil et al. (2025b) used a combination of geophysical methods, glaciological observations, and a firn densification model to investigate the firn structure and density distribution in the accumulation area of the Grosser Aletschgletscher. Meanwhile, Suter et al. (2001) illustrates the spatial distribution of cold firn and the influence of climatic variables and topography on firn distribution in the European Alps using firn cores and modelling. All of these studies resolve the vertical firn density-depth relation or firn densification, but not the firn compaction rate. Firn densification and firn compaction are not separate processes but coupled expressions of the same underlying mechanism: as the firn column is compressed under the increasing overburden stress of successive snow accumulation, its thickness decreases (compaction) while its bulk density increases correspondingly (densification) (Bader, 1954; MacFerrin et al., 2022).
Accurate knowledge of firn compaction is essential for converting geodetically observed volume into mass changes, since a major fraction of measured surface-elevation change in accumulation area results from firn compaction rather than mass gain or loss (Huss, 2013). Therefore, firn compaction has been extensively quantified in polar ice sheets, using in-situ strain measurements (Arthern et al., 2010), repeated borehole density logging (Morris and Wingham, 2014), and semi-empirical densification models tuned to Antarctic and Greenland conditions (Ligtenberg et al., 2011) to better evaluate ice sheet mass balance estimates. In contrast, firn compaction and temporal density change observations remain scarce in Alpine glaciers, even though these systems are subject to intense summer melt, percolation, and refreezing that can alter firn compaction behaviour in ways not captured by polar-tuned models (Huss, 2013; Mattea et al., 2021).
Dry firn compaction typically progresses through three recognised stages: an initial stage dominated by grain-boundary sliding, sintering, and packing (ρ = 550 kg m−3), followed by power-law creep and plastic deformation, and a final, relatively slow stage governed by pore close-off as enclosed air volume is reduced (ρ > 830 kg m−3) (Herron and Langway, 1980; Morris and Wingham, 2014). The boundary between the first two stages remains poorly defined (Benson, 1962; Simonsen et al., 2013). Dry firn compaction rates are primarily controlled by overburden pressure, firn temperature, and density (Bader, 1962; Shapiro et al., 1997). In warmer settings, refreezing of meltwater acts as an additional densification mechanism, accelerating firn densification (Braithwaite et al., 1994; Reeh, 2008). However, no single model reliably reproduces firn compaction rates across settings (Arthern et al., 2010), and in situ measurements remain largely restricted to polar regions (Stevens et al., 2024).
In-situ compaction has traditionally been measured using the manual coffee-can method (Hamilton et al., 1998), later automated with draw-wire sensors in Antarctica (Arthern et al., 2010) and applied across 48 boreholes at eight Greenland sites (MacFerrin et al., 2022). Other borehole approaches include repeated neutron-probe density logging (Morris and Wingham, 2014) and optical stratigraphy, applied at the Greenland Summit (Hawley and Waddington, 2011) and later extended to millimetre-scale resolution using high-resolution imagery at Derwael Ice Rise, Antarctica (Hubbard et al., 2020). These methods yield high-resolution compaction estimates but remain invasive and spatially limited. Non-invasive alternatives instead rely on repeated radar surveys (Kruetzmann et al., 2011). Medley et al. (2015) estimated compaction from airborne radar combined with firn-core-derived wave speeds, providing limited vertical resolution but broader spatial coverage. While Kruetzmann et al. (2011) used GPR to infer accumulation and compaction from density-dependent dielectric properties, without accounting for velocity differences between reflectors. Another radar-based technique, Autonomous phase-sensitive radar (ApRES), has similarly been used to track internal reflectors and derive compaction and vertical strain rates in Antarctica (Case and Kingslake, 2022; Gillet-Chaulet et al., 2011; Kingslake et al., 2014; Nicholls et al., 2015).
To our knowledge, no studies have quantified temporal changes in firn densification and compaction rates using multi-year in situ geophysical and glaciological measurements. Consequently, we present the first such analysis using non-invasive GPR-derived geophysical measurements, primarily the common-midpoint (CMP) method, supported by direct glaciological observations, including shallow and deep firn cores, at the accumulation area of the Grosser Aletschgletscher in the Swiss Alps. Specifically, our study focuses on the following research questions:
- i.
What do the CMP measurements reveal about temporal changes in the firn pack?
- ii.
Can we quantify the firn compaction or densification rate from the multi-year CMP gather?
- iii.
What do the multi-year GPR and firn-core measurements reflect about the effect of a warming climate and extreme Alpine summers on firn stratigraphy?
In this study, we use the dataset established in our prior work (Patil et al., 2025a), complemented by new investigations such as a deep firn core, additional CMP measurements, and an extended GPR profile (Fig. 1). These new observations help to address limitations stated in Patil et al. (2025b), including the requirement of a deep firn core for direct validation of the CMP-derived density-depth profile, better estimation of spatial firn density and accumulation, and extending the field observations required to quantify temporal changes in firn pack, such as firn density and compaction rate.
The Grosser Aletschgletscher is the largest glacier in the European Alps (Switzerland, 46.5° N, 8.0° E, Fig. 1), characterised by three large accumulation basins that converge at the Konkordiaplatz and form a 13 km long, curved glacier tongue to the south (Grab et al., 2021). The glacier area was approximately 78.5 km2 in 2017, and 20 km long (GLAMOS, 2018a; Linsbauer et al., 2021). The glacier elevation ranges from 1700 to 4200 m a.s.l., while the average equilibrium line altitude (ELA) over the last decade was approximately 3160 and 3185 m a.s.l. at the end of summer 2025 (GLAMOS, 2025). The glacier receives high precipitation (winter mass balance) at the accumulation area (Jungfraufirn, Ewigschneefeld, and Mönchsjoch), primarily driven by northern precipitation (Schwarb et al., 2001; MeteoSchweiz, 2025; Rückamp et al., 2026). At the central accumulation basin (Jungfraufirn), point-based surface mass balances have been measured since 1920, providing long-term annual and seasonal mass balance (Huss et al., 2009; GLAMOS, 2022). The meteorological data recorded at the weather station at 3571 m a.s.l. shows an annual mean temperature of −6.35 °C over the last 25 years (2000–2025), and a mean winter temperature (September–May) during the same period of −8.61 °C (MeteoSchweiz, 2025). There are no precipitation observations at this site due to extreme weather conditions (e.g., strong winds).
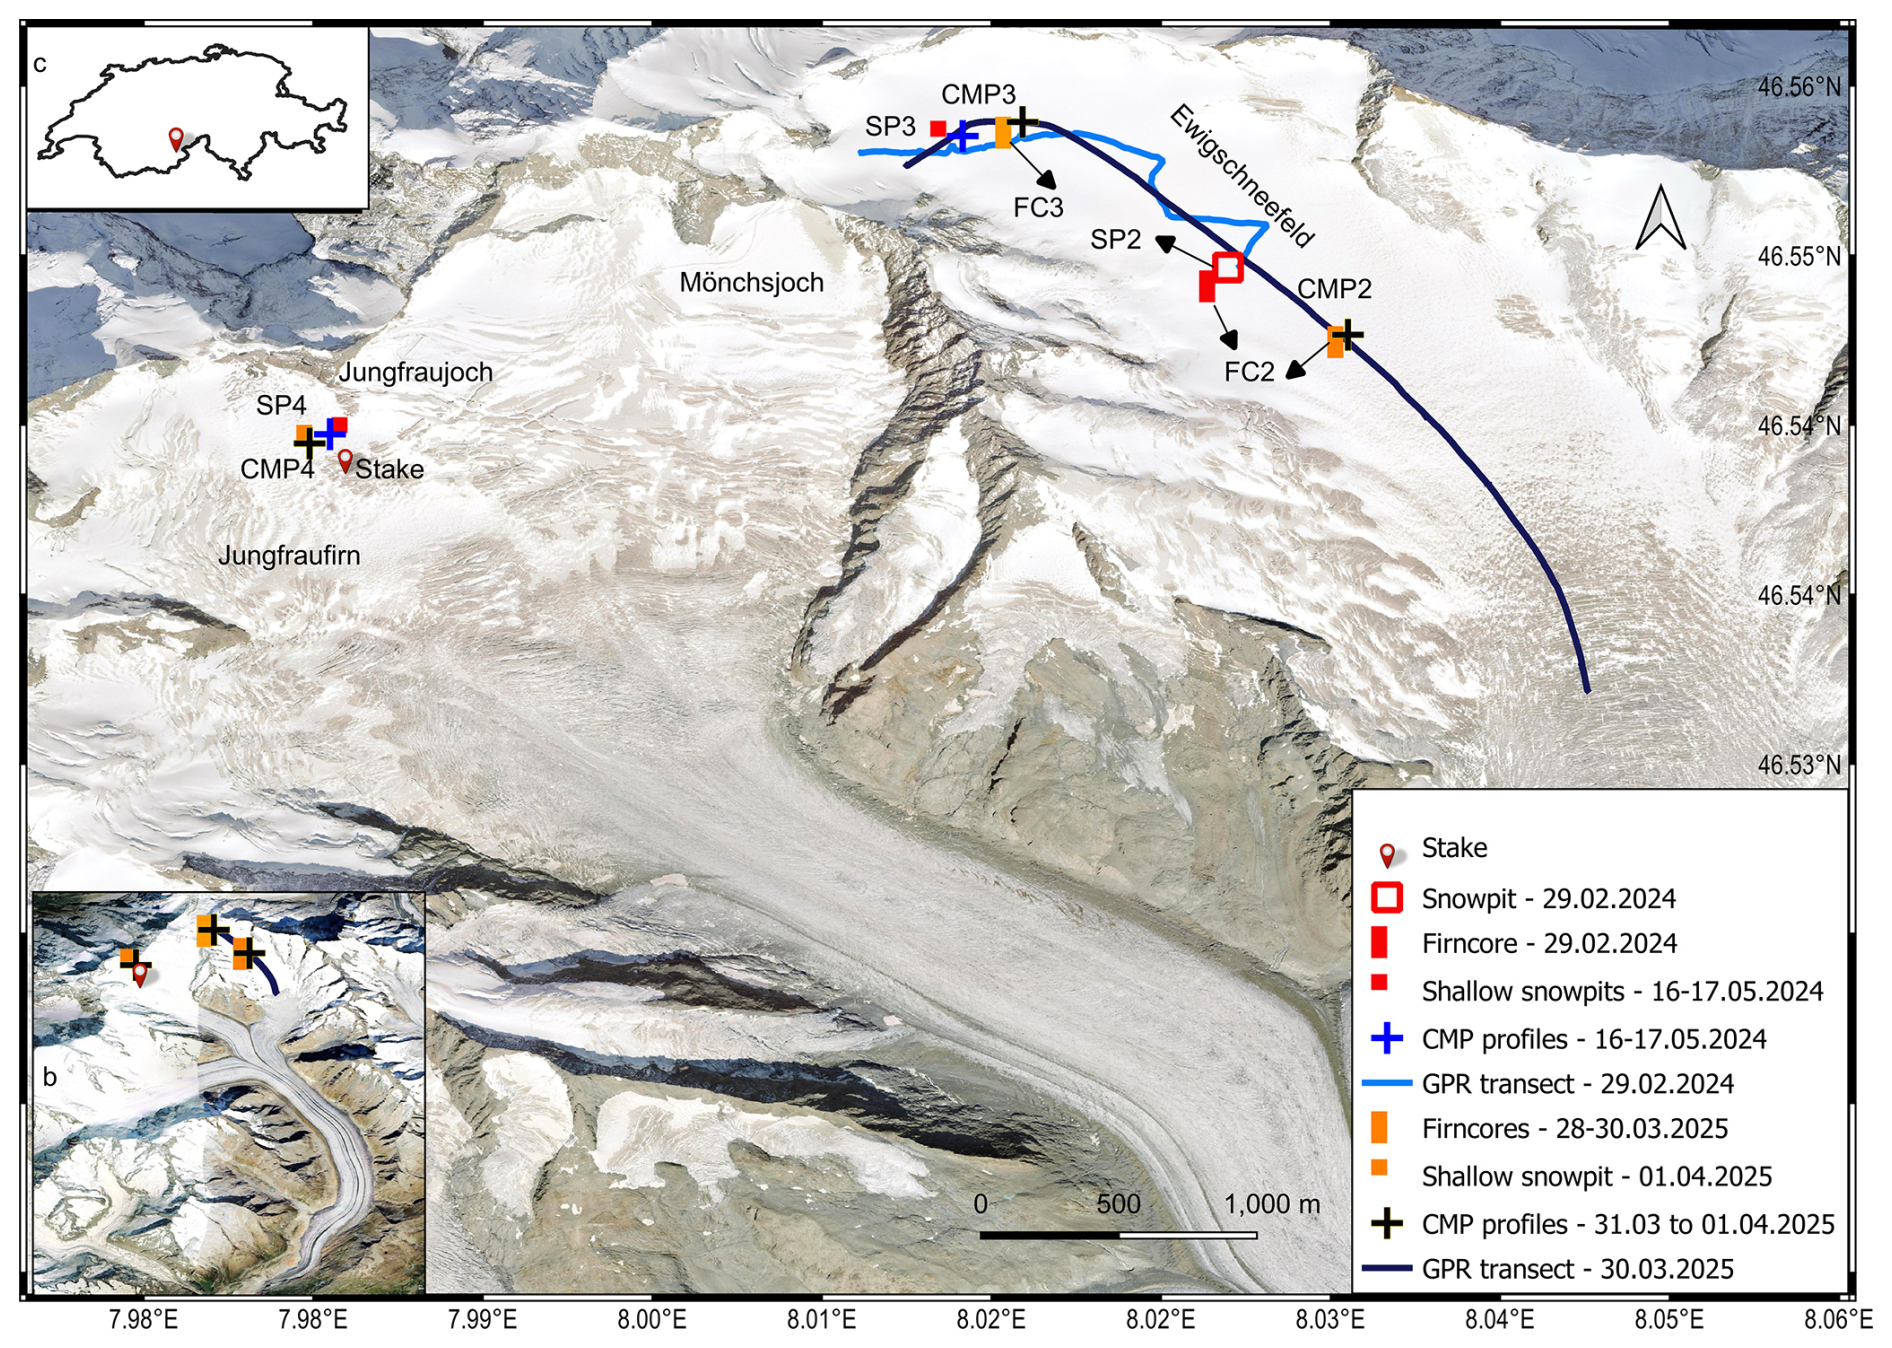
Figure 1The Study area illustrating the upper part of the Grosser Aletschgletscher, consisting of Jungfraufirn, Ewigschneefeld, and Mönchsjoch. The figure also shows the corresponding glaciological and geophysical measurements from the 2025 campaign, along with similar measurements from the 2024 campaign (Patil et al., 2025a) used in this study, as detailed in the legend. The background map shown in the figure was obtained from the Swiss Federal Office of Topography (swisstopo, 2026), a cloud-optimised Geo-TIFF of 2 m resolution. The inset map (b) is a satellite image of the Grosser Aletschgletscher (imagery and map data © 2024 Google). The geographical location of the Grosser Aletschgletscher is shown in the inset map (c) on the top left.
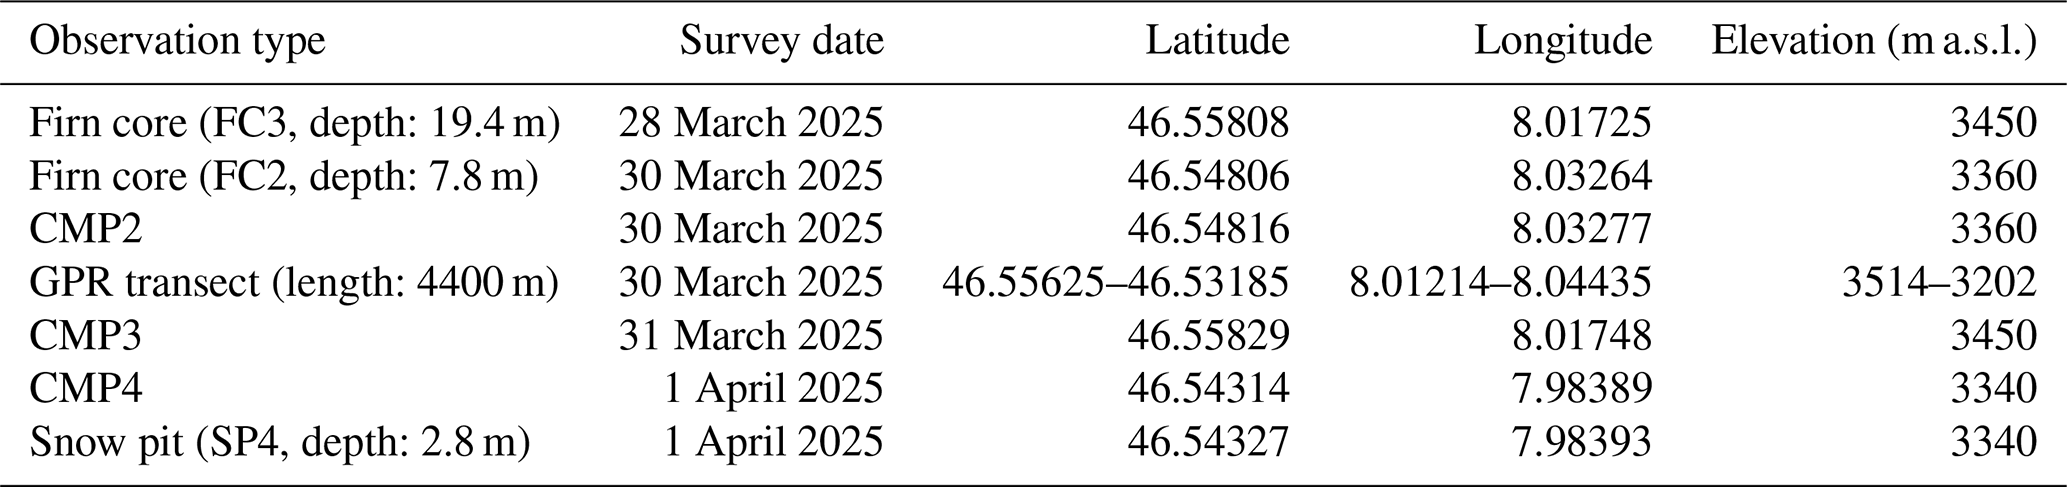
Temporal changes in firn density and compaction can be investigated through multi-year or repeat measurements at similar locations (Medley et al., 2015). We retrieved a deep (FC3) and shallow firn core (FC2) to compare with GPR measurements at the upper and lower parts of the Ewigschneefeld, respectively, and a snow pit (SP4) near the mass balance stake at Jungfraufirn (Fig. 1). In addition, we acquired a GPR profile on Ewigschneefeld that links the two CMP locations and extends past the ablation zone in the lower section of Ewigschneefeld. All these measurements were gathered between 28 March and 1 April 2025 and are summarised in Table 1. To investigate temporal firn evolution, the 2025 dataset was complemented by our previous field observations (Patil et al., 2025a), which are also shown in Fig. 1.
Table 1Summary of all glaciological and geophysical measurements along with the deep firn core (FC3, in Fig. 1) acquired during the Grosser Aletschgletscher winter-2025 expedition.
3.1 Ground-penetrating radar data
We enhanced our 2024 measurements with two CMP 2025 measurements at each location (CMP3 and CMP4) (Fig. 1), approximately 50–100 m apart, and an additional new CMP gather at the lower part of the Ewigschneefeld (CMP2 in Fig. 1). We also extended the GPR transect to trace the spatial firn-to-ice transition and the variation in firn thickness with elevation along a flow line. All three CMP measurements were collected using a 200 and 600 MHz dual-frequency, mono-static IDS GPR system. Table 2 illustrates the GPR system settings used for all CMP gathers and GPR transects during both 2024 and 2025 field campaigns. The common midpoint (CMP) method is a geophysical approach that assumes subsurface reflectors (IRHs in radargrams) are horizontal, homogeneous layers. The CMP gather follows a similar acquisition procedure as that described by Patil et al. (2025b). During CMP acquisition, the transmitter (Tx) and receiver (Rx) are moved so that they remain at equal distances from a selected fixed midpoint. With this approach, subsurface targets appear as diffraction hyperbolas in the radargram (Fig. 2a). The CMP setup used 20 cm offsets from the fixed midpoint, perpendicular to the GPR transect direction (i.e., a 10 cm shift of the antennas on either side of the midpoint), covering a total CMP measurement length of 20 m. The details of CMP acquisition with schematic representation are given in the supplement along with a representative CMP radargram as in Fig. S1 in the Supplement.
Table 2The GPR antenna settings used for the GPR profile and CMP measurements during two winter campaigns in 2024 and 2025.
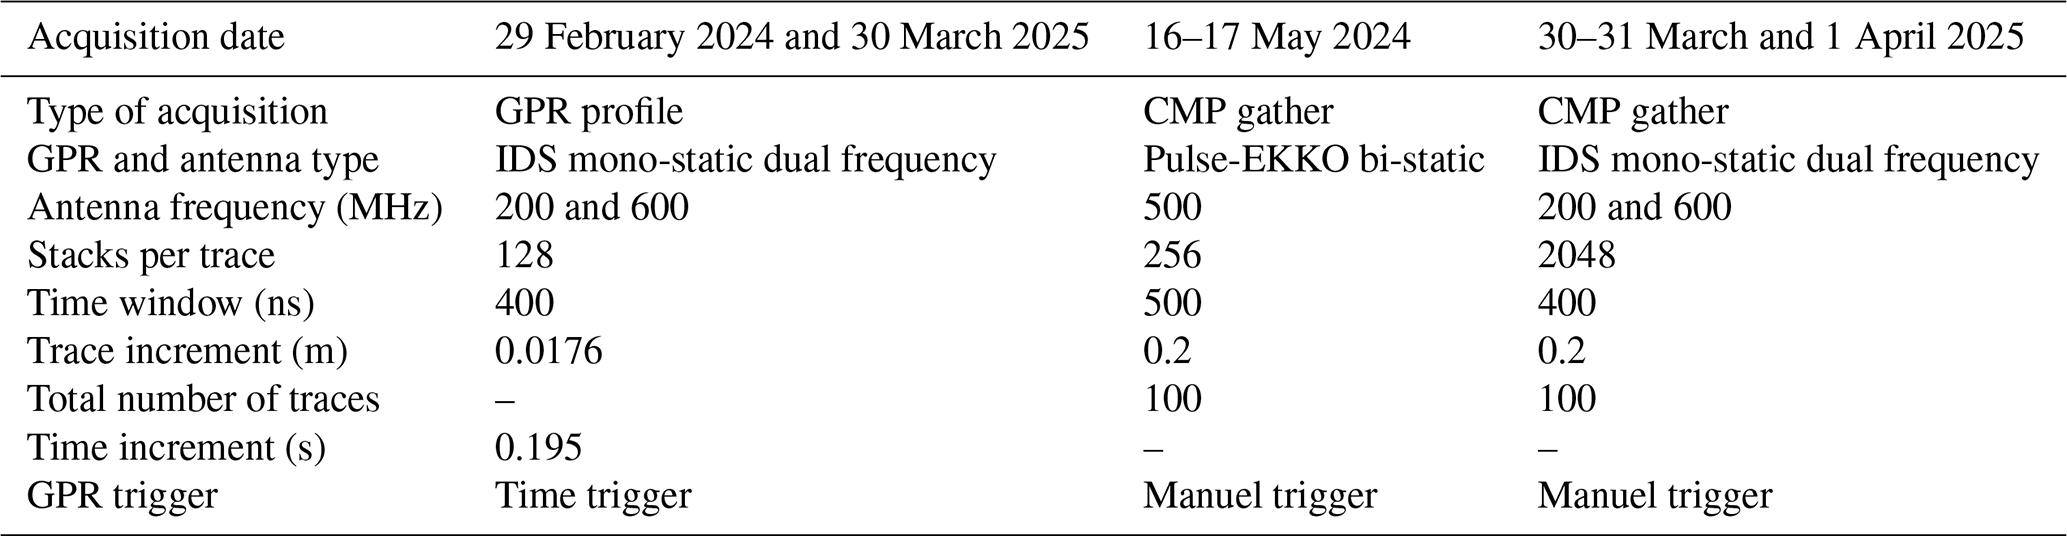
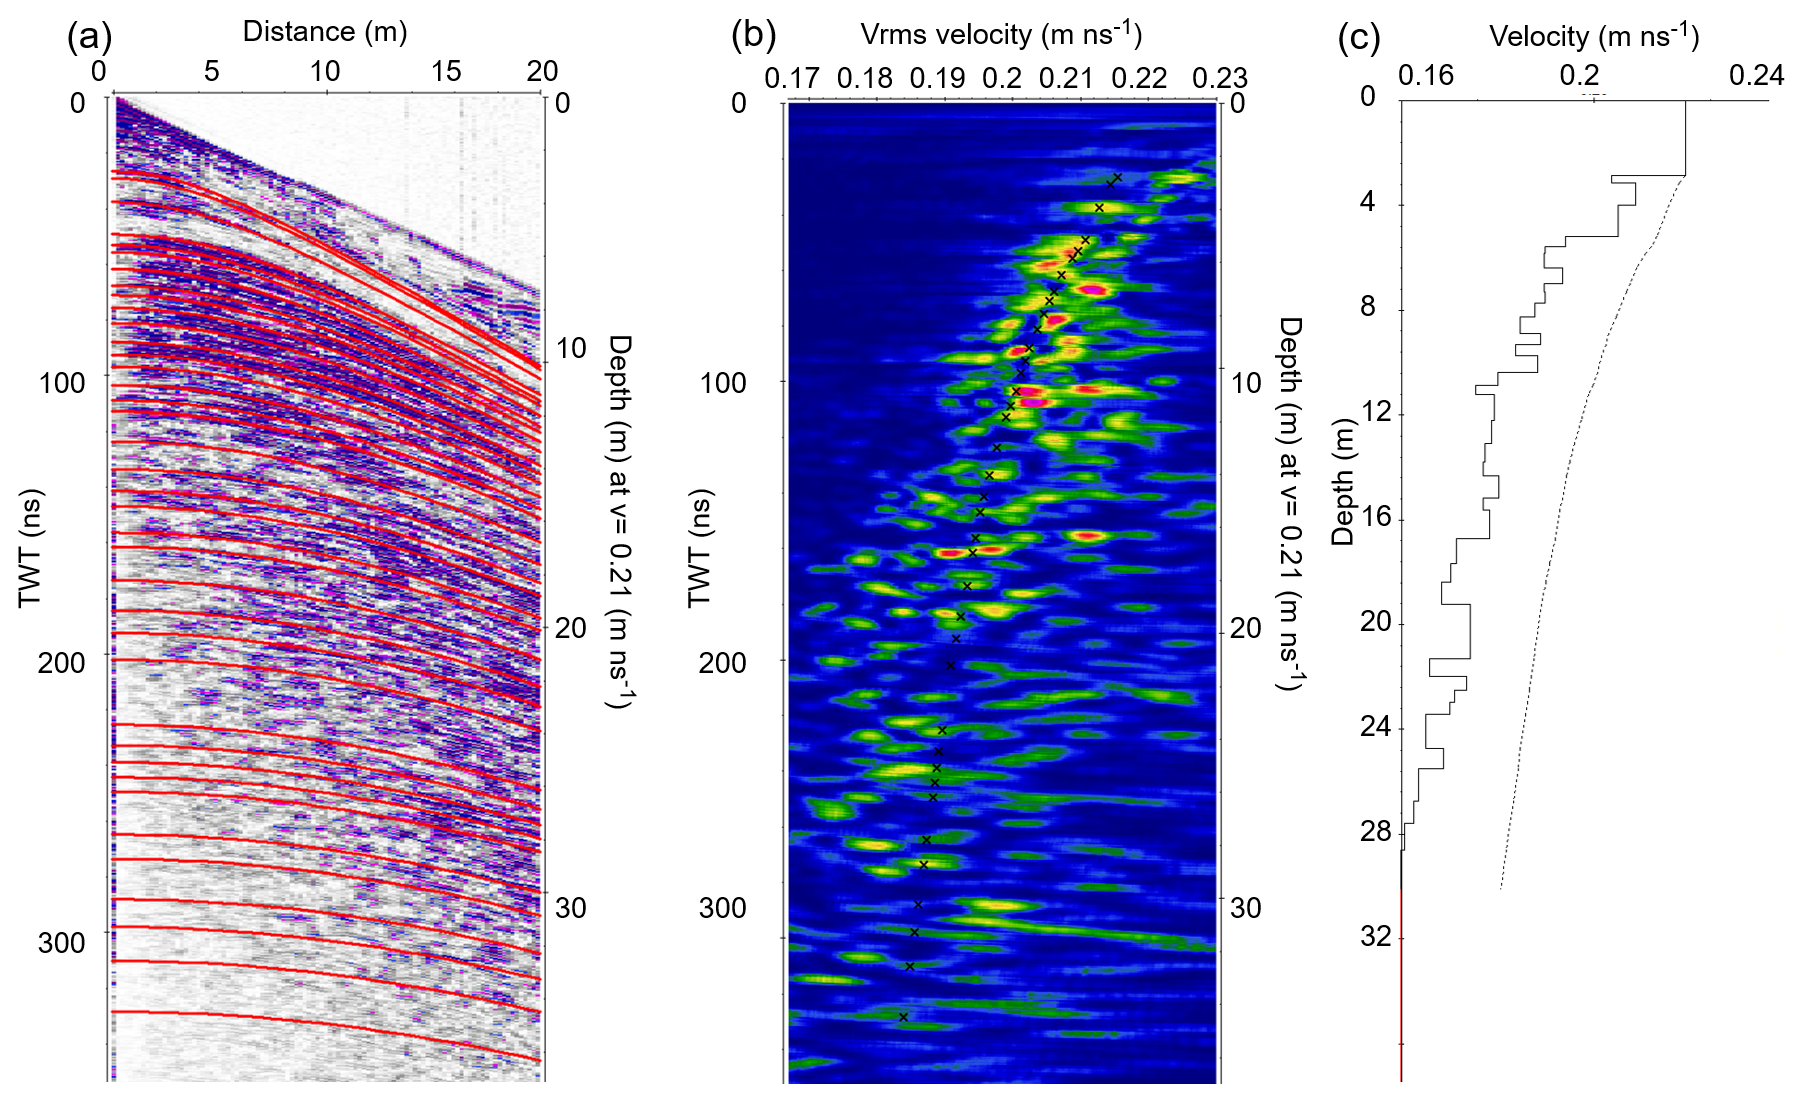
Figure 2The semblance analysis of the common mid-point (CMP) data gathered at the Ewigschneefeld (CMP2 in Fig. 1). The picked hyperbolic pattern or internal reflection horizons (IRHs) using ReflexW software (a) matches the energy coherence (b) representing Vrms velocities corresponding to the semblance pick. The 1-D modelled interval velocity for the picked Vrms is shown on the right part (c) of the figure. The dotted line shows the picked Vrms, and the solid line indicates the corresponding interval velocity. The left y axis in panels (a) and (b) represents the radar wave two-way travel time (TWT) in ns. The right y axis of panels (a) and (b) indicates an approximate depth (m), assuming a constant radar velocity in firn of 0.21 m ns−1. In panel (c), the left y axis shows the depth adjusted to the modelled interval velocity. The x axis in panel (a) is the distance in metres, and in panels (b) and (c), the pickable Vrms velocity for the corresponding semblance energy.
The GPR profile (same instrument as for the CMP) with a length of 4.4 km extends below the equilibrium line altitude (ELA), covering an elevation range from 3514 to 3202 m a.s.l (Table 1, black GPR transect in Fig. 1) and extends beyond the 1.8 km long GPR track from 2024 (blue GPR transect in Fig. 1). The GPR was towed manually using external GPS location with a time trigger. The overview of measurement locations from both winter campaigns (2024 and 2025) is shown in Fig. 1.
3.2 Firn cores, snow-pit, and isotope data
We acquired an approximately 18.3 m deep firn core from the base of the 1.12 m shallow snow-pit, using an electromechanical drill (FELICS small, icedrill.ch AG., 2010; Ginot et al., 2002). The corer retrieves 0.9 m core segments (58/73 mm core/borehole diameter) at the upper part of Ewigschneefeld near the CMP3 location (FC3 in Fig. 1). This enables direct observation of the firn density profile to a depth of nearly 19.4 m. Density within the snow pit was estimated by measuring the weight of the collected snow sample in a plastic bag using an analogue scale and the volume of a 14 cm-long cylindrical cone with a diameter of 4.75 cm. At the same time, the firn core sections were split into approximately 20 cm intervals for density measurements. The initial 20 cm of the first firn core was soft, and we assumed some disturbance due to drilling during density estimation at a shallow depth of around 2–3 m. We used plastic bags and analogue weighing springs to measure a sample weight. Further, density was determined from the known corer volume and weight of the measured core sample. The 20 cm firn core sections were stored in plastic bags, melted at the research station, and the meltwater was transferred into sampling tubes. The collected samples were analysed in the laboratory of the Geozentrum Nordbayern at Friedrich-Alexander-Universität Erlangen-Nürnberg for stable isotopes (expressed as per-mil deviation from a defined standard: VSMOW Vienna Standard. Mean Ocean Water) and chemical impurities (major ions). The details of the water isotope and chemical impurities analysis are provided in the Supplement.
An additional shallow firn core (FC2) of approximately 7 m depth from the bottom of a 1.12 m snow-pit was gathered on 30 March 2025, using a “Mark II Ice Coring System” from Kovacs Ice Drilling Equipment with a 9 cm diameter at the lower part of the Ewigschneefeld near the CMP2 location (orange FC2 in Fig 1). When translating from snow-pit to firn core drilling, we expect a loss of around 15–20 cm in core length due to the crumbling of fresh snow, and the data gap is filled by assuming a fresh-snow density measured from the snow-pit. A snow pit (orange SP4 in Fig. 1) approximately 2.8 m deep was dug near the CMP4 location to measure near-surface density and to investigate melt-induced ice lenses at the Jungfraufirn. The density of all snow pits was estimated using weight of collected sample and cone volume (14 cm-long, 4.75 cm-diameter).
Our methodological framework integrates basic GPR processing that helps to interpret the radar stratigraphy as in Sect. 4.1. Whereas Sect. 4.2 elaborates the CMP semblance analysis to extract Vrms and corresponding TWT of identifiable IRHs. Further, Vrms is converted to interval velocity using the Dix equation, enabling the retrieval of the layer density and density-depth profiles through the critical refractivity index method CRIM. Section 4.3 explains the iterative process for identifying annual layers from CMP-derived IRHs by matching estimated SWE to annual point mass-balance observations. Subsequently, we also provide a method to date annual layers from the deep firn core and to chronologically match them with CMP-gathered IRHs. With the help of two CMP-derived density profiles (CMP2 and CMP3) we traced the spatial firn density and accumulation distribution as explained in Sect. 4.4. Finally, Sect. 4.5 illustrated the method to estimate firn compaction rate from the 2024 and 2025 CMP measurements. The details of each method are provided in respective subsections below. All GPR surveys, including CMP data, directly measure radar travel times and reflected wave-fields. We interpret observed reflectors/IRHs as interfaces to identify them as annual firn layers subsequently and to derive firn layer density, layer thickness, and compaction rate.
4.1 GPR data processing
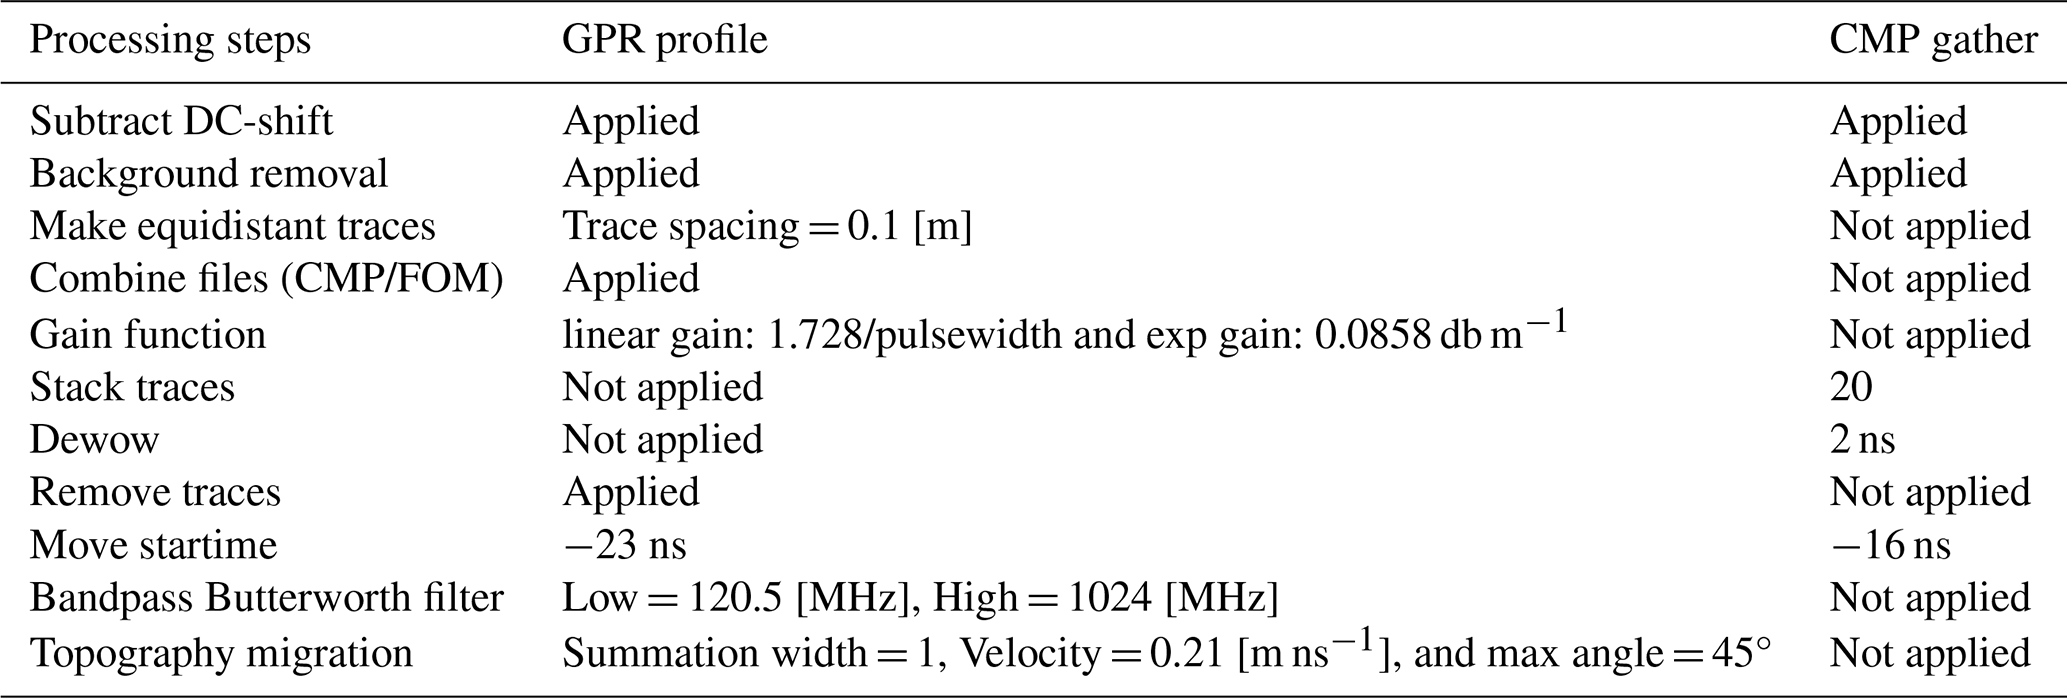
The GPR transect was processed using ReflexW software (Sandmeier, 2010) following the conventional processing steps as described in previous studies (Ulriksen, 1982; Annan, 1993; Fisher et al., 1996). A sequence of processing steps, such as filtering and gain, removes noise and improves the visibility of the radargrams. The application of de-wow filtering, stacking, and a bandpass Butterworth filter increases the signal-to-noise ratio. Other processing steps included moving the start time to adjust the first arrival at the surface, background removal, and static correction to reduce system-induced irregularities. We also applied interpolation technique for equidistant traces (Fig. 2a) similar to that of the Patil et al. (2025b) study. The visible IRHs on GPR transect radargrams were traced/picked using the built-in semi-automated phase follower tool within ReflexW software. The basic GPR processing steps used for GPR transects and CMP gathers are detailed in Table 3. A flowchart and detailed explanation on GPR transects and CMP data processing flow is provided in the Supplement (Fig. S2).
Table 3Processing steps and parameter values applied to the GPR long profile and CMP gather. Each processing step and value is subject to the quality of the acquired data.
4.2 GPR CMP semblance analysis
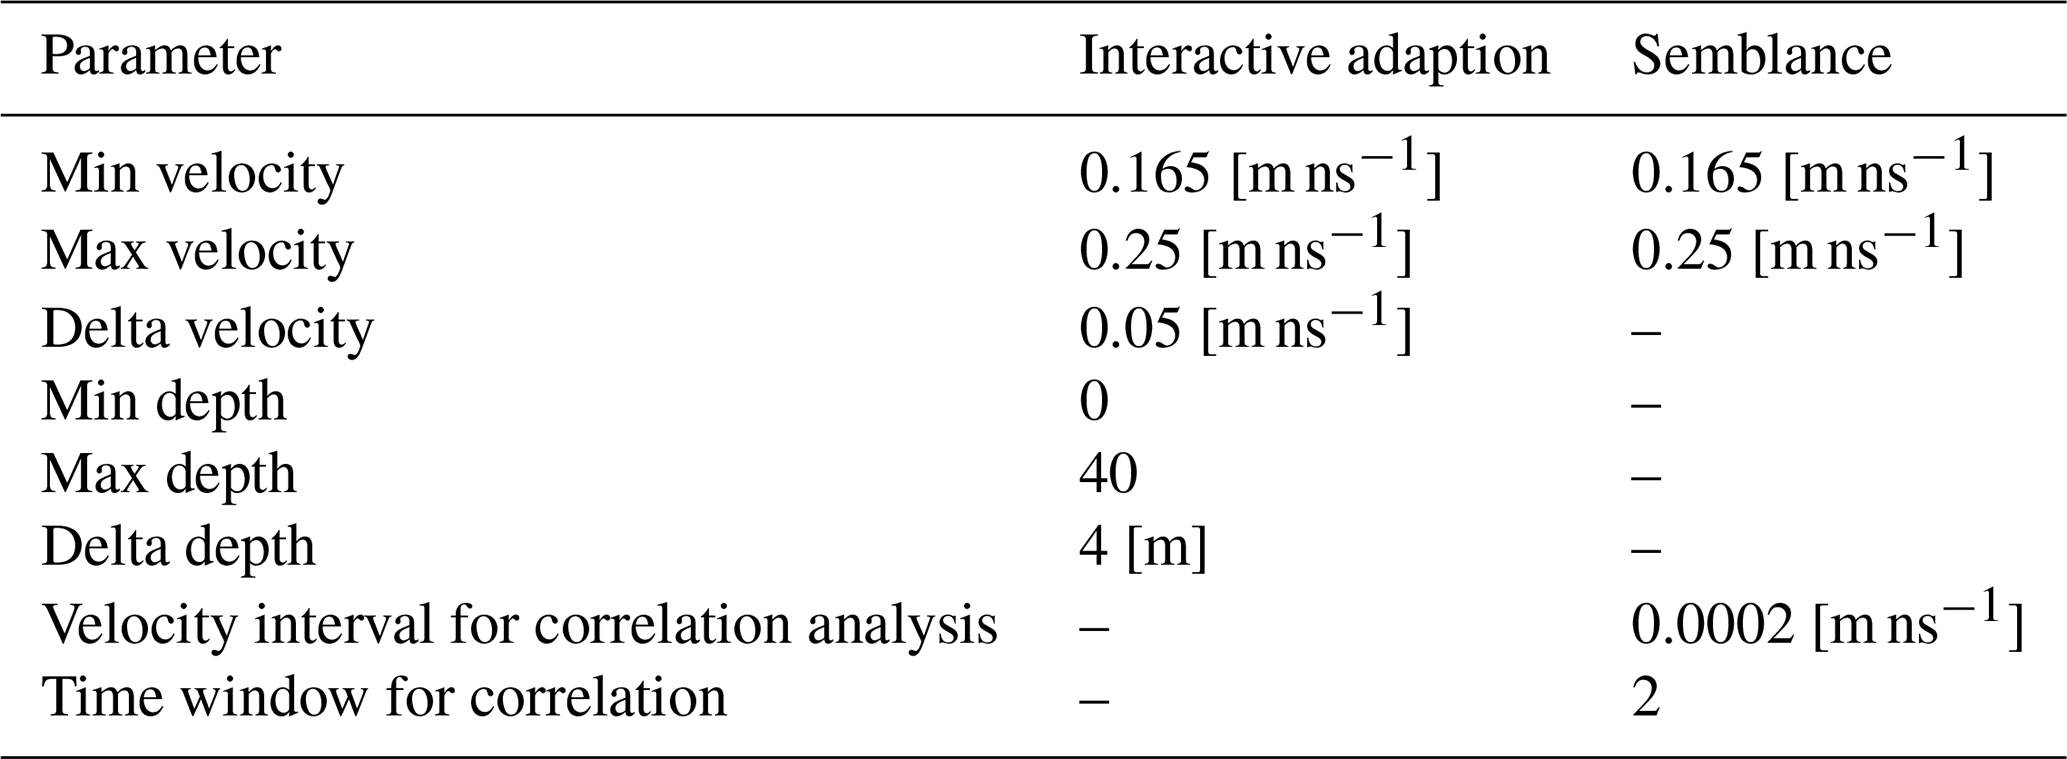
Studies such as Looyenga (1965), Topp et al. (1980), and Endres et al. (2009) illustrate that the subsurface properties of the medium can be derived from the radar wave propagation velocity, which is necessary to accurately estimate internal reflection horizon (IRH) depths from the measured two-way travel time (TWT). The radar propagation velocity as Vrms in the medium above the target can be estimated by matching the reflections of a synthetic propagation model to the curvature of the observed reflections (Yilmaz, 2001; Annan, 2005; Schmelzbach et al., 2012). The CMP data were processed in a manner comparable to our 2024 workflow (Patil et al., 2025b) and, as outlined in Sect. 4.1, the only difference is that each Tx–Rx offset was acquired individually and then merged into a continuous profile within ReflexW. The parameters and parameter values used for the semblance analysis are provided in Table 4.
Table 4Parameter values applied to the Semblance analysis of all CMP data gathered in 2024 and 2025 within the ReflexW interactive CMP (1D) velocity analysis window.
The semblance analysis (Fig. 2) aids in picking Vrms and TWT based on the peak energy coherence between waveforms that are centred on hyperbolic trajectories (Fig. 2b) within the analysis windows (Sheriff and Geldart, 1999). The picked Vrms velocities and corresponding TWT of each reflector from the semblance analysis can be used to determine the interval velocities (Fig. 2c) using the Dix equation (Eq. 1), which is a measure of subsurface dielectric properties within each firn layer (between two IRH boundaries):
where Vint is the interval velocity through layer i, twti, twti−1, and are two-way travel times and root-mean square (vrms) velocities through layer ith, and i−1th interfaces, respectively. Further, the density within each firn layer can be obtained by using the relation between the interval velocity (Vint) and the density by modifying the critical refractivity index method CRIM (Wharton et al., 1980; Knight et al., 2004) as
Here, Vair and Vice are radar wave velocities in air and ice (0.3 and 0.167 m ns−1, respectively), whereas the velocity of the radar wave propagation within the firn layer (Vfirn) is estimated from the Dix equation (Eq. 1) as Vint using picked Vrms from CMP semblance analysis and density of ice is assumed as 920 kg m−3. Further details of the semblance analysis and processing technique as a flowchart (Fig. S2) can be found in the Supplement with added screenshots of CMP-1D velocity analysis from the ReflexW software (Fig. S3).
4.3 Internal reflection horizons as annual firn layers
Sold et al. (2015) illustrates the identification of internal reflection horizons (IRHs) as annual layers through direct comparison with firn core observations. Patil et al. (2025b) presents an iterative chronological method to identify internal reflection horizons (IRHs) as annual layers by estimating snow water equivalent (SWE) from GPR-derived CMP-based radar velocity and comparing it with point mass-balance observations. We used this approach to identify observed internal reflectors in CMP acquisition as annual layers from the CMP (CMP2 and CMP4) acquisition. This is achieved firstly by determining each reflector's depth from the measured TWT, and estimating the snow water equivalent (SWE) of the respective layer by multiplying the radar interval velocity (Eq. 1) with the estimated density within each layer (Eq. 2):
with 0.5 × TWTi × Vi being the thickness of the respective layer and ρi is the density of the firn layer.
The estimated SWE within each reflector was compared chronologically with the long-term point mass balance observations (Stake in Fig. 1). The matched SWE between the CMP-derived and long-term point mass balance measurements from the identified IRH is treated as an annual layer; otherwise, the next reflector (IRH) is evaluated iteratively until a SWE agreement indicates the correct annual layer boundary for that particular year. This process was applied to CMP-derived reflectors at CMP2 and CMP4 locations, where no deep firn-core data is available (Fig. 1), assuming constant relative accumulation, which is likely to be constant over a limited area and conservation of mass within each identified annual layer. Figure 3 illustrates the flowchart of the iterative method for identifying internal reflectors as annual layers, applied only to the CMP2 and CMP4 datasets.
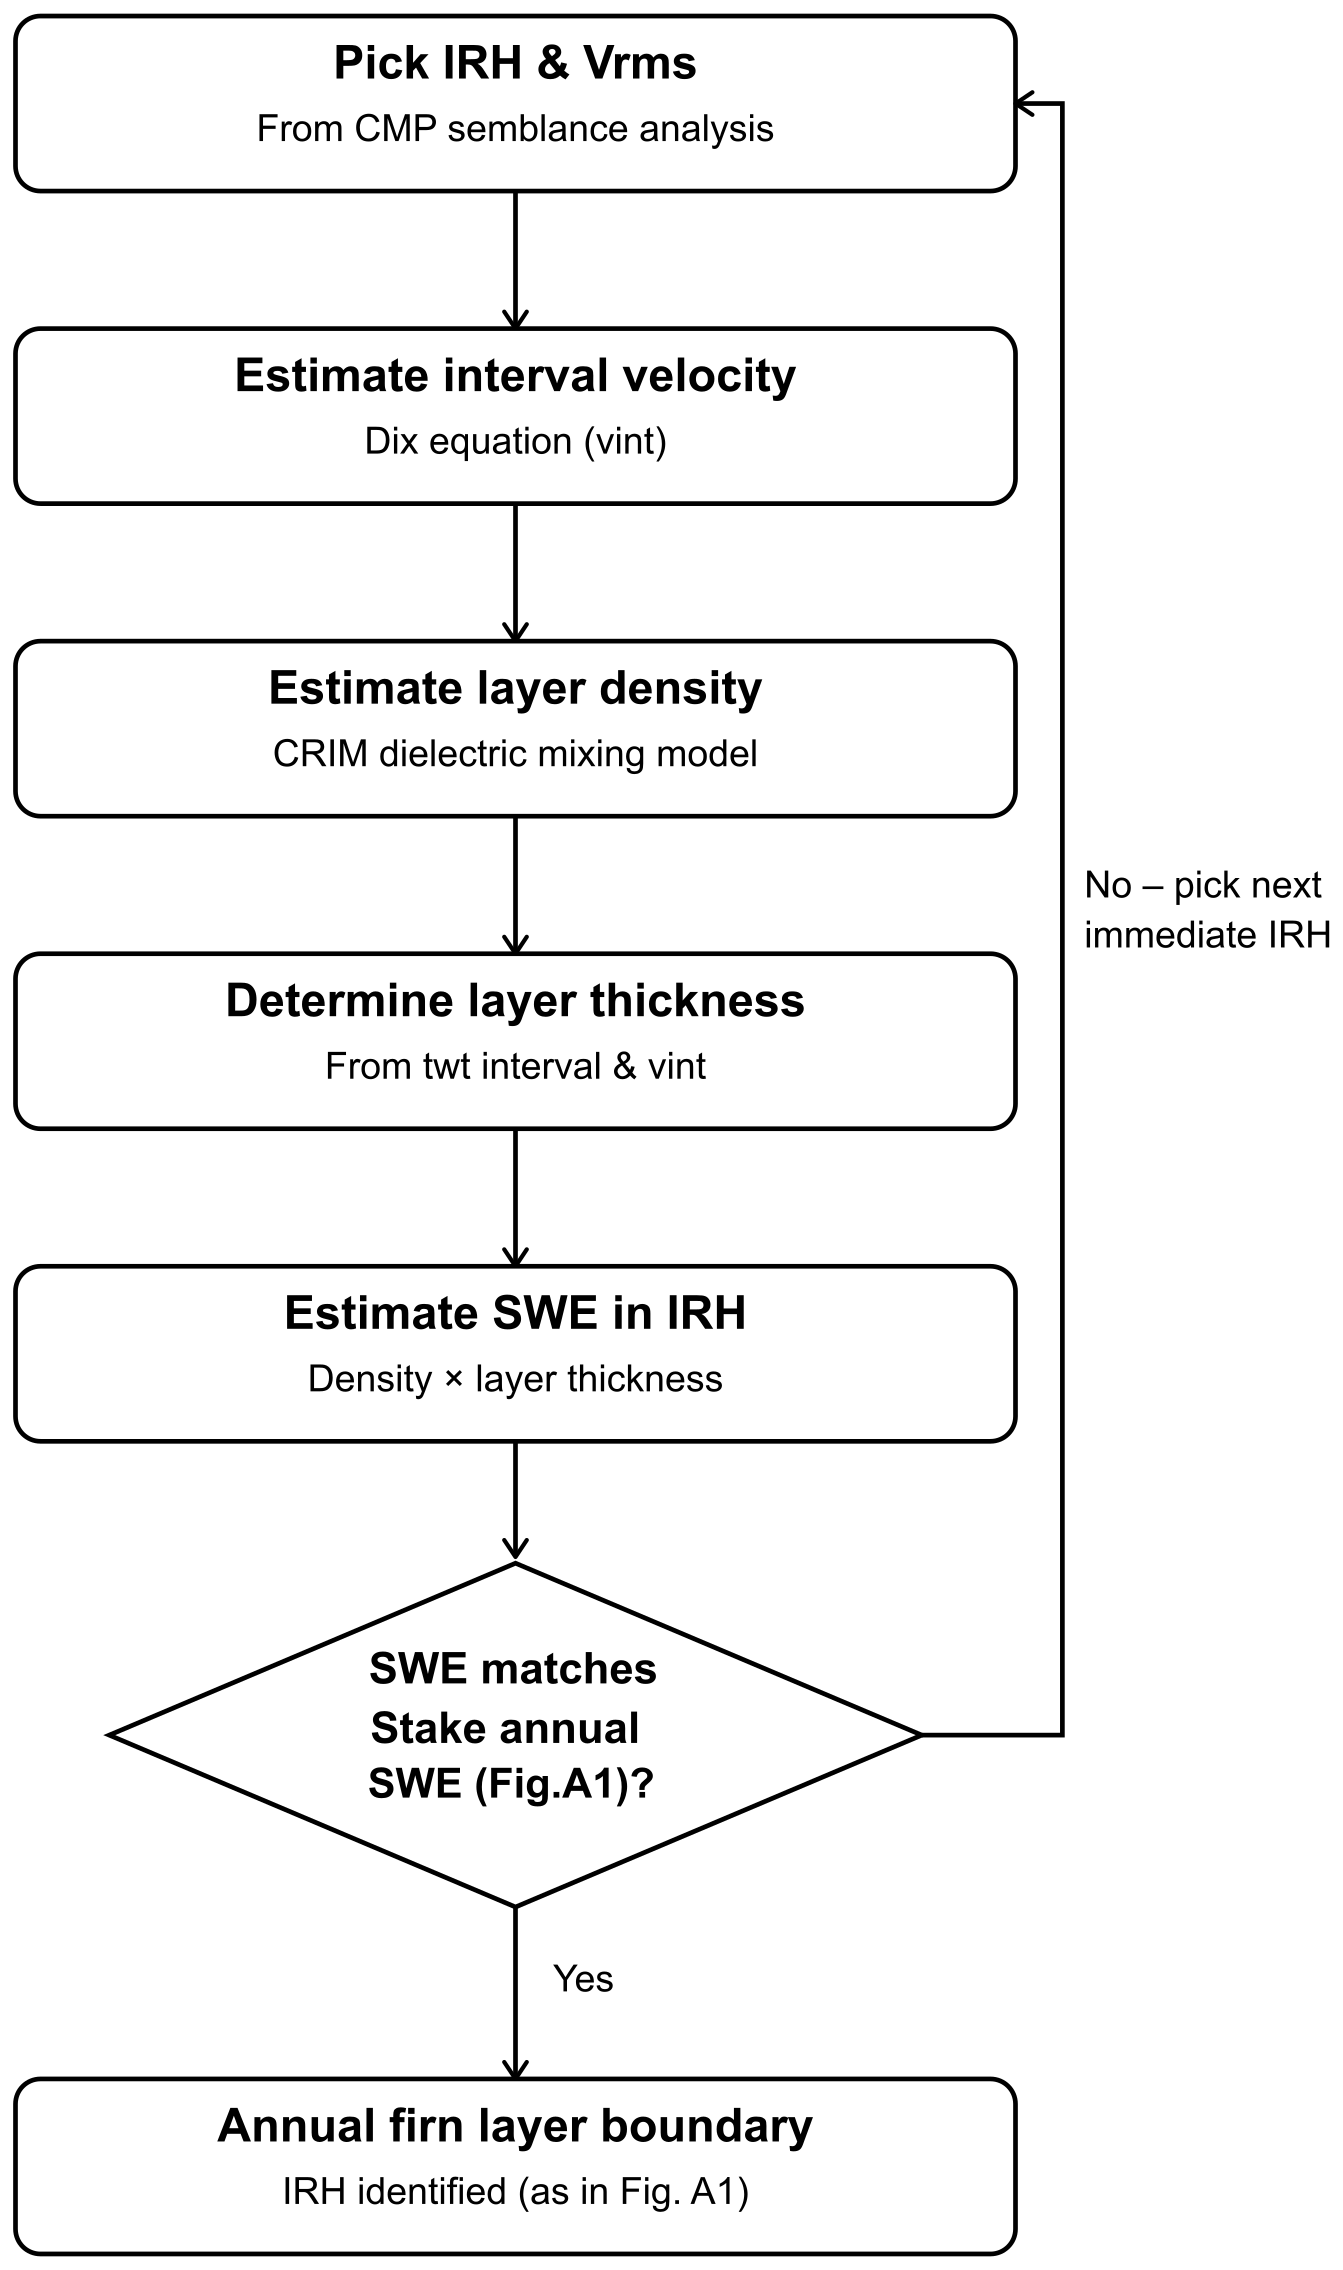
Figure 3Flow chart illustrating an iterative process of identifying CMP IRHs as annual layers as explained in Patil et al. (2025b).
Annual layer dating using firn core
We used spikes in chemical impurities, particularly Fe, as a summer horizon complemented by visible Sahara dust events from the firn core (FC3 in Fig. 1) to date the annual firn layers. Further, IRHs from nearby CMP3 measurements (CMP3 in Fig. 1) were identified as annual layers by chronologically comparing the estimated SWE above each Fe spike with the CMP-derived SWE (Eq. 3). The comparison of estimated SWE from point mass-balance measurements (stake in Fig. 1) and FC3 is shown in Fig. A5, which is used to identify annual layers using CMP gathered at CMP3 locations. The uncertainty associated with IRHs derived from the semblance analysis and annual layer dating is discussed in Sect. 6.5.
4.4 Spatial firn density variation and accumulation distribution
The study by Patil et al. (2025b) demonstrates a method for tracing spatial firn density and accumulation history using a CMP-derived firn density-depth profile and an extrapolated profile from a shallow firn core. We improved this method by using a deep firn core (FC3) and a CMP-derived (CMP2) firn density-depth profile approximately 2 km apart (Fig. 1). We estimated spatial firn density variation and accumulation distribution, following a similar approach to our previous work (Patil et al., 2025b), using a CMP-derived density-depth profile (CMP2) for the lower part and a firn core (FC3) for the upper part of the Ewigschneefeld. We identified annual layers (Sect. 4.3 and “Annual layer dating using firn core”) and estimated corresponding densities within firn layers (Eq. 2). Further, we obtained the spatial firn density distribution by interpolating the density gradient along the GPR profile (black line in Fig. 1) between the FC3 and CMP2 locations. The accumulation distribution can be estimated in terms of SWE by multiplying the firn layer thickness by the estimated density of the respective layer (Eq. 3). The IRHs identified on the radargram (Fig. 4b) are considered as annual layers by following the procedure in Sect. 4.3 and Fig. 3. We compared the results of accumulation and density variations with those from 2024 investigations and interpreted the temporal changes. We provide corresponding figures with brief interpretation in Appendix A (Figs. A3 and A4). However, we discuss their effects on temporal changes in density and compaction rate estimates in the respective discussion sections (Sect. 6.3 and 6.4).
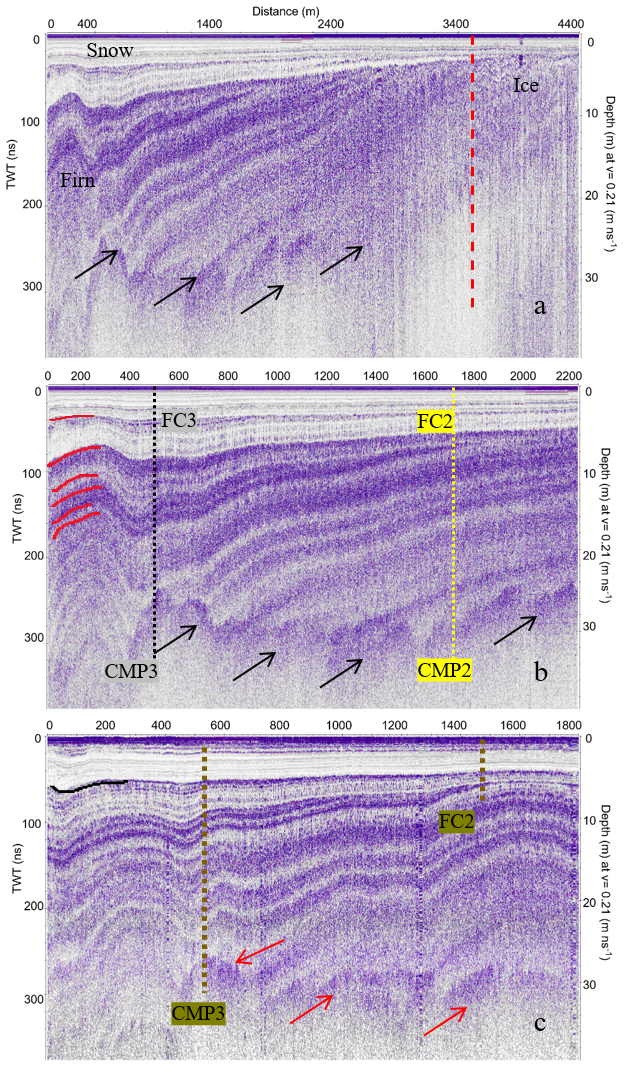
Figure 4Radargrams obtained from the ground-penetrating radar (GPR) profiles gathered in 2025 (a), a shortened 2025 radargram (b) that covers a similar section as the 2024 radargram (c). The location of the GPR profiles is described in the data chapter (Sect. 3). The top x axis shows the distance of GPR profiles, the left y axis depicts radar two-way travel time (TWT) in ns, and the right y axis indicates the approximated depth in meters, assuming constant radar velocity in firn (0.21 m ns−1). The approximate locations of CMP and firn-core measurements along the respective GPR profiles, as detailed in Fig. 1, are indicated in the respective radargrams (b, c). The dotted vertical red line depicts the approximate location of the equilibrium line altitude (ELA). The pickable IRHs in both radargrams are shown in red lines (b) and a black line (c), and the strong reflector at the deeper depth of the radargrams is shown in black (a, b) and red (c) arrows.
4.5 Firn compaction rate
To derive the firn compaction rate from the CMP data, we compute the change in annual-layer thickness between two time points (Hawley et al., 2004), in our case between the 2024 and 2025 measurements. After identifying annual layers, we determine the change in TWT in nanoseconds (ns) and, subsequently, the depth for each layer from the interval velocity. This change in layer thickness with time provides the compaction rate.
The equation used here (Eq. 4) results in negative values for thinning layers between repeated measurements.
We begin with the glaciological and firn-core observations that provide context and act as last summer's horizon markers for the radar analysis. These secondary datasets and results serve as inputs for the main radar-based CMP results, forming the core of this study. The main findings include: CMP-based firn stratigraphy, changes in firn density over time, and CMP-derived compaction rates. Lastly, we present additional GPR profiles that show the spatial firn stratigraphy, helping us trace the spatial variation in firn density.
5.1 Contextual glaciological observations
Figure 5 shows snow and firn density-depth profiles at three locations of the Grosser Aletschgletscher accumulation area using firn cores and snow-pits from winter 2025 (orange coloured FC2, FC3, and SP4 in Fig. 1). The 19.4 m deep firn core (FC3) display firn density fluctuation from surface snow density of 200 to ∼ 830 kg m−3 at 18 m depth. The typical firn density of 550 kg m−3 is reached at around 5 m, and the depth of near pore close-off density (830 kg m−3) is deeper than the drilling depth despite some local maxima at ∼ 13 and 18 m, which can be attributed to increased local density due to ice lenses. The shallow firn core obtained at the lower part of the Ewigschneefeld (FC2 in Fig. 5) demonstrates a similar density-depth variation compared to that of the deep firn core (FC3), but with generally higher densities. The depth to reach firn density (550 kg m−3) is at 3–3.25 m. The density offset between FC2 and FC3 locations is pronounced at depths greater than 2 m. The estimated bulk SWE up to the common depth of around 8 m at the FC3 location is around 3950 mm w.e. in comparison with 4140 mm w.e. at FC2.
Ice lenses were found in the firn core (FC2) at shallower depths (around 3 m) and at the bottom of the firn core (7–7.5 m), depicting the corresponding density maxima at these depths. Within the deep firn core (FC3), we could not identify any near-surface ice lenses up to a depth of 8.5 m. Several ice lenses were identified at greater depths, corresponding to local density maxima. The visible Sahara dust layers (orange bars) can also be seen near 9 and 11.5 m in the deep firn core (FC3) and at 6.5 m (brown bar) in the shallow firn core (FC2). The density trend from the snow-pit (SP4) shows similar variations as that of FC2, except for the higher surface snow density and a sharp kink at 2.5 m depth with a surface density offset of around 80 kg m−3 when compared with the FC3 measurement results.
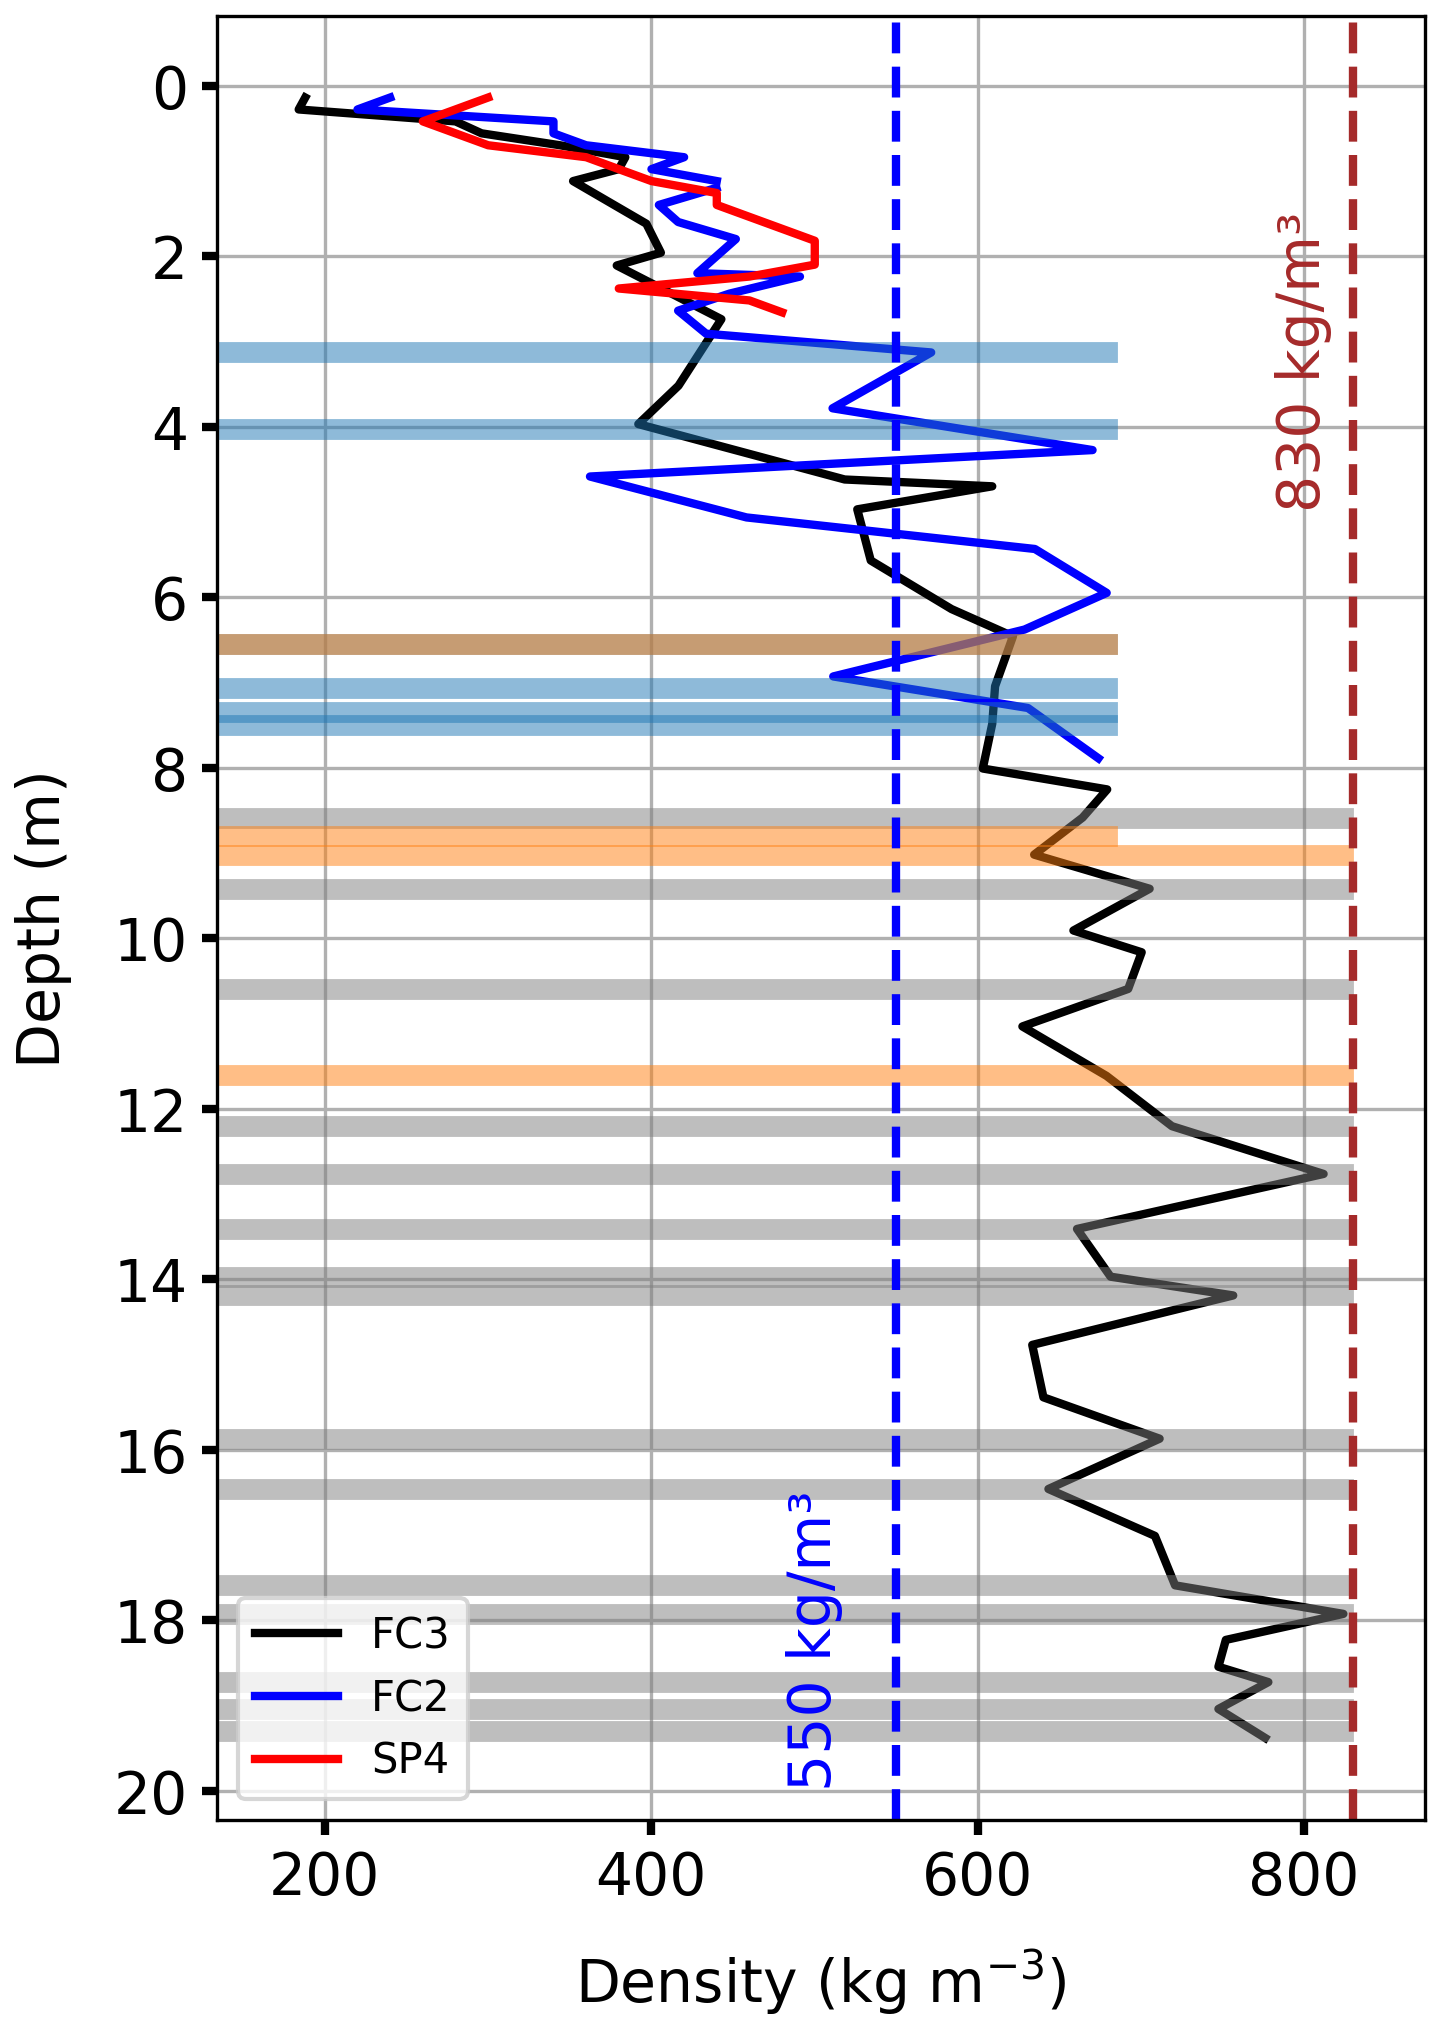
Figure 5The density-depth profile obtained from the deep firn core (FC3), a shallow firn core (FC2), and a snow-pit (red line, SP4) from winter 2025 (Fig. 1). The light blue and grey horizontal bars represent visually identified ice lenses in the shallow firn core (blue line) and in the deep firn core (black line), respectively. Visible Sahara dust layers are shown as orange horizontal bars and a brown bar. The vertical dotted blue and brown lines indicate the firn and pore close-off density, respectively. All ice lenses and the visible thickness of the Sahara dust layer are not to scale.
Firn core-derived profiles of stable water isotope and chemical impurities
Figure 6 shows the comparison of the density (a), stable water isotope (b), and electrical conductivity (c) profiles. Whereas major ions and chemical impurities (d, e, f, and g) profiles indicate the deposition of dust and anthropogenic pollutants with depth. The variations in the δ18O show pronounced signal fluctuations from the surface to a depth of 3.5–4 m. The result shows that the stable water isotope signal attenuates from 3.5 to 9 m, and we estimate that the last summer horizon, starts at a depth of 3–4 m (at the time of sampling, Table 1). The results show lower δ18O concentrations of −12 ‰ to −17 ‰ between 4 and 8 m, which further decreases to below −12 ‰ between 9 and 15 m. At deeper depths (depth > 15 m), δ18O concentration fluctuates between −17 ‰ and −10 ‰. The electrical conductivity, which indicates total ion content in Fig. 6c, shows a strong spike near 4 m depth. However, below 4 m, the electrical conductivity signal is significantly reduced, indicating loss of signal due to meltwater percolation (washout and eventual run-off of soluble ions) and a mean concentration of 5.8 µS cm−1. Whereas some noticeable spikes at around 9 and 13 m depth near the visible Sahara dust and ice lenses depict the presence of low-concentration impurities (near 15 µS cm−1).
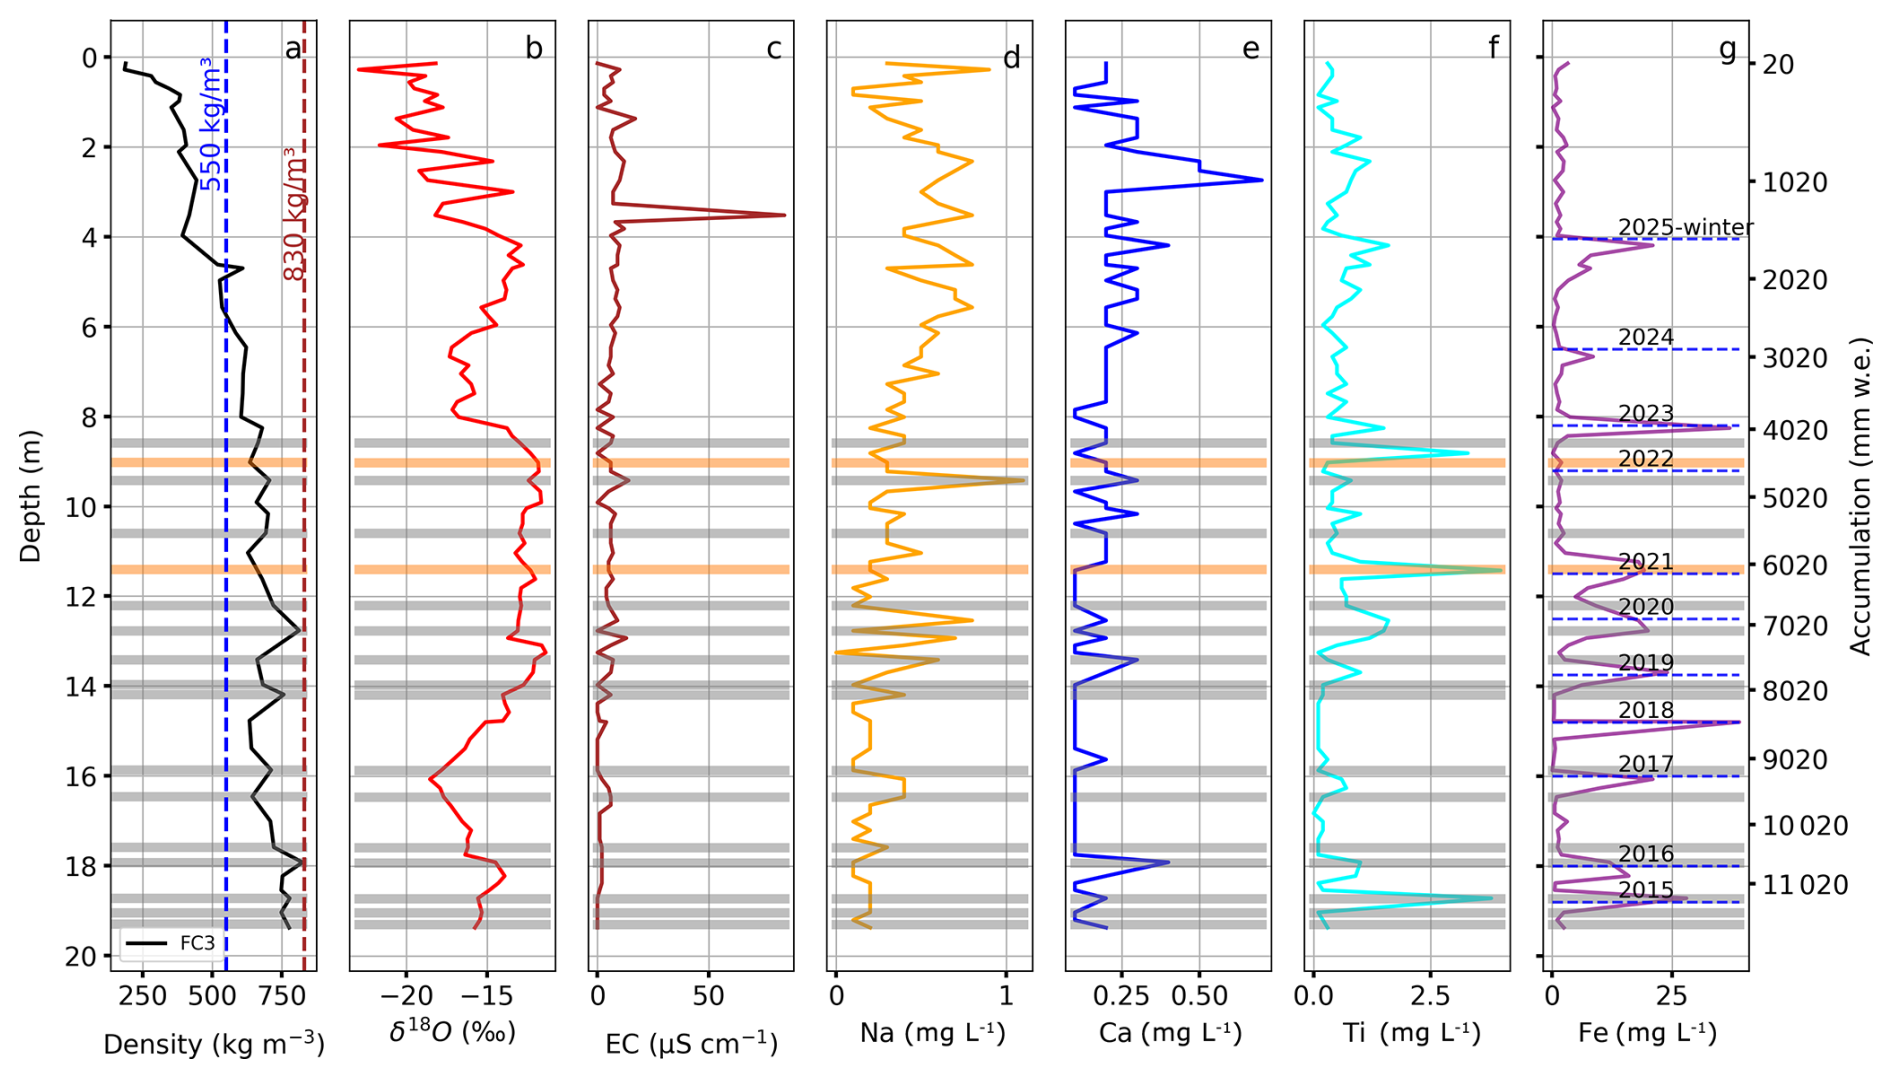
Figure 6Illustration of depth distribution of different parameters in the firn core (a) density, (b) stable water isotope, (c) electrical conductivity, and the lab analysis of the major ions and chemical impurity concentration (mg L−1) with depth, such as Na (orange, d), Ca (blue, c), Ti (cyan, f), and Fe (purple, g) for FC3 at the upper Ewigschneefeld. The firn and pore close-off densities are indicated by dotted blue and brown vertical lines, respectively (a). Grey horizontal bars represent visually identified ice lenses, whereas orange horizontal bars depict visible Sahara dust events. The highlighted dashed blue lines (g) indicate the identified annual layers. The right y axis shows the bulk accumulation estimated from the firn core data. The thickness of all ice lenses and the visible Sahara dust layer is not to scale.
Figure 6d, e, f, and g show fluctuations in major ion and chemical impurity concentrations with depth. Of the measured species, Na is primarily associated with sea salt, with additional contributions from mineral dust that decrease with depth, except for the spike near the identified Sahara dust and ice lenses in the firn core. Ca, Ti, and Fe are most indicative of mineral dust (particularly Ti and Fe can also have anthropogenic sources). We identified two prominent visible Sahara dust (orange bars) events within the last 10 years from the firn core. However, three spikes in Ti mineral concentration (> 2.5 mg L−1) at depths corresponding to two visible Sahara dust layers and one at 18–19 m depth demonstrated a possible third Sahara dust event in 2016, which we did not identify visually from the firn core. This is further evident from an increased Fe mineral concentration (> 25 mg L−1) at the same depth (18–19 m). The Ca ion concentration is well below 0.5 mg L−1 except at 3 m depth. We estimated the mean concentration of Na, Ca, Ti, and Fe as 0.34, 0.19, 0.6, and 4.8 mg L−1, respectively.
Figure 6 also shows the bulk accumulation estimated from the deep firn core in mm w.e. (right y axis). We traced depth to annual layers and corresponding accumulation by considering Fe peaks as a reference to the last summer horizon. We identified visible Sahara dust events recorded in March 2022 and February 2021 agree well with the physically identified visible Sahara dust layers. The third Sahara dust event identified from mineral concentrations (Ti and Fe) in the firn core also matches the event observed in April 2016 (GLAMOS, 2018b).
5.2 Comparison of multi-year glaciological measurements
We compared repeated glaciological measurements collected at the lower part of Ewigschneefeld on 29 February 2024 and 30 March 2025, approximately 50 m apart. Figure 7 shows the firn cores, the snow pit-derived density-depth profiles, corresponding identified ice lenses and the visible Sahara dust layer during two field measurements approximately 400 d apart. The comparison of the 2024 and 2025 results show depth to the last summer horizon at this elevation varies between the two years. In 2024, the measured winter accumulation up to the measurement day was approximately 1985 mm w.e. (∼ 5 m depth), whereas on 30 March 2025, the estimated accumulation was 1380 mm w.e. (∼ 3 m depth). Because of the lack of isotope analysis from the shallow firn core in 2025, we can not provide further supporting evidence for the summer-to-winter transition, as compared to the firn core in winter 2024, where the result was supported by isotope analysis (see Fig. 9 in Patil et al., 2025b). The detailed comparison reveals that the variation in density with depth remains similar up to the depth of the last summer horizon (3 m). However, winter snow density at the surface in 2024 was nearly 100 kg m−3 lower than that of 2025 measurements (depth < 1 m). The winter 2025 firn core results show significant fluctuations with a maximum density offset of 200 kg m−3 between 4 and 5 m depth, which is not observed in winter 2024 (FC2 and SC2-2024). This can be attributed to the observed ice lenses at that depth. Furthermore, the depth to firn density (550 kg m−3) is much shallower (depth < 4 m) in FC2-2025 than in FC2-2024 where it occurred at around 5 m. The maximum density of around 650 kg m−3 occurs between 5.5 and 6.5 m in 2025, whereas in 2024 it occurs at 7 m depth.
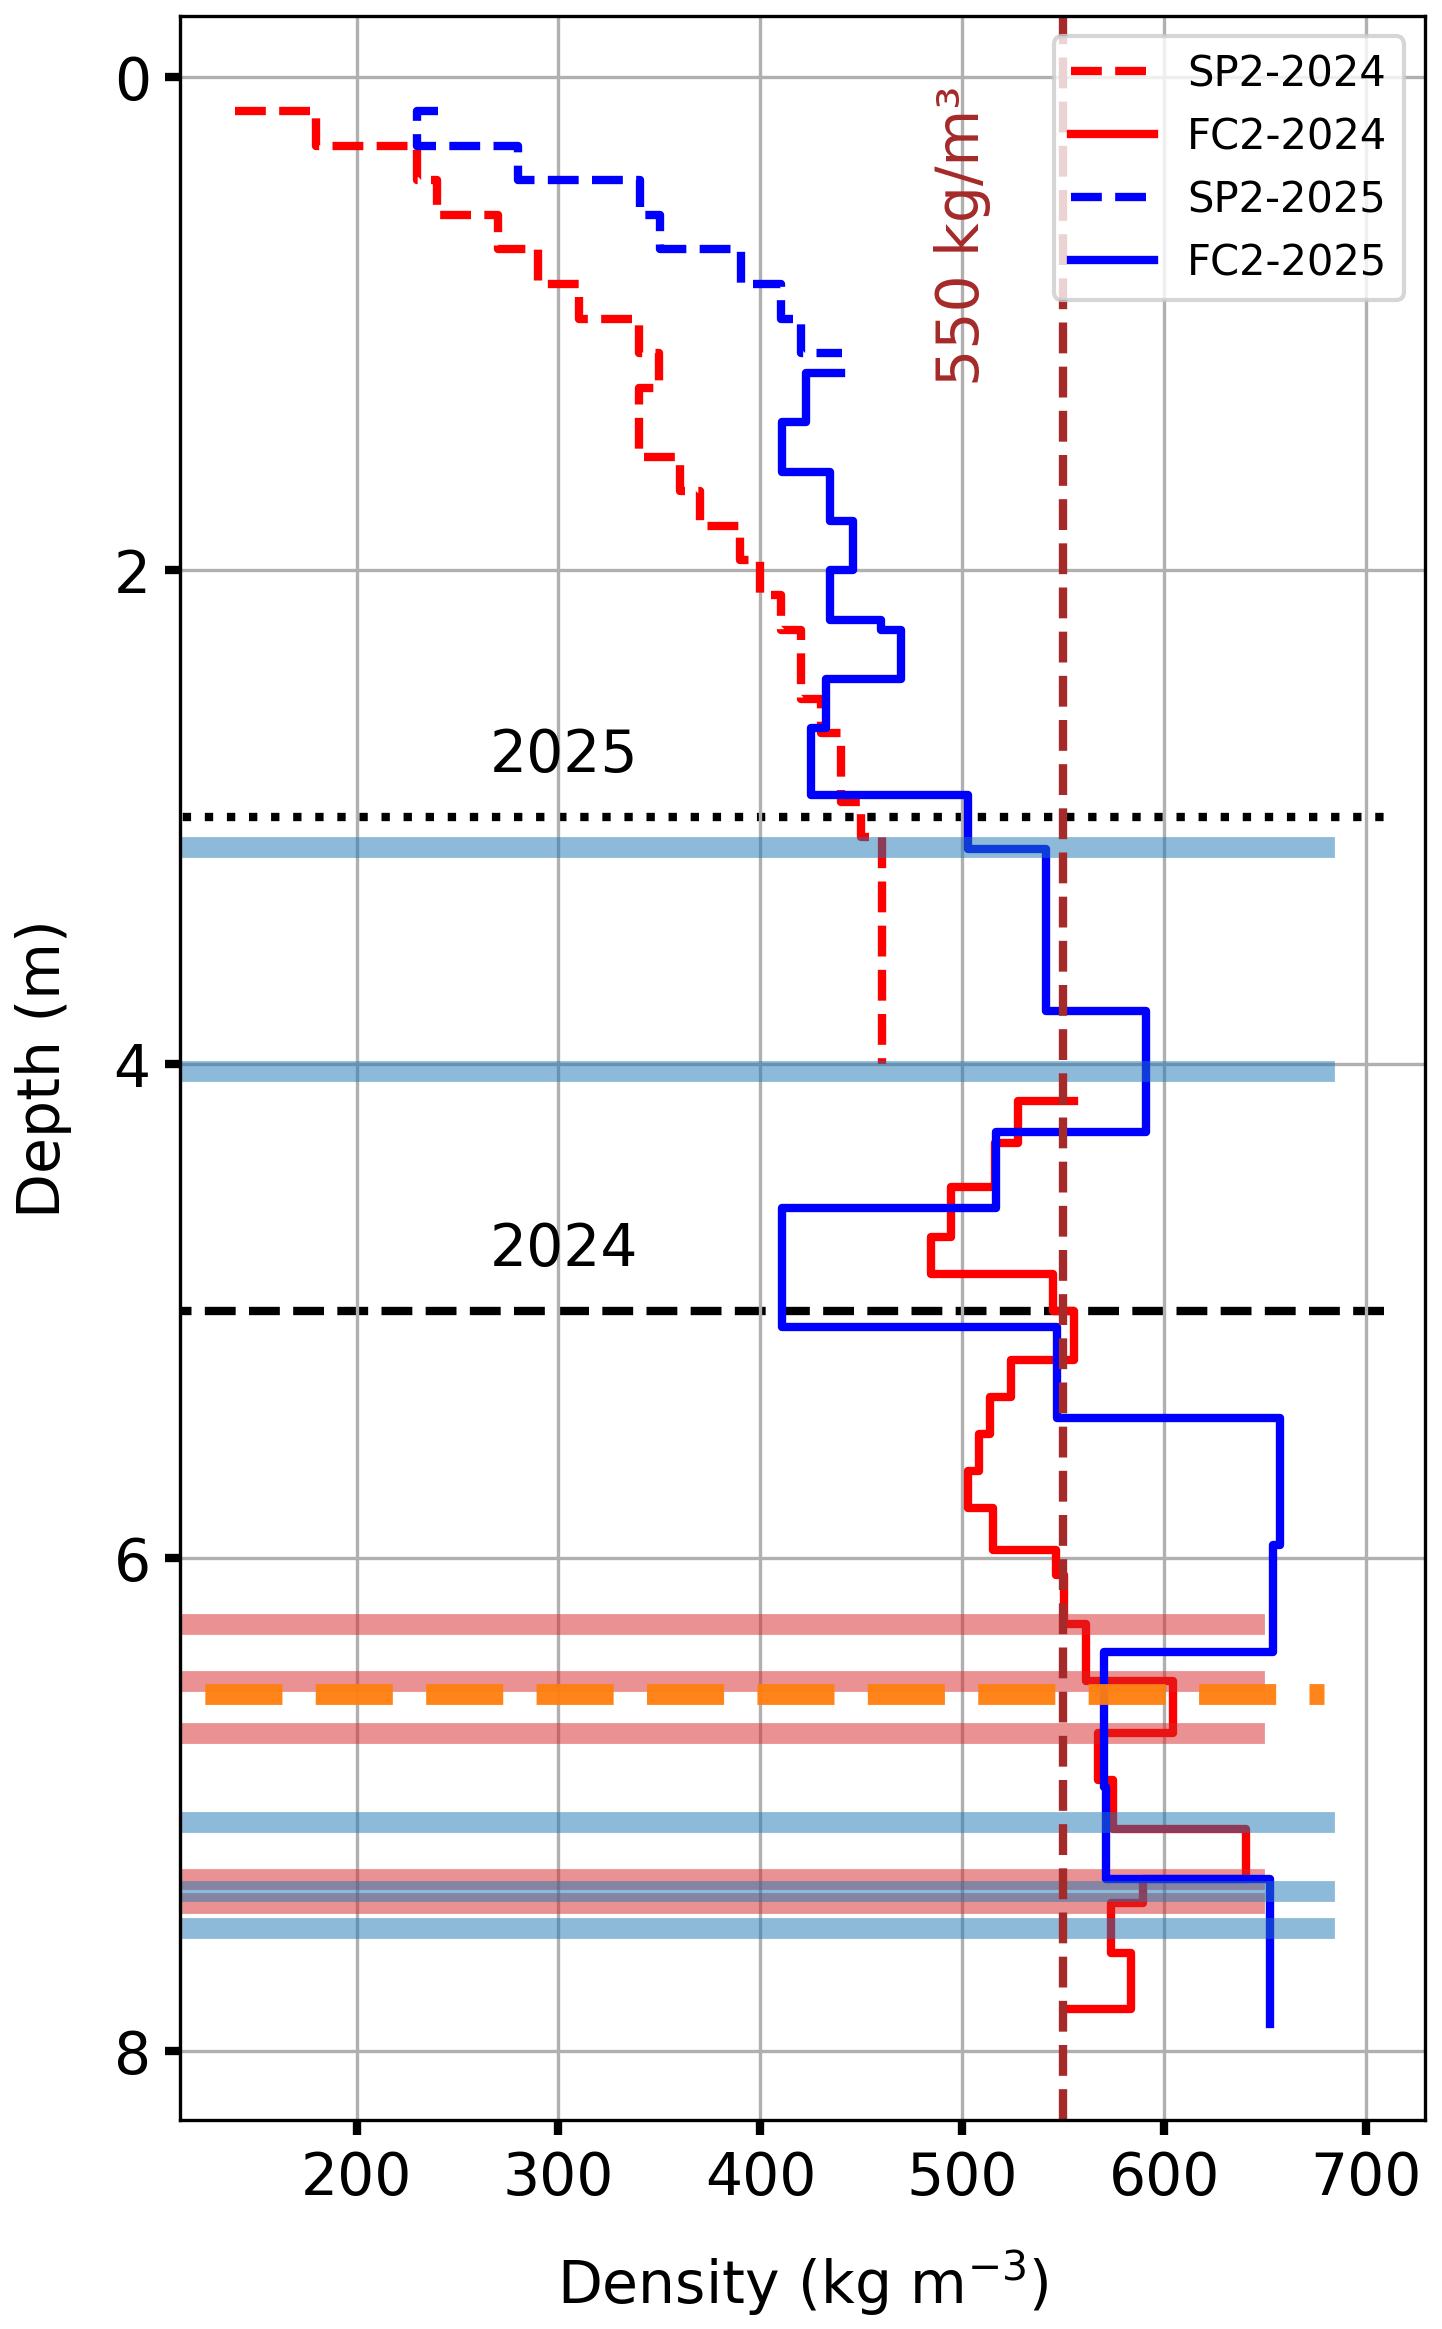
Figure 7Comparison of firn density-depth derived from the 2024 and 2025 winter glaciological measurements (shallow firn cores, FC2 in Fig. 1) at the lower part of Ewigschneefeld. The dashed red and blue vertical lines refer to the density profiles from the snow pit, whereas the solid red and blue lines illustrate density-depth profiles derived from the firn core starting at the bottom of the respective snow pits. The horizontal lines shown here are identified ice lenses from the snow and firn cores corresponding to the coloured lines. The visible Sahara dust layer is depicted by a horizontal dashed orange line, identified from the firn core collected during the 2025 measurements. The black dashed-and-dotted horizontal layer represents the 2025 and 2024 winter accumulations in meters of depth, respectively. The legend at the top-right corner of the figure shows the years and corresponding glaciological measurements. The depth axis (y axis) is plotted as a reference surface for the respective 2025 and 2024 shallow firn core results.
5.3 Radar-derived firn stratigraphy
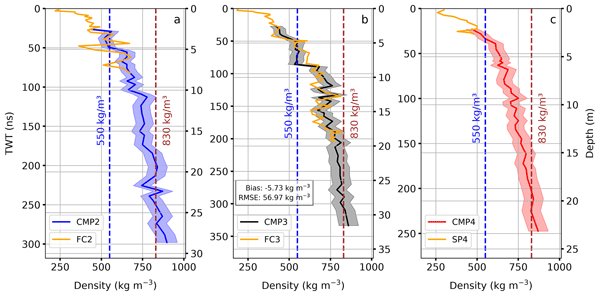
The firn density-depth profiles of all three CMP acquisitions show increasing density with depth. Figure 8 illustrates the variable densification across three locations of the Grosser Aletschgletscher. At the lower part of Ewigschneefeld, the identified first reflector depth is approximately 3 m, and density above the first reflector is around 450 kg m−3 (CMP2), which is similar to the results from the CMP4 profile with an initial density of 460 kg m−3. In contrast, the CMP3 located at the higher elevation has a somewhat lower density (420 kg m−3) from the surface to the first reflector depth (around 3.5 m). The depth to the firn density (550 kg m−3) also varies across three locations, ranging from 3–3.5 m at CMP2 and CMP4 to approximately 5 m at CMP3 (higher elevation). Similarly, the depth to pore close-off density (830 kg m−3) is significantly shallower, around 18–19 m at the CMP2 and CMP4 locations, compared to 27 m at the CMP3 location.
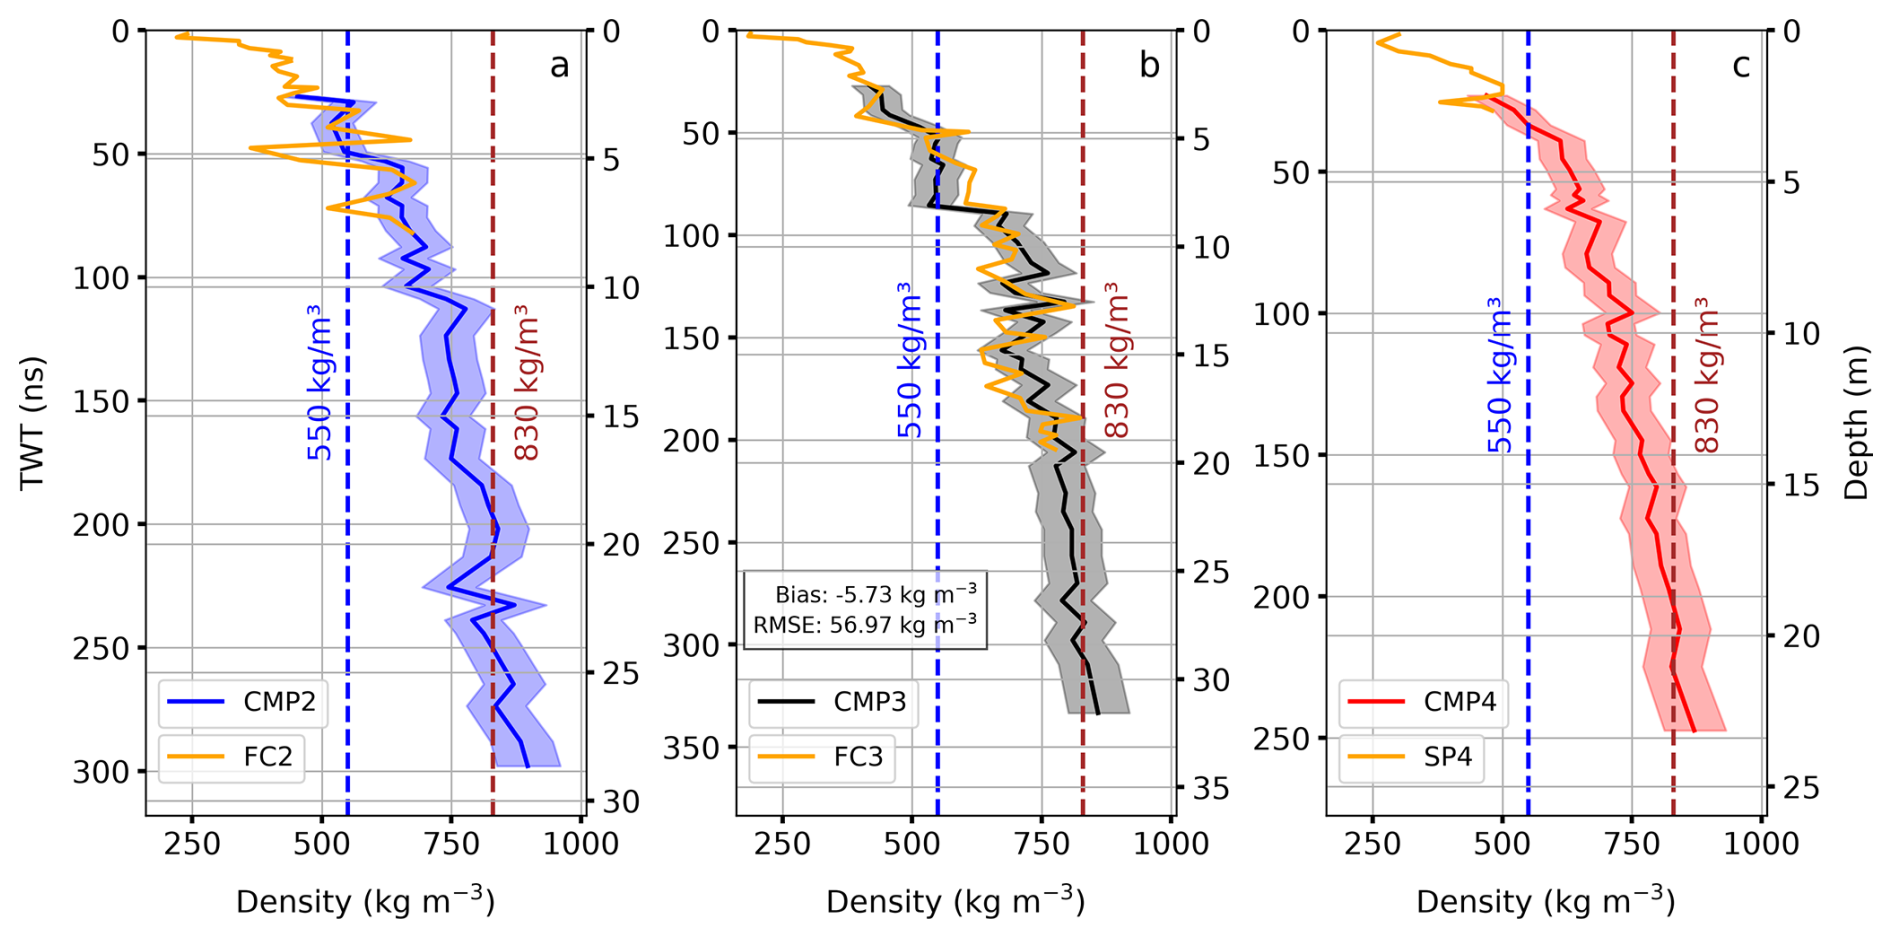
Figure 8Firn density-depth profiles estimated from the CMP gather acquired in winter 2025 at the accumulation area of the Grosser Aletschgletscher (black crosses in Fig. 1). The figure also shows firn density-depth profiles obtained from firn cores (FC2 and FC3) and a snow pit (SP4) near each corresponding CMP measurement location (orange line in each subplot). The blue line (panel a) shows the CMP-derived (CMP2) firn density-depth profile from the lower part of the Ewigschneefeld, the black line (panel b) is obtained from the upper part of the Ewigschneefeld, and the red line (panel c) shows the density-depth profile near the long-term mass balance measurement location (Jungfraufirn, Fig. 1). The uncertainty range is shown in corresponding shaded colours. The dotted blue and brown lines depict the depth to firn and pore close-off density. The left and right y axes demonstrate the radar two-way travel time (TWT) in ns and depth in meters corrected for each of the CMP locations after the Dix equation (Eq. 2), respectively.
The comparison of the density-depth profiles between the firn core (FC3) and CMP3 measurements (Fig. 8b) illustrates similar density variations with depth. It is noticeable that certain sharp spikes in FC3 and CMP3 density measurements are located at approximately the same depths, and both show a similar depth for the snow-firn transition. Comparison of density-depth derived from FC3 and CMP3 gives a mean bias of −5.73 kg m−3 and RMSE of ∼ 57 kg m−3 (Fig. 8). Whereas the comparison of the shallow firn core (FC2) and the CMP2 density profile shows a strong spike at 5 m depth in the firn core, and a similar spike is visible in CMP2 near 4.5 m depth (Fig. 8a). The radar-derived depth to the deepest discernible IRH at all locations also varies from 23 m (CMP4) to 27 m (CMP2) to 32 m (CMP3). The uncertainty of radar wave velocity determination from the semblance analysis increases with depth, as seen on all three CMP density-depth profiles in Fig. 8 (shaded area).
5.4 Firn stratigraphy from GPR profiles
The radargram obtained from the 4.4 km-long GPR transect collected on 30 March 2025 is shown in Fig. 4a. Although it is treated as a secondary result, it provides essential spatial context that improves the firn-density and accumulation estimates discussed in Sect. 6.2 and Appendix A. The depicted radargram spans ∼ 300 m surface elevation range (Table 1), starting at the upper accumulation area (left side of Fig. 4a) and reaching into the ablation area of the Ewigschneefeld. Between 0 and 3500 m, the visible IRHs show decreasing thickness with increasing distance along the profile. We identified the upper white region of the radargram, preceding the first prominent IRHs, as accumulated winter snow from the 2024/2025 winter; below, IRHs are interpreted as firn layers. At a depth below 25 m (∼ 220 ns), a prominent undulated reflector is visible (black arrows in Fig. 4a), which spans approximately between 200 and 2500 m in distance within the accumulation area. It is evident that the total firn thickness reduces with the elevation, and almost no firn exists from 3500 m onwards (∼ 3200 m a.s.l.) (rightmost part in Fig. 4a) reaching an ablation area. There, no distinct IRHs are visible except the 2025 winter accumulation and glacier ice boundary. This can be interpret as a spatial firn-to-ice transition and beginning of an ablation area (elevation ∼ 3200 m a.s.l) as discussed in Sect. 6.2.
Figure 4b and c illustrate the comparison of the processed GPR long profile radargrams acquired on 30 March 2025 and 29 February 2024. Here, we use only the upper 2.2 km of the 2025 profile, which also covers the extent of the 2024 profile (Fig. 4b). The first reflector between the surface and 60 ns (4.5 m) depth in Fig. 4c (black line) depicts the 2024 winter accumulation, which is overlaid by the 2025 winter accumulation of approximately 3 m depth (40 ns) in Fig. 4b (red line). Both radargrams show various distinct IRHs, with a prominent reflector at approximately 240 ns (24 m) in 2025 (Fig. 4b, black arrows) and 260 ns (26 m) in 2024 (Fig. 4c, red arrows), along the GPR transect. We used the 2025 GPR transect (Fig. 4b) along with FC3 and CMP2 to trace spatial firn density and accumulation. The corresponding results and discussion are presented in Appendix A, Figs. A3 and A4.
5.5 Radar-derived temporal change in firn density
The temporal changes in firn density at the accumulation area of the Grosser Aletschgletscher from the CMP measurements are shown in Fig. 9. We identified more than 30 IRHs in each CMP3 and CMP4 measurement in both years (2024 and 2025). The use of a 600 MHz GPR system in 2025 provides higher resolution but less penetration depth than the 500 MHz GPR system used in 2024. Therefore, we present CMP results at a common depth from all CMP measurements. It is also evident from Fig. 9a and b that the radar wave attenuates faster in the presence of denser firn (CMP4), providing the deepest discernible IRH approximately at 23 m depth. In contrast, at the CMP3 location, the deepest IRH is at nearly 33 m.
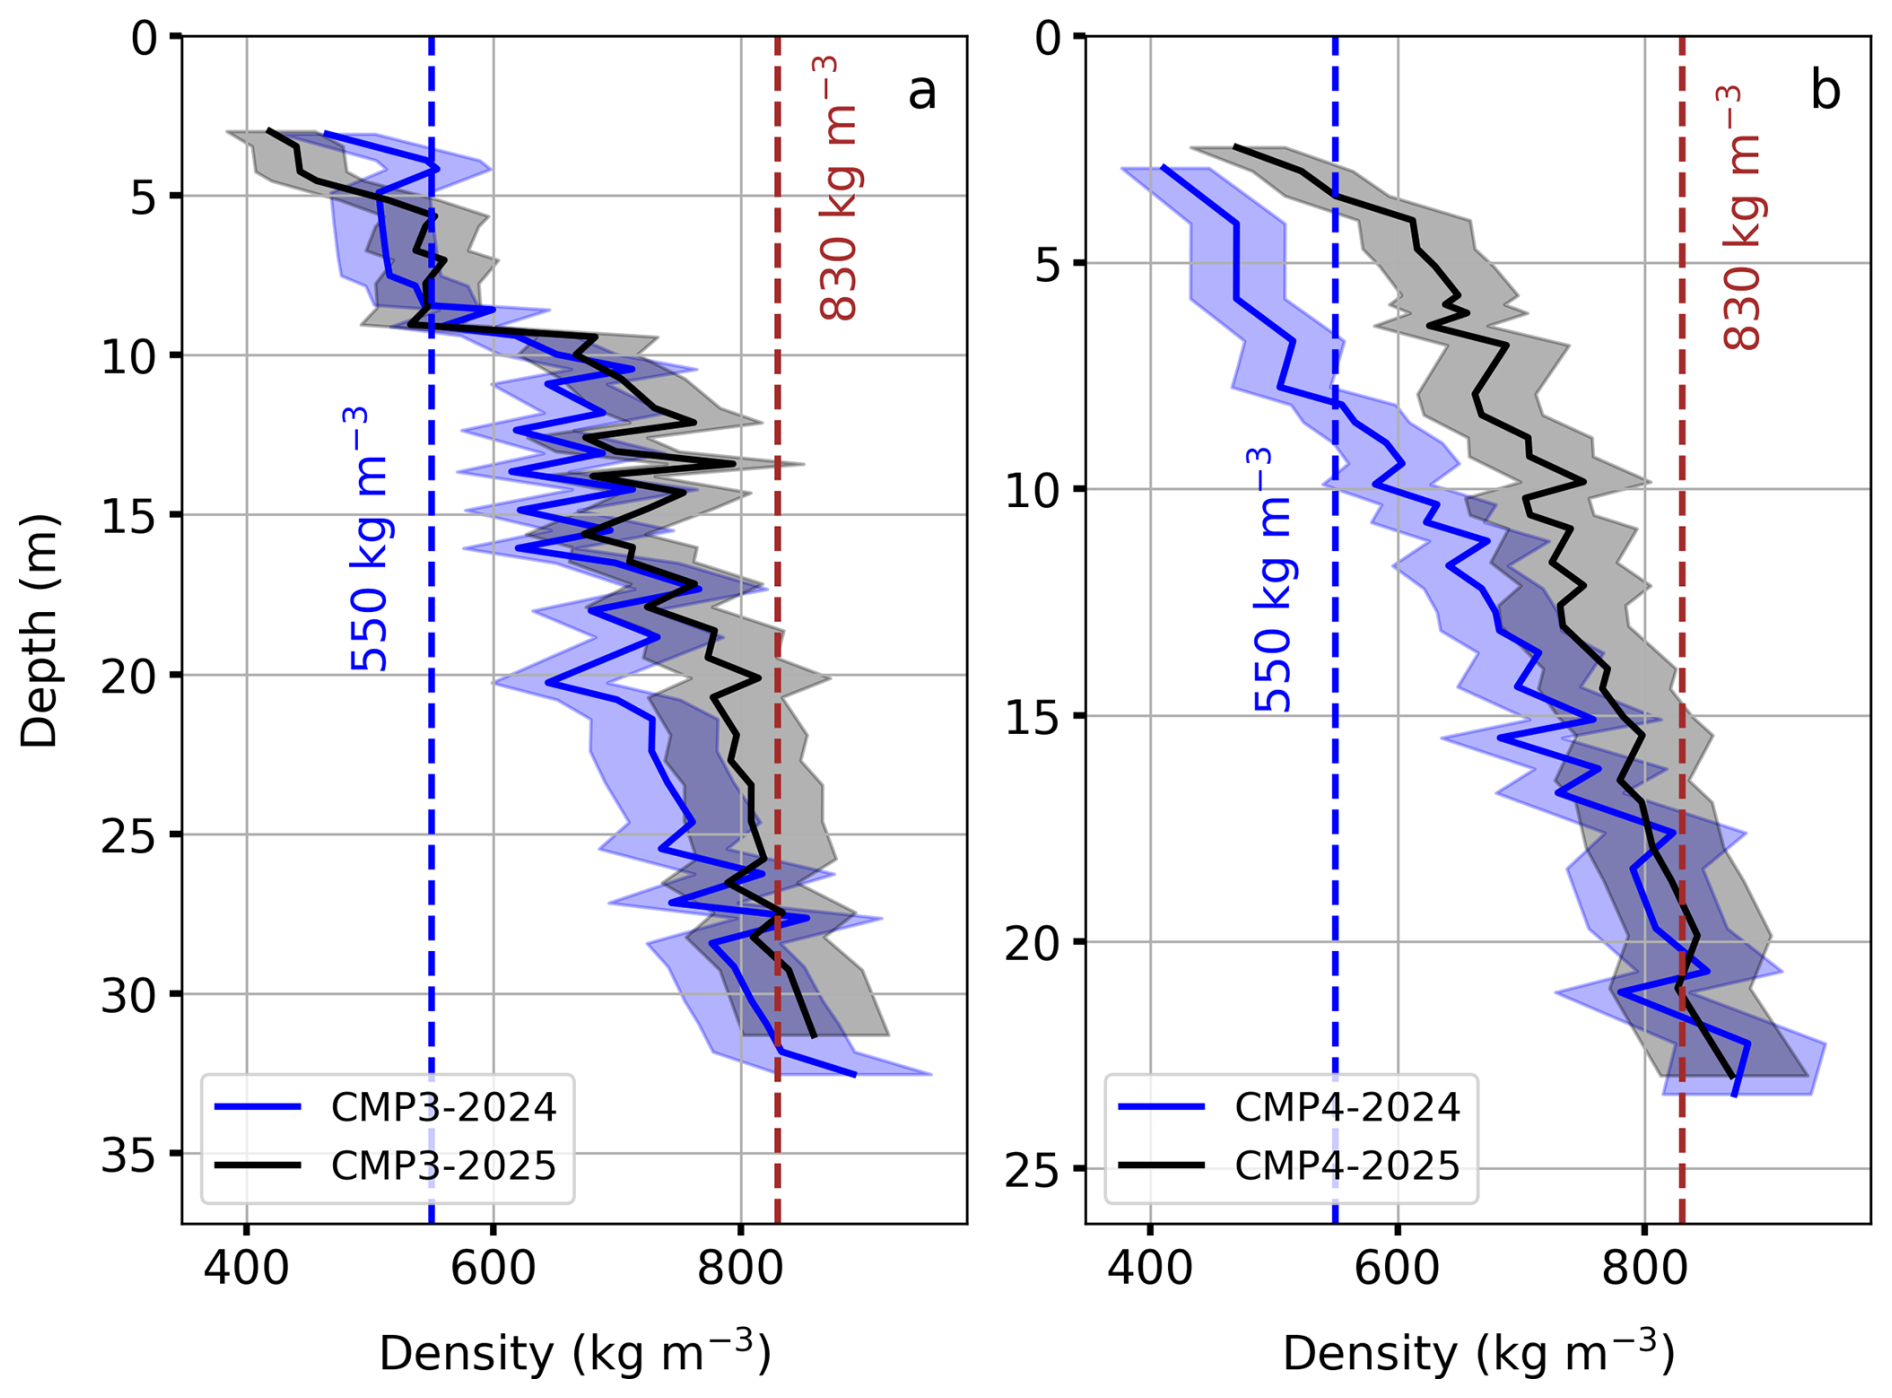
Figure 9Comparison of the CMP-derived firn density-depth profiles obtained at the upper part of Ewigschneefeld CMP3 (a) and near the stake CMP4 (b) during the 2024 and 2025 winters. The colours refer to 2024 (blue) and 2025 (black) measurements. The blue and brown dotted vertical lines indicate the depths at which firn and pore close-off density are reached, respectively. The firn density-depth profiles are plotted along with the uncertainty in Vrms picking (0.005 m ns−1) from Semblance analysis as a corresponding coloured shaded area.
The comparison of temporal changes in CMP-estimated firn density at the CMP3 location (Fig. 1) shows an increase in firn density with depth, with some fluctuations along the profiles occurring at similar depths. It is observable that the firn density profile from 2025 (black line in Fig. 9a) shifted towards higher values compared with the 2024 CMP measurements. The depth to the firn density (550 kg m−3) is around 7 m in 2025 and 8 m in 2024, and the pore close-off density (830 kg m−3) is reached at approximately 27 m in the 2025 and 2024 measurements. Similarly, increased firn density with depth is seen in Fig. 9b, estimated from CMP4 measurements near the Stake (Fig. 1), which is located at a lower elevation than the CMP3 measurements. Comparison of firn density-depth profiles shows a distinct, higher density shift in 2025. The depth to firn density is at around 3.5 m in 2025 and 8 m in 2024, whereas the pore close-off density is observed at approximately 19 m in both years.
Figure 10 represents the temporal changes within the identified annual firn layers using repeated 2024 and 2025 CMP measurements at two locations of the accumulation area of the Grosser Aletschgletscher. As explained in the method section (Sect. 4.3), we identified 10 and 11 annual layers from more than 30 IRHs at CMP3 (Fig. 10a) and CMP4 (Fig. 10b) measurements. At the CMP3 locations, firn density within the annual layers is higher than in the 2024 measurements. The 2025 winter accumulation shows a lower snow density (430 kg m−3) than the 2024 winter accumulation, which is close to 500 kg m−3 (orange line in Fig. 10a). We estimated an increase in density offset across all identified layers from 2024 to 2025, with the change more pronounced in layers 3 and 4 (years 2022 and 2021). The results indicate that the effect of densification is low in deeper or older layers (layers 9 and 10 correspond to 2016 and 2015, respectively), and the estimated density within the identified oldest layer (2015) is approximately 750 kg m−3. The identifiable 2022 firn layer at the CMP3 location densified from 540 kg m−3 in 2024 to 610 kg m−3 in 2025.
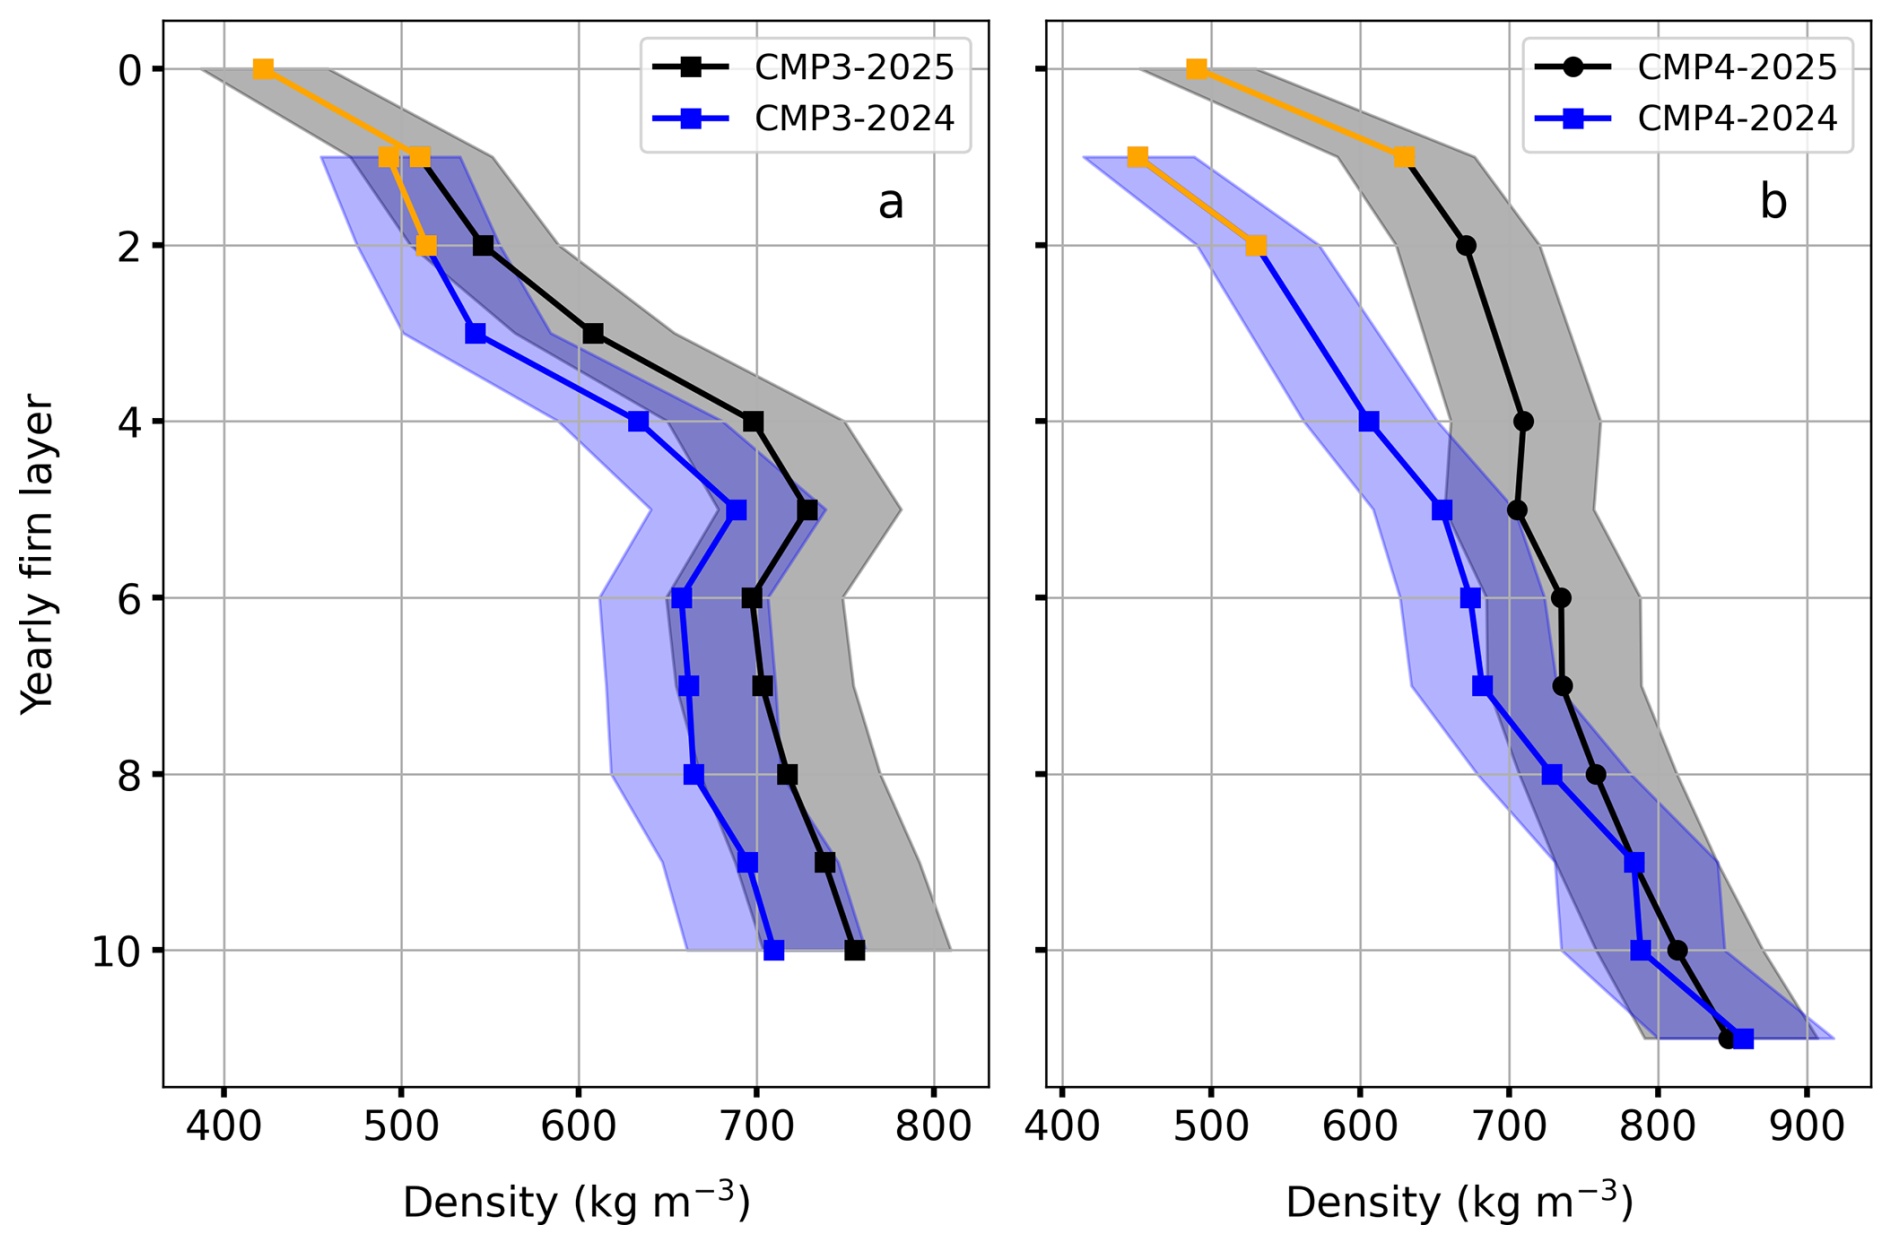
Figure 10Illustration of the temporal density change in annual layers at the upper part of Ewigschneefeld from CMP3 measurements (a) and identified from CMP4 measurements near the stake (b). Blue lines in both plots (a) and (b) depict the density in 2024, whereas the black lines show the density from the 2025 winter measurements. The corresponding coloured shaded area represents the uncertainty in density estimation due to the changes in Vrms picking (0.005 m ns−1) from the Semblance analysis. The orange line in both plots represents the winter accumulation density (from the surface to the last summer horizon) for measurement years. The y axis depicts the number of firn layers in descending order, with reference to the 2025-winter surface as zero and the deepest layer 11 as 2014.
Similarly, the CMP4 results show pronounced firn densification in the near-surface annual layers (2023 and 2021), with complete ablation of layer 3 (2022) at this location. The maximum densification is around 140 and 100 kg m−3 yr−1 in the 2023 and 2021 firn layers between 2024 and 2025. The estimated density change (offset) within older layers (2017 to 2014) is small. The density difference between the winter 2024 and 2025 accumulation (orange line in Fig. 10b) is not as significant as recorded at the CMP3 location (near 40 kg m−3). The identified oldest layer (2014) has a density near the pore close-off density (830 kg m−3) in the 2024 and 2025 measurements. Whereas the 2024 winter-accumulated snow densifies further, from 450 to 620 kg m−3 in 2025. Figure A6 also depicts a form of visualisation of the temporal changes in firn density within identified annual layers at two locations.
5.6 CMP-derived firn compaction rate
The CMP-derived compaction rate of commonly identified annual layers at both CMP3 and CMP4 locations is shown in Fig. 11a, and the corresponding temporal change in firn density is depicted in Fig. 11b. We estimated that commonly identified annual layers, particularly those near the surface (younger layers), were compacted by nearly 0.3 m yr−1 at the CMP4 location (red line) at 7–8 m depth during 2023 (Fig. 12). In contrast, the compaction rate of the same layers at the CMP3 location was approximately 0.2 m yr−1 at the same depth (7–8 m) in 2023 (Fig. 12). The compaction rate of the deepest layers at the CMP3 and CMP4 locations is nearly zero. The estimated bulk compaction from the reference surface (layer 0 as 2023) to the common firn layer (layer 8 as 2015) at CMP3 is 0.5 m, and at the CMP4 location is 1.18 m between the 2024 and 2025 measurement periods. The mean compaction rate of commonly identified annual layers from 0–8 (2023 to 2015) at the CMP4 location is approximately −0.14 m yr−1, whereas at the CMP3 location it is approximately −0.06 m yr−1. It is noticeable that the higher compaction of younger layers and lower compaction of older (deeper) layers correlate well with the observed change in firn layer density over a year (Fig. 11b).
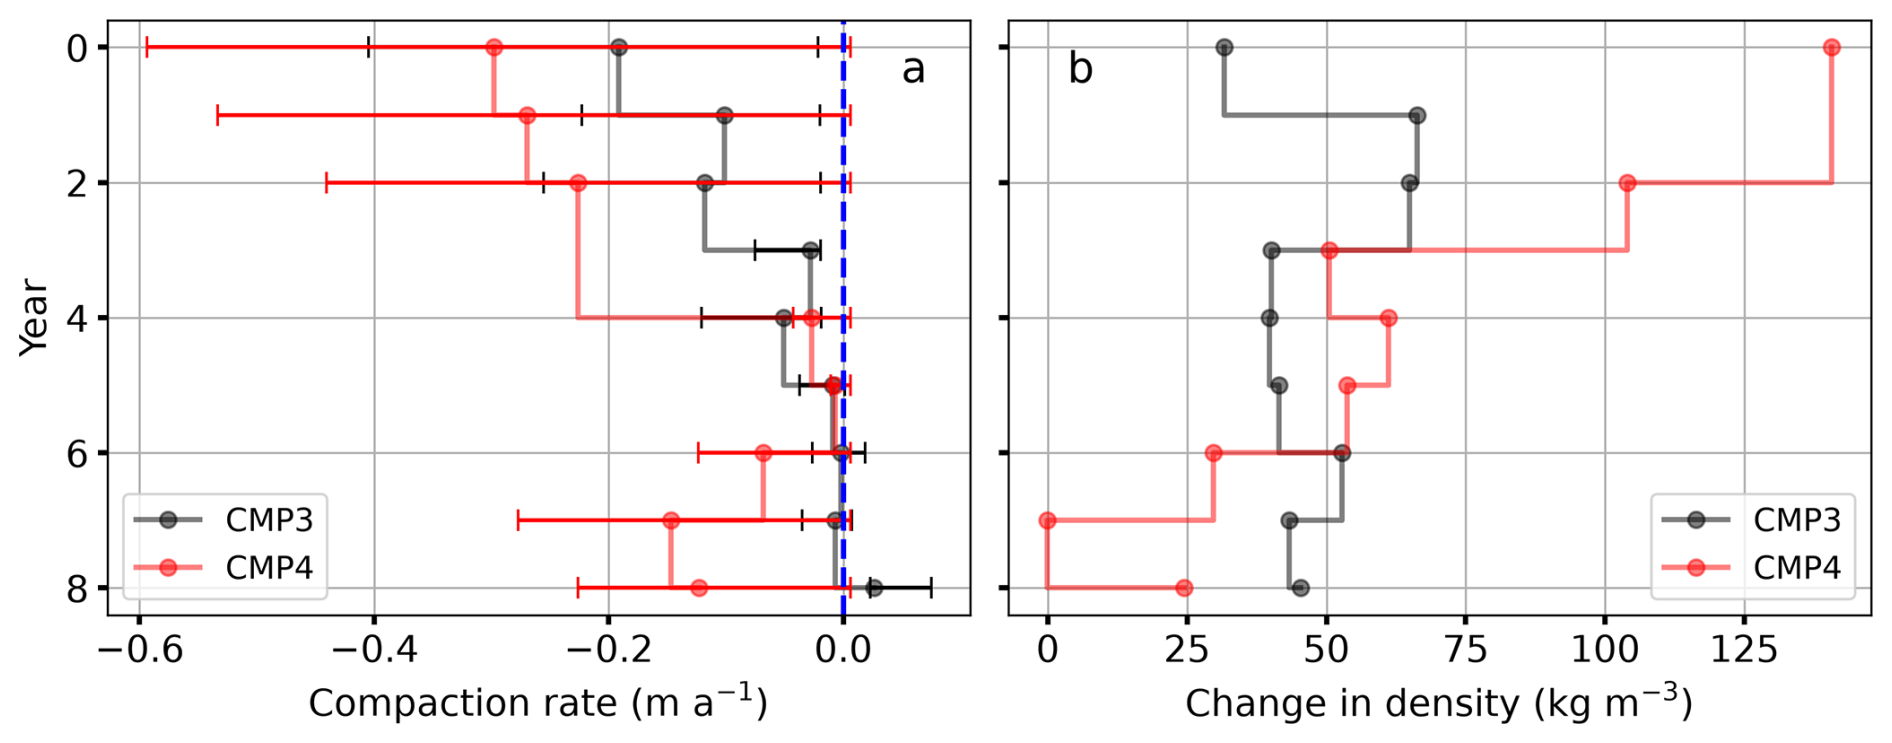
Figure 11Illustration of the compaction rate (a) and change in density-age (b) within annual layers derived at the upper part of the Ewigschneefeld (CMP3, black line) and near the stake (red line) during the 2024 and 2025 expeditions. The vertical dotted blue line indicates zero compaction rates. The compaction rate-year profile (a) is plotted along with the uncertainty in Vrms picking (0.005 m ns−1) from Semblance analysis. The y axis depicts the yearly firn layers with reference layer zero as the year 2023 and the deepest layer 9 as the year 2014.
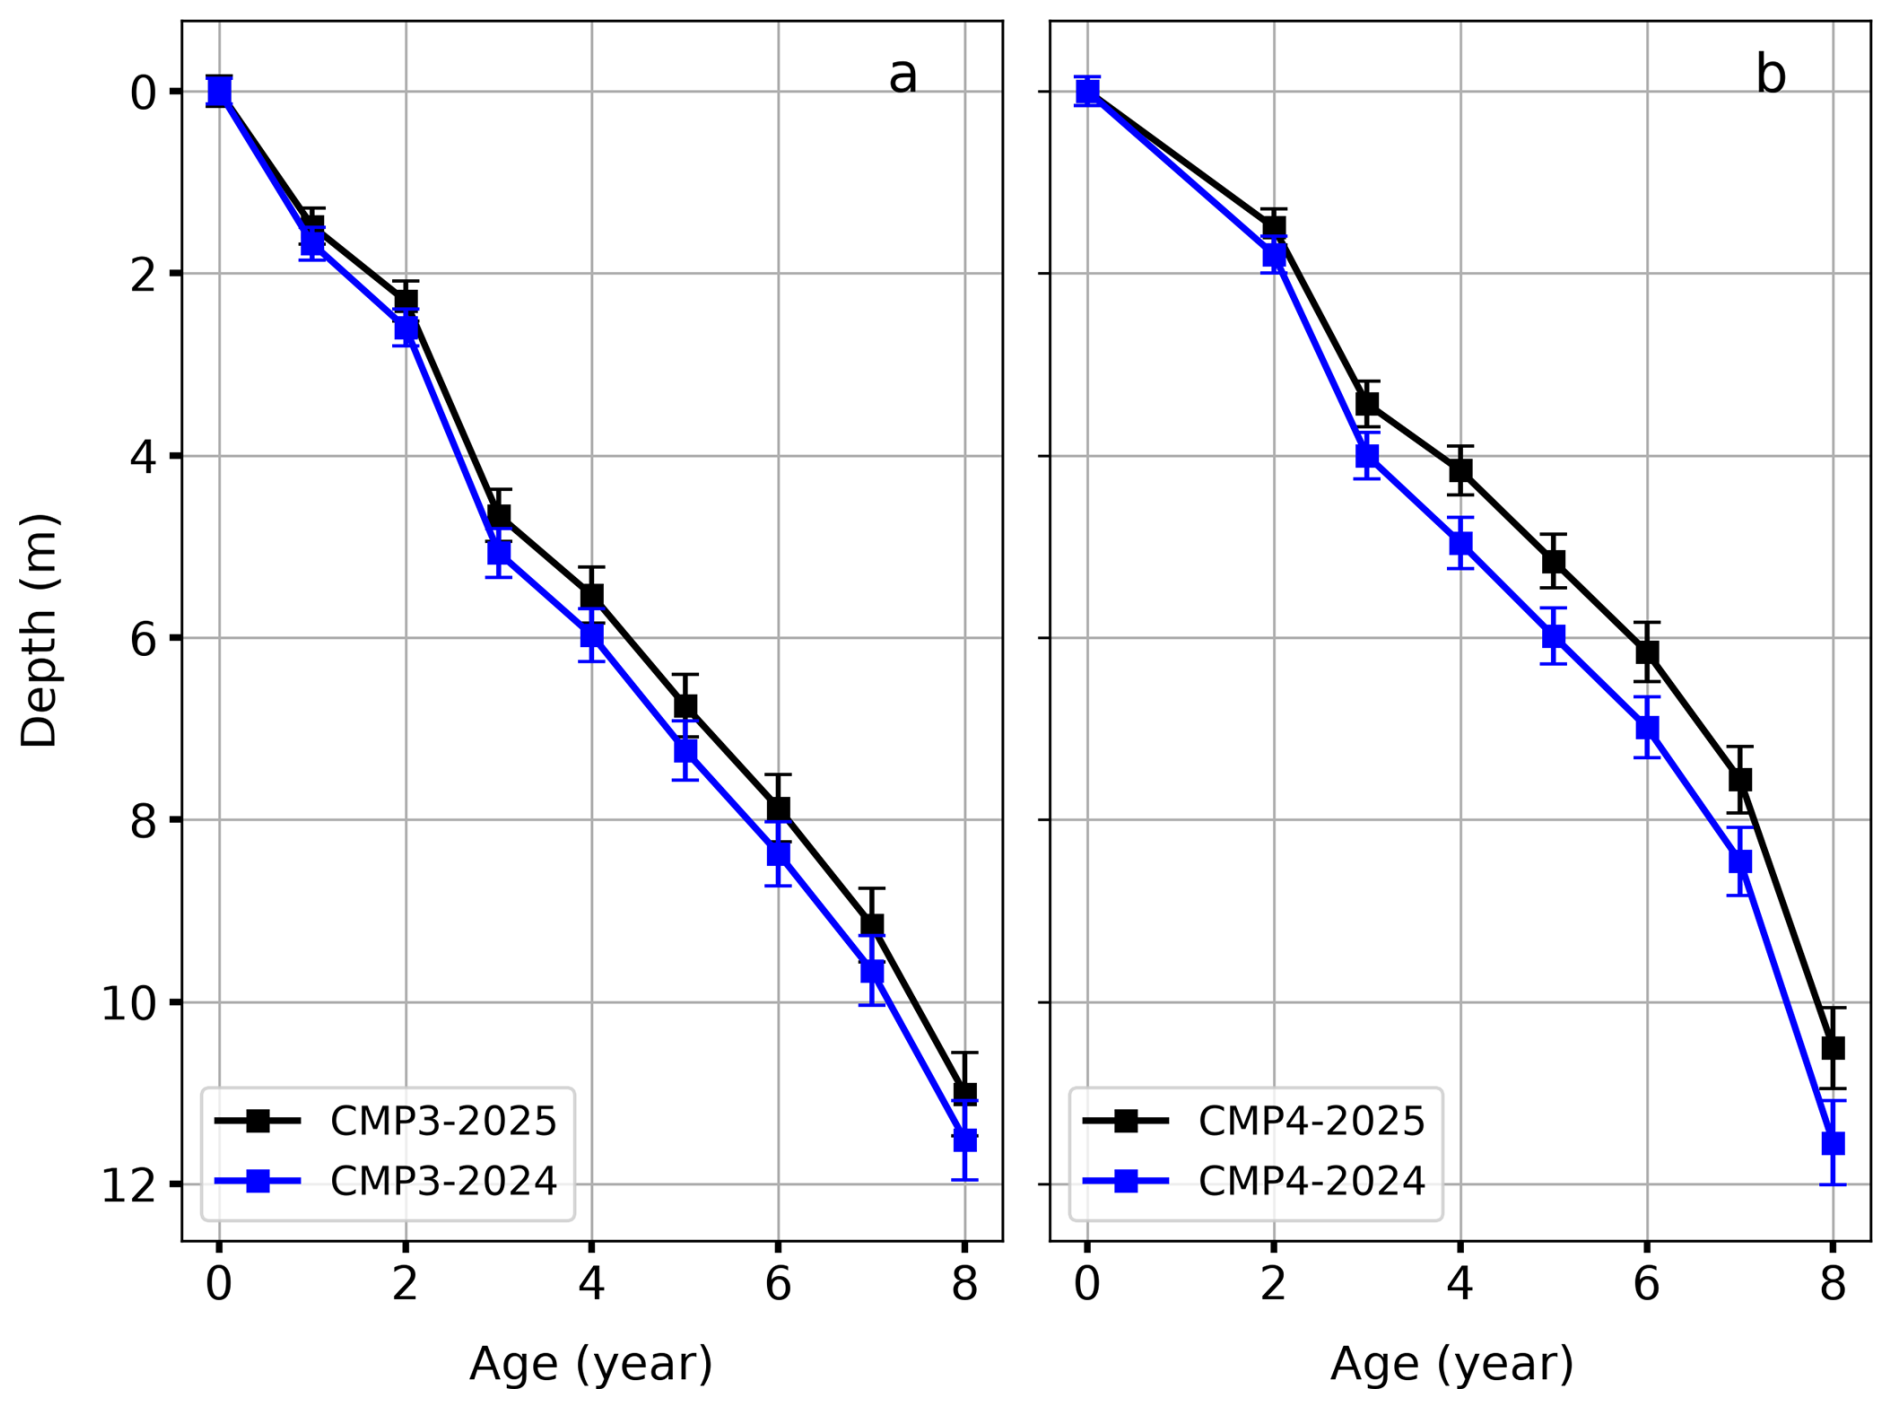
Figure 12The depth-age plot derived from the CMP measurements at the upper part of the Ewigschneefeld CMP3 (a) and near the stake CMP4 (b) in 2024 and 2025. The blue line shows the cumulative depths of all identified common annual layers derived from CMP3 and CMP4 measurements in 2024. The black line depicts the CMP3 and CMP4 measurements in 2025. The x axis depicts the number of annual firn layers in descending order (left to right), with reference to the 2023 annual layer as zero and the deepest layer as 2015. The error bars of the corresponding colours illustrate the Vrms sensitivity (0.005 m ns−1) of depth estimations from the Semblance analysis.
Cumulative depth-age Fig. 12a and b illustrate the depth of commonly identified annual layers from the referenced layer (2023 as layer 0) to the last identified layer 8 (2015) in both measurement years at CMP4 and CMP3 locations. At the CMP3 location, the cumulative depth of 9 identified annual layers is approximately 11.52 m in 2024, compacted to 11 m in 2025. The compaction is most pronounced in the near-surface layers (Fig. 11a), as reflected by the close spacing of layers 0–3 compared to the deeper layers (4–8), which are nearly parallel. At the CMP4 location, the total thickness of the 8 identified annual layers is around 13.4 m in the 2024 measurements and 12.2 m in the 2025 measurements. Similar to the CMP3 location, the effect of compaction is pronounced in near-surface layers (0–4). As mentioned previously, the 2022 extreme summer melt completely ablated layer 1 at the CMP4 location, which is identifiable at the CMP3 location, resulting in a thicker firn body of around 8 m up to layer 6 in 2025 compared to 6 m at the CMP4 location. The overall bulk thickness from 0–9 layers at the CMP4 location is almost similar to that of the CMP3 location, which we attribute to the uncertainty (Figs. A5 and 6) in annual layer dating using the firn core (FC3, method section “Annual layer dating using firn core”) as discussed in Sect. 6.5.
6.1 Stratigraphy from firn cores
Direct observations at three accumulation-area sites reveal both common firn features and site-specific stratigraphy. The deep (FC3) and shallow (FC2) cores from the upper and lower Ewigschneefeld (Fig. 1) display similar density–depth profiles with increasing density with depth. Surface snow density is slightly lower at FC3 (3450 m a.s.l.) than at FC2 (3360 m a.s.l.), which we attribute to the temperature lapse rate, resulting in denser snow at lower elevation. This is supported by the SP4 (3340 m a.s.l.) profile, which shows a higher surface density of 80 kg m−3 (Fig. 5) than FC3, consistent with the other observations. Temperature records indicate mean summer temperatures of about 2.3 and 3.2 °C in July and August 2024 at 3570 m a.s.l. (MeteoSchweiz, 2025), implying enhanced melt at lower elevations (FC2 and SP4 in Fig. 1). We further hypothesise that wind-driven snow and spatial variability in accumulation (Fig. A4) contribute to higher surface densities at lower elevations (FC2 and SP4), but quantifying this is beyond the scope of this study. Our results indicate that the depth to the last summer horizon is about 3.5 m, based on FC3 and FC2, supported by visible ice lenses and a local density increase from 420 to 550 kg m−3 at FC2. In contrast, we did not detect distinct ice lenses at 3–4 m depth in FC3, which we attribute to reduced surface melt at higher elevations (> 3440 m a.s.l.) that would otherwise form such lenses. Overall, the data indicate a well-defined summer layer beneath the winter snow in 2025 (Fig. 6b and c). We interpret the ice lenses as evidence of melt–refreeze events, which reflect temperature variations during their formation.
The isotope results show clear variation at shallower depths (< 4 m), indicating changes in winter precipitation. The δ18O range of −24 ‰ to −12 ‰ matches expected values for this altitude (Schotterer et al., 2004), implying that both winter and summer accumulation are preserved in the upper 0–4 m. Below 4 m, the strongly smoothed signal with little seasonal contrast suggests the effect of the 2024 summer surface melt. Attenuation of δ18O between 8 and 14 m, together with numerous ice lenses, likely reflects extreme melt in summer 2022, which diluted isotopic signals and marks the refreezing depth of that melt (Fig. 6b). Schotterer et al. (2004) demonstrated that ice cores from the Swiss Alps, including those from the Jungfraujoch Saddle (1987), illustrate how wind and surface melt smooth δ18O. Likewise, a sharp electrical conductivity peak (∼ 80 µS cm−1 at ∼ 3.5 m; Fig. 6c) provides independent validation for identifying the position of the last summer horizon, complementing the other results (Fig. 6b, c). We attribute the smoother conductivity signal below 4 m to signal loss due to surface meltwater washout and runoff of soluble ions. The increase in conductivity between 8 and 15 m likely records melt-driven impurity concentration during the extreme 2022 summer (Fig. 6c).
The analysed chemical impurities (Na, Ca, Ti, and Fe; Fig. 6) in the firn core reflect atmospheric pollution history from anthropogenic and natural sources (e.g., Schwikowski et al., 1999; Clifford et al., 2019; Eichler et al., 2023). Surface melt can significantly disturb these records by altering signal preservation (e.g., Avak et al., 2018; Huber et al., 2024), as shown by the loss of signal strength with depth (Fig. 6). Annual layer dating at CMP3 is based on Fe concentration spikes, supported by Ti and visible Sahara dust layers (Fig. 6g), because Ti and Fe are less affected by meltwater infiltration and are better preserved. In contrast, Na and Ca are more soluble and diluted by meltwater percolation (Avak et al., 2018, https://doi.org/10.1029/2019JF005026). Figure 7 compares FC2 2025 and 2024 and shows temporal changes in firn density. Winter 2024 had intense snowfall of about 3000 mm w.e., while winter 2025 had about 1900 mm w.e. (GLAMOS, 2025), indicating changes in seasonal accumulation. This is further evident in our two firn core results, indicating varying fresh-snow density and depth to the last summer surface (3.25–3.5 m, 1700 mm w.e. in 2025, vs. 5 m in 2024), which we attribute to differences in winter accumulation. Surface-melt ice lenses formed in summer 2024 appear in the FC2 2025 core below 3 m, raising density to nearly 600 kg m−3 at 4 m depth; the same density occurred at 6.5 m in 2024. We interpret the cluster of ice lenses at 6.25–6.5 m in 2024 as the same feature observed at 6.8–7.1 m in 2025 (Fig. 7). This 0.3–0.75 m downward shift over 1 year suggests additional 2025 winter accumulation. Because FC2-2025 was drilled on 30 March 2025 and winter 2024 accumulation was high, the precise position of the 2023 annual layer is uncertain. We tentatively assign the ice lenses near 7 m depth to the 2023 layer (Fig. 7), assuming 3–4 m of 2025 winter accumulation (about 2000 mm w.e.) and a ∼ 3.5 m thick 2024 firn layer.
6.2 Radar-derived density profiles and spatial firn stratigraphy
The GPR-based CMP measurements provide an indirect firn density–depth profile, which we compared with densities from direct observations, FC3 (Fig. 1), near CMP3 (Fig. 8b). Both profiles show similar structures, with sharp density increases at comparable depths (∼ 5, 12, 14, 16, and 17 m in Fig. 8b), indicating ice lenses at these depths (Fig. 5). Both observations show good agreement in the upper part, supporting the use of CMP measurements for density estimation. All three CMP results also reveal firn thickness in the accumulation area of the Grosser Aletschgletscher, highest at the Ewigschneefeld (CMP3) and lowest at the Jungfraufirn (CMP4 near the Stake in Fig. 1). Earlier studies Oeschger et al. (1977) and Lang (1981) reported similar firn thickness, with a firn–ice transition depth of 32 m at the Grosser Aletschgletscher.
Radar wave penetration depth varies across the glacier (∼ 32 m at CMP3, ∼ 28 m at CMP2, and ∼ 23 m at CMP4 in Fig. 8), which we attribute to attenuation caused by increasing firn density with depth, altering the dielectric property of the medium (Davis and Annan, 1989). The estimated depths to firn and pore close-off density at all CMP locations indicate spatial variation in firn densification, mainly driven by melt and refreezing, which enhance densification at CMP4 relative to the other two CMP locations. We interpret these melt–refreezing processes as elevation-dependent and minimal at CMP3.
In the GPR transect, we interpret the first strong reflector as the 2025 winter accumulation depth (Fig. 4a). Snow layer thickness decreases from ∼ 30 to ∼ 20 ns over the first 2000 m, then thins from ∼ 20 to 15 ns between ∼ 2000 and 4400 m, indicating spatially variable winter accumulation. From ∼ 3500 m onward (Fig. 4a), IRHs below the 2025 winter layer vanish, marking the transition to the ablation area and the approximate ELA, consistent with GLAMOS (2025). We compared the upper 2.2 km of this profile (Fig. 4b) with a 1.8 km profile from 29 February 2024 (Fig. 4c). In the lower part (distance > 1200 m), strong compaction of the full winter accumulation (3000 mm w.e., thickness > 6 m) and melt–refreeze processes dominate. Accordingly, in both radargrams, near-surface IRHs (Fig. 4b, c) and all identified IRHs (Fig. 4a) thin with increasing distance and decreasing elevation, consistent with melt-driven ablation controlled by lapse rate and variable accumulation.
A strong reflector is visible at the deepest part of the radargrams (Fig. 4a and b) across the accumulation area (0–2400 m). In the 2024 GPR transect, this reflector was interpreted as an annual layer (Fig. 4c) by Patil et al. (2025b), but the 2025 radargrams show that its geometry is uneven and becomes increasingly distorted toward the saddle. This behaviour is consistent with enhanced scattering and stratigraphic disturbance. We hypothesise that the observed variation in stratigraphy and the prominent reflector may result from crevasses and strong accumulation gradients near the ridge separating Ewigschneefeld from Mönchsjoch (Fig.1). Similar undulated reflectors have been reported in Bannwart et al. (2024) for the same region. We need further research and additional field observations to support our hypothesis.
6.3 Radar-derived temporal changes in firn density
Studies such as Sold et al. (2015) suggest that melt and refreezing can produce high-density layers, or ice lenses, that can be misinterpreted as annual layers. Therefore, not all IRHs necessarily represent annual layers, which is also clear from the comparison of density-depth profiles between the firn core (FC3) and CMP3 (Fig. 8b). The method explained in Sect. 4.3, which is introduced in Patil et al. (2025b), was used to identify IRHs as annual layers (Fig. A2a). Figure A2a demonstrate the annual layer identification by chronologically comparing CMP-derived SWE with point mass balance estimations (Sect. 4.3), whereas Fig. A2b shows the layer dating using CMP3-estimated SWE and FC3 (section “Annual layer dating using firn core”). Thus, the identified annual layers from multi-year CMP measurements at two locations (CMP3 and CMP4 in Fig. 1) are shown in Fig. 10, illustrating temporal changes in firn density within these layers. It is noticeable that the firn density has increased over the year at both CMP locations. The density-depth profiles at CMP3 show that the vertical structure of the density variations is preserved, while the absolute values increase. The changes we observe therefore reflect differences in the magnitude of densification within individual annual layers rather than variations in the densification pattern itself. We attribute these layer-specific density increases primarily to compaction of accumulated snow, as surface melt is generally negligible at this site. The change in density within identified annual layers over the year increases and is highest (∼ 70 kg m−3) in layers 3 and 4 (2022 and 2021) and is relatively low within older layers (∼ 40 kg m−3 in 6–10 layers). The year-to-year density change of layer 5 remains minimal (∼ 30 kg m−3), despite the absolute density in layer 5 being higher. We attribute the higher absolute density to lower seasonal accumulation, summer melt and refreezing (year 2020 in Fig. A1). Several studies have shown that the firn layers with initial lower density densify faster than the firn layers with initial higher density (e.g., Gerland et al., 1999; Fujita et al., 2014). This aligns with our results from the CMP3 location, where shallower layers (3–4) densify faster than older layers (7–10) in measurements from 2024 to 2025. This suggests that processes such as pressure sintering dominate densification in denser layers with densities above 550 kg m−3 (Maeno and Ebinuma, 1983; van den Broeke et al., 2008).
According to Sorge's law, the density of snow does not change with time at a given depth below the surface, provided no melting occurs in summer (Bader, 1954). This is not valid at the CMP3 location. Although repeated CMP-derived density profiles show similar density fluctuations in the upper firn column, they show significant density offset below the 20 m depth. This difference in density profiles reflects the influence of variable seasonal accumulation, summer melt (Fig. A1), and ice-lens formation (Fig. 5), all of which disrupt the steady-state conditions required for validation of Sorge's law. Furthermore, we also observe the depth to firn density at around 7–8 m and pore close-off density at around 25–26 m in 2024 and 2025. A similar study by Stevens et al. (2024), but using direct observations (firn cores), addresses firn density evolution over a temporal scale (2016–2022) at Wolverine Glacier, Alaska, and demonstrates the importance of firn properties for glacier mass-balance estimates. The study illustrates that firn densification accelerated due to increased melt and refreezing, leading to reduction in pore space and enhanced firn compaction. The study also demonstrates that the substantial variability in firn and snow air content over 5 years has direct implications for geodetic mass-balance calculations. This further suggests the importance of investigations of mountain glacier firn to improve glacier hydrology and reduce uncertainties in geodetic mass-balance calculations (Stevens et al., 2024). Here, we show that temporal firn variations can be detected and quantified with CMP methods, which is important for characterising the climatic impact on the firn body. Our CMP surveys resolve density–depth structure and IRH displacement across multiple locations, enabling spatially distributed estimates of firn evolution that complement the point-scale precision of firn cores. Although firn-core data remain necessary, CMP offers a faster approach with greater penetration depth than traditional, time and labour-intensive firn core methods.
The changes in firn density at the CMP4 location (Fig. 1) are mainly driven by summer surface melt and refreezing in addition to compaction, because it is located at a lower elevation than CMP3 (Table 1). The CMP-derived density profile indicates the higher densification at CMP4 (750 kg m−3 between 0 and 10 m depth) compared to CMP3 (600 kg m−3 between 0 and 10 m depth). This is further supported by the SP4 density profile depicting higher surface density. Absence of melt layers between 0 and 8 m depth from FC3 also indicates spatial variability in melt and refreezing processes between CMP3 and CMP4. These melt-related processes explain significantly higher densification rates, i.e., layer 2 densified from 520 to 680 kg m−3 and layer 4 from 600 to 700 kg m−3 (Fig. 10). Studies such as Colbeck (1978) and Kawashima and Yamada (1997) demonstrate firn density as a power-law dependency on time while the densification rate increases exponentially with pressure, which we also attribute to our results at this location. Further, a shift in depth to firn density over a year at the CMP4 location (Fig. 9b), which is approximately 7.5 m in 2024 and 3.5 m in 2025, indicates that the firn is densifying faster at shallower depths. This is explained by additional compaction between two measurement periods (Table 1), predominantly due to intense 2024-winter accumulation, the refreezing of surface melt in 2024-summer, and an additional accumulation layer in 2025-winter. However, this is not the case at the CMP3 location (Fig. 9a), where surface melt is likely much lower, and percolation plays a minor role; thus, densification is significantly lower in layer 2 (520–550 kg m−3). This implies that the firn densifies faster at low-lying locations compared to firn located at higher elevations, demonstrating different climate settings at the two locations of the glacier accumulation area.
Our secondary results on the spatial changes in firn density (Fig. A3) and accumulation (Fig. A4) were estimated by interpolating density gradient and estimating the SWE (Sect. 4.4) between two CMP gathers at the upper and lower parts of the Ewigschneefeld (Fig. 1) using picked IRHs from the long GPR transect acquired in 2025 (Fig. 4b). Similar to the 2024 results presented in Patil et al. (2025b), our new results show that spatial firn density increases with increasing radar profile distance and decreasing elevation. This further illustrates that the same firn layers at lower elevations are denser than those at higher elevations, whereas the thickness of annual layers reflects differences in spatial accumulation variation.
6.4 Firn compaction rate and role of extreme summers
Our attempt to estimate the compaction rate in an Alpine glacier using CMP measurements will contribute new information to this poorly resolved issue. Figure 11a and b illustrate the estimated compaction rate and the corresponding change in density at two locations in the Grosser Aletschgletscher accumulation area, respectively. The change in density at the CMP4 location is higher in the near-surface annual layers 0 and 1, which represent 2023 and 2021, with the 2022 layer melted away. This results in higher compaction (0.3 m yr−1) compared to older layers, likely due to reduced firn air content (Pfeffer and Humphrey, 1996) caused by overburden stress from the 2025 winter accumulation, summer melt (Fig. A1), and refreezing of the record-high 2024 accumulation (∼ 3000 mm w.e. as in Fig.A1). The recorded point mass balance measurement near the CMP4 location indicates an annual mass balance (year 2024) at the end of the summer seasonal measurement is around 2000 mm w.e. Additionally, the meteorological data suggest that the mean surface temperature at 3570 m a.s.l. in 2024 July and August months was around 2.3 and 3.2 °C and in 2023 was around 1.4 and 1.0 °C (MeteoSchweiz, 2025), therefore, we expect a more pronounced surface melt at 3340 m a.s.l. near the CMP4 location. Assuming partial meltwater percolated down and refroze at a certain depth within the 2024 winter accumulated snow, and compacting it further, which increases the density from 450 to 620 kg m−3 (Fig. 10b). The process of refreezing in the 2024 summer and the accumulation of 2025 winter snow further compacted the 2023 layer from 530 to 680 kg m−3 and the 2021 layer from 600 to 700 kg m−3. This change in density corresponds to compaction rates of 0.3 and 0.26 m yr−1 in the 2023 and 2021 layers, which we interpret as reasonable estimates. Compaction in the deeper layers is primarily driven by overburden stress from the denser 2023 and 2021 firn layers, yielding minimal compaction rates. This implies that the compaction rate decreases gradually with age; we estimated almost zero compaction within deeper layers (layers 4–6 in Fig. 11a), which are already denser than near-surface layers and require more time to compact further. Thus, we highlight the importance of surface meltwater percolation in resolving compaction rates within the firn pack. The same is highlighted by Stevens et al. (2024), suggesting the importance of considering the effect of meltwater percolation on compaction rate to improve firn modelling in mountain glaciers.
However, at the upper part of the Ewigschneefeld, where summer melt is relatively low, we expect minimal refreezing of the 2024 surface melt without producing ice lenses, which is also evident from our firn core results (no ice lenses, FC3 in Fig. 5). This is observed from the density change (30 kg m−3) in the near surface annual layer 0, represents 2023 (Figs. 10a and 11b) as well as the compaction rate of around 0.19 m yr−1 (Fig. 10a), which we ascribe to the overburden stress from accumulated snow. The presence of the firn layer 1 (2022 in Fig. 11) at this elevation experienced an increased change in density (nearly 70 kg m−3) with an estimated compaction rate of 0.2 m yr−1, predominantly due to a ∼ 9 m thick accumulation on top of this layer. We attribute the increase in change in density within layer 1 (2022) to the fact that firn density increases with pressure (Kawashima and Yamada, 1997). Even though the change in density is decreasing in layers 2, 3, 4, and 5, whereas the compaction rate in certain layers (3 and 4) is increasing, this is inconsistent with our results from the CMP4 location. This discrepancy likely arises from uncertainty in picking denser but relatively thin layers (2020, 2019, and 2018 in Fig. A1). We discuss these uncertainties in the subsequent section.
Medley et al. (2015) illustrate that firn compaction rates are primarily driven by climate and expected to vary spatially with surface climate conditions. Similarly, the study by Kruetzmann et al. (2011) emphasises region-specific compaction rates that depend on mean annual temperature, lower latitude, higher elevation, and higher annual accumulation. Therefore, direct comparison of Alpine compaction rates with polar studies is not meaningful. However, for the context, Medley et al. (2015) report compaction rate of ∼ 0.33 m yr−1 in West Antarctica, while Kruetzmann et al. (2011) find ∼ 0.05–0.250.19 m yr−1 near Ross Island, Antarctica. Further, we did not consider the effect of strain rate on our compaction rate estimate because finely resolved vertical strain rates within each identified annual layer are unavailable. However, we presented a quantitative estimate of the strain contribution to IRH displacement in the supplement by assuming a vertical strain rate, using available ice velocity data from Millan et al. (2022) and Leinss and Bernhard (2021).
Figure 12 shows the depth-age (depth-firn layers) from the reference year 2023 (layer 0) to the commonly identified annual layers at the CMP3 and CMP4 locations (layer 8, 2015). The observed changes in depth to annual layers in 2024 and 2025 (Fig. 12a) are closely related to the estimated compaction rates at the CMP3 location (Fig. 11a). Annual layers appear closer to each other when compacted more (layers 0–4), and layers with minimum compaction are almost parallel to each other. This observation also holds at the CMP4 location, where the near-surface layers (0–4) are non-parallel and exhibit a higher compaction rate than the older layers (4–8). The comparison of the CMP3 and CMP4 depth-age plots shows that the cumulative depth of 7 layers at the CMP3 location is approximately 8 m, whereas at the CMP4 location, it is 6 m in 2025. This is mainly attributed to the ablation of the 2022 layer at this location. However, the total depth to layer 8 at both locations is nearly the same (11 m), indicating that layers 6–8 are thicker at CMP4 and relatively thinner at CMP3. We expect that the identified similar layer (layer 8) should appear at a greater depth at the CMP3 location than at the CMP4 location, due to better preservation of firn layers where surface melt is relatively less. The presence of the 2022 layer should also result in a higher cumulative thickness for all identified layers at the CMP3 location than at CMP4. We attribute this discrepancy to the uncertainty associated with the layer dating using Fe spikes (Fig. 6g) at the CMP3 location (section “Annual layer dating using firn core”) by comparing the CMP-derived SWE with SWE above the Fe peaks rather than considering the point mass balance observation (Fig. A5). We discuss all uncertainties mentioned in this study in the following section.
6.5 Conservation of mass, uncertainties, and advantages
Identification of CMP-derived IRHs as annual layers by chronologically comparing the CMP4-estimated SWE with point mass balance-derived SWE (Sect. 4.3) and firn core-based Fe peaks as summer horizon, and matching CMP3-derived SWE layers to FC3-estimated SWE (section “Annual layer dating using firn core” and Fig. 6g) requires the assumption of conservation of mass. This means that between 2024 and 2025, no mass loss was observed, implying surface meltwater at the CMP4 location refroze within the same layer. The same is also valid at the CMP3 location, where the surface melt is relatively low. This is supported by the estimated SWE in the respective layers in 2024 and 2025, which match well (R2 > 0.9; Fig. A2) at both locations. The comparison of shallow firn cores from 2024 and 2025 (Fig. 7) indicates that the conservation-of-mass assumption is valid, as identified ice lenses at ∼ 6.25–6.5 m depth in 2024 are still present in 2025 at ∼ 7–7.5 m depth. This indicates that despite the 2024 summer surface melt at the CMP2 location (at a similar elevation to CMP4 in Fig. 1), the meltwater refreezed within the 2024 winter layer, with no evidence of internal accumulation in subsequent layers. Further, ice core results from the Jungfraujoch drilled in 2002 illustrate that the subzero borehole temperatures (−4 and −6 °C) in the upper part of the firn zone, and high annual net accumulation (1–2 m w.e.), suggest the negligible percolation of melt through underlying annual layers (Schotterer and Stichler, 2002). These limited direct observations support our mass-conservation assumption to some extent. However, our measurements do not account for mass conservation during extreme melt seasons, such as the 2022 summer, due to the lack of data during those periods.
Previous studies suggest that refreezing within the seasonal snowpack occurs when preferential flow occurs through vertical piping (Marsh and Woo, 1984; Albert et al., 1999; Evans et al., 2016; Williamson et al., 2020). We hypothesise that higher surface meltwater during extreme summers (e.g., summer 2022) percolates deeper and refreezes within the subsequent firn layer, thereby altering the mass of the deeper layer through internal accumulation. These processes challenge our assumption of mass conservation when meltwater drains from the glacier system. However, tracking meltwater percolation, preferential flow, and refreezing complicates the understanding of firn, even though we can, to some extent, derive this information from deep firn cores and CMP measurements. For this reason, we propose continuous monitoring of the Alpine firn using strain meters (Arthern et al., 2010; MacFerrin et al., 2022), and radar techniques that are implemented to study polar firn, such as Autonomous Phase Sensitive Radar (ApRES), as stated in Nicholls et al. (2015) and Case and Kingslake (2022).
Patil et al. (2025b) exemplifies uncertainties in Vrms picking from Semblance analysis, which increases with depth, and also illustrates challenges in picking IRHs that generate high permittivity contrast, such as ice lenses and visible Sahara dust layers. As explained by Booth et al. (2011), we assigned a sensitivity of 0.005 m ns−1 for the Vrms picking from the semblance analysis, which resulted in a density fluctuation of 60–100 kg m−3. We observe that these uncertainties affect our density-depth profiles (Figs. 9, 10, and 12). As depth increases, the uncertainty in Vrms picking increases, and so does the density estimation. Whereas uncertainty in compaction rate estimation also depends on the quality of the Vrms pick. Figure 11a shows the error bars corresponding to the 0.005 m ns−1 for the Vrms picking, illustrating uncertainty in compaction rate related to the magnitude of the compaction rate. This means layers with a high compaction rate have higher uncertainty than those with a lower compaction rate. Other uncertainty lies with identifying the same IRH across multiple or repeated surveys, and any misidentification can amplify errors in compaction rates and annual layer depth estimates (Medley et al., 2015). The accuracy of picking IRHs from CMP gathers and identifying annual layers can introduce significant uncertainties in temporal changes in firn density and compaction rate, as well as in spatial accumulation estimates.
Furthermore, the thickness of identified layers is less sensitive to the Vrms pick than to the TWT pick. For instance, uncertainty in 1 ns picking changes the neighbouring layer thickness by 10 cm. This uncertainty amplifies when the layers are thin and close to each other, impacting the compaction rate estimations (Fig. 11a). Additionally, this is reflected in the deeper layers, as shown in Fig. 12, where the error bars are more pronounced at greater depth (layers 5–8). Similar uncertainties are discussed in Kruetzmann et al. (2011), suggesting that bias in density measurements alters the TWT-to-depth estimations and emphasises density measurements as a potential source of error when deriving radar-wave velocities from firn-core-derived density estimations. In our study, we assign potential sources of error to radar velocity and TWT picking, which govern the identification of IRHs as annual layers.
Firn-core studies help attain high-accuracy, direct measurements of density, stratigraphy, and melt features, but are spatially sparse, time-intensive, and logistically demanding (Stevens et al., 2024). In contrast, CMP-based GPR surveys yield spatially distributed density–depth profiles and IRH geometries to depths of ∼ 30–40 m (Patil et al., 2025b), depending on the antenna frequency and requirement of vertical resolution. CMP method further allows us to map firn structure and compaction across the accumulation area (Brown et al., 2012; Patil et al., 2025b). Our repeat CMP approach therefore complements firn cores by extending point-scale observations into a continuous framework. Our multi-year CMP observations help quantify temporal changes in firn density and firn compaction rates within the identified annual layers. The application of the CMP method, given its non-invasive, less laborious nature and ease of data collection (Davis and Annan, 1989), is well suited to challenging conditions such as high-mountain glaciers. Whereas Phase-sensitive radar systems (such as ApRES/pRES) provide precise, time-resolved measurements of vertical movement (strain rates) and firn compaction at single sites (Case and Kingslake, 2022), however they require independent density data. We can address density data by applying the CMP method wherever the ApRES data are available, to further improve the temporal and quantitative resolution of the density profile to attain better firn compaction and strain rates. Considering the CMP ability to resolve radar velocity with depth to derive the density profile, we propose that a combination of CMP, firn cores, and ApRES as a complementary set of tools: firn cores offer ground truth and detailed process data, CMP provides radar velocity-based spatial and temporal measurements of density and compaction, and ApRES delivers high-precision temporal changes at key reference locations.
We have presented a novel geophysical approach using multi-year GPR-based CMP measurements to derive temporal changes in firn pack, such as firn density and compaction rate estimations at different parts of the Grosser Aletschgletscher's accumulation area. The winter 2024 and 2025 multi-year CMP data and GPR transects, complemented by direct observations, such as firn cores, offer a unique dataset for firn studies. Our primary results demonstrate how firn properties are affected by processes such as surface melt, refreezing, and temperature lapse rate within the accumulation area of the Grosser Aletschgletscher. The comparison between firn density-depth profiles derived from direct (firn core) and indirect (CMP) observations at the same location correlates well, thus emphasising the suitability of the GPR-based CMP method as a complementary tool for the investigation of temporal changes in firn pack. Our deep firn core-derived profiles of water-stable isotopes, chemical impurities, and visible Sahara dust layers provide independent validation for tracing depth to the last summer horizon and dating annual layers. Analysis of chemical impurities, particularly Fe, helps identify 10 annual layers by comparing the CMP-estimated SWE with the firn core from the upper part of the Ewigschneefeld. Furthermore, by applying a method similar to that introduced in previous studies (Sold et al., 2015; Patil et al., 2025b), we identified 10 annual layers at the Jungfraufirn site. The winter 2024 and 2025 CMP measurements at two locations in the accumulation area differ in elevation, which helps quantify temporal and spatial changes in firn density and compaction rates. Our secondary results, derived from the comparison of GPR transects collected in two winter seasons, offer a better interpretation of firn stratigraphy, providing evidence of a possible new feature at greater depth (> 25 m), which we hypothesise to be an effect of topography-driven glacier dynamics. However, we need further investigation for better interpretation of the reflector. The 4.4 km-long GPR profile helped us trace the spatial extent of the firn body by locating the Equilibrium Line Altitude. We acknowledge the limitations and uncertainties that influence our results, particularly those associated with IRH picking from CMP semblance analysis, which are also addressed in Booth et al. (2011) and Patil et al. (2025b). Our assumption of conservation of mass can be challenged if extreme summer melt drains from the glacier system rather than refreezing within the deeper layers (internal accumulation). Firn processes, such as meltwater percolation and refreezing, complicate the interpretation of indirect (GPR) measurements, even though multi-year CMP measurements offer quantification of temporal changes in firn pack, such as firn density and compaction rate, but lack the detailed understanding of firn processes on a fine scale. We propose continuous monitoring of firn processes in Alpine glaciers through field observations to help calibrate existing firn models and improve glacier mass-balance estimates.
Figure A2a illustrates that CMP helped identify 11 annual firn layers among the more than 30 IRHs observed in the CMP2 radargram collected at the lower part of Ewigschneefeld. Similarly, 10 annual layers from the CMP4 (near the stake in Fig. 1) were obtained using the method described in Sect. 4.3. Whereas Fig. A2b shows the identified 10 annual layers from the CMP3 measurement (upper part of Ewigschneefeld) are identified using Fe peaks from firn core chemical analysis (section “Annual layer dating using firn core”). The total winter accumulation in 2025 (until the end of March) is estimated from point mass-balance measurements to be 1800 mm w.e., as shown by the blue vertical bar; the grey bars represent the annual accumulation for each year. The seasonal and annual mass-balance measurements from long-term point measurements (Stake in Fig. 1) are demonstrated in Fig. A1. It is noticeable that the extreme 2022 summer removed the entire winter accumulation and part of the 2021 firn layer (nearly 1000 mm w.e. shown as a cyan bar and CMP4) near the point mass-balance measurement site. However, this is not the case at the upper part of Ewigschneefeld (CMP3, Fig. A2b), which is evident from the radargram obtained from the GPR transect (Fig. 4) and shows that using CMP-derived density estimates, approximately 600 mm w.e. of the 2022 firn layer remained there. All CMP-derived SWE compared with the estimated SWE from the point mass-balance (grey bars) agree well with R2 values, which are well above 0.9.
The spatial firn density and accumulation distribution can be estimated by tracing the annual layers on the radargram obtained from the GPR transect (Fig. 4b). Figure A3 demonstrates the firn density distribution between the upper CMP3 or FC3 (left) and lower CMP2 (right) gathered in winter 2025 at the Ewigschneefeld (Figs. 1 and 4b). It is observed that the winter 2025 layer has negligible variability in accumulated snow density, approximately 500 kg m−3, at the two locations, which the low winter temperatures can explain during and after deposition. The annual layers below exhibit distinct density variations with increasing distance (left to right in Fig. A3). There exists a difference in density between the upper and lower ends of the profile, and we assume that density (linear) increases within each firn layer with distance. This illustrates that as the elevation decreases, firn density increases. The lower firn layers (2017 to 2015) show an increase in density from 700 to 750 kg m−3 and from 750 to 800 kg m−3 between the two CMP gathers. Further, the maximum density of around 760 kg m−3 is seen in 2016 and 2015 layers at 17–25 m depth at the upper part of the Ewigschneefeld, but the density of around 800 kg m−3 within the same layers can be observable near 10 m depth at the lower part of the Ewigschneefeld (distance > 1700 m).
Similarly, the accumulation distribution across spatial scales is shown in Fig. A4. The estimated accumulation is the product of the density gradient within the firn layers and the thickness of each picked layer. Thicker layers are visible at shallower depths, which correlates with high winter accumulation and/or relatively lower summer melt (Fig. A1). However, at lower elevations, the layer thickness reduces, particularly in years such as 2022, 2020, 2019, and 2018. The deeper layers (2016–2015) are well-defined, with their thickness clearly visible throughout the radargram. The higher accumulation (> 3000 mm w.e.) in certain layers is directly associated with uncertainty in layer picking (subjective picking). The improved accuracy of the accumulation distribution depends on how well the IRHs are picked. However, thinner, shallower layers (around 1000 and 2200 m along the profile and at 5–10 m depth) and deeper layers are clearly distinct but difficult to pick out accurately (Fig. 4a and b).
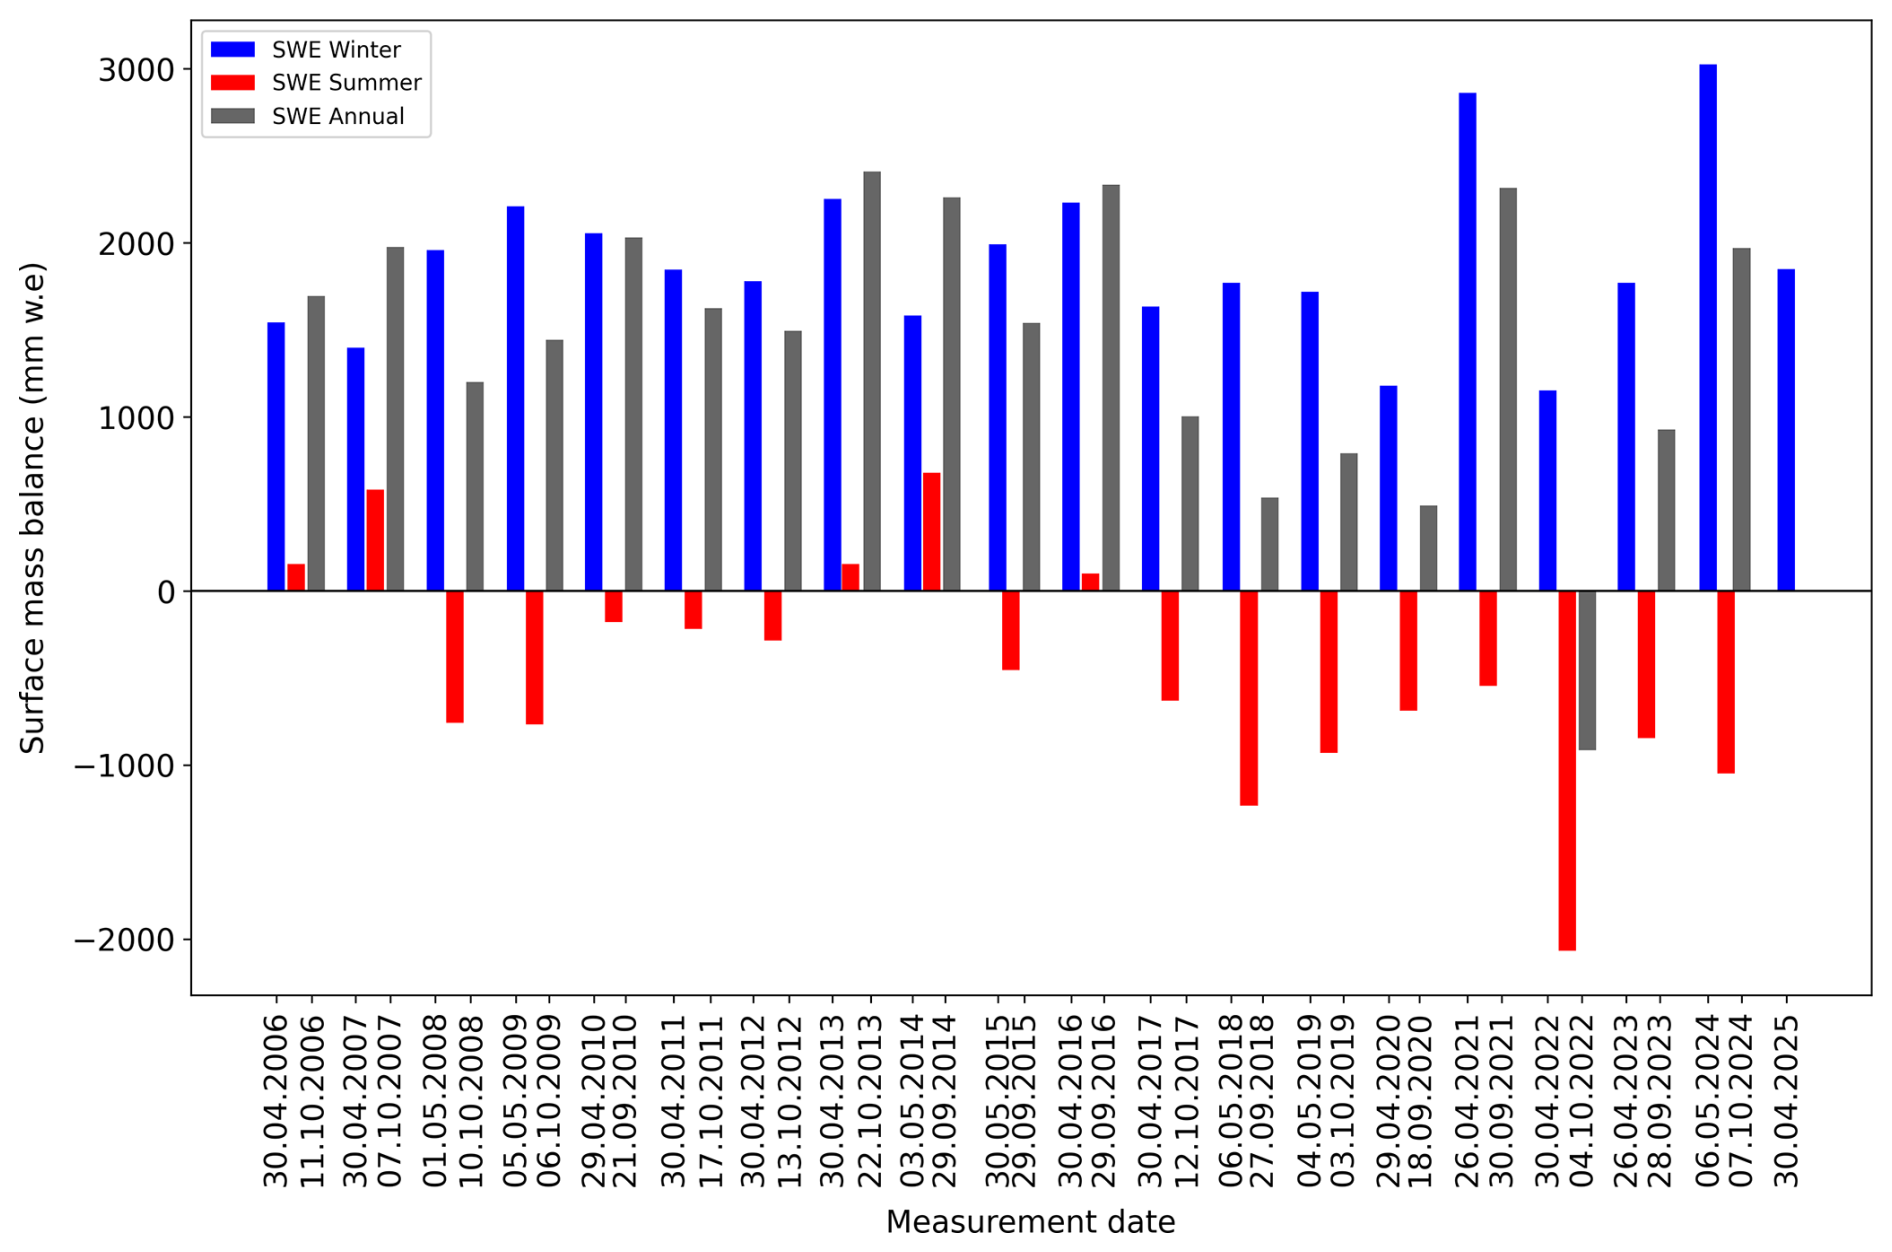
Figure A1The long-term point mass balance measurements at the end of each season near the Jungfraufirn area (Fig. 1) of the Grosser Aletschgletscher glacier (approximate location: 46.54314° N, 7.98389° E, and elevation: 3340 m a.s.l.). The winter (blue) and summer (red) are the measured seasonal mass balances. The grey bars represent the annual balance estimated by adding the seasonal mass balance (winter and summer) over the last 20 years (GLAMOS, 2025). The seasonal mass balance measurement date is indicated on the x axis.
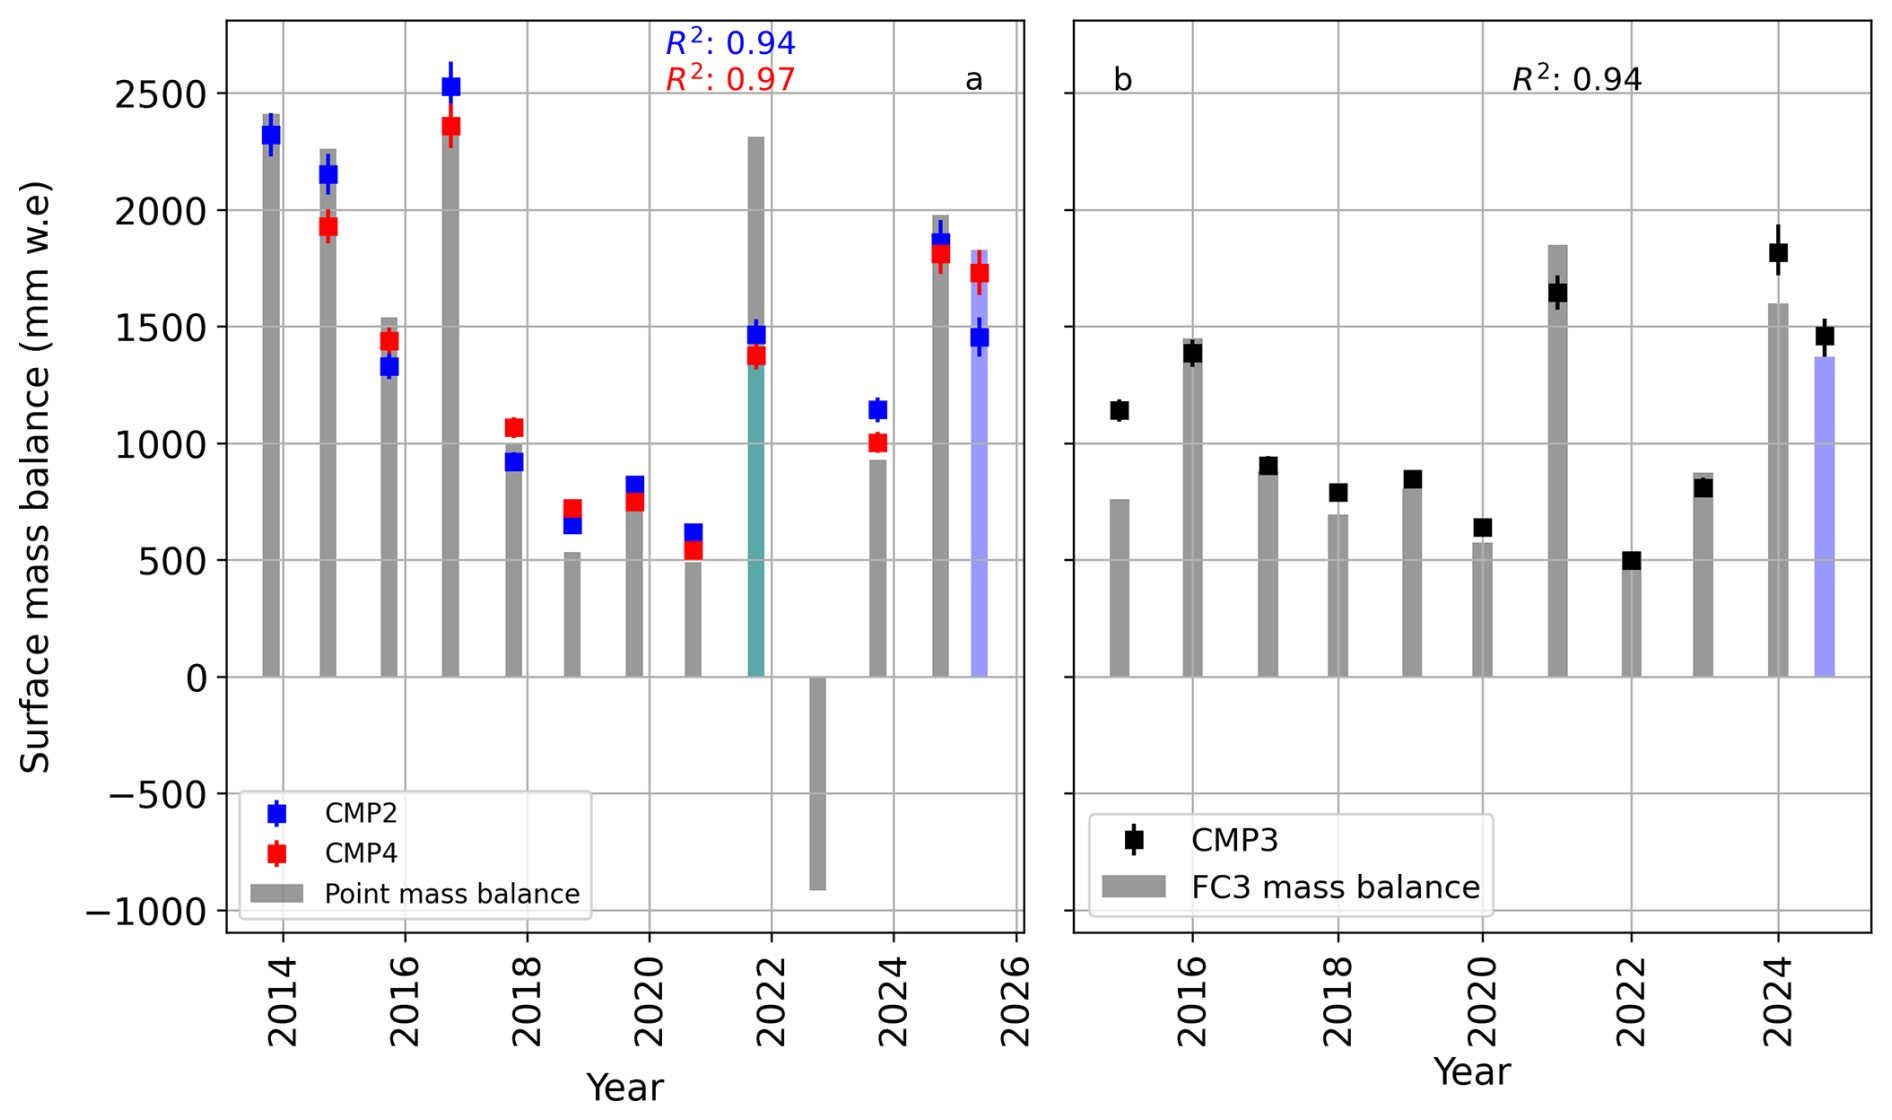
Figure A2Identification of annual layers by comparing estimated SWE from three CMP gathers across the accumulation area of the Grosser Aletschgletscher with the measured SWE from point mass-balance measurements (Fig. 1). Blue squares represent the identified annual layers from CMP2 (lower part of Ewigschneefeld, a), the red square, CMP4 near the point mass-balance measurement (Jungfraufirn), and the black square, CMP3 (upper part of Ewigschneefeld, b). The y axis shows the annual surface mass balance in mm w.e., and the x axis shows the year. The blue vertical bar shows the winter accumulation in 2025, and the cyan vertical bar in 2021 represents the remaining firn layer after the complete removal of the 2022 winter and some part of the 2021 layer (nearly 1000 mm w.e.) at the point mass balance measurement location (Stake in Fig. 1).
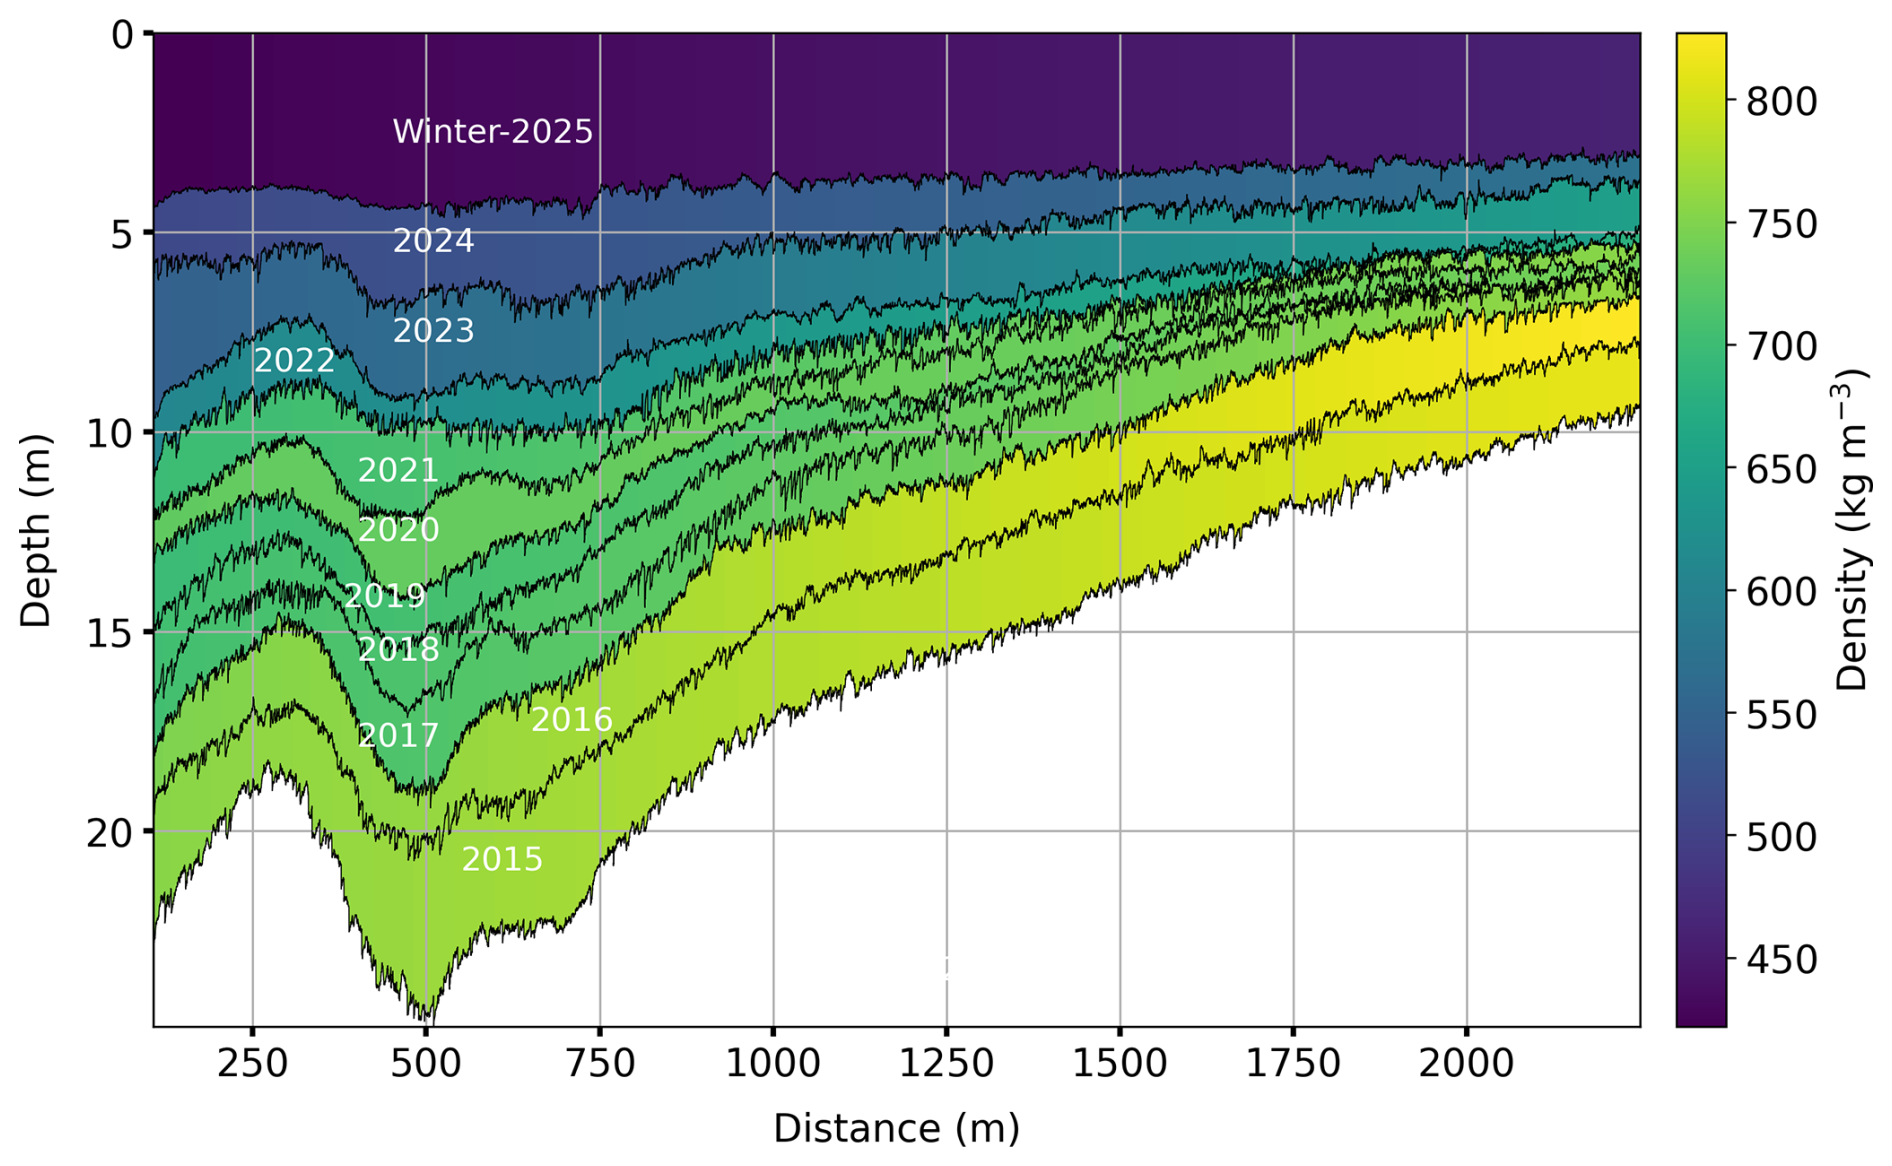
Figure A3Illustration of the spatial firn density distribution estimated by interpolating the identified annual layer density using two CMP measurements gathered at the upper and lower parts of Ewigschneefeld near the GPR long transect (Fig. 1). The black wiggle lines are picked internal reflection horizons (IRHs) obtained from the GPR transect radargram, represented as annual layers marked with corresponding years in white.
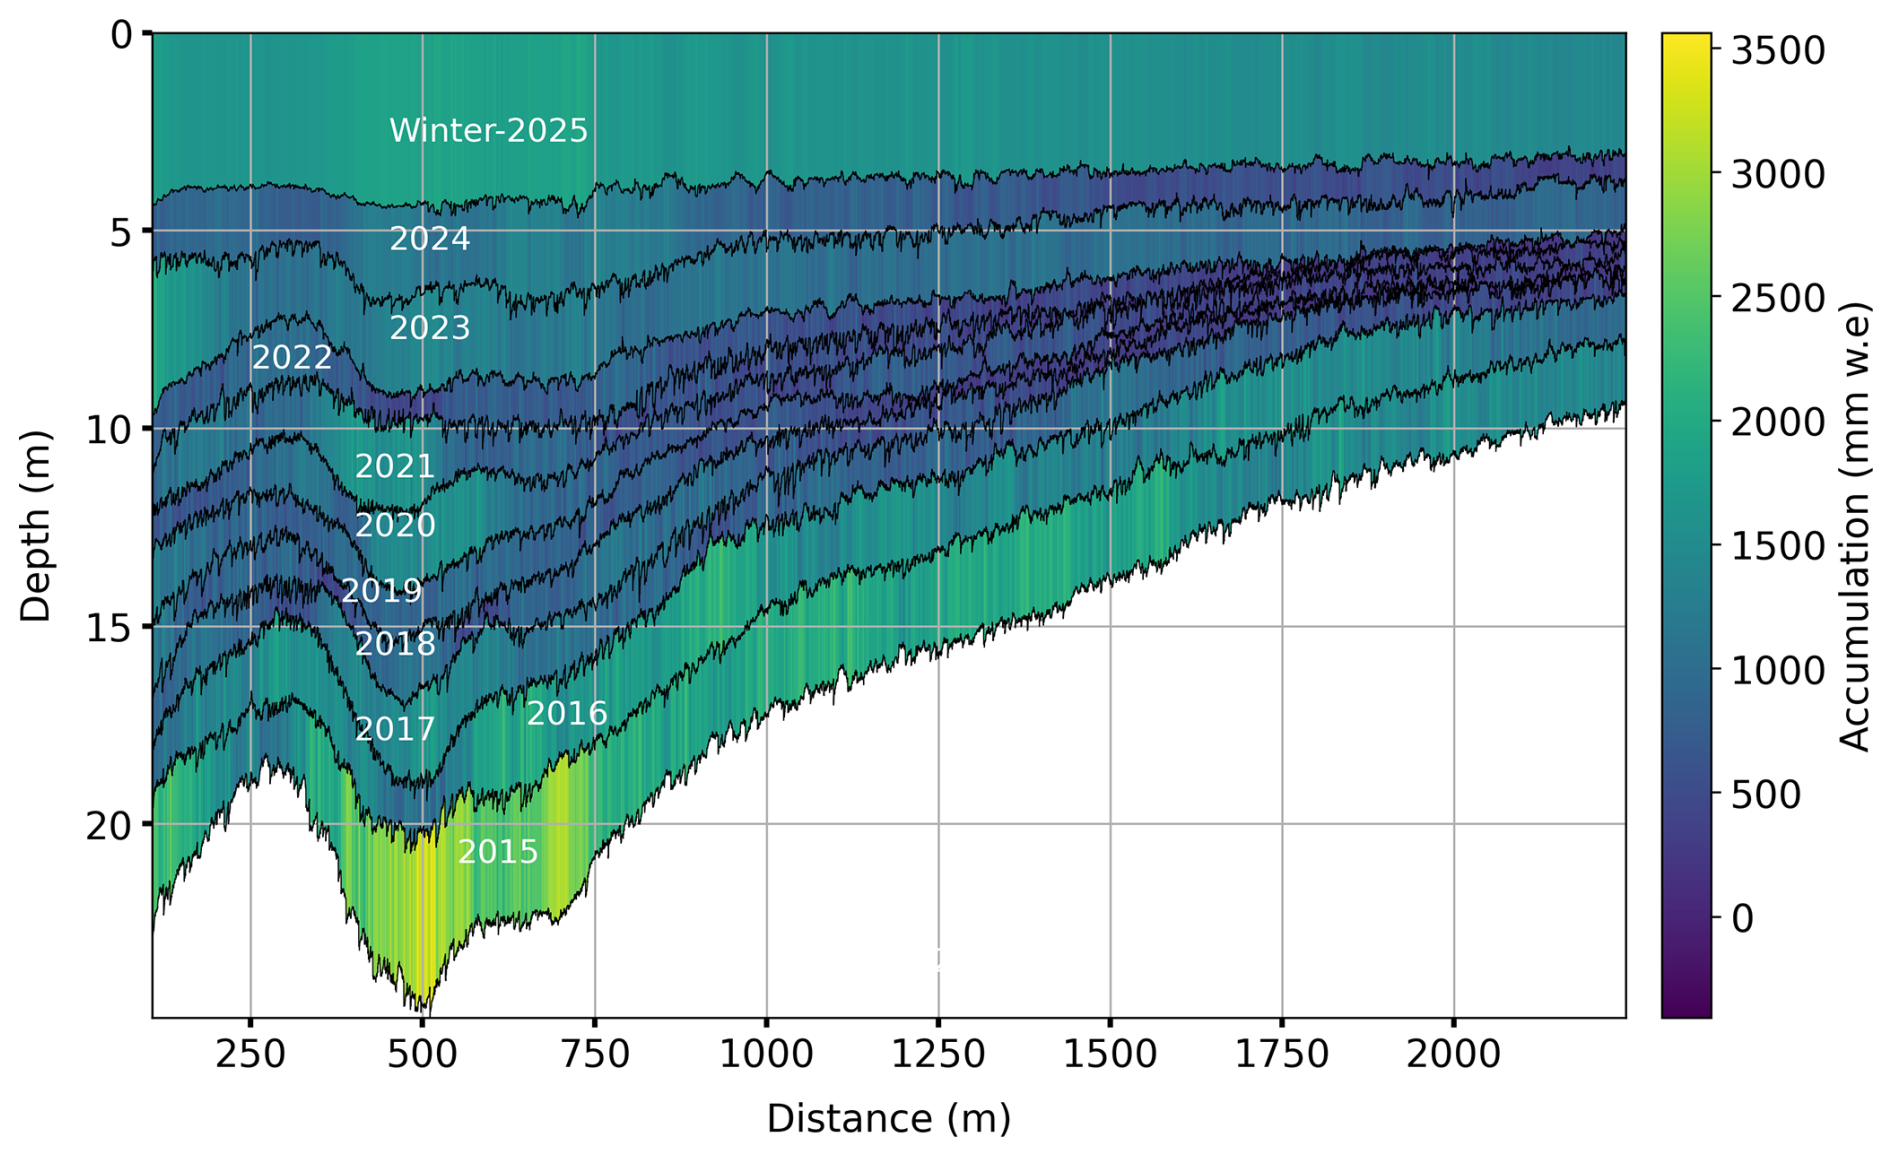
Figure A4Illustration of the spatial accumulation distribution estimated by multiplying the interpolated annual layer density and the thickness using two CMP measurements gathered at the upper and lower parts of Ewigschneefeld near the GPR long transect (Fig. 1). The black wiggle lines are picked internal reflection horizons (IRHs) obtained from the GPR transect radargram, represented as annual layers marked with corresponding years in white.
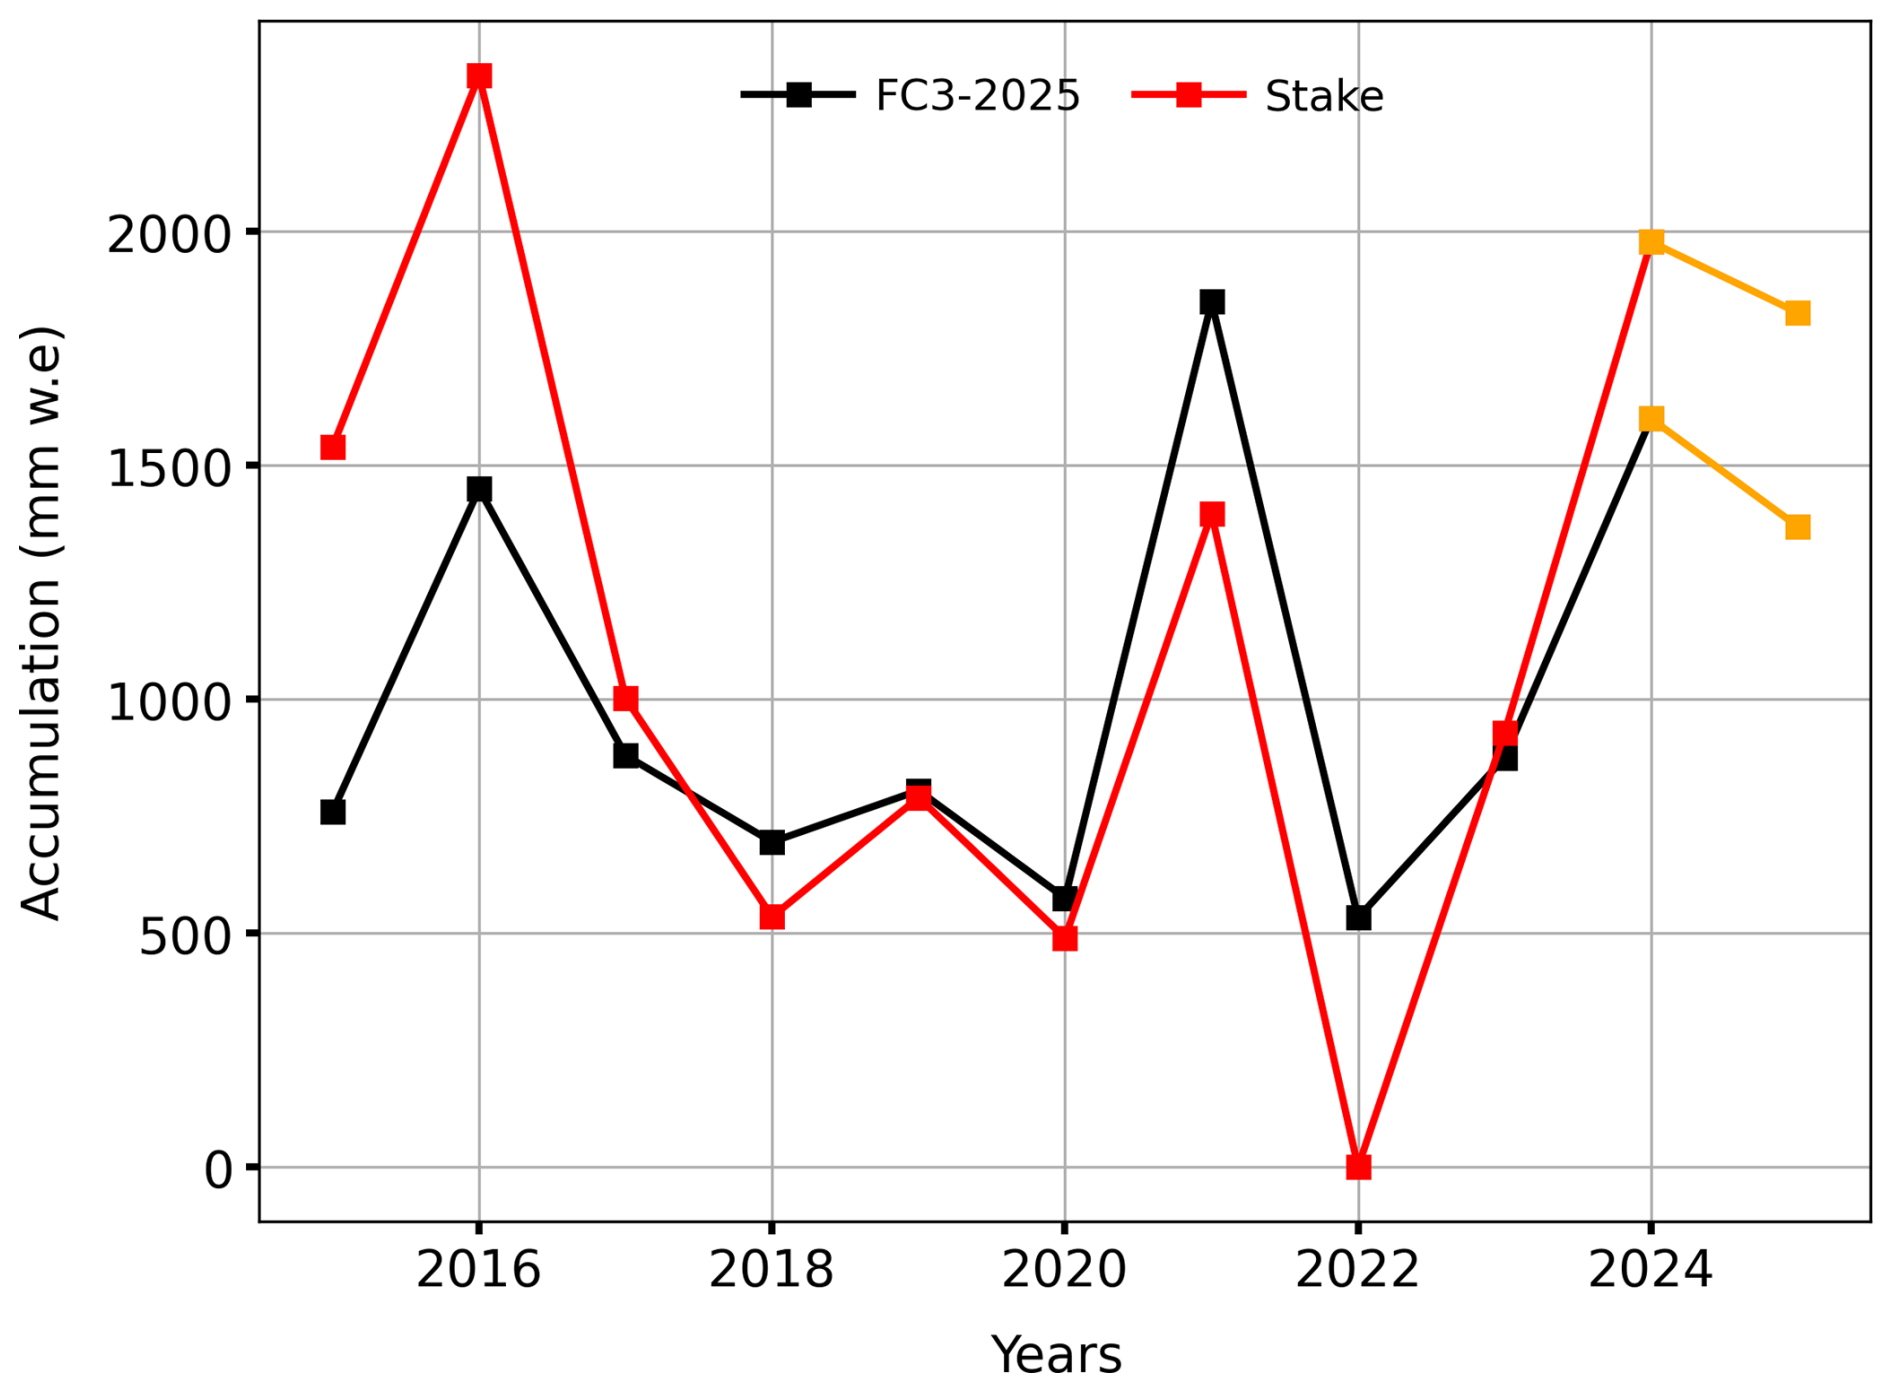
Figure A5Comparison of accumulation within identified annual layers at the Upper part of Ewigschneefeld (black) using chemical impurity analysis (Fe) from a deep firn core, and the point mass balance measurement near the stake (red) location (Jungfraufirn in Fig. 1). Orange lines show the winter accumulation at respective locations.
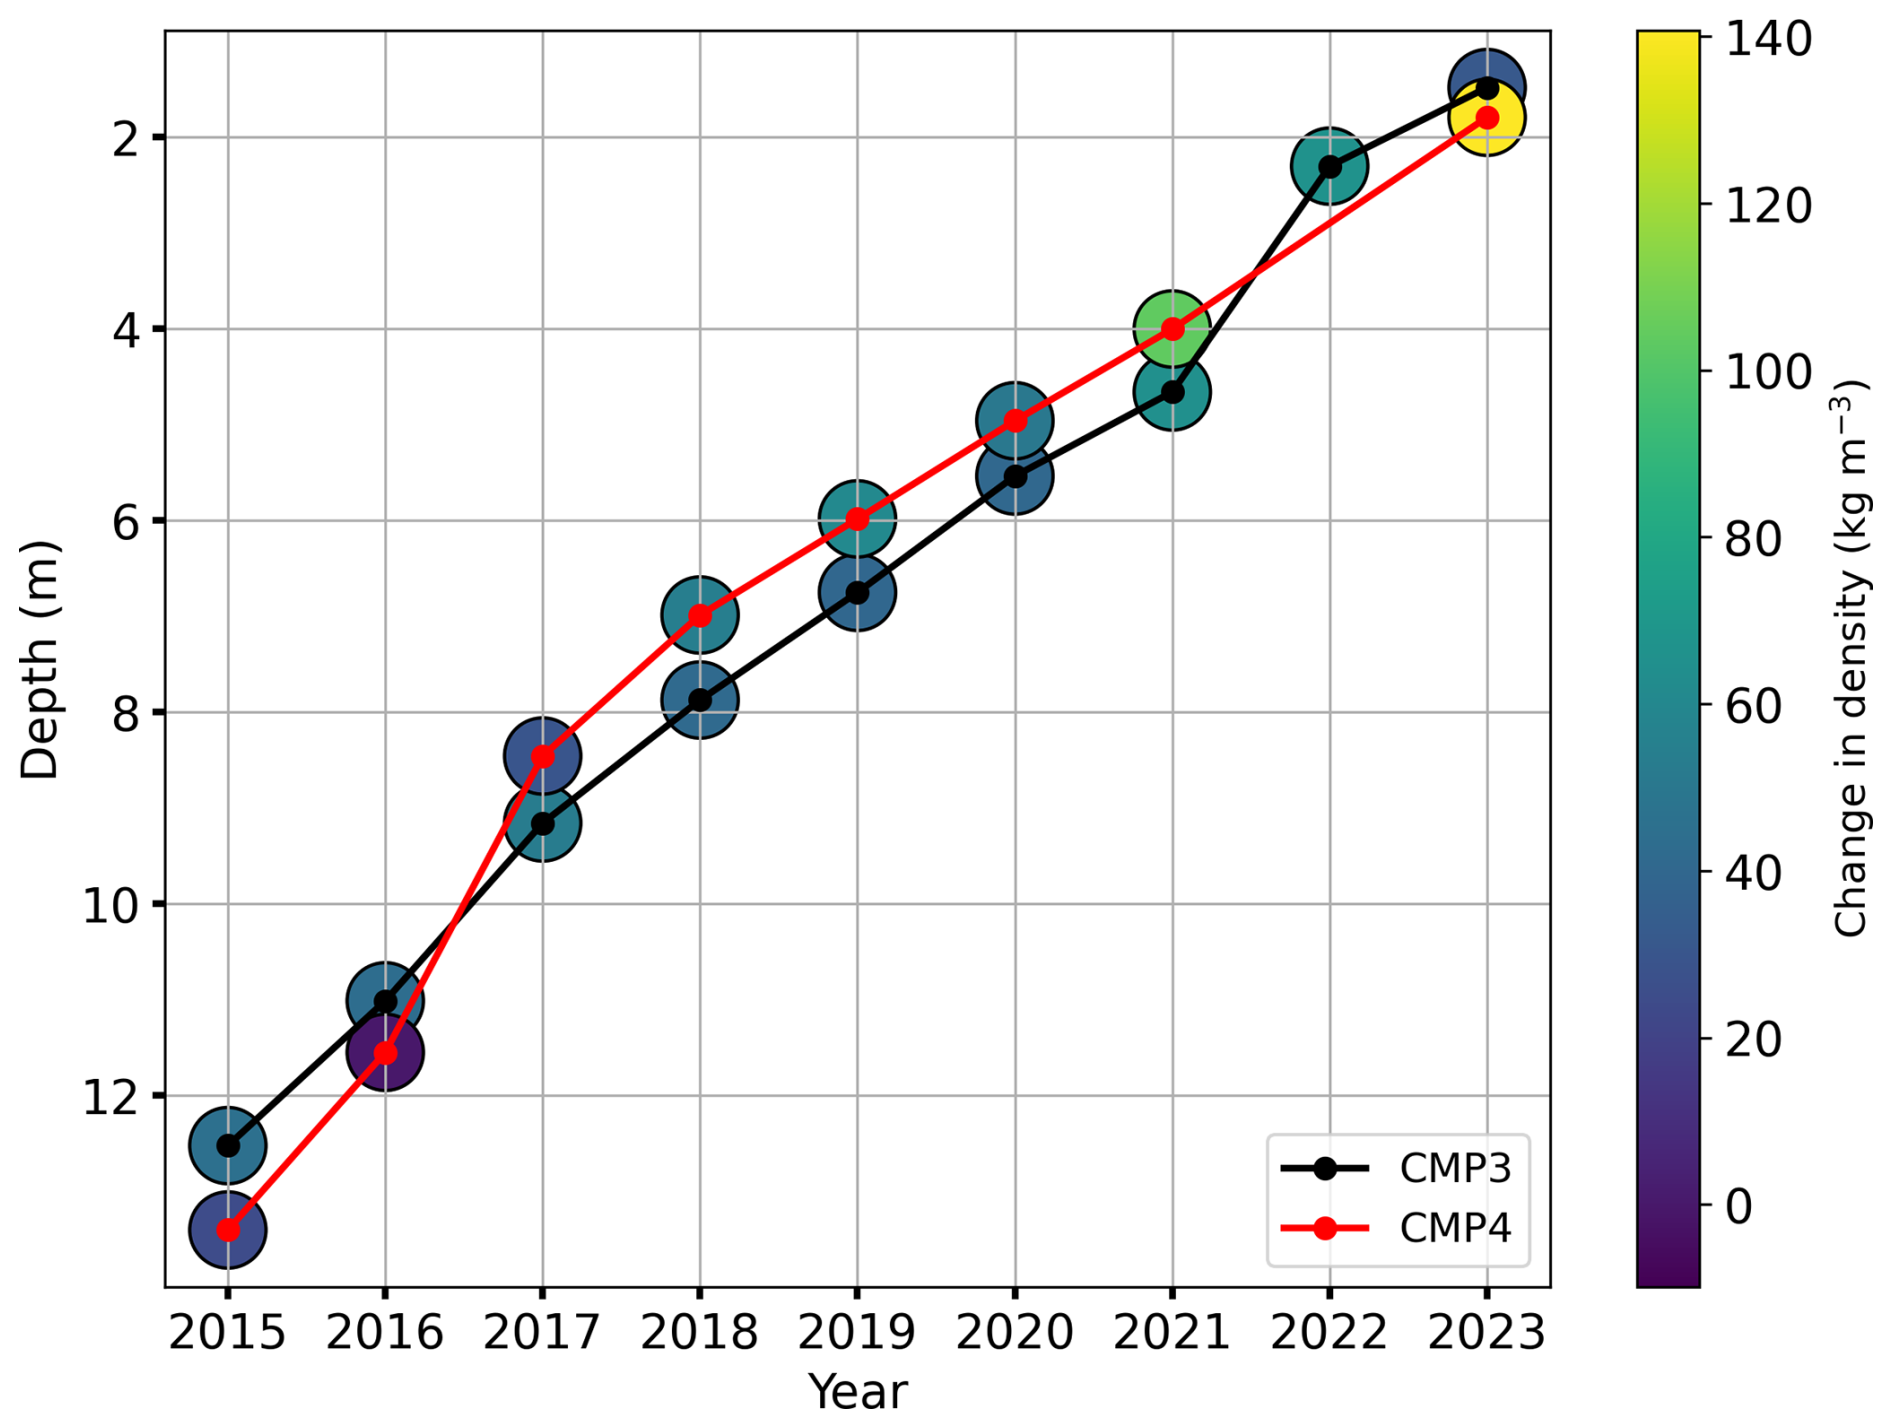
Figure A6Illustration of changes in firn density with depth and age. The CMP3-derived (black line) and CMP4-estimated (red line) density changes at the upper part of the Ewigschneefeld and near the Stake (Fig. 1). The y axis is the depth (m) of the identified annual layers, and the x axis is the corresponding annual layers in years. The colour gradient represents density changes within the identified annual layers, and the corresponding density values are shown in the colour bar.
The raw data and semi-processed data acquired during the 2024–25 expedition can be accessed at https://doi.org/10.5281/zenodo.22026601 (Patil et al., 2026). Already existing datasets that are used in this study are available at https://doi.org/10.18750/massbalance.2025.r2025 (GLAMOS, 2025) and https://doi.org/10.5281/zenodo.17077546 (Patil et al., 2025a).
The supplement related to this article is available online at https://doi.org/10.5194/tc-20-4927-2026-supplement.
AP, with assistance from CM, initiated and developed the study. AP. wrote the paper, conducted the data analysis, and performed all the visualisations. CM processed the GPR long profile data. The field campaigns were planned with contributions from CM, TS, and AG. All co-authors contributed to the reviewing and editing of the manuscript.
The contact author has declared that none of the authors has any competing interests.
Publisher's note: Copernicus Publications remains neutral with regard to jurisdictional claims made in the text, published maps, institutional affiliations, or any other geographical representation in this paper. The authors bear the ultimate responsibility for providing appropriate place names. Views expressed in the text are those of the authors and do not necessarily reflect the views of the publisher.
The study was funded by the Bavarian State Ministry of Science and the Arts within the Elitenetwork Bavaria International Doctoral Programme “M3OCCA - Measuring and Modelling Mountain Glaciers and Ice Caps in a Changing Climate”. We thank Samuel Marending for his support during the 2025 field campaign. We also acknowledge the data provided by Dr Andreas Bauder from ETH Zurich. We appreciate the discussions with Dr Carlos Martin from the British Antarctic Survey in Cambridge, UK. We also thank Dr Christian Gerlach from BAdW, Munich, Germany, for his support with custom documentation. Further, we thank the International Foundation High Alpine Research Stations Jungfraujoch and Gornergrat (HFSJG) and Jungfraubahn, Switzerland, for their support in the smooth conduct of our expeditions. We appreciate the help from the HYDROGEOLOGY LABORATORY FAU ERLANGEN-NUREMBERG in analysing our firn-core-derived water isotope and chemical impurity data.
This research has been supported by the Elitenetzwerk Bayern (grant no. IDP M3OCCA) and the Deutsche Forschungsgemeinschaft (DFG) (grant no. SE 3091/5-1 awarded to Thorsten Seehaus). This research was further supported by Alexander R. Groos, who received primary funding from the European Union's Horizon 2020 research and innovation programme via the European Research Council (ERC) as a Starting Grant (FRAGILE project; principal investigator: Johannes J. Fürst) under grant agreement no. 948290.
This paper was edited by Horst Machguth and reviewed by two anonymous referees.
Albert, M., Koh, G., and Perron, F.: Radar investigations of melt pathways in a natural snowpack, Hydrol. Process., 13, 2991–3000, https://doi.org/10.1002/(SICI)1099-1085(19991230)13:18<2991::AID-HYP10>3.0.CO;2-5, 1999. a
Alean, J., Haeberli, W., and Schädler, B.: Snow accumulation, firn temperature and solar radiation in the area of the Colle Gnifetti core drilling site (Monte Rosa, Swiss Alps): Distribution patterns and interrelationships, Z. Gletscherkd. Glazialgeol., 19, 131–147, https://epic.awi.de/id/eprint/31421/ (last access: 13 July 2026), 1983. a
Ambach, W. and Eisner, H.: Analysis of a 20 m firn pit on the Kesselwandferner (Ötztal Alps), J. Glaciol., 6, 223–231, https://doi.org/10.3189/S0022143000019237, 1966. a
Annan, A. P.: Practical Processing of GPR Data, in: Proceedings of the Second Government Workshop on Ground Penetrating Radar, Columbus, Ohio, https://johnrleeman.com/documents/GPR_data_processing.pdf (last access: 13 July 2026), 1993. a
Annan, A. P.: Ground-Penetrating Radar, in: Near-Surface Geophysics, Society of Exploration Geophysicists, 357–438, https://doi.org/10.1190/1.9781560801719.ch11, 2005. a
Arnaud, L., Barnola, J. M., and Duval, P.: Physical modeling of the densification of snow/firn and ice in the upper part of polar ice sheets, in: Physics of Ice Core Records, Hokkaido University Press, Hokkaido, Japan, 285–305, http://hdl.handle.net/2115/32472 (last access: 13 July 2026), 2000. a
Arthern, R. and Wingham, D.: The Natural Fluctuations of Firn Densification and Their Effect on the Geodetic Determination of Ice Sheet Mass Balance, Climatic Change, 40, 605–624, https://doi.org/10.1023/A:1005320713306, 1998. a
Arthern, R. J., Vaughan, D. G., Rankin, A. M., Mulvaney, R., and Thomas, E. R.: In situ measurements of Antarctic snow compaction compared with predictions of models, J. Geophys. Res.-Earth, 115, F03011, https://doi.org/10.1029/2009JF001306, 2010. a, b, c, d
Avak, S. E., Schwikowski, M., and Eichler, A.: Impact and implications of meltwater percolation on trace element records observed in a high-Alpine ice core, J. Glaciol., 64, 877–886, https://doi.org/10.1017/jog.2018.74, 2018. a, b
Bader, H.: Sorge's Law of Densification of Snow on High Polar Glaciers, J. Glaciol., 2, 319–323, https://doi.org/10.3189/S0022143000025144, 1954. a, b
Bader, H.: Theory of densification of dry snow on high polar glaciers, II, Tech. Rep. 108, US Army Cold Regions Research and Engineering Laboratory, https://api.semanticscholar.org/CorpusID:129377325 (last access: 13 July 2026), 1962. a
Bannwart, J., Piermattei, L., Dussaillant, I., Krieger, L., Floricioiu, D., Berthier, E., Roeoesli, C., Machguth, H., and Zemp, M.: Elevation bias due to penetration of spaceborne radar signal on Grosser Aletschgletscher, Switzerland, J. Glaciol., 70, e1, https://doi.org/10.1017/jog.2024.37, 2024. a
Benson, C. S.: Stratigraphic Studies in the Snow and Firn of the Greenland Ice Sheet, Tech. Rep. Technical Report 70, U.S. Army Snow, Ice and Permafrost Research Establishment (SIPRE), https://apps.dtic.mil/sti/citations/ADA337542 (last access: 27 August 2026), 1962. a
Bezeau, P., Sharp, M., Burgess, D., and Gascon, G.: Firn profile changes in response to extreme 21st-century melting at Devon Ice Cap, Nunavut, Canada, J. Glaciol., 59, 981–991, https://doi.org/10.3189/2013JOG12J208, 2013. a
Blatter, H. and Hutter, K.: Polythermal conditions in Arctic glaciers, J. Glaciol., 37, 261–269, https://doi.org/10.3189/S0022143000007279, 1991. a
Booth, A. D., Clark, R. A., and Murray, T.: Influences on the resolution of GPR velocity analyses and a Monte Carlo simulation for establishing velocity precision, Near Surf. Geophys., 9, 399–411, https://doi.org/10.3997/1873-0604.2011019, 2011. a, b
Braithwaite, R. J., Laternser, M., and Pfeffer, W. T.: Variations of near-surface firn density in the lower accumulation area of the Greenland ice sheet, Pâkitsoq, West Greenland, J. Glaciol., 40, 477–485, https://doi.org/10.3189/S002214300001234X, 1994. a
Brown, J., Bradford, J., Harper, J., Pfeffer, W. T., Humphrey, N., and Mosley-Thompson, E.: Georadar-derived estimates of firn density in the percolation zone, western Greenland ice sheet, J. Geophys. Res.-Earth, 117, F02089, https://doi.org/10.1029/2011JF002089, 2012. a
Case, E. and Kingslake, J.: Phase-sensitive radar as a tool for measuring firn compaction, J. Glaciol., 68, 139–152, https://doi.org/10.1017/jog.2021.83, 2022. a, b, c
Clifford, H. M., Spaulding, N. E., Kurbatov, A. V., More, A., Korotkikh, E. V., Sneed, S. B., Handley, M. J., Maasch, K. A., Loveluck, C. P., Chaplin, J., McCormick, M., and Mayewski, P. A.: A 2000 year Saharan dust event proxy record from an ice core in the European Alps, J. Geophys. Res.-Atmos., 124, 12882–12900, https://doi.org/10.1029/2019JD030725, 2019. a
Cogley, J. G., Hock, R., Rasmussen, L. A., Arendt, A. A., Bauder, A., Braithwaite, R. J., Jansson, P., Kaser, G., Möller, M., Nicholson, L., and Zemp, M.: Glossary of Glacier Mass Balance and Related Terms, no. 86 in IHP-VII Technical Documents in Hydrology, UNESCO-IHP, iACS Contribution No. 2, Paris, http://unesdoc.unesco.org/images/0019/001925/192525e.pdf (last access: 13 July 2026), 2011. a
Colbeck, S. C.: The difficulties of measuring the water saturation and porosity of snow, J. Glaciol., 20, 189–201, https://doi.org/10.3189/S0022143000198089, 1978. a
Cuffey, K. M. and Paterson, W. S. B.: The Physics of Glaciers, Butterworth-Heinemann, Oxford, 4th edn., ISBN 978-0-12-369461-4, https://booksite.elsevier.com/samplechapters/9780123694614/01~Front_Matter.pdf, (last access: 21 October 2025), 2010. a
Davis, J. L. and Annan, A. P.: GROUND-PENETRATING RADAR FOR HIGH-RESOLUTION MAPPING OF SOIL AND ROCK STRATIGRAPHY, Geophys. Prospect., 37, 531–551, https://doi.org/10.1111/j.1365-2478.1989.tb02221.x, 1989. a, b
Eichler, A., Legrand, M., Jenk, T. M., Preunkert, S., Andersson, C., Eckhardt, S., Engardt, M., Plach, A., and Schwikowski, M.: Consistent histories of anthropogenic western European air pollution preserved in different Alpine ice cores, The Cryosphere, 17, 2119–2137, https://doi.org/10.5194/tc-17-2119-2023, 2023. a
Endres, A. L., Murray, T., Booth, A. D., and West, L. J.: A new framework for estimating englacial water content and pore geometry using combined radar and seismic wave velocities, Geophys. Res. Lett., 36, L04501, https://doi.org/10.1029/2008GL036876, 2009. a
Evans, S. L., Flores, A. N., Heilig, A., Kohn, M. J., Marshall, H. P., and McNamara, J. P.: Isotopic evidence for lateral flow and diffusive transport, but not sublimation, in a sloped seasonal snowpack, Idaho, USA, Geophys. Res. Lett., 43, 3298–3306, https://doi.org/10.1002/2015GL067605, 2016. a
Fisher, D. A., Wake, C., Kreutz, K., Yalcin, K., Steig, E., Mayewski, P., Anderson, L., Zheng, J., Rupper, S., Zdanowicz, C., Demuth, M., Waszkiewicz, M., Dahl-Jensen, D., Goto-Azuma, K., Bourgeois, J. B., Koerner, R. M., Sekerka, J., Osterberg, E., Abbott, M. B., Finney, B. P., and Burns, S. J.: Stable Isotope Records from Mount Logan, Eclipse Ice Cores and Nearby Jellybean Lake. Water Cycle of the North Pacific Over 2000 Years and Over Five Vertical Kilometres: Sudden Shifts and Tropical Connections, Gegr. Phys. Quatern., 58, 337–352, https://doi.org/10.7202/013147ar, 2006. a
Fisher, S. C., Stewart, R. R., and Jol, H. M.: Ground Penetrating Radar (GPR) Data Enhancement Using Seismic Techniques, J. Environ. Eng. Geophys., 1, 89–96, https://doi.org/10.4133/JEEG1.2.89, 1996. a
Fountain, A. G. and Walder, J. S.: Water flow through temperate glaciers, Rev. Geophys., 36, 299–328, https://doi.org/10.1029/97RG03579, 1998. a
Fujita, S., Hirabayashi, M., Goto-Azuma, K., Dallmayr, R., Satow, K., Zheng, J., and Dahl-Jensen, D.: Densification of layered firn of the ice sheet at NEEM, Greenland, J. Glaciol., 60, 905–921, https://doi.org/10.3189/2014JoG14J006, 2014. a
Gerland, S., Oerter, H., Kipfstuhl, J., Wilhelms, F., Miller, H., and Miners, W. D.: Density log of a 181 m long ice core from Berkner Island, Antarctica, Ann. Glaciol., 29, 215–219, https://doi.org/10.3189/172756499781821427, 1999. a
Gillet-Chaulet, F., Hindmarsh, R. C. A., Corr, H. F. J., King, E. C., and Jenkins, A.: In-situ quantification of ice rheology and direct measurement of the Raymond Effect at Summit, Greenland using a phase-sensitive radar, Geophys. Res. Lett., 38, L24503, https://doi.org/10.1029/2011GL049843, 2011. a
Ginot, P., Stampfli, F., Stampfli, D., Schwikowski, M., and Gäggeler, H. W.: FELICS, a new ice core drilling system for high-altitude glaciers, Mem. Natl Inst. Polar Res., 56, 38–48, https://ci.nii.ac.jp/naid/110000010492 (last access: 27 August 2026), 2002. a
GLAMOS: The Swiss Glaciers 1880-2016/17, Glaciological Reports No 1-140, Yearbooks of the Cryospheric Commission of the Swiss Academy of Sciences (SCNAT), VAW/ETH Zurich, https://doi.org/10.18752/glrep_series, 2018a. a
GLAMOS: The Swiss Glaciers 2015/16 and 2016/17, Tech. Rep. Glaciological Report No. 135/136, Cryospheric Commission (EKK) of the Swiss Academy of Sciences (SCNAT), under review, 126 pp., https://scnat.ch/en/uuid/i/89c3b590-2b34-5567-802d-b448f8d9a4d7-The_Swiss_Glaciers_201516_and_201617 (last access: 28 August 2026), 2018b. a
GLAMOS: The Swiss Glaciers 2019/20 and 2020/21, Glaciological Report No. 141/142, Cryospheric Commission (EKK) of the Swiss Academy of Sciences (SCNAT), VAW/ETH Zürich, https://doi.org/10.18752/glrep_141-142, 2022. a
GLAMOS: Swiss Glacier Mass Balance, release 2025, GLAMOS [data set], https://doi.org/10.18750/massbalance.2025.r2025, 2025. a, b, c, d, e
Grab, M., Mattea, E., Bauder, A., Huss, M., Rabenstein, L., Hodel, E., Linsbauer, A., Langhammer, L., Schmid, L., Church, G., Hellmann, S., Délèze, K., Schaer, P., Lathion, P., Farinotti, D., and Maurer, H.: Ice thickness distribution of all Swiss glaciers based on extended ground-penetrating radar data and glaciological modeling, J. Glaciol., 67, 1074–1092, https://doi.org/10.1017/jog.2021.55, 2021. a
Hamilton, G. S., Whillans, I. M., and Morgan, P. J.: First point measurements of ice-sheet thickness change in Antarctica, Ann. Glaciol., 27, 125–129, https://doi.org/10.3189/1998AoG27-1-125-129, 1998. a
Hawley, R. L. and Waddington, E. D.: In situ measurements of firn compaction profiles using borehole optical stratigraphy, J. Glaciol., 57, 289–294, https://doi.org/10.3189/002214311796405889, 2011. a
Hawley, R. L., Waddington, E. D., Lamorey, G. W., and Taylor, K. C.: Vertical-strain measurements in firn at Siple Dome, Antarctica, J. Glaciol., 50, 447–452, https://doi.org/10.3189/172756504781829972, 2004. a
Herron, M. M. and Langway Jr., C. C.: Firn Densification: An Empirical Model, J. Glaciol., 25, 373–385, https://doi.org/10.3189/S0022143000015239, 1980. a, b
Hooke, R. L., Gould, J. E., and Brzozowski, J.: Near-surface temperatures near and below the equilibrium line on polar and subpolar glaciers, Z. Gletscherkd. Glazialgeol., 19, 1–25, 1983. a
Horlings, A. N., Christianson, K., and Miège, C.: Expansion of Firn Aquifers in Southeast Greenland, J. Geophys. Res.-Earth, 127, e2022JF006753, https://doi.org/10.1029/2022JF006753, 2022. a
Hubbard, B., Philippe, M., Pattyn, F., Drews, R., Young, T. J., Bruyninx, C., Bergeot, N., Fjøsne, K., and Tison, J.-L.: High-resolution distributed vertical strain and velocity from repeat borehole logging by optical televiewer: Derwael Ice Rise, Antarctica, J. Glaciol., 66, 523–529, https://doi.org/10.1017/jog.2020.18, 2020. a
Huber, C. J., Eichler, A., Mattea, E., Brütsch, S., Jenk, T. M., Gabrieli, J., Barbante, C., and Schwikowski, M.: High-altitude glacier archives lost due to climate change-related melting, Nat. Geosci., 17, 110–113, https://doi.org/10.1038/s41561-023-01366-1, 2024. a, b
Huss, M.: Density assumptions for converting geodetic glacier volume change to mass change, The Cryosphere, 7, 877–887, https://doi.org/10.5194/tc-7-877-2013, 2013. a, b, c, d
Huss, M., Bauder, A., and Funk, M.: Homogenization of long-term mass balance time series, Ann. Glaciol., 50, 198–206, 2009. a
icedrill.ch AG.: IceDrill.ch, http://icedrill.ch (last access: 24 March 2026), 2010. a
Kawashima, K. and Yamada, T.: Experimental studies on the transformation from firn to ice in the wet-snow zone of temperate glaciers, Ann. Glaciol., 24, 181–185, https://doi.org/10.3189/S0260305500012143, 1997. a, b, c
Kindstedt, I., Winski, D., Stevens, C. M., Skelton, E., Copland, L., Kreutz, K., Mannello, M., Clavette, R., Holmes, J., Albert, M., and Williamson, S. N.: Ongoing firn warming at Eclipse Icefield, Yukon, indicates potential widespread meltwater percolation and retention in firn pack across the St. Elias Range, The Cryosphere, 19, 3655–3680, https://doi.org/10.5194/tc-19-3655-2025, 2025. a
Kingslake, J., Hindmarsh, R. C. A., Aðalgeirsdóttir, G., Conway, H., Corr, H. F. J., Gillet-Chaulet, F., Martín, C., King, E. C., Mulvaney, R., and Pritchard, H. D.: Full-depth englacial vertical ice sheet velocities measured using phase-sensitive radar, J. Geophys. Res.-Earth, 119, 2604–2618, https://doi.org/10.1002/2014JF003275, 2014. a
Knight, R., Tercier, P., and Irving, J.: The effect of vertical measurement resolution on the correlation structure of a ground penetrating radar reflection image, Geophys. Res. Lett., 31, L21607, https://doi.org/10.1029/2004GL021112, 2004. a
Kruetzmann, N. C., Rack, W., McDonald, A. J., and George, S. E.: Snow accumulation and compaction derived from GPR data near Ross Island, Antarctica, The Cryosphere, 5, 391–404, https://doi.org/10.5194/tc-5-391-2011, 2011. a, b, c, d, e
Lang, H.: Is evaporation an important component in high Alpine hydrology?, Nord. Hydrol., 12, 217–224, 1981. a
Leinss, S. and Bernhard, P.: TanDEM-X: Deriving InSAR Height Changes and Velocity Dynamics of Great Aletsch Glacier, IEEE J. Sel. Top. Appl., 14, 4798–4815, https://doi.org/10.1109/JSTARS.2021.3078084, 2021. a
Li, J. and Zwally, H. J.: Modeling the density variation in the shallow firn layer, Ann. Glaciol., 38, 309–313, https://doi.org/10.3189/172756404781814988, 2004. a
Ligtenberg, S. R. M., Helsen, M. M., and van den Broeke, M. R.: An improved semi-empirical model for the densification of Antarctic firn, The Cryosphere, 5, 809–819, https://doi.org/10.5194/tc-5-809-2011, 2011. a, b
Linsbauer, A., Huss, M., Hodel, E., Bauder, A., Fischer, M., Weidmann, Y., Bärtschi, H., and Schmassmann, E.: The New Swiss Glacier Inventory SGI2016: From a Topographical to a Glaciological Dataset, Front. Earth Sci., 9, 704189, https://doi.org/10.3389/feart.2021.704189, 2021. a
Looyenga, H.: Dielectric constants of heterogeneous mixtures, Physica, 31, 401–406, https://doi.org/10.1016/0031-8914(65)90045-5, 1965. a
Lüthi, M. and Funk, M.: Dating ice cores from a high Alpine glacier with a flow model for cold firn, Ann. Glaciol., 31, 69–79, 2000. a
MacFerrin, M. J., Stevens, C. M., Vandecrux, B., Waddington, E. D., and Abdalati, W.: The Greenland Firn Compaction Verification and Reconnaissance (FirnCover) dataset, 2013–2019, Earth Syst. Sci. Data, 14, 955–971, https://doi.org/10.5194/essd-14-955-2022, 2022. a, b, c
Maeno, N. and Ebinuma, T.: Pressure sintering of ice and its implication to the densification of snow at polar glaciers and ice sheets, J. Phys. Chem., 87, 4103–4110, 1983. a
Marsh, P. and Woo, M.-K.: Wetting front advance and freezing of meltwater within a snow cover: 1. Observations in the Canadian Arctic, Water Resour. Res., 20, 1853–1864, https://doi.org/10.1029/WR020i012p01853, 1984. a
Mattea, E., Machguth, H., Kronenberg, M., van Pelt, W., Bassi, M., and Hoelzle, M.: Firn changes at Colle Gnifetti revealed with a high-resolution process-based physical model approach, The Cryosphere, 15, 3181–3205, https://doi.org/10.5194/tc-15-3181-2021, 2021. a
Medley, B., Ligtenberg, S., Joughin, I., Van Den Broeke, M., Gogineni, S., and Nowicki, S.: Antarctic firn compaction rates from repeat-track airborne radar data: I. Methods, Ann. Glaciol., 56, 155–166, https://doi.org/10.3189/2015AoG70A203, 2015. a, b, c, d, e
MeteoSchweiz: Jahresverlauf an Stationen. Jungfraujoch, https://www.meteoswiss.admin.ch/services-and-publications/applications/measurement-values-and-measuring-networks.html#param=messnetz-automatisch&lang=en&station=JUN&chart=day&table=false&compare=n (last access: 13 July 2026), 2025. a, b, c, d
Millan, R., Mouginot, J., Rabatel, A., and Morlighem, M.: Ice velocity and thickness of the world's glaciers, Nat. Geosci., 15, 124–129, https://doi.org/10.1038/s41561-021-00885-z, 2022. a
Miller, J. B., Frisbee, M. D., Hamilton, T. L., and Murugapiran, S. K.: Recharge from glacial meltwater is critical for alpine springs and their microbiomes, Environ. Res. Lett., 16, 064012, https://doi.org/10.1088/1748-9326/abf06b, 2021. a
Morris, E. M. and Wingham, D. J.: Densification of polar snow: Measurements, modeling, and implications for altimetry, J. Geophys. Res.-Earth, 119, 349–365, https://doi.org/10.1002/2013JF002898, 2014. a, b, c
Nicholls, K. W., Corr, H. F., Stewart, C. L., Lok, L. B., Brennan, P. V., and Vaughan, D. G.: A ground-based radar for measuring vertical strain rates and time-varying basal melt rates in ice sheets and shelves, J. Glaciol., 61, 1079–1087, https://doi.org/10.3189/2015JoG15J073, 2015. a, b
Ochwat, N. E., Marshall, S. J., Moorman, B. J., Criscitiello, A. S., and Copland, L.: Evolution of the firn pack of Kaskawulsh Glacier, Yukon: meltwater effects, densification, and the development of a perennial firn aquifer, The Cryosphere, 15, 2021–2040, https://doi.org/10.5194/tc-15-2021-2021, 2021. a
Oeschger, H., Schotterer, U., Stauffer, B., Haeberli, W., and Röthlisberger, H.: First results from Alpine core drilling projects, Z. Gletscherkd. Glazialgeol., 13, Heft 1/2, 193–208, ISBN: 3-7030-0056-2, 1977. a
Patil, A., Mayer, C., Seehaus, T., Groos, A. R., Lambrecht, A., Pfluger, F., Schlenk, P., Saigger, M., and Stelzig, M.: Ground Penetrating Radar and Glaciological methods: Firn structure and density measurements in the accumulation area of the Grosser Aletschgletscher winter-2024, Version v1, Zenodo [data set], https://doi.org/10.5281/zenodo.17077546, 2025a. a, b, c, d
Patil, A. M., Mayer, C., Seehaus, T., Groos, A. R., and Bauder, A.: Investigating firn structure and density in the accumulation area of the Grosser Aletschgletscher using ground-penetrating radar, The Cryosphere, 19, 5547–5577, https://doi.org/10.5194/tc-19-5547-2025, 2025b. a, b, c, d, e, f, g, h, i, j, k, l, m, n, o, p, q, r
Patil, A. M., Mayer, C., Lambrecht, A., Seehaus, T., Groos, A. R., Jenk, T. M., Worek, M., and Marending, S.: Ground Penetrating Radar, CMP and Glaciological methods: Annual changes in firn density and compaction measurements in the Grosser Aletschgletscher Winter-2024/25, Version 1.2, Zenodo [data set], https://doi.org/10.5281/zenodo.22026601, 2026. a
Pfeffer, W. T. and Humphrey, N. F.: Determination of timing and location of water movement and ice-layer formation by temperature measurements in sub-freezing snow, J. Glaciol., 42, 292–304, https://doi.org/10.3189/S0022143000004159, 1996. a
Reeh, N.: A nonsteady-state firn-densification model for the percolation zone of a glacier, J. Geophys. Res., 113, F03023, https://doi.org/10.1029/2007JF000746, 2008. a, b
Rückamp, M., Cheng, G., Gutjahr, K., Möller, M., Pellikka, P. K. E., and Mayer, C.: Future Retreat of Great Aletsch Glacier and Hintereisferner – application of a full-Stokes model to two valley glaciers in the European Alps, The Cryosphere, 20, 2999–3024, https://doi.org/10.5194/tc-20-2999-2026, 2026. a
Samimi, S. and Marshall, S. J.: Diurnal Cycles of Meltwater Percolation, Refreezing, and Drainage in the Supraglacial Snowpack of Haig Glacier, Canadian Rocky Mountains, Front. Earth Sci., 5, https://doi.org/10.3389/feart.2017.00006, 2017. a
Sandmeier, K.: Reflex-Win Version 5.5.1, Sandmeier Scientific Software, https://www.sandmeier-geo.de/reflexw.html (last access: 27 August 2026), 2010. a
Schmelzbach, C., Tronicke, J., and Dietrich, P.: High-resolution water content estimation from surface-based ground-penetrating radar reflection data by impedance inversion, Water Resour. Res., 48, W08505, https://doi.org/10.1029/2012WR011955, 2012. a
Schneider, T. and Jansson, P.: Internal accumulation in firn and its significance for the mass balance of Storglaciären, Sweden, J. Glaciol., 50, 25–34, https://doi.org/10.3189/172756504781830277, 2004. a
Schotterer, U. and Stichler, W.: Extending isotope in precipitation data beyond direct measurements: the perspective from glacier ice-core measurements in Switzerland, in: Stable Isotopes, edited by: Edwards, T. D., Kull, C., and Alverson, K., PAGES News, 10-2, 6–7, https://doi.org/10.22498/pages.10.2.6, 2002. a
Schotterer, U., Finkel, R., Oeschger, H., Siegenthaler, U., Wahlen, M., Bart, G., and von Gunten, H. R.: Isotope measurements on firn and ice cores from Alpine glaciers, in: Isotopes and Impurities in Snow and Ice, IAHS Publication, 118, 232–236, 1977. a
Schotterer, U., Stichler, W., and Ginot, P.: The influence of post-depositional effects on ice core studies: examples from the Alps, Andes, and Altai, in: Earth Paleoenvironments: Records Preserved in Mid- and Low-Latitude Glaciers, edited by: Green, J. R. and Thompson, L. G., vol. 9 of Developments in Paleoenvironmental Research, Springer, Dordrecht, https://doi.org/10.1007/1-4020-2146-1_3, 2004. a, b
Schwarb, M., Daly, C., Frei, C., and Schär, C.: Mean annual and seasonal precipitation in the European Alps 1971–1990, in: Hydrological Atlas of Switzerland, Federal Office for the Environment (FOEN), Bern, Switzerland, https://hydrologischeratlas.ch/produkte/druckausgabe/niederschlag/tafel-2-6(last access: 13 July 2026), 2001. a
Schwikowski, M., Brütsch, S., Gäggeler, H. W., and Schotterer, U.: A high-resolution air chemistry record from an Alpine ice core: Fiescherhorn Glacier, Swiss Alps, J. Geophys. Res.-Atmos., 104, 13709–13719, https://doi.org/10.1029/1998JD100112, 1999. a
Shapiro, L. H., Johnson, J. B., Sturm, M., and Blaisdell, G. L.: Snow Mechanics: Review of the State of Knowledge and Applications, Tech. rep., Defense Technical Information Center, Fort Belvoir, VA, https://doi.org/10.21236/ADA330695, 1997. a
Sheriff, R. E. and Geldart, L. P.: Exploration Seismology, Cambridge University Press, 2nd edn., ISBN 0-521-46282-7, 1999. a
Simonsen, S. B., Stenseng, L., Ađalgeirsdóttir, G., Fausto, R. S., Hvidberg, C. S., and Lucas-Picher, P.: Assessing a multilayered dynamic firn-compaction model for Greenland with ASIRAS radar measurements, J. Glaciol., 59, 545–558, https://doi.org/10.3189/2013JoG12J158, 2013. a
Sold, L., Huss, M., Eichler, A., Schwikowski, M., and Hoelzle, M.: Unlocking annual firn layer water equivalents from ground-penetrating radar data on an Alpine glacier, The Cryosphere, 9, 1075–1087, https://doi.org/10.5194/tc-9-1075-2015, 2015. a, b, c, d, e
Sold, L., Huss, M., Machguth, H., Joerg, P. C., Leysinger-Vieli, G., Linsbauer, A., Salzmann, N., Zemp, M., and Hoelzle, M.: Mass Balance Re-analysis of Findelengletscher, Switzerland: Benefits of Extensive Snow Accumulation Measurements, Front. Earth Sci., 4, 18, https://doi.org/10.3389/feart.2016.00018, 2016. a
Stevens, C. M., Sass, L., Florentine, C., McNeil, C., Baker, E., and Bollen, K.: Direct measurements of firn-density evolution from 2016 to 2022 at Wolverine Glacier, Alaska, J. Glaciol., 70, e2, https://doi.org/10.1017/jog.2024.24, 2024. a, b, c, d, e, f, g
Suter, S., Laternser, M., Haeberli, W., Frauenfelder, R., and Hoelzle, M.: Cold firn and ice of high-altitude glaciers in the Alps: Measurements and distribution modelling, J. Glaciol., 47, 85–96, 2001. a
swisstopo: SwissImage 10 Orthoimage, https://www.swisstopo.admin.ch/en/orthoimage-swissimage-10 (last access: 13 July 2026), 2026. a
Topp, G. C., Davis, J. L., and Annan, A. P.: Electromagnetic determination of soil water content: Measurements in coaxial transmission lines, Water Resour. Res., 16, 574–582, https://doi.org/10.1029/WR016i003p00574, 1980. a
Ulriksen, C. P.: Application of Impulse Radar to Civil Engineering, PhD thesis, Lund University of Technology, Lund, Sweden, https://www.nypl.org/research/research-catalog/bib/pb9910011683506421 (last access: 27 August 2026), 1982. a
van den Broeke, M., van de Berg, W. J., and van Meijgaard, E.: Firn depth correction along the Antarctic grounding line, Antarct. Sci., 20, 513–517, https://doi.org/10.1017/S095410200800148X, 2008. a
Wharton, R. P., Hazen, G. A., Rau, R. N., and Best, D. L.: Electromagnetic Propagation Logging: Advances in Technique and Interpretation, in: SPE Annual Technical Conference and Exhibition, SPE Paper 9267, Society of Petroleum Engineers, Dallas, Texas, https://doi.org/10.2118/9267-MS, 1980. a
Williamson, S. N., Zdanowicz, C., Anslow, F. S., Clarke, G. K. C., Copland, L., Danby, R. K., Flowers, G. E., Holdsworth, G., Jarosch, A. H., and Hik, D. S.: Evidence for elevation dependent warming in the St. Elias Mountains, Yukon, Canada, J. Climate, 33, 3253–3269, https://doi.org/10.1175/JCLI-D-19-0405.1, 2020. a, b
Yilmaz, Ö.: Seismic Data Analysis: Processing, Inversion, and Interpretation of Seismic Data, Society of Exploration Geophysicists, 10, https://doi.org/10.1190/1.9781560801580, ISBN 978-1-56080-094-1, 978-1-56080-158-0, 2001. a