the Creative Commons Attribution 4.0 License.
the Creative Commons Attribution 4.0 License.
 | 21 Jan 2026
ICESat-2 surface elevation assessment with kinematic GPS and static GNSS near the ice divide in Greenland
Robert L. Hawley
Denis Felikson
Jamie C. Good
Since 2007, researchers have conducted monthly or semimonthly kinematic GPS surveys along a 15 km transect near Summit Station, Greenland, providing ice surface elevation data with high relative accuracy (± 0.8 cm) and high precision (± 0.8 cm). We use these surveys to assess the long-term stability of ICESat-2 surface height measurements, revealing a sub-1.0 cm bias and sub-6.0 cm precision relative to ICESat-2 data, with no significant temporal trend in performance. While reliable, these surveys are resource-intensive. We describe an alternative, novel validation method using autonomous GNSS stations with interferometric reflectometry (GNSS-IR) to measure surface elevation concurrent with ICESat-2 overpasses. This method agrees well with kinematic GPS (−0.2 ± 5.0 cm) and is sensitive to active accumulation and surface roughness, offering additional environmental context. The ICESat-2 measurements are biased by −0.9 ± 3.8 cm compared to these autonomous stations. Together, these results demonstrate the importance of sustained, high-accuracy GNSS for building a long-term elevation benchmark record in Greenland, while also establishing GNSS-IR as a scalable alternative in support of current and future altimetry missions.
- Article
(3878 KB) - Full-text XML
- BibTeX
- EndNote


Precise and accurate satellite altimetry is required to measure the Greenland Ice Sheet's accelerating contribution to sea level rise (e.g., Sørensen et al., 2011; Khan et al., 2022; Smith et al., 2023c). Early measurements of Greenland's elevation changes relied on airborne radar campaigns in the 1980s and 1990s, which had limited accuracy and coverage, particularly in steep terrain. The launch of the Ice, Cloud, and land Elevation Satellite (ICESat) in 2003 significantly improved repeat coverage with laser altimetry, enhancing the understanding of surface mass balance of peripheral glaciers (e.g., Howat et al., 2008), the margins and interior of the Greenland and Antarctic ice sheets (e.g., Zwally et al., 2011), and ice shelves (e.g., Brunt et al., 2017), while achieving centimeter-level precision and accuracy (Schutz et al., 2005; Abdalati et al., 2010; Siegfried et al., 2011).
ICESat-2 improves on ICESat with continuous measurements on a 91 d repeat cycle, a six-beam array for slope detection and correction, and a smaller 17 m footprint for each beam (Markus et al., 2017; Magruder et al., 2021). Several efforts have assessed ICESat-2 performance in the cryosphere, primarily through ground campaigns in Antarctica. A 300 km traverse at 88° S, conducted annually from 2018 to 2020, intersects ∼ 275 ICESat-2 reference ground tracks (RGTs) due to orbital convergence at this latitude (Brunt et al., 2019, 2021). Low accumulation in this region allows ICESat-2 surface elevation estimates to be compared directly to ground traverse data, regardless of the timing of recent satellite overpasses. These studies have evaluated all six ICESat-2 beams, building on validation approaches from the original ICESat mission and airborne lidar campaigns (e.g., Fricker et al., 2005; Schröder et al., 2017; Brunt et al., 2017).
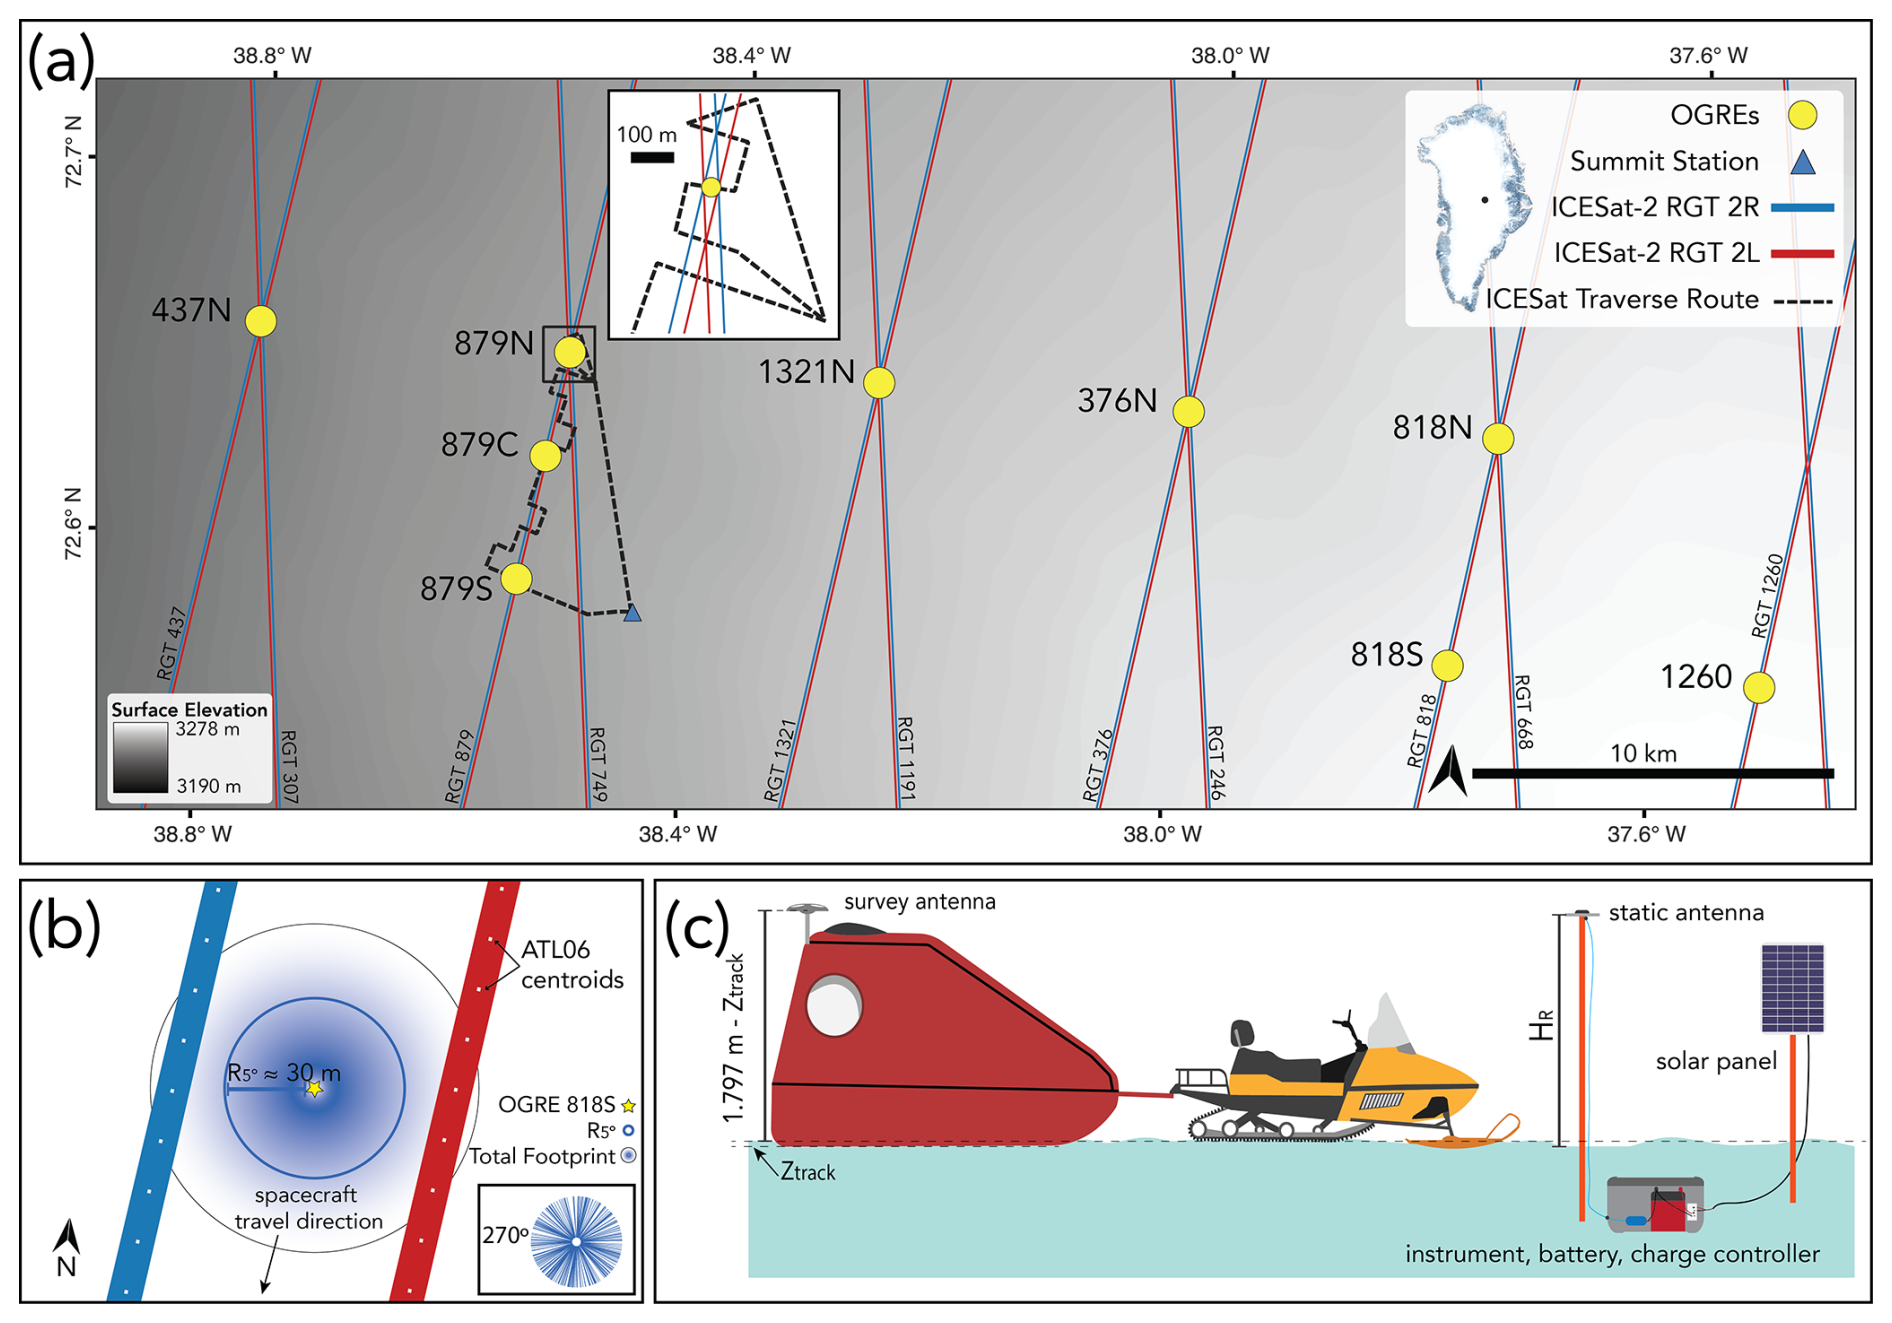
Figure 1(a) Map of the ICESat-2 traverse route, Open GNSS Research Equipment (OGRE) GNSS-IR stations, and ICESat-2 reference ground tracks for laser beams 2L and 2R. The inset highlights the northern traverse end where ascending and descending ICESat-2 tracks intersect at OGRE station 879N. (b) Plan view of typical OGRE station position and sensing footprint relative to the 2L and 2R ICESat-2 beams. The inset depicts an example azimuthal distribution of GNSS-IR antenna height estimates HR over a 24 h period. (c) Survey setup: the red sled, carrying a Trimble R7 receiver and roof-mounted antenna, is towed by a snowmobile. Sled sinkage (Ztrack) is measured twice each survey to correct GPS heights to the snow surface. To the right, the static OGRE setup features an antenna planted on a pole in the firn, whereby the antenna height HR is measured using GNSS-IR. Surface elevations on this map are derived from the MEaSUREs Greenland Ice Mapping Project 2 (Howat et al., 2014).
At Summit, Greenland (72.573° N, 38.470° W, 3253 m), a ground team has conducted monthly or semimonthly kinematic Global Position System (GPS) ground traverses since 2007 on a defined survey transect, making it unparalleled as a consistent, temporally long record of surface elevation change (Fig. 1a). These surveys provide a coincident record for the entire ongoing seven year duration of the ICESat-2 mission. By contributing a complementary geographic setting to Antarctica, these surface elevation measurements expand on previous validation efforts. Meanwhile, these measurements also reduce uncertainties from temporal offsets between overpasses and ground surveys. Unlike the arid East Antarctic Plateau, Summit experiences a significant accumulation rate, offering a realistic yet controlled environment to ensure ICESat-2 accurately captures ice sheet surface changes.
From 2022 to 2025, a network of low-power, low-cost, static on-ice Global Navigation Satellite System (GNSS) receiver stations, called OGREs (Open GNSS Research Equipment) operated along the ICESat-2 GPS traverse and at other regional ICESat-2 overpass locations (Fig. 1a) (Pickell and Hawley, 2024b). With Summit accumulating approximately 0.6–0.8 m yr−1 (Pickell et al., 2025b; Dibb and Fahnestock, 2004), these autonomous stations further reduce accumulation-related uncertainties by recording surface elevations temporally coincident with ICESat-2 overpass times. Surface elevation is derived from each OGRE geolocated antenna position using GNSS interferometric reflectometry (GNSS-IR), which determines the antenna height above the snow/ice surface using ground-reflected GNSS signals (Larson et al., 2009). This technique is widely applied, including for tidal measurements, snow depth estimates, and lake surface altimetry (e.g., Larson et al., 2013; Larson and Nievinski, 2013; Holden and Larson, 2021). In Greenland and Antarctica, this technique is used to measure snow surface height change (Siegfried et al., 2017; Dahl-Jensen et al., 2010; Larson et al., 2020 and Hoffman et al., 2025). Pickell et al. (2025b) also show that this technique is sensitive to surface roughness and subdaily accumulation in the Greenland summit region, which may further contextualize ICESat-2 surface height and height uncertainty estimates.
Here, we evaluate the data quality of kinematic GPS ground traverses (2018–2025) and static GNSS stations (2022–2025) to assess their accuracy and precision for comparison with precise satellite altimetry. We then compare these measurements with the full record of coincident ICESat-2 surface elevation data, analyzing the temporal stability of the ATLAS instrument over its lifespan and across all seasons. Finally, we analyze GNSS-IR sensitivity to surface and near-surface environmental conditions during ICESat-2 overpasses, and whether these environmental conditions such as active accumulation, blowing snow, or clouds affect ICESat-2 data.
2.1 ICESat-2 ATL06
For ICESat-2 traverse data comparisons, we select data from RGT 749 and RGT 879, along with nine additional RGTs for OGRE comparisons (Fig. 1a). Our analysis uses the land-ice elevation product ATL06 (version 6), which determines surface elevation estimates by selectively fitting and filtering 40 m windows of along-track geolocated photons every 20 m (Smith et al., 2019). ATL06 serves as the foundation for many higher-level ice surface change datasets.
We subset the data to include only elevation estimates from Spot 3 and Spot 4, the middle beam pair that intersects the ground traverse route and OGRE sensing footprints (Fig. 1a and b). Spot 3 is approximately four times stronger than Spot 4 due to ATLAS instrument design constraints (Markus et al., 2017). Every few months, the strong and weak beams switch orientation as the satellite performs a 180° yaw maneuver, thus switching Spot 3 and Spot 4 correspondence with the 2L and 2R ground tracks.
2.2 Kinematic survey GPS data
We collected GPS data at 1 Hz using a Trimble R7, with surveyors driving at approximately 5 m s−1 along the ∼ 25 km route (Fig. 1a and c), which intersects ICESat-2 RGT 879 and RGT 749 at multiple locations. At this speed, each GPS solution corresponds to a ∼ 5 m footprint. To minimize the impact of accumulation-driven surface changes, surveys are conducted within five days of the ICESat-2 overpass.
We processed GPS data using the Canadian Spatial Reference System Precise Point Positioning (CSRS-PPP) platform (Natural Resources Canada (NRCan), 2025). Processing parameters include final IGS orbit solutions, a 7.5° elevation angle cutoff for multipath mitigation, and corrections for solid Earth and polar tides. At the time of writing, CSRS-PPP only fixes integer phase ambiguities with GPS signals. Solutions are referenced to the GRS80 ellipsoid in the corresponding ITRF frame at the epoch of data collection, with IGS antenna phase center offset corrections applied for the Zephyr antenna, ensuring final solutions correspond to the antenna reference point (ARP). ICESat-2 land surface heights are similarly corrected for solid Earth and polar tides but are referenced to the ITRF2014 frame and WGS84 ellipsoid (Neumann et al., 2019), and we transform CSRS-PPP solutions to the ITRF2014 frame referenced to the WGS84 ellipsoid.
To derive surface elevation, the antenna mount height (1.797 m) is subtracted from the ARP. Track depth Ztrack, the snow surface depression due to vehicle weight, is measured at the start and end of each survey, with the mean value added to the corrected elevation estimate. Instead of using PPP estimates of uncertainty, we incorporate a more robust estimate of uncertainty described in Sect. 3.1. During the summer of 2024, we also mounted a downward-pointing laser rangefinder with millimeter-level precision on the survey sled sidewall to monitor sled track depth, providing an independent estimate of sled surface penetration variability over two surveys.
2.3 OGRE GNSS and interferometric reflectometry data
Each OGRE station features an L1/L2 frequency GNSS antenna mounted on a pole above the snow (Fig. 1c). These stations span from the west of Summit Station, where the maximum estimated slope is ∼ 0.09° to near the ice divide (∼ 0.00°), where an additional station (Station 1260) was deployed in 2023. During the summer of 2024, all but the three closest stations to the ICESat-2 traverse route were decommissioned.
The OGREs collected multi-constellation data at 1 Hz during 24 h periods coinciding with the 12 h prior and the 12 h after an ICESat-2 satellite overpass at the OGRE's location. This length of period was chosen to allow sufficient convergence time for the PPP technique. These data were processed statically using CSRS-PPP with the same parameters as the kinematic dataset. The westernmost OGREs experience significant horizontal displacement at approximately 2 m yr−1 (5.5 mm d−1), which introduces additional uncertainty into the PPP solution. Nevertheless, we treat the station as static and accept the positional error from unmodeled motion. Meanwhile, Station 1260 logged data for only 3 h daily, which allowed it to run daily throughout the winter. The shorter logging period increases uncertainty in the vertical component of the PPP solutions, but we included this station in our analysis due to its unique configuration and geographic location.
To convert from the antenna height (HR) to the snow-air interface, we use the GNSS-IR technique and follow the methods of Pickell et al. (2025b) and Larson (2024). Processing parameters include restricting satellite arcs to 5–25°, removing the primary signal with a 4th order polynomial, extracting frequencies with a Lomb–Scargle method, and requiring the dominant frequency to exceed the noise floor by at least a factor of four. This produces hundreds of HR estimates distributed circularly about the instrument (Fig. 1b), incorporating all GNSS constellations at L1 and L2 frequencies. For a nominal HR of 2 m, the footprint radius is set by the centroid of the reflection point of the radio wave's first Fresnel zone at 5°, corresponding to a radial distance of about 30 m (Fig. 1b).
We then take the mean of all HR estimates () over a measurement period, and subtract it from the statically-determined vertical elevation of the antenna phase center, Zppp:
Phase center corrections to the ARP are not applied to the geodetic elevation in the CSRS-PPP platform. However, uncertainty from this omission cancels when is subtracted from the static elevation, as estimates are relative to the antenna phase center. Any remaining uncertainties that stem from the reflectometry and PPP are addressed in Sect. 3.3.
We also analyze individual HR estimates over each measurement period to determine if there is active accumulation or erosion taking place on the surface; a statistically significant temporal trend in which HR estimates change by more than 1.0 cm during a 24 h window is flagged as a potential period of significant wind redistribution, precipitation, or hoar frost events, which may influence both the ATL06 height estimate and the comparison technique.
3.1 Kinematic GPS data quality assessment
Following the methods in Siegfried et al. (2011), we assess the quality of the kinematic survey data by analyzing the scatter of positions during periods when the survey sled is stationary for 7 s or more. The median standard deviation of each of these “pseudo-static points” (PSPs) across all surveys is calculated to be 0.8 cm (n= 9353), representing the precision of each individual GPS elevation estimate. This compares similarly with a prior estimate of precision of 0.9–1.8 cm (n= 108) at Summit with a Trimble R7 (Siegfried et al., 2011).
To assess the relative accuracy of the data, we take advantage of unique surveys where the traverse is driven twice successively, allowing us to compare repeat survey data minimally affected by surface changes. For each position in the first survey, we find the nearest corresponding point from the second survey within a 5 m radius and calculate the elevation residuals. This method introduces some uncertainty due to small-scale spatial variability but avoids uncertainty from interpolation to a common location. The median residual across all points from all repeat surveys is 0.8 cm (n= 78 025), representing the relative accuracy of each GPS-derived elevation estimate. Siegfried et al. (2011) estimated a relative accuracy of 0.9 cm (n= 1059) using a similar method, and Brunt et al. (2017) estimated a relative accuracy of −0.9 to 2.6 cm (n= 1067), which closely agree despite slight differences in data processing and comparison methods.
3.2 Kinematic GPS data comparison with ICESat-2 ATL06
To assess the bias and precision of ICESat-2 ATL06 estimates, we first search for any GPS ground survey within 4 d before or after the overpass date. ICESat-2 ATL06 data are filtered to include only those with a quality flag of 0 (ATL06_quality_summary), indicating no detected quality issues with the segment. For this flag to be zero, certain photon density criteria must be met, along with low errors in surface heights: this flag is designed to conservatively ensure bad data is filtered, sometimes at the expense of flagging good data (Smith et al., 2023b). Given the study area is low-sloping and crevasse-free, we apply further constraints on estimates of the ATL06 spread by decreasing the allowable height and geolocation errors for each ATL06 elevation: h_li_sigma < 0.1 m, geo_h_sigma < 1 m. These additional filters reduce the overall number of comparisons from 1823 to 1747. The nearest GPS point within a 20 m radius of the ATL06 point location is identified and used to calculate the bias of the ICESat-2 ATL06 elevation estimate.
To assess the long-term temporal stability of ICESat-2 surface elevation biases relative to the ground-based GPS measurements, we then fit a linear model to the residuals for each beam spot. We evaluated the significance of any temporal trend based on the slope of the fitted model. Additionally, to test for systematic differences between ascending and descending orbits, we performed a two-sample t-test comparing the distributions of elevation biases for each orbit direction. We assumed normality for both sample distributions in this test.
3.3 OGRE data quality assessment
The OGRE-derived surface elevation estimate, OGREsurface consists of two components: the PPP-derived elevations, and the GNSS-IR-derived correction of that elevation to the surface (Eq. 1). Due to the unique geometry of the HR reflection locations (Fig. 1b), it is challenging to analytically quantify the uncertainty of the mean elevation estimate for a 24 h period, which is comprised of hundreds of HR estimates in different azimuthal directions throughout the period. We estimate uncertainties based on the HR mean standard error, the surface roughness estimate in the sampling domain, and a centimeter-level uncertainty for the PPP vertical solution (Eq. 2).
While PPP solutions report uncertainties at mm-level, past studies in the cryosphere confirm that this is often an underestimate (Khan et al., 2008). In this dataset, the reported 95 % (∼ 2σ) vertical uncertainties are typically 0.7 to 0.8 cm, with higher uncertainties related to shorter convergence periods. To better reflect validated performance, we chose a more conservative estimate of vertical uncertainty, σelevation, of 1.2 cm, based on crossover analysis of the same instrument–antenna configuration used in this study (Pickell and Hawley, 2024b). σreflection is the interferometric reflectometry precision, taken as 3.0 cm (Pickell et al., 2025b), and σspatial ranges from 2–9 cm based on estimates from Pickell et al. (2025b). N is the number of HR measurements for a given survey date. If we assume maximum values in Eq. (2), including a 9 cm spatial variability in surface elevation within the instrument footprint, and 200 reflectometry measurements in the 24 h period, our estimated overall precision of the combined PPP-GNSS-IR surface elevation measurement is approximately 1.4 cm.
Past studies have shown GNSS-IR-derived surface elevations are biased (Pickell et al., 2025b; Siegfried et al., 2017), and we assess this by comparing surface elevations to the kinematic GPS data when the kinematic survey passes within 20 m of the OGRE; this assessment yields a bias of −0.2 ± 5.0 cm (n= 72). We also extend the analysis from Pickell et al. (2025b) which robustly compares GNSS-IR estimates to a network of manually measured stakes distributed within the sensing footprint of an OGRE located nearby Summit Station (not included in the OGRE-ICESat-2 analysis in this study) between 2022 and 2025. We find a bias of 2.1 ± 2.9 cm (n= 125) (Fig. A1). Consequently, we correct for this bias for all OGRE surface elevation estimates, noting that seasonal differences in biases are difficult to assess and this correction may be specific to this particular instrument-antenna setup in the dry snow zone; however, the most important metric of comparison is the temporal variability between the ICESat-2 and OGRE estimates, which are not affected by this bias correction.
3.4 Comparison method: ICESat-2 and OGRE
For ATL06-OGRE comparisons, we apply the same filters described above, including filtering for a quality flag of 0 and a temporal search of 4 d (the majority of temporal offsets between ICESat-2 overpasses and OGRE data are 0 d). However, as spot 3 and 4 straddle the OGRE (Fig. 1b), we must define a larger search radius to find intersecting ICESat-2 ATL06 points at 60 m, which is greater than the 45 m across-track spacing between ATL06 beam pairs, to account for variability in ICESat-2 beam pointing. We assume a linear surface slope between each beam pair, and assess the excursion of the OGRE elevation from the linear interpolation between the beam pair. This approach will contain additional uncertainties due to topography and surface roughness variability which are unaccounted for in this interpolation, but this method will still allow us to evaluate cross-track consistency between the two laser beams and identify potential beam biases.
To assess how surface conditions influence ICESat-2 elevation retrievals, we use OGRE station data to flag days with active surface height change. We defined an active surface event as any 24 h period with a detected surface height change greater than 1.0 cm. These events may reflect wind redistribution or snowfall, both of which can affect ICESat-2 return quality. Then, we identified corresponding ICESat-2 overpasses affected by blowing snow or cloud cover using the bsnow_conf and cloud_flg_asr data fields, retaining only those classified with at least medium confidence. If the processes driving surface height change indeed affect the optical return of the laser altimeter, then these events should be reflected in corresponding ICESat-2 snow or cloud flags.
To further examine these potential environmental impacts on altimetry precision, we compared height residual distributions between days with and without blowing snow or cloud flags, and between days with elevated surface roughness (from OGRE-derived HR) and those without. We also tested for a correlation between increased residuals and increased surface roughness estimates, in addition to any correlation between ATL06 reported height uncertainties and OGRE-derived surface roughness.
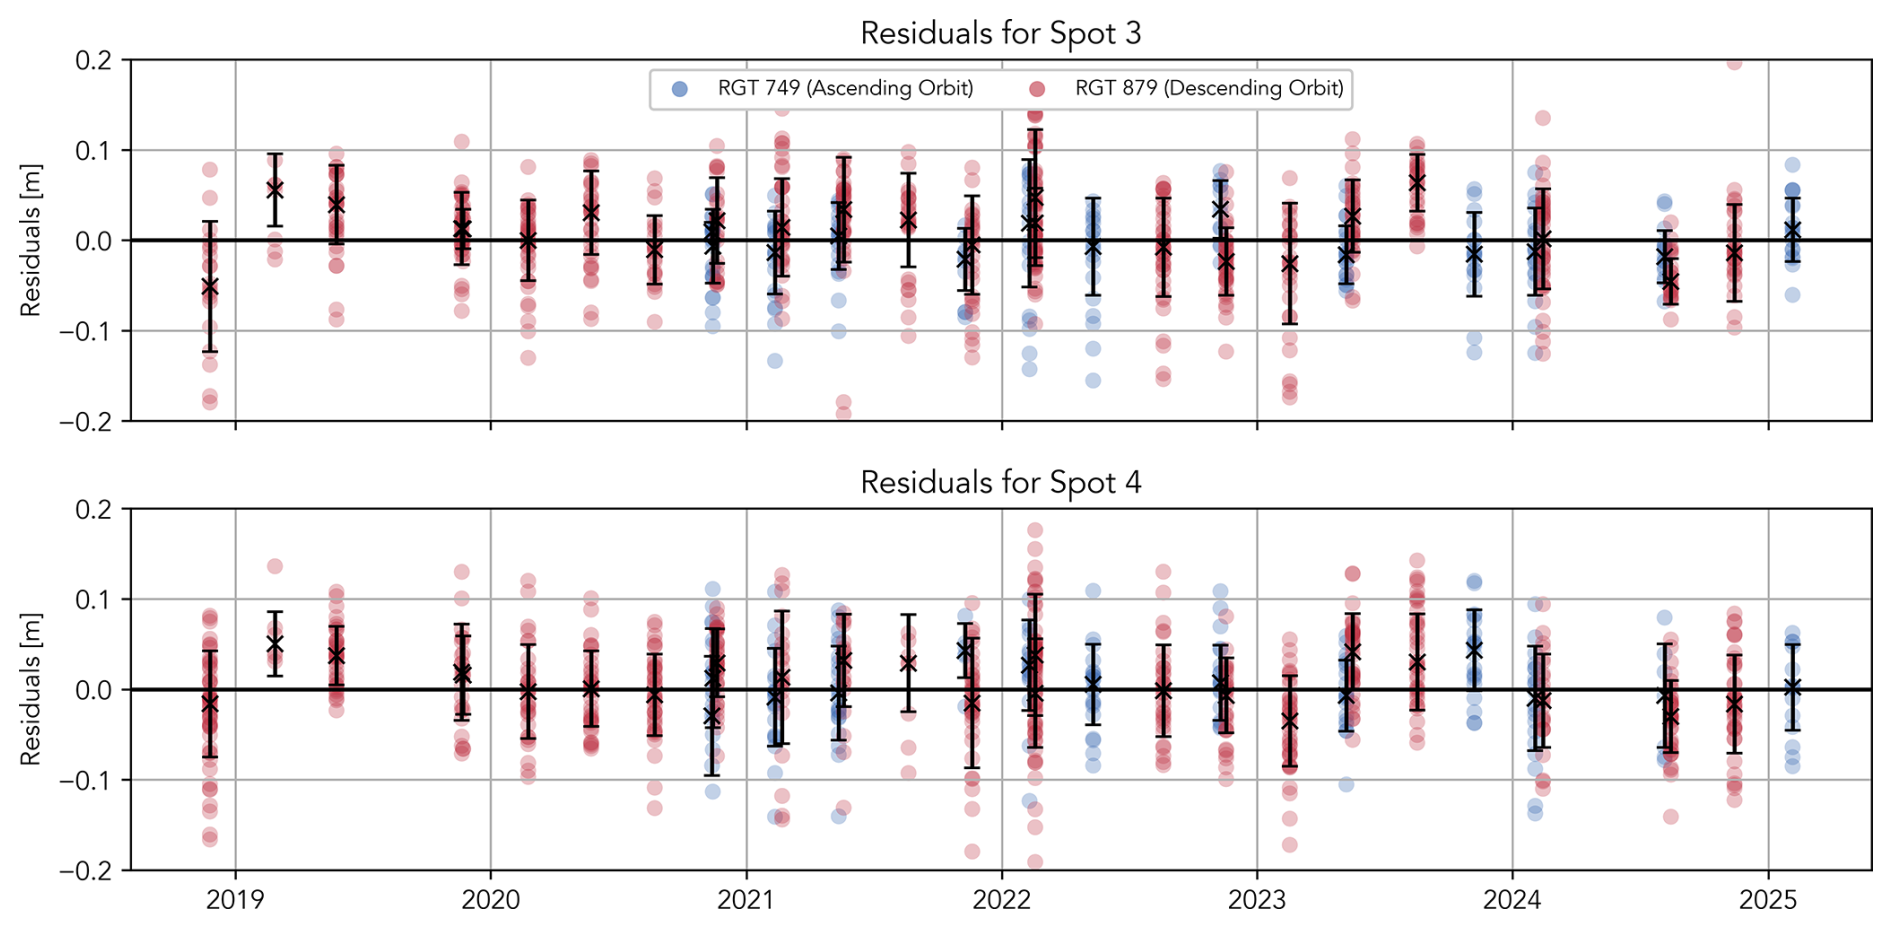
Figure 2Spot 3 and Spot 4 residuals relative to kinematic GPS data. Residuals derived from descending overpass comparisons are in red, and residuals derived from ascending comparisons are in blue. We also show the median residual between the GPS survey and ICESat-2 ATL06 heights for each overpass in black, with the vertical bars indicating uncertainties expressed as the standard deviation of the residuals from that day.
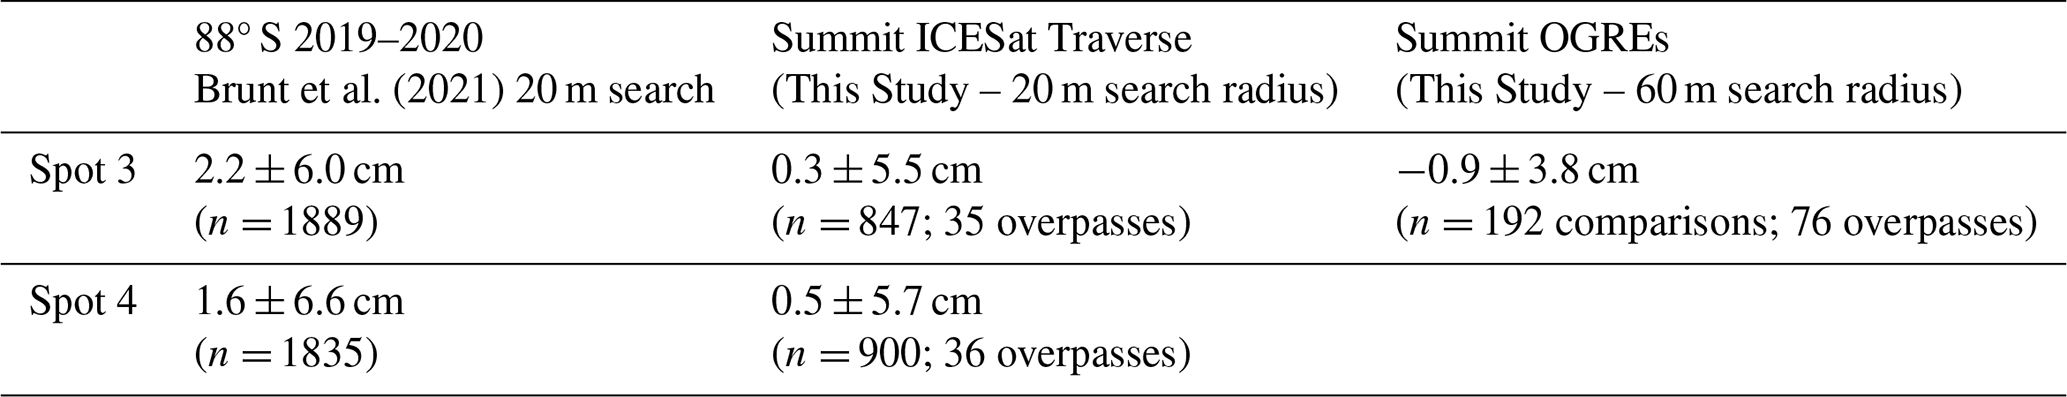
Table 1Comparison of ICESat-2 Elevation Biases from Different Validation Datasets.
4.1 ICESat-2 - kinematic traverse comparison
Between 2018 and 2024, the ground traverse team successfully surveyed over 30 overpasses, and 1747 comparisons were made individually between ATL06 points and ground-based measurements (Fig. 2). Aggregated statistics of biases relative to the GPS over all overpasses are presented in Table 1, alongside results from previous validation efforts in Antarctica. The 1σ standard deviations are taken to be the ICESat-2 precision relative to the GPS data.
To assess the long-term stability of the biases, we applied a linear fit to the ATL06-GPS residuals across the entire comparison period. No statistically significant slope was detected, indicating no measurable trend in bias over time. We also found no significant differences between ascending and descending orbits (p< 0.05), suggesting orbit direction does not affect the bias.
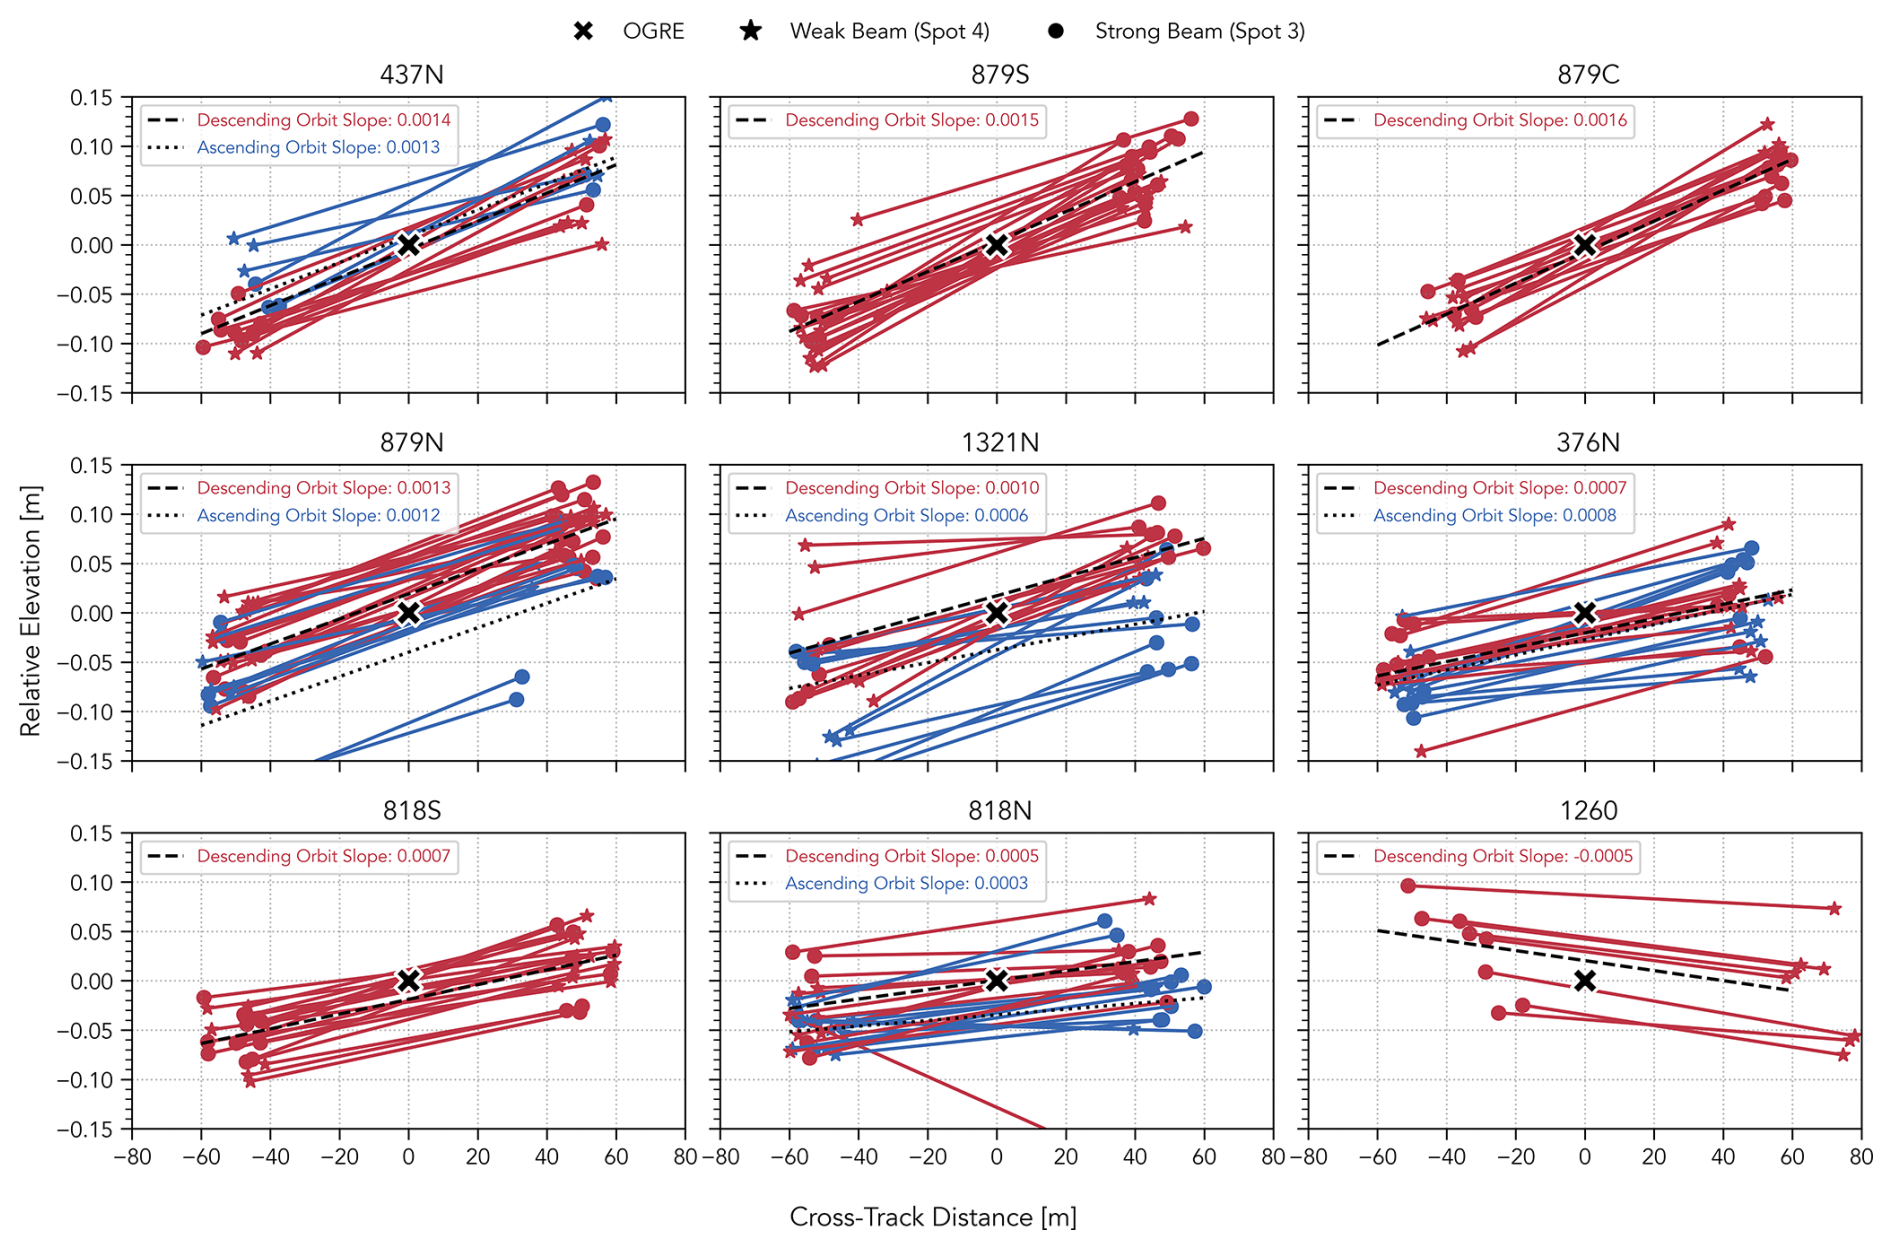
Figure 3ICESat-2 beam pair elevations relative to OGRE-derived surface elevations. Subplots are arranged by OGRE station locations, west to east from upper left to lower right. Any beam pair found within the 60 m search radius of the OGRE is plotted and colored by the orbit direction. The end-cap markers are stars for the weak beam spot and circles for the strong beam, which indicate the satellite's yaw configuration.
4.2 ICESat-2 - OGRE comparison
While the ICESat-2 ground traverse can intersect at most 10 overpasses in a year (tracks 879 or 749 are repeated every 91 d), the OGRE network covers 11 unique RGTs, allowing for dozens of comparisons in a year. Over the study period, 76 overpasses took place, from which 192 Spot 3/Spot 4 beam pairs fall within the 60 m search radius of the OGREs, producing a median bias of −0.9 ± 3.8 cm (n= 192) (Table 1, Fig. 3). Over this shorter period, a larger difference in biases between ascending and descending orbits is observed; surface estimates from ascending tracks are −2.3 ± 4.3 cm (n= 51) compared to −0.5 ± 3.3 cm (n= 141) for the descending tracks, which is statistically significant. No statistical differences are observed in the slope estimates when the strong and weak beams switch sides relative to the OGRE, which would arise if one beam was significantly more biased than the other.
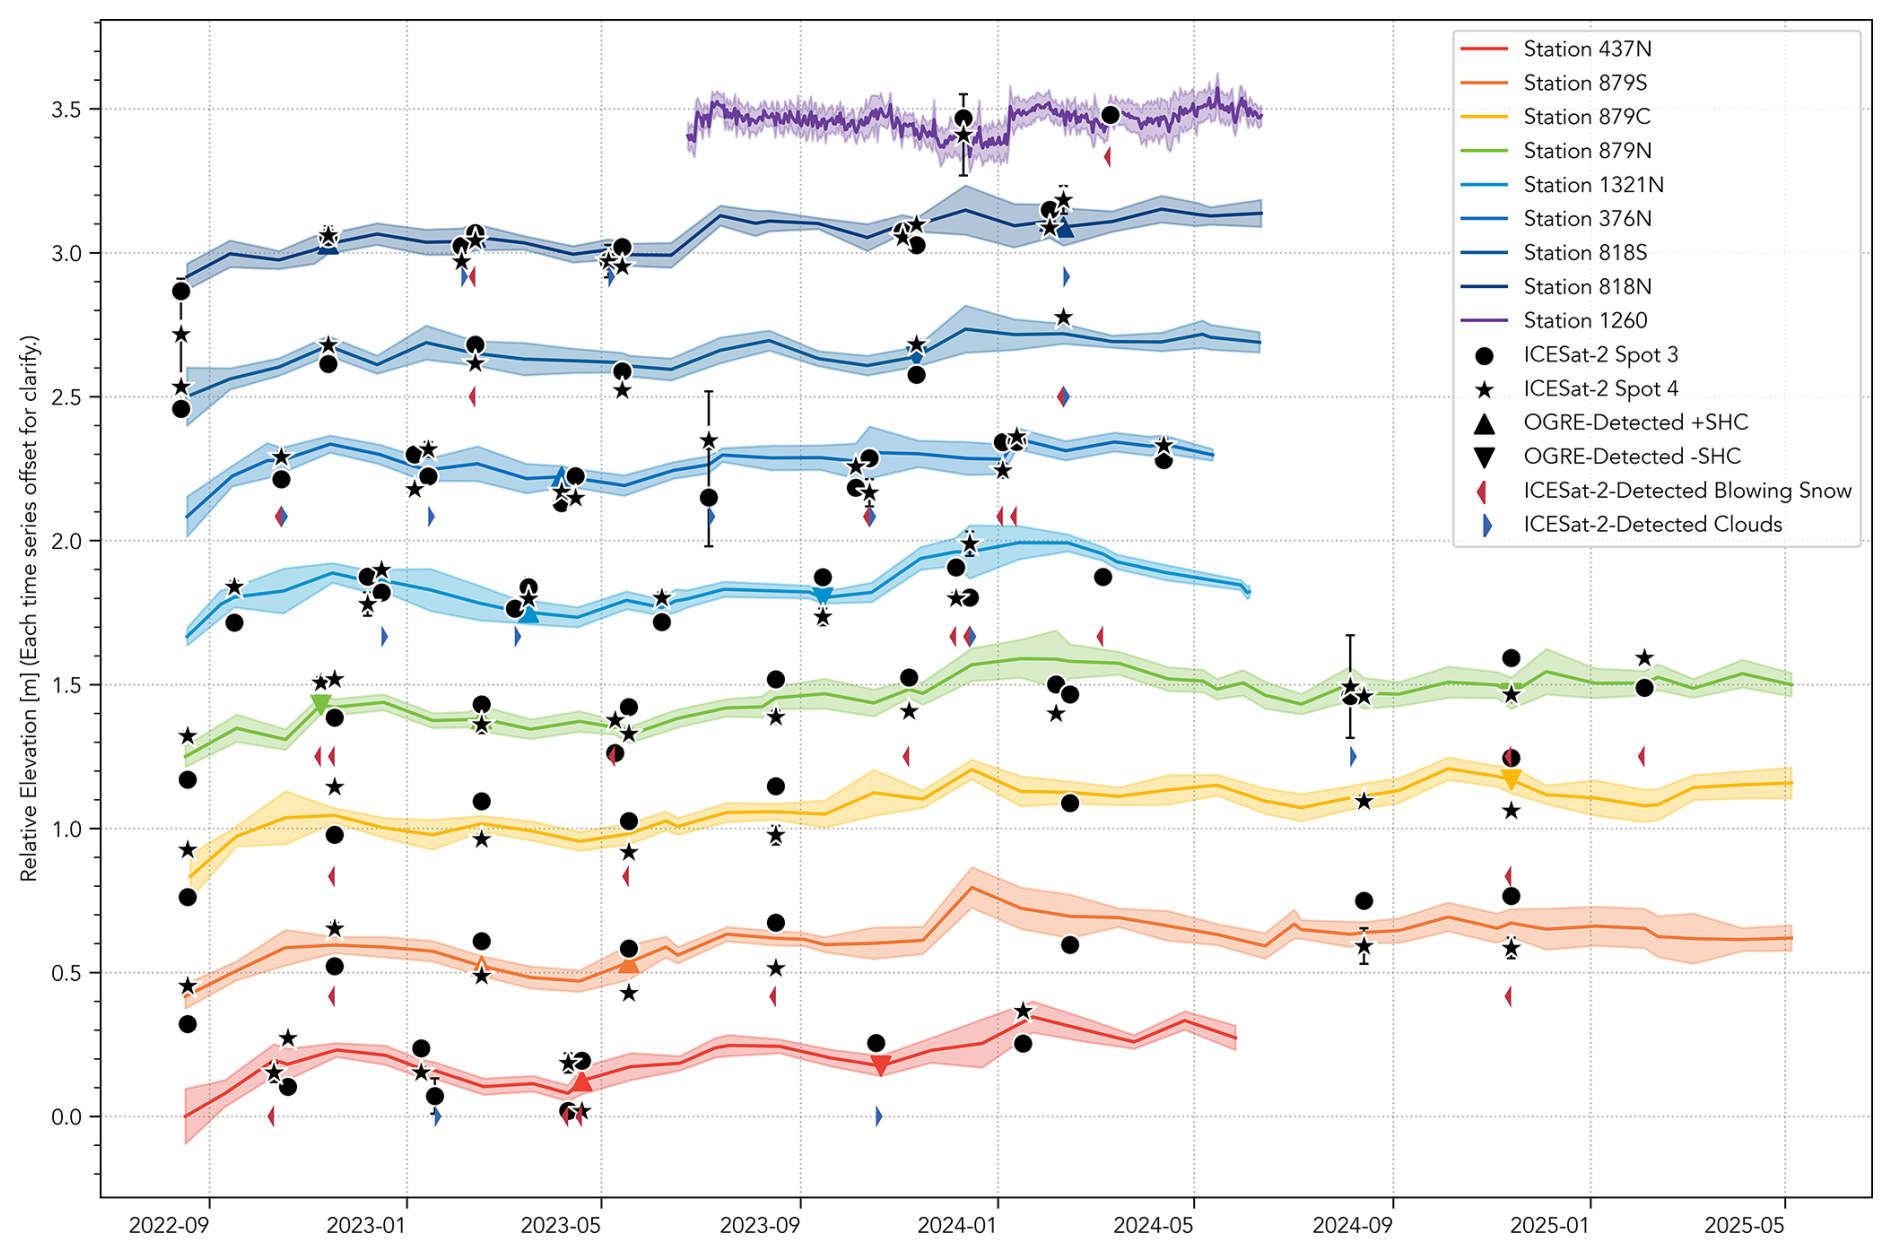
Figure 4Time series of OGRE surface elevations compared to adjacent ATL06 surface elevations. Each OGRE time series is vertically offset by +0.4 m for clarity and annotated to indicate periods of active positive or negative surface height change (SHC) corresponding to ICESat-2 overpasses. The 1σ shaded regions surrounding each OGRE time series represent the spread in HR estimates, which are influenced in part by surface roughness. Elevations and uncertainties are derived from monthly or semimonthly estimates (or daily estimates for Station 1260), but are connected with lines for visual continuity. ICESat-2 elevations falling within each hemispherical footprint of each OGRE station are averaged together, and the error bars are taken to be the spread in these data, or in the case of only a single elevation, the ATL06 estimated error of that point. Each overpass is annotated with a marker when blowing snow or clouds were detected.
For the assessment of potential environmental influences on ICESat-2 data quality, we first identified 14 d in which OGRE-detected surface height changes were greater than 1.0 cm. Meanwhile, blowing snow or cloud cover was detected by ICESat-2 flags on 23 d, but only 4 of these coincided with days when OGREs detected surface height change (Fig. 4). Furthermore, when comparing ICESat-2 residuals between flagged and unflagged days (i.e., cloudy or blowing snow vs. clear-sky), we found no significant differences in the elevation biases. Similarly, we observed no relationship between OGRE-derived surface roughness and ATL06 height uncertainty (h_li_sigma), the propagated measurement of error for ATL06 measurements.
Temporal biases or long-term trends in altimetry performance can affect mass balance studies (Siegfried et al., 2011). However, the absence of a clear temporal trend in our comparison data indicates ICESat-2 altimetry consistency beyond its original 3 year mission. Meanwhile, the correlation between each overpass median bias for the two spots is r= 0.64 (p< 0.01), suggesting that the biases are influenced by the same physical or instrumental effects. Other sources of variability in biases may stem from time-dependent volumetric/subsurface scattering of the beams, though in interior regions, this effect on ATL06 estimates is likely under a centimeter (Smith et al., 2019, 2025). Rain events, thick hoar frost, and potential seasonal differences between winter and summer snowpack are not captured by the ATL06 algorithm. Furthermore, atmospheric forward scattering increases in the presence of clouds or blowing snow, but this effect is not corrected during ATL06 processing (Smith et al., 2019) and our results do not indicate this effect is detectable.
Uncertainties also arise from temporal and spatial mismatches between satellite and ground data. The temporal offset between ICESat-2 overpasses and the kinematic survey introduces surface elevation errors, but reducing the temporal search to a ± 12 h period does not significantly change our results. The median bias and precision becomes −0.1 ± 5.9 cm for Spot 3 and 0.2 ± 5.7 cm for Spot 4 (compared to 0.3 and 0.5 cm originally), while the overall number of residuals is reduced by nearly 50 %. Spatial effects are tested by expanding the search radius to 40 m, yielding biases of 0.0 ± 6.0 cm (n= 1719) and 0.2 ± 6.3 cm (n= 1782) for Spot 3 and 4, respectively. The small lowering of the ICESat-2 ATL06 surface relative to the kinematic traverse is accompanied by a larger spread in the precision estimate. More GPS points with the larger radius may better capture a spatially representative and similar surface to the ATL06 footprint, but also increase the uncertainty due to the expanded spatial search area.
With static OGRE data, temporal uncertainty is largely eliminated because the measurements straddle the overpass time. Instead, precision is more affected by spatial factors. For example, when the search radius is expanded to 100 m, the bias remains stable (−0.9 cm), but the precision estimate decreases to ± 4.5 cm (n= 577). With the OGRE data, we also observe a statistically significant difference in orbit-based biases between the ascending and descending tracks within the OGRE comparison time frame. Luthcke et al. (2005) and Neumann et al. (2019) link potential differences in orbit determination and related parameters to short-term biases in photon estimation and geolocation. However, these effects may average out over time, appearing random on longer timescales, consistent with the absence of a temporal trend in our kinematic survey results. Unique to the GNSS-IR method, the sensing footprint shrinks as the pole becomes buried, potentially increasing the sensitivity to localized topography or surface roughness, thereby influencing the stability and representativeness of the derived elevation. There may also be unresolved biases due to radio shadowing or seasonal effects that warrant further investigation (Appendix A). We note, however, that these unresolved biases do not affect our core results: the variability between ICESat-2 and OGRE measurements (± 3.8 cm) is small, and it is this consistently low scatter – rather than the exact magnitude of the bias – that demonstrates the robustness of the comparison.
We also test for environmental effects. Herzfeld et al. (2021) show that ICESat-2 is capable of detecting blowing snow and optically thick clouds, and altimetry is likewise affected by the presence of these features. Surface change in interior Greenland is often linked to blowing snow and/or clouds (Pettersen et al., 2018), and therefore we assume OGRE-detected height changes are accompanied by blowing snow and/or optically thick clouds. Separating overpasses flagged for blowing snow and/or cloudy days, or days in which the OGRE detects active surface change, does not affect bias or precision. Likewise, when we test for the effect of solar elevation angle (day versus night), no differences in residuals are found. Pickell et al. (2025b) show that GNSS-IR is sensitive to changes in surface roughness at centimeter to meter scale, which would also affect photon returns and potentially bias ICESat-2 height estimates. This sensitivity to roughness is captured by the uncertainty estimates for each static station in Fig. 4. However, we detect no significant correlation between ICESat-2 biases and surface roughness over this period. The lack of detectable response to environmental conditions may suggest that the ATL03 and ATL06 algorithms coupled with our outlier elimination successfully identify and filter data affected by these phenomena, and therefore do not impact our comparison results with the refined ATL06 product.
Finally, while we quantified the accuracy and precision of the GPS and GNSS measurements, correlated errors such as tropospheric or ionospheric effects remain unaccounted for (Brunt et al., 2019). Another systematic effect may also stem from the variable track Ztrack depth throughout each survey. These manual track-depth measurements (typically two per survey) provide a sparse estimate of the mean track depression, while a laser range-finder provides nearly continuous measurements along the track that allows us to assess the Gaussian variability characteristics. To investigate this, we examine the data from the downward-pointing survey sled laser over two traverses. The 1σ variability in track depths was ∼ 2.0 cm. Since only two manual measurements are typically used to estimate the mean track depth for correction, this introduces a potential bias in the GPS-derived surface elevations due to under-sampling, with an estimated standard error of ± 1.41 cm based on the laser-derived variability. This uncertainty should be propagated into any comparison with ICESat-2 surface elevations and may partially account for both the observed bias and the scatter in the residuals. OGRE surface estimates are free from this source of uncertainty.
These results highlight the complementary capabilities of kinematic traverses and static GNSS stations for evaluating ICESat-2 surface elevations. Kinematic surveys provide spatially extensive, high-accuracy reference data, but their intensive logistical requirements limit temporal coverage. Static GNSS stations, by contrast, operate autonomously at relatively low cost, and our comparisons show they achieve biases and variabilities comparable to the kinematic approach. In addition, static stations overcome key challenges of the kinematic method by eliminating the need for timed traverses or manual track depth measurements. Beyond ICESat-2, radar altimetry validation could benefit from these stations, as the interferometric reflectometry footprint is well aligned with spaceborne radar measurements. Moreover, because static stations also resolve horizontal velocity, they hold particular promise for supporting new missions such as NISAR.
The long-term campaign of ground-based GPS traverses in the interior region of Greenland shows high precision and relative accuracy, forming a robust dataset for ICESat-2 comparisons that cover the full ongoing mission lifespan. In comparing this ground-based data with ATL06 height estimates, biases are sub-1 cm and precision is better than 6.0 cm, consistent with past assessments conducted in Antarctica. Meanwhile, lower surface roughness and smaller temporal offsets between the ground surveys and overpasses in Greenland may account for small improvements in results.
We also use an autonomous method of retrieving ground-based surface elevation estimates using GNSS interferometric reflectometry with a standard GNSS receiver, mounted on a mast in the snow. The unique capabilities of this setup include the ability to retrieve surface heights temporally aligned with ICESat-2 overpasses, to eliminate the need to measure sled track depths, and to detect heightened surface roughness states and active surface height change. The resulting comparisons with this technique and ICESat-2 altimetry closely agree with the biases and precisions derived with the traverse data. Moreover, the high quality of the ICESat-2 surface elevation estimates led to no degradation in performance during ground-detected surface elevation change events coincident with ICESat-2 overpasses.
The cost effectiveness and geographic flexibility of static stations enable more frequent and spatially distributed ICESat-2 comparisons, providing a scalable alternative method for current and future validation efforts requiring more autonomy and year-round reliability. By combining high-precision GPS traverses with static GNSS-IR observations, these findings reinforce the high quality of ICESat-2 surface elevation data in interior Greenland and advance broader efforts to monitor cryosphere change with increased temporal and spatial resolution.
We extend the GNSS-IR bias assessment work of Pickell et al. (2025b) by using a network of 121 snow stakes surrounding a separate, statically-placed OGRE near Summit Station. Pickell et al. (2025b) found that changes in snow height detected from the OGRE most closely corresponded to the inner 36 stakes that surrounded the OGRE, spaced 8 m apart in a grid pattern. These stakes were referenced to the same datum as the OGRE antenna during the summer of 2024 to allow for direct comparisons between the GNSS reflectometry-derived height above the surface and the mean stake height above the surface.
As the stakes and the OGRE were subsequently raised later in 2024, we repeated the referencing of the stakes in 2025 to add an additional year of comparisons between the two datasets. We find the median bias between the two datasets to be −2.1 ± 2.9 (n= 125), meaning that the OGRE reflectometry estimates are smaller than the stake height measurements. Therefore, the surface as determined by the OGRE is vertically higher than the referenced stake surface by approximately 2.1 cm.
We performed an ANOVA test (F=4.82, p=0.0033) showing seasonal variation in residuals, with the wintertime period (December, January, February) having the largest residuals, and the summertime (June, July, August) having the smallest residuals. This could be due to a number of factors, but it highlights the need to continue to study the sources of bias in GNSS interferometric reflectometry. Meanwhile, snow buildup and pitting is most often observed in the wintertime in the stake forest and could bias these measurements, while human errors are possible. Thus, we do not attribute the sources of bias to either technique on seasonal timescales.
The Ice, Cloud, and land Elevation Satellite-2 (ICESat-2) data used in this paper (ATLAS/ICESat-2 L3A Land Ice Height ATL06, Version 6) are available from the National Snow and Ice Data Center (NSIDC) (https://doi.org/10.5067/ATLAS/ATL06.006, Smith et al., 2023a). The OGRE data are available at the Arctic Data Center (https://doi.org/10.18739/A2183446Q, Pickell and Hawley, 2024a). The GPS traverse data RINEX files are available on the Dartmouth Dataverse (https://doi.org/10.21989/D9/0ZOWK2, Pickell et al., 2025a).
DJP and RLH designed and executed the study and DJP wrote the manuscript, with feedback from all other authors. DF provided ICESat-2 data analysis and feedback on the manuscript. JCG and RLH conceived of the downward-looking laser study.
The contact author has declared that none of the authors has any competing interests.
Publisher's note: Copernicus Publications remains neutral with regard to jurisdictional claims made in the text, published maps, institutional affiliations, or any other geographical representation in this paper. The authors bear the ultimate responsibility for providing appropriate place names. Views expressed in the text are those of the authors and do not necessarily reflect the views of the publisher.
We thank Battelle ARO and the dedicated crew at Summit Station for the field logistics and support, and especially the science technicians who carried out the monthly traverses throughout the years.
This research has been supported by the National Aeronautics and Space Administration (grant no. 80NSSC21K1876). In addition, the development and deployment of the OGRE instrumentation was funded by the National Science Foundation Office of Polar Programs (grant no. 2028421).
This paper was edited by Kristin Poinar and reviewed by two anonymous referees.
Abdalati, W., Zwally, H. J., Bindschadler, R., Csatho, B., Farrell, S. L., Fricker, H. A., Harding, D., Kwok, R., Lefsky, M., Markus, T., Marshak, A., Neumann, T., Palm, S., Schutz, B., Smith, B., Spinhirne, J., and Webb, C.: The ICESat-2 Laser Altimetry Mission, Proceedings of the IEEE, 98, 735–751, https://doi.org/10.1109/JPROC.2009.2034765, 2010. a
Brunt, K. M., Hawley, R. L., Lutz, E. R., Studinger, M., Sonntag, J. G., Hofton, M. A., Andrews, L. C., and Neumann, T. A.: Assessment of NASA airborne laser altimetry data using ground-based GPS data near Summit Station, Greenland, The Cryosphere, 11, 681–692, https://doi.org/10.5194/tc-11-681-2017, 2017. a, b, c
Brunt, K. M., Neumann, T. A., and Larsen, C. F.: Assessment of altimetry using ground-based GPS data from the 88S Traverse, Antarctica, in support of ICESat-2, The Cryosphere, 13, 579–590, https://doi.org/10.5194/tc-13-579-2019, 2019. a, b
Brunt, K. M., Smith, B. E., Sutterley, T. C., Kurtz, N. T., and Neumann, T. A.: Comparisons of Satellite and Airborne Altimetry With Ground-Based Data From the Interior of the Antarctic Ice Sheet, Geophys. Res. Lett., 48, e2020GL090572, https://doi.org/10.1029/2020GL090572, 2021. a, b
Dahl-Jensen, T., Larsen, T. B., and Voss, P. H.: Greenland ice sheet monitoring network (GLISN): a seismological approach, GEUS Bulletin, 20, 55–58, https://doi.org/10.34194/geusb.v20.4956, 2010. a
Dibb, J. E. and Fahnestock, M.: Snow accumulation, surface height change, and firn densification at Summit, Greenland: Insights from 2 years of in situ observation, J. Geophys. Res.-Atmos., 109, https://doi.org/10.1029/2003JD004300, 2004. a
Fricker, H. A., Borsa, A., Minster, B., Carabajal, C., Quinn, K., and Bills, B.: Assessment of ICESat performance at the salar de Uyuni, Bolivia, Geophys. Res. Lett., 32, https://doi.org/10.1029/2005GL023423, 2005. a
Herzfeld, U., Hayes, A., Palm, S., Hancock, D., Vaughan, M., and Barbieri, K.: Detection and Height Measurement of Tenuous Clouds and Blowing Snow in ICESat-2 ATLAS Data, Geophys. Res. Lett., 48, e2021GL093473, https://doi.org/10.1029/2021GL093473, 2021. a
Hoffman, A. O., Maclennan, M. L., Lenaerts, J., Larson, K. M., and Christianson, K.: Amundsen Sea Embayment accumulation variability measured with global navigation satellite system interferometric reflectometry, The Cryosphere, 19, 713–730, https://doi.org/10.5194/tc-19-713-2025, 2025. a
Holden, L. D. and Larson, K. M.: Ten years of Lake Taupō surface height estimates using the GNSS interferometric reflectometry, Journal of Geodesy, 95, 74, https://doi.org/10.1007/s00190-021-01523-7, 2021. a
Howat, I. M., Smith, B. E., Joughin, I., and Scambos, T. A.: Rates of southeast Greenland ice volume loss from combined ICESat and ASTER observations, Geophys. Res. Lett., 35, https://doi.org/10.1029/2008GL034496, 2008. a
Howat, I. M., Negrete, A., and Smith, B. E.: The Greenland Ice Mapping Project (GIMP) land classification and surface elevation data sets, The Cryosphere, 8, 1509–1518, https://doi.org/10.5194/tc-8-1509-2014, 2014. a
Khan, S. A., Wahr, J., Leuliette, E., van Dam, T., Larson, K. M., and Francis, O.: Geodetic measurements of postglacial adjustments in Greenland, J. Geophys. Res.-Sol. Ea., 113, https://doi.org/10.1029/2007JB004956, 2008. a
Khan, S. A., Bamber, J. L., Rignot, E., Helm, V., Aschwanden, A., Holland, D. M., van den Broeke, M., King, M., Noël, B., Truffer, M., Humbert, A., Colgan, W., Vijay, S., and Kuipers Munneke, P.: Greenland Mass Trends From Airborne and Satellite Altimetry During 2011–2020, J. Geophys. Res.-Earth Surf., 127, e2021JF006505, https://doi.org/10.1029/2021JF006505, 2022. a
Larson, K. M.: Gnssrefl: an open source software package in python for GNSS interferometric reflectometry applications, GPS Solutions, 28, 165, https://doi.org/10.1007/s10291-024-01694-8, 2024. a
Larson, K. M. and Nievinski, F. G.: GPS snow sensing: results from the EarthScope Plate Boundary Observatory, GPS Solutions, 17, 41–52, https://doi.org/10.1007/s10291-012-0259-7, 2013. a
Larson, K. M., Gutmann, E. D., Zavorotny, V. U., Braun, J. J., Williams, M. W., and Nievinski, F. G.: Can we measure snow depth with GPS receivers?, Geophys. Res. Lett., 36, https://doi.org/10.1029/2009GL039430, 2009. a
Larson, K. M., Ray, R. D., Nievinski, F. G., and Freymueller, J. T.: The Accidental Tide Gauge: A GPS Reflection Case Study From Kachemak Bay, Alaska, IEEE Geosci. Remote Sens. Lett., 10, 1200–1204, https://doi.org/10.1109/LGRS.2012.2236075, 2013. a
Larson, K. M., MacFerrin, M., and Nylen, T.: Brief Communication: Update on the GPS reflection technique for measuring snow accumulation in Greenland, The Cryosphere, 14, 1985–1988, https://doi.org/10.5194/tc-14-1985-2020, 2020. a
Luthcke, S. B., Rowlands, D. D., Williams, T. A., and Sirota, M.: Reduction of ICESat systematic geolocation errors and the impact on ice sheet elevation change detection, Geophys. Res. Lett., 32, https://doi.org/10.1029/2005GL023689, 2005. a
Magruder, L., Neumann, T., and Kurtz, N.: ICESat-2 Early Mission Synopsis and Observatory Performance, Earth and Space Science, 8, e2020EA001555, https://doi.org/10.1029/2020EA001555, 2021. a
Markus, T., Neumann, T., Martino, A., Abdalati, W., Brunt, K., Csatho, B., Farrell, S., Fricker, H., Gardner, A., Harding, D., Jasinski, M., Kwok, R., Magruder, L., Lubin, D., Luthcke, S., Morison, J., Nelson, R., Neuenschwander, A., Palm, S., Popescu, S., Shum, C., Schutz, B. E., Smith, B., Yang, Y., and Zwally, J.: The Ice, Cloud, and land Elevation Satellite-2 (ICESat-2): Science requirements, concept, and implementation, Remote Sens. Environ., 190, 260–273, https://doi.org/10.1016/j.rse.2016.12.029, 2017. a, b
Natural Resources Canada (NRCan): Canadian Spatial Reference System Precise Point Positioning (CSRS-PPP), Natural Resources Canada, https://webapp.csrs-scrs.nrcan-rncan.gc.ca/geod/tools-outils/ppp.php (last access: 21 May 2025), 2025. a
Neumann, T. A., Martino, A. J., Markus, T., Bae, S., Bock, M. R., Brenner, A. C., Brunt, K. M., Cavanaugh, J., Fernandes, S. T., Hancock, D. W., Harbeck, K., Lee, J., Kurtz, N. T., Luers, P. J., Luthcke, S. B., Magruder, L., Pennington, T. A., Ramos-Izquierdo, L., Rebold, T., Skoog, J., and Thomas, T. C.: The Ice, Cloud, and Land Elevation Satellite – 2 mission: A global geolocated photon product derived from the Advanced Topographic Laser Altimeter System, Remote Sens. Environ., 233, 111325, https://doi.org/10.1016/j.rse.2019.111325, 2019. a, b
Pettersen, C., Bennartz, R., Merrelli, A. J., Shupe, M. D., Turner, D. D., and Walden, V. P.: Precipitation regimes over central Greenland inferred from 5 years of ICECAPS observations, Atmos. Chem. Phys., 18, 4715–4735, https://doi.org/10.5194/acp-18-4715-2018, 2018. a
Pickell, D. and Hawley, R.: An East-West Network of Twelve Global Navigation Satellite System (GNSS) Stations in the Summit Region of Greenland: RINEX Data, 2022–2025, Arctic Data Center [data set], https://doi.org/10.18739/A2183446Q, 2024a. a
Pickell, D. J. and Hawley, R. L.: Performance characterization of a new, low-cost multi-GNSS instrument for the cryosphere, J. Glaciol., 70, e41, https://doi.org/10.1017/jog.2023.97, 2024b. a, b
Pickell, D. J., Hawley, R. L., Brunt, K. M., Burkhart, J. F., Dorsi, S. W., McConnell, J. R., Neumann, T. A., and Pettit, J.: ICESat/ICESat-2 Traverse: Monthly GPS Surface Elevation Data at Summit Station, Greenland, Dartmouth Dataverse, V1 [data set], https://doi.org/10.21989/D9/0ZOWK2, 2025a. a
Pickell, D. J., Hawley, R. L., and LeWinter, A.: Spatiotemporal patterns of accumulation and surface roughness in interior Greenland with a GNSS-IR network, The Cryosphere, 19, 1013–1029, https://doi.org/10.5194/tc-19-1013-2025, 2025b. a, b, c, d, e, f, g, h, i, j
Schröder, L., Richter, A., Fedorov, D. V., Eberlein, L., Brovkov, E. V., Popov, S. V., Knöfel, C., Horwath, M., Dietrich, R., Matveev, A. Y., Scheinert, M., and Lukin, V. V.: Validation of satellite altimetry by kinematic GNSS in central East Antarctica, The Cryosphere, 11, 1111–1130, https://doi.org/10.5194/tc-11-1111-2017, 2017. a
Schutz, B. E., Zwally, H. J., Shuman, C. A., Hancock, D., and DiMarzio, J. P.: Overview of the ICESat Mission, Geophys. Res. Lett., 32, https://doi.org/10.1029/2005GL024009, 2005. a
Siegfried, M. R., Hawley, R. L., and Burkhart, J. F.: High-Resolution Ground-Based GPS Measurements Show Intercampaign Bias in ICESat Elevation Data Near Summit, Greenland, IEEE Transactions on Geoscience and Remote Sensing, 49, 3393–3400, https://doi.org/10.1109/TGRS.2011.2127483, 2011. a, b, c, d, e
Siegfried, M. R., Medley, B., Larson, K. M., Fricker, H. A., and Tulaczyk, S.: Snow accumulation variability on a West Antarctic ice stream observed with GPS reflectometry, 2007–2017, Geophys. Res. Lett., 44, 7808–7816, https://doi.org/10.1002/2017GL074039, 2017. a, b
Smith, B., Fricker, H. A., Holschuh, N., Gardner, A. S., Adusumilli, S., Brunt, K. M., Csatho, B., Harbeck, K., Huth, A., Neumann, T., Nilsson, J., and Siegfried, M. R.: Land ice height-retrieval algorithm for NASA's ICESat-2 photon-counting laser altimeter, Remote Sens. Environ., 233, 111352, https://doi.org/10.1016/j.rse.2019.111352, 2019. a, b, c
Smith, B., Adusumilli, S., Csathó, B. M., Felikson, D., Fricker, H. A., Gardner, A. S., Holschuh, N., Lee, J., Nilsson, J., Paolo, F., Siegfried, M. R., Sutterley, T., and the ICESat-2 Science Team: ATLAS/ICESat-2 L3A Land Ice Height. (ATL06, Version 6), Boulder, Colorado USA, NASA National Snow and Ice Data Center Distributed Active Archive Center [data set], https://doi.org/10.5067/ATLAS/ATL06.006, 2023a. a
Smith, B., Hancock, D., Harbeck, K., Roberts, L., Neumann, T., Brunt, K., Fricker, H., Gardner, A., Siegfried, M., Adusumilli, S., Csatho, B., Holschuh, N., Nilsson, J., Paolo, F., and Felikson, D.: Ice, Cloud, and Land Elevation Satellite (ICESat-2) Project Algorithm Theoretical Basis Document (ATBD) for Land Ice Along-Track Height Product (ATL06), version 6, NASA National Snow and Ice Data Center Distributed Active Archive Center [data set], https://doi.org/10.5067/VWOKQDYJ7ODB, 2023b. a
Smith, B. E., Medley, B., Fettweis, X., Sutterley, T., Alexander, P., Porter, D., and Tedesco, M.: Evaluating Greenland surface-mass-balance and firn-densification data using ICESat-2 altimetry, The Cryosphere, 17, 789–808, https://doi.org/10.5194/tc-17-789-2023, 2023c. a
Smith, B. E., Studinger, M., Sutterley, T., Fair, Z., and Neumann, T.: Understanding biases in ICESat-2 data due to subsurface scattering using Airborne Topographic Mapper waveform data, The Cryosphere, 19, 975–995, https://doi.org/10.5194/tc-19-975-2025, 2025. a
Sørensen, L. S., Simonsen, S. B., Nielsen, K., Lucas-Picher, P., Spada, G., Adalgeirsdottir, G., Forsberg, R., and Hvidberg, C. S.: Mass balance of the Greenland ice sheet (2003–2008) from ICESat data – the impact of interpolation, sampling and firn density, The Cryosphere, 5, 173–186, https://doi.org/10.5194/tc-5-173-2011, 2011. a
Zwally, H. J., Li, J., Brenner, A. C., Beckley, M., Cornejo, H. G., DiMarzio, J., Giovinetto, M. B., Neumann, T. A., Robbins, J., Saba, J. L., Yi, D., and Wang, W.: Greenland ice sheet mass balance: distribution of increased mass loss with climate warming; 2003–07 versus 1992–2002, J. Glaciol., 57, 88–102, https://doi.org/10.3189/002214311795306682, 2011. a
- Abstract
- Introduction
- Data
- Data quality assessment and comparison methods
- Results
- Discussion
- Conclusions
- Appendix A: Analysis of absolute bias of GNSS-IR technique for surface altimetry validation
- Data availability
- Author contributions
- Competing interests
- Disclaimer
- Acknowledgements
- Financial support
- Review statement
- References