
the Creative Commons Attribution 4.0 License.
the Creative Commons Attribution 4.0 License.
 | 31 Aug 2026
Wet snow avalanche preconditions from Sentinel-1 multi-track composites
Gwendolyn Dasser
Valentin T. Bickel
Marius Rüetschi
Mylène Jacquemart
Mathias Bavay
Elisabeth Hafner-Aeschbacher
Alec van Herwijnen
David Small
Andrea Manconi
Information about snowpack at high spatio-temporal resolution is important for the timely identification of conditions favouring snow avalanche release. However, such information is often available only at specific instrumented locations. Spaceborne synthetic aperture radar (SAR) sensors can facilitate the acquisition of such information over large areas and in remote and challenging terrain. In this work, we evaluate the use of European Space Agency's (ESA) Copernicus Sentinel-1 (S1) SAR multi-track composites to monitor snowpack wetness evolution. We focus on a study area of 400 km2 around Davos, Switzerland, where comprehensive in-situ information are available for validation of remotely sensed snowpack conditions. We found statistically relevant anticorrelation between S1 SAR backscatter decrease in both polarisations and increase in modelled liquid water content (VV: −0.42, VH: −0.38) and modelled runoff (VV: −0.44, VH: −0.49). We calculate a wet snow ratio (0 referring to dry, 1 to fully wet snowpack conditions) relying on dual-polarisation S1 backscatter time series. By comparing our indicator against the SAR Wet Snow (SWS) products, openly available from the Copernicus Land Monitoring Service, we found clear benefit in terms of spatial performance. We also compare our wet snow ratio time series to a unique catalogue of snow avalanche, aiming to identify conditions that may precede an increase in wet snow avalanche activity. We found a clear transition from dry snow avalanche dominated to wet snow avalanche dominated conditions when the S1 derived wet snow ratio reaches values of 0.17, while at 0.35 only wet snow avalanche were reported. Our results suggest that, despite current limitations in spatial and temporal resolution, S1 multi-track composites may assist wide area evaluation of snowpack wetness conditions, and provide additional indicatots on the initiation of wet snow avalanche release. The continued operation of the S1 mission, together with the growing availability of additional spaceborne SAR platforms, will enable increasingly accurate characterisation of snowpack conditions related to snow avalanche release. As climate warming drives a projected shift towards a higher proportion of wet relative to dry snow avalanche activity, such capabilities will become increasingly critical for operational hazard assessment in alpine environments.
- Article
(22524 KB) - Full-text XML
- BibTeX
- EndNote


Avalanches are and will remain a major natural hazard in alpine regions, causing fatalities, infrastructure damage, and disruptions that underscore the need for reliable prediction tools. Wet snow avalanches, with their highly destructive potential, are increasing in frequency relative to dry snow avalanches (Eckert et al., 2024), yet remain difficult to predict (Hendrick et al., 2023; Mitterer and Schweizer, 2013; Baggi and Schweizer, 2009). For one, this difficulty can be attributed to the limited availability of in-situ measurements of snow conditions in the release areas (Reuter et al., 2025) as well as the incomplete understanding of how liquid water influences the mechanical properties of the snowpack. In this respect, knowledge of the spatio-temporal distribution of snowpack wetness is of major relevance for snow avalanche hazard assessment and more broadly for accurate run-off modelling (Wendleder et al., 2018; Nagler et al., 2018; Dietz et al., 2012). Currently, avalanche warning is based on information from weather forecasts, local observers, automatic weather stations and spatially distributed environmental models (e.g., gridded snowpack and meteorological models) (Hendrick et al., 2023). Temporally and spatially continuous high-resolution monitoring of snow wetting in complex and remote terrain could, therefore, help to improve the forecasting of wet snow avalanches over large spatial scales. In this regard, remotely sensed data can help overcome traditional challenges related to terrain accessibility and data continuity over space and time, to provide cost-effective methods to efficiently monitor large and remote areas.
Synthetic aperture radar (SAR) from spaceborne sensors, such as the ones onboard the European Space Agency's (ESA) Copernicus Sentinel-1 (hereafter S1), offers a promising approach to monitor the snowpack evolution at regional scales. Even though the interaction between the snowpack and the microwave signal is complex and not yet fully understood, changes in the radar backscatter are well known to provide information on snow wetting (Karbou et al., 2021; Marin et al., 2020; Truckenbrodt et al., 2019; Nagler et al., 2016). The presence of liquid water in the snowpack attenuates the radar backscatter (Marin et al., 2020; Tsai et al., 2019; Linlor, 1980). This attenuation results from changes in the scattering mechanisms and the dielectric properties of the snowpack (Murfitt et al., 2024; Singh and Varade, 2025).
The resulting decrease in the backscatter amplitude can be leveraged to detect wet snow in SAR images by comparing it with a reference image without snow or with only dry snow (Nagler and Rott, 2000). When the signal decreases below the threshold of a known “dry” reference, wet snow is assumed to be present. The combination of co- and cross-polarisation has been found to be most effective for the detection of melt onset (Darychuk et al., 2025). In comparison with ground-based measurements and with some temporal delay, indications of the moistening, ripening and runoff phases can be found within the S1 data (Marin et al., 2020). The backscatter minimum has been connected to the isothermal state of the snowpack, when connecting the S1 data to pit-measured LWC (Detre et al., 2025).
By developing a representation of detected wet snow based on elevation–time and elevation–aspect diagrams, wet snow lines (elevation where melting begins) can be derived across large spatial scales (Karbou et al., 2021, also in Li et al., 2025).
Radar-derived wet snow maps – such as the SAR Wet Snow (SWS) product (European Environment Agency, 2025) – are publicly available, but (i) they are limited to a relatively low spatial resolution of 60×60 m; and (ii) in mountainous terrains they are prone to topographic distortions caused by the oblique, right-looking viewing geometry of S1 satellites. This leads to foreshortening, layover, shadowing and a highly variable ground resolution (Small et al., 2011). Topographic effects can be minimised by producing composites of radiometrically terrain-corrected (RTC) images from ascending and descending orbits (Small et al., 2022). To address these limitations, multi-track S1 acquisitions can be combined in a way that accounts for locally varying ground resolution. The approach of generating local resolution weighted (LRW) composites makes use of multiple viewpoints on mountainous terrain to improve local resolution and reduce missing data (shadow) from an individual orbit (Small et al., 2022). This method exploits the enhanced ground resolution available on slopes oriented along the radar line of sight (backslopes). This increases resolution arises from an increased number of resolution cells per standardised ground range interval, resulting in higher spatial sampling density and, consequently, greater radiometric stability (Small et al., 2022). This allows for minimisation of outlier-effects and thereby reduces noise by applying weighted averaging using the local resolution in areas visible in multiple orbits.
The aim of our work is to assess the suitability of S1 LRW composites vs the publicly available SWS products, for the detection of wet snow conditions and to understand whether this information can be leveraged for forecasting of wet snow avalanches. To achieve this, we first evaluated the sensitivity of radar backscatter to different snow characteristics in RTC images by correlating RTC data with measured and modelled snowpack data. We then generated multi-track LRW composites at a 5×5 m resolution and applied a wet snow detection approach on a regional-scale (400 km2) in the area of Davos, Switzerland. Finally, we compared the wet snow distribution to a dataset of observed wet and dry snow avalanches and evaluated whether a transition from dry to wet snow release conditions can be identified in the wet snow maps.
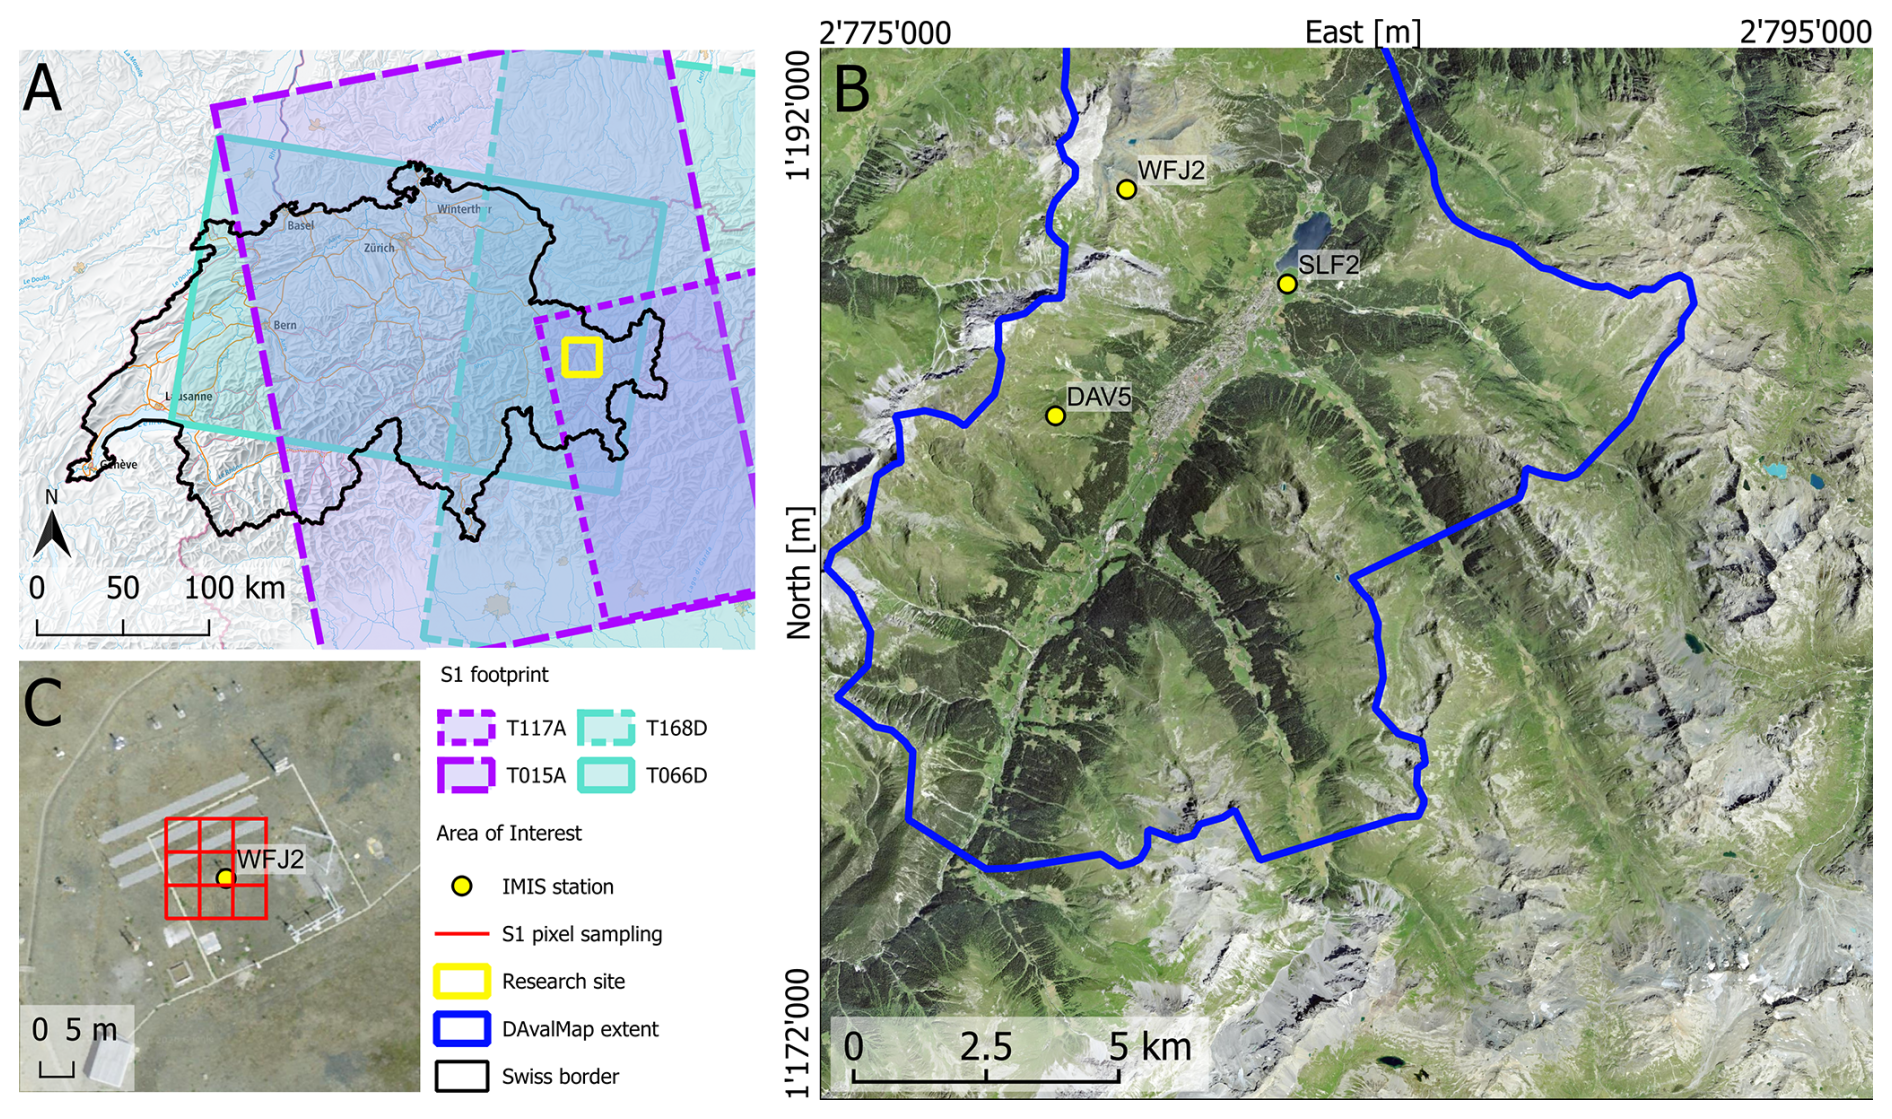
Figure 1Overview of the area of study on three scales. (A) Outline of the Sentinel-1 footprints in relation to the study site of interest (Basemap © Esri, Swiss border © swissBOUNDARIES3D). (B) Area of study (displayed in reference system CH1903+/LV95, with EPSG: 2056, Basemap © Esri), extent and location of the avalanche library (DAvalMap, blue outline (Northwards cut to study area extent)), and the IMIS stations used (yellow dots). (C) Indication of the 3×3 pixel window used to calculate the Sentinel-1 backscatter median around the corresponding IMIS station (Basemap © Google Maps).
The complex topography of the Davos region and its dense monitoring network make this area an ideal study site for alpine wet snow dynamics (see Fig. 1). The region hosts national and regional monitoring efforts, resulting in a dense network of meteorological and snow monitoring stations and the availability of long-term observational data. This unique setting has enabled numerous local studies, such as multi-season field campaigns documenting avalanche release activity (Hafner et al., 2021).
The study area covers 400 km2 with elevations that range between 1542 and 3225 m a.s.l. (according to Federal Office of Topography and Swisstopo, 2022). The site is characterized by steep, mountainous terrain and a pronounced winter season. Measured daily air temperature at the stations vary from min −27.4 °C in winter (at WFJ2 station) to max +29.3 °C in summer (SLF2 station). At WFJ2, mean daily air temperatures averaged −6.2±5.1 °C in winter and −1.6±5.0 °C in spring over the period 2018–2021 (IMIS, 2023).
3.1 In-situ automated weather station data
We used data from three automatic weather stations which are part of the network of the intercantonal measurement and information system (IMIS): SLF2 (1563 m a.s.l.), DAV5 (2315 m a.s.l.) and WFJ2 (2536 m a.s.l.), see Fig. 1. These stations provide automatic measurements every 30 min of: snow depth, air and surface temperature, wind speed and wind direction, relative humidity, reflected shortwave radiation, ground temperature, snow temperature at 25, 50 and 100 cm above the ground, and precipitation (unheated rain gauge) for SLF2 and WFJ2 (IMIS, 2023). The variables indicated with “measured” in Table 1 are the ones we consider from the IMIS station measurements for this study.
3.2 Modelled data from SNOWPACK
To compare our data with relevant snowpack parameters, we used output data from the snow cover model SNOWPACK (Bavay, 2026b). This model was developed to support an operational avalanche warning service based on IMIS station data (Lehning et al., 1999). SNOWPACK simulates the detailed stratigraphy of the snowpack based on meteorological input data. Specifically, the model uses local meteorological measurements, such as air temperature, snow depth or snow surface temperature, to predict the snow microstructure, density, temperature and liquid water content of the layers in the snowpack (parameters measured at IMIS stations mentioned above). The model produces a detailed description of snow properties including weak layer characterization (Stössel et al., 2010), phase changes, water transport in snow using a simplified model (Hirashima et al., 2010) or with full Richards Equations (Wever et al., 2014) and water vapour transport in snow (Jafari et al., 2022). SNOWPACK is used by several countries for their operational avalanche warning services (Morin et al., 2020), but also in fundamental and applied research studies. SNOWPACK is provided alongside its meteorological preprocessor MeteoIO (Bavay and Egger, 2013) and Graphical User Interface Inishell (Bavay et al., 2022) under an open source licence (LGPLv3). The whole dataset of reruns of the simulations performed for the operational avalanche warning service of Switzerland is available in Bavay (2026a).
Table 1Abbreviation table for the variables from SNOWPACK, which were used in the following tables containing the correlation variables. The brackets indicate whether the variables were measured by IMIS and then forced into the model or modelled by SNOWPACK.
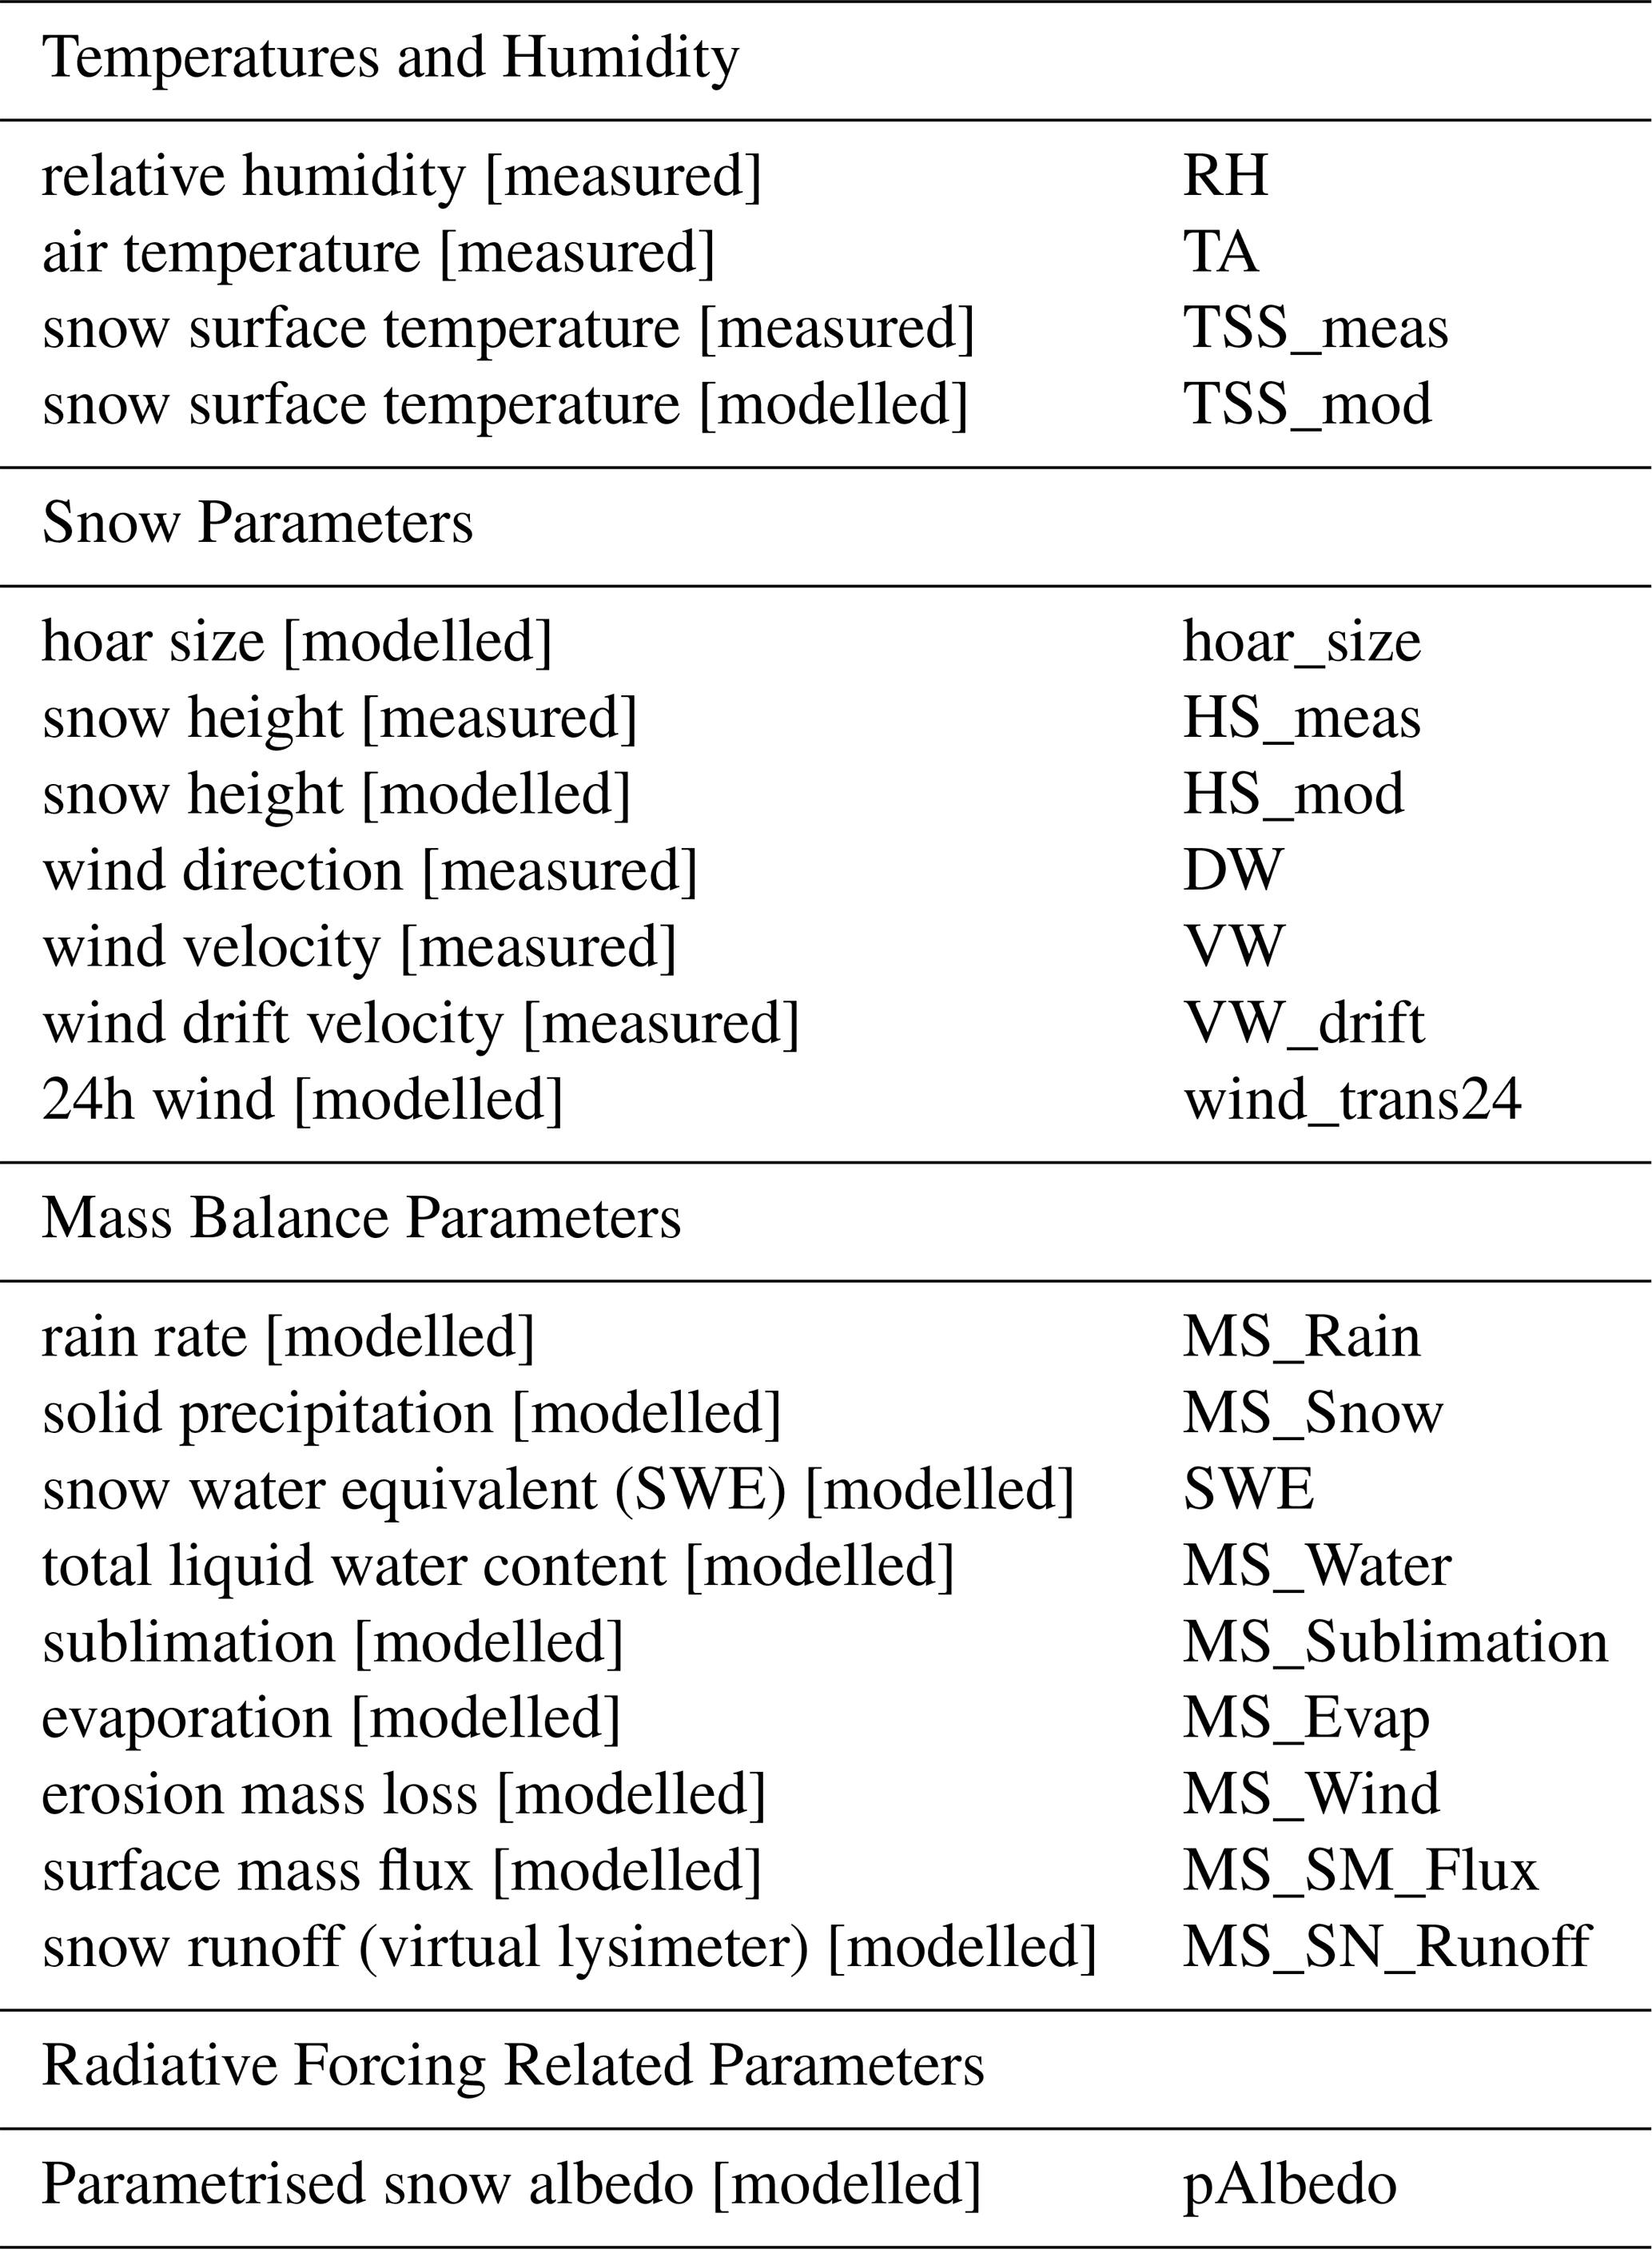
In this study, we used the output data from the SNOWPACK version of December 2022 (git version: 98a23cd, Bavay, 2026b) in an operational setup. The SNOWPACK output includes both measured data at the station, providing its meteorological forcing, as well as modelled parameters and provides data every three hours from January 2018 to August 2021. Due to a sensor failure, no SNOWPACK simulations were available at the SLF2 station for the 2018–2019 season. Table 1 shows all data provided by the model, including abbreviations and the information on which are measured at the three reference sites and which ones are modelled.
3.3 Sentinel-1 data
We used SAR data from the European Space Agency's Sentinel-1 (S1) satellites between January 2018 and August 2021. The mission provides C-band data with a central frequency of 5.405 GHz in the two polarizations vertical-vertical (VV) and vertical-horizontal (VH). Over central Europe, S1 has long had an orbital repeat cycle of six days, though this is not always maintained due to the failure of S1B in December 2021 up to the launch of S1C (European Space Agency, 2022).
We processed SAR data from the descending orbits 066 and 168 as well as the ascending orbits 015 and 117 (Fig. 1) acquired in interferometric wide (IW) swath mode. The single-look-complex (SLC) data has a native pixel spacing of ∼ 2.3 m in slant range and ∼ 14.1 m in azimuth (Bourbigot et al., 2016). Over Davos, the images were acquired at 05:34 (track 066), 05:27 (track 168), 17:15 (track 15), and 17:07 (track 117) UTC over the course of four days (in consecutive order; see Appendix Fig. A1).
A digital terrain model (DTM) provided by swisstopo with a ground sampling distance 5×5 m was used in SAR data and considered to perform aspect dependency analysis in four aspect categories (N: 315–45°, E: 45–135°, S: 135–225°, W: 225–315°) (Federal Office of Topography and Swisstopo, 2022).
Data from S1 is also the basis of the freely available Copernicus SAR Wet Snow (SWS) product. We downloaded the SWS products (version: 2025, European Environment Agency, 2025) for the period between January 2018 to July 2021 via the WEkEO platform (https://wekeo.copernicus.eu/, last access: 12 February 2026), the EU Copernicus reference service providing environmental data and virtual processing environments. The SWS dataset has a resolution of 60×60 m and is based on ground range detected (GRD) imagery, i.e. already focused SAR data, which was detected, multi-looked and projected onto an ellipsoidal model WGS84 (EUMETSAT and ECMWF and EEA and Mercator Ocean International, 2026). The data product offers classified information derived from S1 backscatter, specifically, wet snow (signal loss in comparison to stacked winter reference, class 110), dry snow, no snow or patchy snow (class 125). The product also includes pixel classes that are masked due to (i) unsuitable radar geometry, (ii) water, (iii) forest, (iv) urban area, (v) non-mountain area and no data available. We treated classes (i) to (v) as voids. We then mosaiced same day products (different footprints) to cover the entire site and when the footprints were overlapping for valid pixels (meaning class wet snow 110 or dry/no snow 125), used the latest assigned class on that day.
3.4 DAvalMap: Snow avalanche catalogue
Our snow avalanche reference was the data from the Davos Avalanche Mapping Project (DAvalMap, detailed description in Hafner et al., 2021). This inventory was created by the avalanche warning service SLF through systematic mapping of field observations within a perimeter covering roughly 180 km2 (see Fig. 1; Hafner et al., 2021). The dataset includes information on the release date, avalanche type (wet or dry snow avalanche) and the elevation zone at release. Small avalanches (50 m for slab and glide-snow avalanches, 100 m for loose snow avalanches) were generally not recorded in the catalogue, thereby setting a minimum size of avalanches within the data set.
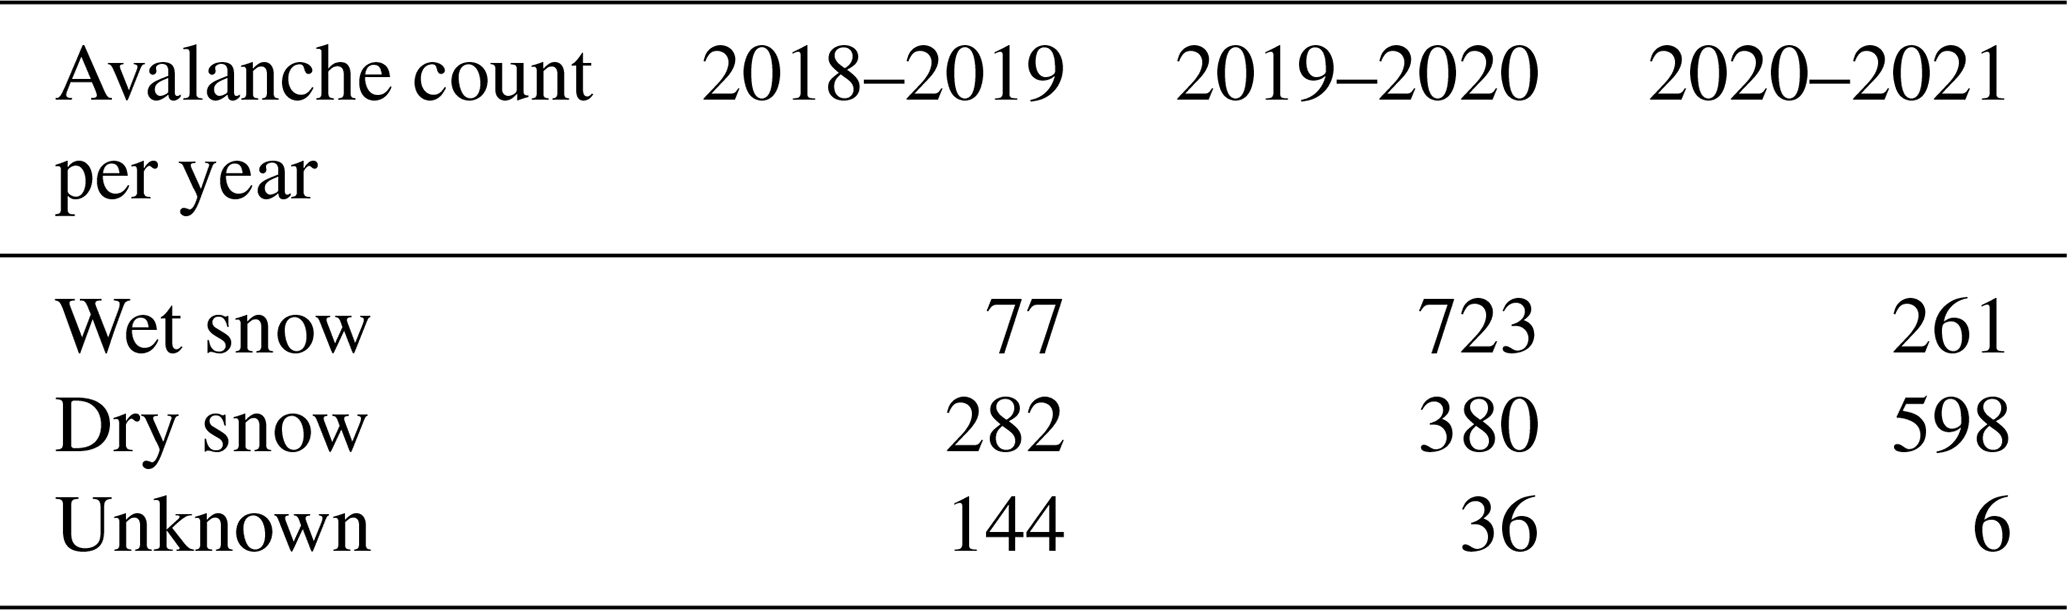
We defined avalanche conditions to be dominated by wet or dry snow avalanches, when the majority was within the corresponding category (priority to wet avalanches, when equal). In the season 2019–2020, the size restriction of the recorded avalanches was handled less strictly, also including smaller loose snow avalanches, which would have been excluded in the other years. The number of avalanches by type and season used in this work is summarised in Table 2 and the used information as a subset of the database can be found in the Supplement.
Table 2Count of avalanches from DAvalMap sorted by type and year starting 1 August.
4.1 Sentinel-1 data processing
To create LRW composites from S1 data, we first performed a radiometric terrain correction (RTC; using the terrain-flattened γ0-convention, Small, 2011) on the S1 acquisitions and then combined the data into LRW composites. These composites were calculated by applying a weighted function to the RTC images based on the local incidence angle from at least two different flight tracks (in our site we had a maximum of two descending and two ascending tracks). Weighting was applied according to the local spatial resolution in the corresponding flight track (Small, 2012). We masked out areas that lied in radar shadow in all tracks, following the processing chain by Small et al. (2011) and Small et al. (2022). In cases where information was unavailable in some tracks, i.e. lying in radar shadow, only the available orbits were considered (as in Small et al., 2022). RTC values below −30 dB were classified as noise below the sensor sensitivity threshold and were therefore not considered in the LRW calculation (Torres et al., 2012).
Images with less than 75 % of the acquired scene containing valid pixels were discarded. This resulted in 444 LRW composites: 186 entailing all tracks, 29 three-track composites, and 6 two-track composites per polarisation. Two additional dates had only one track available therefore did not improve over RTC level. The maximum timespan covered by a composite was less than 84 h.
To generate wet snow maps we applied the common approach of comparing acquisition scenes to a no-snow or dry snow reference and identified a signal loss of 2 dB as an indication for the presence of wet snow (Nagler et al., 2016). No standard approach for the selection of a reference image has yet been established, leaving space for potential differences in results (Li et al., 2025). Nagler et al. (2016) used a single image from summer, where the least amount of (melting) snow was assumed to be present in the scene. The revised version of the SWS product (European Environment Agency, 2025) uses the mean of the winter months (December, January, February) as a dry snow reference. However, when working with large elevation ranges – as is the case in our study area – even images from December, January and February can contain wet snow and “contaminate” the image. Conversely, a summer image is also likely to contain wet snow at high elevations and more likely to be affected by changes in seasonality across the imagery (e.g. vegetation related).
Therefore, rather than relying on a single image, or a purely calendar-based winter-month approach, we calculated a median backscatter value per pixel over the entire available time series (indicated in black in Fig. 2). With this approach, we account for the challenge of finding a suitable reference image, which becomes less accurate the longer the time span between the reference and acquisition becomes.
We then mapped wet snow on a pixel-by-pixel basis wherever the relative backscatter dropped below the 2 dB threshold at both polarisations. To increase robustness of the final product, we determined wet snow to be present only if it was identified in both polarisations.
4.2 Time series analysis: S1 backscatter sensitivity to snow characteristics
To evaluate the factors influencing SAR backscatter time series, we performed correlation analyses between various measured and modelled parameters over time (see Fig. 3, Appendices A4 and A5). Since single pixel analyses are prone to radar noise (e.g. speckle) and uncertainties, we tested the correlation of values recorded on a 3×3 pixel window (indicated in Fig. 1C). We used the time closest to S1 acquisition on the corresponding day, where both IMIS and SNOWPACK data was available: namely 06:00 to match descending SAR image acquisitions and 18:00 to match the ascending acquisitions (UTC+1).
For the correlation analyses we calculated Pearson's correlation coefficient and associated RMSE values, along with Spearman's rank coefficient. Pearson’s was used to assess the potential strength and direction of linear relationships, while Spearman’s captured monotonic trends between variables. To minimise the correlation coefficient bias due to the effect of over-represented numerical values (e.g. zero is used by SNOWPACK when void), correlations were only calculated during the snow cover period (defined as snow height above zero within SNOWPACK). The significance level for both tests was set to p-values below 0.05.
We assessed the time difference between the onset of the main melting season and its detection in the S1 LRW data to better quantify potential uncertainties introduced by the temporal binning inherent to using the multi-track LRW data. We defined peak melt onset as the first date on which the 3 d median runoff exceeded the runoff threshold (set to 1 kg m−2, from virtual lysimeter data in SNOWPACK). This date when the runoff exceeds the threshold, was then compared to the current or first following composite time on which wet snow was detected in the LRW time series. For example, in spring 2018 the 3 d median runoff first exceeded the threshold on 25 May; this date lies within the concurrent multi-track LRW composite (22–25 May 2018), in which wet snow was already detected (24 May 2018), corresponding to an offset of −1 d.
To quantitatively compare the S1 LRW wet snow product with the SWS dataset by taking all parts of the confusion matrix into account, we calculated Matthews Correlation Coefficient (MCC) between the two binary products over all years (similarly applied by e.g. Liu et al., 2025). Further, evident false positive wet snow detections at WFJ2 were separately quantified by calculating the frequency with which wet snow was detected, by either the multi-track LRW approach or the SWS product, when the measured snow depth at the station was zero.
4.3 Retrieval of wet snow avalanche preconditions
After mapping wet snow across the study site, its relative occurrence to dry/no snow was quantified by assessing elevation-dependent melting over time across elevation bands. Elevation bands were defined in 100 m increments from 1500 to 3000 m a.s.l. Data was binned into six day increments, starting with the first LRW per season. To focus on areas that are potential avalanche release zones we excluded areas with slopes below 28° (Bühler et al., 2018). For homogeneity in the intercomparison with the coarser resolved SWS dataset, the latter has been oversampled using nearest neighbour interpolation onto the 5×5 m grid.
For each elevation band, we computed the wet snow ratio as:
where Rwet(z) is the wet snow ratio at elevation band z, Nwet(z) is the number of wet snow pixels, and Ntotal(z) is the total number of non-void pixels in that elevation band.
By comparing the wet snow detection from S1 with the event-based snow avalanche catalogue (DAvalMap), we retrieved information on the wet snow avalanche preconditions. After discarding duplicates and data collected outside our study area from the catalogue, the avalanches were matched to the wet snow ratio (see Eq. 1) according to the elevation of the release zone and the date of release. Temporal matching to the LRW composites was performed to simulate an operational scenario, where avalanche occurrence is evaluated based on the most recent information on snowpack wetting. Avalanches were therefore assigned to the latest available LRW composite preceding their occurrence (illustrated in appendix Fig. A1).
To assess the potential for this wet snow ratio to indicate the transition from dry to wet snow avalanche dominated conditions, we computed histograms and Gaussian distributions of recorded dry and wet snow avalanches in relation to the wet snow ratio. To enable a performance comparison, this analysis was performed for both the LRW-based dataset presented here and the downloaded SWS product. We then related the dominant avalanche types to the wet snow ratio and determined the thresholds at which conditions transition from dry-dominated to wet-dominated and finally to wet snow avalanche only. The wet snow avalanche only was defined as the threshold of wet snow ratio above which wet snow ratio there were never more dry snow avalanches recorded than wet snow avalanches.
Because the SWS product does not require temporal increments as the LRW product, we were able to match the avalanches from the catalogue to near-daily increments. Avalanches that occurred when no data was provided were carried over to the next previously available date (see Appendix A1). We then extracted the thresholds from the distribution of wet snow ratios and the dominated avalanche type as before. This allowed us to compare and assess the feasibility between the two products for practice.
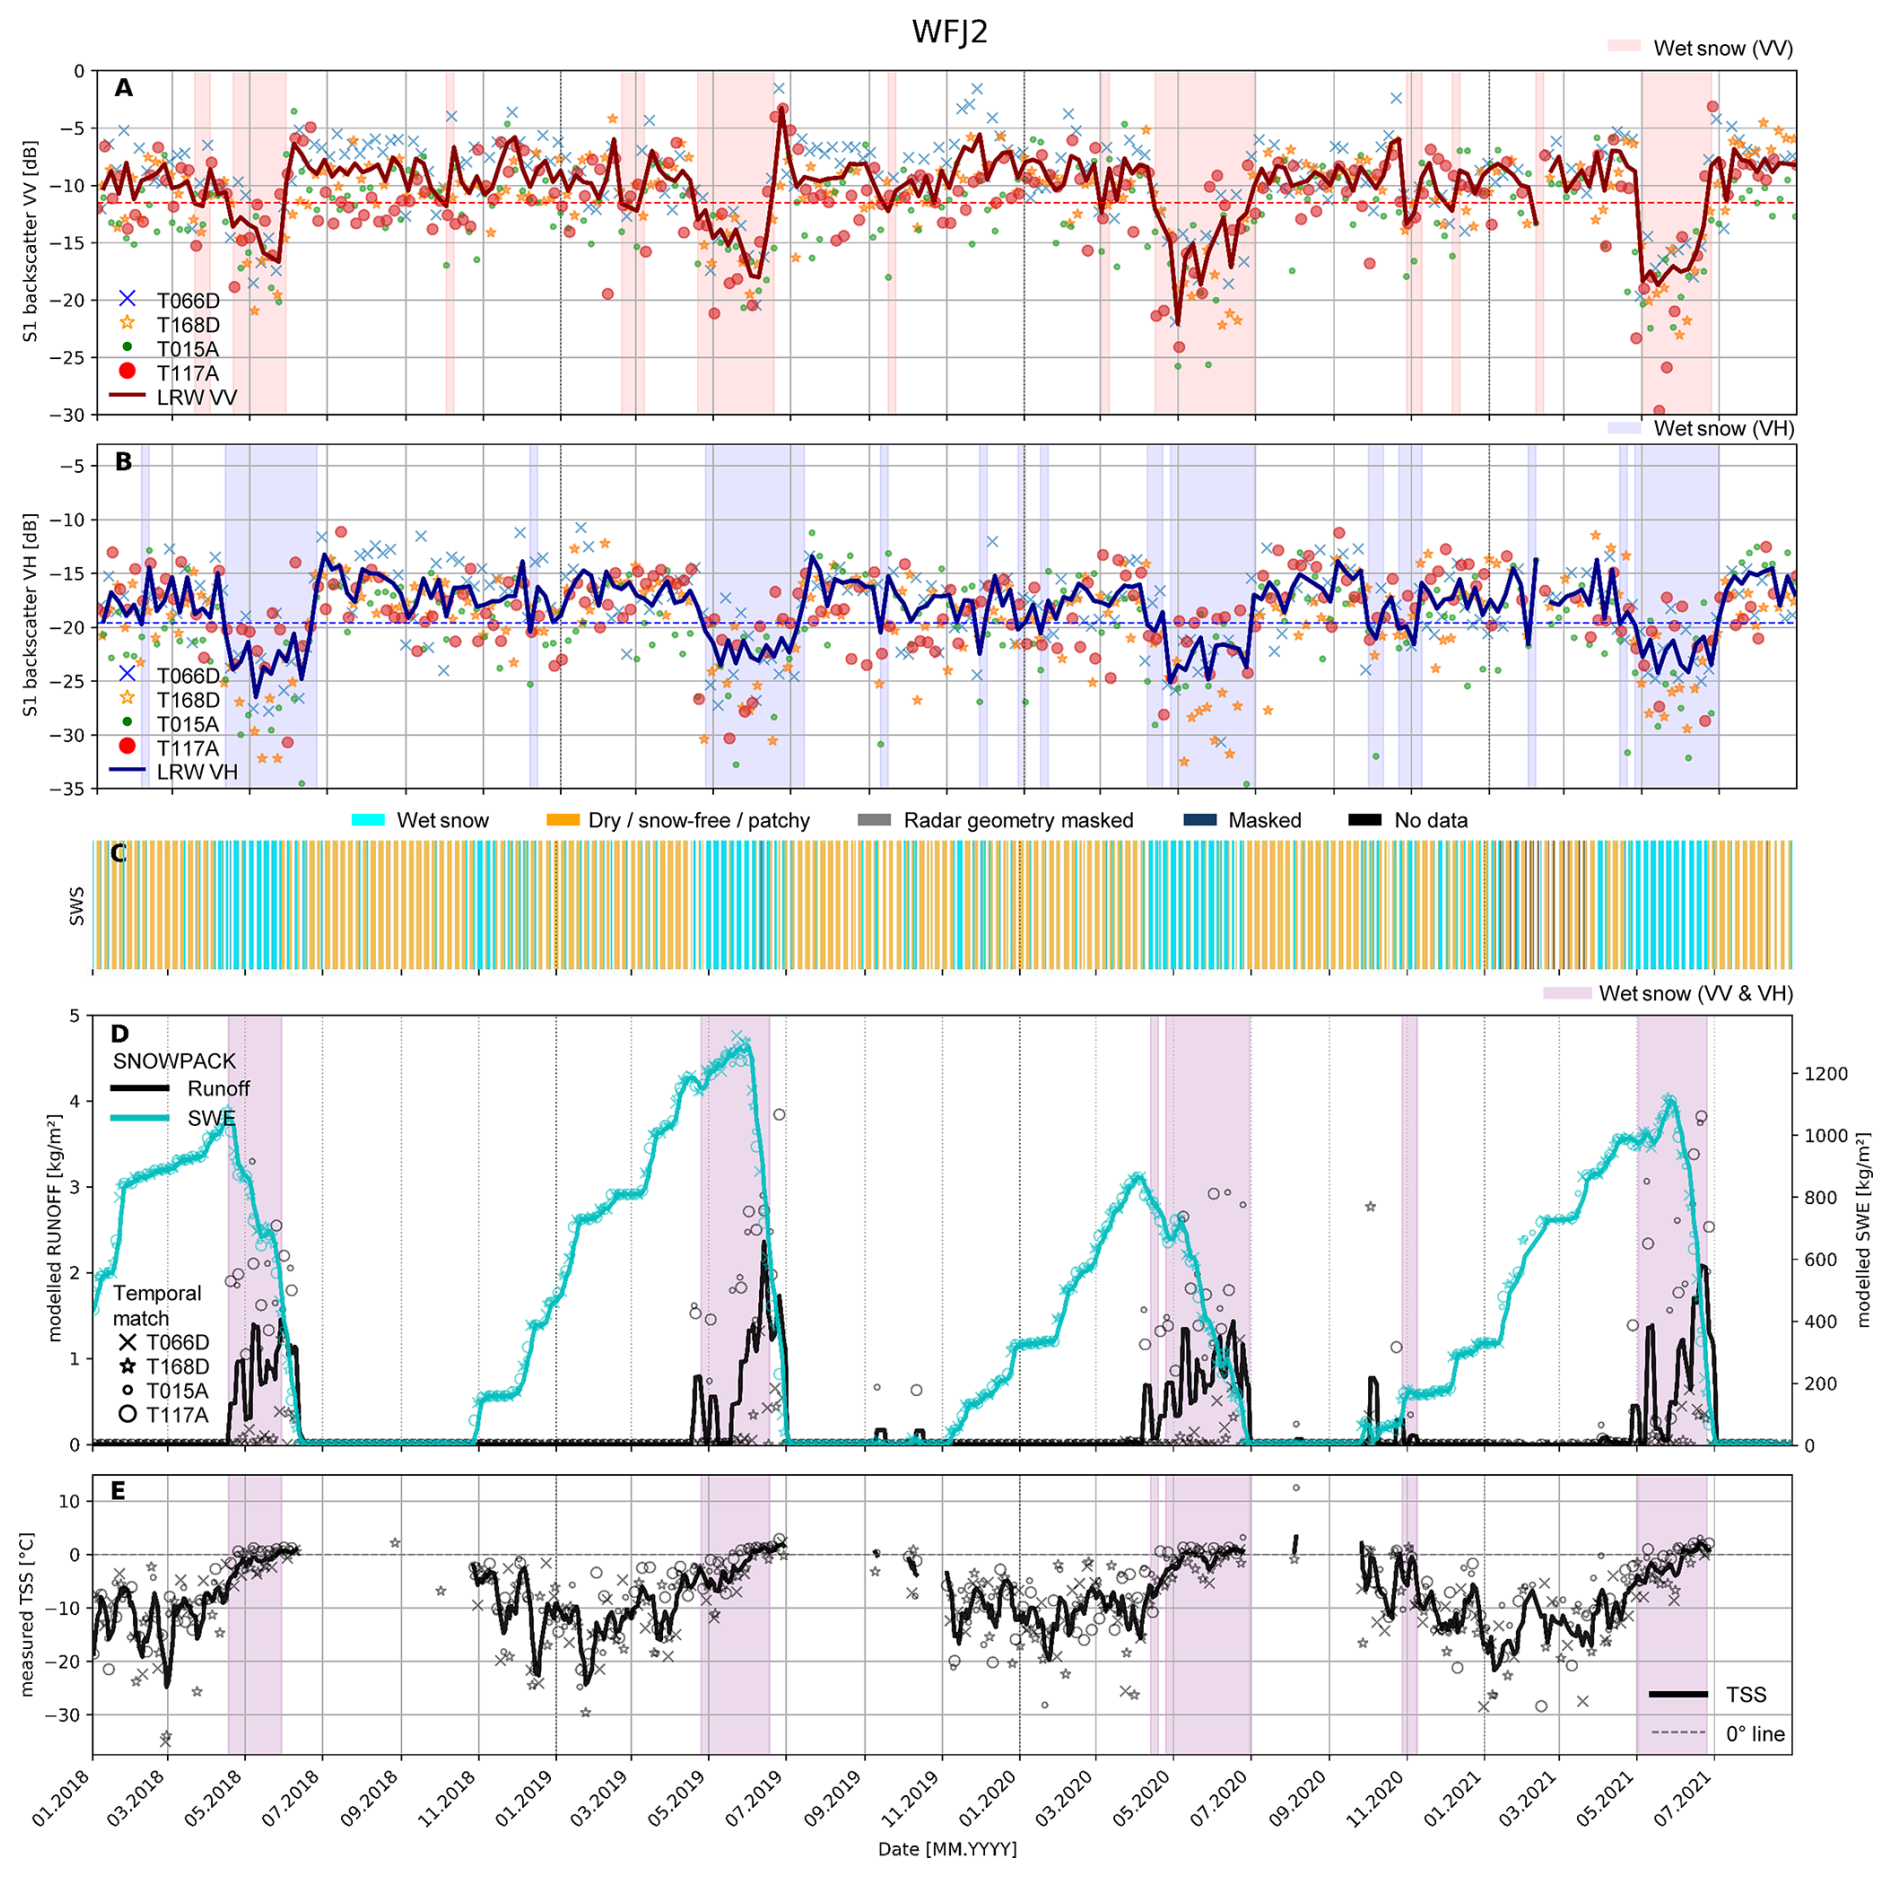
Figure 2Time series of wet snow evolution over four melting seasons from January 2018 until August 2021 at Weissfluhjoch (WFJ2). (A) and (B) show the time series extracted from the pixel within which the IMIS station is situated in (A) co- and (B) cross-polarised S1 data (contains modified Copernicus S1 data). The horizontal line indicates the time series median including the 2 dB threshold and the shading background displays the times during which the backscatter falls below this and wet snow is detected. (C) SAR Wet Snow classified layer per track over the station area (European Environment Agency, 2025). (D) Modelled time series of virtual lysimeter (MS RUNOFF) and snow water equivalent (SWE) with markers indicating the corresponding time of S1 acquisition and mean values indicated via connecting lines. Similarly, (E) shows the local measured snow surface temperature (TSS), masked to when snow height at IMIS station was measured non-zero. In (D) and (E), the applied purple shading corresponds to our wet snow combined polarisation product.
5.1 Time series analysis
In general, the LRW backscatter signal fell below the wet snow threshold slightly after runoff commenced and measured snow height began to decrease (Fig. 2). Wet snow detected by the S1 dual-polarisation approach preceded the rise of runoff above 1 kg m−2 by no more than one LRW acquisition interval (6 d) (Fig. 2: −1, +1.6, +5.1, +5.6 d delay for 2017–2018, 2018–2019, 2019–2020, and 2020–2021, respectively). Every season, backscatter in both polarisations (VV & VH) fell 3 dB or more below the median in late spring/early summer, coincident with the onset of snow melt at high elevations and temperatures around the melting point (see Fig. 2E). Sporadic decreases of backscatter during periods where SNOWPACK data did not suggest the presence of wet snow were observed in both polarisations in all years. However, for all such spurious events the drop only occurred in one polarisation but not in the other. Overall, the combination of VV and VH polarisation (indicated by overlaid shadings in Fig. 2D and E) shortened the time-span of detected wet snow and resulted in somewhat delayed detections (especially in season 2020–2021), but minimised the potentially false detections during periods when snow melt likely did not occur.
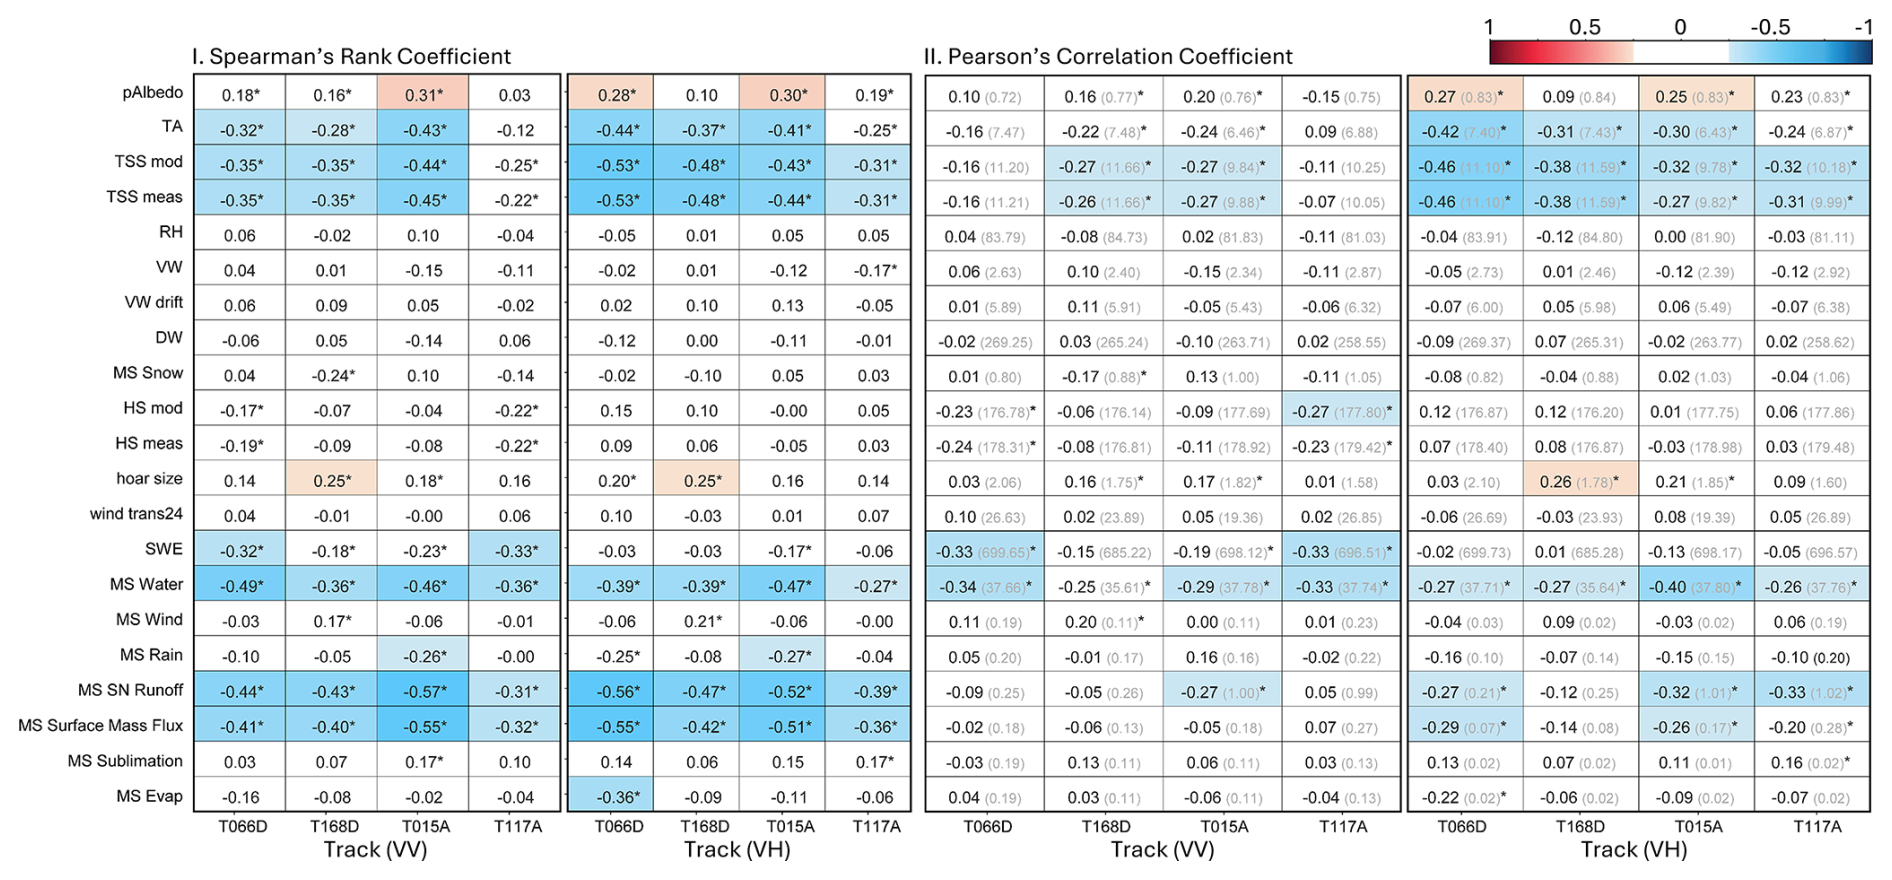
Figure 3Correlation of analysed SNOWPACK variables compared to the median Sentinel-1 backscatter time series at the WFJ2 station per track (location see Fig. 1). The table includes the results per polarisation state for a 3×3 pixel-window. Included are the Spearman's (I) and Pearson's (II) correlation coefficients and the root mean square error (RMSE) calculated between the Pearson's and the actual data. * indicate values with a p-value of below 0.05. Abbreviations can be found in Table 1 and the correlation of the other stations in Appendices A4 and A5.
Statistical comparisons between the RTC level backscatter time series and the station measurements at all stations revealed a negative correlation between S1 backscatter and modelled liquid water content as well as measured runoff (January 2018 to August 2021, Fig. 2). For runoff, the correlations ranged from −0.13 (VV; SLF2) to −0.49 (VH; WFJ2) in Spearman's rank and from −0.28 to −0.26 for Pearson's correlation (averaged over the tracks per station per polarisation (Fig. 3, and Appendices A4 and A5)). This and the slight correlation found with the liquid water content (0.15 in VH at SLF2 −0.49 in VV at WFJ2 for Spearman's and −0.01 in VV at SLF2 to −0.4 at WFJ2 for Pearson's) indicates the expected sensitivity of S1 to water within the snowpack (Nagler and Rott, 2000).
Among the SNOWPACK variables, Spearman rank correlations (restricted to snow-covered conditions) revealed a strong positive relationship between runoff and liquid water content (0.74). Liquid water content showed a weak positive correlation with snow height (0.26), while no significant relationship was found between runoff and snow height (−0.03). This indicates that runoff is primarily controlled by the availability of liquid water within the snowpack rather than by snow depth itself. While the stations at lower elevations showed a much lower signal stability (Appendices A2 and A3), similar tendencies of correlations were found.
Comparing our detection of wet snow to the SWS product is not trivial due to the differences in spatial and temporal resolution and the lack of a spatially continuous reference data. However, the overall MCC value of 0.90 between SWS and LRW at WFJ2 station suggested a general agreement on the main melting phases (Fig. 2C for SWS and shadings in Fig. 2D and E for detected from LRW product), with yearly MCC values varying between 0.87 (2017–2018 and 2019–2020) and 0.94 (2018–2019)).
Overall, the SWS layer provides spatial coverage of 30 %–60 % of the study area (median: 48.6 %), whereas the multi-track LRW approach achieves 94 %–100 % coverage (median: 99.9 %). The reduced coverage of the SWS product is primarily attributable to masking strategies applied to minimise artifacts arising from radar geometry effects, from land cover types such as forest and water bodies (visual in Appendix A10).
At the WFJ2 station, the SWS product resulted in 17 false positive wet snow detections across the time series, instances where wet snow was indicated in the absence of snow cover, whereas the dual-polarised multi-track LRW approach produced none.
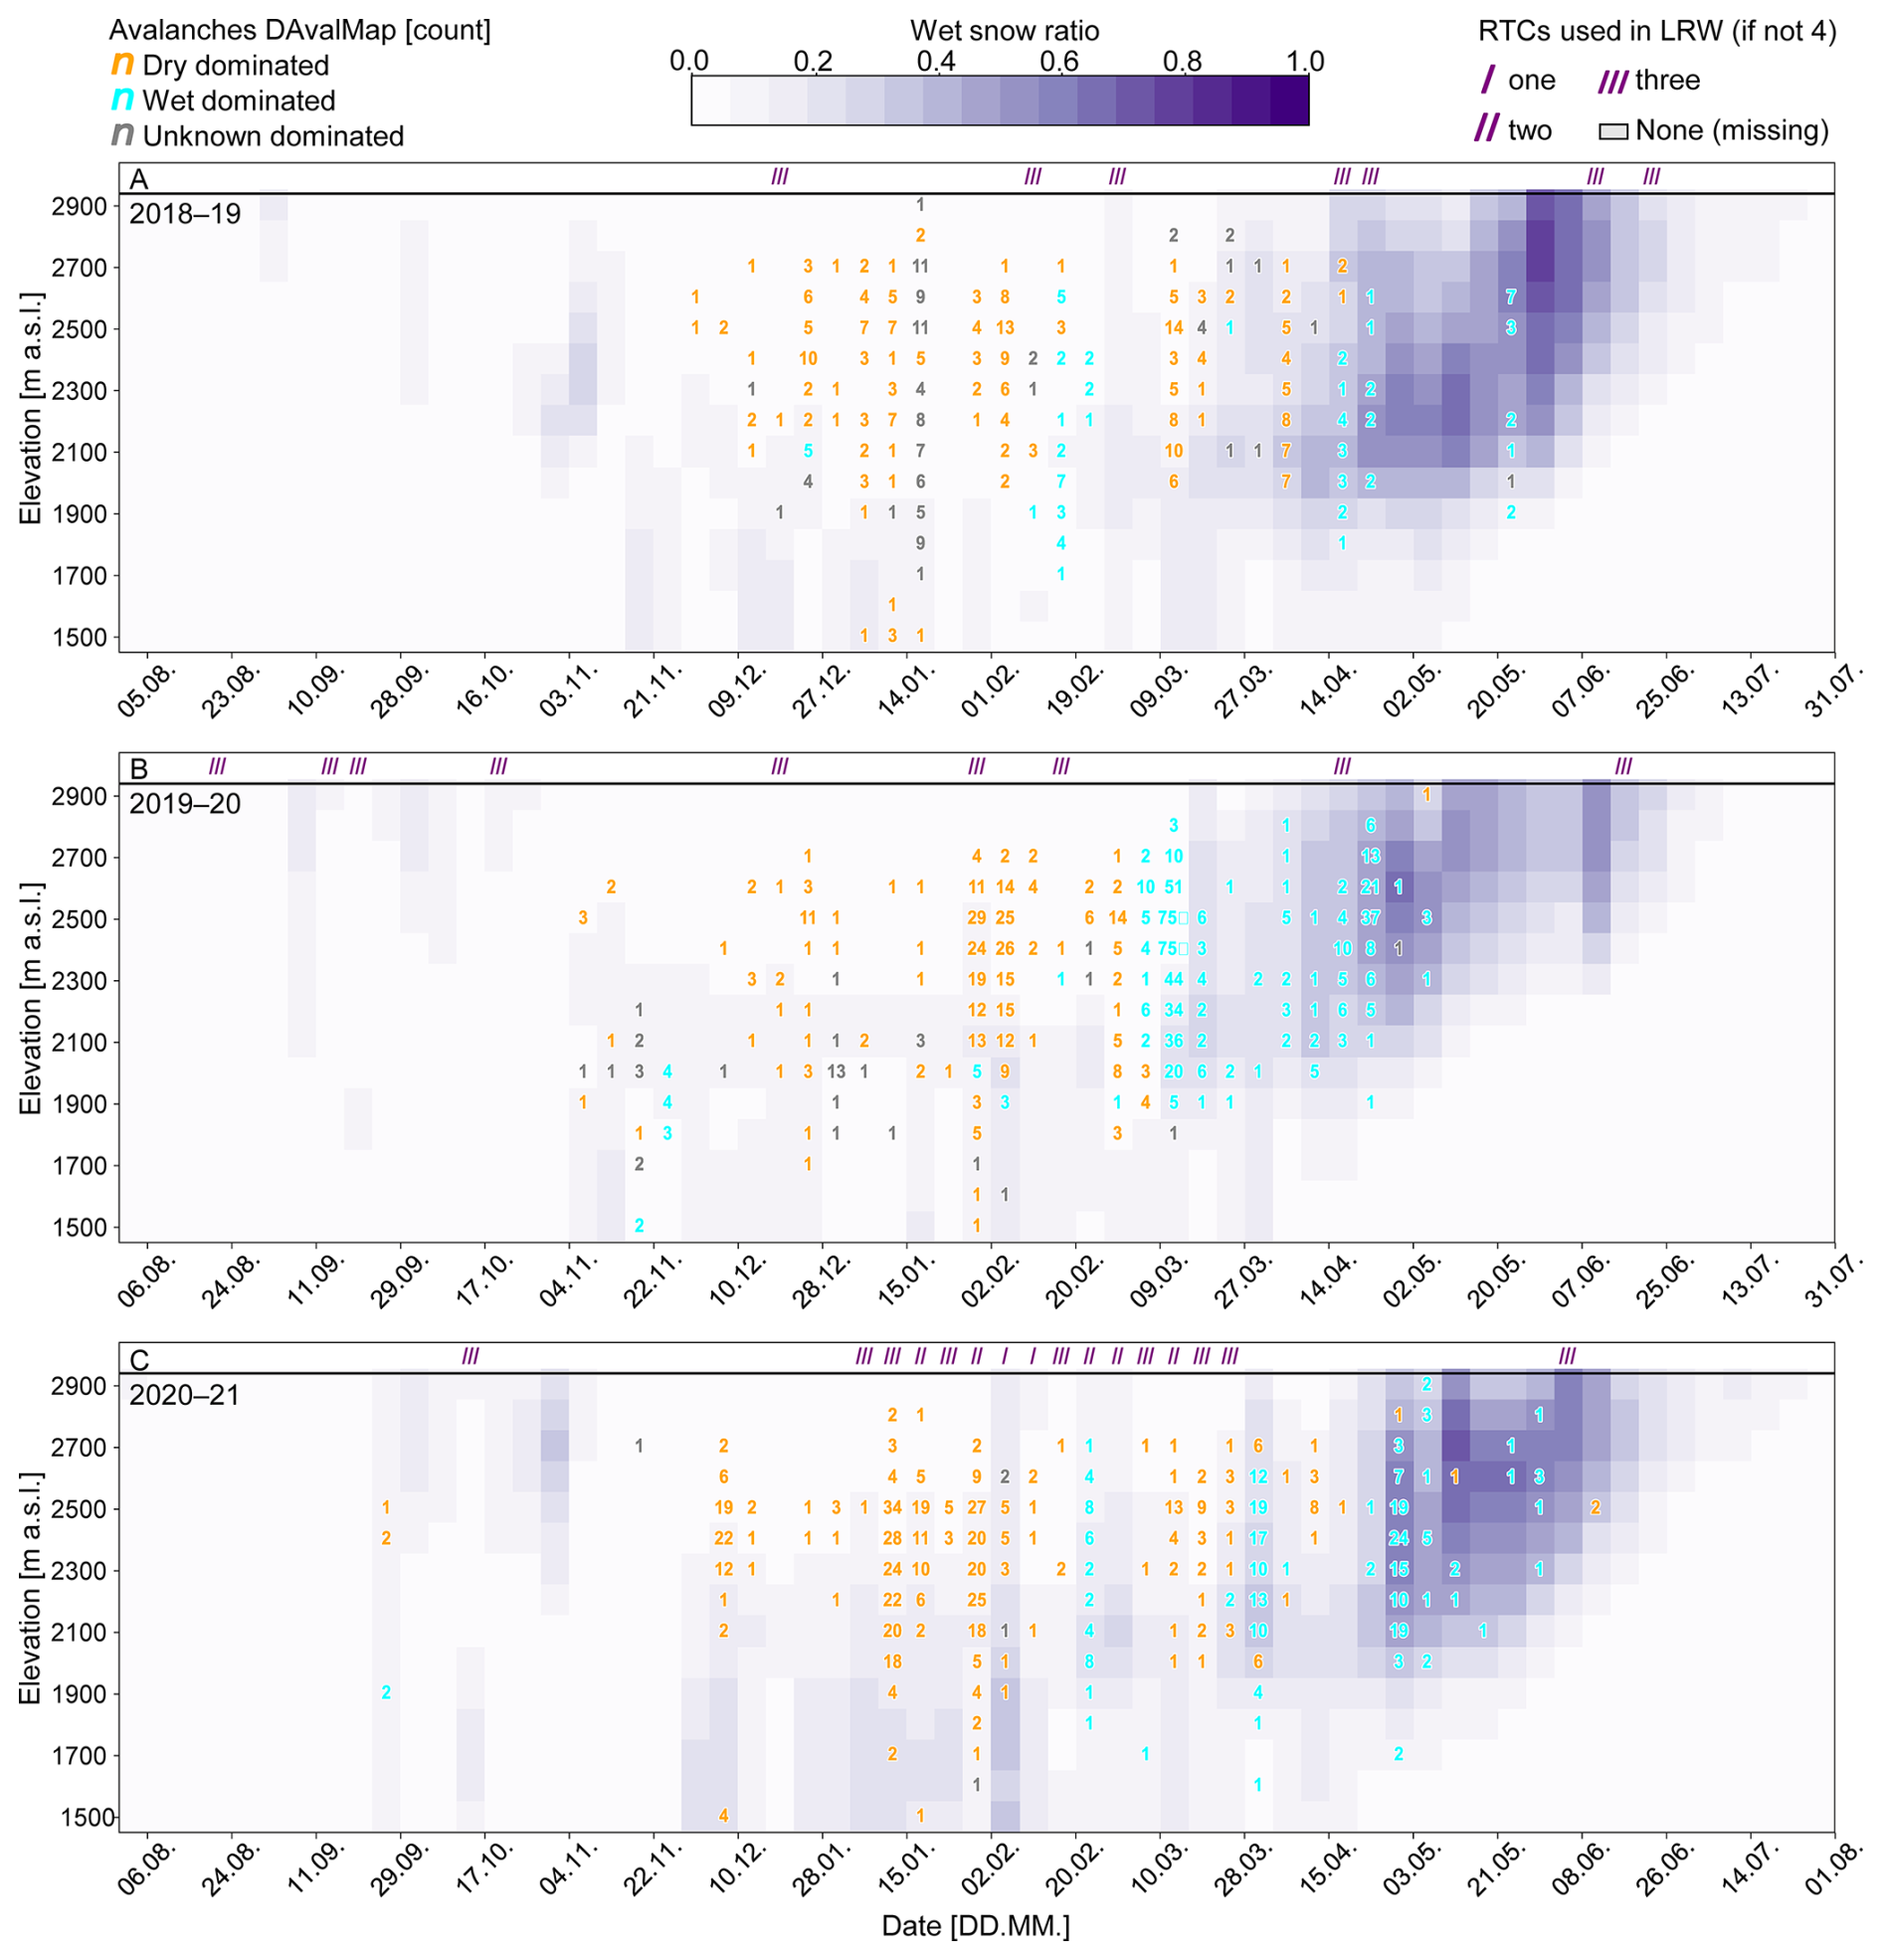
Figure 4Time-elevation plots of wet snow ratio evolution for combined polarised product across three melting seasons (A: August 2018–July 2019, B: August 2019–July 2020 and C: August 2020–July 2021) featuring the area of Davos as indicated in Fig. 1, resolved at discrete 100 m elevation bands. The wet snow ratio is the percentage of pixel per elevation band that was detected as indicating wet snow using S1 data. The number of/lines indicates the count of tracks used, when less than the max. of four tracks were used for the LRW creation. Coloured numbers indicate the count of recorded snow avalanches per time step according to the DAvalMap data set at the corresponding elevation band and coloured according to the dominant avalanche type dry (orange), wet (cyan) and unknown (gray) (Hafner et al., 2021). In case of equal count of avalanches, “wet” snow was given priority followed by “unknown” and then “dry” snow avalanches. Plot design was inspired by Karbou et al. (2021) and Karbou et al. (2022).
5.2 Retrieval of wet snow avalanche preconditioning
Across the whole study region, the wet snow ratio shows some distinct seasonal patterns that are consistent across years. At the beginning of the winter season, the elevation of areas with moderate wet snow ratios decreases, indicating the decrease of the snowline and a gradual transition to wide-spread dry snow. Once the melt season starts, there is both an overall rise of wet snow ratio as well as a rise in elevation of areas with high wet snow ratios (Fig. 4). Across the three analysed seasons, the 2018–2019 and 2020–2021 spring seasons reached higher wet snow ratios than 2019–2020, reaching 70 %–80 % in mid or late March, whereas 2019–2020 peaked at about 60 %. Both these two years saw warm phases in February with wetting occurring quite early compared to other years. In 2020–2021, elevated wet snow ratios (> 30 %) appeared earlier in the season (November–February) between 1500 and 2200 m a.s.l., followed by a second peak of up to 70 %–80 % in mid-May.
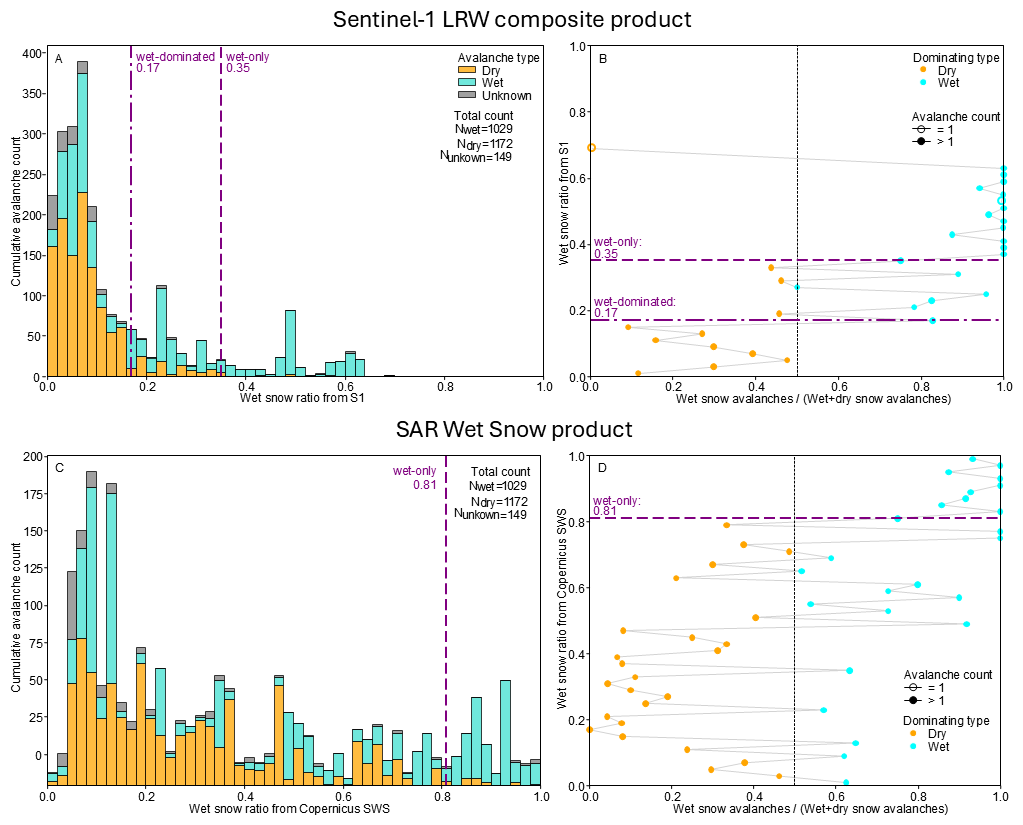
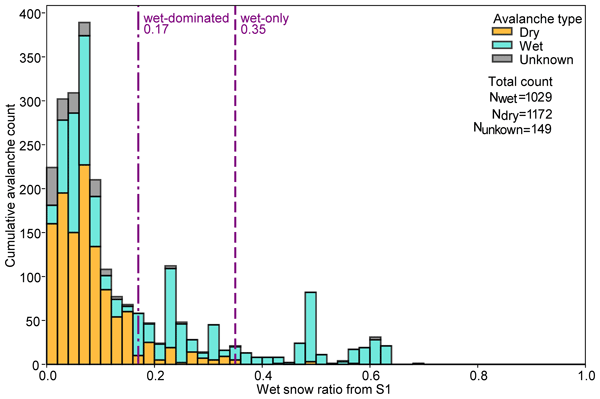
Figure 5Extraction of wet snow ratio thresholds from S1 (I) using our LRW approach and (II) SWS product. (A) Total avalanche count per type in comparison to wet snow ratio and the extracted wet-dominated and wet-only transition lines after applying Gaussian distribution. (B) wet snow ratio in comparison to dominating type. The extracted thresholds only consider wet and dry snow (unknown, excluded) and entries when more than one avalanche was present. In cases of equal count wet and dry snow avalanches, wet snow was given priority.
Figure 5A shows a histogram of avalanche types as a function of wet snow ratio. Figure 5B then displays the wet snow ratio against the proportion of wet snow avalanches among all avalanches. The transition between dry snow avalanche dominated conditions and wet snow-dominated conditions was found at a wet snow ratio of 0.17. The transition to exclusively wet snow avalanches occurred at a ratio of 0.35 when extracted from the LRW data (Fig. 5A–B).
When parsing the data by aspect ranges (Appendix A7), we found the highest sensitivity (lowest wet snow ratio threshold for transition to wet snow-dominated or only-wet snow) in south facing slopes (0.07–0.21), similar in east and west facing slopes (East: 0.23–0.39 and West: 0.20–0.37) and an immediate transition from dry dominated to wet snow avalanches only for north facing slopes at 0.13. The narrower transitioning phase in south and north facing slopes than in east and west facing slopes, indicates higher sensitivity in those aspect directions.
For the SWS product, the general transition between the avalanche release conditions was found to be less distinct (Fig. 5C–D). Although dry snow avalanches were more prevalent at lower wet snow ratios (below approximately 0.5), periods characterised exclusively by dry snow avalanche activity could not be distinguished. The transition to a state dominated solely by wet snow avalanches occurred at a higher threshold, when compared to the multitrack LRW-based product, i.e. 0.81 (Fig. 5C–D).
This study evaluates SAR-based wet snow conditions derived from LRW Sentinel-1 products. The use of LRW composites enables the integration of backscatter from different tracks and optimise data coverage for avalanche-related purposes. The product allowed a clear separation between conditions where dry snow avalanches dominate, wet snow avalanches dominate, and only wet snow avalanches exist.
6.1 S1 sensitivity to snowpack characteristics
We compared the produced wet snow time series to weather station data and modelled snow parameters extracted from SNOWPACK, using statistical analyses to assess the sensitivity of the radar data to changes in the snowpack. In the following, we first discuss the findings and limitations related to measured variables from the weather stations, then evaluate the relationships obtained from modelled SNOWPACK variables, and finally combine both perspectives to interpret the radar signal response.
Among the measured variables, snow height (HS) in combination with snow surface temperatures (TSS) provided an indication of the seasonal evolution of the snowpack and the onset of melt. Periods with non-zero snow height together with temperatures around the freezing point can be interpreted as conditions favourable for snow wetting. However, the in-situ stations directly measure physical quantities such as snow depth and snow surface temperature, whereas the SAR-derived wet snow product infers the presence of liquid water indirectly from changes in backscatter intensity: the two approaches therefore do not measure the same quantity, which explains the rather low correlation statistics between S1 backscatter and measured variables at WFJ2. While single-point measurements cannot fully capture the spatial variability of alpine terrain, the temporal agreement found between the observed snow depth, snow surface temperature, and the S1-detected wet snow periods nonetheless supports the feasibility of our approach.
However, the relationship between these variables and snow wetness remains indirect, explaining the rather low correlation statistics between S1 backscatter at WFJ2 and measured snow surface temperature. While single-point measurements cannot fully capture the spatial variability of alpine terrain, the temporal agreement found between the observed snow depth, snow surface temperature, and the S1-detected wet snow periods nonetheless supports the feasibility of our approach.
In contrast to the measured parameters, certain parameters extracted from SNOWPACK showed stronger relationships with the SAR backscatter signal. Across all tests, liquid water content and snow runoff exhibited the strongest correlations with the SAR derived snow wetness (Fig. 3 and Appendices A4 and A5). This supports the assumption that decreases in SAR backscatter are linked to liquid water within the snowpack. Already at a liquid water content of 5 %, the water acts significantly as an absorbent and specular reflector to C-band frequencies, resulting in low backscatter values (Lund et al., 2022; Nagler et al., 2016).
Combining the measured and modelled data allowed us to define the most likely onset of the melting season at the station and to subsequently determine the time difference between that and the wet snow detection. Interestingly, we observed a lag between the decrease in snow depth, the increase in modelled liquid water content, and the detection of wet snow from the LRWs. By contrast, the onset of runoff was matched without time lag (see Fig. 2). This can be explained by the fact that runoff onset is itself delayed relative to the initial moistening and ripening phases, as the first meltwater is retained within the pore space of the snowpack before drainage occurs (Detre et al., 2025). The S1-derived wet snow signal therefore likely reflects a more advanced stage of the wetting process, by which time runoff onset is also imminent. Compared to Marin et al. (2020), who identified all three melt phases (i.e. moistening, ripening, and runoff) from multi-temporal SAR backscatter, this suggests that our approach may not fully capture the early moistening phase. This is consistent with Carletti et al. (2025), who found liquid water content to be the dominant control on S1 backscatter at the onset of the melting season, with surface roughness becoming increasingly influential thereafter. Nevertheless, the detection of runoff onset may still provide valuable information that can support the early warning of wet snow avalanches.
In both the correlation analysis and the time series generation, data from the WFJ2 station outperformed the other two stations, but we believe that this is largely a consequence of local conditions and the effect of less pronounced snow conditions. The DAV5 station station (Appendix Fig. A2) is on a north facing slope and is surrounded by avalanche protection structures on three sides. These structures very likely affect the radar backscatter. At SLF2, the snowmelt in spring 2020 is not captured at all. This station is situated at the lowest elevation of the three, so seasonal transitions are expected to be less pronounced and less intense melt events are more likely to be missed. The shallower snowpack and less pronounced winter conditions around SLF2 station is making this station-location most prone to the influence of surface roughness, which governs the S1 signal during patchy snow conditions (Carletti et al., 2025). Also at SLF2, proximity to infrastructure (> 15 m) and temporary constructions may have caused signal interference. An example of this is likely the increased backscatter observed early in the year coinciding with the World Economic Forum, plausibly linked to temporary metal constructions for security around the nearby helicopter landing zone (Appendix Fig. A3, especially in 2018). The comparatively poor performance at the DAV5 and SLF2 stations highlights challenges faced by the product under specific local conditions. However, this is expected to have limited implications for the general applicability of the product to avalanche release assessment, as release zones are typically situated at higher, more exposed elevations, where conditions more closely resemble those at WFJ2 station, at which the method performed well.
6.2 S1 based wet snow detection
The mapping of wet snow from S1 SAR data involves key methodological choices for which widely-used standards do not yet exist. This is particularly true for generating the reference image, defining the wet snow threshold, and the handling of the different polarisations. Each of these can have an influence on the final product.
No standard approach for generating a reference image is established. The first version of the SWS layer was based on a reference image calculated as the median from a stack of summer acquisitions (assumed no snow; European Environment Agency, 2023). Other studies as well as the current SWS dataset calculate the mean over dry or no snow images (e.g., European Environment Agency, 2025; Karbou et al., 2021; Li et al., 2025) or use a single reference image featuring either dry or no snow conditions (e.g., Mendes et al., 2022). Increasing temporal baselines between the image of interest and the reference image, results in greater errors due to land use and land cover changes over time. In the application of wet snow avalanche forecasting and nowcasting, time efficiency and accuracy is of major importance. By choosing an “all season” median, we have wet snow contamination in the reference; however the results of our study indicate applicability of the method (see Fig. 2) and follow the process applied in Lievens et al. (2019). The advantage of reference image generation in that way is a high level of automation, no arbitrary reference selection and a simplified update-ability.
Once relative changes are computed, a threshold below which wet snow is present needs to be set. This threshold is usually between 2 and 3 dB signal loss relative to a reference image or all-season median (this work) and is based on histogram analysis (e.g., Nagler et al., 2016). Adaptive and dynamic thresholds based on the underlying land cover class (Liu et al., 2022) or other additional datasets (James et al., 2024) have recently been suggested. However, we used the established and widely applied threshold of 2 dB for S1 data (Nagler et al., 2021, 2016, results indicated in Fig. 2). Although an adaptive backscatter analysis sounds promising, there were no widely available and regularly updated land cover products with suitable spatial resolution available in our case, and the most robust algorithm minimises requirements on the input data.
The selection of polarisation modes from S1 data has varied between wet snow observation studies. While e.g. Detre et al. (2025), Carletti et al. (2025), Gao and Ma (2024), Murfitt et al. (2024) used VV polarised data, James et al. (2024) used VH polarised and Darychuk et al. (2025), Li et al. (2025), Jans et al. (2025), Karbou et al. (2021) used a dual-polarised approach. In our results, the correlation values showed similar trends between the different polarisation modes (Fig. 3 and Appendices A4 and A5). In contrast to Karbou et al. (2021) we performed the analysis on separate polarisation states before combining the wet snow masks, this mitigated the issue of using a thresholding approach developed by Nagler et al. (2016) on a dB scale on a ratio value as implemented by Karbou et al. (2021). The strongest divergence between the wet snow ratio extracted from VV and VH polarisation was observed in late summer/early autumn, whereby the VH polarisation indicated higher ratio values than VV. This might be related to a remaining influence of seasonal activity of vegetation (e.g. by occurrence of shrub forest), which is known to influence backscatter signal (Gao and Ma, 2024) or by the ripening which Marin et al. (2020) found to have a depolarizing effect on the signal. The time series showed similar results for both polarisation modes. The applied combination of both polarisations resulted in fewer misclassifications and therefore higher robustness.
6.3 Benefit of using S1 multitrack LRW processing
Due to their complex topography, high mountain environments pose several well-known challenges for monitoring with SAR data, and minimising these effects is crucial for operational applications.
While the multi-track LRW approach and commonly available S1-based snow products such as the SWS or Wet/Dry Snow layers (European Environment Agency, 2023) showed strong overall seasonal agreement (MCC = 0.9), a direct quantitative comparison of both products against observed runoff carried too much uncertainty to be conclusive. The combined arbitrariness in defining melt season boundaries in the noisier SWS time series, the sensitivity of the chosen runoff thresholds, and the need to account for interruptions such as the runoff pause during the 2018–2019 season, rendered such a comparison insufficiently stable. While the overall agreement is strong, the multi-track LRW approach addresses more subtle differences in spatial detail and coverage.
Instead of the commonly used GRD data, the usage of SLC data in combination with a high resolution DEM and LRW compositing allows for a higher spatial resolution, resulting in more detailed representation of snow wetness patterns. Multi-track LRW allows the mitigation of typical SAR geometry effects such as layover and shadowing as well as the minimisation of noise in the dataset. By combining acquisitions from different viewing geometries, noise can be filtered and areas that would otherwise lack data can be partially recovered, increasing the spatial coverage of the resulting product. This is especially relevant in steep terrain, where single-track acquisitions often lead to systematic data gaps. This increased data availability also stabilises the derived wet snow ratios, as a larger number of valid pixels can be included in the calculations, reducing the influence of outliers. In addition to spatial improvements, the use of LRW composites enhances the temporal robustness of the time series. By integrating multiple acquisitions, the impact of missing individual scenes is reduced, allowing for more consistent monitoring of snow conditions over time. So while SWS offer a grid sampling of 60 m (European Environment Agency, 2023; Karbou et al., 2021), which may not sufficiently resolve the variability of mountainous topography, our S1 LRW approach offers more spatial detail.
These improvements are particularly relevant for applications such as avalanche forecasting, where both spatial detail and temporal consistency are critical, especially for capturing the onset of snow wetting across different slope aspects (Cluzet et al., 2024). With the community increasingly moving towards the provision of large-scale LRW datasets such as already available from e.g. Copernicus Data Space Center (2026), making use of this data will become more efficient and operational applicability more feasible.
6.4 Extracting avalanche release conditions (wet vs dry) from S1-based wet snow ratio
To assess the applicability of SAR-based wet snow detection for the retrieval of the avalanche release conditions, we compared the wet snow ratios derived from both the multi-track LRW product and the standard SWS to the DAvalMap wet snow avalanche catalogue. This approach provides an indication of how well remotely sensed wet snow conditions may provide indication on avalanche type occurrence.
The available DAvalMap catalogue contains field-based observations of avalanches and their type (wet, dry, unknown). Even though this dataset is not without limits, it provides a valuable opportunity to relate avalanche activity to SAR-derived snow wetting. In the following, we discuss a few aspects which must be considered when interpreting the wet snow ratio in relation to this dataset. The catalogue does not permit a full evaluation of the detection performance beyond the observed avalanche sample. In other words, a lack of record does not necessarily mean that wet snow avalanche conditions were not present. Also, the DAvalMap perimeter is smaller than the study area used for LRW production, meaning that avalanches outside of this region were not systematically recorded. As a result, elevation bins above approximately 2800 m a.s.l. contain little to no documented avalanche activity.
All avalanches included in the dataset were classified into wet, dry or unknown-type snow avalanches, where the classification pertained to the conditions in the starting zone. However, this classification is challenging from a distance, and some events may have been misclassified, particularly in cases when avalanches started as dry snow avalanches, but developed into wet snow avalanches during their descent (Köhler et al., 2018). Lastly, the inventory is based on in-situ observations that depend on good visibility and are biased towards days with lower avalanche risk, as observations are less likely to be made during hazardous conditions (Schweizer et al., 2020; van Herwijnen and Schweizer, 2011). This can lead to uncertainties in the assigned release dates of up to several days (avalanches are reported when they have been observed instead of when they have been triggered (Schweizer et al., 2020). However, this issue is less pronounced for wet snow avalanches occurring on sunny days during warming. Given the applied six d temporal resolution of our product, the impact of these timing uncertainties is expected to be limited. However, such misclassifications are likely to have a stronger effect on the daily temporal matching to the SWS product. Even with these observational shortcomings, this dataset is one of the most comprehensive avalanche activity datasets (Schweizer et al., 2020).
The initial clusters of wet snow avalanches in spring 2019 and 2020 did not coincide with a pronounced increase in the wet snow ratio across those two seasons (see Fig. 4). These events were the most susceptible to misclassification in the DAvalMap dataset, given their higher potential at the start of the melting season to initiate as dry releases before transitioning into wet snow avalanches. Furthermore, they are the most likely to occur during short-lived wetting phases that may go undetected given the temporal resolution of S1 imagery (shown in daily grid and unavailable images in Fig. A8). Rainfall showed no significant dependency with wet snow avalanche occurrence over the time series (r<0.2; mean daily rainfall: 17 kg m−2; Appendix Fig. A9), indicating that rain-on-snow events had limited influence on wet snow avalanche releases in this dataset, excluding this as potential factor. This underscores the need for improved temporal coverage of the SAR mission to enhance the timing accuracy of remotely sensed snowpack transitions.
All these effects impact the threshold extraction which marks the transition from dry to wet snow avalanche release conditions. Additionally, we found an aspect dependency on the sensitivity of the thresholds (Appendix Fig. A7). This can be attributed for one to (a) the difference in melting, since the north-facing slopes are typically later in melting and then more intensive (visible in the elevation dependent melting diagrams, Appendix Fig. A6), but also (b) the inherent flight geometry of the sensor, which covers the south facing slopes the best, and offers least coverage for north facing slopes.
Ideally, a clear threshold of the wet snow ratio would identify the transition between dry and wet snow avalanche release conditions, indicating that the ratio provides a robust measure to differentiate between these conditions. To mark the uncertainty range, we also provide a threshold for wet-dominated conditions, where wet snow avalanches prevail but dry snow avalanches can still occur. However, the use of the SWS product showed increased noise and lower reliability with a transition to wet-only conditions at a very late stage. This highlights the dependency of the threshold on the underlying radar data processing. Consequently, the thresholds derived in this study should be interpreted as a range that needs to be selected according to the specific product used in practical applications.
We encourage future research to make use of not only multi-platform but also multi-frequency data such as a combination of X- and L-band with e.g. the recently launched NISAR mission (Oveisgharan et al., 2024). This would allow the capture of different stages of the melting due to differences in sensitivity to water presence with varying wavelengths, thereby enabling better estimates of the liquid water content and not only the presence of liquid water.
This study shows that S1 LRW multi-track composites provide useful information on snowpack wetting in complex alpine terrain and can support the identification of conditions associated with wet snow avalanche releases. We found a consistent relationship between decreasing SAR backscatter and increasing liquid water content in the snowpack as well as runoff, thereby linking RTC images to snowpack characteristics. The use of the LRW multi-track compositing approach allowed us to derive a relationship between the wet snow ratio and avalanche observations, which revealed a transition from conditions dominated by dry snow avalanches to conditions where wet snow avalanches became predominant. At a wet snow ratio of 0.35 only wet snow avalanches were recorded. Compared with the SWS product, the LRW-based approach provided a clearer separation of avalanche-release conditions, highlighting the benefit of multi-track compositing in steep terrain.
The approach remains limited by the revisit time of S1 and uncertainties in avalanche timing, which may affect the detection of short wetting phases. Despite these limitations, the results suggest that S1 multi-track composites may assist the evaluation of snowpack wetting across large areas and provide additional information on the development of conditions prone to wet snow avalanches.
A1 Temporal binning of avalanche data
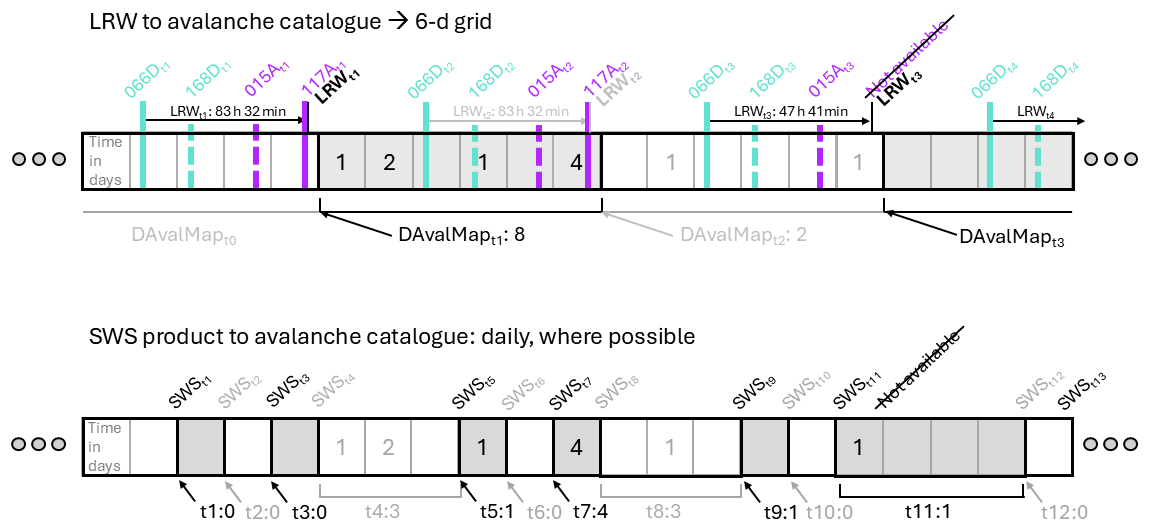
Figure A1Exemplary illustration of performed temporal binning featuring the SAR acquisition times in descending and ascending tracks to corresponding local resolution composites (shading) in combination with the summed wet snow avalanches. Binning has been optimised to include all recorded wet snow avalanches (from DAvalMap catalogue, indicated in circles) while minimising the temporal offset between an acquisition towards the avalanche to best match the wet snow condition.
A2 Time series of stations DAV5 and SLF2
A2.1 DAV5 station
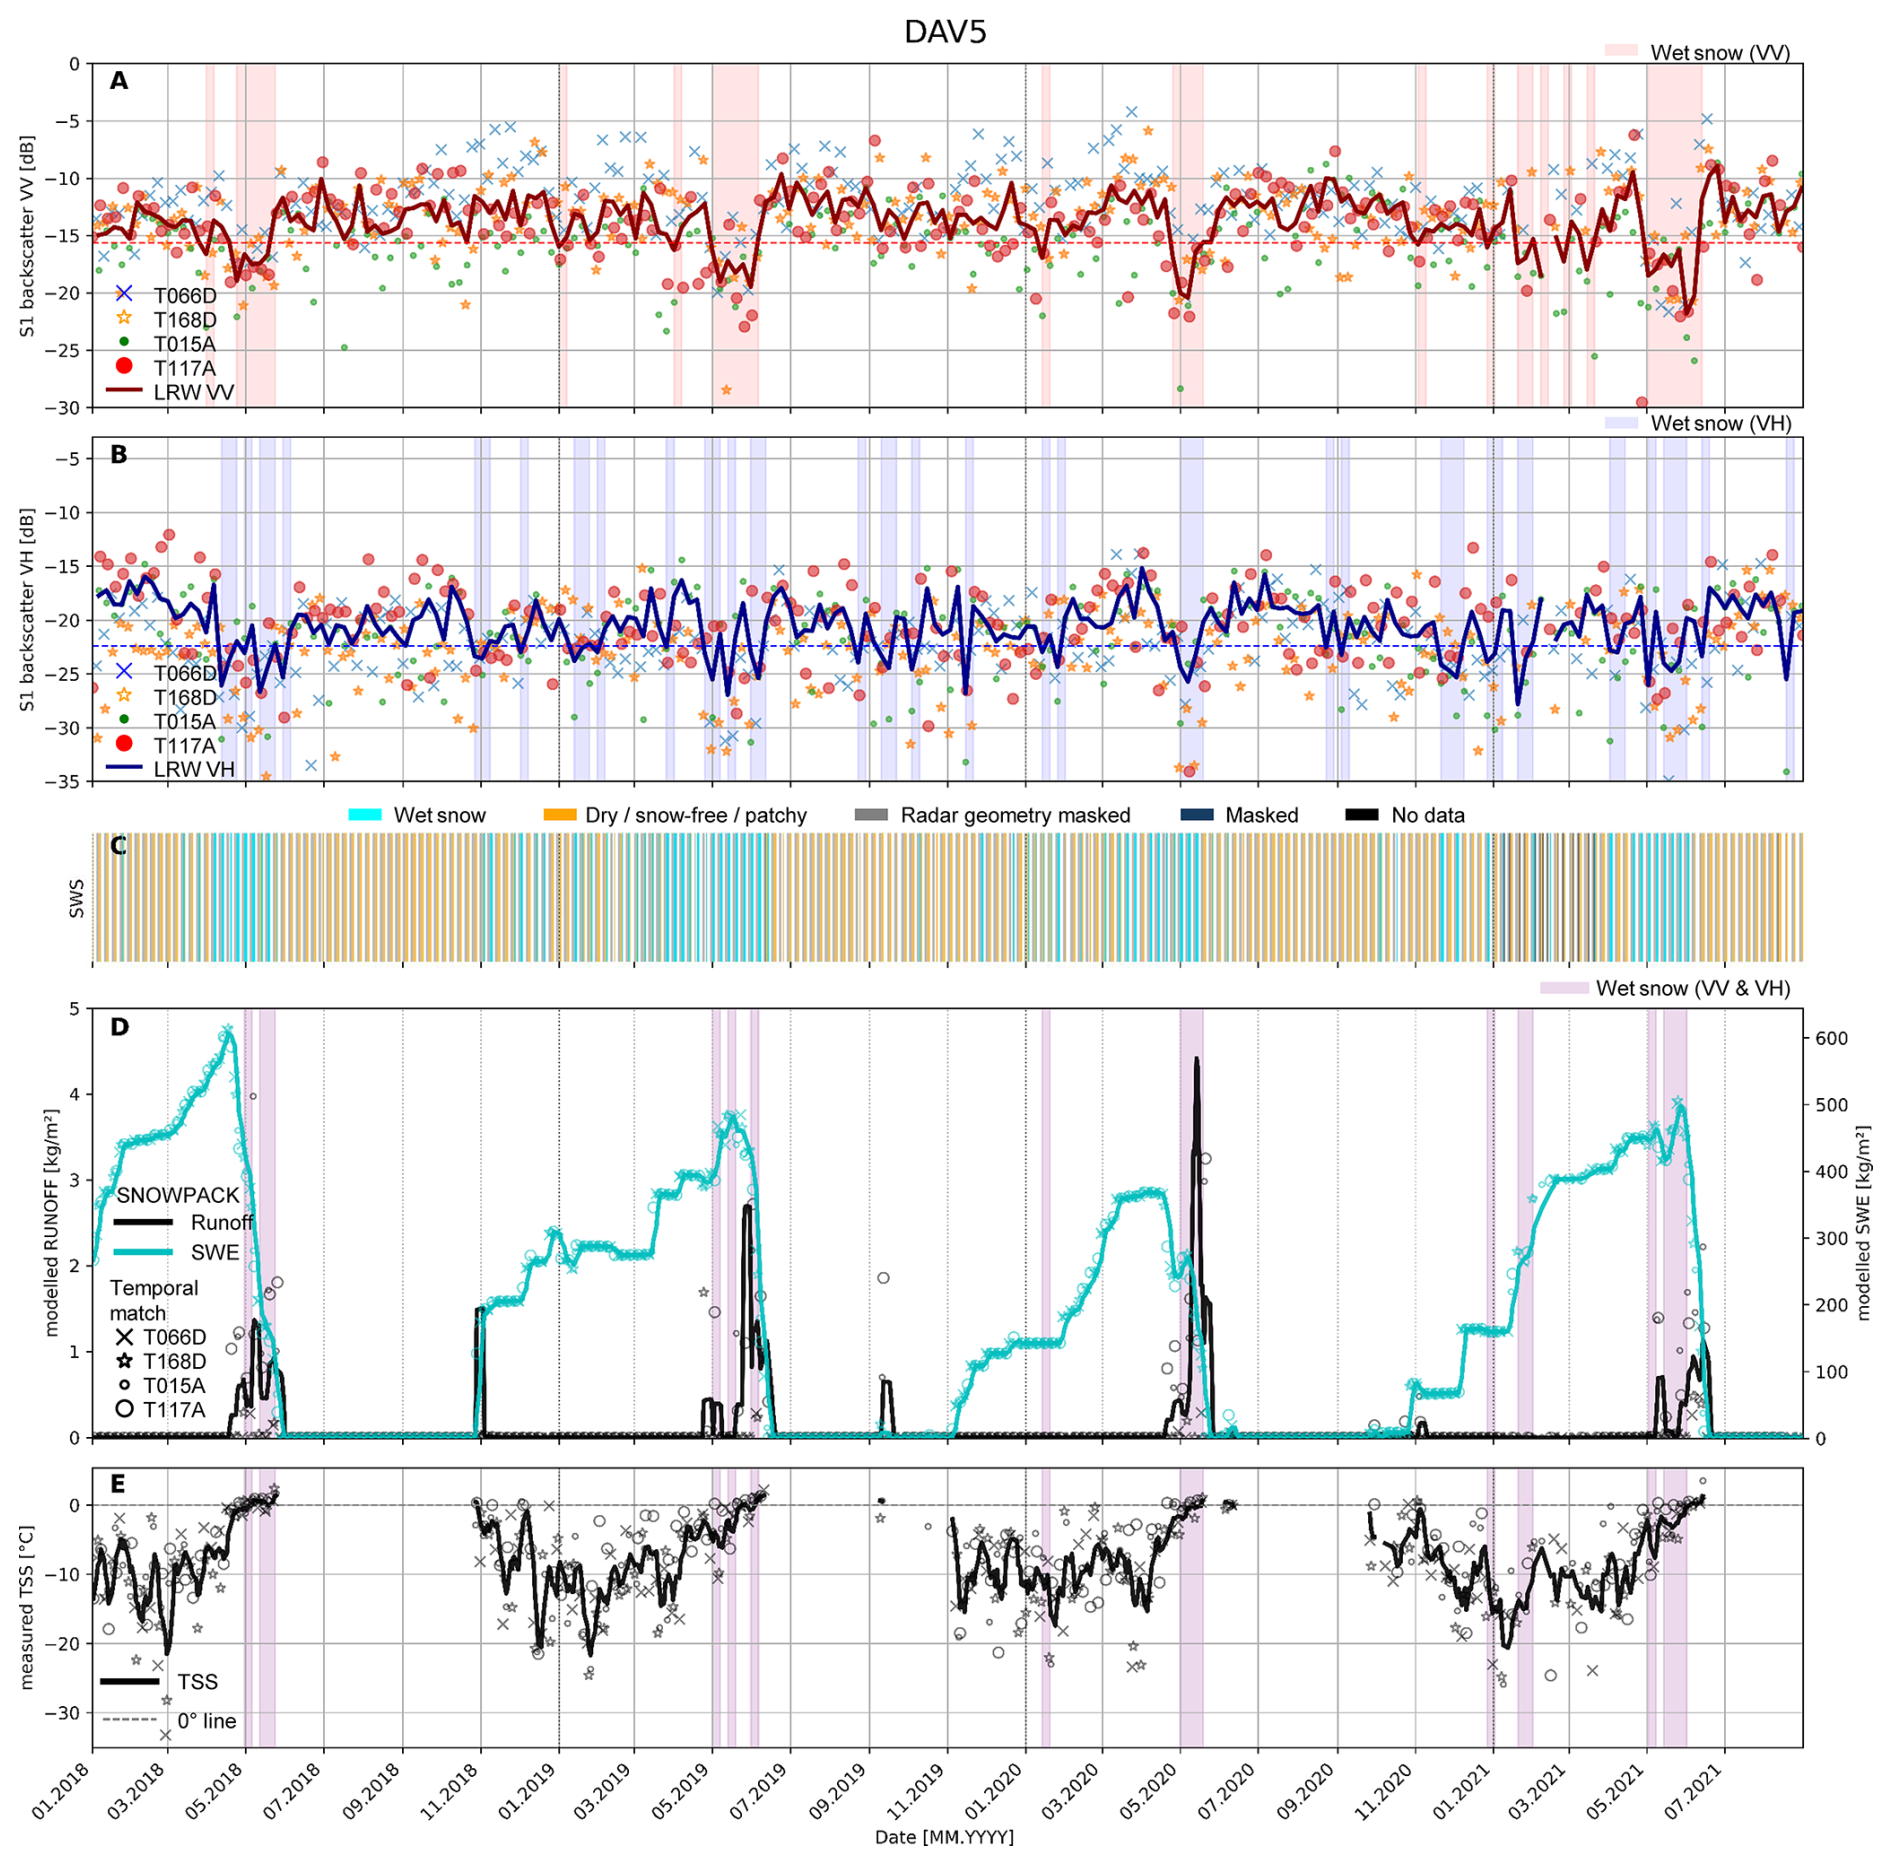
Figure A2Time series of wet snow evolution over four melting seasons from January 2018 until August 2021 at DAV5 station. (A) and (B) show the time series extracted from the pixel within which the IMIS station is situated in co- (A) and cross-polarised (B) S1 data. The horizontal line indicates the time series median including the 2 dB threshold and the shading background displays the times during which the backscatter falls below this and wet snow is detected. (C) SAR Wet Snow classified layer per each track over the station area (European Environment Agency, 2025). (D) Modelled time series of virtual lysimeter (MS SN RUNOFF) and snow water equivalent (SWE) from SNOWPACK data with markers indicating the corresponding time of S1 acquisition and the line being the mean between those four times. Similar (E) shows the local measured snow surface temperature (TSS) from IMIS, masked to when snow height as non-zero. In (D) and (E), the applied purple shading corresponds to our wet snow combined polarisation product.
A2.2 SLF2 station
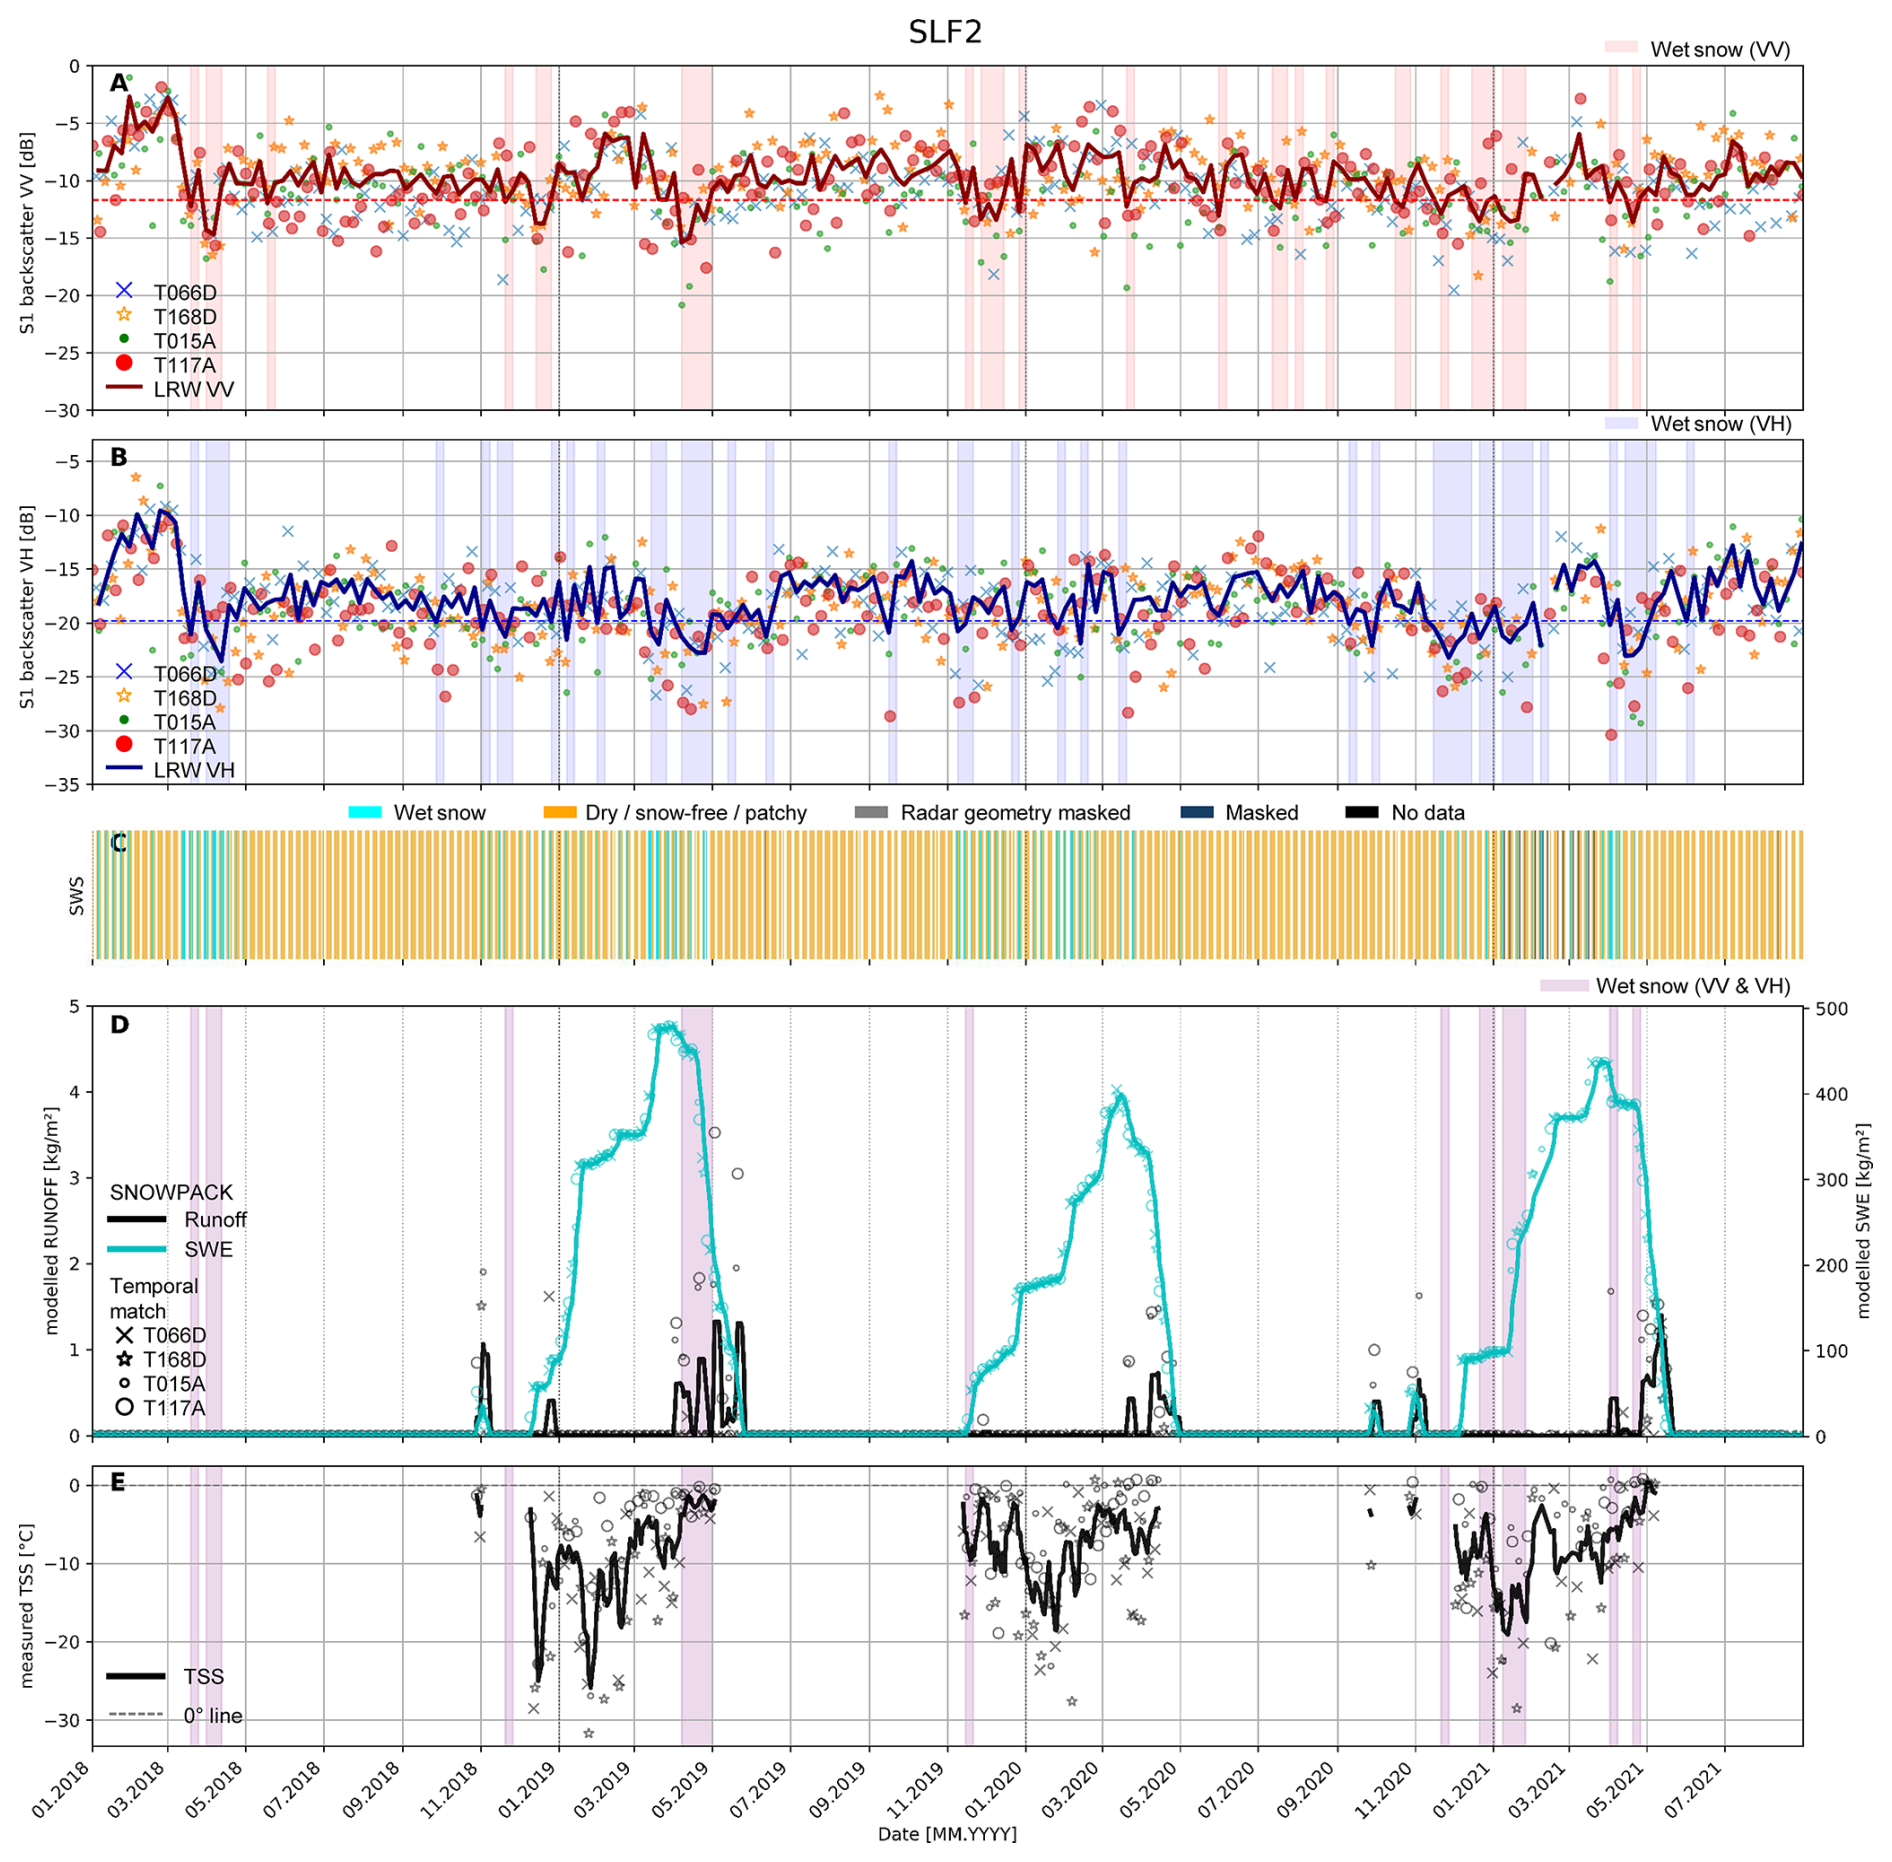
Figure A3Time series of wet snow evolution over four melting seasons from January 2018 until August 2021 at SLF2 station. (A) and (B) show the time series extracted from the pixel within which the IMIS station is situated in co- (A) and cross-polarised (B) S1 data. The horizontal line indicates the time series median including the 2 dB threshold and the shading background displays the times during which the backscatter falls below this and wet snow is detected. (C) SAR Wet Snow classified layer per each track over the station area (European Environment Agency, 2025). (D) modelled time series of virtual lysimeter (MS SN RUNOFF) and snow water equivalent (SWE) from SNOWPACK data with markers indicating the corresponding time of S1 acquisition and the line being the mean between those four times. Similar (E) shows the local measured snow surface temperature (TSS), masked to when snow height as non-zero. In (D) and (E), the applied purple shading corresponds to our wet snow combined polarisation product. Data displayed in (D) and (E) only available from September 2018 due to a sensor failure before.
A3 Correlation assessments between RTC time series and in-situ and modelled SNOWPACK data
A3.1 DAV5 station
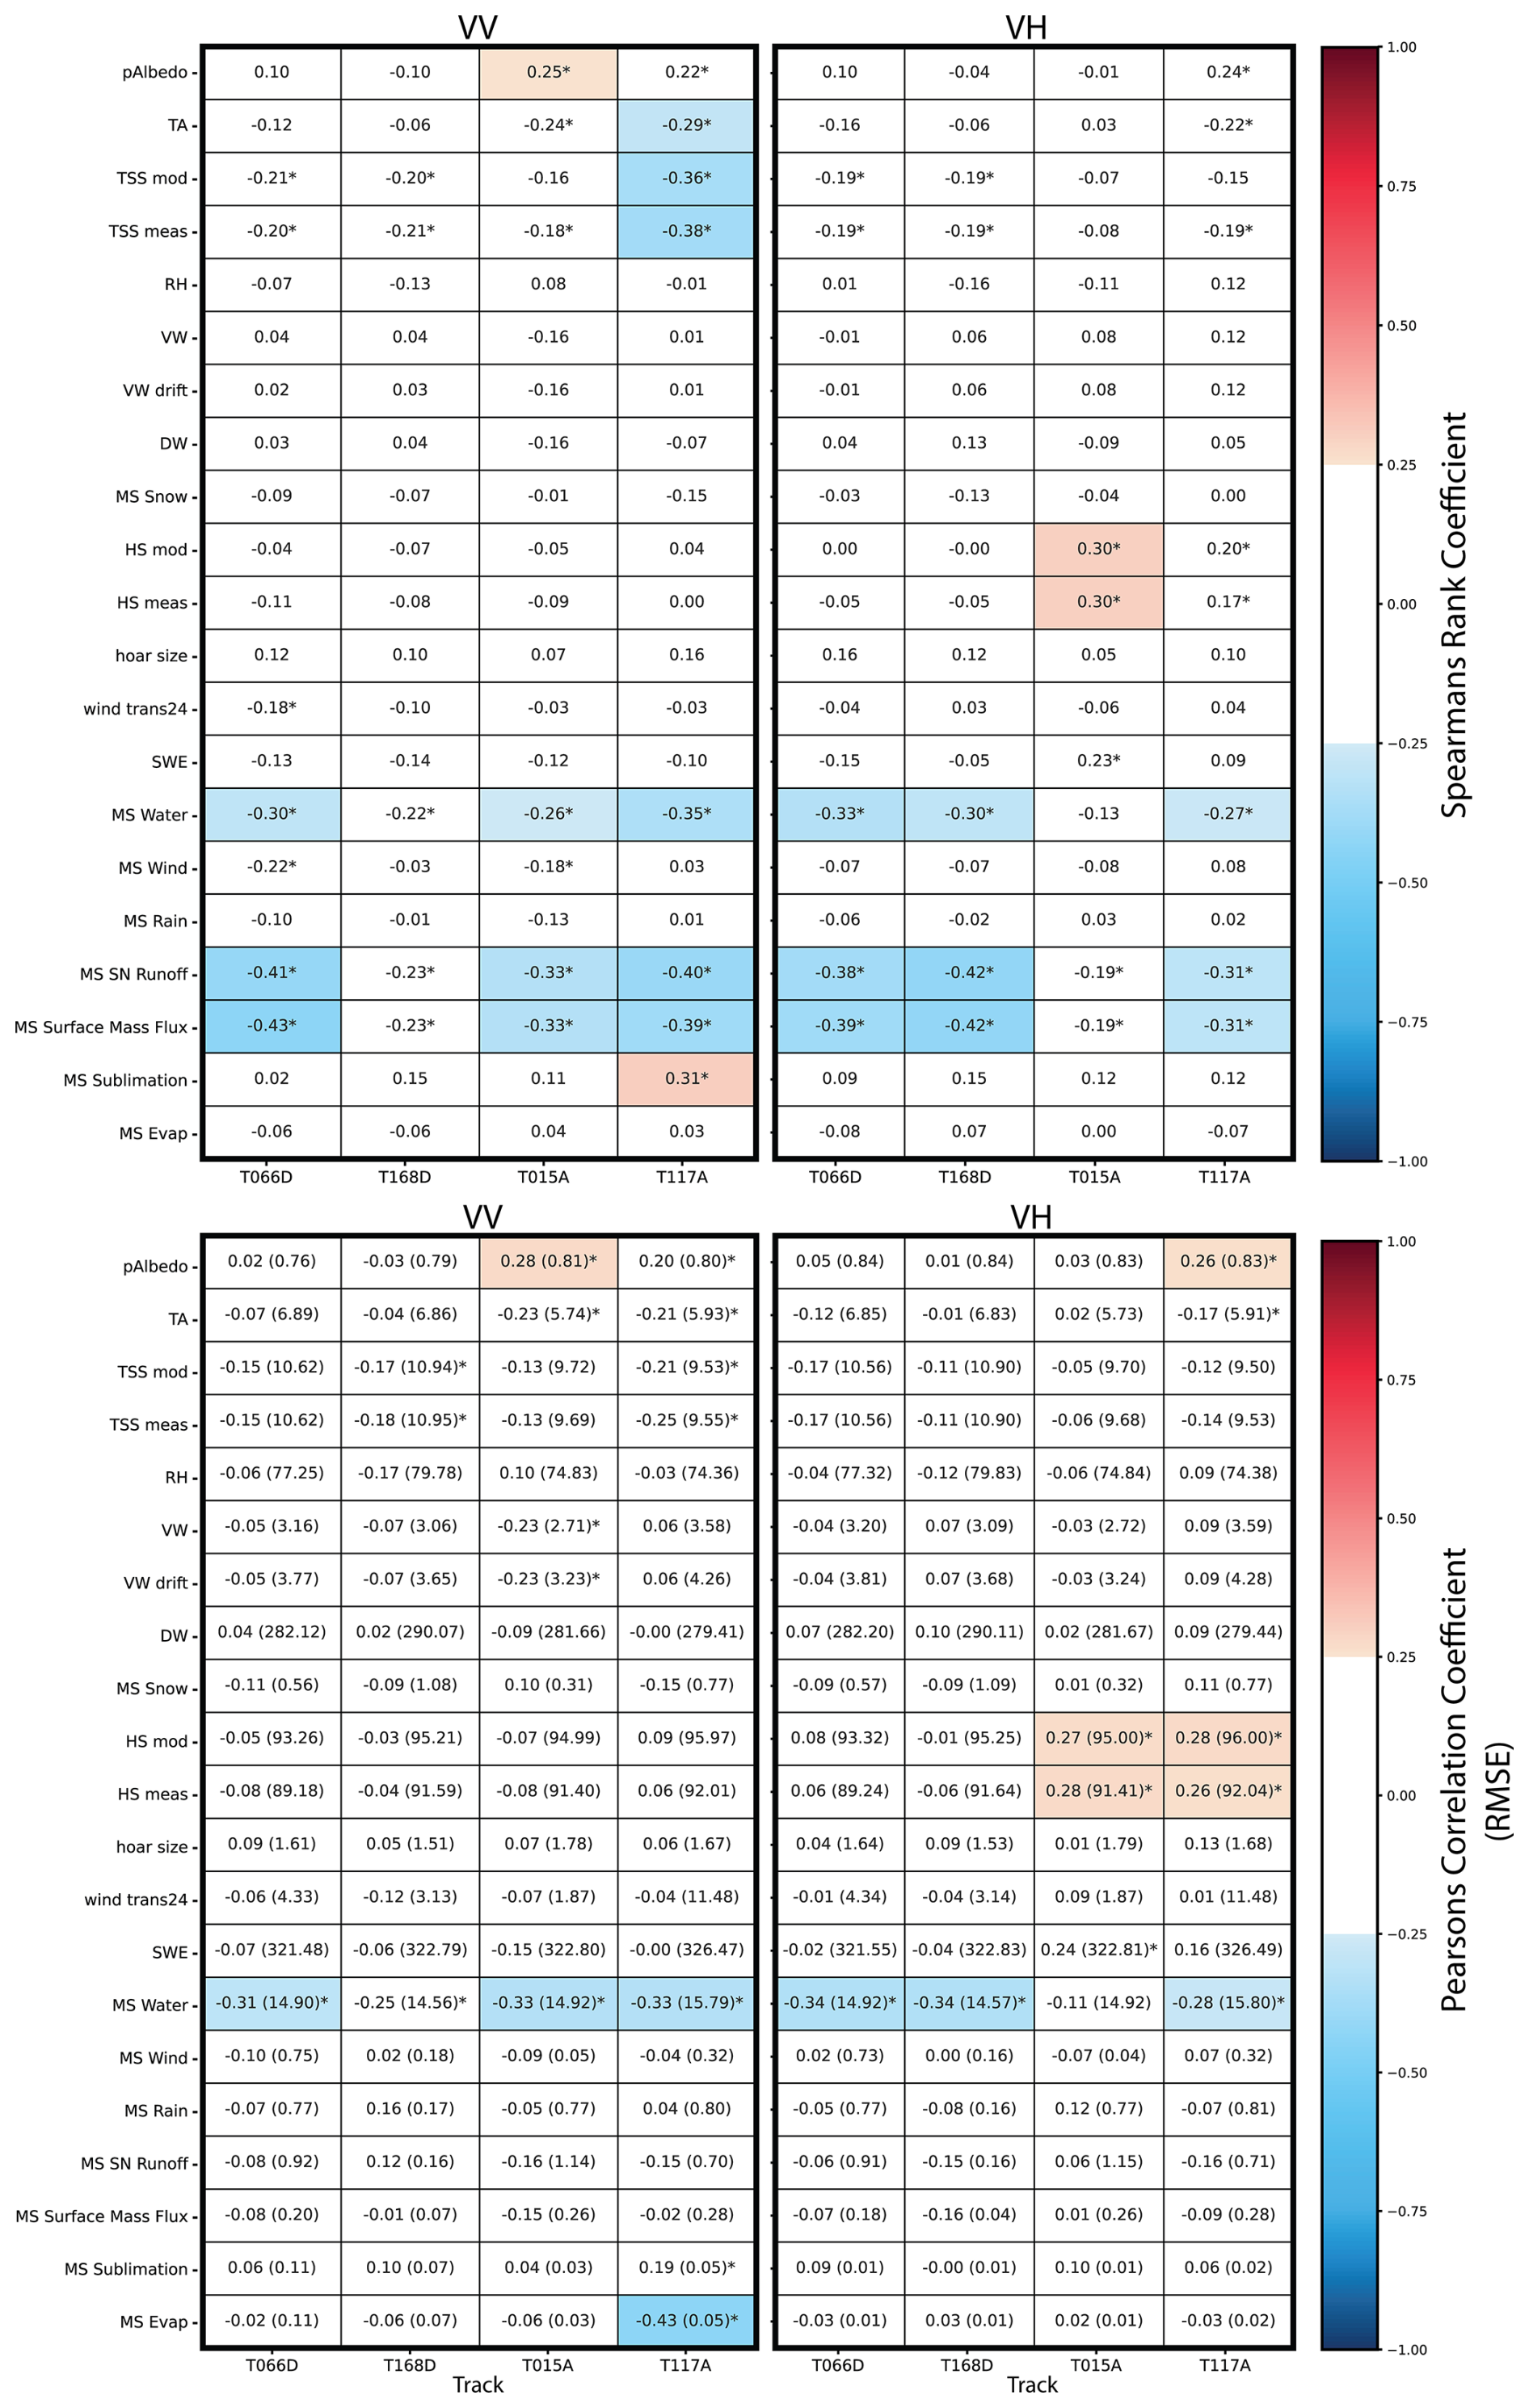
Figure A4Correlation of analysed SNOWPACK variables compared to the median VV and VH S1 backscatter time series at the DAV5 station per track (location see Fig. 1). The table includes the results per polarisation state for 3×3 window size. Included are the Spearman's (top) and Pearson's (bottom) correlation coefficient and the RMSE calculated between the Pearson's and the actual data. * indicate values that came with a p-value of below 0.05. Abbreviations can be found in Table A2.
A3.2 SLF2 station
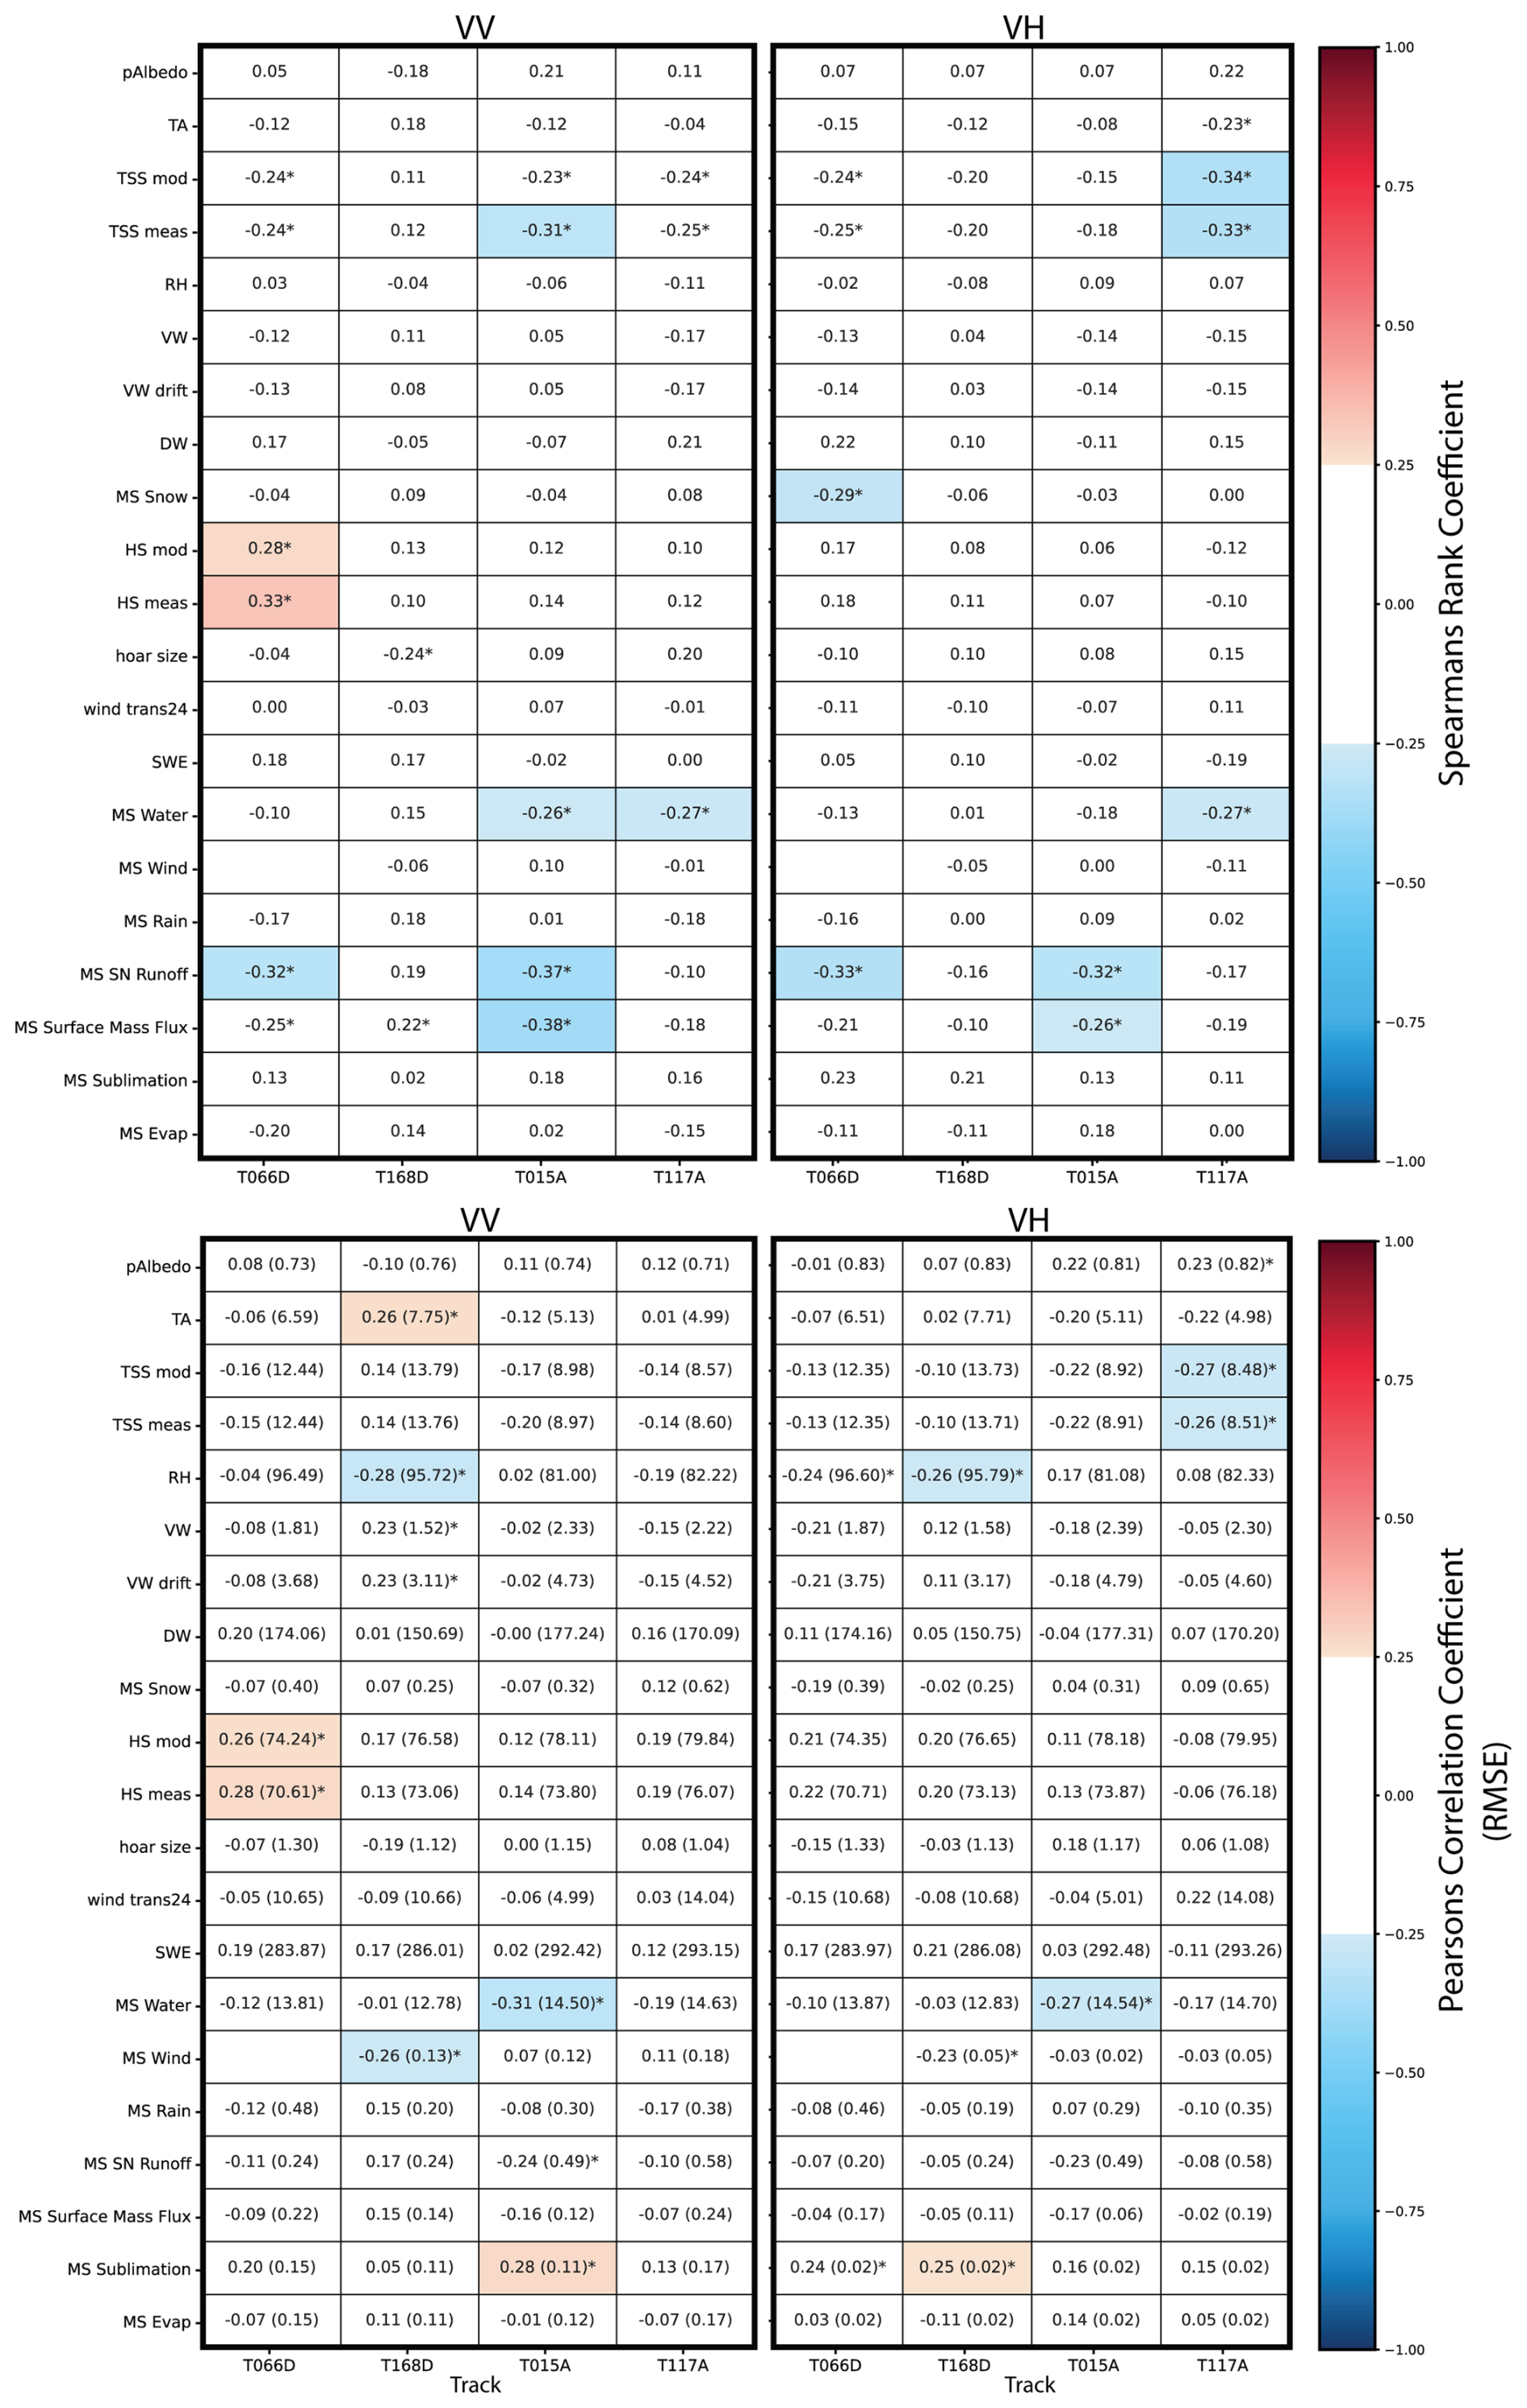
Figure A5Correlation of analysed SNOWPACK variables compared to the median VV and VH S1 backscatter time series at the SLF2 station per track (location see Fig. 1). The table includes the results per polarisation state for 3×3 window size. Included are the Spearman's (top) and Pearson's (bottom) correlation coefficient and the RMSE calculated between the Pearson's and the actual data. * indicate values that came with a p-value of below 0.05. Abbreviations can be found in Table 1.
A4 Aspect dependency of wet snow ratio time-elevation plots and thresholds
A4.1 Aspect dependent time-elevation based melting evolution
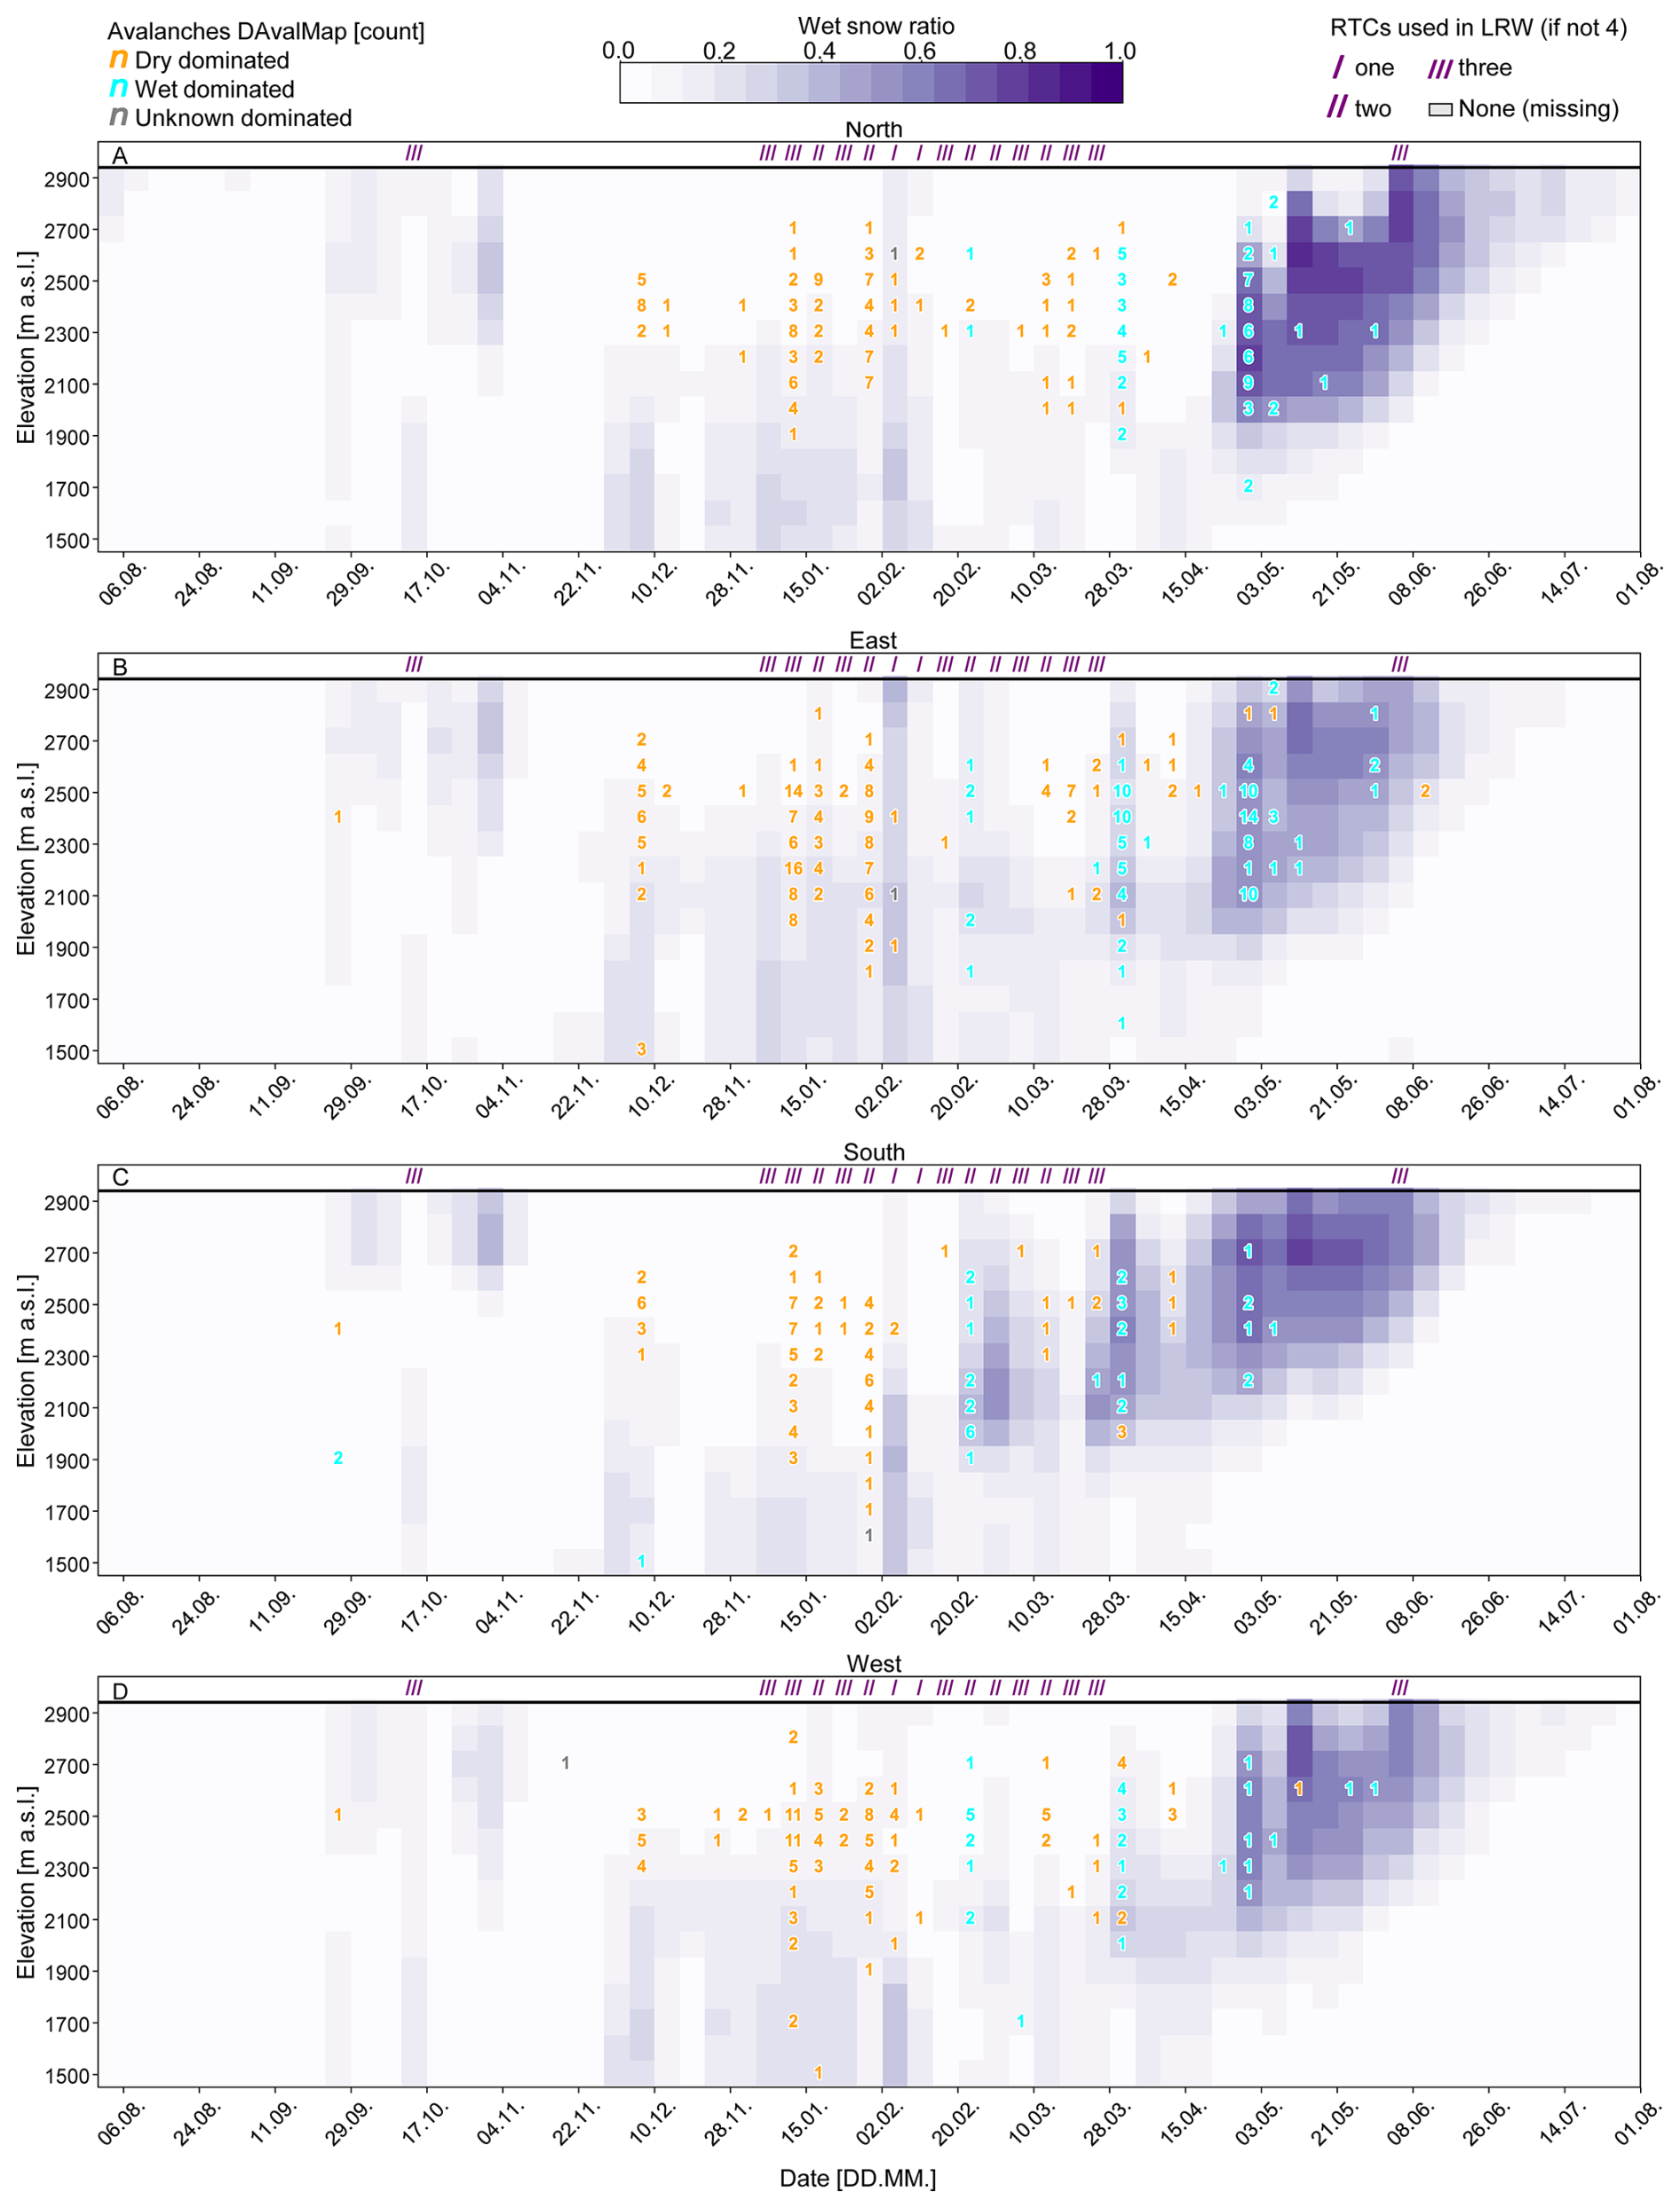
Figure A6Time-elevation plots of wet snow ratio evolution for combined polarised product for the exemplary seasons of 2020–2021. Displayed are the time series resolved into the different slope aspects: (A) North, (B) South, (C) East and (D) West. The plot encompasses data featuring the area of Davos as indicated in Fig. 1, resolved at discrete 100 m elevation bands. The wet snow ratio is the percentage of pixel per elevation band that was detected as indicating wet snow using S1 data. Coloured numbers indicate the count of recorded wet snow avalanches per time step according to the DAvalMap data set at the corresponding elevation band (Hafner et al., 2021). Plot design was inspired by Karbou et al. (2021) and Karbou et al. (2022).
A4.2 Aspect dependent threshold extraction
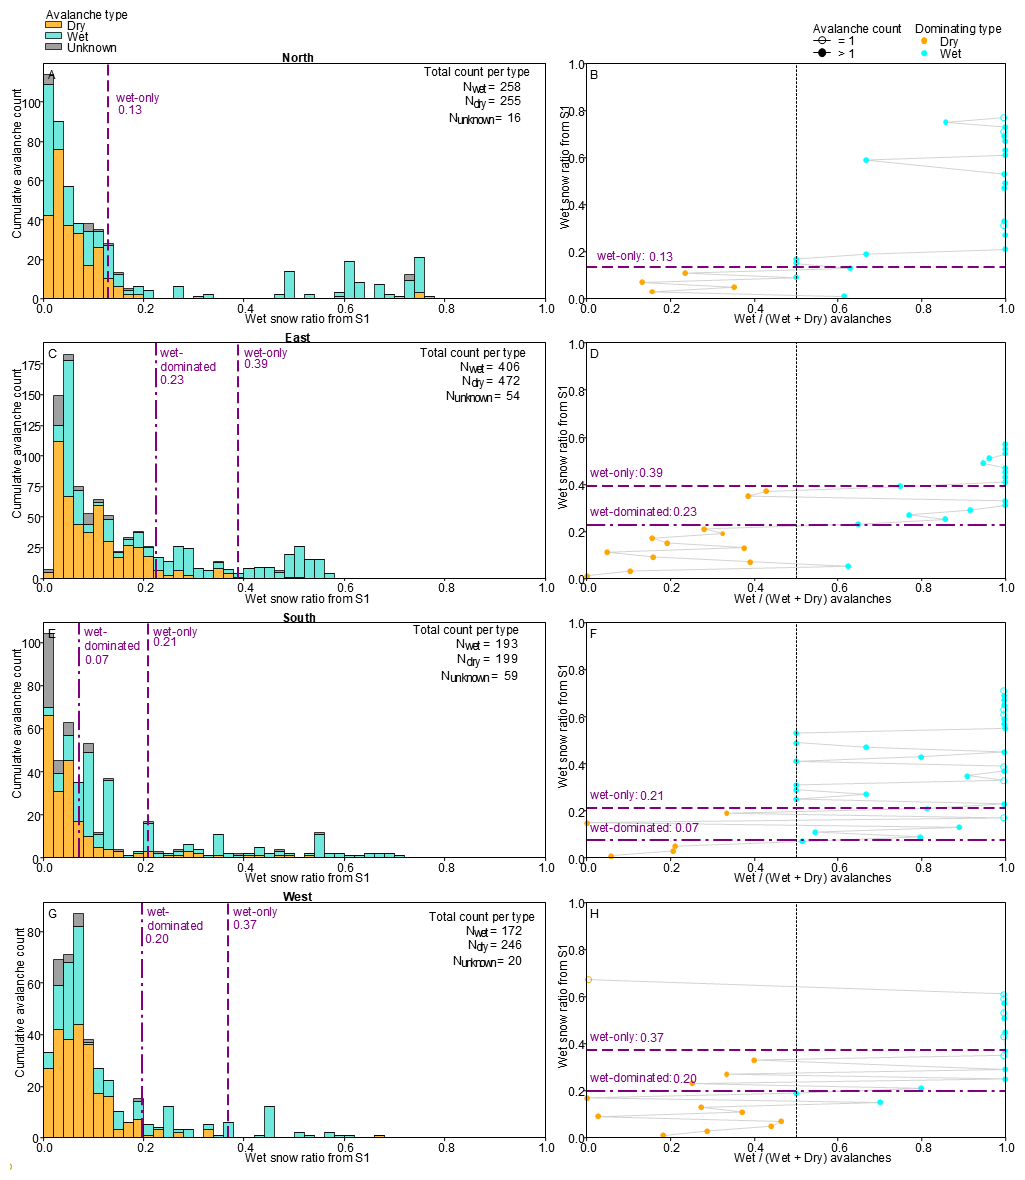
Figure A7Extraction of wet snow ratio thresholds from S1 using the LRW approach. Left column: Total avalanche count per type in comparison to wet snow ratio and the extracted wet-dominated and wet-only transition lines after applying gaussian distribution. Right column: Wet snow ratio in comparison to dominating type. The extracted thresholds only consider wet and dry snow (unknown, excluded) and entries when more than one avalanche was present. In case of equal count wet and dry snow avalanches, wet snow was given priority. The four rows show the data parsed by aspect ranges.
A5 Time-elevation evolution of wet snow ratio derived from SWS product
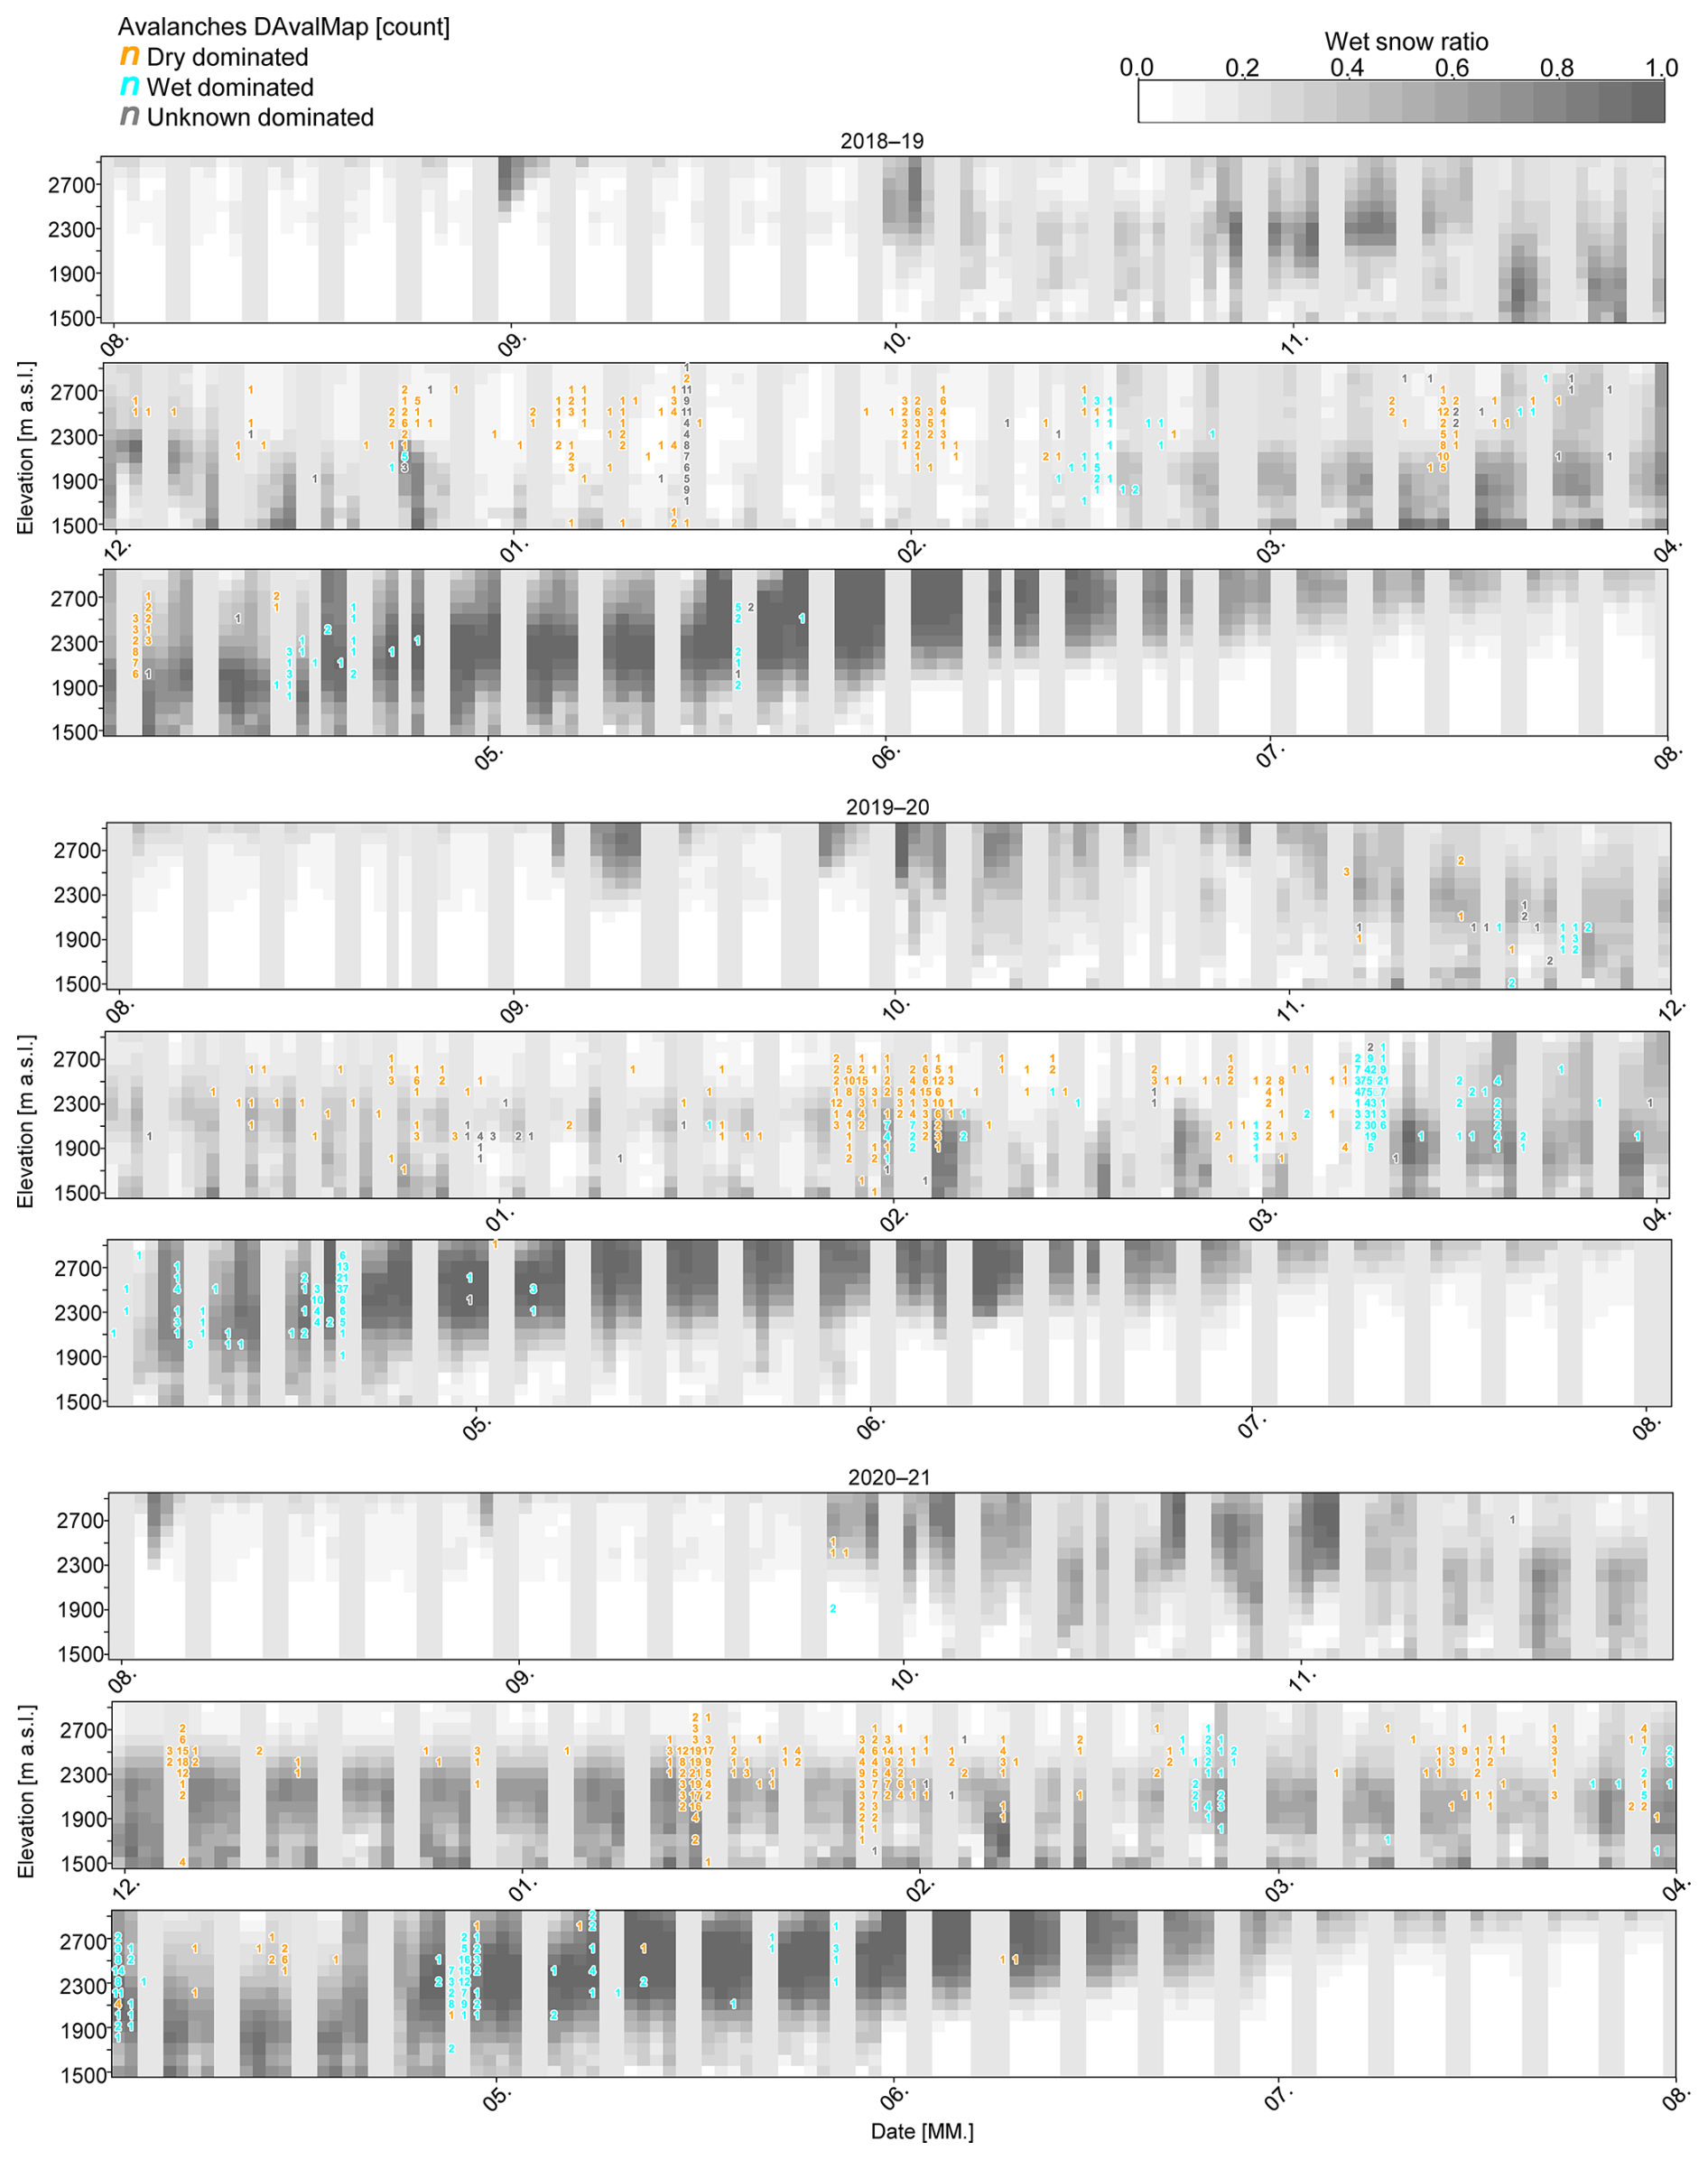
Figure A8Wet snow ratio evolution extracted from the SWS product (European Environment Agency, 2025) over time per elevation on a daily grid across the three melting seasons. Recorded avalanches are superimposed on the plot, with the colours indicating the dominant type of avalanche recorded. Empty columns of no available data are displayed in light gray.
A6 Avalanche probability resolved towards in-situ IMIS station data and modelled SNOWPACK parameters
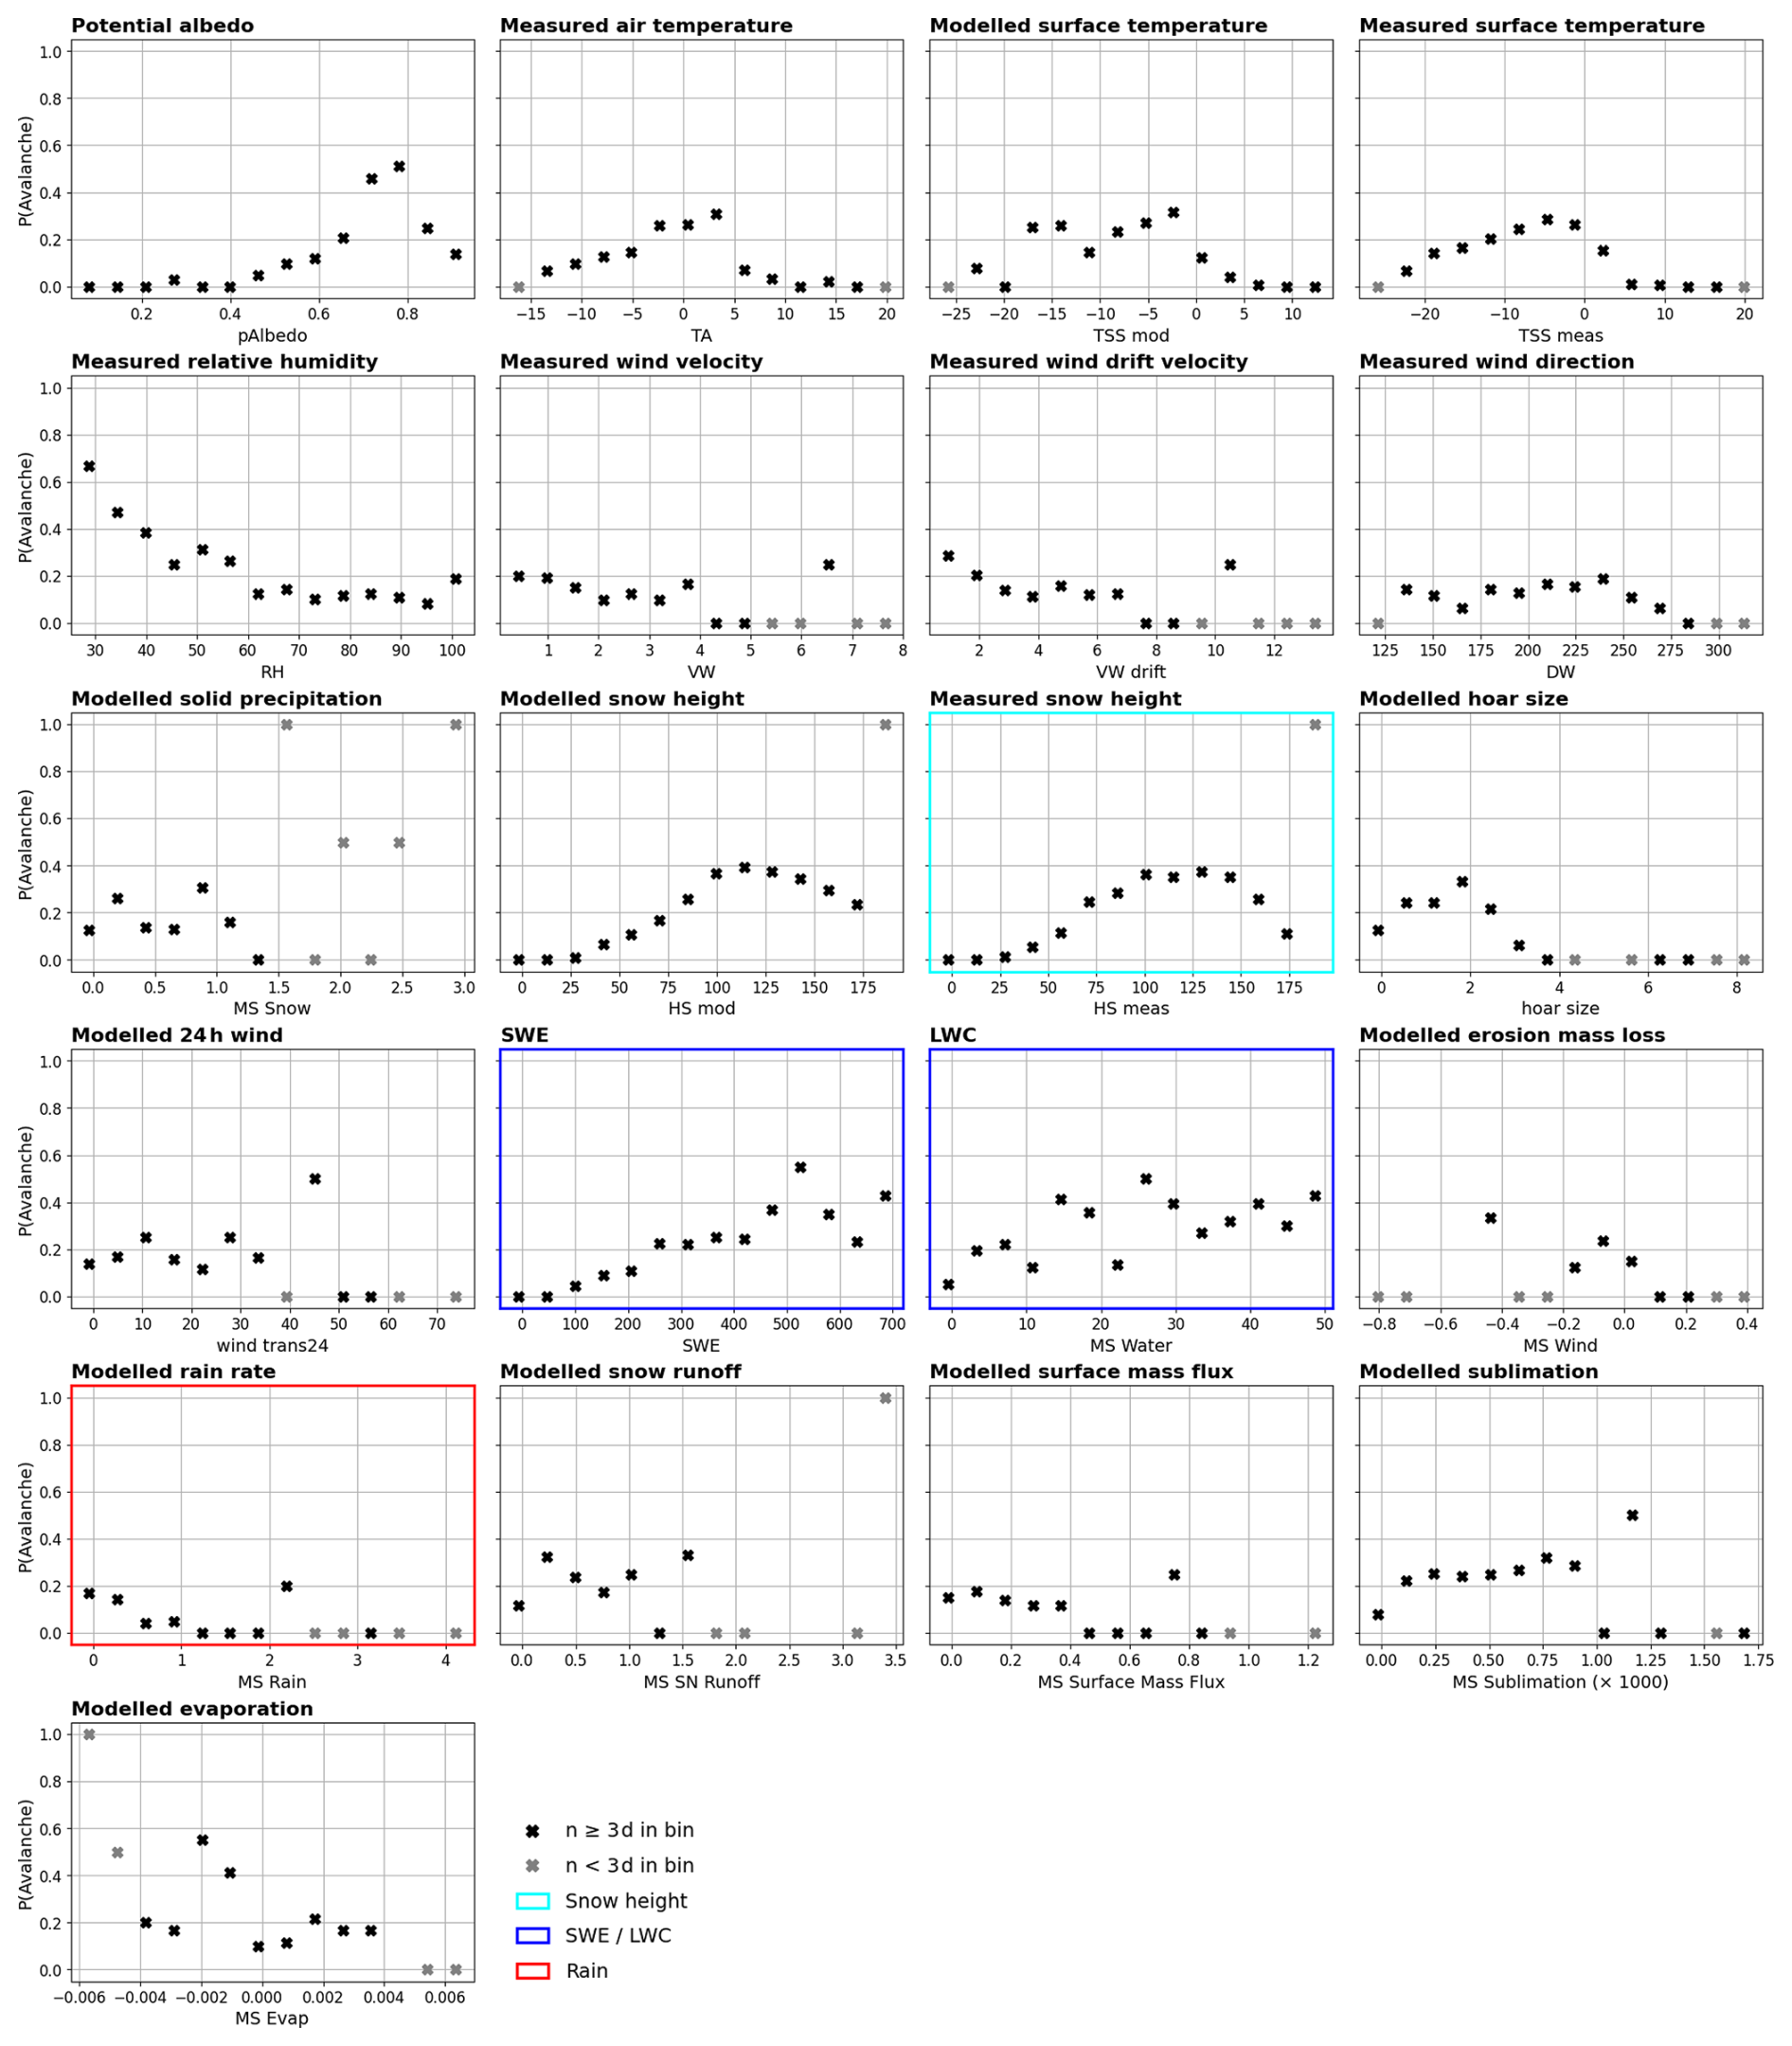
Figure A9Probability of ≥ 1 avalanche report from the DAvalMap dataset as a function of SNOWPACK variables. Each subplot shows the conditional probability of at least one avalanche occurring on a day given a range of values for a specific variable (e.g., “On days with X mm of rain, what's the chance of ≥ 1 avalanche being reported?”). The variable measurement is the mean across the three stations WFJ2, DAV5, SLF2. To calculate probabilities, days were binned by the variable of interest, and the fraction of days with reported avalanches was computed within each bin as the mean of the binary avalanche indicator. This yields an empirical estimate of avalanche probability conditioned on variable ranges. In colours indicated are the variables used in plots and statements in the main text (see Fig. 2).
A7 Visualisation LRW-product to SWS and optical false colour imagery
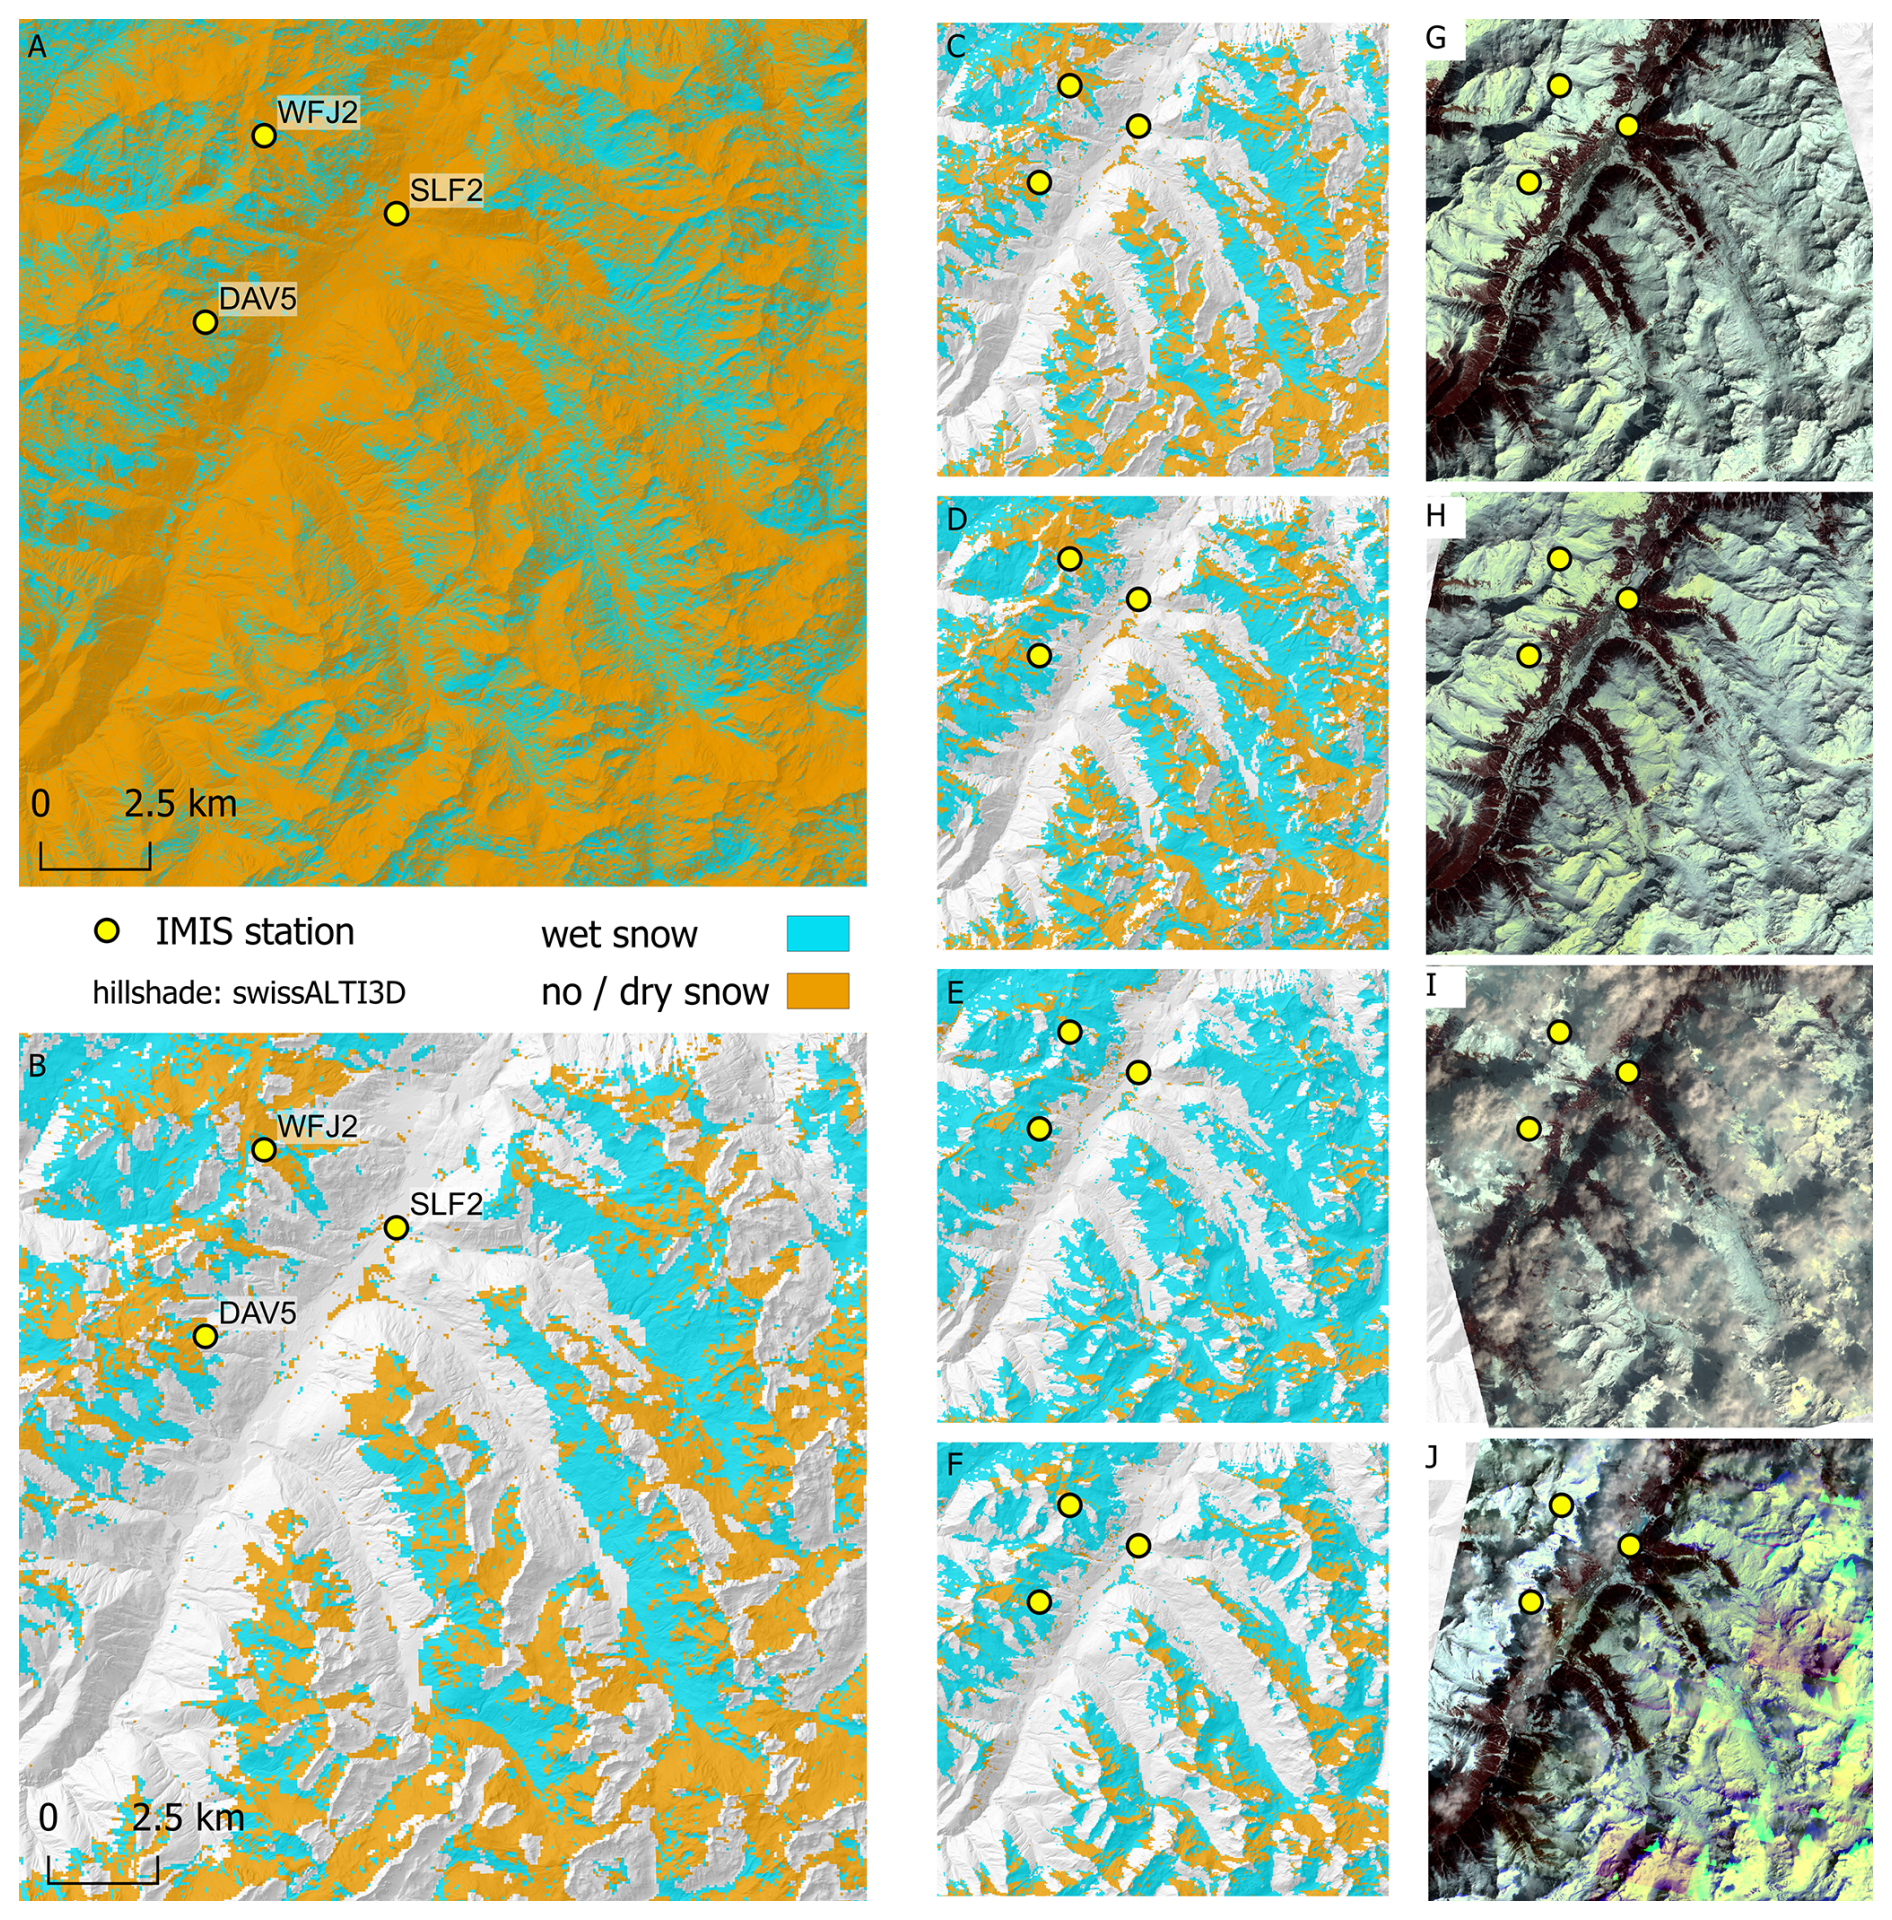
Figure A10Example case (31 March 2021–3 April 2021) of wet snow detection on a visual comparison. The outline of all the images is the same as the research site displayed in Fig. 1B. (A) Based on our processing using LRW, whereas (B) shows pixels usable from SWS layer on the first acquisition day (European Environment Agency, 2025). (C)–(F) show SWS product for the four acquisitions which were used for creating the LRW based product (C) (same as B in different scale): 31 March (D) 1 April, (E) 2 April, (F) 3 April 2021 and (G)–(J) show the corresponding optical imagery from © Planet Labs PBC. Imagery using false colour infrared (Red: NIR, Green: red, Blue: green). Image contains modified Copernicus Sentinel-1 data (2021).
SAR data can be downloaded from the Copernicus Open Access Hub or from the Alaska Satellite Facility. SAR processing has been performed using the gamma software (Gamma Remote Sensing, 2025). The SNOWPACK data including the forced IMIS station information can be found under Bavay (2026a) with further information on the model under Bavay (2026b). The code used in this study is publicly available on the GitLab repository: https://gitlabext.wsl.ch/alpineremotesensing-public/ccamm-wet-snow (last access: 13 August 2026). This GitLab repository also contains information used from the DAvalMap catalogue (original dataset described in Hafner et al., 2021).
Conceptualisation: AM, MJ; Data Curation: AM, GD, VB, MR; Formal Analysis, Investigation, Software, Visualization: GD, VB, MR; Methodology: GD, VB, AM, MR, MJ; Project Administration: AM, MJ; Validation: GD, VB, MR, EH; Writing – Original Draft Preparation: GD; Writing – Review and Editing: GD, VB, AM, MJ, MR, MB, EH, AvH; Revisions: GD, AM, MJ, MR, MB, DS; Funding Acquisition: MJ, AvH; Supervision: AM
The contact author has declared that none of the authors has any competing interests.
Publisher's note: Copernicus Publications remains neutral with regard to jurisdictional claims made in the text, published maps, institutional affiliations, or any other geographical representation in this paper. The authors bear the ultimate responsibility for providing appropriate place names. Views expressed in the text are those of the authors and do not necessarily reflect the views of the publisher.
The authors thank Martin Hendrick for discussions on SNOWPACK variables, Yves Bühler for his contribution on funding acquisition and Thomas Stucki for the assistance regarding the DAvalMap catalogue.
This work has been supported by the WSL research program for Climate Change Impacts on Mass Movement (CCAMM, https://ccamm.slf.ch/, last access: 14 August 2026).
This paper was edited by Chris Derksen and Stef Lhermitte and reviewed by two anonymous referees.
Baggi, S. and Schweizer, J.: Characteristics of wet-snow avalanche activity: 20 years of observations from a high alpine valley (Dischma, Switzerland), Nat. Hazards, 50, 97–108, https://doi.org/10.1007/S11069-008-9322-7, 2009. a
Bavay, M.: Snowpack operational reruns 2023 (2023-08), Zenodo [data set], https://doi.org/10.5281/zenodo.19388833, 2026a. a, b
Bavay, M.: Snowpack-3.6.5, Zenodo [data set], https://doi.org/10.5281/zenodo.19258679, 2026b. a, b, c
Bavay, M. and Egger, T.: MeteoIO 2.4.2: a preprocessing library for meteorological data, Tech. rep., 2013, http://models.slf.ch/p/meteoio (last access: 14 August 2026), 2013. a
Bavay, M., Reisecker, M., Egger, T., and Korhammer, D.: Inishell 2.0: Semantically driven automatic GUI generation for scientific models, Geosci. Model Dev., 15, 365–378, https://doi.org/10.5194/gmd-15-365-2022, 2022. a
Bourbigot, M., Johnsen, H., Piantanida, R., Hajduch, G., and Poullaouec, J.: Sentinel-1 product definition, Tech. rep., ISBN S1-RS-MDA-52-7440, 2016. a
Bühler, Y., von Rickenbach, D., Stoffel, A., Margreth, S., Stoffel, L., and Christen, M.: Automated snow avalanche release area delineation – validation of existing algorithms and proposition of a new object-based approach for large-scale hazard indication mapping, Nat. Hazards Earth Syst. Sci., 18, 3235–3251, https://doi.org/10.5194/nhess-18-3235-2018, 2018. a
Carletti, F., Marin, C., Ghielmini, C., Bavay, M., and Lehning, M.: Multitemporal analysis of Sentinel-1 backscatter during snowmelt using high-resolution field measurements and radiative transfer modelling, The Cryosphere, 19, 5579–5612, https://doi.org/10.5194/tc-19-5579-2025, 2025. a, b, c
Cluzet, B., Magnusson, J., Quéno, L., Mazzotti, G., Mott, R., and Jonas, T.: Exploring how Sentinel-1 wet-snow maps can inform fully distributed physically based snowpack models, The Cryosphere, 18, 5753–5767, https://doi.org/10.5194/tc-18-5753-2024, 2024. a
Copernicus Data Space Center: Sentinel-1 Documentation, https://documentation.dataspace.copernicus.eu/ (last access: 14 August 2026), 2026. a
Darychuk, S. E., Shea, J. M., and Derksen, C.: Comparison of snowmelt timing estimates from Sentinel-1 SAR and surface observations in British Columbia, Canada, Remote Sens. Environ., 328, 114863, https://doi.org/10.1016/j.rse.2025.114863, 2025. a, b
Detre, A., McGrath, D., Gagliano, E., Bonnell, R., Webb, R., Marshall, H. P., and Shean, D.: Sentinel-1 SAR Estimates of Snowmelt Onset Coincide With SNOTEL Soil Moisture Pulses Across the Western United States, Hydrol. Process., 39, https://doi.org/10.1002/HYP.70341, 2025. a, b, c
Dietz, A. J., Kuenzer, C., Gessner, U., and Dech, S.: Remote sensing of snow – a review of available methods, Int. J. Remote Sens., 33, 4094–4134, https://doi.org/10.1080/01431161.2011.640964, 2012. a
Eckert, N., Corona, C., Giacona, F., Gaume, J., Mayer, S., van Herwijnen, A., Hagenmuller, P., and Stoffel, M.: Climate change impacts on snow avalanche activity and related risks, Nat. Rev. Earth Environ., 5, 369–389, https://doi.org/10.1038/s43017-024-00540-2, 2024. a
EUMETSAT and ECMWF and EEA and Mercator Ocean International: Sentinel-1 – Documentation, European Space Agency, https://documentation.dataspace.copernicus.eu/Data/SentinelMissions/Sentinel1.html (last access: 23 June 2026), 2026. a
European Environment Agency: High Resolution layer: Wet/Dry Snow 2016-present; Algorithm theoretical basis document for snow products based on Sentinel-1 and Sentinel-2, Tech. rep., Pan European high-resolution snow & ice monitoring of the Copernicus land monitoring service, https://land.copernicus.eu/en/products/snow/high-resolution-wet-dry-snow (last access: 14 August 2026), 2023. a, b, c
European Environment Agency: SAR Wet Snow 2016-present (raster 60 m), Europe, NRT, Copernicus Land Monitoring Service, https://doi.org/10.2909/cd23c4bb-b3cb-4331-bb89-93321b46f8ed, 2025. a, b, c, d, e, f, g, h, i
European Space Agency: Mission ends for Copernicus Sentinel-1B satellite, European Space Agency, https://www.esa.int/Applications/Observing_the_Earth/ (last access: 14 August 2026), 2022. a
Federal Office of Topography and Swisstopo: swissALTI3D: The high precision digital elevation model of Switzerland, Tech. rep., https://www.swisstopo.admin.ch/en/geodata/height/alti3d.html (last access: 14 August 2026), 2022. a, b
Gamma Remote Sensing: GAMMA Software, https://www.gamma-rs.ch/gamma-software (last access: 9 April 2026), 2025. a
Gao, B. and Ma, W.: Capturing Snowmelt Runoff Onset Date under Different Land Cover Types Using Synthetic Aperture Radar: Case Study of Sierra Nevada Mountains, USA, Appl. Sci. (Switzerland), 14, https://doi.org/10.3390/app14156844, 2024. a, b
Hafner, E. D., Techel, F., Leinss, S., and Bühler, Y.: Mapping avalanches with satellites – evaluation of performance and completeness, The Cryosphere, 15, 983–1004, https://doi.org/10.5194/tc-15-983-2021, 2021. a, b, c, d, e, f
Hendrick, M., Techel, F., Volpi, M., Olevski, T., Pérez-Guillén, C., Herwijnen, A. V., and Schweizer, J.: Automated prediction of wet-snow avalanche activity in the Swiss Alps, J. Glaciol., 50, 1–14, https://doi.org/10.1017/jog.2023.24, 2023. a, b
Hirashima, H., Kamiishi, I., Yamaguchi, S., Sato, A., and Lehning, M.: Application of a numerical snowpack model to estimate full-depth avalanche danger, in: Proceedings of the 2010 International Snow Science Workshop, Squaw Valley, CA, USA, 17–22 October 2010, 47–52, https://arc.lib.montana.edu/snow-science/item/342 (last access: 20 August 2026), 2010. a
IMIS: IMIS measuring network, EnviDat, https://doi.org/10.16904/envidat.406, 2023. a, b
Jafari, M., Sharma, V., and Lehning, M.: Convection of water vapour in snowpacks, J. Fluid Mech., 934, https://doi.org/10.1017/jfm.2021.1146, 2022. a
James, G., Karbou, F., and Durand, P.: Dynamical System Approach for Wet Snow Retrieval in Mountains Using Sentinel-1 SAR Images, IEEE Trans. Geosci. Remote Sens., 62, https://doi.org/10.1109/TGRS.2024.3431191, 2024. a, b
Jans, J. F., Beernaert, E., De Breuck, M., Brangers, I., Dunmire, D., De Lannoy, G., and Lievens, H.: Sensitivity of Sentinel-1 C-band SAR backscatter, polarimetry and interferometry to snow accumulation in the Alps, Remote Sens. Environ., 316, https://doi.org/10.1016/j.rse.2024.114477, 2025. a
Karbou, F., Veyssière, G., Coleou, C., Dufour, A., Gouttevin, I., Durand, P., Gascoin, S., and Grizonnet, M.: Monitoring wet snow over an alpine region using sentinel-1 observations, Remote Sens., 13, 1–22, https://doi.org/10.3390/rs13030381, 2021. a, b, c, d, e, f, g, h, i
Karbou, F., James, G., Fructus, M., and Marti, F.: On the Evaluation of the SAR-Based Copernicus Snow Products in the French Alps, Geosciences, 12, https://doi.org/10.3390/geosciences12110420, 2022. a, b
Köhler, A., Fischer, J. T., Scandroglio, R., Bavay, M., McElwaine, J., and Sovilla, B.: Cold-To-warm flow regime transition in snow avalanches, The Cryosphere, 12, 3759–3774, https://doi.org/10.5194/tc-12-3759-2018, 2018. a
Lehning, M., Bartelt, P., Brown, B., Russi, T., Stöckli, U., and Zimmerli, M.: SNOWPACK model calculations for avalanche warning based upon a new network of weather and snow stations, Cold Reg. Sci. Technol., 30, 145–157, https://doi.org/10.1016/S0165-232X(99)00022-1, 1999. a
Li, S., Huang, L., Bernhard, P., and Hajnsek, I.: Mapping seasonal snow melting in Karakoram using SAR and topographic data, The Cryosphere, 19, 1621–1639, https://doi.org/10.5194/tc-19-1621-2025, 2025. a, b, c, d
Lievens, H., Demuzere, M., Marshall, H.-p., Reichle, R. H., Brangers, I., Rosnay, P. D., Dumont, M., Girotto, M., Immerzeel, W., Jonas, T., Kim, E. J., Koch, I., Marty, C., Saloranta, T., Schöber, J., and De Lannoy, G. J.: Snow depth variability in the Northern Hemisphere mountains observed from space, Nat. Commun., 10, 1–33, https://doi.org/10.1038/s41467-019-12566-y, 2019. a
Linlor, W. I.: Permittivity and attenuation of wet snow between 4 and 12 GHz, J. Appl. Phys., 51, 2811–2816, https://doi.org/10.1063/1.327947, 1980. a
Liu, C., Li, Z., Zhang, P., Huang, L., Li, Z., and Gao, S.: Wet snow detection using dual-polarized Sentinel-1 SAR time series data considering different land categories, Geocarto Int., 37, 10907–10924, https://doi.org/10.1080/10106049.2022.2043450, 2022. a
Liu, Z., Filhol, S., and Treichler, D.: Retrieving snow depth distribution by downscaling ERA5 Reanalysis with ICESat-2 laser altimetry, Cold Reg. Sci. Technol., https://doi.org/10.1016/j.coldregions.2025.104580, 2025. a
Lund, J., Forster, R. R., Deeb, E. J., Liston, G. E., Skiles, S. M. K., and Marshall, H. P.: Interpreting Sentinel-1 SAR Backscatter Signals of Snowpack Surface Melt/Freeze, Warming, and Ripening, through Field Measurements and Physically-Based SnowModel, Remote Sens., 14, https://doi.org/10.3390/rs14164002, 2022. a
Marin, C., Bertoldi, G., Premier, V., Callegari, M., Brida, C., Hürkamp, K., Tschiersch, J., Zebisch, M., and Notarnicola, C.: Use of Sentinel-1 radar observations to evaluate snowmelt dynamics in alpine regions, The Cryosphere, 14, 935–956, https://doi.org/10.5194/tc-14-935-2020, 2020. a, b, c, d, e
Mendes, C. W., Neto, J. A., Hillebrand, F. L., DE FREITAS, M. W., Costi, J., and Simões, J. C.: Snowmelt retrieval algorithm for the Antarctic Peninsula using SAR imageries, Anais da Academia Brasileira de Ciencias, 94, https://doi.org/10.1590/0001-3765202220210217, 2022. a
Mitterer, C. and Schweizer, J.: Analysis of the snow-atmosphere energy balance during wet-snow instabilities and implications for avalanche prediction, The Cryosphere, 7, 205–216, https://doi.org/10.5194/tc-7-205-2013, 2013. a
Morin, S., Horton, S., Techel, F., Bavay, M., Coléou, C., Fierz, C., Gobiet, A., Hagenmuller, P., Lafaysse, M., Ližar, M., Mitterer, C., Monti, F., Müller, K., Olefs, M., Snook, J. S., van Herwijnen, A., and Vionnet, V.: Application of physical snowpack models in support of operational avalanche hazard forecasting: a status report on current implementations and prospects for the future, Cold Reg. Sci. Technol., 170, 102910, https://doi.org/10.1016/j.coldregions.2019.102910, 2020. a
Murfitt, J., Duguay, C., Picard, G., and Lemmetyinen, J.: Forward modelling of synthetic-aperture radar (SAR) backscatter during lake ice melt conditions using the Snow Microwave Radiative Transfer (SMRT) model, The Cryosphere, 18, 869–888, https://doi.org/10.5194/tc-18-869-2024, 2024. a, b
Nagler, T. and Rott, H.: Retrieval of wet snow by means of multitemporal SAR data, IEEE Trans. Geosci. Remote Sens., 38, 754–765, https://doi.org/10.1109/36.842004, 2000. a, b
Nagler, T., Rott, H., Ripper, E., Bippus, G., and Hetzenecker, M.: Advancements for snowmelt monitoring by means of Sentinel-1 SAR, Remote Sens., 8, 1–17, https://doi.org/10.3390/rs8040348, 2016. a, b, c, d, e, f, g
Nagler, T., Rott, H., Ossowska, J., Schwaizer, G., Small, D., Malnes, E., Luojus, K., Metsämäki, S., and Pinnock, S.: Snow cover monitoring by synergistic use of sentinel-3 SLSTR and sentinel-1 SAR data, in: International Geoscience and Remote Sensing Symposium (IGARSS), 8727–8730, https://doi.org/10.1109/IGARSS.2018.8518203, 2018. a
Nagler, T., Schwaizer, G., Keuris, L., Rott, H., Luojus, K., Moisander, M., Small, D., Metsämäki, S., Malnes, E., and Eckerstorfer, M.: SEOM S1-4Sci Snow: Development of Pan-European Multi-Sensor Snow Mapping Methods Exploiting Sentinel-1, Final Report, Deliverable 4.2, Issue/Revision 1.2, ENVEO IT GmbH, Innsbruck, Austria, https://eo4society.esa.int/wp-content/uploads/2021/06/S14SciSnow.D4.2_v1_2_FR.pdf (last access: 18 August 2026), 2021. a
Oveisgharan, S., Zinke, R., Hoppinen, Z., and Marshall, H. P.: Snow water equivalent retrieval over Idaho - Part 1: Using Sentinel-1 repeat-pass interferometry, The Cryosphere, 18, 559–574, https://doi.org/10.5194/tc-18-559-2024, 2024. a
Reuter, B., Hagenmuller, P., and Eckert, N.: Trends in avalanche problems in the French Alps between 1958 and 2020, Cold Reg. Sci. Technol., 238, 104555, https://doi.org/10.1016/J.COLDREGIONS.2025.104555, 2025. a
Schweizer, J., Mitterer, C., Techel, F., Stoffel, A., and Reuter, B.: On the relation between avalanche occurrence and avalanche danger level, The Cryosphere, 14, 737–750, https://doi.org/10.5194/tc-14-737-2020, 2020. a, b, c
Singh, H. and Varade, D.: Inversion of snow geophysical parameters using the VHR PAZ X-band dual polarimetric SAR data: first known experiments in the Himalayan region, Int. J. Appl. Earth Obs., 141, https://doi.org/10.1016/j.jag.2025.104653, 2025. a
Small, D.: Flattening gamma: Radiometric terrain correction for SAR imagery, IEEE Trans. Geosci. Remote Sens., 49, 3081–3093, https://doi.org/10.1109/TGRS.2011.2120616, 2011. a
Small, D.: SAR backscatter multitemporal compositing via local resolution weighting, in: IGARSS 2012, 4521–4524, ISBN 9781467311595, https://doi.org/10.1109/IGARSS.2012.6350465, 2012. a
Small, D., Zuberbühler, L., Schubert, A., and Meier, E.: Terrain-flattened gamma nought Radarsat-2 backscatter, Can. J. Remote Sens., 37, https://doi.org/10.5589/m11-059, 2011. a, b
Small, D., Rohner, C., Miranda, N., Ruetschi, M., and Schaepman, M. E.: Wide-Area Analysis-Ready Radar Backscatter Composites, IEEE Trans. Geosci. Remote Sens., 60, https://doi.org/10.1109/TGRS.2021.3055562, 2022. a, b, c, d, e
Stössel, F., Guala, M., Fierz, C., Manes, C., and Lehning, M.: Micrometeorological and morphological observations of surface hoar dynamics on a mountain snow cover, Water Resour. Res., 46, https://doi.org/10.1029/2009WR008198, 2010. a
Torres, R., Snoeij, P., Geudtner, D., Bibby, D., Davidson, M., Attema, E., Potin, P., Rommen, B. Ã., Floury, N., Brown, M., Traver, I. N., Deghaye, P., Duesmann, B., Rosich, B., Miranda, N., Bruno, C., L'Abbate, M., Croci, R., Pietropaolo, A., Huchler, M., and Rostan, F.: GMES Sentinel-1 mission, Remote Sens. Environ., 120, 9–24, https://doi.org/10.1016/j.rse.2011.05.028, 2012. a
Truckenbrodt, J., Freemantle, T., Williams, C., Jones, T., Small, D., Dubois, C., Thiel, C., Rossi, C., Syriou, A., and Giuliani, G.: Towards sentinel-1 SAR analysis-ready data: A best practices assessment on preparing backscatter data for the cube, Data, 4, https://doi.org/10.3390/data4030093, 2019. a
Tsai, Y. L. S., Dietz, A., Oppelt, N., and Kuenzer, C.: Remote sensing of snow cover using spaceborne SAR: A review, Remote Sens., 11, https://doi.org/10.3390/rs11121456, 2019. a
van Herwijnen, A. and Schweizer, J.: Monitoring avalanche activity using a seismic sensor, Cold Reg. Sci. Technol., 69, 165–176, https://doi.org/10.1016/j.coldregions.2011.06.008, 2011. a
Wendleder, A., Dietz, A. J., and Schork, K.: Mapping snow cover extent using optical and SAR data, Tech. rep., ISBN: 9781538671504, 2018. a
Wever, N., Fierz, C., Mitterer, C., Hirashima, H., and Lehning, M.: Solving Richards Equation for snow improves snowpack meltwater runoff estimations in detailed multi-layer snowpack model, The Cryosphere, 8, 257–274, https://doi.org/10.5194/tc-8-257-2014, 2014. a