
the Creative Commons Attribution 4.0 License.
the Creative Commons Attribution 4.0 License.
 | 25 Aug 2026
Asymmetric shifts in seasonal transition timing in a sub-Arctic river system under climate warming
Abolfazl Jalali Shahrood
Amirhossein Ahrari
Ali Torabi Haghighi
Climate warming is altering the timing of snow and ice processes across northern river systems, yet long-term shifts in their seasonal dynamics remain insufficiently resolved. Here, we analyze a 59-year daily record (1 October 1966–30 September 2025) from the River Oulankajoki in northeastern Finland to characterize proxy-based seasonal transitions in discharge, snow depth, and air temperature. Using a rule-based detection framework, we identify earlier shifts in springtime events across snow, discharge, and temperature timings (significant for discharge and temperature). In contrast, autumn/winter timings for those variables exhibit higher year-to-year variability and no consistent trends. The Cooling Dominant Period (CDP) has shortened. Over the record the thermal cooling transition shifted later than snow onset, and the thermal warming transition earlier than snow end. This indicates that thermal proxies are shifting faster than their surface-response counterparts at this site.
- Article
(5775 KB) - Full-text XML
-
Supplement
(878 KB) - BibTeX
- EndNote


The Arctic's cryo-hydrological systems are experiencing significant changes driven by climate warming. Arctic regions are warming at a rate approximately two to four times faster than the global average, with the most pronounced warming occurring during autumn and winter months (García Criado et al., 2025; Masson-Delmotte et al., 2021; Prowse et al., 2007). Annual average temperatures in the Arctic are expected to rise by approximately 3.7 °C by 2050, relative to the 1981–2000 baseline (Prowse et al., 2007). Snow cover extent and duration have generally declined across the Northern Hemisphere in recent decades (Bring et al., 2016), with snow depth and duration projected to continue their downward trends (Burrell et al., 2023). Specifically, Arctic snow cover duration has shortened by approximately 2–4 d per decade over the past 30–40 years, and spring snow cover extent has declined by over 30 % since 1971 (Box et al., 2019). Snowmelt is occurring earlier in many regions, often accompanied by more frequent rain-on-snow events (Park et al., 2016). These changes have also affected the timing of spring freshets, which have shifted earlier in Eurasian basins at a rate of about 1.1 d per decade, while North American basins show no significant trends (Feng et al., 2021).
Cryo-hydrological processes in Arctic river systems are experiencing significant transformations driven by climate change. These widespread changes in river flow patterns are primarily driven by rising air temperatures (Pavelsky and Zarnetske, 2017). The timing and magnitude of spring river flows are shifting, with many Arctic rivers transitioning from a nival to a pluvial regime (i.e., snowmelt-dominated to rainfall-dominated) (Prowse et al., 2006). River ice, a critical element of the cryosphere that significantly impacts the global hydrological system, is highly sensitive to weather and hydrological conditions (Shen, 2016). This sensitivity is particularly evident in the Northern Hemisphere, where by 2010, major ice cover existed on 29 % of total river lengths, and seasonal ice affected approximately 58 % of river lengths (Bennett and Prowse, 2010). Globally, the duration of river ice cover has declined specifically over the past three decades (Newton and Mullan, 2021; Yang et al., 2020), with studies attributing these changes to global warming (Fukś, 2023).
An example is the Danube River, where increasing winter temperatures have reduced its ice cover duration by about 28 d per century (Ionita et al., 2018). Broader analyses using more than 400 000 Landsat images reveal a global average reduction in river ice extent from 10 % to 7.5 % over the last 30 years (Yang et al., 2020). The most substantial reductions in ice cover duration have occurred in northeastern North America, Central Europe, and areas surrounding the Tibetan Plateau (Fukś, 2023). Ice thickness has also shown widespread decline. For instance, major Arctic rivers in Russia experienced reductions in maximum ice thickness ranging from 2.3 to 12.6 cm per decade between 1955 and 2012 (Fukś, 2023). Numerous studies report overall decreases in river ice thickness across various regions (Nalbant and Sharma, 2023; Vuglinsky, 2017; Vuglinsky and Valatin, 2018).
The timing of river ice freeze-up and break-up has been significantly shifting. Many rivers and lakes around the world exhibit later freeze-up dates and earlier break-up times, which leads to a shorter annual ice cover period (Janowicz, 2010; Newton and Mullan, 2021; Rokaya et al., 2019; Sharma et al., 2022; Shiklomanov and Lammers, 2014; Takács and Kern, 2015; Yang et al., 2020). Long-term records spanning the past 150–200 years provide clear evidence of these trends across Northern Hemisphere lakes and rivers, with freeze-up occurring approximately 5.8 d per century later and break-up about 6.5 d per century earlier (Burrell et al., 2023). On average, ice break-up has moved earlier by about 0.6 d per decade since 1850, correlating with a global temperature increase of about 0.12 °C per decade (Fukś, 2023; Magnuson et al., 2000). Freeze-up timing shows greater regional variability, which shows both delayed and earlier occurrences depending on location; however, the dominant global trend is toward later freeze-up dates (Fukś, 2023). Spring and autumn temperatures play critical roles in determining break-up and freeze-up timing, respectively (Brown et al., 2018). Research conducted in the Mackenzie River Delta suggests increasingly earlier spring break-up, with Siberian rivers exhibiting even more pronounced changes than rivers in North America (Podkowa et al., 2023). These shifts are driven primarily by rising springtime air temperatures and indirectly by enhanced river discharge from increased snowmelt (Bieniek et al., 2011; Brown et al., 2018).
Shifts in river ice regimes are disrupting both ecosystems and human activities in the Arctic. Earlier ice break-up and reduced ice cover alter seasonal flooding, nutrient transport, and thermal conditions in aquatic systems, that might affect fish habitats and species composition (Prowse et al., 2006; Yang et al., 2020). These changes also threaten traditional practices, winter transportation, and water resource availability in northern communities (Brown et al., 2018; Fukś, 2023). On land, permafrost thaw is reshaping vegetation, while aquatic ecosystems experience species shifts and declines in fish condition (Lehnherr et al., 2018; Liljedahl et al., 2016).
River ice and cold-climate hydrological processes are important indicators of climate change in Arctic regions, yet their potential is limited by persistent data gaps. River discharge data offer a useful proxy, with the timing and magnitude of spring flows reflecting changes in ice break-up. Increased spring discharge typically accelerates break-up, while autumn and early winter flows influence freeze-up timing (Feng et al., 2021; Park et al., 2016). Among climate variables, air temperature is the dominant driver of ice regimes, strongly correlating with both freeze-up and break-up events (Ionita et al., 2018; Shiklomanov and Lammers, 2014). The freezing index, based on cumulative sub-zero temperatures, is commonly used to estimate ice thickness and seasonal transitions. Specifically, spring temperatures play a critical role in predicting break-up dates (Park et al., 2016). Snow cover is another key proxy, with declining winter snow depths and shorter durations contributing to earlier break-up through reduced surface albedo and enhanced melt (Bring et al., 2016; Lesack et al., 2014). Together, these variables indicate the value of integrating hydrological and climatic data to monitor cryospheric change.
There is a significant shortage of consistent hydrological observations related to river ice across the Arctic, particularly in remote regions (Podkowa et al., 2023). Long-term records of freeze-up and break-up dates, as well as ice thickness, are scarce and often fragmented, that limits the ability to detect robust climate trends (Feng et al., 2021; Park et al., 2016). The decline in river gauging stations since the mid-1980s, especially in Russia and Canada, has further reduced the availability of continuous datasets (Prowse et al., 2007). Inconsistencies in data collection methods and definitions, such as differing criteria for the start or end of ice events, complicate trend analysis and comparisons across regions (Sharma et al., 2022; Yang et al., 2020). For example, some observations record initial break-up, while others note complete ice clearance, a process that may span several weeks (Prowse et al., 2007). These methodological disparities, combined with reduced ground-based monitoring, hinder efforts to separate climate change signals from natural variability and challenge the integration of datasets at the pan-Arctic scale.
Given the persistent data gaps and inconsistencies in direct river ice observations, proxy variables such as air temperature, river discharge, and snow cover have become essential for assessing changes in ice dynamics. These proxies are particularly important in regions where long-term observational records are sparse or incomplete. In response to this challenge, the present study builds on the River Ice Timing Characteristics and Extremes (RiTiCE) framework developed in MATLAB (Jalali Shahrood et al., 2023) to characterize long-term proxy-based transition timing in the River Oulankajoki in northern Finland. RiTiCE is a rule-based framework that detects Phase Change Timings (PCTs) from daily discharge, snow depth, and air temperature time series. From these PCTs, Intra-Variable Intervals (IVIs) and Cross-Variable Intervals (CVIs) are derived to describe timing relationships between thermally-derived (i.e., air temperature) and surface response (i.e., discharge and snow depth) transitions. In this study, PCTs are grouped into an onset-group (autumn/winter transitions) and a release-group (spring transitions). RiTiCE has been validated across multiple Arctic and sub-Arctic river systems, including the Tornionjoki, Kiiminkijoki, Kemijoki, and Tana rivers (Jalali Shahrood, 2023; Jalali Shahrood et al., 2024). This study aims to answer the following research questions:
-
How have the PCTs shifted over the observational record?
-
How have the derived IVIs and CVIs changed, and do these changes differ between the onset-group and the release-group?
-
How has the temporal coupling between thermally-derived PCTs and their surface response evolved in terms of the direction and magnitude of cross-variable timing offsets?
2.1 Phase Change Timings (PCTs)
RiTiCE is applied to annual daily time series of discharge, snow depth, and air temperature to detect transition timings in each variable. Input data must be prepared under consistent preprocessing rules and analyzed using variable-specific transition detection methods.
The datasets must be prepared as follows:
-
Leap days (29 February) must be removed to maintain a uniform 365 d structure across all years.
-
Data must be reorganized by Water Year (WY), defined from 1 October to 30 September.
Note: Each water year is named for its starting calendar year; for example, WY1966 spans 1 October 1966 to 30 September 1967, and the full record WY1966–WY2024 covers 1 October 1966 to 30 September 2025.
RiTiCE detects PCTs, IVIs, and CVIs from annual daily time series of discharge, snow depth, and air temperature. The timings may not necessarily correspond directly to observed processes such as ice formation, break-up, or snowmelt but were earlier tested against recorded ice condition data in previous studies (Jalali Shahrood et al., 2023, 2024). The timings at which a variable undergoes detected transition are referred to as PCTs and defined in Table 1.
From PCTs, two types of derived metrics are constructed: (i) IVIs which describe durations between PCTs within a single variable, and (ii) CVIs, which quantify signed timing offsets between two PCT dates from different variables. IVIs and CVIs are summarized in Tables S1–2. We report only the primary IVIs defined between each variable's PCTs; their complementary intervals are deterministic 365 d complements and therefore redundant.
Table 1Summary of PCTs detected by RiTiCE, their definitions, variables used and methods applied. Legacy labels (e.g., FUD, BUD, SBD, SMD, TTP−/TTP+) are omitted to avoid misinterpretation of PCTs as direct representations of freeze-up, break-up, or snowmelt events.
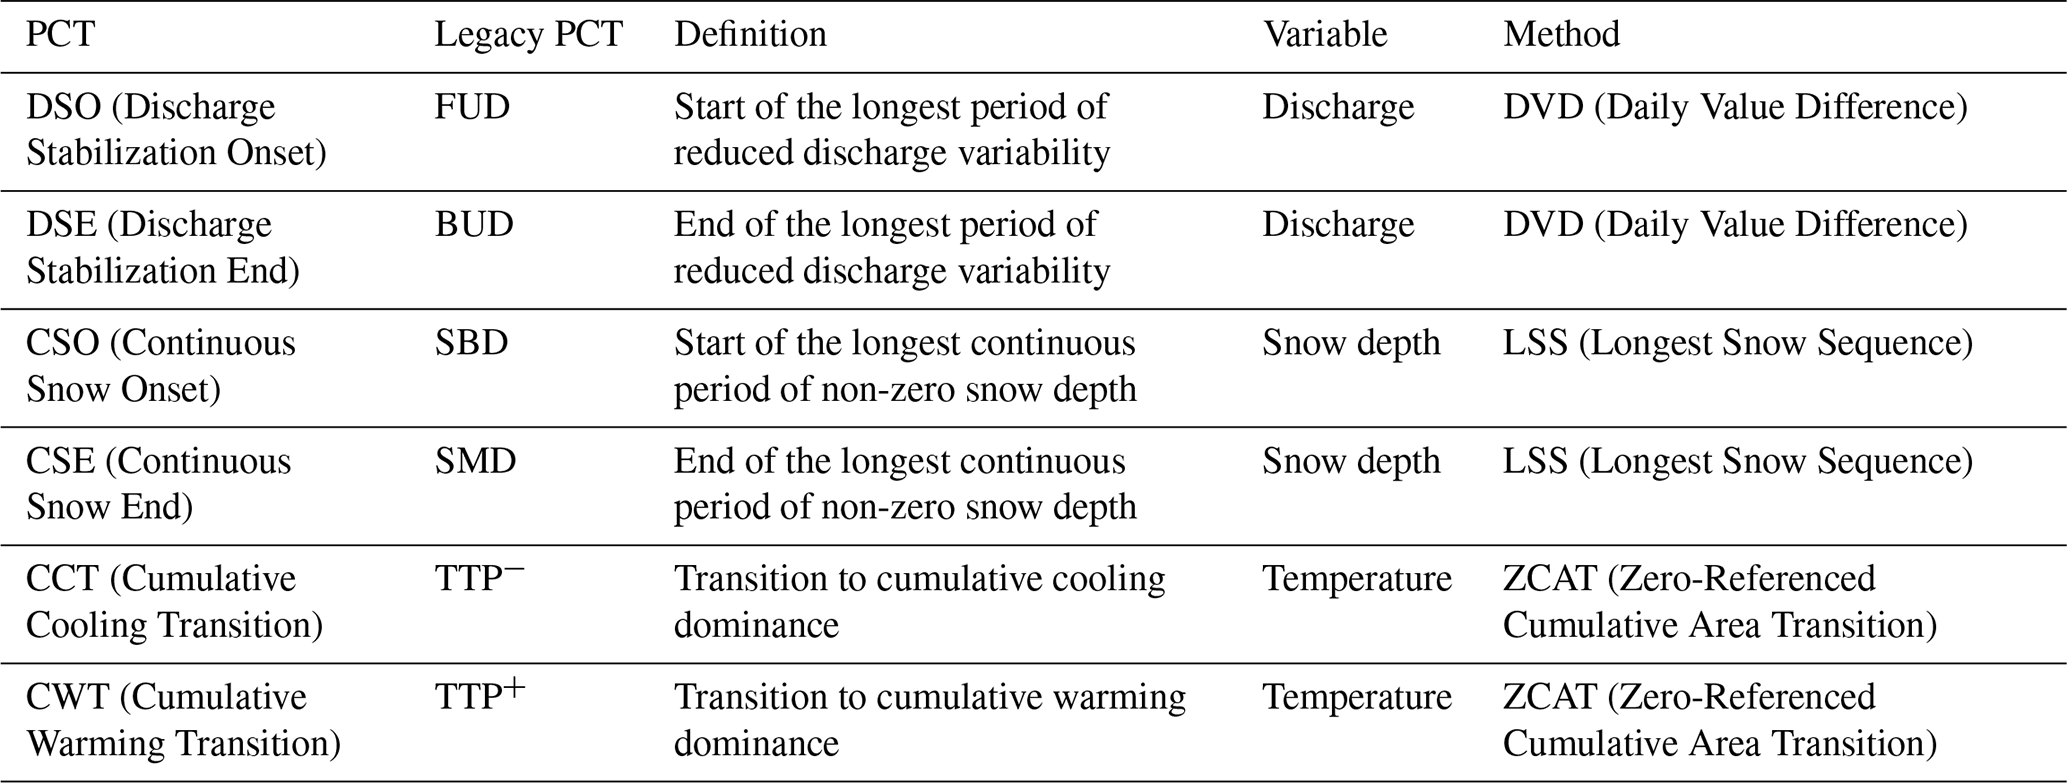
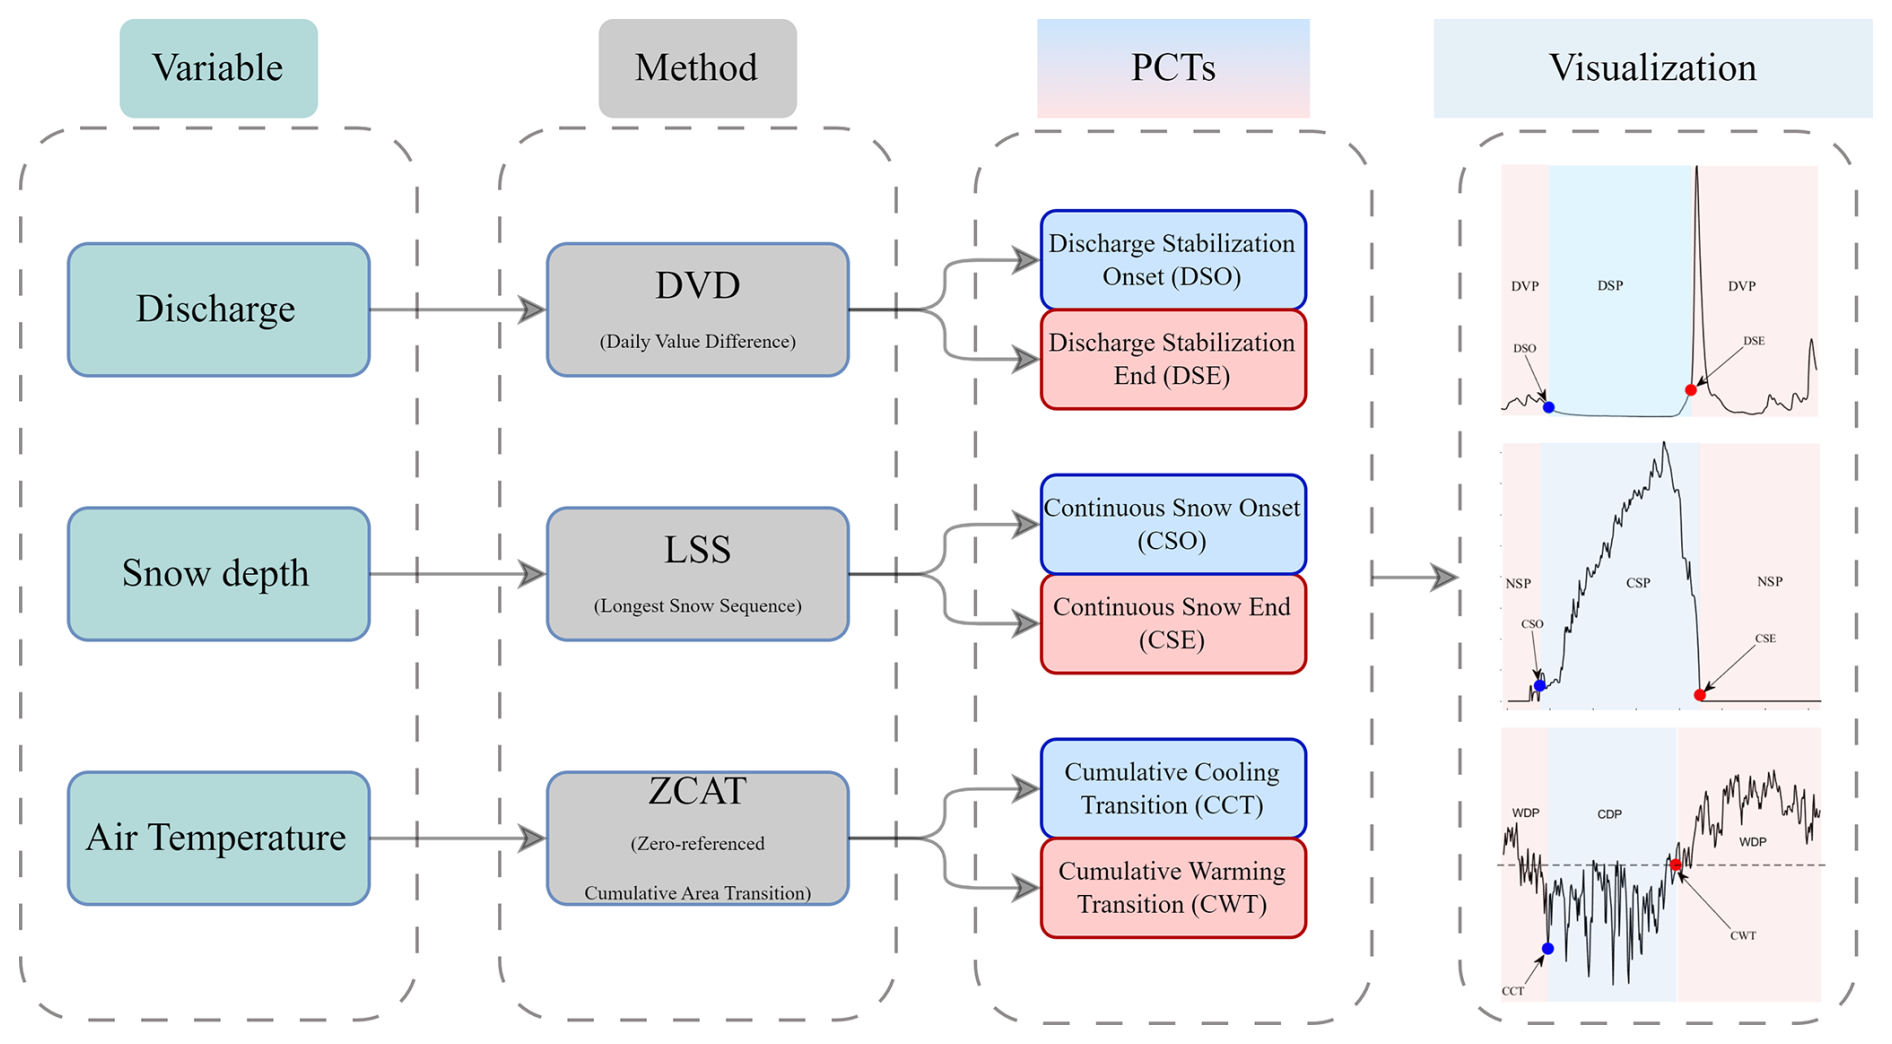
Figure 1 summarizes how RiTiCE detects PCTs and IVIs from daily time series. Three variables of discharge, snow depth, and air temperature are processed using variable-specific methods. The DVD method detects Discharge Stabilization Onset and End (DSO, DSE), LSS identifies Continuous Snow Onset and End (CSO, CSE), and ZCAT defines Cooling and Warming Transitions (CCT, CWT). Each PCT pair defines an IVI, Discharge Stability Period (DSP: DSO–DSE), Continuous Snow Period (CSP: CSO–CSE), and Cooling Dominant Period (CDP: CCT–CWT).
2.2 Discharge Phase Change Timings (PCTs): Discharge Stabilization Onset and End (DSO & DSE)
In RiTiCE, DSO and DSE represent transition timings inferred from changes in discharge variability rather than direct observations of river ice conditions. DSO and DSE capture changes in discharge variability that may be associated with ice-related processes, but are not equivalent to visually observed freeze-up or break-up dates as defined by the International Association for Hydraulic Research (IAHR, 1980); although they can be compared with those reported in earlier studies (Jalali Shahrood et al., 2023, 2024).
Discharge stabilization is detected using the Daily Value Difference (DVD) method. Daily changes in discharge were computed between consecutive days as forward differences:
Note: An equivalent backward-difference definition uses the same consecutive-day differences with a one-day index shift and therefore yields the same stability structure; detected DSO/DSE are not materially sensitive to this choice.
For each WY (365 d), this yields N=364 day-to-day changes in discharge ΔQt. Variability of ΔQt across the entire WY is summarized by:
We classify day-to-day changes as stable when |ΔQt|≤σΔQ. DSE is taken as the day of WY corresponding to the end of the longest contiguous sequence of stable daily changes in the full WY, with day indices obtained by applying a consistent one-day offset to the ΔQt series.
In a second step, discharge and day-to-day changes are restricted to the period before DSE, a separate variability threshold is computed from those pre-DSE day-to-day changes only, and DSO is taken as the start of the longest contiguous stable segment under that pre-DSE threshold (with one-day offset). A pre-DSE threshold is used because the full-water-year variability of day-to-day discharge changes is dominated by the spring freshet, which is the largest source of day-to-day change in the annual hydrograph. Under a single full-water-year threshold, the low-variability winter recession can satisfy the stability criterion only a day or two into the water year in some years, placing DSO implausibly early. Restricting the threshold to the pre-DSE differences, from which the freshet is excluded, yields a stricter variability scale that locates DSO at the onset of the sustained winter recession. DSO is constrained to occur before DSE. DSP is then defined as the interval between DSO and DSE (DSP ). DSE is the end day of the longest full-water-year stable run, and DSO is the start day of the longest pre-DSE stable run; when several runs share the maximum length, the earliest is selected. In this record the two runs lie within a single contiguous stable segment in all 59 water years, so DSP = DSE − DSO represents a single continuous discharge-stability period (Fig. 2).
where Qt: discharge on day t (m3 s−1), ΔQt: day-to-day change (m3 s−1), N=364: number of day-to-day changes in a 365 d WY, : mean of ΔQt over the WY, tk = indices of the longest contiguous run in the full WY with |ΔQt|≤σΔQ, sk = indices of the longest contiguous run before DSE with , σΔQ: standard deviation of ΔQt over the full WY (used for DSE), : standard deviation of ΔQt computed on day-to-day changes before DSE (used for DSO).
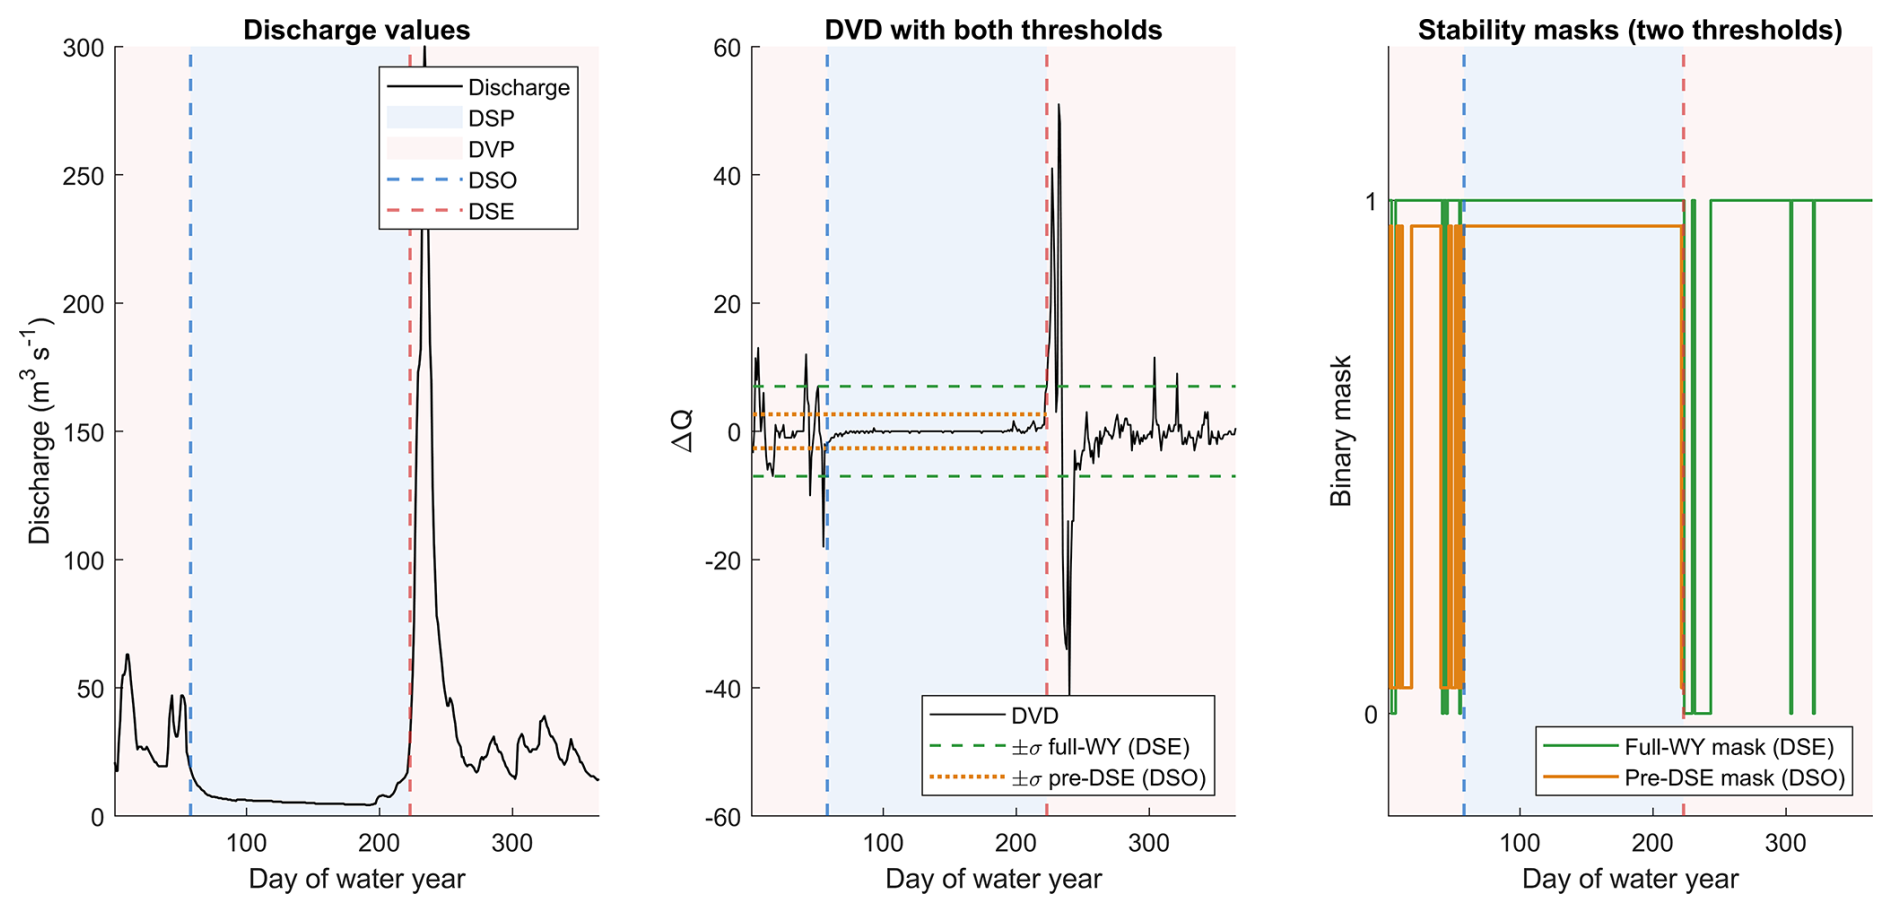
Figure 2Detection of Discharge Stabilization Onset (DSO) and Discharge Stabilization End (DSE) by the Daily Value Difference (DVD) method, illustrated for WY1966. (Left) Daily discharge with DSO (blue dashed line) and DSE (red dashed line); the Discharge Stability Period (DSP) is shaded blue and the complementary Discharge Variability Period (DVP) pink. (Centre) Day-to-day discharge changes (DVD) with both variability thresholds: the full-water-year ±σ band (green dashed), used to locate DSE as the end of the longest full-water-year stable run, and the stricter pre-DSE ±σ band (orange dotted), used to locate DSO as the start of the longest stable run before DSE. (Right) The two corresponding binary stability masks: the full-water-year mask (green, for DSE) and the pre-DSE mask (orange, for DSO); a day is stable (mask = 1) when its DVD value lies within the relevant band, otherwise unstable (mask = 0). The pre-DSE mask in the third panel follows the same binary logic of Full-WY mask (0 and 1) but for better readability its height is manually reduced in this figure.
2.3 Snow Depth Phase Change Timings (PCTs): Continuous Snow Onset and End (CSO & CSE)
To determine the timing of persistent snow cover, we apply the Longest Snow Sequence (LSS) method (Fig. 3). A binary snow presence mask is generated from daily snow depth values, where each day is assigned a value of 1 if snow is present (S≠0) and 0 otherwise:
LSS identifies the longest Mt=1 segment and hence CSO and CSE; CSP is then the period between CSO and CSE:
where: St= Snow depth on day t (in cm), for t ∈ {1, 2, …, 365}, Mt= Binary snow presence mask, [tstart, tend] = Indices of the longest continuous subsequence such that Mt=1 for all t∈ [tstart, tend],
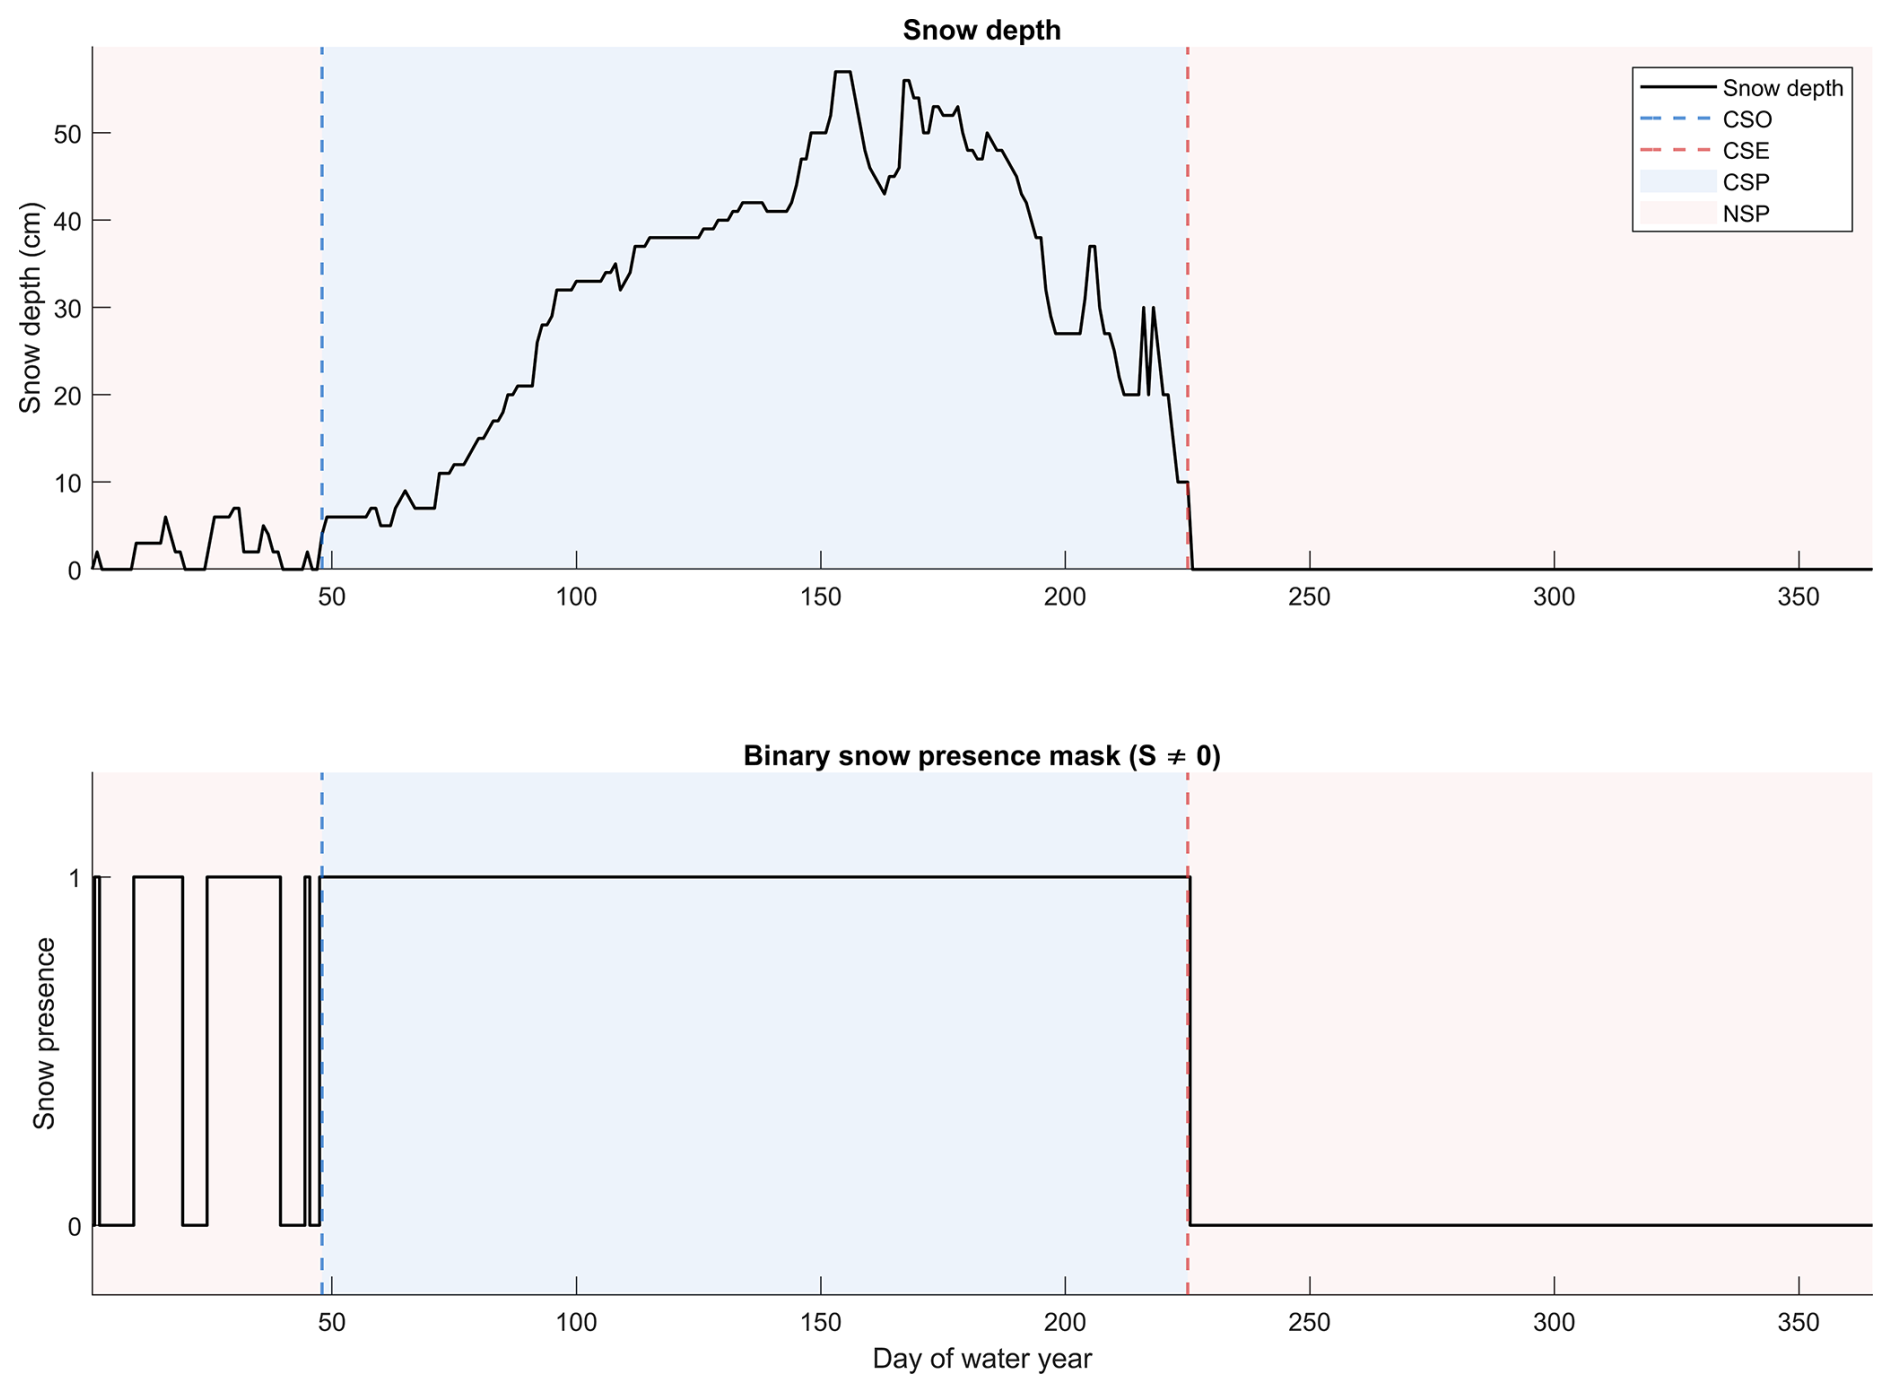
Figure 3Detection of Continuous Snow Onset (CSO) and Continuous Snow End (CSE) from snow depth data. (Top) Daily snow depth with CSO (blue dashed line) and CSE (red dashed line). (Bottom) Binary snow presence mask used to identify the longest Continuous Snow Period (CSP).
2.4 Air Temperature Phase Change Timings (PCTs): Cumulative Cooling and Warming Transitions (CCT & CWT)
Temperature transitions are characterized using the Zero-Referenced Cumulative Area Transition (ZCAT) method, which captures the integrated thermal state by accumulating daily areas between the temperature curve and the 0 °C baseline (Fig. 4). ZCAT is used because it returns a single within-year transition date for each of the cooling and warming phases directly from the cumulative curve. Freezing and thawing degree-day sums (FDD and TDD) quantify accumulated thermal energy in °C days but do not by themselves define a transition date without an additional threshold or breakpoint rule. FDD and TDD are therefore reported separately as complementary thermal context rather than as timing definitions. For each day t, the area between day t and t+1 is computed using the trapezoidal rule:
The cumulative temperature area is then given by:
where Tt= daily mean temperature on day t, At= area contribution between day t and t+1, Ct= Cumulative curve, CCT = the last zero-crossing of Ct prior to CWT, marking the transition from cumulative warming to cumulative cooling dominance, CWT = the day at which Ct reaches its minimum, marking the transition from cumulative cooling to cumulative warming dominance.
Note: In one water year (WY2009), Ct did not cross zero within the water-year window, and CCT defaulted to the first day of the water year. Inspection of the preceding water year showed that the corresponding zero-crossing fell at the end of September, just before the water-year boundary. Because this affects a single year, the water-year definition and the ZCAT procedure are kept unchanged in this study.
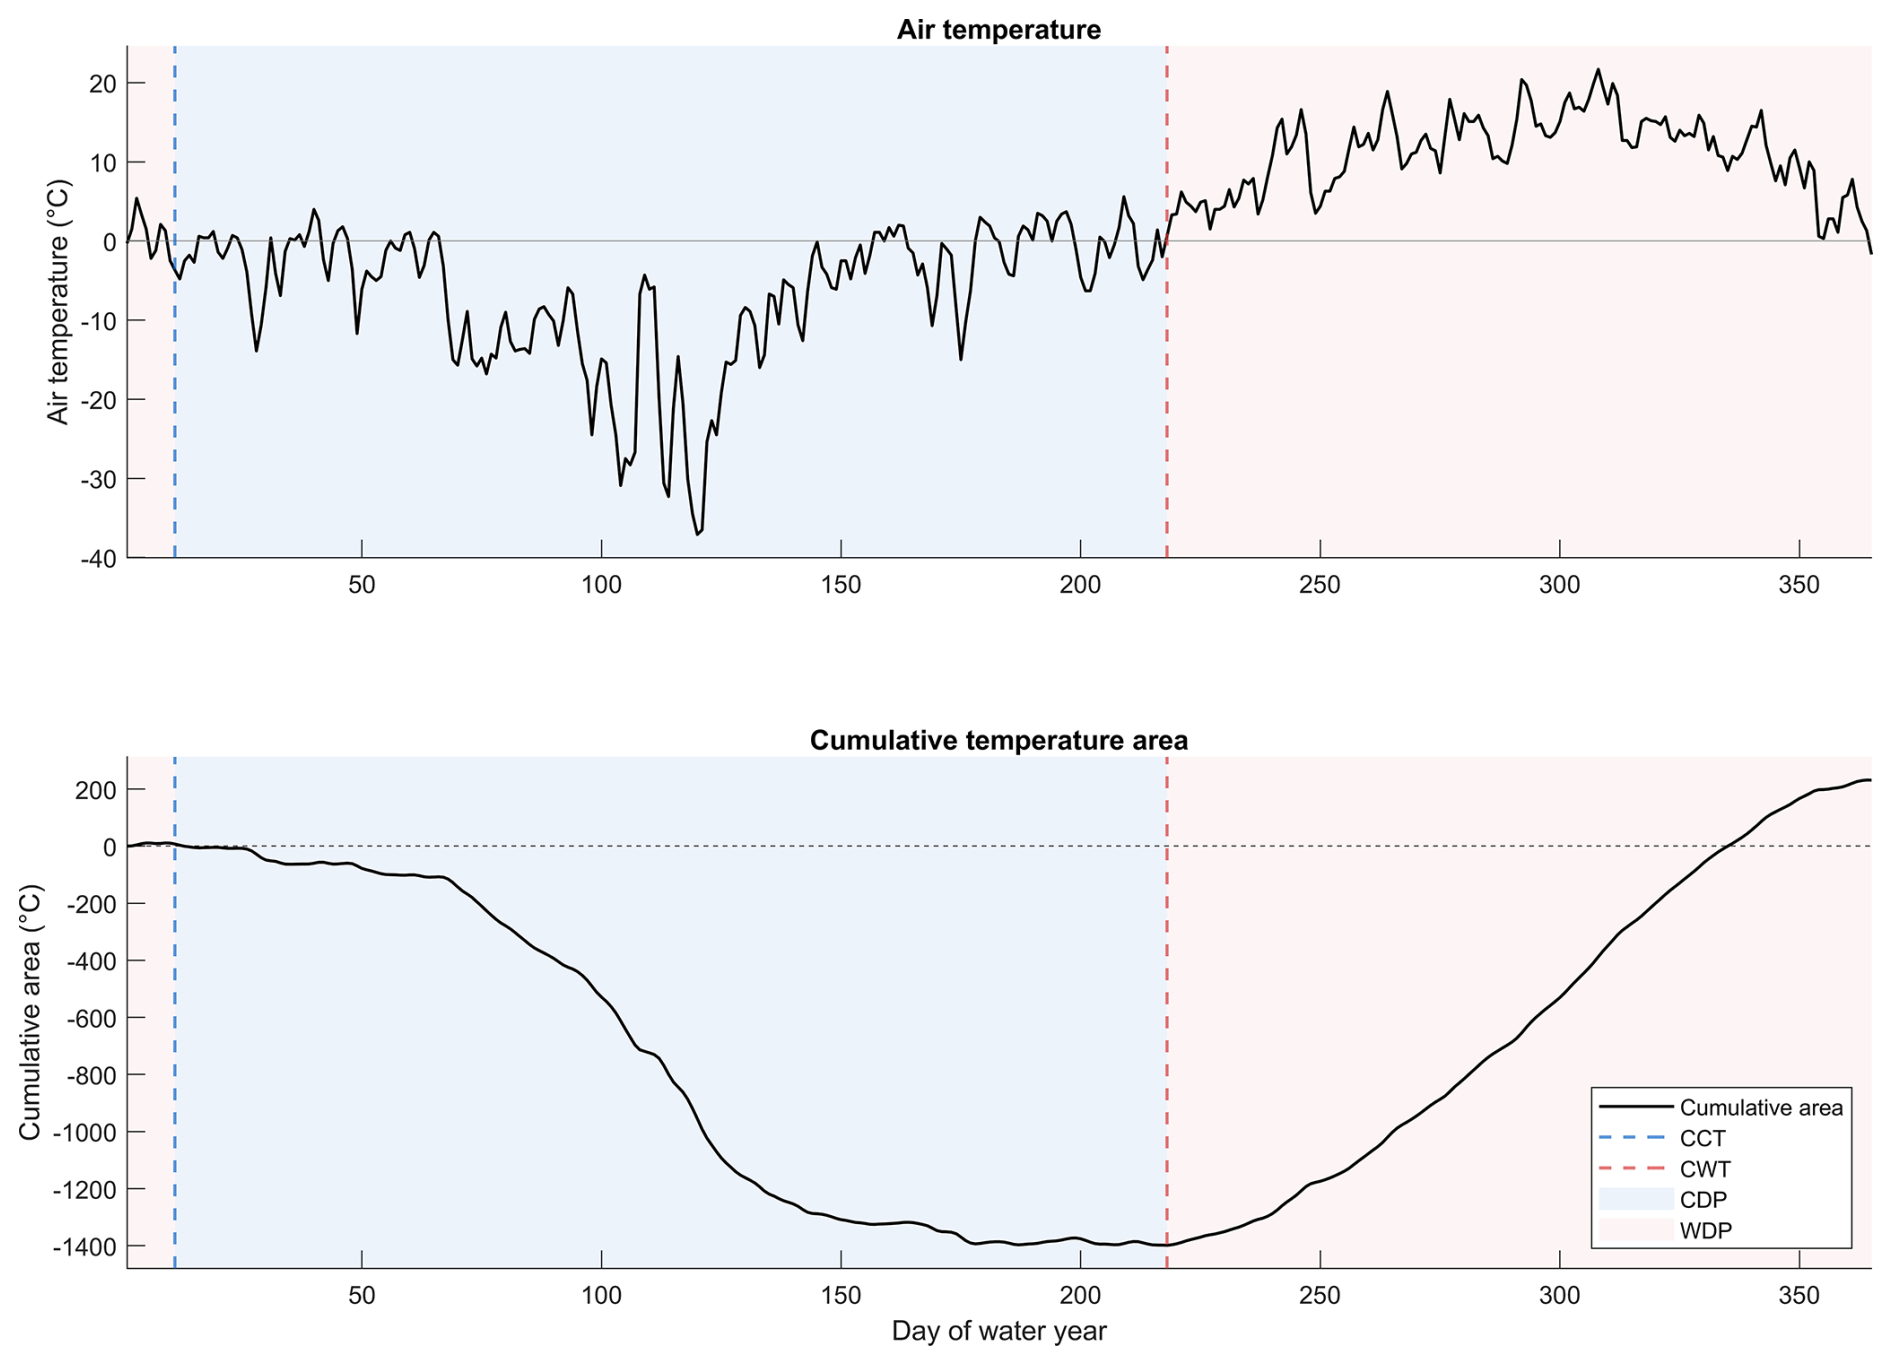
Figure 4Detection of Cumulative Cooling Transition (CCT) and Cumulative Warming Transition (CWT) using Zero-Referenced Cumulative Area Transition (ZCAT). (Top) Daily air temperature. (Bottom) Cumulative temperature curve, used to detect CCT & CWT. As At is computed between t and t+1, reported transition days follow the same +1 index mapping.
2.5 Data
Daily air temperature and snow depth records were obtained from the Finnish Meteorological Institute (FMI) Open Data Portal (Finnish Meteorological Institute, 2026), specifically from the Kuusamo Kiutaköngäs weather station (66°22′4′′ N, 29°19′40′′ E), about 500 m away from the Oulanka Research Station. These records span from October 1966 to September 2025 (WY1966–WY2024). Snow depth is recorded in whole centimeters. The FMI code −1 denotes a trace (snow present but below the 1 cm measurement resolution) and was recoded to 0 for the continuous-snow-cover analysis. A total of 35 non-consecutive days across the WY1966–WY2024 window (12 d with missing values on recorded dates and 23 absent calendar dates) were linearly interpolated to maintain a complete 365 day-per-year series. The observational accuracy for snow depth is ±2 cm, and the record resolutions is 1 cm (whole centimeters). Since CSO and CSE are defined by the longest continuous run of snow presence, they are governed by the sustained winter snowpack rather than by ±2 cm noise near the 1 cm presence threshold. Daily river discharge measurements were acquired from the Oulanka Research Station (daily mean), hosted by the Finnish Environment Institute (SYKE, 2026). Winter discharge values in the Hertta database are flagged as “Redukoitu” (quality code “=”), meaning they are estimates derived from post-processing corrections applied when ice conditions affect the rating curve relationship. The DVD-based proxies (DSO, DSE) are therefore derived from a quality-controlled rather than a directly measured record, and DSO/DSE should be interpreted as discharge regime transition proxies rather than direct ice phenology dates.
In addition to discharge, snow depth, and air temperature used for RiTiCE, we analyzed ancillary datasets of water temperature and ice thickness (available for limited periods). These records are operationally constrained (e.g., seasonal deployment, access/safety, and quality control) and therefore are not treated as direct freeze-up/break-up observations. Instead, they are used as operational context to assess whether the PCTs occur in a plausible seasonal neighborhood relative to these operations, and not as validation of the proxy timings (Fig. S2). The ancillary datasets were obtained from SYKE open data platform (SYKE, 2026).
2.6 Trends and correlations analysis
Long-term monotonic trends in annual PCT, IVI, and CVI series, and in the hydroclimatic extremes, were tested using the Mann–Kendall test (Kendall, 1975; Mann, 1945). To reduce potential inflation of significance arising from serial autocorrelation, each series was pre-whitened by removing the AR(1) component prior to testing (Von Storch, 1999). This pre-whitened Mann–Kendall procedure is referred to as PW-MK throughout results. Statistical significance was evaluated at p<0.05. Trend magnitude was quantified using Sen's slope (Sen, 1968; Theil, 1950), reported in the native units of each metric (days yr−1 for PCTs and IVIs; signed days yr−1 for CVIs). As many series are tested, we controlled the false discovery rate within predefined families of related tests (the six PCT trends, the three IVI trends, the six CVI trends, the three seasonal air-temperature trends, the degree-day trends, and the hydroclimatic extreme-value trends) using the Benjamini–Hochberg procedure (Benjamini and Hochberg, 1995). We report the Benjamini–Hochberg q-value alongside the uncorrected p-value. Our main conclusions rest on trends that are individually strong and remain significant after this correction; trends that are nominally significant (uncorrected p<0.05) but fall just above the corrected threshold (q>0.05) are reported with their q-values and interpreted as nominal rather than as established trends.
Associations among PCTs and IVIs over the full record were assessed using Spearman rank correlations (ρ) (Spearman, 1904), computed on paired water-year values. Correlation p-values are reported alongside ρ. Within each Spearman correlation matrix we also applied the Benjamini–Hochberg correction. Every correlation interpreted here remains significant after correction. The record was also divided into an early period (WY1966–WY1994, n=29) and a late period (WY1995–WY2024, n=30) to describe changes in timing structure between the two halves of the study period. Early–late correlation differences were assessed with a permutation test (the 59 paired water-year values were pooled and randomly reassigned to the early and late periods 20 000 times to build the null distribution of the difference in Spearman ρ) and are treated as descriptive.
2.7 Study Area
River Oulankajoki (Fig. 5) is a boreal river system located in northeastern Finland near the Arctic Circle (Arvola and Nurmesniemi, 2000; Saraniemi et al., 2008). Situated within the boreal zone, it displays cold-climate hydrological characteristics, including seasonal snow accumulation, extended ice cover, and distinct freeze-thaw cycles. Hydrologically, the river is strongly seasonal (Blåfield et al., 2024; Saraniemi et al., 2008). The mean annual discharge is approximately 25.5 m3 s−1, with low flows dropping to around 3 m3 s−1 in late winter and peak flows reaching up to 249 m3 s−1 during the spring snowmelt in May–June. The river typically freezes from mid-November to early May. Recent climatic trends show significant warming in the region, with average temperatures rising by 0.61 °C per decade and summer temperatures by 0.41 °C per decade. These trends are shortening the winter season and altering the basin's overall hydroclimatic regime. Over the past five decades, spring floods have weakened by 7 %, while high-flow events in other seasons have increased by 10 %. Annual minimum flows have risen by 28 %, that reflects both climatic and hydrological shifts (Blåfield et al., 2024).
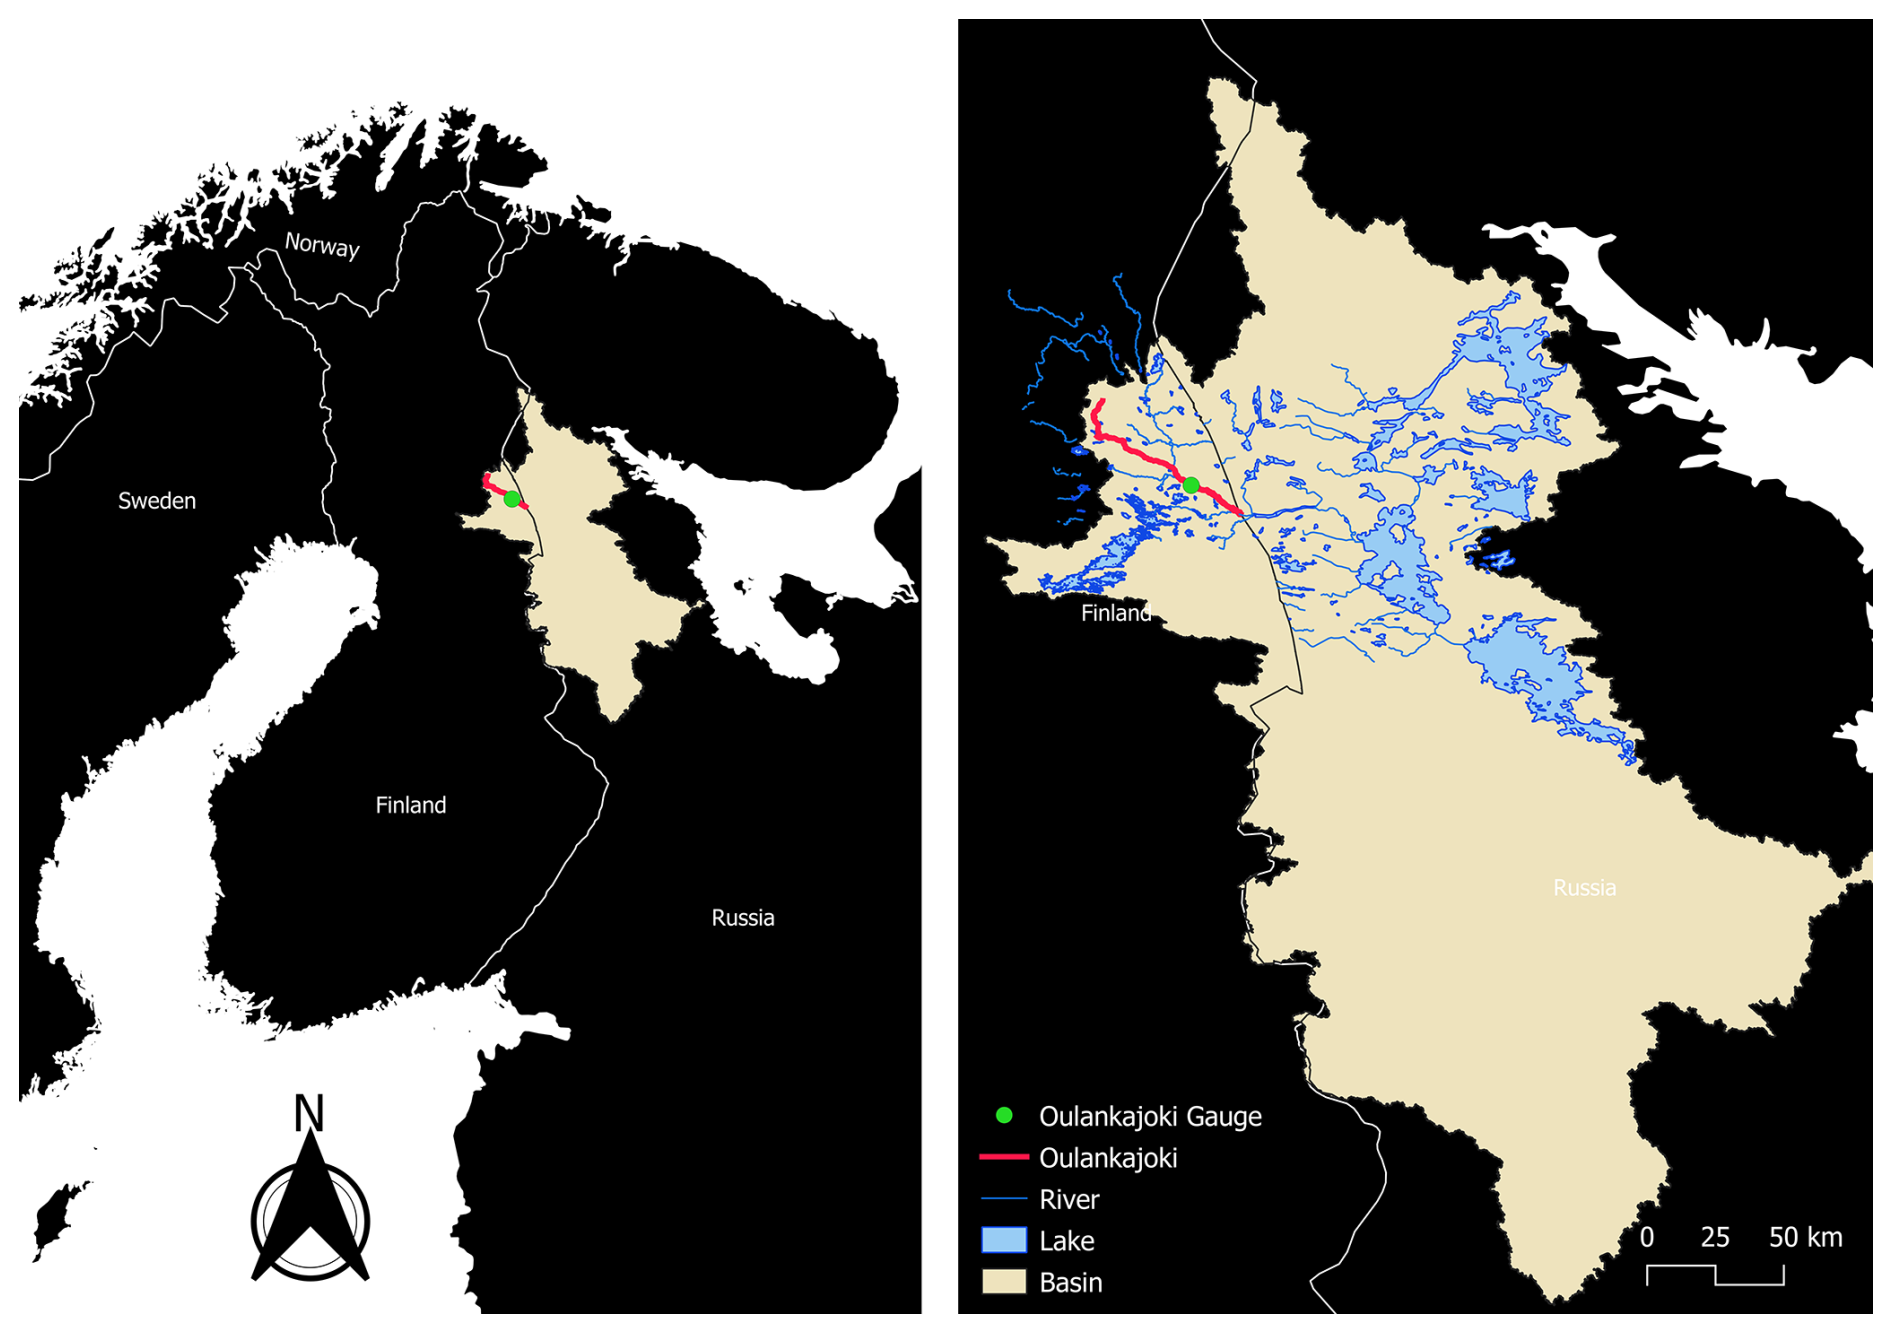
Figure 5Location of the River Oulankajoki basin. Spatial data: Finnish Environment Institute (Syke), CC BY 4.0 (rivers, lakes, water bodies, drainage basin); Digital Chart of the World, U.S. Defense Mapping Agency, public domain (Russian/Finnish hydrography); Natural Earth, public domain (country boundaries). Gauging-station location added by the authors.
3.1 Distribution and Early–Late Shifts of PCTs
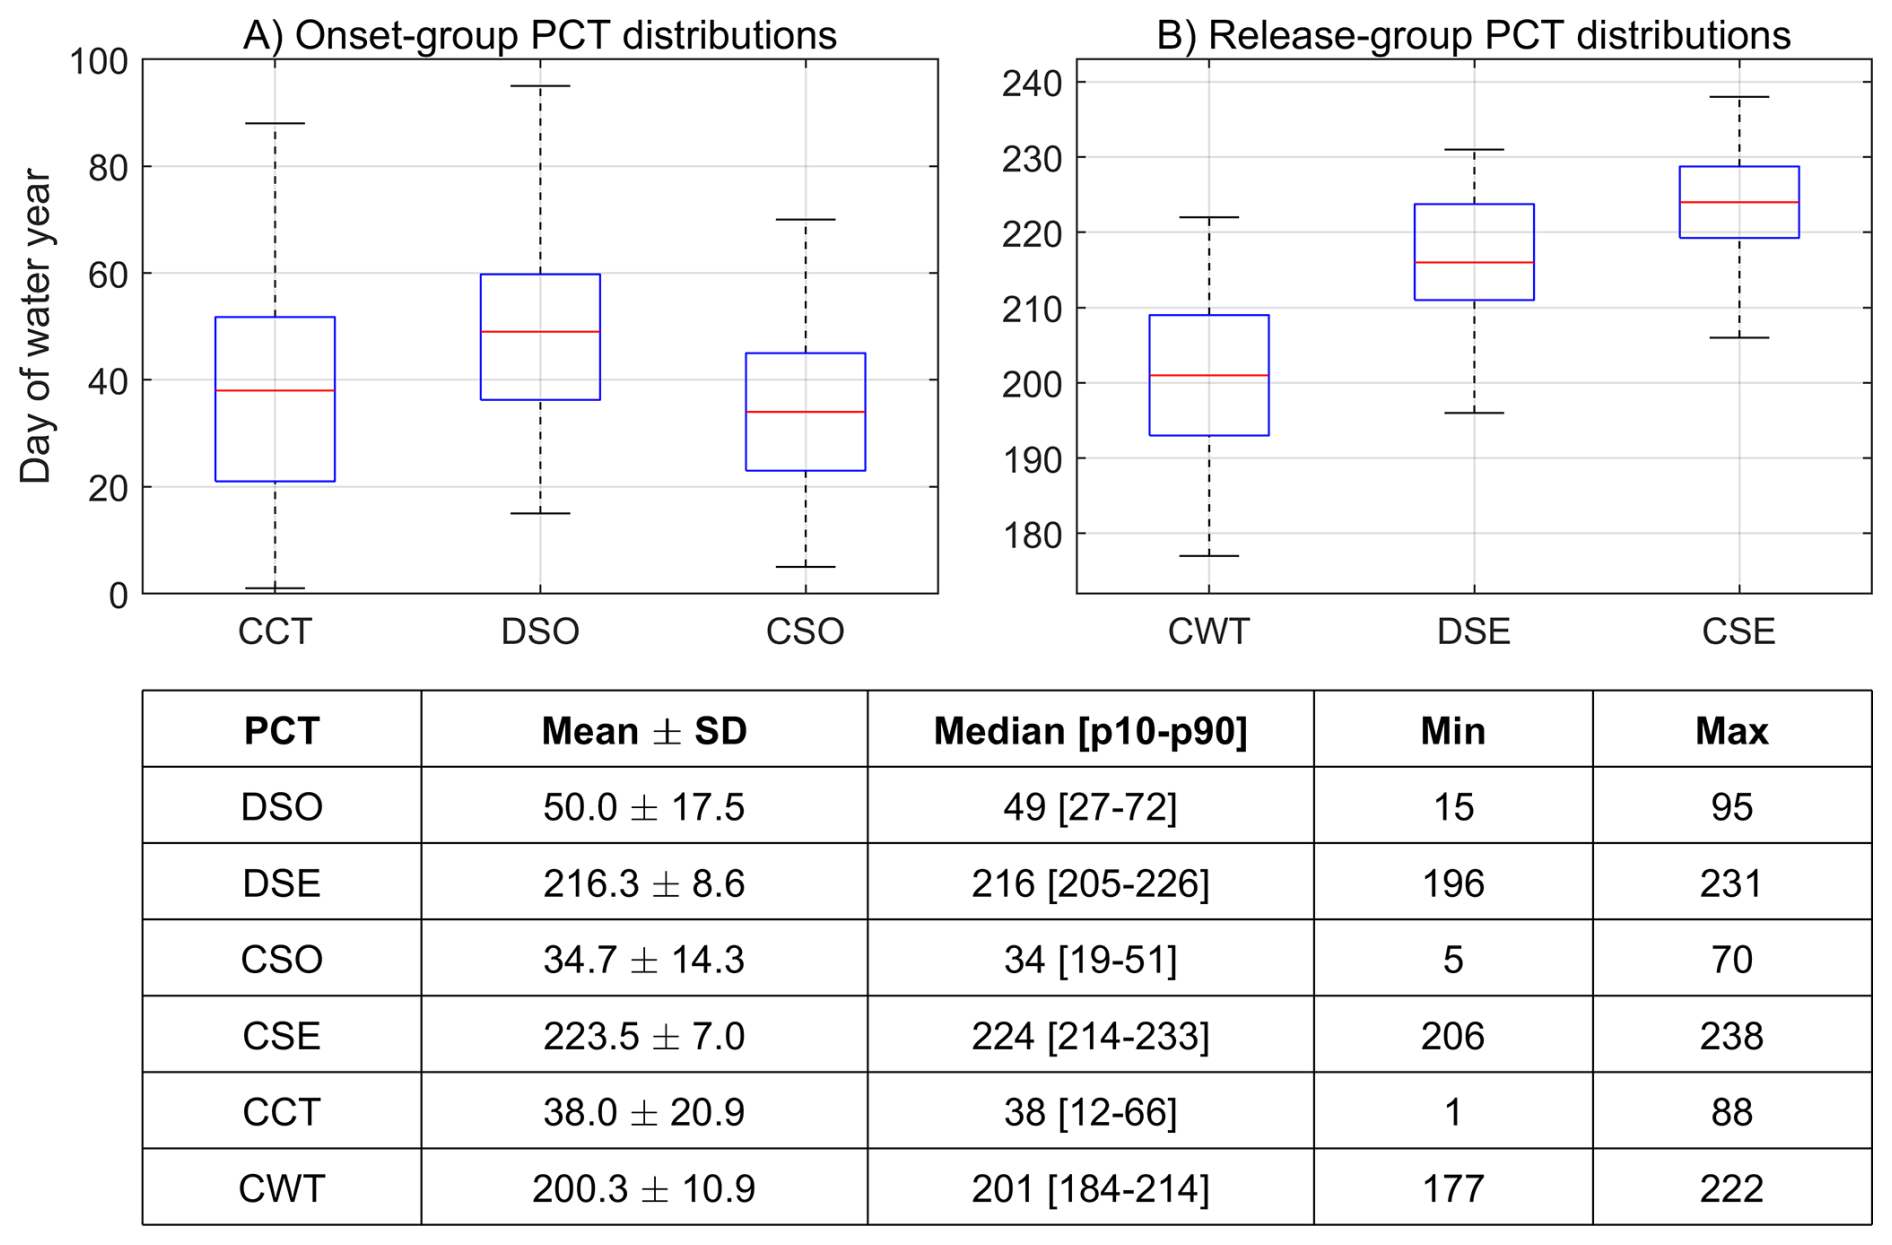
Over the 59-year record (WY1966–WY2024, n=59), the six PCTs ranged across distinct portions of the WY (Fig. 6; embedded table). Among the onset-group, DSO ranged from day 15 to day 95 (median 49, SD ± 17.5 d). CSO ranged from day 5 to day 70 (median 34, SD ± 14.3 d). CCT ranged from day 1 to day 88 (median 38, SD ± 20.9 d; the day 1 value corresponds to WY2009, see Sect. 2.4). Among the release-group, DSE ranged from day 196 to day 231 (median 216, SD ± 8.6 d). CSE ranged from day 206 to day 238 (median 224, SD ± 7.0 d). CWT ranged from day 177 to day 222 (median 201, SD ± 10.9 d). CCT showed the largest spread and CSE showed the smallest of all six PCTs.
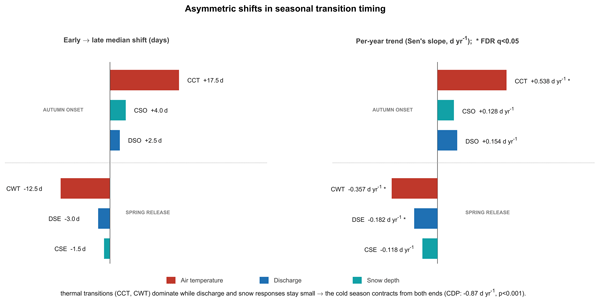
The record was divided into two approximately equal sub-periods to allow balanced comparison of early and late period distributions. Comparing the early period (WY1966–WY1994, n=29) with the late period (WY1995–WY2024, n=30), all three onset-group PCTs shifted to later days of the WY (Fig. 7). DSO shifted by +2.5 d (median: day 48.0 to day 50.5). CSO shifted by +4.0 d (median: day 34.0 to day 38.0). CCT shifted by +17.5 d (median: day 30.0 to day 47.5). All three release-group PCTs shifted to earlier days of the WY. DSE shifted by −3.0 d (median: day 218.0 to day 215.0). CSE shifted by −1.5 d (median: day 224.0 to day 222.5). CWT shifted by −12.5 d (median: day 208.0 to day 195.5). Decadal-binned distributions of all six PCTs across consecutive 10-year blocks (WY1966–WY1975 through WY2016–WY2024) are provided in Supplement Fig. S1; in the decadal-binned distributions, CCT and CWT showed the most consistent directional progression across successive decades, while DSO, CSO, DSE, and CSE varied across decadal blocks without a monotonic step pattern.
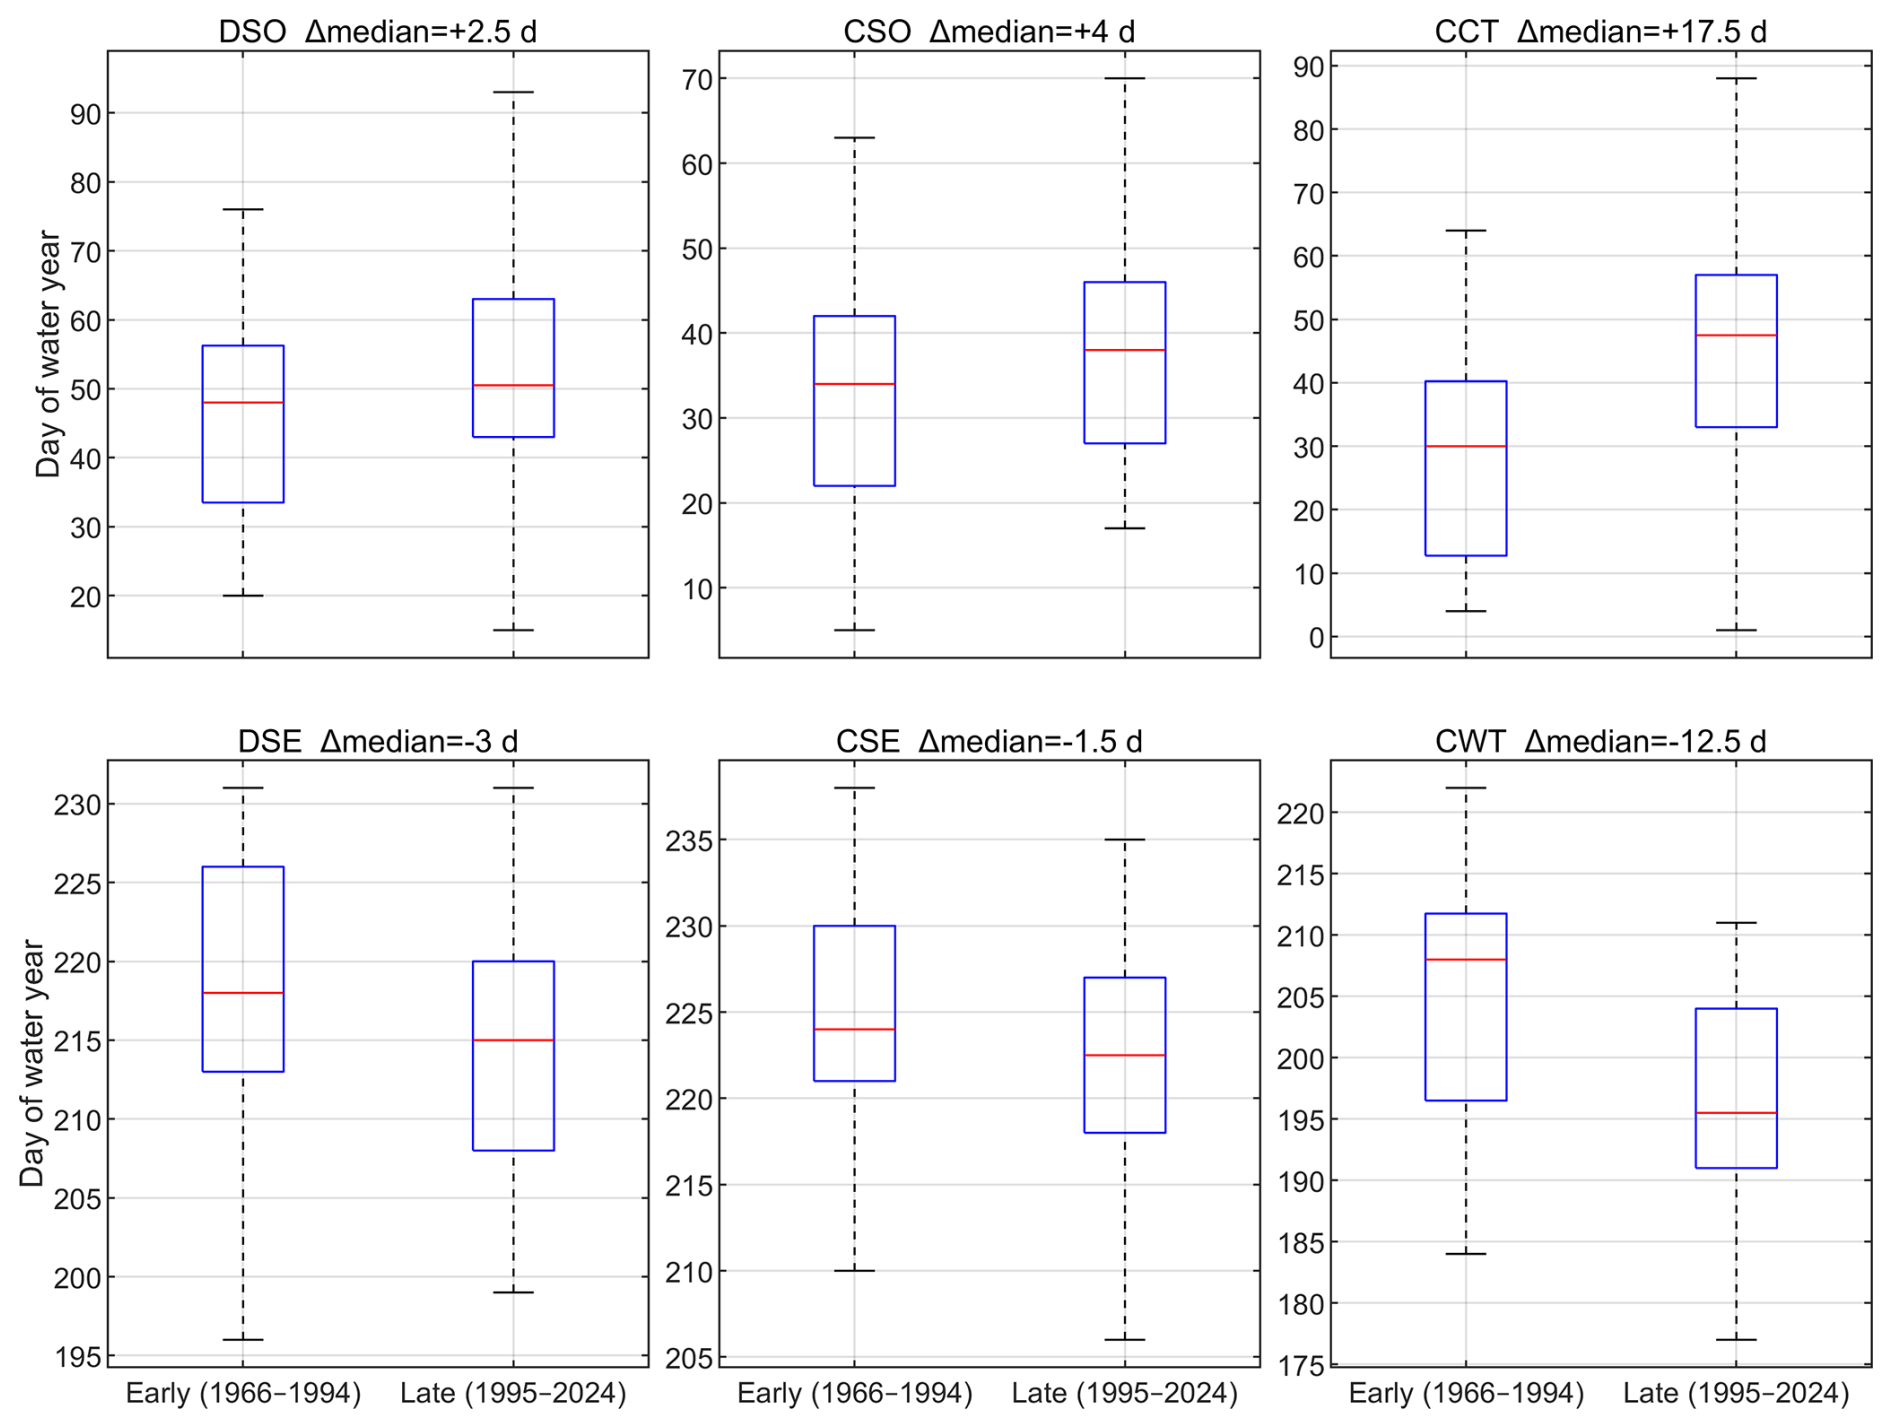
Figure 7Early vs late period distributions of PCTs (day of WY) for WY1966–WY1994 (n=29) and WY1995–WY2024 (n=30); panel titles report the change in median timing (late – early, days). Top row shows onset-group PCTs and bottom row release-group PCTs. Left column shows discharge PCTs, middle snow depth PCTs, and right air temperature PCTs.
3.2 Ordering Patterns and Interannual Variability of PCT Sequencing
The onset-group varied in ordering across the full record (WY1966–WY2024, n=59; Fig. 8A). Five of the six possible orderings occurred at least once. The most frequent ordering was CSO → CCT → DSO, occurring in 25 years (42.4 %). CCT → CSO → DSO occurred in 13 years (22.0 %), CSO → DSO → CCT in 11 years (18.6 %), CCT → DSO → CSO in 7 years (11.9 %), and DSO → CSO → CCT in 3 years (5.1 %). The ordering DSO → CCT → CSO did not occur in any year. Across the full record, DSO preceded CCT in 14 of 59 years (23.7 %), and DSO preceded CSO in 7 of 59 years (11.9 %). Three water years illustrate how these reversals arise (Fig. S3). In WY1975, a short early snow spell fell outside the longest continuous snow segment, so CSO was set later and the order was CCT, DSO, CSO. In WY2011, discharge stabilized while the cumulative cooling transition was delayed, giving the order CSO, DSO, CCT. In WY2020, discharge stabilized early and the initial snow record again fell outside the continuous segment, giving the order DSO, CSO, CCT. The release group occupied a fixed global ordering in all 59 years: CWT → DSE → CSE occurred in 100 % of WYs (Fig. 8B). DSO, CSO, and CCT each ranged across global ranks 1, 2, and 3, with no PCT holding a fixed rank position in any year, while CWT held global rank 4, DSE rank 5, and CSE rank 6 in every year (Fig. 8G).
Comparing the early (WY1966–WY1994, n=29; Fig. 8C–D) and late (WY1995–WY2024, n=30; Fig. 8E–F) sub-periods, the release-group invariance (CWT → DSE → CSE, 100 %) held in both periods without exception. Within the onset group, the ordering CSO → CCT → DSO was the most frequent in both periods (37.9 % early, tied with CCT → CSO → DSO at 37.9 %; 46.7 % late).
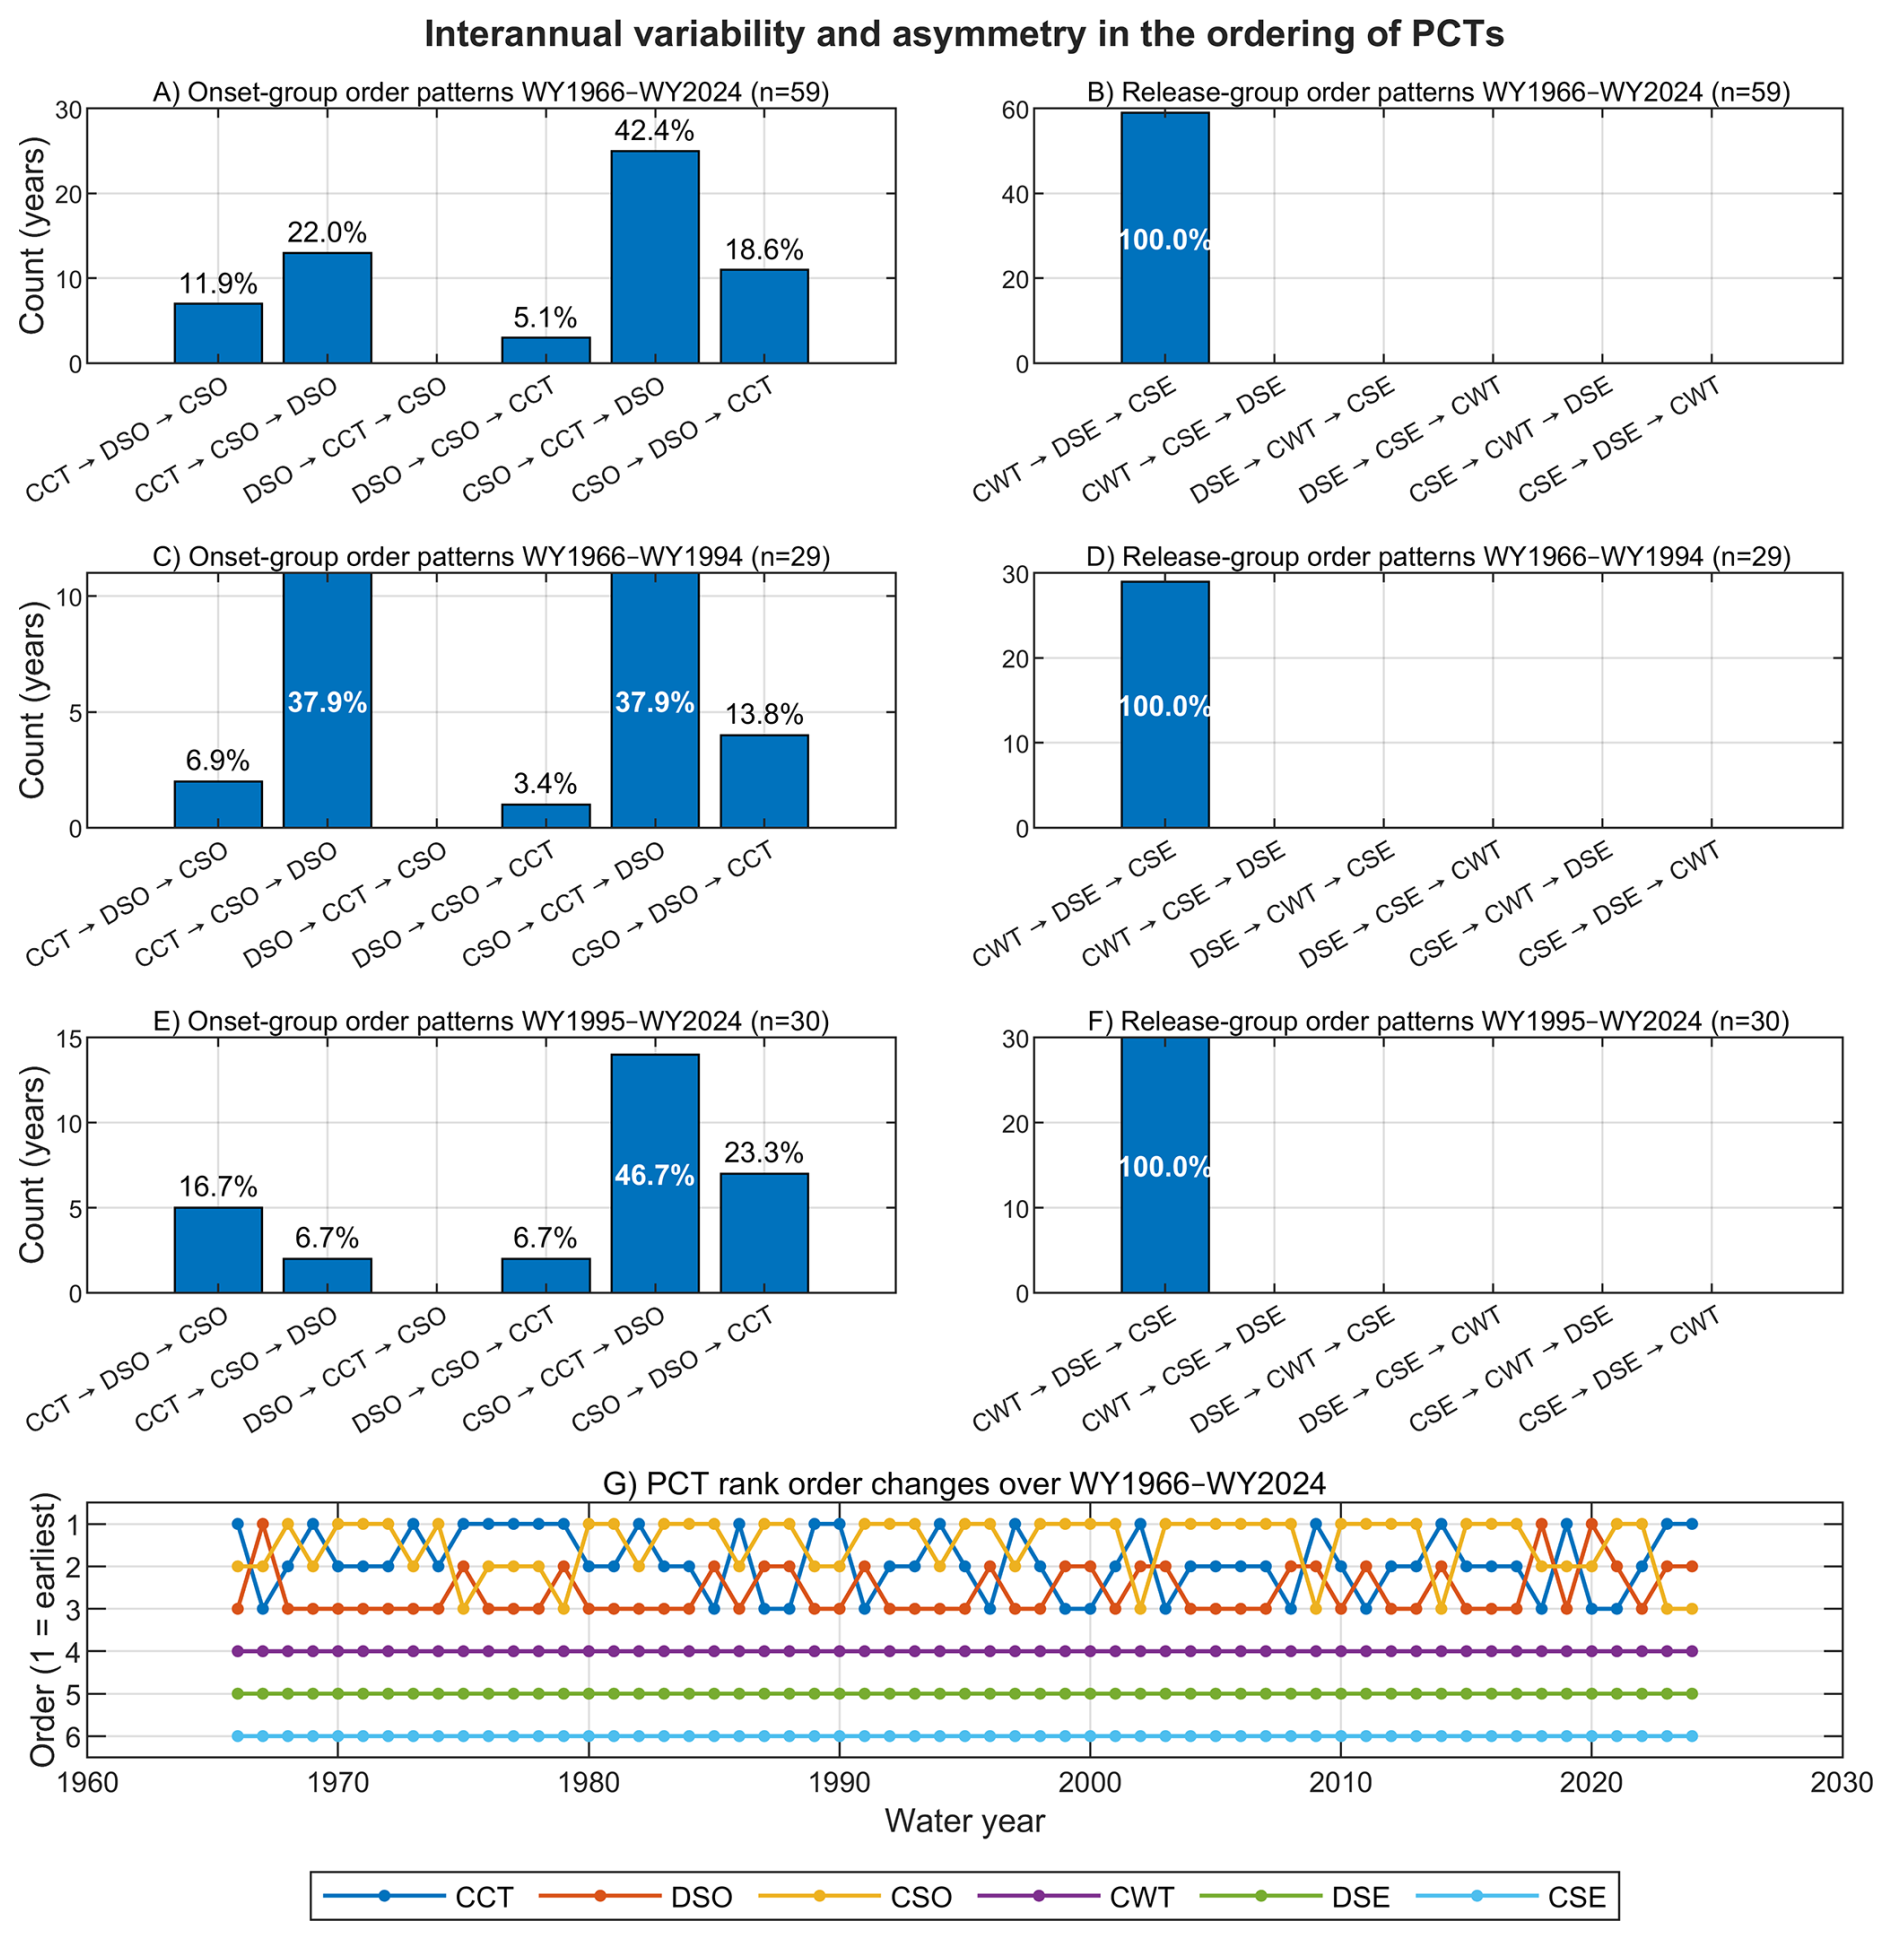
Figure 8Interannual variability and asymmetry in the ordering of PCTs (WY1966–WY2024, n=59). (A) Onset-group ordering frequencies, full record. (B) Release-group order-pattern frequencies, full record. (C) Onset-group order-pattern frequencies, early period (WY1966–WY1994, n=29). (D) Release-group ordering frequencies, early period. (E) Onset-group ordering frequencies, late period (WY1995–WY2024, n=30). (F) Release-group ordering frequencies, late period. (G) Year-to-year PCT rank order changes across the full record (rank 1 = earliest in that water year).
3.3 Spearman Correlations Among PCTs and IVIs - Full Record and Early-Late Comparison
Within the release-group, DSE and CSE showed the strongest PCT correlation (r=0.74, p<0.001), followed by DSE and CWT (r=0.60, p<0.001) and CSE and CWT (r=0.53, p<0.001) over the 59-year record. Within the onset-group, DSO and CSO (r=0.46, p<0.001), DSO and CCT (r=0.48, p<0.001), and CSO and CCT (r=0.49, p<0.001) were all significant and positive (Fig. 9A).
In the early period (WY1966–WY1994, n=29), the strongest correlations were DSE and CSE (r=0.82, p<0.001) and DSE and CWT (r=0.67, p<0.001). DSO and CSO (r=0.64, p<0.001) and CSE and CWT (r=0.55, p=0.002) were also significant (Fig. 9B).
In the late period (WY1995–WY2024, n=30), DSO and CCT, and CSO and CCT, increased to r=0.52 (p=0.003) and r=0.68 (p<0.001), respectively, while DSE and CSE, DSE and CWT, and CSE and CWT, decreased to r=0.60 (p<0.001), r=0.44 (p=0.015), and r=0.44 (p=0.016), respectively. DSO and DSE showed a nominally significant negative correlation (, p=0.013) in the late period (Fig. 9C).
For IVIs over the full record, all three pairings were significant and positive: DSP and CSP (r=0.55, p<0.001), DSP and CDP (r=0.57, p<0.001), and CSP and CDP (r=0.58, p<0.001) (Fig. 9D). In the early period, DSP and CSP (r=0.61, p<0.001) and DSP and CDP (r=0.43, p=0.021) were significant; CSP and CDP did not reach significance (r=0.36, p=0.052) (Fig. 9E). In the late period, DSP and CSP (r=0.4, p=0.03), DSP and CDP (r=0.54, p=0.002), and CSP and CDP (r=0.69, p<0.001) were all significant (Fig. 9F), with CSP and CDP showing the strongest IVI correlation of either period. The early–late correlation differences are not significant under a permutation test and are described without implying a change in coupling.
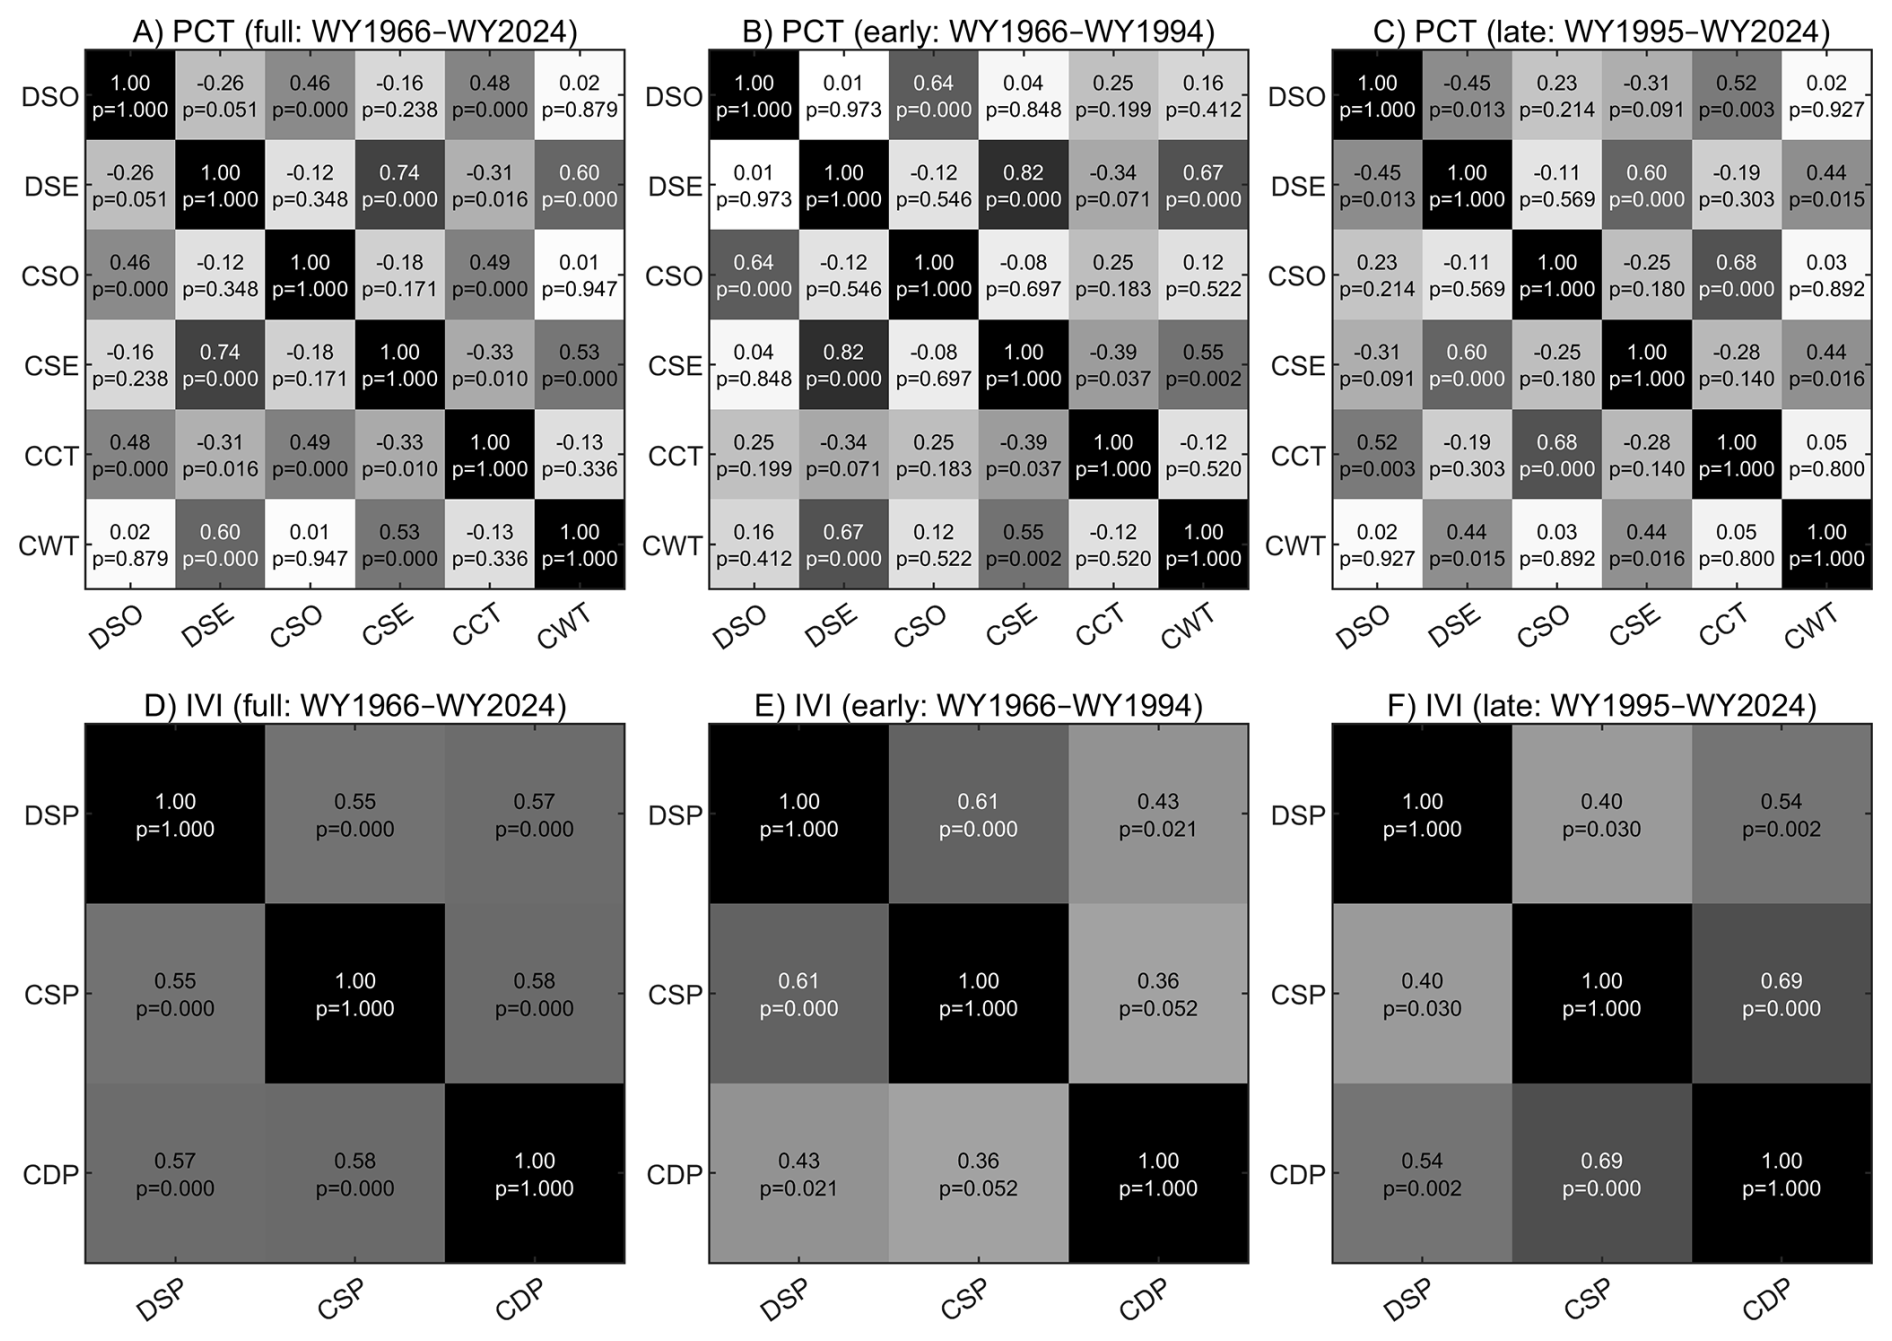
Figure 9Spearman correlation matrices for PCTs (top row, panels A–C) and IVIs (bottom row, panels D–F) for the full record (WY1966–WY2024, n=59), early period (WY1966–WY1994, n=29), and late period (WY1995–WY2024, n=30).
3.4 Long-term Trends in PCT, IVI, CVI, Temperature, Freeze–Thaw Degree-Days, and Hydroclimatic Extremes
Among the six PCTs, CCT shifted later at +0.538 d yr−1 (PW-MK p<0.001) and CWT shifted earlier at −0.357 d yr−1 (p=0.002). DSE shifted earlier at −0.182 d yr−1 (p=0.023) and CSE at −0.118 d yr−1 (p=0.038). DSO (Sen=+0.154 d yr−1, p=0.281) and CSO (Sen d yr−1, p=0.247) showed no significant trend. Among the IVIs, CDP decreased at −0.871 d yr−1 (p<0.001). DSP decreased at −0.333 d yr−1 (p=0.041) under the SD-based threshold; because this DSP trend does not persist under an alternative variability scale, it is reported as indicative rather than as a robust trend. CSP showed a negative Sen slope (−0.237 d yr−1) but did not reach significance (p=0.089) (Fig. 10). After within-family Benjamini–Hochberg correction, CCT (q=0.00385), CWT (q=0.00663), and DSE (q=0.0457) remain significant among the PCTs and CDP (q<0.001) among the IVIs, whereas CSE (q=0.0572) and DSP (q=0.062) fall just above the corrected threshold and are treated as nominal.
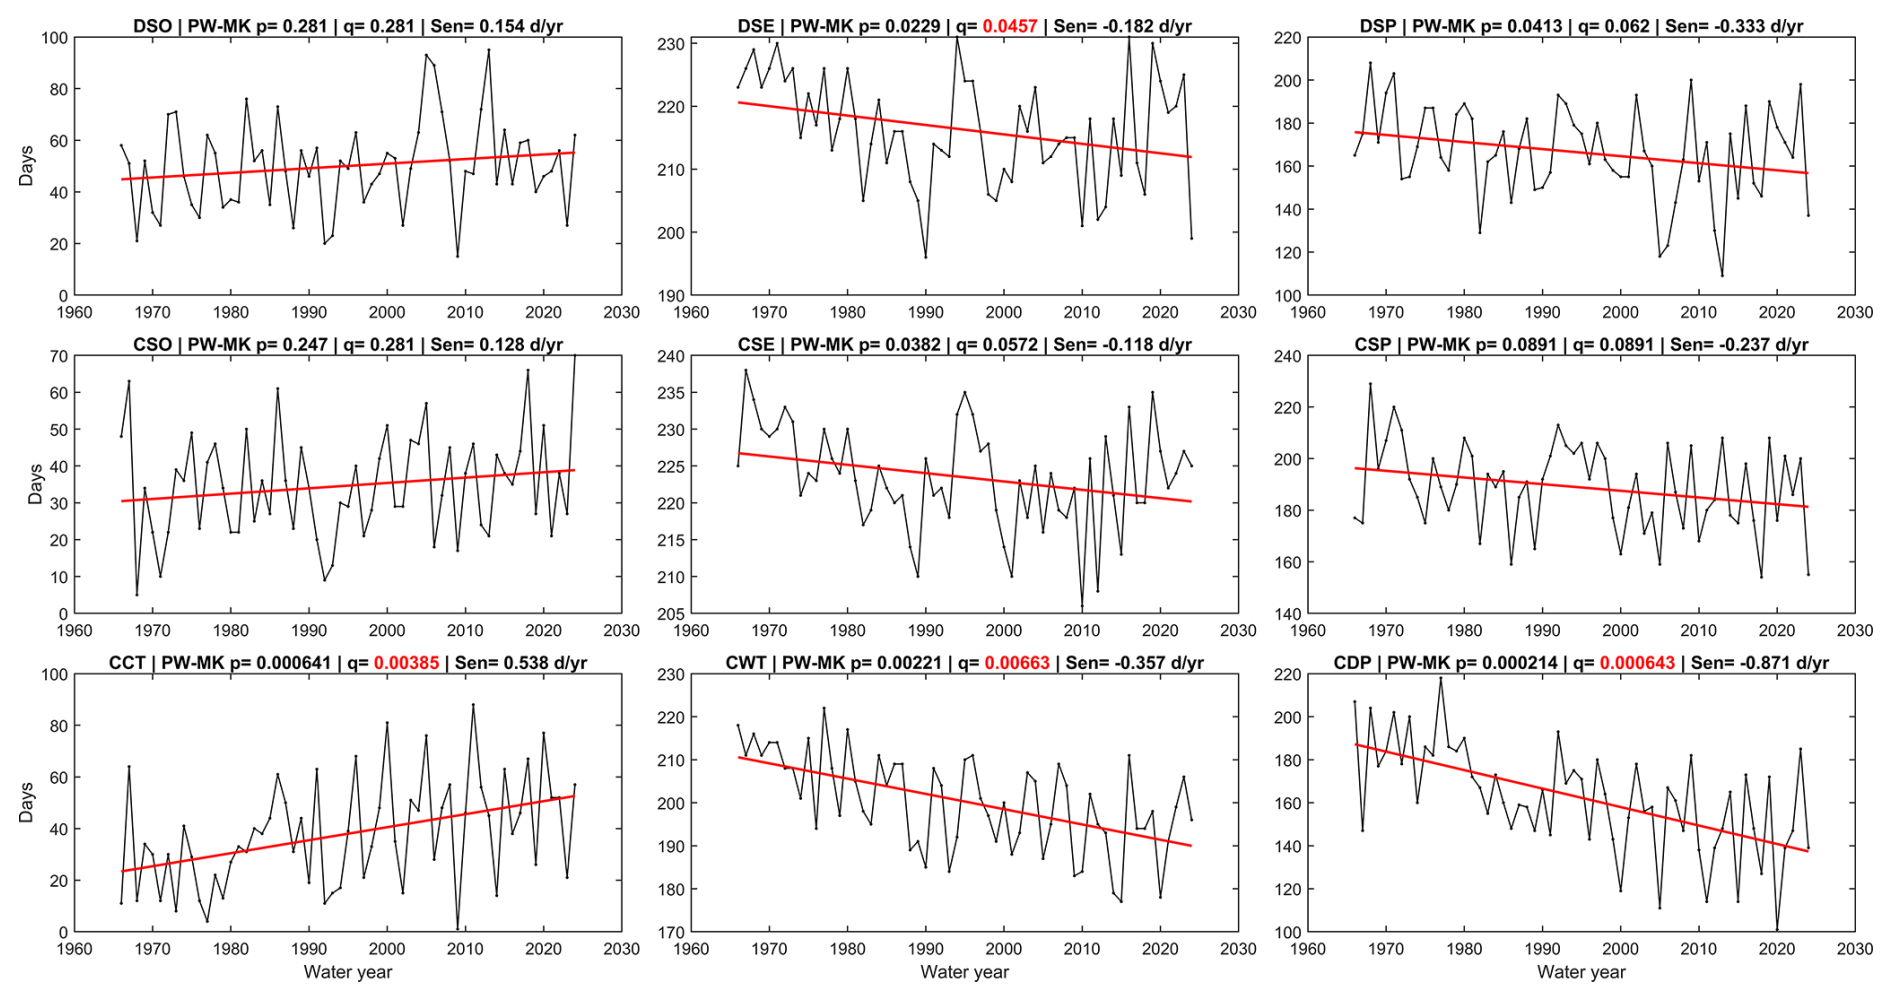
Figure 10Long-term trends in Phase Change Timings (PCTs) and Intra-Variable Intervals (IVIs) (WY1966–WY2024; n=59). Panel titles report the PW-MK p-value, the Benjamini–Hochberg q-value (corrected within family), and Sen's slope; the q-value is shown in red where the trend remains significant after correction (q<0.05).
The offset between CSE and CWT decreased at −0.231 d yr−1 (p=0.011), and the offset between CSO and CCT increased at +0.333 d yr−1 (p=0.040); both offsets are nominal after the multiple-testing correction (q=0.068 and q=0.120, respectively). The remaining four CVIs showed no significant trend, the offset between DSO and CSO (Sen d yr−1, p=0.496), between DSO and CCT (Sen d yr−1, p=0.103), between DSE and CSE (Sen =0.000 d yr−1, p=0.958), and between DSE and CWT (Sen d yr−1, p=0.102) (Fig. 11).
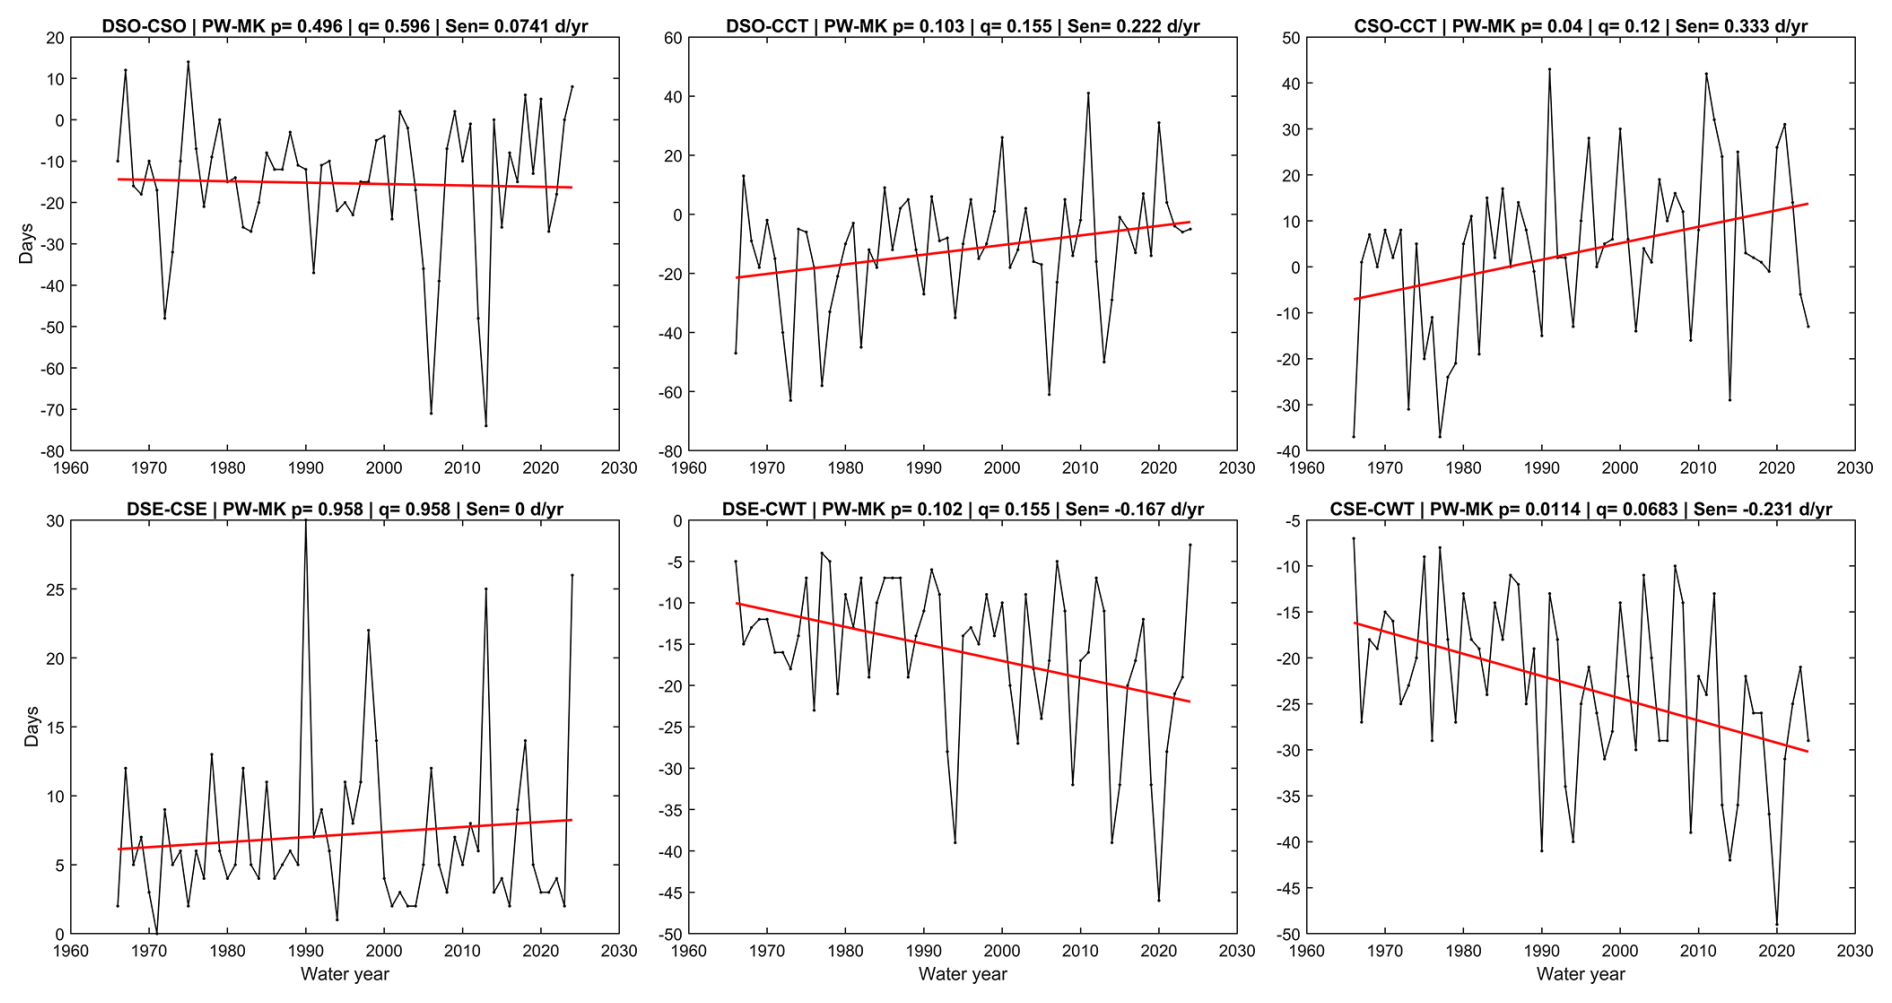
Figure 11Long-term trends in cross-variable timing offsets (CVIs) derived from PCT pairs (WY1966–WY2024; n=59). Panel titles report the PW-MK p-value, the Benjamini–Hochberg q-value (corrected within family), and Sen's slope; the q-value is shown in red where the trend remains significant after correction (q<0.05).
Mean air temperature increased significantly in all three seasonal windows (Fig. 12), with October–December at +0.066 °C yr−1 (p=0.001), March–May at +0.037 °C yr−1 (p=0.0076), and the November–April window at +0.067 °C yr−1 (p=0.0041). All three seasonal air-temperature trends remain significant after within-family correction.
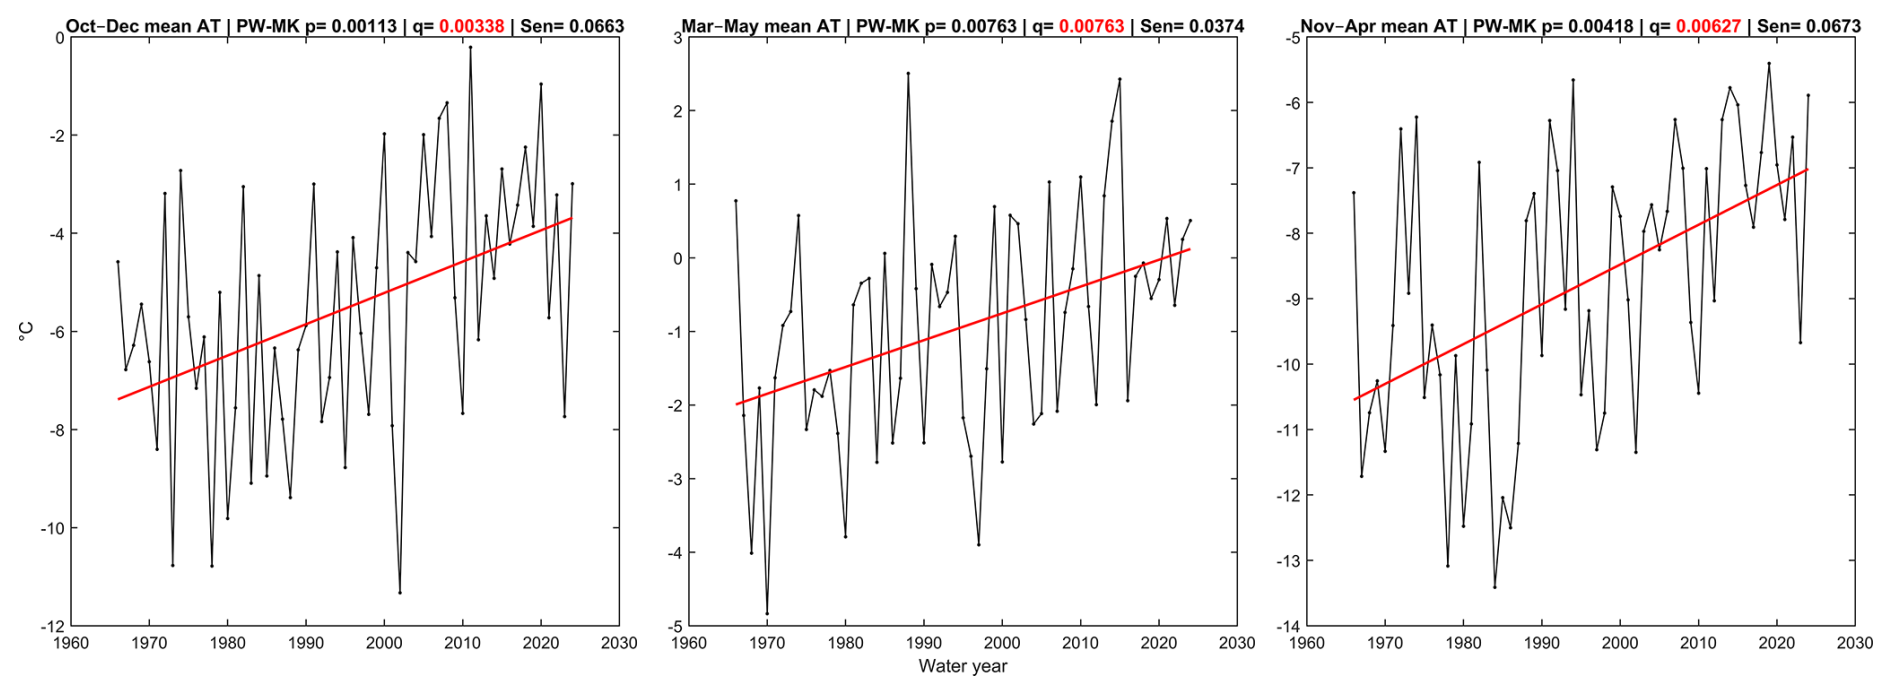
Figure 12Long-term trends in seasonal air temperature (AT) (WY1966–WY2024; n=59). Panel titles report the PW-MK p-value, the Benjamini–Hochberg q-value (corrected within family), and Sen's slope; the q-value is shown in red where the trend remains significant after correction (q<0.05).
FDD accumulated from WY start to CCT increased at +0.956 °C d yr−1 (p<0.01). FDD accumulated from CCT to CWT decreased at −13.9 °C d yr−1 (p<0.001), and full water-year FDD decreased at −12.5 °C d yr−1 (p<0.002). TDD accumulated from WY start to CWT increased at +0.76 °C d yr−1 (p=0.044) and full water-year TDD increased at +6.78 °C d yr−1 (p<0.003). TDD accumulated from CCT to CWT showed no significant trend (Sen °C d yr−1, p=0.278) (Fig. 13). After within-family correction, the three FDD trends and the full-water-year TDD trend (q=0.00573) remain significant, whereas the trend in TDD accumulated from the water-year start to CWT (q=0.053) falls just above the threshold and is treated as nominal.
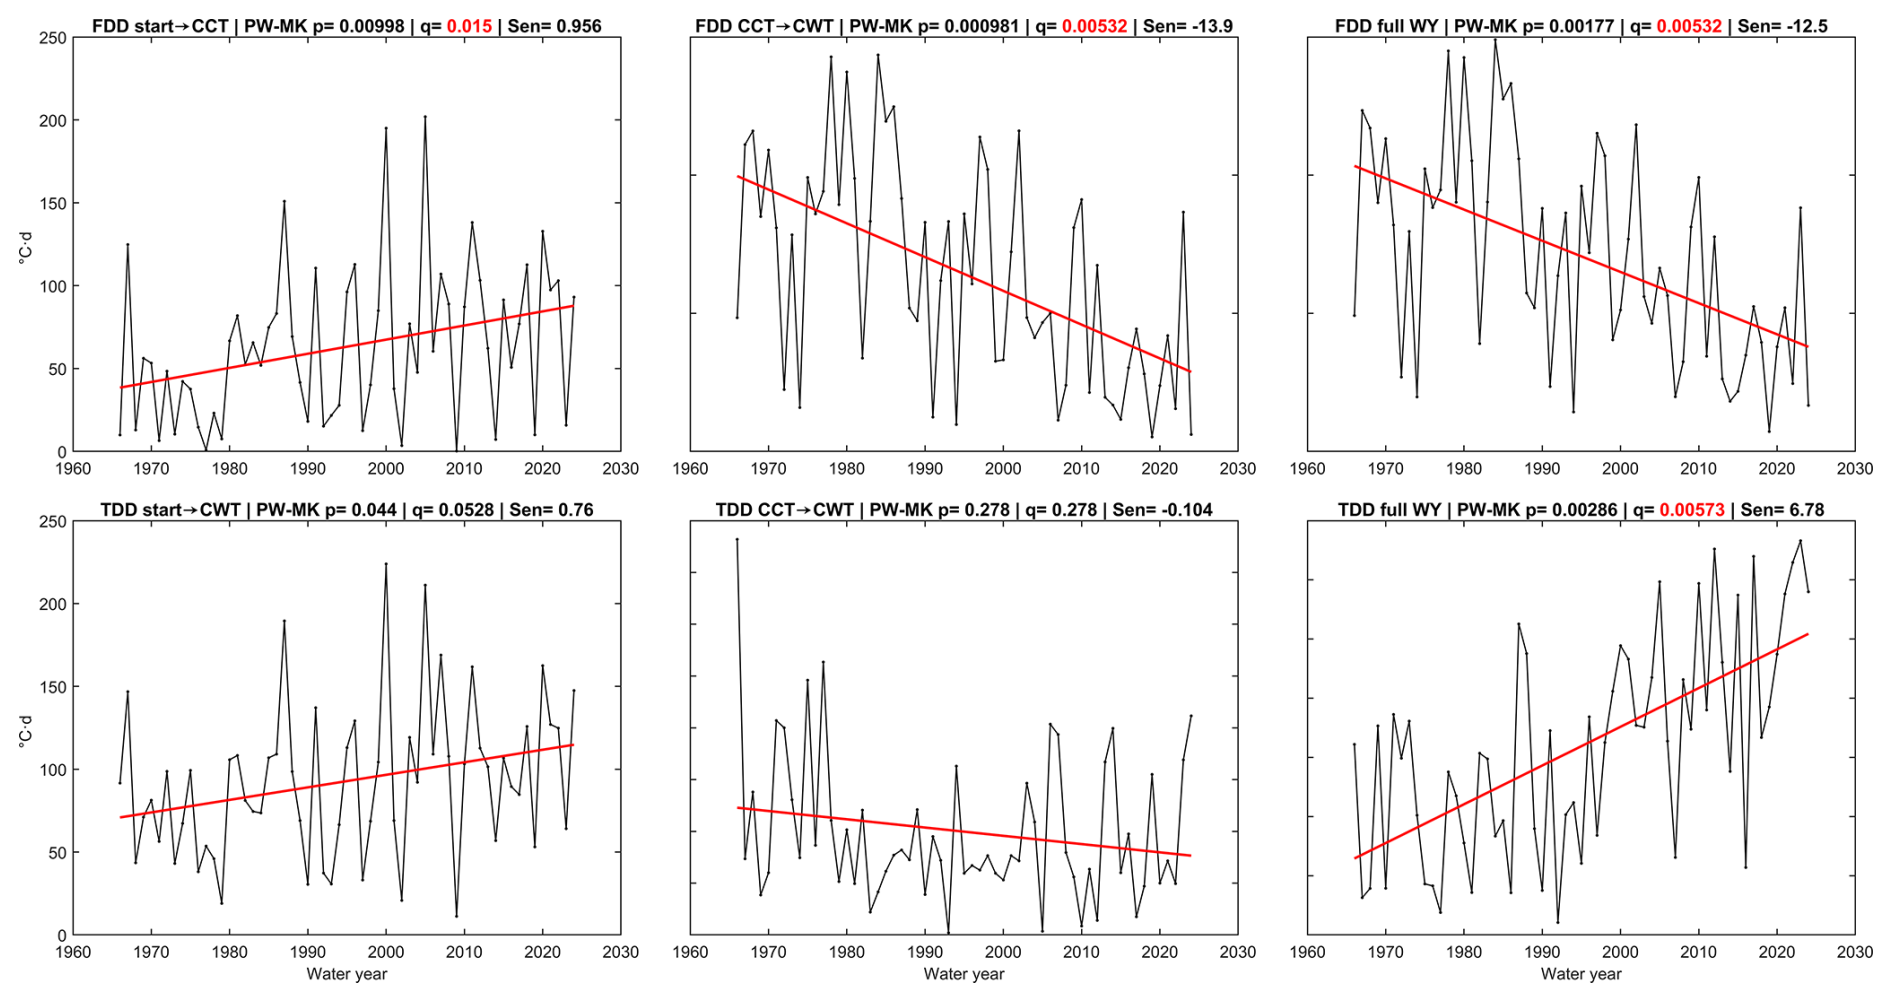
Figure 13Long-term trends in freezing and thawing degree-day (FDD/TDD) linked to the ZCAT transition timings (WY1966–WY2024; n=59). Panel titles report the PW-MK p-value, the Benjamini–Hochberg q-value (corrected within family), and Sen's slope; the q-value is shown in red where the trend remains significant after correction (q<0.05).
Annual maximum discharge (p=0.896), minimum discharge (p=0.172), and average discharge during the DSP (p=0.178) showed no significant trends. Maximum snow depth (p=0.539) and average snow depth during the CSP (p=0.295) showed no significant trends. Annual maximum air temperature (p=0.156) and average air temperature during the CDP (p=0.261) showed no significant trends. Annual minimum air temperature showed the strongest extreme-value trend (+0.0596 °C yr−1, uncorrected p=0.0498), but no extreme-value metric remains significant after the multiple-testing correction (Fig. 14).
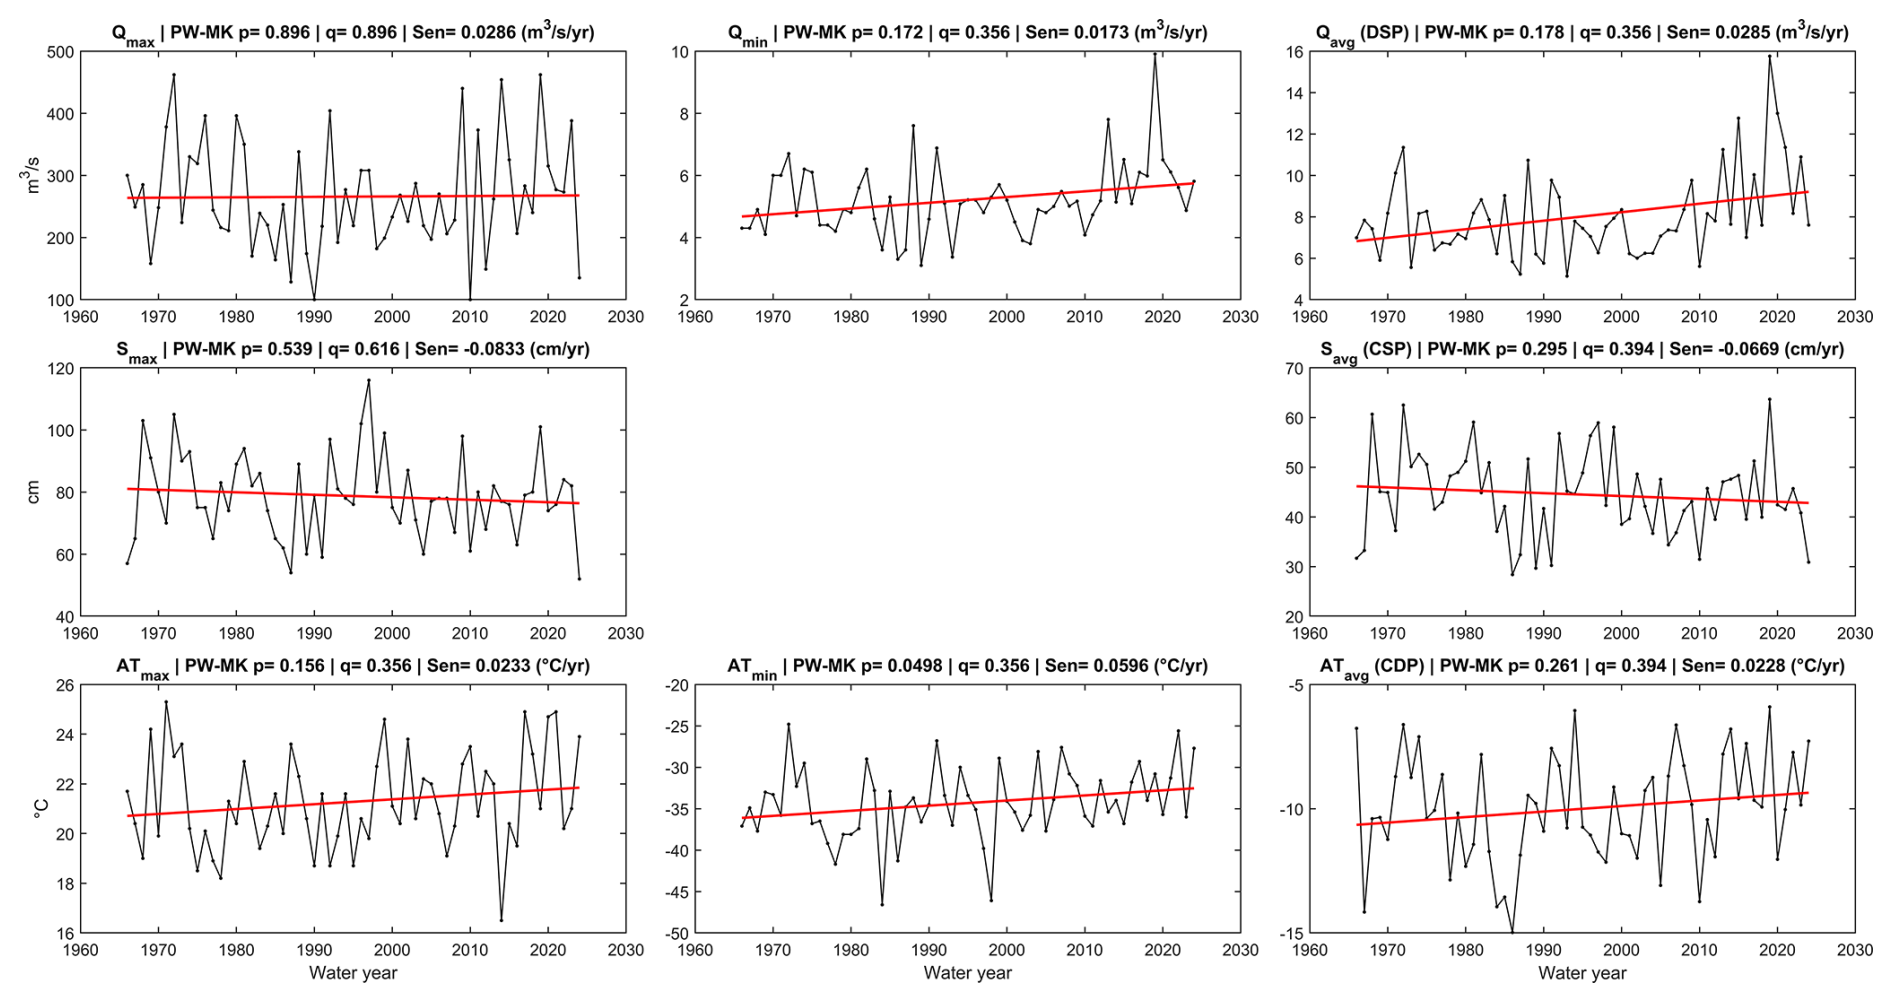
Figure 14Long-term trends in hydroclimatic extreme-value and their average within IVIs (WY1966–WY2024; n=59). Panel titles report the PW-MK p-value, the Benjamini–Hochberg q-value (corrected within family), and Sen's slope; the q-value is shown in red where the trend remains significant after correction (q<0.05).
Our results form a coherent picture of asymmetric change in proxy-based transition timing at the River Oulankajoki over 59 WYs. Thermally-derived transitions (CCT, CWT) shifted faster and further than their surface response transitions (DSO, CSO, DSE, CSE), and this asymmetry was more coherent and systematic in the release-group, where all three PCTs shifted earlier (significantly for CWT and DSE, and nominally for CSE after multiple-testing correction) with CWT shifting furthest, than in the onset-group, where only the thermally-derived CCT shifted significantly while surface proxies remained trendless. Among the onset group, the thermally-derived CCT shifted significantly (+0.538 d yr−1, p=0.001), while the surface response proxies DSO and CSO showed no significant trend. At the period level, this contrast is clear; CCT shifted +17.5 d between the early and late sub-periods, compared with only +2.5 d for DSO and +4.0 d for CSO. In the release group, CWT shifted −12.5 d versus −3.0 d for DSE and −1.5 d for CSE. Air temperature is measured at a single point approximately 500 m from the gauge, while discharge integrates the entire upstream basin; this spatial mismatch can contribute to occasional ordering reversals in onset-group PCTs (e.g., DSO preceding CSO or CCT), particularly in years with early baseflow stabilization or delayed cumulative cooling. Figure S3 shows three example water years (WY1975, WY2011, and WY2020) in which these reversals occur. Among the release group, CWT, DSE, and CSE all shifted to earlier days, with CWT carrying the largest shift (−0.357 d yr−1, p=0.002). These PCT shifts are consistent with the observed warming across all three seasonal windows: October–December mean AT increased at +0.066 °C yr−1 (p=0.001), November–April at +0.067 °C yr−1 (p=0.004), and March–May at +0.037 °C yr−1 (p=0.008), indicating that both the onset and release seasons warmed significantly over the record.
This difference is consistent with release-group PCTs being more tightly governed by progressive atmospheric warming, whereas onset-group PCTs remained subject to localized and stochastic controls, such as precipitation phase, surface insulation, and early snowfall events. Prior studies report that river ice release timing across North America and Europe has advanced at approximately 0.6 d per decade, closely linked to warming temperatures (Chen and She, 2020; Newton and Mullan, 2021), while onset timing trends remain spatially heterogeneous and weakly correlated with climate signals (Liston and Hall, 1995; Prowse and Bonsal, 2004), which is consistent with the pattern observed at this case study site. The sequencing analysis reinforces this structure; within the onset-group, CCT, DSO, and CSO exhibited flexible interannual rankings, with five of six possible orderings occurring across the 59-year record. Moreover, the dominant ordering CSO → CCT → DSO increased in frequency from 37.9 % in the early period to 46.7 % in the late period, which suggests a gradual consolidation of onset-group sequencing consistent with CCT shifting progressively later relative to the surface proxies; since this ordering involves DSO, whose absolute timing is method-dependent, these frequencies are interpreted qualitatively. In contrast, the release-group maintained the invariant ordering CWT → DSE → CSE in all 59 years. The correlation structure further supports this asymmetry; strong pairwise correlations among release-group PCTs (CWT and DSE: r=0.60; CWT and CSE: r=0.53; DSE and CSE: r=0.74) contrasted with weaker and more variable correlations among onset-group PCTs, particularly in the early period. Onset-group correlations were numerically higher in the late period (CSO–CCT r=0.68, DSO–CCT r=0.52) than in the early period, and some release-group correlations were numerically lower (DSE–CSE r=0.82 to r=0.60), but none of these early–late differences is significant under a permutation test.
The CDP shortened at −0.871 d yr−1 (p<0.001), the largest IVI trend in the dataset, contracting simultaneously from both ends as CCT shifted later and CWT shifted earlier. FDD accumulated between CCT and CWT declined at −13.9 °C d yr−1 (p<0.001), which indicates that the thermal winter narrowed in both duration and cold intensity. Notably, FDD accumulated from the WY start to CCT increased at +0.956 °C d yr−1 (p=0.010), indicating that early-season cold accumulation intensified even as the overall cold period contracted. The CDP therefore narrowed primarily through a later onset of the cooling-dominant phase and an earlier end, rather than through a uniform reduction in cold intensity across the season. Full water-year FDD also declined (−12.5 °C d yr−1, p=0.002), while full water-year TDD increased (+6.78 °C d yr−1, p=0.003), which further supports the rebalancing of the annual thermal budget away from cold accumulation and toward warm accumulation driven primarily by the inward movement of CDP boundaries. DSP also decreased under the primary threshold (−0.333 d yr−1, p=0.041), which is consistent with DSE shifting earlier; however, this DSP trend is not robust to the discharge variability scale and is treated as indicative. CSP showed a negative Sen's slope but did not reach significance (p=0.089), consistent with the smaller period-level shift in CSE (−1.5 d) relative to CWT (−12.5 d) between sub-periods. These results at this site are directionally in line with reported trends of earlier seasonal transitions across Arctic and sub-Arctic systems (Dauginis and Brown, 2021; Fukś, 2023; Markus et al., 2009; Newton and Mullan, 2021; Podkowa et al., 2023; Sharma et al., 2016; Wang and Feng, 2024), though generalization beyond this site is not made here.
We also identified two changes in CVIs, the temporal offsets between thermally-derived and surface response transitions, both nominal after the multiple-testing correction. The interval between CSO and CCT increased at +0.333 d yr−1 (p=0.040), meaning CCT shifted later relative to CSO over the record. The interval between CSE and CWT shifted at −0.231 d yr−1 (p=0.011), which means CWT advanced faster than CSE. The interval between DSE and CWT shifted in the same direction but did not reach significance (p=0.102). The interval between DSE and CSE remained stationary (Sen =0.000 d yr−1, p=0.958), both DSE and CSE shifted almost in parallel throughout the record. A number of studies report that despite earlier atmospheric warming, surface responses have lagged in sub-Arctic and boreal systems (Schwartz et al., 2006; Stone et al., 2002). This growing offset between thermally-derived and surface response transitions in systems with similar thermal-nival structure, poses challenges for hydrological modelling and ecosystem forecasting, as degree-day and temperature-threshold models may increasingly misestimate the timing of surface-driven responses (Bjorkman et al., 2015; Groisman and Easterling, 1994; Siegel et al., 2022). The smaller shift in CSE relative to CWT (−1.5 d vs. −12.5 d) may also partly reflect that CSO/CSE are based on terrestrial snow depth at a single station rather than snow conditions on the river surface.
Despite significant shifts in PCT timing and IVI duration, all discharge and snow depth magnitude metrics remained statistically unchanged over the 59-year record. Neither maximum discharge (p=0.896) nor minimum discharge (p=0.172) showed a significant trend. Average discharge during the DSP showed no significant trend (p=0.178). Maximum snow depth (p=0.539) and average snow depth during the CSP (p=0.295) also remained stable. Annual minimum air temperature showed a nominal increase (+0.060 °C yr−1, uncorrected p=0.0498) that does not survive the multiple-testing correction, and annual maximum air temperature showed no significant trend (p=0.156). These findings align with studies reporting resilience in streamflow and snow depth magnitudes despite substantial hydroclimatic timing shifts (Harder et al., 2015; Shiklomanov et al., 2007), with increases in winter baseflow in northern basins attributed to permafrost thaw and deeper infiltration (St. Jacques and Sauchyn, 2009). Although some studies report increasing peak flows in certain regions (Burn et al., 2010; Byun et al., 2019), maximum discharge at this site remained stable over the record (p=0.896).
Changes in the timing of onset-group and release-group PCTs alter the seasonal windows available for sediment and nutrient transport, aquatic habitat structure, and biological processes. Earlier shifts in release-group PCTs and a contracting CDP affect the timing of ecological cues that depend on seasonal temperature and flow structure (Janowicz, 2010; Prowse et al., 2011). The stability and timing of the winter low-flow period bear on the reliability of winter infrastructure in northern communities (Prowse et al., 2007). Since the DSP trend is not robust to the discharge variability scale, we do not draw a conclusion about a change in the length of this period here.
All findings in this study are specific to the River Oulankajoki at the Oulanka gauging station over WY1966–WY2024. Winter discharge values in the source record are operationally corrected estimates (quality code “Redukoitu”), meaning DSO and DSE are derived from a quality-controlled rather than a directly measured series and should be interpreted accordingly as discharge regime transition proxies. The two discharge timings differ markedly in their sensitivity to the DVD variability scale. Replacing the SD-based threshold with an IQR-based alternative (IQR/1.349) displaces DSO by a median of 91 d (median of signed differences, later in almost all years) but DSE by a median of only 7 d (earlier in every year), because DSO marks the onset of stability immediately after the abrupt spring freshet, whereas DSE marks the end of the winter stable period along the gradual autumn–winter recession. DSE and its earlier trend are robust to this choice, whereas DSO, DSP, and all DSO-derived quantities are method-dependent and are interpreted qualitatively rather than as quantitative trend estimates; in particular, the DSP trend does not persist under the alternative scale. The qualitative onset-group result (flexible interannual ordering of DSO, CSO, and CCT with no coherent onset trend) and the release-group invariance (CWT → DSE → CSE in all 59 years) do not depend on the variability scale. Independent observational context was provided by ice thickness measurement records (WY1980–WY1994, n=15) and water temperature winter gap data (WY1970–WY2024, n=55); however, both datasets are operationally constrained and neither constitutes a direct freeze-up or break-up observation, their temporal relationship with the proxy PCTs shows considerable interannual spread (Fig. S2), and they should be interpreted as plausibility checks rather than validation. The proxy framework used here is most appropriate for unregulated boreal rivers without frequent mid-winter melt events; applicability to regulated or hydropeaking systems would require re-evaluation of the DVD stability definition.
This study provides a 59-year assessment of seasonal cryo-hydrological dynamics in a sub-Arctic river system using a structured detection approach across six key timing metrics. By applying the RiTiCE framework to the River Oulankajoki, we document a coherent shift in release-group timings toward earlier dates (statistically significant for DSE and CWT, and nominal for CSE after multiple-testing correction), while onset-group PCTs (DSO, CSO) remain temporally unstable and trendless, and CCT shifted significantly later. This growing asymmetry is evident in proxy-detected transition timing at this site. The analysis reveals that changes in phase transition timing are not occurring in isolation. The CDP has shortened, and the offset between CSE and CWT narrowed over the record (CWT advancing faster than CSE; nominal after the multiple-testing correction). The DSP also shortened under the primary threshold, but this DSP trend is reported as indicative because it is sensitive to the discharge variability scale. These results document differential rates of shift between thermally-derived and surface response proxies at this site, rather than a uniform seasonal shift.
Despite these structural changes, hydrological extremes such as peak discharge and maximum snow depth remain relatively stable. The results demonstrate that proxy-detected seasonal transitions at this site show increasing differential rates of shift under continued warming. The differential shifts between thermally-derived and surface proxy transitions pose a challenge for proxy-based forecasting of seasonal conditions, assessing flood risk, and managing aquatic ecosystems. These findings emphasize the need for long-term observational records and improved process-based models that incorporate not only temperature thresholds but also lagged hydrological responses and transitional variability under continued warming at this site and in systems with similar thermal-nival structure.
The daily air temperature and snow depth records used in this study are publicly available from the Finnish Meteorological Institute (FMI) Open Data Portal (https://en.ilmatieteenlaitos.fi/open-data, last access: 20 August 2026), and the daily mean river discharge records from the Finnish Environment Institute (SYKE) Hertta database (https://wwwp2.ymparisto.fi/scripts/kirjaudu.asp, last access: 20 August 2026). The RiTiCE analysis code and the processed water-year input series generated for this study are available from the corresponding author upon reasonable request.
The supplement related to this article is available online at https://doi.org/10.5194/tc-20-4701-2026-supplement.
A.J.S. conceived the study, developed the methodology, processed and analyzed the data, wrote the manuscript, and prepared all figures. A.A. contributed to the interpretation of results and manuscript preparation. A.T.H. supervised the study.
The contact author has declared that none of the authors has any competing interests.
Publisher's note: Copernicus Publications remains neutral with regard to jurisdictional claims made in the text, published maps, institutional affiliations, or any other geographical representation in this paper. The authors bear the ultimate responsibility for providing appropriate place names. Views expressed in the text are those of the authors and do not necessarily reflect the views of the publisher.
The authors gratefully acknowledge the Maa- ja vesitekniikan tuki ry (MVTT) for funding this research. We thank the Oulanka Research Station for long-term hydrological monitoring and infrastructure support. We are also grateful to SYKE (Finnish Environment Institute) and the Finnish Meteorological Institute (FMI) for providing the datasets. We appreciate the efforts of all personnel involved in field measurements and data collection over this 59-year record. Artificial intelligence tools were used in a limited capacity to assist with code refinement, code commenting, instruction generation, and language editing of the manuscript. No scientific concepts, methodology, or analytical logic were generated by AI.
This research has been supported by the Maa- ja vesitekniikan tuki ry (grant no. 4802).
This paper was edited by Homa Kheyrollah Pour and reviewed by two anonymous referees.
Arvola, L. and Nurmesniemi, A.: Seasonal dynamics of plankton in two boreal rivers in northern Finland, SIL Proceedings, 1922–2010, 27, 1928–1932, https://doi.org/10.1080/03680770.1998.11901578, 2000.
Benjamini, Y. and Hochberg, Y.: Controlling the False Discovery Rate: A Practical and Powerful Approach to Multiple Testing, J. R. Stat. Soc. B, 57, 289–300, https://doi.org/10.1111/j.2517-6161.1995.tb02031.x, 1995.
Bennett, K. E. and Prowse, T. D.: Northern Hemisphere geography of ice‐covered rivers, Hydrol. Process., 24, 235–240, https://doi.org/10.1002/hyp.7561, 2010.
Bieniek, P. A., Bhatt, U. S., Rundquist, L. A., Lindsey, S. D., Zhang, X., and Thoman, R. L.: Large-scale climate controls of interior Alaska river ice breakup, J. Clim., 24, 286–297, 2011.
Bjorkman, A. D., Elmendorf, S. C., Beamish, A. L., Vellend, M., and Henry, G. H. R.: Contrasting effects of warming and increased snowfall on Arctic tundra plant phenology over the past two decades, Glob. Change Biol., 21, 4651–4661, https://doi.org/10.1111/gcb.13051, 2015.
Blåfield, L., Marttila, H., Kasvi, E., and Alho, P.: Temporal shift of hydroclimatic regime and its influence on migration of a high latitude meandering river, J. Hydrol., 633, 130935, https://doi.org/10.1016/j.jhydrol.2024.130935, 2024.
Box, J. E., Colgan, W. T., Christensen, T. R., Schmidt, N. M., Lund, M., Parmentier, F.-J. W., Brown, R., Bhatt, U. S., Euskirchen, E. S., and Romanovsky, V. E.: Key indicators of Arctic climate change: 1971–2017, Environ. Res. Lett., 14, 045010, https://doi.org/10.1088/1748-9326/aafc1b, 2019.
Bring, A., Fedorova, I., Dibike, Y., Hinzman, L., Mård, J., Mernild, S. H., Prowse, T., Semenova, O., Stuefer, S. L., and Woo, M.-K.: Arctic terrestrial hydrology: A synthesis of processes, regional effects, and research challenges, J. Geophys. Res.-Biogeo., 121, 621–649, https://doi.org/10.1002/2015JG003131, 2016.
Brown, D. R., Brinkman, T. J., Verbyla, D. L., Brown, C. L., Cold, H. S., and Hollingsworth, T. N.: Changing river ice seasonality and impacts on interior Alaskan communities, Weather Clim. Soc., 10, 625–640, https://doi.org/10.1175/WCAS-D-17-0101.1, 2018.
Burn, D. H., Sharif, M., and Zhang, K.: Detection of trends in hydrological extremes for Canadian watersheds, Hydrol. Process., 24, 1781–1790, https://doi.org/10.1002/hyp.7625, 2010.
Burrell, B. C., Beltaos, S., and Turcotte, B.: Effects of climate change on river-ice processes and ice jams, International Journal of River Basin Management, 21, 421–441, https://doi.org/10.1080/15715124.2021.2007936, 2023.
Byun, K., Chiu, C.-M., and Hamlet, A. F.: Effects of 21st century climate change on seasonal flow regimes and hydrologic extremes over the Midwest and Great Lakes region of the US, Sci. Total Environ., 650, 1261–1277, https://doi.org/10.1016/j.scitotenv.2018.09.063, 2019.
Chen, Y. and She, Y.: Long-term variations of river ice breakup timing across Canada and its response to climate change, Cold Reg. Sci. Technol., 176, 103091, https://doi.org/10.1016/j.coldregions.2020.103091, 2020.
Dauginis, A. A. and Brown, L. C.: Recent changes in pan-Arctic sea ice, lake ice, and snow-on/off timing, The Cryosphere, 15, 4781–4805, https://doi.org/10.5194/tc-15-4781-2021, 2021.
Feng, D., Gleason, C. J., Lin, P., Yang, X., Pan, M., and Ishitsuka, Y.: Recent changes to Arctic river discharge, Nat. Commun., 12, 6917, https://doi.org/10.1038/s41467-021-27228-1, 2021.
Finnish Meteorological Institute: Daily Air Temperature and Snow Depth Observations, Kuusamo Kiutaköngäs Weather Station, FMI Open Data [data set], https://en.ilmatieteenlaitos.fi/open-data (last access: 20 August 2026), 2026.
Fukś, M.: Changes in river ice cover in the context of climate change and dam impacts: a review, Aquat. Sci., 85, 113, https://doi.org/10.1007/s00027-023-01011-4, 2023.
García Criado, M., Myers-Smith, I. H., Bjorkman, A. D., Elmendorf, S. C., Normand, S., Aastrup, P., Aerts, R., Alatalo, J. M., Baeten, L., and Björk, R. G.: Plant diversity dynamics over space and time in a warming Arctic, Nature, 642, 653–661, https://doi.org/10.1038/s41586-025-08946-8, 2025.
Groisman, P. Y. and Easterling, D. R.: Variability and trends of total precipitation and snowfall over the United States and Canada, J. Climate, 7, 184–205, https://doi.org/10.1175/1520-0442(1994)007<0184:VATOTP>2.0.CO;2, 1994.
Harder, P., Pomeroy, J. W., and Westbrook, C. J.: Hydrological resilience of a Canadian Rockies headwaters basin subject to changing climate, extreme weather, and forest management, Hydrol. Process., 29, 3905–3924, https://doi.org/10.1002/hyp.10596, 2015.
IAHR: Multilingual Ice Terminology, Section on Ice Problems, Research Centre for Water Resources Development, Budapest, Hungary, https://rivergages.mvr.usace.army.mil/WaterControl/Districts/MVP/Reports/ice/iahr_ice_terminology.html (last access: 20 August 2026), 1980.
Ionita, M., Badaluta, C.-A., Scholz, P., and Chelcea, S.: Vanishing river ice cover in the lower part of the Danube basin–signs of a changing climate, Sci. Rep., 8, 7948, https://doi.org/10.1038/s41598-018-26357-w, 2018.
Jalali Shahrood, A.: Past, present, and future of river flow regime in Nordic region focusing on river ice break-up events, Ph.D. thesis, University of Oulu, Oulu, Finland, ISBN 978-952-62-3872-2, 2023.
Jalali Shahrood, A., Ahrari, A., Rossi, P. M., Klöve, B., and Torabi Haghighi, A.: RiTiCE: River Flow Timing Characteristics and Extremes in the Arctic Region, Water, 15, 861, https://doi.org/10.3390/w15050861, 2023.
Jalali Shahrood, A., Ahrari, A., Karjalainen, N., Klöve, B., and Haghighi, A. T.: Application of RiTiCE in understanding hydro-meteorological controls on ice break-up patterns in River Tornionjoki, Environ. Monit. Assess., 196, 764, https://doi.org/10.1007/s10661-024-12910-w, 2024.
Janowicz, J. R.: Observed trends in the river ice regimes of northwest Canada, Hydrol. Res., 41, 462–470, https://doi.org/10.2166/nh.2010.145, 2010.
Kendall, M. G.: Rank correlation methods, 4th edn., Charles Griffin, London, 202 pp., ISBN 0-85264-199-0, 1975.
Lehnherr, I., St. Louis, V. L., Sharp, M., Gardner, A. S., Smol, J. P., Schiff, S. L., Muir, D. C., Mortimer, C. A., Michelutti, N., and Tarnocai, C.: The world's largest High Arctic lake responds rapidly to climate warming, Nat. Commun., 9, 1290, https://doi.org/10.1038/s41467-018-03685-z, 2018.
Lesack, L. F., Marsh, P., Hicks, F. E., and Forbes, D. L.: Local spring warming drives earlier river-ice breakup in a large Arctic delta, Geophys. Res. Lett., 41, 1560–1567, https://doi.org/10.1002/2013GL058761, 2014.
Liljedahl, A. K., Boike, J., Daanen, R. P., Fedorov, A. N., Frost, G. V., Grosse, G., Hinzman, L. D., Iijma, Y., Jorgenson, J. C., and Matveyeva, N.: Pan-Arctic ice-wedge degradation in warming permafrost and its influence on tundra hydrology, Nat. Geosci., 9, 312–318, https://doi.org/10.1038/ngeo2674, 2016.
Liston, G. E. and Hall, D. K.: Sensitivity of lake freeze-up and break-up to climate change: a physically based modeling study, Ann. Glaciol., 21, 387–393, https://doi.org/10.3189/S0260305500016116, 1995.
Magnuson, J. J., Robertson, D. M., Benson, B. J., Wynne, R. H., Livingstone, D. M., Arai, T., Assel, R. A., Barry, R. G., Card, V., and Kuusisto, E.: Historical trends in lake and river ice cover in the Northern Hemisphere, Science, 289, 1743–1746, https://doi.org/10.1126/science.289.5485.1743, 2000.
Mann, H. B.: Nonparametric tests against trend, Econometrica, 13, 245–259, https://doi.org//10.2307/1907187, 1945.
Markus, T., Stroeve, J. C., and Miller, J.: Recent changes in Arctic sea ice melt onset, freezeup, and melt season length, J. Geophys. Res., 114, 2009JC005436, https://doi.org/10.1029/2009JC005436, 2009.
Masson-Delmotte, V., Zhai, P., Pirani, A., Connors, S. L., Péan, C., Berger, S., Caud, N., Chen, Y., Goldfarb, L., and Gomis, M. I. (Eds.): Climate Change 2021: The Physical Science Basis. Contribution of Working Group I to the Sixth Assessment Report of the Intergovernmental Panel on Climate Change, Cambridge University Press, Cambridge, United Kingdom and New York, NY, USA, 2391 pp., https://doi.org/10.1017/9781009157896, 2021.
Nalbant, M. A. and Sharma, S.: Investigating the impact of climate change on river ice thickness across the Northern Belt of United States, ISH J. Hydraul. Eng., 29, 217–231, https://doi.org/10.1080/09715010.2022.2050309, 2023.
Newton, A. M. W. and Mullan, D. J.: Climate change and Northern Hemisphere lake and river ice phenology from 1931–2005, The Cryosphere, 15, 2211–2234, https://doi.org/10.5194/tc-15-2211-2021, 2021.
Park, H., Yoshikawa, Y., Oshima, K., Kim, Y., Ngo-Duc, T., Kimball, J. S., and Yang, D.: Quantification of warming climate-induced changes in terrestrial Arctic river ice thickness and phenology, J. Climate, 29, 1733–1754, https://doi.org/10.1175/JCLI-D-15-0569.1, 2016.
Pavelsky, T. M. and Zarnetske, J. P.: Rapid decline in river icings detected in Arctic Alaska: Implications for a changing hydrologic cycle and river ecosystems, Geophys. Res. Lett., 44, 3228–3235, https://doi.org/10.1002/2016GL072397, 2017.
Podkowa, A., Kugler, Z., Nghiem, S. V., and Brakenridge, G. R.: Ice Freeze-Up and Break-Up in Arctic Rivers Observed With Satellite L-Band Passive Microwave Data From 2010 to 2020, Water Resour. Res., 59, e2022WR031939, https://doi.org/10.1029/2022WR031939, 2023.
Prowse, T., Alfredsen, K., Beltaos, S., Bonsal, B. R., Bowden, W. B., Duguay, C. R., Korhola, A., McNamara, J., Vincent, W. F., Vuglinsky, V., Walter Anthony, K. M., and Weyhenmeyer, G. A.: Effects of Changes in Arctic Lake and River Ice, AMBIO, 40, 63–74, https://doi.org/10.1007/s13280-011-0217-6, 2011.
Prowse, T. D. and Bonsal, B. R.: Historical trends in river-ice break-up: a review, Hydrol. Res., 35, 281–293, https://doi.org/10.2166/nh.2004.0021, 2004.
Prowse, T. D., Wrona, F. J., Reist, J. D., Gibson, J. J., Hobbie, J. E., Lévesque, L. M., and Vincent, W. F.: Climate change effects on hydroecology of Arctic freshwater ecosystems, AMBIO, 35, 347–358, https://doi.org/10.1579/0044-7447(2006)35[347:CCEOHO]2.0.CO;2, 2006.
Prowse, T. D., Bonsal, B. R., Duguay, C. R., and Lacroix, M. P.: River-ice break-up/freeze-up: a review of climatic drivers, historical trends and future predictions, Ann. Glaciol., 46, 443–451, https://doi.org/10.3189/172756407782871431, 2007.
Rokaya, P., Morales-Marín, L., Bonsal, B., Wheater, H., and Lindenschmidt, K.-E.: Climatic effects on ice phenology and ice-jam flooding of the Athabasca River in western Canada, Hydrol. Sci. J., 64, 1265–1278, https://doi.org/10.1080/02626667.2019.1638927, 2019.
Saraniemi, M., Huusko, A., and Tahkola, H.: Spawning migration and habitat use of adfluvial brown trout, Salmo trutta, in a strongly seasonal boreal river, Boreal Env. Res., 13, 121–132, 2008.
Schwartz, M. D., Ahas, R., and Aasa, A.: Onset of spring starting earlier across the Northern Hemisphere, Glob. Change Biol., 12, 343–351, https://doi.org/10.1111/j.1365-2486.2005.01097.x, 2006.
Sen, P. K.: Estimates of the regression coefficient based on Kendall's tau, J. Am. Stat. Assoc., 63, 1379–1389, https://doi.org/10.1080/01621459.1968.10480934, 1968.
Sharma, S., Magnuson, J. J., Batt, R. D., Winslow, L. A., Korhonen, J., and Aono, Y.: Direct observations of ice seasonality reveal changes in climate over the past 320–570 years, Sci. Rep., 6, 25061, https://doi.org/10.1038/srep25061, 2016.
Sharma, S., Filazzola, A., Nguyen, T., Imrit, M. A., Blagrave, K., Bouffard, D., Daly, J., Feldman, H., Feldsine, N., and Hendricks-Franssen, H.-J.: Long-term ice phenology records spanning up to 578 years for 78 lakes around the Northern Hemisphere, Sci. Data, 9, 318, https://doi.org/10.1038/s41597-022-01391-6, 2022.
Shen, H. T.: River Ice Processes, in: Advances in Water Resources Management, edited by: Wang, L. K., Yang, C. T., and Wang, M.-H. S., Springer International Publishing, Cham, 483–530, https://doi.org/10.1007/978-3-319-22924-9_9, 2016.
Shiklomanov, A. I. and Lammers, R. B.: River ice responses to a warming Arctic – recent evidence from Russian rivers, Environ. Res. Lett., 9, 035008, https://doi.org/10.1088/1748-9326/9/3/035008, 2014.
Shiklomanov, A. I., Lammers, R. B., Rawlins, M. A., Smith, L. C., and Pavelsky, T. M.: Temporal and spatial variations in maximum river discharge from a new Russian data set, J. Geophys. Res.-Biogeo., 112, G04S53, https://doi.org/10.1029/2006JG000352, 2007.
Siegel, J. E., Fullerton, A. H., and Jordan, C. E.: Accounting for snowpack and time-varying lags in statistical models of stream temperature, J. Hydrol. X, 17, 100136, https://doi.org/10.1016/j.hydroa.2022.100136, 2022.
Spearman, C.: The Proof and Measurement of Association between Two Things, Am. J. Psychol., 15, 72, https://doi.org/10.2307/1412159, 1904.
St. Jacques, J.-M. and Sauchyn, D. J.: Increasing winter baseflow and mean annual streamflow from possible permafrost thawing in the Northwest Territories, Canada, Geophys. Res. Lett., 36, L01401, https://doi.org/10.1029/2008GL035822, 2009.
Stone, R. S., Dutton, E. G., Harris, J. M., and Longenecker, D.: Earlier spring snowmelt in northern Alaska as an indicator of climate change, J. Geophys. Res., 107, https://doi.org/10.1029/2000JD000286, 2002.
SYKE (Finnish Environment Institute): Daily river discharge, Oulanka Research Station, Hertta database [data set], https://wwwp2.ymparisto.fi/scripts/kirjaudu.asp (last access: 20 August 2026), 2026.
Takács, K. and Kern, Z.: Multidecadal changes in the river ice regime of the lower course of the River Drava since AD 1875, J. Hydrol., 529, 1890–1900, https://doi.org/10.1016/j.jhydrol.2015.01.040, 2015.
Theil, H.: A rank-invariant method of linear and polynomial regression analysis, Indagat. Math., 12, 173–177, 1950.
Von Storch, H.: Misuses of Statistical Analysis in Climate Research, in: Analysis of Climate Variability, edited by: Von Storch, H. and Navarra, A., Springer Berlin Heidelberg, Berlin, Heidelberg, 11–26, https://doi.org/10.1007/978-3-662-03744-7_2, 1999.
Vuglinsky, V.: Assessment of changes in ice regime characteristics of Russian lakes and rivers under current climate conditions, Nat. Resour., 8, 416–431, https://doi.org/10.4236/nr.2017.86027, 2017.
Vuglinsky, V. and Valatin, D.: Changes in ice cover duration and maximum ice thickness for rivers and lakes in the Asian part of Russia, Nat. Resour., 9, 73–87, https://doi.org/10.4236/nr.2018.93006, 2018.
Wang, X. and Feng, L.: Patterns and Trends in Northern Hemisphere River Ice Phenology from 2000 to 2021, Remote Sens. Environ.t, 313, 114346, https://doi.org/10.1016/j.rse.2024.114346, 2024.
Yang, X., Pavelsky, T. M., and Allen, G. H.: The past and future of global river ice, Nature, 577, 69–73, https://doi.org/10.1038/s41586-019-1848-1, 2020.