
the Creative Commons Attribution 4.0 License.
the Creative Commons Attribution 4.0 License.
 | 24 Aug 2026
Modeling the Distribution of Mountain Permafrost in Chile
Alexander Brenning
Guillermo F. Azócar
Pablo Iribarren Anacona
Kenji Yoshikawa
Gino Casassa
Pedro Straub-Bustamante
Duilio Fonseca-Gallardo
Jorge Huenante
Mountain permafrost affects slope stability and hydrological processes, yet its distribution remains poorly understood in many parts of the world, including Chile. This study develops the first empirically calibrated national-scale high-resolution (30 m × 30 m) model of mountain permafrost distribution in mainland Chile, using geomorphological evidence from intact (active and inactive) and relict rock glaciers, along with empirical indicators of permafrost presence/absence primarily derived from borehole temperature records, test pits, and surface temperature measurements. We employ a generalized additive model representing local and regional trends by incorporating mean annual air temperature, potential incoming solar radiation, and latitude as predictors. This model achieved an area under the receiver operating characteristic curve (AUROC) of 0.70 (0.74) in spatial (non-spatial) cross-validation. The model's predictions generate a Permafrost Favorability Index (PFI), which expresses the potential of permafrost occurrence conditional on the predictor variables. Excluding glaciers, rock glaciers and vegetated surfaces, areas with PFI values (≥ 0.75) were classified as having favorable conditions for permafrost development. Under this criterion, approximately 1.06 % (8042 km2) of mainland Chile exhibits conditions suitable for mountain permafrost, concentrated in the Atacama, Antofagasta, Coquimbo, and Santiago Metropolitan regions (21–32° S and 33–34° S). In contrast, permafrost is scarce or absent from the Maule to the Magallanes regions (south of ∼ 36° S). The interpretation of PFI values should consider local environmental factors not included in the model, such as snow cover duration, clast size, soil properties, and surface albedo. These variables may influence the presence or absence of permafrost locally and should be accounted for through an interpretative guide. This first version of the permafrost distribution model provides a baseline for understanding its general distribution in Chile, which should be refined as new empirical evidence and improved subsurface temperature records become available in the future.
- Article
(8820 KB) - Full-text XML
- BibTeX
- EndNote


Mountain permafrost is a key component of high-altitude environments, influencing slope stability (Harris et al., 2001; Huggel et al., 2010) and hydrological systems (Jones et al., 2019; Arenson et al., 2022). Information on mountain permafrost supports assessments of climate change impacts on fragile mountain ecosystems and of risks to human livelihoods and economic activities in these regions. In the Andes, mountain permafrost has gained growing attention as mining, water resource management, and infrastructure development increasingly expand into arid and semi-arid high-altitude areas (Brenning and Azócar, 2010a; Masiokas et al., 2020). Environmental impacts in permafrost areas are currently not addressed by specific regulations, although related policy discussions have been ongoing since 2019 in the context of proposed glacier protection legislation (Senate of Chile, 2023). Despite these implications, its spatial distribution remains poorly understood in the Andes due to limited empirical data and model-based assessments. This study addresses this gap by developing the first high-resolution, statistically based permafrost favorability model in Chile.
Empirical models combining observational data with topographic and climatic predictor variables provide an effective means of approximating permafrost distribution at regional scales (Keller, 1992; Gruber and Hoelzle, 2001; Lewkowicz and Ednie, 2004; Janke, 2005; Boeckli et al., 2012a, b; Gruber, 2012; Sattler et al., 2016; Marcer et al., 2017; Azócar et al., 2017; Deluigi et al., 2017; Hu et al., 2024; Wu et al., 2025). While such models have been widely applied in many mountain regions, their application in the Andes remains limited. Previous studies covering the Andean region are either very general and based on coarse-resolution global climate models (Gruber, 2012; Saito et al., 2015), or they focus on specific regions, such as the semi-arid Andes of central-northern Chile (Azócar et al., 2017).
Recent advances in gathering evidence of permafrost presence in this remote mountain region along with improved climate data (Brun et al., 2022) and better computer processing present a unique opportunity to model permafrost distribution at finer spatial resolutions and broader scales in the Andes. In addition to an increasing availability of geomorphological evidence (Dirección General de Aguas, 2022b, or Chilean Water Directorate, hereafter DGA), government-led monitoring programs and environmental baseline studies provide in-situ permafrost observations (Yoshikawa et al., 2025).
Rock glaciers, as geomorphological indicators, are widely used as proxies for mountain permafrost distribution due to their association with permafrost conditions (Janke, 2005; Boeckli et al., 2012a; Sattler et al., 2016; Azócar et al., 2017; Hu et al., 2024; Mahanta et al., 2024; Wu et al., 2025). Despite their abundance in the Andes, their use in permafrost modeling has been underexplored. One challenge is that rock glaciers, due to their downslope movement and ice-rich content, can extend into permafrost-free terrain and exhibit delayed responses to climatic changes. Bias corrections, such as elevation offsets, are necessary to account for these effects (Boeckli et al., 2012a; Azócar et al., 2017; Cao et al., 2021).
This study, which is based on a project conducted for the Dirección General de Aguas (2022a), delivers the first peer-reviewed, high-resolution (30 m × 30 m) statistical model of permafrost distribution across mainland Chile, integrating geomorphological evidence (e.g., rock glacier activity status), field data (e.g., borehole and surface temperature records), and topoclimatic predictors (e.g., mean annual air temperature and potential incoming solar radiation). Empirical models, including generalized additive models (GAMs), were used to capture nonlinear relationships between predictors and permafrost presence or absence. GAMs are particularly suitable for this purpose as they balance flexibility and interpretability (Hjort and Luoto, 2013; Goetz et al., 2015). Our model generates a regionalization, conceptualized as a Permafrost Favorability Index (PFI), that reflects the likelihood of permafrost occurrence conditional on the available environmental predictors (Boeckli et al., 2012a; Azócar et al., 2017). The results are compared to the global permafrost zonation index of Gruber (2012).
This research provides a baseline assessment of the potential spatial distribution of mountain permafrost under current climatic conditions in Chile. By combining landform-based and field-observed evidence, it establishes a foundation for future investigations into permafrost characteristics, dynamics, and sensitivity to climate change. The findings also address critical knowledge gaps in the Andean cryosphere and offer a platform for future studies.
The study area spans the entire length of mainland Chile located in South America, encompassing the Andes mountain range from approximately 18° S in the north to 56° S in the south. This region covers diverse climatic and topographic conditions, ranging from the hyper-arid Atacama Desert in the north to the cool temperate zone in the south, with tenfold differences in annual precipitation. Peak elevations frequently exceed 5000 m above sea level in the northern and central Andes, occasionally even 6000 m, as at Nevado Ojos del Salado (6893 m a.s.l., 27°07' S) or Volcán Tupungato (6570 m a.s.l., 33°21' S), and gradually declining toward the southern Andes with summit elevations rarely above 3000 m a.s.l. (e.g., Monte San Lorenzo, 3706 m a.s.l., 47°35' S).
The 0 °C isotherm altitude (Zero Isotherm Altitude, ZIA), an indicator of large-scale patterns in mountain climate, declines gradually with increasing latitude. In the northern Chilean Andes, it is located around 4,500–5000 m a.s.l., decreasing to ∼ 1000 m in the southernmost part of the study area (Masiokas et al., 2020).
Vegetation is sparse at high elevations, particularly in the arid and semi-arid Andes north of ∼ 34° S, with the exception of azonal wetlands and floodplains. Toward the south, alpine vegetation only becomes more prevalent – and summit elevations high enough – at elevations close to the ZIA south of ∼ 41° S. Nevertheless, the treeline is also much lower (e.g., at ∼ 1200 m a.s.l. at ∼ 41° S and ∼ 600–700 m at ∼ 54° S; Daniels and Veblen, 2003; Hansson et al., 2023) and therefore remains well below possible permafrost occurrences.
The distribution of glaciers, rock glaciers, and permafrost reflects these latitudinal gradients in climate and topography. In the north to central Chilean Andes, summit elevations exceed the modern equilibrium line altitude (ELA), typically above 5000 m a.s.l. north of 31° S (Azócar and Brenning, 2010; Masiokas et al., 2020). Nevertheless, glaciers in the northern Chilean Andes are scarce and often limited to small glacierets or perennial snow patches. In the southern Andes, the ELA descends to altitudes below 1500 m a.s.l. due to increased precipitation and cooler temperatures, facilitating the development of extensive ice fields such as the Northern and Southern Patagonian Ice Fields (Masiokas et al., 2020).
Rock glaciers, as permafrost landforms, are distributed across the Andes but exhibit distinct latitudinal and altitudinal patterns. Active and inactive rock glaciers are prevalent above 4200 m a.s.l. in the arid and semi-arid northern Andes. In central Chile, active rock glaciers are observed mainly above 3500 m a.s.l., whereas in southern Chile, their presence diminishes due to higher precipitation and the absence of suitable debris accumulation. There are gaps in the distribution of rock glaciers in northern Chile between 24 and 26° S, and in southern Chile from 36.5 to 43.5° S.
This section outlines the data sources and statistical methods used to model permafrost distribution across mainland Chile. Overall, we follow an empirically calibrated statistical modeling approach based on positional and climatic predictor variables (Boeckli et al., 2012a; Sattler et al., 2016; Azócar et al., 2017; Deluigi et al., 2017; Marcer et al., 2017; Wu et al., 2025). We detail the response variable based on geomorphological and in-situ evidence, the derivation of predictor variables such as MAAT (mean annual air temperature) and PISR (potential incoming solar radiation), and the application of a GAM to produce a high-resolution permafrost favorability index.
3.1 Response and predictor variables
3.1.1 Permafrost evidence
The response variable for modeling permafrost distribution was derived from an inventory of geomorphological and empirical evidence of permafrost presence and absence across mainland Chile. Two main sources of data were used: (1) a comprehensive rock glacier inventory and (2) in-situ evidence from boreholes, test pits, and ground surface temperature measurements.
Rock glacier inventory
Rock glaciers, geomorphological indicators of permafrost, were identified and classified based on their distinct morphological features, such as tongue- or lobe-shaped forms with surface ridges and furrows indicative of deformation (Barsch, 1996; Roer and Nyenhuis, 2007). Active and inactive rock glaciers, grouped together as intact forms, were distinguished from relict forms using criteria adapted to the conditions in the Andes (Azócar et al., 2017). While intact rock glaciers are often characterized by steep fronts and unstable rocks, relict forms exhibit collapsed surfaces indicative of ice loss. Given the inherent subjectivity in interpreting these features from satellite imagery, intact forms were treated as a single category.
Rock glacier data were compiled from (1) the Public Glacier Inventory (PGI) of the DGA (2022c) containing only intact rock glaciers, (2) an existing inventory for the Huasco to Choapa catchments in north–central Chile (Azócar et al., 2017), and additional relict landforms mapped manually across the Andes for this study. Rock glaciers were represented by point features marking their root zones, with the exception of the inventory data from (Azócar et al., 2017), which represented toe locations that were bias-adjusted in the modeling process (see Sect. 3.2). Root-zone points were extracted from the PGI polygon data using an automated extraction procedure, reducing the sensitivity to inaccuracies in polygon extent and shape.
The activity status of all rock glaciers was assessed based on visual interpretation of Esri World Imagery (resolution ≤ 1 m, in particular Maxar WorldView–2/GeoEye–2). Two operators conducted the classification independently using the criteria summarized in Table 1, and ambiguous cases were reviewed jointly to ensure consistent interpretation. The criteria catalog was adapted for this study based on previous studies (Barsch, 1996; Burger et al., 1999; Roer and Nyenhuis, 2007; Azócar et al., 2017). In the case of status information included in existing inventories, the classification was re-assessed. For example, 46 out of 2966 intact rock glaciers from the PGI were assigned to the relict rock glacier class. Recent guidelines for rock glacier inventories and remote-sensing approaches provide additional tools for improving such classifications (RGIK Working Group, 2023; Brardinoni et al., 2026).
Table 1Evaluation of geomorphological, geomorphometric, and environmental parameters for determining the dynamics of rock glaciers (RG) in the dry Andes.
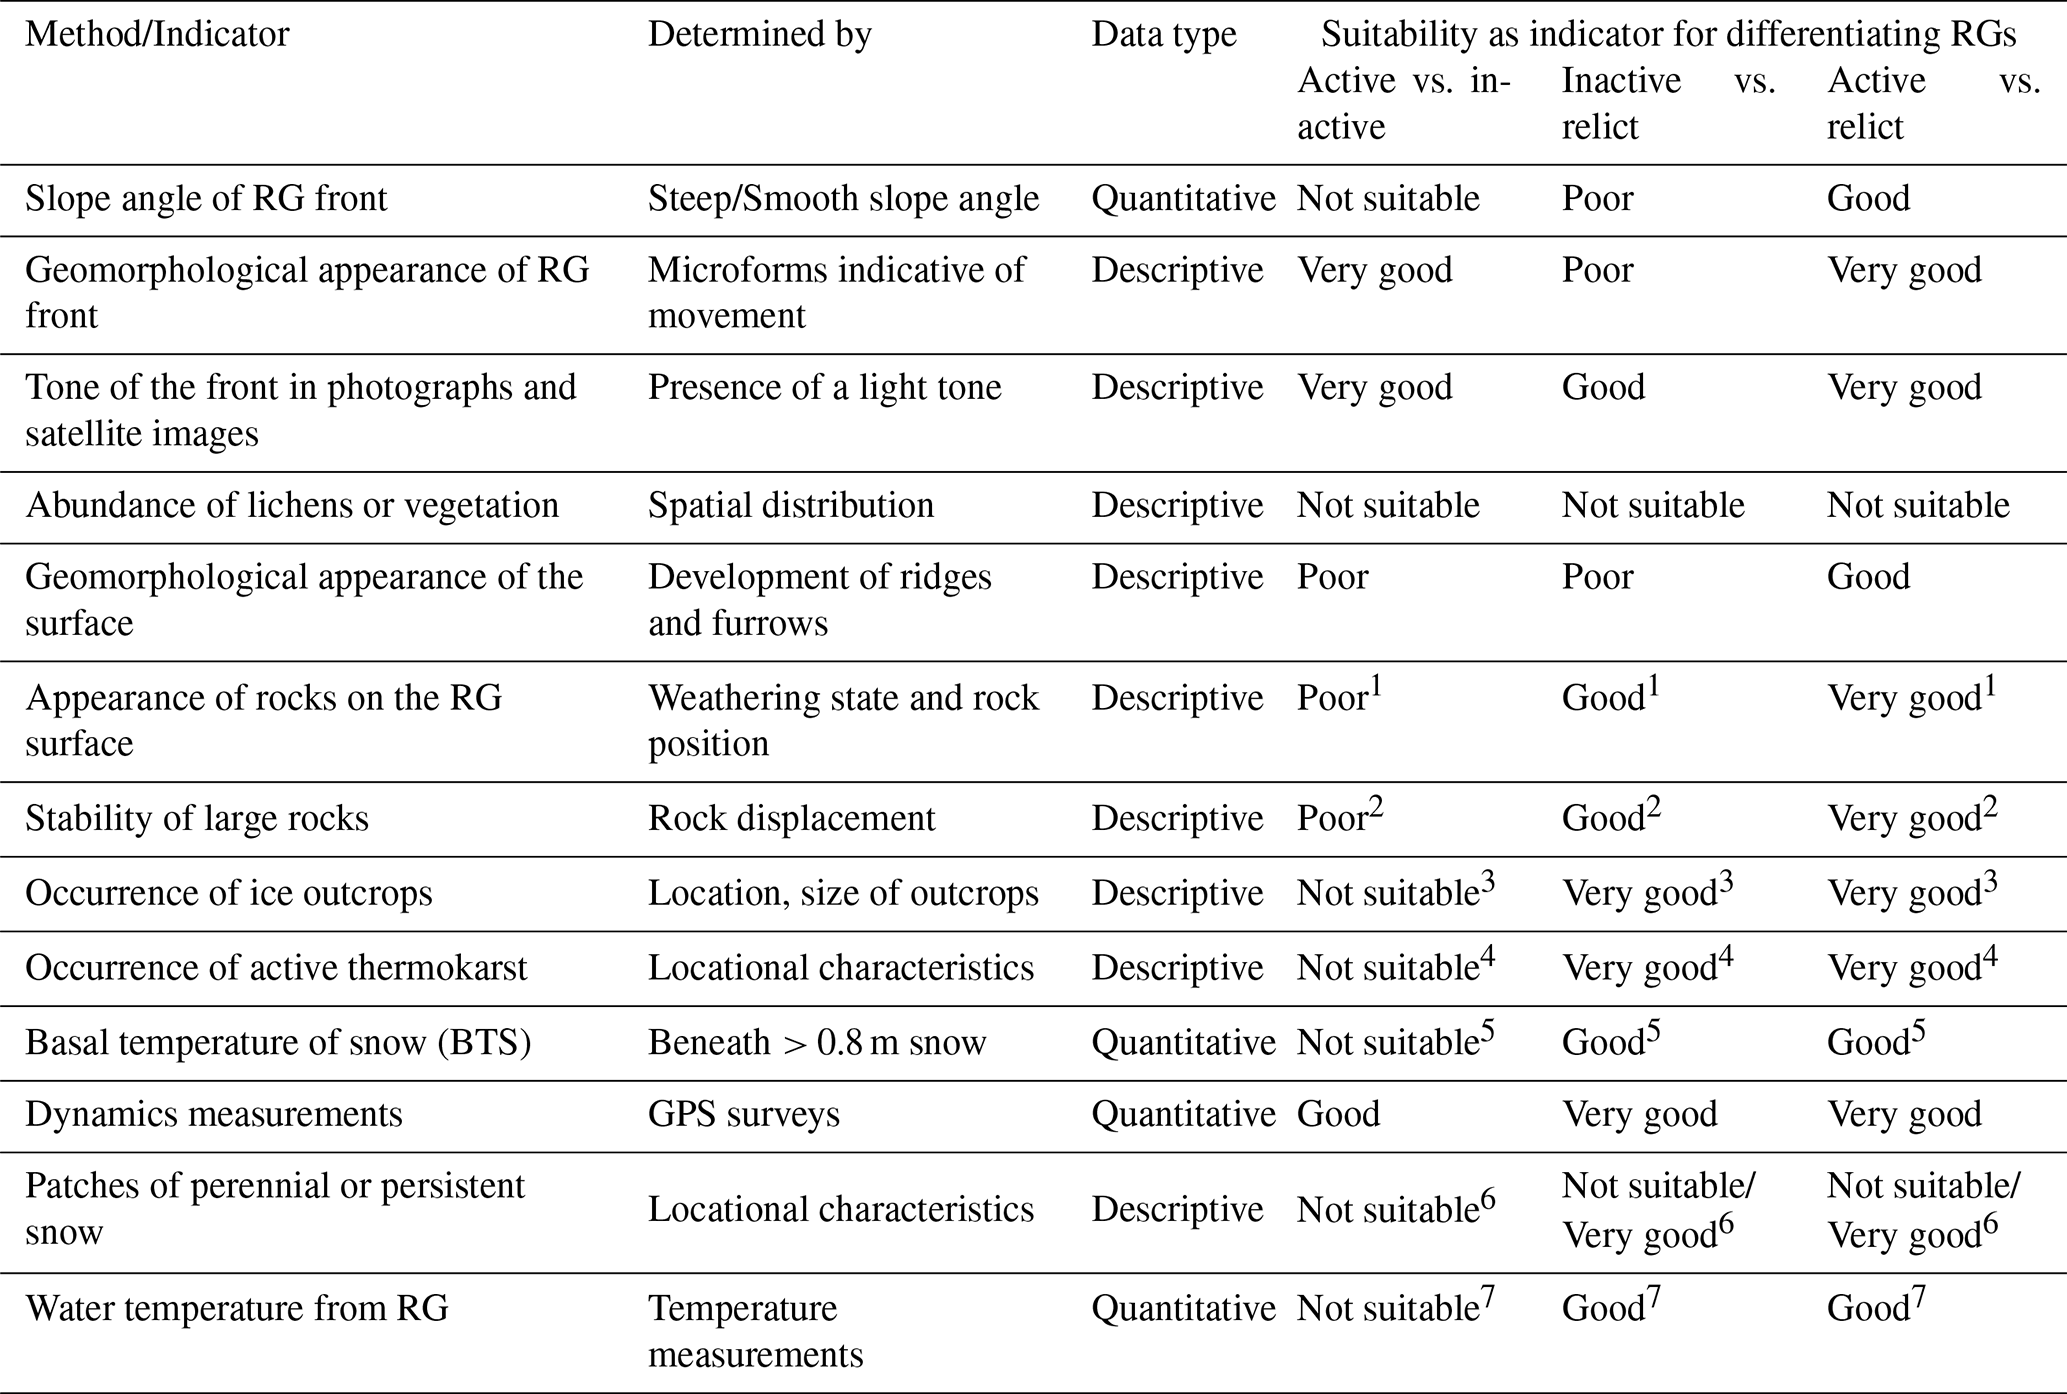
1 Generally, active and inactive RGs tend to have fresh rock fragments, often with overturned rocks. In contrast, relict RGs exhibit weathered rock fragments, sometimes covered with lichens. 2 On active and inactive RGs, large blocks can often be slightly displaced by human force, unlike in relict RGs where the rocks have settled and are much harder to move. 3 The occurrence of ice outcrops indicates a non-relict state but does not distinguish between active and inactive rock glaciers. Conversely, the absence of ice outcrops does not indicate the dynamic state of the RG. 4 The absence of active thermokarst does not necessarily indicate that the RG is active or inactive; however, the presence of active thermokarst could indicate that the RG is active or inactive but not relict. 5 BTS (basal temperature of snow) values 2 °C indicate no permafrost, while BTS 3 °C indicates a probable presence of permafrost. Therefore, measuring the basal snow temperature could be a useful indicator to differentiate between intact and relict RGs. However, the temperature thresholds defining the presence or absence of permafrost must be calibrated locally (see Lewkowicz and Ednie, 2004). 6 The absence of perennial snow patches does not necessarily indicate the absence of permafrost and, therefore, the activity level of a RG. However, the presence of perennial snow patches could be used as an indicator of the presence of permafrost and, consequently, active or inactive RGs (Haeberli, 1975). 7 A temperature close to 0 °C implies that water has permafrost contact within the RG; therefore, it would indicate an active or inactive RG state. However, a higher temperature does not necessarily mean there is no ice within a RG (Haeberli, 1975).
In-situ evidence of permafrost
Complementing the rock glacier inventory, an extensive dataset of 238 in-situ observations was compiled to document the presence or absence of permafrost (DGA, 2022b). These data, primarily sourced from government and mining-related studies, include test pits (TP; 135 observations of subsurface conditions), ground surface temperature (GST; 23 locations), and boreholes (BH; 80 ground temperature records; 12 of the BH are also documented in a recent study by Koenig et al., 2025). Evidence was classified according to the likelihood of permafrost presence or absence, using established thresholds and expert validation. Of the total observations, 93 indicated permafrost presence (3 confirmed, 36 probable, and 54 possible), while 145 indicated absence (16 confirmed, 129 uncertain). The majority of these observations are located in the Atacama region (181 between 26 and 28° S), while only isolated observations exist south of the Metropolitan Region and the southern Magallanes Region (6 south of 34° S; see Fig. 1).
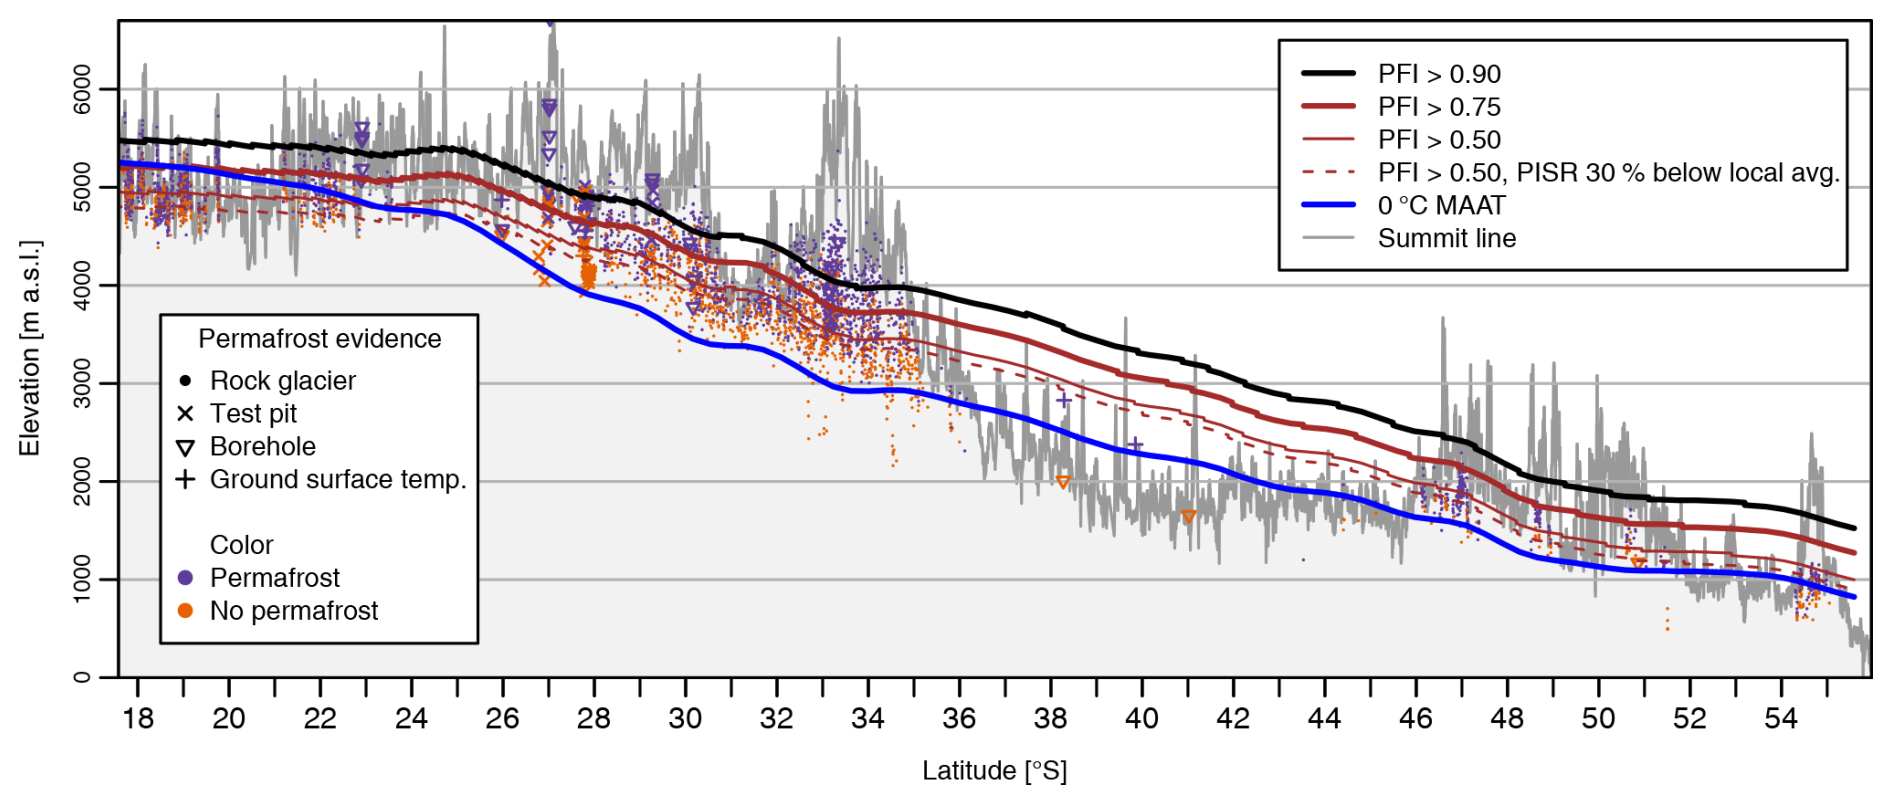
Figure 1Latitudinal shift in the altitudinal distribution of PFI in mainland Chile: Elevation at which the PFI has values 0.90, 0.75 and 0.50 at PISR equal to the regional mean, and for a PFI of 0.75 and PISR 30 % below regional mean. The 0 °C isotherm altitude and permafrost evidence records are shown for reference. Latitudes of in-situ observations were perturbed to reduce clutter, and only a random sample of observations is shown where density is highest (in-situ observations: 27–29° S; rock glaciers: 27–36° S).
3.1.2 Predictor variables
The predictor variables used in the permafrost distribution model included topoclimatic and topographic data, specifically MAAT, PISR, and latitude, all of which were derived at or resampled to a 30 m × 30 m target resolution. As digital elevation model (DEM) we use the NASADEM product (NASA JPL, 2020), which provides full, gap-filled coverage of Chile's topography at this resolution.
MAAT was derived from CHELSA–BIOCLIM+ gridded climate datasets (Brun et al., 2022), which provide global temperature data (1979–2019 mean) at ∼ 1 km × 1 km resolution. The dataset was resampled to 30 m × 30 m resolution using a GAM with NASADEM elevation and latitude as predictors. This model setup adjusts CHELSA–BIOCLIM+ data, allowing for a latitudinal temperature shift as well as latitudinally varying lapse rates. The final model used 27.6 effective degrees of freedom and achieved an of 0.893 with a residual standard deviation of 1.09 °C and used a constant lapse rate of 0.005398 °C m−1. Uncertainty in the downscaled MAAT field therefore contributes to uncertainty in the resulting permafrost favorability estimates, particularly near the lower limit of favorable permafrost conditions. This source of uncertainty is not explicitly propagated in the delta-method uncertainty estimates reported below.
Potential Incoming Solar Radiation (PISR) represents the annual sum of direct and diffuse solar radiation and was calculated using SAGA GIS (v9.0.2; Conrad et al., 2015) based on the NASADEM. Annual PISR was estimated for clear-sky conditions in 30 min time steps and at 10 d intervals, accounting for topographic shading. Regional atmospheric transmittance values were adjusted by latitude, ranging from 50 % in northern Chile to 70 % in southern regions with increased atmospheric moisture content. To improve model interpretability, PISR values were centered around the dataset's mean, creating a normalized variable (CPISR) for input into the statistical model. A CPISR value of 1.2, for example, means that a location has a PISR 20 % above the study area's mean value.
Additionally, latitude was used as a proxy for large-scale climatic gradients, especially those related to snow cover and precipitation characteristics.
3.2 Statistical model
A GAM was implemented to predict the spatial distribution of permafrost in mainland Chile. GAMs extend generalized linear models (GLMs) by allowing nonlinear relationships between predictors and the response variable through the use of smoothing functions (Wood, 2017). They have been applied successfully to model rock glacier and mountain permafrost distribution as well as other geomorphological processes and landforms (Brenning and Azócar, 2010b; Hjort and Luoto, 2013; Brenning et al., 2015; Azócar et al., 2017). While the use of more flexible models such as random forests has been proposed in the context of permafrost modeling (Deluigi et al., 2017; Hu et al., 2024; Mahanta et al., 2024), increases in model performance are often negligible or due to overfitting and may not outweigh the loss of interpretability compared to additive models (Goetz et al., 2015; Jiang et al., 2024).
As response variable Y we use an indicator variable for permafrost presence (Y= 1) versus absence (Y= 0) derived from all geomorphological and in-situ evidence described in Sect. 3.1.1. Our predictors are MAAT, CPISR, and latitude. The model, which uses a logistic link function, can therefore be expressed as:
where P(x) is the probability of permafrost presence at location x, β0 is the intercept, and fMAAT, fCPISR, fLAT are nonlinear smoothing functions for MAAT, CPISR, and latitude, respectively. We impose monotonicity constraints (Pya and Wood, 2015) to avoid overfitting and improve geomorphological plausibility by ensuring a monotonic decrease in predicted probabilities for increasing MAAT, CPISR, and latitude. In addition, model adjustments as outlined below are implemented to reduce possible biases.
Model predictions on the probability scale were used to define a permafrost favorability index (PFI), which we interpret as a relative indicator of potential permafrost conditions rather than as a calibrated probability of local permafrost occurrence (Boeckli et al., 2012a; Azócar et al., 2017).
The model was fitted in R using the scam package, which extends the mgcv implementation of spline-based GAMs (Wood, 2017; Pya, 2023) for model fitting, RSAGA and terra for spatial data processing (Brenning et al., 2022; Hijmans, 2025), and sperrorest for model assessment (Brenning, 2012). Predictor variables were extracted and processed using SAGA GIS (v9.0.2; Conrad et al., 2015). For reproducibility, a revised, fully terra-based implementation of the workflow was released at Zenodo (Brenning and Azócar, 2026).
Model assessment
Model performance was evaluated using spatial cross-validation (CV) to account for spatial dependencies in the data and assess how well the model generalizes from the data (Brenning, 2012; Jiang et al., 2024). We used leave-one-block-out CV with k= 10 blocks created by k-means clustering. The area under the receiver operating characteristic curve (AUROC) was calculated as a goodness-of-fit measure. AUROC values range from 0.5 (no predictive power) to 1.0 (perfect separation of both classes), with values above 0.70 considered acceptable (Hosmer and Lemeshow, 2000).
Model adjustments
To refine the permafrost distribution model and address potential biases, several adjustments were implemented, including the use of altitudinal offsets, the exclusion of certain surface types, and the definition of a model domain based on climatic thresholds. Such adjustments have been implemented previously in similar studies (Boeckli et al., 2012a; Azócar et al., 2017).
While intact rock glaciers (active and inactive) are considered indicators of the lower limit of permafrost, their distal parts have often advanced into zones where climatic conditions are less favorable for permafrost. To account for this, the model considered the root zones (maximum altitude) of rock glaciers as more representative of conditions favorable for permafrost preservation, rather than their toes. For rock glaciers in the Huasco, Elqui, Limarí, and Choapa basins, an altitudinal offset of 89 m, estimated by Azócar et al. (2017), was therefore applied as an adjustment, while in the other areas, actual root-zone locations were available.
Because the model is empirically calibrated, the MAAT predictor does not need to represent the exact thermal conditions under which the geomorphological indicators developed or reached quasi-equilibrium. What is required is that it provides a spatially coherent temperature index whose systematic offsets from longer-term effective thermal conditions are smooth functions of predictors included in the model. For instance, if such offsets vary mainly with latitude, they can be absorbed by the fitted latitude smooth. Thus, alternative MAAT reference fields that differ smoothly along the modeled climatic gradient would be expected to yield similar favorability surfaces, although the individual smooth terms may differ. This does not imply that the model reconstructs historical climate variability or transient ground thermal responses; rather, it reflects the empirical calibration of the response surface within the represented predictor space.
To align with the project scope, we constrained the model domain using exclusion criteria related to glaciers, vegetation, and MAAT. Glacier-covered areas were removed as glaciers in this region cannot be assumed to be cold-based. Glacier polygons were sourced from the PGI (DGA, 2022c). Similarly, areas with vegetation cover were excluded using a normalized difference vegetation index (NDVI) derived from Landsat imagery (2013–2022; U.S. Geological Survey Landsat 8 Collection 1 Tier 1 32-Day NDVI Composite). A threshold of ≥ 0.2 was applied to the 75th percentile of NDVI during this period to generate a binary mask of vegetated zones. Thus, even sparse vegetation with a short greening period is masked out. Areas with MAAT above 5 °C were also discarded.
4.1 Exploratory analysis
The dataset for modeling permafrost distribution consisted of 10 517 observations, including 6187 intact and 4092 relict rock glaciers from multiple inventories, and in-situ evidence (DGA, 2022a). Observations were classified into two categories: presence of permafrost (6279 observations) and absence of permafrost (4238 observations).
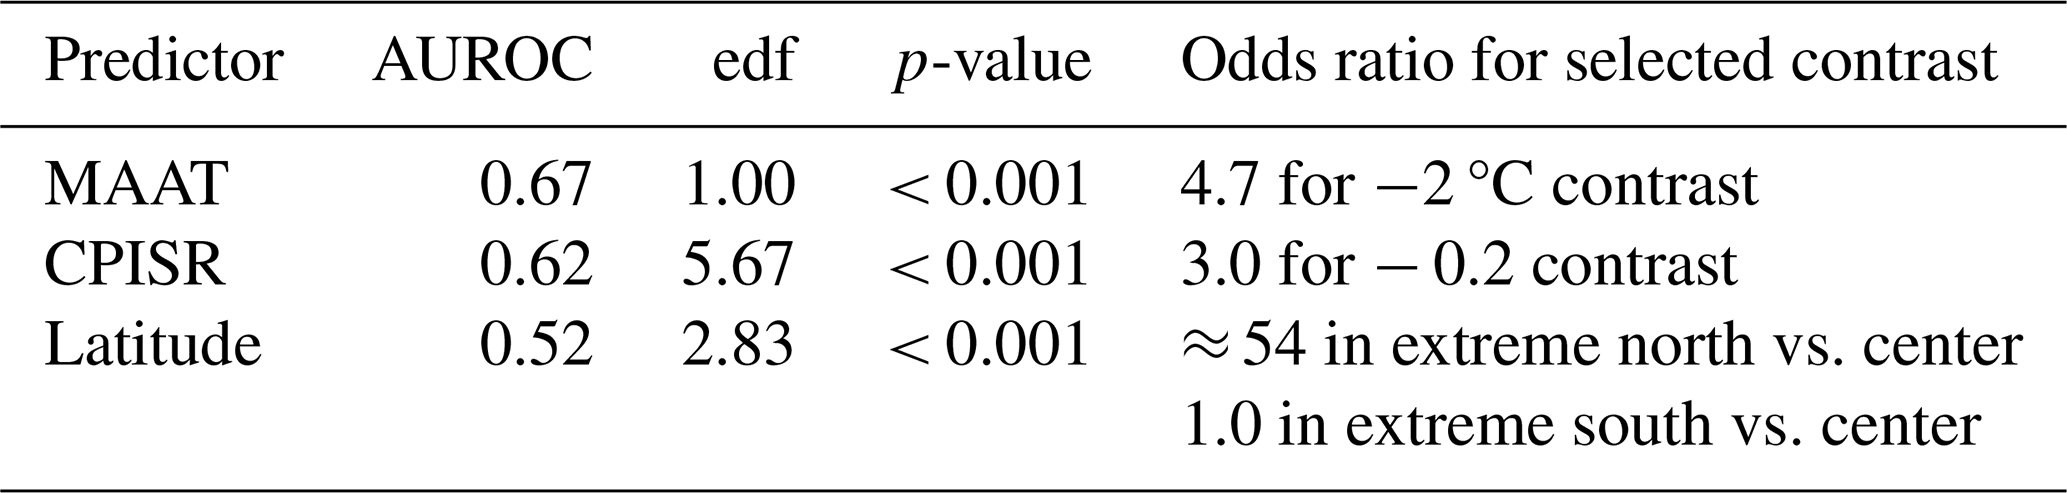
MAAT, CPISR and latitude each were negatively associated with permafrost presence (univariate AUROC values: 0.67, 0.62 and 0.52, respectively; Table 2). We also evaluated concurvity (a measure of nonlinear dependence among predictors in GAMs). Pairwise Pearson and Spearman correlations of predictors were weak (absolute values below 0.40), indicating no concurvity issues.
Table 2Summary statistics of the permafrost distribution model, a shape-constrained GAM, and its predictor variables (edf: effective degrees of freedom).
4.2 Model performance and interpretation
In the model of permafrost presence versus absence, all predictor variables (MAAT, CPISR, and latitude) showed a statistically significant association with the response (p-values < 0.001; Table 2), using moderately nonlinear smoothing functions with up to 5.7 effective degrees of freedom for each predictor (Fig. 2). The monotonicity constraint on latitude eliminated an implausible overshoot or “cold anomaly” in a data-poor region in south-central Chile (37–44° S), which would have been modeled with 8.9 additional degrees of freedom if an unconstrained model had been used. Using spatial CV, the model's AUROC showed “acceptable” discrimination between presence and absence of permafrost, with a mean AUROC of 0.74 for random partitions and 0.70 for spatial blocks. This difference suggests that the model generalizes well from the data.
Model-derived local uncertainty was estimated with the delta method (Wood, 2017) and expressed on the PFI scale. This uncertainty describes the sampling uncertainty of the fitted response surface, conditional on the selected model structure, predictor variables, and training data. It was small over most of the prediction domain: in 75 % of the area, the standard error was below 0.015 and only in 1 % of the area it exceeded 0.05 PFI units. They were lowest (< 0.01 on average) between ∼ 29 and ∼ 48° S and highest (> 0.015) north of (∼ 25° S). These values indicate that the fitted regional-scale response surface is relatively stable. They should not be interpreted as comprehensive local uncertainty bounds for permafrost occurrence, because they do not include uncertainty from response classification, omitted local controls, or predictor errors.
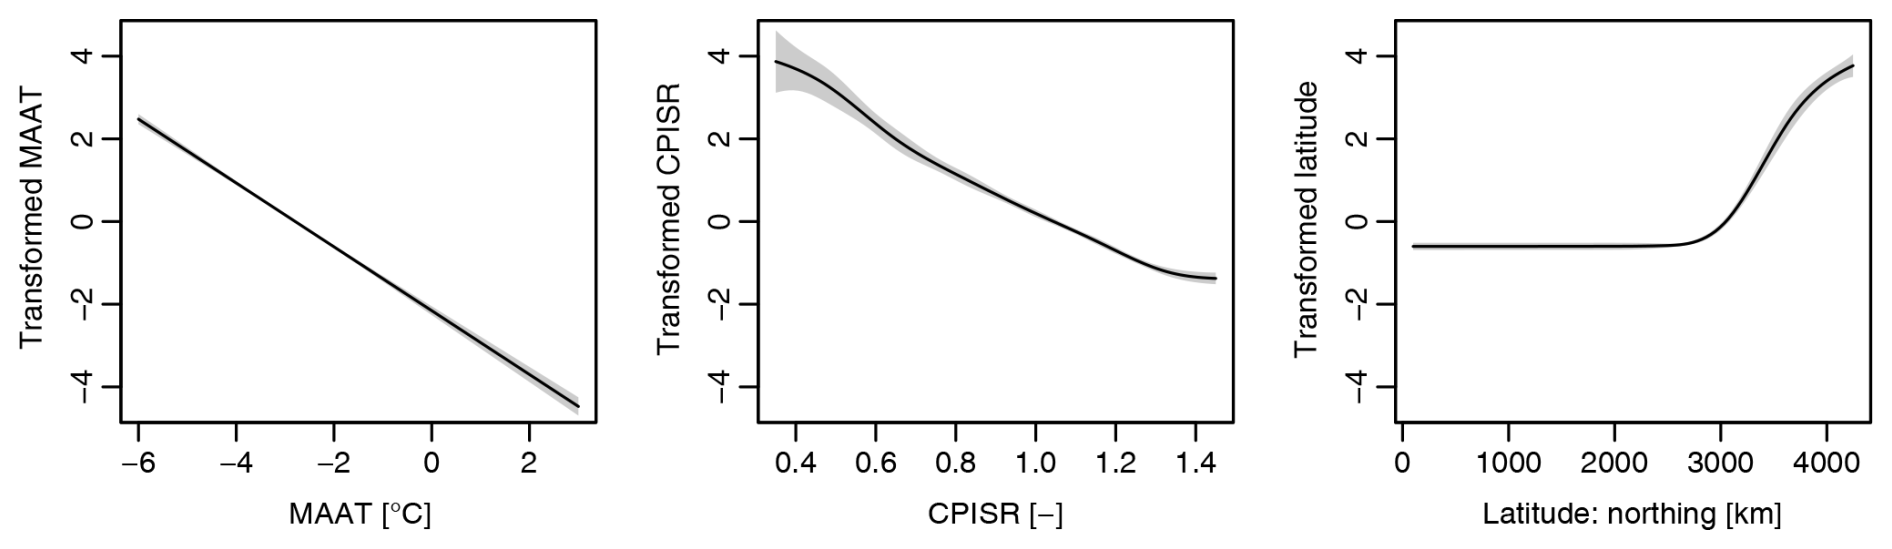
Figure 2Nonlinear transformation functions of the shape-constrained GAM of permafrost distribution in mainland Chile. Transformed values on the y-axes are on the logit scale.
In the interpretation of predictor–response relationships, the odds of permafrost presence were found to be about 4.7 times higher for a 2 °C lower MAAT, when focusing on the −4 to 0 °C range. A CPISR difference of 0.2 was associated with an odds ratio of 3.0, when accounting for the other variables in the model. Latitudinally, the model predicted increased permafrost presence in the northernmost part (odds ratio up to 54 compared to central Chile), indicating more favorable conditions than in central Chile, under otherwise equal conditions.
4.3 Borehole consistency check and interpretation of PFI
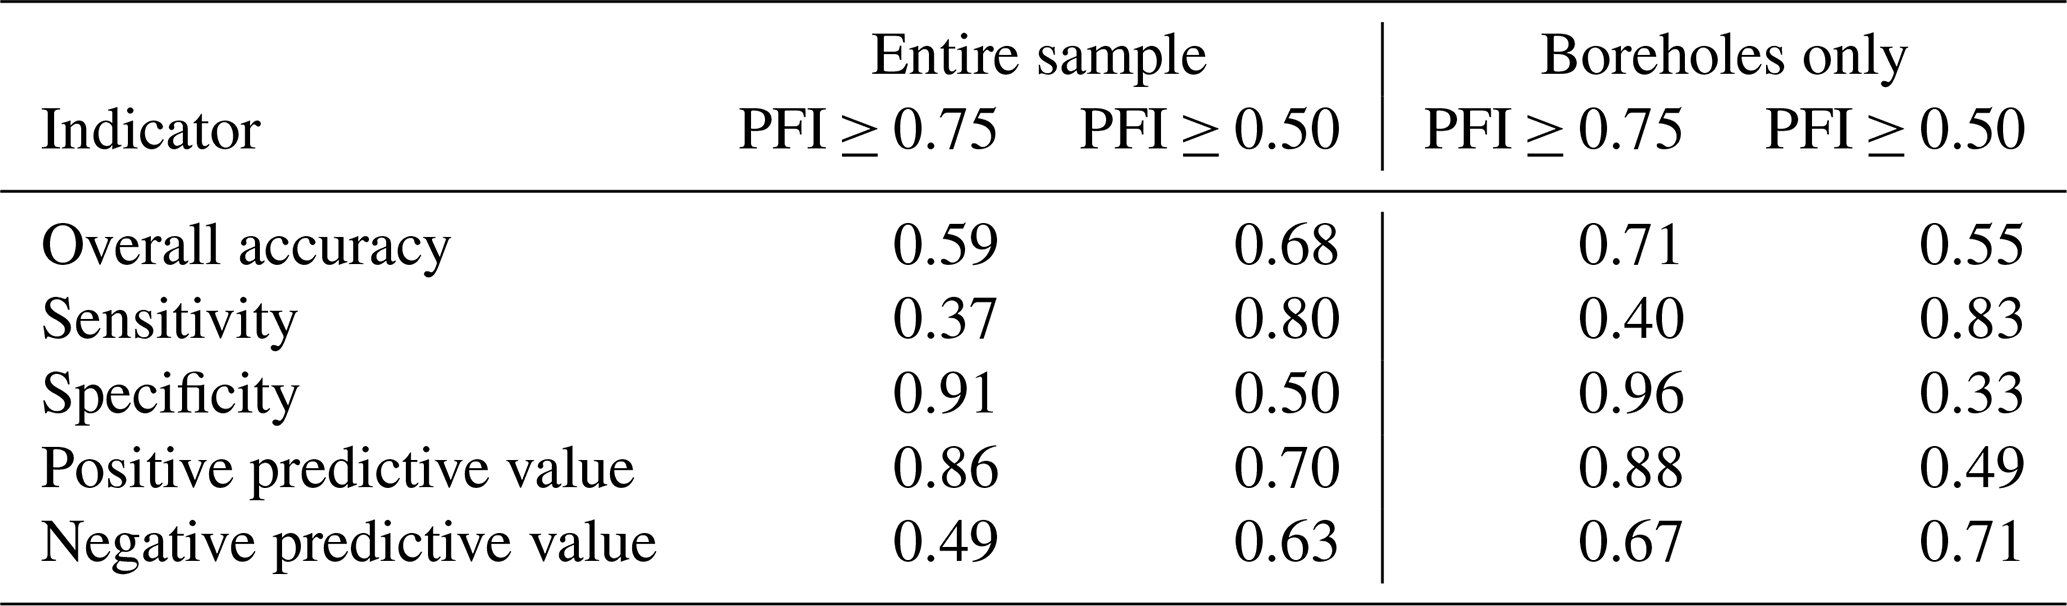
As a consistency check, the PFI was evaluated against local borehole data, which represent the most reliable, but non-randomly distributed subset of the training evidence for permafrost presence or absence. These borehole sites represent a subset of the in-situ observations described in Sect. 3.1.1. Of 80 borehole sites, 35 indicated permafrost presence, and 45 indicated absence. Agreement between thresholded PFI classes and borehole evidence was summarized using confusion matrices with several PFI thresholds (0.75, 0.85, and 0.90). At a threshold of PFI ≥ 0.75, the model achieved high specificity (96 %), correctly predicting almost all sites without permafrost, but only 40 % sensitivity, or permafrost detection rate (Table 3). Reducing the threshold to PFI ≥ 0.50 improved sensitivity to 83 %, with a substantial decrease in specificity to 33 %. In terms of the predictive value of identified permafrost areas, 88 % (49 %) of identified permafrost locations presented borehole evidence of permafrost, when applying a PFI threshold of 0.75 (0.50). Based on these results, a threshold of 0.75 was deemed appropriate for identifying conditions favorable for permafrost existence, while recognizing that alternative thresholds may be chosen depending on the intended application, and permafrost is considered possible for PFIs between 0.50 and 0.75.
Table 3Summary statistics describing agreement between thresholded PFI classes and the entire training sample or the borehole subset (N= 80). The borehole sites represent a subset of the training data (0.8 %) and are therefore used as a consistency check rather than as independent validation.
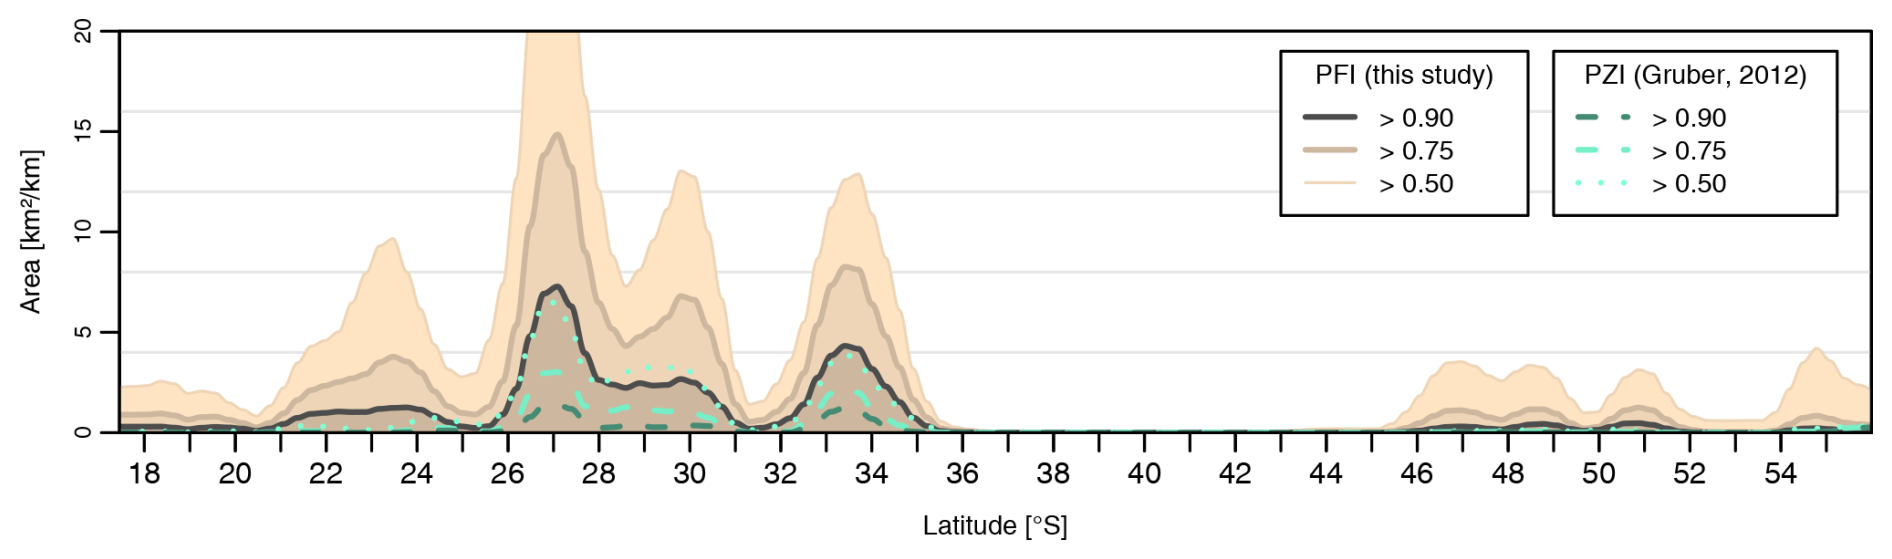
The local permafrost evidence indicates that the global PZI may be comparatively restrictive in the Chilean Andes. Using a threshold of PZI ≥ 0.50, only 16 % of all positive field observations and 37 % of the borehole-based permafrost observations would be identified as potential permafrost locations, indicating low sensitivity even at this relatively low threshold. Similar discrepancies between the global PZI and regional permafrost evidence in the Chilean Andes have previously been reported by Azócar et al. (2017). These results suggest that the global PZI underestimates the extent of conditions favorable for mountain permafrost in the Chilean Andes when compared with locally calibrated empirical models.
4.4 Distribution and interpretation of PFI
The predicted PFI's generalized lati-altitudinal distribution is summarized in Fig. 1, showing that the transition from relict to intact rock glaciers takes place mostly within a 500 m elevation band above the ZIA, or between about −3 and 0 °C MAAT. In the southern part and especially in the extreme north, this transition occurs at somewhat higher MAAT, around 0 °C and even above, respectively. This transition band generally corresponds to the 0.50–0.75 PFI range. Nevertheless, favorable conditions can be shifted about 500 m downward where incoming solar radiation is low (dashed line in Fig. 1).
Assuming PFI ≥ 0.75 indicates conditions highly favorable for permafrost, approximately 1.06 % (8042 km2) of mainland Chile may support permafrost, excluding glaciated and vegetated areas (Table 4; Fig. 3). Considering that the PFI may not be reliable in exposed bedrock areas, which can be approximated by having slope angles 30° (Azócar et al., 2017), this reduces to 6378 km2.
Table 4Potential distribution of mountain permafrost in mainland Chile by region: areas with PFI ≥ 0.75.
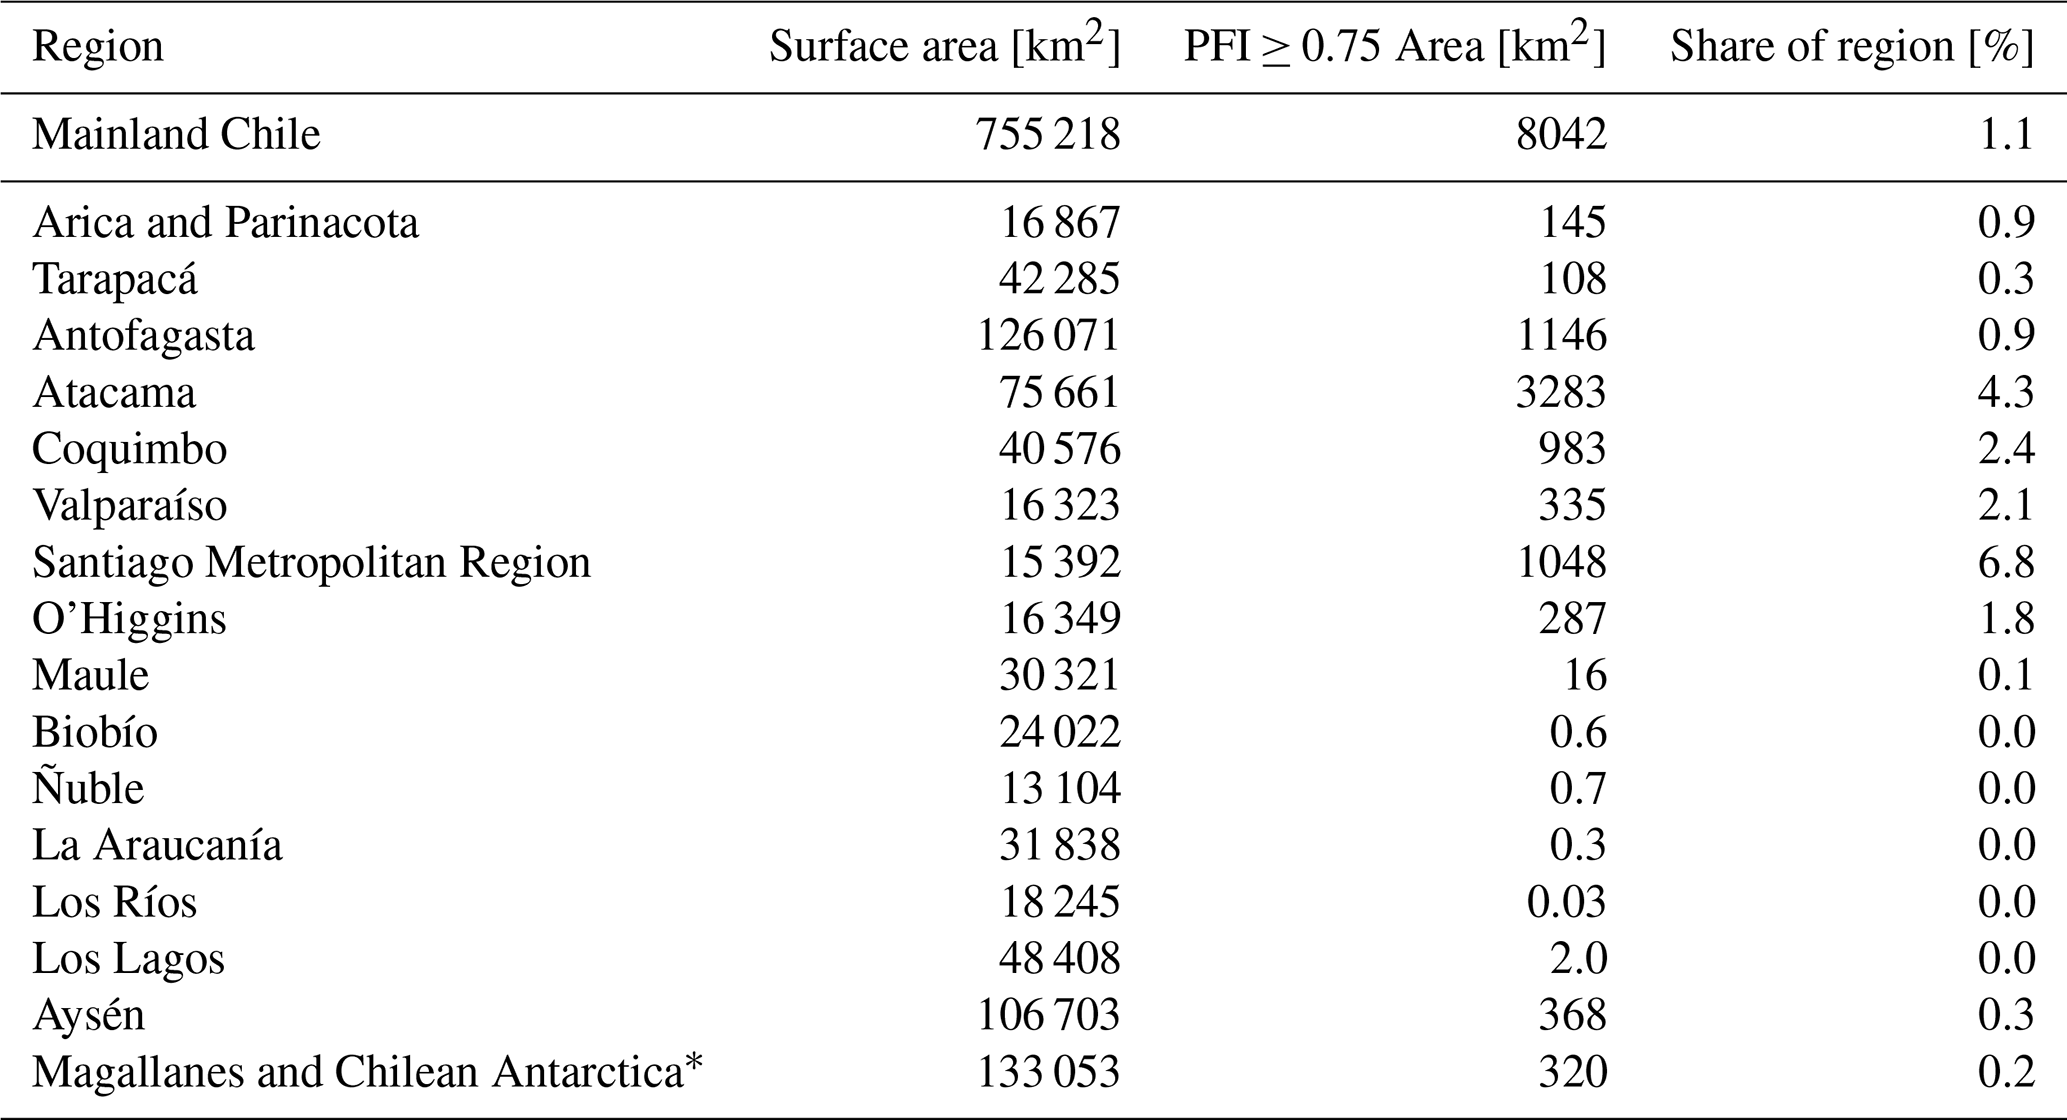
* Not including Antarctica.
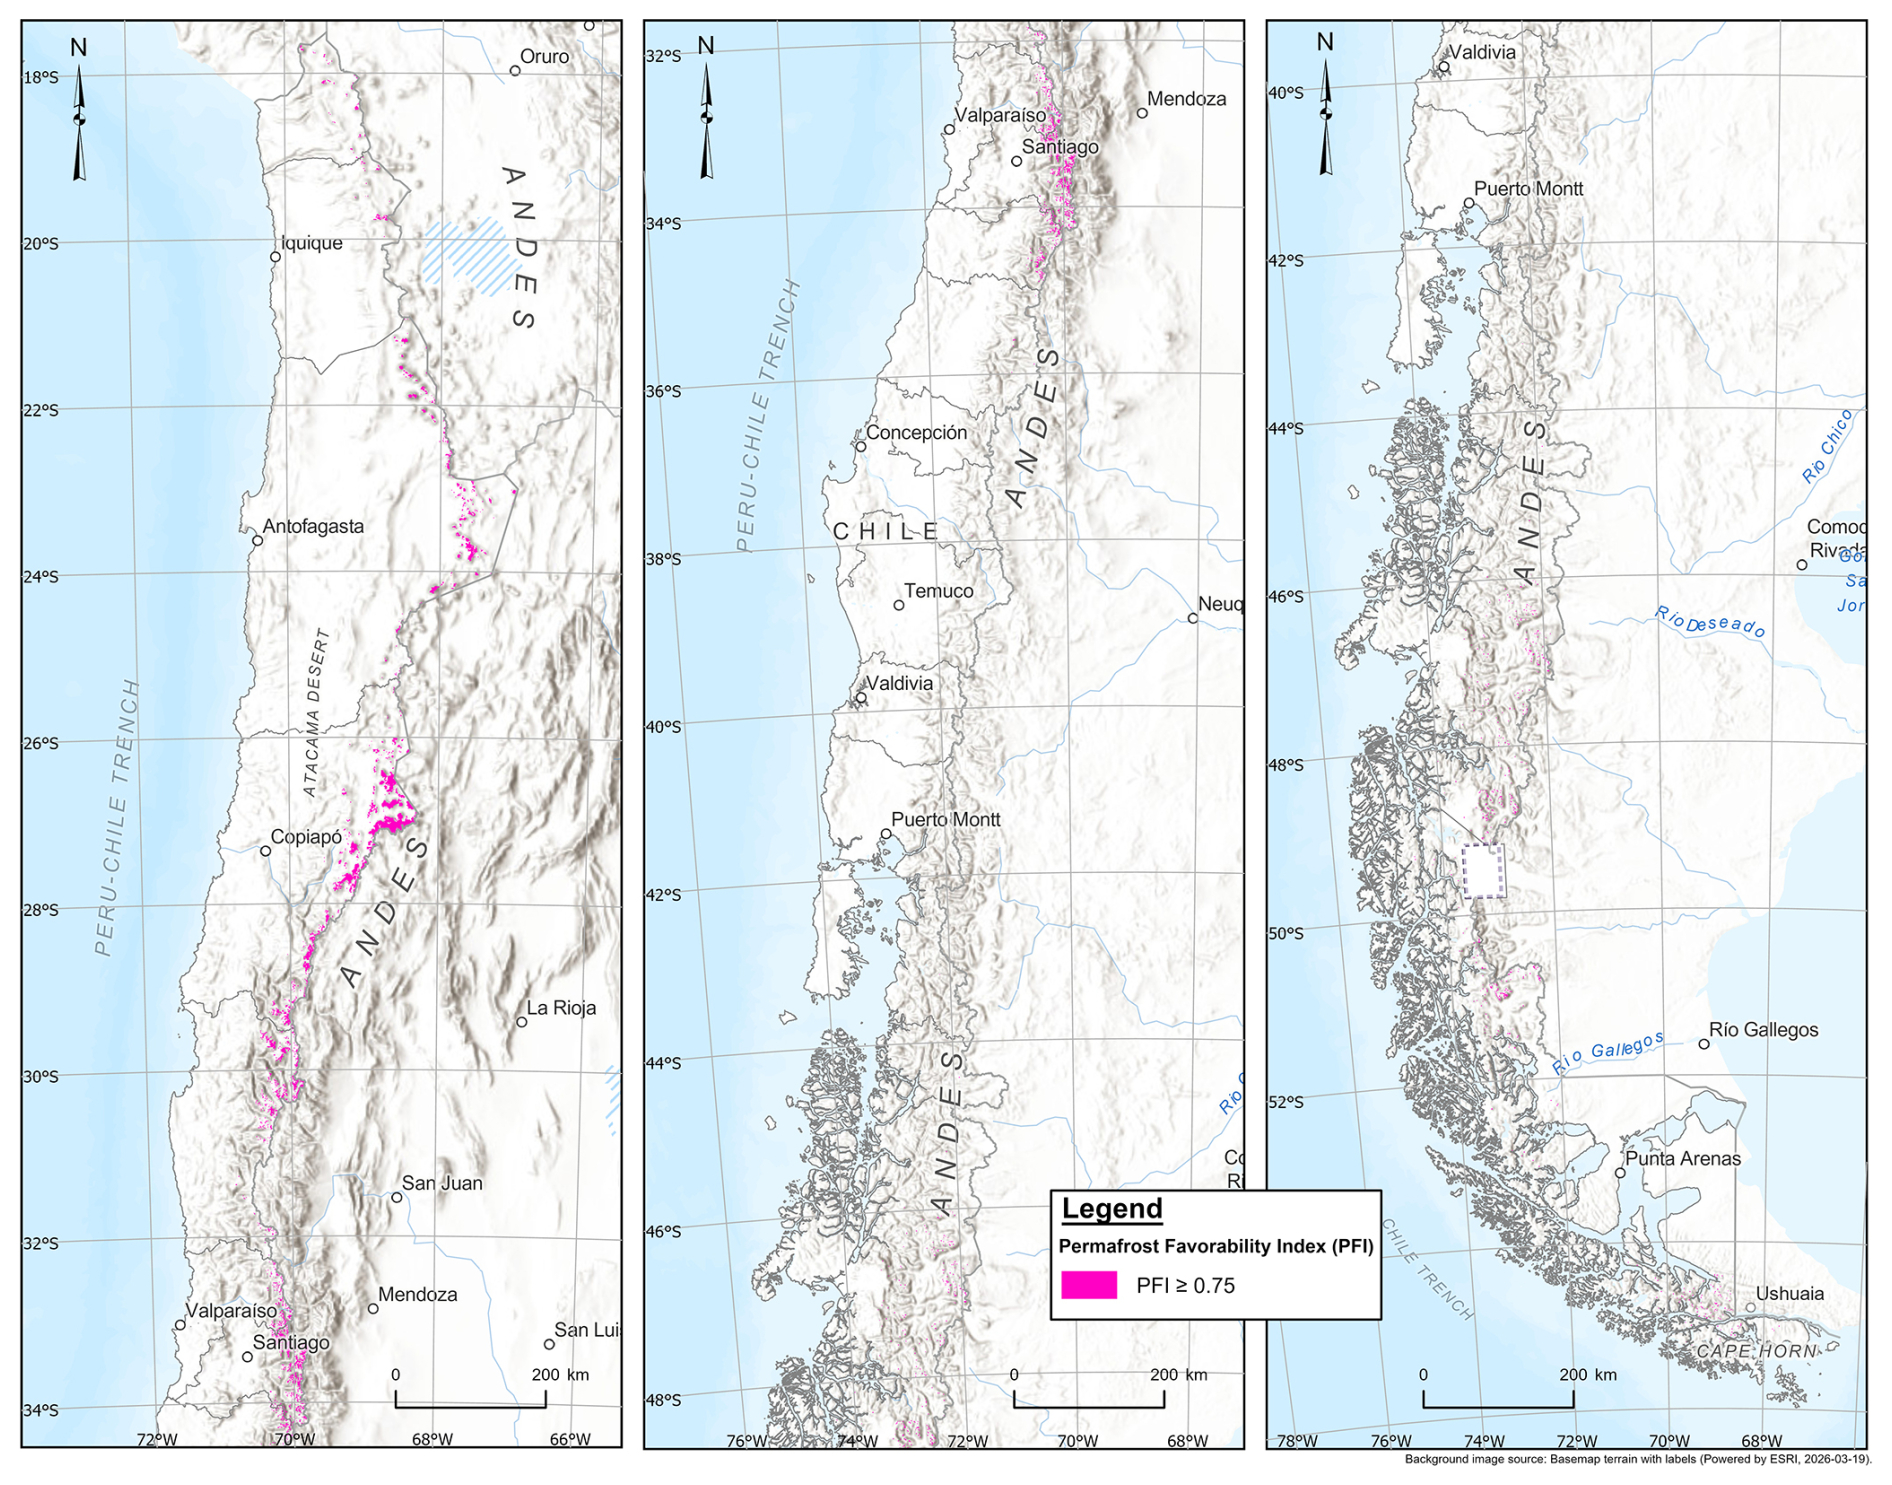
Figure 3Permafrost favorability map at a 1 km × 1 km resolution, highlighting grid cells containing at least one cell with PFI ≥ 0.75 at the full resolution. Basemap Esri Terrain with Labels. Sources: Esri, TomTom, Garmin, FAO, NOAA, USGS, © OpenStreetMap contributors, and the GIS User Community | Powered by Esri.
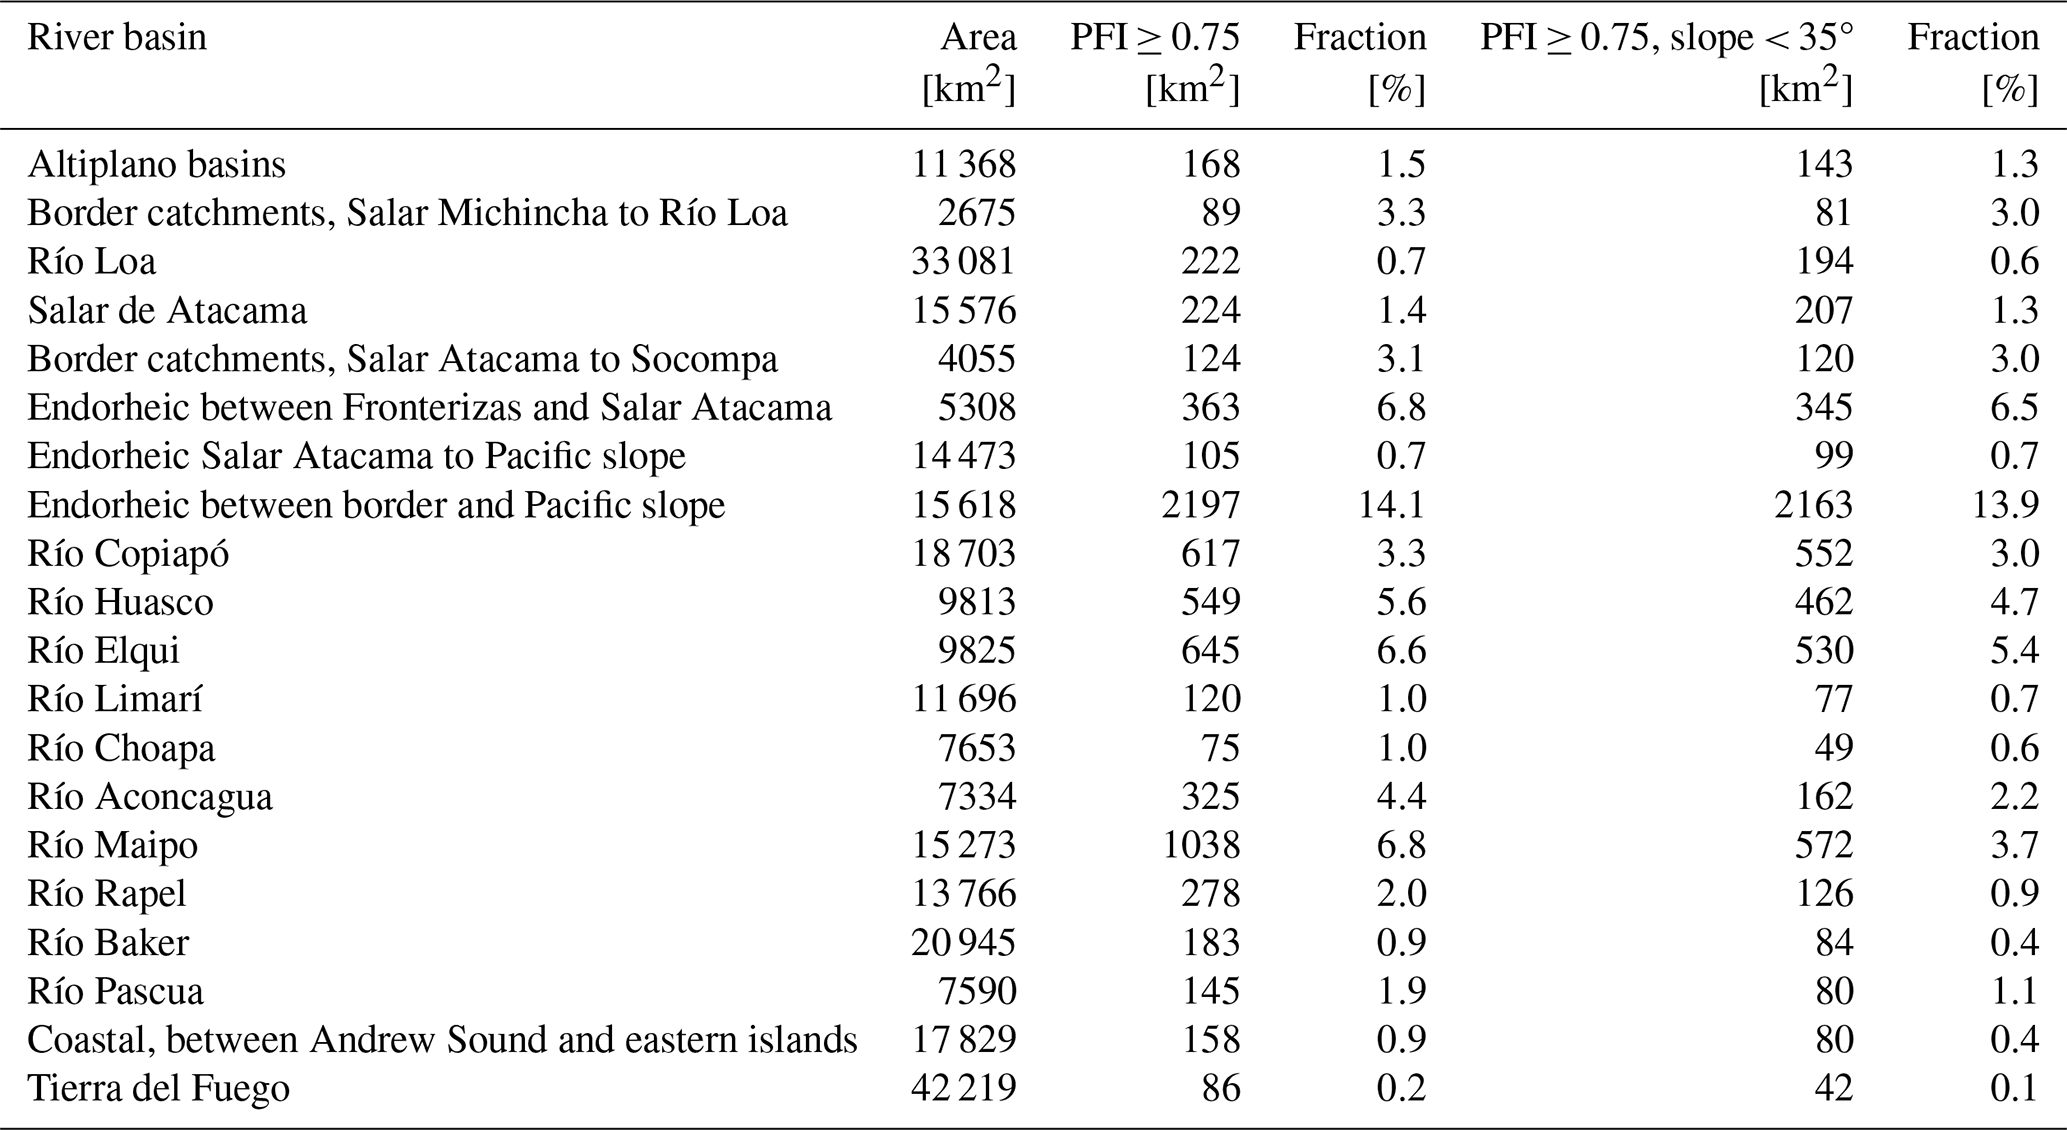
Regions with the highest concentrations of favorable permafrost conditions are located in Atacama, Antofagasta, Coquimbo (21–32° S), and the Santiago Metropolitan Region (33–34° S), where extensive mountain areas exceed the critical elevation thresholds (Fig. 4). In contrast, regions south of Maule (∼ 36° S) exhibit only isolated or no favorable conditions for permafrost due to higher temperatures and generally lower elevations. Statistics for the main catchments with likely permafrost presence are included in the Appendix in Table A1. This allows for a comparison with results of an earlier study in the semi-arid Andes (Huasco to Choapa basins), which obtained very similar estimates using a similar methodology (1051 km2 in Azócar et al., 2017 vs. 1118 km2 in this study, both for PFI ≥ 0.75 and limited to slope < 35°).
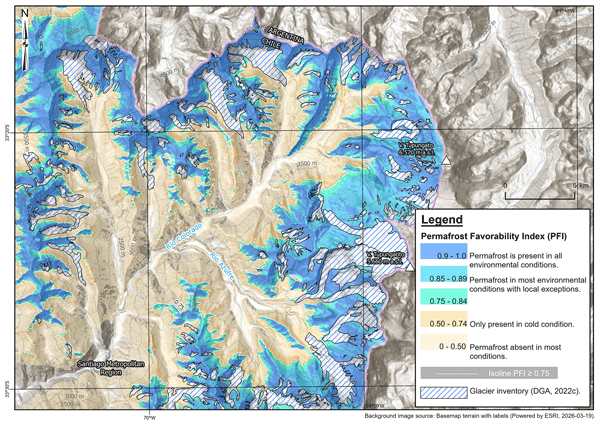
A qualitative interpretation guide was developed based on a similar document by Boeckli et al. (2012b) to aid governmental and public use of PFI maps (Fig. 5). In particular, the consideration of snow cover duration, surface material properties and climatic conditions need to be considered in practical applications (see Sect. 5.1). Figure 6 shows a sample PFI map from central Chile, and additional maps are included in the Appendix (Figs. A1 and A2), illustrating representative areas in the northern and southern Andes. The complete PFI raster dataset and the corresponding technical report is publicly available through Zenodo and Dirección General de Aguas repositories (DGA, 2022a; Azócar et al., 2022); PFI map sheets covering the entire study region are published in a separate repository (Azócar et al., 2026).
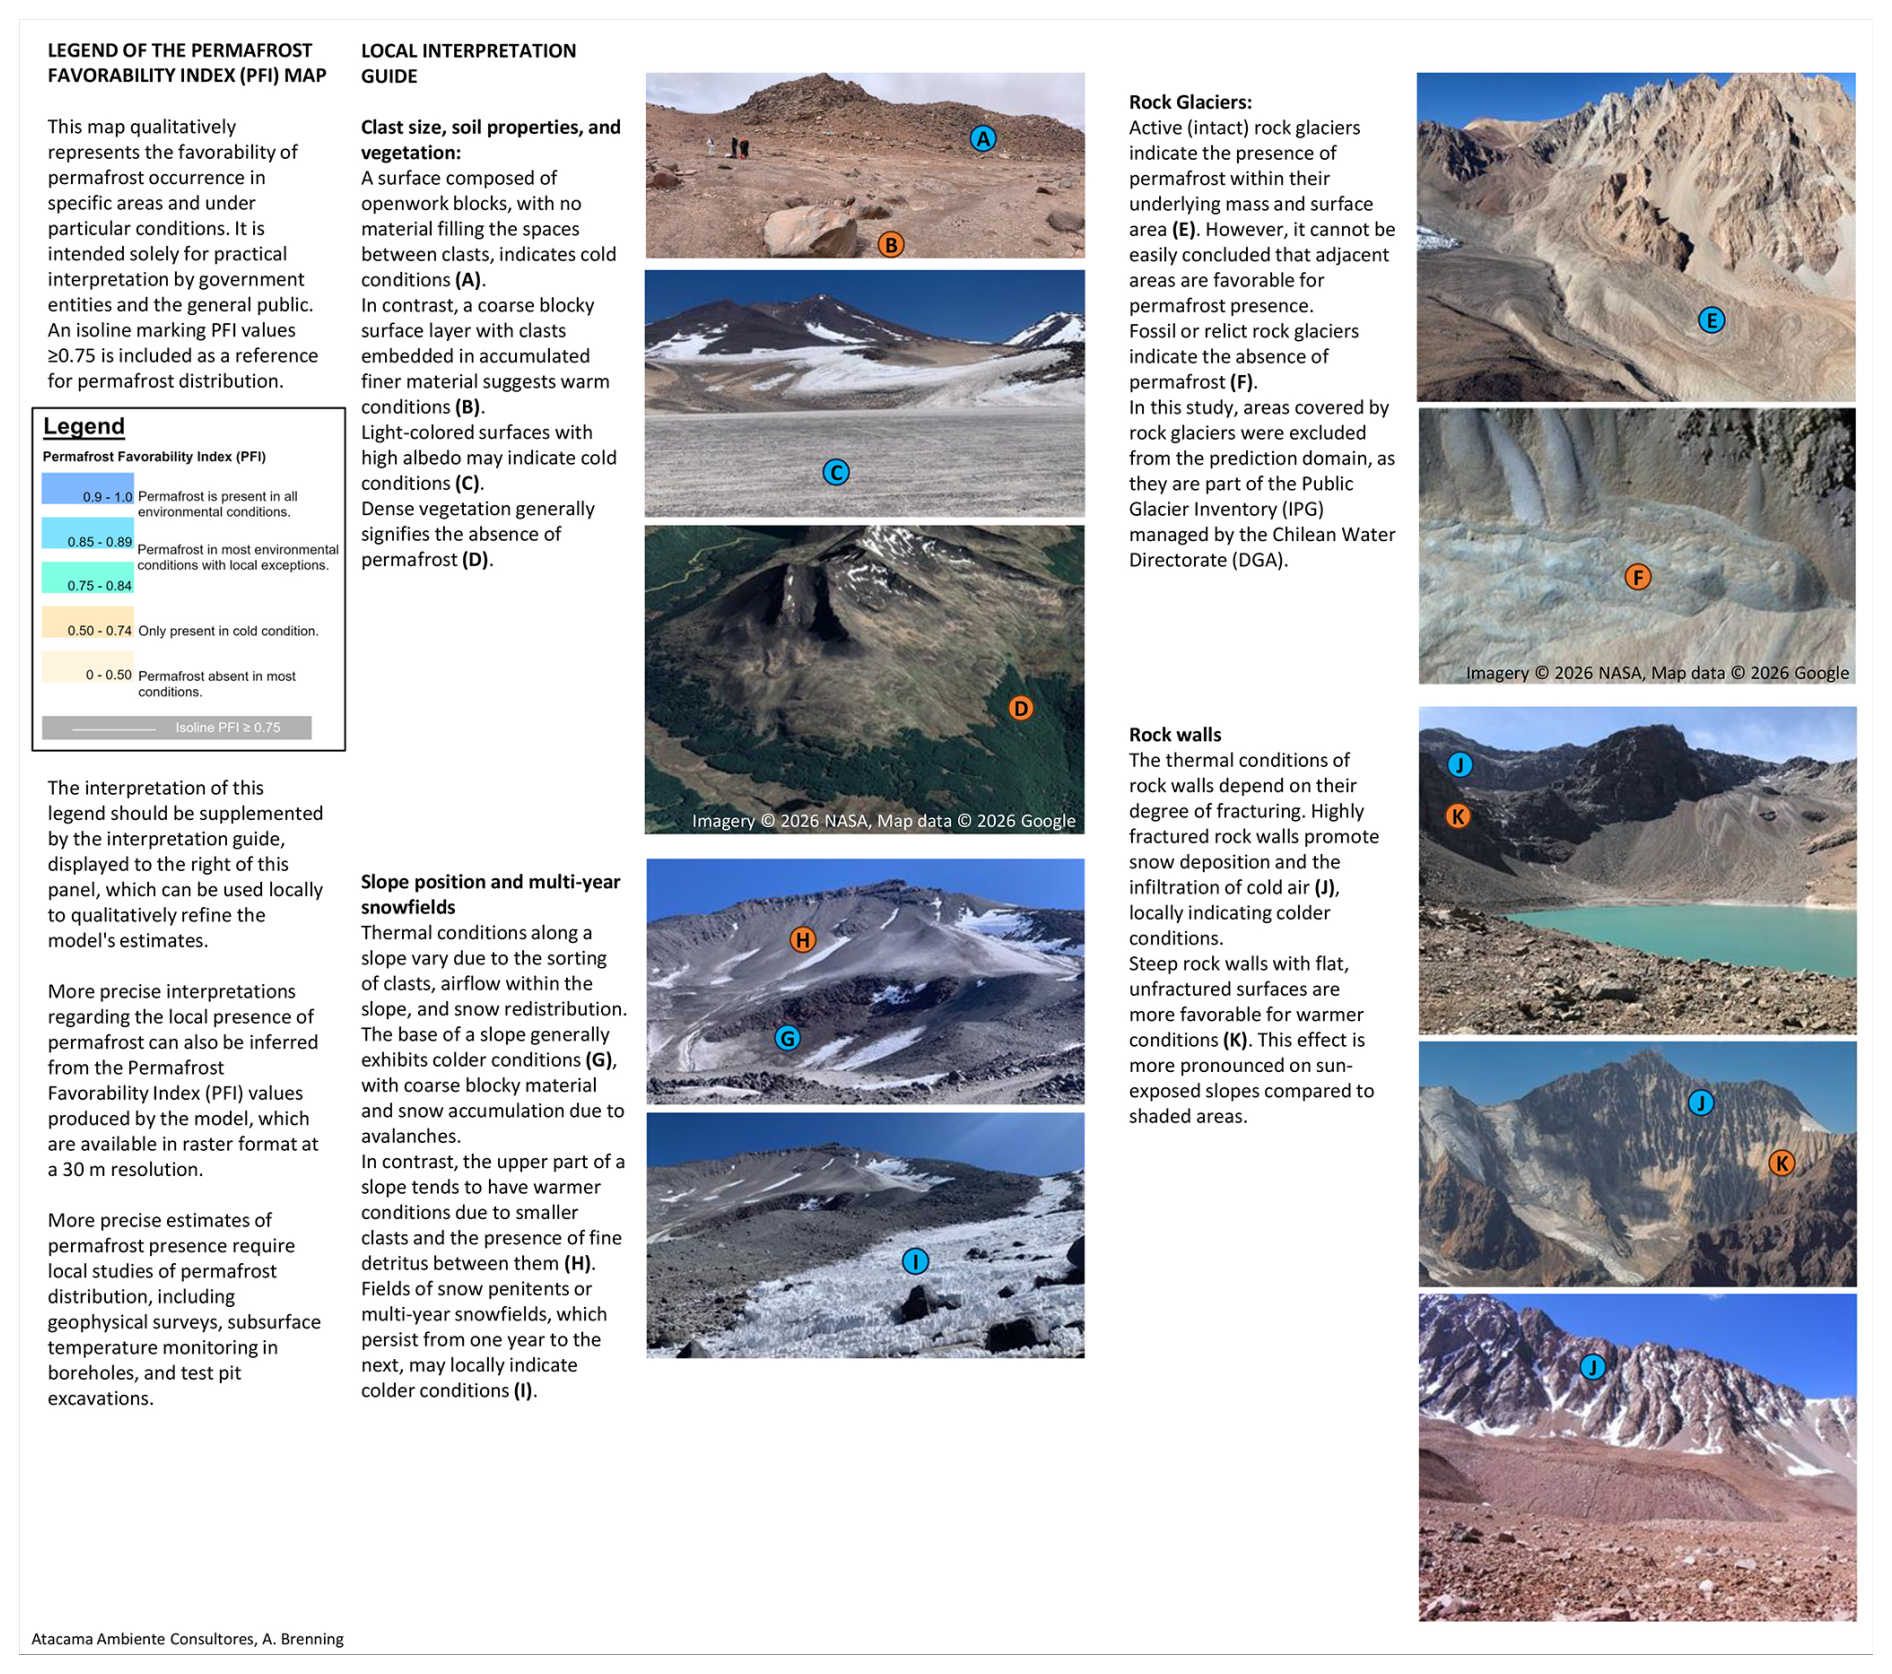
Figure 5Legend and interpretation guide accompanying the permafrost favorability index map for mainland Chile. Original version in Spanish, by Atacama Ambiente Consultores; photos by K. Yoshikawa (A/B, C, H/G, I) and G. Azócar (E, J/K). Google Earth-derived perspective view (D) and satellite image (F): Imagery © 2026 NASA, Map data © 2026 Google.
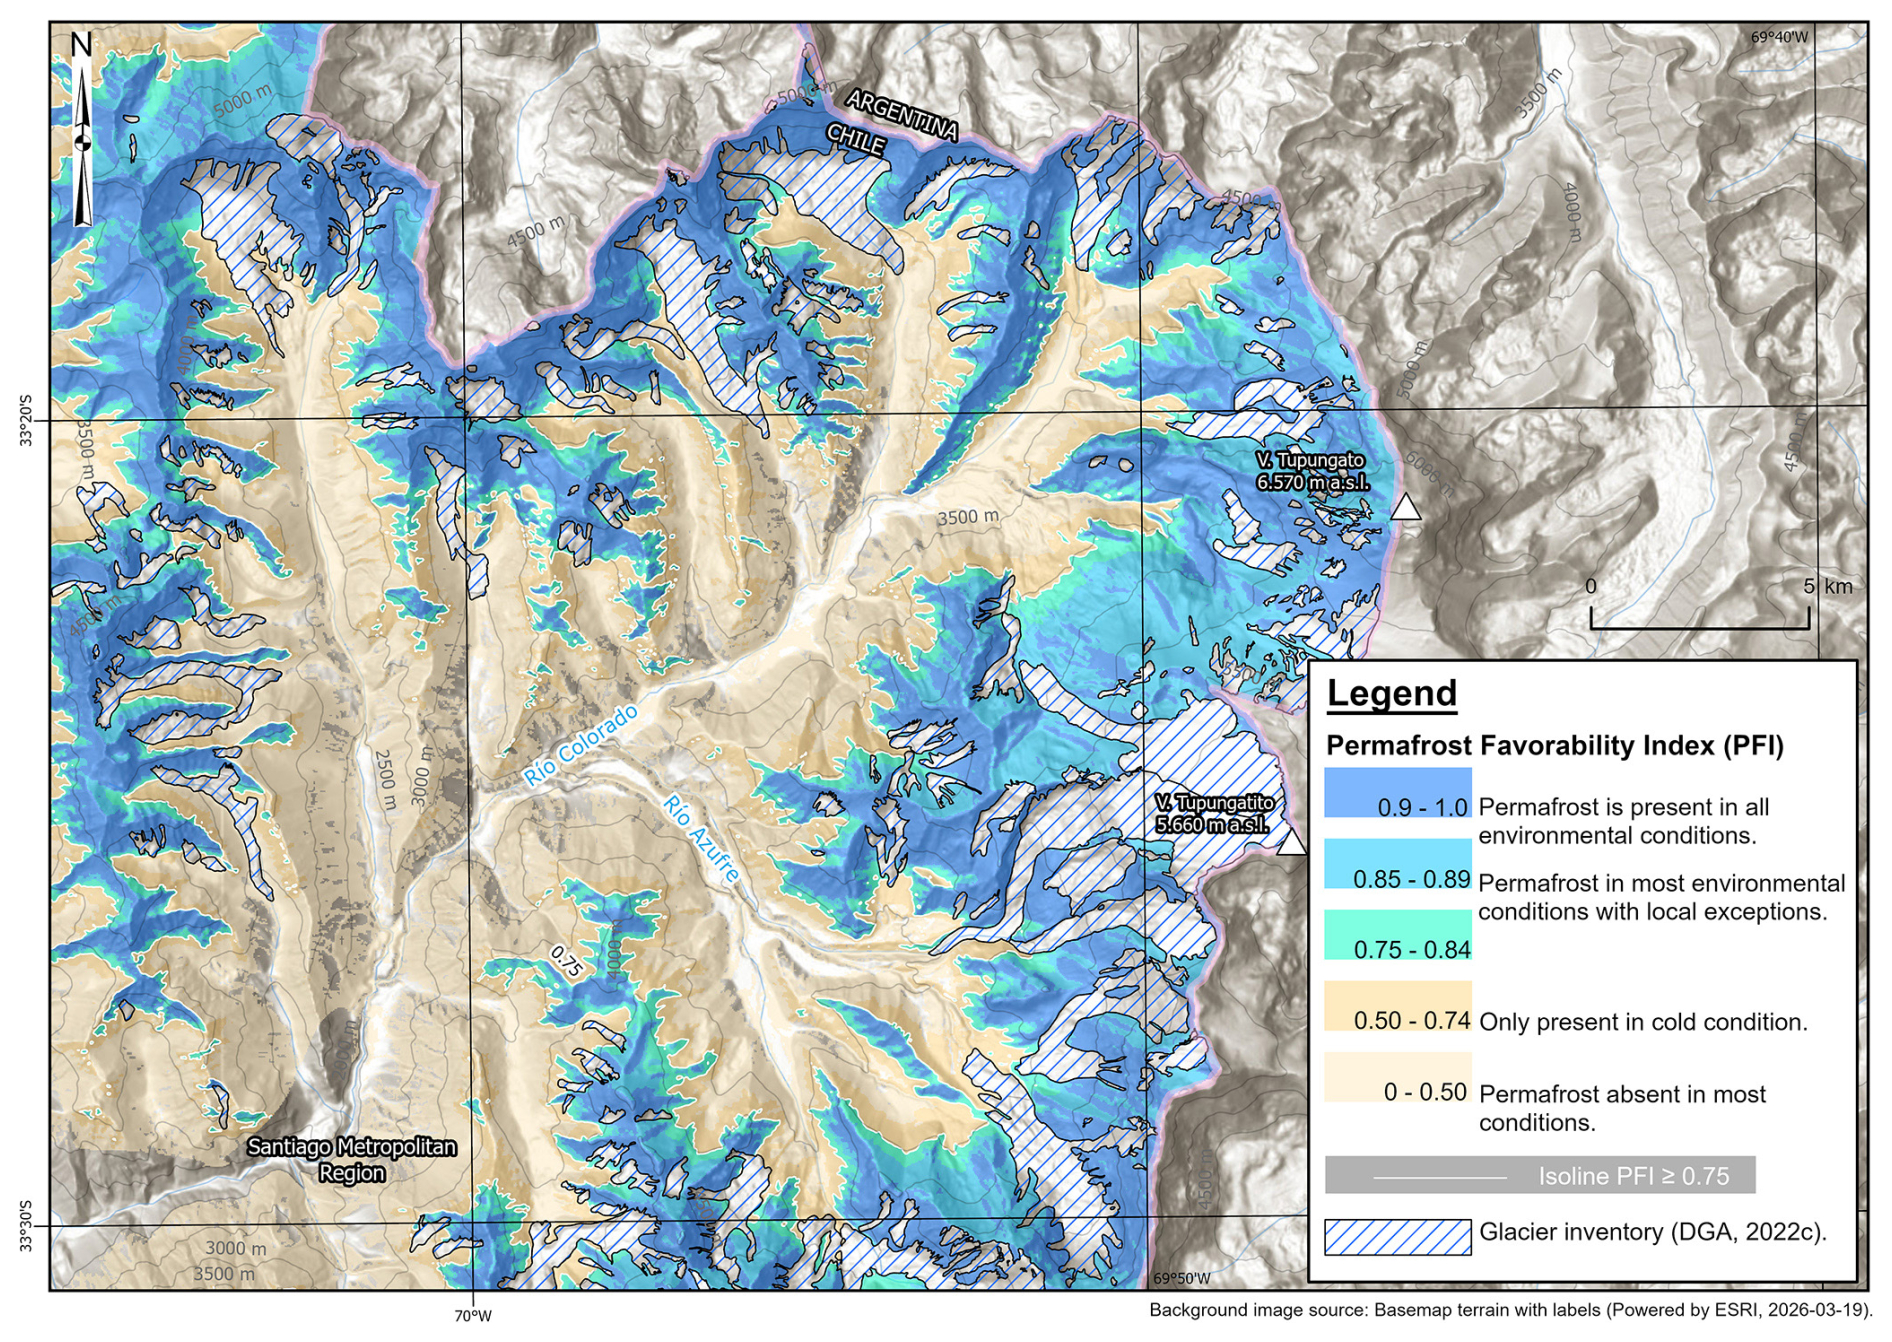
Figure 6Permafrost favorability index map for a sample area in the Andes of Santiago at 33.3° S. Additional maps for sample areas in northern and southern Chile are included in the Appendix. Basemap Esri Terrain with Labels. Sources: Esri, TomTom, Garmin, FAO, NOAA, USGS, © OpenStreetMap contributors, and the GIS User Community | Powered by Esri.
5.1 Rock glaciers and in-situ permafrost evidence
Rock glaciers are widely recognized as indicators of the lower limit of permafrost distribution, as evidenced by studies across various mountain regions globally (Boeckli et al., 2012a; Sattler et al., 2016; Azócar et al., 2017; Marcer et al., 2017; Baral et al., 2020; Mahanta et al., 2024; Wu et al., 2025). However, their use as a proxy for permafrost conditions requires bias adjustments and careful interpretation, particularly when considering local environmental variability (Boeckli et al., 2012a; Azócar et al., 2017; Cao et al., 2021). In this study, glaciers and areas with (even sparse) vegetation cover were excluded, although they may locally present permafrost. More importantly, only root-zone locations of rock glaciers were considered as permafrost evidence to exclude permafrost evidence from rock glacier tongues and lobes, which may have crept into non-permafrost terrain. Where only rock glacier toe locations were available, a bias adjustment was applied that accounts for the average altitudinal extent of rock glaciers (Azócar et al., 2017). Nevertheless, we point out that permafrost near the lower limit of its modeled potential distribution may be sporadic in extent consisting of remnants that may not be preserved under present and future climatic conditions.
Also, the classification of rock glacier activity used in this study is subject to uncertainties and subjectivity. Recent advances in remote sensing allow their dynamics to be quantified using satellite-based kinematic observations (e.g., InSAR-derived velocity fields), which may provide an additional basis for distinguishing active from inactive landforms in future studies (RGIK Working Group, 2023; Cusicanqui et al., 2025; Rouyet et al., 2025; Brardinoni et al., 2026).
The incorporation of additional in-situ permafrost evidence, including borehole measurements, enriches the empirical basis for model training and assessment. This is particularly relevant in regions where rock glaciers are scarce or inexistent, as in parts of southern Chile or the most arid parts of the Atacama desert (Brenning, 2005; Yoshikawa et al., 2025). Future studies should prioritize expanding ground-truth observations across diverse environmental contexts, especially in non-rock glacier debris-covered terrain. Such studies would greatly benefit from targeted study designs rather than circumstantial evidence from various research or industrial activities.
5.2 Model performance, interpretation, and future enhancements
The statistical performance of the model indicates that MAAT, CPISR, and latitude emerge as key predictors of permafrost distribution at the regional scale, consistent with previous studies (e.g., Brenning and Azócar, 2010b; Boeckli et al., 2012a; Wu et al., 2025). Our AUROC values (0.70 in spatial CV) are consistent with regional-scale permafrost modeling efforts in the Andes and Alps (∼ 0.75–0.80). Higher AUROC values in some studies (≥ 0.9) often result from more restrictive definitions of permafrost indicators, which reduce data heterogeneity but may artificially inflate model performance. This happens when inactive rock glaciers are excluded as indicators (Sattler et al., 2016; Marcer et al., 2017) or where low-elevation non-rock glacier areas are conceptualized as non-permafrost areas (Mahanta et al., 2024).
Although the model provides a useful regional-scale understanding of permafrost distribution, it does not fully account for critical local factors, such as snow redistribution by wind and avalanches or variations in soil and surface material properties, because spatially consistent datasets describing these processes are currently not available across the full extent of mainland Chile. These factors are known to influence ground thermal regimes (Hoelzle et al., 2001; Boeckli et al., 2012a; Apaloo et al., 2012; Koenig et al., 2025). For example, coarse blocky materials favor permafrost by enhancing ventilation and reducing heat retention, while fine-grained sediments tend to create warmer ground conditions (Gruber and Hoelzle, 2008; Pruessner et al., 2018; Wicky and Hauck, 2020). Apaloo et al. (2012) showed that in the Andes of Santiago (33.5° S), openwork boulder terrain was associated with ∼ 0.6–0.8 °C lower mean annual ground surface temperatures (MAGST). Moreover, surfaces with 30 d of additional snow cover had a MAGST depression by 0.1–0.6 °C. In the semi-arid Andes at 30° S, areas with long-lasting snow cover had a ∼ 0.4 °C cooler MAGST (Centro de Estudios Avanzados en Zonas Áridas, 2012).
Geophysical studies in the Central Andes have also highlighted the large variability in ground-ice contents between different permafrost landforms and the presence of substantial ground ice outside rock glaciers (Mathys et al., 2022). This is consistent with interpreting intermediate PFI values as areas where permafrost may occur with lower or more heterogeneous ice contents.
The magnitude of these local modifications of ground thermal regimes shows that these effects should be incorporated in future modeling efforts. Field investigations of local-scale permafrost patterns outside of rock glaciers are now required to fill this gap, enabling future models to integrate regional and local patterns and thereby reduce uncertainties. In addition to ground temperature monitoring, geophysical methods can help elucidate spatial patterns as well as characteristics such as ice content and thickness, which influence the sensitivity of mountain permafrost to climate change (Hauck, 2013; Mollaret et al., 2019; Hilbich et al., 2022; Mathys et al., 2022). Our model can help guide future sampling and monitoring campaigns as it identifies areas with particularly high uncertainties, close to the proposed PFI thresholds.
The scarcity of permafrost observations in some regions of the Chilean Andes introduces additional uncertainty into the modeled distribution. This is particularly evident in south-central (37–44° S) and southernmost Chile (∼ 54° S), where comparatively low mountain elevations and glacier-dominated cryospheric conditions limit the occurrence of rock glaciers. In such data-poor regions, statistical models may produce unstable or geomorphologically implausible patterns unless appropriate constraints are imposed. The shape-constrained GAM applied in this study helps enforce physically plausible relationships between predictors and permafrost occurrence, thereby reducing the risk of unrealistic spatial predictions in poorly constrained regions, but predictions in these areas should still be interpreted cautiously. Targeted field investigations and monitoring programs in these regions would help improve the empirical basis of future permafrost distribution models, and data from across the border may further help to stabilize models.
In the meantime, the PFI offers a semi-quantitative rating of permafrost potential based on statistical relationships between predictors and observed permafrost evidence. As in similar modeling efforts (e.g., Boeckli et al., 2012a), the interpretation of PFI scores must consider the local environmental context as this is not incorporated in the current model in sufficient detail. We propose that PFI values greater than 0.9 should be interpreted as permafrost being very likely present regardless of local conditions. In PFI zones between 0.75 and 0.90, permafrost may be present primarily under cold local conditions (with shading or long-lasting snow cover) and dependent on surface materials. In areas with PFI values between 0.50 and 0.75, we conclude that permafrost presence is limited to favorable local conditions. In areas with lower PFI scores, permafrost is unlikely under most conditions.
5.3 Implications for regional permafrost distribution
The model predicts that more than 8000 km2 of mainland Chile may have favorable conditions for permafrost occurrence (PFI ≥ 0.75). These areas are predominantly concentrated in high-altitude zones within the Atacama, Antofagasta, Coquimbo and Santiago Metropolitan regions, with minimal to no favorable conditions observed in southern regions (i.e., Maule to Magallanes). This pattern reflects the interplay between altitude, solar radiation, and latitude as first-order controls of permafrost occurrence. Being driven by local permafrost evidence, our model not only provides more detail but also eliminates biases detected in the too restrictive global permafrost index, PZI (Gruber, 2012).
This research provides the first countrywide empirically calibrated assessment of mountain permafrost distribution in Chile based on local geomorphological and in-situ evidence, offering a baseline for future monitoring, environmental assessment, and infrastructure planning in high-mountain regions. It furthermore refines previous models (Azócar et al., 2017; BGC Ingeniería Ltda., 2021) with new in-situ data from various sites and monitoring contexts, and it provides a generalized, synoptic vision across multiple rock glacier inventories.
This study also highlights the need for enhanced ground-truthing efforts to improve the calibration and validation of permafrost distribution models. A systematic approach to sampling ground temperatures across varied landforms and environmental conditions, coupled with expanded geophysical surveys, would strengthen the empirical foundation for future permafrost studies. At present, studies on local patterns are limited to near-surface ground temperatures (Apaloo et al., 2012; Centro de Estudios Avanzados en Zonas Áridas, 2012), which provide limited insights into thermal conditions at relevant depths (Brenning et al., 2005). Additionally, the integration of remotely-sensed information with higher spatial and temporal resolution could refine the representation of local environmental factors, such as surface roughness, snow cover and vegetation dynamics (Jiang et al., 2020; Popescu et al., 2024), and confirm the activity status of rock glaciers (RGIK Working Group, 2023; Rouyet et al., 2025).
Although the PFI can suggest areas with cold ground conditions, it should not be used as a direct indicator of ground ice content. The presence of ground ice in permafrost may depend on local environmental conditions and the general climate setting (Hilbich et al., 2022).
This study presents the first peer-reviewed, high-resolution, national-scale model of mountain permafrost distribution in Chile, providing a basis for estimating its potential spatial extent and first-order environmental controls. The model, based on geomorphological indicators, in-situ observations and topoclimatic variables, estimates that approximately 1.06 % (8042 km2) of mainland Chile may support permafrost, with favorable conditions concentrated in high-altitude areas of the Atacama, Antofagasta, Coquimbo and Santiago Metropolitan regions. In contrast, regions south of Maule exhibit limited permafrost due to lower elevations.
While rock glaciers are an established and relatively easy to classify proxy for permafrost distribution, their use introduces some biases that we account for through model adjustments and the use of and comparison to in-situ observations. Further ground-truthing, including borehole measurements and geophysical surveys, is essential to further refine the model and its bias adjustments in order to enhance model accuracy. Despite these limitations, the study contributes to knowledge of Chile's cryosphere and will serve as a starting point for local adjustment.
Since the model does not account for local factors such as snow redistribution, substrate properties, and microclimatic effects, which can influence permafrost presence on finer spatial scales, these factors need to be considered when interpreting the proposed permafrost favorability index locally. In addition, ground ice presence and content should be expected to vary locally. The PFI should thus not be used as a stand-alone basis for site-specific engineering design or hazard assessment, as such applications require local investigations, including geophysical surveys, borehole temperature monitoring, and geomorphological field assessment.
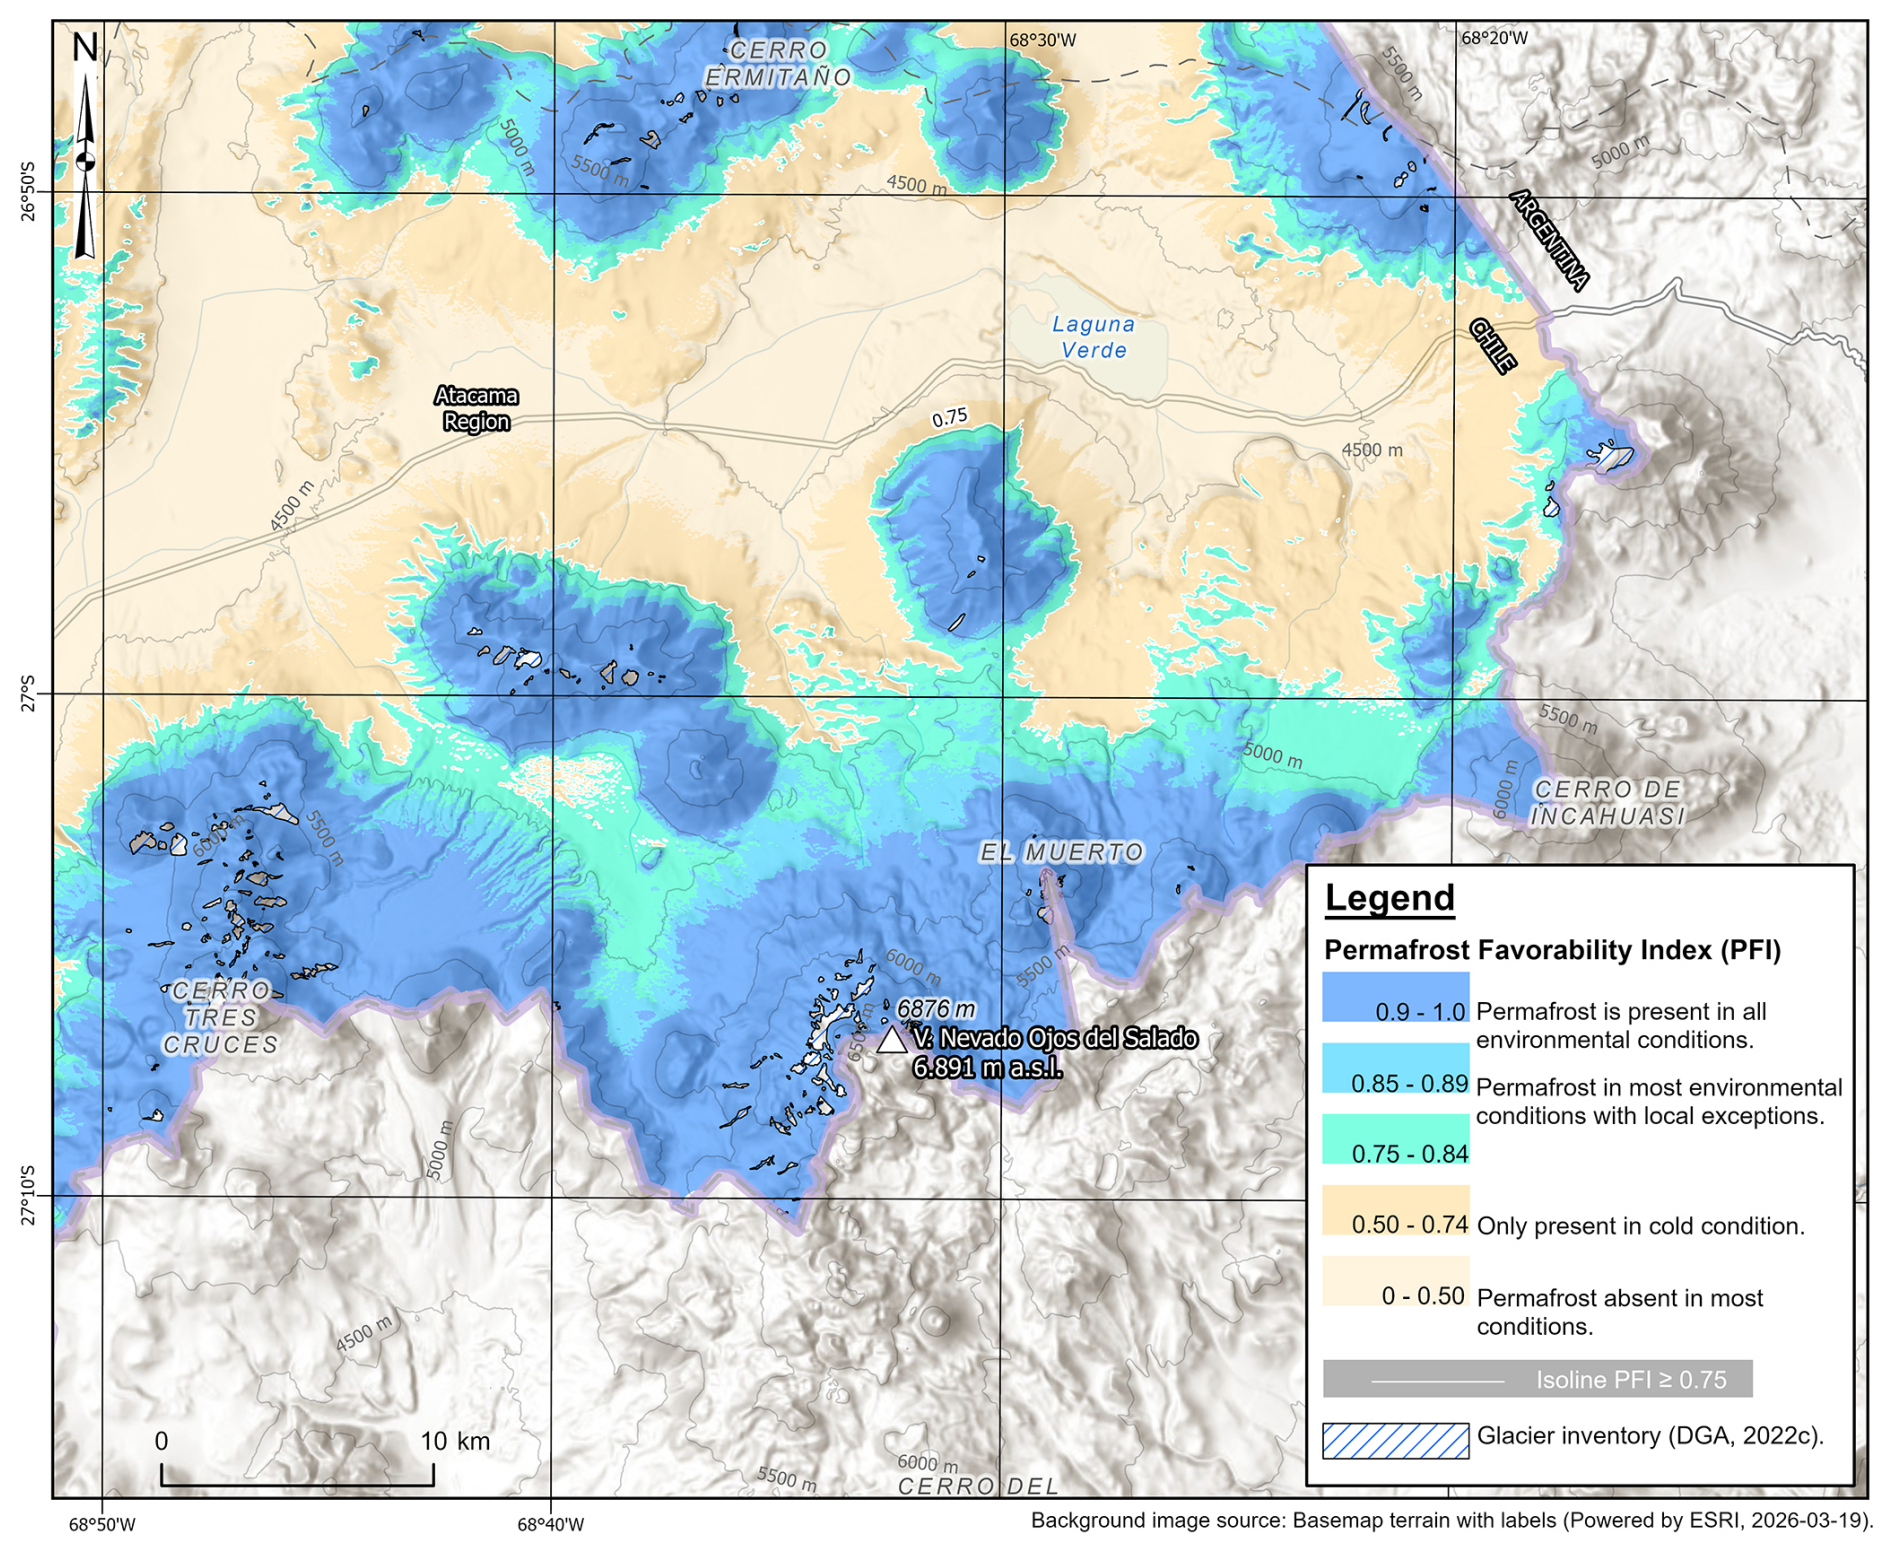
Figure A1Permafrost favorability index map for a sample area in the dry Andes, Atacama region, at 27° S. Basemap Esri Terrain with Labels. Sources: Esri, TomTom, Garmin, FAO, NOAA, USGS, © OpenStreetMap contributors, and the GIS User Community | Powered by Esri.
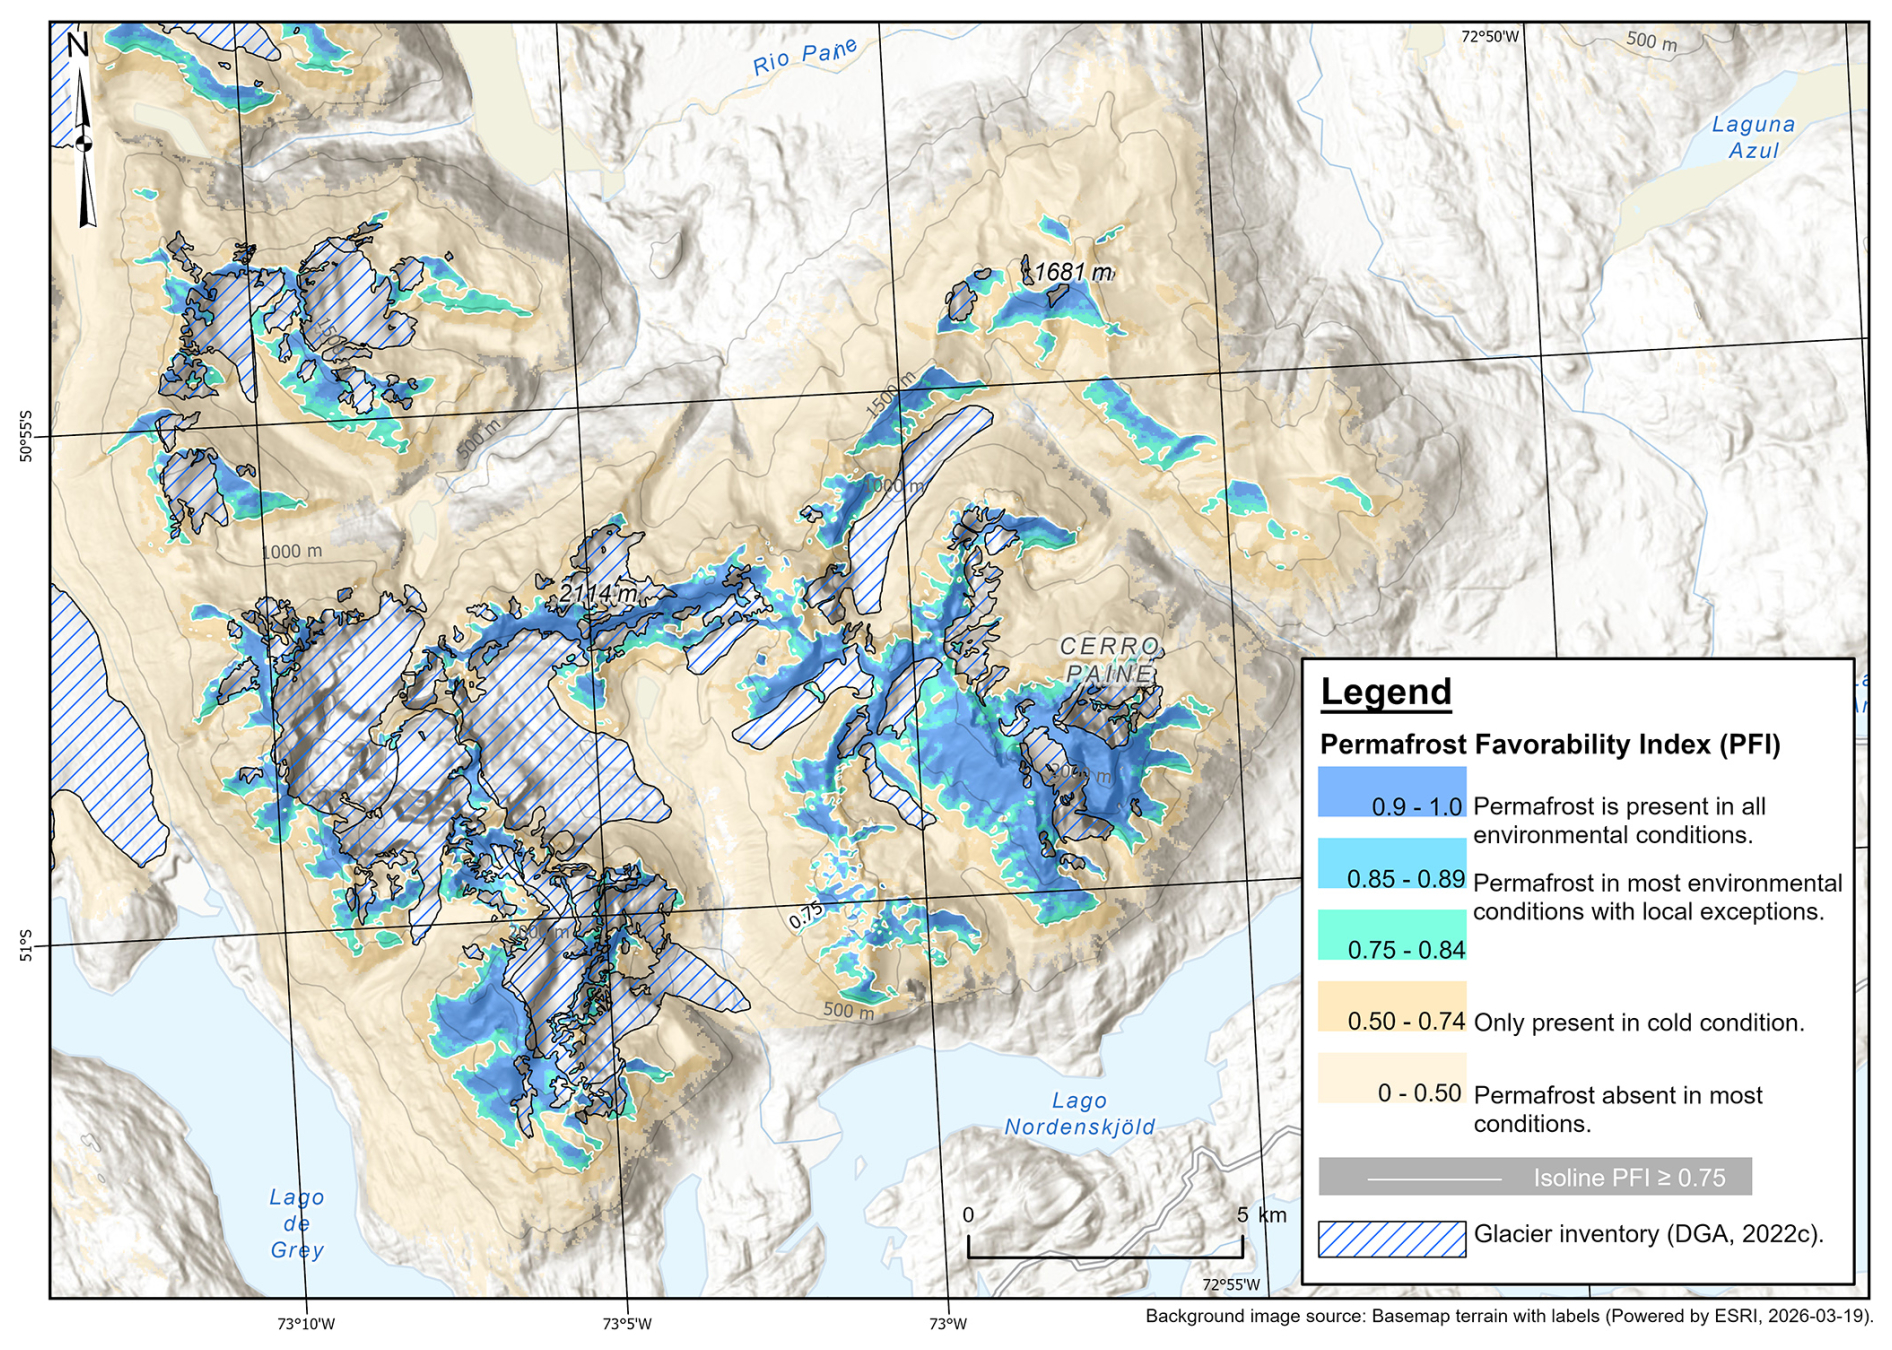
Figure A2Permafrost favorability index map for a sample area in the Patagonian Andes, region of Magallanes and Chilean Antarctica, northeast of Cordillera Darwin at 54.4° S. Basemap Esri Terrain with Labels. Sources: Esri, TomTom, Garmin, FAO, NOAA, USGS, © OpenStreetMap contributors, and the GIS User Community | Powered by Esri.
Table A1Permafrost favorability index statistics by catchment, from north to south, for all river basins with more than 50 km2 area of PFI ≥ 0.75. Areas with PFI ≥ 0.75 and slope angle < 35° are shown to exclude likely bedrock areas. Catchment names are based on the official classification.
The Permafrost Favorability Index (PFI) raster developed in this study is available through the digital repository of the Dirección General de Aguas (DGA) at https://snia.mop.gob.cl/PIA/handle/20.500.13000/126863 (last access: 19 August 2026) as the primary source and at Zenodo https://doi.org/10.5281/zenodo.19342541 (Azócar et al., 2022) as a secondary mirror. Map sheets covering the study area are available at Zenodo https://doi.org/10.5281/zenodo.20045182 (Azócar et al., 2026). Code and data that rebuild the statistical models and reproduce the published PFI raster are available at Zenodo https://doi.org/10.5281/zenodo.21499253 (Brenning and Azócar, 2026).
GFA, AB, PIA, KY and GC contributed to the study conception and design. Material preparation and data collection were performed by GFA supported by PSB and DFG, and data analysis was conducted by GFA with support from AB. The first draft of the manuscript was written by AB based on a technical report mainly written by GFA and revised by GC, PIA, KY and AB, and all authors commented on previous versions of the manuscript. All authors read and approved the final manuscript.
The contact author has declared that none of the authors has any competing interests.
Publisher's note: Copernicus Publications remains neutral with regard to jurisdictional claims made in the text, published maps, institutional affiliations, or any other geographical representation in this paper. The authors bear the ultimate responsibility for providing appropriate place names. Views expressed in the text are those of the authors and do not necessarily reflect the views of the publisher.
This publication is based on a project funded by the Dirección General de Aguas, Ministerio de Obras Públicas, Chile, under Grant “Modelo de favorabilidad de ocurrencia de permafrost (PFI) en Chile Continental”, S.I.T. No. 530, Ministerio de Obras Públicas, Chile, awarded to Atacama Ambiente Consultores (https://snia.mop.gob.cl/PIA/items/0df1c24d-f1ba-4afb-b250-615a40580d18, last access: 19 August 2026).
This paper was edited by Jeannette Noetzli and reviewed by Lukas U. Arenson and one anonymous referee.
Apaloo, J., Brenning, A., and Bodin, X.: Interactions between seasonal snow cover, ground surface temperature and topography (Andes of Santiago, Chile), Permafrost Periglac., 23, 277–291, https://doi.org/10.1002/ppp.1753, 2012. a, b, c
Arenson, L. U., Harrington, J. S., Koenig, C. E. M., and Wainstein, P. A.: Mountain permafrost hydrology – A practical review following studies from the Andes, Geosciences, 12, 48, https://doi.org/10.3390/geosciences12020048, 2022. a
Azócar, G. F. and Brenning, A.: Hydrological and geomorphological significance of rock glaciers in the Dry Andes, Chile (27°–33° S), Permafrost Periglac., 21, 42–53, https://doi.org/10.1002/ppp.669, 2010. a
Azócar, G. F., Brenning, A., and Bodin, X.: Permafrost distribution modelling in the semi-arid Chilean Andes, The Cryosphere, 11, 877–890, https://doi.org/10.5194/tc-11-877-2017, 2017. a, b, c, d, e, f, g, h, i, j, k, l, m, n, o, p, q, r, s, t, u
Azócar, G., Iribarren, P., Pedro, S. B., Fonseca-Gallardo, D., Brenning, A., Yoshikawa, K., Casassa, G., and Huenante, J.: Modeling the Distribution of Mountain Permafrost in Chile, Dirección General de Aguas (DGA), Chile, Zenodo [data set], https://doi.org/10.5281/zenodo.19342541, 2022. a, b
Azócar, G., Brenning, A., Iribarren Anacona, P., Yoshikawa, K., Casassa, G., Straub Bustamante, P., Fonseca-Gallardo, D., and Huenante, J.: Modeling the Distribution of Mountain Permafrost in Chile (Maps), Atacama Ambiente Consultores, https://doi.org/10.5281/zenodo.20045182, 2026. a, b
Baral, P., Haq, M. A., and Yaragal, S. B.: Assessment of rock glaciers and permafrost distribution in Uttarakhand, India, Permafrost Periglac., 31, 31–56, https://doi.org/10.1002/ppp.2008, 2020. a
Barsch, D.: Rockglaciers: Indicators for the present and former geoecology, in: high mountain environments, Springer, Berlin, Germany, https://doi.org/10.1007/978-3-642-80093-1, 1996. a, b
BGC Ingeniería Ltda.: Modelo de Distribución de Permafrost – Chile, Unpublished presentation file and digital data Project P40186, Servicio Nacional de Geología y Minería, Chile, Santiago, Chile, https://www.sernageomin.cl/ (last access: 13 March 2026), 2021 (available upon request). a
Boeckli, L., Brenning, A., Gruber, S., and Noetzli, J.: A statistical approach to modelling permafrost distribution in the European Alps or similar mountain ranges, The Cryosphere, 6, 125–140, https://doi.org/10.5194/tc-6-125-2012, 2012a. a, b, c, d, e, f, g, h, i, j, k, l
Boeckli, L., Brenning, A., Gruber, S., and Noetzli, J.: Permafrost distribution in the European Alps: calculation and evaluation of an index map and summary statistics, The Cryosphere, 6, 807–820, https://doi.org/10.5194/tc-6-807-2012, 2012b. a, b
Brardinoni, F., Vivero, S., Barboux, C., Bodin, X., Cicoira, A., Echelard, T., Hu, Y., Jones, N., Lambiel, C., MacDonell, S., Pellet, C., Rouyet, L., Ruiz, L., Schaffer, N., Wehbe, M., and Delaloye, R.: RGIK guidelines for compiling consistent rock glacier inventories, Geomorphology, 492, 110050, https://doi.org/10.1016/j.geomorph.2025.110050, 2026. a, b
Brenning, A.: Climatic and geomorphological controls of rock glaciers in the Andes of central Chile, PhD thesis, Humboldt-Universität zu Berlin, Mathematisch-Naturwissenschaftliche Fakultät II, Berlin, Germany, https://doi.org/10.18452/15332, 2005. a
Brenning, A.: Spatial cross-validation and bootstrap for the assessment of prediction rules in remote sensing: The R package “sperrorest”, in: IEEE International Symposium on Geoscience and Remote Sensing IGARSS, 5372–5375, Munich, Germany, https://doi.org/10.1109/IGARSS.2012.6352393, 2012. a, b
Brenning, A. and Azócar, G. F.: Minería y glaciares rocosos: impactos ambientales, antecedentes políticos y legales, y perspectivas futuras, Revista de Geografía Norte Grande, 143–158, https://doi.org/10.4067/S0718-34022010000300008, 2010a. a
Brenning, A. and Azócar, G. F.: Statistical analysis of topographic and climatic controls and multispectral signatures of rock glaciers in the dry Andes, Chile (27°–33°S), Permafrost Periglac., 21, 54–66, https://doi.org/10.1002/ppp.670, 2010b. a, b
Brenning, A. and Azócar, G.: Modeling the Distribution of Mountain Permafrost in Chile (Version 1.0), Zenodo [data set and code], https://doi.org/10.5281/zenodo.21499253, 2026. a, b
Brenning, A., Gruber, S., and Hoelzle, M.: Sampling and statistical analyses of BTS measurements, Permafrost Periglac., 16, 383–393, https://doi.org/10.1002/ppp.541, 2005. a
Brenning, A., Schwinn, M., Ruiz-Páez, A. P., and Muenchow, J.: Landslide susceptibility near highways is increased by 1 order of magnitude in the Andes of southern Ecuador, Loja province, Nat. Hazards Earth Syst. Sci., 15, 45–57, https://doi.org/10.5194/nhess-15-45-2015, 2015. a
Brenning, A., Bangs, D., and Becker, M.: RSAGA: SAGA geoprocessing and terrain analysis, R package version 1.4.0, CRAN [code], https://doi.org/10.32614/CRAN.package.RSAGA, 2022. a
Brun, P., Zimmermann, N. E., Hari, C., Pellissier, L., and Karger, D. N.: Global climate-related predictors at kilometer resolution for the past and future, Earth Syst. Sci. Data, 14, 5573–5603, https://doi.org/10.5194/essd-14-5573-2022, 2022. a, b
Burger, K., Degenhardt, J., and Giardino, J.: Engineering geomorphology of rock glaciers, Geomorphology, 31, 93–132, https://doi.org/10.1016/S0169-555X(99)00074-4, 1999. a
Cao, B., Li, X., Feng, M., and Zheng, D.: Quantifying overestimated permafrost extent driven by rock glacier inventory, Geophys. Res. Lett., 48, e2021GL092476, https://doi.org/10.1029/2021GL092476, 2021. a, b
Centro de Estudios de Zonas Áridas: Caracterización y monitoreo de glaciares rocosos en la cuenca del río Elqui, y balance de masa del glaciar Tapado, Technical report, Dirección General de Aguas, Unidad de Glaciología y Nieves, Ministerio de Obras Públicas, Santiago, https://repositoriodirplan.mop.gob.cl/biblioteca/handle/20.500.12140/220347 (last access: 19 August 2026), 2012. a, b
Conrad, O., Bechtel, B., Bock, M., Dietrich, H., Fischer, E., Gerlitz, L., Wehberg, J., Wichmann, V., and Böhner, J.: System for Automated Geoscientific Analyses (SAGA) v. 2.1.4, Geosci. Model Dev., 8, 1991–2007, https://doi.org/10.5194/gmd-8-1991-2015, 2015. a, b
Cusicanqui, D., Lacroix, P., Bodin, X., Robson, B. A., Kääb, A., and MacDonell, S.: Detection and reconstruction of rock glacier kinematics over 24 years (2000–2024) from Landsat imagery, The Cryosphere, 19, 2559–2581, https://doi.org/10.5194/tc-19-2559-2025, 2025. a
Daniels, L. D. and Veblen, T. T.: Altitudinal treelines of the southern Andes near 40° S, The Forestry Chronicle, 79, 237–241, https://doi.org/10.5558/tfc79237-2, 2003. a
Deluigi, N., Lambiel, C., and Kanevski, M.: Data-driven mapping of the potential mountain permafrost distribution, Sci. Total Environ., 590–591, 370–380, https://doi.org/10.1016/j.scitotenv.2017.02.041, 2017. a, b, c
Dirección General de Aguas: Modelo de Favorabilidad de Ocurrencia de Permafrost (PFI) en Chile Continental, prepared by: Atacama Ambiente Consultores, Technical Report S.I.T. No. 530, Ministerio de Obras Públicas, Chile, Santiago, Chile, https://snia.mop.gob.cl/PIA/handle/20.500.13000/126863 (last access: 19 August 2026), 2022a. a, b, c
Dirección General de Aguas: Anexo N°6: Informe Técnico Catastro de Evidencias de Permafrost en Chile, prepared by: Atacama Ambiente Consultores, Technical Report S.I.T. No. 530530, Ministerio de Obras Públicas, Chile, Santiago, Chile, https://snia.mop.gob.cl/PIA/handle/20.500.13000/126863 (last access: 19 August 2026), 2022b. a, b
Dirección General de Aguas: Metodología del inventario público de glaciares, Technical report, Ministerio de Obras Públicas, Chile, Santiago, Chile, https://snia.mop.gob.cl/PIA/handle/20.500.13000/125542 (last access: 19 August 2026), 2022c. a, b
Goetz, J., Brenning, A., Petschko, H., and Leopold, P.: Evaluating machine learning and statistical prediction techniques for landslide susceptibility modelling, Comp. Geosci., 81, 1–11, 2015. a, b
Gruber, S.: Derivation and analysis of a high-resolution estimate of global permafrost zonation, The Cryosphere, 6, 221–233, https://doi.org/10.5194/tc-6-221-2012, 2012. a, b, c, d, e
Gruber, S. and Hoelzle, M.: Statistical modelling of mountain permafrost distribution: Local calibration and incorporation of remotely sensed data, Permafrost Periglac., 12, 69–77, https://doi.org/10.1002/ppp.374, 2001. a
Gruber, S. and Hoelzle, M.: The cooling effect of coarse blocks revisited, in: 9th International Conference on Permafrost, edited by: Kane, D. L. and Hinkel, K. M., vol. 1, 557–561, University of Alaska Fairbanks, Fairbanks, AK, https://www.uspermafrost.org/conference-proceedings (last access: 19 August 2026), 2008. a
Haeberli, W.: Untersuchungen zur Verbreitung von Permafrost zwischen Flüelapass und Piz Grialetsch (Graubünden), vol. 17 of Mitteilungen der Versuchsanstalt für Wasserbau, Hydrologie und Glaziologie der ETH Zürich, ETH Zürich, Zurich, https://ethz.ch/content/dam/ethz/special-interest/baug/vaw/vaw-dam/documents/das-institut/mitteilungen/1970-1979/017.pdf (last access: 19 August 2026), 1975. a, b
Hansson, A., Shulmeister, J., Dargusch, P., and Hill, G.: A review of factors controlling Southern Hemisphere treelines and the implications of climate change on future treeline dynamics, Agr. Forest Meteorol., 332, 109375, https://doi.org/10.1016/j.agrformet.2023.109375, 2023. a
Harris, C., Davies, M. C. R., and Etzelmüller, B.: The assessment of potential geotechnical hazards associated with mountain permafrost in a warming global climate, Permafrost Periglac., 12, 145–156, https://doi.org/10.1002/ppp.376, 2001. a
Hauck, C.: New concepts in geophysical surveying and data interpretation for permafrost terrain, Permafrost Periglac., 24, 131–137, https://doi.org/10.1002/ppp.1774, 2013. a
Hijmans, R. J.: terra: Spatial data analysis, R package version 1.8-25, CRAN [code], https://doi.org/10.32614/CRAN.package.terra, 2025. a
Hilbich, C., Hauck, C., Mollaret, C., Wainstein, P., and Arenson, L. U.: Towards accurate quantification of ice content in permafrost of the Central Andes – Part 1: Geophysics-based estimates from three different regions, The Cryosphere, 16, 1845–1872, https://doi.org/10.5194/tc-16-1845-2022, 2022. a, b
Hjort, J. and Luoto, M.: Statistical methods for geomorphic distribution modeling, 53–73, Elsevier, https://doi.org/10.1016/B978-0-12-374739-6.00028-2, 2013. a, b
Hoelzle, M., Mittaz, C., Etzelmüller, B., and Haeberli, W.: Surface energy fluxes and distribution models of permafrost in European mountain areas: An overview of current developments, Permafrost Periglac., 12, 53–68, https://doi.org/10.1002/ppp.385, 2001. a
Hosmer, D. W. and Lemeshow, S.: Applied logistic regression, John Wiley & Sons Inc., USA, https://doi.org/10.1002/0471722146, 2000. a
Hu, Z., Yan, D., Feng, M., Xu, J., Liang, S., and Sheng, Y.: Enhancing mountainous permafrost mapping by leveraging a rock glacier inventory in northeastern Tibetan Plateau, Int. J. Digit. Earth, 17, 2304077, https://doi.org/10.1080/17538947.2024.2304077, 2024. a, b, c
Huggel, C., Fischer, L., Schneider, D., and Haeberli, W.: Research advances on climate-induced slope instability in glacier and permafrost high-mountain environments, Geogr. Helv., 65, 146–156, https://doi.org/10.5194/gh-65-146-2010, 2010. a
Janke, J. R.: Modeling past and future alpine permafrost in the Colorado Front Range, Earth Surf. Process. Landf., 30, 1495–1508, https://doi.org/10.1002/esp.1205, 2005. a, b
Jiang, H., Zheng, G., Yi, Y., Chen, D., Zhang, W., Yang, K., and Miller, C. E.: Progress and challenges in studying regional permafrost in the Tibetan Plateau using satellite remote sensing and models, Front. Earth Sci., 8, 560403, https://doi.org/10.3389/feart.2020.560403, 2020. a
Jiang, S., Sweet, L.-b., Blougouras, G., Brenning, A., Li, W., Reichstein, M., Denzler, J., Shangguan, W., Yu, G., Huang, F., and Zscheischler, J.: How interpretable machine learning can benefit process understanding in the geosciences, Earth's Future, 12, https://doi.org/10.1029/2024EF004540, 2024. a, b
Jones, D. B., Harrison, S., Anderson, K., and Whalley, W. B.: Rock glaciers and mountain hydrology: A review, Earth-Sci. Rev., 193, 66–90, https://doi.org/10.1016/j.earscirev.2019.04.001, 2019. a
Keller, F.: Automated mapping of mountain permafrost using the program PERMAKART within the geographical information system ARC/INFO, Permafrost Periglac., 3, 133–138, 1992. a
Koenig, C. E. M., Hilbich, C., Hauck, C., Arenson, L. U., and Wainstein, P.: Thermal state of permafrost in the Central Andes (27–34° S), The Cryosphere, 19, 2653–2676, https://doi.org/10.5194/tc-19-2653-2025, 2025. a, b
Lewkowicz, A. and Ednie, M.: Probability mapping of mountain permafrost using the BTS method, Wolf Creek, Yukon Territory, Canada, Permafrost Periglac., 15, 67–80, https://doi.org/10.1002/ppp.480, 2004. a, b
Mahanta, K. K., Pradhan, I. P., Gupta, S. K., and Shukla, D. P.: Assessing machine learning and statistical methods for rock glacier-based permafrost distribution in northern Kargil region, Permafrost Periglac., 35, 262–277, https://doi.org/10.1002/ppp.2240, 2024. a, b, c, d
Marcer, M., Bodin, X., Brenning, A., Schoeneich, P., Charvet, R., and Gottardi, F.: Permafrost favorability index: Spatial modeling in the French Alps using a rock glacier inventory, Front. Earth Sci., 5, 105, https://doi.org/10.3389/feart.2017.00105, 2017. a, b, c, d
Masiokas, M. H., Rabatel, A., Rivera, A., Ruiz, L., Pitte, P., Ceballos, J. L., Barcaza, G., Soruco, A., Bown, F., Berthier, E., Dussaillant, I., and MacDonell, S.: A review of the current state and recent changes of the Andean cryosphere, Front. Earth Sci., 8, 99, https://doi.org/10.3389/feart.2020.00099, 2020. a, b, c, d
Mathys, T., Hilbich, C., Arenson, L. U., Wainstein, P. A., and Hauck, C.: Towards accurate quantification of ice content in permafrost of the Central Andes – Part 2: An upscaling strategy of geophysical measurements to the catchment scale at two study sites, The Cryosphere, 16, 2595–2615, https://doi.org/10.5194/tc-16-2595-2022, 2022. a, b
Mollaret, C., Hilbich, C., Pellet, C., Flores-Orozco, A., Delaloye, R., and Hauck, C.: Mountain permafrost degradation documented through a network of permanent electrical resistivity tomography sites, The Cryosphere, 13, 2557–2578, https://doi.org/10.5194/tc-13-2557-2019, 2019. a
NASA JPL: NASADEM Merged DEM Global 1 arc second V001, https://doi.org/10.5067, 2020. a
Popescu, R., Filhol, S., Etzelmüller, B., Vasile, M., Pleșoianu, A., Vîrghileanu, M., Onaca, A., Șandric, I., Săvulescu, I., Cruceru, N., Vespremeanu-Stroe, A., Westermann, S., Sîrbu, F., Mihai, B., Nedelea, A., and Gascoin, S.: Permafrost distribution in the southern Carpathians, Romania, derived from machine learning modeling, Permafrost Periglac., 35, 243–261, https://doi.org/10.1002/ppp.2232, 2024. a
Pruessner, L., Phillips, M., Farinotti, D., Hoelzle, M., and Lehning, M.: Near-surface ventilation as a key for modeling the thermal regime of coarse blocky rock glaciers, Permafrost Periglac., 29, 152–163, https://doi.org/10.1002/ppp.1978, 2018. a
Pya, N.: scam: Shape Constrained Additive Models, R package, CRAN [code], https://doi.org/10.32614/CRAN.package.scam, 2023. a
Pya, N. and Wood, S. N.: Shape constrained additive models, Stat. Comput., 25, 543–559, https://doi.org/10.1007/s11222-013-9448-7, 2015. a
RGIK Working Group: Guidelines for inventorying rock glaciers: Baseline and practical concepts (version 1.0), Tech. rep., IPA Action Group Rock Glacier Inventories and Kinematics, Université de Fribourg, https://doi.org/10.51363/unifr.srr.2023.002, 2023. a, b, c
Roer, I. and Nyenhuis, M.: Rockglacier activity studies on a regional scale: Comparison of geomorphological mapping and photogrammetric monitoring, Earth Surf. Process. Landf., 32, 1747–1758, https://doi.org/10.1002/esp.1496, 2007. a, b
Rouyet, L., Bolch, T., Brardinoni, F., Caduff, R., Cusicanqui, D., Darrow, M., Delaloye, R., Echelard, T., Lambiel, C., Pellet, C., Ruiz, L., Schmid, L., Sirbu, F., and Strozzi, T.: Rock Glacier Inventories (RoGIs) in 12 areas worldwide using a multi-operator consensus-based procedure, Earth Syst. Sci. Data, 17, 4125–4157, https://doi.org/10.5194/essd-17-4125-2025, 2025. a, b
Saito, K., Trombotto, D., Yoshikawa, K., Mori, J., Sone, T., Marchenko, S., Romanovsky, V., Walsh, J., Hendricks, A., and Bottegal, E.: Late quaternary permafrost distribution downscaled for South America: Examinations of GCM-based maps with observations, Permafrost Periglac., 27, 43–55, https://doi.org/10.1002/ppp.1863, 2015. a
Sattler, K., Anderson, B., Mackintosh, A., Norton, K., and de Róiste, M.: Estimating permafrost distribution in the maritime Southern Alps, New Zealand, based on climatic conditions at rock glacier sites, Front. Earth Sci., 4, https://doi.org/10.3389/feart.2016.00004, 2016. a, b, c, d, e
Senate of Chile: Boletin 11876–12, https://tramitacion.senado.cl/appsenado/templates/tramitacion/index.php?boletin_ini=11876-12 (last access: 19 August 2026), 2023. a
Wicky, J. and Hauck, C.: Air convection in the active layer of rock glaciers, Front. Earth Sci., 8, 335, https://doi.org/10.3389/feart.2020.00335, 2020. a
Wood, S. N.: Generalized Additive Models: An Introduction with R, CRC Press, 2nd edn., https://doi.org/10.1201/9781315370279, 2017. a, b, c
Wu, T., Wang, X., Yuan, H., Kong, X., Cai, J., Guo, X., and Liu, G.: Evaluating machine learning models for enhanced permafrost distribution mapping using rock glaciers: A case study in Shaluli Mountain, Southeast Tibetan Plateau, Remote Sens. Appl.-Soc. Environ., 40, 101745, https://doi.org/10.1016/j.rsase.2025.101745, 2025. a, b, c, d, e
Yoshikawa, K., Casassa, G., Azócar, G., Iribarren Anacona, P., Masías, P., Miyata, T., Takahashi, N., Schorghofer, N., Ramirez, E., and Cáceres Correa, B.: Permafrost and active layer characteristics in the high arid Andes between the Altiplano and high Atacama Desert, Arct. Antarct. Alp. Res., 57, 2532202, https://doi.org/10.1080/15230430.2025.2532202, 2025. a, b