
the Creative Commons Attribution 4.0 License.
the Creative Commons Attribution 4.0 License.
 | 21 Aug 2026
Spatial heterogeneity in post-fire permafrost evolution as revealed by satellite radar observations
Barbara Widhalm
Annett Bartsch
Benjamin Jones
Wildfires, which have profound impacts on permafrost environments, are expected to increase in frequency and intensity as a result of climate change. This study aims to enhance our understanding of how wildfires affect permafrost by investigating multiple Arctic tundra regions using a space-for-time approach, examining fire events up to approximately 90 years post-occurrence. We employed Synthetic Aperture Radar (SAR) data acquired in L- and C-band to evaluate thaw season deformation rates, associated with soil moisture, as well as annual deformation rates through interferometric (InSAR) retrieval, alongside an analysis of C-band backscatter values. InSAR data offers insights into permafrost degradation, active layer dynamics and soil moisture, while backscatter measurements provide valuable information on land surface roughness, vegetation structure, including surface soil moisture content. Through this approach, we identified increased thaw season subsidence rates, with regional differences in the response to fire. However, when aggregated across all study regions, spanning all permafrost zones, this increased thaw season subsidence rate persisted for about 50 years post-fire. Elevated annual subsidence rates, on the other hand, were detectable on average only for about 10 years across all regions. However, thaw season deformation rates were observed to require somewhat longer times to adjust to surrounding values in colder regions. While all regions show similar deformation trend directions, with initially higher subsidence values, backscatter results varied depending on region and ground temperature. We found increased summer backscatter in fire scars within warmer regions likely due to higher soil moisture, while fire scars in colder regions tended to exhibit lower backscatter compared to their unburned surroundings, likely driven predominantly by the effect of initial vegetation loss. The study region with average positive annual ground temperatures, where permafrost is still present below 2 m, showed an initial increase in summer backscatter values of about 1 dB, whereas areas °C featured partially reduced initial backscatter values of, on average, 0.5 dB or less. Examining multiple regions across permafrost gradients revealed the region-specific nature of fire scar characteristics, emphasizing the need to account for a variety of factors when assessing fire scar recovery.
- Article
(18342 KB) - Full-text XML
- BibTeX
- EndNote


The frequency of wildfires in boreal and Arctic regions has risen significantly in recent decades and is expected to continue to increase (Holloway et al., 2020; McCarty et al., 2021; Hu et al., 2015; Masrur et al., 2018; Miller et al., 2023). Recent years have seen increasingly extreme fire seasons across the Pan-Arctic (McCarty et al., 2021). Climate change is anticipated to further amplify this trend by increasing the likelihood of Arctic fires through more extreme fire weather, enhanced lightning frequency, and drier vegetative and ground fuel conditions (McCarty et al., 2021).
Wildfires have profound impacts on permafrost environments. They contribute to permafrost degradation by removing vegetation and the organic layer, leading to the mobilization of carbon through combustion and the additional release of soil organic carbon as permafrost degrades (Mack et al., 2011; Holloway et al., 2020; Jones et al., 2015; Michaelides et al., 2019). Therefore, the interaction between permafrost thaw and wildfires is considered crucial for accurately quantifying the permafrost carbon feedback (Madaj, 2025). Wildfire induced permafrost degradation is reflected in the thickening of the active layer and the onset of thermokarst (Liu et al., 2014). Fires have immediate as well as long-term impacts on permafrost environments, among other effects, by altering ground thermal and hydrological regimes (Holloway et al., 2020), ultimately leading to shifts in vegetation structure and species composition (Frost et al., 2020; Heim et al., 2025).
Vegetation recovery varies depending on species. While lichens and mosses take a significant amount of time to recover to their pre-disturbance condition (Bliss and Wein, 1972; Kolden and Rogan, 2013), tussocks regenerate rapidly (Kolden and Rogan, 2013). Furthermore, fires have been found to expedite the succession of grasses and tall shrubs, thereby promoting shrubification (Jones et al., 2013; Gaglioti et al., 2021; Jandt et al., 2021; Heim et al., 2025).
The review by Holloway et al. (2020) documents that in boreal and tundra environments the active layer thickness (ALT) increases rapidly in the years following a fire, reaches its peak typically within 5 to 10 years, and subsequently undergoes a gradual recovery. The recovery of permafrost itself, which lies beneath the active layer, is a complex process influenced by various factors, which can be categorized into antecedent, disturbance and post-fire factors (Holloway et al., 2020; Nossov et al., 2013; Jafarov et al., 2013; Smith et al., 2015; Zhang et al., 2015; Jones et al., 2024b). Antecedent factors include site characteristics such as ground temperatures and ground ice content, as well as site vegetation, organic layer thickness, soil moisture conditions or soil type (Chen et al., 2021a, b; Miller et al., 2024). The degree of disturbance during the fire also affects the recovery rate, as do post-fire conditions like residual organic layer thickness and accumulation rates. Additionally, soil moisture conditions, changes in snowpack, and thermokarst development are further influencing factors (Holloway et al., 2020). As a result, the recovery process following fires shows considerable variability across different tundra locations (Heim et al., 2025), influenced not only by differences in fire characteristics, but also ecological factors like ground ice regimes (Foster et al., 2022).
Besides in situ studies of fire scars, remote sensing data has been used to investigate the effects of fires in Arctic tundra environments. In particular, InSAR derived ground surface deformation data has been utilized in local studies to examine permafrost degradation (e.g. (Liu et al., 2014; Iwahana et al., 2016; Abe et al., 2022; Yanagiya et al., 2023)), with Michaelides et al. (2019) specifically focusing on the temporal fire response of the active layer and permafrost. Michaelides et al. (2019) utilized a space-for-time approach to study the Yukon-Kuskokwim Delta, finding that seasonal subsidence (associated with the seasonal thaw-freeze subsidence-heave cycle; hereafter referred to as thaw season subsidence) and ALT in response to fire peak around 5 years post-fire, with conditions returning to pre-fire levels after approximately 15 years. The degradation of permafrost and “thinning of the permafrost layer” associated with the melting of excess ground ice near the permafrost table (Schaefer et al., 2015), reflected in a long-term trend (hereafter referred to as the annual deformation rate), reached their peak 25 years after the fire, with full recovery to pre-fire conditions taking about 66 years (Michaelides et al., 2019).
Cao and Furuya (2025) expanded the concept introduced by Michaelides et al. (2019) which was based on temporally sparse samples, and applied it to a boreal permafrost environment in North Yukon. A comparatively short annual subsidence rate phase was observed during the first decade, followed by a recovery period characterized by uplift over the subsequent 15–30 years, until the ground approached pre-fire conditions, caused by vegetation regeneration.
Clayton et al. (2025) also examined the Yukon-Kuskokwim Delta, similarly to Michaelides et al. (2019). Using a space-for-time substitution approach, Clayton et al. (2025) investigated not only vegetation recovery but also changes in soil moisture, ALT, and thaw season subsidence. They found that ecological succession spans decades. ALT was initially higher in burned areas and negatively correlated with soil moisture, which remained higher than in unburned areas and showed no recovery over 46 years. They found only low coefficients of determination between the thaw season subsidence and the time since burn, with values returning to the zero-effect line after 29 years.
Recently, Zhang et al. (2025) examined thaw stages in interior Alaska through the integration of field measurements, LiDAR data, optical imagery, and elevation data, highlighting the utility of space-borne sensors for capturing these dynamics.
Wig et al. (2025) investigated Volumetric Water Content (VWC), ALT, and thaw season subsidence in burned and unburned areas of the North American Arctic using data derived from a combination of L-band and P-band airborne radar. Their findings showed that soil VWC was higher in burned areas. However, at the Arctic scale, the differences in ALT and mean thaw season subsidence between burned and unburned sites were minimal. The linkage between soil moisture and thaw season deformation rates as derived from C-band SAR has been quantified by Widhalm et al. (2025), who showed that higher thaw season subsidence rates in Arctic lowland permafrost regions were associated with higher near-surface soil moisture compared to drier conditions, a pattern previously suggested to be associated with greater ground-ice content and the higher thermal conductivity characteristic of wetter areas (Antonova et al., 2018). Specifically the concept of expressing thaw season deformation rates with respect to degree days of thaw (DDT), denoted as αDDT, has been shown of added value in permafrost environments. As absolute thaw season deformation values depend on the year-specific amount of seasonal heating, expressing thaw season deformation rates in the degree day of thaw domain reduces the influence of interannual variability and accounts for differences arising from the timing of the first acquisition date relative to thaw onset. The use of degree days of thaw rather than day of year has therefore been proposed for analyzing thaw season deformation to improve comparability between years (Bartsch et al., 2019), and further facilitates comparisons across regions. This concept has been so far not tested in the context of post fire evolution monitoring.
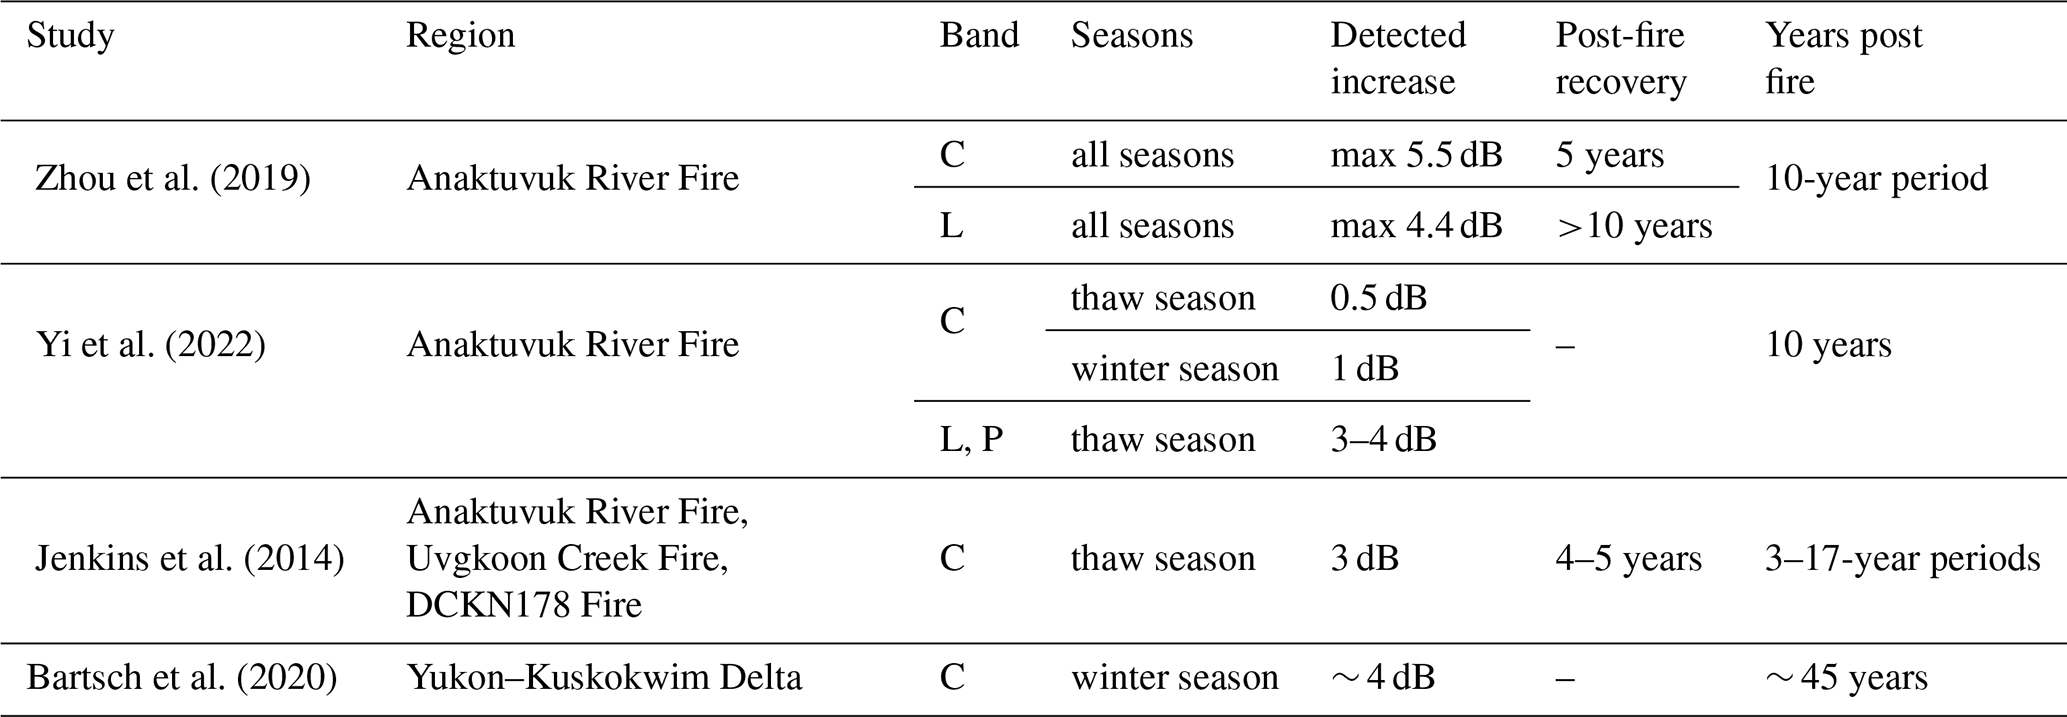
The use of SAR backscatter data to study changes after wildfires in tundra regions is limited, with only a few studies addressing this field, and these have focused on a small number of fire events (summerized in Table 1). Zhou et al. (2019), Yi et al. (2022), and Jenkins et al. (2014) investigated the fire response of SAR data for the Anaktuvuk River Fire, with Jenkins et al. (2014) also including two other regions in Alaska. Zhou et al. (2019) and Jenkins et al. (2014) observed an increase in C-band backscatter, ranging from approximately 3 to 5.5 dB, with C-band values returning to pre-fire levels after 4–5 years. Findings of Yi et al. (2022) add to these results, showing strong increases of 3–4 dB in low-frequency radar backscatter approximately 10 years post-fire, with limited contrast in C-band data over the same period. Yi et al. (2022) also noted that C-band winter backscatter was generally more than 1 dB higher in burned areas, attributing these changes to increased surface roughness, microtopography, and enhanced subsurface scattering due to a drier and deeper active layer. Bartsch et al. (2020) also observed higher winter backscatter for fire scars in the Yukon-Kuskokwim Delta. This increase was attributed to the formation of depth hoar in the snow cover, resulting from a delayed freeze-up compared to pre-fire conditions, and the presence of liquid water in the soil in early winter. While these studies analyze SAR backscatter directly, the studies by Clayton et al. (2025) and Wig et al. (2025) likewise rely on backscatter-derived information by analyzing VWC products, which are generated from P-band polarimetric backscatter collected during the ABoVE campaign (Chen et al., 2023).
Zhou et al. (2019)Yi et al. (2022)Jenkins et al. (2014)Bartsch et al. (2020)Table 1Studies addressing backscatter response after fire events.
The across region analyses presented by Wig et al. (2025) did not incorporate the fire year information. The space for time assessments by Michaelides et al. (2019) and Clayton et al. (2025) have been limited to the Yukon-Kuskokwim Delta and in case of Cao and Furuya (2025) to the Arctic-boreal North Yukon region. In this study, we build on and extend the previous site specific SAR based research by exploring fire events in various regions, that were selected to represent an environmental gradient and spanning across all permafrost zones, applying a space-for-time approach across all areas examined. We utilized InSAR derived deformation rates and SAR backscatter data to analyze fire responses and integrated ground temperature data to explore how permafrost recovery is influenced by varying thermal conditions. Specifically the concept of thaw season deformation rates with respect to degree days of thaw (indicating soil moisture) has been applied. In order to compare with pre-fire conditions we incorporated the difference with undisturbed reference areas, which allows to account for year-to-year fluctuations. By integrating data from diverse sources, such as InSAR, SAR backscatter, and observations across multiple regions, we aim to deepen our understanding of fire response processes and their variation across different environmental contexts.
The five study regions represent a gradient of ground temperatures (Fig. 1a) and permafrost zones respectively, spanning from sporadic to continuous permafrost (Fig. 1b). Study regions differ in topographic setting with dwarf- to low-shrub tundra predominating at most sites (Figs. A1 and A2). Each region contains multiple fire scars of varying age (Fig. 2a–d).
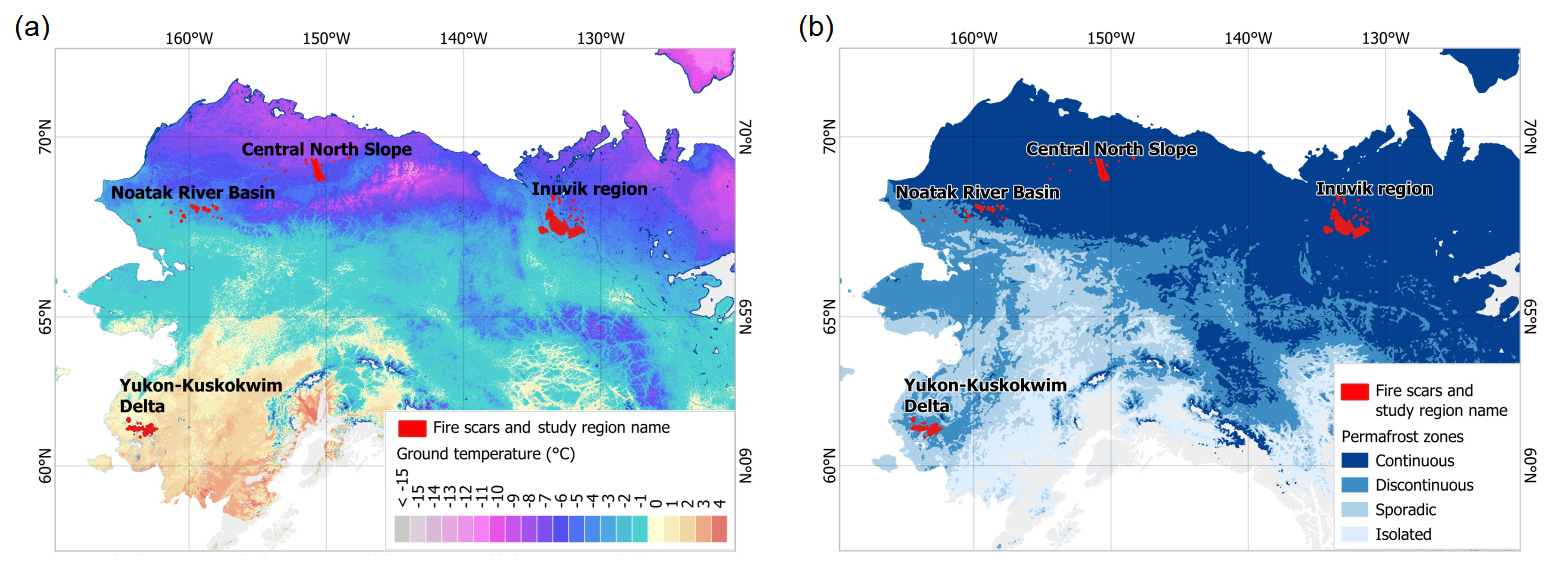
Figure 1Study region locations: Yukon-Kuskokwim Delta, southwestern Alaska; Noatak River Basin, northwestern Alaska; Central North Slope, northern Alaska; Inuvik region, northwestern Canada. (a) Background map: ground temperature at 2 m depth for the year 2021 (Westermann et al., 2024). (b) Background map: Permafrost zones (Obu et al., 2019).
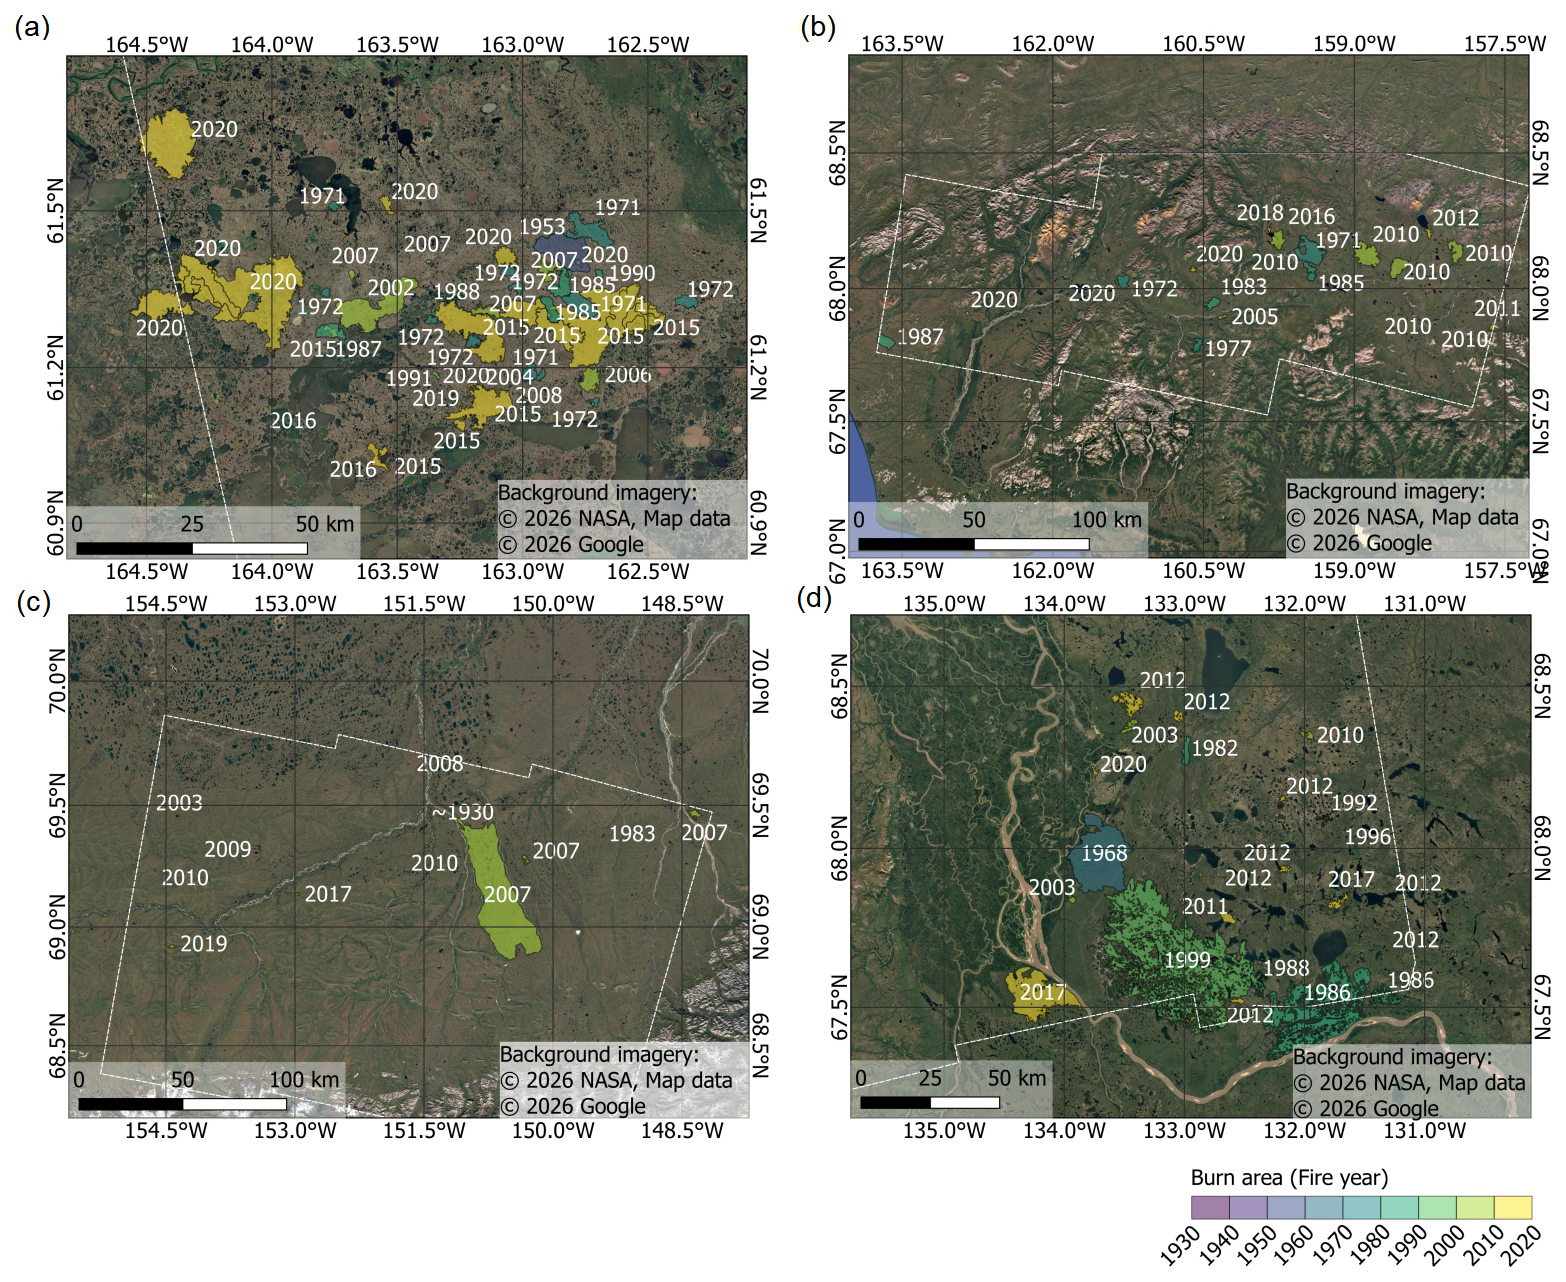
Figure 2(a–d) Fire scars analyzed in this study and fire years of the study regions (a) Yukon-Kuskokwim Delta, (b) Noatak River Basin, (c) Central North Slope, (d) Inuvik region. Dashed white lines indicate the analysis boundary (Fire scars of a–c, with the exception of the prehistoric Shivugak Bluffs Burn in c, derived from the Alaska large fire database (Kasischke et al., 2002) and d Fire History dataset from the Government of the Northwest Territories (NWT Centre for Geomatics). Background imagery: © 2026 NASA, Map data © 2026 Google Satellite).
2.1 Yukon-Kuskokwim Delta
The Yukon-Kuskokwim Delta in southwestern Alaska is located between the Yukon and Kuskokwim Rivers within a region characterized by ice-rich discontinuous permafrost (Clayton et al., 2025). It is a subarctic lowland marked by numerous ponds and lakes, with deposits composed of silt, sand, gravel, and organic materials (Burns, 1964). The Yukon-Kuskokwim Delta is the warmest region in our study, with average ground temperatures at 2 m depth of approximately 1.3 °C in the areas encompassing the fire scars (Westermann et al., 2024). The investigated fires lie within the Yukon-Kuskokwim uplands, which are part of the inland areas of the delta (Jorgenson and Roth, 2010), an area with a long history of tundra fires and relatively warm permafrost (Frost et al., 2020). Here, wildfires are predominantly fueled by lichens, which dominate the gentle, rolling hills of this region alongside shrubs and sedges (Frost et al., 2020).
2.2 Inuvik region
The Inuvik study region, located east of the Mackenzie Delta, lies in the zone of continuous permafrost (Obu et al., 2019) and is dominated by glacial sediments (Geological Survey of Canada, 2014). It is predominantly composed of a mixed cover of trees and other natural vegetation, interspersed with patches of shrubs and herbaceous vegetation (European Commission, Joint Research Centre:, 2003). With average ground temperatures at 2 m depth of about −3.9 °C, this region represents the second coldest site in our study (Westermann et al., 2024).
2.3 Noatak River Basin
The Noatak study region in northwest Alaska comprises the Noatak River Basin, which lies within the Noatak National Preserve at the western edge of the Brooks Range. The valley of the Noatak River is situated between the DeLong Mountains to the north and the Baird Mountains to the south and is characterized by predominantly low shrub or tussock tundra (Holt et al., 2009) and underlain by continuous permafrost (Elias et al., 1999). Mean annual ground temperatures are approximately −2.4 °C in the vicinity of the fire scars (Westermann et al., 2024), which primarily occur in low-lying areas near the Noatak River (Racine et al., 1985), in more productive vegetation types (Gaglioti et al., 2021).
2.4 Central North Slope
The study region in the Central North Slope of Alaska includes the upland areas at the Brooks Foothills (Yedoma permafrost region), situated between the Brooks Range to the south and the Beaufort Coastal Plain to the north, and is underlain by continuous permafrost (Obu et al., 2019). This region is characterized by silt, rocky silt and peat lithology, and it is dominated by shrubby tussock tundra and low shrubs (Muller et al., 2018). Here the lowest mean annual ground temperatures at 2 m depth are found, with approximately −6.5 °C (Westermann et al., 2024). The most prominent fire of this region is the Anaktuvuk River Fire, which burned an area of about 1000 km2 in 2007 (Miller et al., 2023, 2024).
3.1 Sentinel-1
The Sentinel-1 satellites, operated by ESA, are equipped with C-band SAR sensors at a wavelength of 5.6 cm. The first Sentinel-1 satellite was launched in 2014, followed by the second in 2016, which ceased operations at the end of 2021. An additional Sentinel-1 satellite was launched in December 2024. While the dual-satellite constellation theoretically enabled a 6 d repeat cycle, the typical interval was 12 d due to the mission’s global observation plan. The data utilized in this study was obtained in VV polarization using the Interferometric Wide (IW) swath mode, offering a 2.3 m × 13.9 m (range × azimuth) ground sampling distance for 250 km-wide swaths.
For InSAR analysis, data from the thawing season were used, starting once interferogram coherence became satisfactory after snowmelt and ending when the freezing period began, as determined by ERA5 data. For backscatter analysis, all available data from the month of August were employed. To investigate winter backscatter, only data from November to January within the approximate temperature range of −1 to −15 °C were considered, due to the temperature sensitivity of the measurements (Bergstedt et al., 2018). Additionally, dates impacted by rain-on-snow events were excluded (Bartsch et al., 2023).
3.2 ALOS-2 PALSAR-2
PALSAR-2 aboard JAXA's ALOS-2 satellite is a L-Band SAR sensor (24 cm wavelength) and was launched in 2014. Data used in this study was acquired in ScanSAR mode in HH polarization, with single look pixel spacing of about 9 and 3 m in range and azimuth and an applied nominal resolution of about 23 m. ALOS-2 has a revisit time of 14 d; however, images are not acquired regularly, so the selection of available images is much more limited. Depending on the study region, data were used either from the beginning of the thawing season (Inuvik region and Noatak River Basin), from the end of the thawing season (Central North Slope) or August to September (Yukon-Kuskokwim Delta). For each region, the dataset covers a timespan of at least three years, with the dates of the observations listed in Table A6.
3.3 Fire scars
The Alaska large fire database (Bureau of Land Management, Alaska Interagency Coordination Center, 2024) includes both current and historical wildfire data starting from 1940. The location and perimeter of fires are mapped using three techniques: ground surveys, airborne surveys, and interpreting aerial photography. For the Central North Slope, the oldest fire scar included in this study was the Shivugak Bluffs Burn described in Miller et al. (2024), which was identified in a 1948 aerial photograph. Due to the extent of thermokarst development, the fire was suggested to have occurred some decades earlier. Therefore, an approximate fire year of 1930 was assumed here. For Inuvik, the Fire History dataset from the Government of the Northwest Territories (NWT Centre for Geomatics) was used, with recorded fires starting in 1950. Data sources include GPS, MODIS, Landsat, and Sentinel-2.
3.4 Auxiliary data
3.4.1 ERA5
Air temperature data used to compute degree day of thaw (DDT) dependent thaw season deformation rates (see Sect. 4.2.1) and to perform DDT-based modeling of annual deformation rates for the Yukon-Kuskokwin Delta (see Sect. 4.2.2) were obtained from the ERA5 reanalysis dataset. ERA5 integrates observational data with model outputs to provide a globally consistent climate record (Hersbach et al., 2023). As proposed by Widhalm et al. (2025), we used 2 m air temperature with a temporal resolution of 2 h and a spatial resolution of 0.25°.
3.4.2 Circumarctic land cover units (CALU)
The circumarctic land cover units dataset (CALU, Bartsch et al., 2024) was used for masking purposes (see Sect. 4.2.1). This dataset combines Sentinel-1 and Sentinel-2 data at 10 m resolution, with units representing similar reflectance characteristics and associated with specific vegetation and soil properties.
3.4.3 CCI Permafrost Ground Temperature
To relate the results to ground temperatures, ESA's Climate Change Initiative (CCI) Permafrost product at a depth of 2 m for the year 2021 was used (Westermann et al., 2024). It is based on a thermal model that is both driven and constrained by satellite observations, incorporating MODIS Land Surface Temperature data combined with downscaled ERA5 reanalysis near-surface air temperature information. It has a spatial resolution of 0.01° and represents average annual ground temperatures.
3.4.4 Copernicus DEM
The Copernicus Digital Elevation Model (DEM, Copernicus, 2019, Fig. A1) is a digital surface model derived from the WorldDEM, which in turn is based on data from the TanDEM-X mission and locally supplemented with other elevation models. In this study, the globally available 30 m resolution version was used for InSAR processing and for the derivation of slope information used in the masking of the analyzed datasets.
3.4.5 ABoVE InSAR L-band thaw season subsidence
In order to evaluate the Sentinel-1 thaw season deformation rate results (−αDDT), they were compared to the ABoVE (Arctic-Boreal Vulnerability Experiment) thaw season deformation products (Chen et al., 2022). These products are derived from L-band (UAVSAR, Uninhabited Aerial Vehicle Synthetic Aperture Radar) InSAR pairs acquired in June and September 2017 for 51 sites in Alaska and Northwest Canada, providing a spatial resolution of 30 m.
3.4.6 LiDAR DTM, Anaktuvuk River tundra fire
For the evaluation of PALSAR-2 annual deformation rates, a comparison with high resolution (1 m spatial resolution) digital terrain models (DTMs) was conducted. Three airborne LiDAR DTMS from the summers of 2009, 2014 and 2021 are available from Jones et al. (2024b) for a 50 km2 area within the Anaktuvuk River tundra fire scar (North Slope).
A space-for-time approach was employed to analyze the time-dependent effects of fire scars on deformation and backscatter, with fire scars from different temporal stages evaluated to compensate for the lack of sufficiently long observational time series caused by limitations in satellite data availability. Thaw seasonal (−αDDT) as well as annual deformation rates were considered. Furthermore, the effects of ground temperatures on the results have been investigated. Table A1 provides the years used for each parameter in the analysis.
4.1 Fire scar age analysis
To allow for a comparison with pre-fire conditions each fire scar was compared to its unburned surrounding area by calculating the difference between the median values of the fire scar and the median of the adjacent area, which was defined as a 5 km buffer around the scar, excluding all recorded fire scars within the buffer. This method additionally helps to counteract spatially limited phenomena such as insufficiently corrected atmospheric or ionospheric effects, or poorly chosen reference points in the case of InSAR, as well as differences in vegetation cover and prevailing moisture conditions in the case of backscatter analysis. Areas with multiple fire events were excluded. Results were masked for terrain slopes less than 5° to exclude areas potentially affected by mass movements, such as solifluction (Widhalm et al., 2025). For this, the Copernicus DEM was used. Furthermore, for the Noatak River Basin and Central North Slope, areas along river courses with significantly different InSAR signals and γ0 values were masked. Land cover information from CALU (Bartsch et al., 2024) was used for this purpose. The classes “partially barren” and “shallow water/abundant macrophytes” were masked with a 100m buffer for large polygons. In addition, CALU water classes were used to mask out open water areas, ensuring that no open water pixels remained in the datasets. InSAR and backscatter results were masked identically to ensure comparability. Fire scars were selected based on their masked 5 km buffer areas, which mostly displayed homogeneous results.
The results were analyzed with respect to the time since initial burn, with multiple results per year averaged per region, and functions were fitted to the data for each study site. For thaw season deformation rates (−αDDT), an exponential model was applied to account for the decrease in thaw season deformation rates over time. To evaluate the annual deformation rate, both exponential and damped oscillation models were tested, as proposed by Michaelides et al. (2019) and Cao and Furuya (2025), respectively. In contrast, backscatter values exhibited a more linear trend and therefore a linear model was applied in this case. These comparisons were also conducted in relation to the corresponding ground temperature at 2 m depth to analyze potential influences.
4.2 InSAR processing
4.2.1 Sentinel-1 thaw season deformation rate −αDDT
The applied Sentinel-1 processing follows the workflow described in Widhalm et al. (2025), utilizing interferograms processed sequentially in a daisy-chain network (list of used interferograms shown Tables A2, A3, A4 and A5). Interferograms were multi-looked with a factor of 5 by 1 pixels. The topographic phase was accounted for using the 30 m Copernicus DEM, and adaptive phase filtering (Goldstein and Werner, 1998) was applied before unwrapping (Costantini, 1998). Unwrapped interferograms were masked based on mean coherence (threshold 0.8) and mean filtered correlation coefficient (threshold 0.5) (similar to Strozzi et al., 2026). Reference points were selected at airstrips for the Central North Slope and Yukon-Kuskokwim Delta, similar to Bartsch et al. (2019) and at low-lying bedrock areas, considered to be stable, for the Inuvik region and Noatak River Basin. The phase time series was then derived from the masked interferograms, using a multi-reference small baseline approach (Berardino et al., 2002; Werner et al., 2012), and converted to vertical displacements, assuming all motion occurred in the vertical direction. To mitigate the effects of large-scale atmospheric disturbances, a low-frequency correction was performed by applying a linear least-squares type spatial filter, as implemented in the GAMMA software, using a neighbourhood radius of approximately 20 km to estimate and remove long-wavelength atmospheric path delays. The filtered results were then geocoded for further analysis.
Assuming a linear relationship between the cumulative positive degree days/degree days of thaw (DDT) and thaw season surface displacement, we determined the thaw season deformation rate (deformation per DDT [mm DDT−1], here denoted as −αDDT, Eq. 1) (Widhalm et al., 2025). This assumption is supported by Widhalm et al. (2025), who demonstrated that a linear scaling between DDT and thaw season subsidence yielded higher coefficients of determination with in situ soil moisture measurements than a dependence, despite the latter being consistent with physical theory (Stefan’s equation). In Widhalm et al. (2025), positive αDDT values were used to represent subsidence in order to better capture its relationship with soil moisture. In this study, we treat subsidence as negative and therefore use −αDDT. di denotes the cumulative displacement measured between the first acquisition and the ith time step, and n is the total number of available observation dates (Widhalm et al., 2025).
To further reduce atmospheric effects, the median was calculated over three consecutive thawing seasons using a sliding temporal window, applied wherever sequential years of data were available. For visualization of the overall thaw patterns, maps of the median across all computed years are presented, including the locations of the selected reference points (Fig. A3).
4.2.2 PALSAR-2 annual deformation rate
Interferograms were generated with a multi-looking factor of 2 by 9 pixels for all possible pairs, and only those with sufficient coherence resulting in minimal unwrapping errors, as determined by visual inspection (e.g. as done in Chen et al., 2020, Eshqi Molan et al., 2018), were selected. Table A7 specifies which interferograms were utilized. For topographic phase removal, the Copernicus DEM with 30 m spatial resolution was employed. Adaptive phase filtering (Goldstein and Werner, 1998) was applied prior to unwrapping (Costantini, 1998) and masking was performed in the same manner as for Sentinel-1 processing, using thresholds of mean coherence and mean filtered correlation coefficient. As for Sentinel-1, the phase time series was derived using the same reference points and converted to vertical displacements, followed by spatial filtering (filter radius ∼ 20 km) and geocoding of the results. To further minimize remaining atmospheric effects, individual years of the time series were not analyzed separately; instead, a linear regression over a maximum of three consecutive years was used to estimate annual deformation rates (cm yr−1). In the case of Central North Slope, where a time span of four years were analyzed, the data were split into two overlapping three-year time series for trend estimation.
For the Yukon-Kuskokwim Delta, a fully connected interferometric network could only be established by including short seasonal interferograms, as end-of-season interferograms often had to be discarded due to low coherence. To avoid the inclusion of seasonal interferograms, which would introduce a seasonal displacement component and potentially amplify any bias in the estimated long-term deformation rate, a different approach was adopted for this region. Instead, August acquisitions were incorporated, and the long-term deformation component was estimated following the approach described in Liu et al. (2012). Using similarly pre-processed and spatially filtered interferograms, the displacement D between two acquisition dates t1 and t2 was modeled as:
where R is the annual deformation rate, E is the coefficient of the thaw season deformation, and DDT1 and DDT2 the DDTs at ti.
To illustrate the overall annual deformation patterns derived for all regions, maps showing the annual rates across all years are presented, including the locations of the selected reference points (Fig. A4).
4.3 Sentinel-1 γ0
Radiometrically Terrain Corrected (RTC) Sentinel-1 data generated by the Alaska Satellite Facility (ASF) was used for backscatter analyses. γ0 data with 10 m pixel spacing was utilized. Sentinel-1 γ0 data from unfrozen summer conditions in August and selected frozen winter season data (see Sect. 3.1) were averaged for each year. The difference between the mean August backscatter and the mean backscatter of the following winter, which primarily reflects soil moisture information (Widhalm et al., 2015), was further analyzed. In the case of the backscatter data, each year was treated separately in the analysis instead of being averaged over multiple years. To visualize the overall patterns, Figs. A5, A6, and A7 show the median across all investigated years.
4.4 Qualitative assessment of InSAR results
For the evaluation of Sentinel-1 thaw season deformation rate results (−αDDT), they were compared to the ABoVE thaw season deformation products (Chen et al., 2022). Because the ABoVE thaw season deformation product is expressed in absolute values, while −αDDT represents the thaw season deformation rate in mm DDT−1, these two observables are compared in a qualitative consistency assessment. This comparison highlights whether regions with higher absolute thaw season deformation in the ABoVE product correspond to higher thaw season subsidence rates in −αDDT. Spatial variations in −αDDT arising from local differences in DDT values are expected to be small when considering individual study areas of limited size, making the qualitative comparison between the two datasets justified.
Since the ABoVE products are from 2017, we compared them with our data from the same year for regions where measurements were available. Excluding pixels masked in this study, a common area is covered of about 460 km2 for the Noatak River Basin, 2400 km2 for the Central North Slope region and 1600 km2 for the Yukon-Kuskokwim Delta.
In order to assess the reliability of annual deformation rates derived from PALSAR-2 InSAR, used in this study, a comparison to annual deformations rates delineated from LiDAR DTMs (Jones et al., 2024b) was conducted. An area of 50 km2 within the Anaktuvuk River tundra fire scar (North Slope) was investigated. The fire event occurred in 2007, and DTMs are available for the years 2009, 2014, and 2021. The InSAR data covers a time period of 2015–2019. Although the time interval for the DTMs does not precisely align with that of the InSAR data, the annual deformation rate derived from the DTMs for the period 2014–2021 was still used to make an approximate comparison.
4.5 Model and InSAR uncertainties
Uncertainties of depicted data points for curve fitting are provided as error bars indicating the standard deviation across multiple results within each time-since-burn year. Additional uncertainty indicators are provided as error bars for the InSAR-derived estimates. For the thaw season deformation rate (−αDDT), the standard error of the linear regression between DDT and surface displacement was derived. For the annual deformation rates the standard deviations of the linear model with respect to the time-series input data are provided. For the Yukon-Kuskokwim region, where annual deformation rates were estimated using the DDT-based approach by Liu et al. (2012), the standard deviations of displacement residuals were calculated. In order to illustrate the uncertainty of the fitted functions, the 95 % uncertainty envelopes are provided, similarly to Cao and Furuya (2025), estimated as the predicted value ± 1.96 times the residual standard error (RSE = ), where RSS is the residual sum of squares, n is the number of observations, and p is the number of model parameters). For the regionally merged result an additional 95 % confidence interval is estimated based on a parametric bootstrap (2000 samples), defined as the 2.5th and 97.5th percentiles of the resulting predictions.
5.1 Fire scar selection
The temporal distribution of the fire events, which were selected based on homogeneity, varies across the different study regions (Fig. 3). In the Inuvik region, 25 fire scars were applicable for the final analysis, with fire events dating back to 1968. The temporal distribution of fire events shows good coverage starting from the 1980s, with the longest interval between events being 14 years, from 1968 to 1982. The maximum number of fire events used in a single year for this region was eight, occurring in 2012. In the Noatak River Basin, many available fire scars were not selected due to too heterogeneous buffer reference areas. In total, 20 fire events were selected, with 6 occurring between 1971 and 1987 and 14 between 2005 and 2020. In the Central North Slope, not many fire scars were available, resulting in the smallest number used per region in this study. In total, 12 fire scars were used, mostly from between 2003 and 2019. An additional fire scar from 1983 was available, as well as the oldest fire scar in the study, estimated to date to approximately 1930. In the Yukon-Kuskokwim Delta, the highest number of fire scars was used, totaling 43, with multiple events occurring in the same years. The oldest event in this region is dating back to 1953. The maximum data gap between events is 18 years, occurring between 1953 and 1971.
Although the fire scar values exhibit considerable variability, no correlation between standard deviation and fire scar size was found (Table A8).
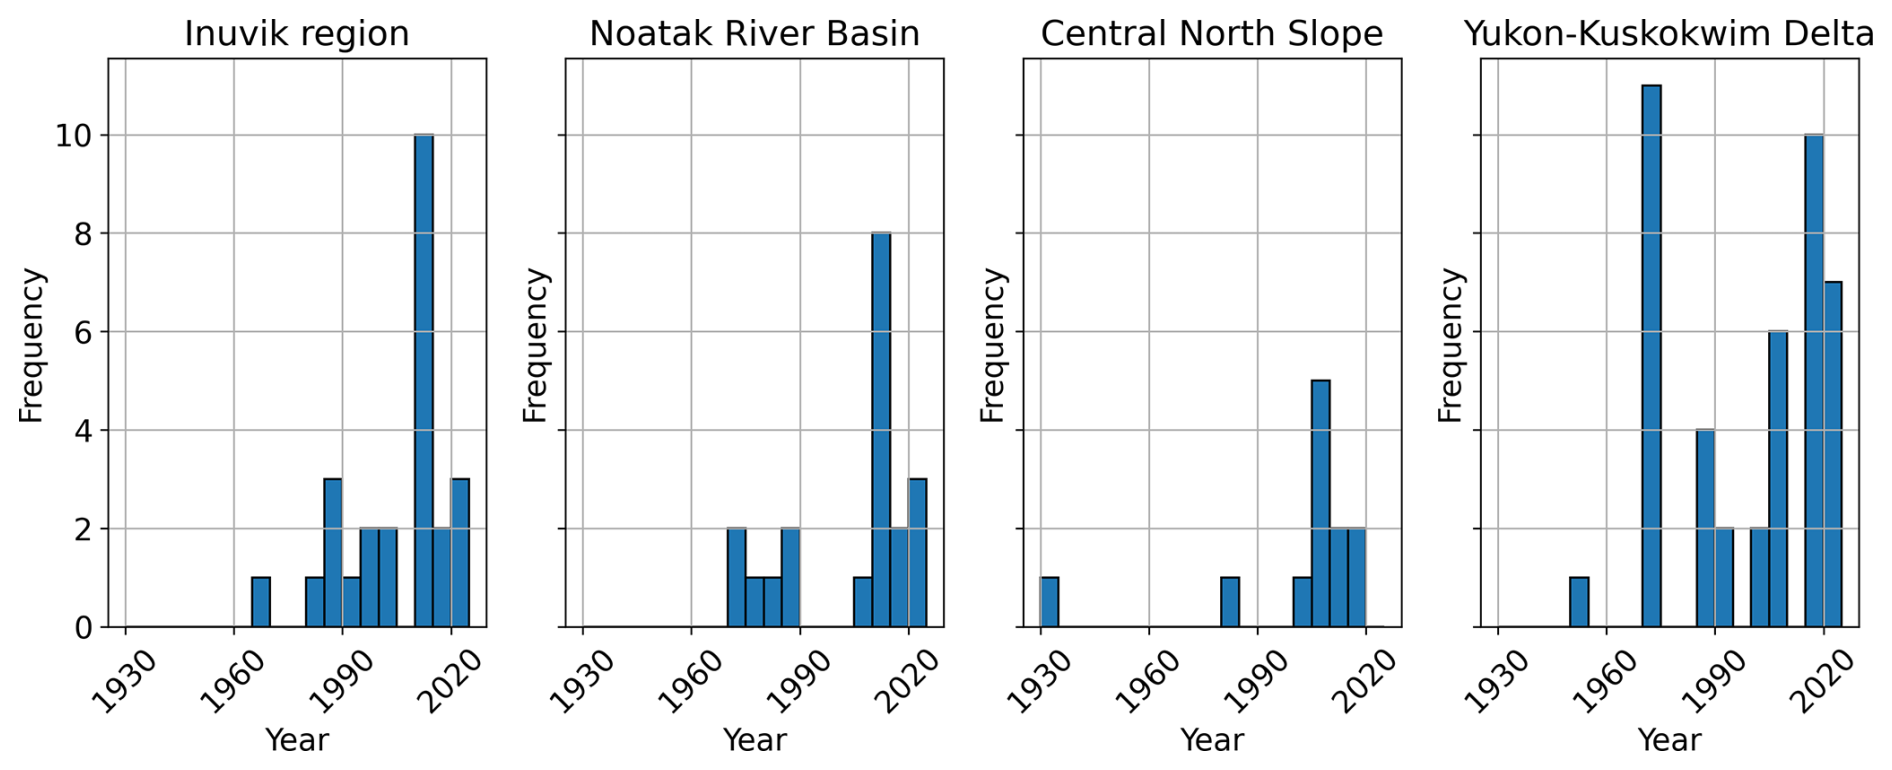
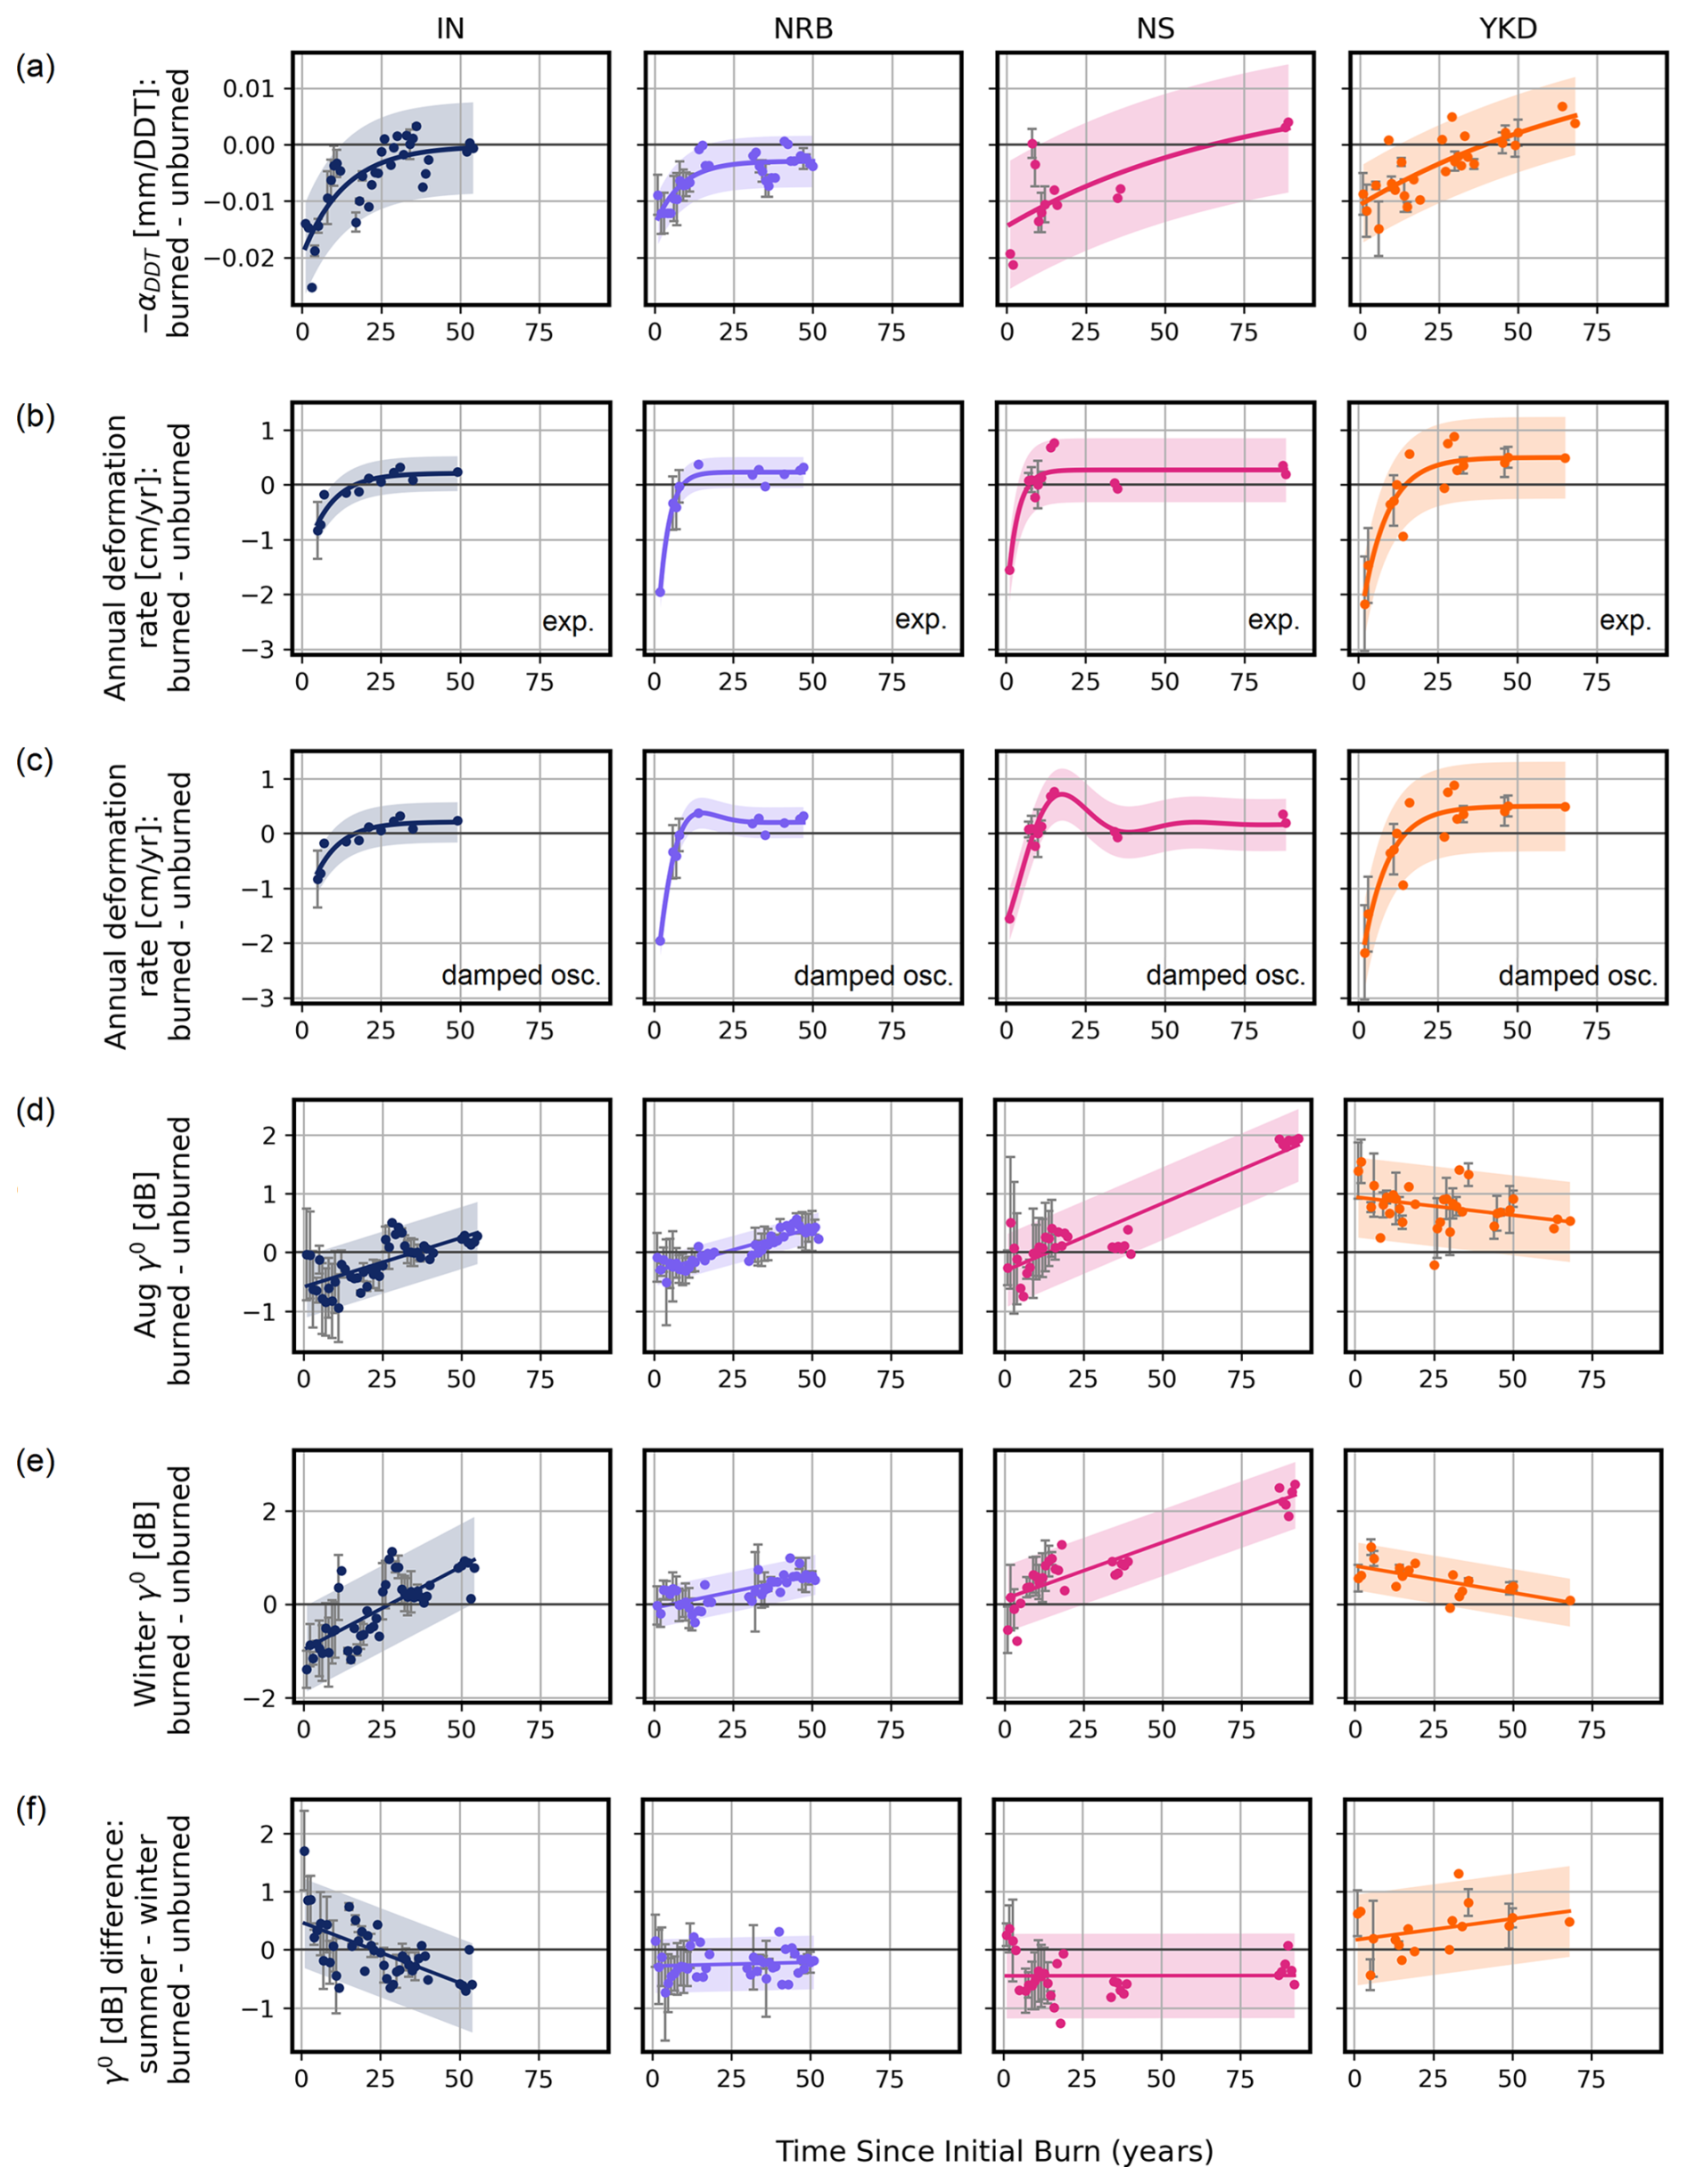
Figure 4Dependence of investigated parameters on fire scar age. Parameter values of the fire scars were normalized by subtracting the unburned buffer area values and averaged per year and study region (NRB: Noatak River Basin, NS: Central North Slope, YKD: Yukon-Kuskokwim Delta). The shaded regions represent the 95 % uncertainty envelope of the fitted models estimated as the predicted value ± 1.96 times the residual standard error. The error bars represent the standard deviation across all fire scars within each time-since-burn year and are therefore shown only for time-since-burn years for which multiple fire scars are available. Both exponential (Michaelides et al., 2019) (shown in b) and damped oscillation models (Cao and Furuya, 2025) (shown in c) were tested to describe the annual deformation rates (for functions see Table A9).
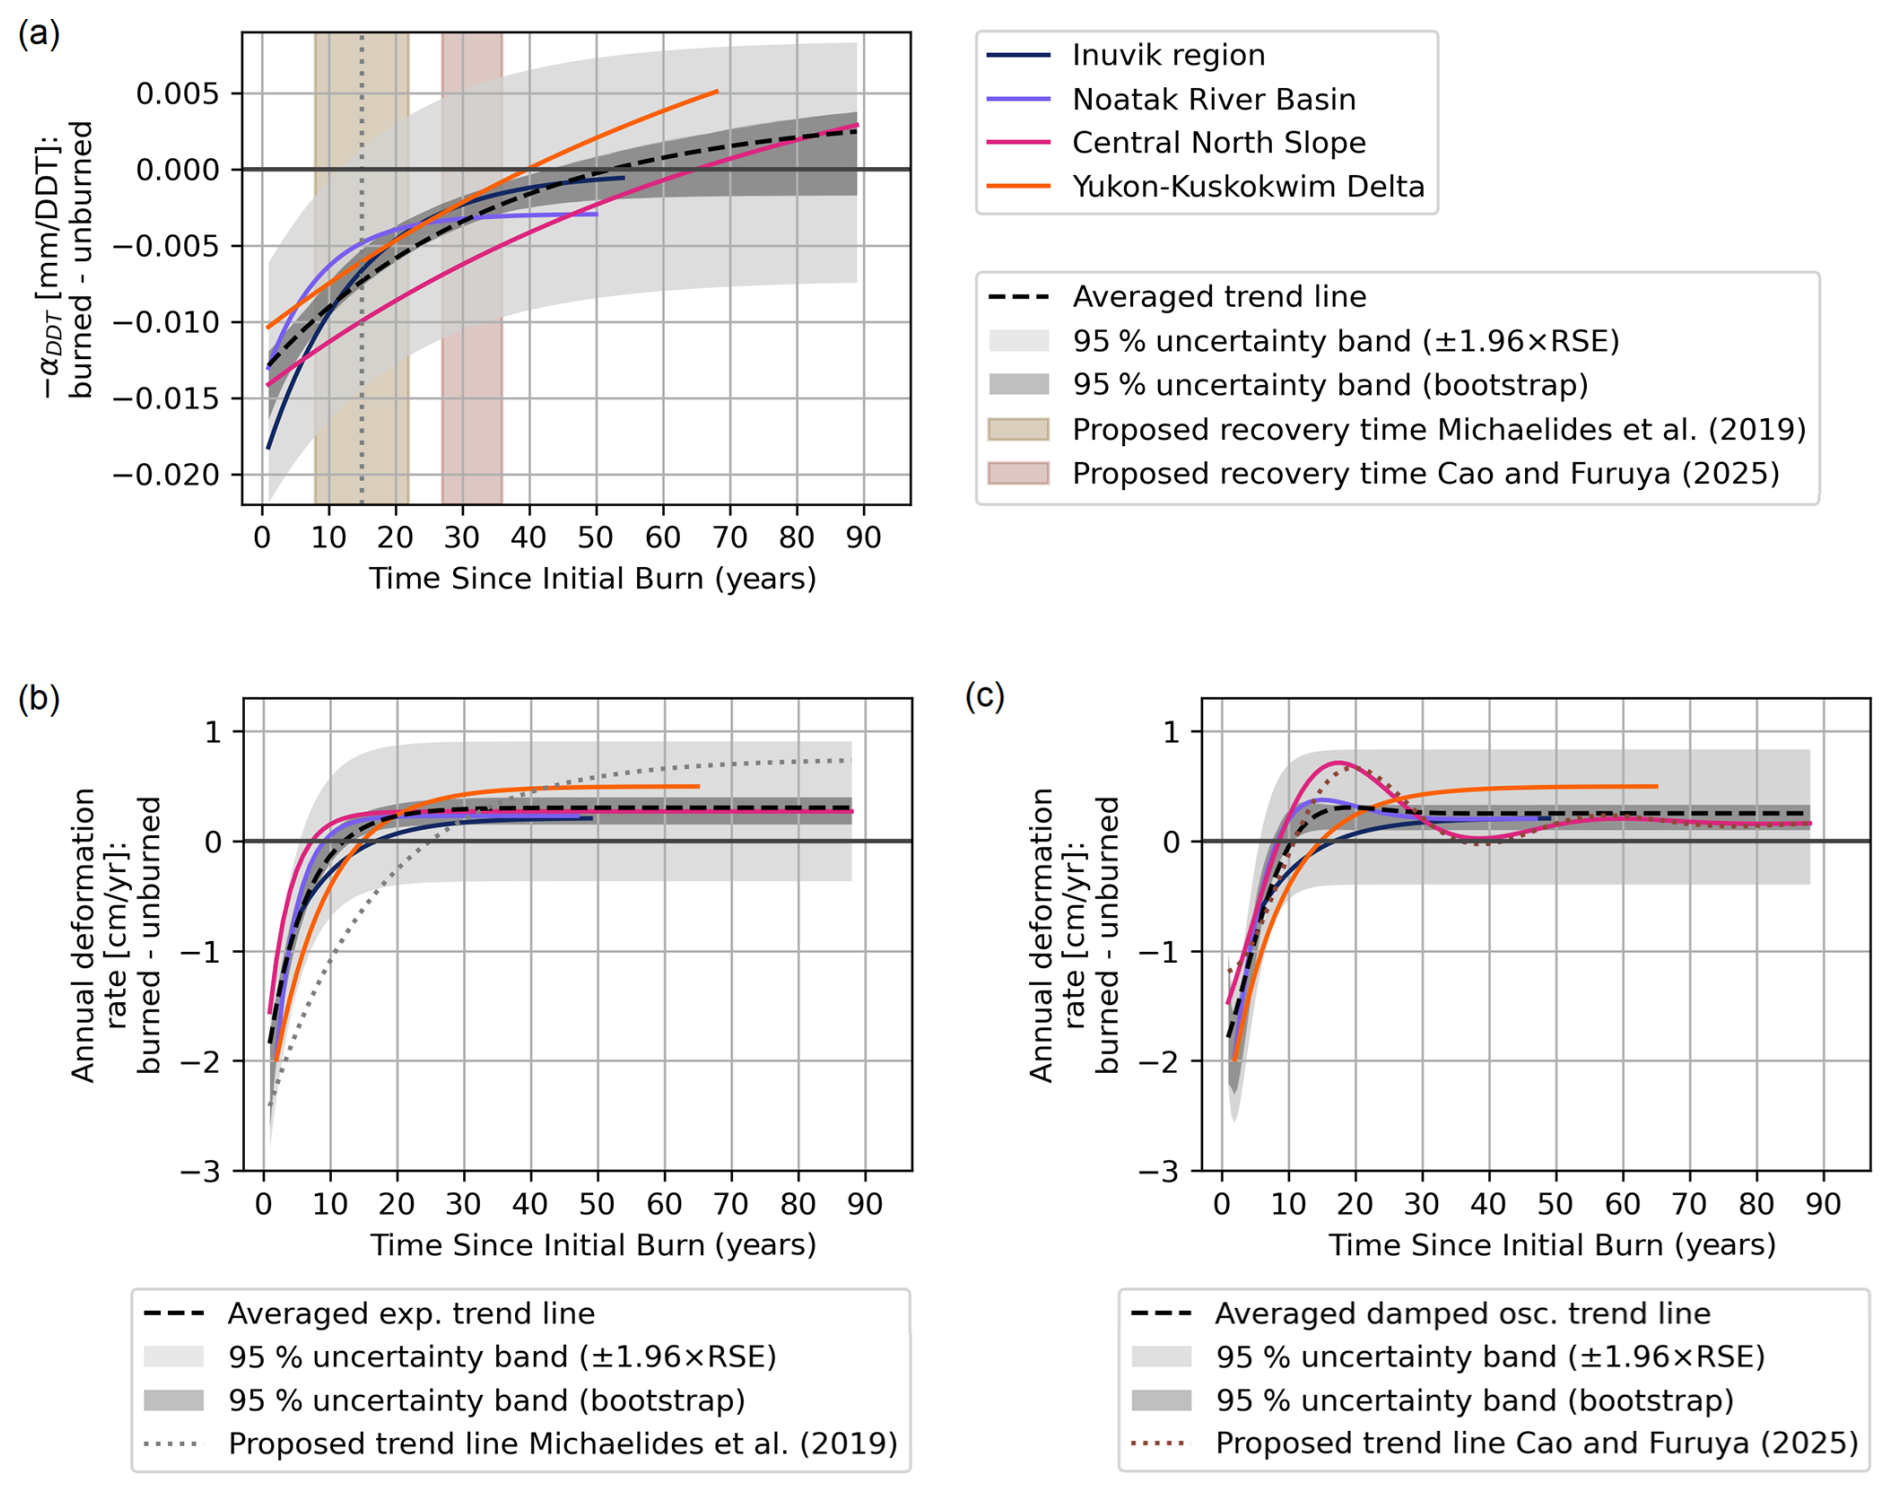
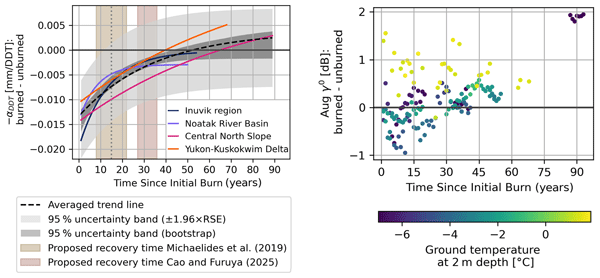
Figure 5Regionally merged representation of Fig. 4a, b and c representing the analyzed parameters as a function of fire scar age: (a) −αDDT and fitted exponential functions, (b) annual deformation rate and fitted exponential functions (c) annual deformation rate and fitted damped oscillation functions. Two alternative 95 % uncertainty bands are shown for comparison: (1) the light grey band shows the interval estimated as the predicted value ± 1.96 times the residual standard error, based on all regional data points shown in Fig. 4; (2) the dark grey band was computed using a parametric bootstrap (2000 samples) based on all regional data points shown in Fig. 4, and defined as the 2.5th and 97.5th percentiles of the resulting predictions. The vertical bands in (a) indicate the proposed recovery time of the thaw season deformation according to Fig. 7 in Michaelides et al. (2019) and Cao and Furuya (2025). Dotted lines (b) and (c) represent the functions suggested by Michaelides et al. (2019) and Cao and Furuya (2025) for annual deformation rates. Average and literature-based annual deformation rate functions are listed in Table A9.
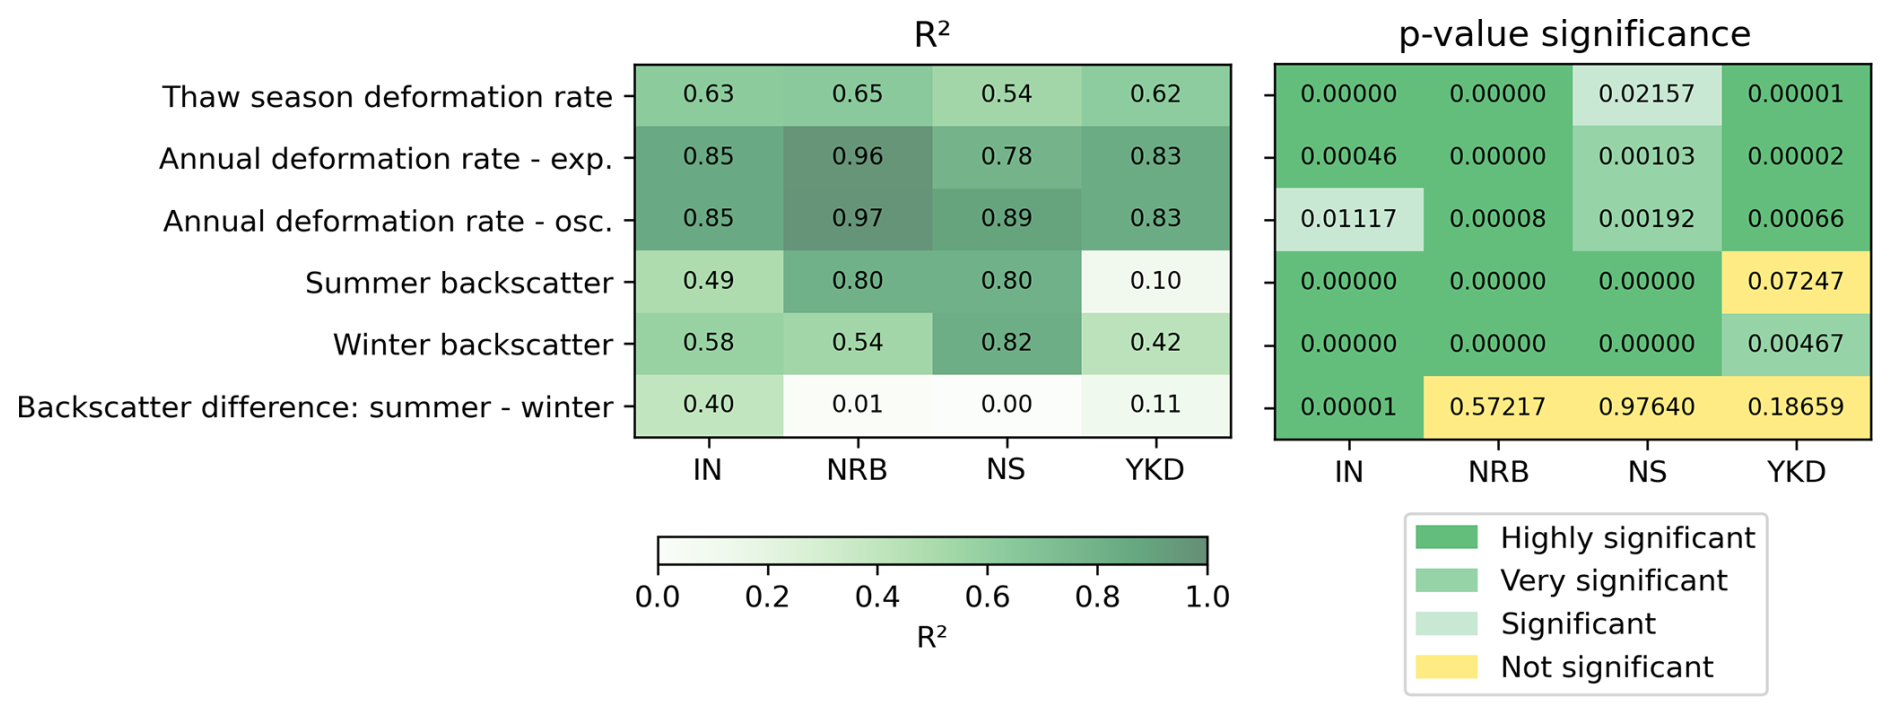
Figure 6R2 and p-values, reflecting model fit and statistical significance, of fitted functions relating fire scar age to the analyzed parameters (see Figs. 4 and 5) for study regions IN: Inuvik region, NRB: Noatak River Basin, NS: Central North Slope, YKD: Yukon-Kuskokwim Delta. For the annual deformation rate both an exponential function and a damped oscillation function were tested. Significance categories are defined as follows: p<0.001 (highly significant), p<0.01 (very significant), p<0.05 (significant), p≥0.05 (not significant).
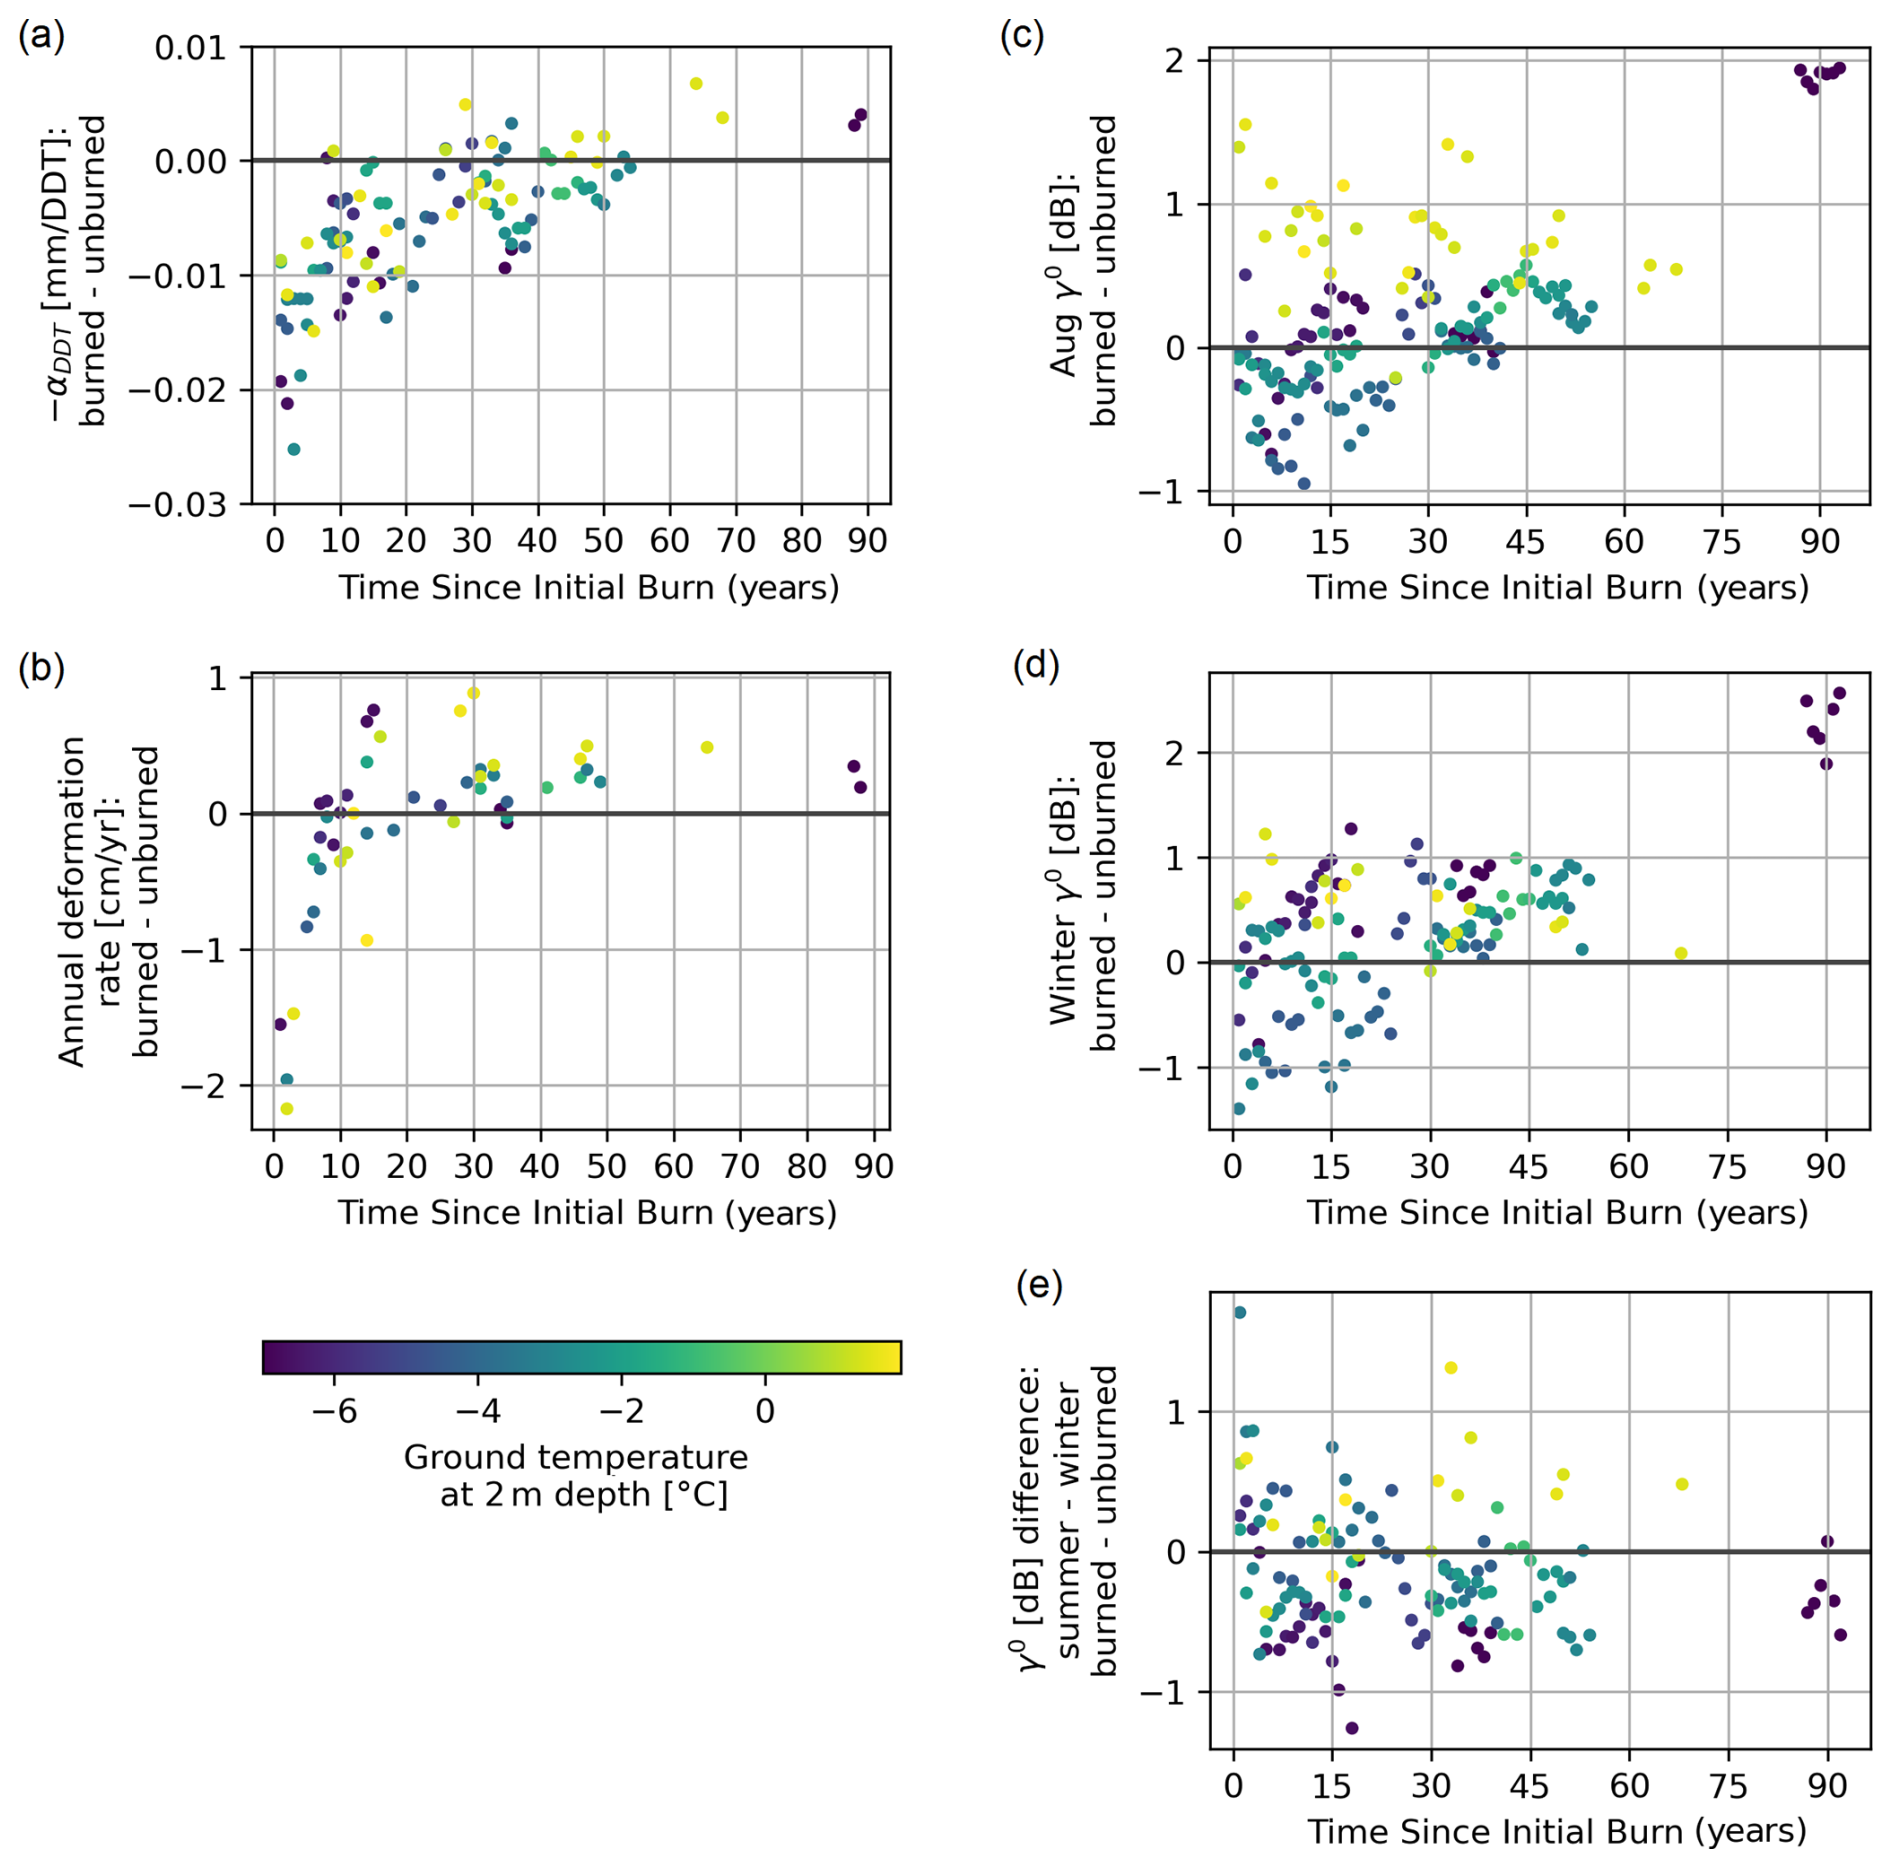
Figure 7Scatterplots of the investigated parameters against fire scar age across all study regions. Values of the fire scars were normalized by subtracting the unburned buffer area values and averaged per year and study region. Each subplot displays a different parameter, with point color indicating ground temperature at 2 m depth (Westermann et al., 2024).
5.1.1 Sentinel-1 thaw season deformation rate, −αDDT
In all study areas, the −αDDT values within the fire scars are initially more negative than in the unburned surrounding regions after a fire event, suggesting increased thaw season subsidence within the fire scars following the fire (Figs. 4a, 5a and A8a). −αDDT values are initially higher in magnitude by approximately 0.01 to 0.015 mm DDT−1 on average. This effect decreases over time, following a region-specific pattern that is almost linear in some areas and exponential in others. For the Central North Slope and the Yukon-Kuskokwim Delta, which feature the oldest investigated fire scars, the temporal decrease is nearly linear, eventually resulting in subsidence values within the scars that are lower than those of the surrounding regions. Values comparable to those of the surrounding areas are reached approximately 40 years following the fire event in the Yukon-Kuskokwim Delta and after approximately 65 years in the Central North Slope. For the Inuvik region, the temporal trend decreases exponentially toward zero, reaching values similar to the surrounding unburned regions after more than 50 years, while in the Noatak River Basin, the values do not reach levels comparable to the surrounding in the same period of time. For the average across all regions, the trend is slightly exponential, with values approaching those of the surrounding regions after approximately 50 years.
The uncertainty band in the Central North Slope exhibits the largest spread (Figs. 4a and A8a), with the lowest R2 values for the fitted function (0.54, see Fig. 6). All other regions display higher R2 values (>0.6), with highly significant fits (p-values < 0.001, Fig. 6).
The investigation of −αDDT values in relation to fire scar age and ground temperatures at a depth of 2 m does not reveal a clear dependency (Fig. 7a). However, the colder regions, the Central North Slope (∼ −6.5 °C), Inuvik region (∼ −3.9 °C) and Noatak River Basin (∼ −2.4 °C), exhibit a slower approach toward surrounding values, compared to the warmest region Yukon-Kuskokwim Delta (∼ 1.3 °C, Fig. 5a).
5.1.2 PALSAR-2 annual deformation rate
Investigating the behavior of annual deformations rates after fire events reveals that initial annual subsidence rate values are on average approximately 1.8 cm yr−1 higher than those of the surrounding unburned areas (Fig. 5b, c). The high annual subsidence rate values for young fire scars decrease more rapidly in the initial years following the event, aligning with unburned surrounding values on average after about 10 to 12 years (Fig. 5b, c). After this point, the values typically start to exhibit heave relative to the surrounding areas, with the magnitude of the heave varying depending on the study region.
The Yukon-Kuskokwim Delta shows on average slightly larger relative heave values for older scars compared to their surroundings (Figs. 4b, c, 5b, c and A8b, c). The exponential function in this region, and similarly in other regions, shows deviations from the function reported by Michaelides et al. (2019) for the Yukon-Kuskokwim Delta (Fig. 5b). In all regions, the fitted exponential models in our study exhibit larger decay constants, reflecting a shorter recovery timescale, than reported by Michaelides et al. (2019). When applying a damped oscillation model, as done by Cao and Furuya (2025), no damping of the long-term relative heave values in the Yukon-Kuskokwim Delta can be observed (Figs. 4c, 5c and and A8c). The Central North Slope and Noatak River Basin show very similar patterns when using the exponential fit (Fig. 5b). For the damped oscillation fit, the Central North Slope region closely resembles the function proposed by Cao and Furuya (2025), with a damping of relative heave values until ∼ 40 years to near zero, followed by a small subsequent heave (Fig. 5c). For the Inuvik region, the exponential fit is more appropriate and yields higher significance than the damped oscillation fit (Fig. 6). Following the initial increased annual subsidence rate values, the Inuvik region takes the longest to align with the surrounding areas, requiring about 17 years (Fig. 5b, c), which is only slightly longer than for the Yukon-Kuskokwim Delta (about 15 years). In the long term, all these regions maintain relative heave values compared to their surroundings. All regions exhibit high R2 values for the fits, both for the exponential and the oscillation functions, and are statistically significant (p-values ≥ 0.05, see Fig. 6). Overall, the two models produce very similar results in most regions, with results mostly falling within each other's uncertainty ranges, indicating limited distinguishability between the exponential and damped oscillator models in most regions and suggesting that both models have comparable predictive ability.
When considering ground temperatures at a depth of 2 m, no clear dependency of annual deformation rates on ground temperature could be discerned (Fig. 7b); however, the warmest region, the Yukon-Kuskokwim Delta, shows on average slightly larger deviations from the surrounding reference areas for older fire scars than colder regions (Fig. 5b, c).
5.2 Sentinel-1 summer backscatter
The investigation of August backscatter revealed consistent, highly significant trends across the regions of Inuvik, Central North Slope, and Noatak River Basin (Figs. 4d and 6). Younger fire scars displayed lower backscatter values, with reductions of, on average, 0.5 dB or less compared to their surroundings (Fig. 4d). Over time, the backscatter intensity increases, eventually exceeding the surrounding values after approximately 15 to 35 years. The Yukon-Kuskokwim Delta exhibits contrasting behavior compared to these regions (Fig. 4d), however the fitted linear function is not statistically significant (p-values > 0.05, Fig. 6). Backscatter values of fire scars are here consistently higher than those of the surrounding reference areas, decreasing over time (Fig. 4d).
When considering the corresponding ground temperatures (within fire scars only, difference to surroundings on average 0.02 °C, with 0.33 °C SD), a clear difference between colder and warmer regions becomes evident (Fig. 7c). While the three colder regions, all below −2 °C, initially exhibit lower backscatter values for fire scars compared to the surrounding areas, followed by a gradual reversal, the warmer Yukon-Kuskokwim Delta region tends to show higher backscatter values within the fire scars, especially for younger fire scars (Fig. 4d). The prevailing backscatter level of the surrounding region does not appear to influence the direction of the trends, as Yukon-Kuskokwim Delta values differ only minimally from those of the colder Noatak River Basin and Central North Slope, whereas the Inuvik region, the second coldest study region, exhibits surrounding backscatter values more than 1 dB higher than the other regions (Fig. A5).
5.3 Sentinel-1 winter backscatter
The direction of the winter backscatter trends (Fig. 4e) is mostly consistent with the summer trends (Fig. 4d), although the trend lines for the Inuvik region, Noatak River Basin, and Central North Slope are less closely aligned compared to the August data. Initial differences are greater for Inuvik in winter than in summer, while the opposite is observed for the average values of the other two regions, where initial values inside and outside the burn area closely resemble each other on average. Nonetheless, backscatter values increase over time in all three areas, with values surpassing the reference values for the Inuvik region at an earlier time compared to the summer data. The trend observed in the Yukon-Kuskokwim Delta resembles that of the summer data, however, the values decrease more rapidly over time in winter than in summer.
The separation between warmer and colder regions appears less apparent in the winter data compared to the August data, with overlapping values (Fig. 7d). Nevertheless, it remains evident that initial lower winter backscatter relative to surrounding reference values is observed only in regions with temperatures below −2 °C for younger fire scars, whereas the warmer region exhibits higher winter backscatter than their surroundings throughout the entire investigated period. Similar to the summer backscatter data, the trend directions appear to be independent of the surrounding backscatter level, as the warmest region, the Yukon-Kuskokwim Delta shows winter backscatter values that more closely resemble those of the colder Noatak River Basin and Central North Slope, whereas the second-coldest region, Inuvik, exhibits notably higher winter backscatter values (Fig. A6).
5.4 Sentinel-1 backscatter summer − winter difference
The investigation of the summer-minus-winter backscatter difference reveals distinct patterns across different regions (Fig. 4f). For the Central North Slope and the Noatak River Basin, the rates of change in summer and winter backscatter over time are approximately similar, with August backscatter initially showing larger deviations from the reference areas (Fig. 4d, e). No significant trend over time can be observed here (Fig. 6).
For the Inuvik region, August backscatter initially exhibits smaller differences, but the rate of change in winter backscatter differences is faster than that of August (Fig. 4d, e). Similarly, in the Yukon-Kuskokwim Delta, winter backscatter changes faster over time, though it shows less deviation from the reference areas compared to summer backscatter.
When considering ground temperatures, particularly for older fire scars, a difference is observed between the warmest region, the Yukon-Kuskokwim Delta, and the coldest region, the Central North Slope (Figs. 7e and 4f). In the Yukon-Kuskokwim Delta, winter backscatter especially for slightly older fire scars is closer to the reference areas, whereas in the Central North Slope, the opposite pattern is evident (Fig. 4d, e).
5.5 Qualitative consistency check of InSAR thaw season deformation rate patterns
The assessment of the comparison between Sentinel-1 derived thaw season deformation rates of the thawing season 2017 and the ABoVE thaw season subsidence products shows a linear trend visible in the value distributions for ranges with sufficient sample sizes (Fig. 8). Although the ABoVE product represents absolute thaw season subsidence and −αDDT expresses the thaw season deformation rate in the DDT domain, the comparison shows that larger absolute ABoVE thaw season subsidence values correspond to more negative −αDDT values, indicating higher subsidence rates. This relationship is consistent within each study region where sufficient sample sizes are available and provides a qualitative indication of consistency between the two deformation metrics.
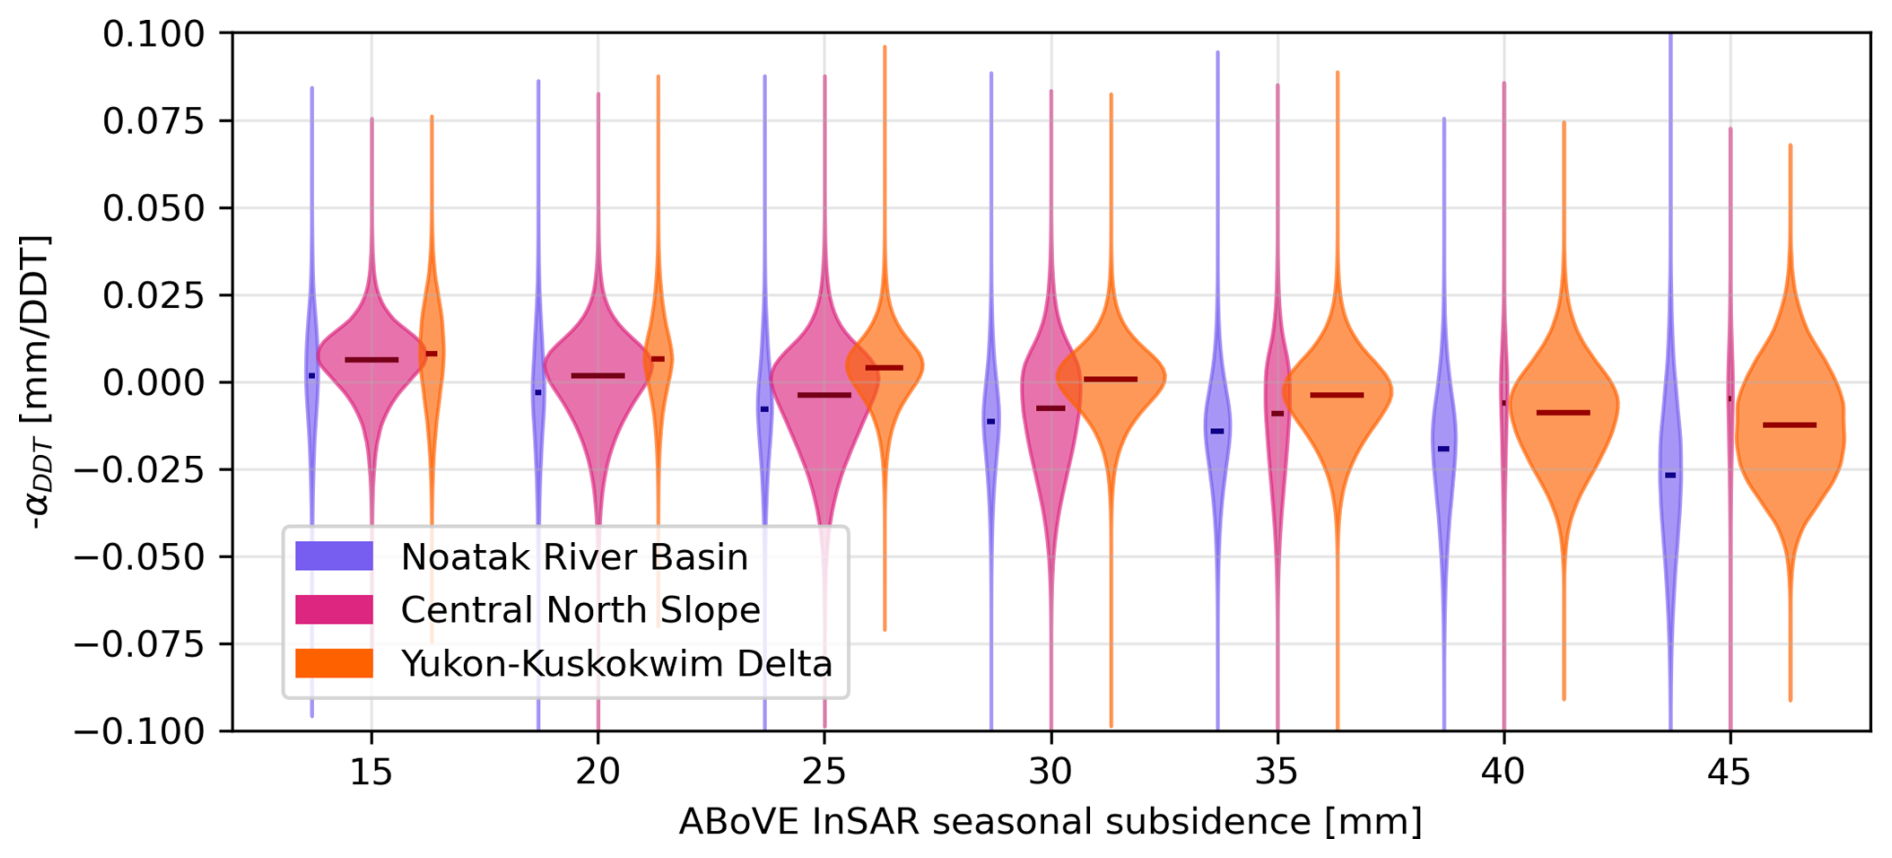
Figure 8Sentinel-1 thaw season deformation rate (−αDDT) statistics (violin plot) of the 2017 thawing season by thaw season deformation bins (bin size 5 mm) of the ABoVE (Arctic-Boreal Vulnerability Experiment) InSAR L-band thaw season subsidence product of 2017 (Chen et al., 2022). Median values are shown as vertical lines; violin widths reflect the sample size.
5.6 Qualitative assessment of InSAR annual deformation rate results
To assess the spatial consistency of the long-term annual deformation rate results from PALSAR-2 InSAR, we compared them with deformation estimates derived from LiDAR DTMs (Jones et al., 2024b). Although the DTM data (2009, 2014, 2021) and InSAR time range (2015–2019) do not perfectly overlap, the annual deformation rate from 2014–2021 was used for an approximate comparison. An analysis of the histograms of the annual deformation rates (Fig. 10a) indicates an approximate alignment of median values (0.4 cm yr−1 heave for InSAR results and 0.2 cm yr−1 heave for DTM-derived results). The larger spread of deformation values derived from the LiDAR DTM may result from systematic differences between the InSAR and the ΔDTM approach, rather than from the DTM’s higher spatial resolution, as the data were downsampled to the same resolution for this comparison. On the other hand, the mean values of annual deformation rates for the time period closer to the fire event show subsidence rate values of 2.8 cm yr−1 (Fig. 10a dashed line). Moreover, the spatial distribution of pronounced annual subsidence rates observed in the DTMs in parts aligns with annual subsidence rate patterns derived from PALSAR-2, as illustrated in Fig. 9. This similarity in spatial patterns is also reflected in a linear trend visible in the comparison of the value distributions (Fig. 10b). However, a quantitative comparison reveals systematic differences between the two datasets. An additive bias is indicated by the regression intercept of 0.35 cm yr−1, while the regression slope of 0.10, which deviates substantially from the 1:1 line, indicates a conditional bias between the LiDAR-derived and InSAR-derived annual deformation rates. A Bland–Altman analysis (Fig. 10c) further assesses the agreement between the two datasets, revealing a mean bias of −0.25 cm yr−1 and 95 % limits of agreement ranging from −2.07 to +1.57 cm yr−1, with most pixels falling within these limits. however, a proportional bias is evident, with differences increasing systematically for pixels with larger deformation rates.
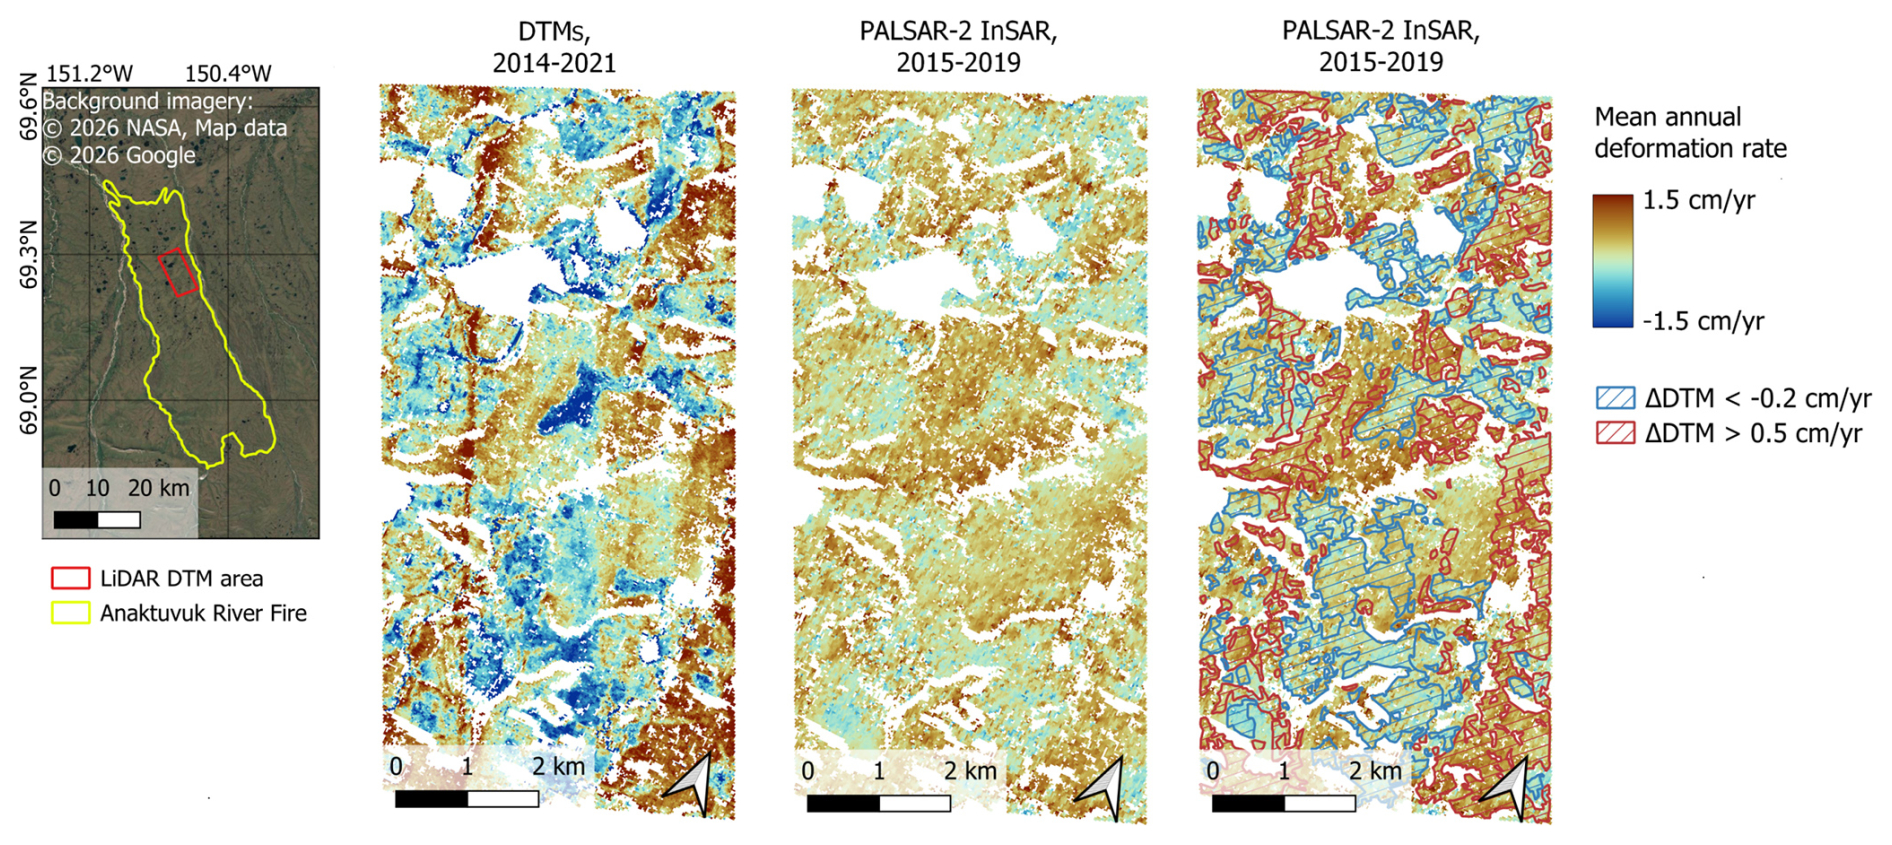
Figure 9Comparison of annual deformation rate maps derived from PALSAR-2 InSAR data (2015–2019) and downsampled LiDAR DTMs (Jones et al., 2024b) (2014–2021) for a 50 km2 area within the Anaktuvuk River tundra fire scar (fire event 2007). The left panel shows the extent of the Anaktuvuk River fire scar and the location of the LiDAR DTM analysis area, which is displayed in the annual deformation rate maps on the right. (Background imagery of left panel: © 2026 NASA, Map data © 2026 Google Satellite).
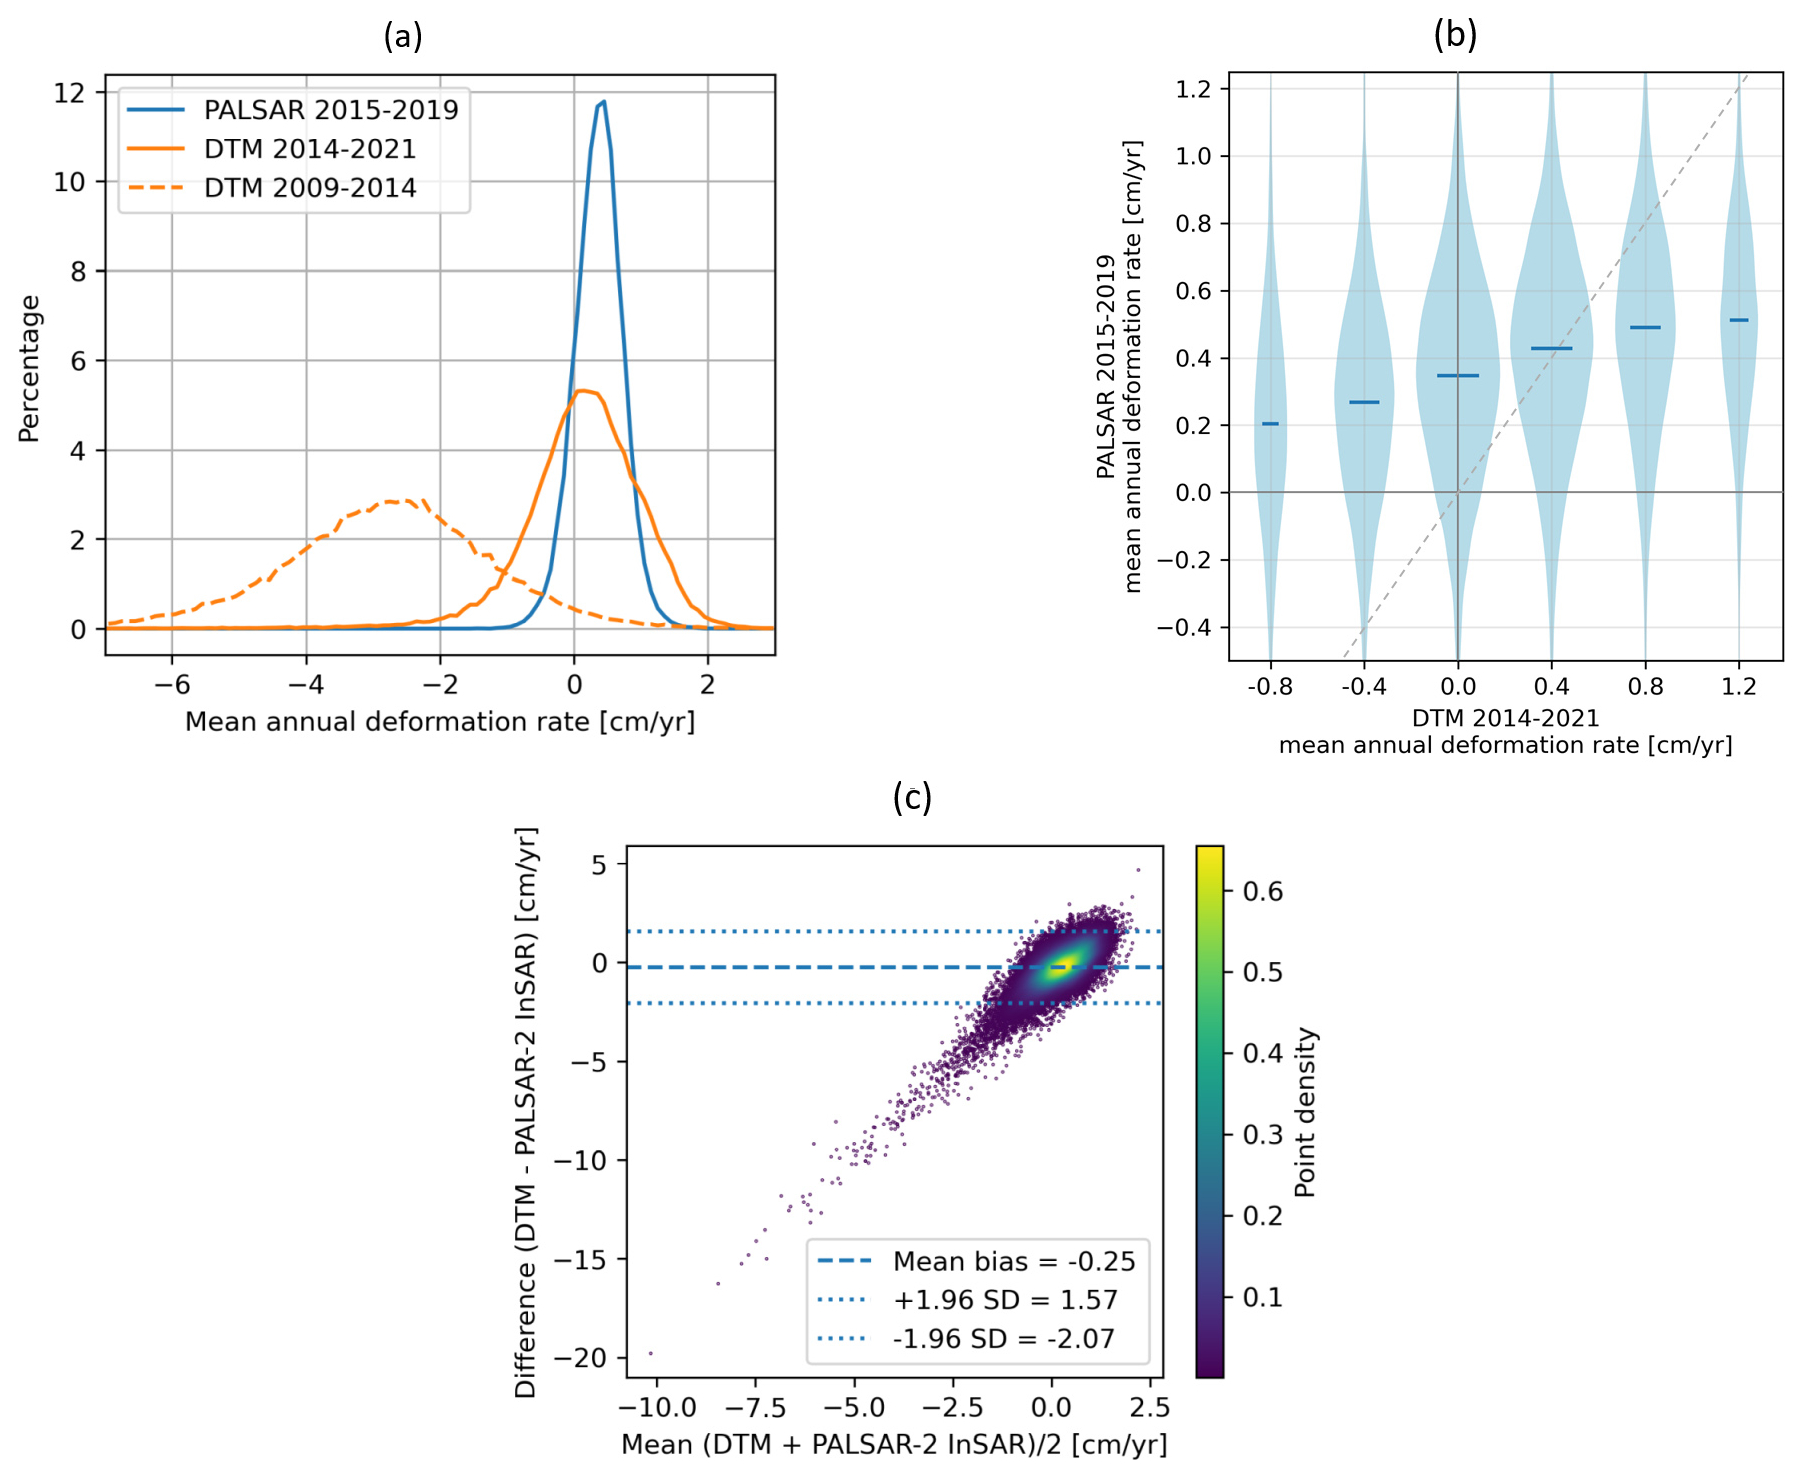
Figure 10Anaktuvuk River tundra fire scar (fire event 2007) assessment: (a) Histograms of annual deformation rate from PALSAR-2 InSAR for the period 2015–2019, and annual deformation rate values derived from downsampled LiDAR DTMs (Jones et al., 2024b) for the periods 2009–2014 and 2014–2021 for a 50 km2 area within the fire scar. The histograms use a bin size of 0.1 cm yr−1. (b) Annual deformation rate from PALSAR-2 InSAR for the period 2015–2019 statistics (violin plot) by annual deformation rate bins (bin size 0.4 cm yr−1) derived from downsampled LiDAR DTMs (Jones et al., 2024b) for the periods 2014–2021. Median values are shown as vertical lines; violin widths reflect the sample size. (c) Bland-Altman plot of annual deformation rates from PALSAR-2 InSAR (2015–2019) and downsampled LiDAR DTMs (Jones et al., 2024b) (2014–2021). The dashed line indicates the mean bias (−0.25 cm yr−1) and the dotted lines indicate the 95 % limits of agreement (−2.07 to +1.57 cm yr−1). The color indicates the point density.
6.1 Sources of uncertainty and limitations
For the interpretation of the space-for-time analysis results, it is important to consider that the temporal coverage and the number of selected fires vary across the studied regions (Fig. 3), which affects the quality of the derived trends. The Inuvik, Yukon-Kuskokwim Delta, and Noatak River Basin regions had an adequate temporal distribution and a sufficient number of usable fire scars, encompassing both younger and older scars. The Central North Slope, while containing the fewest investigated scars and being primarily characterized by younger ones, also included the oldest fire scar observed in this study.
Including both large fire scars, which may span different site-specific characteristics, as well as small scars, could introduce additional uncertainty to the results. The dependency of the standard deviation values of the investigated parameters on fire scar size was examined after binning the fire scar sizes into 50 km2 increments and using median standard deviations to account for the bias toward smaller size ranges. While winter backscatter exhibited comparatively higher R2 values (0.33, Table A8), the standard deviation values of the investigated parameters generally showed little dependency on fire scar size, although the standard deviations themselves remained non-negligible.
Furthermore, the reliability of our InSAR results must be considered. We assessed this by comparing thaw season deformation rate results (−αDDT) to ABoVE InSAR L-band thaw season subsidence products (Fig. 8), providing a qualitative consistency check of deformation patterns, with the observed linear trends in the value distributions supporting the overall consistency of the results. While the values of the distributions for a given range vary across regions, potentially as a result of DDT normalization or spatial filtering, this does not affect our analysis, as we consider relative differences between fire scars and their surrounding areas. The qualitative consistency of annual deformation rates was assessed by comparing our InSAR results with LiDAR-derived ΔDTMs, demonstrating similar median values and broad correspondence in spatial deformation patterns (Figs. 9 and 10). However, systematic biases between the datasets were identified, which may be attributed to the different observation periods covered and fundamental differences in measuring principles between the two approaches. In addition, the use of an unburned reference area helps to mitigate localized effects such as uncorrected atmospheric or ionospheric disturbances, as well as errors resulting from poorly selected reference points. Furthermore, the spatial filtering applied to the InSAR results reduces not only large-scale atmospheric and ionospheric artifacts but also removes deformation signals with spatial scales larger than the filter radius. This filtering centers the mean deformation around zero (Bartsch et al., 2026). In this context, the use of unburned reference areas allows the interpretation to focus on deformation within the fire scars relative to their undisturbed surroundings, rather than on potentially biased absolute values. This relative approach also helps to account for interannual fluctuations, since deformation trends in the burn scars are evaluated against prevailing conditions in the unburned surroundings, making the inferred trends more robust to annual regional variations. Additionally, for InSAR data, the seasonal median and the annual rate were computed over a maximum of three years to reduce atmospheric and ionospheric effects. Furthermore, although the coarse resolution of ERA5 air temperature data may introduce some uncertainties, its application for deriving −αDDT values has been demonstrated to be suitable in a previous study (Widhalm et al., 2025).
Furthermore, uncertainties of the fitted functions and observations need to be considered. The uncertainty band based on the residual standard error represents the scatter of the observed data around the fitted function and reflects the variability among individual observations. Consequently, the broad uncertainty bands indicate that recovery times of individual fire scars may deviate from the recovery time inferred from the fitted function. In contrast, the bootstrap confidence interval reflects the uncertainty of the fitted recovery function itself.
The error bars representing the standard deviation across all fire scars within each time-since-burn year (Fig. 4) illustrate the variability in deformation rates among individual fire scars within the same region. The InSAR-specific error bars (Fig. A8) represent the uncertainty of the individual InSAR-derived deformation estimates arising from the respective estimation procedures and illustrate the confidence associated with the estimated deformation rates.
6.2 Thaw season deformation rate, −αDDT
The analysis of thaw season subsidence rates (Figs. 4a and 5a) revealed that, as expected, younger fire scars exhibit higher subsidence values. Thaw seasonal subsidence rates gradually decreased over time, with different regions displaying varying fire responses, some areas displaying a more linear trend and others a more exponential trajectory. Nevertheless, when averaged across all regions, thaw season subsidence rate values progressively converged toward those of the surrounding unburned reference areas, reaching alignment after approximately 50 years (Fig. 5a). The 95 % bootstrap confidence interval, incorporating all data points, suggests that alignment may occur as early as 43 years post-fire, whereas no alignment with the reference level is reached within the observed time period for the lower bound of the interval. The 95 % uncertainty band based on the residual standard error, representing the variability of the observed data around the fitted function, suggests that alignment with the reference level could occur as early as 12 years post-fire.
These findings differ from previous results on thaw season subsidence (Michaelides et al., 2019; Cao and Furuya, 2025) based on the bootstrap confidence interval. However, the residual standard error based uncertainty band encompasses the recovery times reported by previous studies. The larger number of fire scars investigated in our study across all regions may also contribute to the broader uncertainty range observed here. Although these studies investigated thaw season subsidence rather than the thaw season deformation rate (−αDDT) used in our study, comparing the recovery time remains valid because both quantities are expected to correspond to the same recovery timescale, as absolute thaw season deformation is inherently reflected in the thaw season deformation rates. In particular, Michaelides et al. (2019) reported in Fig. 7 that thaw season subsidence in the Yukon-Kuskokwim Delta returned to pre-fire conditions after approximately 15 ± 7 years (Fig. 5a). This delineated value greatly depends on the pre-fire thaw season subsidence assumed by Michaelides et al. (2019). Contrary to Michaelides et al. (2019), our study establishes the difference from undisturbed conditions by incorporating an unburned reference area, which allows for the comparison of reference regions under the same recording conditions, while also accounting for processing inaccuracies related to shifts in the value range. Furthermore unlike Michaelides et al. (2019), our study did not exclude the contributions of annual effects resulting from “permafrost layer thinning” due to melting of excess ground ice from our thaw season −αDDT product, which may account for discrepancies, particularly if increased annual deformation rates persist over a longer time period and contribute to the observed −αDDT values. However, the overall annual deformation rates observed in our PALSAR data (Fig. 5b and c) suggest increased permafrost layer thinning over a period shorter than the observed thaw season results. In this case, equilibrium is reached on average after approximately 10 years.
The recovery time of thaw season subsidence was indicated at approximately 27 to 36 years in Cao and Furuya (2025) for an Arctic-boreal region in North Yukon. This time span is longer than suggested by Michaelides et al. (2019), yet still shorter than what we observed in our study regions (Fig. 5a).
Clayton et al. (2025) also investigated thaw season subsidence using a space-for-time approach in the Yukon-Kuskokwim Delta. Similar to our methodology, they employed buffer zones as unburned reference areas. Their results showed that fire scars reached equilibrium with reference areas after 29 years, which is similar to the results of Cao and Furuya (2025) in North Yukon. Clayton et al. (2025) employed a linear fit, which our data likewise indicate to be appropriate for the same region. In our analysis, equilibrium is reached approximately 10 years later for this region (Fig. 5a). However, the coefficient of determination indicated by Clayton et al. (2025) (R2=0.045) was substantially lower than the value we obtained for the same region (R2=0.62, Fig. 6).
In Wig et al. (2025), hardly any difference in ALT and thaw season subsidence was observed between burned and unburned areas across regions of the North American Arctic-Boreal zone. However, this study relied on a more simplified approach, not accounting for fire year or regional differences.
As reported in other studies (Holloway et al., 2020), the increase in ALT typically peaks within 5 to 10 years. Nevertheless, the observed prolonged influence on −αDDT values (Fig. 5a) suggests that factors other than ALT may contribute to these thaw season results. In Widhalm et al. (2025), a connection between −αDDT values and soil moisture was demonstrated. This relationship indicates that within fire scars, higher soil moisture levels within the active layer may persist for a longer period than what has been reported for ALT effects. Clayton et al. (2025) reported increased soil moisture for burned areas in the Yukon-Kuskokwim Delta even after 46 years. Increased postfire soil moisture can be attributed to changes soil properties, thawing of the upper transition zone and a reduction in evapotranspiration (Liljedahl et al., 2007). Clayton et al. (2025) found that the greatest changes in soil moisture occurred near the surface. The influence of near surface soil moisture can also be inferred from the difference between summer and winter backscatter values (Fig. 4f). However, a direct relationship for the time period indicated by the −αDDT values (Figs. 4a and 5a) cannot be derived from the backscatter data.
A possible reason for prolonged increase in soil moisture might be an enhancement of roughness which leads to the trapping of blowing snow, which has been reported to linger 20 d longer in areas with degraded ice wedges on the Seward Peninsula, Alaska (Jones et al., 2021). As a result, wetter conditions develop in depressions, which subsequently also affect −αDDT. Whether these wetter conditions persist throughout the thawing season or are confined to the immediate post-snowmelt period remains to be confirmed by in situ measurements.
Ground temperatures within fire scars and their unburned surroundings showed no substantial differences (mean difference: 0.02 °C), indicating that the CCI ground temperature values used in our comparisons are unaffected by fire. Furthermore, comparisons with ground temperatures revealed no clear influence on the thaw season deformation rate results (Fig. 7a). However, when analyzing the trends of thaw season deformation rates per study region (Fig. 5a) in relation to their prevailing ground temperatures, it can be noted that fire scars in colder regions require somewhat more time to return to deformation values of the undisturbed surrounding.
6.3 Annual deformation rate
In Michaelides et al. (2019), the peak of “permafrost layer thinning” is reported to occur 25 years after fire events in the Yukon-Kuskokwim Delta, which is much later than what is observed from the fitted function of the annual deformation rate values of our study, where annual deformation rates of fire scars match those of surroundings after about 15 years for this region (Fig. 5b). This discrepancy is further amplified by the fitting function used, which allows for stronger reductions in values during the initial years compared to later years. However, the estimate reported by Michaelides et al. (2019) falls within the RSE-based uncertainty band of our fitted function for this region and is also consistent with the uncertainty of the individual InSAR-derived deformation rate estimates. This suggests that, although our fitted function indicates a faster recovery, the associated uncertainties overlap with previous observations (Fig. A8b). Compared to Michaelides et al. (2019), our study incorporated a larger amount of fire scars and covered a longer temporal span of fire event years, which enabled a more comprehensive reconstruction of the system’s temporal evolution and may contribute to differences observed between the studies. The larger number of investigated fire scars across most study regions compared to previous studies may also contribute to the broader RSE-based uncertainty envelope observed in our study.
The timespan of the initial subsidence following fire events in our results, approximately 7–13 years across all regions’ data points based on the 95 % bootstrap confidence interval (Fig. 5b and c), however much closer resembles that reported by Cao and Furuya (2025) (Fig. 5c), who analyzed fire scars in the Arctic-boreal North Yukon region and also acquired more fire samples covering the post-fire progression. Consistent with Cao and Furuya (2025), we found that, on average, this timespan is confined to the first decade after the fire event. For the Central North Slope, we also identified the reported uplift relative to the surrounding areas during the subsequent 30 years, which gradually attenuates to values comparable to the undisturbed surroundings (Fig. 5c). In contrast, other regions, especially the Inuvik region and Yukon-Kuskokwim Delta exhibited no discernible oscillatory behavior, resulting in an average trend that more closely aligns with an exponential fit, showing heave relative to the surrounding undisturbed areas.
A potential connection with ground temperatures could be suggested for annual deformation rates (Fig. 7b), where the warmest region, the Yukon-Kuskokwim Delta exhibited most pronounced relative heave for old fire scars compared to their surroundings (Fig. 5b, c). This may indicate that regions with higher ground temperatures may be more susceptible to permafrost thaw following fire events. However, this interpretation would need to be validated using data from additional warmer regions, as factors other than ground temperature may influence these outcomes, such as burn severity, ground ice content, vegetation cover, and soil moisture conditions.
6.4 Backscatter data
Incorporating SAR backscatter data could enhance our understanding of how vegetation structure and soil moisture are affected in these regions.
By analyzing changes in backscatter, we can gain insights into the post-fire dynamics of vegetation recovery and soil moisture variations. The comparison of summer backscatter values between fire scars and their surroundings revealed that fire scars in warmer ground temperature areas exhibit higher backscatter than unburned areas especially for younger fires, reducing over time, whereas colder regions initially tend to show slightly lower backscatter values, which increase over time (Figs. 4d and 7c). These patterns appear to be independent of the prevailing backscatter level of the surrounding areas, and thus of vegetation type and surface conditions (Fig. A5). Our findings, however, are not consistent with research by Zhou et al. (2019) and Jenkins et al. (2014), who observed higher backscatter values up to 4–5 years after the Anaktuvuk River fire. In our results, this specific fire shows minimal deviations from surrounding backscatter values 10–15 years after the event (not explicitly shown). This finding aligns with Yi et al. (2022)'s observations, which also noted only limited contrast in C-band data after 10 years.
The deviations observed in previous studies of the Anaktuvuk River fire suggest that our findings regarding the relationship between ground temperatures and fire scar backscatter data may not be the sole contributing factor. For instance, Jones et al. (2024a) reported that post-fire ecosystem changes contributed to a cessation in permafrost thaw, and recovery of the permafrost table within approximately 10 years after the Anaktuvuk River fire, with about 15 cm of aggraded permafrost observed on average. However, the increase in microtopography that developed due to thermokarst following the tundra fire remains evident. A similar recovery time span can also be inferred for summer backscatter data of this region.
Although there may be other factors that influence backscatter trends, many of the fire scars investigated in our study do indicate a connection between fire scar backscatter and ground temperatures (Fig. 7c), independent of the initial backscatter levels (Fig. A5). Higher backscatter in fire scars has previously been attributed to increased surface roughness. This alone would however not explain why summer values of the warmer region are decreasing over time, while they seem to increase in colder regions (Fig. 4d), presuming the surface roughness would increase with the progression of thermokarst development. Another cause for enhanced summer backscatter values is increased soil moisture. Higher soil moisture in burned than in unburned areas has been reported for the Yukon-Kuskokwim Delta even after 46 years (Clayton et al., 2025), which may as well be similarly deduced from backscatter data throughout the investigated period (Fig. 4f). Here, summer backscatter in fire scars is increasingly higher than for winter backscatter (Fig. 4d, e). As both winter and summer backscatter values gradually approach those of the unburned surrounding areas, the summer backscatter reduction in the Yukon-Kuskokwim Delta might also stem from differing causes, than from a reduction of soil moisture. It also has to be considered that higher winter backscatter in this region has previously been attributed to the presence of depth hoar in the snowpack, attributed to a freeze-up that occurred later than under pre-fire conditions (Bartsch et al., 2020).
Whereas this warmer region experiences a presumed initial rise in near surface soil moisture, some colder regions like the Noatak River Basin and Central North Slope seem to exhibit lower soil moisture than their surroundings (Fig. 4f). If it is correct to assume that the resulting differences between summer and winter backscatter are primarily due to variations in soil moisture, then these effects are not clearly linked to ground temperatures, since the Inuvik region also exhibits initially elevated deduced soil moisture levels, which decrease over time.
While the initially higher summer backscatter values in burned areas of the warmer Yukon-Kuskokwim Delta (Fig. 4d) might in some part be explainable due to enhanced soil moisture, the observed initial lower backscatter in colder ground temperature areas might additionally be attributed to reduced volume scattering resulting from vegetation loss. This may account for the greater reduction in backscatter values within the Inuvik region, where taller vegetation heights are to be found (European Commission, Joint Research Centre:, 2003). The backscatter increasing over time might be explained by shrubification (Myers-Smith et al., 2011).
A clear increase of backscatter values could for instance also be observed for the oldest fire scar investigated within this study, the Shivugak Bluffs Burn of the Central North Slope region (Fig. 4d and e at about 90 years since initial burn). Miller et al. (2024) examined the long-term biophysical impacts of this tundra fire. The fire led to profound and persistent changes in vegetation structure and composition. Compared to adjacent unburned tundra, the burned area is now dominated by tall willows and grasses, while sedges, mosses, and other cold-tolerant species have significantly declined. This shift reflects a transition from a stress-tolerant plant community to one shaped by post-fire competition and warming. Thinning of the organic soil layer after fire has amplified permafrost thaw and thermokarst development, contributing to sustained ground warming. While the burned tundra has dried over time as ice-wedge troughs connected and drained, the unburned tundra is currently undergoing a parallel but slower process of wetting and thaw. The findings suggest that fire can act as a catalyst for vegetation and permafrost regime shifts, with consequences that persist for centuries (Miller et al., 2024). The reported conspicuously tall willows and terrain rugosity of this fire scar further explain the observed high backscatter values associated with it.
InSAR data revealed differences between thaw season and annual deformation rates across all investigated North American Arctic tundra regions. The initially higher thaw season deformation rates of young fire scars required more time until they first converged with those of the undisturbed surrounding. While seasonal convergence varied regionally, annual deformation rates were more similar. The latter takes generally only about 7 to 13 years to approach surrounding values compared to on average 50 years for thaw season deformations. The comparison to ground temperatures indicated that annual deformation rates of older fire scars, attributed to permafrost recovery, were more pronounced in the warmest region. However this pattern needs to be further explored through investigations in other warm regions. In colder regions, thaw season deformations were observed to require somewhat longer times to adjust to surrounding values. Further distinct differences between warmer and colder regions were observed for summer backscatter data, where fire scars in the warmer region featured higher backscatter values compared to surrounding areas. These higher backscatter values could potentially be attributed to initially higher soil moisture levels, while colder regions tend to have decreased backscatter values in fire scars, possibly mainly due to vegetation loss and a gradual increase caused by shrubification and a thermokarst related rise in surface roughness. To further clarify these assumptions, additional research is required.
The main difference between the deformation and backscatter results, however, is that while all regions generally exhibited similar deformation trends, characterized by initially increased subsidence, the backscatter results varied substantially between regions, even display opposing trends.
These findings underscore the complex interactions between fire, ground temperature, active layer, permafrost dynamics, and vegetation, illustrating that fires can have different impacts on permafrost and the appearance of fire scars depending on the region. This emphasizes the importance of considering multiple factors when evaluating fire scar recovery.
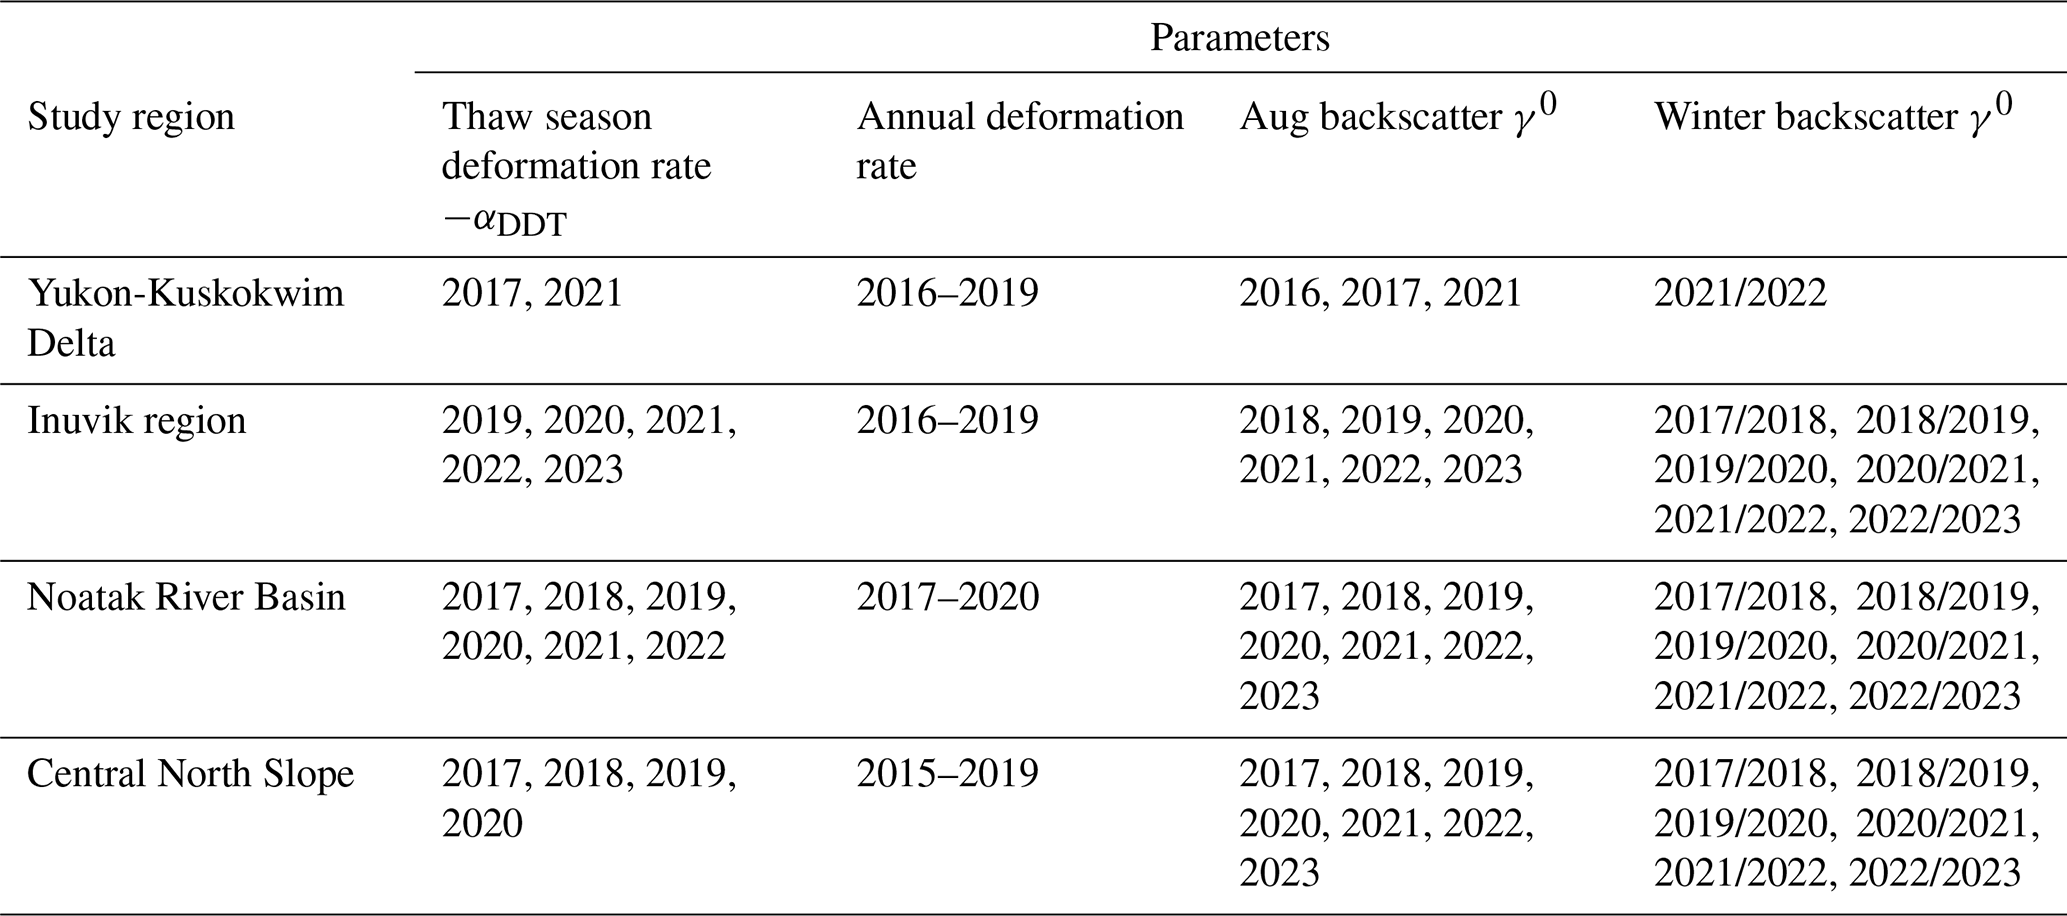
Table A2Sentinel-1 InSAR scene pairs of the Yukon-Kuskokwim Delta used in this study. PB – Perpendicular baseline, TI – Temporal interval.
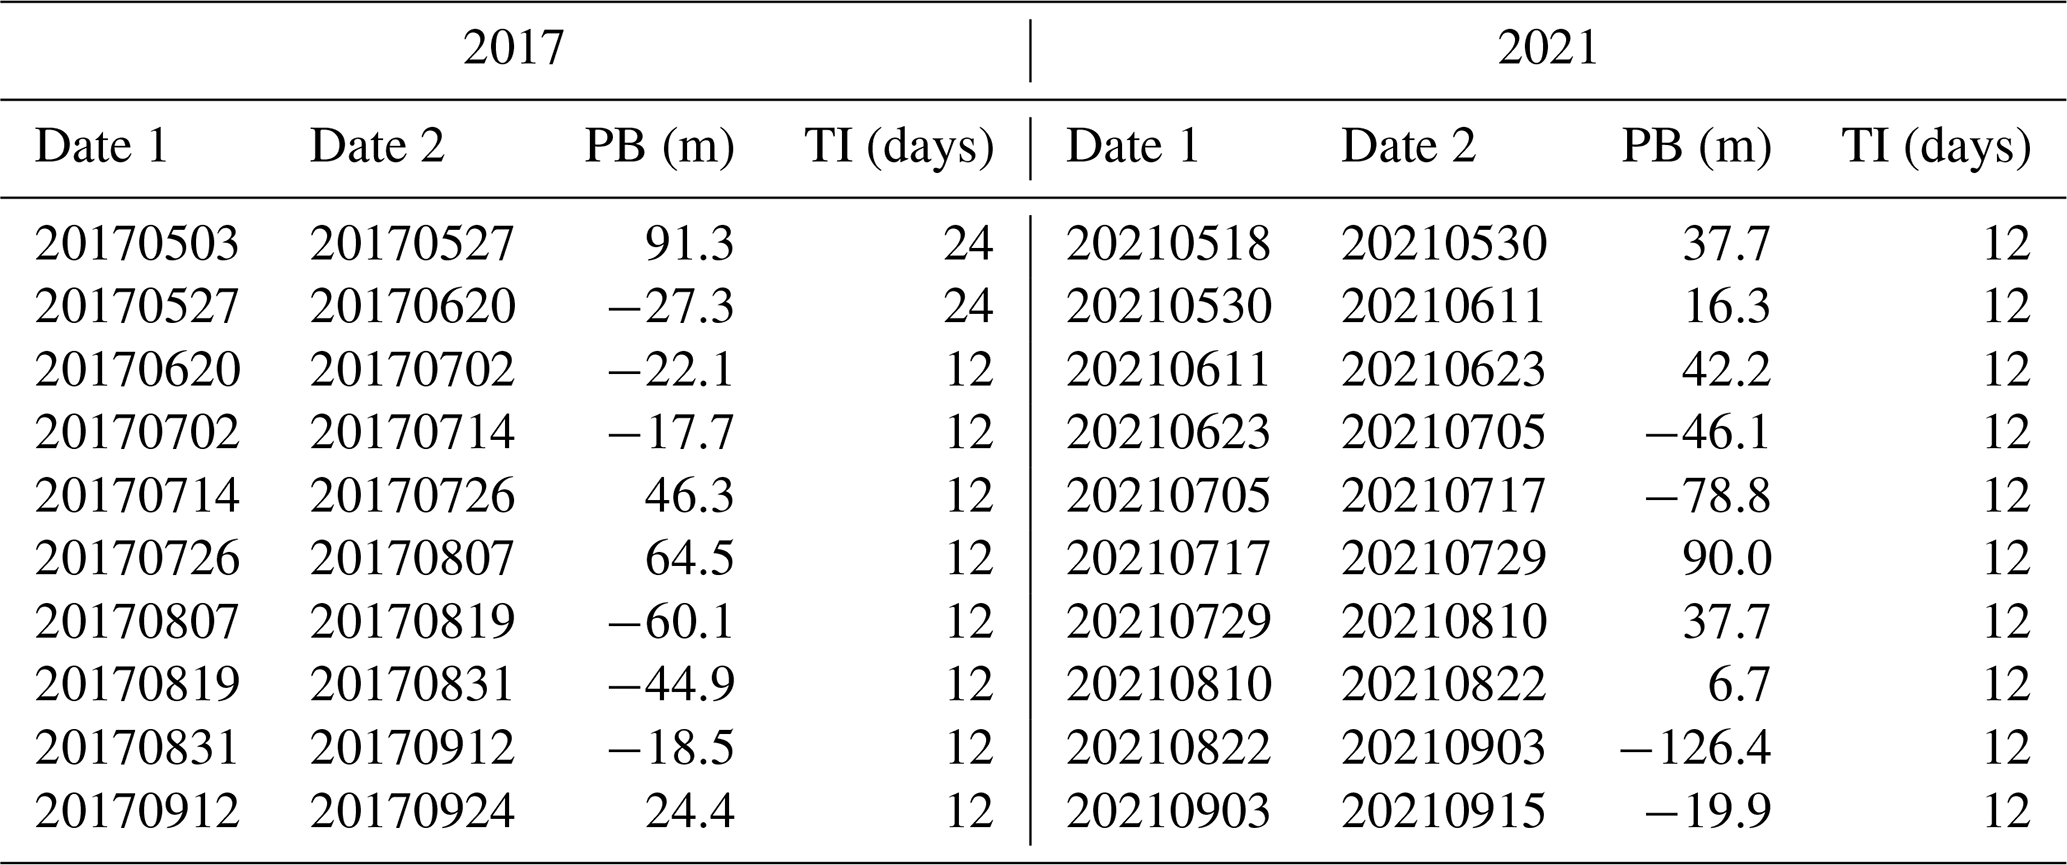
Table A3Sentinel-1 InSAR scene pairs of the Inuvik region used in this study. PB – Perpendicular baseline, TI – Temporal interval.
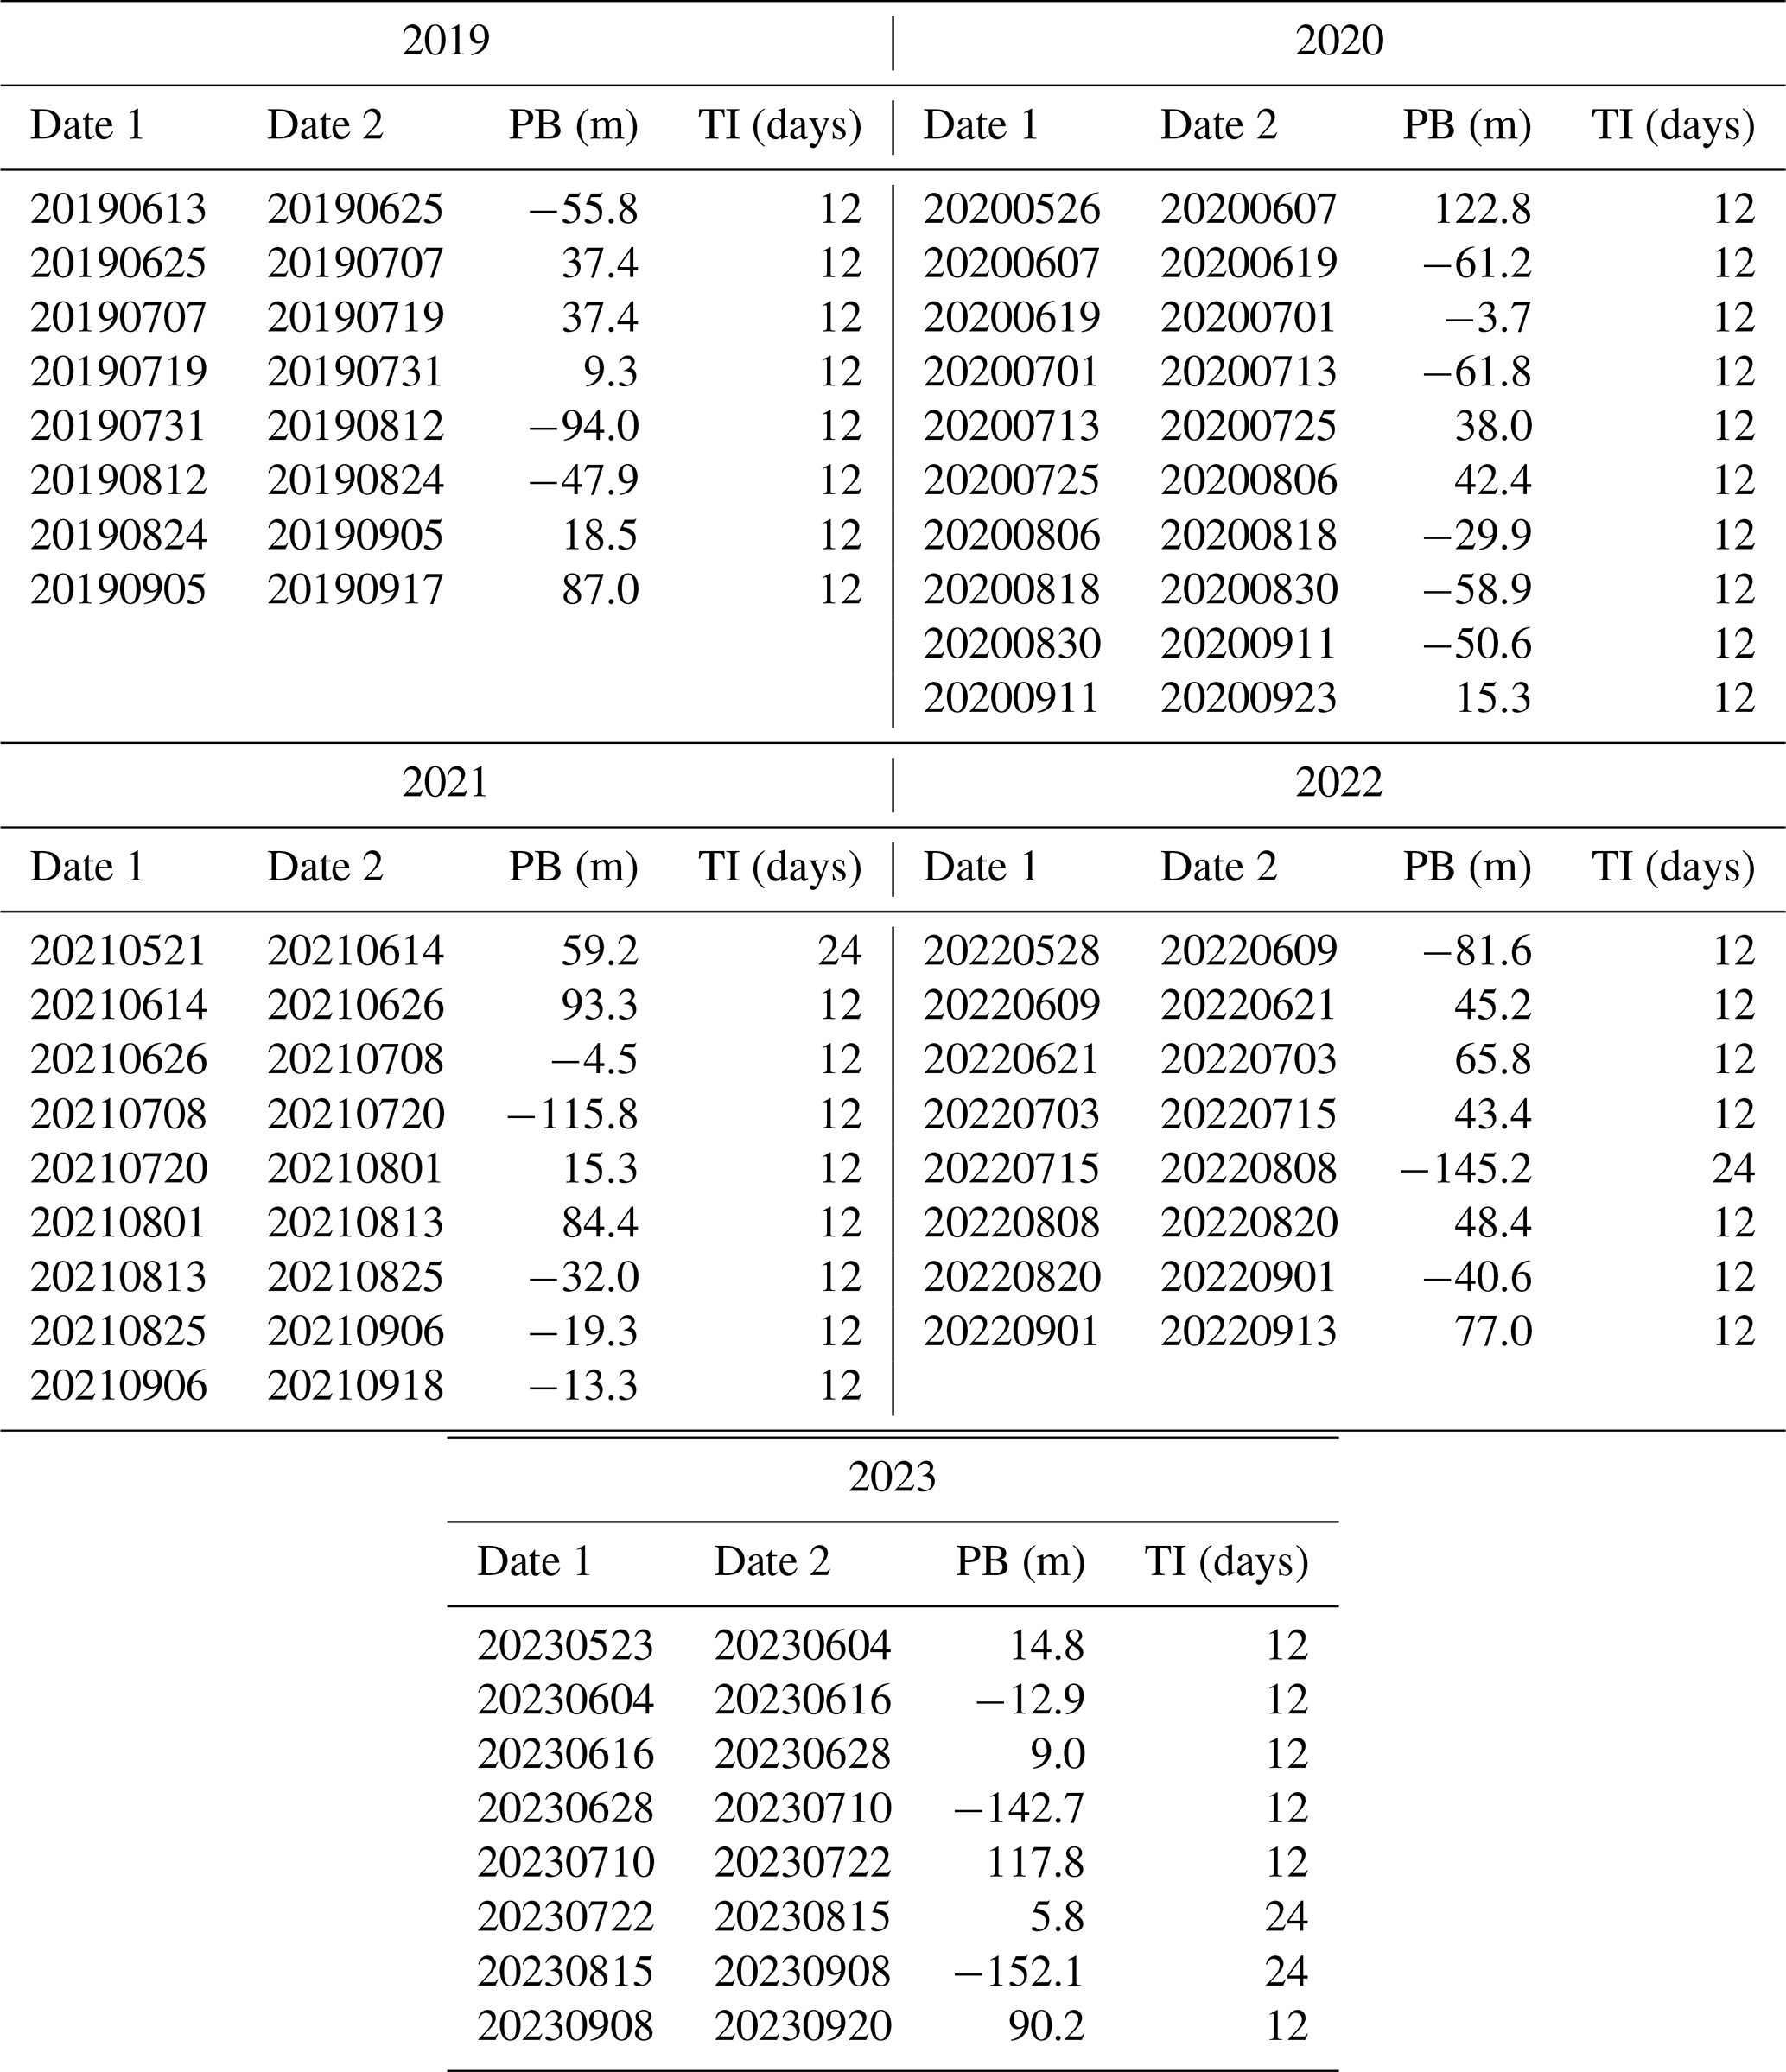
Table A4Sentinel-1 InSAR scene pairs of the Noatak River Basin used in this study. PB – Perpendicular baseline, TI – Temporal interval.
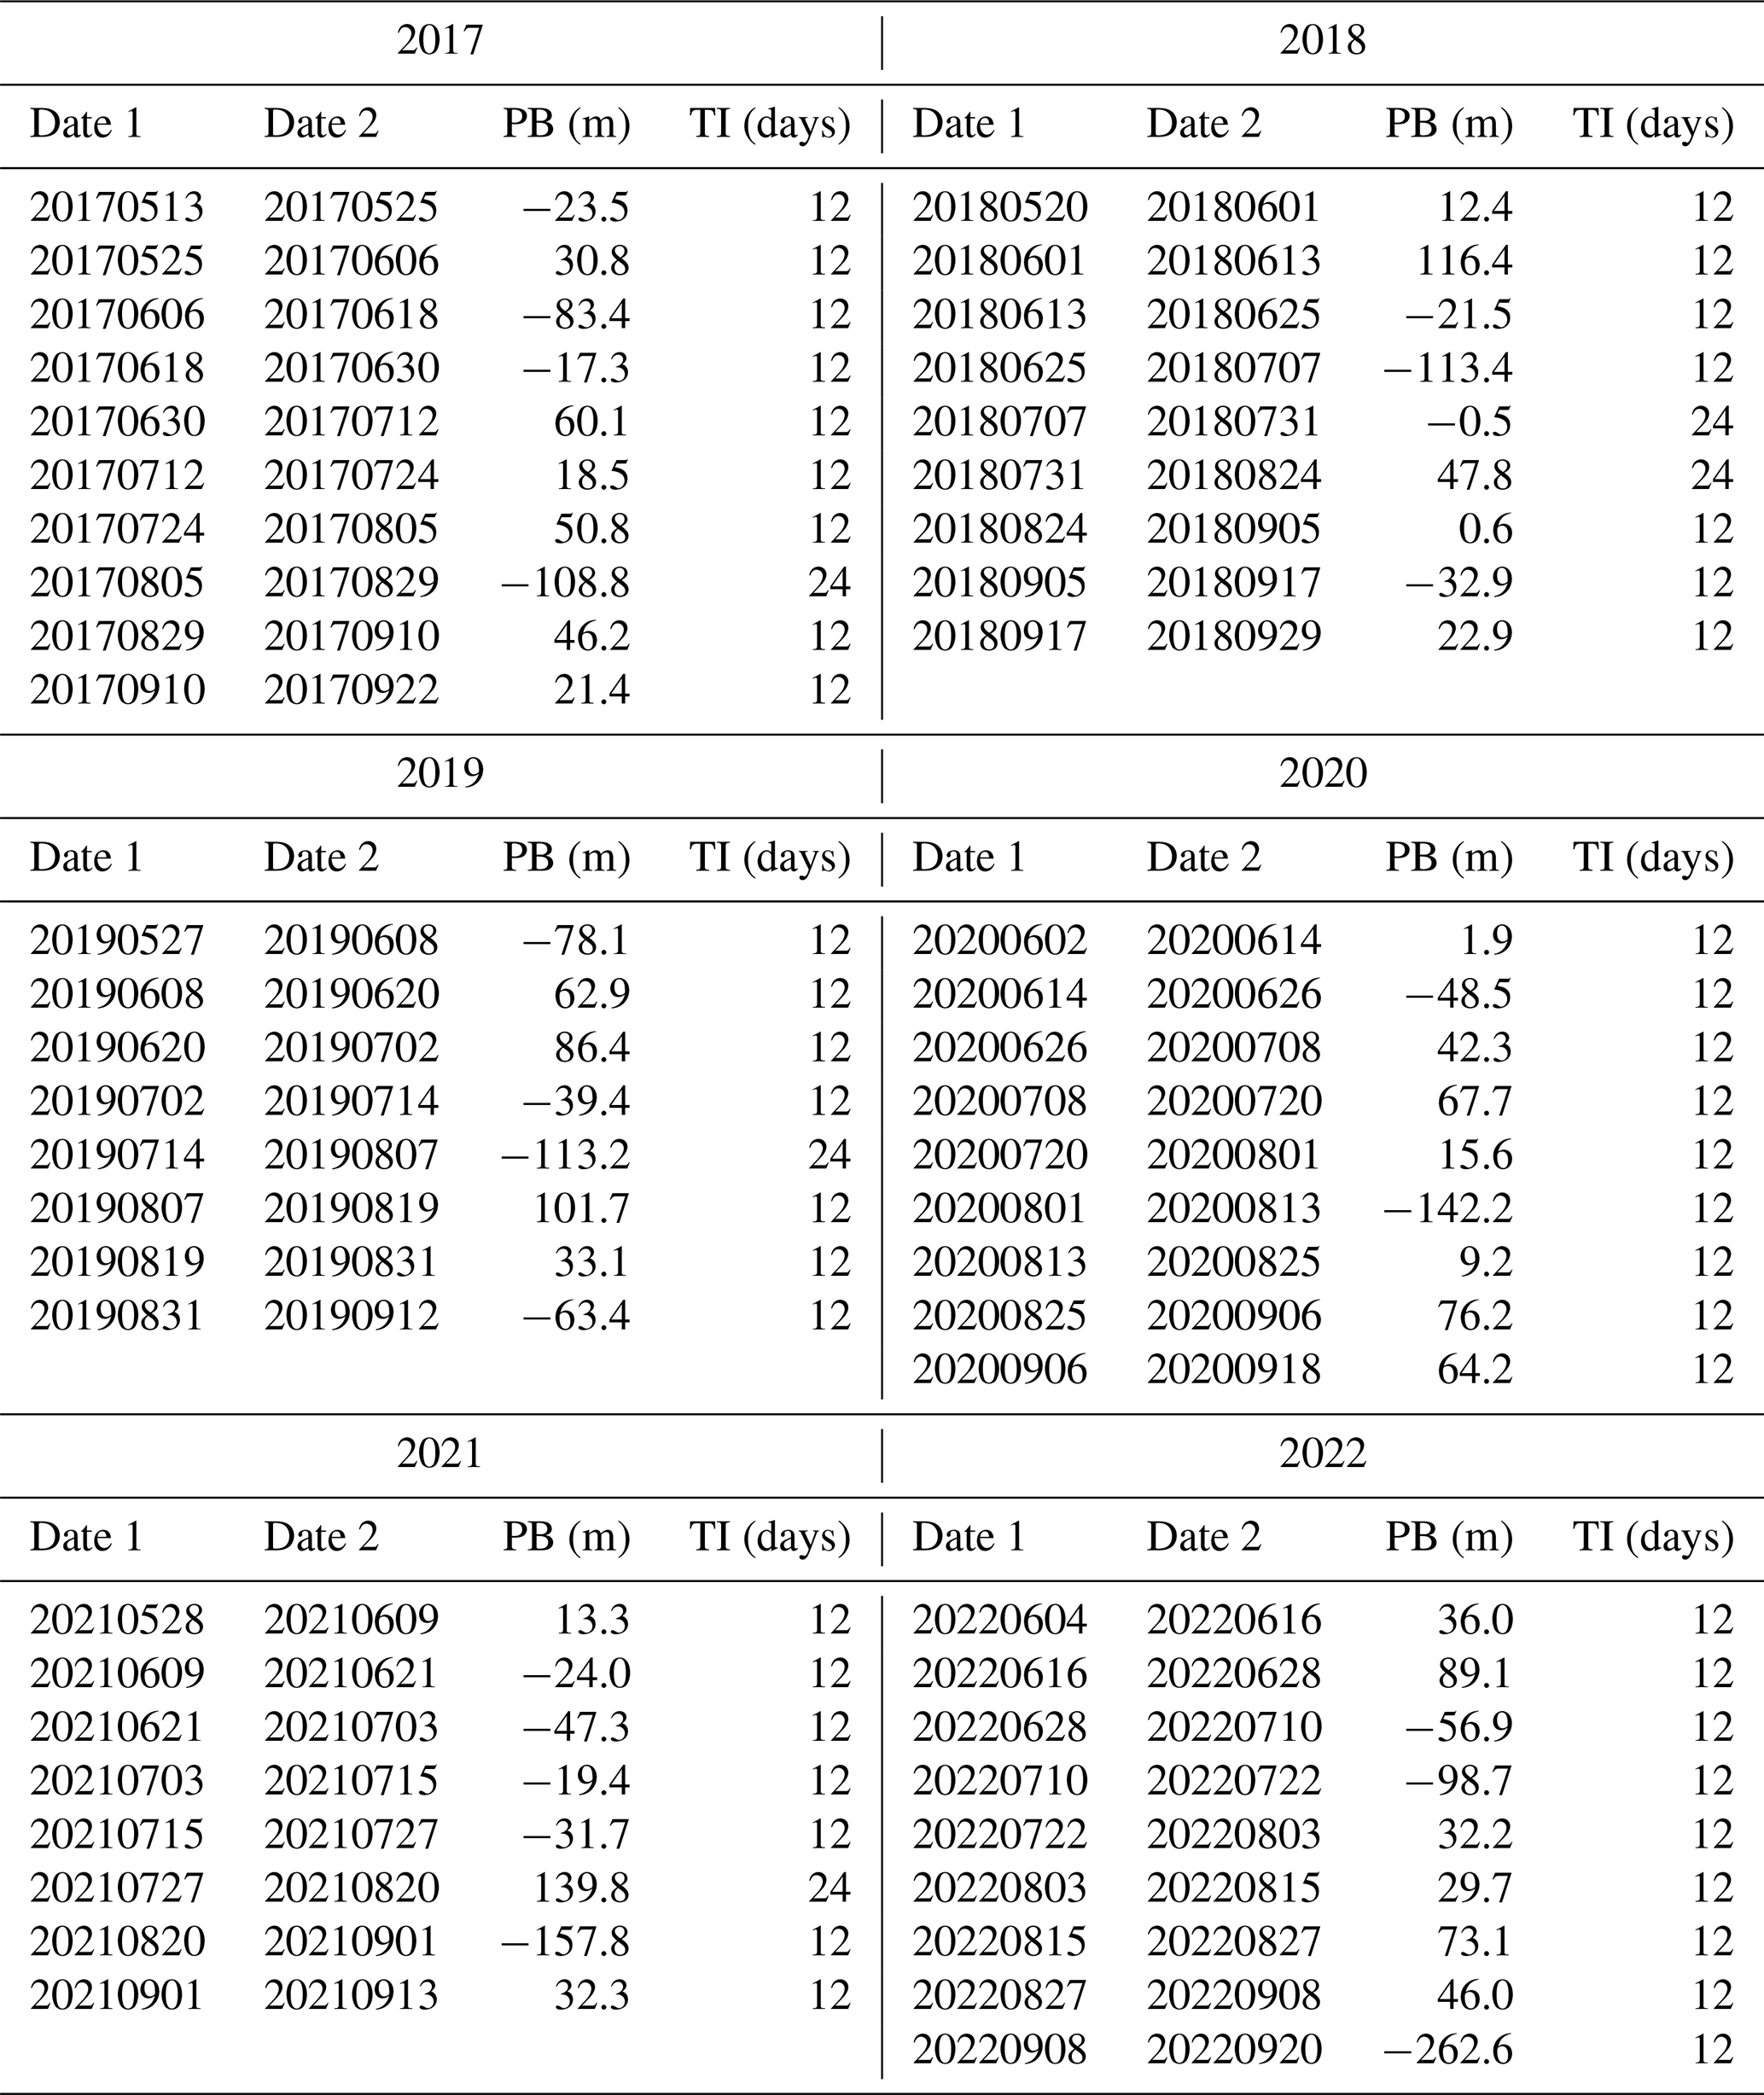
Table A5Sentinel-1 InSAR scene pairs of the Central North Slope used in this study. PB – Perpendicular baseline, TI – Temporal interval.
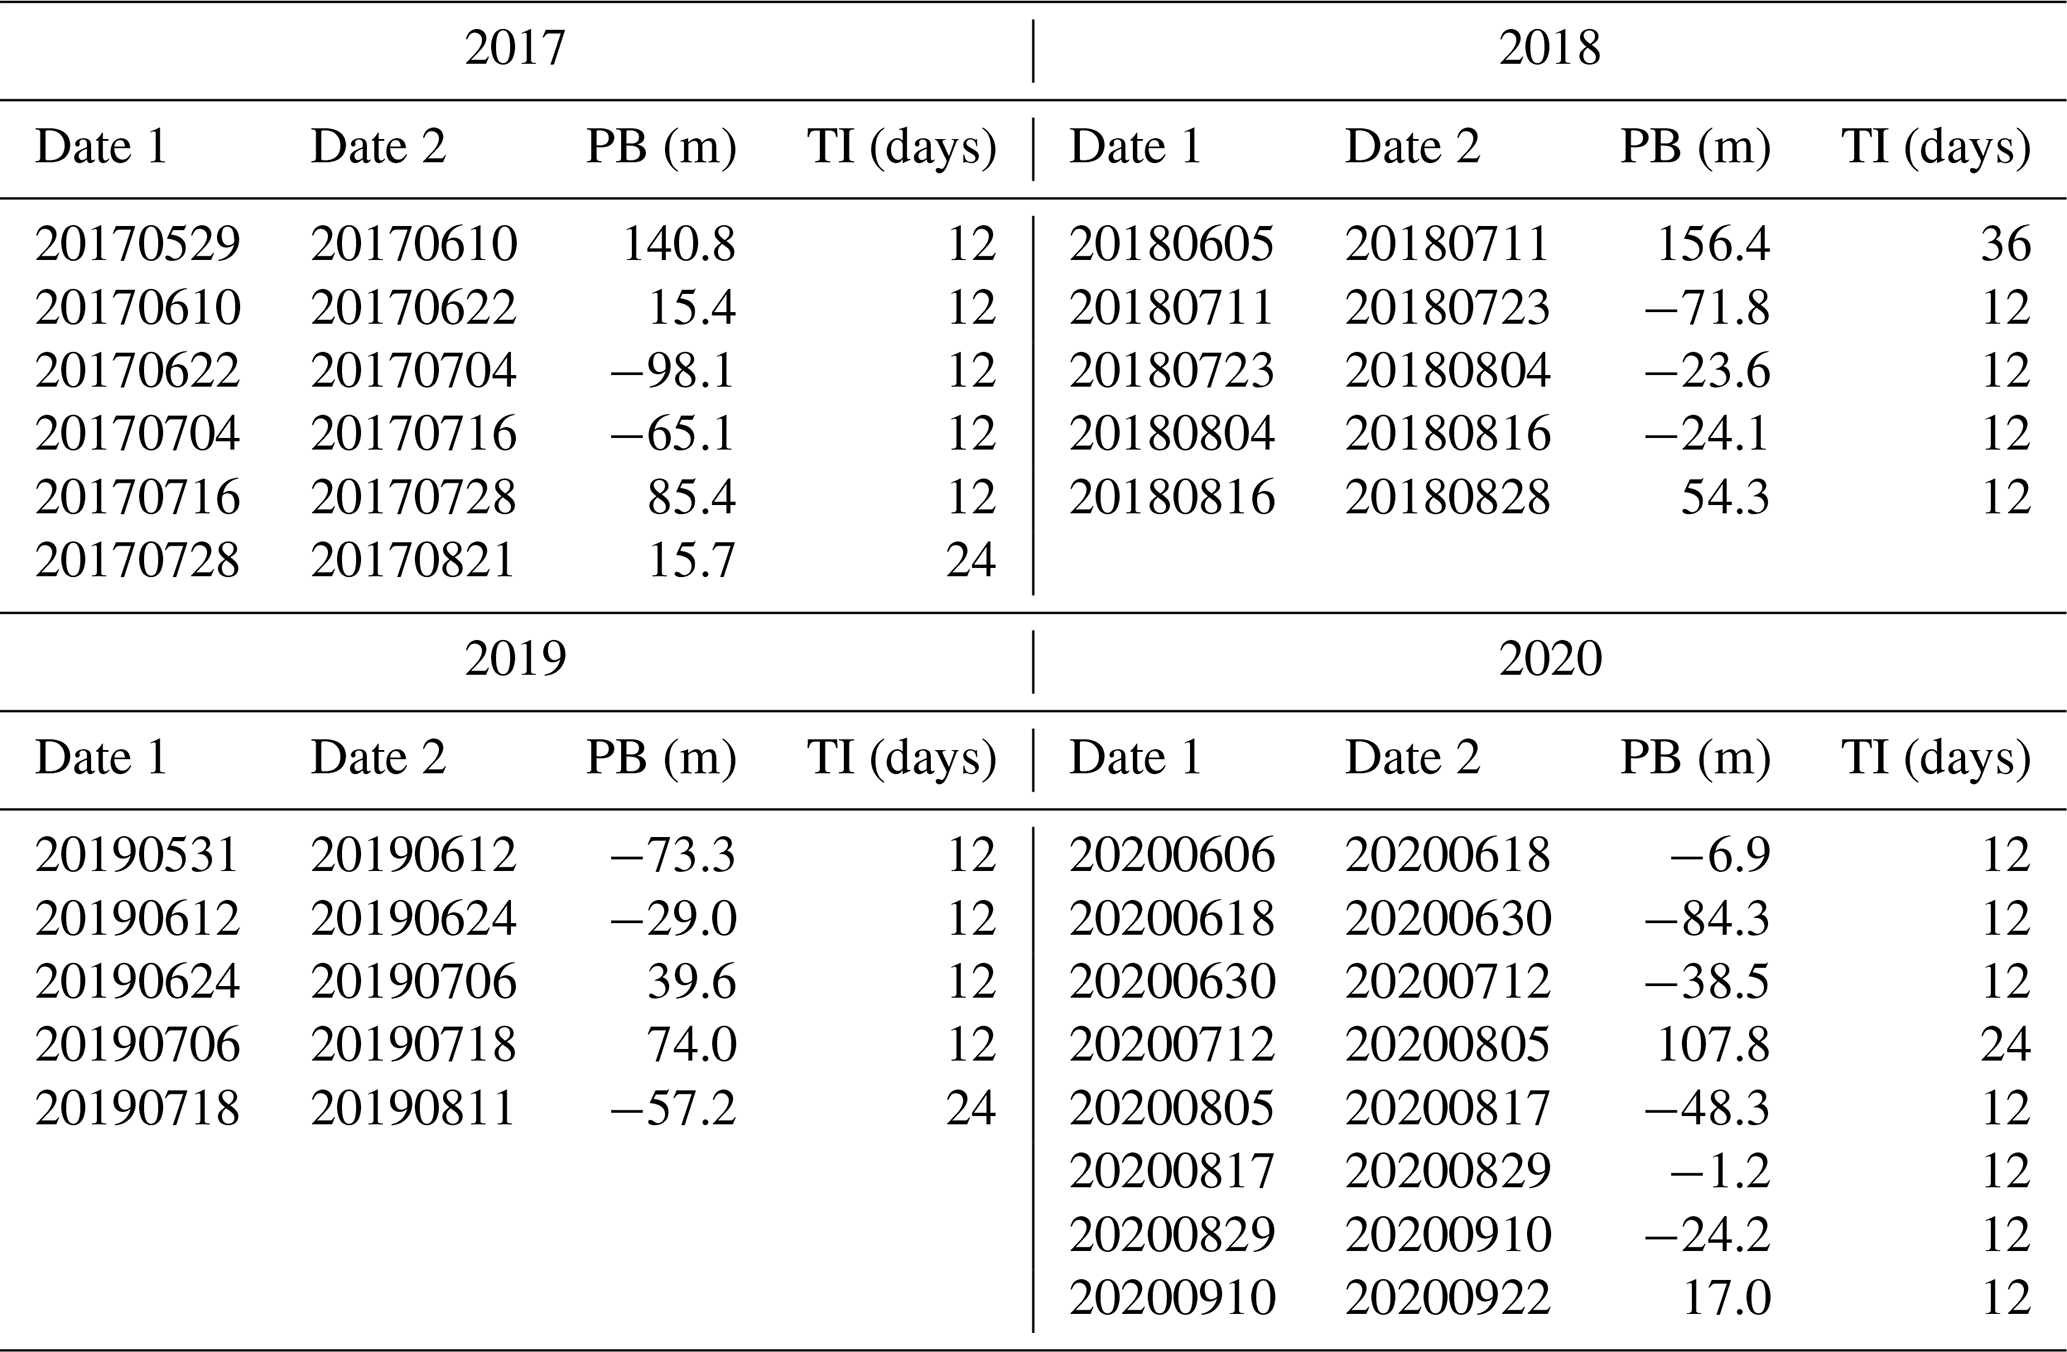
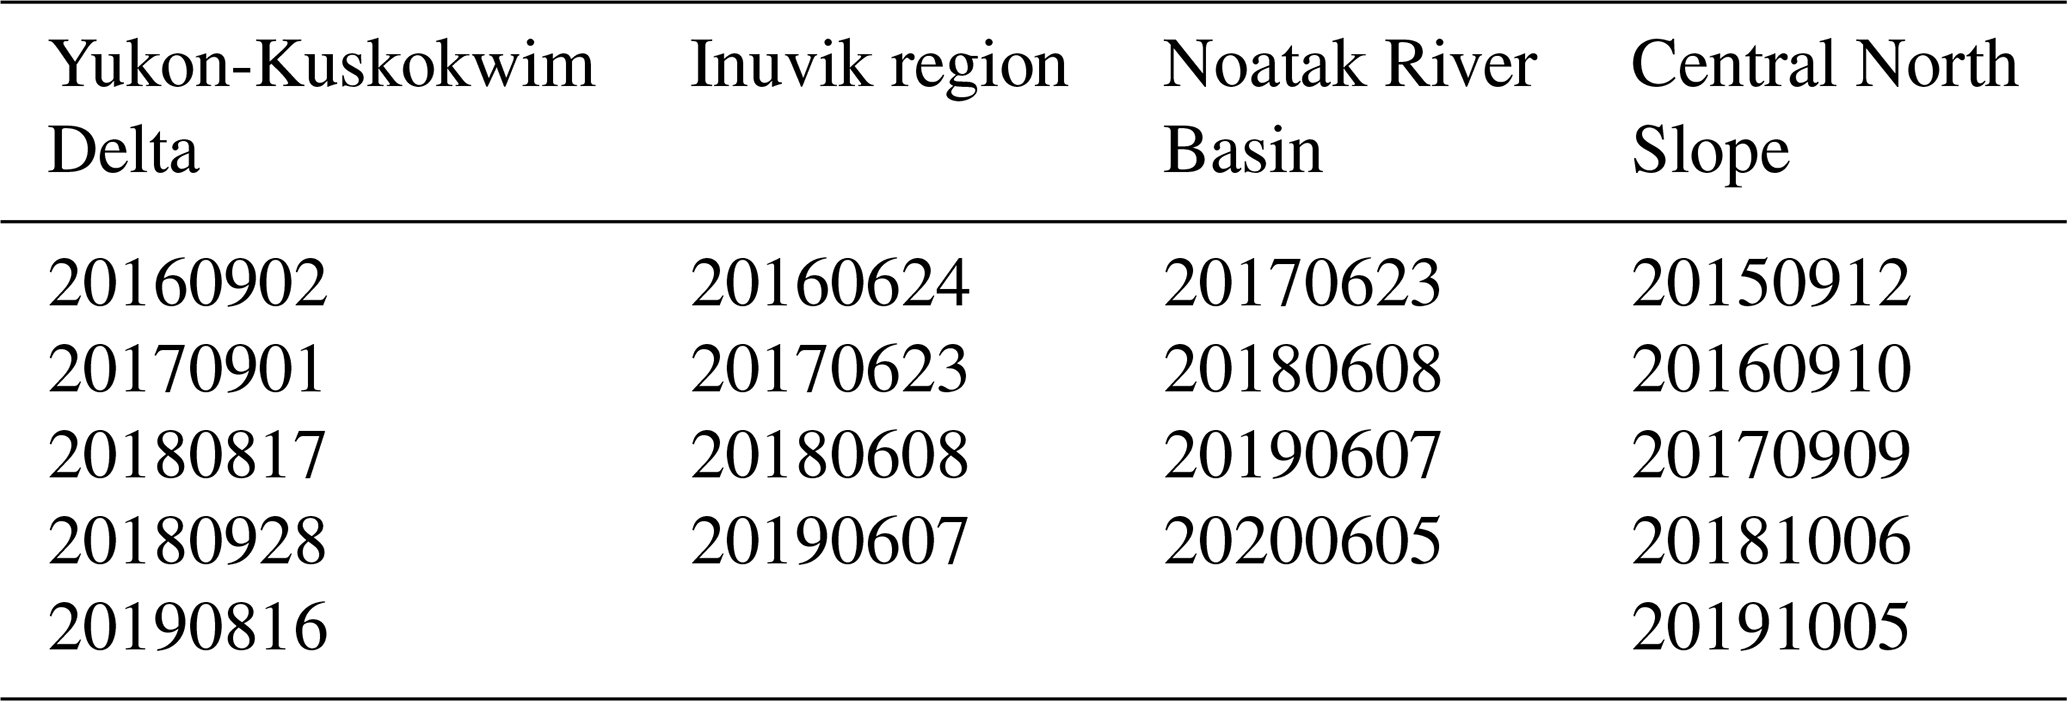
Table A7PALSAR-2 InSAR scene pairs used in this study. PB – Perpendicular baseline, TI – Temporal interval
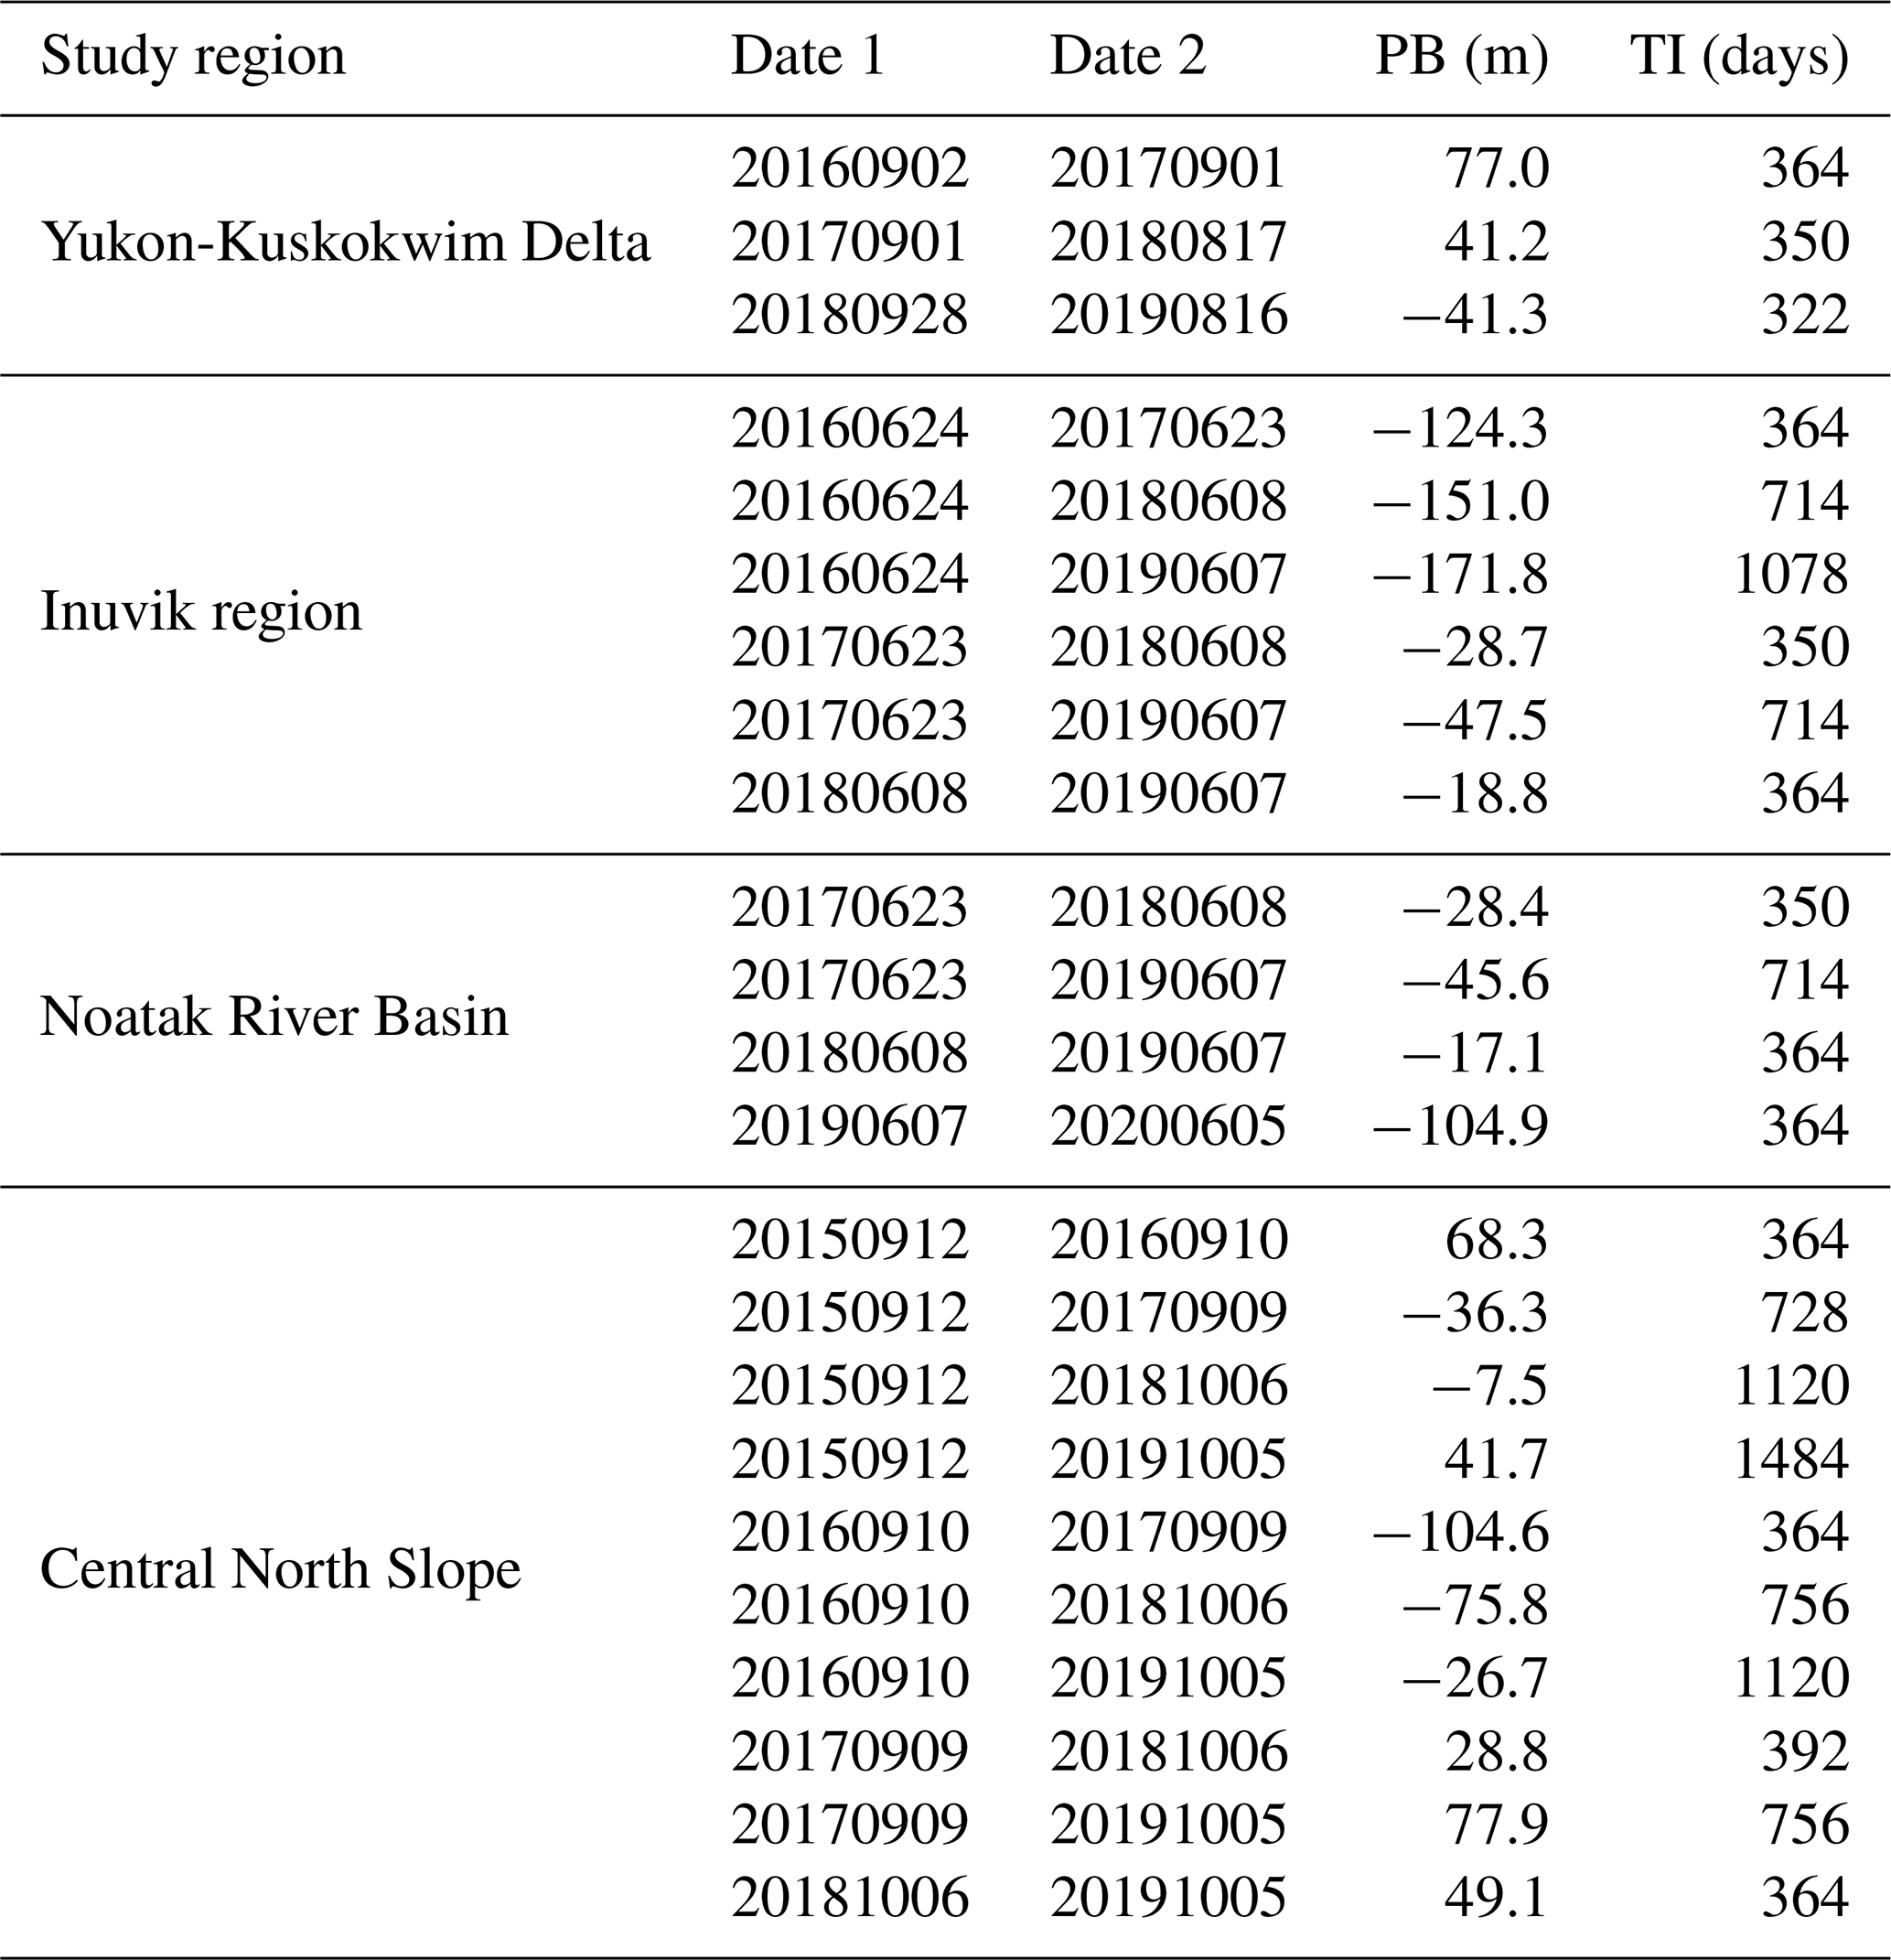
Table A8Mean standard deviation of fire scars across the analyzed parameters, and coefficient of determination (R2) for the correlation between fire scar size bins (50 km2 increments) and the median standard deviation of each bin.
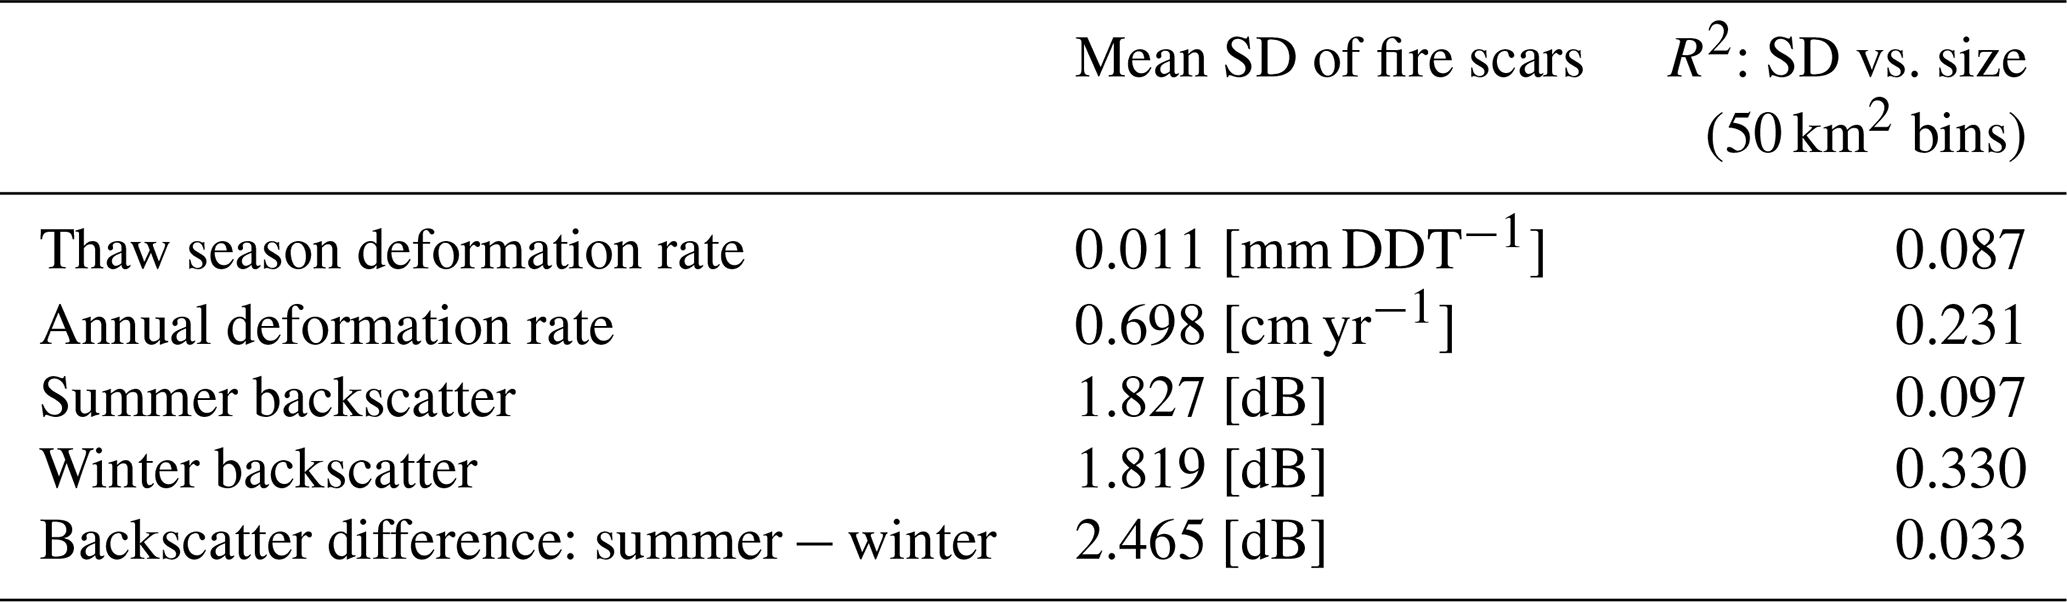
Table A9Equations representing the average functions obtained from region-specific fits of post-fire annual deformation rates. Two additional functions from the literature are included for comparison; these were adapted to units of cm yr−1 and adjusted so that subsidence is represented by negative values.

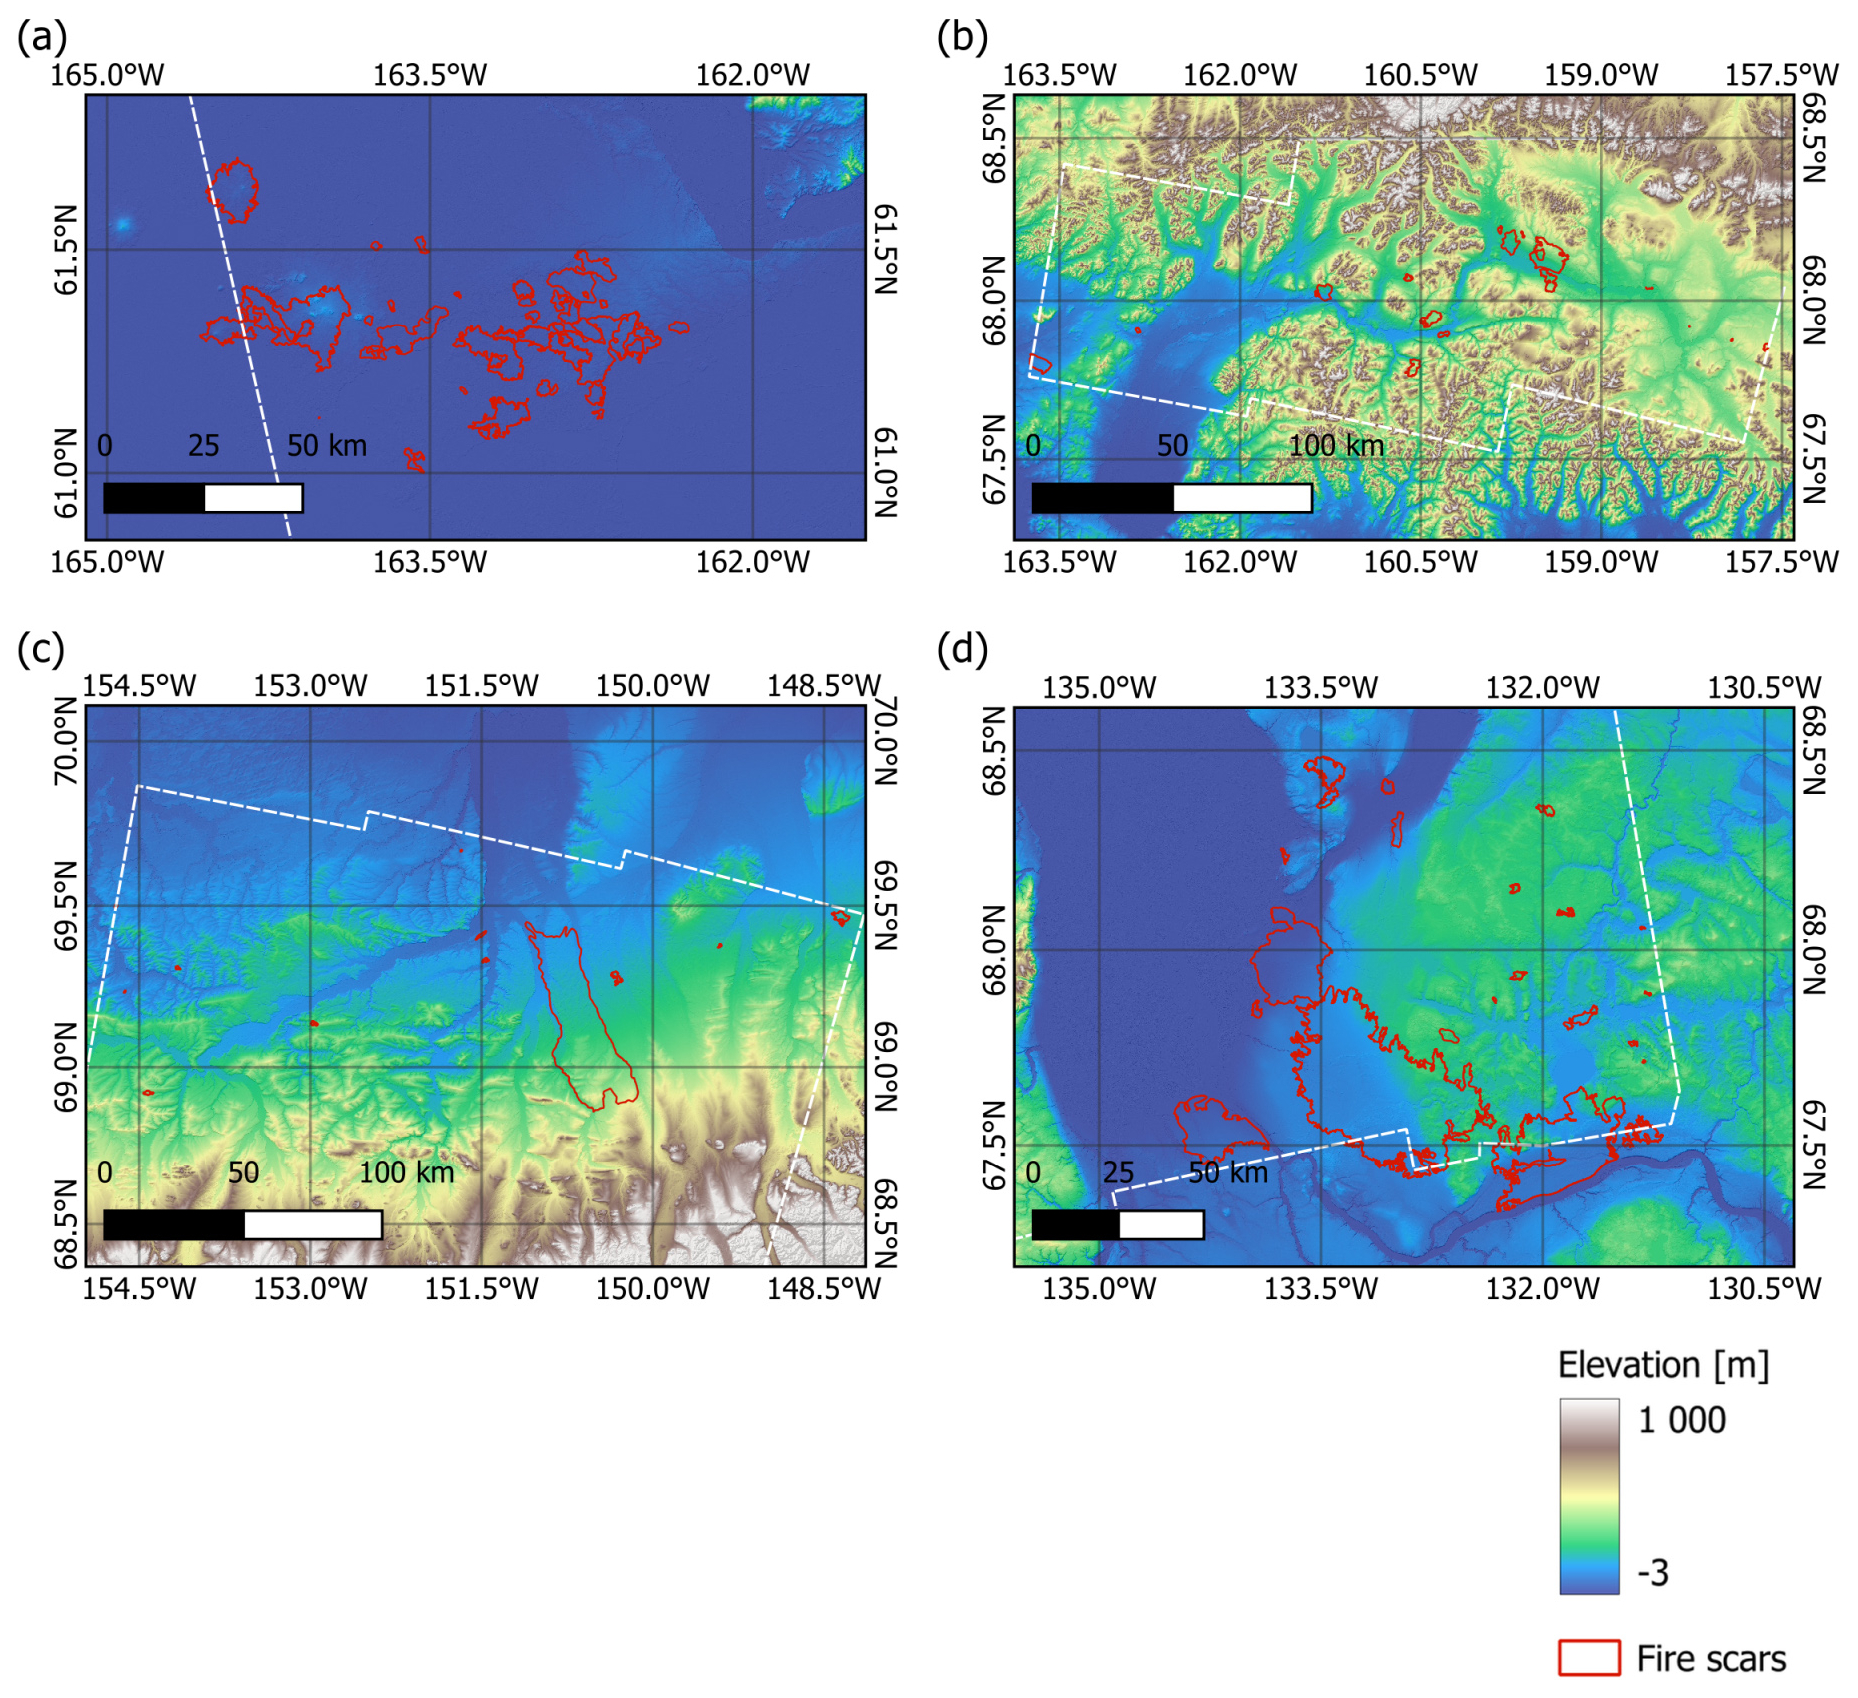
Figure A1Topography (Copernicus DEM, Copernicus, 2019) of the study regions: (a) Yukon-Kuskokwim Delta, (b) Noatak River Basin, (c) Central North Slope, (d) Inuvik region. Dashed white lines indicate the analysis boundaries. For the sources of fire scars, see Sect. 3.3.
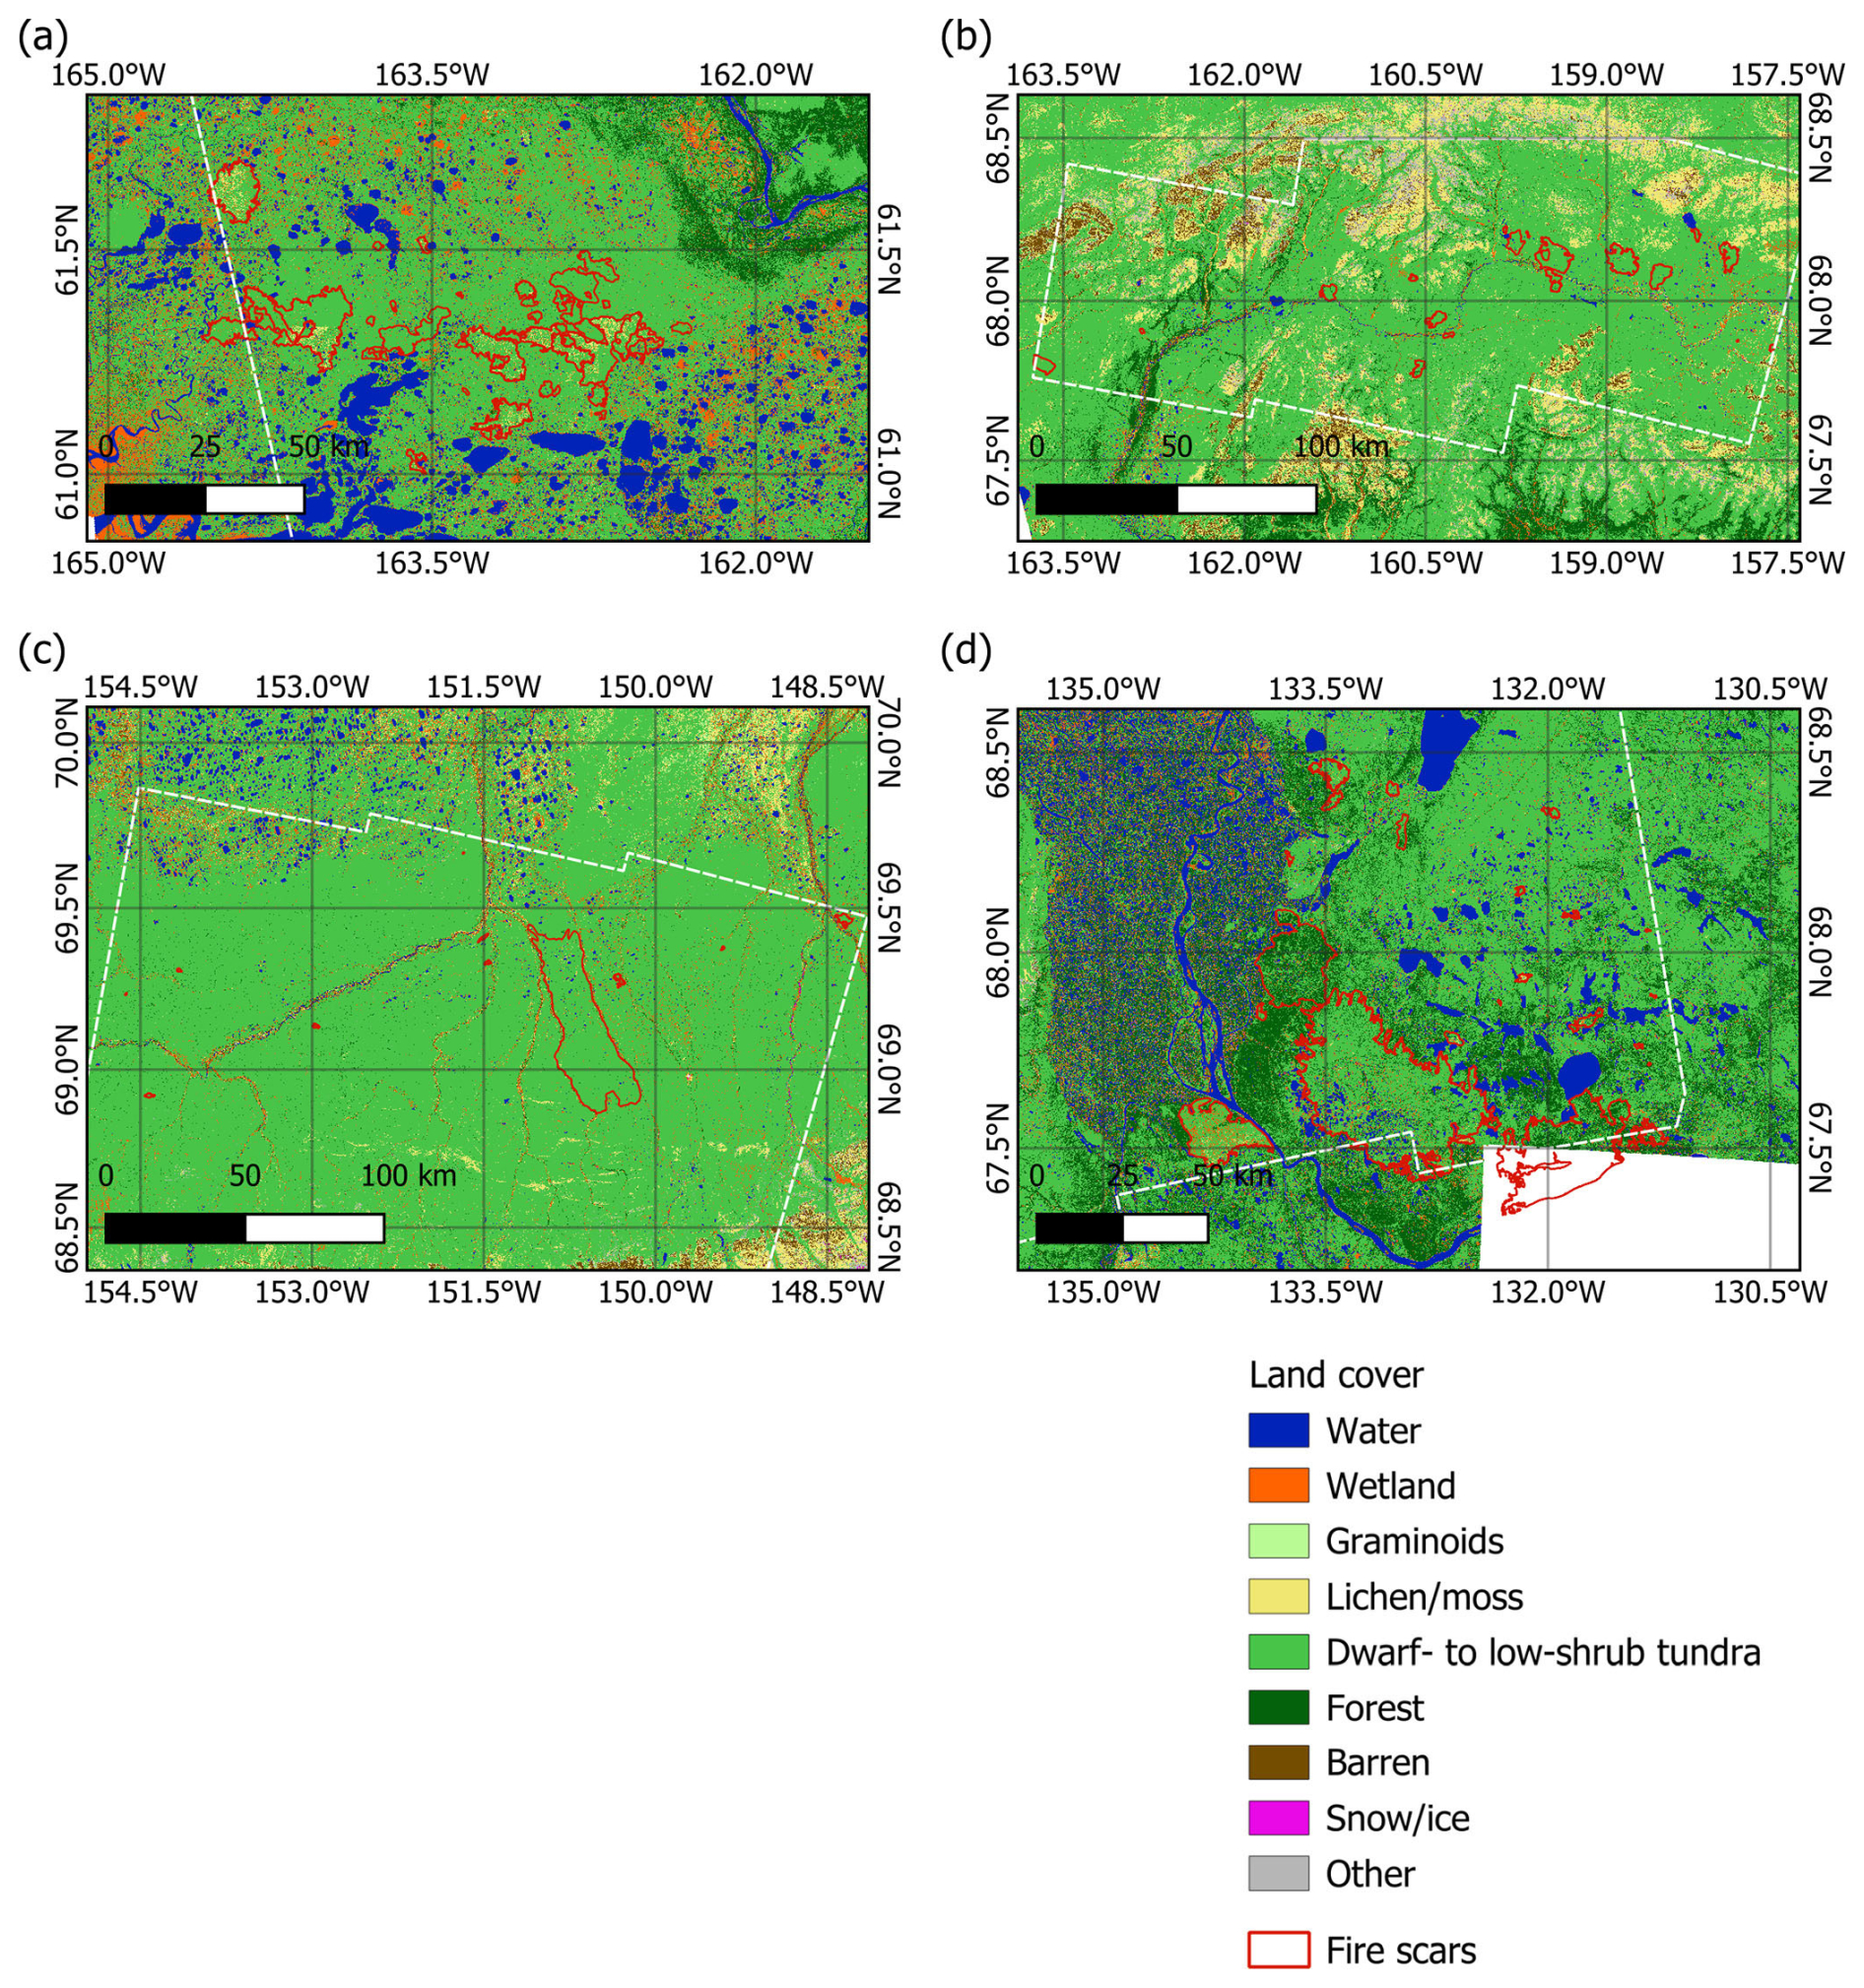
Figure A2Circumarctic land cover units (CALU, grouped according to Table 2 of Bartsch et al. (2024)) of the study regions: (a) Yukon-Kuskokwim Delta, (b) Noatak River Basin, (c) Central North Slope, (d) Inuvik region. Dashed white lines indicate the analysis boundaries. For the sources of fire scars, see Sect. 3.3.
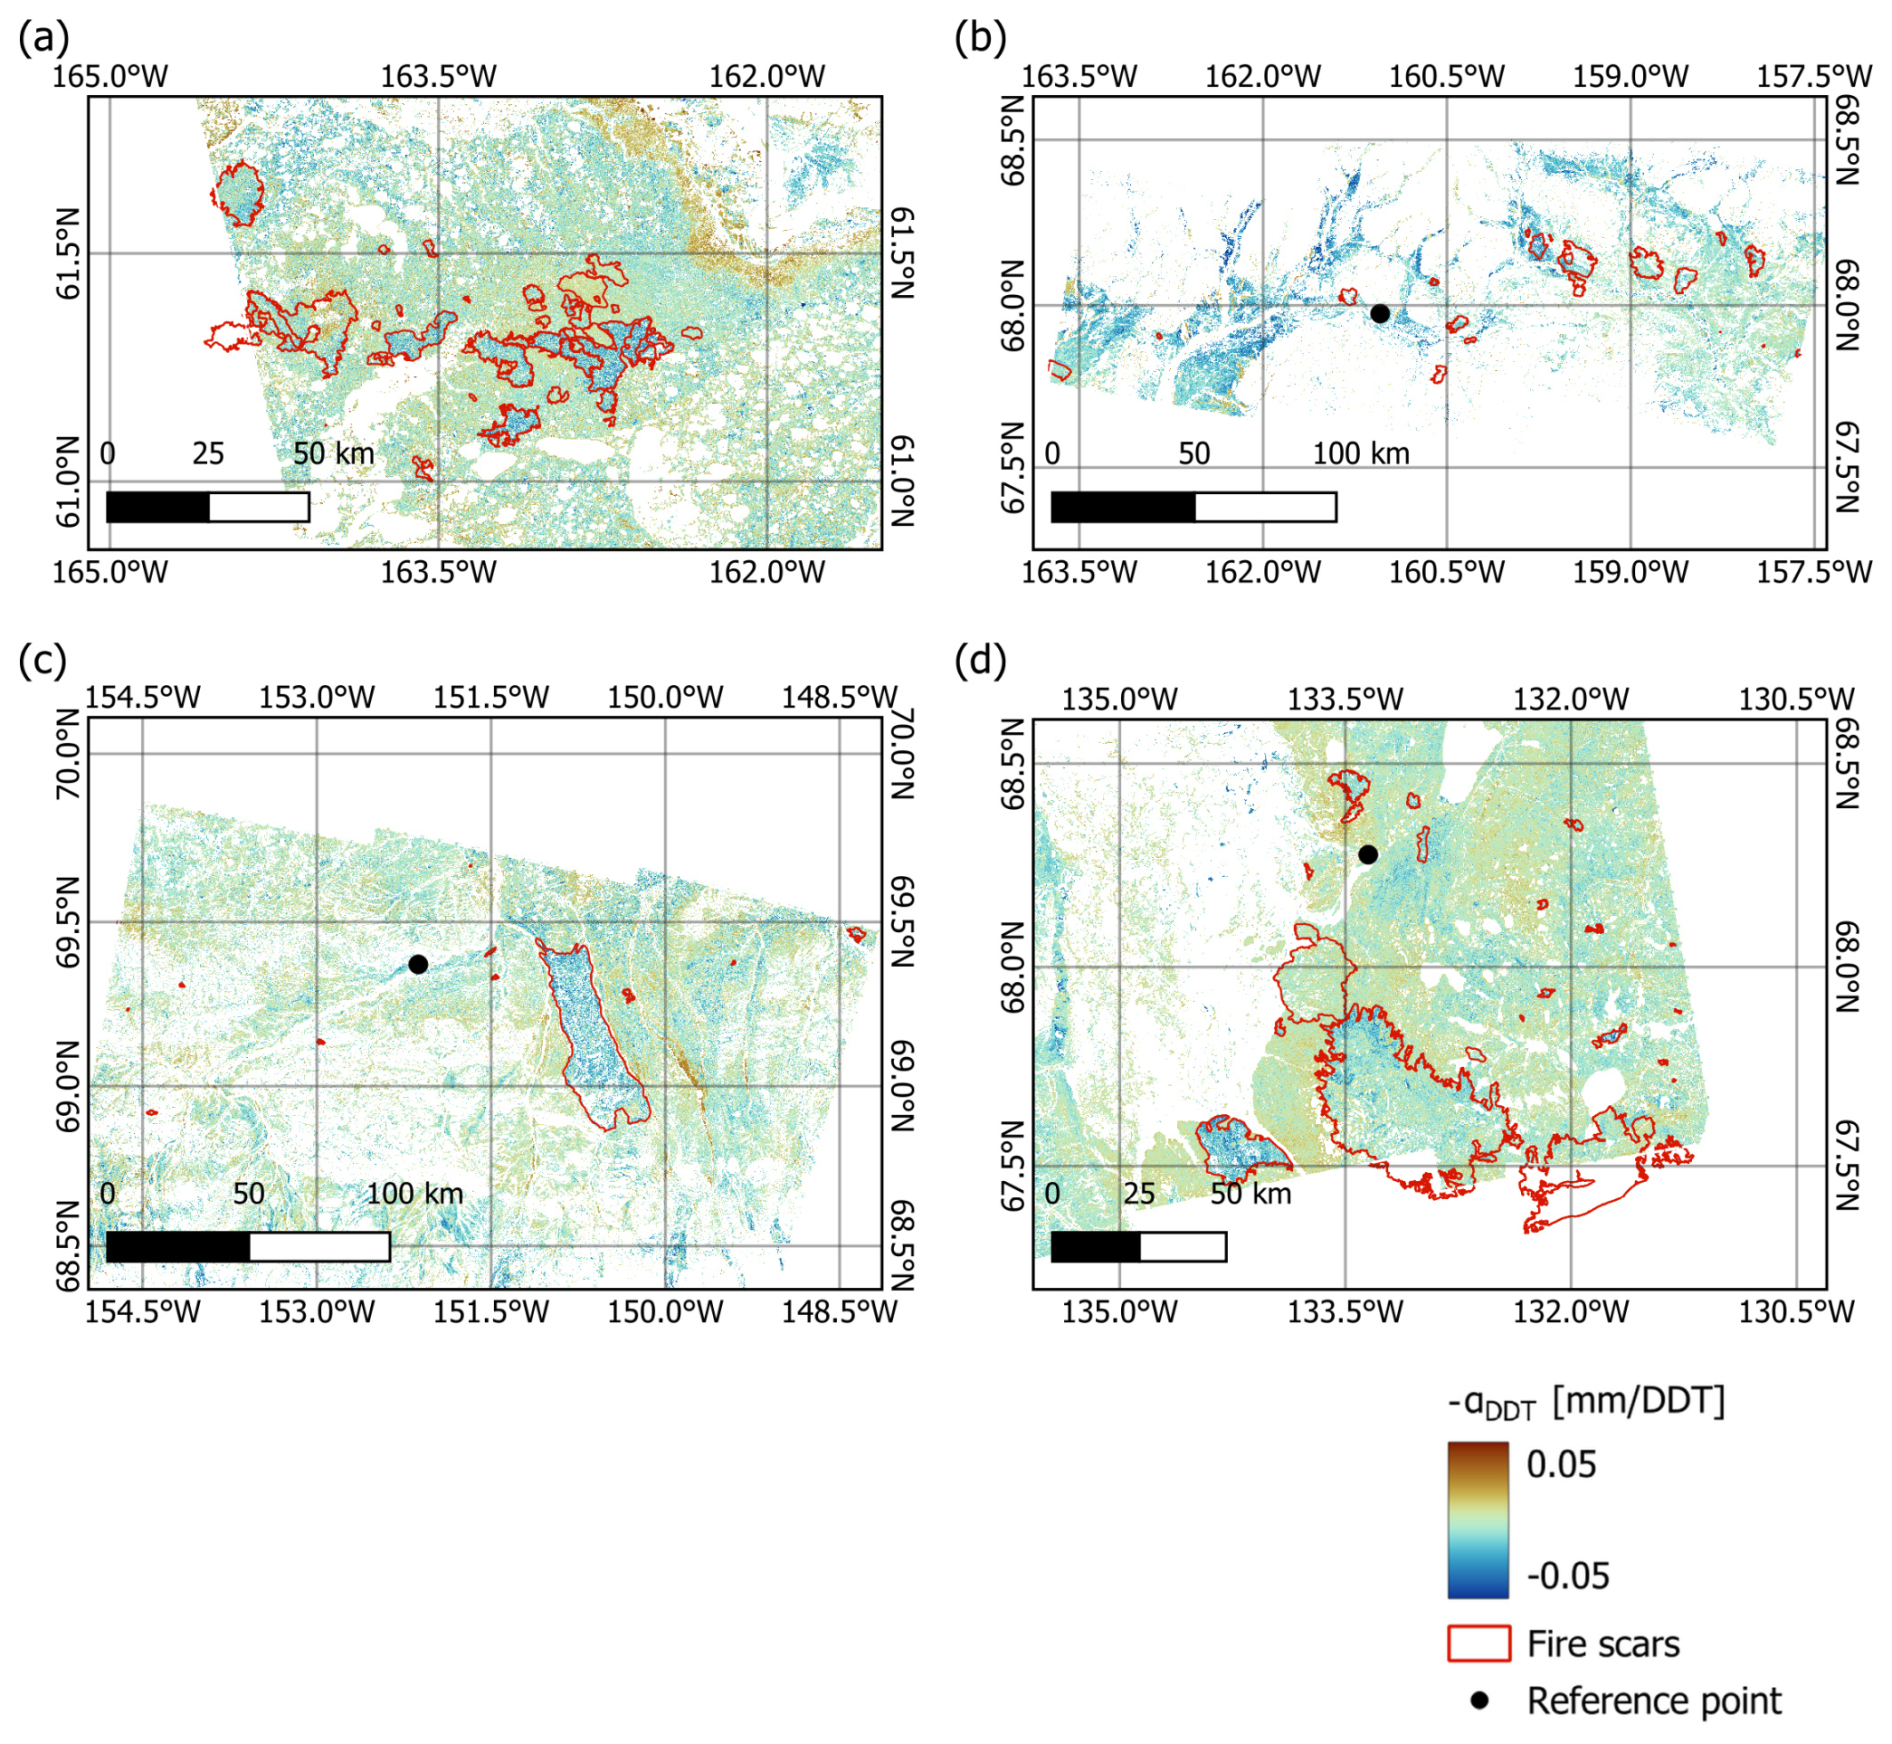
Figure A3Sentinel-1 thaw season deformation rate (−αDDT) maps for the study regions (a) Yukon-Kuskokwim Delta, (b) Noatak River Basin, (c) Central North Slope, (d) Inuvik region. Values represent the median of all calculated years. Reference points are indicated, with the Yukon-Kuskokwim Delta reference point located southeast of the mapped area and selected at the Bethel airstrip. For the sources of fire scars, see Sect. 3.3.
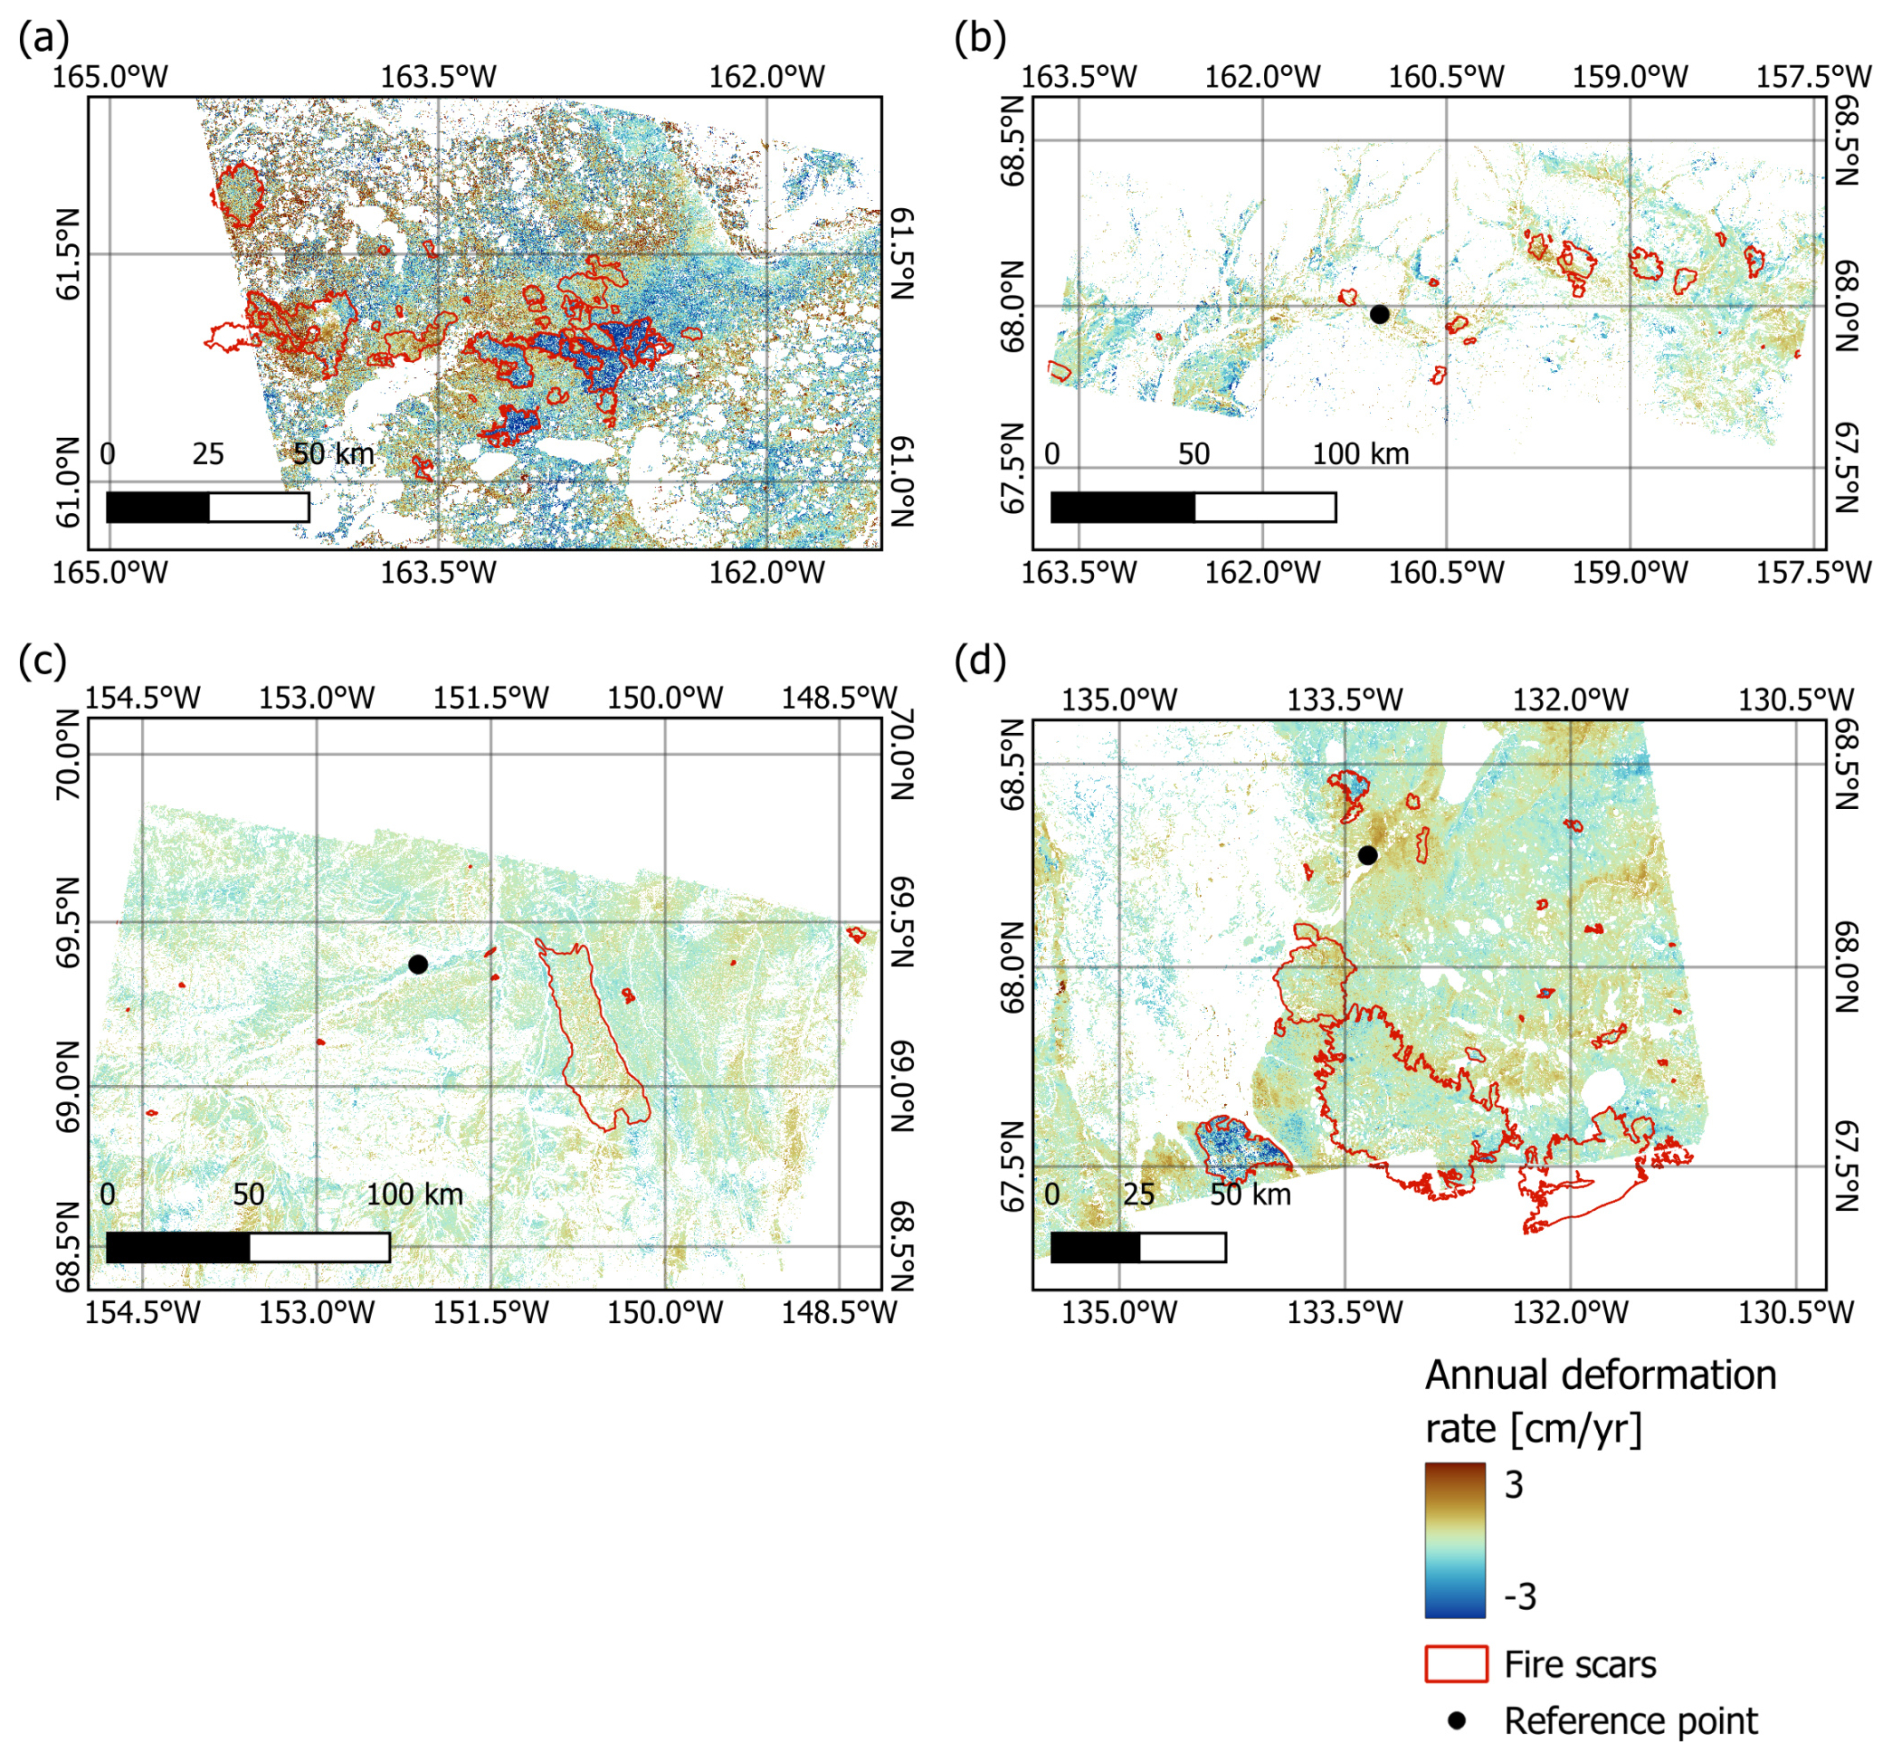
Figure A4PALSAR-2 annual deformation rate maps for the study regions (a) Yukon-Kuskokwim Delta, (b) Noatak River Basin, (c) Central North Slope, (d) Inuvik region. Values represent the annual deformation rate, calculated for all investigated years. Reference points are indicated, with the Yukon-Kuskokwim Delta reference point located southeast of the mapped area and selected at the Bethel airstrip. For the sources of fire scars, see Sect. 3.3.
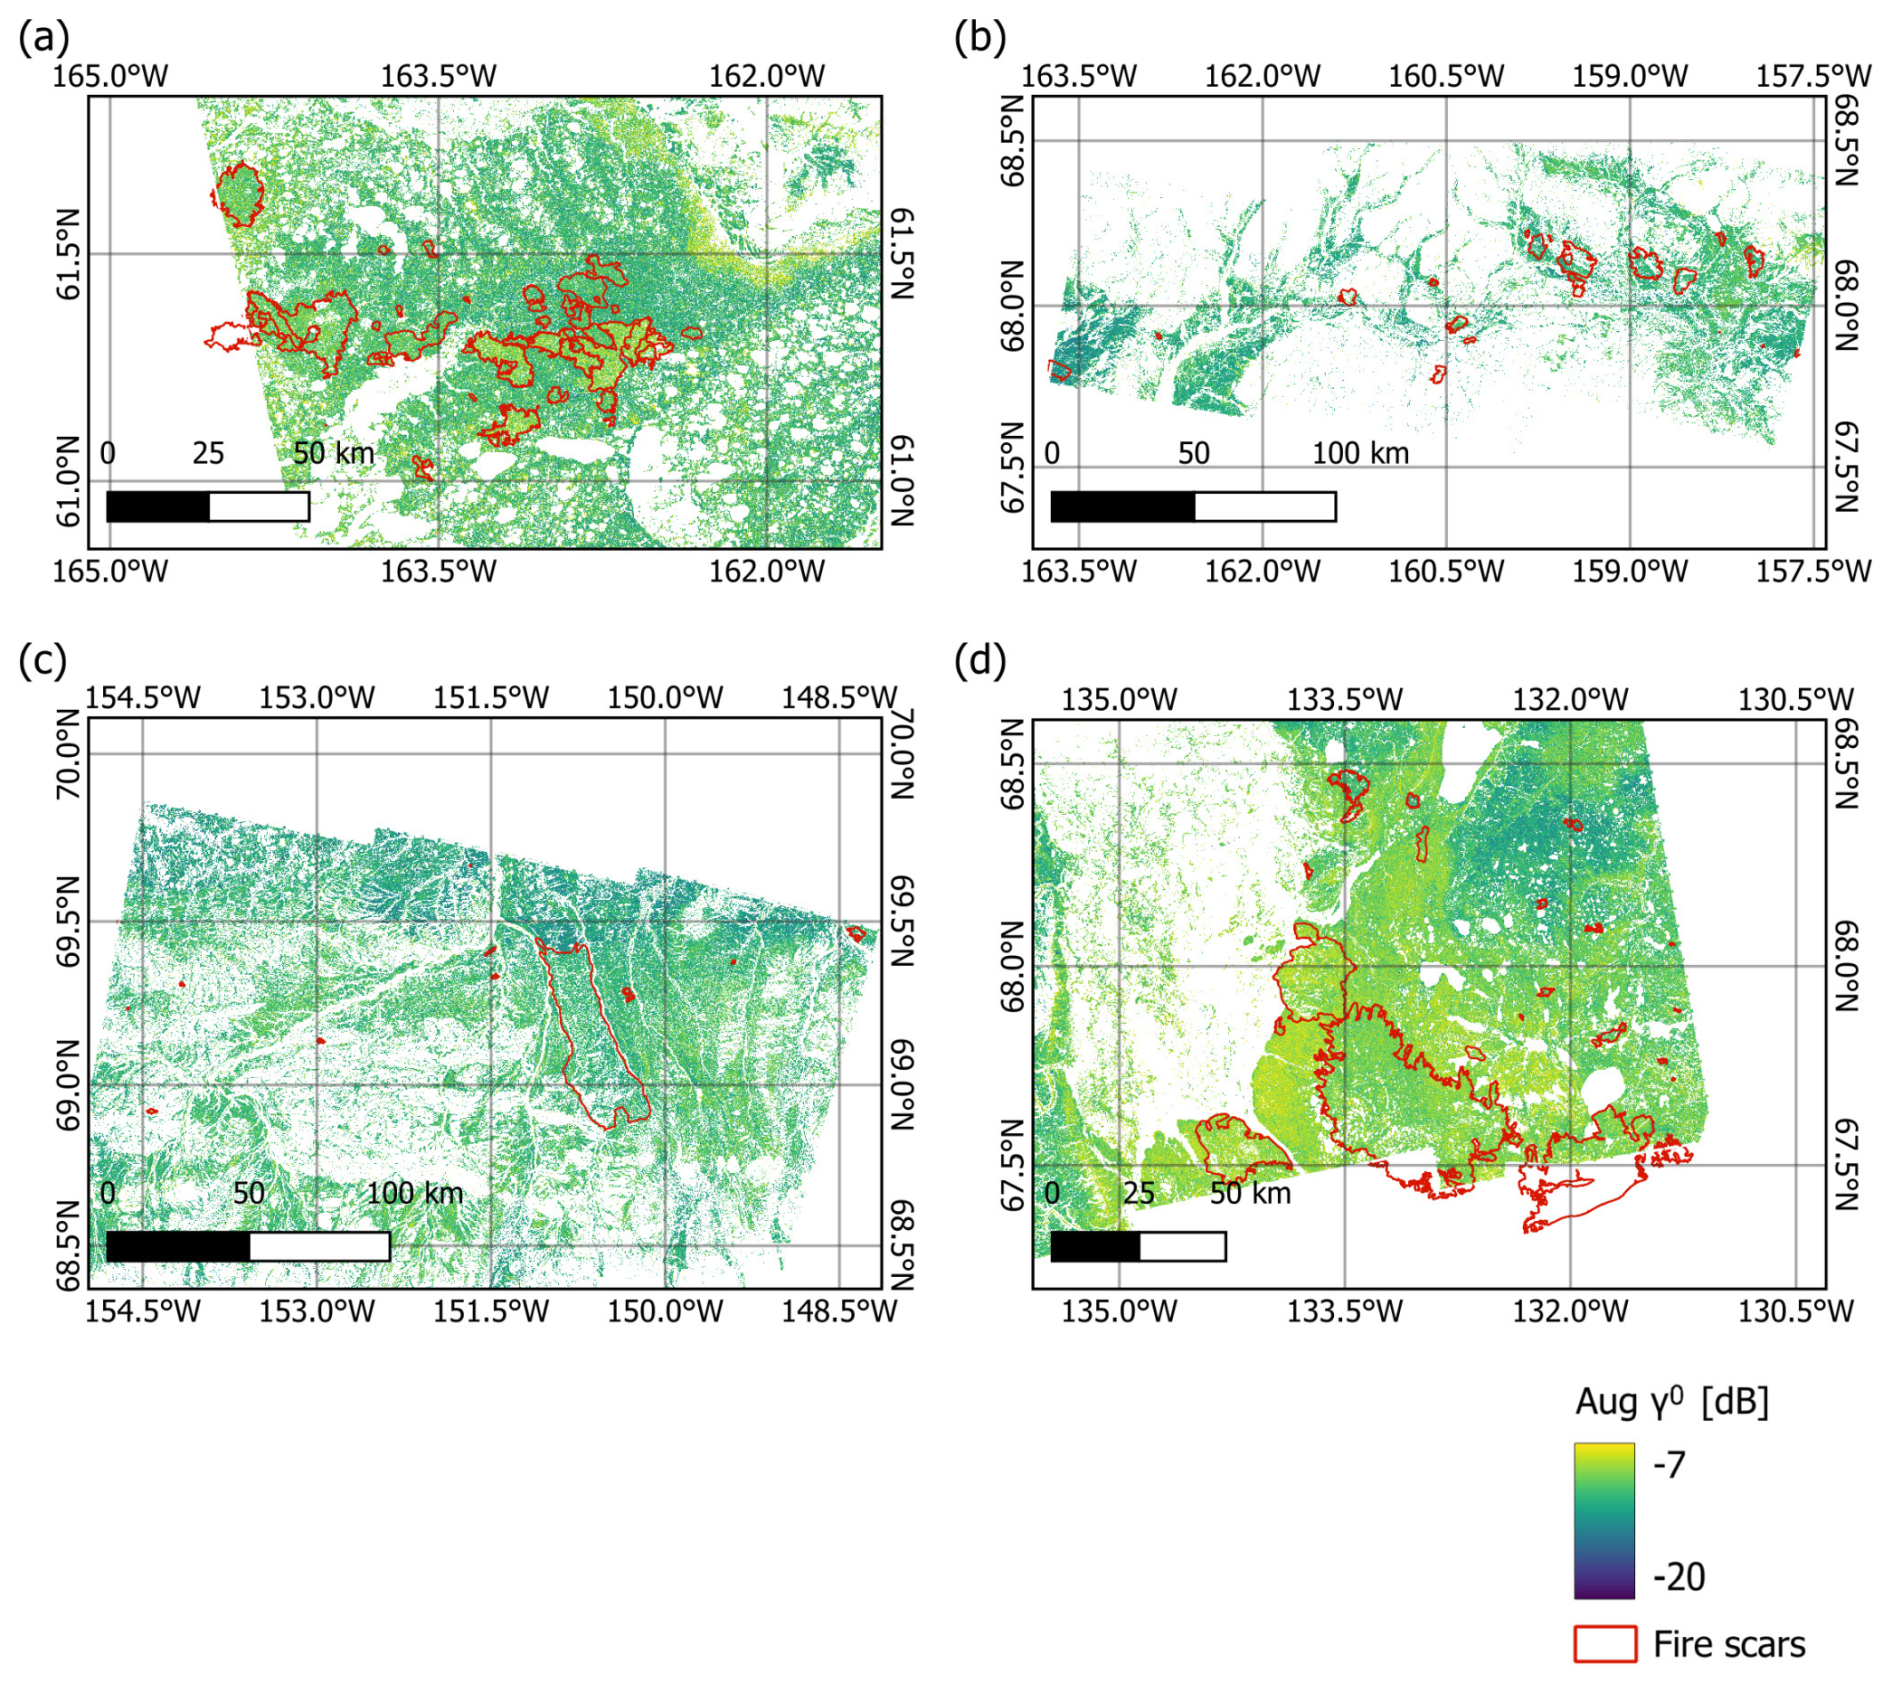
Figure A5Sentinel-1 summer backscatter maps for the study regions (a) Yukon-Kuskokwim Delta, (b) Noatak River Basin, (c) Central North Slope, (d) Inuvik region. Values represent the median of all calculated years. For the sources of fire scars, see Sect. 3.3.
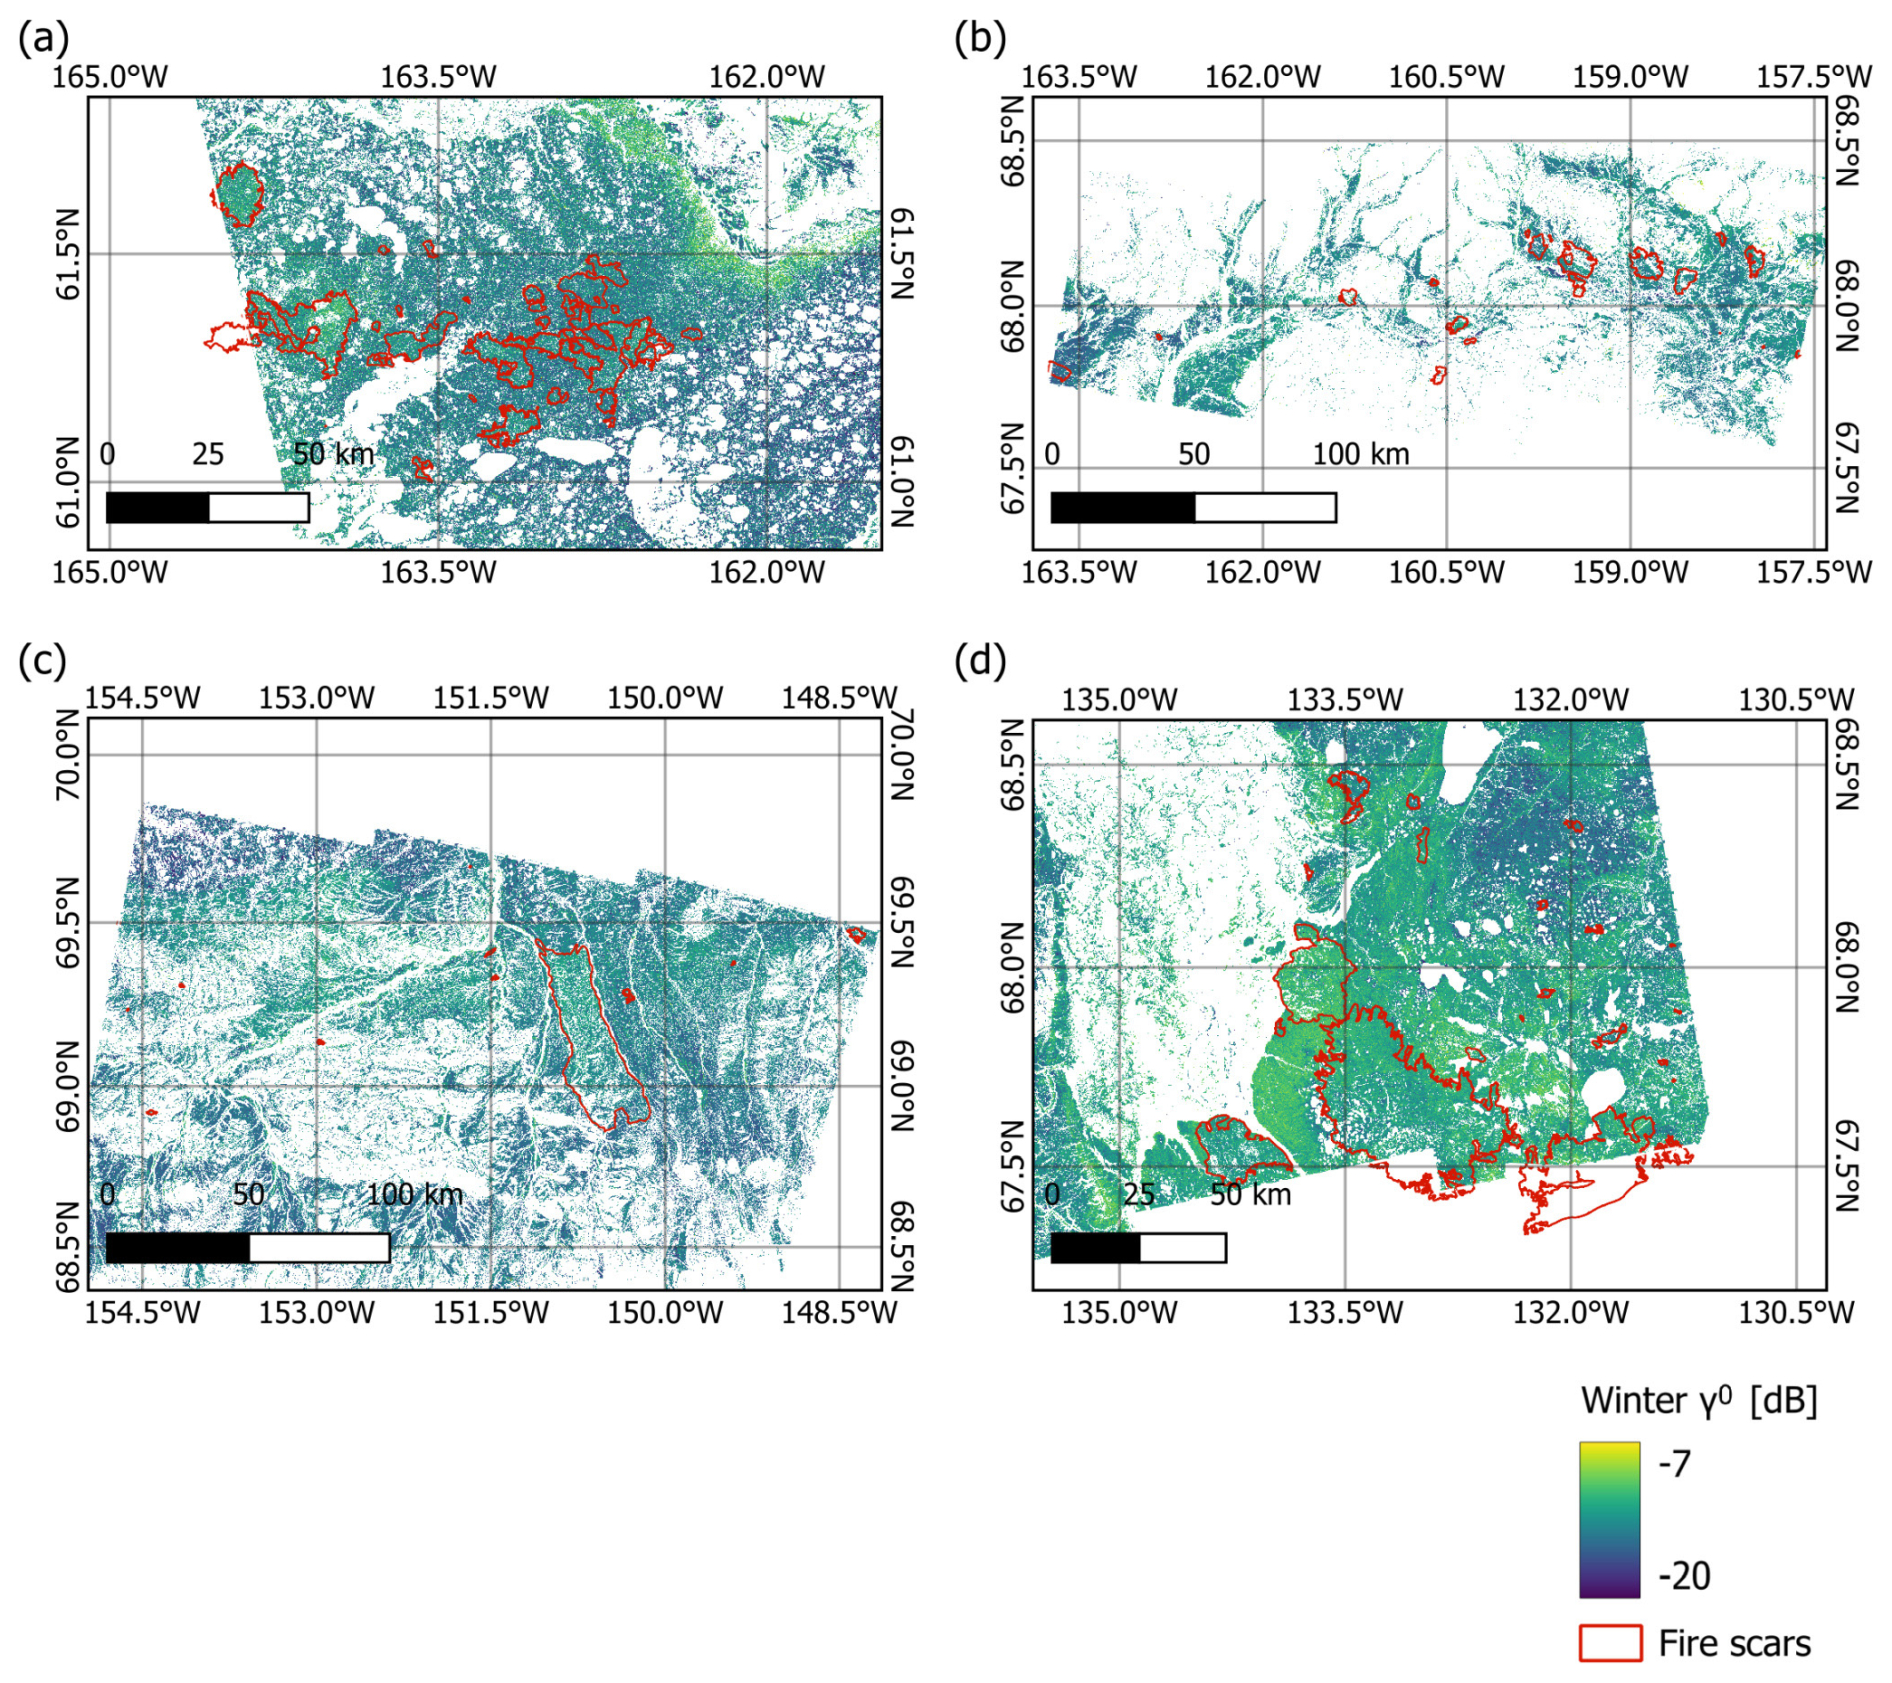
Figure A6Sentinel-1 winter backscatter maps for the study regions (a) Yukon-Kuskokwim Delta, (b) Noatak River Basin, (c) Central North Slope, (d) Inuvik region. Values represent the median of all calculated years. For the sources of fire scars, see Sect. 3.3.
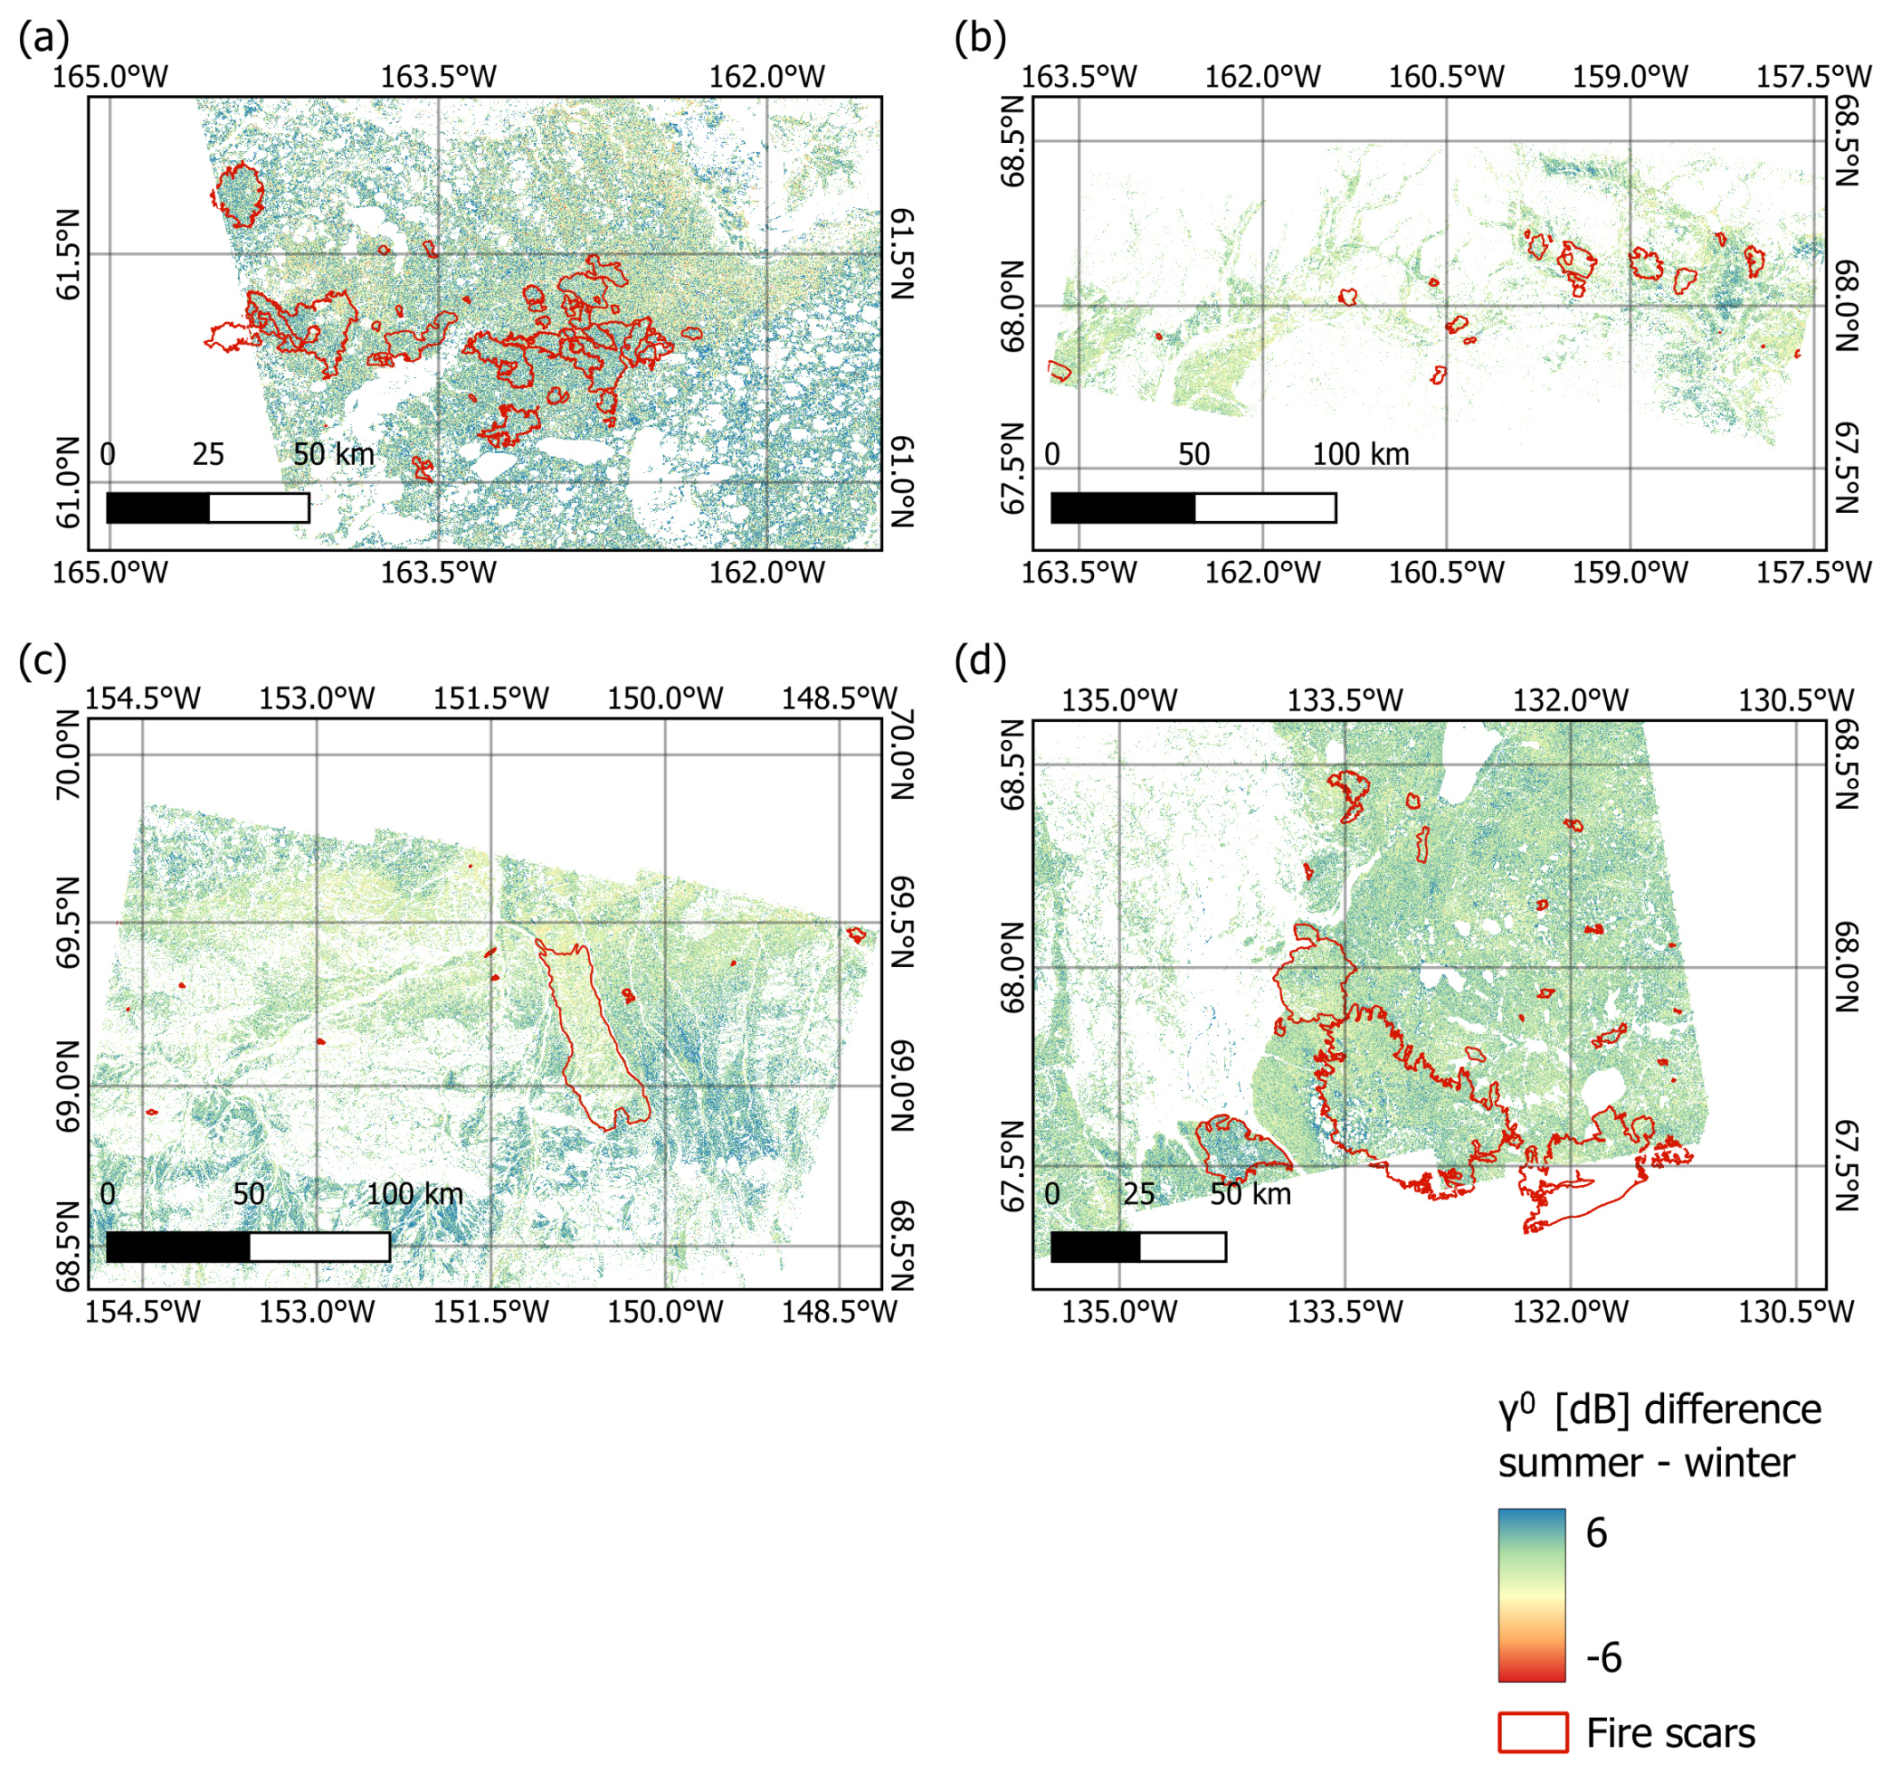
Figure A7Sentinel-1 backscatter difference of summer minus winter for the study regions (a) Yukon-Kuskokwim Delta, (b) Noatak River Basin, (c) Central North Slope, (d) Inuvik region. Values represent the median of all calculated years. For the sources of fire scars, see Sect. 3.3.
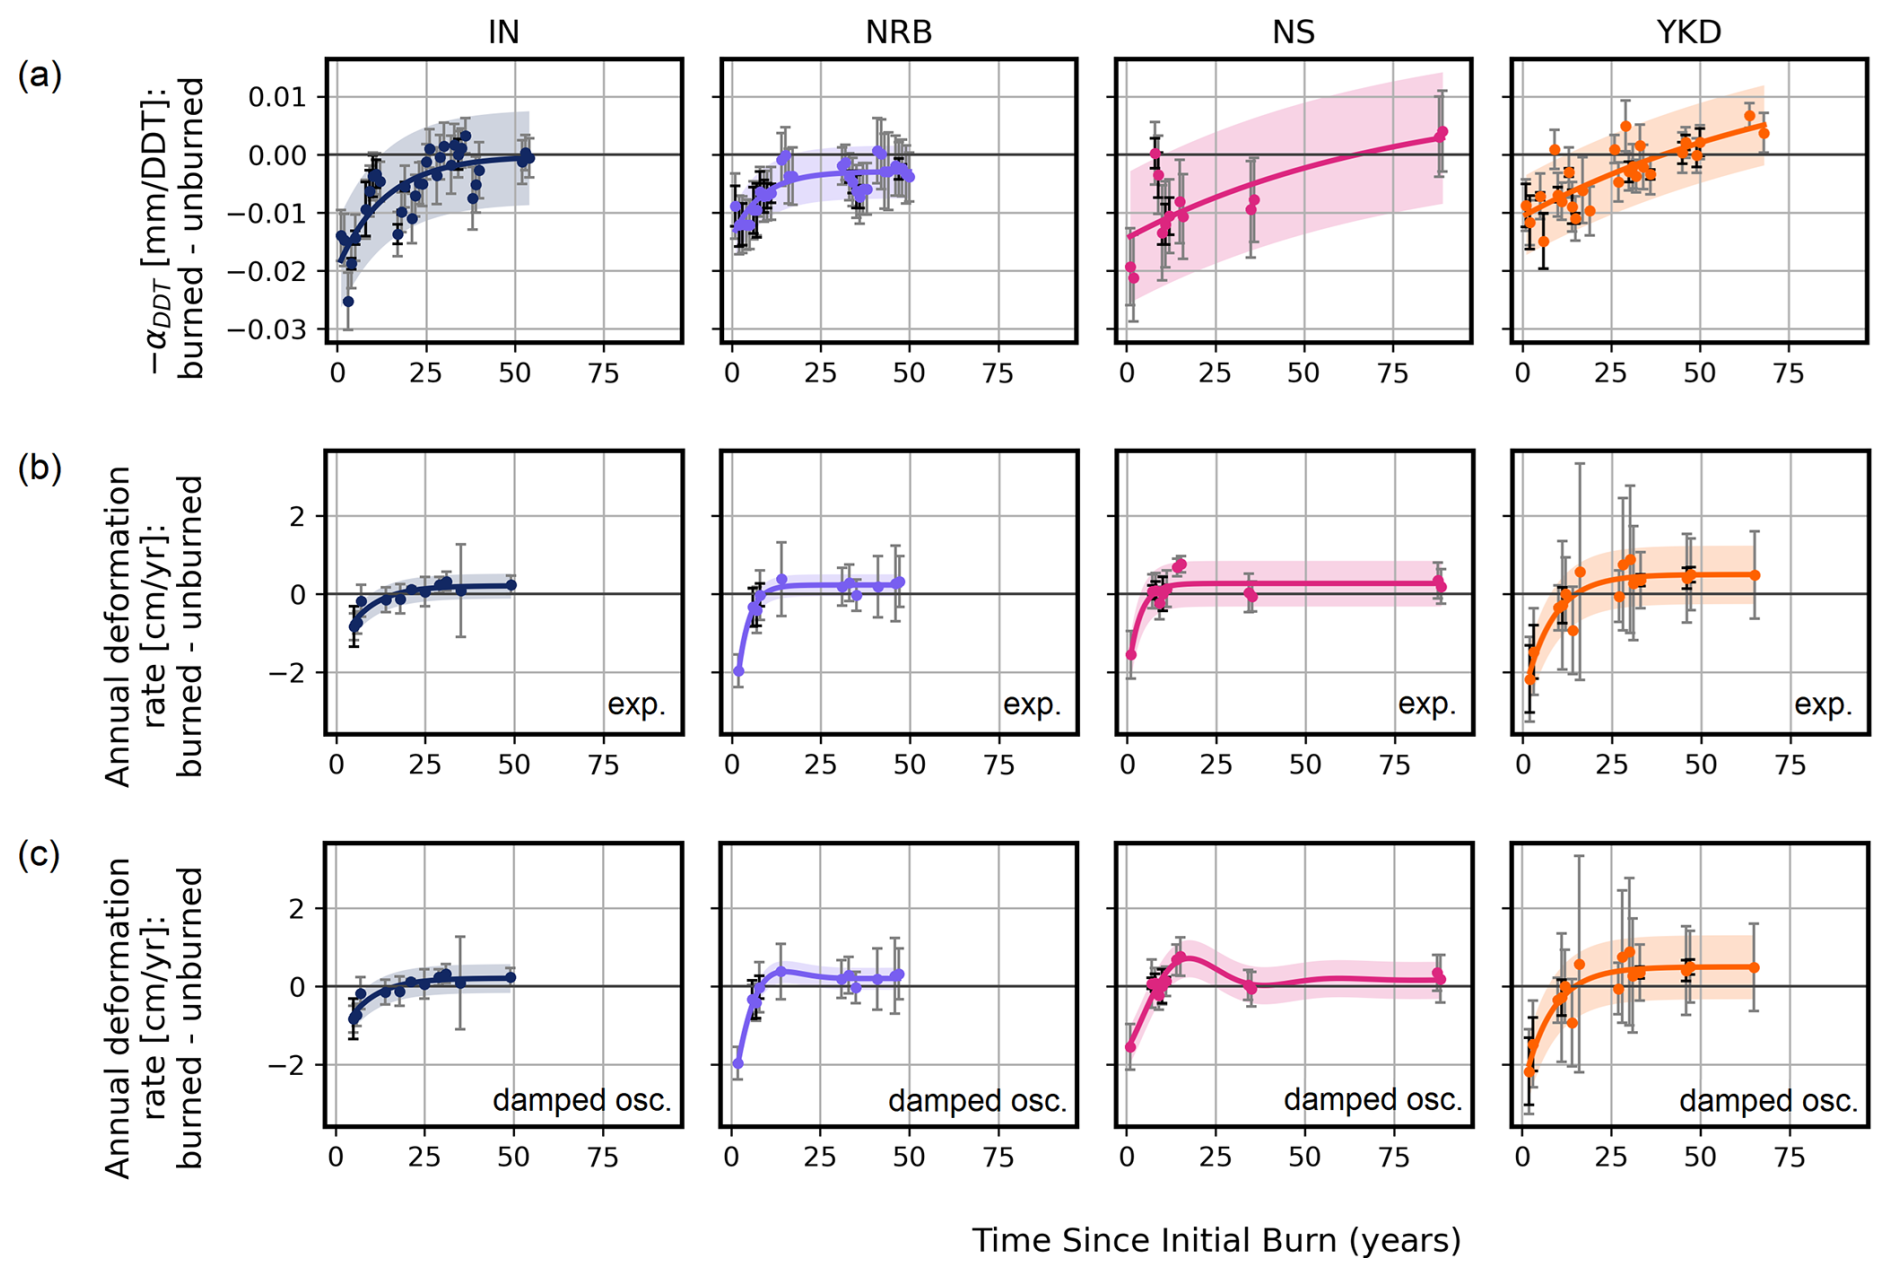
Figure A8Dependence of seasonal and annual deformation rates on fire scar age including InSAR uncertainty error bars complementing Fig. 4. Parameter values of the fire scars were normalized by subtracting the unburned buffer area values and averaged per year and study region (NRB: Noatak River Basin, NS: Central North Slope, YKD: Yukon-Kuskokwim Delta.) The shaded regions represent the 95 % uncertainty envelope of the fitted models estimated as the predicted value ± 1.96 times the residual standard error. The error bars in black represent the standard deviation across all fire scars within each time-since-burn year, as also depicted in Fig. 4. Grey error bars indicate the standard error of the linear regression for the thaw season deformation rate (−αDDT). For annual deformation rates, error bars represent the standard deviation of the linear model associated with the linear-model fit to the InSAR displacement time series. For the Yukon-Kuskokwim region, where annual deformation rates were estimated using the DDT-based approach by Liu et al. (2012), error bars represent the standard deviation of displacement residuals. Both exponential (Michaelides et al., 2019) (shown in b) and damped oscillation models (Cao and Furuya, 2025) (shown in c) were tested to describe the annual deformation rates (for functions see Table A9).
InSAR data were processed using the GAMMA software. All further processing was performed using freely available software (e.g., Rasterio, GDAL, QGIS).
Sentinel-1 satellite data are freely available from the Copernicus Data Space Ecosystem (https://dataspace.copernicus.eu, last access: 20 August 2026). PALSAR-2 data have been obtained under JAXA EO-RA3 PI agreement #ER3A2N076. Auxiliary data are openly available, and data access information is provided in the reference list.
BW and AB developed the concept for the study. BW processed all satellite data, analysed the results and wrote the first draft of the manuscript. BJ processed the LiDAR data. AB and BJ contributed to the writing of the manuscript.
The contact author has declared that none of the authors has any competing interests.
Publisher's note: Copernicus Publications remains neutral with regard to jurisdictional claims made in the text, published maps, institutional affiliations, or any other geographical representation in this paper. The authors bear the ultimate responsibility for providing appropriate place names. Views expressed in the text are those of the authors and do not necessarily reflect the views of the publisher.
This article is part of the special issue “Cryospheric ecosystems: climate feedback loops, threatened ecosystems, and consequences of climate change”. It is not associated with a conference.
This work was supported by the European Research Council project No. 951288 (Q-Arctic). PALSAR-2 data have been obtained under JAXA EO-RA3 PI agreement #ER3A2N076. BMJ was supported by US National Science Foundation award OIA-1929170.
This research has been supported by the European Research Council, H2020 European Research Council (grant no. 951288). BMJ was supported by US National Science Foundation award OIA-1929170.
This paper was edited by Krystyna Kozioł and reviewed by two anonymous referees.
Abe, T., Iwahana, G., Tadono, T., and Iijima, Y.: Ground Surface Displacement After a Forest Fire Near Mayya, Eastern Siberia, Using InSAR: Observation and Implication for Geophysical Modeling, Earth and Space Science, 9, https://doi.org/10.1029/2022EA002476, 2022. a
Antonova, S., Sudhaus, H., Strozzi, T., Zwieback, S., Kääb, A., Heim, B., Langer, M., Bornemann, N., and Boike, J.: Thaw Subsidence of a Yedoma Landscape in Northern Siberia, Measured In Situ and Estimated from TerraSAR-X Interferometry, Remote Sensing, 10, https://doi.org/10.3390/rs10040494, 2018. a
Bartsch, A., Leibman, M., Strozzi, T., Khomutov, A., Widhalm, B., Babkina, E., Mullanurov, D., Ermokhina, K., Kroisleitner, C., and Bergstedt, H.: Seasonal Progression of Ground Displacement Identified with Satellite Radar Interferometry and the Impact of Unusually Warm Conditions on Permafrost at the Yamal Peninsula in 2016, Remote Sensing, 11, https://doi.org/10.3390/rs11161865, 2019. a, b
Bartsch, A., Widhalm, B., Leibman, M., Ermokhina, K., Kumpula, T., Skarin, A., Wilcox, E. J., Jones, B. M., Frost, G. V., Höfler, A., and Pointner, G.: Feasibility of tundra vegetation height retrieval from Sentinel-1 and Sentinel-2 data, Remote Sens. Environ., 237, 111515, https://doi.org/10.1016/j.rse.2019.111515, 2020. a, b, c
Bartsch, A., Bergstedt, H., Pointner, G., Muri, X., Rautiainen, K., Leppänen, L., Joly, K., Sokolov, A., Orekhov, P., Ehrich, D., and Soininen, E. M.: Towards long-term records of rain-on-snow events across the Arctic from satellite data, The Cryosphere, 17, 889–915, https://doi.org/10.5194/tc-17-889-2023, 2023. a
Bartsch, A., Efimova, A., Widhalm, B., Muri, X., von Baeckmann, C., Bergstedt, H., Ermokhina, K., Hugelius, G., Heim, B., and Leibman, M.: Circumarctic land cover diversity considering wetness gradients, Hydrol. Earth Syst. Sci., 28, 2421–2481, https://doi.org/10.5194/hess-28-2421-2024, 2024. a, b, c
Bartsch, A., Widhalm, B., Radha Krishnan, S. R., and Liu, Z.: Tracking land surface deformation in lowland permafrost regions across the Arctic exploiting the first decade of Copernicus Sentinel-1, Remote Sens. Environ., 340, 115409, https://doi.org/10.1016/j.rse.2026.115409, 2026. a
Berardino, P., Fornaro, G., Lanari, R., and Sansosti, E.: A new algorithm for surface deformation monitoring based on small baseline differential SAR interferograms, IEEE T. Geosci. Remote, 40, 2375–2383, https://doi.org/10.1109/TGRS.2002.803792, 2002. a
Bergstedt, H., Zwieback, S., Bartsch, A., and Leibman, M.: Dependence of C-Band Backscatter on Ground Temperature, Air Temperature and Snow Depth in Arctic Permafrost Regions, Remote Sensing, 10, https://doi.org/10.3390/rs10010142, 2018. a
Bliss, L. C. and Wein, R. W.: Plant community responses to disturbances in the western Canadian Arctic, Can. J. Botany, 50, 1097–1109, https://doi.org/10.1139/b72-136, 1972. a
Bureau of Land Management, Alaska Interagency Coordination Center: Alaska Fire History Perimeter Polygons, 1940–2024, AICC [data set], https://fire.ak.blm.gov/predsvcs/maps.php (last accessed: 1 April 2025), 2024. a
Burns, J. J.: Pingos in the Yukon-Kuskokwim Delta, Alaska: Their Plant Succession and Use by Mink, Arctic, 17, 203–210, http://www.jstor.org/stable/40507169 (last access: 20 August 2026), 1964. a
Cao, Z. and Furuya, M.: Decades-Long Evolution of Post-Fire Permafrost Deformation Detected by InSAR: Insights From Chronosequence in North Yukon, AGU Advances, 6, e2025AV001849, https://doi.org/10.1029/2025AV001849, 2025. a, b, c, d, e, f, g, h, i, j, k, l, m, n, o, p
Chen, J., Wu, Y., O'Connor, M., Cardenas, M. B., Schaefer, K., Michaelides, R., and Kling, G.: Active layer freeze-thaw and water storage dynamics in permafrost environments inferred from InSAR, Remote Sens. Environ., 248, 112007, https://doi.org/10.1016/j.rse.2020.112007, 2020. a
Chen, R. H., Michaelides, R. J., Chen, J., Chen, A. C., Clayton, L. K., Bakian-Dogaheh, K., Huang, L., Jafarov, E., Liu, L., Moghaddam, M., Parsekian, A. D., Sullivan, T. D., Tabatabaeenejad, A., Wig, E., Zebker, H. A., and Zhao, Y.: ABoVE: Active Layer Thickness from Airborne L- and P-band SAR, Alaska, 2017, Ver. 3, ORNL Distributed Active Archive Center [data set], https://doi.org/10.3334/ORNLDAAC/2004, 2022. a, b, c
Chen, R. H., Michaelides, R. J., Zhao, Y., Huang, L., Wig, E., Sullivan, T. D., Parsekian, A. D., Zebker, H. A., Moghaddam, M., and Schaefer, K. M.: Permafrost Dynamics Observatory (PDO): 2. Joint Retrieval of Permafrost Active Layer Thickness and Soil Moisture From L-Band InSAR and P-Band PolSAR, Earth and Space Science, 10, e2022EA002453, https://doi.org/10.1029/2022EA002453, 2023. a
Chen, Y., Hu, F. S., and Lara, M. J.: Divergent shrub-cover responses driven by climate, wildfire, and permafrost interactions in Arctic tundra ecosystems, Glob. Change Biol., 27, 652–663, https://doi.org/10.1111/gcb.15451, 2021a. a
Chen, Y., Lara, M. J., Jones, B. M., Frost, G. V., and Hu, F. S.: Thermokarst acceleration in Arctic tundra driven by climate change and fire disturbance, One Earth, 4, 1718–1729, https://doi.org/10.1016/j.oneear.2021.11.011, 2021b. a
Clayton, L., Schaefer, K., Hoy, E., Elder, C., French, N., Frost, G., Wig, E., and Lee, X.: Tundra recovery post-fire in the Yukon-Kuskokwim Delta, Alaska, Environ. Res. Lett., 20, https://doi.org/10.1088/1748-9326/adbfaa, 2025. a, b, c, d, e, f, g, h, i, j, k
Copernicus: Copernicus DEM – Global Digital Elevation Model, CDSE [data set], https://doi.org/10.5270/ESA-c5d3d65, 2019. a, b
Costantini, M.: A novel phase unwrapping method based on network programming, IEEE T. Geosci. Remote, 36, 813–821, https://doi.org/10.1109/36.673674, 1998. a, b
Elias, S. A., Hamilton, T. D., Edwards, M. E., Begét, J. E., Krumhardt, A. P., and Lavoie, C.: Late Pleistocene environments of the western Noatak basin, northwestern Alaska, GSA Bulletin, 111, 769–789, https://doi.org/10.1130/0016-7606(1999)111<0769:LPEOTW>2.3.CO;2, 1999. a
Eshqi Molan, Y., Kim, J.-W., Lu, Z., Wylie, B., and Zhu, Z.: Modeling Wildfire-Induced Permafrost Deformation in an Alaskan Boreal Forest Using InSAR Observations, Remote Sensing, 10, https://doi.org/10.3390/rs10030405, 2018. a
European Commission, Joint Research Centre: Global Land Cover 2000 database, European Commission, Joint Research Centre [data set], https://forobs.jrc.ec.europa.eu/products/glc2000/glc2000.php (last access: 20 August 2026), 2003. a, b
Foster, A. C., Wang, J. A., Frost, G. V., Davidson, S. J., Hoy, E., Turner, K. W., Sonnentag, O., Epstein, H., Berner, L. T., Armstrong, A. H., Kang, M., Rogers, B. M., Campbell, E., Miner, K. R., Orndahl, K. M., Bourgeau-Chavez, L. L., Lutz, D. A., French, N., Chen, D., Du, J., Shestakova, T. A., Shuman, J. K., Tape, K., Virkkala, A.-M., Potter, C., and Goetz, S.: Disturbances in North American boreal forest and Arctic tundra: impacts, interactions, and responses, Environ. Res. Lett., 17, 113001, https://doi.org/10.1088/1748-9326/ac98d7, 2022. a
Frost, G. V., Loehman, R. A., Saperstein, L. B., Macander, M. J., Nelson, P. R., Paradis, D. P., and Natali, S. M.: Multi-decadal patterns of vegetation succession after tundra fire on the Yukon-Kuskokwim Delta, Alaska, Environ. Res. Lett., 15, 025003, https://doi.org/10.1088/1748-9326/ab5f49, 2020. a, b, c
Gaglioti, B. V., Berner, L. T., Jones, B. M., Orndahl, K. M., Williams, A. P., Andreu-Hayles, L., D'Arrigo, R. D., Goetz, S. J., and Mann, D. H.: Tussocks Enduring or Shrubs Greening: Alternate Responses to Changing Fire Regimes in the Noatak River Valley, Alaska, J. Geophys. Res.-Biogeo., 126, https://doi.org/10.1029/2020JG006009, 2021. a, b
Geological Survey of Canada: Surficial geology of Canada; Geological Survey of Canada, Canadian Geoscience Map 195 (preliminary, Surficial Data Model v. 2.0 conversion of Map1880A), scale 1:5 000 000, https://doi.org/10.4095/295462, 2014. a
Goldstein, R. M. and Werner, C. L.: Radar interferogram filtering for geophysical applications, Geophys. Res. Lett., 25, 4035–4038, https://doi.org/10.1029/1998GL900033, 1998. a, b
Heim, R. J., Rocha, A. V., Zemlianskii, V., Barrett, K., Bültmann, H., Breen, A., Frost, G. V., Hollingsworth, T. N., Jandt, R., Kozlova, M., Kurka, A., Jorgenson, M. T., Landhäusser, S. M., Loranty, M. M., Miller, E. A., Narita, K., Pravdolyubova, E., Hölzel, N., and Schaepman-Strub, G.: Arctic tundra ecosystems under fire – Alternative ecosystem states in a changing climate?, J. Ecol., 113, https://doi.org/10.1111/1365-2745.70022, 2025. a, b, c
Hersbach, H., Bell, B., Berrisford, P., Biavati, G., Horányi, A., Muñoz Sabater, J., Nicolas, J., Peubey, C., Radu, R., Rozum, I., Schepers, D., Simmons, A., Soci, C., Dee, D., and Thépaut, J.-N.: ERA5 hourly data on single levels from 1940 to present, Copernicus Climate Change Service (C3S) Climate Data Store (CDS) [data set], https://doi.org/10.24381/cds.adbb2d47, 2023. a
Holloway, J. E., Lewkowicz, A. G., Douglas, T. A., Li, X., Turetsky, M. R., Baltzer, J. L., and Jin, H.: Impact of wildfire on permafrost landscapes: A review of recent advances and future prospects, Permafrost Periglac., 31, 371–382, https://doi.org/10.1002/ppp.2048, 2020. a, b, c, d, e, f, g
Holt, E., McCune, B., and Neitlich, P.: Macrolichen communities in relation to soils and vegetation in the Noatak National Preserve, Alaska, Botany, 87, 241–252, https://doi.org/10.1139/B08-142, 2009. a
Hu, F., Higuera, P., Duffy, P., Chipman, M., Rocha, A., Young, A., Kelly, R., and Dietze, M.: Arctic tundra fires: natural variability and responses to climate change, Front. Ecol. Environ., 13, 369–377, https://doi.org/10.1890/150063, 2015. a
Iwahana, G., Uchida, M., Liu, L., Gong, W., Meyer, F. J., Guritz, R., Yamanokuchi, T., and Hinzman, L.: InSAR Detection and Field Evidence for Thermokarst after a Tundra Wildfire, Using ALOS-PALSAR, Remote Sensing, 8, https://doi.org/10.3390/rs8030218, 2016. a
Jafarov, E. E., Romanovsky, V. E., Genet, H., McGuire, A. D., and Marchenko, S. S.: The effects of fire on the thermal stability of permafrost in lowland and upland black spruce forests of interior Alaska in a changing climate, Environ. Res. Lett., 8, 035030, https://doi.org/10.1088/1748-9326/8/3/035030, 2013. a
Jandt, R. R., Miller, E. A., and Jones, B. N.: Fire effects 10 years after the anaktuvuk river tundra fire, Tech. rep., US Department of the Interior, Bureau of Land Management, https://www.blm.gov/sites/default/files/docs/2021-06/BLM_AK_TR_64.pdf (last access: 20 August 2026), 2021. a
Jenkins, L., Bourgeau-Chavez, L., French, N., Loboda, T., and Thelen, B.: Development of Methods for Detection and Monitoring of Fire Disturbance in the Alaskan Tundra Using a Two-Decade Long Record of Synthetic Aperture Radar Satellite Images, Remote Sensing, 6, 6347–6364, https://doi.org/10.3390/rs6076347, 2014. a, b, c, d, e
Jones, B., Grosse, G., Arp, C. D., Miller, E., Liu, L., Hayes, D. J., and Larsen, C. F.: Recent Arctic tundra fire initiates widespread thermokarst development, Scientific Reports, 5, 15865, https://doi.org/10.1038/srep15865, 2015. a
Jones, B., Kanevskiy, M., Shur, Y., Gaglioti, B., Jorgenson, M., Ward Jones, M., Veremeeva, A., Miller, E., and Jandt, R.: Post-fire stabilization of thaw-affected permafrost terrain in northern Alaska, Scientific Reports, 14, https://doi.org/10.1038/s41598-024-58998-5, 2024a. a
Jones, B., Kanevskiy, M., Shur, Y., Ward Jones, M., Gaglioti, B., Jorgenson, T., Veremeeva, A., Miller, E., and Jandt, R.: Multi-temporal elevation data, ground temperature time-series, and permafrost borehole logs document the recovery of permafrost at the Anaktuvuk River tundra fire, 2009 to 2023, Arctic Data Center [data set], https://doi.org/10.18739/A2251FM9P, 2024b. a, b, c, d, e, f, g, h
Jones, B. M., Breen, A. L., Gaglioti, B. V., Mann, D. H., Rocha, A. V., Grosse, G., Arp, C. D., Kunz, M. L., and Walker, D. A.: Identification of unrecognized tundra fire events on the north slope of Alaska, J. Geophys. Res.-Biogeo., 118, 1334–1344, https://doi.org/10.1002/jgrg.20113, 2013. a
Jones, B. M., Tape, K. D., Clark, J. A., Bondurant, A. C., Ward Jones, M. K., Gaglioti, B. V., Elder, C. D., Witharana, C., and Miller, C. E.: Multi-Dimensional Remote Sensing Analysis Documents Beaver-Induced Permafrost Degradation, Seward Peninsula, Alaska, Remote Sensing, 13, https://doi.org/10.3390/rs13234863, 2021. a
Jorgenson, M. T. and Roth, J. E.: Landscape classification and mapping for the Yukon-Kuskokwim Delta, Alaska, Tech. rep., U.S. Fish and Wildlife Service by ABR, Inc., Environmental Research and Services, Fairbanks, AK, USA, https://www.academia.edu/106336923/LANDSCAPE_CLASSIFICATION (last access: 20 Augsut 2026), 2010. a
Kasischke, E., Williams, D., and Barry, D.: Analysis of patterns of large fires in the boreal forest region of Alaska, Int. J. Wildland Fire, 11.2, 131–144, https://doi.org/10.1071/WF02023, 2002. a
Kolden, C. A. and Rogan, J.: Mapping Wildfire Burn Severity in the Arctic Tundra from Downsampled MODIS Data, Arct. Antarct. Alp. Res., 45, 64–76, https://doi.org/10.1657/1938-4246-45.1.64, 2013. a, b
Liljedahl, A., Hinzman, L., Busey, R., and Yoshikawa, K.: Physical short-term changes after a tussock tundra fire, Seward Peninsula, Alaska, J. Geophys. Res.-Earth, 112, https://doi.org/10.1029/2006JF000554, 2007. a
Liu, L., Schaefer, K., Zhang, T., and Wahr, J.: Estimating 1992–2000 average active layer thickness on the Alaskan North Slope from remotely sensed surface subsidence, J. Geophys. Res.-Earth, 117, https://doi.org/10.1029/2011JF002041, 2012. a, b, c
Liu, L., Jafarov, E. E., Schaefer, K. M., Jones, B. M., Zebker, H. A., Williams, C. A., Rogan, J., and Zhang, T.: InSAR detects increase in surface subsidence caused by an Arctic tundra fire, Geophys. Res. Lett., 41, 3906–3913, https://doi.org/10.1002/2014GL060533, 2014. a, b
Mack, M., Bret-Harte, M., Hollingsworth, T., Jandt, R., Schuur, E., Shaver, G., and Verbyla, D.: Carbon loss from an unprecedented Arctic tundra wildfire, Nature, 475, 489–92, https://doi.org/10.1038/nature10283, 2011. a
Madaj, L.: Entangled climate risks: Interactions between permafrost thaw and wildfires, Cascade Institute, version 1.0, https://cascadeinstitute.org/technical-paper/permafrost-wildfires-brief/ (last access: 20 August 2026), 2025. a
Masrur, A., Petrov, A. N., and DeGroote, J.: Circumpolar spatio-temporal patterns and contributing climatic factors of wildfire activity in the Arctic tundra from 2001–2015, Environ. Res. Lett., 13, 014019, https://doi.org/10.1088/1748-9326/aa9a76, 2018. a
McCarty, J. L., Aalto, J., Paunu, V.-V., Arnold, S. R., Eckhardt, S., Klimont, Z., Fain, J. J., Evangeliou, N., Venäläinen, A., Tchebakova, N. M., Parfenova, E. I., Kupiainen, K., Soja, A. J., Huang, L., and Wilson, S.: Reviews and syntheses: Arctic fire regimes and emissions in the 21st century, Biogeosciences, 18, 5053–5083, https://doi.org/10.5194/bg-18-5053-2021, 2021. a, b, c
Michaelides, R. J., Schaefer, K., Zebker, H. A., Parsekian, A., Liu, L., Chen, J., Natali, S., Ludwig, S., and Schaefer, S. R.: Inference of the impact of wildfire on permafrost and active layer thickness in a discontinuous permafrost region using the remotely sensed active layer thickness (ReSALT) algorithm, Environ. Res. Lett., 14, 035007, https://doi.org/10.1088/1748-9326/aaf932, 2019. a, b, c, d, e, f, g, h, i, j, k, l, m, n, o, p, q, r, s, t, u, v, w, x
Miller, E. A., Jones, B. M., Baughman, C. A., Jandt, R. R., Jenkins, J. L., and Yokel, D. A.: Unrecorded Tundra Fires of the Arctic Slope, Alaska USA, Fire, 6, https://doi.org/10.3390/fire6030101, 2023. a, b
Miller, E. A., Baughman, C. A., Jones, B. M., and Jandt, R. R.: Biophysical effects of an old tundra fire in the Brooks Range Foothills of Northern Alaska, U.S.A, Polar Sci., 39, 100984, https://doi.org/10.1016/j.polar.2023.100984, 2024. a, b, c, d, e
Muller, S., Walker, D., and Jorgenson, M.: Land Cover and Ecosystem Map Collection for Northern Alaska, ORNL DAAC, Oak Ridge, Tennessee, USA [data set], https://doi.org/10.3334/ORNLDAAC/1359, 2018. a
Myers-Smith, I. H., Forbes, B. C., Wilmking, M., Hallinger, M., Lantz, T., Blok, D., Tape, K. D., Macias-Fauria, M., Sass-Klaassen, U., Lévesque, E., Boudreau, S., Ropars, P., Hermanutz, L., Trant, A., Collier, L. S., Weijers, S., Rozema, J., Rayback, S. A., Schmidt, N. M., Schaepman-Strub, G., Wipf, S., Rixen, C., Ménard, C. B., Venn, S., Goetz, S., Andreu-Hayles, L., Elmendorf, S., Ravolainen, V., Welker, J., Grogan, P., Epstein, H. E., and Hik, D. S.: Shrub expansion in tundra ecosystems: dynamics, impacts and research priorities, Environ. Res. Lett., 6, 045509, https://doi.org/10.1088/1748-9326/6/4/045509, 2011. a
Nossov, D. R., Torre Jorgenson, M., Kielland, K., and Kanevskiy, M. Z.: Edaphic and microclimatic controls over permafrost response to fire in interior Alaska, Environ. Res. Lett., 8, 035013, https://doi.org/10.1088/1748-9326/8/3/035013, 2013. a
Obu, J., Westermann, S., Bartsch, A., Berdnikov, N., Christiansen, H. H., Dashtseren, A., Delaloye, R., Elberling, B., Etzelmüller, B., Kholodov, A., Khomutov, A., Kääb, A., Leibman, M. O., Lewkowicz, A. G., Panda, S. K., Romanovsky, V., Way, R. G., Westergaard-Nielsen, A., Wu, T., Yamkhin, J., and Zou, D.: Northern Hemisphere permafrost map based on TTOP modelling for 2000–2016 at 1 km2 scale, Earth-Sci. Rev., 193, 299–316, https://doi.org/10.1016/j.earscirev.2019.04.023, 2019. a, b, c
Racine, C. H., Dennis, J. G., and Patterson, W. A.: Tundra Fire Regimes in the Noatak River Watershed, Alaska: 1956-83, Arctic, 38, 194–200, http://www.jstor.org/stable/40510382, 1985. a
Schaefer, K., Liu, L., Parsekian, A., Jafarov, E., Chen, A., Zhang, T., Gusmeroli, A., Panda, S., Zebker, H. A., and Schaefer, T.: Remotely Sensed Active Layer Thickness (ReSALT) at Barrow, Alaska Using Interferometric Synthetic Aperture Radar, Remote Sensing, 7, 3735–3759, https://doi.org/10.3390/rs70403735, 2015. a
Smith, S., Riseborough, D., and Bonnaventure, P.: Eighteen Year Record of Forest Fire Effects on Ground Thermal Regimes and Permafrost in the Central Mackenzie Valley, NWT, Canada, Permafrost Periglac., 26, https://doi.org/10.1002/ppp.1849, 2015. a
Strozzi, T., Jones, N., Boike, J., Antonova, S., Heim, B., Leinss, S., Wegmüller, U., Westermann, S., Kääb, A., Grosse, G., and Bartsch, A.: Seasonal vertical surface thaw displacement in 2018 on Samoylov Island (Lena Delta, northeastern Siberia) measured by satellite SAR interferometry with X-, C- and L-band sensors, Remote Sens. Environ., 335, 115293, https://doi.org/10.1016/j.rse.2026.115293, 2026. a
Werner, C., Wegmüller, U., and Strozzi, T.: Deformation time-series of the Lost-Hills oil field using a multibaseline interferometric SAR inversion algorithm with finite difference smoothing constraints, in: Proceedings of the AGU Fall Meeting, San Francisco, CA, USA, https://www.gamma-rs.ch/uploads/media/2012-1_Multi-Baseline_Time-Series.pdf (last access: 20 August 2026), 2012. a
Westermann, S., Barboux, C., Bartsch, A., Delaloye, R., Grosse, G., Heim, B., Hugelius, G., Irrgang, A., Kääb, A., Matthes, H., Nitze, I., Pellet, C., Seifert, F., Strozzi, T., Wegmüller, U., Wieczorek, M., and Wiesmann, A.: ESA Permafrost Climate Change Initiative (Permafrost_cci): Permafrost version 4 data products, NERC EDS Centre for Environmental Data Analysis [data set], https://catalogue.ceda.ac.uk/uuid/e852d5caed0d40f7ad78432f9b42f9a4/ (last access: 20 August 2026), 2024. a, b, c, d, e, f, g
Widhalm, B., Bartsch, A., and Heim, B.: A novel approach for the characterization of tundra wetland regions with C-band SAR satellite data, Int. J. Remote Sens., 36, 5537–5556, https://doi.org/10.1080/01431161.2015.1101505, 2015. a
Widhalm, B., Bartsch, A., Strozzi, T., Jones, N., Khomutov, A., Babkina, E., Leibman, M., Khairullin, R., Göckede, M., Bergstedt, H., von Baeckmann, C., and Muri, X.: InSAR-derived seasonal subsidence reflects spatial soil moisture patterns in Arctic lowland permafrost regions, The Cryosphere, 19, 1103–1133, https://doi.org/10.5194/tc-19-1103-2025, 2025. a, b, c, d, e, f, g, h, i, j
Wig, E., Schaefer, K., Michaelides, R., Chen, R., Clayton, L. K., Fager, B., Huang, L., Parsekian, A. D., Zebker, H., Zhang, Y., and Zhao, Y.: Permafrost Dynamics Observatory: 3. Remote Sensing Big Data for the Active Layer, Soil Moisture, and Greening and Browning, Earth and Space Science, 12, https://doi.org/10.1029/2024EA003725, 2025. a, b, c, d
Yanagiya, K., Furuya, M., Danilov, P., and Iwahana, G.: Transient Freeze-Thaw Deformation Responses to the 2018 and 2019 Fires Near Batagaika Megaslump, Northeast Siberia, J. Geophys. Res.-Earth, 128, e2022JF006817, https://doi.org/10.1029/2022JF006817, 2023. a
Yi, Y., Chen, R. H., Moghaddam, M., Kimball, J. S., Jones, B. M., Jandt, R. R., Miller, E. A., and Miller, C. E.: Sensitivity of Multifrequency Polarimetric SAR Data to Postfire Permafrost Changes and Recovery Processes in Arctic Tundra, IEEE T. Geosci. Remote, 60, 1–15, https://doi.org/10.1109/TGRS.2021.3125715, 2022. a, b, c, d, e
Zhang, C., Douglas, T. A., Brodylo, D., Jorgenson, M. T., and Bosche, L. V.: Mapping permafrost thaw stages in interior Alaska, Remote Sens. Environ., 329, 114941, https://doi.org/10.1016/j.rse.2025.114941, 2025. a
Zhang, Y., Wolfe, S. A., Morse, P. D., Olthof, I., and Fraser, R. H.: Spatiotemporal impacts of wildfire and climate warming on permafrost across a subarctic region, Canada, J. Geophys. Res.-Earth, 120, 2338–2356, https://doi.org/10.1002/2015JF003679, 2015. a
Zhou, Z., Liu, L., Jiang, L., Feng, W., and Samsonov, S. V.: Using Long-Term SAR Backscatter Data to Monitor Post-Fire Vegetation Recovery in Tundra Environment, Remote Sensing, 11, https://doi.org/10.3390/rs11192230, 2019. a, b, c, d