Articles | Volume 20, issue 7
https://doi.org/10.5194/tc-20-4133-2026
© Author(s) 2026. This work is distributed under
the Creative Commons Attribution 4.0 License.
https://doi.org/10.5194/tc-20-4133-2026
© Author(s) 2026. This work is distributed under
the Creative Commons Attribution 4.0 License.
Svalbard glacier calving front changes from the 1930s to the 1970s from archived satellite and aerial images

Loris Danjou
Department of Arctic Geophysics, The University Centre in Svalbard (UNIS), Longyearbyen, Norway
Department of Physics and Technology, UiT The Arctic University of Norway, Tromsø, Norway
Eero Rinne
CORRESPONDING AUTHOR
Department of Arctic Geophysics, The University Centre in Svalbard (UNIS), Longyearbyen, Norway
Erik Schytt Mannerfelt
Department of Geosciences, University of Oslo, Oslo, Norway
Department of Arctic Geology, The University Centre in Svalbard (UNIS), Longyearbyen, Norway
Related authors
No articles found.
Ida Lundtorp Olsen, Henriette Skourup, Heidi Sallila, Stefan Hendricks, Renée Mie Fredensborg Hansen, Stefan Kern, Stephan Paul, Marion Bocquet, Sara Fleury, Dmitry Divine, and Eero Rinne
Earth Syst. Sci. Data, 18, 2469–2505, https://doi.org/10.5194/essd-18-2469-2026, https://doi.org/10.5194/essd-18-2469-2026, 2026
Short summary
Short summary
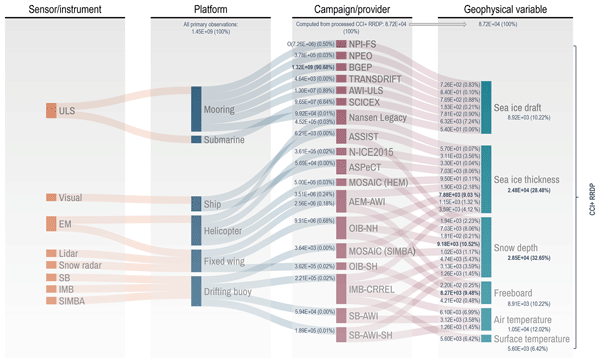
Discover the latest advancements in sea ice research with our comprehensive Climate Change Initiative (CCI) sea ice thickness (SIT) Round Robin Data Package (RRDP). This pioneering collection contains reference measurements from 1960 to 2024 from airborne sensors, buoys, visual observations and sonar and covers the polar regions from 1993 to 2024, providing crucial reference measurements for validating satellite-derived sea ice thickness.
Tazio Strozzi, Erik Schytt Mannerfelt, Oliver Cartus, Maurizio Santoro, Thomas Schellenberger, and Andreas Kääb
The Cryosphere, 20, 1679–1697, https://doi.org/10.5194/tc-20-1679-2026, https://doi.org/10.5194/tc-20-1679-2026, 2026
Short summary
Short summary
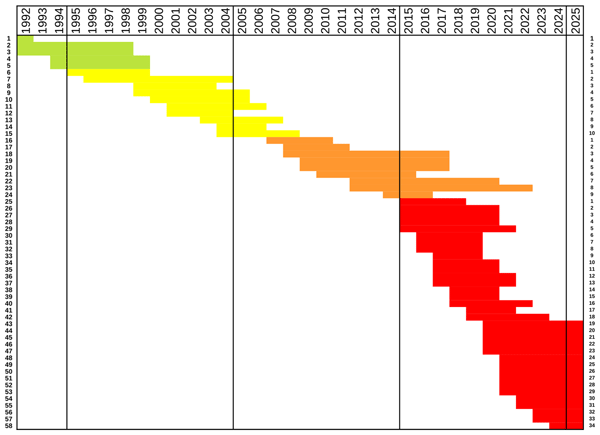
By analysing 30 years of satellite SAR (Synthetic Aperture Radar) data, we have found that the number of glacier surges over Svalbard has tripled since 2015. We show that this increase is unlikely to be explained solely by improvements in data quality or by random fluctuations in surge frequency, suggesting that this trend is caused by an external forcing mechanism. Given our incomplete understanding of surge initiation, the cause of the observed threefold increase remains however uncertain.
Renée Mie Fredensborg Hansen, Henriette Skourup, Eero Rinne, Arttu Jutila, Isobel R. Lawrence, Andrew Shepherd, Knut Vilhelm Høyland, Jilu Li, Fernando Rodriguez-Morales, Sebastian Bjerregaaard Simonsen, Jeremy Wilkinson, Gaelle Veyssiere, Donghui Yi, René Forsberg, and Taniâ Gil Duarte Casal
The Cryosphere, 19, 4167–4192, https://doi.org/10.5194/tc-19-4167-2025, https://doi.org/10.5194/tc-19-4167-2025, 2025
Short summary
Short summary
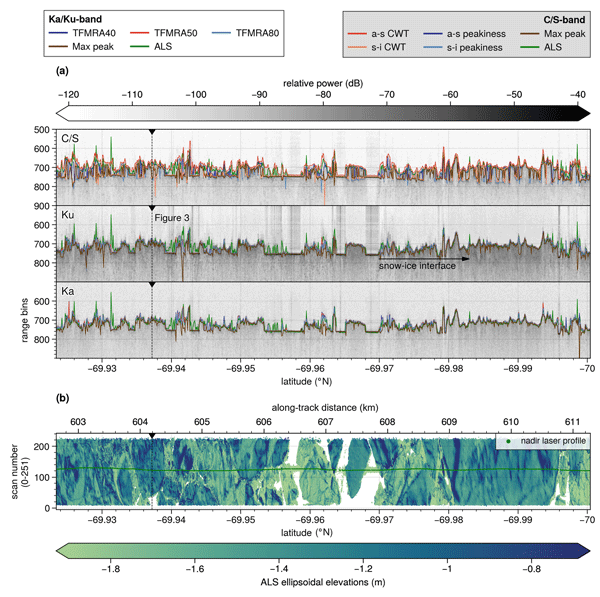
An airborne campaign collected unprecedented coincident multi-frequency radar and lidar data over sea ice along a CryoSat-2 and ICESat-2 (CRYO2ICE) orbit in the Weddell Sea, useful for evaluating microwave snow penetration. Ka-band and Ku-band had limited penetration with significant contributions from the air–snow interface, contradicting traditional assumptions with discrepancies between commonly used C/S-band "snow-radar" methodologies, all challenging comparisons of airborne and spaceborne estimates.
Renée Mie Fredensborg Hansen, Henriette Skourup, Eero Rinne, Arttu Jutila, Isobel R. Lawrence, Andrew Shepherd, Knut Vilhelm Høyland, Jilu Li, Fernando Rodriguez-Morales, Sebastian Bjerregaaard Simonsen, Jeremy Wilkinson, Gaelle Veyssiere, Donghui Yi, René Forsberg, and Taniâ Gil Duarte Casal
The Cryosphere, 19, 4193–4209, https://doi.org/10.5194/tc-19-4193-2025, https://doi.org/10.5194/tc-19-4193-2025, 2025
Short summary
Short summary
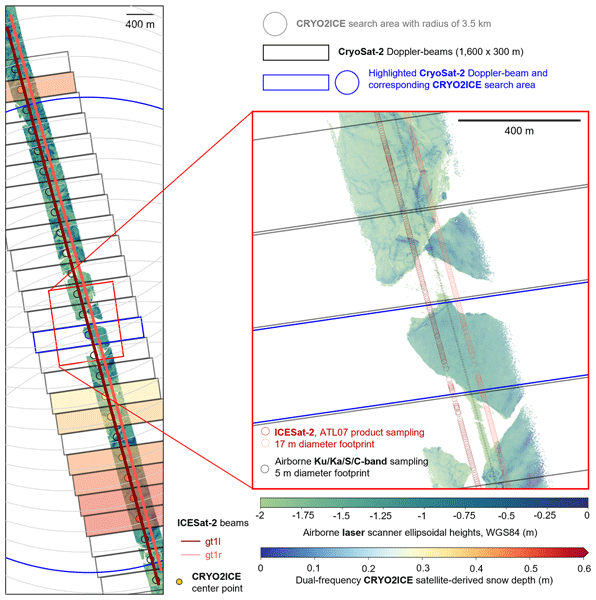
An airborne campaign collected unprecedented coincident multi-frequency radar and lidar data over sea ice along a CryoSat-2 and ICESat-2 (CRYO2ICE) orbit in the Weddell Sea, useful for evaluating microwave snow penetration. Ka-band and Ku-band had limited penetration with significant contributions from the air–snow interface, contradicting traditional assumptions with discrepancies between commonly used C/S-band "snow-radar" methodologies, all challenging comparisons of airborne and spaceborne estimates.
Alexandra Hamm, Erik Schytt Mannerfelt, Aaron A. Mohammed, Scott L. Painter, Ethan T. Coon, and Andrew Frampton
The Cryosphere, 19, 3693–3724, https://doi.org/10.5194/tc-19-3693-2025, https://doi.org/10.5194/tc-19-3693-2025, 2025
Short summary
Short summary
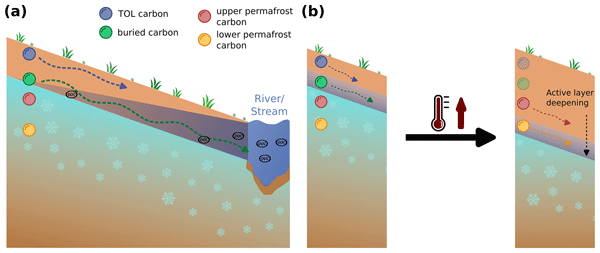
The fate of thawing permafrost carbon is essential for understanding the permafrost–climate feedback and projections of future climate. Here we study transport of organic carbon by groundwater in the active layer of a hillslope model. We find that carbon transport velocities and microbial mineralization rates are strongly dependent on liquid saturation in the seasonally thawed active layer. In a warming climate, the rate at which permafrost thaws determines how fast carbon can be transported.
Marion Bocquet, Sara Fleury, Fanny Piras, Eero Rinne, Heidi Sallila, Florent Garnier, and Frédérique Rémy
The Cryosphere, 17, 3013–3039, https://doi.org/10.5194/tc-17-3013-2023, https://doi.org/10.5194/tc-17-3013-2023, 2023
Short summary
Short summary
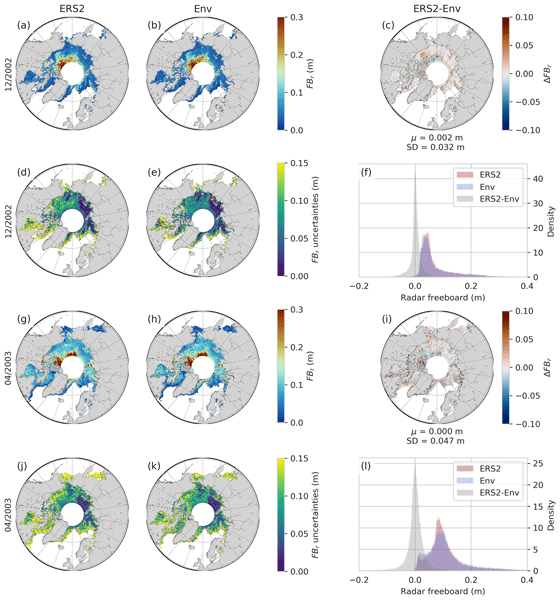
Sea ice has a large interannual variability, and studying its evolution requires long time series of observations. In this paper, we propose the first method to extend Arctic sea ice thickness time series to the ERS-2 altimeter. The developed method is based on a neural network to calibrate past missions on the current one by taking advantage of their differences during the mission-overlap periods. Data are available as monthly maps for each year during the winter period between 1995 and 2021.
Fabian Walter, Elias Hodel, Erik S. Mannerfelt, Kristen Cook, Michael Dietze, Livia Estermann, Michaela Wenner, Daniel Farinotti, Martin Fengler, Lukas Hammerschmidt, Flavia Hänsli, Jacob Hirschberg, Brian McArdell, and Peter Molnar
Nat. Hazards Earth Syst. Sci., 22, 4011–4018, https://doi.org/10.5194/nhess-22-4011-2022, https://doi.org/10.5194/nhess-22-4011-2022, 2022
Short summary
Short summary
Debris flows are dangerous sediment–water mixtures in steep terrain. Their formation takes place in poorly accessible terrain where instrumentation cannot be installed. Here we propose to monitor such source terrain with an autonomous drone for mapping sediments which were left behind by debris flows or may contribute to future events. Short flight intervals elucidate changes of such sediments, providing important information for landscape evolution and the likelihood of future debris flows.
Erik Schytt Mannerfelt, Amaury Dehecq, Romain Hugonnet, Elias Hodel, Matthias Huss, Andreas Bauder, and Daniel Farinotti
The Cryosphere, 16, 3249–3268, https://doi.org/10.5194/tc-16-3249-2022, https://doi.org/10.5194/tc-16-3249-2022, 2022
Short summary
Short summary
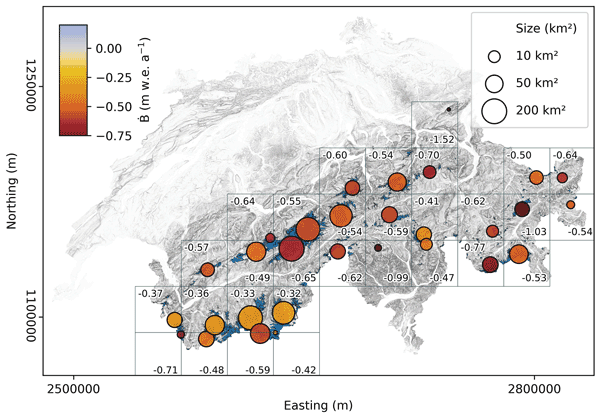
How glaciers have responded to climate change over the last 20 years is well-known, but earlier data are much more scarce. We change this in Switzerland by using 22 000 photographs taken from mountain tops between the world wars and find a halving of Swiss glacier volume since 1931. This was done through new automated processing techniques that we created. The data are interesting for more than just glaciers, such as mapping forest changes, landslides, and human impacts on the terrain.
Alexandru Gegiuc, Juha Karvonen, Jouni Vainio, Eero Rinne, Roman Bednarik, and Marko Mäkynen
The Cryosphere Discuss., https://doi.org/10.5194/tc-2022-8, https://doi.org/10.5194/tc-2022-8, 2022
Publication in TC not foreseen
Short summary
Short summary
Current users of operational ice charts call for quantitative uncertainty information, which the current ice charts lack. In this work we demonstrate for the first time the use of eye tracking methodology as a non-invasive way to identify elements behind uncertainties typically introduced during the process of visual mapping of sea ice information in satellite radar imagery. Uncertainty information would increase reliability of the manually produced ice charts and increase navigation safety.
Cited articles
Bayr, K. J., Hall, D. K., and Kovalick, W. M.: Observations on glaciers in the eastern Austrian Alps using satellite data, Int. J. Remote Sens., 15, 1733–1742, https://doi.org/10.1080/01431169408954205, 1994. a
Błaszczyk, M., Moskalik, M., Grabiec, M., Jania, J., Walczowski, W., Wawrzyniak, T., Strzelewicz, A., Malnes, E., Lauknes, T. R., and Pfeffer, W. T.: The response of tidewater glacier termini positions in Hornsund (Svalbard) to climate forcing, 1992–2020, J. Geophys. Res.-Earth, 128, e2022JF006911, https://doi.org/10.1029/2022JF006911, 2023. a
Cooper, M. A., Lewińska, P., Smith, W. A. P., Hancock, E. R., Dowdeswell, J. A., and Rippin, D. M.: Unravelling the long-term, locally heterogenous response of Greenland glaciers observed in archival photography, The Cryosphere, 16, 2449–2470, https://doi.org/10.5194/tc-16-2449-2022, 2022. a, b
Copernicus Climate Change Service: ERA5 monthly averaged data on single levels from 1940 to present, Climate Data Store (CDS) [data set], https://doi.org/10.24381/CDS.F17050D7, 2019. a
Danjou, L.: Svalbard glacier calving fronts (1936–1978), Zenodo [data set], https://doi.org/10.5281/zenodo.17391880, 2025. a
Danjou, L.: lorisdanjou/Svalbard_calving_fronts_1930s_1970s: Svalbard_calving_fronts_1930s_1970s (Version v1), Zenodo [software], https://doi.org/10.5281/zenodo.21262162, 2026. a
Dowdeswell, J. A.: Remote Sensing Studies of Svalbard Glaciers, PhD thesis, Scott Polar Research Institute, University of Cambridge, https://doi.org/10.17863/CAM.12791, 1984. a
Galiatsatos, N.: Assessment of the CORONA series of satellite imagery for Landscape archaeology: a case study from the Orontes valley, Syria, PhD thesis, Durham University, https://etheses.durham.ac.uk/id/eprint/281/1/PhD_thesis.pdf (last access: 8 July 2026), 2004. a
Ghuffar, S., Bolch, T., Rupnik, E., and Bhattacharya, A.: A pipeline for automated processing of declassified Corona KH-4 (1962–1972) stereo imagery, IEEE T. Geosci. Remote, 60, 1–14, https://doi.org/10.1109/TGRS.2022.3200151, 2022. a
Goossens, R., De Wulf, A., Bourgeois, J., Gheyle, W., and Willems, T.: Satellite imagery and archaeology: the example of CORONA in the Altai Mountains, J. Archaeol. Sci., 33, 745–755, https://doi.org/10.1016/j.jas.2005.10.010, 2006. a
Hall, D. K., Ormsby, J. P., Bindschadler, R. A., and Siddalingaiah, H.: Characterization of snow and ice reflectance zones on glaciers using Landsat thematic mapper data, Ann. Glaciol., 9, 104–108, https://doi.org/10.3189/S0260305500000471, 1987. a
Hall, D. K., Riggs, G. A., and Salomonson, V. V.: Development of methods for mapping global snow cover using moderate resolution imaging spectroradiometer data, Remote Sens. Environ., 54, 127–140, https://doi.org/10.1016/0034-4257(95)00137-P, 1995. a
Harcourt, W. D., Pearce, D. M., Gajek, W., Lovell, H., Mannerfelt, E. S., Kääb, A., Benn, D. I., Luckman, A., Hann, R., Kohler, J., Strozzi, T., McCerery, R., and Davies, B. J.: Surging glaciers in Svalbard: observing their distribution, characteristics and evolution, Earth-Sci. Rev., 275, 105410, https://doi.org/10.1016/j.earscirev.2026.105410, 2026. a, b, c, d
Kim, K. T., Jezek, K. C., and Sohn, H. G.: Ice shelf advance and retreat rates along the coast of Queen Maud Land, Antarctica, J. Geophys. Res.-Oceans, 106, 7097–7106, https://doi.org/10.1029/2000JC000317, 2001. a
Kochtitzky, W. and Copland, L.: Retreat of Northern Hemisphere marine-terminating glaciers, 2000–2020, Geophys. Res. Lett., 49, e2021GL096501, https://doi.org/10.1029/2021GL096501, 2022. a, b, c, d
Lea, J. M., Mair, D. W. F., and Rea, B. R.: Evaluation of existing and new methods of tracking glacier terminus change, J. Glaciol., 60, 323–332, https://doi.org/10.3189/2014JoG13J061, 2014. a, b, c, d
Li, T., Heidler, K., Mou, L., Ignéczi, Á., Zhu, X. X., and Bamber, J. L.: A high-resolution calving front data product for marine-terminating glaciers in Svalbard, Earth Syst. Sci. Data, 16, 919–939, https://doi.org/10.5194/essd-16-919-2024, 2024. a, b, c
Liestøl, O.: Glacier surges in West Spitsbergen, Can. J. Earth Sci., 6, 895–897, https://doi.org/10.1139/e69-092, 1969. a, b
Lovell, H. and Boston, C. M.: Glacitectonic composite ridge systems and surge-type glaciers: an updated correlation based on Svalbard, Norway, Arktos, 3, 2, https://doi.org/10.1007/s41063-017-0028-5, 2017. a
Luckman, A., Benn, D. I., Cottier, F., Bevan, S., Nilsen, F., and Inall, M.: Calving rates at tidewater glaciers vary strongly with ocean temperature, Nat. Commun., 6, 8566, https://doi.org/10.1038/ncomms9566, 2015. a
Manabe, S. and Wetherald, R. T.: The effects of doubling the CO2 concentration on the climate of a general circulation model, J. Atmos. Sci., 32, 3–15, https://doi.org/10.1175/1520-0469(1975)032<0003:TEODTC>2.0.CO;2, 1975. a
Mannerfelt, E. S., Schellenberger, T., and Kääb, A. M.: Tracking glacier surge evolution using interferometric SAR coherence – examples from Svalbard, J. Glaciol., 71, e43, https://doi.org/10.1017/jog.2025.27, 2025. a
Moholdt, G., Nuth, C., Hagen, J. O., and Kohler, J.: Recent elevation changes of Svalbard glaciers derived from ICESat laser altimetry, Remote Sens. Environ., 114, 2756–2767, https://doi.org/10.1016/j.rse.2010.06.008, 2010. a
Molnár, G.: Orthocorrection of KH-5 ARGON satellite imagery of Aral Sea, International Journal of Geoinformatics, 17, 85, https://doi.org/10.52939/ijg.v17i1.1715, 2021. a, b
Nuth, C., Moholdt, G., Kohler, J., Hagen, J. O., and Kääb, A.: Svalbard glacier elevation changes and contribution to sea level rise, J. Geophys. Res.-Earth, 115, https://doi.org/10.1029/2008JF001223, 2010. a
Otero, J., Navarro, F. J., Lapazaran, J. J., Welty, E., Puczko, D., and Finkelnburg, R.: Modeling the controls on the front position of a tidewater glacier in Svalbard, Front. Earth Sci., 5, https://doi.org/10.3389/feart.2017.00029, 2017. a
Racoviteanu, A. E., Glasser, N. F., Robson, B. A., Harrison, S., Millan, R., Kayastha, R. B., and Kayastha, R.: Recent evolution of glaciers in the Manaslu Region of Nepal from satellite imagery and UAV data (1970–2019), Front. Earth Sci., 9, https://doi.org/10.3389/feart.2021.767317, 2022. a, b
RGI 7.0 Consortium: Randolph Glacier Inventory – A Dataset of Global Glacier Outlines, Version 7.0, NASA National Snow and Ice Data Center Distributed Active Archive Center [data set], https://doi.org/10.5067/f6jmovy5navz, 2023. a, b, c
Rott, H.: Thematic studies in alpine areas by means of polarimetric SAR and optical imagery, Adv. Space Res., 14, 217–226, https://doi.org/10.1016/0273-1177(94)90218-6, 1994. a
Rounce, D. R., Hock, R., Maussion, F., Hugonnet, R., Kochtitzky, W., Huss, M., Berthier, E., Brinkerhoff, D., Compagno, L., Copland, L., Farinotti, D., Menounos, B., and McNabb, R. W.: Global glacier change in the 21st century: every increase in temperature matters, Science, 379, 78–83, https://doi.org/10.1126/science.abo1324, 2023. a
Sevestre, H. and Benn, D. I.: Climatic and geometric controls on the global distribution of surge-type glaciers: implications for a unifying model of surging, J. Glaciol., 61, 646–662, https://doi.org/10.3189/2015JoG14J136, 2015. a
U.S. Geological Survey: USGS EROS Archive – Declassified Data – Declassified Satellite Imagery – 1, https://www.usgs.gov/centers/eros/science/usgs-eros-archive-declassified-data-declassified-satellite-imagery-1 (last access: 8 July 2026), 2018. a, b
U.S. Geological Survey: Landsat Multispectral Scanner (MSS) Collection 2 (C2) Level 1 (L1) Data Format Control Book (DFCB), https://d9-wret.s3.us-west-2.amazonaws.com/assets/palladium/production/s3fs-public/atoms/files/LSDS-1416_LandsatMSS-C2-L1-DFCB-v3.pdf (last access 8 July 2026), 2020a. a
U.S. Geological Survey: USGS EROS Archive – Landsat Archives – Landsat 1-5 Multispectral Scanner Collection 2 Level-1 Data – U.S. Geological Survey, https://www.usgs.gov/centers/eros/science/usgs-eros-archive-landsat-archives-landsat-1-5-multispectral-scanner last access: 8 July 2026), 2020b. a
U.S. Geological Survey: Declassified Satellite Imagery – Corona, Argon, and Lanyard, https://www.usgs.gov/centers/eros/science/usgs-eros-archive-declassified-data-declassified-satellite-imagery-1 last access: 8 July 2026), 2021. a
Wang, S., Liu, H., Yu, B., Zhou, G., and Cheng, X.: Revealing the early ice flow patterns with historical declassified intelligence satellite photographs back to 1960s, Geophys. Res. Lett., 43, 5758–5767, https://doi.org/10.1002/2016GL068990, 2016. a
Welch, G. F., McChristian L. S., and Kulpa, J. E.: Hexagon (KH-9) Mapping Camera Program and Evolution, edited by: Burnett, M. G., https://www.nro.gov/Portals/65/documents/foia/declass/mapping1.pdf (last access: 8 July 2026), 1982. a
Williams, R. S.: Satellite Remote Sensing of Vatnajökull, Iceland, Ann. Glaciol., 9, 127–135, https://doi.org/10.3189/S0260305500000501, 1987. a
Yavaşlı, D. D., Tucker, C. J., and Melocik, K. A.: Change in the glacier extent in Turkey during the Landsat Era, Remote Sens. Environ., 163, 32–41, https://doi.org/10.1016/j.rse.2015.03.002, 2015. a
Ye, W., Qiao, G., Kong, F., Ma, X., Tong, X., and Li, R.: Improved geometric modeling of 1960s KH-5 ARGON satellite images for regional Antarctica applications, Photogramm. Eng. Rem. S., 83, 477, https://doi.org/10.14358/PERS.83.7.477, 2017. a, b
Short summary
We retrieved front locations for 171 Svalbard tidewater glaciers in the 1960s and 1970s, from Landsat images and – for the first time in this region – declassified intelligence satellite photographs. We compared our results to aerial photographs from the 1930s and calculated that these glaciers retreated by about 1 km between 1936 and 1978. We also discovered one undocumented glacier surge (a rapid front advance), precised the time frames of two others, and documented two other glacier advances.
We retrieved front locations for 171 Svalbard tidewater glaciers in the 1960s and 1970s, from...