the Creative Commons Attribution 4.0 License.
the Creative Commons Attribution 4.0 License.
 | 20 Jan 2026
The observed evolution of Arctic amplification over the past 45 years
Mark C. Serreze
Elizabeth Cassano
Alex Crawford
John J. Cassano
Chen Zhang
To address research gaps in understanding Arctic Amplification, we use data from ERA5, an observational surface temperature dataset, and sea ice concentration to examine the seasonal, spatial and decadal evolution of Arctic 2 m and lower tropospheric temperatures and lower tropospheric (surface to 850 hPa) static stability over the past 45 years. A Local Amplification Anomaly (LAA) metric is used to examine how spatial patterns of Arctic 2 m temperature anomalies compare to anomalies for the globe as a whole. Pointing to impacts of seasonally-delayed albedo feedback, growing areas of end-of-summer (September) open water largely co-locate with the strongest positive anomalies of 2 m temperatures through autumn and winter and their growth through time; small summer trends reflect the effects of a melting sea ice cover. Because of seasonal ice growth, the association between rising 2 m temperatures and sea ice weakens from autumn into winter, except in the Barents Sea where there have been prominent downward trends in winter ice extent. Imprints of variable atmospheric circulation are prominent in the Arctic temperature evolution. Low-level (surface to 850 hPa) stability over the Arctic increases from autumn through winter, consistent with the greater depth of surface-based atmospheric heating seen in autumn. However, trends towards weaker static stability dominate the Arctic Ocean in autumn and winter, especially over areas of September and wintertime ice loss. Sea ice thinning, leading to increased conductive heat fluxes though the ice, likely also contributes to reduced stability.
- Article
(10992 KB) - Full-text XML
-
Supplement
(3929 KB) - BibTeX
- EndNote


Arctic amplification (AA) refers to the observation that, over the last several decades, the rate of increase in surface air temperature over the Arctic region has been larger than for the globe as a whole. As reviewed by Esau et al. (2023), AA is having impacts on Arctic terrestrial and marine ecosystems, permafrost conditions, ice sheets and glaciers as well as human systems. AA was predicted as a consequence of global warming even in the earliest generation of climate models, and was envisioned as far back as the 19th century (Arrhenius, 1896). Various studies have placed the ratio of Arctic to global warming from two to four, with differences relating to the definition of the Arctic region, data used, the time period examined and the season examined (Yu et al., 2021a; Walsh, 2014; Richter Menge and Druckenmiller, 2020; Jansen et al., 2020; AMAP, 2021; Rantanen et al., 2022). Using several observational data sets and defining the Arctic as the region poleward of the Arctic Circle, Rantanen et al. (2022) find a factor of four warming relative to the globe over the period 1979–2021 based on annual mean temperatures. From comparisons with climate models, they conclude that this large ratio is either an extremely unlikely event, or that the models systematically underestimate AA. Zhou et al. (2024) conclude that the externally forced amplification is three-fold, with natural variability explaining the remainder. The Polar Amplification Model Intercomparison Project (PAMIP; Smith et al., 2019) further investigates the causes and consequences of polar amplification using a coordinated set of numerical model experiments, providing valuable insights into the mechanisms driving AA.
Growing spring and summer sea ice loss, leading to more seasonal heat gain in the ocean mixed layer and subsequent upward heat release in autumn and winter – a seasonally-delayed expression of albedo feedback – is widely accepted as a key driver of AA (Perovich et al., 2007; Steele et al., 2008; Serreze et al., 2009; Screen and Simmonds, 2010a, b; Stammerjohn et al., 2012; Stroeve et al., 2014; Dai et al., 2019). However, based on observations and modeling studies, AA is also recognized as involving a suite of connected contributions including changes in atmospheric circulation and poleward energy transport (Graversen and Burtu, 2016; Woods and Caballero, 2016; Henderson et al., 2021; Previdi et al., 2021; Zhang et al., 2025), Planck feedback (Pithan and Mauritsen, 2014), positive lapse rate feedback (Pithan and Mauritsen, 2014; Stuecker et al., 2018; Previdi et al., 2021), changes in ocean heat transport (Beer et al., 2020), changes in autumn cloud cover (Kay and Gettelman, 2009; Wu and Lee, 2012) and even reduced air pollution in Europe (Navarro et al., 2016; Krishnan et al., 2020). Taylor et al. (2022) provide an insightful history of AA science.
However, much remains to be understood about AA, notably the spatial aspects of its observed evolution, seasonal shifts in its expression and evolution, and the vertical structure of AA in the context of changing static stability. Here, using data from the ERA5 reanalysis, surface temperature observations, and satellite-derived sea ice concentration, we focus on understanding the decadal evolution and seasonal/spatial expressions of Arctic temperature anomalies. The local characteristics of AA are important, as regional variations can produce different remote influences, including midlatitude climate extremes (Zhou et al., 2023). We show how: (1) the pronounced autumn contribution to AA, through which internal energy gained by the upper ocean in spring and summer in growing open water areas is subsequently released back to the atmosphere, decays into winter as sea ice forms (the exception being in the Barents Sea sector, which has seen pronounced winter ice losses); (2) the decadal evolution of AA is modulated by variable spatial expressions of atmospheric circulation; (3) the deeper vertical extent of pronounced temperature anomalies in autumn than winter is consistent with the seasonal increase in static stability from autumn to winter; and (4) reductions in static stability in autumn point toward increasingly deep penetration of surface warming into the troposphere with continued sea ice loss, and potentially greater impacts of AA on altering weather patterns in lower latitudes (Ding et al., 2024).
Data from the European Centre for Medium-range Weather Forecasts (ECMWF) reanalysis (ERA5; Hersbach et al., 2020) are used for analysis. Monthly temperature (2 m and the significant levels from 1000 to 500 hPa) and surface and latent heat fluxes were used on the 0.25° × 0.25° horizontal grid from 1979–2024. While ERA5 data are available since 1950, fields since 1979, the advent of the modern satellite database for assimilation, are more reliable. ERA5 is chosen because, in various comparisons of (near-) surface parameters throughout the Arctic, ERA5 performs similarly to or better than other global and regional reanalysis products (Graham et al., 2019; Barrett et al., 2020; Renfrew et al., 2021; Crawford et al., 2022). Reliance is placed on trends and anomalies. Anomalies are referenced to the 30-year period 1981–2010, but comparisons are made with different averaging periods. To assess relationships with sea ice conditions, we use the satellite passive microwave records from the National Snow and Ice Data Center. The satellite passive microwave record provides estimates of concentration and extent from October 1978 through the present at 25 km resolution on a polar stereographic grid by combining data from the Nimbus-7 Scanning Multichannel Microwave Radiometer (SMMR, 1979–1987), the Defense Meteorological Satellite Program (DMSP) Special Sensor Microwave/Imager (SSM/I, 1987–2007) and the Special Sensor Microwave Imager/Sounder (SSMIS, 2007–onwards) Comiso (2023).
Our results must be viewed within the context of known problems in ERA5, one being a warm bias in 2 m air temperature over the Arctic (Yu et al., 2021b; Tian et al., 2024). Compared to an extensive set of matching drifting observations, Yu et al. (2021b) found ERA5 to have a mean bias of 2.34 ± 3.22 °C in 2 m air temperature, largest in April and smallest in September. Interestingly, surface (skin) temperature biases were found to be negative (−4.11 ± 3.92 °C overall, largest in December and smaller in the warmer months), although the magnitudes might be overestimated by the location of the surface temperature sensors on the buoys, which may have been affected by snow cover. While we are largely dealing in this paper with anomalies, rather than absolute values, our comparisons between Arctic and global anomalies may be influenced by the fact that biases at the global scale are different. Wang et al. (2019) found that compared to the earlier ERA-Interim effort, ERA5 has a larger warm bias at very low temperatures ( °C) but a smaller bias at higher temperatures. ERA5 has higher total precipitation and snowfall over Arctic sea ice. The snowpack in ERA5 results in less heat loss to the atmosphere and hence thinner ice at the end of the growth season, despite the warm bias.
To further address biases in ERA5, analysis was also performed using the Berkeley Earth Surface Temperatures (BEST) gridded surface temperature data (Rohde and Hausfather, 2020; available for download from: https://berkeleyearth.org/data/, last access: September 2025). This dataset extends back to 1850, combining both 2 m temperatures over land as well as sea surface temperatures to create a global, gridded observational dataset to which reanalysis data can be compared.
3.1 Seasonality of 2 m Temperature Trends
A key, but in our view, under-appreciated aspect of AA is its strong seasonality – under-appreciated not that it exists but in the sense that processes at work during summer over the Arctic Ocean, when AA is small, set the stage for understanding the strong imprints of AA during autumn and winter. Rantanen et al. (2022) found that the AA factor as assessed for the region poleward of the Arctic circle ranges from less than 2 in July to over 5 in November. Climate models examined in that study largely capture this seasonality but with smaller amplification factors. Figure 1 shows spatial patterns of surface air temperature trends by season based on ERA5. In this study, the Arctic is defined as areas poleward of 60° N, but maps extend down to 50° N to enable comparisons between changes in the Arctic and the higher middle latitudes. The same analysis but performed with the BEST data are shown in Fig. S1 in the Supplement. The description of the results from these figures apply to both datasets except where explicitly stated.
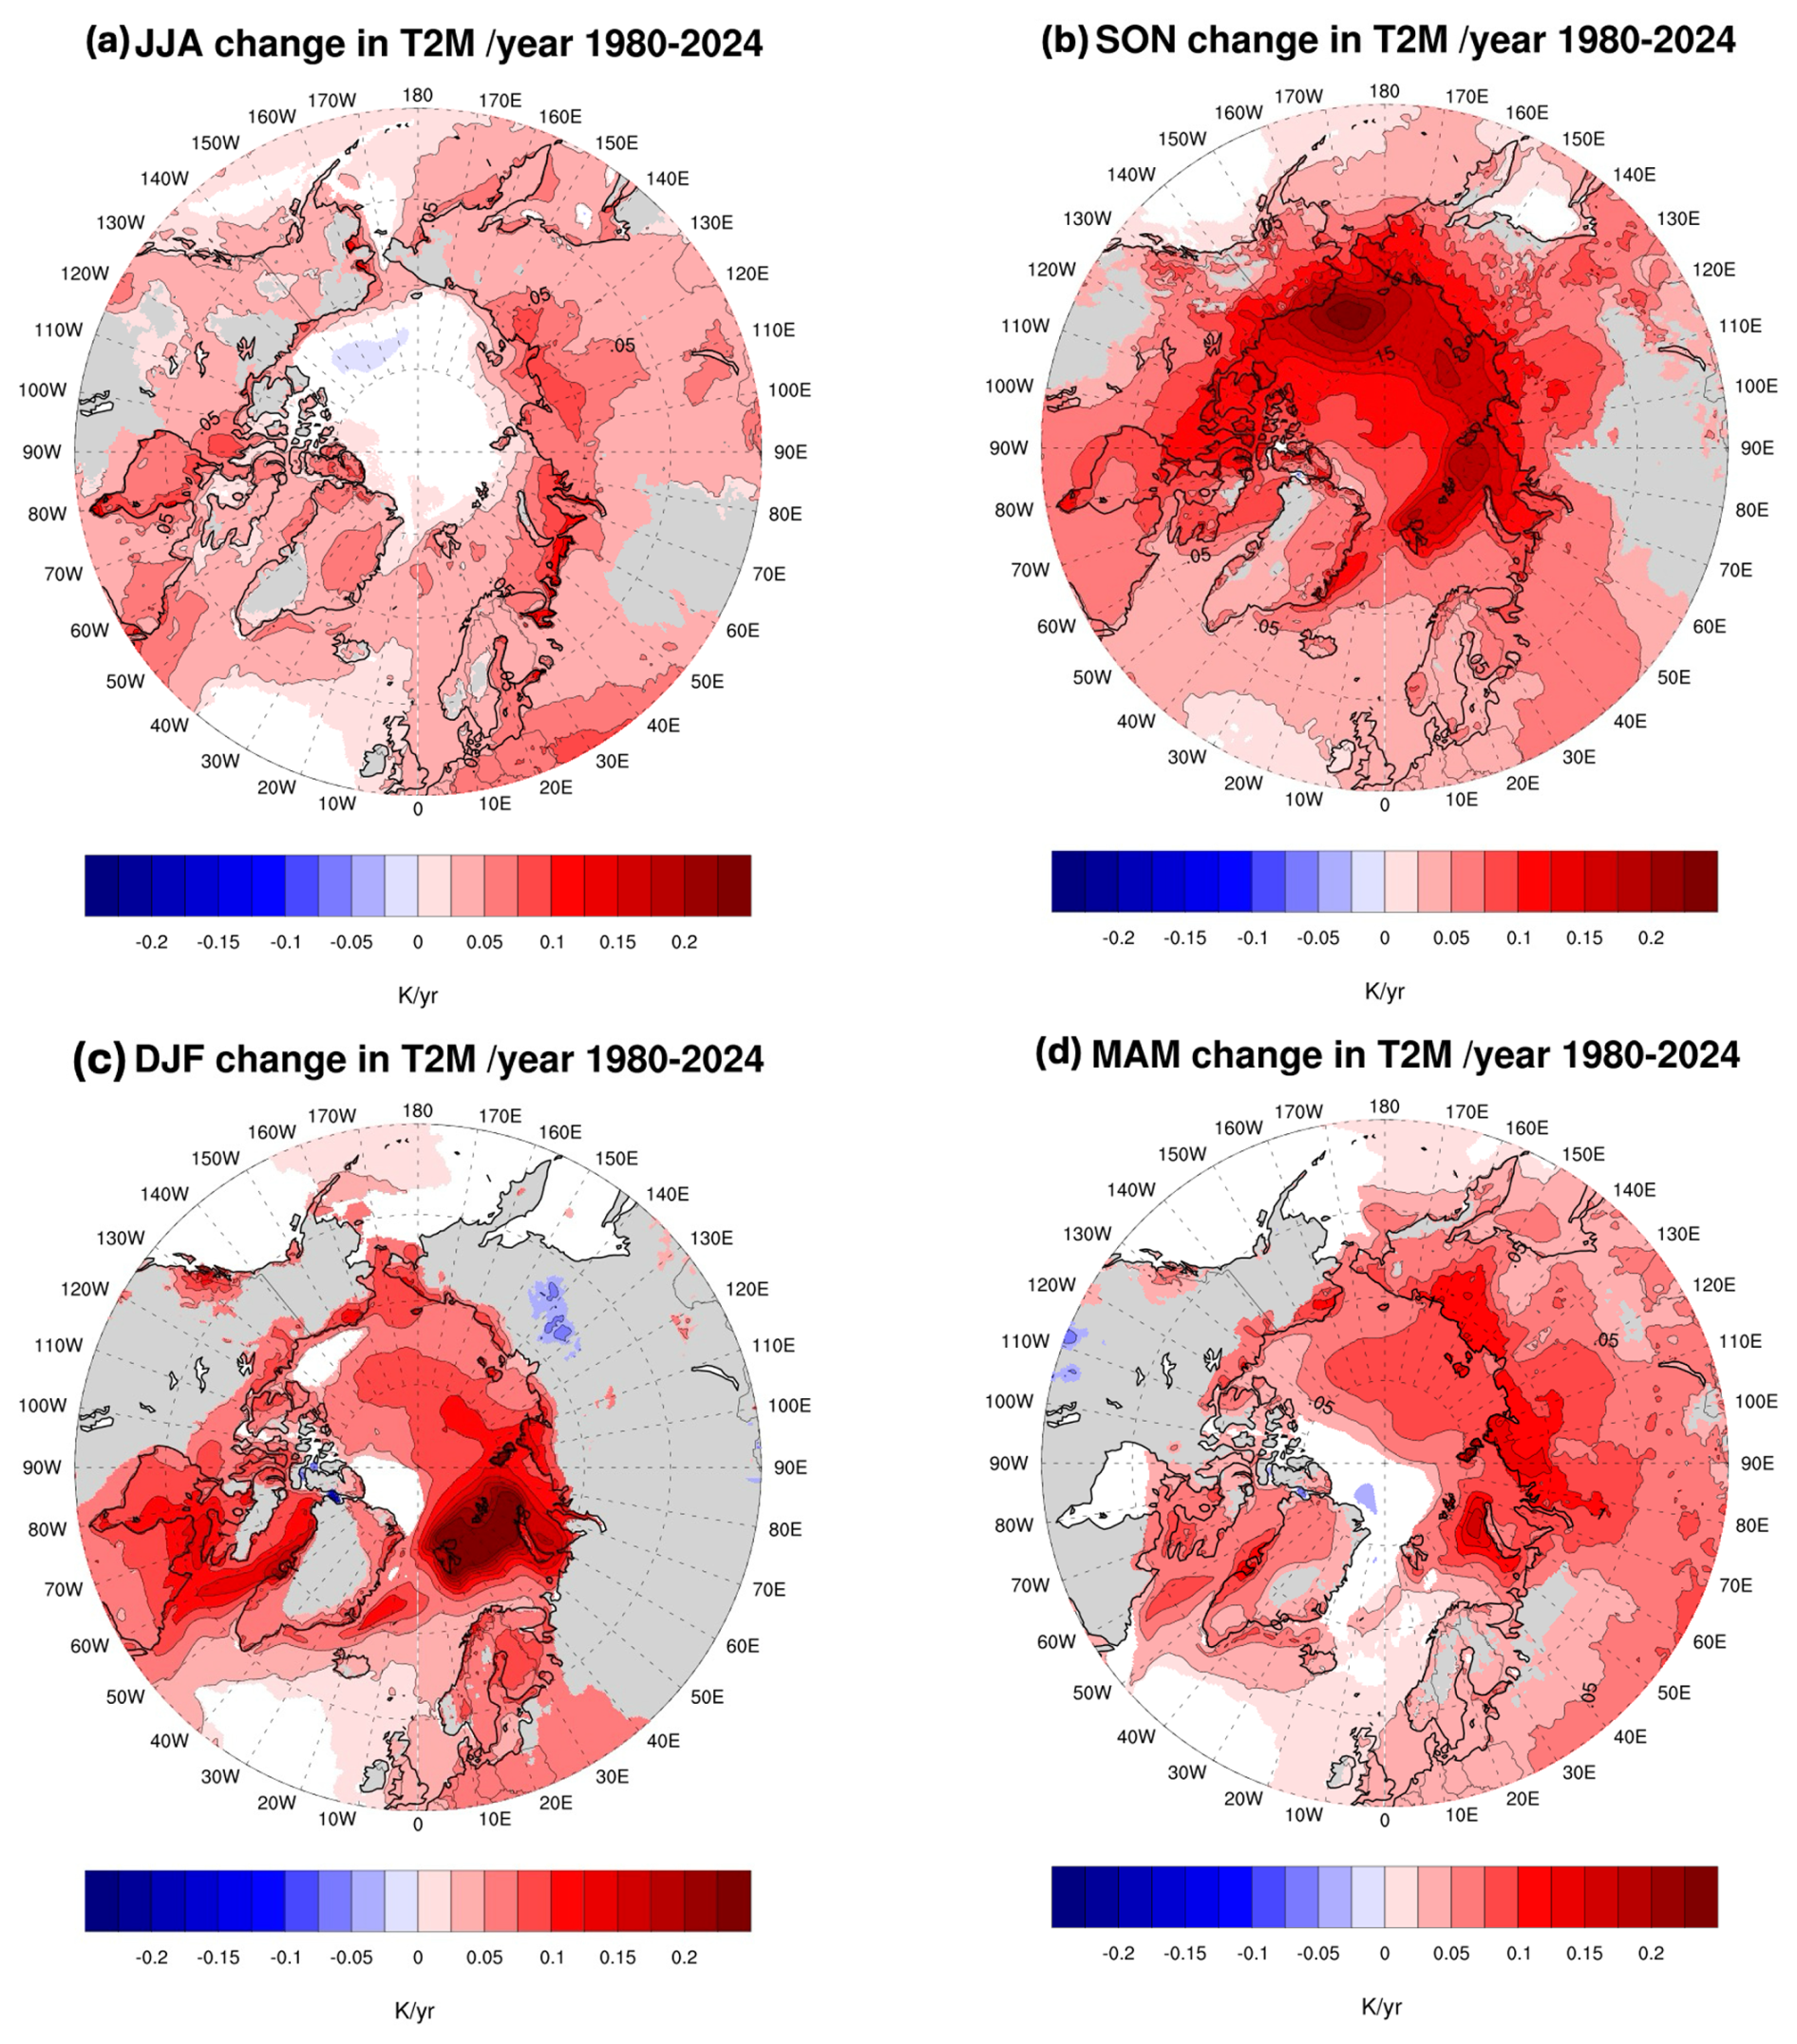
Figure 1Linear trends in ERA5 2 m temperatures (T2M) by season from 1980 to 2024, in degrees per year for (a) June, July, August (JJA), (b) September, October, November (SON), (c) December, January, February (DJF) and (d) March, April, May (MAM). Only trends significant at p<0.05 are shaded based on an ordinary least squares regression test.
The sharply smaller trends in summer compared to autumn and winter across Arctic latitudes clearly stands out. In interpreting these patterns, we focus on broad, contiguous regions rather than isolated grid points that may be affected by spatial autocorrelation. Summer trends are nevertheless largely positive and statistically significant across most of the Arctic and subarctic lands. Trends in ERA5 are very small and not statistically significant across the central Arctic Ocean, while in the BEST data, the trends over the Arctic Ocean are significant, albeit still small (Fig. S1a). Since the skin temperature of a melting sea ice cover is pegged to the melting point, it follows that surface air temperature trends must be small in this area. Over land, earlier loss of the snow cover (Mudryk et al., 2023) likely contributes to the rise in surface air temperatures seen there. Trends along the Russian and Alaska coastline are also positive. Melt onset typically starts in June in the southern margins of the ice cover and progresses poleward (Markus et al., 2009). Positive trends along the coastal seas are consistent with satellite observations of a progressively earlier onset of melt (Stroeve et al., 2014; Stroeve and Notz, 2018). They are also consistent with progressively earlier exposure of dark open water areas, their expanding coverage through time, and associated increased internal energy in the ocean mixed layer (Perovich et al., 2007; Serreze et al., 2009; Perovich and Polashenski, 2012; Stammerjohn et al., 2012; Dai et al., 2019; Li et al., 2022; Bianco et al., 2024). However, the large specific heat of water and the depth of heating (10–30 m) will limit the rise in surface air temperature. Note also the positive trends over the northern North Atlantic, which is ice-free over the entire year. Somewhat larger trends are found over part of the Kara and Barents Seas.
The largest temperature trends for autumn, locally exceeding 0.2 °C yr−1, lie primarily on the Eurasian side of the Arctic Ocean and north of Alaska. A comparison to the spatial pattern of September (end of summer) sea ice concentration (Fig. 2), provides an understanding: the trends are largest in those areas with the sharpest downward trends in ice concentration, most notably in the Chukchi and East Siberian Seas and hence where there will be strong upward surface heat fluxes as the ocean loses the internal energy it gained in summer. Our interpretation, building from the above discussion and from earlier studies (e.g., Stammerjohn et al., 2012; Stroeve et al., 2016; Lebrun et al., 2019), is that through the years, ice begins to retreat earlier and earlier in spring and summer, largely from the shores of Alaska and the Russian coast, exposing areas of dark open water, which absorbs solar energy. This means more energy gain in the ocean mixed layer, and over an increasingly large area, with time. As solar radiation declines in autumn, this energy is released upwards to the atmosphere, seen as positive temperature anomalies that grow in magnitude and spatial coverage with time. Before sea ice forms, all of the internal energy gained in summer must be depleted.
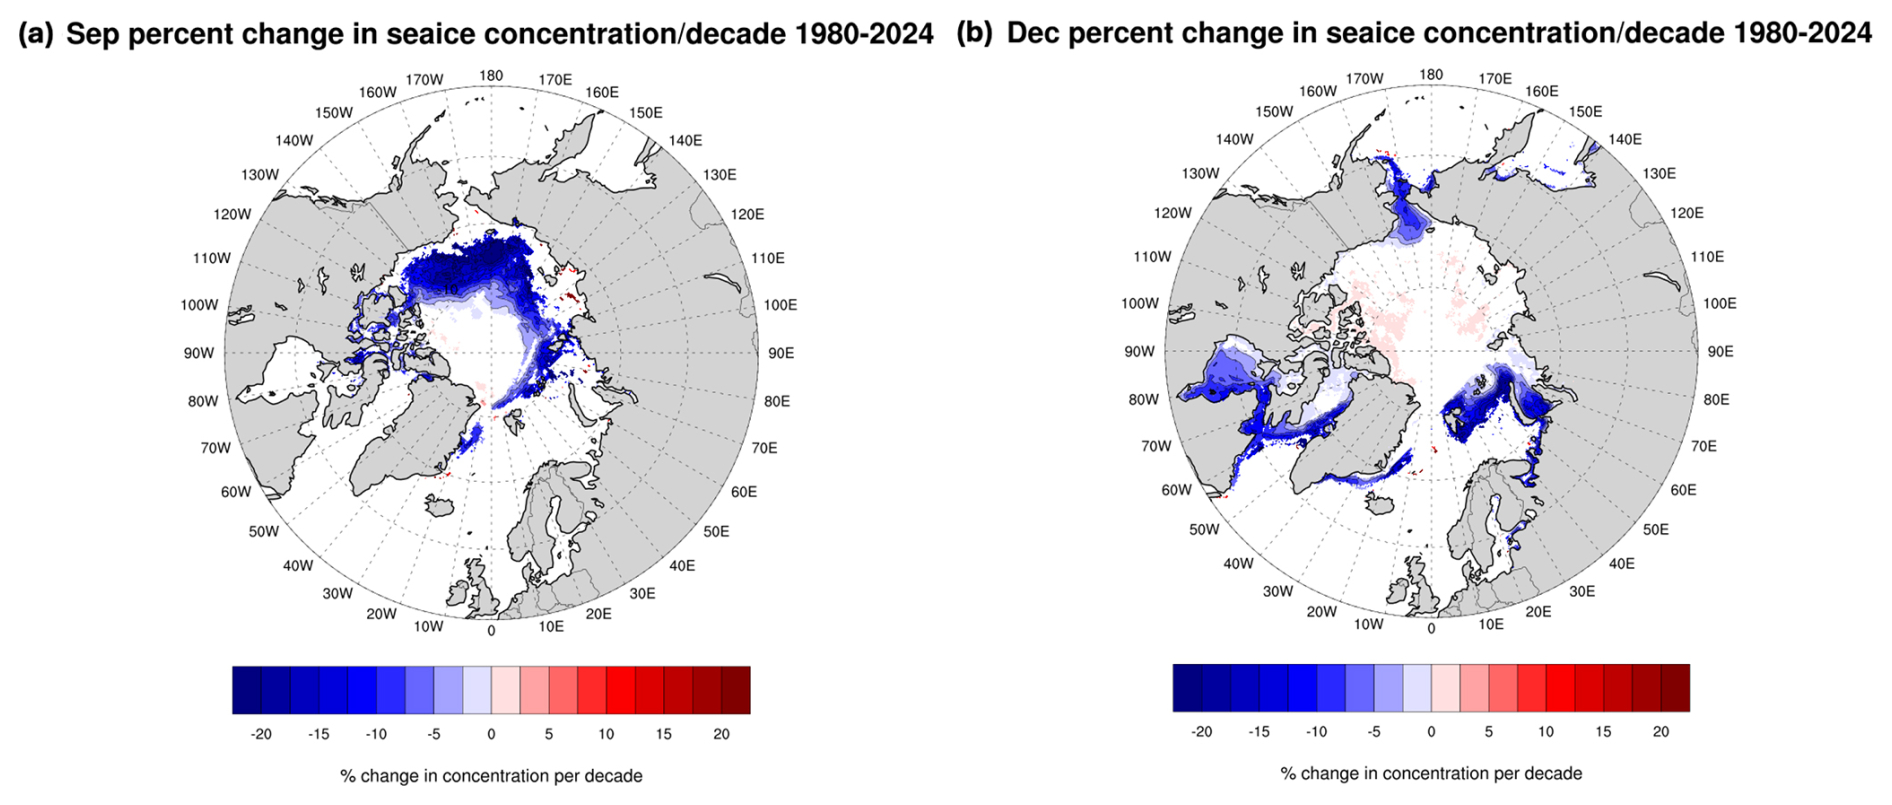
Figure 2Linear trends in sea ice concentration % per decade 1980 through 2024 for September (a) and December (b). Only trends significant at p < 0.05 are shaded based on an ordinary least squares regression test.
The pattern of winter temperature trends is quite different. The positive trends along the Eurasian coastline and in the Chukchi and Barents Seas are greatly reduced, and the largest trends, exceeding 0.2 °C yr−1, are now located in the Barents Sea. The reason for this is clear: by December, the areas of open water along the coast have re-frozen, reducing energy transfer between the ocean and atmosphere. The Barents Sea is, in turn, one of the few areas with a substantial downward trend in winter sea ice extent (Fig. 2b). Still, positive 2 m temperature trends in both autumn and winter encompass much of the Arctic Ocean away from areas of ice loss. One likely driver of this is progressive thinning of the ice cover (Landy et al., 2022; Sumata et al., 2023), allowing for an increase in conductive fluxes through the ice (Liu and Zhang, 2025). Autumn and winter trends in sensible and latent heat fluxes from ERA5 show an increase over the time period of study of these fluxes from the surface to the atmosphere (Fig. S2). Another driver is likely polar temperature advection from the areas of sea ice loss (Timmermans et al., 2018), as evidenced by the tongue of fairly large positive trends extending from the Barents Sea into the Arctic Ocean. Also of interest is that trends over much of the land area are very small, even negative, especially over Eurasia.
By spring, the magnitude of temperature trends in both the ERA5 and BEST data over the Barents Sea has dropped relative to winter, but is still prominent. Through spring, downward trends in sea ice concentration (not shown) persist, but, compared to winter, air-sea temperature differences are smaller, hence ocean to atmosphere surface heat fluxes are smaller. Substantial positive trends are found along the Eurasian coast, again suggestive of the role of atmospheric heat advection. Trends over much of high-latitude North America are small.
To summarize, it is apparent that an assessment of Arctic Amplification based on comparing the Arctic trend with the trend for the globe as a whole must recognize the highly pronounced seasonal and spatial heterogeneity of Arctic trends. Summer 2 m temperature trends are mostly small, but the smallness over the Arctic Ocean is due to the melting of ice. The much larger autumn trends reflect energy transfer from the ocean to the atmosphere via upward surface heat fluxes from increasing extensive areas of open water. By winter, open water areas along the Eurasian coast and the Chukchi Sea have re-frozen and the locus of maximum temperature trends is shifted to the Barents Seas, consistent with the downward trends in sea ice concentration there. Spring trends are weaker than winter trends, but are still large in the Barents Sea sector. However, for autumn, winter and spring, there are also features in the spatial patterns of trends that point to advection and other processes, and winter trends in particular are small over much of the land area.
3.2 Local Amplification Anomaly Approach
To gain further insight into trends, we now look at the evolution of AA by decade, 1980–1989, 1990–1999, 2000–2009, and 2010–2019, as well as the last 5 years of the record, 2020–2024, making use of what we term a Local Amplification Anomaly (LAA) approach.
For each of these periods, we calculated the average 2 m temperature at each ERA5 and BEST grid point across the globe, then calculated the anomalies at each grid point relative to the 1981–2010 climatology. Taking the (spatially weighted) average of all grid point anomalies yields the global temperature anomaly for each period. Then, at each grid point we subtracted this global temperature anomaly from the anomaly at that point. We then compiled maps of the anomalies for the region poleward of 50° N (including the Arctic (north of 60° N) and the sub-Arctic (50–60° N)). Examining these LAAs gives us a sense of the spatial structure of Arctic temperature anomalies in terms of how they contribute to the overall AA evolution. In Table 1 we also provide, for each decade and season, the average of the anomalies relative to the global average poleward of 60° N and the average global anomaly. Results that follow will of course reflect the chosen 1981–2010 referencing period.
Table 1Average temperature anomalies (K; with respect to 1981–2010) for the Arctic (north of 60° N), the globe, and their difference for the BEST and ERA5 data.
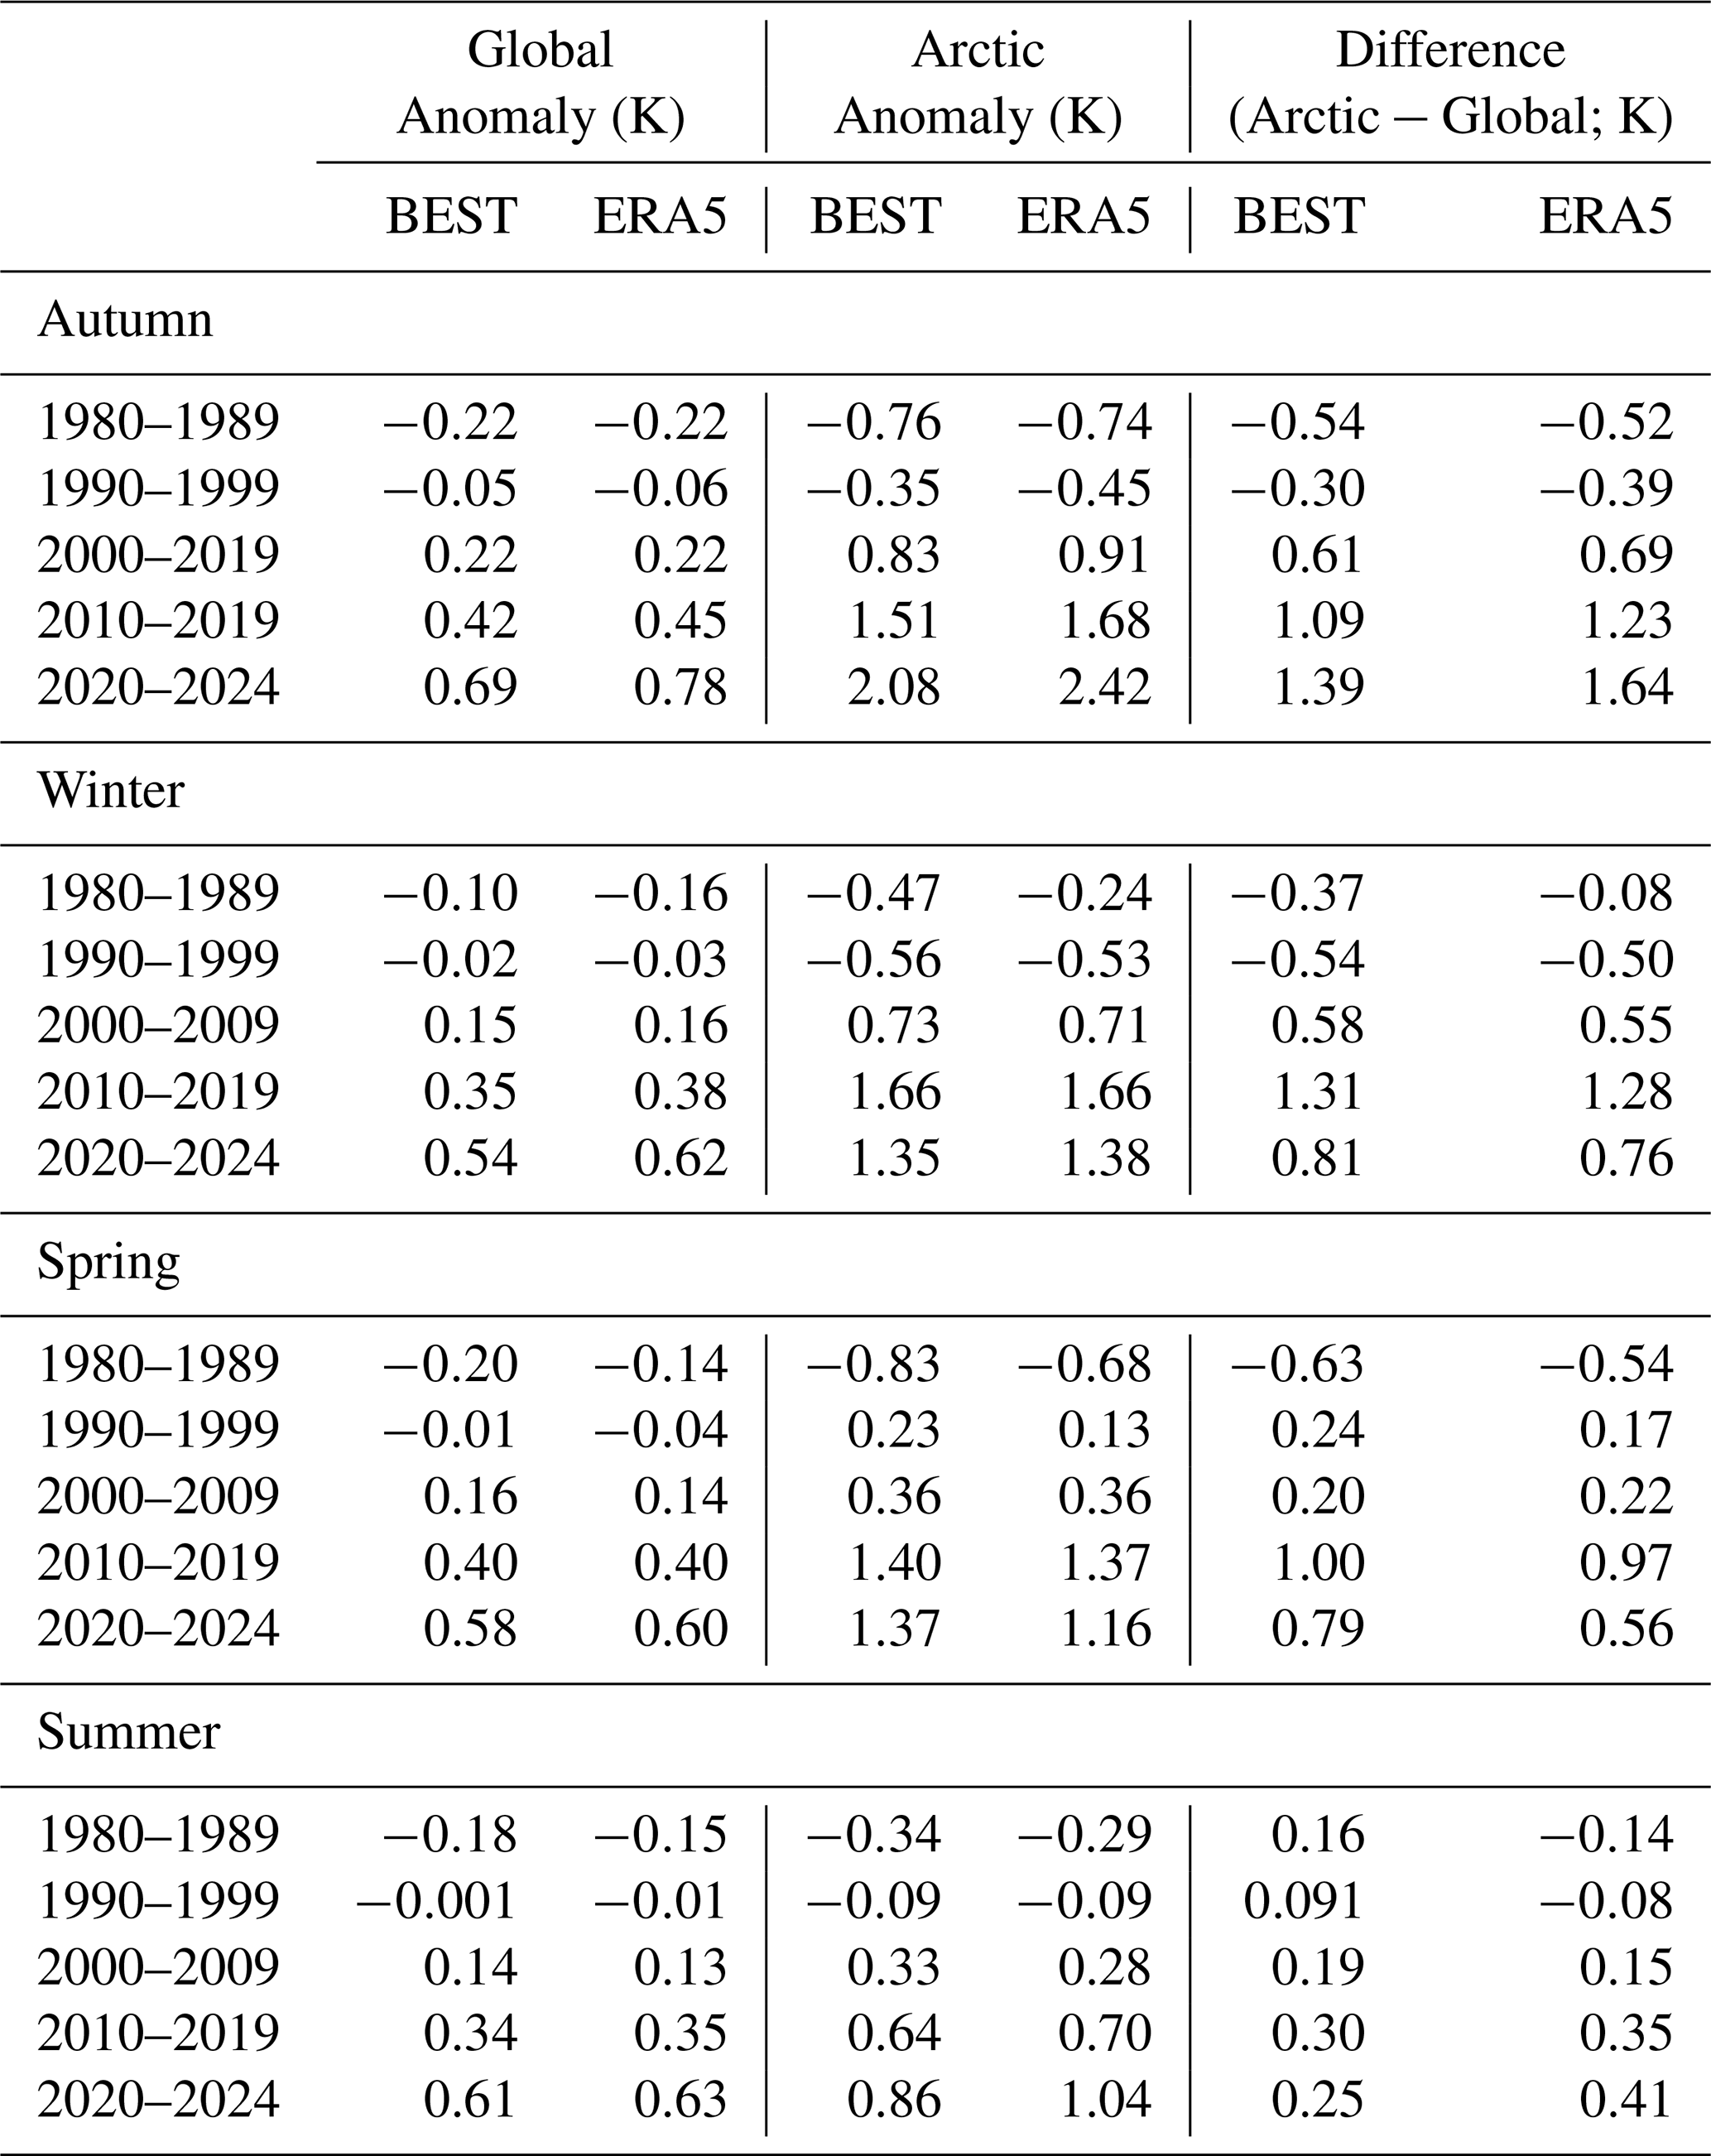
Results for autumn are examined first (Fig. 3 (ERA5) and Fig. S3 (BEST data)). The description of the results apply to both datasets unless indicated otherwise. For the first 2 decades, 1980–1989 and 1990–1999, both the average global anomaly and the average Arctic anomaly are small and negative, with the Arctic anomalies actually more negative than the global value. Since 1980–1989 is (primarily) the first decade of the 1981–2010 baseline period, greater negative anomalies for the Arctic than the globe still indicate amplified warming in the Arctic. Likewise, as the middle of the baseline period, 1990–1999 experiences the smallest anomalies. This pattern reverses starting in the 2000–2009 decade. What this is capturing is that early in the record, the poleward gradient in 2 m temperatures was stronger than it is today; as AA evolves, the gradient obviously weakens.
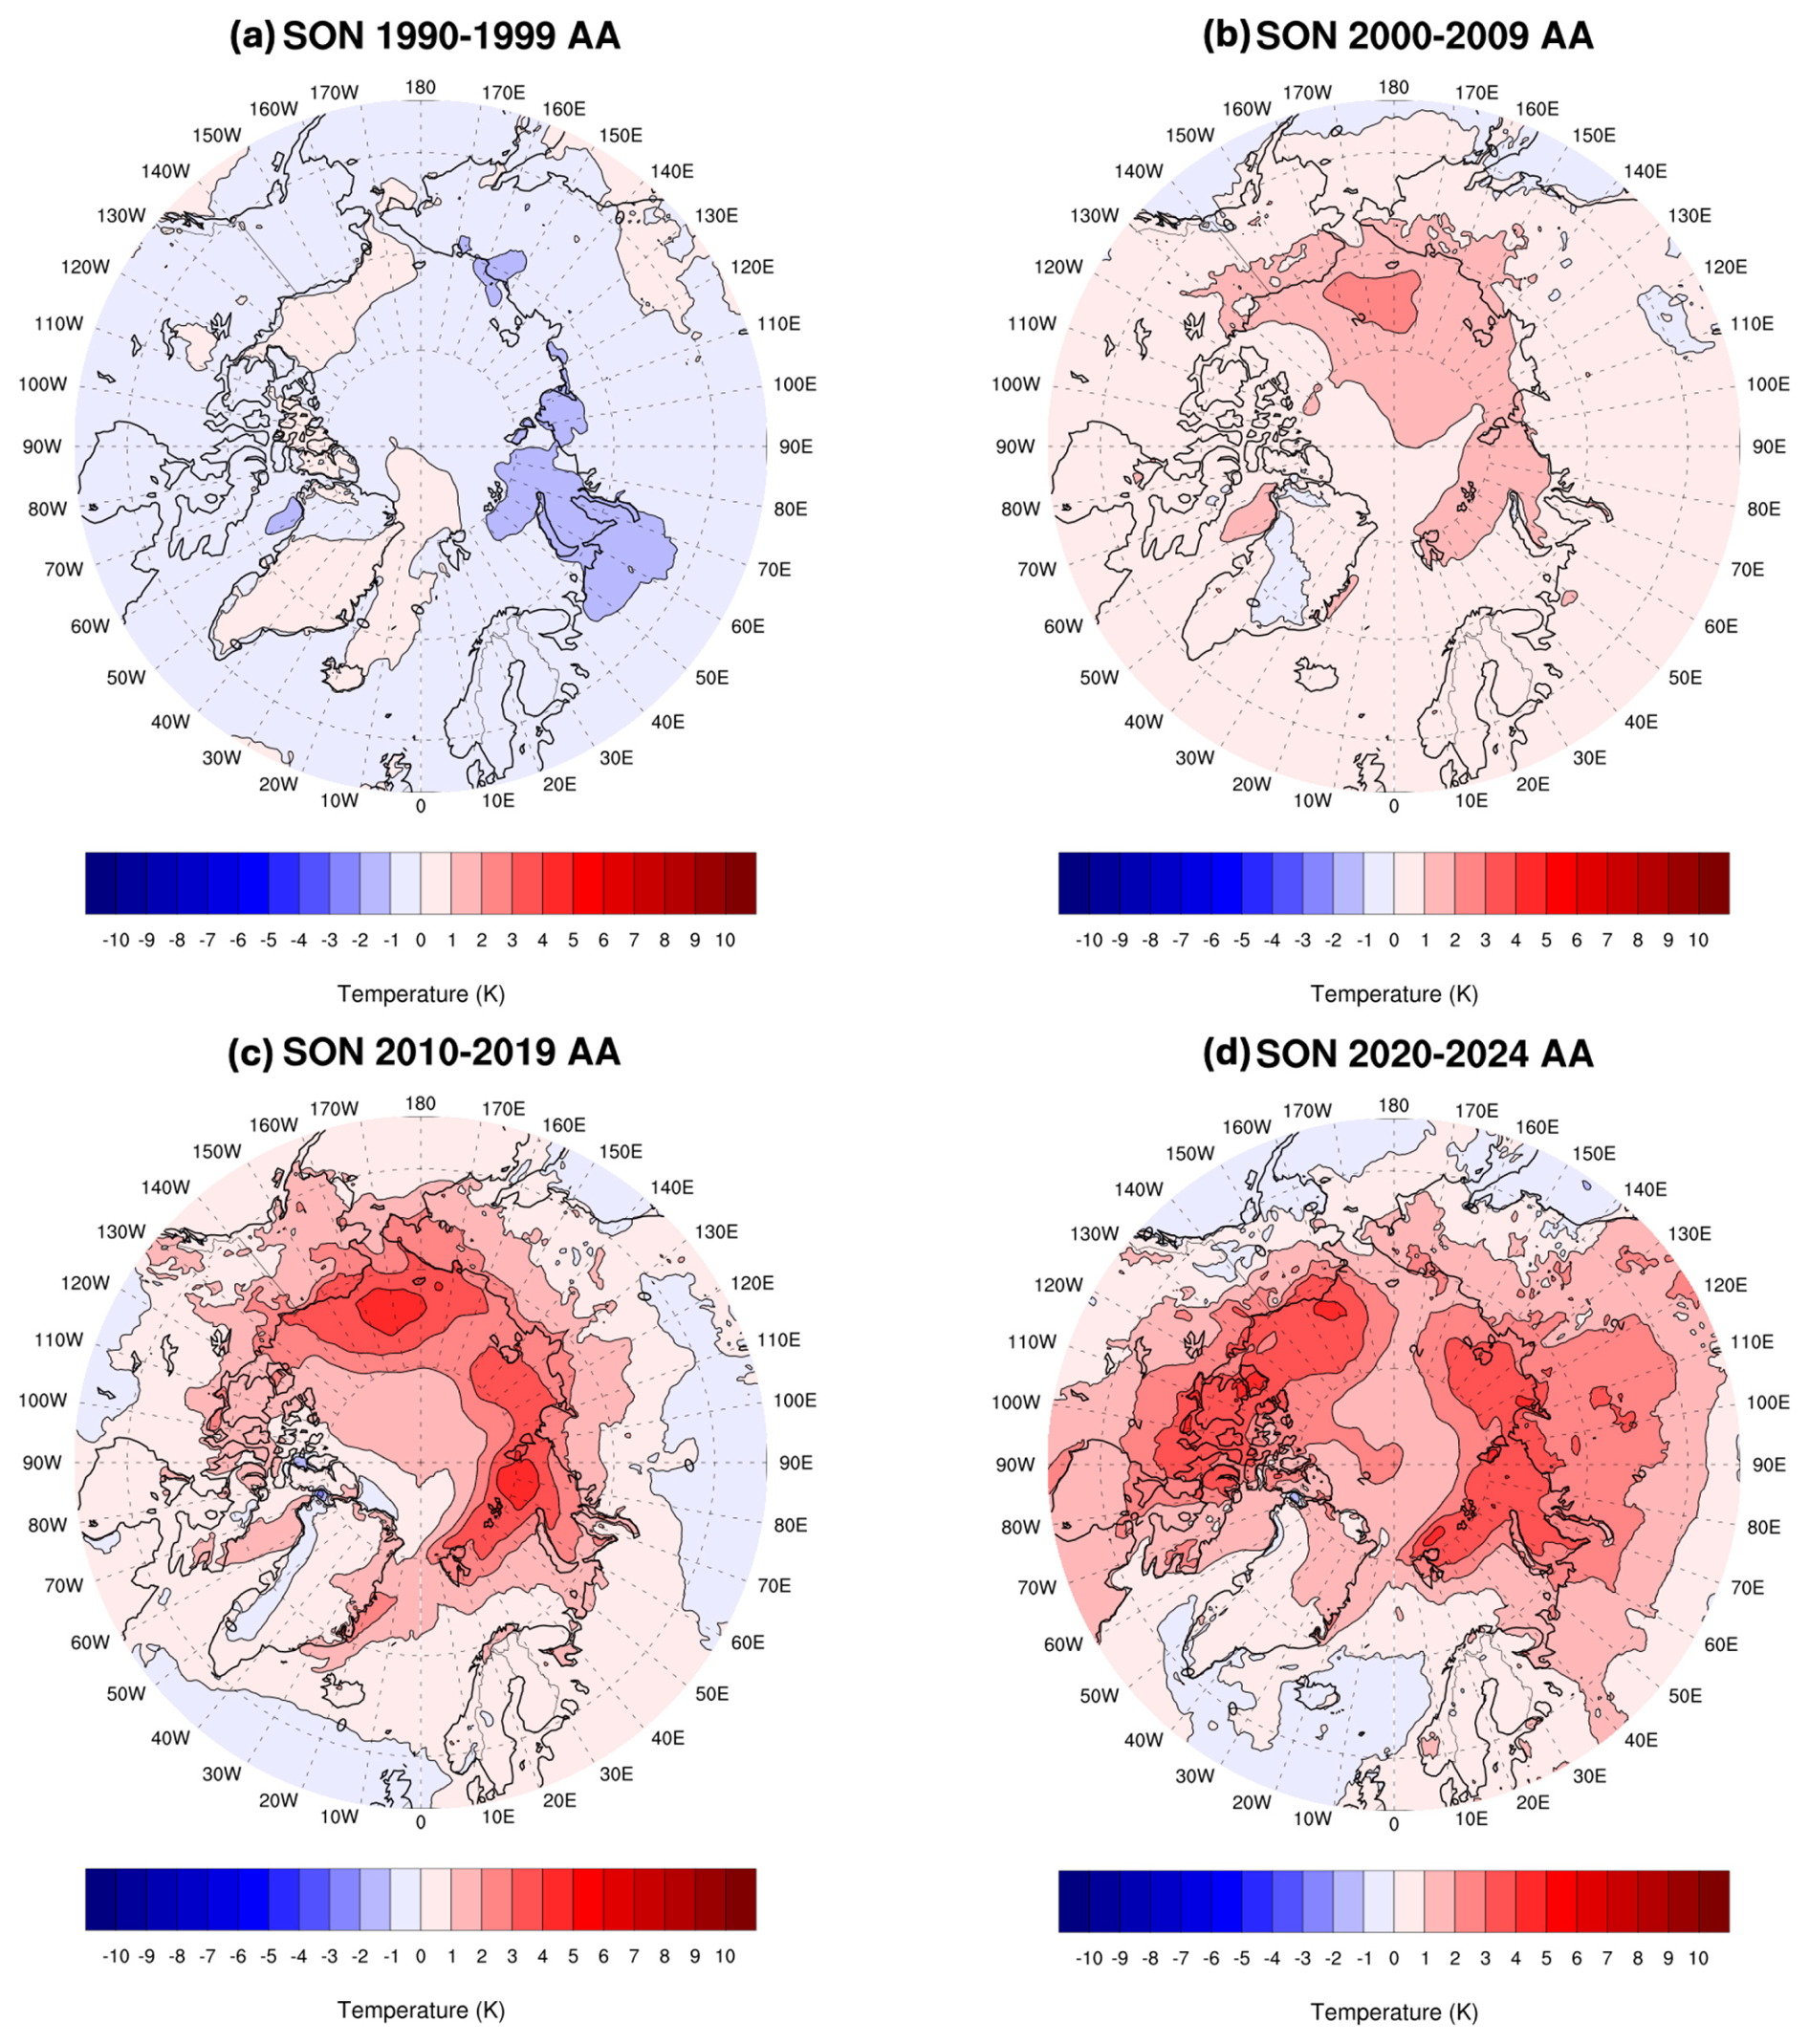
Figure 3Autumn (September, October, November (SON)) ERA5 2 m temperature anomalies in °C relative to 1981–2010 for (a) 1990–1999, (b) 2000–2009, (c) 2010–2019 and (d) 2020–2024 minus the global average temperature anomaly for each period.
For the first decade, 1980–1989, LAAs are generally small across the Arctic, with a mix of positive and negative values, but with the negative anomalies obviously dominating (not shown). The exception is in the Chukchi Sea, where strong negative LAA values of up to 3 °C are found. Based on data from 1979–1996, Parkinson et al. (1999) showed downward trends in ice concentration in the Chukchi Sea of around 4 % per decade. However, as the area had more sea ice in the 1980–1989 decade relative to the 1981–2010 climatology, it shows up as negative LAA values in Fig. 3. As noted, in the 1990–1999 decade, both the Arctic average and the global average anomaly are at their minimum, since this decade is in the middle of the 1981–2010 baseline (Table 1). However, the difference between the 1990–1999 and the subsequent 2000–2009 decade is striking. Both the Arctic and global average anomalies are positive (Table 1, Figs. 3 and S3). Positive LAA values encompass most of the Arctic. The largest positive LAA values lie in the Chukchi and East Siberian Seas, reflecting the continuing development through this decade of extensive open waters in September (Figs. 3 and S3). Note that the first clear indication of the emergence of AA related to sea ice loss was based on data extending through the end of the 2000–2009 decade (Serreze at al., 2009; Screen et al., 2010a, b). Wang et al. (2017) similarly found the emergence of amplified temperature anomalies over the Arctic (60–90° N) compared to the northern mid-latitudes (30–60° N) in this decade. By the 2010–2019 decade, autumn LAA values of 3–5 °C in the ERA5 data (2–4 °C in the BEST data) are now prominent along the entire Eurasian coast and in the Chukchi Sea; consistent with the continued increase in open water areas in September. Much smaller AA values encompass most of the rest of the Arctic.
The most recent period, 2020–2024, sees a shift. While strongly positive anomalies relative to global average anomalies – that is, positive LAA values – remain over much of the Eurasian coastal sea, LAA anomalies over the Chukchi Sea are now smaller, and larger values have appeared in the Beaufort Sea and the Canadian Arctic Archipelago. In explanation, when Arctic sea ice extent began to decline, it was initially most prominent in the Chukchi Sea region, so LAA values there are especially large, as seen in the 2009–2009 and 2010–2019 plots. With the rise in the global temperature anomalies, these LAA values become more subdued.
The winter evolution is quite different. The Arctic-averaged anomaly and the global anomaly for the 1980–1989 are small and quite alike – AA had not yet emerged (Table 1). In terms of the LAA structure (not shown), positive values of typically 1–2 °C over much of Eurasia, Alaska and Canada contrast with negative values of similar size elsewhere, the exception being negative values of 2–3 °C in the Barents Sea sector. The story is similar for the 1990–1999 decade – AA had yet to clearly emerge (Table 1), and, indeed, the Arctic average anomaly was about half a degree colder than the global average anomaly. The LAA structure leading to this interesting finding is characterized by partly offsetting positive and negative values (Fig. 4 (ERA5) and Fig. S4 (BEST data)). As was the case for the discussion of the autumn AA, the description of the results applies to both datasets unless indicated otherwise. Of interest in this regard is that North Atlantic Oscillation (or Arctic Oscillation) shifted from a negative to a strongly positive index phase between the 1970s and late 1990s. Numerous studies examined the strong temperature trends associated with this shift, notably warming over northern Eurasia, with cooling over northeastern Canada and Greenland (e.g., Hurrell, 1995, 1996; Thompson and Wallace, 1998). There was vibrant debate over whether the shift might be in part a result of greenhouse gas forcing and an emerging signal of expected Arctic Amplification (see the review in Serreze et al., 2000).
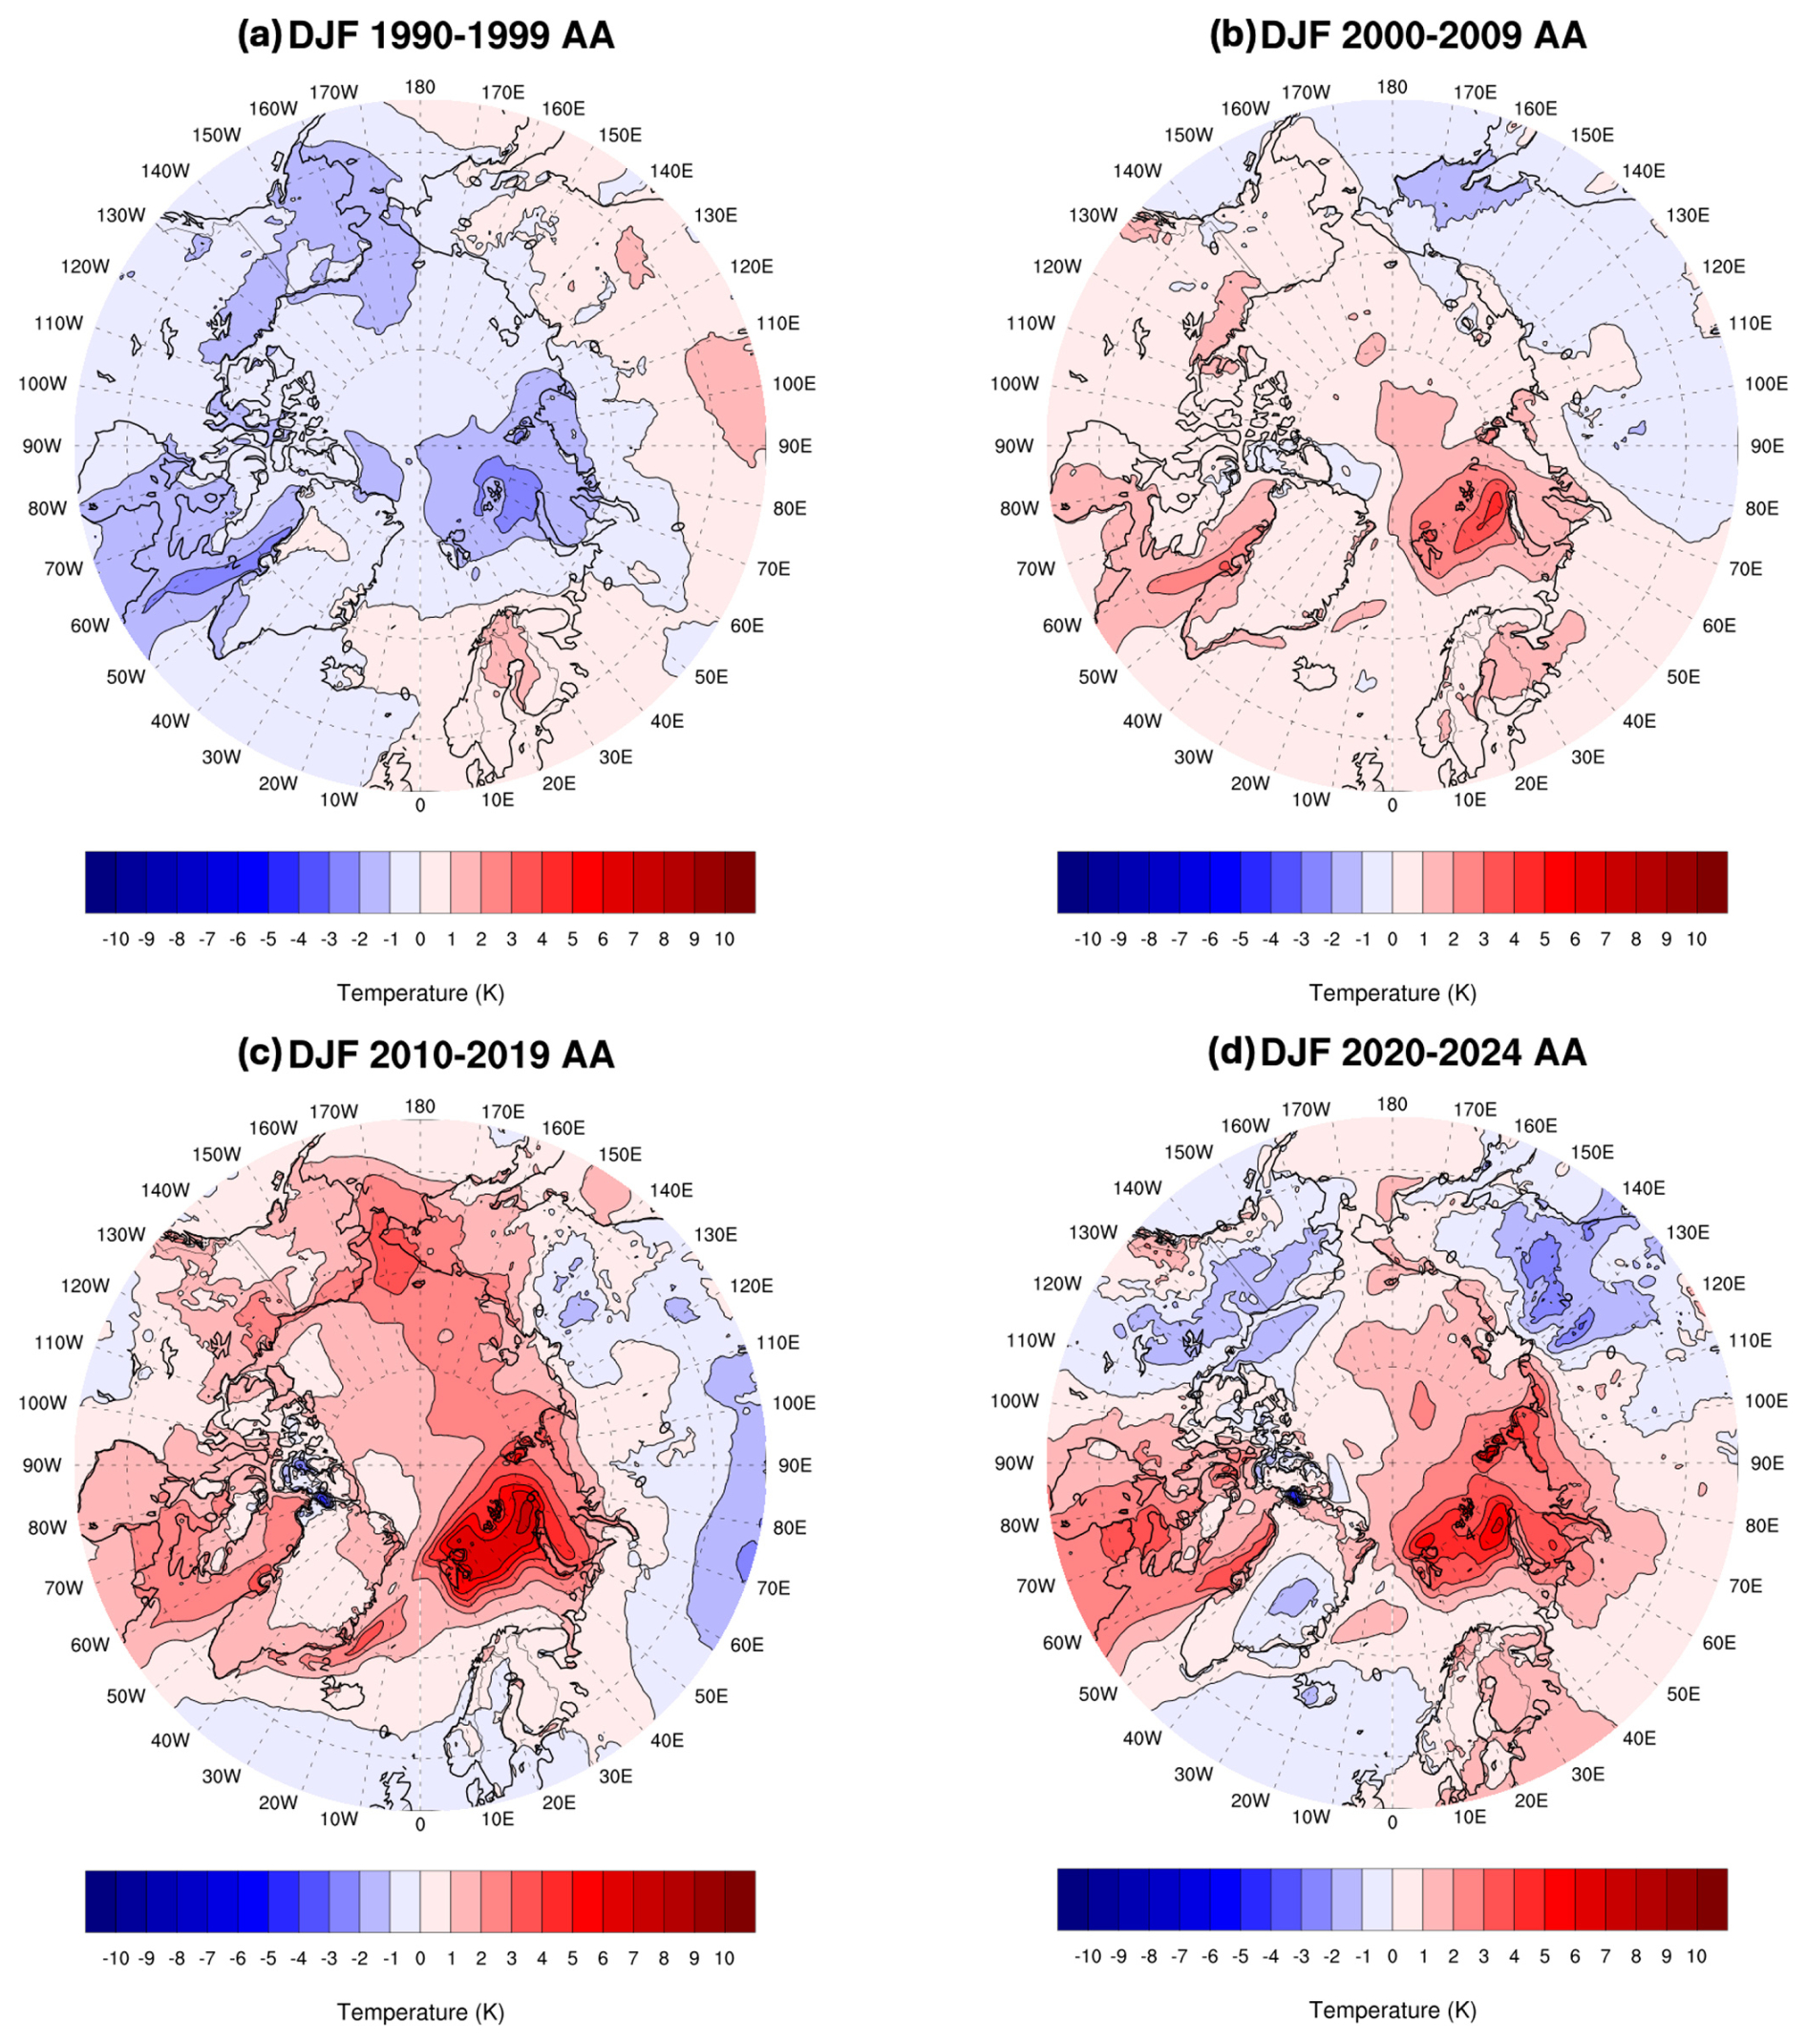
Figure 4Winter (December, January, February, DJF) surface temperature anomalies in °C relative to 1981–2010 for (a) 1990–1999, (b) 2000–2009, (c) 2010–2019 and (d) 2020–2024 minus the global average temperature anomaly for each period.
While there is some indication of a structure in LAA values for the 1990–1999 decade reminiscent of the rising phase of the NAO over this time (note that the index value subsequently decreased), looking back to Table 1, the behavior of the NAO clearly did not “boost” any emerging AA signal.
Turning to the decade 2000–2009, positive LAA values have become more dominant, and fairly large positive values have appeared over the Barents Sea sector, replacing the negative values of the previous decade. While by this decade, AA had clearly emerged (Table 1), note that the positive LAA values over northern Eurasia in 1990–1999 are replaced by negative values, indicative of a circulation shift, notably, regression of the NAO from its previous high index values.
The 2010–2019 period is characterized by the emergence of large positive LAA values over the Barents Sea sector which have intensified since the 2000–2009 decade, pointing to the effects of growing open water areas in this sector. Positive LAA values also cover almost all Arctic latitudes. The Barents Sea feature remains prominent in the past 5 years of the record (2020–2024). Note, however, the negative anomalies over Alaska and eastern Eurasia. As a result, the difference between the Arctic average temperature anomaly and the global average anomaly is actually smaller than in the 2010–2019 period, that is, pan-Arctic AA is somewhat smaller. Note also by comparison with the decade 2010–2019, LAA values along most of the Eurasia coast are less pronounced. This is understood in that, by December, all areas along the Eurasian coast and north of the Chukchi and East Siberian seas have refrozen.
The observation that the last three time periods have negative LAA values over Eurasia is of interest, as it appears linked to the Warm Arctic-Cold Eurasia (WACE) phenomenon. While AA has become increasingly prominent, this has coincided with episodes of surface cooling over Eurasia, most evident in winter with considerable decadal variability. (e.g., Gong et al., 2017; Li et al., 2021). The WACE phenomenon has garnered considerable attention over the past decades and a suite of driving factors have been offered. An Urals blocking pattern has been identified as playing a strong role, and recent work has shown that decadal variability in the WACE phenomenon is mediated by phases of the Pacific Decadal Oscillation and the Atlantic Multidecadal Oscillation (e.g., Luo et al., 2022).
Turning back to the Barents Sea sector, it is notable that this is one of the few areas of the Arctic (along with eastern Hudson Bay/Hudson Strait and Bering Strait, see Fig. 2) with substantial downward trends in winter sea ice concentration. Various studies have attributed the loss of winter ice in the Barents Sea and associated temperature anomalies and trends to processes involving atmospheric circulation, facilitating intrusions of warm moist air into the region with wind patterns promoting stronger transport of warm Atlantic waters into the region (Woods and Caballero, 2016; Lien et al., 2017; Siew et al., 2024). Warm and moist air advection raises temperatures, inhibits autumn and winter sea ice growth (Woods and Caballero, 2016; Crawford et al., 2025; Lee et al., 2017), and enhances spring and summer ice melt (Kapsch et al., 2013; Park et al., 2015). Intrusions of Atlantic-derived waters, which appear to be in part wind driven, also discourage winter ice growth. Beer et al. (2020) identified an oceanic mechanism that increases the vertical heat flux in the upper Arctic Ocean under global warming that causes increased ocean heat transport into the Arctic, which appears as a substantial contributor to Arctic Amplification.
While our primary focus is on the evolution of AA and LAAs in autumn and winter, it is warranted to briefly discuss spring and summer (not shown). The spring pattern of LAAs for the 1980–1989 decade is characterized by small and mostly negative values across the Arctic, transitioning to a mix between small positive and negative values for the 1990–1999 decade, as well as for the 2000–2010 decade. The largest difference between the Arctic average and global average anomaly was for the 2010–2019 decade. This is consistent with the much smaller AA in this season compared to autumn and winter. Only for the last 5 years of the record, 2020–2024 do prominent positive LAA values of over 3 °C appear over Eurasia, but these are partly balanced by negative LAAs elsewhere and may represent short-term internal variability. The key feature of summer is that while as the decades pass, modest positive values of LAA appear over land, values remain close to zero over the Arctic Ocean, reflecting the effects of the melting sea ice surface. The last 5 years also show positive LAA values of up to 3 °C along the shores of Eurasia, likely due to the open coastal waters in these areas.
The results just discussed are with reference to 1981–2010 averages. Use of an earlier climatology (e.g., 1951–1980) naturally yields stronger positive anomalies and weaker negative LAA values in the later part of the temperature records, while a more recent climatology (e.g., 1991–2020, the current NOAA standard) has the opposite effect. The 1981–2010 reference applied in this paper is an appropriate middle ground, and is the reference period used for sea ice analyses by the National Snow and Ice Data Center (Scott, 2022).
3.3 Vertical Structure
An assessment of the vertical structure of warming helps to both highlight the effects of sea ice and shed light on other processes known to be involved in Arctic Amplification, notably, static stability. To this end, we look at longitudinal cross sections of temperature anomalies for the most recent 10 years of the record, averaged between the latitudes 75–80° N, which corresponds to the latitude band with pronounced anomalies in surface air temperature across both SON and DJF. We look first at October, then turn attention to December (Fig. 5). October is when there will be particularly large heat fluxes from the ocean to atmosphere, while in December, most of these areas (apart from the Barents Sea) have re-frozen. This choice of months is intended to capture that contrast.
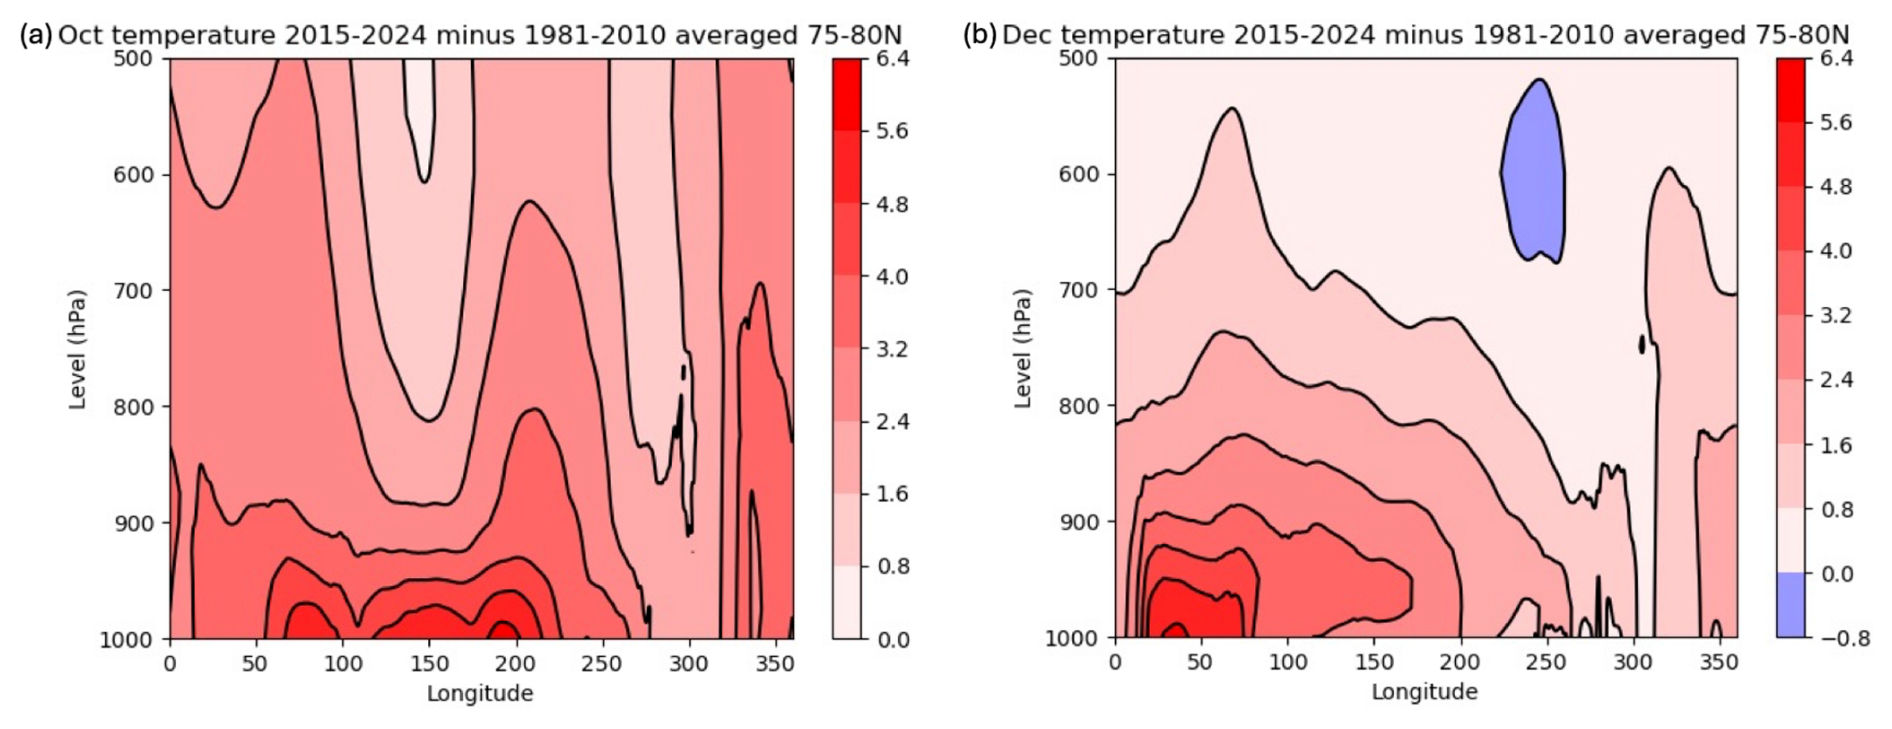
Figure 5Vertical cross sections by longitude across latitudes 75 to 80° N for October (a) and December (b) of temperature anomalies for 2015–2024 minus 1981–2010.
The strongly positive anomalies located from 60–120° E and between 180° E to 120° W (these being stronger) are clearly surface-based, which makes sense as they are due to strong upward surface heat fluxes. The more prominent feature between 180° E and 120° W (centered along the East Siberian and Chukchi Seas) is notable in that anomalies of 3 °C extend up to 700 hPa. The December cross section shows maximum surface-based temperature anomalies focused between about 20–70° E (centered near the Barents Sea), but positive anomalies do not extend as far in the vertical compared to October. Although these anomalies are less vertically extensive, the stronger near-surface temperature difference between the surface and the air above in December could potentially enhance surface fluxes.
3.4 Static Stability
While the magnitude of the surface temperature anomaly will bear on how high in the vertical positive anomalies will persist, the vertical stability will play a role. The strong stability of the lower Arctic troposphere has long been recognized (Wexler, 1936; Bradley et al., 1992; Kahl et al., 1992; Serreze et al., 1992) and is central to arguments that lapse rate feedback is a contributor to AA. Based on radiosonde observations, Serreze et al. (1992) reported that temperature inversions (extremely strong stability), nearly ubiquitous over the ice-covered Arctic Ocean, tend to be surface-based from October through April, increasing in strength from October through winter in both depth and in the temperature difference from inversion base to top. For example, in October the median inversion depth is about 900 m and the temperature difference is about 9 K, whereas corresponding values in March are 1200 m and 12 K. In summer, inversions are shallower and often elevated, with a deep mixed layer below. (There are also commonly shallow melt-induced surface-based inversions.) The seasonal cycle over Arctic land areas is similar but with temperature differences across the inversion of 14–16 K (Fig. 6).
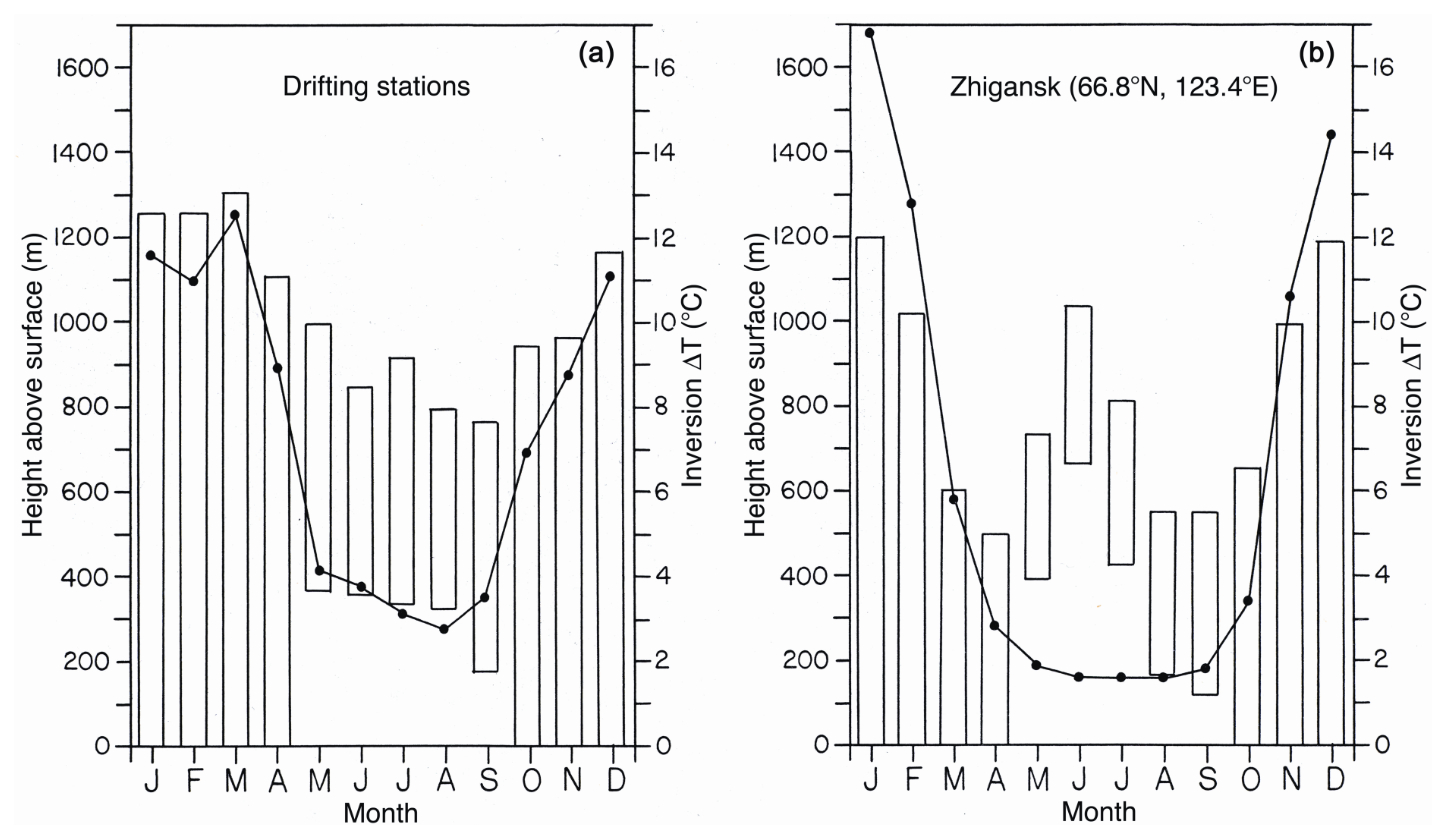
Figure 6Monthly median inversion top (top of bars), base (bottom of bars) and temperature difference (solid lines) from (a) drifting station data from the central Arctic Ocean; (b) station Zhigansk over the Siberian tundra, taken as representative of the region (from Serreze et al., 1992, by permission of AMS).
Figure 7 shows a vertical cross section of potential temperature from the equator to 90° N for October. Potential temperature increases with altitude more steeply in the Arctic than at other latitudes, illustrating its stronger static stability. In turn, a larger vertical extent of warming in October compared to December would be expected given that stability increases from autumn into winter. In terms of potential temperature, at 80° N (for example) the increase in potential temperature from the surface to 850 hPa in October is 10 K, versus 15 K in December. From the surface to 700 hPa, potential temperature increases by 20 K in October versus 25 K in December. The atmosphere starts to cool freely to space at around 5–6 km above the surface (roughly the 500 hPa level). While pronounced autumn warming does not extend upwards that far (Fig. 5), the results nevertheless argue that as amplified warming progresses, cooling to space will become more efficient as a negative feedback on autumn warming.
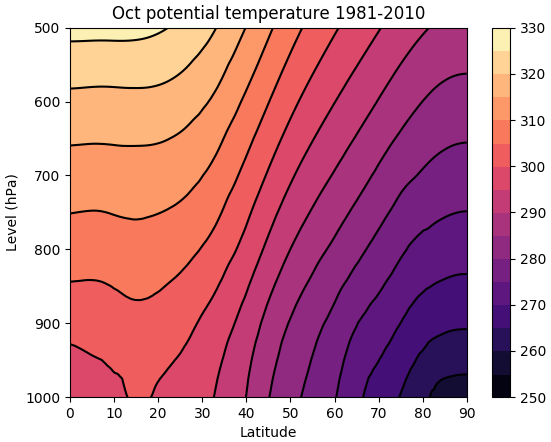
Figure 7Vertical cross section of zonally averaged potential temperature (K) from the equator to the pole for October, averaged over the period 1981–2010.
Figure 8 shows climatological averages of surface to 850 hPa static stability for October, along with linear trends. In a stable atmosphere, is negative (potential temperature increases with height while pressure decreases), so more negative values mean stronger stability. Consistent with Fig. 7, there is a general increase in average stability moving polewards. However, stability is strongest north of Greenland and the Canadian Arctic Archipelago. It is likely not a coincidence that these areas have the thickest sea ice in the Arctic, implying especially small heat fluxes through the ice. Not surprisingly, large trends toward weaker static stability (positive values) dominate all the areas along the Eurasian coast, corresponding to the largest declines in September ice concentration, as well as in the Barents Sea, which has seen declines in winter. Smaller trends towards weaker stability dominate most of the rest of the Arctic Ocean, likely driven by a thinning ice pack. While the average conductive heat flux through most of the ice cover in October is on the order of 5–10 W m−2 (upward), Liu and Zhang (2025) found that the conductive heat flux has increased since 1979 due to thinning, which outcompetes the effect of positive trends in surface skin temperatures. Our analysis finds support in the study of Simmonds and Li (2021) who find strong decreases in the Brunt–Vaisalla frequency over the Arctic and its broader region. We note here that the B-V frequency contains a term which highlights the impact in the colder regions.
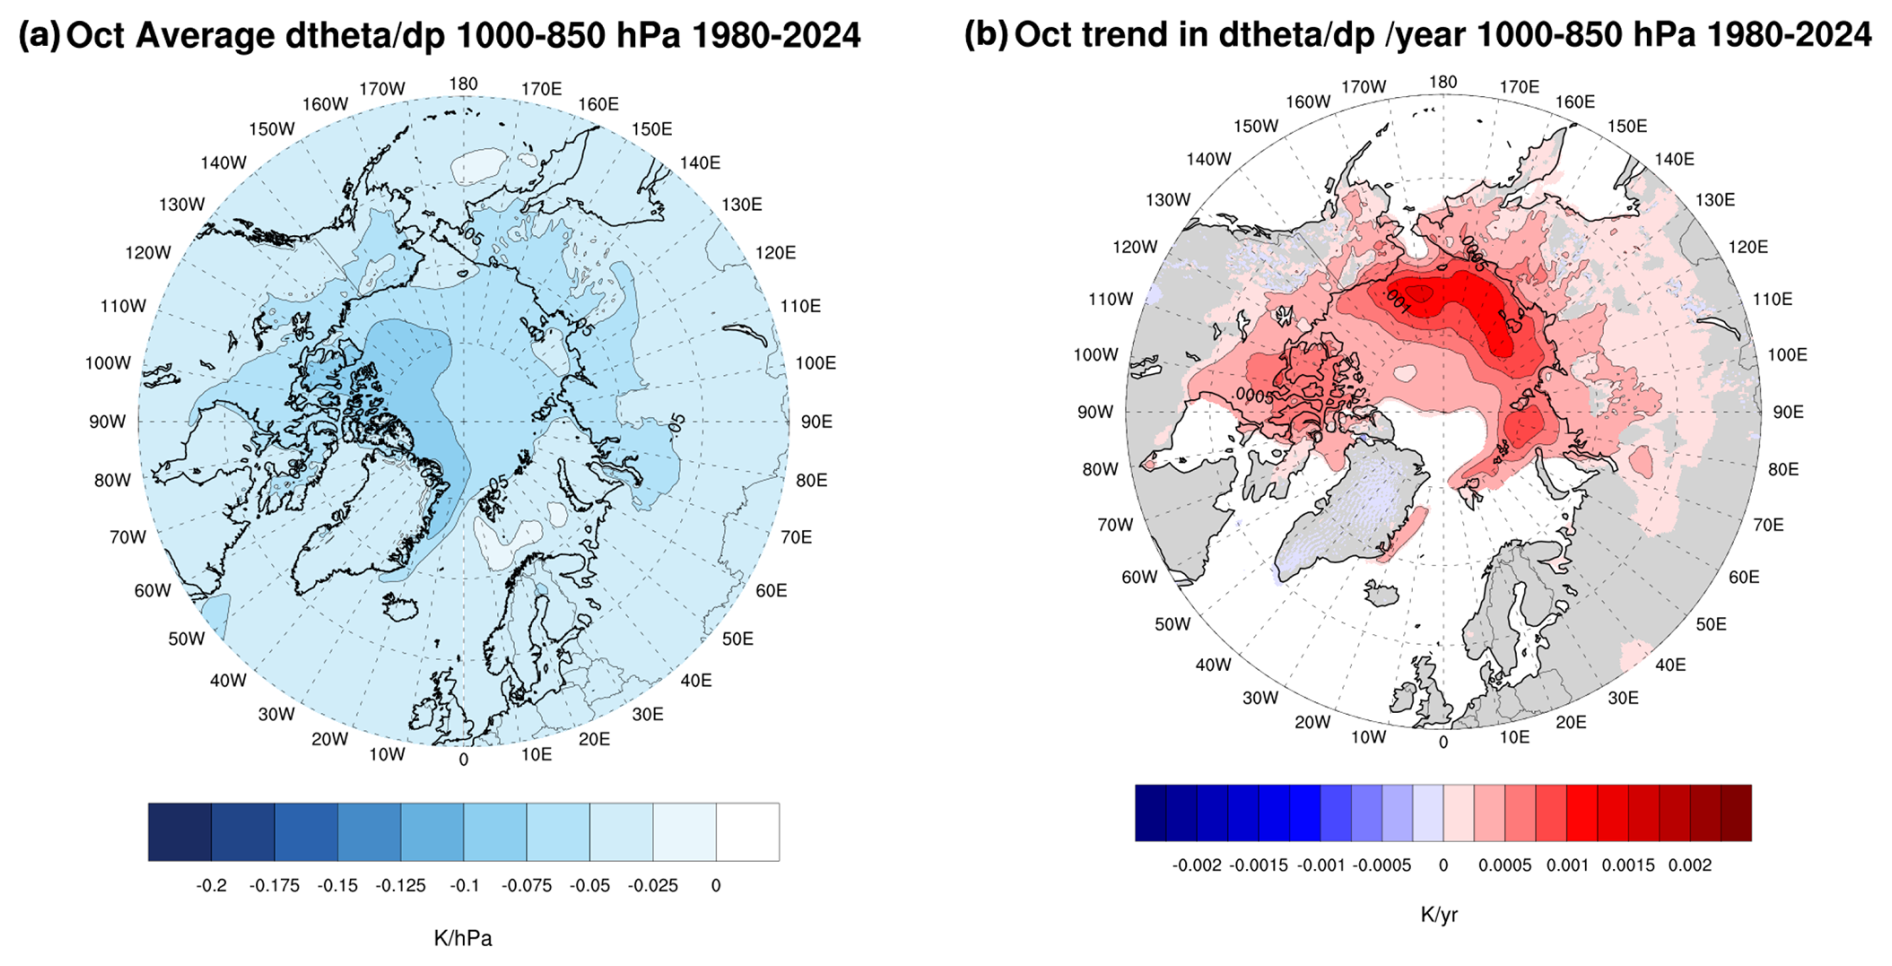
Figure 8Climatological averages (a, K hPa−1) and linear trends (b, ) in low-level vertical stability (expressed as () for October. Positive numbers for the climatological averages mean weaker stability, positive values for trends mean a decrease in stability with time. Only trends significant at p<0.05 are shaded based on an ordinary least squares regression test.
Corresponding results for December follow in Fig. 9. Average stability is generally stronger than for October, with the clear exception of the Norwegian and Barents Seas and the extreme northern North Atlantic, where there is near neutral stability. The Norwegian and Barents Seas, in particular, have been recognized for unstable near-surface boundary layers in winter that develop during cold air outbreaks as Arctic air moves over open water surfaces, promoting strong surface heat fluxes and convective-type precipitation (Olaffson and Okland, 1994). Trends towards weaker stability are in turn prominent in the Barents Sea, the southern Chukchi Sea and Baffin and Hudson Bays, all areas where winter ice losses have been pronounced (especially the Barents Sea). Interesting in this regard is that weakening winter stratification may lead to intensification of near surface winds by increasing downward momentum transfer (Zapponini and Goessling, 2024), which will then foster stronger upward turbulent heat fluxes.
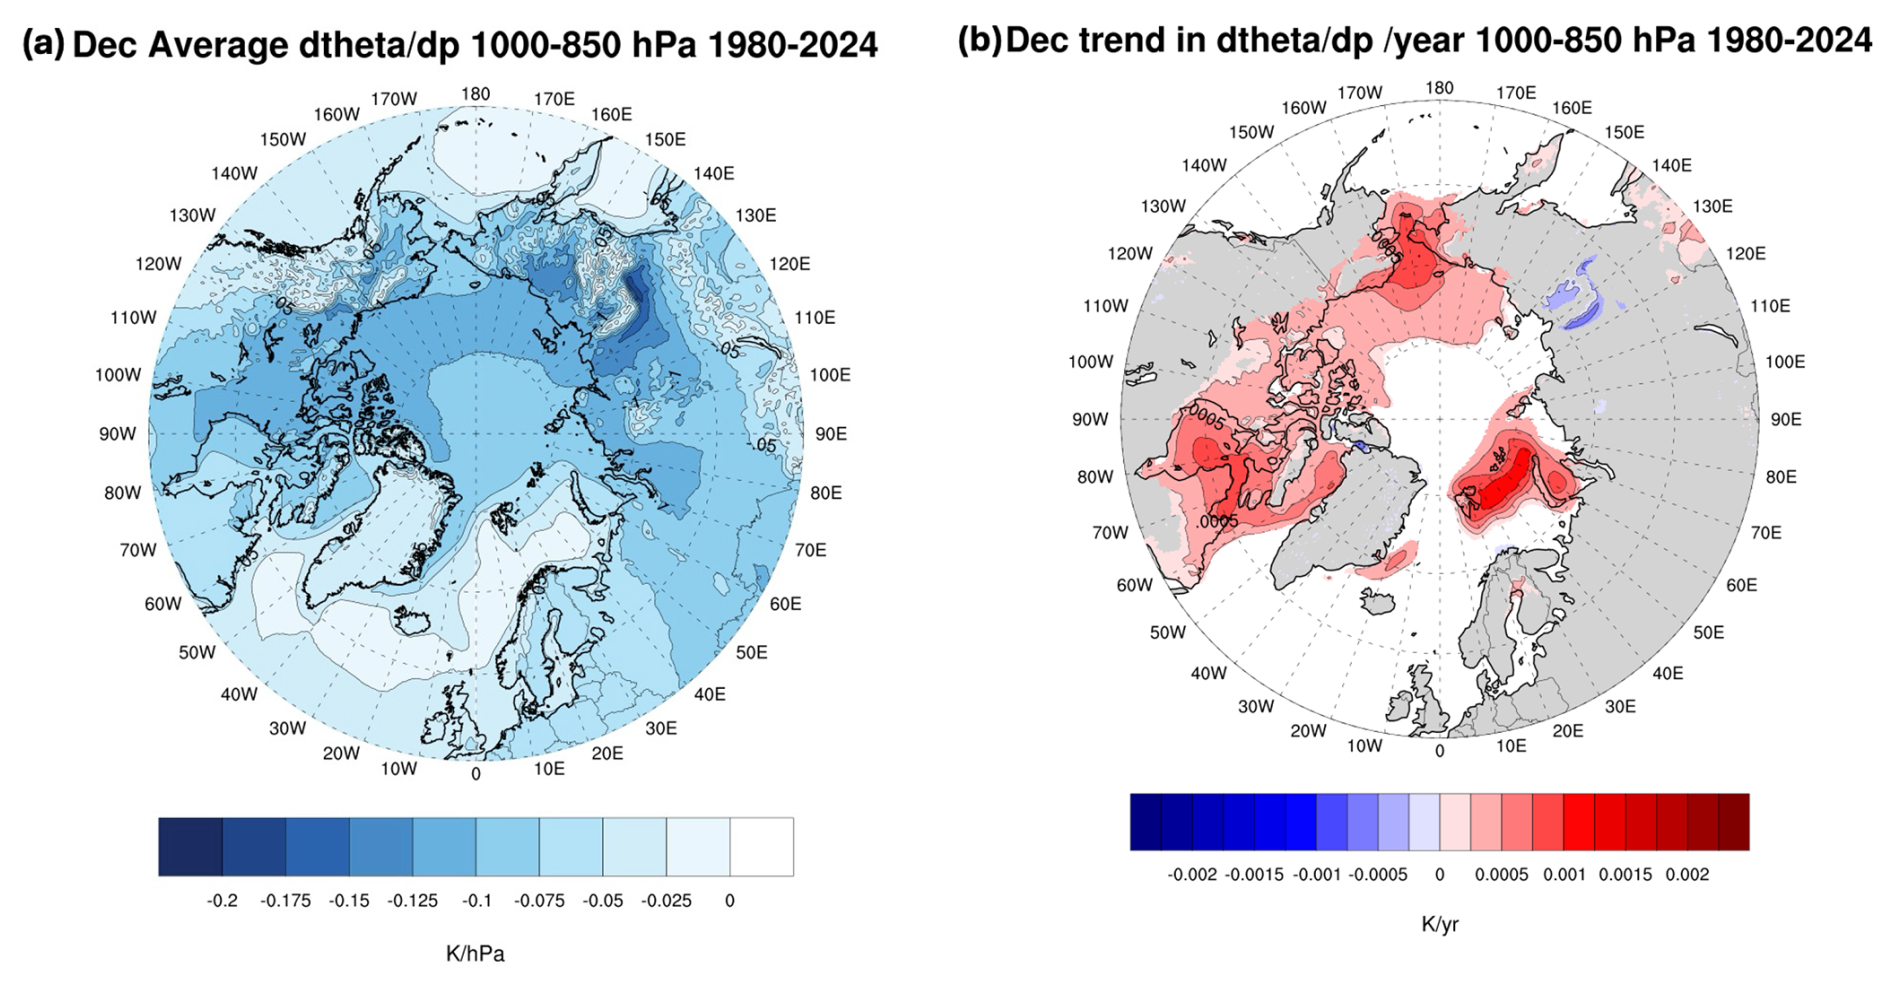
Figure 9Climatological averages (a, K hPa−1) and linear trends (b, ) in low-level vertical stability (expressed as () for December. Positive numbers for the climatological averages mean weaker stability, positive values for trends mean a decrease in stability with time. Only trends significant at p<0.05 are shaded based on an ordinary least squares regression test.
We stress that assessments of atmospheric stability and trends should be viewed with some caution. Based on comparisons with radiosonde profiles at coastal sites, Serreze et al. (2012) found that all three of the most modern reanalyses available at the time of that study (MERRA, NOAA CFSR, ERA-Interim) have positive cold-season temperature (and humidity) biases below the 850 hPa level and consequently did not capture observed low-level temperature and humidity and temperature inversions. MERRA had the smallest biases. Graham et al. (2019) similarly found a positive winter 2 m temperature bias in all six atmospheric reanalyses they compared to sea ice drifting stations – including ERA5. Additionally, Wang and Zhao (2024) found that the depiction of static stability over the Arctic in summer appears to be sensitive to the reanalysis product examined (ERA5, NCEP-R2 and JRA-55).
The results presented here show a clear association between patterns of autumn and winter sea ice concentration trends and both the year-to-year evolution and seasonal expression of Arctic temperature anomalies. The link with sea ice loss can be viewed as an expression of seasonally delayed albedo feedback. We also see signals of variable atmospheric circulation in both temperature trends and the spatial structure of LAAs by decade. As discussed, a suite of other processes can also be linked to Arctic Amplification. Given that any process leading to warming will tend to enhance sea ice melt (spring and summer) or discourage its formation (autumn and winter), it can be viewed as serving to reinforce the key role of sea ice loss on observed AA.
Consider in this regard studies from coupled models showing that AA can arise without the albedo feedback through the lapse rate and Planck feedbacks (e.g., Caballero and Langen, 2005; Pithan and Mauritsen, 2014; Previdi et al., 2021). Lapse rate feedback relates to the stronger stability of the Arctic atmosphere compared to low latitudes, focusing the temperature rise closer to the surface and reducing longwave radiative cooling to space. From coupled simulations, Previdi et al. (2021) find that through positive lapse rate feedback, AA develops in only a few months following an instantaneous quadrupling of atmospheric CO2, well before any significant sea ice loss, although ice loss contributes significantly to warming after the first few months. While one can question what an instantaneous quadrupling of CO2 teaches us about the real world, a key point is once sea ice begins to decline, the positive lapse rate feedback, keeping the heating near the surface, will contribute to spring and summer ice melt and delay seasonal ice growth. That static stability becomes stronger from autumn into winter indicates that focusing the heating near the surface will also be more effective in winter. Conversely, ice loss, and likely also heat fluxes, are changing the larger environment towards reduced stability at low levels.
Turning to the Planck feedback, the larger increase in Arctic temperatures required to bring the system back to radiative equilibrium in response to a forcing can also be seen as a process augmenting summer sea ice loss and delaying autumn and winter ice growth. Increased autumn cloud cover as a contributor to AA is closely tied to sea ice loss through reducing stability in the boundary layer, promoting large upward surface heat fluxes (e.g., Kay and Gettleman, 2009).
In parting, a key message stemming from the present study is that the process of AA must consider both its strong seasonality and that AA, which is generally assessed by comparing Arctic regional temperature trends against trends for the globe as a whole, comes about by the integration across the Arctic of large spatial heterogeneity of temperature changes, seen both in the spatial pattern of Arctic trends but especially when we look at the problem through local amplification anomalies – LAAs. While AA is small in summer, summer processes, namely the reduction of sea ice concentration and enhanced energy gain in the mixed layer, set the stage for the strong regional expressions of AA in autumn. These changes in spatial patterns of temperature anomalies extend into winter as areas of open water freeze over. In all seasons, variable atmospheric circulations appear to be important. Anomalous summer circulation can affect spatial patterns of September ice extent. In autumn and winter, these anomalous circulation patterns can affect temperature through advection as well as by their influence on sea ice concentration, such as in the Barents Sea. Static stability also changes seasonally, which will influence the vertical expression of temperature anomalies.
In short, the more we look at AA, the more we discover that it is a very complex beast. These complexities bear not only on the future evolution of AA and related impacts on permafrost warming and changes in the frequency of rain on snow events (Serreze et al., 2021), but on key issues such as potential impacts of Arctic warming on middle latitude weather patterns (Ding et al., 2024).
The ERA5 data were obtained from the Research Data Archive at the National Center for Atmospheric Research: https://doi.org/10.5065/BH6N-5N20 (ECMWF, 2019). Sea ice data was obtained from the National Snow and Ice Data Center at https://doi.org/10.5067/X5LG68MH013O (Comiso, 2023). For processing code contact Elizabeth Cassano (elizabeth.cassano@colorado.edu).
The supplement related to this article is available online at https://doi.org/10.5194/tc-20-411-2026-supplement.
Mark Serreze wrote the first draft of the paper. Elizabeth Cassano performed the bulk of the data analysis and creation of figures and assisted in writing. Alex Crawford, John Cassano and Chen Zhang provided intellectual input to the paper and contributed to the writing.
The contact author has declared that none of the authors has any competing interests.
Publisher's note: Copernicus Publications remains neutral with regard to jurisdictional claims made in the text, published maps, institutional affiliations, or any other geographical representation in this paper. The authors bear the ultimate responsibility for providing appropriate place names. Views expressed in the text are those of the authors and do not necessarily reflect the views of the publisher.
This research has been supported by NSF Navigating the New Arctic Grant 1928230 and the National Science and Engineering Research Council Discovery Grant RGPIN-2025-05614.
This paper was edited by Stephen Howell and reviewed by three anonymous referees.
AMAP: Arctic Climate Change Update 2021: Key trends and impacts, Summary for policy-makers, Arctic Monitoring and Assessment Programme (AMAP), Oslo, Norway, ISBN: 978-82-7971-201-5, 2021.
Arrhenius, S.: On the influence of carbonic acid in the air upon the temperature of the ground, Philos. Mag. J. Sci., 5, 237–276, 1896.
Barrett, A. P., Stroeve, J. C., and Serreze, M. C.: Arctic Ocean Precipitation from atmospheric reanalyses and comparisons with North Pole drifting station records, J. Geophys. Res.-Oceans, 125, https://doi.org/10.1029/2019jc015415, 2020.
Beer, E., Eisenman, I., and Wagner, T. J.: Polar amplification due to enhanced heat flux across the halocline, Geophys. Res. Lett., 47, https://doi.org/10.1029/2019GL086706, 2020.
Bianco, E., Iovino, D., Masina, S., Materia, S., and Ruggieri, P.: The role of upper-ocean heat content in the regional variability of Arctic sea ice at sub-seasonal timescales, The Cryosphere, 18, 2357–2379, https://doi.org/10.5194/tc-18-2357-2024, 2024.
Bradley, R. S., Kemig, F. T., and Diaz, H. F.: Climatology of surface-based inversions in the North American Arctic, J. Geophys. Res.-Atmos., 97, 15699–15712, https://doi.org/10.1029/92JD01451, 1992.
Caballero, R. and Langen, P.: The dynamic range of poleward energy transport in an atmospheric general circulation model, Geophys. Res. Lett., 32, L02705, https://doi.org/10.1029/2004GL021581, 2005.
Comiso, J. C.: Bootstrap Sea Ice Concentrations from Nimbus-7 SMMR and DMSP SSM/I-SSMIS (NSIDC-0079, Version 4), NASA National Snow and Ice Data Center Distributed Active Archive Center [data set], Boulder, Colorado, USA, https://doi.org/10.5067/X5LG68MH013O, 2023.
Crawford, A., Soriot, C., and Stroeve, J.: Autumn pauses in Arctic-wide sea-ice expansion, J. Glaciol., 71, e21, https://doi.org/10.1017/jog.2024.106, 2025.
Crawford, A. D., Lukovich, J. V., McCrystall, M. R., Stroeve, J. C., and Barber, D. G.: Reduced sea ice enhances intensification of winter storms over the Arctic Ocean, J. Climate, 35, 3353–3370, https://doi.org/10.1175/jcli-d-21-0747.1, 2022.
Dai, A., Luo, D., Song, M., and Liu, J.: Arctic amplification is caused by sea-ice loss under increasing CO2, Nat. Commun., 10, 121, https://doi.org/10.1038/s41467-018-07954-9, 2019.
Ding, S. S., Chen, X., Zhang, X., Zhang, X., and Xu, P.: A review on the Arctic-midlatitudes connection: Interactive impacts, physical mechanisms and nonstationary, Atmosphere, 15, 1115, https://doi.org/10.3390/atmos15091115, 2024.
ECMWF (European Centre for Medium-Range Weather Forecasts: ERA5 Reanalysis (0.25 Degree Latitude-Longitude Grid), updated monthly, NSF National Center for Atmospheric Research [data set], https://doi.org/10.5065/BH6N-5N20, 2019.
Esau, I., Pettersson, L. H., Cancet, M., Chapron, B., Chernokulsky, A., Donlon, C., and Johannesen, J. A.: The arctic amplification and its impact: A synthesis through satellite observations, Remote Sensing, 15, 1354, https://doi.org/10.3390/rs15051354, 2023.
Gong, T., Feldstein, S., and Lee, S.: The role of downward infrared radiation in the recent Arctic winter warming trend, J. Climate, 30, 4937–4949, https://doi.org/10.1175/JCLI-D-16-0180.1, 2017.
Graham, R. M., Cohen, L., Ritzhaupt, N., Segger, B., Graversen, R. G., Rinke, A., Walden, V. P., Granskog, M. A., and Hudson, S. R.: Evaluation of six atmospheric reanalyses over Arctic sea ice from winter to early summer, J. Climate, 32, 4121–4143, https://doi.org/10.1175/jcli-d-18-0643.1, 2019.
Graversen, R. G. and Burtu, M.: Arctic amplification enhanced by latent energy transport of atmospheric planetary waves, Q. J. Roy. Meteor. Soc., 142, 2046–2054, 2016.
Henderson, G. R., Barrett, B. S., Wachowicz, L. J., Mattingly, K. S., Preece, J. R., and Mote, T. L.: Local and remote atmospheric circulation drivers of Arctic change: A review, Frontiers in Earth Science, 9, 709896, https://doi.org/10.3389/feart.2021.709896, 2021.
Hersbach, H., Bell, B., Berrisford, P., Hirahara, S., Horányi, A., Muñoz-Sabater, J., Nicolas, J., Peubey, C., Radu, R., Schepers, D., Simmons, A., Soci, C., Abdalla, S., Abellan, X., Balsamo, G., Bechtold, P., Biavati, G., Bidlot, J., Bonavita, M., De Chiara, G., Dahlgren, P., Dee, D., Diamantakis, M., Dragani, R., Flemming, J., Forbes, R., Fuentes, M., Geer, A., Haimberger, L., Healy, S., Hogan, R. J., Hólm, E., Janisková, M., Keeley, S., Laloyaux, P., Lopez, P., Lupu, C., Radnoti, G., de Rosnay, P., Rozum, I., Vamborg, F., Villaume, S., and Thépaut, J.-N.: The ERA5 global reanalysis, Q. J. Roy. Meteor. Soc., 146, 1999–2049, https://doi.org/10.1002/qj.3803, 2020.
Hurrell, J. W.: Decadal trends in the North Atlantic Oscillation: Regional temperatures and precipitation, Science, 269, 676–679, 1995.
Hurrell, J. W.: Influence of variations in extratropical wintertime teleconnections on Northern Hemisphere temperature, Geophys. Res. Lett., 23, 665–668, 1996.
Jansen, E., Christensen, J. H., Dokken, T., Nisancioglu, K. H., Vintgher, B. M., Capron, E., Guo, C., Jensem, M. F., Langen, P. L., Pedersen, R. A., Yang, S., Bentsen, M., Kjaer, H. A., Sadatzki, H., Sessford, E., and Stendel, M.: Past perspectives on the present era of abrupt Arctic climate change, Nat. Clim. Change, 10, 714–721, 2020.
Kahl, J. D., Serreze, M. C., and Schnell, R. C.: Tropospheric low-level temperature inversions in the Canadian Arctic, Atmos. Ocean, 30, 522–529, https://doi.org/10.1080/07055900.1992.9649453, 1992.
Kapsch, M.-L., Graversen, R. G., and Tjernström, M.: Springtime atmospheric energy transport and the control of Arctic summer sea-ice extent, Nat. Clim. Change, 3, 744–748, https://doi.org/10.1038/nclimate1884, 2013.
Kay, J. E. and Gettelman, A.: Cloud influence on and response to seasonal Arctic sea ice loss, J. Geophys. Res., 114, D18204, https://doi.org/10.1029/2009JD011773, 2009.
Krishnan, S., Ekman, A. M. L., Hansson, H.-C., Riipinen, I., Lewinschal, A., Wilcox, L. J., and Dallafior, T.: The roles of the atmosphere and ocean in driving Arctic warming due to European aerosol reductions, Geophys. Res. Lett., 47, e2019GL086681, https://doi.org/10.1029/2019GL086681, 2020.
Landy, J. C., Dawson, G. J., Tsamados, M., Bushuk, M., Stroeve, J. C., Howell, S. E. L., Krumpen, T., Babb, D. G., Komarov, A. S., Heorton, H. D. B. S., Belter, H. J., and Aksenov, Y.: A year-round satellite sea-ice thickness record from CryoSat-2, Nature, 609, 517–522, https://doi.org/10.1038/s41586-022-05058-5, 2022.
Lebrun, M., Vancoppenolle, M., Madec, G., and Massonnet, F.: Arctic sea-ice-free season projected to extend into autumn, The Cryosphere, 13, 79–96, https://doi.org/10.5194/tc-13-79-2019, 2019.
Lee, S., Gong, T., Feldstein, S. B., Screen, J. A., and Simmonds, I.: Revisiting the cause of the 1989–2009 Arctic surface warming using the surface energy budget: Downward infrared radiation dominates the surface fluxes, Geophys. Res. Lett., 44, 10654–10661, https://doi.org/10.1002/2017GL075375, 2017.
Li, M., Lui, D., Simmonds, A., Dai, A., Zhong, L., and Yao, Y.: Anchoring of atmospheric teleconnection patterns by Arctic Sea ice loss and its link to winter cold anomalies in East Asia, Int. J. Climatol., 41, 547–558, 2021.
Li, Z., Ding, Q., Steele, M., and Schweiger, A.: Recent upper Arctic Ocean warming expedited by summertime atmospheric processes, Nat. Commun., 13, 362, https://doi.org/10.1038/s41467-022-28047-8, 2022.
Lien, V. S., Schlichtholz, P., Skagseth, Ø., and Vikebø, F. B.: Wind-driven Atlantic water flow as a direct mode for reduced Barents Sea ice cover, J. Climate, 30, 803–812, https://doi.org/10.1175/jcli-d-16-0025.1, 2017.
Liu, Y. and Zhang, J.: Conductive heat flux over Arctic sea ice from 1979 to 2022, J. Geophys. Res., 130, e2024JC022062, https://doi.org/10.1029/2024JC022062, 2025.
Luo, B., Luo, D., Dai, A., Simmonds, I., and Wu, L.: Decadal variability of winter warm Arctic-cold Eurasia dipole patterns modulated by Pacific Decadal Oscillation and Atlantic Multidecadal Oscillation, Earth's Future, 10, e2021EF002351, https://doi.org/10.1029/2021EF002351, 2022.
Markus, T., Stroeve, J. C., and Miller, J.: Recent changes in Arctic sea ice melt onset, freezeup, and melt season length, J. Geophys. Res., 114, C12024, https://doi.org/10.1029/2009jc005436, 2009.
Mudryk, L. R., Chereque, A. E., Derksen, C., Loujus, K., and Decharme, B.: Terrestrial Snow Cover, NOAA Arctic Report Card 2023, https://doi.org/10.25923/xqwa-h543, 2023.
Navarro, J. A., Varma, V., Riipinen, I., Seland, O., Kirkevag, A., Struthers, H., Iversen, T., Hansson, H.-C., and Ekman, A. M. L.: Amplification of Arctic warming by past air pollution reductions in Europe, Nat. Geosci., 9, 277–281, https://doi.org/10.1038/ngeo2673, 2016.
Olaffson, H. and Okland, E.: Precipitation from convective boundary layers in Arctic air masses, Tellus A, 46, 4–13, https://doi.org/10.3402/tellusa.v46i1.15422, 1994.
Park, H.-S., Lee, S., Kosaka, Y., Son, S.-W., and Kim, S.-W.: The impact of Arctic winter infrared radiation on early summer sea ice, J. Climate, 28, 6281–6296, https://doi.org/10.1175/JCLI-D-14-00773.1, 2015.
Parkinson, C. L., Cavalieri, D. J., Gloersen, P., Zwally, H. J., and Comison, J. C. C.: Arctic sea ice extent, areas and trends, 1978–1996, J. Geophys. Res., 104, 20837–20856, 1999.
Perovich, D. K. and Polashenski, C.: Albedo evolution of seasonal Arctic sea ice, Geophys. Res. Lett., 39, 8, https://doi.org/10.1029/2012GL051432, 2012.
Perovich, D. K., Light, B., Eicken, H., Jones, K. F., Runcimen, K., and Nghiem, S. V.: Increasing solar heating of the Arctic Ocean and adjacent seas, 1979–2005: Attribution and the role of ice-albedo feedback, Geophys. Res. Lett., 34, L19505, https://doi.org/10.1029/2007GL031480, 2007.
Pithan, F. and Mauritsen, T.: Arctic amplification dominated by temperature feedbacks in contemporary climate models, Nat. Geosci., 7, 181–184, https://doi.org/10.1038/ngeo2071, 2014.
Previdi, M., Smith, K. L., and Polvani, L. M.: Arctic amplification of climate change: a review of underlying mechanisms, Env. Res. Lett., 16, 093003, https://doi.org/10.1088/1748-9326/ac1c29, 2021.
Rantanen, M., Karpechko, A. Y., Lipponen, A., Nordling, K., Hyvärinen, O., Ruosteenoja, K., Vihma, T., and Laaksonen, A.: The Arctic has warmed nearly four times faster than the globe since 1979, Communications Earth & Environment, 3, 168, https://doi.org/10.1038/s43247-022-00498-3, 2022.
Renfrew, I. A., Barrell, C., Elvidge, A. D., Brooke, J. K., Duscha, C., King, J. C., Kristiansen, J., Cope, T. L., Moore, G. W. K., Pickart, R. S., Reuder, J., Sandu, I., Sergeev, D., Terpstra, A., Våge, K., and Weiss, A.: An evaluation of surface meteorology and fluxes over the Iceland and Greenland Seas in ERA5 reanalysis: The impact of sea ice distribution, Q. J. Roy. Meteor. Soc., 147, 691–712, https://doi.org/10.1002/qj.3941, 2021.
Richter-Menge, J. and Druckenmiller, M. L. (Eds.): The Arctic [In “State of the Climate in 2019”], B. Am. Meteorol. Soc., 101, S239–S285, 2020.
Rohde, R. A. and Hausfather, Z.: The Berkeley Earth Land/Ocean Temperature Record, Earth Syst. Sci. Data, 12, 3469–3479, https://doi.org/10.5194/essd-12-3469-2020, 2020.
Scott, M.: “Why use the 1981 to 2010 average for sea ice?”, National Snow and Ice Data Center, https://nsidc.org/learn/ask-scientist/why-use-1981-2010-average-sea-ice (last access: 11 September 2025), 2022.
Screen, J. and Simmonds, I.: Increasing fall–winter energy loss from the Arctic Ocean and its role in Arctic temperature amplification, Geophys. Res. Lett., 37, L16707, https://doi.org/10.1029/2010GL044136, 2010a.
Screen, J. A. and Simmonds, I.: The central role of diminishing sea ice in recent Arctic temperature amplification, Nature, 464, 1334–1337, https://doi.org/10.1038/nature09051, 2010b.
Serreze, M. C., Kahl, J. D., and Schnell, R. C.: Low level temperature inversions of the Eurasian Arctic and comparisons with Soviet drifting station data, J. Climate, 5, 615–629, https://doi.org/10.1175/1520-0442(1992)005<0615:LLTIOT>2.0.CO;2, 1992.
Serreze, M. C., Walsh, J. E., Chapin III, F. S., Osterkamp, T., Dyurgerov, M., Romonovsky, V., Oechel, W. C., Morison, J., Zhang, T., and Barry, R. G.: Observational evidence of recent change in the northern high latitude environment, Climatic Change, 46, 159–207, 2000.
Serreze, M. C., Barrett, A. P., Stroeve, J. C., Kindig, D. N., and Holland, M. M.: The emergence of surface-based Arctic amplification, The Cryosphere, 3, 11–19, https://doi.org/10.5194/tc-3-11-2009, 2009.
Serreze, M. C., Barrett, A. P., and Stroeve, J.: Recent changes in tropospheric water vapor over the Arctic as assessed from radiosondes and atmospheric reanalyses, J. Geophys. Res., 117, D10104, https://doi.org/10.1029/2011JD017421, 2012.
Serreze, M. C., Gustavson, J., Barrett, A. P., Druckenmiller, M. L., Fox, S., Voveris, J., Stroeve, J., Sheffield, B., Forbes, B. C., Rasmus, S., Laptander, R., Brook, M., Brubaker, M., Temte, J., McCrystal, M., and Bartsch, A.: Arctic rain on snow events: bridging observations to understand environmental and livelihood impacts, Environ. Res. Lett., 16, https://doi.org/10.1088/1748-9326/ac269b, 2021.
Siew, P. Y. F., Wu, Y., Ting, M., Zheng, C., Ding., O., and Seager, R.: Significant contribution of internal variability to recent Barents–Kara sea ice loss in winter, Comm. Earth Environ., 5, 411, https://doi.org/10.1038/s43247-024-01582-6, 2024.
Simmonds, I. and Li, M.: Trends and variability in polar sea ice, global atmospheric circulations, and baroclinicity, Ann. NY Acad. Sci., 1504, 167–186, 2021.
Smith, D. M., Screen, J. A., Deser, C., Cohen, J., Fyfe, J. C., García-Serrano, J., Jung, T., Kattsov, V., Matei, D., Msadek, R., Peings, Y., Sigmond, M., Ukita, J., Yoon, J.-H., and Zhang, X.: The Polar Amplification Model Intercomparison Project (PAMIP) contribution to CMIP6: investigating the causes and consequences of polar amplification, Geosci. Model Dev., 12, 1139–1164, https://doi.org/10.5194/gmd-12-1139-2019, 2019.
Stammerjohn, S., Massom, R., Rind, D., and Martinson, D.: Regions of rapid sea ice change: An inter-hemispheric seasonal comparison, Geophys. Res. Lett., 39, L06501, https://doi.org/10.1029/2012GL050874, 2012.
Steele, M., Ermold, W., and Zhang, J.: Arctic Ocean surface warming trends over the past 100 years, Geophys. Res. Lett., 35, L02614, https://doi.org/10.1029/2007GL031651, 2008.
Stroeve, J. and Notz, D.: Changing state of Arctic sea ice across all seasons, Env. Res. Lett., 13, 10300, https://doi.org/10.1088/1748-9326/aade56, 2018.
Stroeve, J. C., Markus, T., Boisvert, L., Miller, J., and Barrett, A.: Changes in Arctic melt season and implications for sea ice loss, Geophys. Res. Lett, 41, 1216–1225, https://doi.org/10.1002/2013GL058951, 2014.
Stroeve, J. C., Crawford, A. D., and Stammerjohn, S.: Using timing of ice retreat to predict timing of fall freeze-up in the Arctic, Geophys. Res. Lett., 43, 6332–6340, https://doi.org/10.1002/2016gl069314, 2016.
Stuecker, M. F., Bitz, C. M., Armour, K. C., Proistosescu, C., Kang, S. M., Xie, S.-P., Kim, D., McGregor, S., Zhang, W., Zhao, S., Cai, W., Dong, Y., and Jin, F.-F.: Polar amplification dominated by local forcing and feedbacks, Nat. Clim. Change, 8, 1076–1081, 2018.
Sumata, H., de Steur, L., Divine, D. V., Granskog, M. A., and Gerland, S.: Regime shift in Arctic Ocean sea ice thickness, Nature, 615, 443–449, https://doi.org/10.1038/s41586-022-05686-x, 2023.
Taylor, P. C., Boeke, R. C., Boisvert, L. N., Feldl, N., Henry, M., Huang, Y., and Tan, I.: Process drivers, inter-model spread, and the path forward: A review of amplified Arctic warming, Frontiers in Earth Science, 9, 758361, https://doi.org/10.3389/feart.2021.758361, 2022.
Thompson, D. W. J. and Wallace, J. M.: The Arctic Oscillation signature in the wintertime geopotential height and temperature fields, Geophys. Res. Lett. 25, 1297–1300, 1998.
Tian, T., Yang, S., Høyer, J. L., Nielsen-Englyst, P., and Singha, S.: Cooler Arctic surface temperatures simulated by climate models are closer to satellite-based data than the ERA5 reanalysis, Communications Earth & Environment, 5, 111, https://doi.org/10.1038/s43247-024-01276-z, 2024.
Timmermans, M.-L., Toole, J., and Krishfield, R.: Warming of the interior Arctic Ocean linked to sea ice losses at the basin margins, Sci. Adv., 4, eaat6773, https://doi.org/10.1126/sciadv.aat6773, 2018.
Walsh, J. E.: Intensified warming of the Arctic: Causes and impacts on middle latitudes, Glob. Planet. Change, 117, 52–63, 2014.
Wang, C., Graham, R. M., Wang, K., Gerland, S., and Granskog, M. A.: Comparison of ERA5 and ERA-Interim near-surface air temperature, snowfall and precipitation over Arctic sea ice: effects on sea ice thermodynamics and evolution, The Cryosphere, 13, 1661–1679, https://doi.org/10.5194/tc-13-1661-2019, 2019.
Wang, X. and Zhao, J.: Trends and oscillations in arctic mediterranean atmospheric static stability during recent Arctic warming, Climate and Atmospheric Science, npj Clim. Atmos. Sci., 7, 27, https://doi.org/10.1038/s41612-024-00576-7, 2024.
Wang, Y., Huang, F., and Fan, T.: Spatio-temporal variations of Arctic amplification and their linkage with the Arctic oscillation, Acta Oceanol. Sin., 36, 42–51, https://doi.org/10.1007/s13131-017-1025-z, 2017.
Wexler, H.: Cooling in the lower atmospheric and the structure of polar continental air, Mon. Weather Rev., 64, 122–136, 1936.
Woods, C. and Caballero, R.: The role of moist intrusions in winter Arctic warming and sea ice decline, J. Climate, 29, 4473–4485, https://doi.org/10.1175/JCLI-D-15-0773.1, 2016.
Wu, D. L. and Lee, J. N.: Arctic low cloud changes as observed by MISR and CALIOP: Implication for the enhanced autumnal warming and sea ice loss, J. Geophys. Res., 117, D07107, https://doi.org/10.1029/2011JD017050, 2012.
Yu, L., Zhong, S., Vihma, T., and Sun, B.: Attribution of late summer early autumn Arctic sea ice decline in recent decades, npj Clim. Atmos. Sci., 4, 3, https://doi.org/10.1038/s41612-020-00157-4, 2021a.
Yu, Y., Xiao, W., Zhang, Z., Cheng, X., Hui, F., and Zhao, J.: Evaluation of 2-m air temperature and surface temperature from ERA5 and ERA-I using buoy observations in the Arctic during 2010–2020, Remote Sensing, 13, 2813, https://doi.org/10.3390/rs13142813, 2021b.
Zapponini, M. and Goessling, H. F.: Atmospheric destabilization leads to Arctic Ocean winter surface wind intensification, Nature Communications Earth & Environment, 5, 262, https://doi.org/10.1038/s43247-024-01428-1, 2024.
Zhang, C., Cassano, J. J., Seefeldt, M. W., Wang, H., Ma, W., and Tung, W.: Quantifying the impacts of atmospheric rivers on the surface energy budget of the Arctic based on reanalysis, The Cryosphere, 19, 4671–4699, https://doi.org/10.5194/tc-19-4671-2025, 2025.
Zhou, W., Yao, Y., Luo, D., Simmonds, I., and Huang, F.: The key atmospheric drivers linking regional Arctic amplification with East Asian cold extremes, Atmos. Res., 283, 106557, https://doi.org/10.1016/j.atmosres.2022.106557, 2023.
Zhou, W., Leung, L. R., and Lu, J.: Steady threefold Arctic amplification of externally forced warming masked by natural variability, Nat. Geosci., 17, 508–515, https://doi.org/10.1038/s41561-024-01441-1, 2024.