the Creative Commons Attribution 4.0 License.
the Creative Commons Attribution 4.0 License.
 | 17 Jun 2026
Thermohydraulic experiments on water infiltration into frozen slopes: the role of macropores and initial water content
Julian Bauer
Sebastian Müller
Thomas Heinze
Homa Khanahmadi
Ivo Baselt
Infiltration of rainwater or snowmelt into frozen soil is strongly constrained by ice-blocked pore spaces, depending on the thermal and hydrological state. The resulting reduction in permeability promotes surface runoff, which can trigger erosion or debris flows. Preferential pathways such as macropores can locally bypass this barrier, yet their quantitative role has remained poorly constrained by experiments. Here, we present nine large-scale rainfall experiments in a tiltable soil box inside a controlled climate chamber, systematically varying initial water content and the presence or absence of an interconnected macropore network. The coarse-textured soil was instrumented with a dense three-dimensional grid of temperature and volumetric water content sensors, complemented by continuous outflow monitoring of drainage and surface runoff. Frost depth was governed primarily by the antecedent thermal state and only weakly by the macropore network or initial water content. In contrast, infiltration/runoff partitioning depended strongly on initial water content and secondarily on the macropore network. Under low initial water content conditions, infiltration was dominated by matrix flow, whereas at high initial water content the frozen matrix became effectively impermeable and the macropore network enabled early and enhanced drainage responses, which we interpret as preferential bypass flow through the interconnected macropore network. Progressive refreezing and particle-assisted clogging reduced macropore functionality over time, shifting flow towards surface runoff. These results reveal the transient, non-linear role of macropore networks in frozen soils and provide a benchmark for testing dual-domain and non-equilibrium models relevant to process representation in alpine hydrology and slope stability.
- Article
(9082 KB) - Full-text XML
- BibTeX
- EndNote


According to the Copernicus Climate Change Service, 2024 was the warmest year on record globally, with mean surface temperatures exceeding pre-industrial levels by more than 1.5 °C (Copernicus Climate Change Service (C3S), 2025). Especially amplified is the warming in high latitude and alpine regions, consistent with elevation-dependent warming observed in many mountain ranges (Wang et al., 2014; Kotlarski et al., 2023; Byrne et al., 2024). Frost days have already declined markedly, alongside reductions in snow cover, permafrost extent, and seasonal snowpack (Bednar-Friedl et al., 2022). These changes lead to more frequent freeze–thaw cycles and intermittent snow-free periods. Recent work highlights that climate impacts in mountain regions can occur not only gradually but also through sudden, non-linear shifts, where small additional warming can trigger pronounced responses in soil processes (Zeng et al., 2025). Total winter precipitation is projected to remain stable or increase in many regions, with a larger fraction falling as rain rather than snow (Ranasinghe et al., 2021; Beniston et al., 2018; Fuentes-Franco et al., 2023). In mountain catchments with seasonally frozen ground, this implies more frequent exposure of frozen soils to liquid precipitation or intense snowmelt during winter and spring (Ala-Aho et al., 2021). While snow modulates winter hydrology in natural systems, we focus here on rainfall onto snow-free but frozen soils to isolate subsurface thermo-hydraulic responses.
Rainfall on frozen ground can produce contrasting hydrological responses. Liquid precipitation may infiltrate and percolate downward, contributing to groundwater recharge, and may locally induce thawing or refreezing along its pathway. However, in frozen soils, matrix infiltration is strongly impeded by ice-blocked pores that drastically reduce hydraulic conductivity (Dingman, 1975; Burt and Williams, 1976; Kane and Stein, 1983; Ireson et al., 2013; Zhao et al., 2026). This limits vertical percolation and promotes water accumulation at the surface. On slopes, this can lead to surface runoff or lateral flow along the soil-air interface, accelerating event runoff and potentially reducing groundwater recharge (Dunne and Black, 1971; Covino, 2017). Each pathway may have implications for slope stability. Infiltration and associated thawing can elevate pore water pressures and reduce effective stress, increasing failure potential, whereas surface runoff can mobilise sediment and initiate erosion, potentially triggering landslides or debris flows (Iverson, 1997; Baselt and Heinze, 2021; Li et al., 2024). The dominant response reflects an interplay between soil structure (grain size distribution, porosity, packing density, macroporosity) and thermo-hydraulic states and forcings (soil temperature, freezing state, rainwater temperature, initial water content) (Baselt and Heinze, 2021). The vertical distribution of liquid water, the associated hydraulic conductivity, and the potential for ice occurrence are key controls on infiltration under seasonally frozen conditions (Demand et al., 2019; Stuurop et al., 2022).
Pore architecture is especially important under frozen conditions because ice formation differs between micro- and macropores (Mohammed et al., 2018; Larsbo et al., 2019; Baselt and Heinze, 2021; Mohammed et al., 2021b). In micropores (packing voids), ice grows from the pore centre toward the solid boundary. Within macropores (equivalent pore diameters typically >0.05 mm, formed by cracks, root channels, or fauna) (Hartge et al., 2014), freezing initiates at the walls and advances inward, lining conduits and altering both flow and heat transfer (Watanabe and Kugisaki, 2017). This asymmetry controls the temporal evolution of infiltration pathways during sub-zero events. Preferential flow through a macropore network can bypass the frozen micropore matrix and enable rapid, gravity-driven infiltration (Johnsson and Lundin, 1991; Stähli et al., 1996; Beven and Germann, 2013; Grant et al., 2019; Holten et al., 2019). A macropore network also affects the thermal regime by enhancing advective heat transport and promoting localised thawing (Watanabe and Kugisaki, 2017; Mohammed et al., 2018). Preferential pathways can, however, be interrupted when conduits within the macropore network refreeze from the walls inward, rapidly reducing hydraulic capacity. On inclined terrain, such transitions strongly affect the partitioning between infiltration and surface runoff and thus geohazard potential (Mohammed et al., 2021a; Sanchez-Rodriguez et al., 2025).
Although the significance of coupled thermo-hydraulic processes and macropore networks is recognised, several widely used hydrological and slope stability models (e.g. GEOtop, Endrizzi et al., 2014, SWAT, Arnold et al., 1998, TRIGRS, Baum et al., 2008, r.slope.stability, Mergili et al., 2014) still treat the subsurface as a single continuum under local thermal equilibrium, neglecting preferential flow. Other frameworks (HYDRUS, Šimůnek et al., 2016, WaSiM, Schulla, 2012) include macropore network or dual-domain representations. HYDRUS offers a freezing-thawing module that couples water, vapour, and heat transport (Hansson et al., 2004). GEOtop and WaSiM include physically based (GEOtop) or parameterised (WaSiM) freeze–thaw modules. Nevertheless, the combined representation of preferential flow and freeze–thaw in seasonally frozen soils remains poorly developed and rarely constrained by experiments (Mohammed et al., 2018; Larsbo et al., 2019; Heinze, 2021). Traditional Richards-based approaches further assume matrix-dominated flow and local thermal equilibrium, which may be inaccurate under strong thermal gradients or pronounced preferential flow (Hansson et al., 2004; Kurylyk et al., 2014; Grenier et al., 2018; Heinze, 2021). Recent developments, including dual permeability approaches (Larsbo et al., 2019) and multiphase local thermal non-equilibrium (LTNE) frameworks (Heinze and Blöcher, 2019), provide more realistic process representations, but their predictive skill still hinges on validation against empirical data.
At the field scale, macropore network-driven infiltration under frozen conditions has been observed (Stähli et al., 1999, 2004; Webb et al., 2018; Mohammed et al., 2019; Fang et al., 2024; Sanchez-Rodriguez et al., 2025), but boundary conditions such as volumetric water content, frost depth, and rainfall intensity are difficult to constrain, and heterogeneity complicates attribution. Consequently, deriving process-resolved insights into macropore network controls under natural conditions remains challenging. Laboratory studies have largely focused on small soil columns, which yielded valuable insights into water redistribution, freezing behaviour, and preferential flow in partially frozen soils (Stadler et al., 2000; Weigert and Schmidt, 2005; Watanabe and Kugisaki, 2017; Grant et al., 2019; Holten et al., 2019; Pittman et al., 2020). The influential study by Watanabe and Kugisaki (2017) showed that introducing artificial macropores (implemented there as single vertical conduits) can delay freezing and promote infiltration, but may refreeze rapidly from the walls inward and block flow. Those experiments, however, used highly idealised configurations: vertical columns with homogeneous fine-textured material, constant thermal gradients, continuous vertical macropores, and ponded infiltration at constant head via a Mariotte bottle. Lateral flow, surface runoff, and geomorphic feedbacks were not represented. In particular, the role of interconnected macropore networks and their dynamic switch between infiltration and blockage remains insufficiently constrained. To our knowledge, no prior experimental study has systematically investigated these coupled thermo-hydraulic processes in a three-dimensional soil body under seasonally frozen conditions while accounting for slope angle, soil structure, and event-scale precipitation characteristics.
Here, we present large-scale laboratory experiments designed to test how an artificial, reproducible, and interconnected macropore network influences thermo-hydraulic processes in seasonally frozen soils across different initial water content states. We evaluate how initial water content and the macropore network influence frost depth and freezing dynamics prior to rainfall, and how they subsequently affect the thermal response and the partitioning between infiltration, drainage, and surface runoff once rainfall begins. We further examine how ongoing refreezing during infiltration modifies macropore network functionality, including flow path continuity and the capacity to bypass frozen pore space.
By systematically controlling slope, initial water content, and thermal boundary conditions in a three-dimensional soil body, we provide new insights into cold-region infiltration dynamics under conditions representative of alpine environments.
2.1 Experimental setup and instrumentation
The large-scale experiments were conducted in the laboratory for Hydromechanics and Hydraulic Engineering at the University of the Bundeswehr Munich. To replicate rainfall on frozen alpine slopes under controlled conditions, two existing water basins in the institute’s experimental hall were converted into a fully integrated large-scale experimental facility. The infrastructure allows the use of substantial soil volumes under precisely controlled hydraulic and thermal boundaries, combining structural flexibility with realistic environmental conditions (Fig. 1). Key components of the experimental setup include:
-
A walk-in climate chamber (exterior dimensions: ). The sidewalls are constructed with a double layer of extruded polystyrene foam insulation enclosed between plywood panels and a wooden frame. The floor and ceiling are insulated with a single layer of extruded polystyrene foam. The chamber is equipped with a 2.5 kW cooling unit (Viessmann Tecto RF WMC3), enabling controlled air temperature regulation within a nominal range of −5 °C to +15 °C (Fig. 1a). During operation, the temperature control unit runs in periodic cooling cycles, resulting in fluctuations around the target set point. A representative temperature record during the freezing phase is provided in Appendix E.
-
A PVC soil box (exterior dimensions: ), which can be filled with approximately 0.79 m3 of soil (about 1500 kg). The soil box was insulated along the bottom and side walls using extruded polystyrene foam to minimise lateral and basal heat exchange with the surrounding environment. This configuration was designed to promote predominantly top-down freezing initiated at the air-soil interface under the imposed boundary conditions (see Appendix E). It can be tilted from 0° to 20° to simulate natural slope conditions (Figs. 1b and 2a). The bottom is filled with honeycomb-structured plates acting as a drainage layer, overlaid with geotextile to prevent sedimentation and blockage of the drainage layer.
-
A rainfall simulator equipped with a dual-fluid nozzle is positioned 50 cm above the soil surface (Fig. 1b). This setup produces a fine, evenly distributed spray with droplet sizes that are characteristic of laboratory rainfall simulators. The setup ensures homogeneous surface wetting and controlled rainfall flux while avoiding splash or soil sealing effects. The nozzle is moved by a motor, reversing directions automatically to ensure even water distribution over the area. Each complete cycle (returning to the starting position) lasts about 20 s. It is enclosed in an acrylic glass housing to minimise overspray. The system allows rainfall intensities ranging from 2–20 L h−1.
-
A macropore pattern plate (Fig. 1c) made of 3 cm thick PVC with 60 guided boreholes (plus 60 individual steel rods). The boreholes were drilled at various inclinations in the horizontal and vertical directions, leaving two principal angles. Practical manufacturing constraints limited the second angle. About 28 % of the boreholes were fully vertical, while the remaining boreholes were at least slightly tilted. The steel rods varied in length, with about 20 % not reaching the soil bottom (dead ends). Each borehole was assigned an individual rod, which was inserted to create the macropore pattern. The angles and rod lengths were selected such that about 15 % of the rods were in contact with each other.
After insertion, the rods were removed, leaving open cylindrical pores within the soil body, including interconnections and dead ends. The artificially created macropore network comprised both interconnected and dead-end pores, representing a simplified analogue of natural macropore systems (e.g. Jarvis, 2007; Beven and Germann, 2013).
Despite the straight geometry of the pores, this configuration enables reproducible studies of connectivity effects on infiltration into frozen soil (Watanabe and Kugisaki, 2017). The rods had a diameter of 10 mm, resulting in a total macropore volume of approximately , corresponding to a volume fraction of 0.5 %. This value lies within the lower bound of typical macropore fractions reported for soils (Hartge et al., 2014), although the pore diameter is at the coarse end of the natural range.
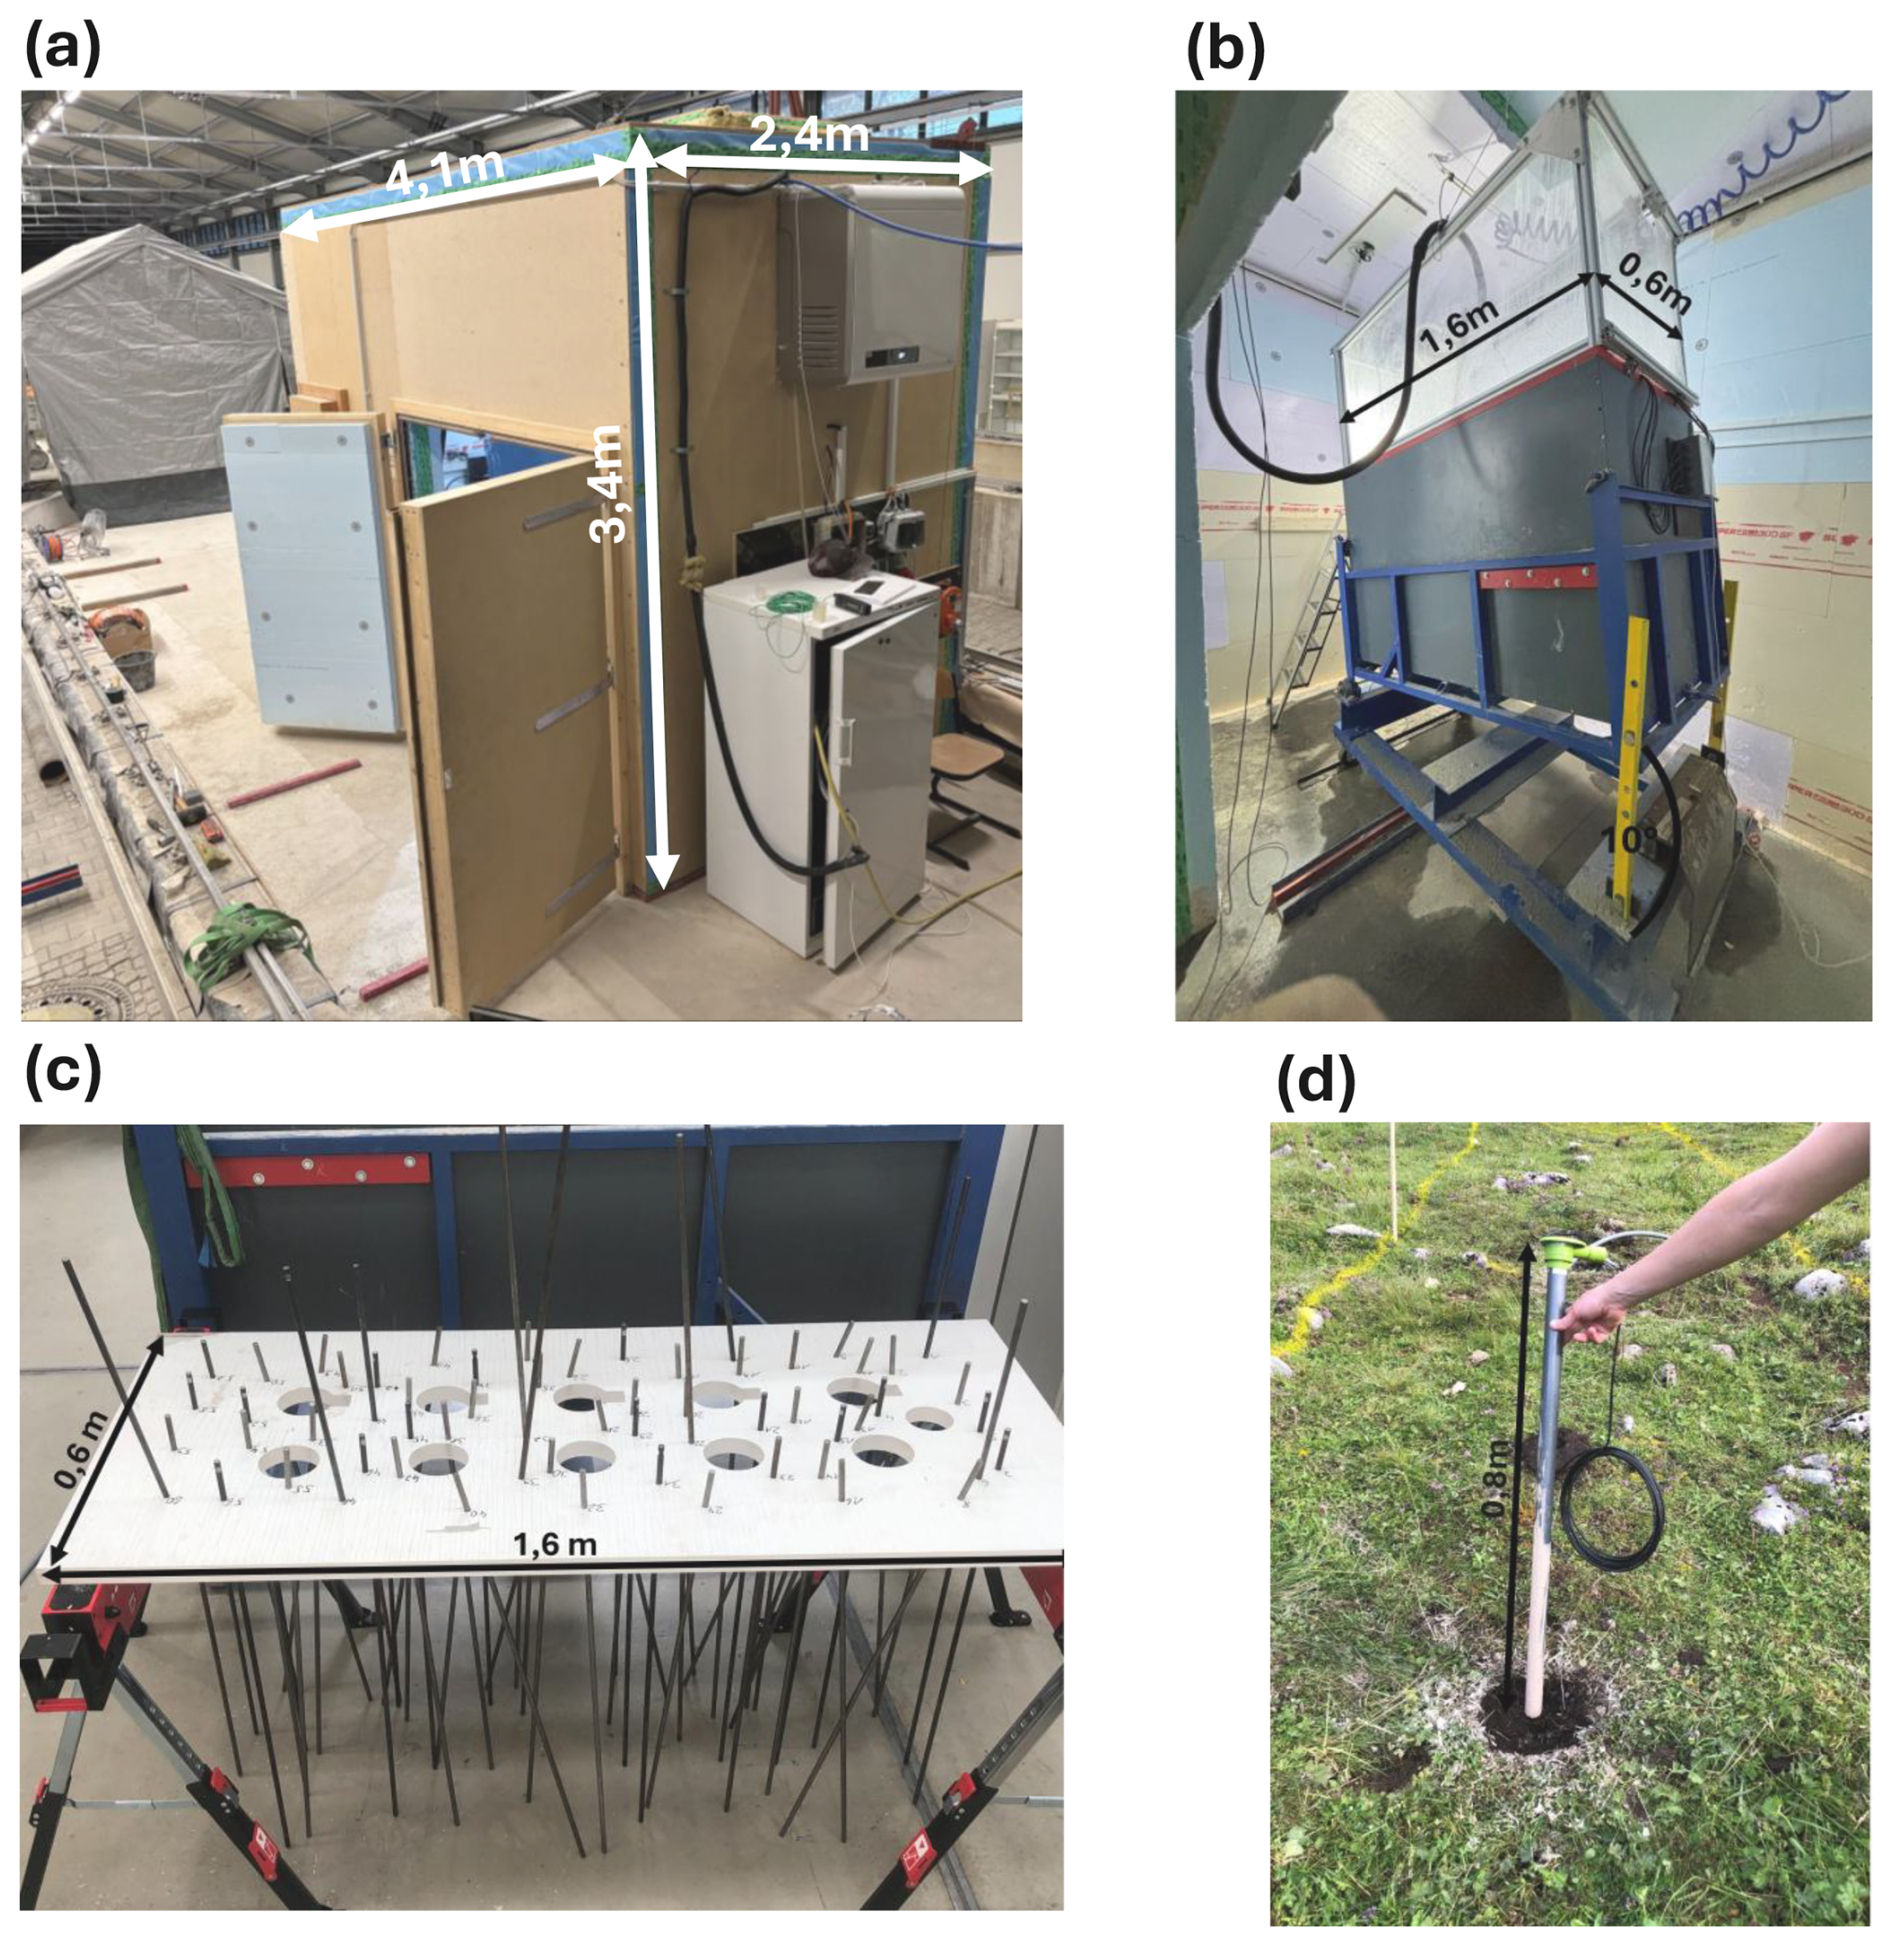
Figure 1Photographic overview of the large-scale experimental facility. (a) Climate chamber, (b) soil box tilted to 10° with rainfall simulator mounted, (c) macropore pattern plate with rods inserted to visualise the artificial pore network, (d) AquaCheck probes for soil moisture and temperature sensing (as seen in a field application).
Water treated by reverse osmosis was supplied from a cooled reservoir (1 °C, 130 L) to ensure controlled irrigation temperatures and was pumped into the climate chamber. An addition of 3 g NaCl per 130 L was used, which is negligible for freezing behaviour but sufficient to provide electrical conductivity for the flow meter measurements.
To monitor the thermo-hydraulic conditions inside the soil body, ten AquaCheck profile probes were vertically installed (Figs. 1d and 2b). Each probe is a cylindrical rod (3 cm diameter) equipped with eight measurement pairs (capacitance sensor for measuring soil moisture and a thermocouple sensor for measuring temperature) spaced at 10 cm intervals vertically. Figure 2b schematically illustrates one probe. The probes were arranged in two parallel lines across the box width, with five probes per line (S1–S5) and 25 cm spacing in the longitudinal direction (the detailed sensor layout is shown in Appendix B). To improve vertical resolution and avoid interference, one line was offset vertically by 5 cm. This configuration provided a total of 80 distinct measurement locations.
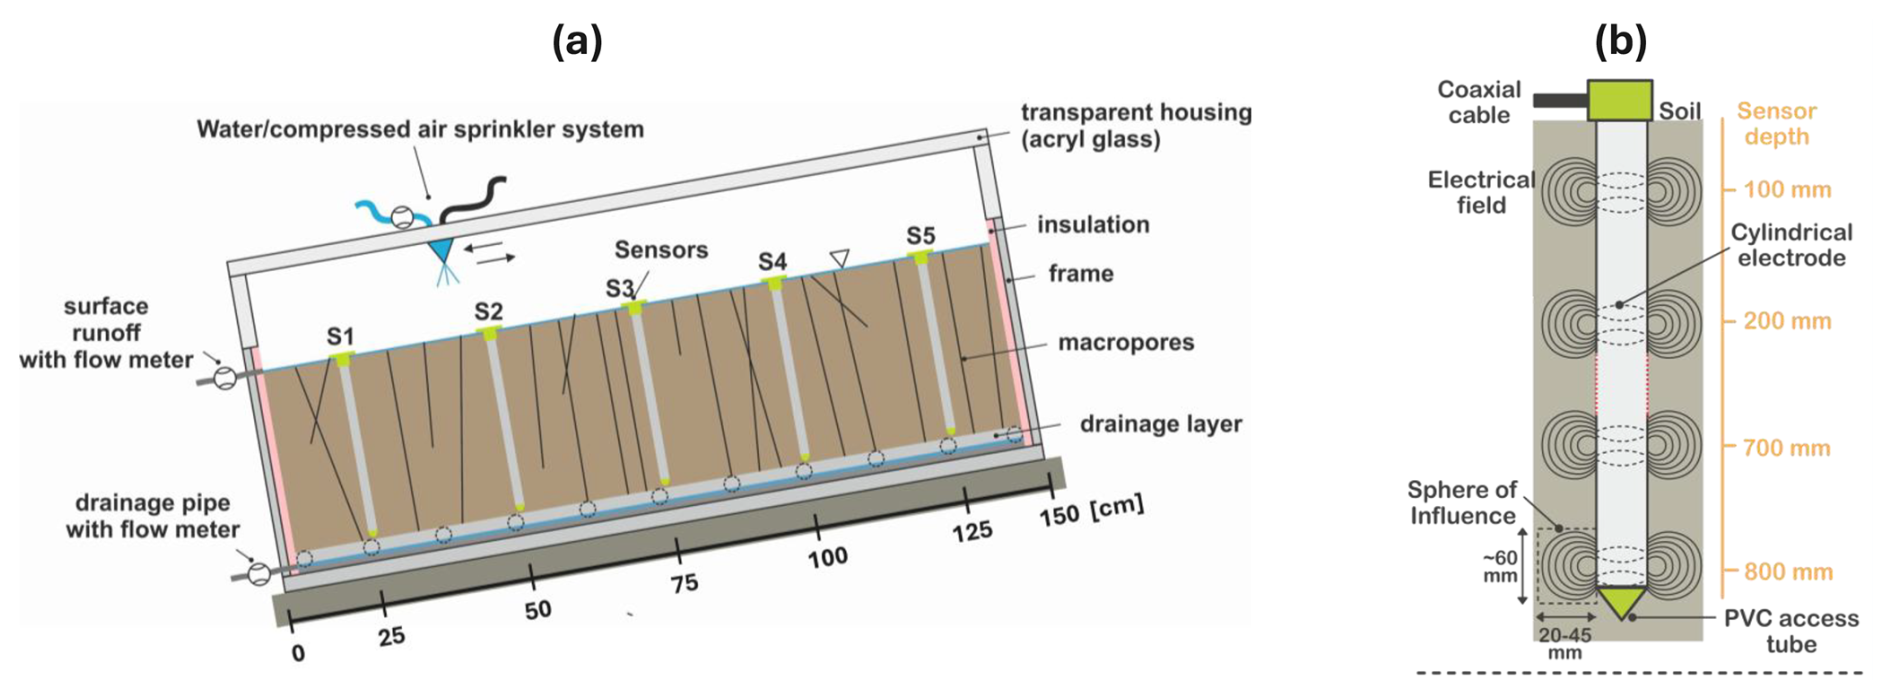
Figure 2Schematic representation of the experimental system. (a) Side view of the soil box with rainfall simulator (not to scale), drainage and surface runoff outlets (with flow meters), and vertically installed probes. Macropore configuration is only shown schematically. (b) AquaCheck probe schematic (not to scale), indicating eight capacitance-based water content sensors and integrated thermocouples. Shaded areas represent approximate measurement influence zones.
Hydrological fluxes (irrigation inflow, surface runoff, and drainage outflow) were recorded using three inductive flow meters (type SM4000, ifm electronic). The devices detect flow rates as low as 0.005 L min−1, ensuring accurate measurements even under low flow conditions.
2.2 Soil characteristics
The soil used in the experiments was an artificial mixture designed to reproduce the texture and hydraulic behaviour of coarse alpine soils. It was blended from individual grain size fractions to achieve a realistic structure while ensuring reproducibility across all experiments. The final mixture consisted of approximately 25 % gravel, 60 % sand, and 15 % silt, based on reference samples from the Reiteralpe region in the German Alps (Fig. D1). Coarse particles larger than 8 mm and fine particles smaller than 0.02 mm were deliberately excluded. This constraint prevented preferential flow along large gravel contacts within the limited soil box volume and avoided clogging of the drainage layer by fine material. The resulting soil exhibited a homogeneous packing structure and stable hydraulic properties across all runs. The dry bulk density of the mixture was approximately 1755 kg m−3, characteristic of coarse-textured, clay-poor soils with low organic content (Poesen and Lavee, 1994; Aşkın and Özdemir, 2003). The effective porosity was estimated at about 0.16, which aligns with dense, sand-rich sediments (Hölting and Coldewey, 2019). The median grain diameter (d50) was roughly 1.2 mm. These properties ensured that the matrix remained dominated by primary pores while still allowing measurable interaction with the macropore network. The saturated hydraulic conductivity (Ksat) was estimated as m s−1 using the HYDRUS 1D model and measured input parameters (Khanahmadi et al., 2026). This value is consistent with well-packed sandy materials of comparable grain size. Because the main purpose of the experiments was to isolate thermo-hydraulic processes rather than to simulate specific field sites, the simplified grain composition provided both hydraulic representativeness and experimental repeatability. The detailed grain size distribution of the artificial soil is provided in Appendix D.
2.3 Experimental scenarios and procedure
A total of nine experiments were conducted under different combinations of freezing conditions, macropore network presence, and initial water content (Table 1). Seven experiments were performed under frozen conditions, covering roughly three initial saturation levels (approximately 60 %, 75 %, and 95 %). Each saturation level included one run with and one without a macropore network. The high volumetric water content (VWC) macropore network case was repeated to confirm the reproducibility of key outcomes. Two additional reference experiments were carried out under non-frozen conditions.
Before each experiment, the soil and the required amount of water were homogeneously mixed using a pug mill mixer to achieve the target initial water content. The soil was then filled into the PVC box in five successive layers. For each layer, the volumetric water content was verified using the oven drying method. After filling, a macropore network was created in half of the experiments by inserting steel rods through the macropore pattern plate (see Fig. 1c). The rods were subsequently removed, leaving an open macropore network with interconnected conduits and dead ends. Preliminary tests were conducted in smaller soil columns and buckets to assess the mechanical stability of the artificially created macropores during freezing. In these tests, the 10 mm cylindrical conduits stayed mechanically open after freezing under similar thermal conditions.
Table 1Overview of the parameter combinations used in the experiments. All experiments were performed at a slope angle of 10°. Acronyms were defined to enable a quick and unambiguous identification of each experiment: the first letter indicates frozen (F) or non-frozen (N) conditions, the second letter denotes the presence (M) or absence (N) of a macropore network, and the final number represents the rounded initial volumetric water content [%].
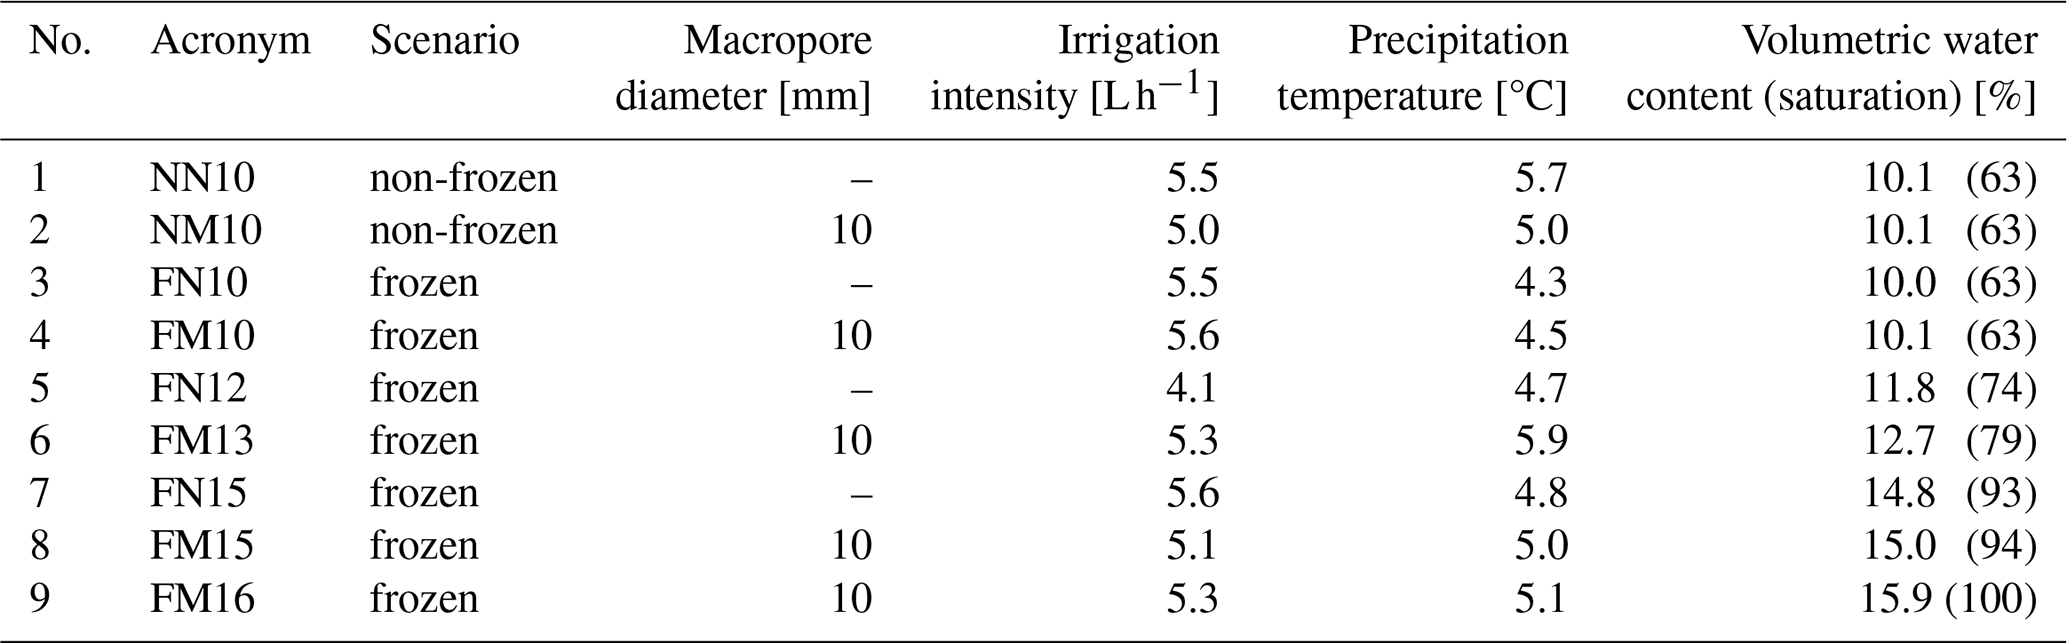
However, we cannot state with complete certainty that they behave in exactly the same way in the experiments. The prepared soil box was then placed inside the climate chamber and subjected to freezing at −4.7 °C for 105–120 h. After the freezing phase, the box was tilted to 10°, and rainfall was applied using the dual-fluid nozzle. During irrigation, the air temperature in the climate chamber was increased to +1 °C to prevent equipment freezing and to simulate mild winter rainfall. Irrigation rates averaged approximately 5 L h−1 and were maintained for up to 20 h (see Table 1). The irrigation water temperature differed slightly from that of the reservoir because the water passed through the inductive flow meter, which caused minor heating, followed by slight cooling when mixed with decompressing air in the nozzle. To account for these variations, the water temperature was monitored manually. As shown in Table 1, the average water temperature varied between experiments (ΔT≈1.6 °C) due to these combined effects and measurement uncertainty. Control measurements were taken every few hours by transferring small samples into a secondary container and measuring them with a handheld thermometer.
VWC and temperature within the soil were recorded by the AquaCheck probes at one minute intervals starting from the onset of freezing. Flow meters continuously logged irrigation inflow, drainage, and surface runoff at 10 Hz. The data were subsequently averaged to one minute intervals to synchronise with the soil sensor measurements. Although the rainfall simulator produced consistent droplet characteristics and reproducible intensities, minor variations in total inflow rate (4.1–5.6 L h−1, see Table 1) occurred. These differences can affect the precise timing of drainage onset and cumulative discharge. Consequently, flow responses are interpreted relative to inflow volumes and initial soil conditions rather than in absolute terms. This approach ensures that any observed differences attributed to the macropore network or initial water content are not confounded by minor inflow variability.
2.4 Sensor calibration and measurement
AquaCheck probes were selected as the primary sensors for this study because of their robustness and reliability. Although originally developed for field applications in agriculture and hydrogeology, they provided the robustness and durability required for large-scale laboratory experiments and thus offered a suitable basis for precise measurements. However, their use under controlled laboratory conditions necessitated careful calibration of both the thermocouples and, in particular, the capacitance sensors. The manufacturer does not recommend relying solely on the standard calibration curves provided for different soil types when high accuracy is required. Instead, the sensors, especially those measuring (liquid) volumetric water content (VWC) were calibrated to the specific soil structure and grain size distribution used in this study. Each AquaCheck probe integrates a thermocouple for temperature measurement and a capacitance sensor for VWC at each of eight measurement points (see Fig. 2b). The thermocouples exhibited small systematic offsets, which were corrected by comparison with high-precision PT1000 sensors (accuracy 0.01 °C).
Unlike many capacitance-based sensors, AquaCheck probes do not output relative permittivity directly. Instead, they provide a factory-calibrated scaled frequency unit (SFU) ranging from 0 in air to 100 in water. While this metric is sufficient for operational field use, it is inadequate for quantitative analysis of freeze and thaw dynamics. To derive physically meaningful dielectric properties, the SFU values were converted to effective relative permittivity (εc) using a soil-specific calibration. Capacitance sensing relies on the strong dielectric contrast between liquid water (εw≈80), air (εa≈1), and soil minerals (εs≈3.9). Conventional calibration curves are valid for unfrozen soil conditions (e.g. Topp et al., 1980), but they fail once ice forms, since the relative permittivity of ice (εi≈3.27) is much lower than that of liquid water (Seyfried and Murdock, 1996). To properly account for both aggregate states of water, we followed previous frozen soil studies (Roth and Boike, 2001; Bittelli et al., 2003; Watanabe et al., 2009; Demand et al., 2019) and applied a three-phase dielectric mixing model for unfrozen conditions (Roth et al., 1990) and a four-phase model for frozen conditions (Roth and Boike, 2001; Watanabe et al., 2009). Under unfrozen conditions (T>0 °C), the three-phase model considers soil, air, and liquid water. According to Roth et al. (1990), the volumetric water content θ is given by:
where , n is porosity, and m is a pore-geometry factor (m=0.5, representing isotropic, random pore structures typical of coarse-textured mineral soils). εc denotes the effective relative permittivity obtained from calibration, while εs, εa, and εw represent the relative permittivities of soil minerals, air, and liquid water, respectively. The temperature dependence of εw is expressed by the empirical polynomial of Roth et al. (1990):
which accounts for the variation of liquid water permittivity with temperature. Under frozen conditions (T<0 °C), the influence of ice within the pore space is considered using the four-phase model (Roth and Boike, 2001; Watanabe et al., 2009):
where the unfrozen water content θu is separated from the total water content θtot.
The combination of the three-phase and four-phase mixing models provides a consistent framework for analysing the measurement data. For every measurement time step, the appropriate model was applied depending on the recorded temperature: the three-phase model for T>0 °C and the four-phase model for T<0 °C. To avoid spurious switching at the freezing point, a hysteresis of ±0.2 °C was applied, following freeze-hold/thaw-update strategies commonly used in frozen soil hydrology (Watanabe and Kugisaki, 2017; Demand et al., 2019). This approach enabled consistent evaluation of thermo-hydraulic processes in the soil.
At each of the 80 measurement points, the total volumetric water content (θtot) was determined as θ (from the three-phase model) at the moment when local temperature exceeded 1 °C, after which this value was fixed for all subsequent times at lower temperatures. The threshold of 1 °C ensured that the reference was derived under unambiguously unfrozen conditions. While this procedure is valid when θtot is known (during the freezing phase), absolute changes in θtot cannot be resolved from dielectric measurements once irrigation begins. Absolute water balances were derived independently of the inductive flow meter data (inflow, drainage, and surface runoff), while relative changes in unfrozen water content (θu) were obtained from the dielectric measurements. The magnetic-inductive flow meters were operated according to the manufacturer’s specifications without additional calibration. The stated measurement accuracy is ±2 % of reading +0.5 % of full scale, and the sensors exhibited stable and repeatable readings throughout all experiments without noticeable drift. For the AquaCheck probes, temperature measurements have an uncertainty of ±0.02 °C. For VWC, the combined uncertainty is estimated at ±1 %, accounting for both sensor repeatability and the soil-specific calibration (details are provided in Appendix C). Accordingly, the temporal analysis of the VWC data, especially after the onset of irrigation, focuses on relative rather than absolute changes.
This section presents the results of the freezing and infiltration experiments. First, we analyse the freezing process as a function of time between the onset of cooling and the initiation of precipitation, with emphasis on the effects of initial water content and the presence of the macropore network. Second, we describe the infiltration behaviour and surface runoff generation during precipitation under partially frozen conditions. Finally, we examine the spatio-temporal evolution of soil temperature and (liquid) volumetric water content (VWC) during irrigation to link observed flow responses to internal thermo-hydraulic dynamics.
3.1 Freezing process
During the initial phase, the soil was frozen while the box remained in a horizontal position and was exposed to sub-zero air temperatures (−4.7 °C) inside the climate chamber. Since there is a strong dominance of vertical temperature gradients compared to lateral temperature gradients (see Appendix F), probe readings were averaged to derive representative one-dimensional vertical profiles of temperature and VWC (Fig. 3). These profiles characterise the freezing behaviour of the soil and provide the basis for assessing the influence of initial water content and the macropore network. One experiment (FN10) represents an exception, as an adjustment to the climate chamber control was required before this run. The modified regulation increased cooling efficiency, resulting in faster and deeper freezing of the soil. Consequently, FN10 is excluded from detailed interpretation regarding the temporal evolution of the freezing process.
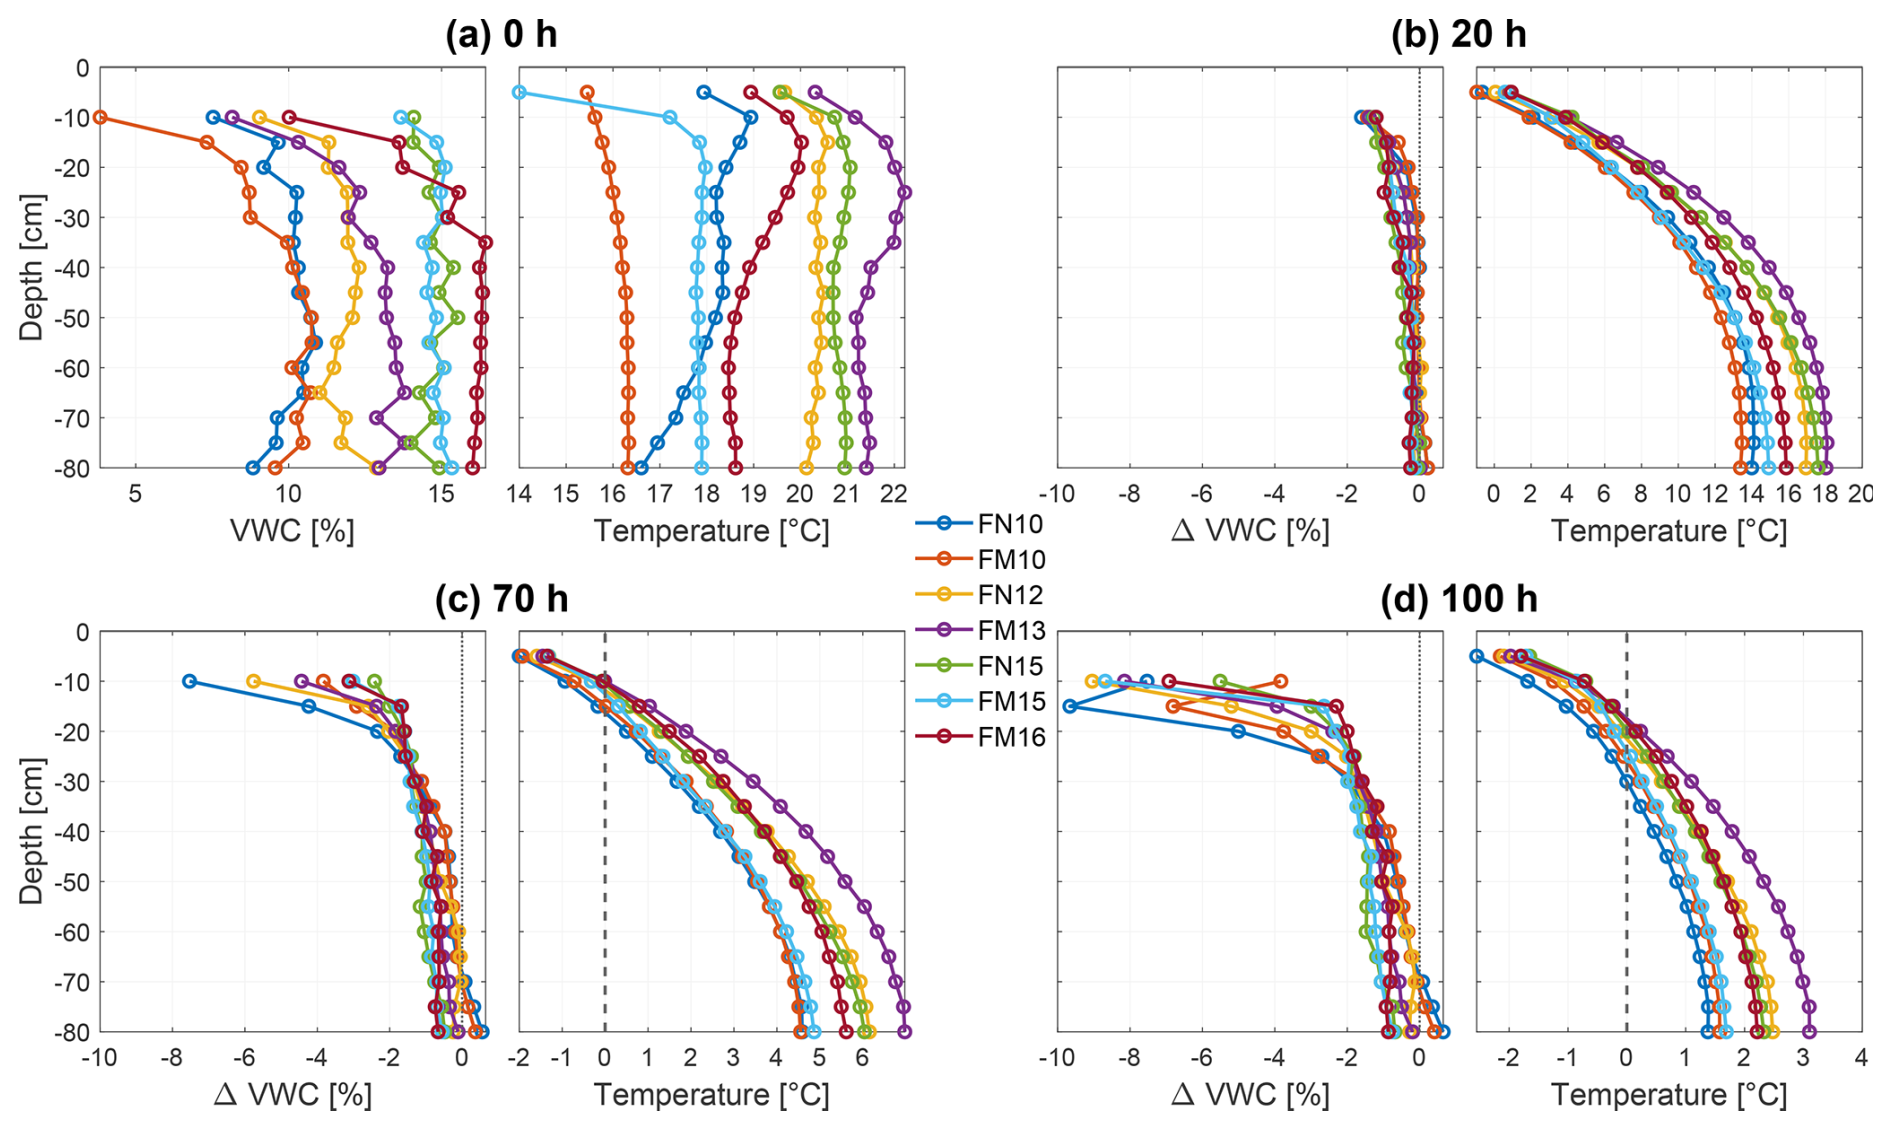
Figure 3Vertical profiles of volumetric water content (VWC, left) and temperature (right) at four stages during the freezing process: (a) immediately after soil filling (initial state), (b) after 20 h of cooling, (c) after 70 h, and (d) after 100 h. In (a), VWC represents absolute values, while in (b)–(d), VWC is shown as the change relative to the initial state. Dashed vertical lines in the temperature plots mark the 0 °C isotherm. The uppermost sensor is partly influenced by ambient air conditions and is excluded from the VWC plots.
At the beginning of the experiment (Fig. 3a), soil temperatures ranged between 14 and 22 °C, reflecting seasonal variability in laboratory conditions between mid-May and late August. VWC profiles agreed well with the target VWC levels defined during filling (e.g. 10 % for FM10).
Vertical heterogeneities in VWC resulted from the layer-wise filling process, which was necessary due to the large soil volume and limited capacity of the mixing device. These variations represent slight differences between mixing batches and do not indicate systematic bias. A comparison of sensor-based VWC with reference measurements from the oven drying method (Appendix C) confirmed the accuracy of the VWC data.
After 20 h of freezing at an air temperature of −4.7 °C, pronounced thermal gradients developed (Fig. 3b). The surface layer (−5 cm) exhibited the highest cooling rates, with a maximum of (FM13) and a median of across all experiments. In contrast, deeper layers (40–60 cm) cooled more slowly (approximately ), reflecting the insulating properties of the soil and box structure, which led to a top-down dominated progression of the cooling front (see Appendix F). Concurrent VWC decreases in the upper 10–20 cm (>0.5 %) occurred during the early cooling phase (20 h), before significant ice formation is expected. These variations are therefore either interpreted as small-scale redistribution processes that may include gravitational drainage and minor structural settling of the soil matrix, or sensor-related temperature effects. However, the exact mechanism cannot be resolved with the available measurements. In high initial VWC scenarios (FN15, FM15, FM16), water displacement occurred throughout the entire profile, consistent with gravitational drainage prior to freezing (estimated at 2–3 L). In drier cases (e.g. FN10, FM10), the VWC reduction near the surface was accompanied by slight increases at depth (≈0.3 %) which may reflect minor redistribution or measurement variability.
By 70 h (Fig. 3c), most upper layers (10–20 cm) had reached the freezing point (0 °C). Initial temperature differences between the experimental runs of up to 6 °C (10 cm) decreased to below 1 °C due to latent heat buffering. Correspondingly, VWC reductions at 15 cm depth ranged from −1.1 % (FM16) to −4.3 % (FN10). Drier soils showed larger decreases, reflecting faster freezing consistent with a lower demand of latent heat.
After 100 h (Fig. 3d), all profiles exhibited sub-zero temperatures in the upper soil column. The freezing front extended to depths of 15–30 cm and was primarily governed by the initial soil temperature. The uppermost 10 cm froze between 52 and 82 h, depending on the initial thermal state. Temperatures at 15 cm across all experiments converged to a narrow range (−1.2 – −0.4 °C), again illustrating the stabilising effect of latent heat. In all experiments, the final (liquid) VWC within the 20–30 cm range decreased, averaging −4.2 % ± 0.5 %. Between 30 and 50 cm, mean losses were about 0.5 %–2 %, and at depths below 50 cm, the differences from the 70 h snapshot were negligible. These patterns are consistent with progressive freezing from the surface downward, reducing the measurable liquid water fraction. In wetter soils, pre-freezing drainage contributed to additional VWC loss at depth. Minor late-stage reductions (>70 h) in the deeper unfrozen layers were also observed. These changes may indicate redistribution processes associated with the advancing freezing front, although the available measurements do not allow the underlying mechanism to be resolved.
Overall, wetter soils cooled slightly more effectively, which might be explained by higher thermal conductivity but exhibited slower advancement of the freezing front, which would be consistent with increased latent heat demand. This effect was masked by initial temperature differences of up to 4 °C. With this setup and under the applied conditions, the presence of the macropore network (macropore volume fraction of 0.5 %) had no visible effect on the thermal or hydraulic behaviour during the freezing phase.
3.2 Water balance during irrigation
The second part of the results focuses on the infiltration phase. After completion of the freezing process, the soil box was inclined at an angle of 10°, and the rainfall simulator was mounted above the surface. Irrigation commenced, and flow meter data were recorded continuously. This section presents the temporal evolution of irrigation inflow, surface runoff, and subsurface drainage outflow throughout each experiment, covering the full duration from the onset of irrigation to the termination of the water supply. Figure 4 summarises the cumulative flow measurements for all experimental scenarios. Each panel displays three cumulative flow curves – blue for inflow from irrigation, orange for surface runoff, and yellow for drainage – plotted against time. Comparative experiments with similar initial water content, conducted with and without a macropore network, are displayed together for direct comparison. The upper left panel shows the unfrozen reference experiments, the upper right panel the frozen low VWC experiments, the lower left the intermediate VWC experiments, and the lower right the high VWC experiments.
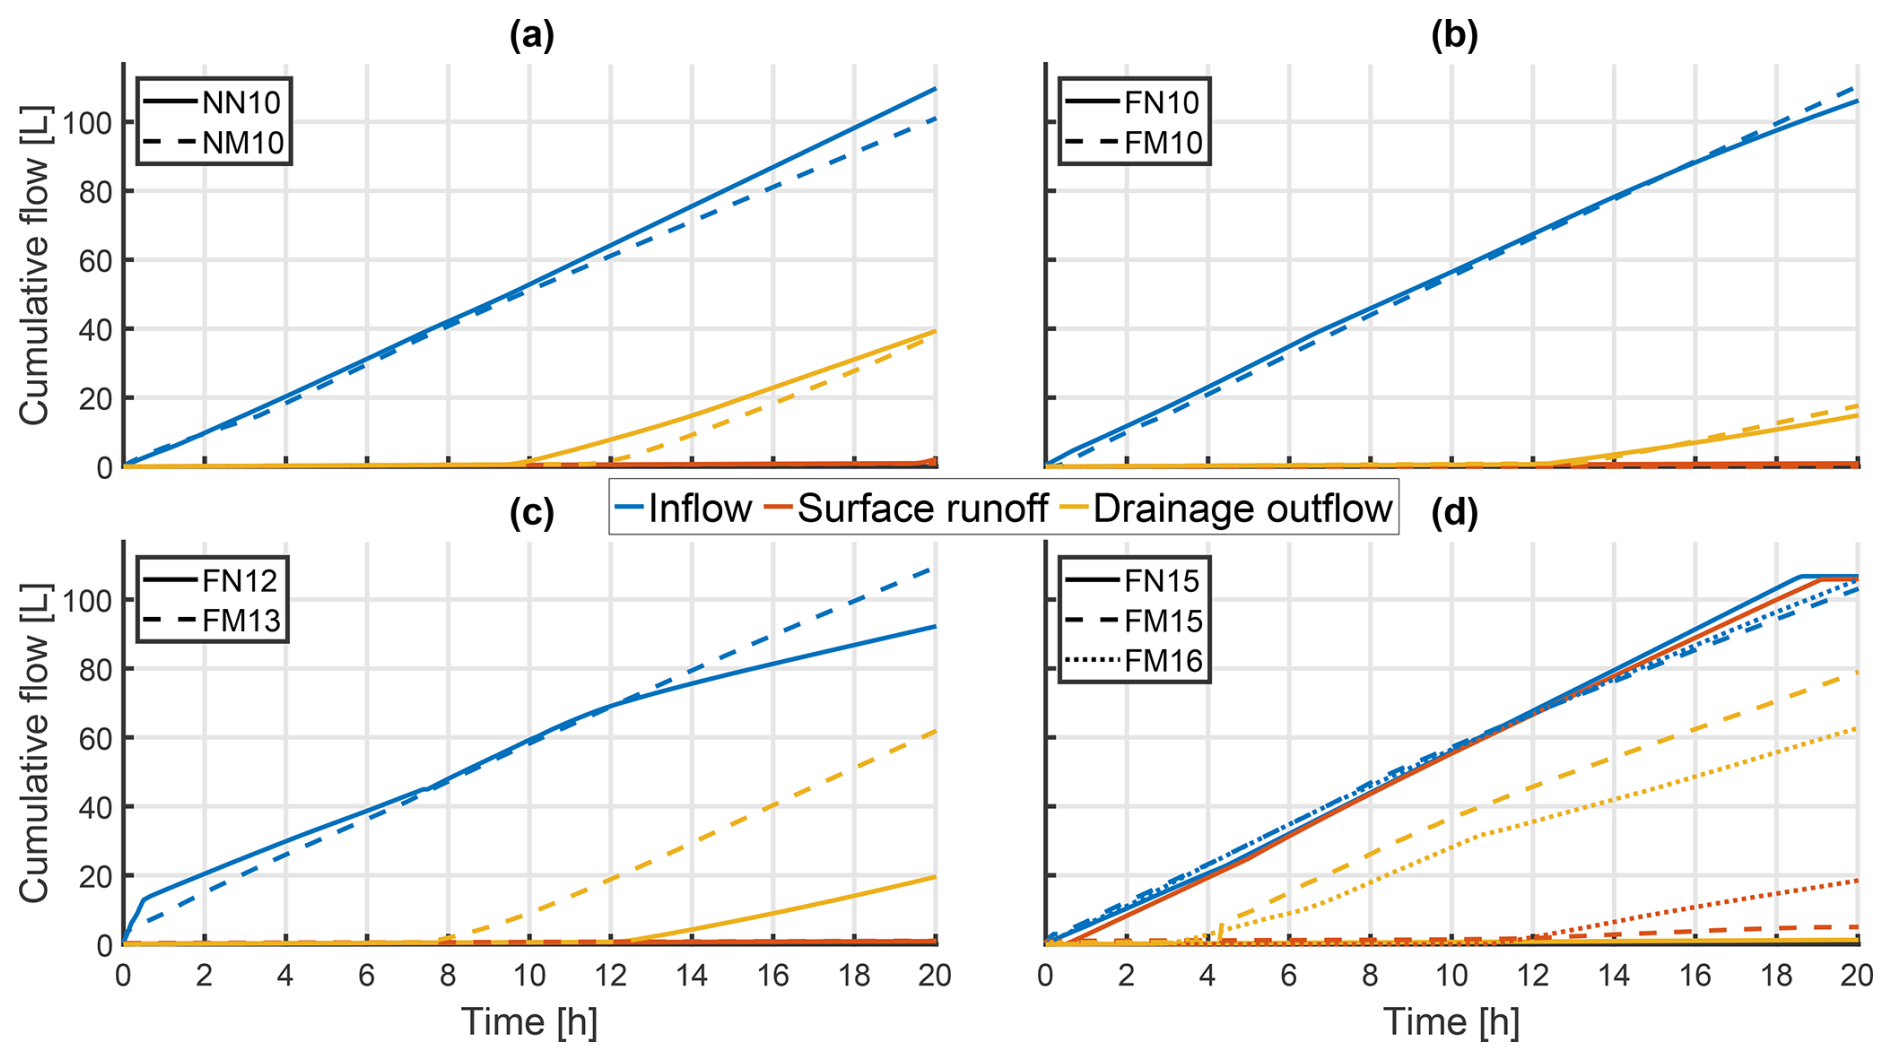
Figure 4Cumulative discharge dynamics from large-scale infiltration experiments into partially frozen soils with and without a macropore network. Each panel compares experiments under similar boundary conditions, showing cumulative inflow (blue), surface runoff (orange), and drainage flow (yellow) over time. Solid lines denote experiments without a macropore network; dashed and dotted lines represent experiments with a macropore network. Panels illustrate (a) unfrozen, low initial water content; (b) frozen, low initial water content; (c) frozen, intermediate initial water content; and (d) frozen, high initial water content scenarios (three experiments).
In the unfrozen (NN10, NM10) and frozen (FN10, FM10) low VWC scenarios, total inflow volumes ranged between 100 and 112 L over 20 h. Drainage began after 9.5–13.5 h and reached 20 L (FN10, FM10) to 40 L (NN10, NM10) by the end of the experiments, whereas surface runoff remained negligible (<5 L). These results indicate that under initially low VWC conditions, nearly all applied water infiltrated until saturation, after which excess input was discharged as drainage. Under these conditions, the macropore network did not act as a dominant preferential pathway, as the soil matrix absorbed most of the precipitation, allowing only minimal bypass flow. Within the unfrozen experiments, small differences between soils with and without macropores were observed. Drainage onset in the macropore network case (NM10) was delayed by about 2 h, likely reflecting a combination of slightly lower inflow and soil structural heterogeneities, such as minor settling, structural rearrangement, or small local cracks.
In contrast, the hydrological differences between the two low VWC frozen scenarios (FN10, FM10) were very small (drainage onset differed by less than 0.5 h). Although the freezing front was more strongly developed in FN10 (see Figs. 3d and 5), both experiments exhibited slower infiltration dynamics compared to the unfrozen reference. Drainage began after approximately 13.6 h, consistent with the reduced permeability under freezing conditions. Overall, the low-VWC experiments indicate that both frozen and unfrozen soils maintained high infiltration capacities, as sufficient air-filled pore space remained and matrix suction was still effective. Under these conditions, the frozen matrix remained sufficiently permeable for continuous infiltration, and no clear signs of progressive refreezing affecting flow partitioning were observed. Thus, the macropore network exerted no systematic influence on the infiltration/runoff partitioning, and observed variability primarily reflected freezing conditions and soil heterogeneity.
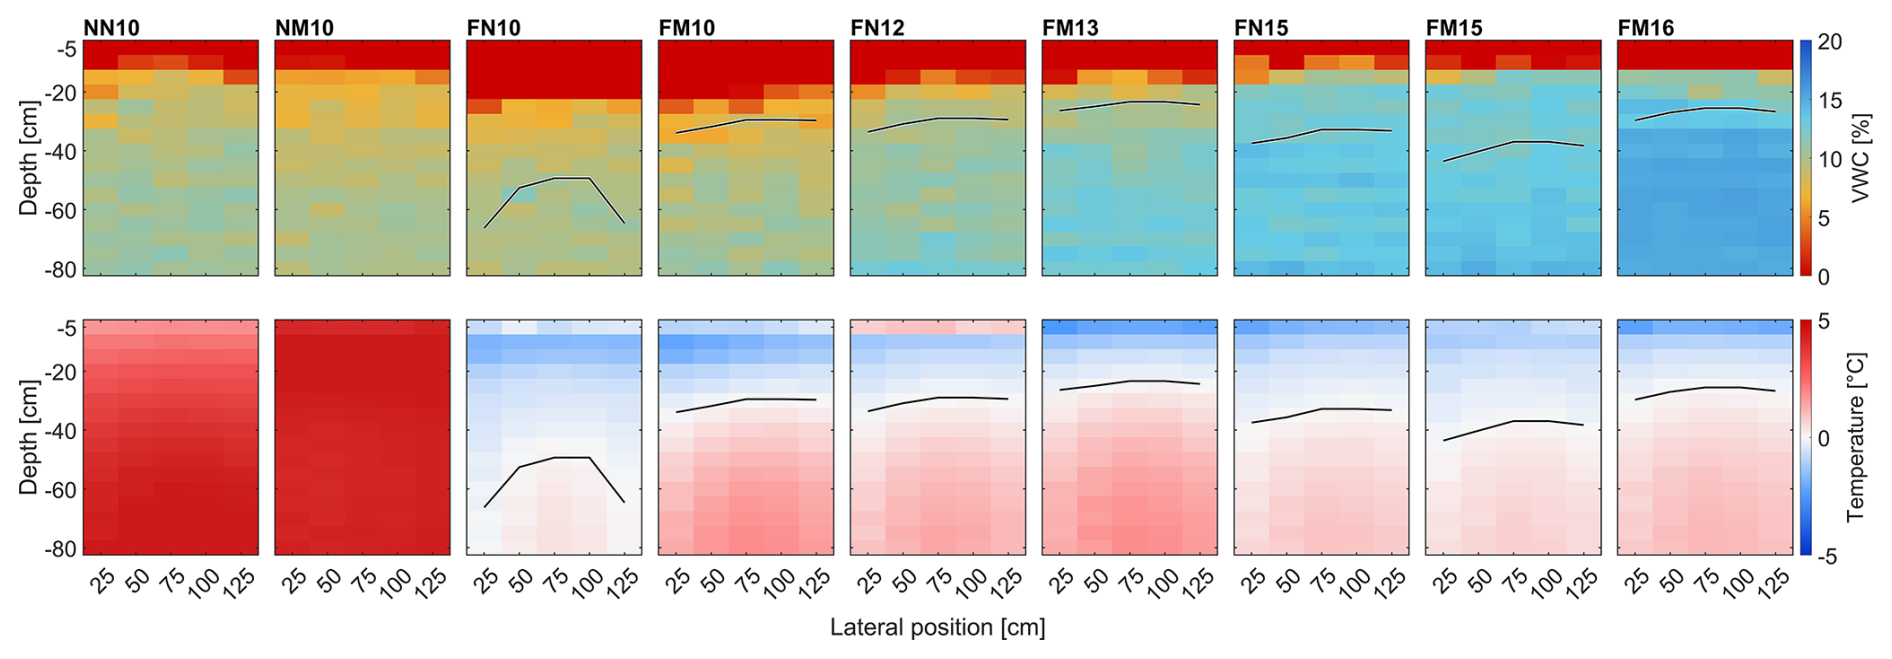
Figure 5Profiles of volumetric water content (VWC) and temperature for all nine experiments directly after the freezing period and before the start of precipitation (t=0 h). The first row shows the total VWC, while the second row depicts the corresponding temperature distribution. The first two profiles represent the unfrozen reference experiments. The black line denotes the 0 °C isotherm. The slope extends from 0 cm at the lower end to 150 cm at the upper end.
At intermediate initial VWC (FN12, FM13), differences between the macropore network and non-macropore setups became more distinct. Inflow volumes were slightly higher in FM13 (110 L) than in FN12 (90 L), but the first 12 h of irrigation showed nearly identical inflow behaviour (about 70 L), enabling a direct comparison of drainage response. The experiment with a macropore network (FM13) exhibited an earlier drainage onset (8 h) compared to the non-macropore case (FN12, 12 h), and the total drainage volume was substantially larger. Although total inflow differed, the similar early inflow phase supports interpretation of the earlier drainage in FM13 as a sign of preferential bypass flow rather than being solely a result of inflow variations. Surface runoff was absent in both experiments. These findings suggest that under intermediate initial water content, the macropore network facilitated preferential pathways that allowed early bypass flow through the partially frozen profile, leading to an earlier drainage onset.
The strongest contrasts were observed under high initial VWC conditions (FN15, FM15, FM16). Visual inspection at the onset of irrigation revealed that the soil surface was fully frozen and exhibited a mechanically rigid structure. This condition resembles what is often described as a nearly impermeable, concrete-like frost layer, typically formed when a saturated upper soil layer refreezes after mid-winter snowmelt (Ala-Aho et al., 2021). In FN15, without a macropore network, almost the entire inflow (≈104 L) was diverted into surface runoff, with negligible drainage (<2 L), indicating that the frozen soil matrix prevented infiltration. In sharp contrast, the macropore network experiments (FM15, FM16) showed substantial early drainage after only about 4 h, reaching 61–80 L in total. After approximately 10.5–11 h, however, drainage rates declined while surface runoff increased (up to 20 L in FM16, see also Appendix H), likely due to progressive refreezing of preferential flow paths within the soil and partial blockage of some macropores (discussed in Sect. 4.3). This temporal pattern occurred consistently in both macropore network experiments (FM15, FM16), though the magnitude of the effect varied.
Taken together, these results indicate that the influence of the macropore network on infiltration and runoff dynamics increased with higher initial VWC. Under low initial VWC conditions, the network exerted only a minor influence on precipitation partitioning, consistent with matrix-dominated infiltration. In contrast, at higher initial VWC, the frozen matrix exhibited strongly reduced permeability, and the macropore experiments showed earlier and more pronounced drainage responses. This pattern is consistent with preferential bypass flow through interconnected macropores that remained hydraulically active at the onset of irrigation. As infiltration continued, drainage rates in the high initial VWC experiments gradually decreased while surface runoff increased. Together with the post-experiment observations of partial macropore refreezing, this temporal shift is interpreted as progressive reduction of macropore hydraulic connectivity during irrigation. Overall, the results support the interpretation that macropore network connectivity and pre-freezing saturation state strongly influence infiltration behaviour under frozen conditions.
3.3 Temperature and water content evolution within the inclined soil body
This subsection presents the spatially distributed sensor data during infiltration into the 10° inclined soil body. The results should be interpreted in conjunction with the cumulative flow shown in Fig. 4. The initial conditions (Fig. 5) and subsequent evolution of VWC and temperature (Figs. 6–8) are displayed as two-dimensional cross-sections (side views of the inclined face of the soil box) with soil depth on the vertical axis and lateral sensor position on the horizontal axis. The upper panels show VWC, while the lower panels show temperature.
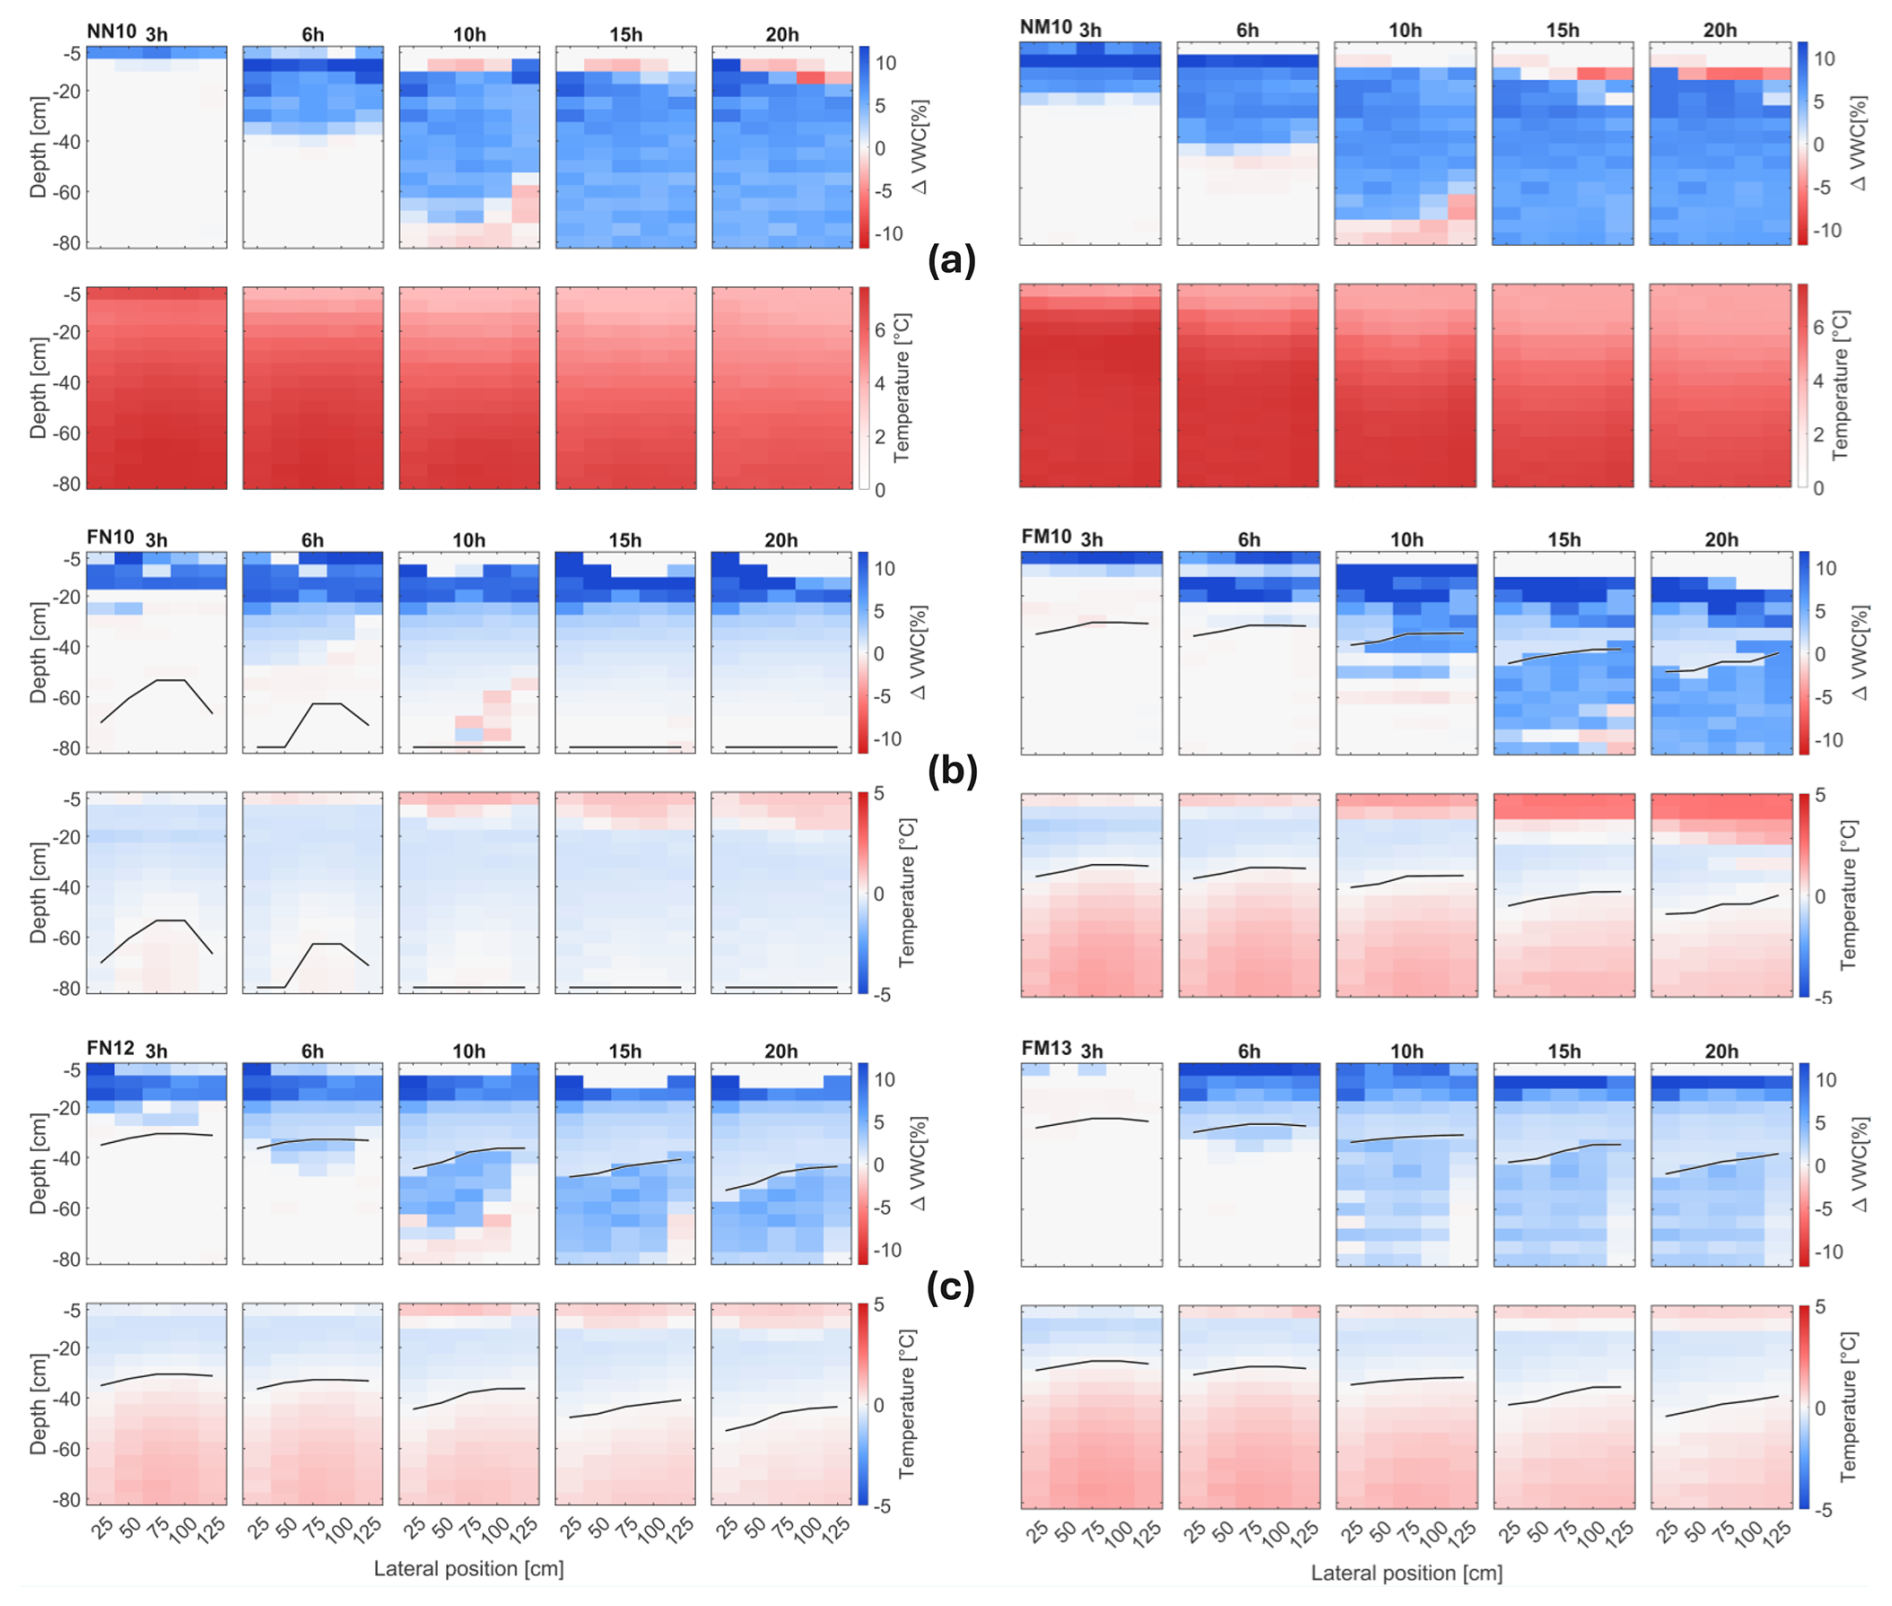
Figure 6Temporal evolution of the change of soil volumetric water content (ΔVWC) and temperature for the low and intermediate water content experiments after the onset of irrigation. The time labels above the plots indicate elapsed time since irrigation began. The first row shows VWC changes relative to t=0 h (in percent), while the second row shows temperature evolution in the frozen soil during irrigation. The black line represents the 0 °C isotherm, marking the position of the freezing front.
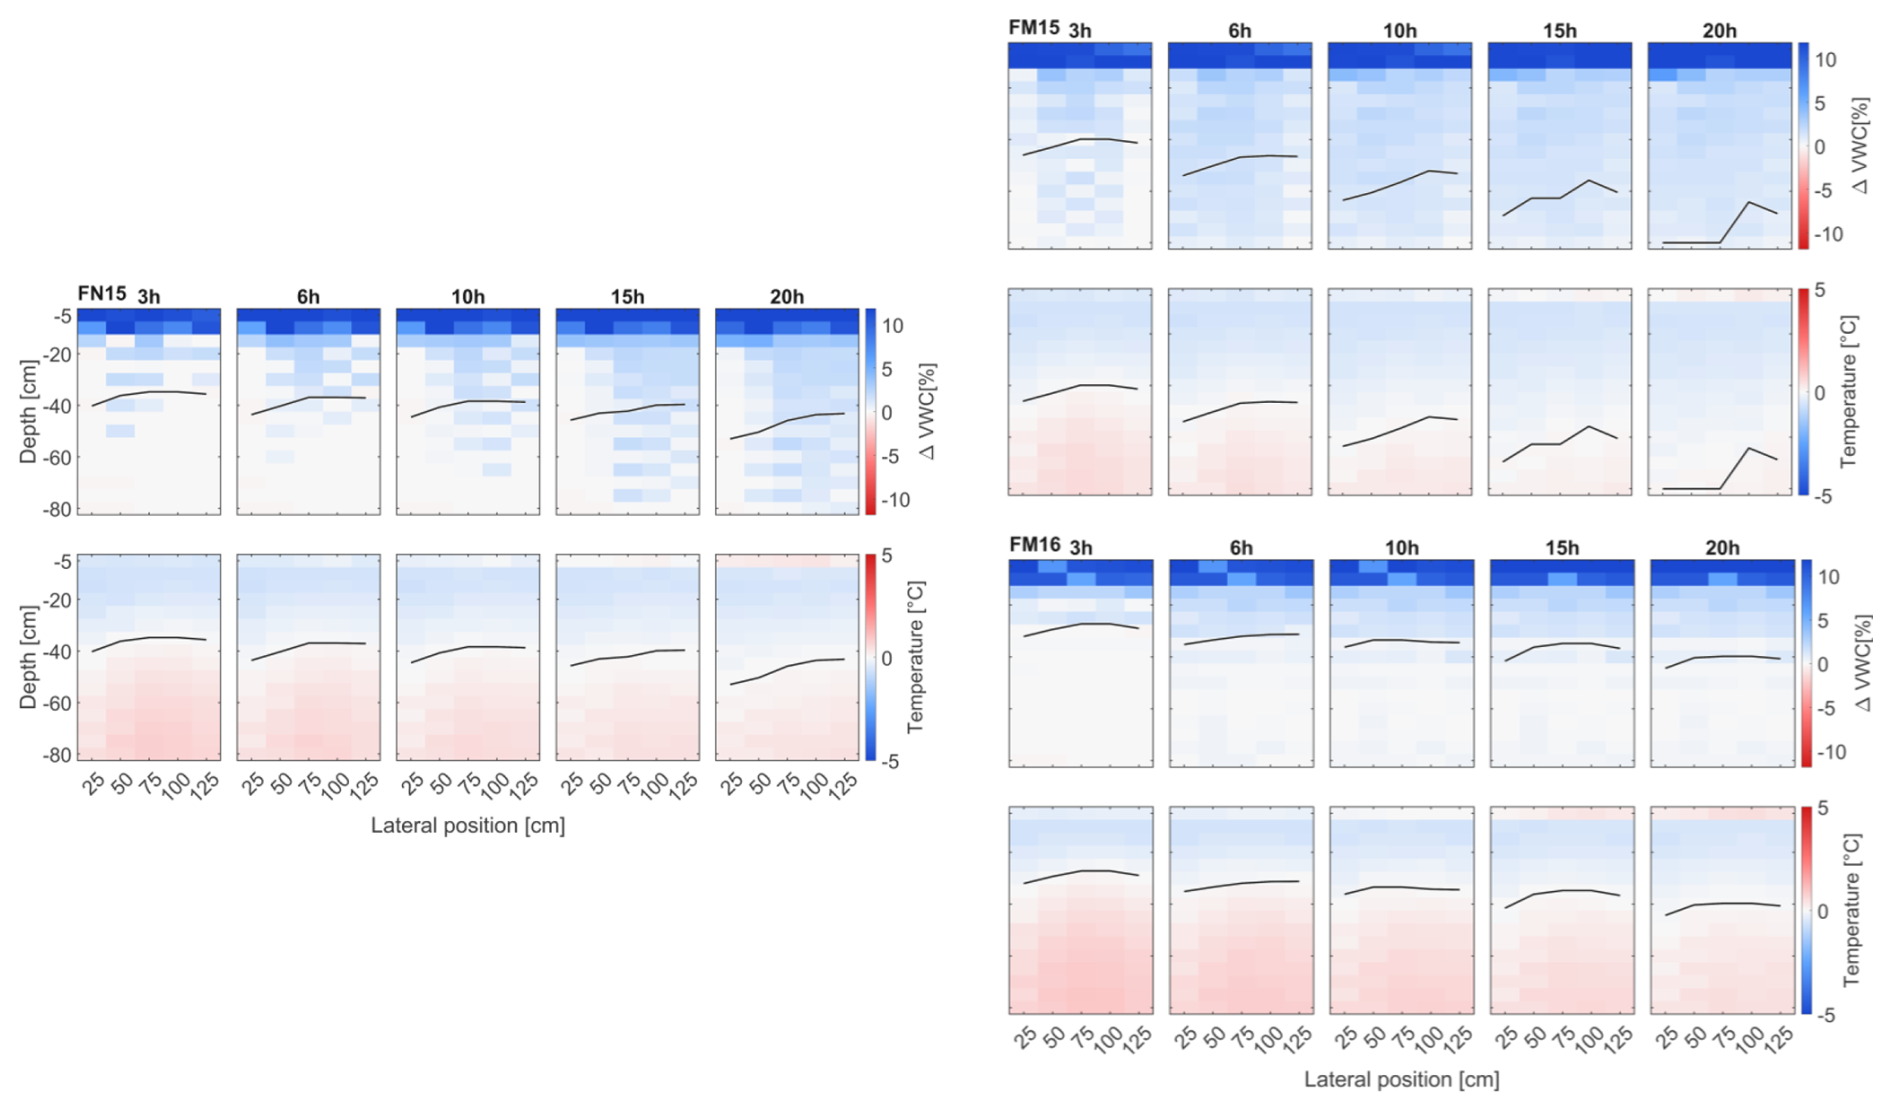
Figure 7Temporal evolution of the change of soil volumetric water content (ΔVWC) and temperature for the high water content experiments after the onset of irrigation. Time labels above the plots indicate the elapsed time since irrigation began. The first row shows VWC changes relative to t=0 h (in percent), while the second row shows the temperature evolution in the frozen soil during irrigation. The black line marks the 0 °C isotherm, indicating the freezing front position.
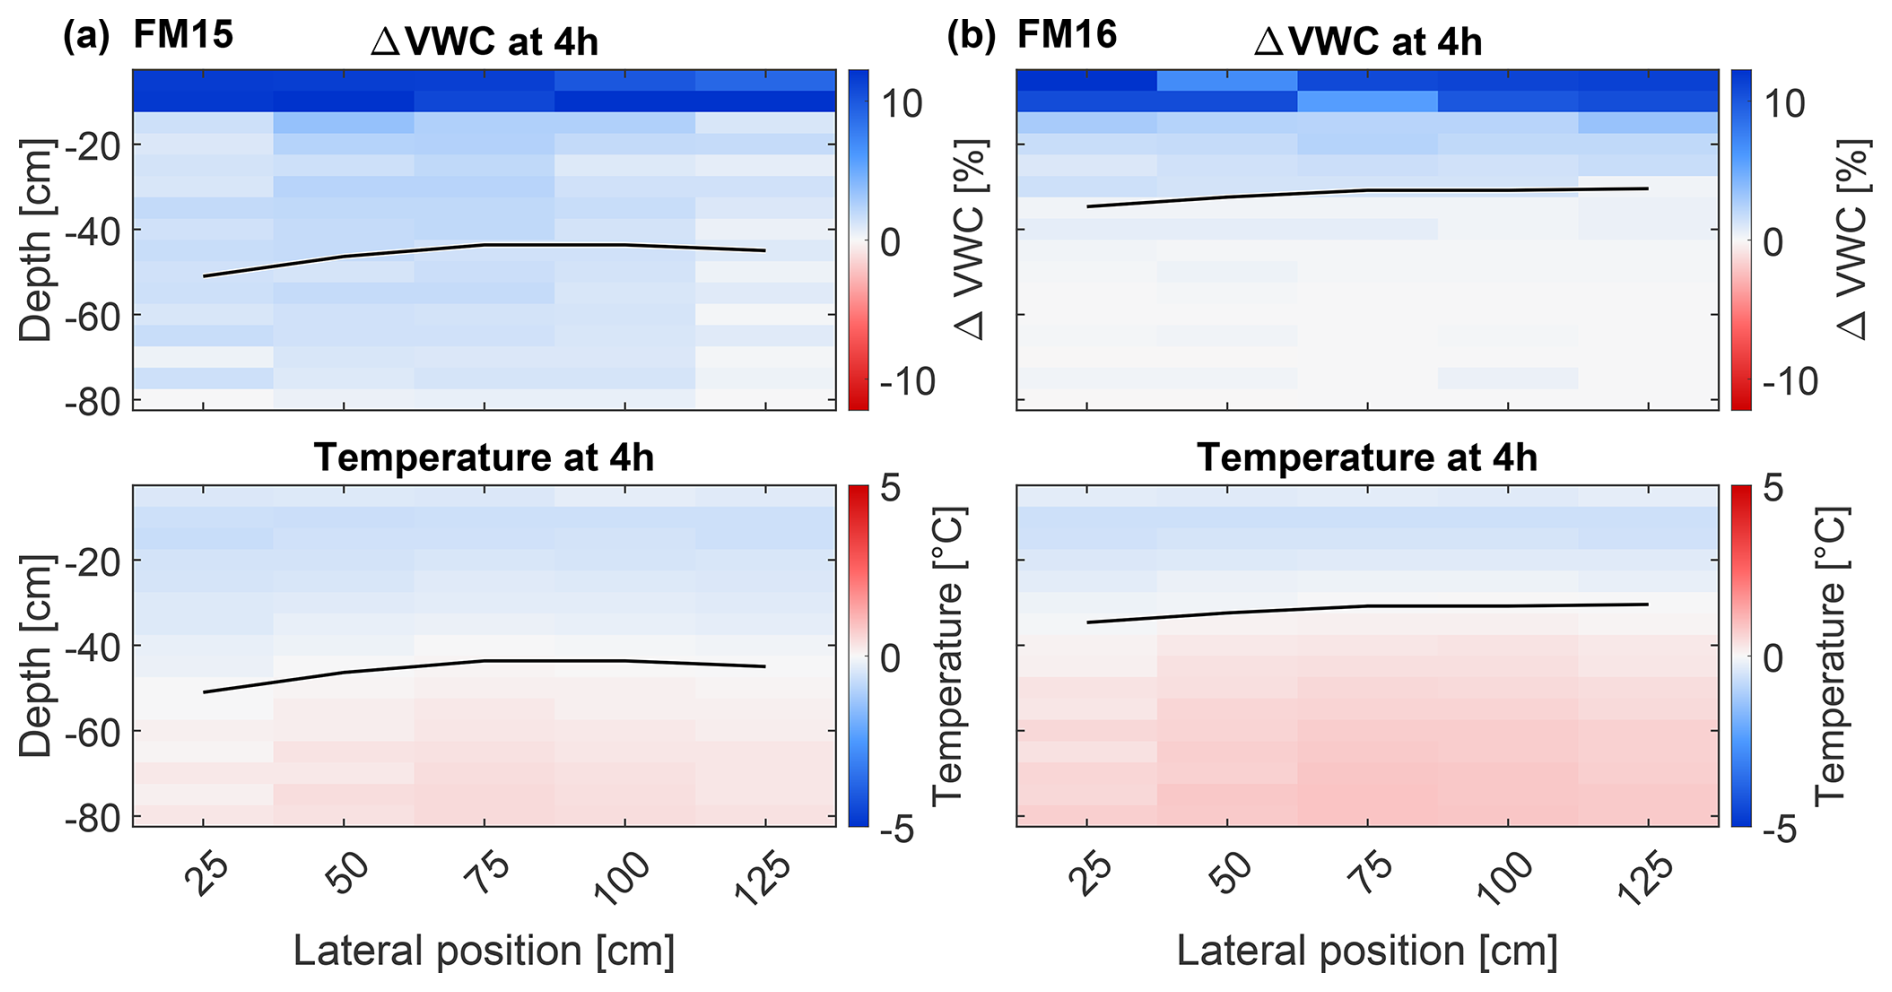
Figure 8Change of soil volumetric water content (ΔVWC) and temperature for the high water content experiments with macropores at the onset of substantial drainage outflow (approximately 4 h after irrigation start). The first row shows VWC changes relative to t=0 h (in percent), while the second row shows the temperature. The black line marks the 0 °C isotherm, indicating the freezing front position.
Colours indicate sensor readings, and the black line in the frozen experiments marks the 0 °C isotherm. The analysis begins with the post-freezing initial state for all nine experiments (Fig. 5), providing a baseline for evaluating the effects of irrigation. In contrast to Fig. 3d, which shows a uniform 100 h snapshot, these profiles represent the final freezing state for each experiment. The duration required to reach this state varied among experiments, as comparable frost depths were targeted between macropore network and non-macropore network pairs (e.g. 102 h for FM13 and 122 h for FN15). It should be noted that changes in measured ΔVWC under partially frozen conditions may reflect multiple processes, including liquid water redistribution, local phase change, and temperature-dependent dielectric effects. Accordingly, these spatial patterns are interpreted in conjunction with the independently measured flux data and temperature evolution rather than as direct evidence of specific flow pathways. In the unfrozen scenarios (NN10, NM10), the temperature remained above 0 °C throughout the soil profile, while in frozen soils, the 0 °C isotherm ranged from 25 cm (FM16) to 55 cm (FN10), primarily depending on initial soil temperature and freezing duration. As discussed in Sect. 3.1, no strong systematic effect of the macropore network or initial VWC is observed.
The temporal evolution of VWC and temperature during irrigation is shown in Figs. 6 and 7. Significantly, the upper panels exclusively show changes in VWC compared to the state immediately after freezing. (Fig. 5). For non-frozen experiments, NN10 and NM10 (Fig. 6a), infiltration progressed steadily with an advancing wetting front along the downslope direction. In NN10, a temperature decrease of 1.6 °C at 55 cm depth within the first 20 h is consistent with advective cooling by the infiltrating water. Net changes in VWC are consistent with progressive wetting under unfrozen conditions and thus reflect infiltration without a frozen barrier. Differences between the macropore network and non-macropore setups were negligible. In FN10, a deeply developed freezing front (50–70 cm) was present at the onset of irrigation. The freezing front progressed downwards and at 10 h the entire soil body was at sub-zero temperatures. Only small (1 %–2 %) changes in the measured (unfrozen) VWC occurred in the deeper layers (40–80 cm), consistent with a largely frozen initial state in which a substantial fraction of pore water had transitioned to ice. FM10 exhibited a weaker frozen layer at 25–30 cm depth. Infiltration into the matrix was visibly delayed, with the wetting front lagging by approximately 20 cm after 10 h (compared to the unfrozen NM10). Once the wetting front approached the 0 °C isotherm, changes in the temperature field and the apparent position of the freezing front coincided with infiltration, from 35 cm at 3 h to 45–55 cm at 20 h, indicating a coupled thermo-hydraulic response during irrigation. Full infiltration occurred in both experiments. In FM10, total VWC increases of 5 %–7 % were observed below the freezing front, whereas FN10 showed much smaller increases because the entire soil body was already frozen. No clear macropore network effect was observed under these relatively low initial water content conditions. In all low VWC experiments (Figs. 6a and b), the sensor readings of the upper 10–20 cm are misleading, since wetting-induced settlement of the soil during irrigation occurred, which exposed sensors to air. These near-surface measurements are therefore considered artefacts and excluded from quantitative interpretation, though retained in the plots for transparency.
In the intermediate VWC experiments FN12 and FM13 (Fig. 6c), a pronounced frozen layer initially extended between 0 and 30–35 cm depth. FM13 showed earlier changes in the measured (unfrozen) VWC at depth, with the 80 cm sensor recording increases of 1 %–2 % after 10 h, whereas FN12 exhibited no detectable change at that level over the same period. Interpreted together with the earlier drainage response (Sect. 3.2), this pattern is consistent with preferential bypass flow in FM13, although direct visualisation of flow paths was not possible within the present setup.
The freezing front advanced during irrigation, reaching 50 cm in FN12 and 45 cm in FM13.
In the high VWC scenarios FN15, FM15, and FM16 (Fig. 7), all experiments began with frost depths of approximately 30–45 cm. In FN15, VWC changes remained below 1 % throughout the profile, and most inflow was diverted into surface runoff (see Fig. 4d). In FM15, small but measurable VWC increases throughout the soil body occurred within the first 6 h. In contrast, FM16 showed no detectable changes in VWC below the freezing front during the early stages of irrigation. To further assess whether drainage occurred prior to detectable matrix wetting, the spatial distribution of VWC was examined at the moment when drainage was first detected in FM15 and FM16 (Fig. 8). The onset of substantial drainage occurred after approximately 4 h (see Fig. 4 and Appendix H). At this time, the mean VWC increase below the freezing front was around 1 % in FM15 and only around 0.2 % in FM16. The low amount of matrix wetting in FM16 prior to drainage is consistent with preferential bypass flow through the macropore network. In FM15, minor increases in VWC were detected at several sensor locations before drainage began, suggesting that limited local matrix wetting may have occurred.
This behaviour is consistent with potential macropore-matrix flow interaction, although the detailed mechanisms cannot be resolved within the framework of the present experiment. However, because ΔVWC under partially frozen conditions may reflect both hydraulic redistribution and phase-change-related dielectric effects, the observed patterns are interpreted in conjunction with the independently measured flux data (Sect. 3.2), these observations are consistent with preferential bypass flow. Overall, the results suggest a transient role of the macropore network in enabling infiltration and heat exchange under fully frozen surface conditions, although the exact flow paths could not be resolved within the current experimental setup.
4.1 Soil freezing behaviour
The freezing dynamics observed in our experiments were governed primarily by the antecedent soil temperature, whereas variations in initial water content and the presence of the macropore network played only minor roles within the tested parameter range (with the exception of the FN10 run, where the cooling procedure was modified). Differences of up to 4–6 °C in the initial thermal state largely determined frost depth, consistent with the importance of sensible heat storage reported by Kurylyk and Hayashi (2016). In wetter soils, higher thermal conductivity facilitated slightly more efficient heat loss from the surface, yet the advance of the freezing front was delayed because the increased water content raised the latent heat requirement. Consequently, cooling and freezing progressed in opposite directions: temperatures decreased more rapidly, but the phase change advanced more slowly.
This highlights the dual role of water content in frozen soils, acting both as a thermal conductor and a latent heat buffer. In fine-textured or organic-rich soils, these effects are further complicated by cryosuction and water redistribution (Nagare et al., 2012), but in our coarse sandy matrix such processes were much smaller. Throughout the experiments, a slight reduction in water content at deeper soil layers during freezing suggested a small upward migration toward the freezing front. However, these effects were minimal within the coarse, low capillarity matrix used here. The absence of an effect of the macropore network on freezing contrasts with the findings of Watanabe and Kugisaki (2017), who reported pronounced retardation of freezing around macropores in fine-textured soil columns. Their experiments used narrow, vertically oriented pores (5 mm diameter) and a macropore volume fraction of about 1.6 %, whereas our large-scale setup contained coarser (10 mm) pores with a smaller total volume fraction (≈0.5 %). Under these conditions, the coarse texture, low porosity, and limited cumulative heat exchange area likely restricted significant thermal buffering along macropore walls. A similar dependence on macropore network fraction was also reported by Demand et al. (2019), who found moderate freezing delays at higher macropore volumes, suggesting that macropore-related thermal effects may scale with their overall abundance. Overall, our findings emphasise the dominant role of thermal preconditioning in controlling frost penetration, while underscoring that such controls are strongly soil-specific. These preconditioning effects set the foundation for the infiltration and runoff dynamics discussed below.
4.2 Infiltration and runoff dynamics
Initial water content emerged as the principal control on infiltration/runoff partitioning in frozen slopes. At low volumetric water content (VWC), infiltration proceeded primarily through the soil matrix, and the macropore network had little influence. At intermediate VWC, however, the macropore network seems to enhance infiltration and drainage by providing preferential flow paths, consistent with a regime shift between matrix-dominated and preferential-flow-influenced infiltration as discussed by Demand et al. (2019) and consistent with the column experiments of Watanabe and Kugisaki (2017). Distributed sensor data align with preferential infiltration bypassing the frozen matrix and with concurrent modifications of the internal thermal regime. The observed migration of the freezing front during irrigation may reflect a coupled redistribution of heat and mass within the soil profile. While advective heat transport associated with surface-cooled infiltrating water is a possible contributing mechanism, which would be consistent with previous modelling studies (Hansson et al., 2004; Grenier et al., 2018), its relative importance cannot be resolved within the present experimental framework.
The strongest contrasts were observed at high VWC (near saturation), where the frozen matrix became nearly impermeable. Without a macropore network, almost all inflow was converted to surface runoff, whereas soils containing a macropore network exhibited rapid initial drainage that bypassed the frozen layer, followed by partial blockage of preferential flow paths due to refreezing. At first glance, these results might appear to contradict the findings of Pittman et al. (2020), who observed reduced infiltration under high initial water content conditions due to freezing and blockage of macropores. However, differences in soil properties likely explain the contrasting behaviour. The soils used by Pittman et al. (2020) contained substantial amounts of swelling clay minerals, particularly smectite, which can expand during wetting and reduce macropore connectivity. Such swelling-induced pore constriction may effectively seal preferential flow pathways under high saturation conditions.
In contrast, the artificial soil used in the present experiments consisted predominantly of sand and gravel with only minor silt content and negligible clay fractions. Swelling processes were therefore absent, and macropore connectivity was primarily controlled by freezing and refreezing processes rather than mineralogical expansion. In addition, the relatively large macropore diameters and the comparatively low effective porosity of the soil matrix likely further promoted the persistence of preferential flow pathways under partially frozen conditions. Similar behaviour has been reported in field observations (Mohammed et al., 2019), where infiltration through frozen soils initially occurred via preferential pathways but declined as soil saturation increased and macropores progressively lost hydraulic connectivity. Taken together, these comparisons highlight that the functionality of macropore networks in frozen soils depends strongly on soil texture and mineralogy, particularly the presence of swelling clay minerals that can modify pore connectivity during wetting. In our experimental configuration, a marked change in infiltration behaviour occurred between the low (≈ 10 %) and the mid-to-high (≈ 12 %–16 %) initial VWC experiments. At lower VWC, sufficient air-filled pore space remained for matrix infiltration to dominate. This is consistent with a transition in behaviour between matrix-dominated infiltration at low initial VWC and stronger preferential-flow influence at intermediate to high initial VWC (Demand et al., 2019). The specific VWC range identified here is configuration-specific and should not be interpreted as a universal threshold. The range would need to be determined through numerical investigations. Alternative explanations for the earlier drainage onset must be considered. Packing heterogeneity introduced during soil preparation, minor structural rearrangements during freezing, or preferential flow along probe–soil interfaces could, in principle, contribute to localised flow acceleration. In addition, differences in frost depth or geometry between experiments may influence the timing of drainage initiation. However, several observations argue against these factors being the dominant control. First, the early inflow volumes in FN12 and FM13 were nearly identical during the initial phase, reducing the likelihood that inflow variability alone explains the timing difference. Second, the earlier drainage in FM13 coincided with spatial VWC increases at depth and with a consistent thermal response pattern, suggesting a system-wide hydraulic effect rather than a local artefact. Third, similar behaviour was not observed in the low VWC experiments, where soil preparation and instrumentation were identical. While preferential bypass flow cannot be directly visualised within the present setup, it provides the most parsimonious explanation consistent with the combined hydraulic and thermal observations. Such behaviour is consistent with field observations of infiltration into seasonally frozen soils, where groundwater recharge and soil moisture responses have been observed prior to complete thaw of the soil profile (Mohammed et al., 2019; Sanchez-Rodriguez et al., 2025). This behaviour highlights the non-linear sensitivity of infiltration to pre-freezing conditions (Stähli et al., 1996, 2004; Mohammed et al., 2018). Small differences in the initial VWC can determine whether a macropore network effectively contributes to the partitioning of precipitation, and whether a precipitation event results in efficient infiltration and drainage or, instead, in rapid and nearly complete surface runoff. Importantly, the sloping experimental setup (10°) promoted efficient lateral runoff, preventing ponding and realistically reproducing natural hillslope conditions often absent in column studies. These findings show that even modest variations in pre-event conditions can shift hillslope response between infiltration-dominated and runoff-dominated regimes, with implications for both groundwater recharge and debris flow initiation. While a transition between matrix-dominated and preferential-flow-influenced behaviour may also occur in other coarse-textured soils, the specific volumetric water content range identified here is configuration-specific. Variations in soil texture, structure, and macropore geometry are likely to shift the balance between micropore ice formation and macropore connectivity. The present results therefore constrain process behaviour under controlled slope-scale conditions.
4.3 Macropore refreezing
A novel aspect of this study is the direct observation of macropore network refreezing on an inclined soil slope under continuous wetting with a fine, naturalistic spray cone. In analysing Figs. 4d and H1 the observed decrease in drainage and the concurrent increase in surface runoff in FM15 and FM16 were initially attributed to refreezing of individual macropores during irrigation. This interpretation was first based on flow meter data and corroborating signals from the AquaCheck probes. After the experiments were terminated and the soil was excavated, this interpretation was supported by post-experimental excavation revealing partially frozen macropores (Fig. 9). Some macropores remained largely unfrozen (mainly in the upper slope) while others exhibited thin ice linings along the pore walls (Fig. 9a and b), particularly in the mid-slope region. In contrast, macropores located on the lower slope were constricted by up to 50 % of their diameter. Macropore refreezing occurred exclusively in the high VWC experiments, and the processes leading to pore blockage differed between runs. In FM15, the soil profile experienced deep and persistent freezing, resulting in thermal refreezing of macropores throughout the column (Fig. 9c). In FM16, by contrast, the frozen layer was shallower, but sediment deposition from the surface promoted pore blockage, as indicated by macropores partially filled with grains (Fig. 9b and c). These observations suggest two distinct mechanisms that reduced the functionality of the macropore network: (i) thermal blockage due to the growth of pure ice along pore walls, and (ii) particle-assisted clogging, where fine particles were flushed into the macropores and subsequently promoted refreezing onto these particles.
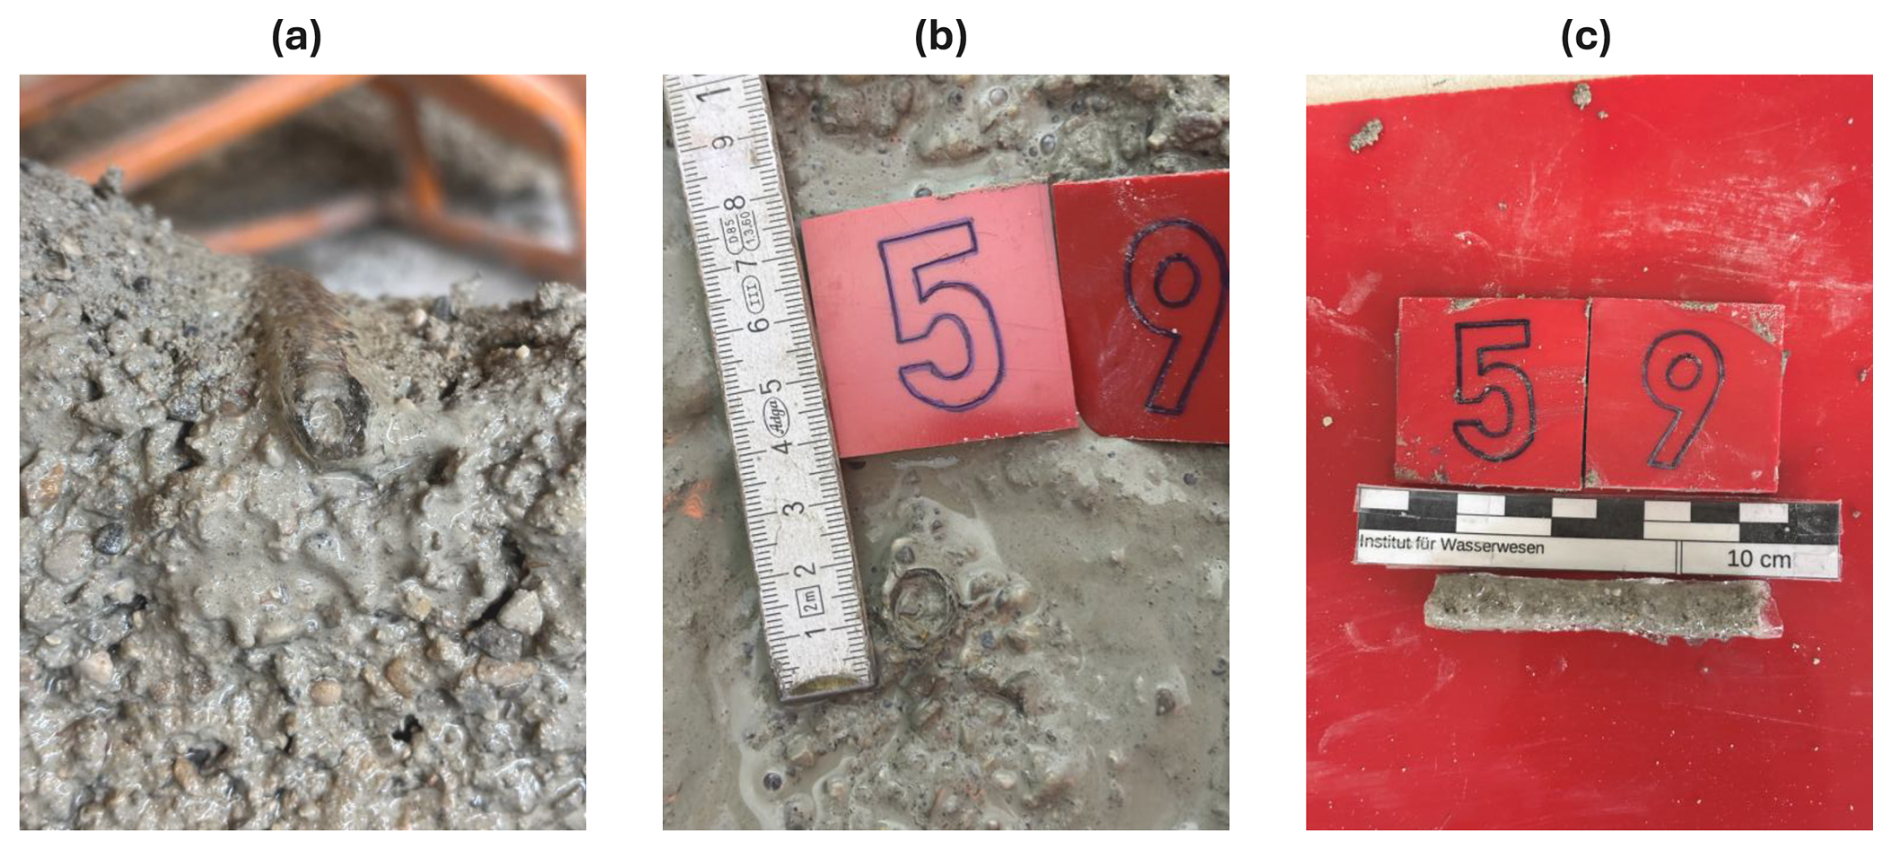
Figure 9Partially frozen macropores observed in the excavated soil. (a) shows a macropore with an approximately 50 % reduction in diameter, coinciding with the sudden increase in surface runoff (observed in FM15). (b) and (c) show a macropore (macropore 59; see Appendix A) at an early stage of ice formation, with a thin ice rim initiating at the pore wall and advancing inward (observed in FM16). All macropores initially had an open diameter of 10 mm. Photographs were taken post-experiment during systematic soil excavation. Residual sand and fines are visible in some macropores, likely introduced by surface runoff during the experiment or inadvertently during excavation.
The macropore network played a dual role, first acting as a conduit system for infiltration and later as a barrier through refreezing, emerges as a key feature of frozen soil hydrology. Refreezing substantially reduced the effective diameter of macropores, strongly diminishing their hydraulic conductivity and their interaction with the surrounding matrix. Even thin ice linings were sufficient to restrict flow and decouple macropores from the unfrozen pore space, leading to a rapid shift from infiltration to surface runoff once the discharge capacity was exceeded. The estimated 50 % narrowing observed in the high initial water content experiments (FM15, FM16) plausibly explains the concurrent decline in drainage and rise in surface runoff. Because natural macropores are irregular, partially filled, and rough-walled, these effects likely represent a lower bound for the hydraulic impact of partial refreezing.
Our findings that macropores freeze progressively from the pore walls inward are consistent with previous observations under idealised laboratory conditions (Watanabe and Kugisaki, 2017). The present study provides experimental evidence that this process also occurs in a large-scale, realistic experimental setup representative of alpine slopes subjected to natural rainfall. Additionally, evidence of particle-assisted clogging was observed, particularly in terminating macropores. Fine particles transported with surface runoff appeared to enter macropores and accumulate at their lower ends, enhancing partial blockage. This process likely acted in conjunction with refreezing, further reducing infiltration capacity. However, the overall extent of clogging remains uncertain, as some deposits may have been introduced during excavation. Similar reductions in infiltration capacity associated with repeated meltwater infiltration followed by refreezing have also been inferred from field observations, where midwinter melt events followed by subsequent freezing (“freezeback”) can reduce infiltration and promote increased runoff during subsequent melt events (Hyman-Rabeler and Loheide, 2023).
4.4 Limitations
The following limitations outline the scope and constraints of our experimental design, which deliberately simplified natural soil complexity to isolate the thermo-hydraulic effects of macropore networks under controlled conditions. The choice of relatively large macropore diameters was intentional to (i) ensure structural stability of the pores during freezing, (ii) facilitate reproducibility across experiments, and (iii) enable clear monitoring of macropore network effects in the presence of a dense sensor grid. In natural alpine soils, macropore networks are more heterogeneous in form and size, with diameters often below 5 mm and influenced by roots, cracks, and biogenic activity. Thus, while the implemented design accentuates preferential flow processes, it represents an upper-end scenario of macropore influence and should be interpreted accordingly.
Regarding the macropore network, we cannot guarantee that every individual macropore remained entirely unchanged throughout the freezing phase, particularly in deeper sections of the soil profile that were not directly observable prior to excavation. However, no visible macropore collapse was observed, and preliminary stability tests confirmed the general mechanical persistence of the 10 mm conduits.
While small, undetected structural rearrangements cannot be completely excluded, such effects would need to be systematic to explain the consistent hydraulic contrasts observed between experimental configurations.
The absence of fine particles and organic matter also suppresses cryosuction and reduces the potential for capillary water redistribution during freezing. Consequently, while the soil mixture reproduces the coarse end of alpine soil textures, it does not capture the full spectrum of cryogenic processes typical of finer structured or organic-rich mountain soils. This simplification was deliberate to isolate the role of the macropore network and initial water content, but it limits the transferability of the results to natural soils with higher silt or clay fractions.
The experimental design intentionally held several influential factors constant to isolate and visualise the role of the macropore network under different initial water contents. While this reduction in degrees of freedom improved interpretability, it also reduced generality. A single coarse-textured artificial soil with standardised packing and no organic content was used. Natural heterogeneity, such as layering, root channels, or biogenic roughness, was not represented and may influence capillarity, cryosuction, and refreezing dynamics. The macropore network in our experiments was artificial and reproducible, with fixed connectivity and orientation. Most macropores were vertical or only slightly inclined, resulting in predominantly vertical flow paths with limited tortuosity and little lateral preferential flow. This differs from natural soils, where macropore networks formed by roots, cracks, and fauna are highly tortuous and interconnected, facilitating both vertical and lateral preferential flow (Hartge et al., 2014). Furthermore, the artificial macropores used here had a uniform diameter of 10 mm, whereas natural systems typically contain a broader distribution of pore sizes. A shift toward smaller, more realistic pore diameters would likely alter refreezing dynamics and the hydraulic response. The parameter space was also restricted: only one macropore volume fraction (≈0.5 %), one pore diameter (10 mm), and one slope inclination (10°) were tested.
Hydraulic and thermal boundary conditions introduce additional limitations. In seasonally frozen soils, increasingly dynamic temperature fluctuations lead to more frequent freeze–thaw cycles, which can either strengthen or weaken frost fronts depending on air temperature and precipitation regime (Lundberg et al., 2016). Rainfall in the laboratory was applied under controlled conditions with predefined intensity and temperature, which cannot fully reproduce the natural variability of precipitation such as bursts, intermittency, or wind effects. In nature, winter precipitation events often occur over much shorter timescales and at lower intensities, yet with highly variable dynamics (Bardou and Delaloye, 2004). Overall, rain-on-frozen-soil events in the field are typically far more transient and complex than those achieved in controlled experiments.
Furthermore, snowpack processes and meltwater inputs were not considered, and the climate chamber conditions approximate but do not fully reproduce outdoor exchanges such as radiation, wind-driven convection, or diurnal cycling. Sensor-related uncertainties provide an additional source of limitation. AquaCheck probes required soil-specific calibration, and conversion from scaled frequency to effective permittivity and subsequently to volumetric water content introduces uncertainty, particularly when ice is present. In addition, the presence of vertically installed AquaCheck probes may locally influence hydraulic or thermal behaviour. Although care was taken to ensure close soil–probe contact during installation, preferential flow along probe–soil interfaces cannot be entirely excluded. However, the sensor data did not exhibit anomalous early-stage wetting signals that would indicate systematic vertical flow along the cylindrical probe surfaces. Probe positions were identical across experiments with and without macropores, and no spatial patterns aligned with probe locations were observed. Any probe-related effects are therefore expected to be secondary relative to the imposed macropore configuration. Local shrinkage occasionally exposed near-surface sensors to air, producing artefacts such as apparent VWC deficits. Although temperature offsets were corrected, small residual biases cannot be excluded. Evidence for refreezing processes such as particle-assisted clogging relies partly on post-excavation inspection, which may disturb fragile ice linings or redistribute fine particles.
Under partially frozen conditions, changes in measured (unfrozen) VWC may reflect a combination of liquid redistribution, local phase change, and temperature-dependent dielectric effects. Consequently, ΔVWC patterns were interpreted in conjunction with independently measured hydraulic fluxes rather than as direct indicators of specific flow pathways.
These limitations delineate the range of validity of our findings and motivate future research across a broader range of soil types, macropore fractions and diameters, slope angles, and compound snow-rain freeze–thaw sequences under more natural boundary conditions. Two aspects of the experimental design warrant particular caution when transferring these results to natural alpine soils. First, the artificial soil mixture was deliberately coarse and lacked organic material, suppressing cryosuction and limiting water redistribution during freezing. This simplification ensured homogeneous packing and reproducible conditions, but likely underestimates the role of capillary retention and ice segregation that occur in finer textured mountain soils. Second, the artificial macropores had a uniform diameter of 10 mm, representing the coarse end of natural variability. While this enhanced structural stability and reproducibility, it represents an upper-end scenario of macropore influence. Natural macropore networks are more heterogeneous in size, orientation, and connectivity, and their hydraulic behaviour may therefore differ from the controlled structures tested here.
4.5 Implications for modelling and field conditions
Despite the outlined limitations, our results bridge the gap between small-scale column experiments and uncontrolled field observations. The combination of a large soil volume, inclined slope, naturalistic rainfall, and a three-dimensional macropore network enabled reproduction of key hydrological processes such as lateral flow and surface runoff phenomena typically absent in column experiments. Field studies have reported both rapid runoff and infiltration under frozen conditions (Stähli et al., 2004; Webb et al., 2018), yet attributing these behaviours to macropore activity remains challenging due to heterogeneity. Our controlled experiments provide rare process-level evidence that even a small macropore volume fraction (0.5 %) can substantially alter infiltration/runoff partitioning under wet preconditions.
From a modelling perspective, these findings underline the limitations of Richards-based local thermal equilibrium (LTE) formulations, which cannot capture the transient role of preferential pathways or the abrupt transition from infiltration to blockage. The observed switch from active infiltration to macropore refreezing highlights the need for dual-domain and local thermal non-equilibrium (LTNE) frameworks (Larsbo et al., 2019; Heinze and Blöcher, 2019). The experimental dataset presented here provides an opportunity to test such models under controlled yet realistic slope-scale conditions. For instance, the paired macropore and non-macropore network experiments can inform the parameterisation of dual-permeability modules in HYDRUS or WaSiM, while the measured thermal dynamics and freeze–thaw transitions offer valuable benchmarks for LTNE implementations such as GEOtop. By confronting these models with experimental evidence, their ability to predict runoff generation, pore-pressure evolution, and slope instability under variable winter conditions can be systematically assessed and improved.
Taken together, our results indicate that macropore networks in frozen soils can play a highly dynamic role governed by initial water content, thermal state, and refreezing. Soils with few macropores tend to promote immediate runoff and debris flow initiation, whereas macroporous soils initially enhance infiltration and pore-pressure build-up before later producing delayed runoff surges. Both pathways are highly relevant for slope stability in mountain environments. With projected increases in winter rainfall and freeze–thaw variability (Beniston et al., 2018; Ranasinghe et al., 2021), preferential flow and transient macropore blockage are likely to become increasingly important for alpine hydrology and hazard prediction.
This study presents nine large-scale laboratory experiments examining rainfall infiltration into frozen slopes under controlled but near-natural boundary conditions. The results reveal the transient and non-linear role of macropore networks in controlling thermo-hydraulic processes in frozen soils:
-
Freezing dynamics. Frost penetration was primarily governed by the antecedent thermal state. The presence of an open macropore network (volume fraction ≈0.5 %) had negligible influence on frost depth or propagation under the tested conditions.
-
Infiltration-runoff partitioning. Partitioning depended strongly on the initial volumetric water content (VWC). At low initial VWC, the matrix remained partly permeable and infiltration was matrix-dominated. At high initial VWC, extensive ice blocking rendered the matrix nearly impermeable and infiltration was predominantly associated with macropore network pathways.
-
Temporal switching of pathways. At high initial VWC conditions, macropore experiments showed enhanced early drainage consistent with macropore-flow, but progressive refreezing and particle-assisted clogging reduced macropore capacity over time, diverting rainfall toward surface runoff.
-
Hazard-relevant implications. These contrasting responses imply different event trajectories on frozen slopes: in macropore-poor soils, frozen matrices favour rapid conversion of rainfall to surface runoff, consistent with immediate overland-flow pulses and potential debris-flow initiation when sediment supply is available. In macroporous soils, early bypass infiltration can transiently elevate subsurface drainage and pore-water pressures below a frozen surface layer before partial refreezing reduces connectivity and shifts fluxes back to the surface. The timing and magnitude of this switch depend on pre-event VWC, macropore connectivity, and refreezing rates (cf. cumulative flows in Fig. 4d), underscoring a regime shift between infiltration-dominated and runoff-dominated responses.
The dataset provides a benchmark for validating dual-domain and local thermal non-equilibrium (LTNE) formulations, including the transient functionality and blockage of preferential pathways. Future work should extend the parameter space toward compound rain-snow events, repeated freeze–thaw cycles, and finer textures with stronger capillarity. With winter rainfall projected to intensify, representing preferential flow and its dynamic refreezing will be increasingly critical for predicting alpine slope stability and subsurface recharge.
The macropore network consisted of 60 boreholes (Ø 10 mm) with varying lengths and inclinations.
About 28 % were vertical, the remaining ones were inclined between 1° and 20° in both longitudinal and transverse directions. Approximately 20 % ended within the soil body, and 15 % were hydraulically connected through intersecting pathways. A representative subset of borehole parameters is listed in Table A1. Figure A1 shows the pattern plate with all 60 boreholes and their respective IDs.
Table A1Representative subset of borehole geometry parameters used in the macropore pattern plate. Only one angle is shown here; the complete geometry, including the 3D CAD technical drawing, is provided in the dataset available from the Open Data repository. Available in the Open Data repository (DOI: https://doi.org/10.60776/MSLOMM).
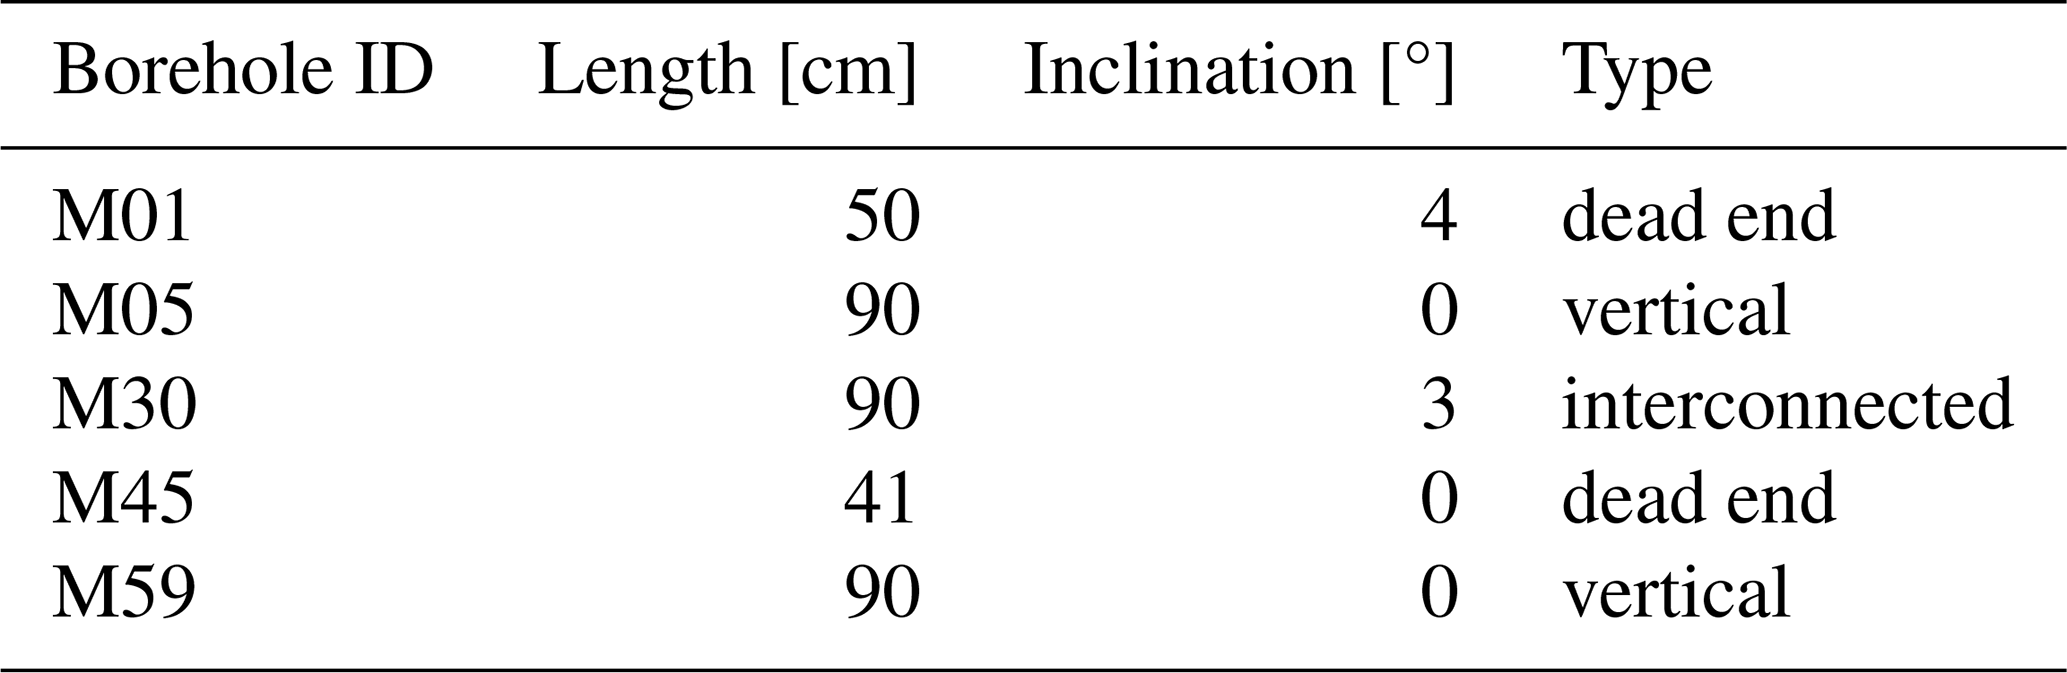
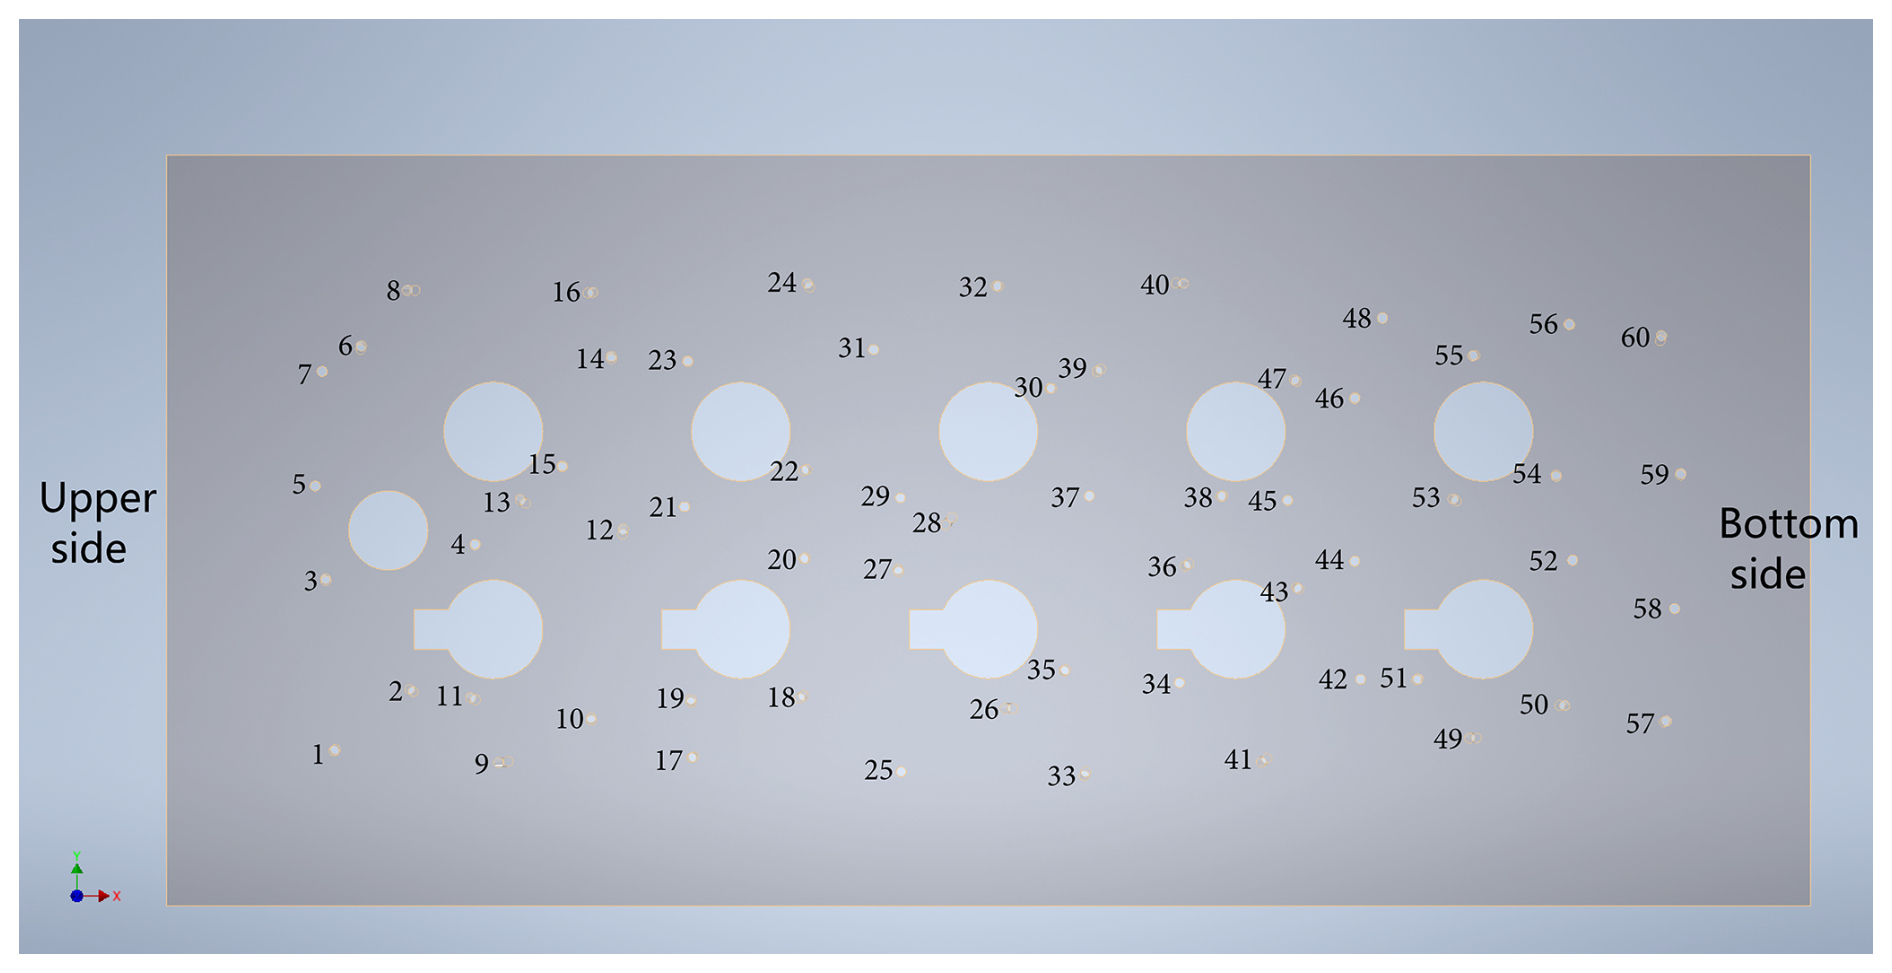
Figure A1Schematic of the macropore pattern plate with 60 numbered boreholes. Large circular openings were left blank to avoid contact with AquaCheck probe heads. The left side corresponds to the upper part of the soil box.
The positions of all AquaCheck probes and individual sensor levels within the soil box are shown in Fig. B1. This schematic illustrates the top and rear views of the complete measurement grid used for temperature and volumetric water content monitoring.
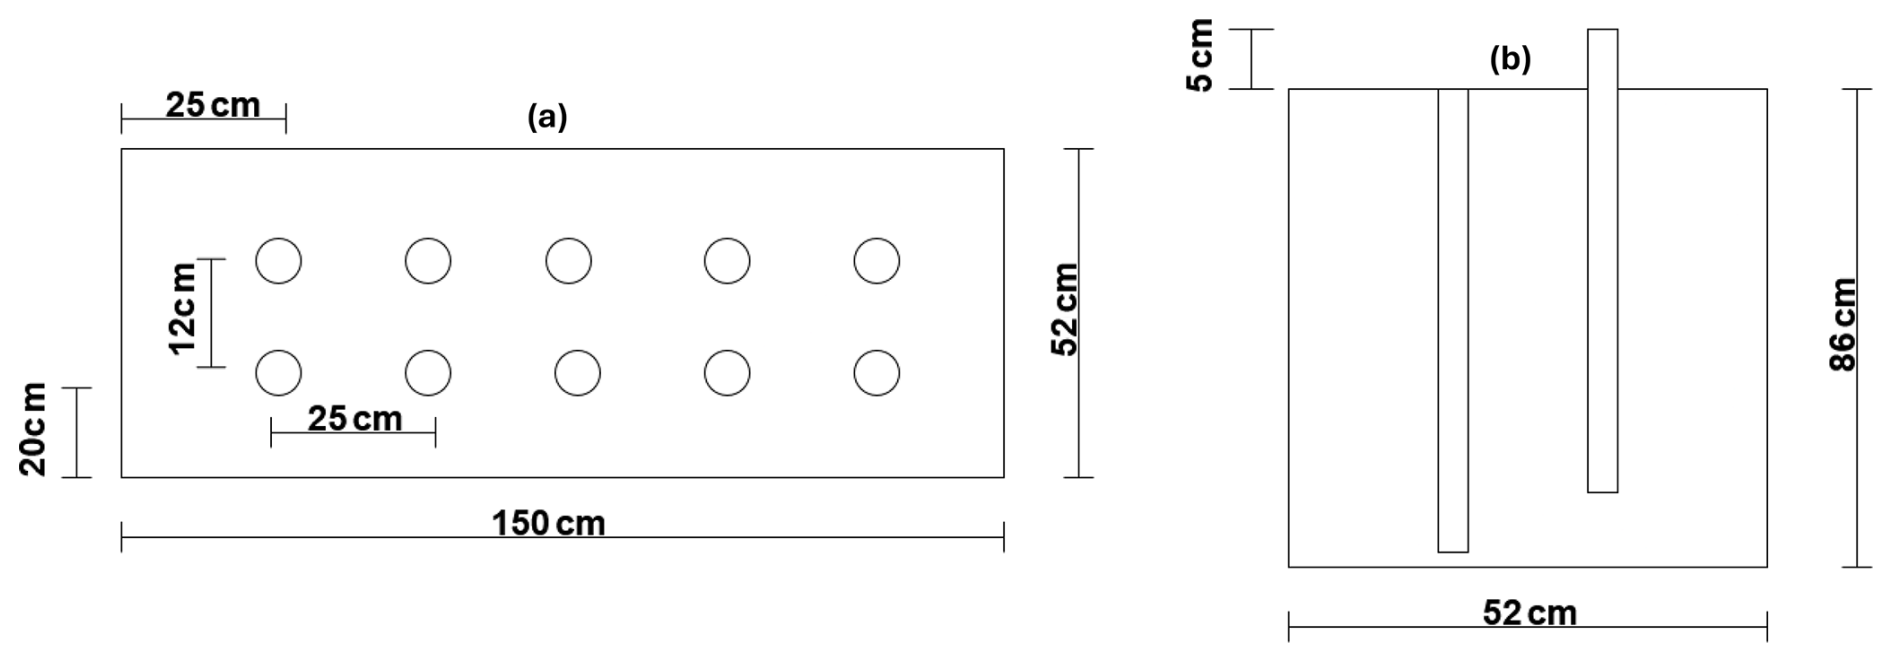
Figure B1 Schematic representation of the probe arrangement showing (a) top view and (b) rear view of the soil box with all AquaCheck probe positions (S1–S5 in two parallel rows). Each probe contains eight combined sensors for temperature and volumetric water content.
All AquaCheck capacitance sensors were calibrated against oven-dried soil samples to obtain dielectric values. Calibration was performed over 20 moisture levels covering the full range from air-dry to saturated conditions. For validation of each experiment, additional soil samples were collected and analysed by oven drying to verify the reliability of the calibrated AquaCheck readings under experimental conditions (Fig. C1). The mean absolute deviation between calibrated volumetric water contents and oven drying reference values remained below ±1.0 percentage points. Temperature readings were validated against PT1000 sensors, and a systematic offset correction of every single sensor was applied. All calibration and comparison data are available in detail in the open data repository (DOI: https://doi.org/10.60776/MSLOMM).
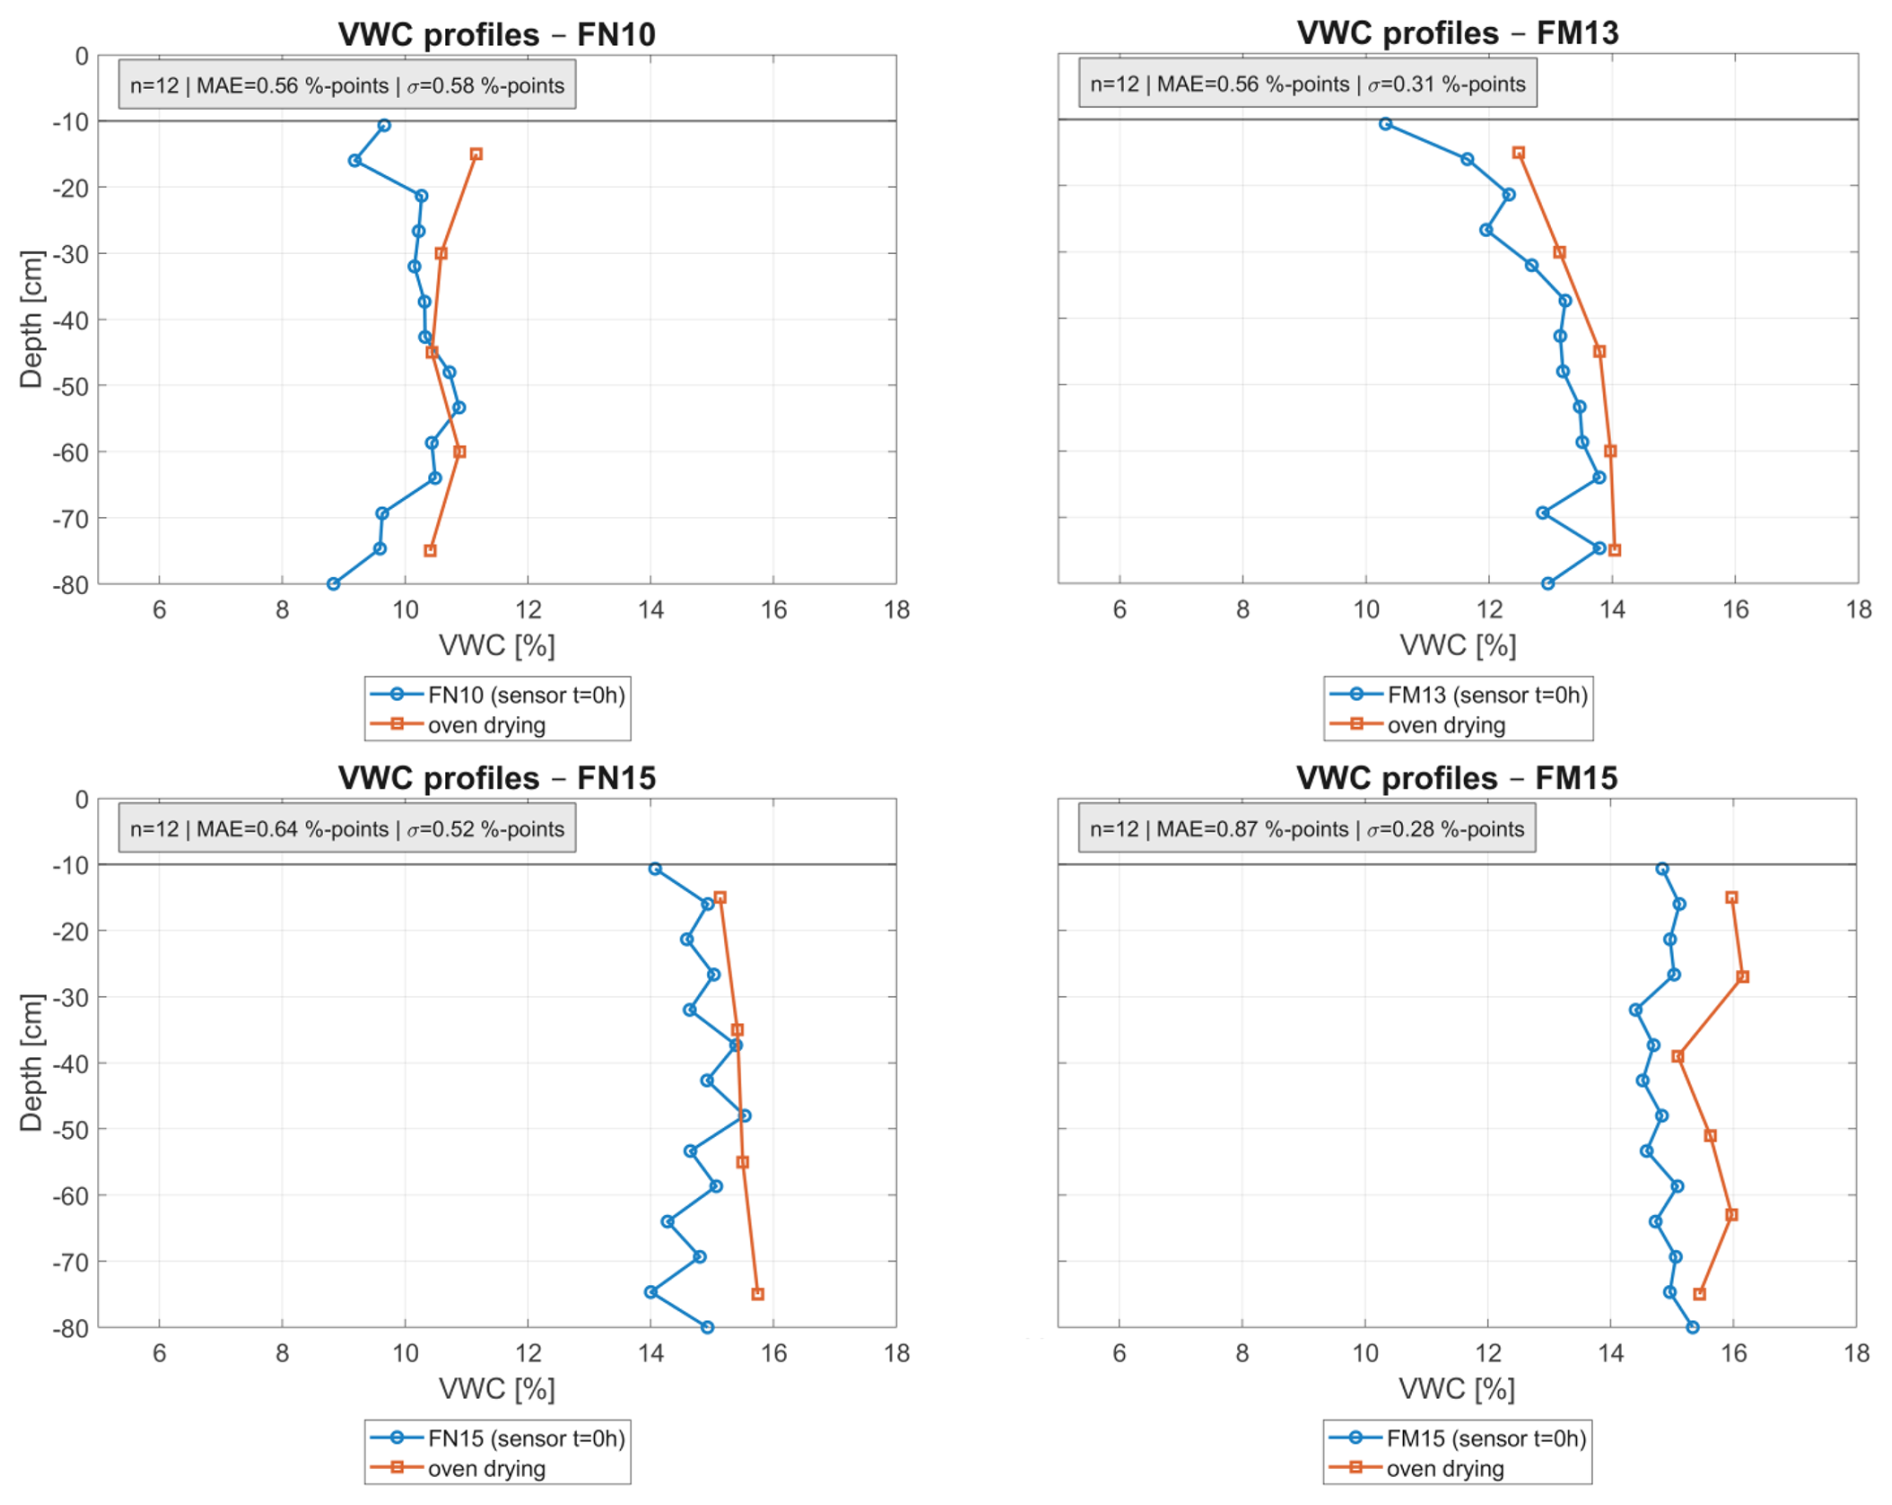
Figure C1Comparison between AquaCheck sensor readings (t=0 h) and oven-dried volumetric water contents for the four experiments with the largest deviations. Each panel shows the vertical water content profile derived from AquaCheck sensors and corresponding oven-drying samples. Reported values include the mean absolute error (MAE) and standard deviation between both measurement methods, expressed in percentage points.
Table D1Grain-size distribution of the artificial soil sample.
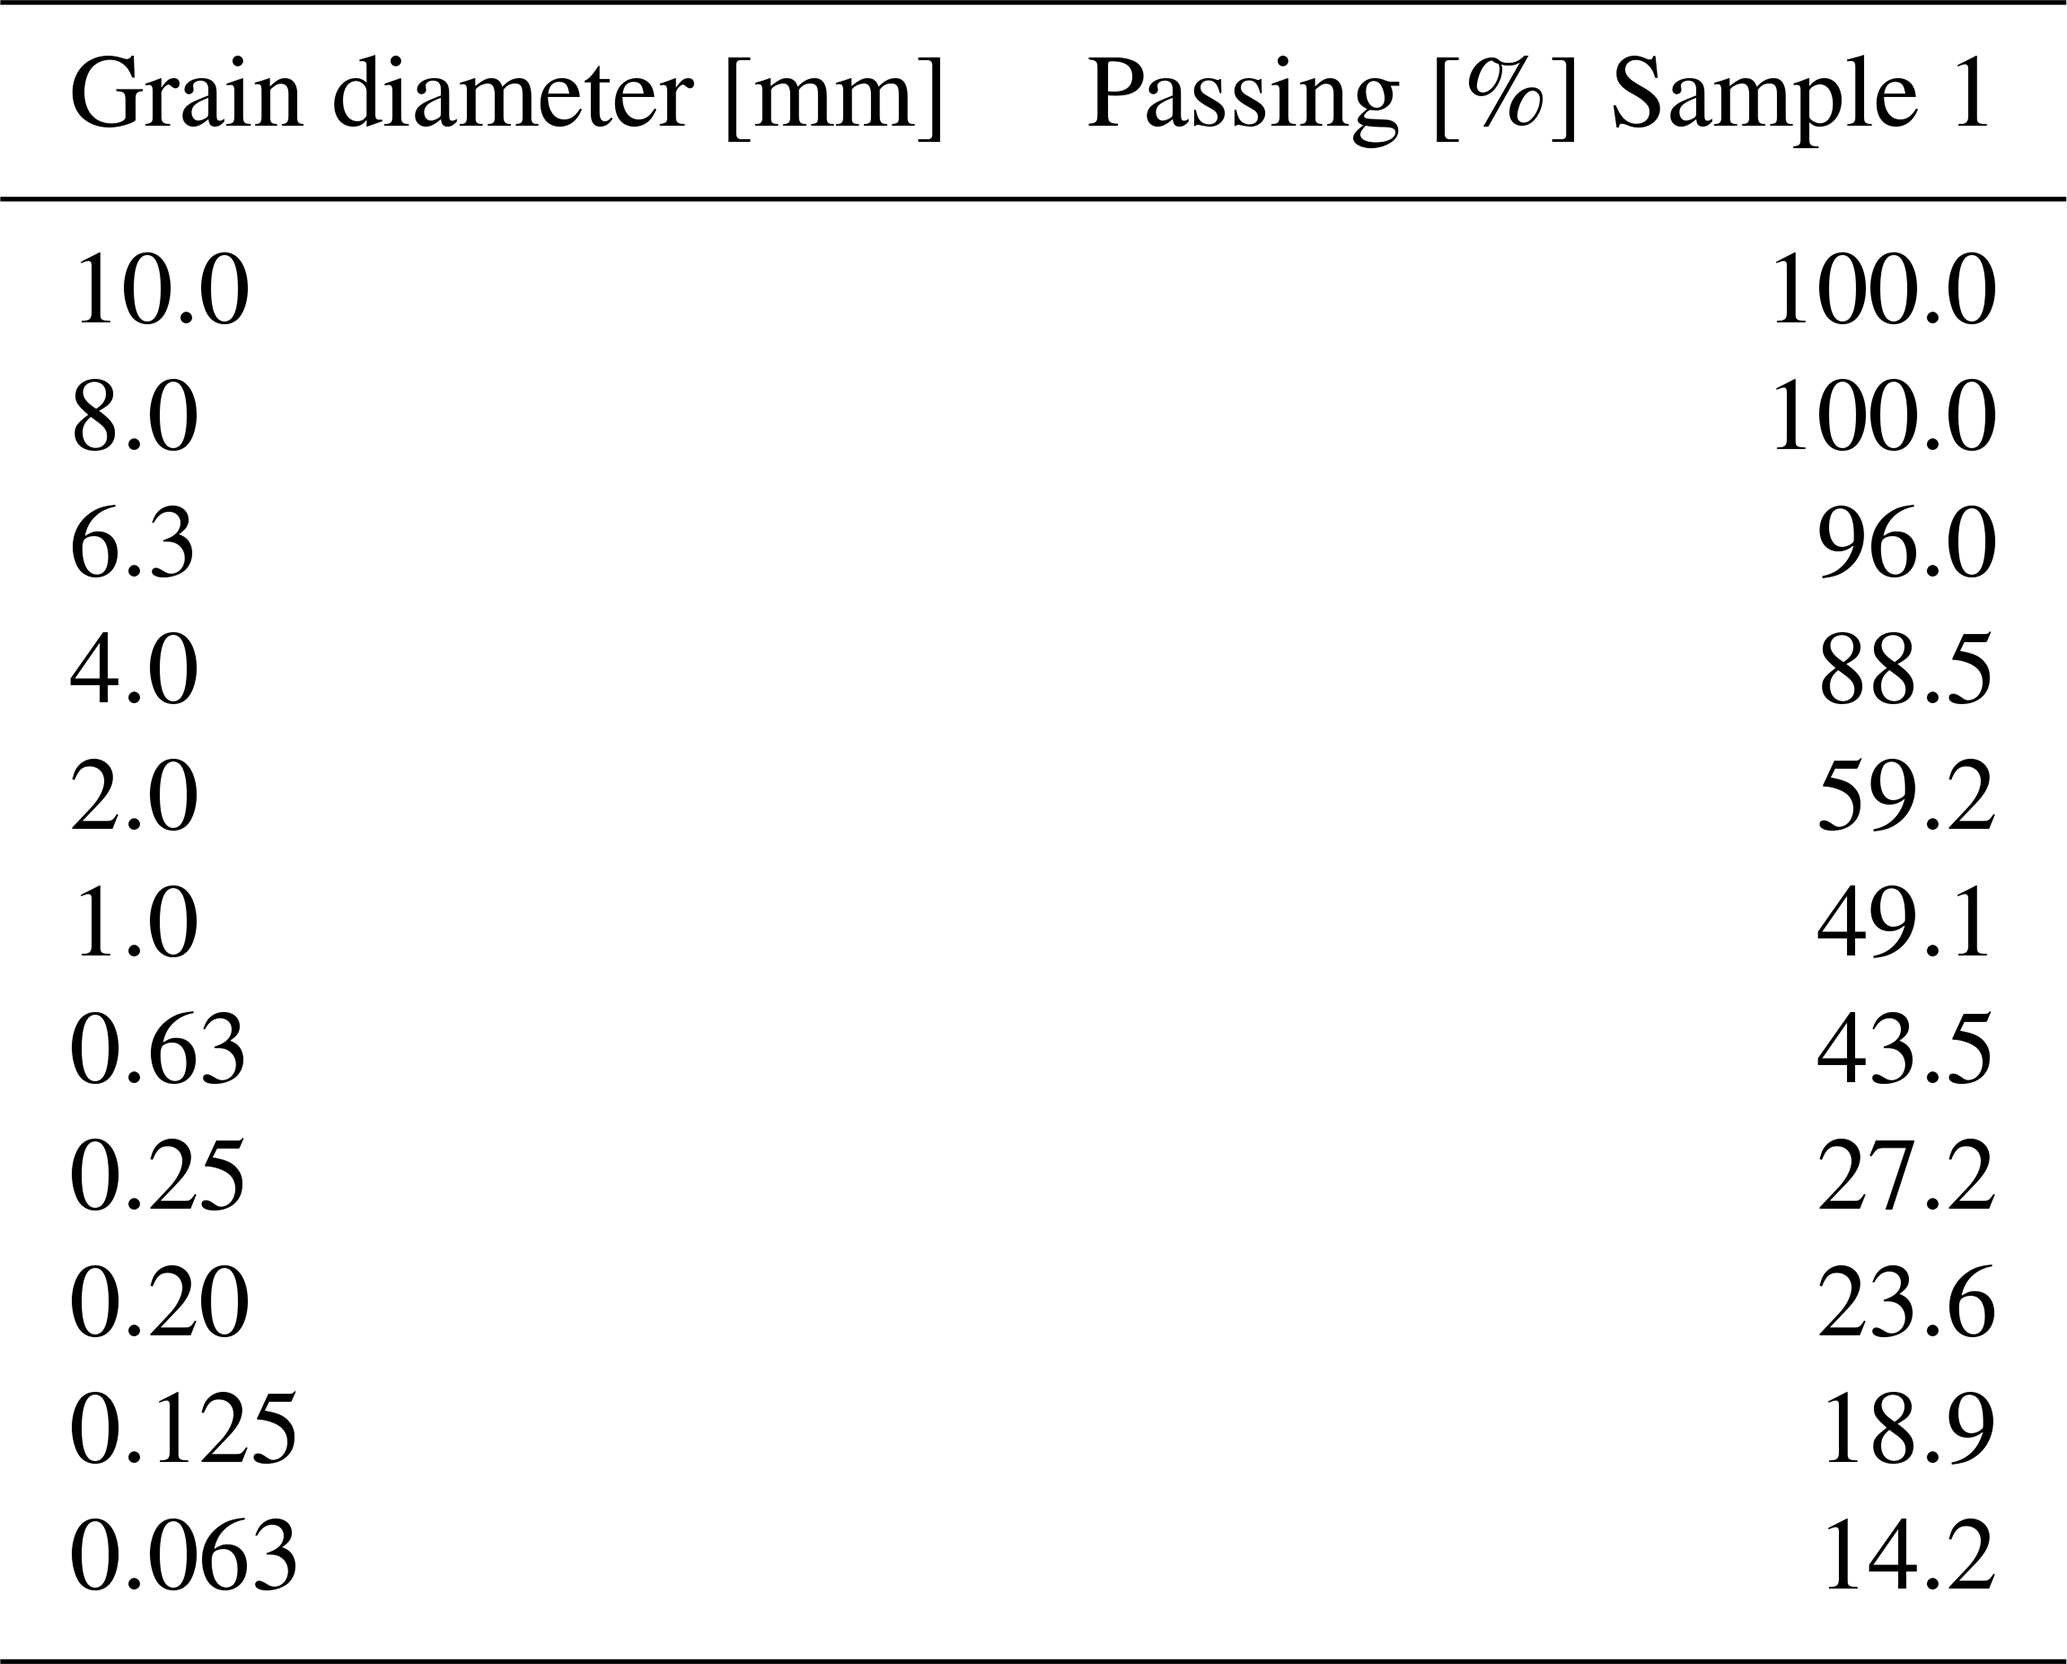
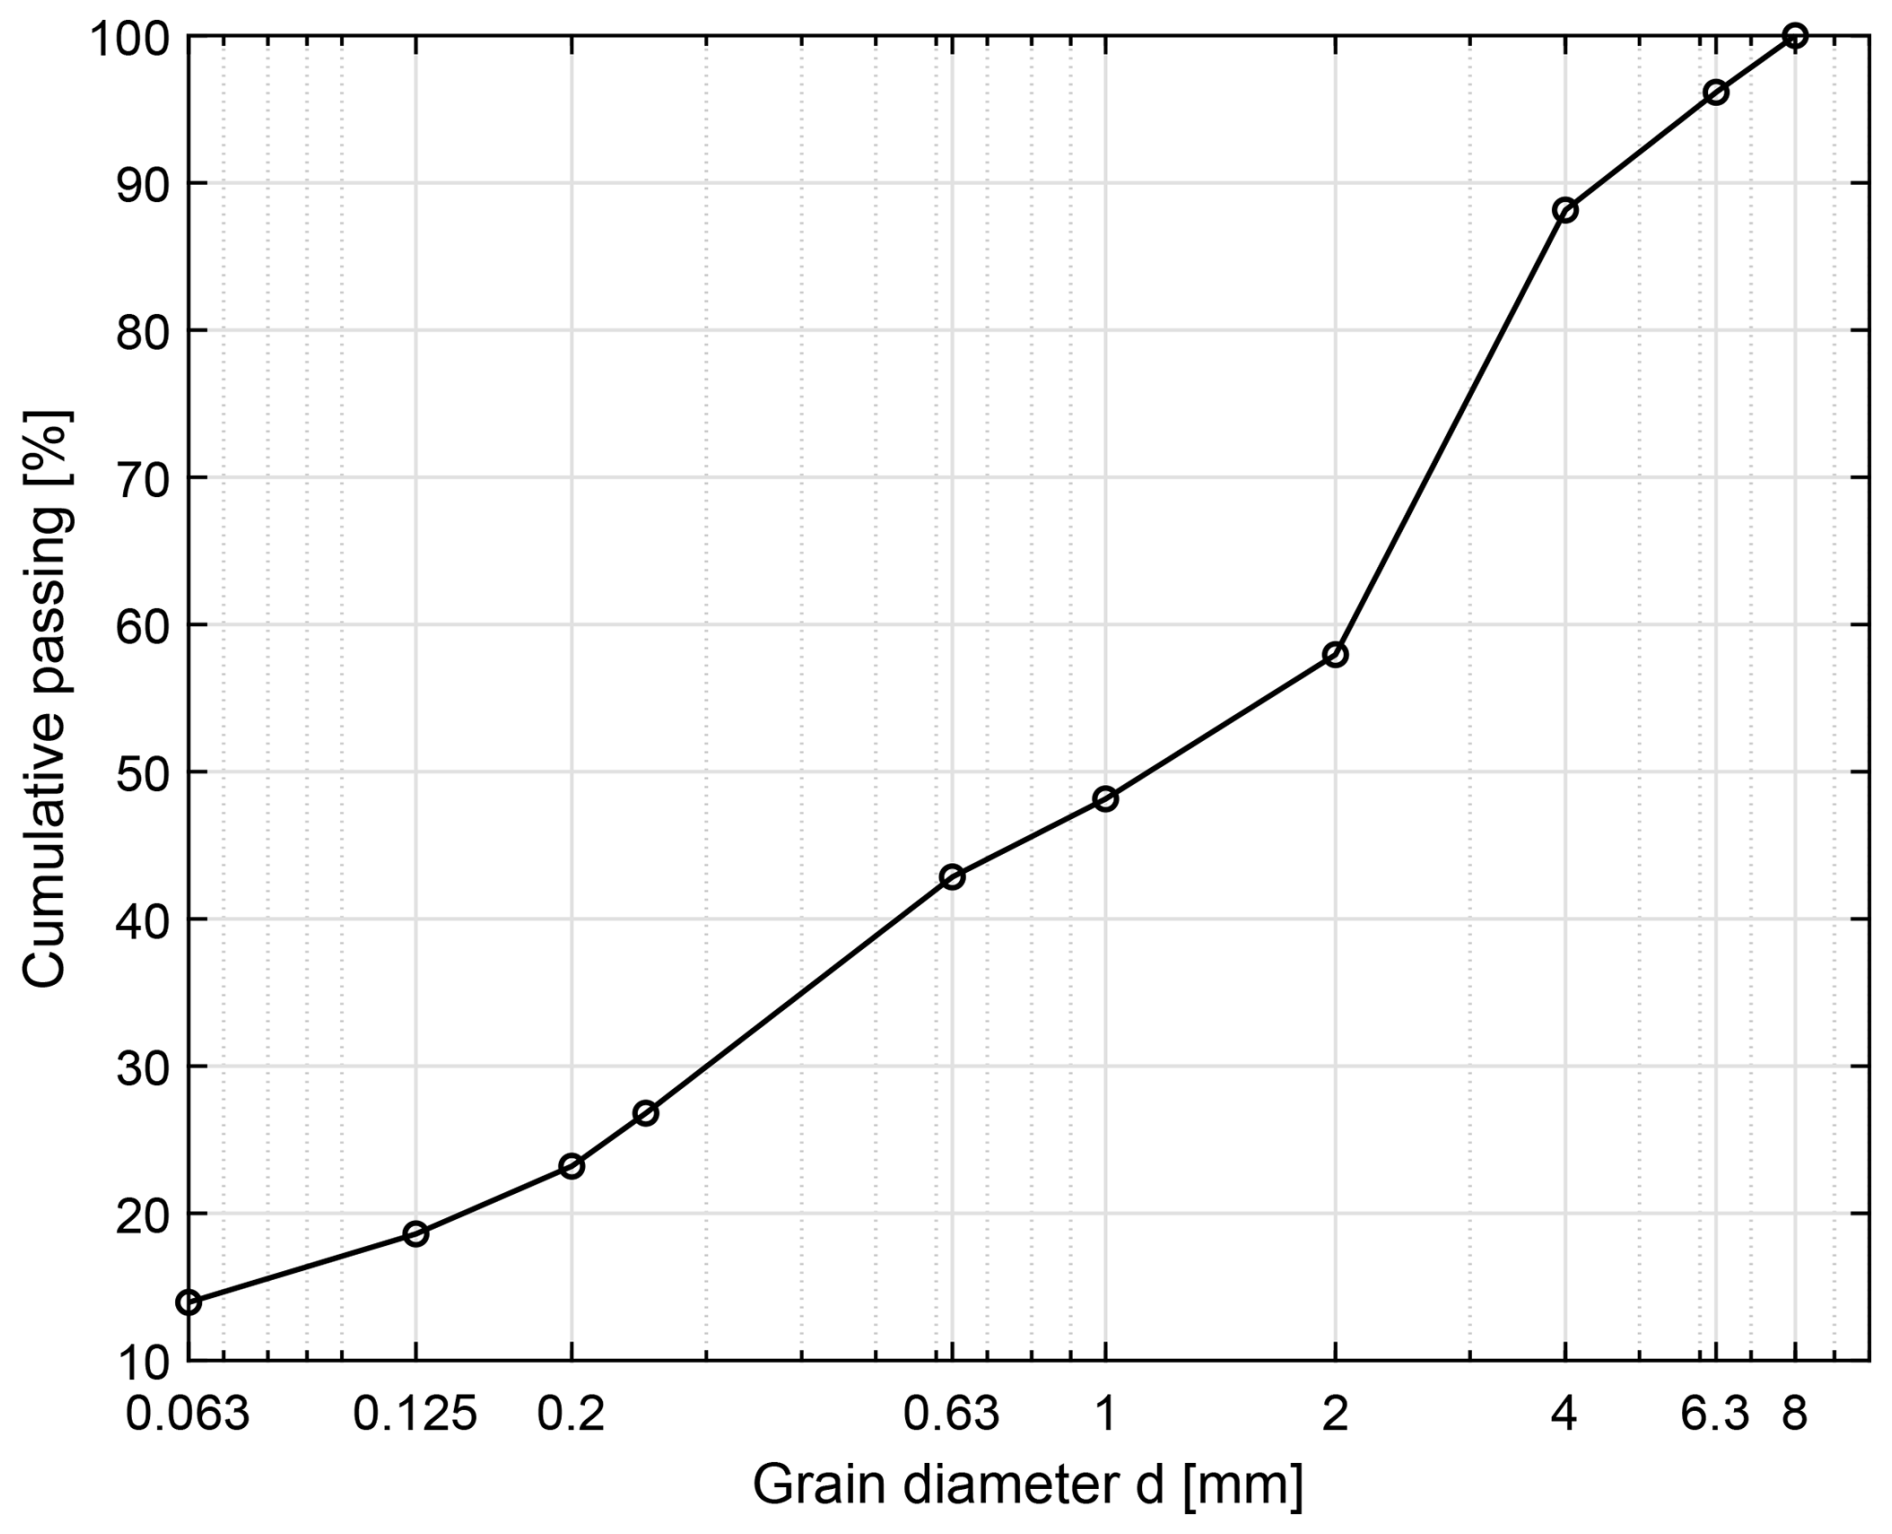
The cooling unit of the climate chamber (Viessmann Tecto RF WMC3) operates in periodic compressor cycles to maintain low air temperatures. During the freezing phase, the nominal set point was −5 °C. Due to the cyclic compressor operation, air temperature fluctuated around this value. The time-weighted mean air temperature during the freezing phase was −4.76 °C. The temporal evolution of the chamber air temperature during a representative experiment is shown in Fig. E1. Such fluctuations are characteristic of standard environmental chamber regulation and were consistent across experiments.
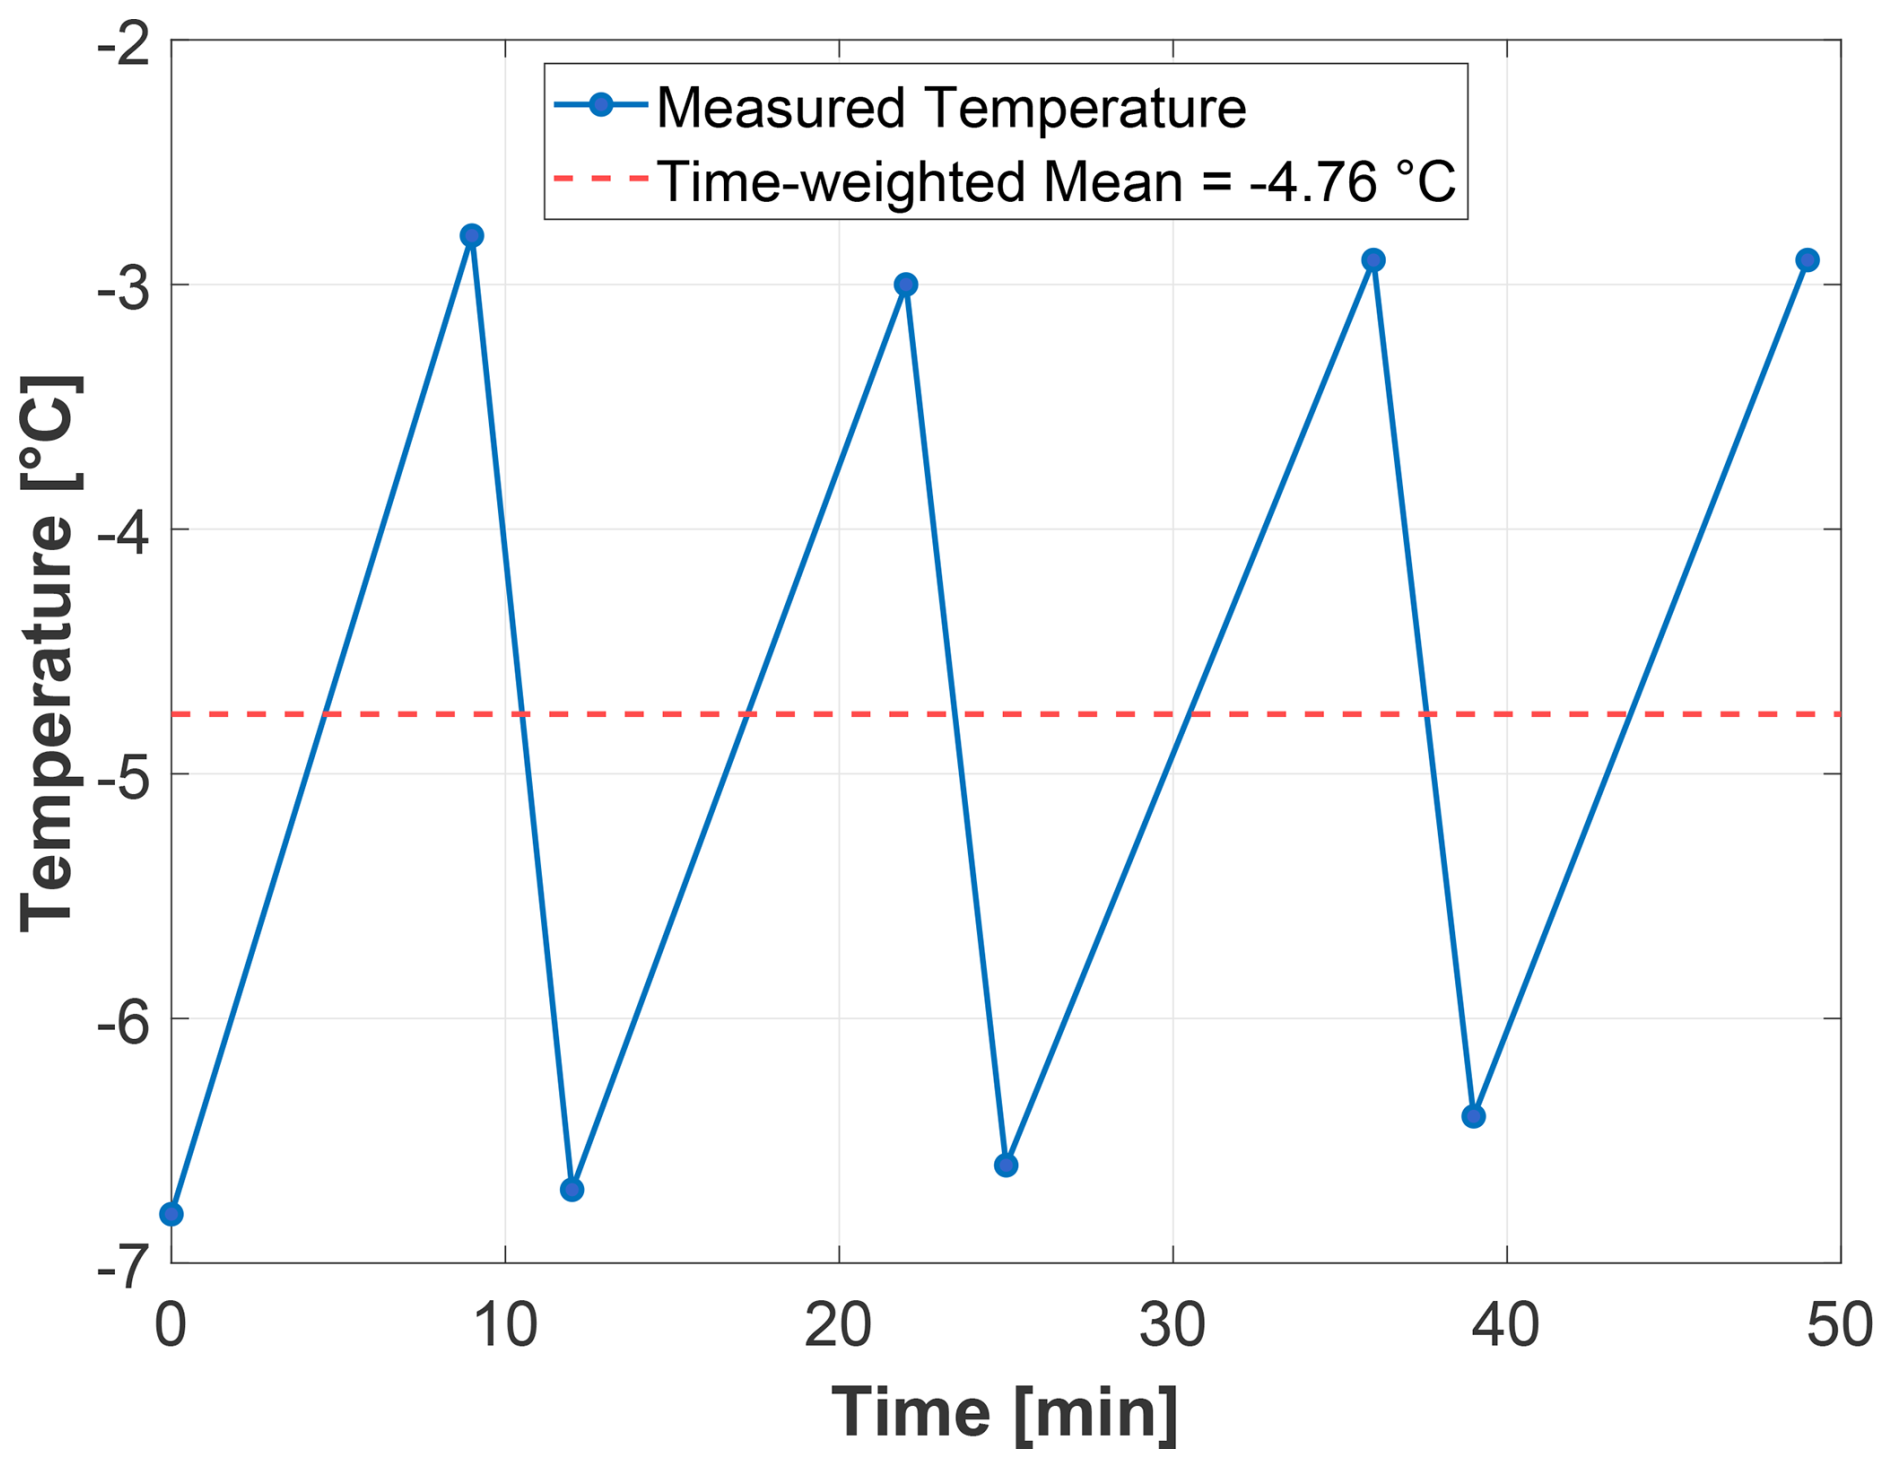
Figure E1Time series of climate chamber air temperature during the freezing phase, illustrating compressor cycling around the nominal set point of −5 °C.
To evaluate whether freezing of the soil body can reasonably be interpreted as predominantly top-down, vertical and lateral temperature gradients were compared using the distributed sensor network. Lateral temperature gradients were computed from temperature differences between sensors at comparable depths but different horizontal positions, whereas vertical gradients were derived from the mean vertical temperature profile. The lateral temperature gradient was defined as
where x represents the horizontal coordinate and T is temperature. The vertical temperature gradient was defined as
where z denotes depth. To quantify the relative importance of vertical versus lateral temperature gradients, we define a dominance factor:
where medianz denotes the median value across all depths at a given time step. Values of D>1 indicate that vertical temperature gradients dominate over lateral gradients, whereas D≈1 would indicate comparable contributions. During the freezing phase, vertical gradients clearly dominated the temperature field. Across all experiments, median values of D ranged between approximately 7.9 and 11.5 (Table F1). In particular, during the first ∼100 h of freezing, D was typically greater than 10, indicating that vertical gradients were roughly an order of magnitude larger than lateral gradients. As the experiments progressed and the soil approached thermal equilibrium under continuous irrigation and nearly constant chamber temperature, vertical gradients weakened and D decreased accordingly. Nevertheless, during the period relevant for freezing-front development, the temperature field remained strongly dominated by vertical gradients (Fig. F1).
Table F1Median dominance factor D across experiments during the full experimental time span.
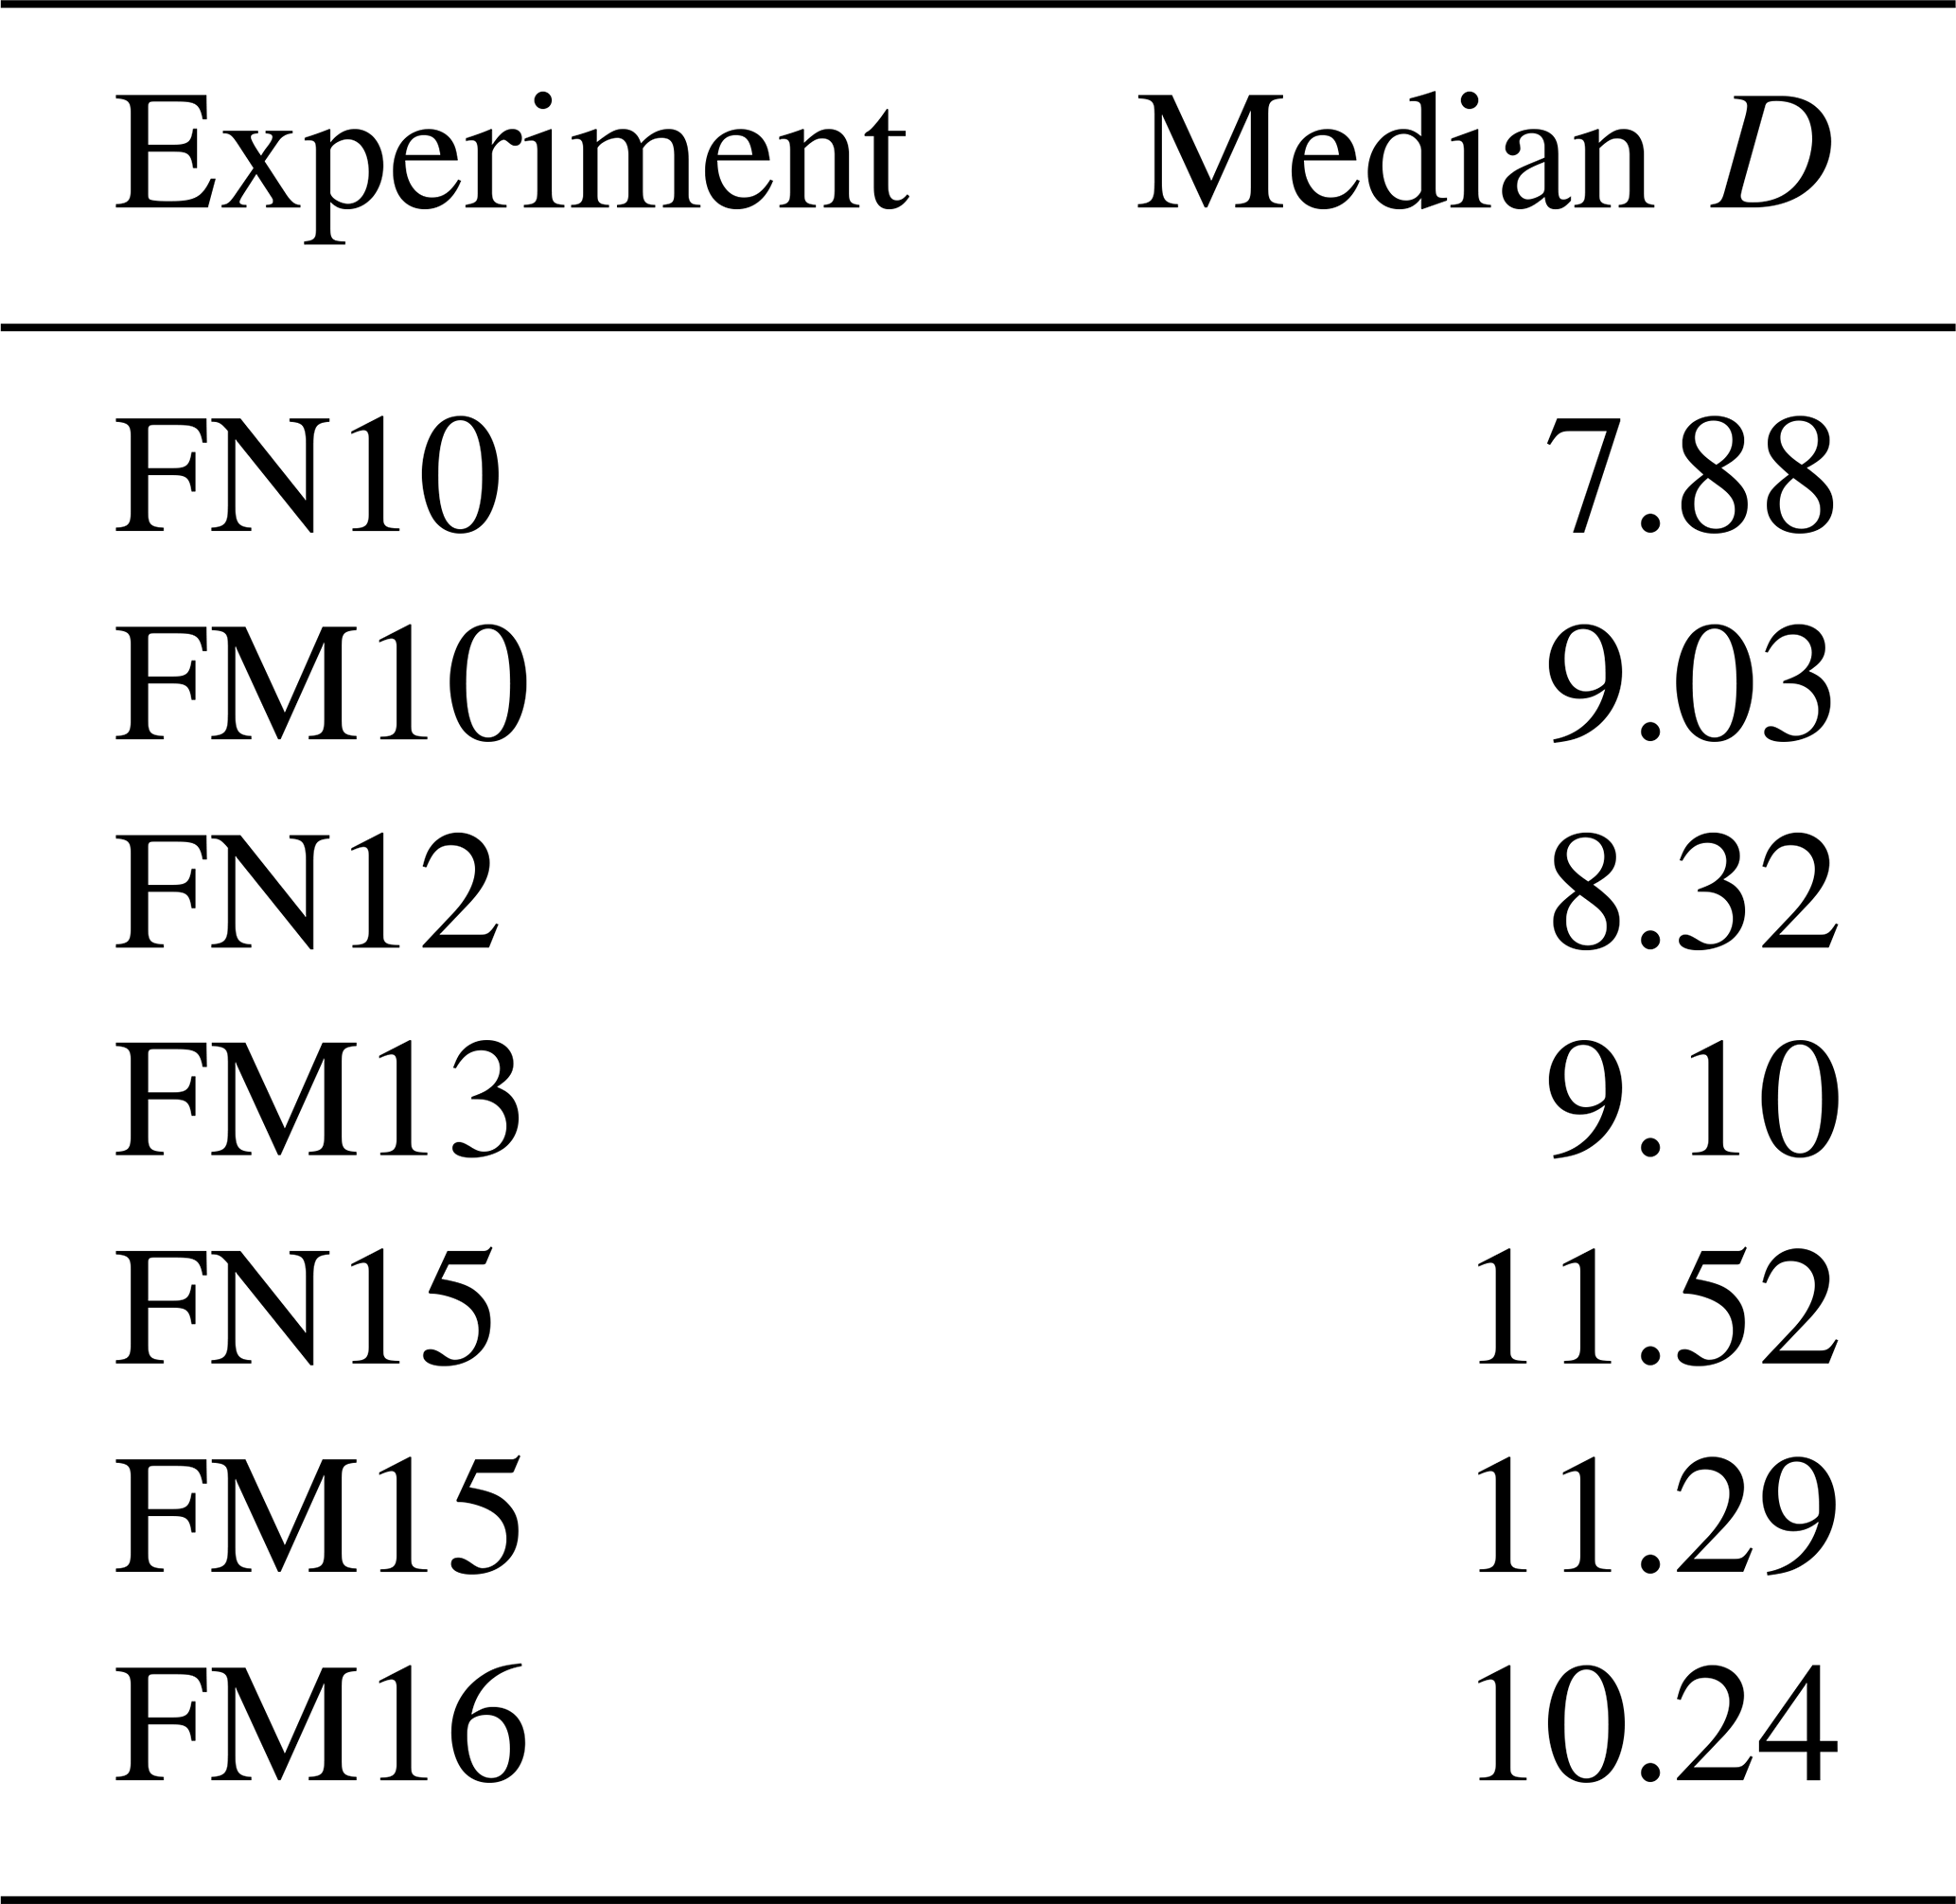
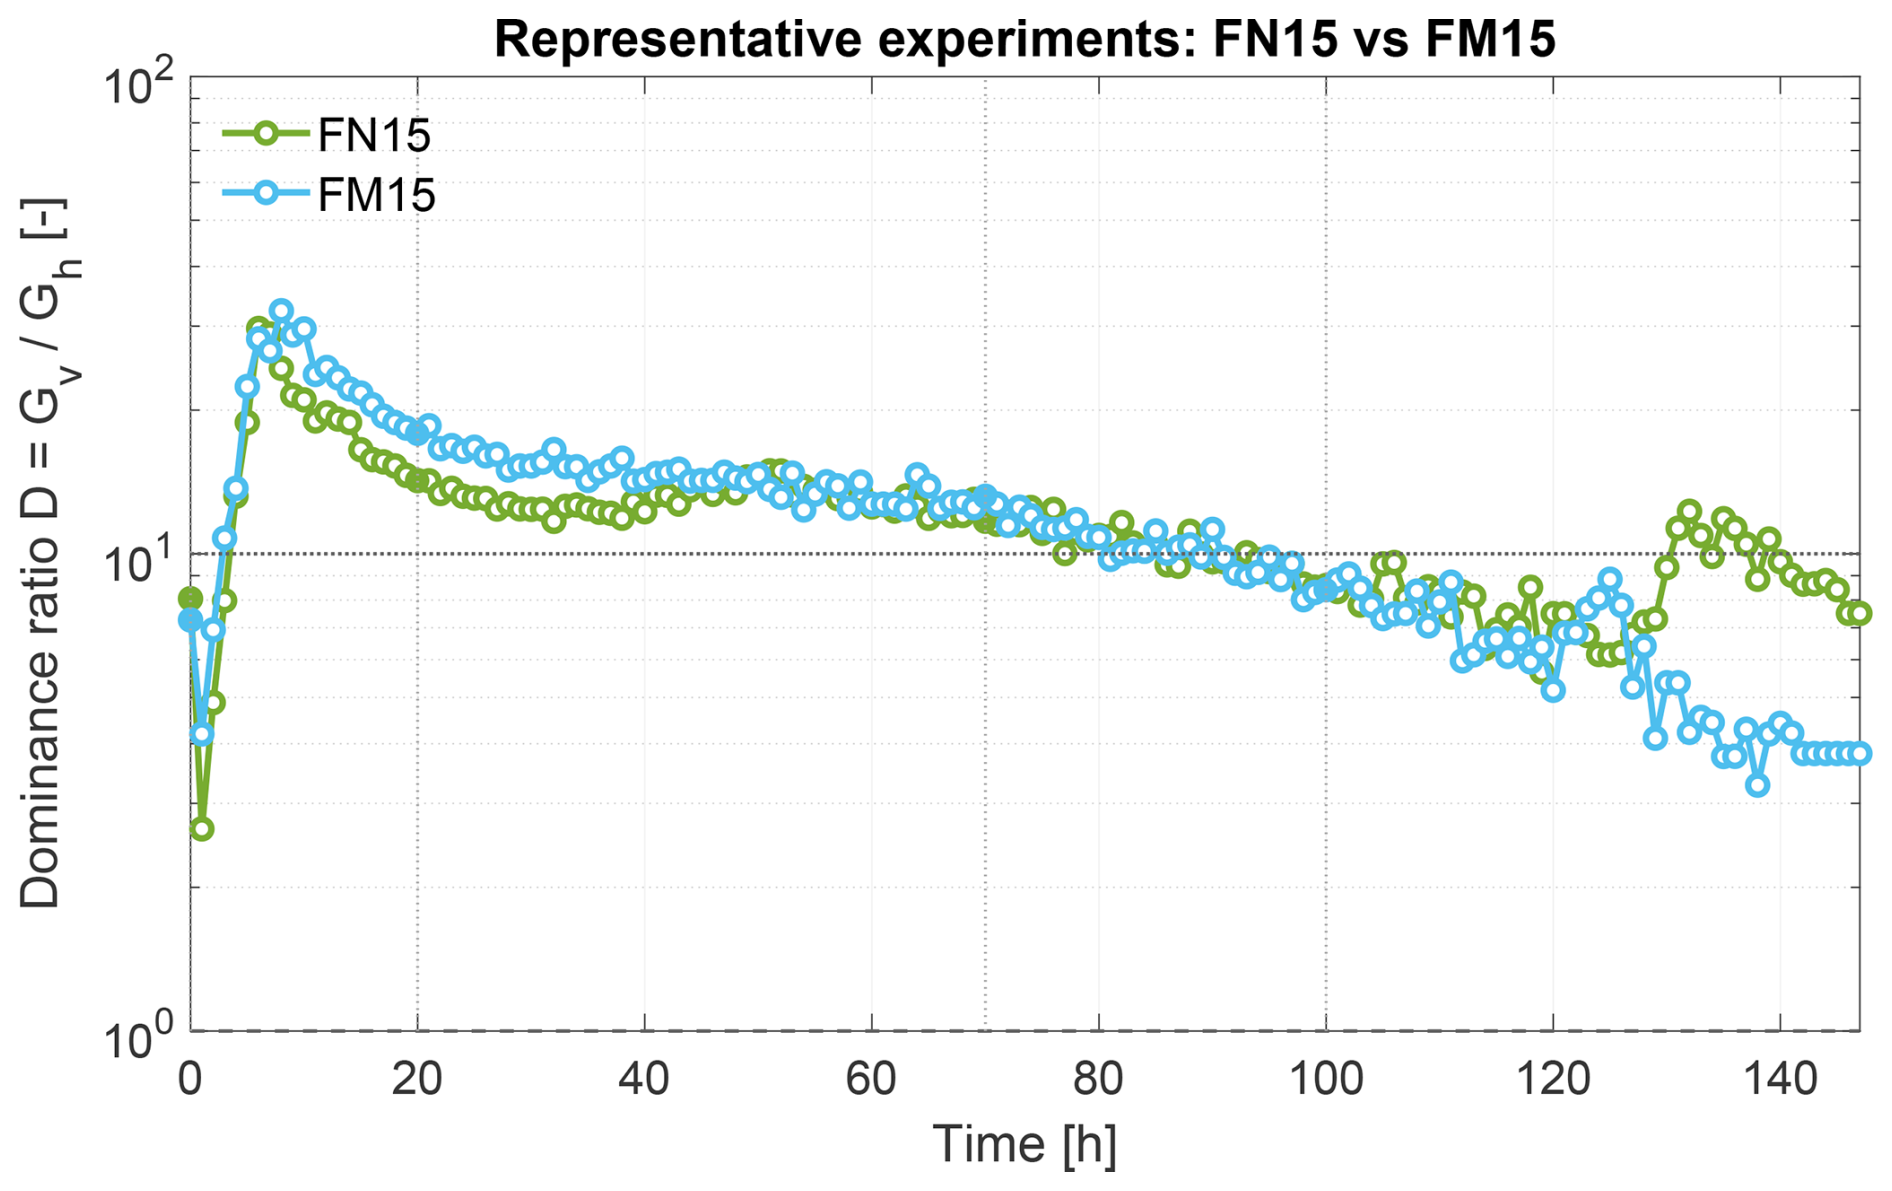
Figure F1Temporal evolution of the gradient dominance factor for two representative experiments.
Figure G1 shows vertical profiles of temperature and volumetric water content (VWC) for the representative experiments FN15 (no macropores) and FM15 (macropore network). Coloured lines represent measurements from the individual AquaCheck probes (S1–S10), while the black line indicates the mean profile across all probes.
These experiments were selected as representative examples illustrating the spatial variability between probes during the freezing phase. It should be noted that these were not the experiments with the most variability. Equivalent plots for the remaining experiments are omitted for brevity. The horizontal positions of the AquaCheck probes are given as (x,y) coordinates with reference to Fig. B1. The probes are located at: S1 (25 cm, 20 cm), S2 (25 cm, 52 cm), S3 (50 cm, 20 cm), S4 (50 cm, 52 cm), etc. Odd-numbered probes (S1, S3, …) contain sensors measuring at depths from 5–75 cm, whereas even-numbered probes (S2, S4, …) contain sensors measuring from 10–80 cm.
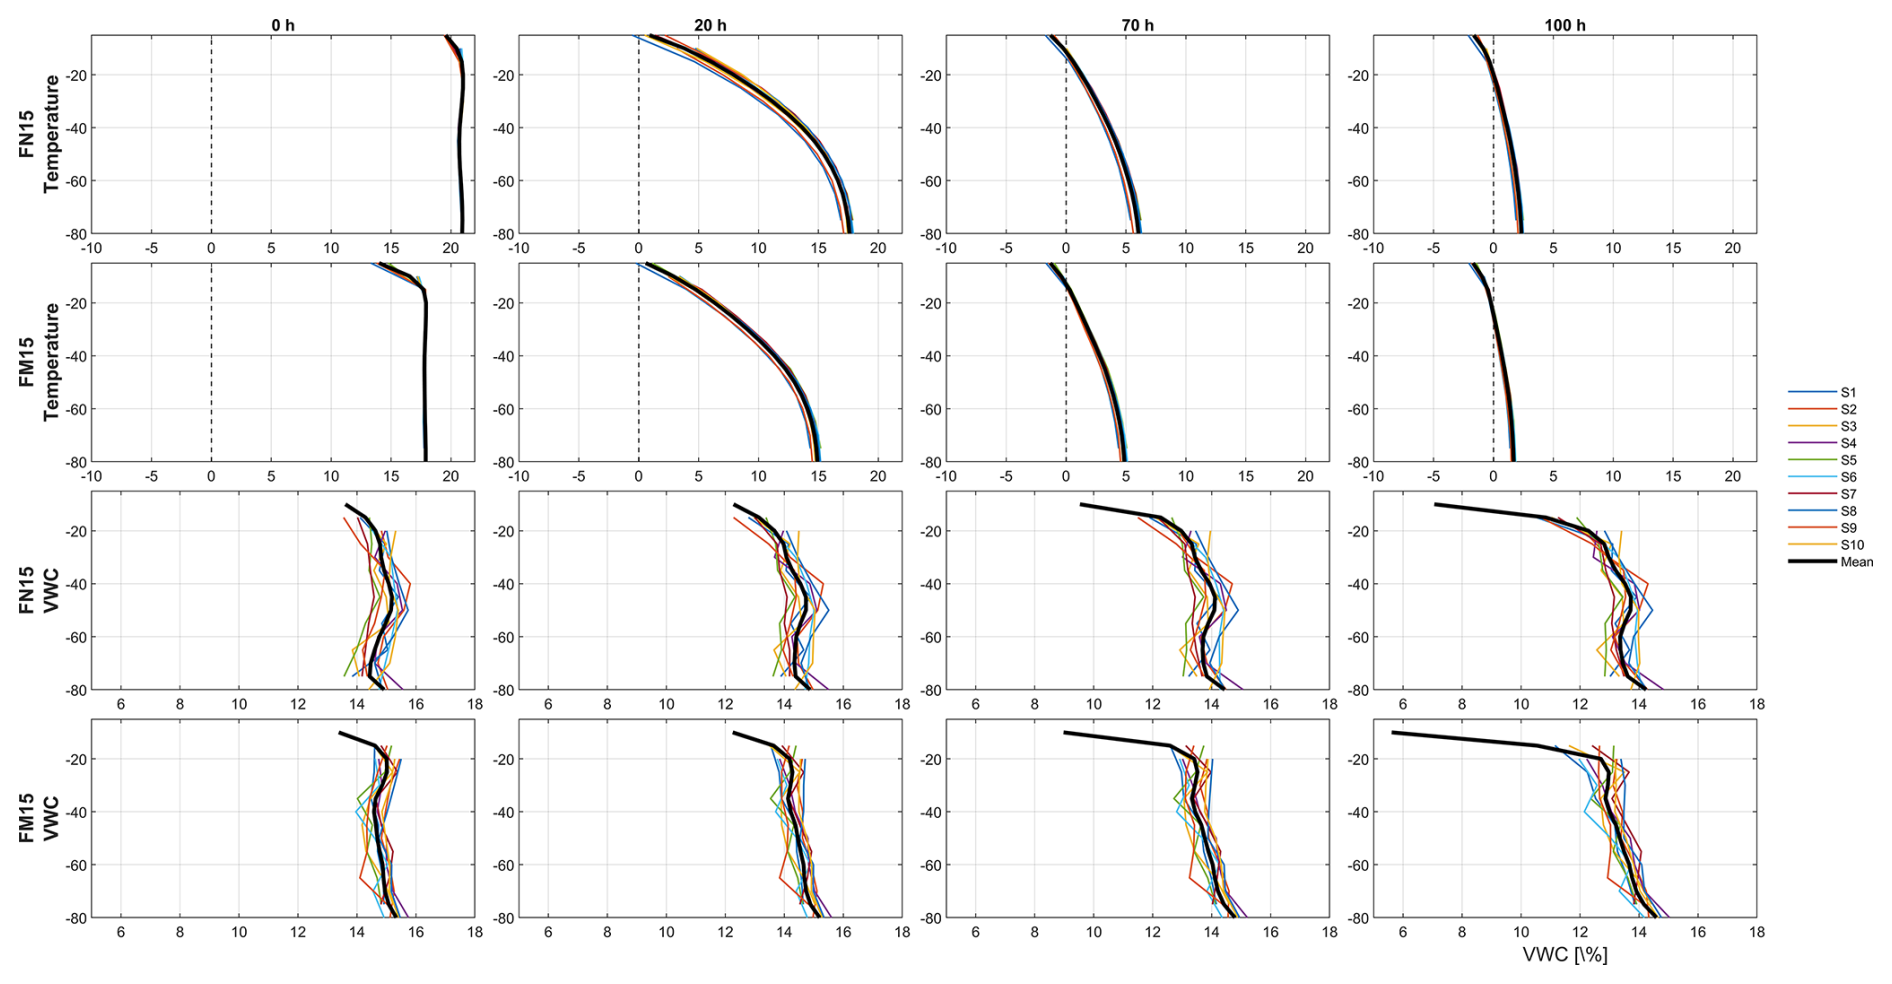
Figure G1Vertical profiles of temperature and volumetric water content (VWC) for experiments FN15 and FM15 at selected times (0, 20, 70, and 100 h). Coloured lines represent measurements from the individual AquaCheck probes (S1–S10), while the black line indicates the mean profile across all probes. The profiles illustrate the spatial variability between sensors during the different stages of the experiment.
Figure H1 shows the temporal evolution of inflow, surface runoff, and drainage outflow for experiments FM15 and FM16. To highlight the temporal shift in flow partitioning, the y axis range is restricted. During experiment FM15, drainage briefly reached approximately 1.5 L min−1 for about two minutes, likely reflecting a short-lived release stored in the drainage layer. Because this peak was very brief relative to the full experiment duration, it is not shown in the plotted axis range in Fig. H1. Note that this short transient drainage peak in FM15 lies outside the plotted axis range. After this peak, drainage rapidly declined to lower and more stable values. In contrast, FM16 exhibited a more gradual increase in drainage outflow followed by stabilisation at lower rates.
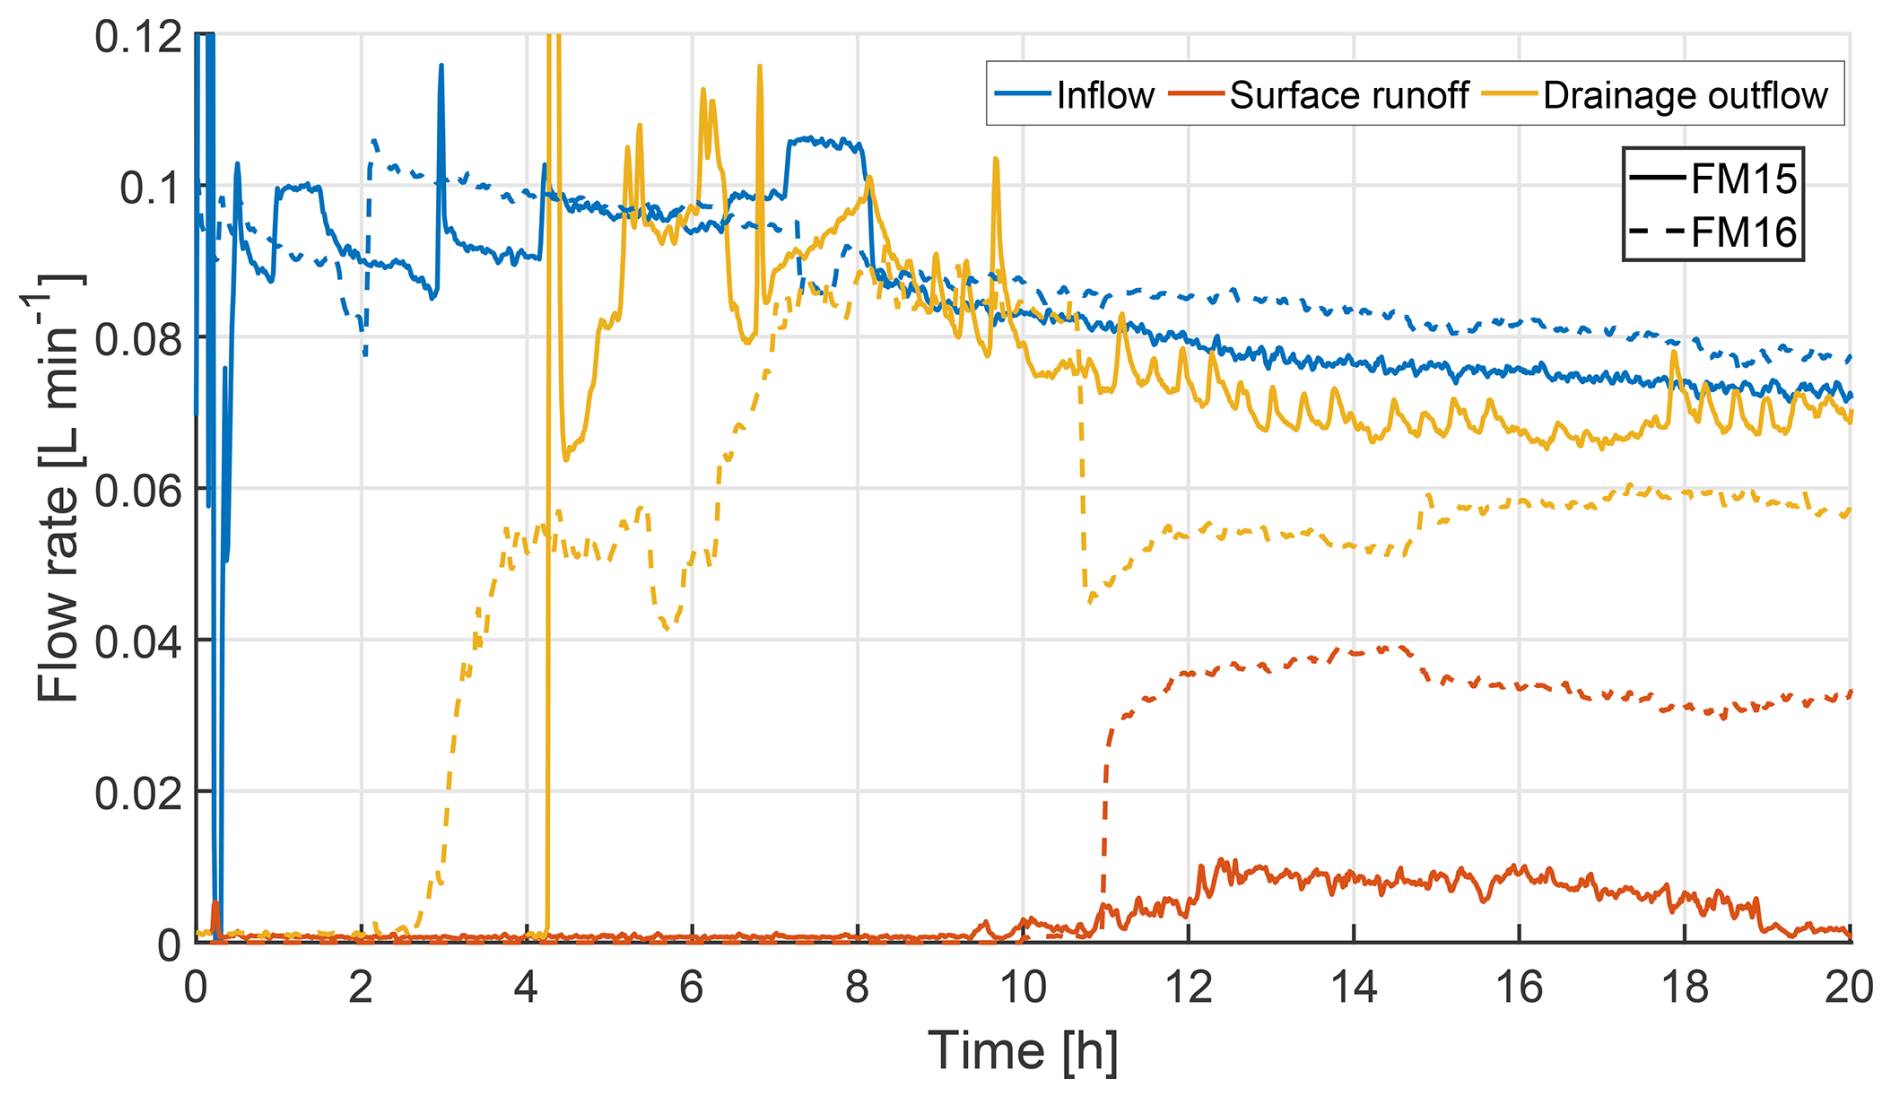
Figure H1Temporal evolution of inflow, surface runoff, and drainage outflow for experiments FM15 and FM16.
All experimental data used in this study are available at the Open Data repository of the Universität der Bundeswehr München. The dataset is published under the following DOI: https://doi.org/10.60776/MSLOMM (Bauer et al., 2025).
The dataset includes all raw and processed measurements of temperature, volumetric water content, inflow, drainage, and surface runoff, as well as sensor calibration files and experiment metadata. If additional information or derived data are required, please contact the corresponding author.
JB – Conceptualization, Methodology, Investigation, Data curation, Formal analysis, Visualization, Writing – original draft preparation; SM – Methodology, Technical design, Writing – review and editing; IB – Conceptualization, Methodology, Supervision, Project administration, Technical design, Writing – review and editing; TH – Conceptualization, Methodology, Writing – review and editing; HK – Writing – review and editing.
The contact author has declared that none of the authors has any competing interests.
Publisher's note: Copernicus Publications remains neutral with regard to jurisdictional claims made in the text, published maps, institutional affiliations, or any other geographical representation in this paper. The authors bear the ultimate responsibility for providing appropriate place names. Views expressed in the text are those of the authors and do not necessarily reflect the views of the publisher.
The authors gratefully acknowledge the technical staff and laboratory assistants of the Institute for Hydroscience at the Universität der Bundeswehr München for their continuous support during the construction, maintenance, and repeated modifications of the experimental setup. Their expertise and commitment were essential for the successful completion of the large-scale experiments. We further thank all colleagues who assisted in preparing and running the experiments.
This research has been supported by the Deutsche Forschungsgemeinschaft (DFG) (project no. 518478532).
This paper was edited by Mahya Roustaei and reviewed by Mehdi Pouragha and one anonymous referee.
Ala-Aho, P., Autio, A., Bhattacharjee, J., Isokangas, E., Kujala, K., Marttila, H., Menberu, M., Meriö, L.-J., Postila, H., Rauhala, A., Ronkanen, A.-K., Rossi, P. M., Saari, M., Haghighi, A. T., and Kløve, B.: What conditions favor the influence of seasonally frozen ground on hydrological partitioning? A systematic review, Environ. Res. Lett., 16, 043008, https://doi.org/10.1088/1748-9326/abe82c, 2021. a, b
Arnold, J. G., Srinivasan, R., Muttiah, R. S., and Williams, J. R.: Large Area Hydrologic Modeling and Assessment Part I: Model Development, J. Am. Water Resour. As., 34, 73–89, https://doi.org/10.1111/j.1752-1688.1998.tb05961.x, 1998. a
Aşkın, T. and Özdemir, N.: Soil bulk density related to soil particle size distribution and organic matter content, Agriculture, 9, 52–55, 2003. a
Bardou, E. and Delaloye, R.: Effects of ground freezing and snow avalanche deposits on debris flows in alpine environments, Nat. Hazards Earth Syst. Sci., 4, 519–530, https://doi.org/10.5194/nhess-4-519-2004, 2004. a
Baselt, I. and Heinze, T.: Rain, Snow and Frozen Soil: Open Questions from a Porescale Perspective with Implications for Geohazards, Geosci. J., 11, 375, https://doi.org/10.3390/geosciences11090375, 2021. a, b, c
Bauer, J.: RainFrozenSlope: Experimental Dataset on Thermo-Hydraulic Water Infiltration into Frozen Slopes with Macropores (Version 1.1), Open Data UniBw M [data set], https://doi.org/10.60776/MSLOMM, 2025. a
Baum, R. L., Savage, W. Z., and Godt, J. W.: TRIGRS: A Fortran Program for Transient Rainfall Infiltration and Grid-Based Regional Slope-Stability Analysis, Version 2.0, Open-File Report 2008-1159, U.S. Geological Survey, https://doi.org/10.3133/ofr20081159, revised 20 October 2009, 2008. a
Bednar-Friedl, B., Biesbroek, R., Schmidt, D. N., Alexander, P., Børsheim, K. Y., Carnicer, J., Georgopoulou, E., Haasnoot, M., Le Cozannet, G., Lionello, P., Lipka, O., Möllmann, C., Muccione, V., Mustonen, T., Piepenburg, D., and Whitmarsh, L.: Europe, in: Climate Change 2022: Impacts, Adaptation and Vulnerability. Contribution of Working Group II to the Sixth Assessment Report of the Intergovernmental Panel on Climate Change, edited by: Pörtner, H.-O., Roberts, D. C., Tignor, M., Poloczanska, E. S., Mintenbeck, K., Alegría, A., Craig, M., Langsdorf, S., Löschke, S., Möller, V., Okem, A., and Rama, B., Cambridge University Press, Cambridge, UK and New York, NY, USA, 1817–1927, https://doi.org/10.1017/9781009325844.015, 2022. a
Beniston, M., Farinotti, D., Stoffel, M., Andreassen, L. M., Coppola, E., Eckert, N., Fantini, A., Giacona, F., Hauck, C., Huss, M., Huwald, H., Lehning, M., López-Moreno, J.-I., Magnusson, J., Marty, C., Morán-Tejéda, E., Morin, S., Naaim, M., Provenzale, A., Rabatel, A., Six, D., Stötter, J., Strasser, U., Terzago, S., and Vincent, C.: The European mountain cryosphere: a review of its current state, trends, and future challenges, The Cryosphere, 12, 759–794, https://doi.org/10.5194/tc-12-759-2018, 2018. a, b
Beven, K. and Germann, P.: Macropores and water flow in soils revisited, Water Resour. Res., 49, 3071–3092, https://doi.org/10.1002/wrcr.20156, 2013. a, b
Bittelli, M., Campbell, G. S., and Evett, S. R.: Noncolinear and Colinear Dielectric Mixing Models for Estimating Water Content in Aggregated Soils, Soil Sci. Soc. Am. J., 67, 1456–1461, 2003. a
Burt, T. P. and Williams, P. J.: Hydraulic conductivity in frozen soils, Earth Surf. Processes, 1, 349–360, https://doi.org/10.1002/esp.3290010404, 1976. a
Byrne, M. P., Boos, W. R., and Hu, S.: Elevation-dependent warming: observations, models, and energetic mechanisms, Weather Clim. Dynam., 5, 763–777, https://doi.org/10.5194/wcd-5-763-2024, 2024. a
Copernicus Climate Change Service (C3S): Global Climate Highlights 2024, https://climate.copernicus.eu/global-climate-highlights-2024, last access: 13 May 2025. a
Covino, T.: Hydrologic connectivity as a framework for understanding biogeochemical flux through watersheds and along fluvial networks, Geomorphology, 277, 133–144, https://doi.org/10.1016/j.geomorph.2016.09.030, 2017. a
Demand, D., Selker, J. S., and Weiler, M.: Influences of Macropores on Infiltration into Seasonally Frozen Soil, Vadose Zone J., 18, 180147, https://doi.org/10.2136/vzj2018.08.0147, 2019. a, b, c, d, e, f
Dingman, S. L.: Hydrologic Effects of Frozen Ground: Literature Review and Synthesis, Special Report 218, U.S. Army Cold Regions Research and Engineering Laboratory, Hanover, NH, https://hdl.handle.net/11681/11739 (last access: 12 June 2026), 1975. a
Dunne, T. and Black, R. D.: Runoff Processes during Snowmelt, Water Resour. Res., 7, 1160–1172, https://doi.org/10.1029/WR007i005p01160, 1971. a
Endrizzi, S., Gruber, S., Dall'Amico, M., and Rigon, R.: GEOtop 2.0: simulating the combined energy and water balance at and below the land surface accounting for soil freezing, snow cover and terrain effects, Geosci. Model Dev., 7, 2831–2857, https://doi.org/10.5194/gmd-7-2831-2014, 2014. a
Fang, Y., Du, X., Ye, X., and Wang, E.: Groundwater Response to Snowmelt Infiltration in Seasonal Frozen Soil Areas: Site Monitoring and Numerical Simulation, J. Hydrol., 11, 201, https://doi.org/10.3390/hydrology11120201, 2024. a
Fuentes-Franco, R., Docquier, D., Koenigk, T., Zimmermann, K., and Giorgi, F.: Winter heavy precipitation events over Northern Europe modulated by a weaker NAO variability by the end of the 21st century, npj Clim. Atmos. Sci., 6, 72, https://doi.org/10.1038/s41612-023-00396-1, 2023. a
Grant, K. N., Macrae, M. L., Rezanezhad, F., and Lam, W. V.: Nutrient Leaching in Soil Affected by Fertilizer Application and Frozen Ground, Vadose Zone J., 18, 180150, https://doi.org/10.2136/vzj2018.08.0150, 2019. a, b
Grenier, C., Anbergen, H., Bense, V., Chanzy, A., Coon, E., Collier, N., Costard, F., Ferry, M., Frampton, A., Frederick, J., Holmén, J., Jost, A., Kokh, S., Kurylyk, B. L., McKenzie, J., Molson, J., Mouche, E., Orgogozo, L., Pannetier, R., Rivière, A., Roux, N., Rühaak, W., Scheidegger, J., Selroos, J.-O., Therrien, R., Vidstrand, P., and Voss, C. I.: Groundwater flow and heat transport for systems undergoing freeze-thaw: Intercomparison of numerical simulators for 2D test cases, Adv. Water Resour., 114, 196–218, https://doi.org/10.1016/j.advwatres.2018.02.001, 2018. a, b
Hansson, K., Šimůnek, J., Mizoguchi, M., Lundin, L.-C., and van Genuchten, M. T.: Water Flow and Heat Transport in Frozen Soil: Numerical Solution and Freeze–Thaw Applications, Vadose Zone J., 3, 693–704, https://doi.org/10.2136/vzj2004.0693, 2004. a, b, c
Hartge, K.-H., Horn, R., Bachmann, J., and Peth, S.: Einführung in die Bodenphysik, 4th edn., Schweizerbart'sche Verlagsbuchhandlung, Stuttgart, ISBN: 9783510652808, 2014. a, b, c
Heinze, T.: A Multi-Phase Heat Transfer Model for Water Infiltration Into Frozen Soil, Water Resour. Res., 57, e2021WR030067, https://doi.org/10.1029/2021WR030067, 2021. a, b
Heinze, T. and Blöcher, J. R.: A model of local thermal non-equilibrium during infiltration, Adv. Water Resour., 132, 103394, https://doi.org/10.1016/j.advwatres.2019.103394, 2019. a, b
Holten, R., Larsbo, M., Jarvis, N., Stenrød, M., Almvik, M., and Eklo, O. M.: Leaching of Five Pesticides of Contrasting Mobility through Frozen and Unfrozen Soil, Vadose Zone J., 18, 180201, https://doi.org/10.2136/vzj2018.11.0201, 2019. a, b
Hölting, B. and Coldewey, W. G.: Hydrogeologie: Einführung in die Allgemeine und Angewandte Hydrogeologie, Springer Spektrum, Berlin, Heidelberg, 8th Edn., ISBN 9783827423542, 2019. a
Hyman-Rabeler, K. A. and Loheide, S. P.: Drivers of Variation in Winter and Spring Groundwater Recharge: Impacts of Midwinter Melt Events and Subsequent Freezeback, Water Resour. Res., 59, e2022WR032733, https://doi.org/10.1029/2022WR032733, 2023. a
Ireson, A. M., van der Kamp, G., Ferguson, G., Nachshon, U., and Wheater, H. S.: Hydrogeological processes in seasonally frozen northern latitudes: understanding, gaps and challenges, Hydrogeol. J., 21, 53–66, https://doi.org/10.1007/s10040-012-0916-5, 2013. a
Iverson, R. M.: The physics of debris flows, Rev. Geophys., 35, 245–296, https://doi.org/10.1029/97RG00426, 1997. a
Jarvis, N. J.: A review of non-equilibrium water flow and solute transport in soil macropores: principles, controlling factors and consequences for water quality, Eur. J. Soil Sci., 58, 523–546, https://doi.org/10.1111/j.1365-2389.2007.00915.x, 2007. a
Johnsson, H. and Lundin, L.-C.: Surface runoff and soil water percolation as affected by snow and soil frost, J. Hydrol., 122, 141–159, https://doi.org/10.1016/0022-1694(91)90177-J, 1991. a
Kane, D. L. and Stein, J.: Water movement into seasonally frozen soils, Water Resour. Res., 19, 1547–1557, https://doi.org/10.1029/WR019i006p01547, 1983. a
Khanahmadi, H., Bauer, J., Baselt, I., and Heinze, T.: The influence of macropores on the thermal state of soil during infiltration in the absence of thermal equilibrium, J. Hydrol., 668, 134983, https://doi.org/10.1016/j.jhydrol.2026.134983, 2026. a
Kotlarski, S., Gobiet, A., Morin, S., Olefs, M., Rajczak, J., and Samacoïts, R.: 21st Century alpine climate change, Clim. Dynam., 60, 65–86, https://doi.org/10.1007/s00382-022-06303-3, published online 10 May 2022, 2023. a
Kurylyk, B. L. and Hayashi, M.: Improved Stefan equation correction factors to accommodate sensible heat storage during soil freezing or thawing, Permafrost Periglac., 27, 189–203, https://doi.org/10.1002/ppp.1865, 2016. a
Kurylyk, B. L., McKenzie, J. M., MacQuarrie, K. T. B., and Voss, C. I.: Analytical solutions for benchmarking cold regions subsurface water flow and energy transport models: One-dimensional soil thaw with conduction and advection, Adv. Water Resour., 70, 172–184, https://doi.org/10.1016/j.advwatres.2014.05.005, 2014. a
Larsbo, M., Holten, R., Stenrød, M., Eklo, O. M., and Jarvis, N.: A Dual-Permeability Approach for Modeling Soil Water Flow and Heat Transport during Freezing and Thawing, Vadose Zone J., 18, 190012, https://doi.org/10.2136/vzj2019.01.0012, 2019. a, b, c, d
Li, L., Li, X., Li, Y., Li, C., Li, Y., Wang, L., He, Y., and Yao, C.: An Analysis of Vertical Infiltration Responses in Unsaturated Soil Columns from Permafrost Regions, Appl. Sci.-Basel, 14, 10195, https://doi.org/10.3390/app142210195, 2024. a
Lundberg, A., Ala-Aho, P., Eklo, O. M., Klöve, B., Kværner, J., and Stumpp, C.: Snow and frost: implications for spatiotemporal infiltration patterns: a review, Hydrol. Process., 30, 1230–1250, https://doi.org/10.1002/hyp.10703, 2016. a
Mergili, M., Marchesini, I., Rossi, M., Guzzetti, F., and Fellin, W.: Spatially distributed three-dimensional slope stability modelling in a raster GIS, Geomorphology, 206, 178–195, https://doi.org/10.1016/j.geomorph.2013.10.008, 2014. a
Mohammed, A. A., Kurylyk, B. L., Cey, E. E., and Hayashi, M.: Snowmelt Infiltration and Macropore Flow in Frozen Soils: Overview, Knowledge Gaps, and a Conceptual Framework, Vadose Zone J., 17, 180084, https://doi.org/10.2136/vzj2018.04.0084, 2018. a, b, c, d
Mohammed, A. A., Pavlovskii, I., Cey, E. E., and Hayashi, M.: Effects of preferential flow on snowmelt partitioning and groundwater recharge in frozen soils, Hydrol. Earth Syst. Sci., 23, 5017–5031, https://doi.org/10.5194/hess-23-5017-2019, 2019. a, b, c
Mohammed, A. A., Cey, E. E., Hayashi, M., and Callaghan, M. V.: Simulating preferential flow and snowmelt partitioning in seasonally frozen hillslopes, Hydrol. Process., 35, e14277, https://doi.org/10.1002/hyp.14277, 2021a. a
Mohammed, A. A., Cey, E. E., Hayashi, M., Callaghan, M. V., Park, Y.-J., Miller, K. L., and Frey, S. K.: Dual-permeability modeling of preferential flow and snowmelt partitioning in frozen soils, Vadose Zone J., 20, e20101, https://doi.org/10.1002/vzj2.20101, 2021b. a
Nagare, R. M., Schincariol, R. A., Quinton, W. L., and Hayashi, M.: Effects of freezing on soil temperature, freezing front propagation and moisture redistribution in peat: laboratory investigations, Hydrol. Earth Syst. Sci., 16, 501–515, https://doi.org/10.5194/hess-16-501-2012, 2012. a
Pittman, F., Mohammed, A., and Cey, E.: Effects of antecedent moisture and macroporosity on infiltration and water flow in frozen soil, Hydrol. Process., 34, 795–809, https://doi.org/10.1002/hyp.13629, 2020. a, b, c
Poesen, J. and Lavee, H.: Rock fragments in top soils: significance and processes, CATENA, 23, 1–28, https://doi.org/10.1016/0341-8162(94)90050-7, 1994. a
Ranasinghe, R., Ruane, A. C., Vautard, R., Arnell, N., Coppola, E., Cruz, F. A., Dessai, S., Islam, A. S., Rahimi, M., Ruiz Carrascal, D., Sillmann, J., Sylla, M. B., Tebaldi, C., Wang, W., and Zaaboul, R.: Climate Change Information for Regional Impact and for Risk Assessment: Supplementary Material, in: Climate Change 2021: The Physical Science Basis. Contribution of Working Group I to the Sixth Assessment Report of the Intergovernmental Panel on Climate Change, edited by Masson-Delmotte, V., Zhai, P., Pirani, A., Connors, S. L., Péan, C., Berger, S., Caud, N., Chen, Y., Goldfarb, L., Gomis, M. I., Huang, M., Leitzell, K., Lonnoy, E., Matthews, J. B. R., Maycock, T. K., Waterfield, T., Yelekçi, O., Yu, R., and Zhou, B., Cambridge University Press, https://www.ipcc.ch/ (last access: 12 June 2026), https://doi.org/10.1017/9781009157896.014, 2021. a, b
Roth, K. and Boike, J.: Quantifying the thermal dynamics of a permafrost site near Ny-Ålesund, Svalbard, Water Resour. Res., 37, 2901–2914, https://doi.org/10.1029/2000WR000163, 2001. a, b, c
Roth, K., Schulin, R., Flühler, H., and Attinger, W.: Calibration of time domain reflectometry for water content measurement using a composite dielectric approach, Water Resour. Res., 26, 2267–2273, https://doi.org/10.1029/WR026i010p02267, 1990. a, b, c
Sanchez-Rodriguez, I., Ireson, A., Brannen, R., and Brauner, H.: Insights into freeze–thaw and infiltration in seasonally frozen soils from field observations, Vadose Zone J., 24, e20396, https://doi.org/10.1002/vzj2.20396, 2025. a, b, c
Schulla, J.: Model Description WaSiM (Water balance Simulation Model), Tech. rep., Hydrology Software Consulting, Zürich, Switzerland, version 9.08, https://www.wasim.ch/en/products/wasim_description.htm (last access: 12 June 2026), 2012. a
Seyfried, M. S. and Murdock, M. D.: Calibration of Time Domain Reflectometry for Measurement of Liquid Water in Frozen Soils, Soil Sci., 161, 87–98, 1996. a
Šimůnek, J., van Genuchten, M. T., and Šejna, M.: Recent Developments and Applications of the HYDRUS Computer Software Packages, Vadose Zone J., 15, vzj2016.04.0033, https://doi.org/10.2136/vzj2016.04.0033, 2016. a
Stadler, D., Stähli, M., Aeby, P., and Flühler, H.: Dye Tracing and Image Analysis for Quantifying Water Infiltration into Frozen Soils, Soil Sci. Soc. Am. J., 64, 505–516, https://doi.org/10.2136/sssaj2000.642505x, 2000. a
Stähli, M., Jansson, P.-E., and Lundin, L.-C.: Preferential water flow in a frozen soil: a two-domain model approach, Hydrol. Process., 10, 1305–1316, https://doi.org/10.1002/(SICI)1099-1085(199610)10:10<1305::AID-HYP462>3.0.CO;2-F, 1996. a, b
Stähli, M., Jansson, P.-E., and Lundin, L.-C.: Soil moisture redistribution and infiltration in frozen sandy soils, Water Resour. Res., 35, 95–103, https://doi.org/10.1029/1998WR900045, 1999. a
Stähli, M., Bayard, D., Wydler, H., and Flühler, H.: Snowmelt Infiltration into Alpine Soils Visualized by Dye Tracer Technique, Arct. Antarct. Alp. Res., 36, 128–135, https://doi.org/10.1657/1523-0430(2004)036[0128:SIIASV]2.0.CO;2, 2004. a, b, c
Stuurop, J. C., van der Zee, S. E. A. T. M., and French, H. K.: The influence of soil texture and environmental conditions on frozen soil infiltration: A numerical investigation, Cold Reg. Sci. Technol., 194, 103456, https://doi.org/10.1016/j.coldregions.2021.103456, 2022. a
Topp, G. C., Davis, J. L., and Annan, A. P.: Electromagnetic determination of soil water content: Measurements in coaxial transmission lines, Water Resour. Res., 16, 574–582, https://doi.org/10.1029/WR016i003p00574, 1980. a
Wang, Q., Fan, X., and Wang, M.: Recent warming amplification over high elevation regions across the globe, Clim. Dynam., 43, 87–101, https://doi.org/10.1007/s00382-013-1889-3, 2014. a
Watanabe, K. and Kugisaki, Y.: Effect of macropores on soil freezing and thawing with infiltration, Hydrol. Process., 31, 270–278, https://doi.org/10.1002/hyp.10939, 2017. a, b, c, d, e, f, g, h, i
Watanabe, K., Mizoguchi, M., Ito, Y., Miyazaki, Y., and Ito, M.: Water and heat dynamics in frozen soil of a boreal forest, Vadose Zone J., 8, 103–109, https://doi.org/10.2136/vzj2008.0040, 2009. a, b, c
Webb, R. W., Fassnacht, S. R., and Gooseff, M. N.: Hydrologic flow path development varies by aspect during spring snowmelt in complex subalpine terrain, The Cryosphere, 12, 287–300, https://doi.org/10.5194/tc-12-287-2018, 2018. a, b
Weigert, A. and Schmidt, J.: Water transport under winter conditions, CATENA, 64, 193–208, https://doi.org/10.1016/j.catena.2005.08.009, 2005. a
Zeng, X.-M., Berdugo, M., Saez-Sandino, T., Tao, D., Ren, T., Zhou, G., Liu, Y.-R., Terrer, C., Reich, P. B., and Delgado-Baquerizo, M.: Temperature thresholds induce abrupt shifts in biodiversity and ecosystem services in montane ecosystems worldwide, P. Natl. Acad. Sci. USA, 122, e2413981122, https://doi.org/10.1073/pnas.2413981122, 2025. a
Zhao, Y., Zheng, C., Gelfan, A., Watanabe, K., Liu, H., Wright, S., Wu, X., Quinton, W., Wang, Y., Yi, S., Zhang, Y., Shi, Y., and Jiao, W.: Frozen Soil Hydrol. Process. and Their Effects: A Review and Synthesis, Rev. Geophys., 64, e2024RG000839, https://doi.org/10.1029/2024RG000839, 2026. a
- Abstract
- Introduction
- Methods
- Results
- Discussion
- Conclusions
- Appendix A: Macropore network geometry
- Appendix B: Sensor positioning and layout
- Appendix C: Sensor calibration and validation
- Appendix D: Soil specifics
- Appendix E: Air temperature control during the freezing phase
- Appendix F: Assessment of vertical versus lateral temperature gradients
- Appendix G: Individual AquaCheck probe profiles for representative experiments
- Appendix H: Temporal fluxes of flow measurements
- Data availability
- Author contributions
- Competing interests
- Disclaimer
- Acknowledgements
- Financial support
- Review statement
- References