the Creative Commons Attribution 4.0 License.
the Creative Commons Attribution 4.0 License.
 | 26 May 2026
Improved workflow for customized ICESat-2 ATL06 elevations captures seasonal mountain snow depths at sub-kilometer scale
Karina Zikan
Ellyn M. Enderlin
Hans-Peter Marshall
Shad O'Neel
Mountain snowpacks are a critical global water resource, providing freshwater to more than a billion people worldwide. Estimates of snow distribution across mountain watersheds are dependent on sparse in situ observations and spatio-temporally limited aerial surveys. Models expand snow depth estimation coverage, but are also limited by the amount of snow depth measurements available for data assimilation. Satellite remote sensing provides larger spatial and temporal coverage of observations. Recent studies have shown that NASA's ICESat-2 satellite can resolve a mountain snow signal by comparing snow covered ICESat-2 returns to an independently collected snow-free digital terrain model (DTM). However, ICESat-2 snow depth uncertainties are estimated to be approximately on the order of snow depths in mountainous terrain, limiting their use. In this study we present a refined methodology for calculating ICESat-2 snow depth to minimize uncertainty in mountain environments and identify terrain with the most potential for ICESat-2 observation. We calculate snow depth by differencing a customized ICESat-2 product (ATL06_SR) and 1 m resolution DTMs of four mountainous sites in central and southern Idaho. Accuracy of ICESat-2 snow depths is assessed at 100–5000 m scales through comparison with in situ automatic weather station (AWS) data and six airborne lidar snow depth surveys. By co-registering to minimize geolocation errors, correcting for slope-related biases, and filtering negative snow depth observations, we find ICESat-2 snow depth uncertainties as low as 0.21 m and R2 correlation as high as 0.92 when compared to in situ observations. The median ICESat-2 snow depth over 100–1000 m lengths accurately captures seasonal snow depth variability and spatial patterns in snow distribution, including elevation-controlled orographic patterns. ICESat-2 snow depths are most accurate in regions where the majority of the terrain has slopes < 20° and typical winter snow depths > 0.5 m. Over 50 % of Idaho's snow-covered area within this moderate slope, deep snowpack range and other mountain regions likely have sizable portions that meet these criteria. Thus by using available high-resolution snow-free DTMs, ICESat-2 applications can be dramatically expanded to provide valuable snow depth timeseries for observation or data assimilation.
- Article
(7263 KB) - Full-text XML
- BibTeX
- EndNote


Mountain snowpacks, a key part of the global water towers, provide critical freshwater resources for over 1.9 billion people around the world (Barnett et al., 2005; Sturm et al., 2017; Immerzeel et al., 2020). Knowing the spatial and temporal distribution of snow mass is necessary to predict runoff and water availability in the melt season (Freudiger et al., 2017). Snow accumulation processes such as orographic precipitation and wind redistribution affect the spatial distribution of snow, creating potentially meters of snow depth variability at the slope scale (meters to hundreds of meters), mountain ridge scale (hundreds to thousands of meters), and mountain range scale (kilometers to thousands of kilometers) (Elder et al., 1991; Deems et al., 2006; Winstral and Marks, 2014; Mott et al., 2018). Given the high spatial variability of snow, the United States 2017–2027 Decadal Survey for Earth Science and Applications from Space calls for 1–4 km global snow water equivalent (SWE) resolution and ∼ 100 m SWE resolution in mountain regions to meet snow observation needs for water management (NASEM, 2018). Although SWE can be calculated from snow depth and density, neither SWE, snow depth, nor snow density observations are available at the called for scale and resolutions. Remote sensing is needed to meet global snow observation needs and will require integration of many remote sensing techniques with models and ground observations (Dozier et al., 2016; Durand et al., 2021).
In this paper, we calculate snow depth measurements from NASA's Ice, Cloud, and Land Elevation Satellite-2 (ICESat-2) – a satellite lidar system. Airborne and terrestrial lidar has been very successful in mapping snow depths with high spatial resolution (Hopkinson et al., 2004; Deems et al., 2013). Unlike other optical techniques, lidar can measure the ground surface under vegetation cover (Deems et al., 2013; Neuenschwander et al., 2020); but, like all optical approaches, lidar requires clear sky conditions. Terrestrial and airborne lidar are used to map snow depth at sub-meter resolutions over large geographic areas, however are still spatially and temporally limited by expense, logistics, and weather conditions (Deems et al., 2013). With repeat global orbits, satellite lidar can help address the need for accurate and widely distributed snow depth measurements.
Although ICESat-2 was not specifically designed for snow depth retrievals, ICESat-2 can resolve a snow signal and when used as a model constraint successfully improves estimated snow depths (Mazzolini et al., 2025). Two approaches for measuring snow depth with ICESat-2 have been developed: a comparative differencing method (Hu et al., 2022a; Enderlin et al., 2022; Deschamps-Berger et al., 2023; Besso et al., 2024; Chen et al., 2025; Fair et al., 2025); and a multiple scattering method (Hu et al., 2022b; Lu et al., 2022). In this paper we use the comparative differencing method, where snow depth is calculated by comparing snow-on elevations from an ICESat-2 product (e.g, ATL08 or ATL06) to an independent high-resolution snow-free digital terrain model (DTM). The comparative–difference method has been used for snow depth mapping with airborne lidar for decades (Deems et al., 2013); conceptually its application to ICESat-2 snow depth-mapping is the same but is complicated by ICESat-2 beam spreading, noisy photon returns, and resolution and scale differences between ICESat-2 and reference DTMs. Much of the mid-latitude snowpack covers mountain watersheds where steep terrain and dense vegetation complicate ICESat-2 elevation data, resulting in snow depth errors that can be on the same order as the snow depths themselves (Enderlin et al., 2022; Deschamps-Berger et al., 2023; Besso et al., 2024; Chen et al., 2025). Surface roughness and slope increase the spread of photon returns within the ICESat-2 beam footprint (Smith et al., 2019). ICESat-2 elevations and derived snow depths become less precise and increasingly negatively biased with increased slope (Smith et al., 2019; Enderlin et al., 2022; Deschamps-Berger et al., 2023; Chen et al., 2025). Additionally, if the ICESat-2 data and independently collected snow-free DTM are not properly aligned geospatially the resulting geolocation offset between the two datasets will introduce geolocation errors. The magnitude of these geolocation errors depends on the slope and aspect of the underlying terrain relative to the direction of the geolocation offset (Nuth and Kääb, 2011; Enderlin et al., 2022; Hugonnet et al., 2022). In order to effectively use ICESat-2 to estimate snow depths in the rugged regions that are the least constrained by observations but where the most snow accumulates there is a need to refine ICESat-2 snow depth retrievals to minimize the aforementioned errors.
Using data from four mountainous sites in central and southern Idaho (Fig. 1), we assess the accuracy of ICESat-2 snow depths at slope to mountain ridge scales through comparison with in situ weather station data and six airborne lidar snow depth surveys. Based on analysis of ICESat-2 snow depth uncertainties in variable terrain, we identify terrain and scales at which ICESat-2 snow depth measurements have the most potential. We present a workflow for calculating ICESat-2 snow depths that can be applied in shallow- to moderately- sloped terrain where a high resolution snow-free DTM is available expanding the utility of ICESat-2 for snow depth observations and data assimilation.
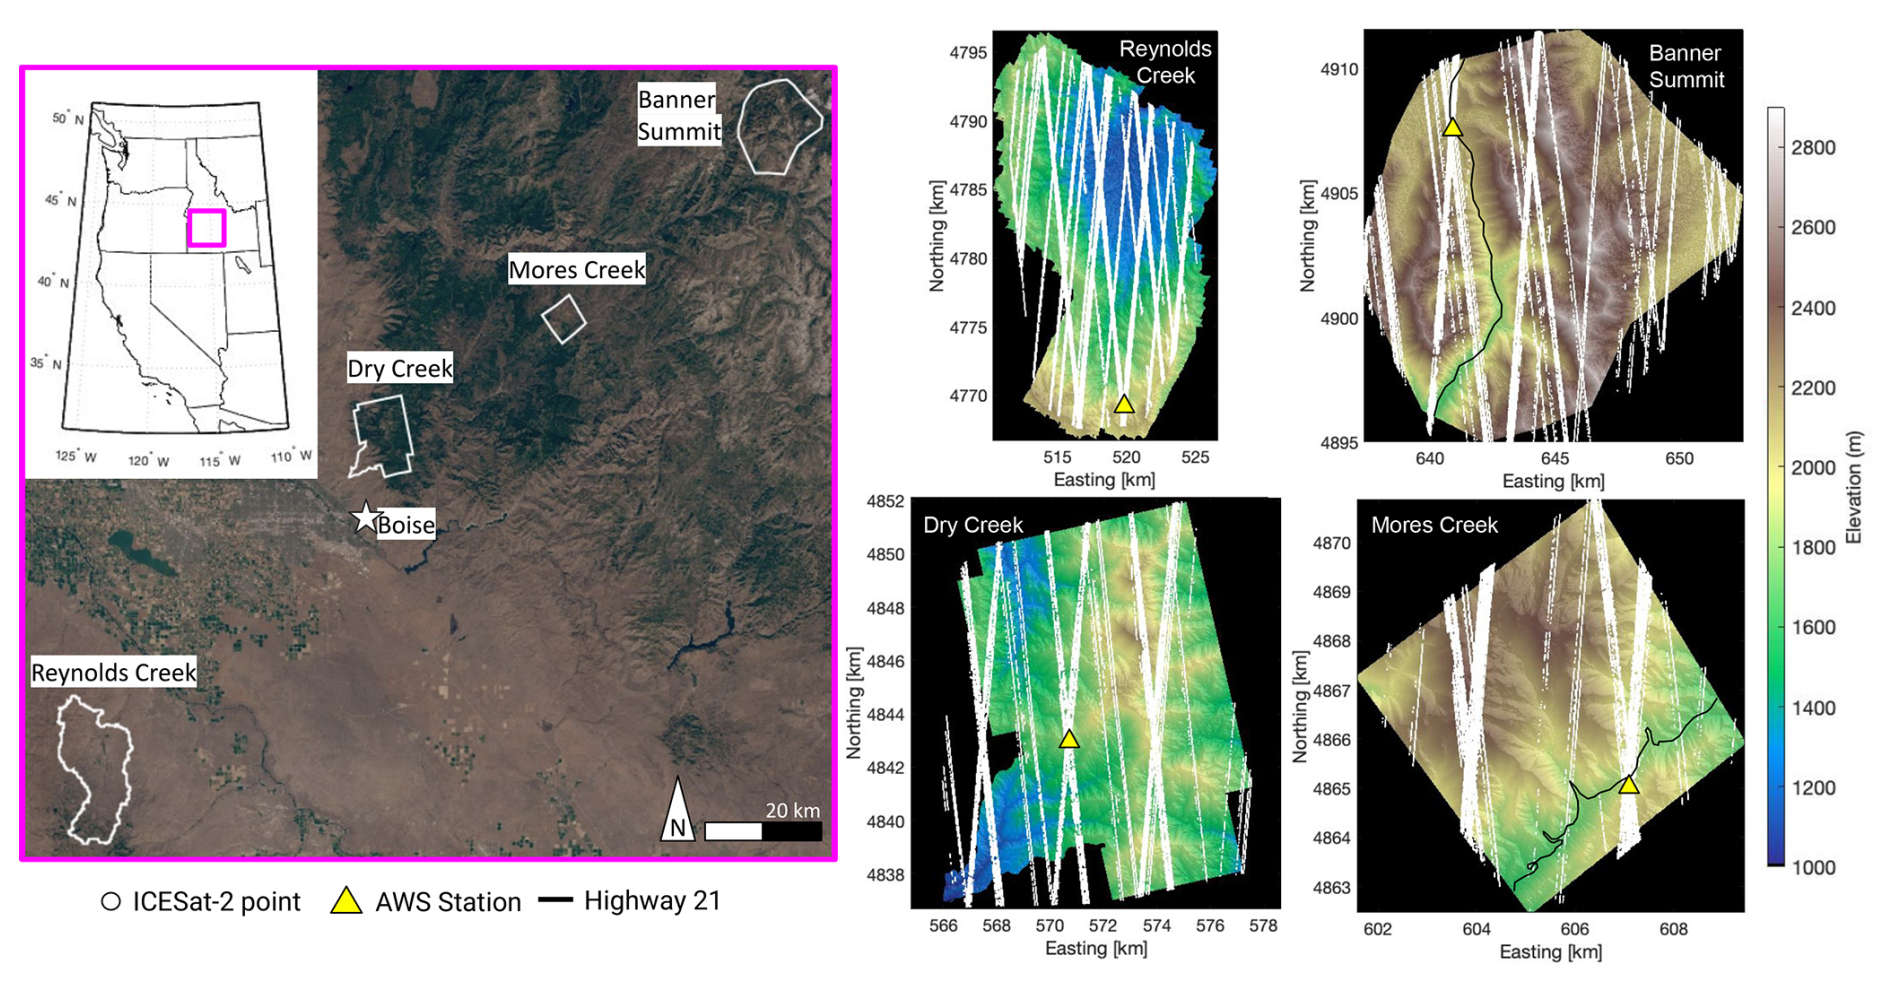
Figure 1(Left) Sentinel-2 image (courtesy of European Space Agency, Copernicus) of southern Idaho with AOIs for each study site. The inset map of the Western United States shows the area within the pink square. (Right) All ICESat-2 ATL06_SR data points from 2018–2024 and AWSs overlaid on the snow-free reference DTMs of Reynolds Creek, Banner Summit, Dry Creek, and Mores Creek.
2.1 ICESat-2
ICESat-2 provides precise laser altimetry from the Advanced Topographic Laser Altimeter System (ATLAS). The high-frequency acquisition of ATLAS provides continuous along-track photon returns along three pairs of weak and strong beam tracks. Each pair of beams has an intra-pair separation of 90 m, and an inter-pair separation of 3.3 km (Neumann et al., 2019). After launch, the mean effective laser footprint diameter of ATLAS was found to be ∼ 11 m (Magruder et al., 2021). ICESat-2 ATL03 returns have a geolocation uncertainty of ∼ 4.4 ± 6 m (Luthcke et al., 2021). Launched in 2018, ICESat-2 has a 91 d polar orbiting cycle but it points off-nadir outside of the polar regions to increase coverage and to map vegetation, repeating reference ground tracks in mid-latitudes every 3 years only. This infrequency of repeat tracks makes it impractical to monitor snow depth on the watershed scale in mid-latitudes by comparing snow-off and snow-on ICESat-2 crossovers. The spatio-temporal restriction caused by infrequent mid-latitude ICESat-2 crossovers can be circumvented by comparing ICESat-2 measurements to independently collected high-resolution snow-free DTMs (Enderlin et al., 2022; Deschamps-Berger et al., 2023; Besso et al., 2024; Chen et al., 2025; Fair et al., 2025). Additionally, ICESat-2's off-pointing angle can be increased up to 10° to target a point of interest, resulting in up to roughly monthly to bi-monthly acquisitions when tasked and increasing the likelihood for clear sky conditions and usable ground observations. We conduct our analysis using observations from four Idaho study sites for which ICESat-2 acquisitions were tasked to overpass an automatic weather station (AWS) within each site. ICESat-2 was tasked so that every track within a 30 km radius of the AWSs were shifted to target the AWS, thus enabling the direct comparison of ICESat-2 and situ snow depth data from 2020–2024, as described in Sect. 3.
The ICESat-2 team releases several standard ICESat-2 products designed for different applications. For this study we use a hybridized ATL06-like data product calculated from the Global Geolocated Photon Data product (ATL03) and based on two higher level ICESat-2 product algorithms: the Land Water Vegetation Elevation product (ATL08) photon classification (Neuenschwander et al., 2023) and the Land Ice Elevation product (ATL06) surface elevation algorithm (Smith et al., 2023). ATL08 uses a surface finding algorithm to identify the ground and top of canopy within the photon signal cloud (ATL03); photons are classified as ground, canopy, top of canopy, or noise returns (Neuenschwander et al., 2023). ATL08 parses the classified photons into 100 m segments with 0 % overlap between each segment. At Reynolds Creek Experimental Watershed (Reynolds Creek), one of our Idaho study sites, ATL08-derived snow depths calculated using a 1 m resolution airborne lidar-derived snow-free reference DTM have an estimated normalized median absolute deviation (NMAD) error estimate of 0.95 m (Höhle and Höhle, 2009; Enderlin et al., 2022). ATL06 is designed for observing ice sheets and glaciers where differences in surface elevation must be resolved on the order of centimeters in order to capture important variations in snow and ice volume. As these land-ice surfaces are vegetation free, ATL06 does not include vegetation filtering. ATL06 calculates ground elevation from the centerpoint of a linear fit to the ATL03 signal photons within a 40 m segment with 50 % overlap between segments, resulting in an estimate of the mean ground elevation every 20 m (Smith et al., 2019). ATL06 accounts for temporary photon detector saturation due to strong reflectance over snowy surfaces, improving snow elevation accuracy. In rough snow-covered terrain, comparable to our mountain study sites, ATL06 is expected to have a better vertical accuracy than the aforementioned ATL08 product. However, ATL06 can have a positive elevation bias in forested terrain due to a lack of vegetation filtering. When compared to a 15 m resolution Airborne Snow Observatory (ASO) DTM for Tuolumne Basin in California, ATL06-derived snow depths have a NMAD of 0.60–1.16 m (Deschamps-Berger et al., 2023). In this study we make use of the strengths of both algorithms using a hybridized data product (ATL06_SR) that incorporates ATL08 vegetation filtering and the ATL06 algorithm into an ATL06-like product (Besso et al., 2024; Fair et al., 2025). ATL06_SR is calculated by applying the ATL06 function to ATL08-identified ATL03 ground photon returns instead of the ATL03-identified ground photon returns. The generation of ATL06_SR is discussed in more detail in Sect. 3.1. As applied in this paper, ATL06_SR includes ATL08's vegetation filtering but does not include the first photon bias correction, which can result in up to ∼ 2 cm of bias, or the transit pulse shape bias, which can result in up to ∼ 1 cm of bias. ATL06_SR derived daily median snow depths have a Root Mean Square Error (RMSE) of 0.18 m in Tuolumne Basin compared to a 3 m resolution ASO DTM and a RMSE of 0.33 m in the Methow Valley in Washington compared to a 1 m resolution airborne lidar DTM (Besso et al., 2024). Thus, we use the hybridized ATL06_SR product to calculate snow depth because of its superior precision relative to either stand-alone product (Besso et al., 2024).
2.2 Sites and validation data
We evaluate ICESat-2 snow depths over four mountain study sites across southern and central Idaho: Reynolds Creek Experimental Watershed (Reynolds Creek), Banner Summit (Banner Summit), Dry Creek Experimental Watershed (Dry Creek), and Mores Creek Summit (Mores Creek). These four sites span an array of vegetation cover, elevation ranges, terrain complexity, and average snow depth. Each site has a high-resolution snow-free airborne lidar DTM freely available acquired during various campaigns as described in the following site descriptions. For each site, the area of interest (AOI) was defined to match the extent of the site's snow-free DTM. To validate the ICESat-2 snow depths, we use in situ snow depths from automatic weather stations (AWS) within each study site. Each site has a SNOwpack TELemetry Network (SNOTEL) AWS; some sites have additional AWSs described below. SNOTEL is a network of automatic weather stations (AWS) in snow-dominated watersheds across the western United States, operated by the USDA NRCS Snow Survey. The SNOTEL stations provide hourly measurements of snow depth with a precision of 0.013 m (, ). Additionally, at Mores Creek, multiple 1 m resolution airborne lidar surveys of snow depth across the Mores Creek AOI were flown over the 2022–2024 winter seasons. Each site is described in more detail below.
2.2.1 Reynolds Creek Experimental Watershed
Reynolds Creek Experimental Watershed (Reynolds Creek) is a 239 km2 semi-arid rangeland watershed in the Owyhee Mountains in Southwestern Idaho (Fig. 1). At lower elevations, the vegetation is predominantly low semi-arid shrubs, such as sagebrush, and cultivated land; in the mid-elevations, juniper is prevalent, and at higher elevations there are copses of Douglas fir and aspens (Seyfried et al., 2018). Elevations in the watershed range from 1100 to 2245 m and span the typical rain–snow transition elevation. Since the 1960s, the Reynolds Creek rain-to-snow transition zone has increased from ∼ 1300–1600 to 1700–2000 m (Seyfried et al., 2018). In 1960, the USDA established the site as a snow hydrology research basin administered by the USDA Agricultural Research Service (ARS) Northwest Watershed Research Center (NWRC). The USDA operates four clustered snow observation AWS in Reynolds Creek at elevations of 2054 to 2097 m a.s.l. (Northwest Watershed Research Center, 2026). The four AWSs were operational for different, but overlapping time periods. The data for all four AWS was concatenated and nominally geolocated to the average location of the four AWSs creating a complete snow depth record for the observation period. The AWSs are within 40 m of each other, therefore within a single 40 m ATL06_SR segment, thus any snow depth variation between AWS should be within the snow depth variation captured by the ICESat-2 segment. A 1 m resolution snow-free lidar DTM of Reynolds Creek was collected by NASA's Jet Propulsion Laboratory (JPL) Airborne Snow Observatory (ASO) in August 2014 (Ilangakoon et al., 2014) and can be accessed through the Idaho lidar Consortium (https://www.idaholidar.org/, last access: 29 January 2023).
2.2.2 Banner Summit
The Banner Summit study area is a 183 km2 section of alpine terrain in the Sawtooth Mountains in Central Idaho (Fig. 1). Banner Summit is predominantly covered in conifer forest. Banner Summit elevations range from 2061 to 2810 m and are typically above the rain–snow transition line from December to May, but span a wide range of snow conditions. The Banner Summit SNOTEL station (Station #312) is installed at 2146 m. A 0.5 m resolution snow-free DTM of Banner Summit was collected by Quantum Spatial, Inc in September 2021 as part of the NASA SnowEx campaign (Adebisi et al., 2022). This study area includes the most avalanche-prone highway in Idaho, HW21, through an area known as “avalanche alley”. The majority of the site burned in the 2024 Wapiti wildfire, however the data used in this study was collected before the fire.
2.2.3 Dry Creek Experimental Watershed
The Dry Creek Experimental Watershed (Dry Creek) study site is a 126 km2 area of the Boise Front Range in western Idaho including the 27 km2 Dry Creek research basin operated by the hydrology group at Boise State University (McNamara et al., 2018). In this water-limited environment, vegetation in the lower watershed is predominately a sparse sagebrush-steppe ecosystem with dense riparian vegetation in the valley bottoms. Mixed conifer forest is the dominant land cover through the upper watershed (McNamara et al., 2018). Elevations in the watershed range from 1160 to 2050 m spanning the typical rain–snow transition elevation. The Lower Deer Point weather station operated by Boise State University is installed at 1850 m (McNamara et al., 2018). A snow-free lidar DTM of the Dry Creek research basin was collected in 2007 (Watershed Sciences, 2007), the upper section of the Dry Creek site was surveyed in 2019 by FEMA (Quantum Spatial, 2018). These two 1 m resolution DTM were combined to create the Dry Creek snow-free reference DTM used in this study. Both DTMs can be accessed through the Idaho Lidar Consortium (https://www.idaholidar.org/, last access: 5 March 2024). We chose to use these DTMs instead of the existing SnowEx lidar snow-free survey of Dry Creek due to their larger spatial coverage of the area.
2.2.4 Mores Creek Summit
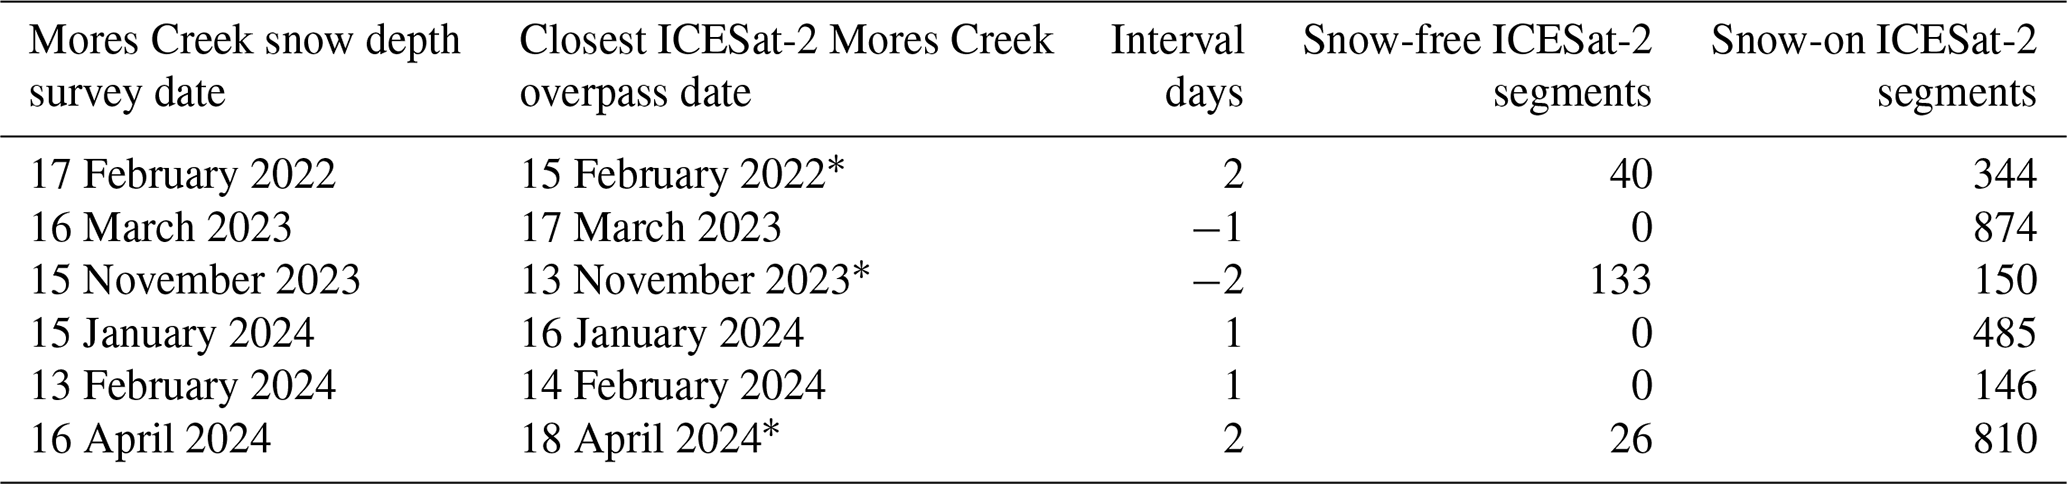
Mores Creek Summit (Mores Creek) is a 38 km2 alpine study site in the Boise Mountains 15 km north of Idaho City in Western Idaho (Fig. 1). Mores Creek is predominantly covered in conifer forest; roughly 50 % of the site burned in the 2016 Pioneer wildfire, leaving standing dead trees and a rapidly evolving understory. Mores Creek elevations range from 1790 to 2369 m and are typically above the rain–snow transition line from December to April. The Mores Creek SNOTEL station (Station #637) is installed at 1859 m. A 0.5 m resolution snow-free DTM of Mores Creek was collected by Quantum Spatial, Inc in September 2021 as part of the NASA SnowEx campaign (Adebisi et al., 2022). Helicopter-based airborne lidar snow depth surveys at 1 m horizontal resolution and 10 cm depth uncertainty over the 38 km2 Mores Creek AOI were collected during the 2022–2024 winter seasons (Ciafone et al., 2024). Surveys were collected during the snow season (November–April); one survey in the 2021–2022 season, two surveys in the 2022–2023 season, and three surveys in the 2023–2024 season were collected within 2 d of an ICESat-2 overpass (Table 2). Of the 6 surveys within 2 days of an ICESat-2 overpass, three have no snow free segments due to either complete snow cover of the observed terrain or cloud contamination of snow-free terrain.
Table 2Mores Creek helicopter survey dates and temporally nearest ICESat-2 Mores Creek overpass. The ICESat-2 overpass dates with an asterisk have available snow-free ATL06_SR data to use to perform an individual co-registration.
We calculate ICESat-2 snow depths in four main steps: (1) pre-process ICESat-2 elevation data (h_IS2) from the study site; (2) co-register the ICESat-2 elevation data with the snow-free reference DTM; (3) extract snow-free reference elevations (h_DTM) and terrain parameters (slope, aspect) within each ICESat-2 segment; and (4) calculate ICESat-2 snow depth (d_IS2) and snow-free elevation residuals (h_residual) using
The snow-free ICESat-2 height residuals, h_residual, are the difference between ICESat-2 and DTM ground elevations in snow-free conditions as determined by the Normalized Difference Snow Index (NDSI) calculated from in near-coincident satellite imagery. In idealized conditions h_residual would be zero. The variation in h_residual is assumed to be from uncertainties in the ICESat-2 and DTM data, natural snow depth variation within the ∼ 11 m diameter ICESat-2 laser footprint, differences in the spatial coverage of elevation returns within each ICESat-2 segment due to differences in sensor design, and geolocation offsets between the datasets. h_residual is used to calculate and correct elevation biases between the datasets and calculate the ICESat-2 precision and snow-free accuracy. ICESat-2 snow depth, d_IS2, is the difference between ICESat-2 and DTM elevations when and where snow is observed in satellite imagery. Due to the effect of slope and vegetation cover, which both reduce the number of ground return photons (n_fit_photon), snow-free and snow-covered conditions could not be clearly distinguished using n_fit_photon at the sites studied. Half (50 %) of identified snow-covered segments have 50 or more photon returns but 20 % of segments from June-August, when the sites are known to be snow free, also meet that criteria. If the photon threshold for snow identification was selected to exclude the majority of the June–August (i.e., snow-free) segments, there is considerable data loss. For example, a threshold of 150 photons per segment would retain only 17 % of identified snow-covered segments and 1 % of June–August segments. Therefore, we chose to use the independent near coincident NDSI maps to identify snow covered terrain. After accuracy analyses, ICESat-2 snow depths are validated against in situ AWS snow depths and the Mores Creek airborne lidar snow depth surveys.
As we developed the workflow presented here, we tested several other changes to these methods that we either found to be impractical or have little to no impact on ICESat-2 snow depth precision (uncertainty) or accuracy (bias). These workflow variations are described in Appendix A.
3.1 Pre-process ICESat-2
We use the ATL06_SR product for all available ICESat-2 data acquired from October 2018 to April 2024 within the boundaries of the four study sites. We refer the reader to Besso et al. (2024) and Shean et al. (2025) for detailed description of the ATL06_SR product used herein. Briefly, to calculate ATL06_SR, we applied the ATL06 function to ATL08 ground-classified ATL03 photons (Besso et al., 2024). We calculated ATL06_SR using the SlideRule Earth data processing package which allows for rapid, cloud-based processing of the ATL03 photon cloud with customized control of the ATL06 algorithm parameters (Shean et al., 2025). For this study ATL06_SR was calculated using ATL08 ground-classified ATL03 photons using otherwise default ATL06 parameters: a 40 m segment length, a step size of 20 m, a minimum along-track spread of 20 m, a maximum of 6 iterations, and a minimum of 10 ATL08 ground classified photons. The resulting ATL06_SR product therefore has an elevation estimate every 20 m. We use the ATL06_SR h_mean parameter – the elevation at the center of a linear fit of the photons within the 40 m segment, equivalent to the area-averaged elevation – as h_IS2 for our analysis. The ATL06_SR h_mean parameter linear fit uses an iterative selection refinement to remove noise from miss-identified photons but does not include the transmit-pulse-shape correction or the first-photon-bias correction included in ATL06's land ice height parameter (h_li) (Smith et al., 2019). Since the ATL06_SR h_mean parameter is evaluated at the center of the ATL06_SR segment, we refer to the nominal location of the elevation data as the centroid. The ATL06_SR and reference DTM data are reprojected to WGS84 UTM zone 11N (EPSG:32611). The native coordinate reference frame (CRS) for ICESat-2 is the WGS84 ellipsoid (EPSG: 4326). The native CRS for the snow-free reference DTMs is the North American Datum 1983 in the horizontal (EPSG: 26911) and the North American Vertical Datum 1988 (EPSG: 5103) geoid heights in the vertical.
3.2 Horizontal co-registration
Geolocation offsets increase uncertainty and introduce error in the interpretation of ICESat-2 elevation data compared to the DTM, especially in sloped terrain. The magnitude of the error depends on the magnitude of the geolocation offset as well as the surface slope and aspect relative to the horizontal direction of offset (Nuth and Kääb, 2011). Since the snow-free reference DTMs of each site are independent of each other, ICESat-2 and the reference DTM must be co-registered on a site by site basis. Accurate co-registration relies on stable surface matching, thus only snow-free ICESat-2 elevation data are used for co-registration. Snow-free ICESat-2 elevations are identified using the temporally closest Sentinel-2 (courtesy of European Space Agency, Copernicus) or Landsat 8/9 (courtesy of NASA and USGS) derived snow cover map. Snow cover is identified using the NDSI, wherein
where ρgreen and ρSWIR are the surface reflectance in the green and SWIR bands respectively. ρgreen and ρSWIR are bands B3 and B11 for Sentinel-2 imagery and bands SR_B3 and SR_B6 for Landsat 8/9 imagery (Riggs et al., 1994; Hall et al., 1995; Gascoin et al., 2019). For each study site, NDSI time series are created using all Sentinel-2 and Landsat 8/9 images covering at least 70 % of the AOI and with < 10 % cloud-cover in the AOI during our observation period (2018–2024). Pixels with an NDSI > 0.4 are classified as snow (Riggs et al., 1994; Gascoin et al., 2019). ATL06_SR segments are assigned as snow-covered or snow-free based on the classification of the nearest neighbor snow cover pixel.
After identifying the snow-free ICESat-2 elevation data, ATL06_SR and the site DTM are co-registered using an iterative grid search algorithm that is similar to the iterative co-registration algorithm used in Zhang et al. (2024) to reduce errors in DTMs of the rugged Qinghai-Tibet Plateau. First a coarse (1 m increment) grid search is performed over a grid of ±8 m in the easting and northing directions – almost double the ICESat-2 geolocation uncertainty of ∼ 4.4. m (Luthcke et al., 2021) – to find the approximate location of the global minimum of the snow-free ICESat-2 elevation residual NMAD. A finer (0.1 m increment) grid search is then performed within ±0.9 m of the coarse grid search's minimum to identify the true global minimum of the snow-free ICESat-2 elevation residual NMAD. At each coordinate in the transform grid the mean reference elevation in each ICESat-2 segment is calculated to downsample the reference DTM to the geometry of the transformed ICESat-2 tracks before calculating the elevation residual NMAD. In addition to the iterative grid search two other co-registration algorithms were tested and rejected during method development, the Nuth and Kääb (2011) co-registration algorithm (as used in Deschamps-Berger et al. (2023)), and a gradient descent (as used in Enderlin et al. (2022)). These are discussed further in Appendix A.
Most existing ICESat-2 snow depth studies use an aggregate co-registration approach where a single co-registration transform is calculated from all snow-free ICESat-2 elevations and applied to all ICESat-2 tracks (Enderlin et al., 2022; Deschamps-Berger et al., 2023). We test both an aggregate co-registration approach using all snow-free ATL06_SR segments and an individual co-registration for each ICESat-2 overpass using all snow-free ATL06_SR segments from the overpass (Fig. 2). For comparison with the results of Enderlin et al. (2022), who estimated a near-zero offset, and Besso et al. (2024), who applied no horizontal transform, we also test a “no co-registration” approach wherein the ICESat-2 elevation residuals and ICESat-2 snow depths are calculated without any horizontal co-registration transform. Final reported ICESat-2 snow depths are calculated using aggregate horizontal co-registration but discussion of other co-registrations is included for comparison.
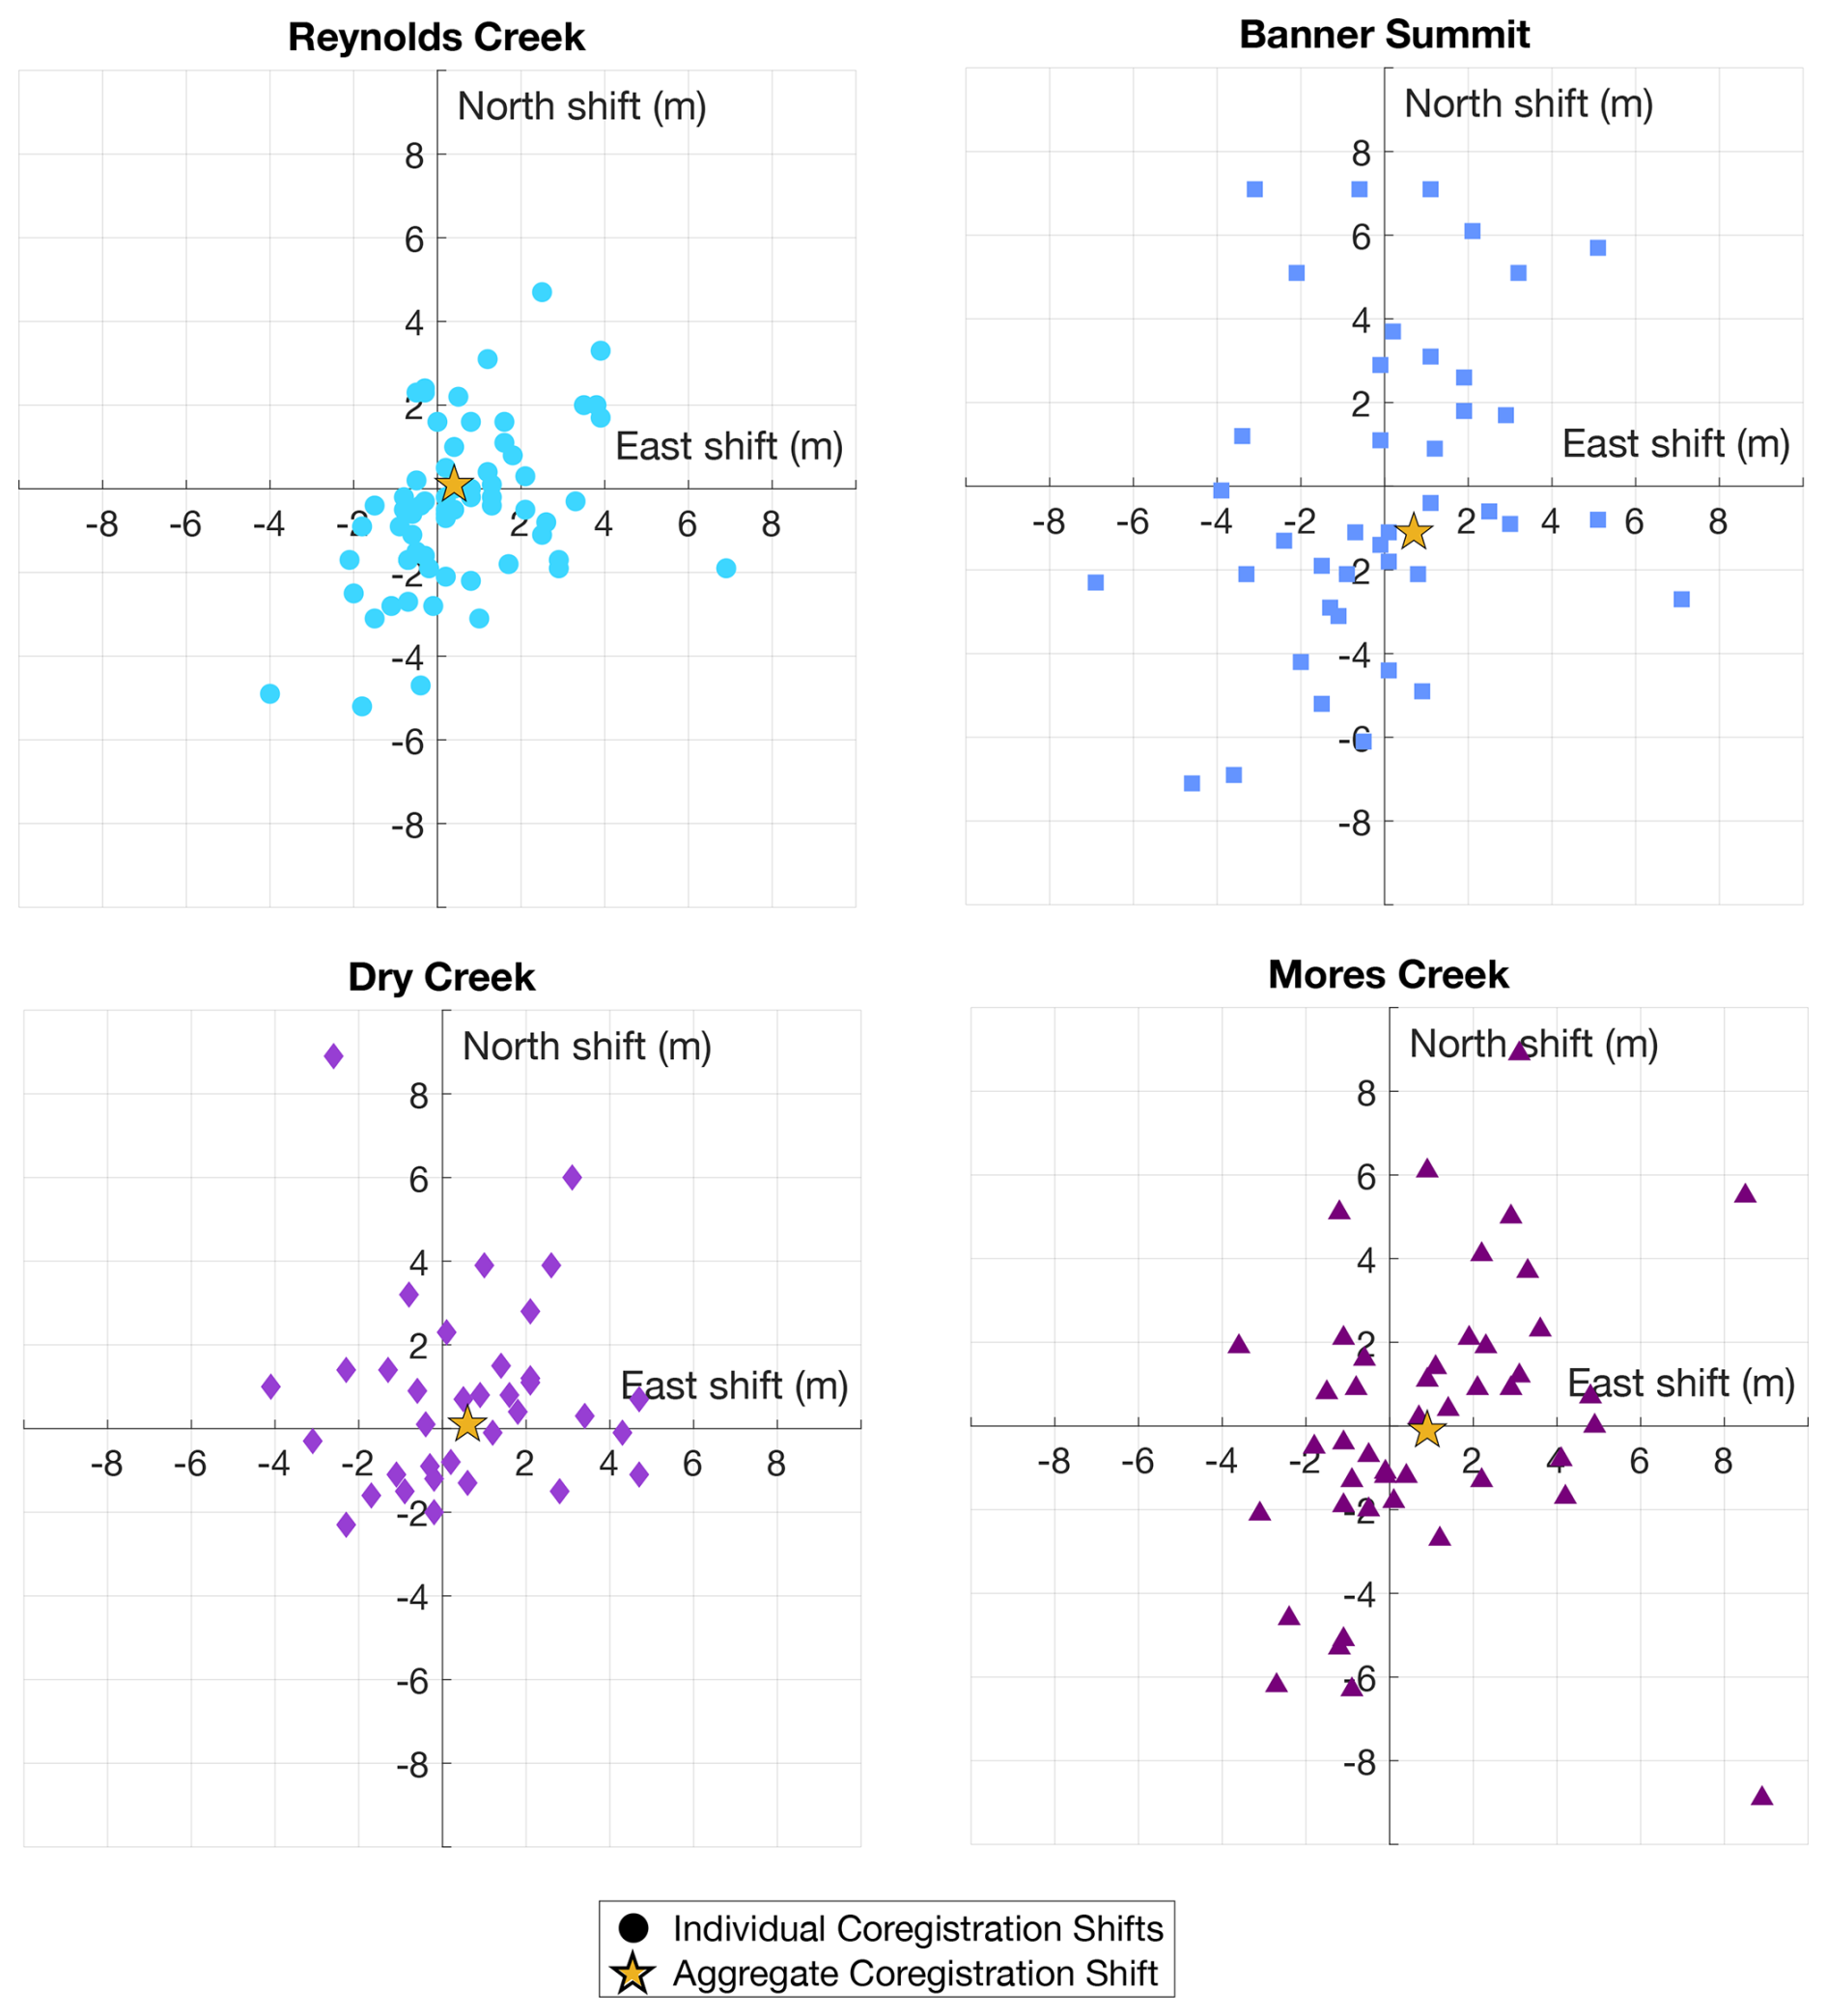
Figure 2Aggregate and individual co-registration northing and easting transforms for Reynolds Creek, Banner Summit, Dry Creek, and Mores Creek. Stars show the aggregate co-registration transform. Colored markers show the individual co-registration transforms. The aggregate co-registration transform for Reynolds Creek = [0.4 m E, 0.1 m N], Banner Summit = [0.7 m E, −1.1 m N], Dry Creek = [0.6 m E, 0.1 m N], and Mores Creek = [0.9 m E, −0.1 m N].
3.3 Calculate reference elevation, slope, and aspect
After horizontal co-registration, we calculate elevation, aspect, and slope metrics from the reference DTM for each ATL06_SR segment. The reference elevation for each ATL06_SR point is the mean elevation of the DTM within the corresponding ATL06_SR segment area (a 11 m by 40 m rectangle, oriented along the ICESat-2 track). The along-track slope and aspect are calculated from a plane fit to the reference DTM surface within the corresponding ATL06_SR segment area. Although the DTM derived terrain metrics are extracted from within the entire ATL06_SR segment area, the DTM terrain metrics are nominally assigned the same segment centroid coordinates as the ATL06_SR elevation to facilitate analysis.
3.4 Vertical co-registration and snow depth estimation
Vertical co-registration is calculated using snow-free conditions and applied to both snow-free and snow-covered data. Since the snow-free ICESat-2 elevation residuals are not normally distributed, we solve for any vertical bias and the progressive negative slope bias that has been previously identified in ICESat-2 data in mountain regions (Smith et al., 2019; Liu et al., 2021; Enderlin et al., 2022; Deschamps-Berger et al., 2023) using the median snow-free elevation bias from slopes of 0 to 40° in 5° steps. Slopes > 40° are excluded to remove outliers. As this progressive slope bias is best described by a quadratic function (Enderlin et al., 2022), we fit a quadratic curve to the median snow-free ICESat-2 elevation residuals relative to slope to solve for site-specific vertical elevation corrections. The vertical bias is assumed to persist in snow-covered conditions, thus the quadratic snow-free vertical bias correction is applied to the snow-covered ICESat-2 returns to minimize biases in snow depth. Transects of 40 m ATL06_SR snow depth estimates are compared to near-coincident airborne lidar snow depth surveys of Mores Creek. To evaluate the scale at which ICESat-2 best captures snow-depth patterns we calculate the median ICESat-2 snow depth within a circle of various radius lengths centered on the AWS, herein we refer to the radius of this circle as the smoothing length. Segment scale spatial variability is evaluated using the NMAD to limit the impact of the heavy-tailed residual distribution while the median snow depth temporal variability is evaluated using the root mean square error (RMSE) as the residual distribution is not heavy-tailed.
3.5 Mores Creek helicopter snow surveys data processing
The Mores Creek helicopter snow depth surveys are co-registered to the snow-free Mores Creek DTM using HW 21 as a control feature as elevation along the plowed road is stable across seasons (Fig. 1) (Hoppinen et al., 2023). The aggregate and individual co-registration transforms calculated for the snow-free Mores Creek DTM are applied to the Mores Creek ICESat-2 data to co-register the ICESat-2 data to the Mores Creek helicopter snow depth surveys. For three of the six Mores Creek helicopter survey dates there are insufficient data to calculate an individual co-registration transform (Table 2) so those dates are excluded from the individual co-registration analysis.
To compare ICESat-2 snow depths to the helicopter lidar snow depth surveys of Mores Creek, snow depth profiles are calculated along the corresponding ICESat-2 overpass at the ATL06_SR resolution, creating synthetic ICESat-2 tracks (Fig. 3). Reference helicopter snow depths are calculated as the average snow depth of the helicopter snow depth survey within the ATL06_SR segment and nominally assigned the centroid coordinates for the corresponding segment.
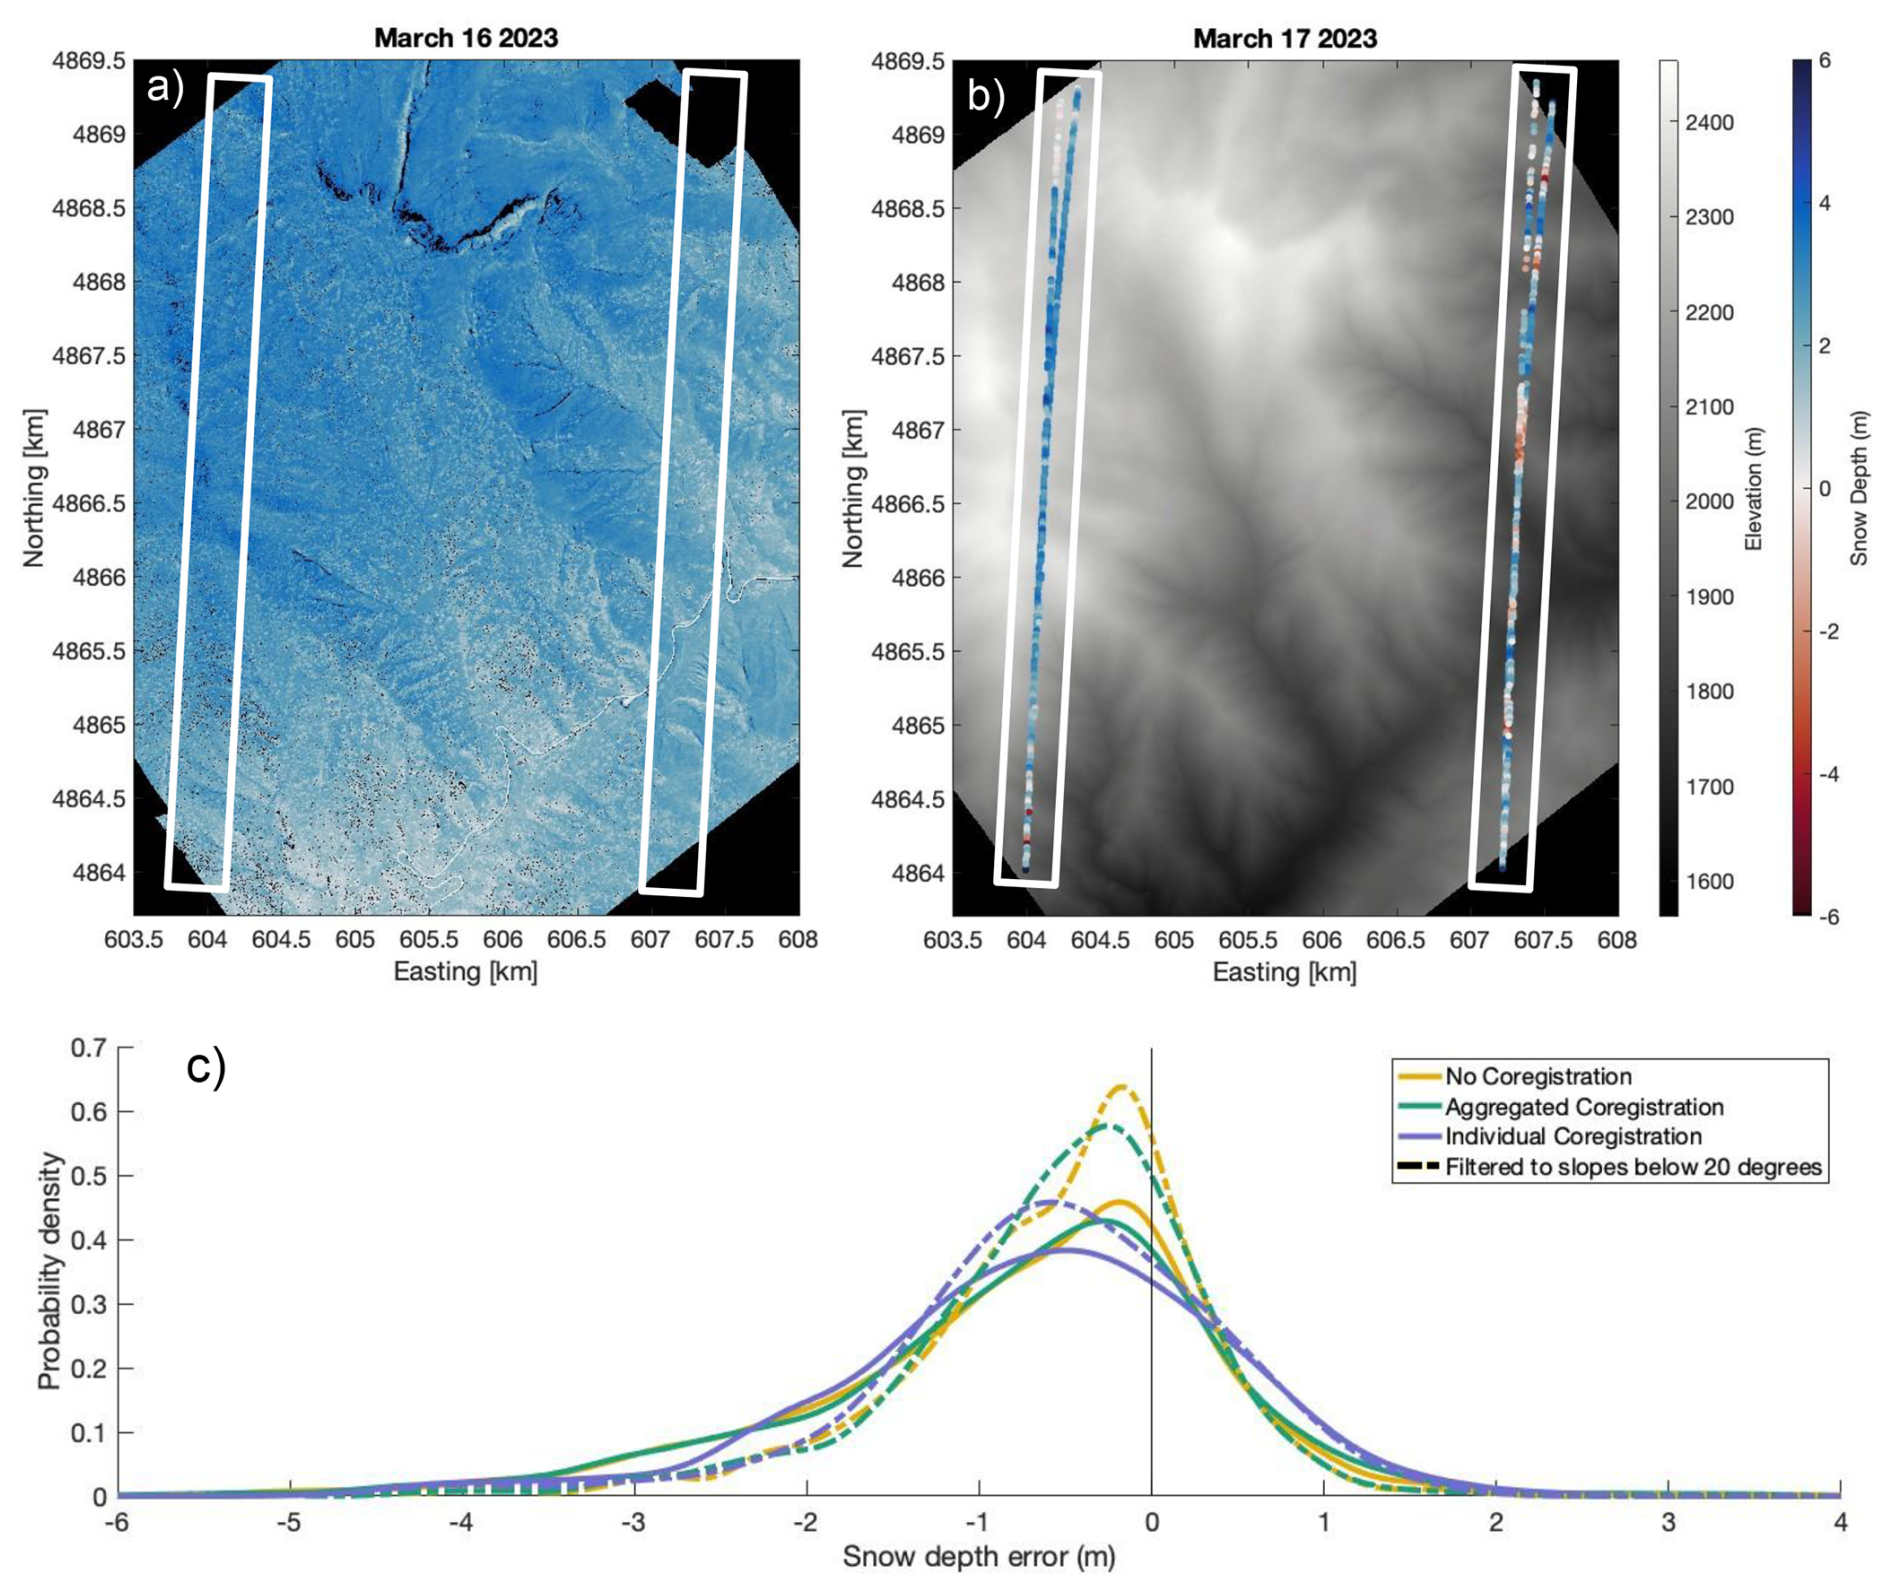
Figure 3(a) 16 March 2023 airborne lidar snow depth map. (b) 17 March 2023 ICESat-2 snow depths calculated using aggregate co-registration overlaid on the Mores Creek snow free reference DTM. Both ICESat-2 snow depths and airborne snow depths are plotted with the same colormap. Blue indicates positive snow depths and red is negative snow depths. White boxes in both (a) and (b) highlight the location of the ICESat-2 tracks from 17 March 2023. (c) Probability distribution of snow depth error for all paired survey dates calculated without co-registration, using aggregate co-registration, and using individual co-registration before and after filtering the segments to slopes < 20°.
Since the focus of this paper is optimization of ICESat-2 processing to estimate snow depths in rugged terrain, we first present the impact of co-registration and slope corrections on ICESat-2 snow depth accuracy and precision, then present a detailed comparison of ICESat-2 snow depths to independent snow observations.
4.1 Aggregate vs. Individual Co-registration Transforms
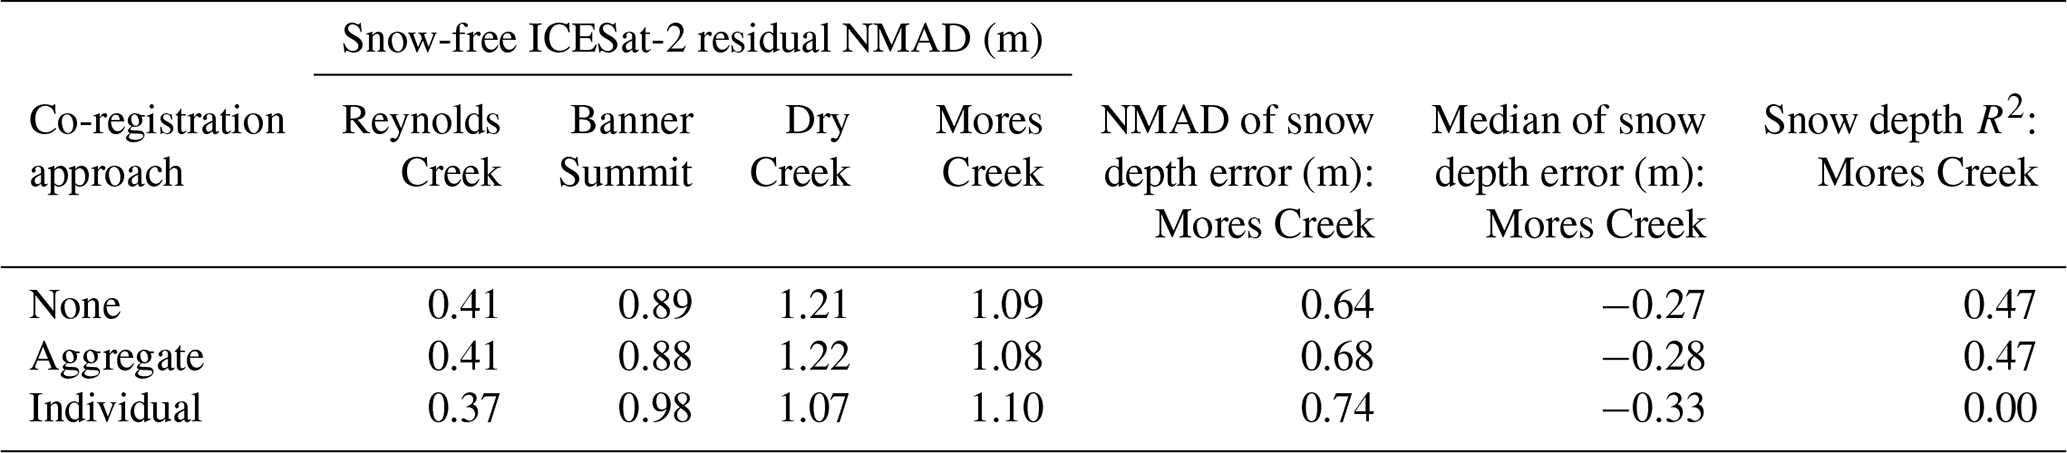
To facilitate comparison with previous analyses of ICESat-2 snow depth mapping, we calculate bias (i.e., median error) and uncertainty (i.e., NMAD of error) without co-registration, using aggregate co-registration transforms, and using individual co-registration transforms. The magnitude of the individual co-registration transforms have a single direction interquartile range of 3.9 m (Fig. 2). In contrast, the magnitude of the aggregate co-registration transforms only reach a maximum of 1.1 m in a single direction (Fig. 2). The directions of the individual co-registration transforms are generally NE or SW, with no clear pattern for ascending or descending ICESat-2 tracks. The snow-free elevation residual NMAD is < 0.5 m at Reynolds Creek, ∼ 1 m at Banner Summit and Mores Creek, and ∼ 1.2 m at Dry Creek regardless of co-registration approach. Individual co-registration results in inconsistent changes of ∼ 10 cm to ICESat-2 precision across sites (Table 2). To assess the influence of co-registration approach on snow depth estimates, we compare snow depth from ICESat-2 and synthetic ICESat-2 tracks calculated from near-coincident Mores Creek airborne lidar snow surveys. We find that ICESat-2 snow depth has a negative bias of ∼ 0.6 m and uncertainty of ∼ 1 m regardless of co-registration approach (Fig. 3, Table 3). Additionally, the coefficient of determination (R2) between the ICESat-2 and airborne lidar snow depths indicates stronger correlation between the variables without co-registration or using aggregate co-registration of ICESat-2 (R2=0.47) relative to individual co-registration (R2=0.00).
Table 3Snow-free elevation residual NMADs for Reynolds Creek, Banner Summit, Dry Creek, and Mores Creek, and ICESat-2 snow depth error NMAD, Median, and R2 compared to the Mores Creek airborne snow depth surveys calculated using no co-registration, aggregate co-registration, and individual co-registration transforms.
We attribute the unreliability of the individual co-registration to the abundance of snow cover in the study site: for several winter ICESat-2 overpasses the site's AOI is almost completely snow covered, resulting in < 100 segments for individual co-registration and a high likelihood that segments identified as snow-free are partially snow-covered. The aggregate co-registration uses ∼ 7000–100 000 snow-free segments for co-registration depending on site while the individual co-registration uses an average of ∼ 100–2000 snow-free segments per overpass date depending on site for co-registration. Thus the individual co-registration has orders of magnitude fewer data points available for co-registration, likely skewing transforms for some of the individual tracks.
4.2 Slope-induced errors
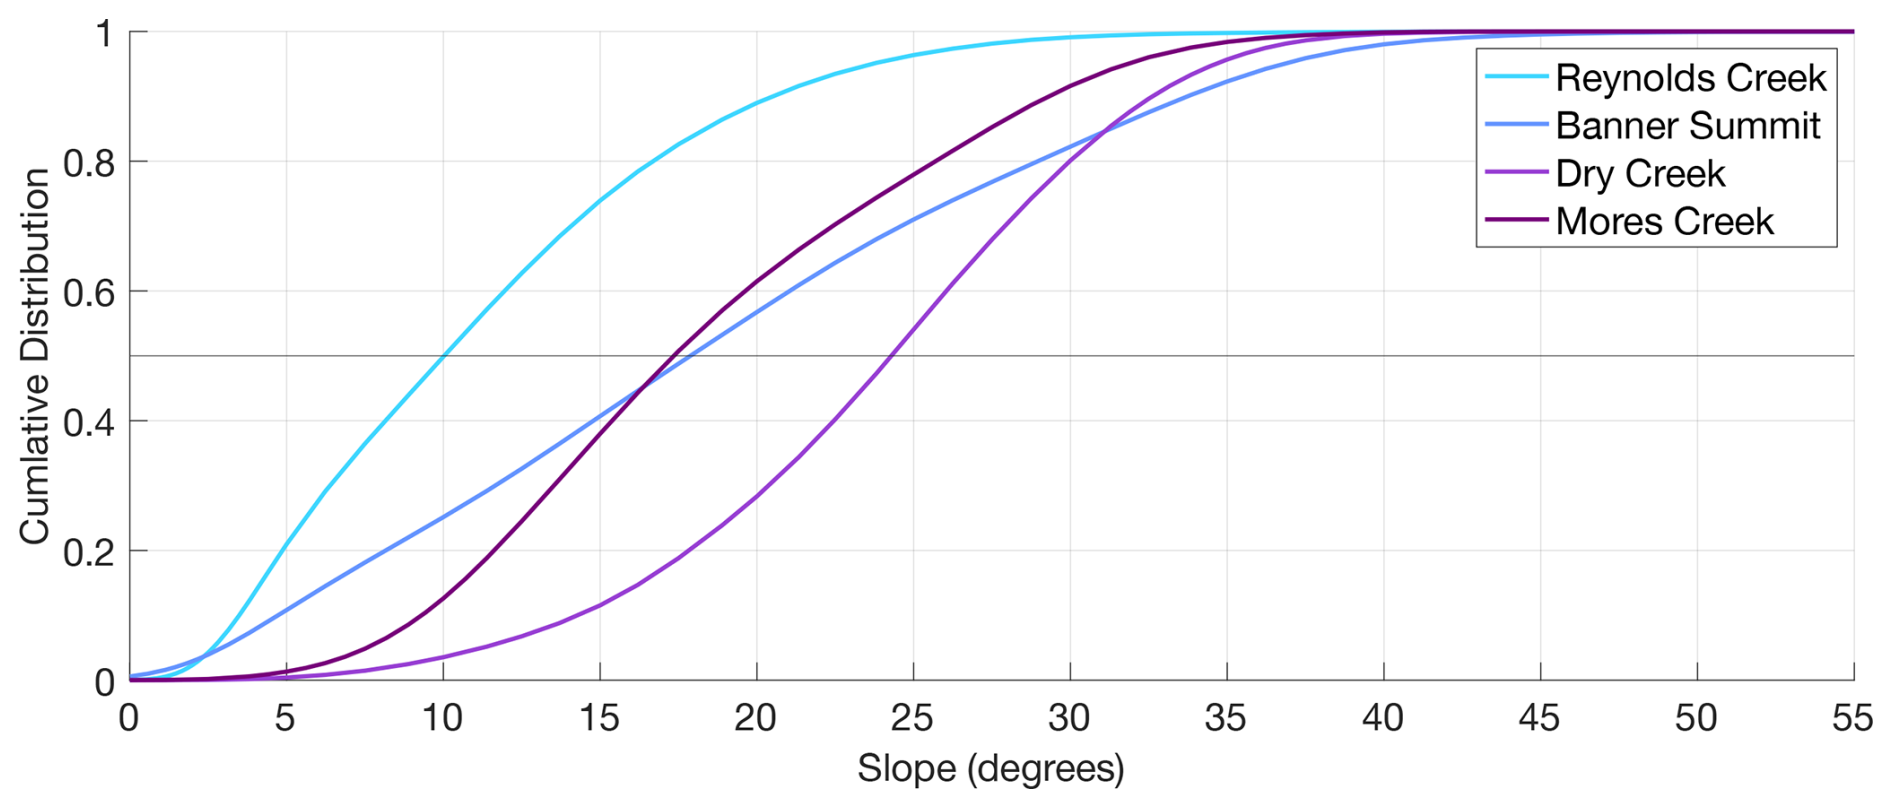
Uncertainty and bias in ICESat-2 elevation residuals, and therefore snow depths, both increase with slope (Table 4, Fig. 4). Bias is effectively minimized through the application of a quadratic slope-dependent adjustment but the bias adjustment has a slope- and site-dependent impact on uncertainty. At all slopes the quadratic slope-dependent adjustment removes vertical bias but the slope-dependent bias adjustment has little impact on uncertainty. The magnitude of uncertainty increases with slope at all sites (Fig. 4). We define shallow, moderate, and steep slopes as < 10, 10–20, > 20° respectively, based on the distribution of slopes across our sites (Fig. 2a). For shallow slopes site-specific uncertainties range from ∼ 0.2–0.6 m, for moderate slopes uncertainties range from ∼ 0.7–1.0 m, and for steep slopes uncertainties range from ∼ 1.3–1.8 m both before and after applying the slope-dependent bias adjustment (Table 4).
Table 4Uncertainty and accuracy statistics before and after applying a site-specific quadratic slope correction.
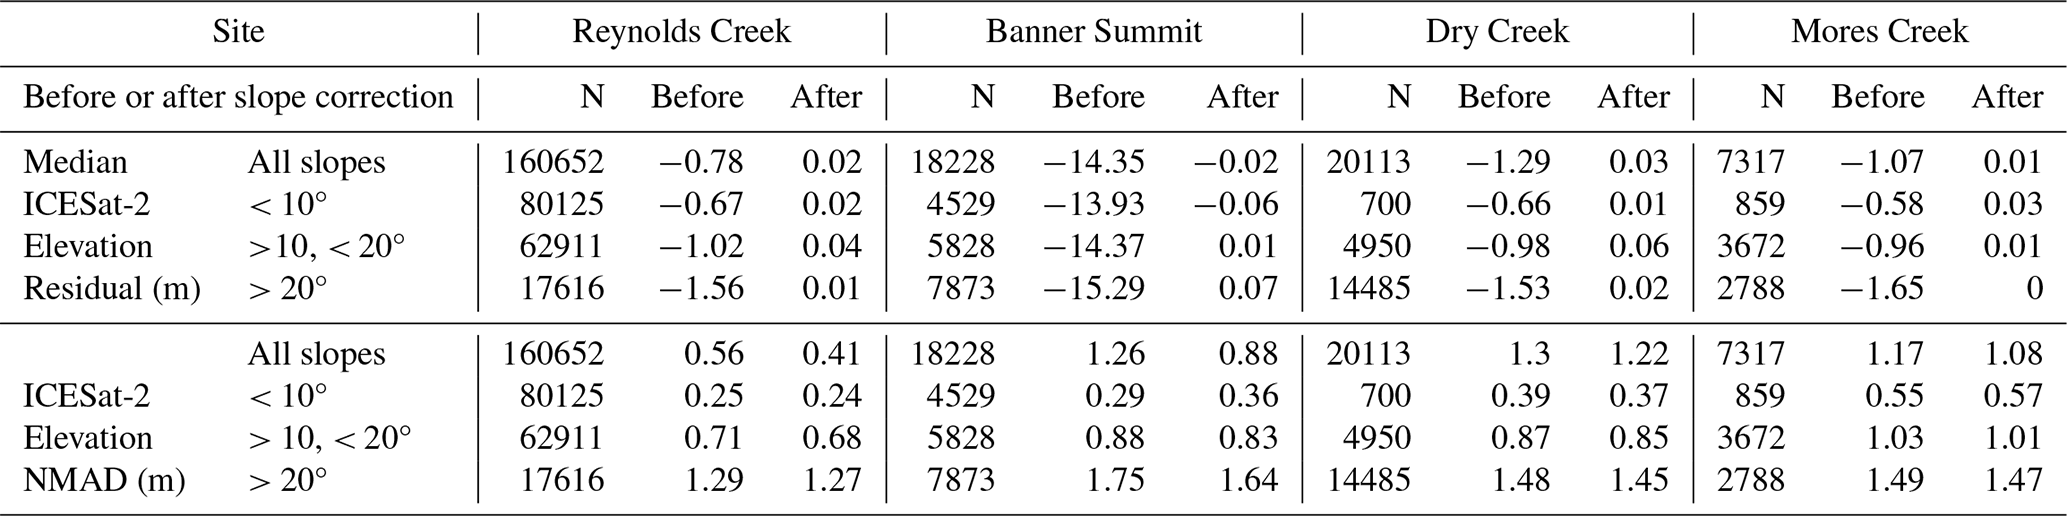
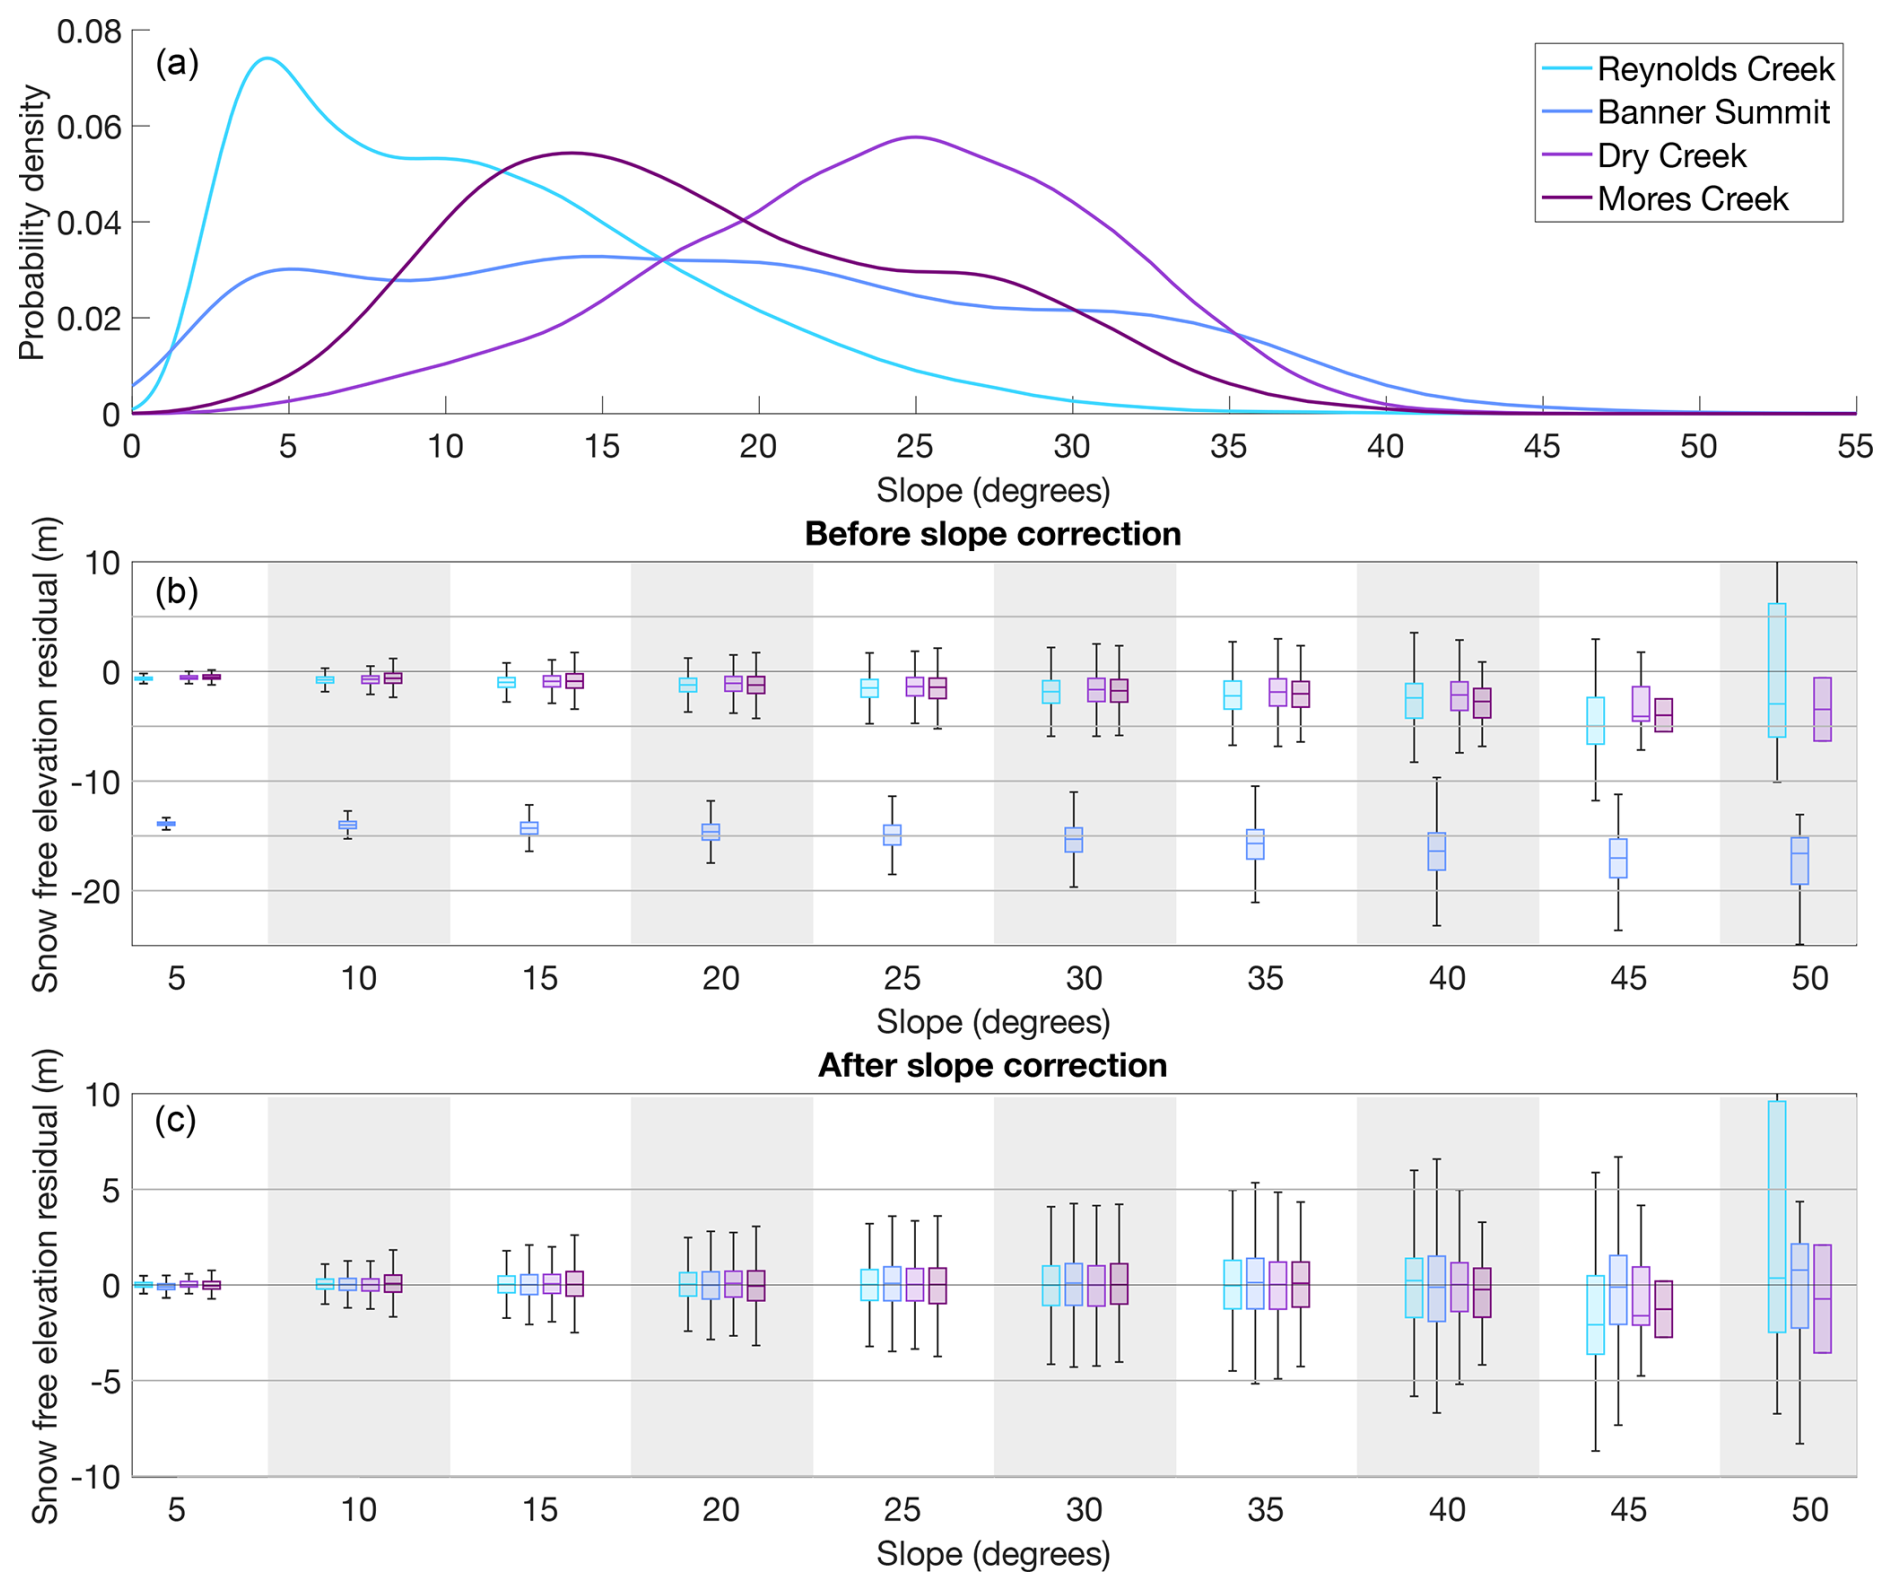
Figure 4(a) Normalized distribution of slopes within each study site. (b, c) Snow-free ICESat-2 elevation residual binned by slope for each site before (b) and after (c) quadratic slope correction. The residuals before slope correction (b) are shown on a scale from −25 to 10 m to show the Banner Summit residuals which have a large vertical offset. The corrected residuals (c) are shown on scale from −10 to 10 m. Cumulative distributions of slope within each study site are shown in Fig. A1.
4.3 Snow depth comparisons at stations
To assess the optimal spatial smoothing length of ICESat-2 snow depths in rugged terrain, median ICESat-2 snow depth is calculated within various distances of the AWS, ranging from 50 to 5000 m, at each site. All following ICESat-2 snow depths are calculated after slope corrections are applied. The daily in situ AWS snow depths are used as ground truth. Across all sites 20 %–50 % of ICESat-2 snow depth segments are negative, and thus clearly inaccurate. At all sites, removing negative ICESat-2 snow depth segments improves median ICESat-2 snow depth agreement with AWS snow depth across all smoothing lengths; the RMSE for all ICESat-2 snow depths at each site ranges from 0.3 to 1.9 m, shrinking to 0.2 to 0.8 m when negative ICESat-2 snow depth segments are excluded (Fig. 7). If negative ICESat-2 snow depths are not excluded, the median ICESat-2 snow depth systematically underestimates AWS snow depth by an average of 0.54 m across all sites and smoothing lengths; with negative ICESat-2 snow depths excluded, median ICESat-2 snow depth systematically underestimates AWS snow depth by an average of 0.22 m (Fig. 5). Because of this improvement to ICESat-2 snow depth accuracy and precision, negative ICESat-2 snow depth segments are excluded from the ICESat-2 snow depth results presented below.
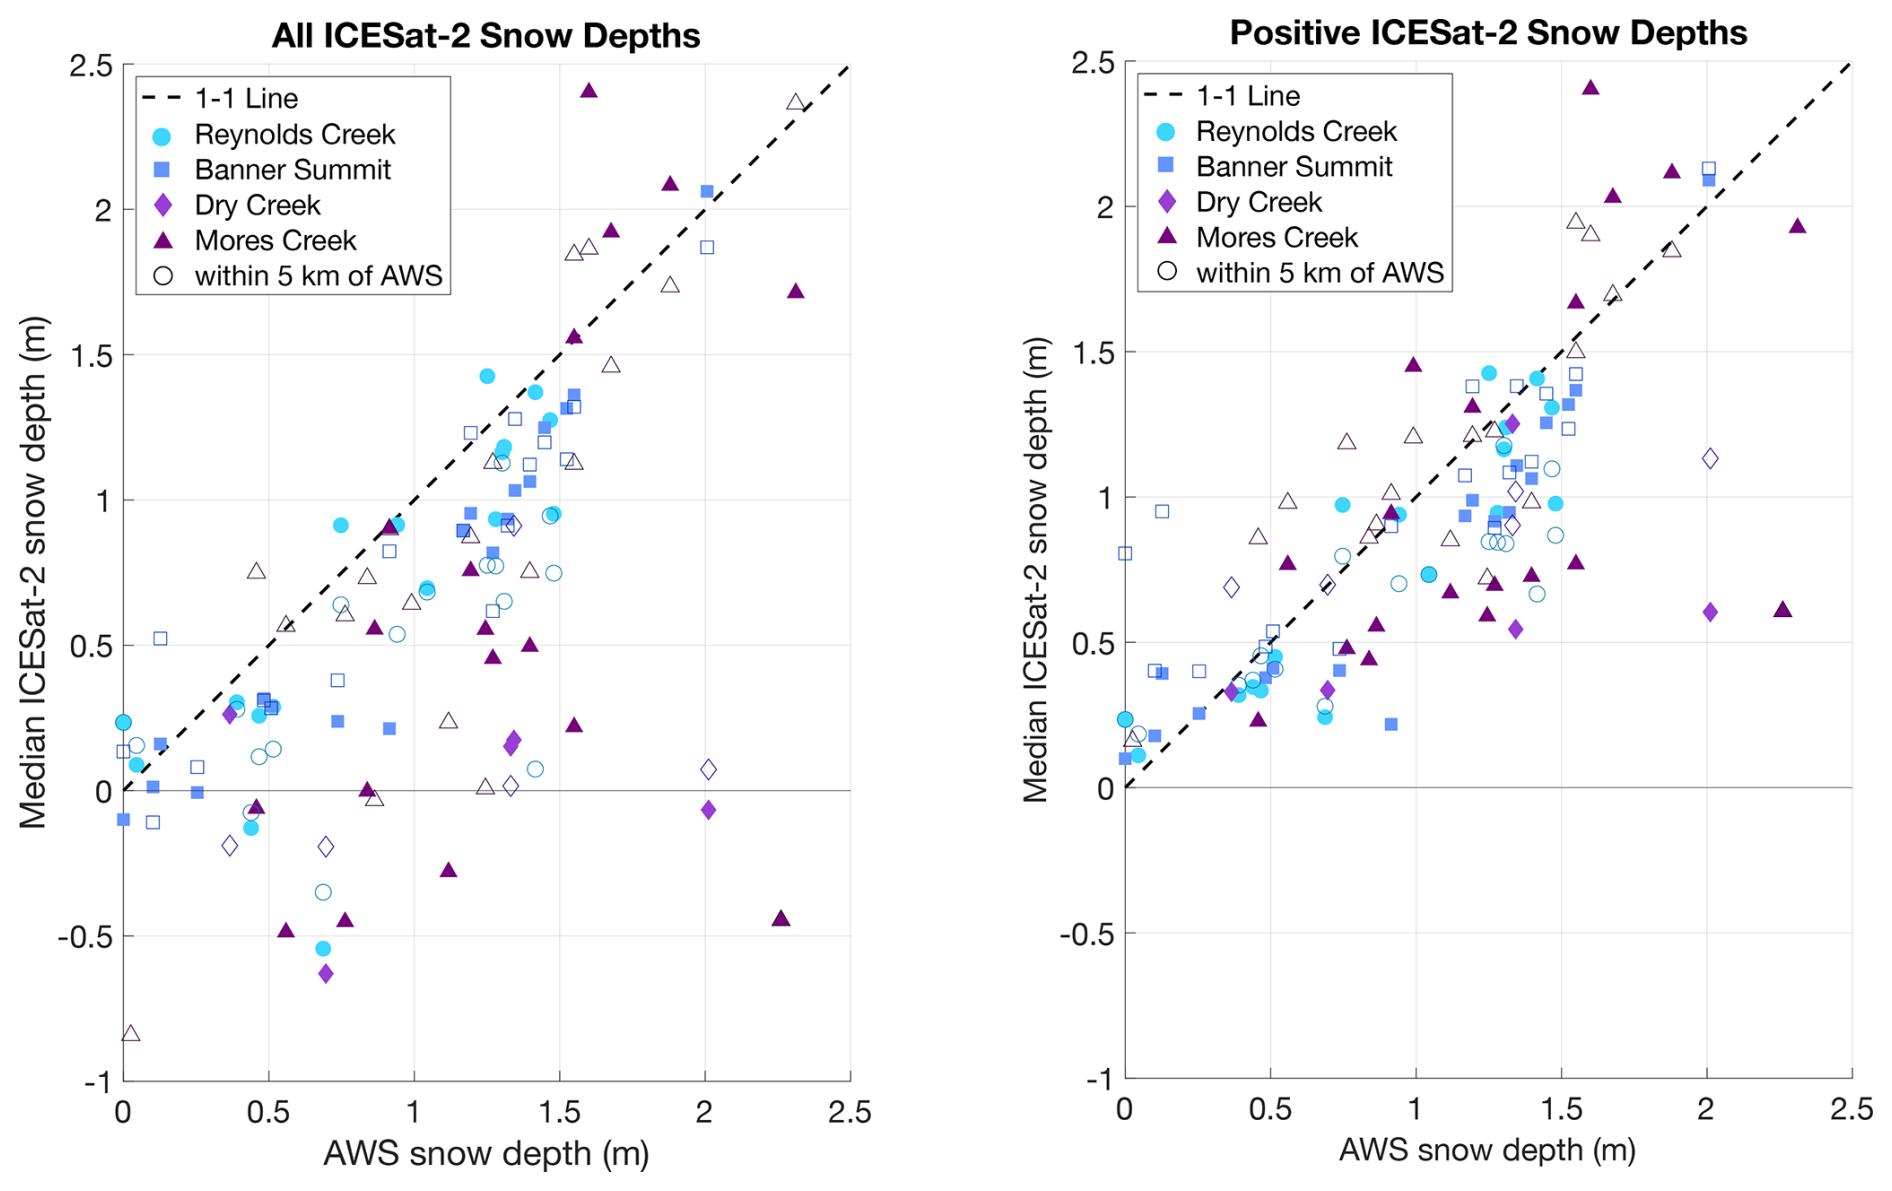
Figure 5AWS snow depth vs. median ICESat-2 snow depth with (left) and without (right) negative ICESat-2 snow depth values. The dotted line is the 1-to-1 line. Marker shape and color distinguish sites. Filled markers indicate the median ICESat-2 snow depth within 500 m of the AWS and empty markers indicate the median ICESat-2 snow depth within 5 km of the AWS.
With negative ICESat-2 snow depth segments removed, the median ICESat-2 snow depth generally captures temporal accumulation and ablation patterns over the snow season at the Reynolds Creek, Banner Summit, and Mores Creek AWSs (Figs. 5, 6, 7). We define the best smoothing length as the length which minimizes snow depth uncertainty while maximizing correlation with the AWS snow depth. At Reynolds Creek and Banner Summit, the AWS snow depth is best captured by ICESat-2 at a smoothing length in the range of 300 to 700 m where the snow depth uncertainty reaches its minimum and the coefficient of determination (R2) for a linear regression fit to the ICESat-2 snow depths relative to AWS snow depths reaches its maximum for the full time period at each site (Fig. 7). At Reynolds Creek R2 is also near maximum for both the accumulation season (October–March; 0.85) and ablation season (April–September; 0.80) at the 500 m smoothing scale. At Banner Summit, snow depth R2 is ∼ 0.9 for both the accumulation season and the ablation season at the 500 m smoothing scale. Mores Creek the relationship is variable between Icesat-2 snow depths and the AWS snow depths when the smoothing length is below ∼ 1000 m and shows little change with smoothing length above ∼ 1000 m. Unlike the other sites, Dry Creek's ICESat-2 snow depth uncertainty and correlation with AWS observation are highly variable and do not show a clear trend with respect to smoothing length.
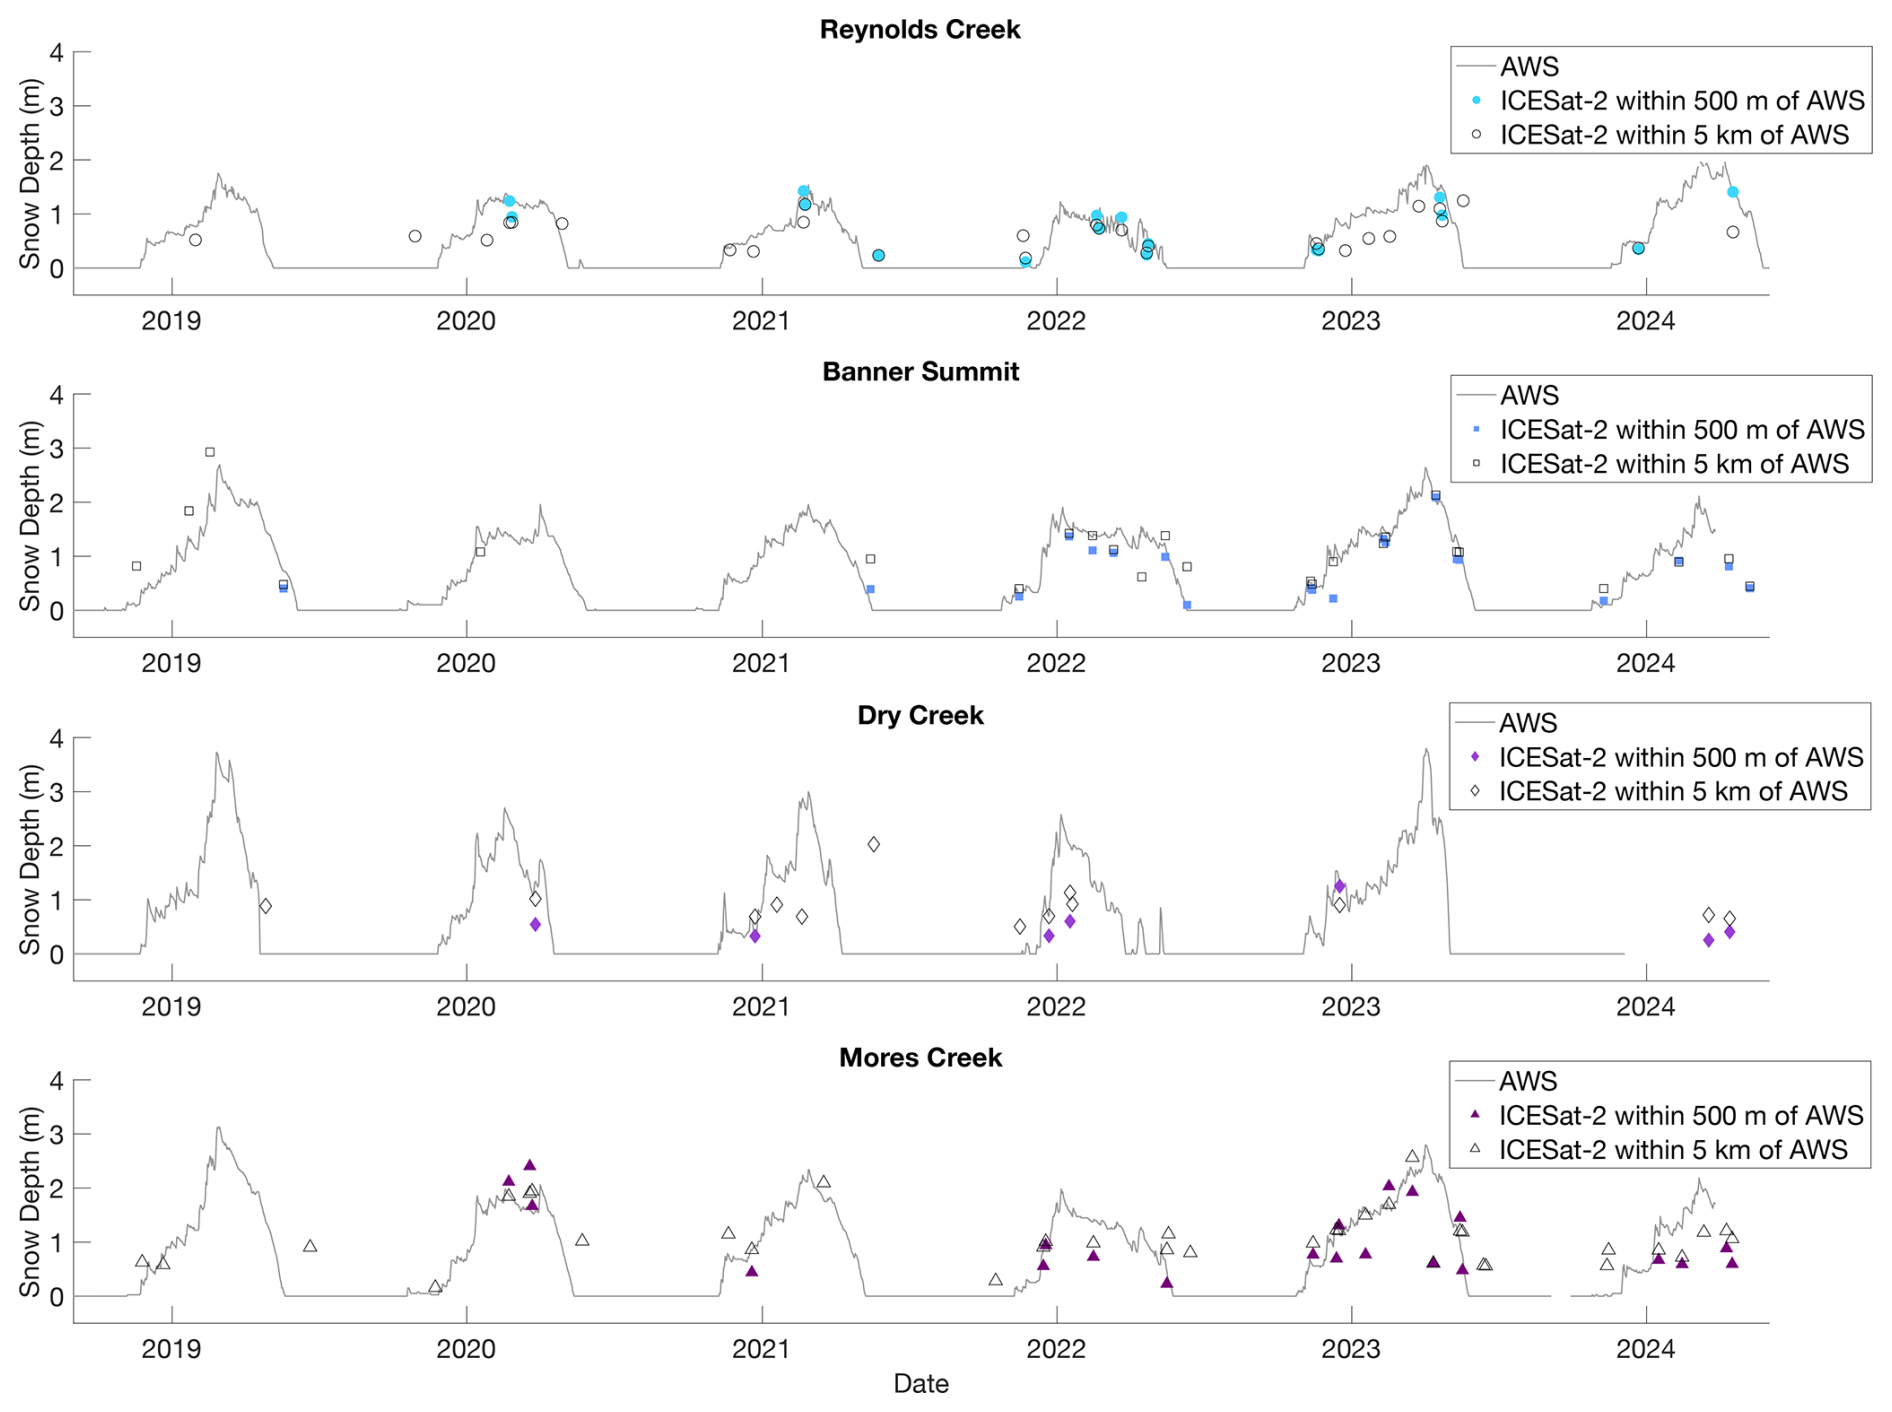
Figure 6Time series of median daily in situ AWS snow depth and median ICESat-2 snow depth with negative ICESat-2 snow depth segments removed for each ICESat-2 overpass. Marker shape and color distinguish sites as in Fig. 5. Filled markers indicate the median ICESat-2 snow depth within 500 m of the AWS and empty markers indicate the median ICESat-2 snow depth within 5 km of the AWS.
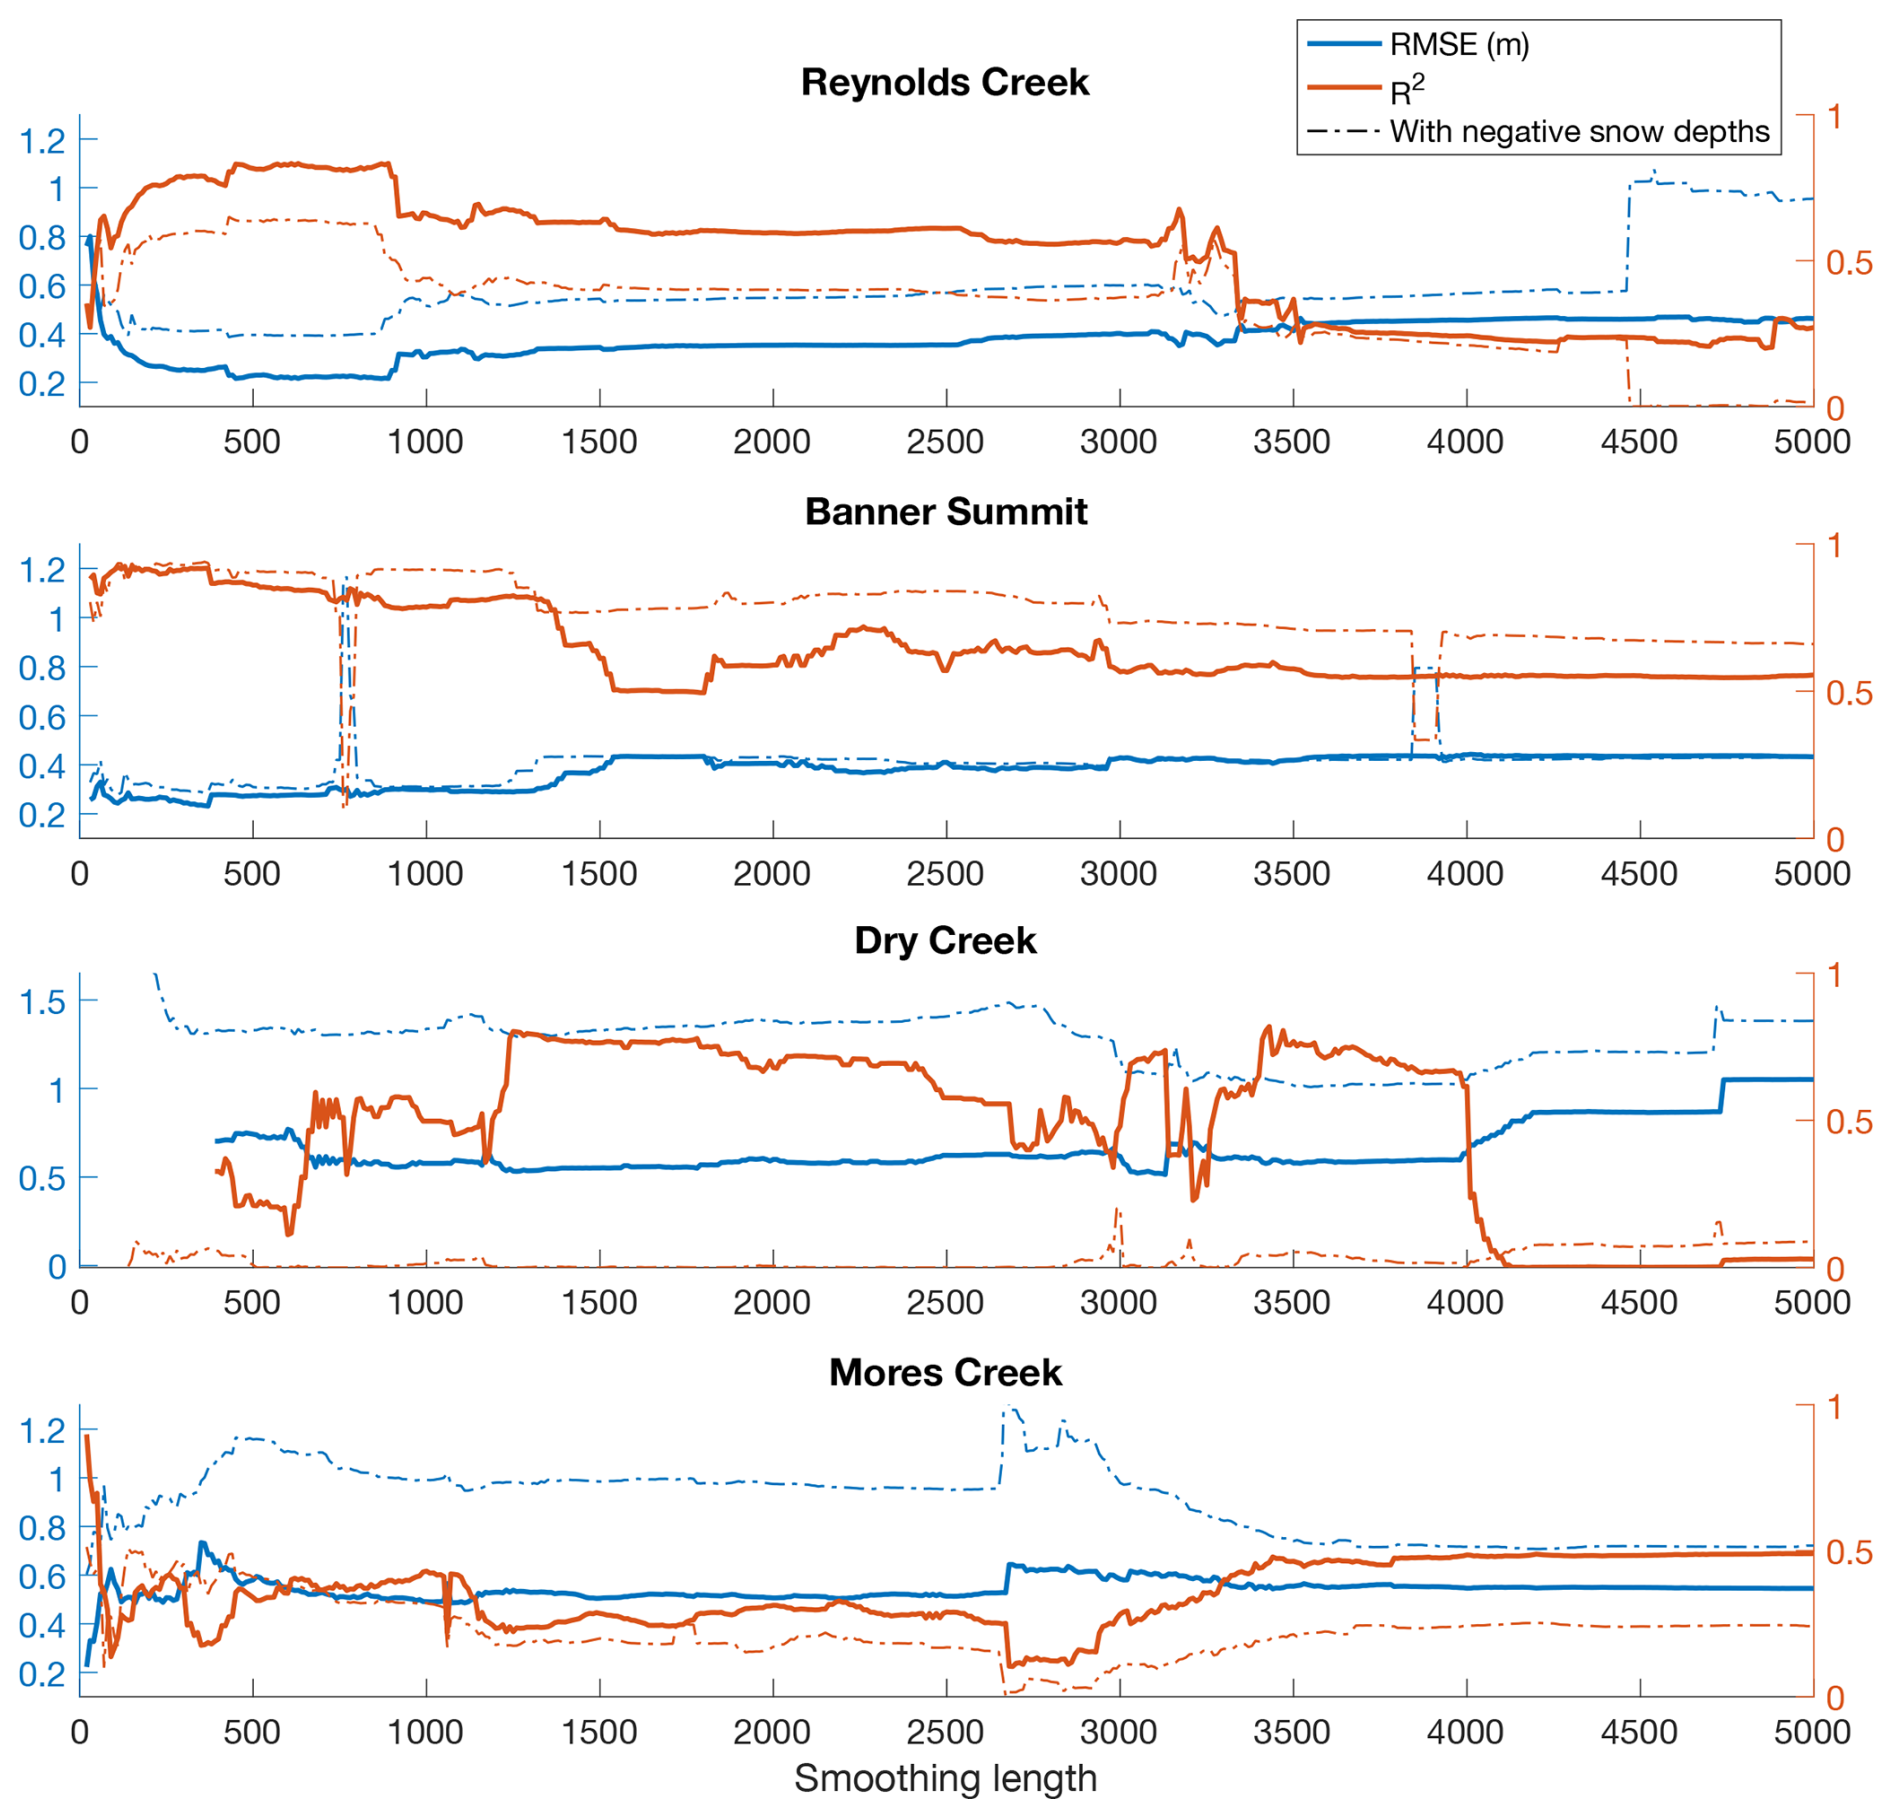
Figure 7Temporal median Icesat-2 snow depth RMSE and R2 compared to in-situ AWS snow depth at smoothing lengths ranging from 50 to 5000 m in 10 m intervals calculated with and without negative ICESat-2 snow depths removed.
Conversely, when capturing the spatial distribution of snow across a watershed larger smoothing scales have lower uncertainty and greater correlation to observed snow depths. Comparing ICESat-2 snow depths to the Mores Creek Airborne surveys ICESat-2 snow depth uncertainty and correlation with observation improve as the smoothing scale increases Comparison of ICESat-2 snow depths against Mores Creek airborne lidar snow depth indicates that ICESat-2 snow depth uncertainty and correlation both improve as smoothing length increases. The ICESat-2 uncertainty drops from 0.61 to 0.42 m while R2 rises from 0.60 to 0.72 as smoothing lengths increase from 50 to 5000 m. The Mores Creek ICESat-2 snow depth NMAD is below 0.5 m for all smoothing lengths > 800 m and filtered to slopes < 20° (Fig. 8). While uncertainty decreases at larger scales we also resolve less detail as spatial scale increases, therefore appropriate smoothing length depends on the snow depth uncertainty and spatial resolution needs of a given application.
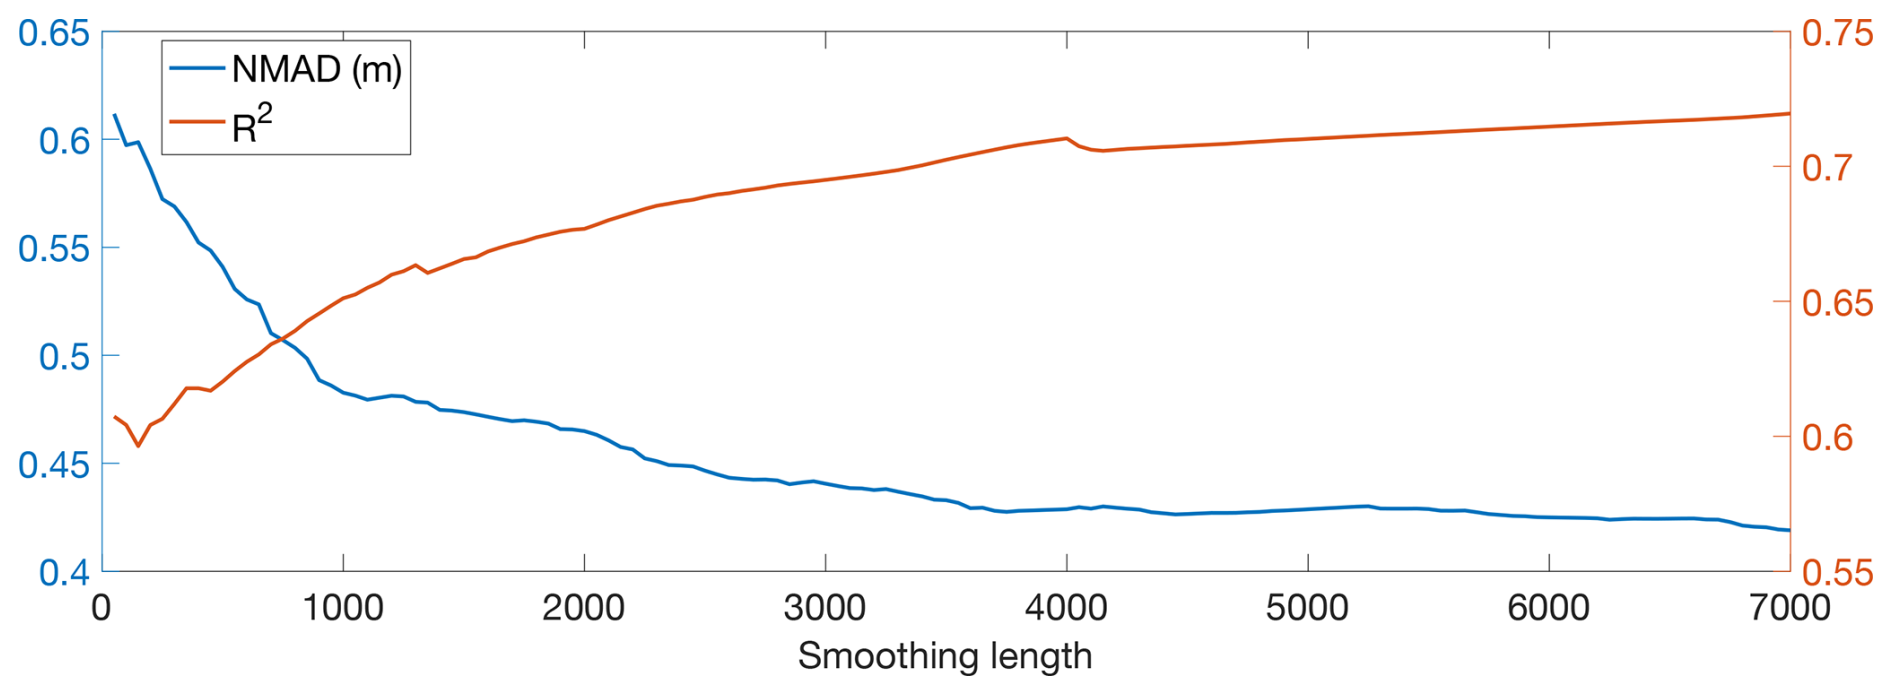
Figure 8Spatial median Icesat-2 snow depth RMSE and R2 compared to Mores Creek airborne lidar snow depths at smoothing lengths ranging from 50 to 5000 m in 10 m intervals.
To assess ICESat-2's ability to capture terrain dependent variations in snow depth, we calculate the snow depth elevation gradient at 100 m elevation increments using ICESat-2 snow depths within 5 km of the AWS for all sites and airborne lidar for Mores Creek. To reduce outliers, the median ICESat-2 snow depth is not calculated for elevation bins with fewer than 30 ICESat-2 observations. In February and March, the months of near-peak snow depth at the AWS, the ICESat-2 snow depth gradient with elevation is 0.11 m per 100 m of elevation gain at Reynolds Creek, 0.12 m at Banner Summit, and 0.18 m at Dry Creek (Fig. 9). At Mores Creek, the ICESat-2 and airborne lidar snow depth gradients with elevation are 0.23 and 0.24 m per 100 m of elevation gain, respectively.
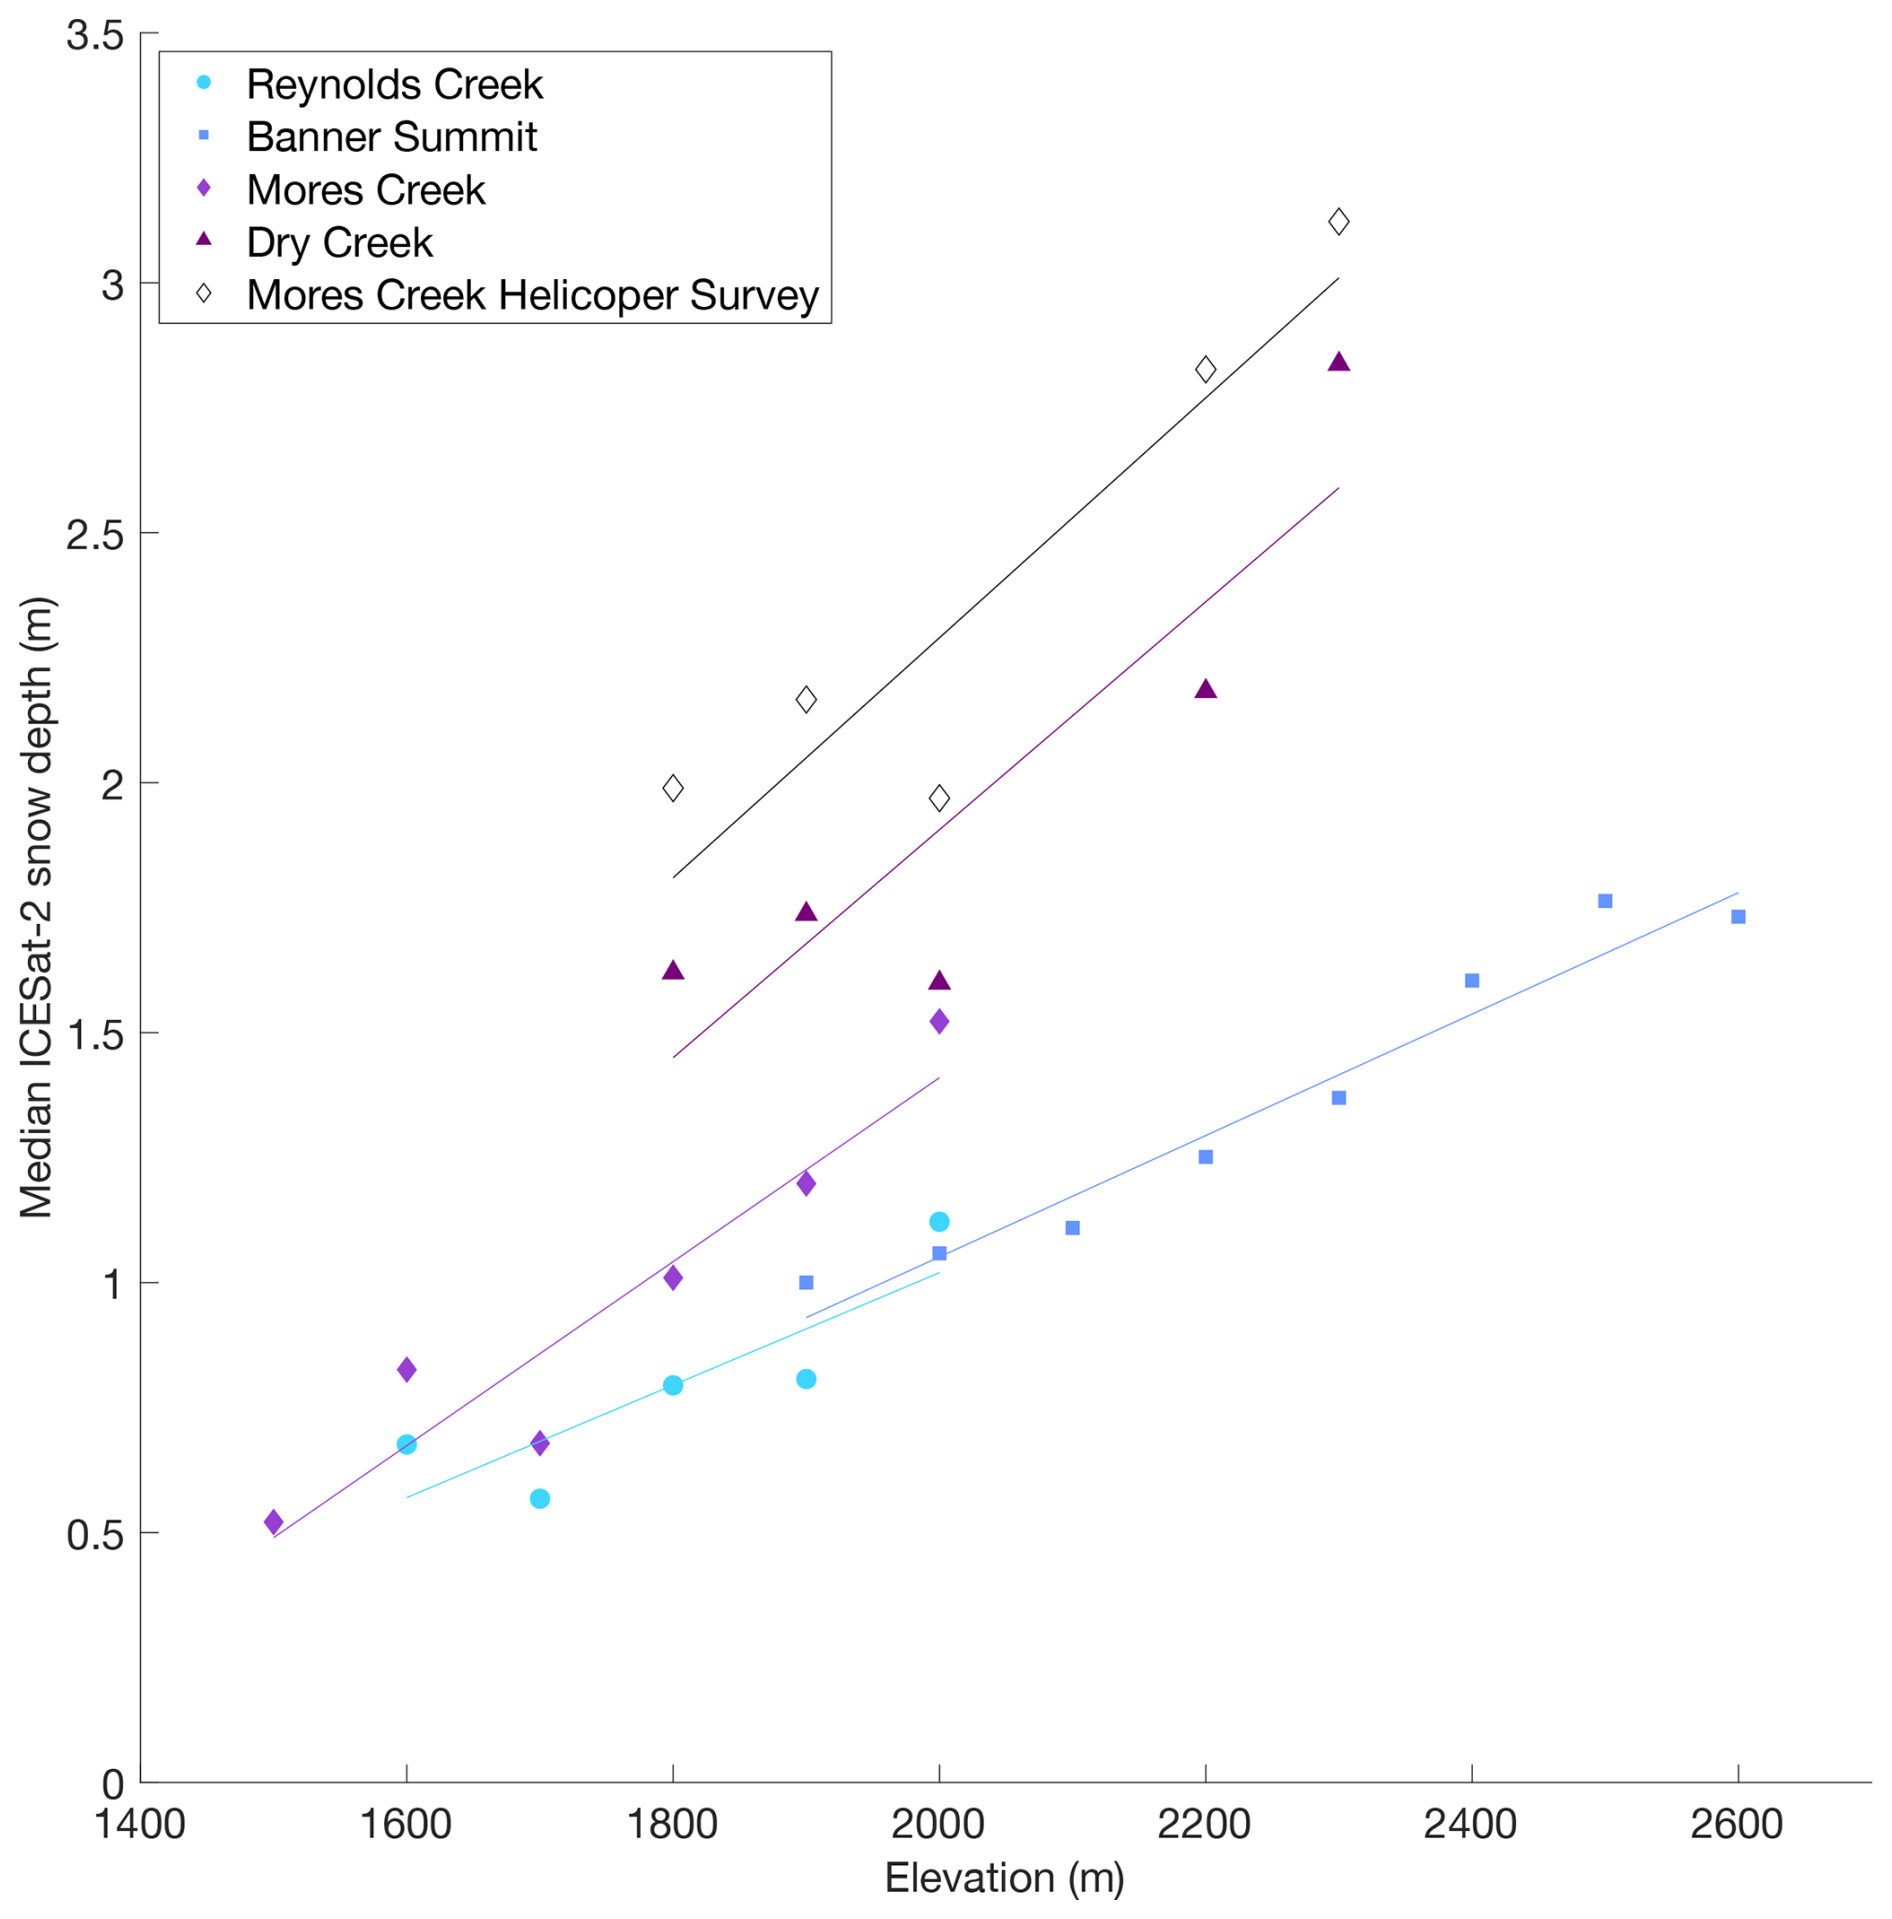
Figure 9Median February and March snow depths within 5 km of the AWS by 100 m elevation increments. Lines show a linear fit to the median snow depth. The Mores Creek ICESat-2 data has been filtering to only overpass dates near-coincident with the airborne snow depth surveys.
We find that the uncertainty in snow free ICESat-2 elevation residuals varies from ∼ 0.4 to 1.2 m depending on site. However, uncertainties in snow depths may be less than inferred from a comparison of snow-free elevations; the NMAD for the near-coincident Mores Creek airborne snow depth surveys and ICESat-2 snow-depths is ∼ 0.5 m less than the NMAD for snow-free Morse Creek terrain (1.08 m, Table 3). ICESat-2 can capture the temporal variations in snow depth measured by AWS with an RMSE as low as 0.2 m and R2 as high as 0.9, at relatively flat study plots. ICESat-2 also captures spatial distribution patterns of ICESat-2 when smoothed over sufficiently large scales. Although there is still the potential for methodological improvements, ICESat-2 is useful for mapping variations in snow depths over 100 m to kilometer scales in regions where there are slopes < 20° and snow depths exceed the approximately half-meter uncertainty, as discussed in more detail in the following sections.
The most pertinent comparisons to previous studies are to Enderlin et al. (2022), which studied Reynolds Creek, and Besso et al. (2024), which used ATL06_SR in a mountain environment. We see a marked improvement in the Reynolds Creek ICESat-2 NMAD from 0.95 m to 0.41 m that we attribute largely to the smaller segment size of ATL06_SR relative to ATL08 as used in Enderlin et al. (2022). Through comparison to AWS snow depths in a different mountain environment, Besso et al. (2024) found median ICESat-2 snow depth RMSE of 0.18-0.81 m and we obtain a comparable RMSE range of 0.22–0.51 m at optimal smoothing lengths, excluding Dry Creek (Fig. 7). We also calculate lower or comparable NMAD values at Reynolds Creek, Banner Summit, and Mores Creek to the NMAD for snow depths in Deschamps-Berger et al. (2023). The slight decrease in NMAD relative to the results of Deschamps-Berger et al. (2023) is likely due to the inclusion of ATL08 vegetation filtering in ATL06_SR, in line with the conclusions of Besso et al. (2024). However, we find our snow depth NMAD estimates still exceed those obtained over the flatter (generally < 10°) and open terrain considered in Fair et al. (2025), supporting the strong dependence of ICESat-2 snow depth accuracy on slope even with optimized processing.
5.1 Individual vs. aggregate co-registration
Careful co-registration is a critical step to reduce geolocation errors in the ICESat-2 snow depth signal, yet it remains a challenge in complex snow-covered terrain that lacks stable controls. For our final ICESat-2 snow depth analysis we apply an aggregate co-registration transform calculated from all the snow-free ICESat-2 observations to maximize stable (snow-free) observations. The orders of magnitude more data available for co-registration when the tracks are aggregated help minimize the impact of ICESat-2 noise, misidentified snow cover, and suboptimal terrain for cross-correlating distinct features with high accuracy.
There is no inherent reason why the co-registration of ICESat-2 tracks relative to a reference DTM should be constant over time, yet we found little change in uncertainty and accuracy of ICESat-2 snow depth estimates when applying no co-registration transform and a time-invariant co-registration transform while applying time-variant co-registration transform performed slightly worse than either other co-registration approach in most cases (Table 3, Fig. 3). There is large variability in estimated individuals co-registration transforms which can exceed ICESat-2 geolocation uncertainty (4.4 m; Luthcke et al. (2021), Fig. 2). Most concerningly, the application of a time-variant co-registration transform resulted in no correlation between ICESat-2 snow depths and precise independent snow depth estimates (Table 3). The high variability in time-variant co-registration of sets may be due to the limited spatial coverage of an individual overpass. If a given overpass happens to fall over a highly sloped or densely vegetated area the co-registration may be in error due to the influence of slope on ICESat-2 accuracy and precision. The poor performance of individual co-registration transforms in the winter is likely also due to sparse snow-free winter terrain. Snow coverage obscures stable terrain and when < 10 % of the region of interest is stable the accuracy of co-registration decreases with the percent of stable terrain (Nuth and Kääb, 2011). At the sites in this study, the individual ICESat-2 overpasses frequently have very few snow-free segments (< 10 % of segments).The impact of snow cover on snow-free ICESat-2 segment availability can clearly be seen at Mores Creek where only 50 % of the paired ICESat-2 and Mores Creek airborne lidar dates have any snow-free ICESat-2 returns at all with which to perform an individual co-registration. There are indications of the impact of snow-free segments in the individual co-registration transforms at each site: at Reynolds Creek and Dry Creek, the two sites that span the typical rain–snow transition line and thus often contain both snow-free and snow-covered ICESat-2 segments, there is less variability within the individual co-registration transforms than for the mostly snow-covered Banner Summit and Mores Creek (Fig. 2). It is possible that, provided a sufficient amount of snow-free observations, an individual co-registration transform calculated for each ICESat-2 overpass may be more accurate than an aggregate co-registration transform. Individual co-registration may be particularly important for tasked study sites, such as these, because the tasked off-nadir pointing angle can vary by up to 10° and uncertainty increases with deviation from an orthogonal incidence angle (Smith et al., 2019). However, for an individual co-registration viable for snow observation, a large portion of the reference DTM must be snow-free in the winter.
Co-registration remains an unsolved problem. Regardless of co-registration approach, ICESat-2 snow depth maintained a negative bias of 0.6 m and uncertainty of 1 m. Vertical co-registration is critical to remove biases between ICESat-2 and independent reference DTMs, such as the large vertical bias present at Banner Summit prior to slope correction (Fig. 4). However, there is likely a limit to the improvement possible from horizontal co-registration. Horizontal co-registration should be considered by default because there can be systematic offsets between ICESat-2 and the reference DTM depending on the georeferencing of the reference DTM, but the time and computation effort required to perform the horizontal co-registration should be weighed against potential improvements if the reference DTM has precise georeferencing.
5.2 Snow depth
ICESat-2 snow depth mapping can capture temporal and spatial snow distribution patterns but its efficacy is dependent on surface slope. In this study, we use multiple datasets for comparison error assessment: snow-free ICESat-2 elevations to snow-free reference DTMs; median ICESat-2 snow depths to AWS snow depths; and ICESat-2 snow depths to airborne lidar-based snow surveys. Each has its strengths and weaknesses. The snow-free ICESat-2 comparison to the reference DTM has the most data and is downsampled to the same spatial coverage and resolution as snow-free ICESat-2, but it is only a proxy for snow covered uncertainty. Snow depth uncertainties are generally less than snow-free uncertainties, likely because ICESat-2 returns a stronger signal from the smoother, brighter, and vegetation-free snow surface. The spatial coverage difference between ICESat-2 (a track of points across an area) versus the AWSs (a point observation) likely contributes to differences in the median ICESat-2 snow depth and AWS snow depth. Although airborne snow depths are only available for six dates at Mores Creek, they are likely a better snow depth validation dataset than the AWS snow depth as the airborne survey is downsampled to the same spatial resolution and coverage as ICESat-2. Our comparison with these data indicate that ICESat-2 systematically underestimates observed snow depth but accurately captures orographic distribution patterns across the 38 km2 area, including the drop in snow depth at 2000 m elevation (Table 3, Figs. 3, 9). Though Mores Creek has a higher snow depth uncertainty than Reynolds Creek or Banner Summit due to its steep terrain, uncertainties in ICESat-2 snow depths compared to the airborne snow depth surveys are ∼ 0.5 m when spatially smoothed and ∼ 0.7 m for individual segments, indicating that ICESat-2 is capable of capturing snow depth variability in shallow-to-moderate slope terrain.
Slope strongly influences uncertainty and bias in snow-free ICESat-2 elevations, and therefore snow depths (Table 4). As the majority of our in situ snow depth observations are point observations, we use snow-free ICESat-2 elevation residuals to gain insight on the impact of slope on uncertainty. We find snow-free uncertainties of ∼ 0.2–0.6 m for slopes < 10° while the snow-free uncertainty increases by ∼ 1 m or more when slopes are > 20°. While it is difficult to directly assess snow depth uncertainty with respect to slope, the magnitude of snow depth uncertainty at each study site follows this pattern given the distributions of slope at each site; Reynolds Creek and Banner Summit – the sites with the largest proportion of slopes < 20° – have the lowest ICESat-2 snow depth uncertainty and highest R2 across the sites, highlighting the potential utility of ICESat-2 for snow depth observations in shallow-sloped locations (Fig. 10). When compared to the Mores Creek airborne snow depth surveys, ICESat-2 snow depth agreement with the airborne observations is distinctly improved by removing observations over > 20° slope terrain (Fig. 3). At Dry Creek, where the majority of slopes are > 20°, ICESat-2 snow depths are unreliable.
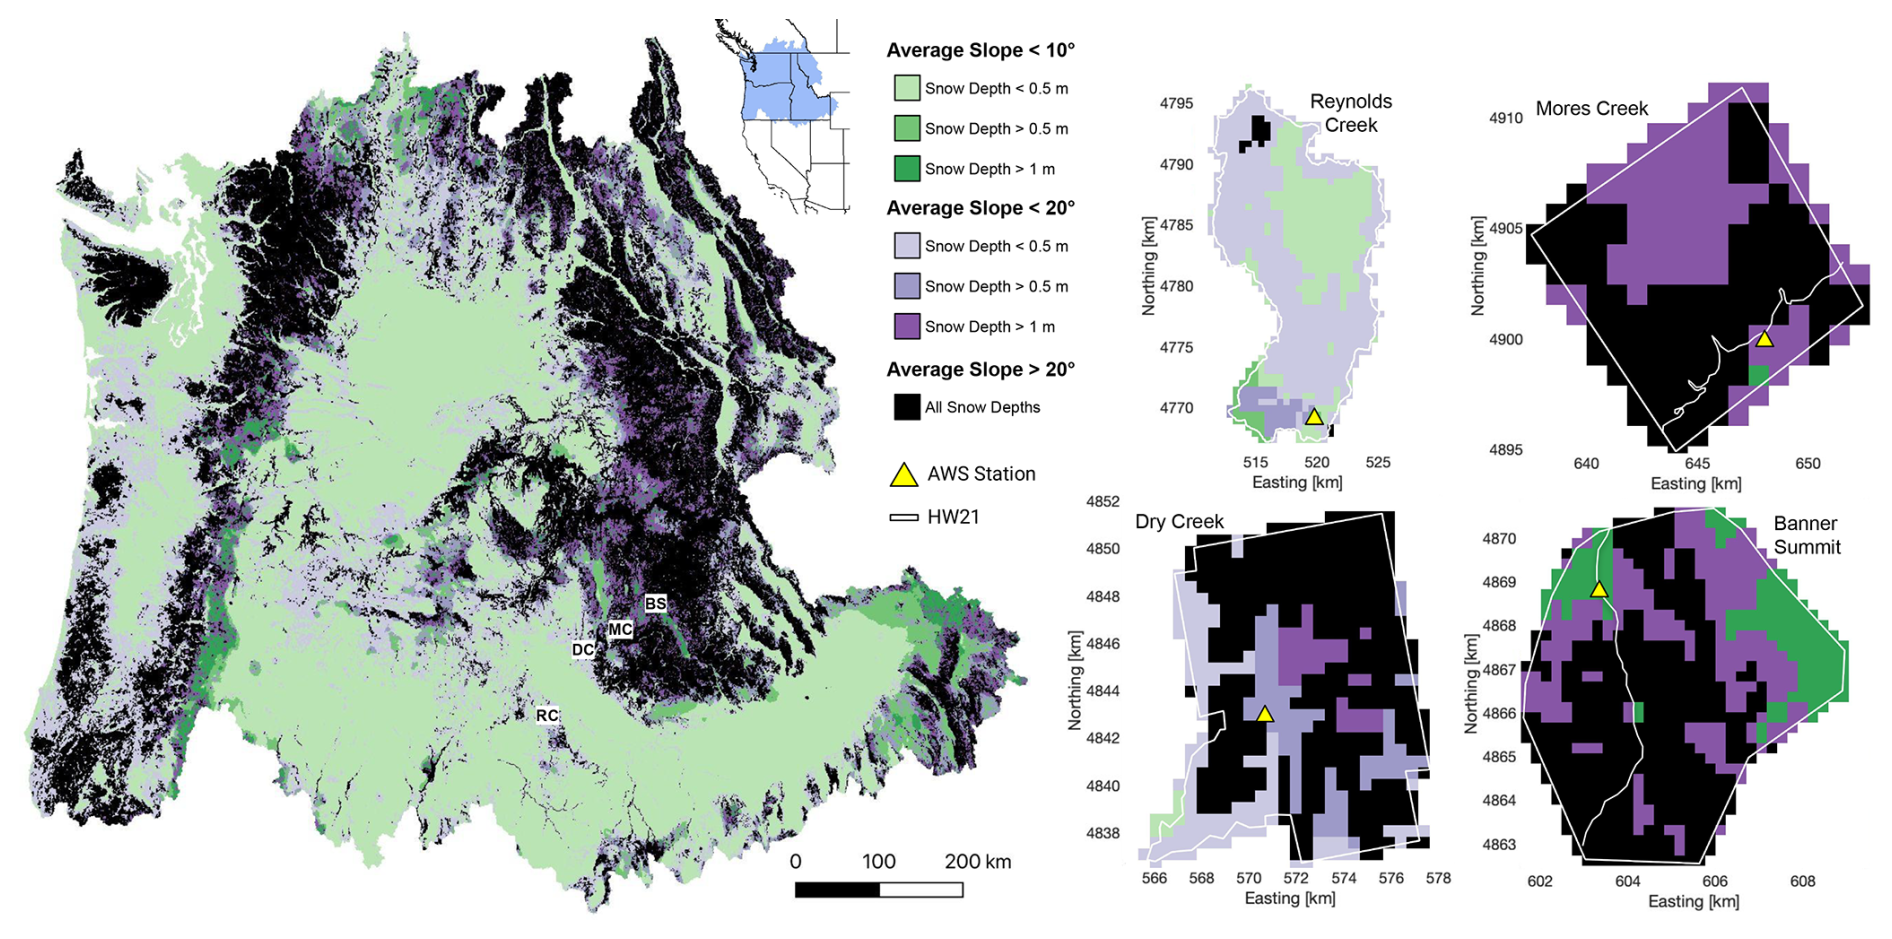
Figure 10Map of slope zones and snow depths at 1 km scale across Idaho. Cutouts show slope zones and snow depths at 500 m scale for Reynolds Creek, Banner Summit, Dry Creek, and Mores Creek. Slopes are calculated from the 30 m scale NASADEM (NASA JPL, 2020) and then averaged over 500 km. Snow depths are average early March SNODAS snow depth (National Operational Hydrologic Remote Sensing Center, 2004) from 2020–2024.
Steep slopes and abundant, mixed vegetation influence actual snow depths through their influence on wind redistribution and the surface energy balance (Winstral and Marks, 2014; Mott et al., 2018; Dharmadasa et al., 2023) and influence apparent snow depths through their impact on lidar returns to the sensor. Low bushy vegetation can influence both real and apparent snow depths. Low, dense bushes can be misclassified as ground in the snow free reference DTM and can create the illusion of negative snow depth (Hopkinson et al., 2004; Tinkham et al., 2011; Gould et al., 2013; Tinkham et al., 2014; May et al., 2025). Bushes are found in all our sites and likely bias the median reference elevation when misidentified as ground, resulting in apparent negative snow depths. The Reynolds Creek and Banner Summit AWSs are surrounded by rolling and relatively open terrain, likely contributing to both site's small snow depth uncertainty (∼ 0.2–0.4 m). The higher snow depth uncertainty at Dry Creek and Mores Creek (∼ 0.5–0.8 m) is likely due to the steep and vegetated terrain surrounding the AWS at each site. Removing negative ICESat-2 snow depths before calculating the median ICESat-2 snow depth reduces bias and uncertainty of the ICESat-2 snow depth estimates, but is sensitive to the vertical co-registration. If negative values are not removed, the median ICESat-2 snow depth systematically underestimates AWS snow depths (Fig. 5). However the data suggests that shallow (< 0.5 m) snow depths may be slightly over-estimated by the median ICESat-2 snow depth when negative ICESat-2 snow depths are removed (Fig. 5). The reductions in bias and uncertainty that result from the removal of negative snow depths are greater than if the data are filtered to remove snow depths over slopes > 20°, indicating that at least a portion of the erroneous snow depths are caused by vegetation effects. The overestimation of shallow snow depths could be mitigated by lowering the minimum snow depth threshold below 0 m based on ICESat-2 snow depth uncertainty, however this also increases the impact of outliers on deeper snow depth estimates.
Spatial smoothing of ICESat-2 snow depths can reduce uncertainty, though the optimal smoothing length depends on terrain and application because actual snow depths and errors vary with slope and vegetation. A larger smoothing length will reduce random errors but may span a wide range of snow depths. A smaller smoothing length may span a smaller range of snow depths, making the estimate more directly comparable to a point in situ observation, but will decrease the number of ICESat-2 segment observations within the smoothing length thus increasing the impact of random errors. We find that when trying to capture the temporal snow depth patterns at a AWS (a point observation) snow depth is best captured by ICESat-2 at a smoothing scale in the range of 300 to 700 m. A 500 m smoothing length contains less terrain variability than longer lengths while still containing a reasonable number of ICESat-2 segment observations (average 13 ICESat-2 segments) as opposed to a 100 m smoothing length (average 3 ICESat-2 segments). Conversely by comparing ICESat-2 to the Mores Creek airborne snow depth surveys we find that ICESat-2 snow depth uncertainties and correlation with observed spatial snow distribution patterns increases with smoothing scale, with uncertainties dropping below 0.5 m when smoothing length is > 800 m. To calculate the snow depth elevation gradient we were able to maintain larger numbers (> 30) of segment observations at a 100 m scale by grouping the data into elevation zones across the watershed rather than 100 m spatial regions. Grouping the ICESat-2 snow depth data into elevation zones may be more effective for characterizing snow depths across a landscape than directly calculating spatial distribution as it maintains a high spatial resolution while averaging over many data points to reduce variability. An elevation-based averaging approach inherently assumes that the primary control on snow depth is elevation; generally this applies (Fig. 9), but slope and vegetation density varies greatly across the terrain, resulting in large variation in snow depth at a given elevation. Grouping the data by elevation zones may obscure other terrain controls on snow depth, however some terrain controls on snow depth may also be obscured by estimating snow depth at the larger spatial smoothing scales required to achieve similar data density. The snow depth averaging approach should be selected based on a given project's needs and these sampling considerations.
5.3 Mapping Applicability for ICESat-2 Snow Depth Measurement
ICESat-2 snow depth mapping is promising, capturing spatial and temporal distribution patterns at scales of 100–1000 m; however, ICESat-2 snow depths are not reliable in all conditions. Based on the results for our study sites, we recommend using ICESat-2 snow depth mapping in regions with a majority of slopes < 20°. For example, at Mores Creek (Fig. 9a), when ICESat-2 returns from steep slopes (> 20°) are filtered, snow depth uncertainty is ∼ 0.3–0.7 m. Although ICESat-2 snow depth uncertainties can be as low as 0.2 m where the majority of slopes are < 10°, based on the relative abundance of shallow-sloped regions at our sites and across Idaho more broadly, restricting ICESat-2 application to such shallow-sloped regions will limit their usefulness. Our work reveals that slope introduces a progressive negative bias and increasing uncertainty. Calculating and applying a site specific slope correction removes the progressive bias and reduces uncertainty up to 30 % so ICESat-2 can be used for snow depth observation in more complex terrain with appropriate spatial averaging.
As with all lidar techniques, care must be taken when interpreting snow-covered ATL06_SR elevations with respect to a reference DTM in regions where low matted vegetation is present (Tinkham et al., 2014; May et al., 2025), regardless of slope. Deep snow covers and smooths low vegetation and small-scale topographic roughness, combined with the high reflectiveness of the snow surface this increases photon return density and accuracy resulting in a more precise snow signal relative to regions with a shallow snowpack (Deems et al., 2013; Filhol and Sturm, 2019; Smith et al., 2019). The effects of vegetation on snow depth uncertainties are demonstrated through a comparison of Mores Creek and Banner Summit: though Mores Creek and Banner Summit have similar slope distribution, the snow depth uncertainties at Mores Creek are slightly larger than for Banner Summit likely due to the abundance of low bushes in close proximity to the Mores Creek AWS. However, the snow depth uncertainty for Mores Creek is ∼ 1 m less than for Dry Creek despite similar vegetation at both sites, which we attribute to the combined effects of more snow-compressed vegetation and shallower slopes at Mores Creek on lidar returns. Even with these corrections, sites like Dry Creek, where steep slopes (majority > 20°) and bushy terrain increase snow depth uncertainty to 1.5 m and snow depth error to 1.2 m, are ill-suited for ICESat-2 observation.
As a reference, we demonstrate where ICESat-2 is expected to yield useful snow depth estimates in Idaho based on slope and the snow depth relative to an estimated uncertainty of ∼ 0.5 m. We use the 30 m NASADEM (NASA JPL, 2020) to estimate slope and the average March SNODAS model output (National Operational Hydrologic Remote Sensing Center, 2004) to estimate peak snow depths (Fig. 10). The state is first classified by slope at 10° increments, then the slope classes are parsed based on their approximate snow depth (Table 4). Although uncertainties in SNODAS and the NASADEM are large, the classified map of Idaho demonstrates why Mores Creek is a reasonable site for ICESat-2 snow depth mapping but Dry Creek is not: though Mores Creek is predominantly steep terrain, the snowpack is deep, whereas Dry Creek is steep and has a shallow snowpack. In contrast, Banner Summit, where we see the lowest ICESat-2 snow uncertainty and highest correlation with in situ snow depth, has a deep snowpack and contains shallow-sloped regions that are ideal for accurate ICESat-2 snow depth estimates. In addition to these slope and snow depth thresholds, we recommend that future applications of ICESat-2 consider both the density and type of vegetation in the study region (Neuenschwander et al., 2020) to maximize the likelihood of canopy penetration and ground identification.
Here we use the NASADEM for visualization of slope ranges, however we do not recommend NASADEM for ICESat-2 snow depth mapping due to its coarse resolution (30 m) and potential vegetation effects. Fortunately, there are publicly available high resolution (< 5 m) DTMs of many snow dependent regions. For example, the USGS 3D Elevation Program (3DEP) has publicly available 1 m resolution DTM coverage for over 70 % of the Western United States and is working toward 100 % coverage. Other mountain regions also have high resolution lidar DTM coverage, such as the Swiss national DTM (swissALTI3D). Utilizing these snow-free DTMs in conjunction with ICESat-2 data has the potential to drastically expand snow observation in mid-latitudes.
Detailed snow depth observation of key watersheds is critical to understanding present and future water availability as the changing climate strains snow water resources. Satellite remote sensing provides a path to meet global snow observation needs in mountain environments where observations are limited. NASA's ICESat-2 satellite lidar altimeter shows promising terrain-dependent potential for snow depth profiling; however, high ICESat-2 uncertainties from terrain, vegetation, and geolocation offsets complicate returns. In this study, we refine ICESat-2 snow depth measurement workflows for mountain environments, validate spatial and temporal snow distribution patterns against in situ and airborne snow depth observations, and identify terrain where ICESat-2 snow depth mapping has the most potential.
ICESat-2 snow depths were calculated by differencing snow-covered ATL06_SR (a customized ICESat-2 ATL06-like product that implements photon classification from the ATL08 product, Besso et al. (2024)) elevations from snow-free reference DTMs. ICESat-2 snow depths were calculated for four sagebrush-steppe and mixed-conifer alpine study sites of varying terrain complexity in central and southern Idaho: Reynolds Creek, Banner Summit, and Dry Creek, and Mores Creek. The median ICESat-2 snow depths calculated at spatial smoothing lengths ranging from 50 to 5000 m were validated against in situ AWS snow depths in each site. At Mores Creek, ICESat-2 snow depths are additionally compared to six airborne lidar snow depth surveys of the site.
We find that ICESat-2 snow depth mapping is most successful in areas where the majority of slopes are < 20° and snow depths are > 0.5 m (Figs. 5, 6). At sites where the majority of slopes are < 20° (Reynolds Creek, Banner Summit, and Mores Creek) the median ICESat-2 snow depth uncertainty is ∼ 0.2–0.6 m with a R2 correlation of ∼ 0.3–0.9 to the AWS snow depth at a smoothing length of 500 m (Figs. 5a, 7, Appendix Table A1). The airborne surveys suggest ICESat-2 best captures spatial snow distribution patterns at greater than 800 m scale, however terrain controlled patterns can be resolved at scales as small as 100 m by grouping the data into zones across the watershed (Figs. 8, 9). As previously identified, there is a progressive negative slope bias in the ICESat-2 data (Fig. 4, Enderlin et al. (2022)). Deschamps-Berger et al. (2023) also found a progressive, though positive, slope bias. ICESat-2 snow-free elevation uncertainty increases by ∼ 1 m when slopes are > 20°, compared to slopes < 10° (Fig. 4, Table 4). A quadratic slope correction removes the bias and improves the uncertainty except when slopes are < 10° (Table 4). ICESat-2 snow depth uncertainty and correlation compared to AWS snow depths generally improve as the smoothing length decreases, while ICESat-2 snow depth uncertainty and correlation compared to airborne lidar snow depths with equivalent spatial coverage generally improve as the smoothing length increases. Removing negative ICESat-2 snow depths before calculating the median ICESat-2 snow depth improves uncertainty and correlation at all smoothing scales (Figs. 5, 7). The improvement is most pronounced at sites with few slopes < 10° (Mores Creek).
While ICESat-2 snow depth mapping is not reliable in all environments, large portions of Idaho fall within the moderate slope, deep snowpack terrain perimeters optimal for ICESat-2 observation (Fig. 10). Similarly large portions of other mountainous regions likely also contain terrain where ICESat-2 snow depth observation is reasonable. Utilizing available high resolution DTMs of these areas, such as those from USGS 3DEP, in conjunction with ICESat-2 data can drastically expand spatial and temporal snow observation coverage. While ICESat-2 cannot solely describe the snowpack, ICESat-2 snow depth measurements weave into the larger array of snow observation techniques and modeling efforts creating a more complete and robust understanding of our seasonal snow reservoirs.
ICESat-2 snow depth mapping is a relatively new method, thus optimal workflows are still being developed. As we developed the workflow presented herein we tested several other changes to co-registration, ICESat-2 processing, and snow-free reference elevation estimation that we either found to be impractical or have little to no impact on ICESat-2 snow depth precision or accuracy. To help guide future improvements to ICESat-2 snow depth mapping we briefly discuss the workflow variations we explored and areas where there are potential opportunities for improvement.
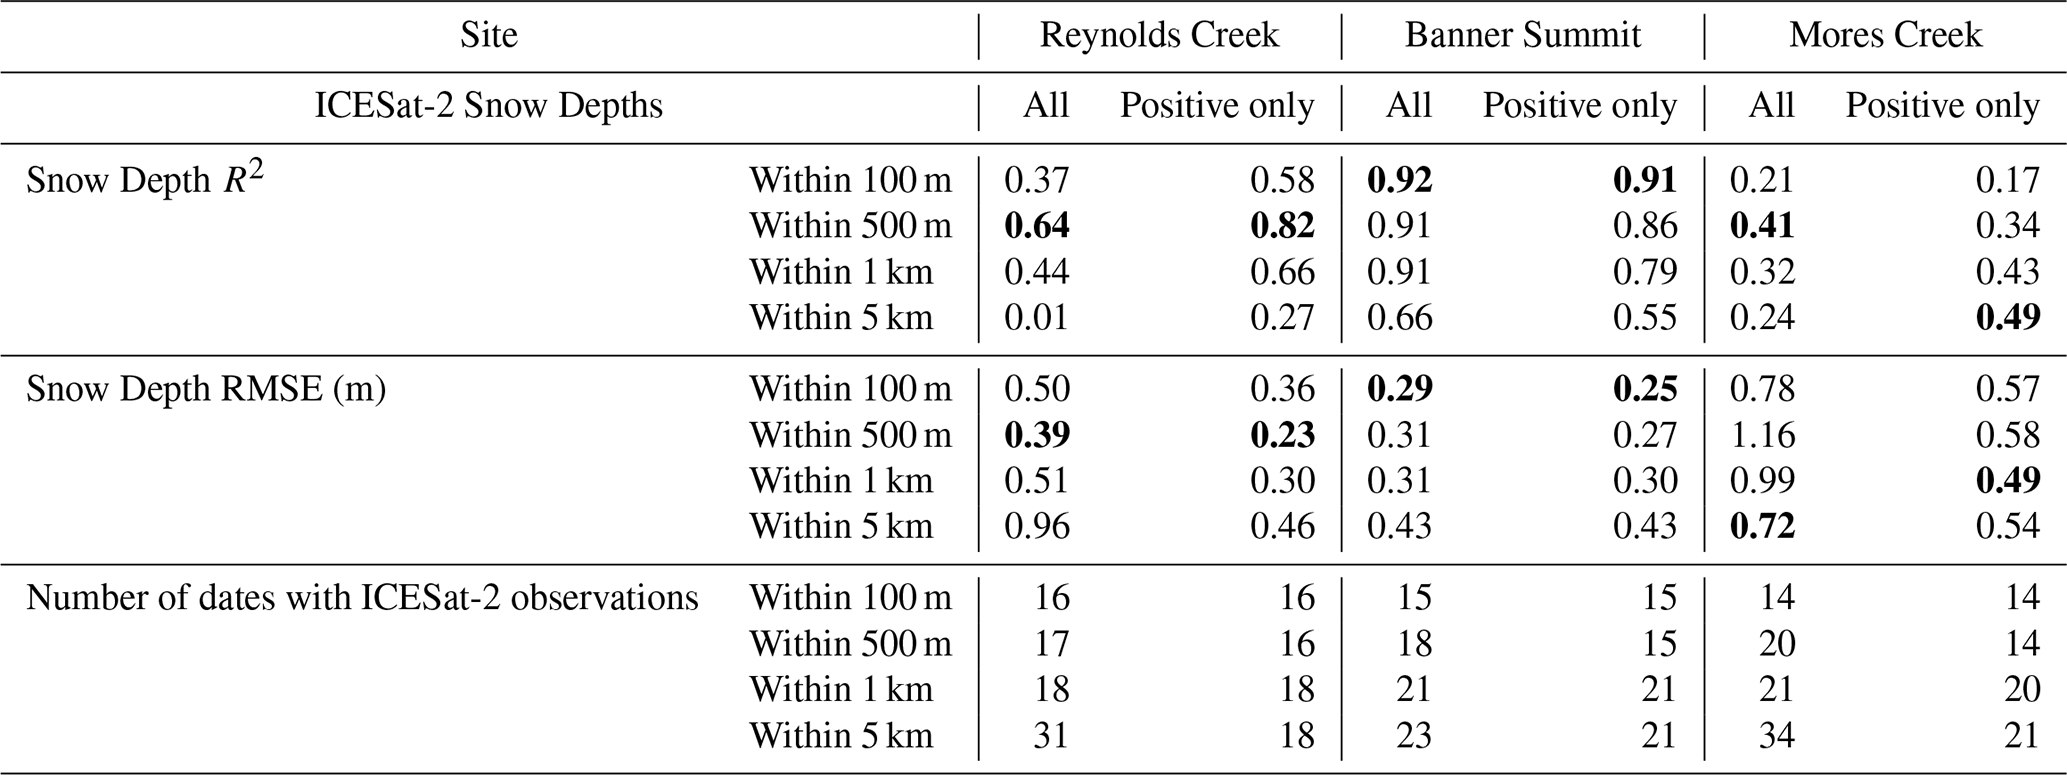
Table A1Snow depth R2 , RMSE, and number of snow depth observations for ICESat-2 snow depths relative to AWS snow depths within 100, 500, 1000, and 5000 m of the AWS at each site. Bold numbers are the highest R2 and lowest RMSE at each study site for all ICESat-2 snow depths (left columns) and positive-only ICESat-2 snow depths (right columns). Statistics are not reported for Dry Creek due to limited data (≤5 dates with ICESat-2 observations).
There is no inherent reason why the co-registration for ICESat-2 tracks relative to a reference DTM should be constant over time, yet we found that application of a time-invariant co-registration transform resulted in ICESat-2 snow depths that were closest to precise independent snow depth estimates (Table 3, Fig. 3). We attribute the larger uncertainty in individually co-registered ICESat-2 snow depths to imprecise co-registration due to sparse snow-free pixel in a given overpass and misclassification of snow-free segments using near-coincident Sentinel-2 and Landsat 8/9 NDSI maps. The lack of snow-free segments available for co-registration could be addressed by including snow-free winter terrain in the AOI. We attempted to include winter snow-free terrain where we could but were limited by available high-resolution DTM coverage. Temporal separation between ICESat-2 and Landsat/Sentinel-2 observation, cloud masking, and mixed cover pixels can all cause misclassification of ATL06_SR segments. To minimize contamination of the snow-covered and snow-free segments the thresholds for snow-covered and snow-free segments could be raised.
In our preliminary method development we tested two separate horizontal co-registration algorithms in addition to the iterative grid search we use in the finalized workflow: the Nuth and Kääb (2011) co-registration algorithm (as used in Deschamps-Berger et al. (2023)), and a gradient descent (as used in Enderlin et al. (2022)). All co-registrations used the snow-free ICESat-2 residual NMAD as the minimization parameter. We were only able to perform a Nuth and Kääb (2011) co-registration in Reynolds Creek because the smaller study sites did not have sufficient data for robust co-registration using this algorthim. Both the Nuth and Kääb (2011) co-registration and the gradient descent co-registration identified horizontal transforms on the order of 1e-4 m while the grid search identified larger horizontal transforms of up to 1.1 m using aggregated ICESat-2 data and up to 8.9 m using individual ICESat-2 data. The larger transforms have a smaller snow-free ICESat-2 residual NMAD then the near-zero transforms found using the Nuth and Kääb (2011) co-registration and the gradient descent. We decided to use the iterative grid search for its reliability, however by adjusting the gradient descent initial guess and resolution a gradient descent should capture the global minimum found using the interactive grid search. For a larger AOI with more available data and complex terrain the Nuth and Kääb (2011) co-registration may be appropriate.
The accuracy of the ICESat-2 snow depths are dependent on the snow-free reference elevations calculated from the snow-free reference DTM. In addition to using the mean DTM elevation within each ATL06_SR segment as the reference ground elevation we tested linear interpolation of the DTM to the ICESat-2 segment centroids (similar to Besso et al. (2024) and Deschamps-Berger et al. (2023)) and weighted mean elevation approaches. For the weighted mean approach, across-track Gaussian-weighting was applied in an attempt to mimic the distribution of photons due to beam spreading. For our study sites, snow depth calculated using the mean DTM elevation as the snow-free reference elevation most closely matches the validation snow depths.
The code used to calculate ICESat-2 snow depths is available at https://github.com/CryoGARS-Glaciology/ICESat2-AlpineSnow (last access: 11 September 2025) or https://doi.org/10.5281/zenodo.17101987 (Zikan and Enderlin, 2025a). The code used to map snow cover is available at https://doi.org/10.5281/zenodo.14868024 (Aberle and Enderlin, 2025). The ICESat-2 snow depth datasets are available at https://doi.org/10.18122/cryogars_snow_data.6.boisestate (Zikan and Enderlin, 2025b).
EE conceptualized the project. KZ and EE developed the data processing codes. KZ processed the data and performed the analysis with supervision from EE, SO, and HM. KZ prepared the manuscript with contributions from all co-authors.
The contact author has declared that none of the authors has any competing interests.
Publisher's note: Copernicus Publications remains neutral with regard to jurisdictional claims made in the text, published maps, institutional affiliations, or any other geographical representation in this paper. The authors bear the ultimate responsibility for providing appropriate place names. Views expressed in the text are those of the authors and do not necessarily reflect the views of the publisher.
We would like to thank the members of the CryoGARS-Glaciology lab for their feedback and assistance downloading and processing ICESat-2 tracks; we are grateful to Rainey Aberle for providing the snow cover mapping code. Additionally, we thank Kate Hemingway for offering their expertise as a proofreader.
This research has been supported by the National Aeronautics and Space Administration (grant no. EPSCoR 80NSSC20M0222) and the National Science Foundation (grant no. GRFP 2023353206).
This paper was edited by Benjamin Smith and reviewed by César Deschamps-Berger and one anonymous referee.
Aberle, R. and Enderlin, E.: RaineyAbe/glacier-snow-cover-analysis: First release (0.0.1), Zenodo [code], https://doi.org/10.5281/zenodo.14868024, 2025. a
Adebisi, N., Marhsall, H.-P., ONeel, S., Vuyovich, C., Hiemstra, C., and Elder, K.: SnowEx20-21 QSI Lidar DEM 0.5m UTM Grid, NASA National Snow and Ice Data Center Distributed Active Archive Center, Version 1 [data set], https://doi.org/10.5067/YO583L7ZOLOO, 2022. a, b
Barnett, T. P., Adam, J. C., and Lettenmaier, D. P.: Potential impacts of a warming climate on water availability in snow-dominated regions, Nature, 438, 303–309, https://doi.org/10.1038/nature04141, 2005. a
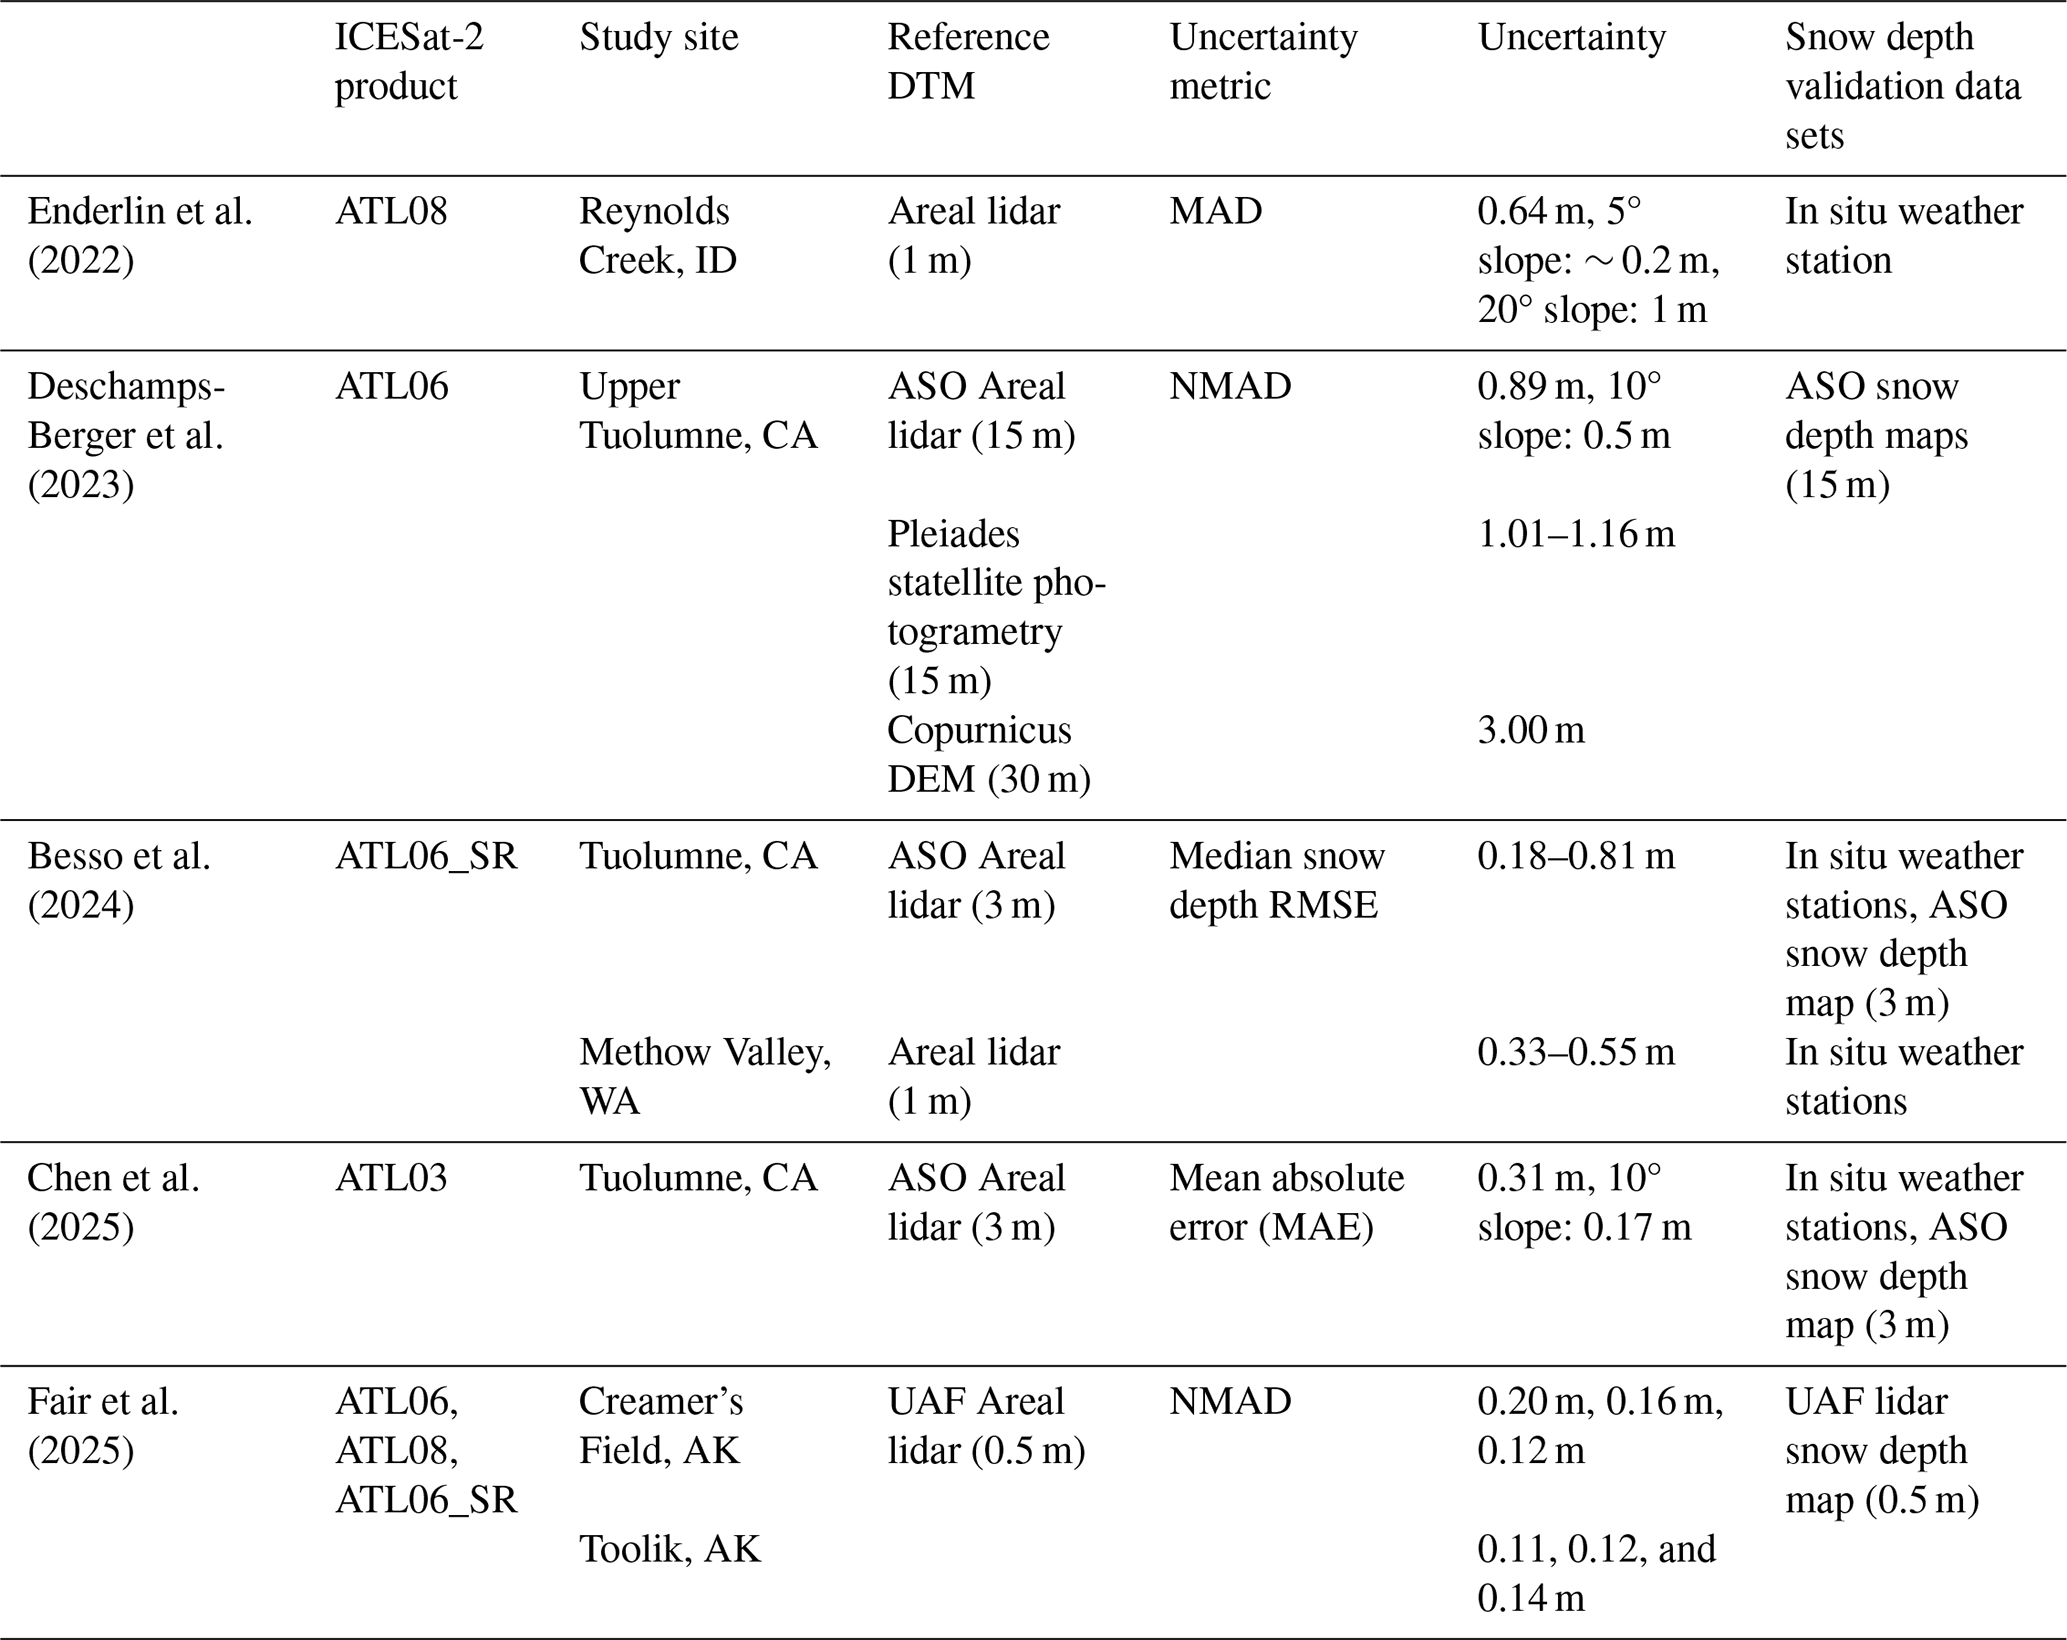
Besso, H., Shean, D., and Lundquist, J. D.: Mountain snow depth retrievals from customized processing of ICESat-2 satellite laser altimetry, Remote Sens. Environ., 300, 113843, https://doi.org/10.1016/j.rse.2023.113843, 2024. a, b, c, d, e, f, g, h, i, j, k, l, m, n, o
Chen, T., Jiang, L., Yang, J., Kong, D., and Pang, Y.: An improvement in ICESat-2 ATL03 snow depth estimation: a case study in the Tuolumne Basin, USA, Int. J. Digit. Earth, 18, 2505628, https://doi.org/10.1080/17538947.2025.2505628, 2025. a, b, c, d, e
Ciafone, S., ONeel, S., Adebisi, N., Zikan, K., Enterkine, J., van der Weide, T., Wilder, B., Hoppinen, Z., Filiano, D., and Marshall, H. P.: SnowEx Mores Creek Summit (MCS) Airborne LiDAR Survey, Version 1, NASA National Snow and Ice Data Center Distributed Active Archive Center [data set], https://doi.org/10.5067/NE8CLN3ES5XQ, 2024. a
Deems, J. S., Fassnacht, S. R., and Elder, K. J.: Fractal Distribution of Snow Depth from Lidar Data, J. Hydrometeorol., 7, 285–297, https://doi.org/10.1175/JHM487.1, 2006. a
Deems, J. S., Painter, T. H., and Finnegan, D. C.: Lidar measurement of snow depth: a review, J. Glaciol., 59, 467–479, https://doi.org/10.3189/2013JoG12J154, 2013. a, b, c, d, e
Deschamps-Berger, C., Gascoin, S., Shean, D., Besso, H., Guiot, A., and López-Moreno, J. I.: Evaluation of snow depth retrievals from ICESat-2 using airborne laser-scanning data, The Cryosphere, 17, 2779–2792, https://doi.org/10.5194/tc-17-2779-2023, 2023. a, b, c, d, e, f, g, h, i, j, k, l, m, n
Dharmadasa, V., Kinnard, C., and Baraër, M.: Topographic and vegetation controls of the spatial distribution of snow depth in agro-forested environments by UAV lidar, The Cryosphere, 17, 1225–1246, https://doi.org/10.5194/tc-17-1225-2023, 2023. a
Dozier, J., Bair, E. H., and Davis, R. E.: Estimating the spatial distribution of snow water equivalent in the world's mountains, WIREs Water, 3, 461–474, https://doi.org/10.1002/wat2.1140, 2016. a
Durand, M., Barros, A., Dozier, J., Adler, R., Cooley, S., Entekhabi, D., Forman, B. A., Konings, A. G., Kustas, W. P., Lundquist, J. D., Pavelsky, T. M., Rodell, M., and Steele‐Dunne, S.: Achieving Breakthroughs in Global Hydrologic Science by Unlocking the Power of Multisensor, Multidisciplinary Earth Observations, AGU Advances, 2, e2021AV000455, https://doi.org/10.1029/2021AV000455, 2021. a
Elder, K., Dozier, J., and Michaelsen, J.: Snow accumulation and distribution in an Alpine Watershed, Water Resour. Res., 27, 1541–1552, https://doi.org/10.1029/91WR00506, 1991. a
Enderlin, E. M., Elkin, C. M., Gendreau, M., Marshall, H., O'Neel, S., McNeil, C., Florentine, C., and Sass, L.: Uncertainty of ICESat-2 ATL06- and ATL08-derived snow depths for glacierized and vegetated mountain regions, Remote Sens. Environ., 283, 113307, https://doi.org/10.1016/j.rse.2022.113307, 2022. a, b, c, d, e, f, g, h, i, j, k, l, m, n, o, p
Fair, Z., Vuyovich, C., Neumann, T., Larsen, C. F., Stuefer, S., Mason, M., and May, L.: Characterizing ICESat‐2 Snow Depths Over the Boreal Forests and Tundra of Alaska in Support of the SnowEx 2023 Campaign, Water Resour. Res., 61, e2024WR039076, https://doi.org/10.1029/2024WR039076, 2025. a, b, c, d, e
Filhol, S. and Sturm, M.: The smoothing of landscapes during snowfall with no wind, J. Glaciol., 65, 173–187, https://doi.org/10.1017/jog.2018.104, 2019. a
Freudiger, D., Kohn, I., Seibert, J., Stahl, K., and Weiler, M.: Snow redistribution for the hydrological modeling of alpine catchments, WIREs Water, 4, e1232, https://doi.org/10.1002/wat2.1232, 2017. a
Gascoin, S., Grizonnet, M., Bouchet, M., Salgues, G., and Hagolle, O.: Theia Snow collection: high-resolution operational snow cover maps from Sentinel-2 and Landsat-8 data, Earth Syst. Sci. Data, 11, 493–514, https://doi.org/10.5194/essd-11-493-2019, 2019. a, b
Gould, S. B., Glenn, N. F., Sankey, T. T., and McNamara, J. P.: Influence of a Dense, Low-height Shrub Species on the Accuracy of a Lidar-derived DEM, Photogramm. Eng. Rem. S., 79, 421–431, https://doi.org/10.14358/PERS.79.5.421, 2013. a
Hall, D. K., Riggs, G. A., and Salomonson, V. V.: Development of methods for mapping global snow cover using moderate resolution imaging spectroradiometer data, Remote Sens. Environ., 54, 127–140, https://doi.org/10.1016/0034-4257(95)00137-P, 1995. a
Hopkinson, C., Sitar, M., Chasmer, L., and Treitz, P.: Mapping Snowpack Depth beneath Forest Canopies Using Airborne Lidar, Photogramm. Eng. Rem. S., 70, 323–330, https://doi.org/10.14358/PERS.70.3.323, 2004. a, b
Hoppinen, Z., Wilder, B., O'Neel, S., and Adebisi, N.: cryogars/ice-road-copters: v1.0.0, Zenodo [code], https://doi.org/10.5281/ZENODO.8184591, 2023. a
Hu, X., Hao, X., Wang, J., Huang, G., Li, H., and Yang, Q.: Can the Depth of Seasonal Snow be Estimated From ICESat-2 Products: A Case Investigation in Altay, Northwest China, IEEE Geosci. Remote S., 19, 1–5, https://doi.org/10.1109/LGRS.2021.3078805, 2022a. a
Hu, Y., Lu, X., Zeng, X., Stamnes, S. A., Neuman, T. A., Kurtz, N. T., Zhai, P., Gao, M., Sun, W., Xu, K., Liu, Z., Omar, A. H., Baize, R. R., Rogers, L. J., Mitchell, B. O., Stamnes, K., Huang, Y., Chen, N., Weimer, C., Lee, J., and Fair, Z.: Deriving Snow Depth From ICESat-2 Lidar Multiple Scattering Measurements, Frontiers in Remote Sensing, 3, 855159, https://doi.org/10.3389/frsen.2022.855159, 2022b. a
Hugonnet, R., Brun, F., Berthier, E., Dehecq, A., Mannerfelt, E. S., Eckert, N., and Farinotti, D.: Uncertainty Analysis of Digital Elevation Models by Spatial Inference From Stable Terrain, IEEE J. Sel. Top. Appl., 15, 6456–6472, https://doi.org/10.1109/JSTARS.2022.3188922, 2022. a
Höhle, J. and Höhle, M.: Accuracy assessment of digital elevation models by means of robust statistical methods, ISPRS J. Photogramm., 64, 398–406, https://doi.org/10.1016/j.isprsjprs.2009.02.003, 2009. a
Ilangakoon, N., Glenn, N. F., Spaete, L. P., Dashti, H., and Li, A.: 2014 Lidar-Derived 1m Digital Elevation Model Data Set for Reynolds Creek Experimental Watershed, Southwestern Idaho, Boise State University ScholarWorks, https://doi.org/10.18122/B26C7X, 2014. a
Immerzeel, W. W., Lutz, A. F., Andrade, M., Bahl, A., Biemans, H., Bolch, T., Hyde, S., Brumby, S., Davies, B. J., Elmore, A. C., Emmer, A., Feng, M., Fernández, A., Haritashya, U., Kargel, J. S., Koppes, M., Kraaijenbrink, P. D. A., Kulkarni, A. V., Mayewski, P. A., Nepal, S., Pacheco, P., Painter, T. H., Pellicciotti, F., Rajaram, H., Rupper, S., Sinisalo, A., Shrestha, A. B., Viviroli, D., Wada, Y., Xiao, C., Yao, T., and Baillie, J. E. M.: Importance and vulnerability of the world’s water towers, Nature, 577, 364–369, https://doi.org/10.1038/s41586-019-1822-y, 2020. a
Judd Communications LLC: Judd Communications depth sensor analog manual, n.d. a
Liu, A., Cheng, X., and Chen, Z.: Performance evaluation of GEDI and ICESat-2 laser altimeter data for terrain and canopy height retrievals, Remote Sens. Environ., 264, 112571, https://doi.org/10.1016/j.rse.2021.112571, 2021. a
Lu, X., Hu, Y., Zeng, X., Stamnes, S. A., Neuman, T. A., Kurtz, N. T., Yang, Y., Zhai, P.-W., Gao, M., Sun, W., Xu, K., Liu, Z., Omar, A. H., Baize, R. R., Rogers, L. J., Mitchell, B. O., Stamnes, K., Huang, Y., Chen, N., Weimer, C., Lee, J., and Fair, Z.: Deriving Snow Depth From ICESat-2 Lidar Multiple Scattering Measurements: Uncertainty Analyses, Frontiers in Remote Sensing, 3, 891481, https://doi.org/10.3389/frsen.2022.891481, 2022. a
Luthcke, S. B., Thomas, T. C., Pennington, T. A., Rebold, T. W., Nicholas, J. B., Rowlands, D. D., Gardner, A. S., and Bae, S.: ICESat‐2 Pointing Calibration and Geolocation Performance, Earth and Space Science, 8, e2020EA001494, https://doi.org/10.1029/2020EA001494, 2021. a, b, c
Magruder, L., Brunt, K., Neumann, T., Klotz, B., and Alonzo, M.: Passive Ground‐Based Optical Techniques for Monitoring the On‐Orbit ICESat‐2 Altimeter Geolocation and Footprint Diameter, Earth and Space Science, 8, e2020EA001414, https://doi.org/10.1029/2020EA001414, 2021. a
May, L. D., Stuefer, S. L., Goddard, S. D., and Larsen, C. F.: Analyzing vegetation effects on snow depth variability in Alaska's boreal forests with airborne lidar, The Cryosphere, 19, 3477–3492, https://doi.org/10.5194/tc-19-3477-2025, 2025. a, b
Mazzolini, M., Aalstad, K., Alonso-González, E., Westermann, S., and Treichler, D.: Spatio-temporal snow data assimilation with the ICESat-2 laser altimeter, The Cryosphere, 19, 3831–3848, https://doi.org/10.5194/tc-19-3831-2025, 2025. a
McNamara, J. P., Benner, S. G., Poulos, M. J., Pierce, J. L., Chandler, D. G., Kormos, P. R., Marshall, H., Flores, A. N., Seyfried, M., Glenn, N. F., and Aishlin, P.: Form and function relationships revealed by long‐term research in a semiarid mountain catchment, WIREs Water, 5, e1267, https://doi.org/10.1002/wat2.1267, 2018. a, b, c
Mott, R., Vionnet, V., and Grünewald, T.: The Seasonal Snow Cover Dynamics: Review on Wind-Driven Coupling Processes, Frontiers in Earth Science, 6, 197, https://doi.org/10.3389/feart.2018.00197, 2018. a, b
NASA JPL: NASADEM Merged DEM Global 1 arc second V001, NASA Land Processes Distributed Active Archive Center [data set], https://doi.org/10.5067/MEASURES/NASADEM/NASADEM _HGT.001, 2020. a, b
National Academies of Sciences, Engineering, and Medicine (U.S.) (NASEM) (Ed.): Thriving on our changing planet: a decadal strategy for Earth observation from space, A consensus study report of the National Academies of Sciences, Engineering, Medicine, The National Academies Press, Washington, DC, ISBN 978-0-309-46757-5, 2018. a
National Operational Hydrologic Remote Sensing Center: Snow Data Assimilation System (SNODAS) Data Products at NSIDC. (G02158, Version 1). Daily, NASA National Snow and Ice Data Center Distributed Active Archive Center [data set], https://doi.org/10.7265/N5TB14TC, 2004. a, b
Neuenschwander, A., Guenther, E., White, J. C., Duncanson, L., and Montesano, P.: Validation of ICESat-2 terrain and canopy heights in boreal forests, Remote Sens. Environ., 251, 112110, https://doi.org/10.1016/j.rse.2020.112110, 2020. a, b
Neuenschwander, A. L., K. L. Pitts, B. P. Jelley, J. Robbins, B. Klotz, S. C. Popescu, R. F. Nelson, D. Harding, D. Pederson, and R. Sheridan: ATLAS/ICESat-2 L3A Land and Vegetation Height, Version 6, NASA National Snow and Ice Data Center Distributed Active Archive Center [data set], https://doi.org/10.5067/ATLAS/ATL08.006, 2023. a, b
Neumann, T. A., Martino, A. J., Markus, T., Bae, S., Bock, M. R., Brenner, A. C., Brunt, K. M., Cavanaugh, J., Fernandes, S. T., Hancock, D. W., Harbeck, K., Lee, J., Kurtz, N. T., Luers, P. J., Luthcke, S. B., Magruder, L., Pennington, T. A., Ramos-Izquierdo, L., Rebold, T., Skoog, J., and Thomas, T. C.: The Ice, Cloud, and Land Elevation Satellite – 2 mission: A global geolocated photon product derived from the Advanced Topographic Laser Altimeter System, Remote Sens. Environ., 233, 111325, https://doi.org/10.1016/j.rse.2019.111325, 2019. a
Northwest Watershed Research Center: Reynolds Mountain East Snow Depth Measurements with Preliminary Level 1 QA/QC, USDA ARS NWRC Public data, https://www.ars.usda.gov/pacific-west-area/boise-id/northwest-watershed-research-center/docs/reynolds-creek-experimental-watershed-data/ (last access: 20 November 2024), 2024. a
Nuth, C. and Kääb, A.: Co-registration and bias corrections of satellite elevation data sets for quantifying glacier thickness change, The Cryosphere, 5, 271–290, https://doi.org/10.5194/tc-5-271-2011, 2011. a, b, c, d, e, f, g, h, i
Quantum Spatial, Inc.: Idaho FEMA 2018 LiDAR; DEM, Idaho LiDAR Consortium, https://www.idaholidar.org/data/fema-boise-payette-2018/ (last access: 14 May 2025), 2018. a
Riggs, G., Hall, D., and Salomonson, V.: A snow index for the Landsat Thematic Mapper and Moderate Resolution Imaging Spectroradiometer, in: Proceedings of IGARSS '94 - 1994 IEEE International Geoscience and Remote Sensing Symposium, vol. 4, IEEE, Pasadena, CA, USA, 1942–1944, ISBN 978-0-7803-1497-9, https://doi.org/10.1109/IGARSS.1994.399618, 1994. a, b
Seyfried, M., Lohse, K., Marks, D., Flerchinger, G., Pierson, F., and Holbrook, W. S.: Reynolds Creek Experimental Watershed and Critical Zone Observatory, Vadose Zone J., 17, 1–20, https://doi.org/10.2136/vzj2018.07.0129, 2018. a, b
Shean, D., Swinski, J. P., Ugarte, C., Lidwa, E., Smith, B., Sutterley, T., Henderson, S., and Neumann, T.: SlideRule, Zenodo [code], https://doi.org/10.5281/ZENODO.16989464, 2025. a, b
Smith, B., Fricker, H. A., Holschuh, N., Gardner, A. S., Adusumilli, S., Brunt, K. M., Csatho, B., Harbeck, K., Huth, A., Neumann, T., Nilsson, J., and Siegfried, M. R.: Land ice height-retrieval algorithm for NASA's ICESat-2 photon-counting laser altimeter, Remote Sens. Environ., 233, 111352, https://doi.org/10.1016/j.rse.2019.111352, 2019. a, b, c, d, e, f, g
Smith, B., Fricker, H. A., Gardner, A., Siegfried, M. R., Adusumilli, S., Csathó, B. M., Holschuh, N., Nilsson, J., Paolo, F. S., and The ICESat-2 Science Team: ATLAS/ICESat-2 L3A Land Ice Height, Version 6, NASA National Snow and Ice Data Center Distributed Active Archive Center [data set], https://doi.org/10.5067/ATLAS/ATL06.006, 2023. a
Sommer Messtechnik: USH-9 Snow Depth Sensor Datasheet, n.d. a
Sturm, M., Goldstein, M. A., and Parr, C.: Water and life from snow: A trillion dollar science question, Water Resour. Res., 53, 3534–3544, https://doi.org/10.1002/2017WR020840, 2017. a
Tinkham, W. T., Huang, H., Smith, A. M. S., Shrestha, R., Falkowski, M. J., Hudak, A. T., Link, T. E., Glenn, N. F., and Marks, D. G.: A Comparison of Two Open Source LiDAR Surface Classification Algorithms, Remote Sensing, 3, 638–649, https://doi.org/10.3390/rs3030638, 2011. a
Tinkham, W. T., Smith, A. M., Marshall, H.-P., Link, T. E., Falkowski, M. J., and Winstral, A. H.: Quantifying spatial distribution of snow depth errors from LiDAR using Random Forest, Remote Sens. Environ., 141, 105–115, https://doi.org/10.1016/j.rse.2013.10.021, 2014. a, b
Watershed Sciences: Dry Creek Snow Off LiDAR Data 2007, https://app.globus.org/file-manager?destination_id=03bed01a-e124-11e7-802a-0a208f818180&destination_path=%2Fprocessed%2FWestern%2FDryCreek2007%2FTS32 (last access: 3 June 2024), 2007. a
Winstral, A. and Marks, D.: Long-term snow distribution observations in a mountain catchment: Assessing variability, time stability, and the representativeness of an index site: LONG-TERM SNOW DISTRIBUTION OBSERVATIONS, Water Resour. Res., 50, 293–305, https://doi.org/10.1002/2012WR013038, 2014. a, b
Zhang, X., Guo, S., Yuan, B., Mu, H., Xia, Z., Tang, P., Fang, H., Wang, Z., and Du, P.: Error-Reduced Digital Elevation Model of the Qinghai-Tibet Plateau using ICESat-2 and Fusion Model, Scientific Data, 11, 588, https://doi.org/10.1038/s41597-024-03428-4, 2024. a
Zikan, K. and Enderlin, E.: CryoGARS-Glaciology/ICESat2-AlpineSnow: ICESat2-AlpineSnow (v1.0), Zenodo [code], https://doi.org/10.5281/zenodo.17101987, 2025a. a
Zikan, K. and Enderlin, E. M.: Dataset for ICESat-2 ATL06_SR derived snow depth transects of Idaho watersheds: Reynolds Creek, Banner Summit, Mores Creek, and Dry Creek (2018–2024), Boise State University [data set], https://doi.org/10.18122/cryogars_snow_data.6.boisestate, 2025b. a