the Creative Commons Attribution 4.0 License.
the Creative Commons Attribution 4.0 License.
 | 21 May 2026
21st century change in precipitation on the Greenland Ice Sheet using high resolution regional climate models
Xavier Fettweis
Nicolaj Hansen
Ruth Mottram
Michiel R. van den Broeke
An ensemble of regional climate model simulations downscaling global climate models within Coupled Model Intercomparison Project Phase 6 (CMIP6) is used to estimate future precipitation changes for the Greenland ice sheet under a range of climate change pathways. The regional climate models are HIRHAM5, MAR3.12 and RACMO2.3p2 contributing a total of eleven simulations for the SSP5-8.5 scenario, five simulations for the SSP2-4.5 scenario and four simulations for the SSP1-2.6 scenario. The Greenland ice sheet is divided into six drainage basins to evaluate the change in total (snow plus rain) precipitation in regions with different precipitation characteristics. Compared with the reference period 1971–2000, the ensemble median change in precipitation for the full Greenland ice sheet for the SSP5-8.5 scenario is estimated to be about +60 Gt (+8 %) per year during the 2031–2060 period and +170 Gt (+24 %) per year during the 2071–2100 period. We see similar ensemble median change for the 2031–2060 period for the SSP1-2.6 and SSP2-4.5 scenarios while the 2071–2100 change is +40 and +80 Gt (+6 % and +11 %) per year for SSP1-2.6 and SSP2-4.5, respectively. Using linear regression on the annual mean change in near-surface (2 m) air temperature and precipitation over the ice sheet, we estimate an increase of about 35 Gt per year in precipitation (equal to about 5 %) for every degree of warming during the 21st century. The change in precipitation phase shows a non-linear increase in rainfall with temperature, particularly along the outer edge and the southern part of the ice sheet. The regional climate model output is compared with an ensemble of global climate models within CMIP6 showing similar patterns in precipitation change but with overall larger changes in the CMIP6 ensemble median compared with the regional climate model ensemble median.
- Article
(7967 KB) - Full-text XML
- BibTeX
- EndNote


Solid precipitation (snowfall) is the largest positive contributor to the (surface) mass balance of the Greenland ice sheet. Runoff from the Greenland ice sheet is the largest negative surface mass balance component and currently a main contributor to sea level rise (Box et al., 2022a). Early work (Huybrechts et al., 1991) suggested that the ice sheet would not contribute significantly to future sea level rise because of the projected increase in snowfall (Bailey and Hubbard, 2025), compensating for increased runoff. However, the observed increase in surface melt/runoff and ice dynamic changes leading to increased solid ice discharge since the late 1990s shows conclusively that, in spite of an increase in observed precipitation (Box et al., 2022a), the ice sheet is net losing mass as increases in melt and runoff rates outpace increases in snowfall. The accumulation of snow is not only important for the ice sheet mass balance (the sum of surface mass balance and solid ice discharge) but also has process implications for ablation via surface albedo feedbacks and firn pore space and energy budgets that determine the retention and refreezing of melt water in the firn pack (Firn Symposium team, 2024; Glaude et al., 2024). If warming-enhanced precipitation occurs under future climate change scenarios, it is likewise important to determine the phase. Liquid precipitation percolates into near-surface snow/firn layers and thereby decreases the pore space in the firn. During the right conditions (heavy rain on low temperature firn), the higher temperature of rain compared to melt water can also transport energy deeper into the firn, warming it and reducing refreezing potential (Harper et al., 2023). Where fresh snow generally increases surface albedo, rain usually has a darkening effect on surface snow, particularly in near infrared wavelengths, and can therefore also enhance melt-albedo feedbacks.
Huai et al. (2025) used CMIP5 and CMIP6 ensembles and found a model mean increase in precipitation for the entire Greenland ice sheet during the 21st century with changes in excess of 200 mm yr−1 along the outer edges for the SSP5-8.5 scenario. However, some individual models showed a decrease in the southeast. Bochow et al. (2024) used CMIP6 ensembles for four different emission scenarios and found an increase in precipitation in correlation with the increase in surface temperature for the 21st century. The aim of this study is to study changes (amount and phase) in the ice sheet precipitation for the 21st century using an ensemble of high resolution regional climate model simulations and compare these results with the forcing CMIP6 models.
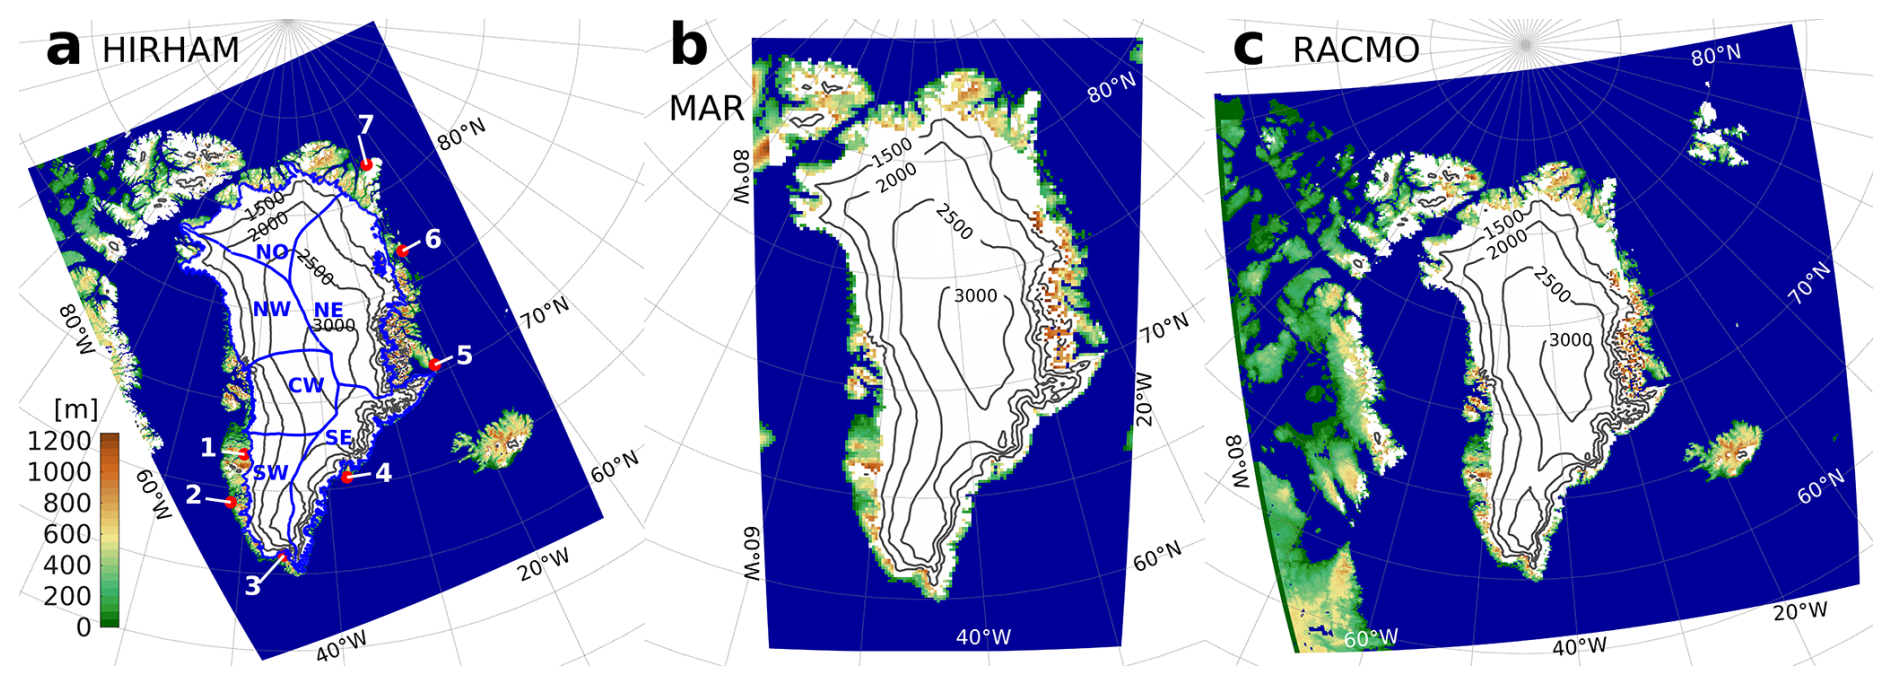
Figure 1Model domain and orography for the HIRHAM (a), MAR (b) and RACMO (c) RCM simulations. Sea points are given in blue, glacier free land points in green/brown and glacier points in white with added surface elevation contour lines in black. The location of seven observational stations (red dots) and six drainage basins (blue contour lines; Rignot and Mouginot, 2012) are shown in panel (a). The stations in order 1–7 are Kangerlussuaq, Nuuk, Narsarsuaq, Tasiilaq, Ittoqqortoormiit, Danmarkshavn and Station Nord.
2.1 Models
A total of eleven global climate model (GCM) – regional climate model (RCM) combinations are used in this study. The RCMs used are: HIRHAM5 (from now on: HIRHAM; one SSP1-2.6 and two SSP5-8.5 simulations), MAR3.12 (from now on: MAR; two SSP1-2.6, four SSP2-4.5 and eight SSP5-8.5 simulations) and RACMO2 (from now on: RACMO; one for each of the three SSP scenarios) (see Table 1). The reference period for this study is 1971–2000, taken from the historical run of the RCM simulations. Two future periods (2031–2060 and 2071–2100) are extracted from the three SSP scenarios. We use the period 1991–2022, using data for both the historical period (from 1991 to 2014) and the SSP5-8.5 period (from 2015 to 2022), for model evaluation against observations and reanalysis data.
The two HIRHAM (combining the dynamics of the HIRLAM model (Undén et al., 2002) and the physical parameterization schemes of the ECHAM model (Roeckner et al., 2003)) simulations are performed on a rotated latitude-longitude grid with a horizontal resolution of 0.05° (about 5.5 km) (Fig. 1a; cf. Boberg et al., 2022, for a more detailed model setup description). The first HIRHAM simulation is forced with the CMIP6 GCM EC-Earth3 for the period 1970–2100 (where the first year is used for spin-up) using the SSP1-2.6 and SSP5-8.5 scenarios whereas the second HIRHAM simulation is forced by CMIP6 GCM CESM2-L for the SSP5-8.5 scenario and the same model set-up and period as for the HIRHAM/EC-Earth3 simulation.
The MAR (Modéle Atmosphérique Régional) simulations (Fig. 1b; Hofer et al., 2020) are performed with a horizontal resolution of 15 km. The CMIP6 GCMs that are downscaled with MAR are CESM2, CESM2-L, CNRM-CM6, CNRM-ESM2, IPSL-CM6A-LR, MPI-ESM1.2-HR, NorESM2 and UKESM1.0-LL. There are in total two SSP1-2.6 simulations, four SSP2-4.5 simulations and eight SSP5-8.5 simulations. The MAR data are regridded onto the HIRHAM grid to enable a model ensemble comparison (see Glaude et al., 2024). After regridding, we apply a common HIRHAM ice mask to all data since the ice sheet extent for the three RCMs are comparable in size (within ±0.6 %).
The RACMO simulations (Noël et al., 2020) are forced by CESM2-L and run at a horizontal resolution of 11 km (see Fig. 1c) with one simulation per SSP scenario. The RACMO data are also regridded onto the HIRHAM grid. For a more detailed model description of RACMO, see Noël et al. (2018).
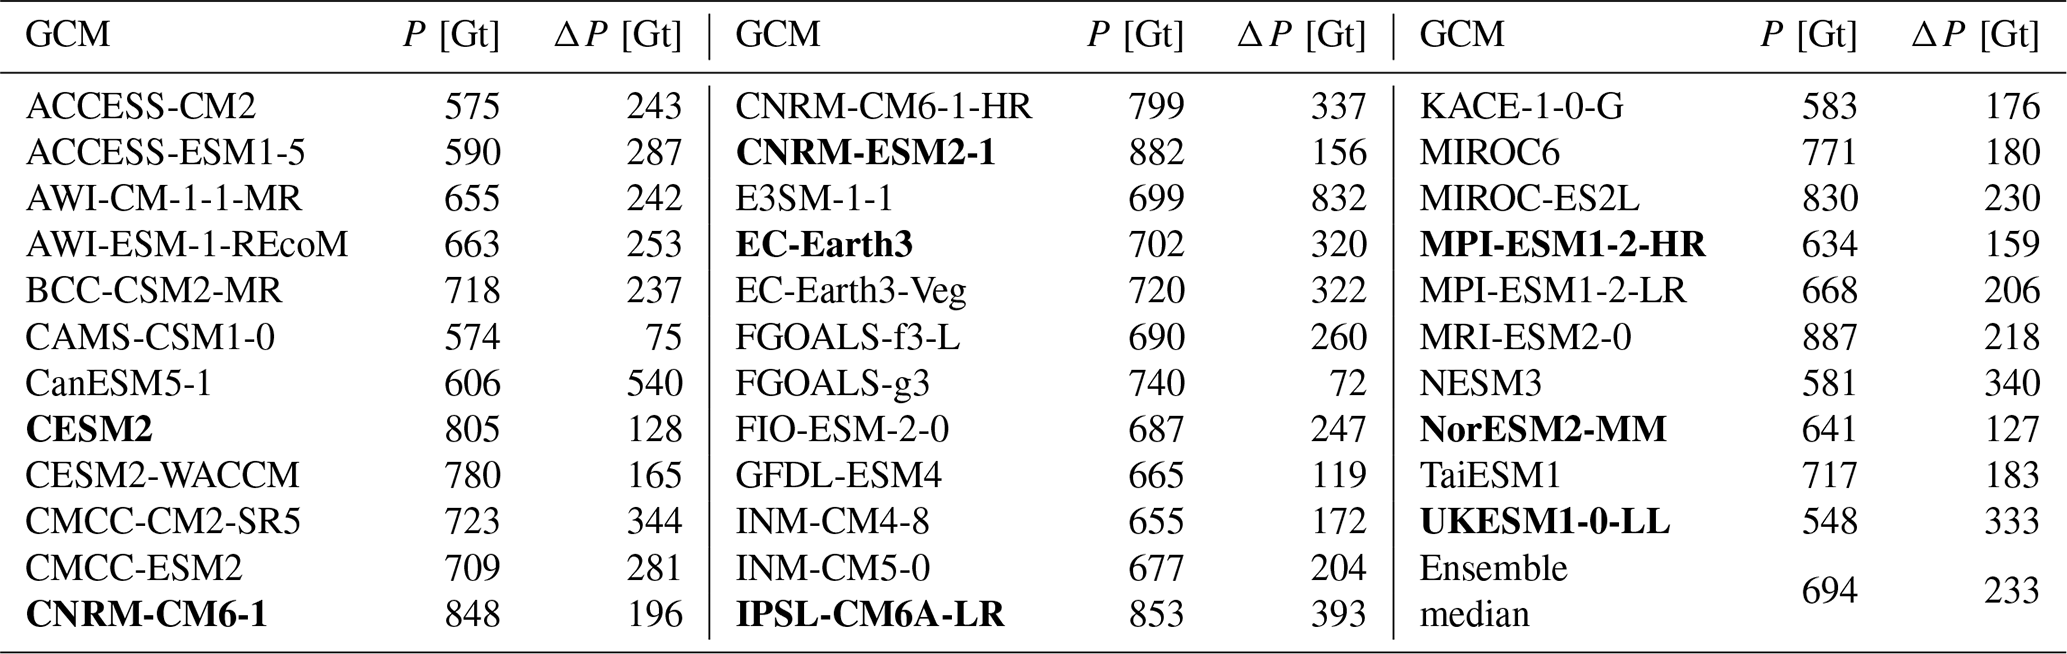
The RCM ensemble is compared with 34 CMIP6 GCM simulations (see Table 2) for the historical and the SSP5-8.5 scenario, selecting only one realization per GCM. The GCM outputs are regridded onto the EC-Earth3 grid with a horizontal resolution of about 80 km (Döscher et al., 2022).
Table 1List of CARRA and RCM simulations used in this study and the annual mean total precipitation for the Greenland ice sheet for the reference period, the mid-century period and the end of century period. Also given are the absolute and relative changes for the two scenario periods. For each of the RCM and the ensemble median, the three lines refer to the SSP1-2.6, SSP2-4.5 andSSP5-8.5 scenarios, respectively. Note that the CARRA value is for the period 1991–2022. NA refers to data not available, either missing scenario simulations (RCM) or time period not covered by the data (CARRA). Also given are the RMSEs and mean biases for 1991–2022 (using historical data and SSP5-8.5 data) relative to observations for the seven weather stations (cf. Fig. 3).
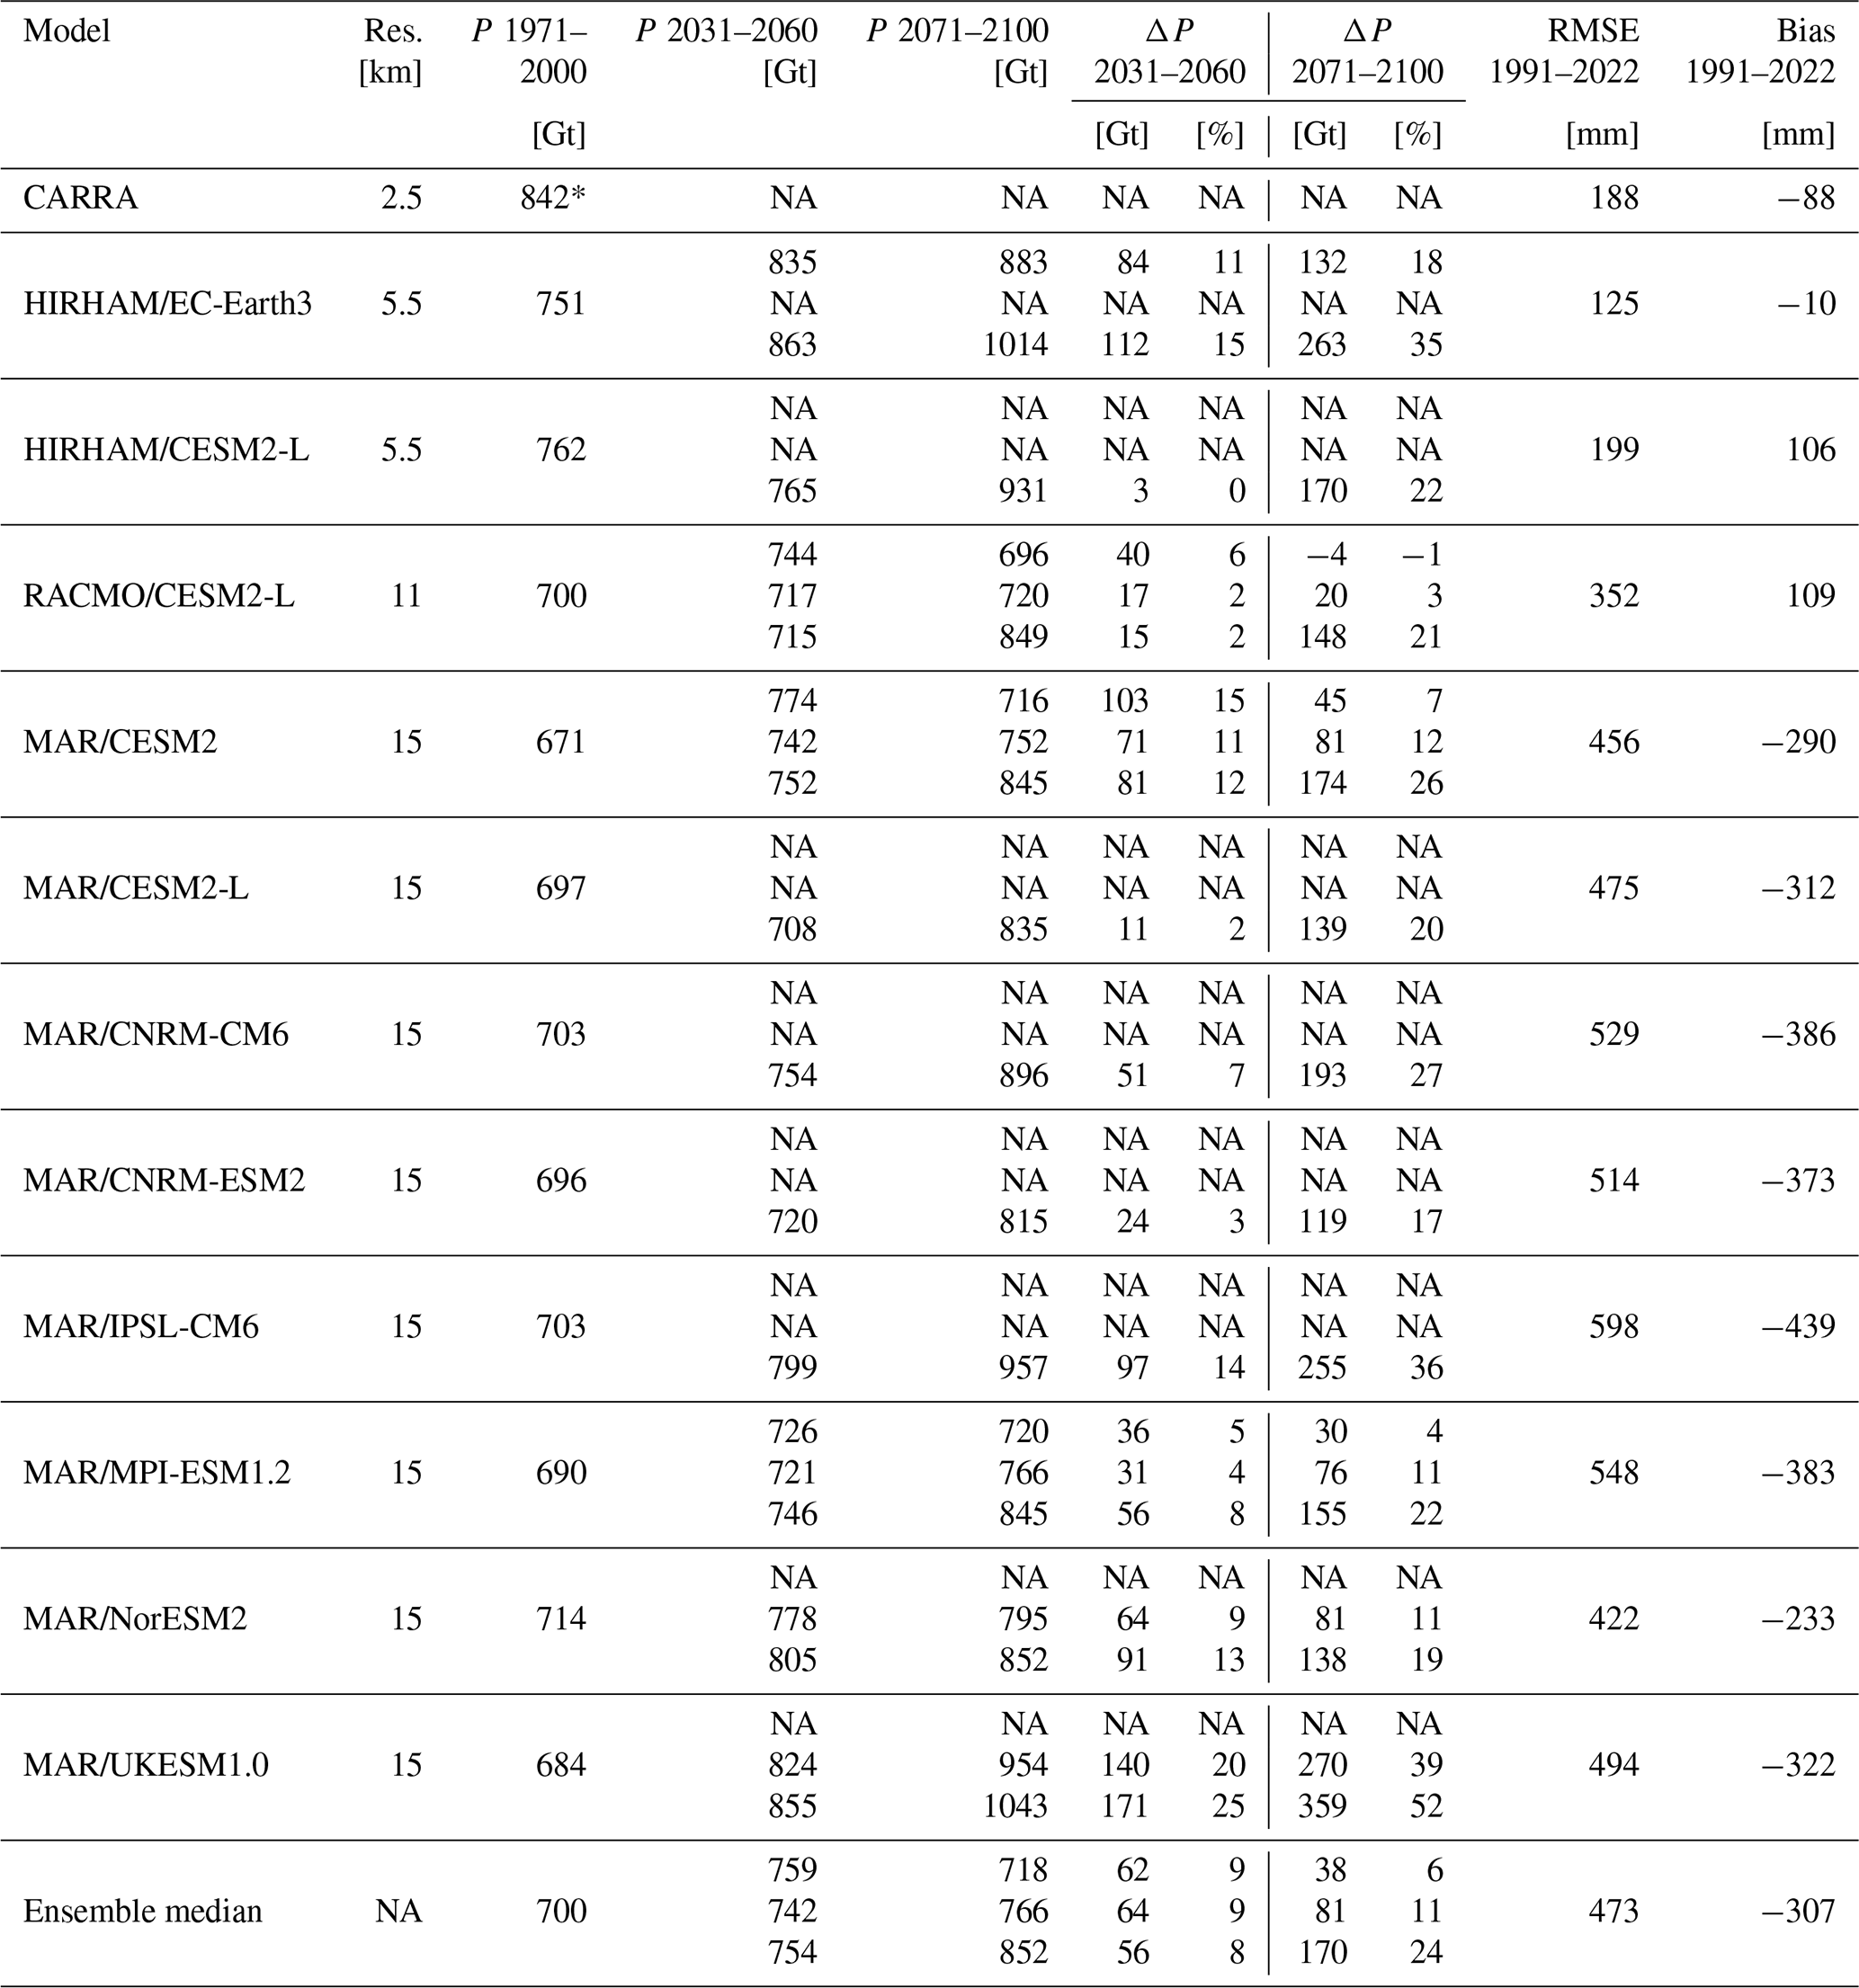
* The CARRA value is for the period 1991–2022.
Table 2List of the 34 CMIP6 GCMs used in this study together with the annual mean total Greenland ice sheet precipitation for 1971–2000 and the change in total precipitation 2071–2100 relative to 1971–2000. Also given are the ensemble median values. The names in bold face are the GCMs downscaled by the RCMs. We have restricted the model selection and only using one ensemble member per GCM.
2.2 Observations and reanalysis
There are limited long-term observations of precipitation in Greenland and observed precipitation, particularly solid, is notoriously difficult to accurately measure (Allerup et al., 1997). Nevertheless, corrected datasets from automatic weather stations (AWS) operated by the Danish Meteorological Institute (DMI) have long time series that have been previously used to evaluate climate models (Huai et al., 2025; Boberg et al., 2018, Huai et al., 2021; Box et al., 2023; Niwano et al., 2021). On the ice sheet, the PROMICE (Fausto et al., 2021) and GC-Net (Steffen and Box, 2001) networks of AWS (Fausto et al., 2026) assess surface height changes, using two or three different techniques, but these are hard to compare with precipitation in a climate model as they measure a different variable affected by for example, melt, firn densification and drifting snow processes. We have therefore chosen to concentrate on using the observed precipitation from the DMI AWS. The station data are undercatch corrected (i.e. positive correction of the amount of water caught by the rain gauge due to winds) using the mean correction factors and mean rainfall fractions from Huai et al. (2021).
The Copernicus Arctic Regional Reanalysis (CARRA; Yang et al., 2020; Schyberg et al., 2020) is available from 1991 onward for two Arctic regions where one covers Greenland. CARRA data have a horizontal grid spacing of 2.5 km compared with the European Center for Medium-range Weather Forecasts fifth-generation reanalysis (ERA5) dataset at 31 km. Compared with ERA5, CARRA includes a number of improvements such as a larger set of local observations, a more realistic ice mask and coastline mask, a satellite derived glacier albedo dataset and high resolution sea surface temperatures and sea ice concentrations. The CARRA outperforms ERA5 when comparing the two datasets with in-situ observations of a range of variables including snowfall, snow depth, pressure, temperature and wind speeds across the Arctic (Køltzow et al., 2022; Box et al., 2023).
Eleven RCM simulations (historical 1991–2014 and SSP5-8.5 for 2015–2022) and CARRA are validated against observations for precipitation from seven stations with at least 10 000 daily measurements (out of a maximum of 11 688) for the 32-year period 1991–2022. The stations (see Fig. 1) are located along the south-western and eastern coast of Greenland.
The six drainage basins (see Fig. 1a) are taken from Rignot and Mouginot (2012), who used ice surface velocity maps from satellite radar interferometry data to divide the ice sheet into six subregions of similar size.
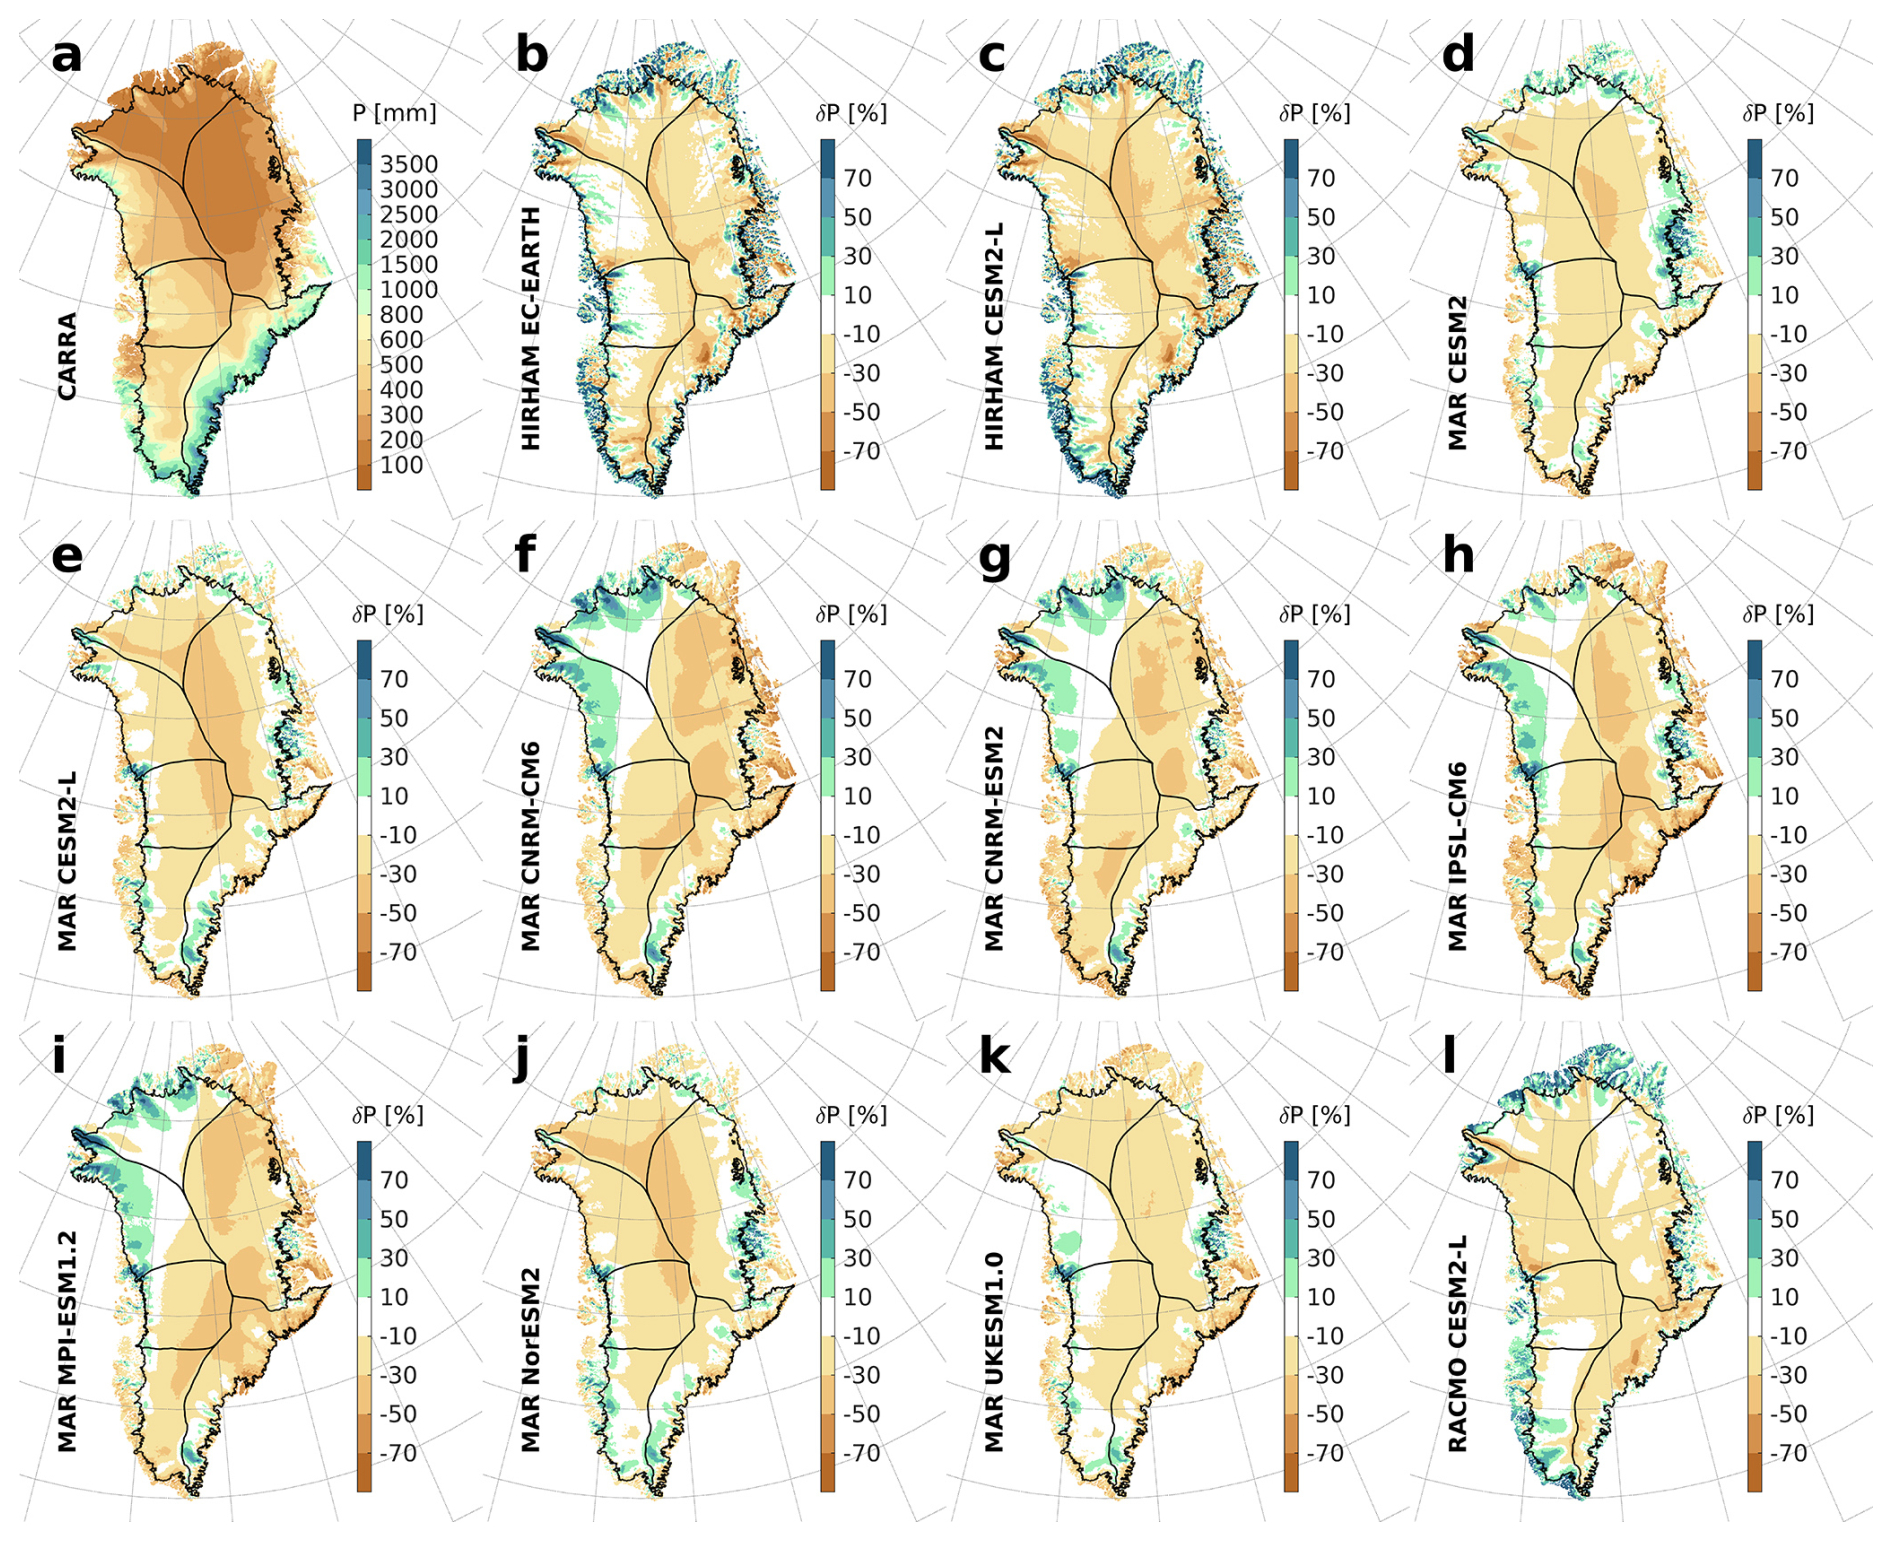
Figure 2Mean annual precipitation for 1991–2022 by CARRA (a) and the model difference relative CARRA for HIRHAM/EC-EARTH (b), HIRHAM/CESM2-L (c), MAR/CESM2 (d), MAR/CESM2-L (e), MAR/CNRM-CM6 (f), MAR/CNRM-ESM2 (g), MAR/IPSL-CM6 (h), MAR/MPI-ESM1.2 (i), MAR/NorESM2 (j), MAR/UKESM1.0 (k) and RACMO/CESM2-L (l). For the RCM data, 1991–2014 is taken from the historical run and 2015–2022 is taken from the SSP5-8.5 scenario run. Black contour lines show the six drainage basins.
2.3 Model evaluation
Figure 2a shows the mean annual precipitation for the CARRA dataset for 1991–2022, with values exceeding 2000 mm yr−1 in the southeast and southwest whereas the northern part of the ice sheet is very dry with values below 200 mm yr−1 in large areas. Figure 2b to l show the relative model difference for the eleven RCM simulations with respect to CARRA. We see similar patterns for all models with large areas with a negative difference of about −10 % to −30 % in the central parts of the ice sheet and smaller areas with a positive difference up to 50 % along the Greenland coastline. The model with the largest positive difference (in regions NW and NO with values in the range 10 %–50 %) over the ice sheet are MAR driven by CNRM-CM6, CNRM-ESM2 and MPI-ESM1.2 while the two HIRHAM simulations and the RACMO simulation have the largest positive differences outside the ice sheet with values in the range 30 %–70 % with peaks in excess of 70 %.
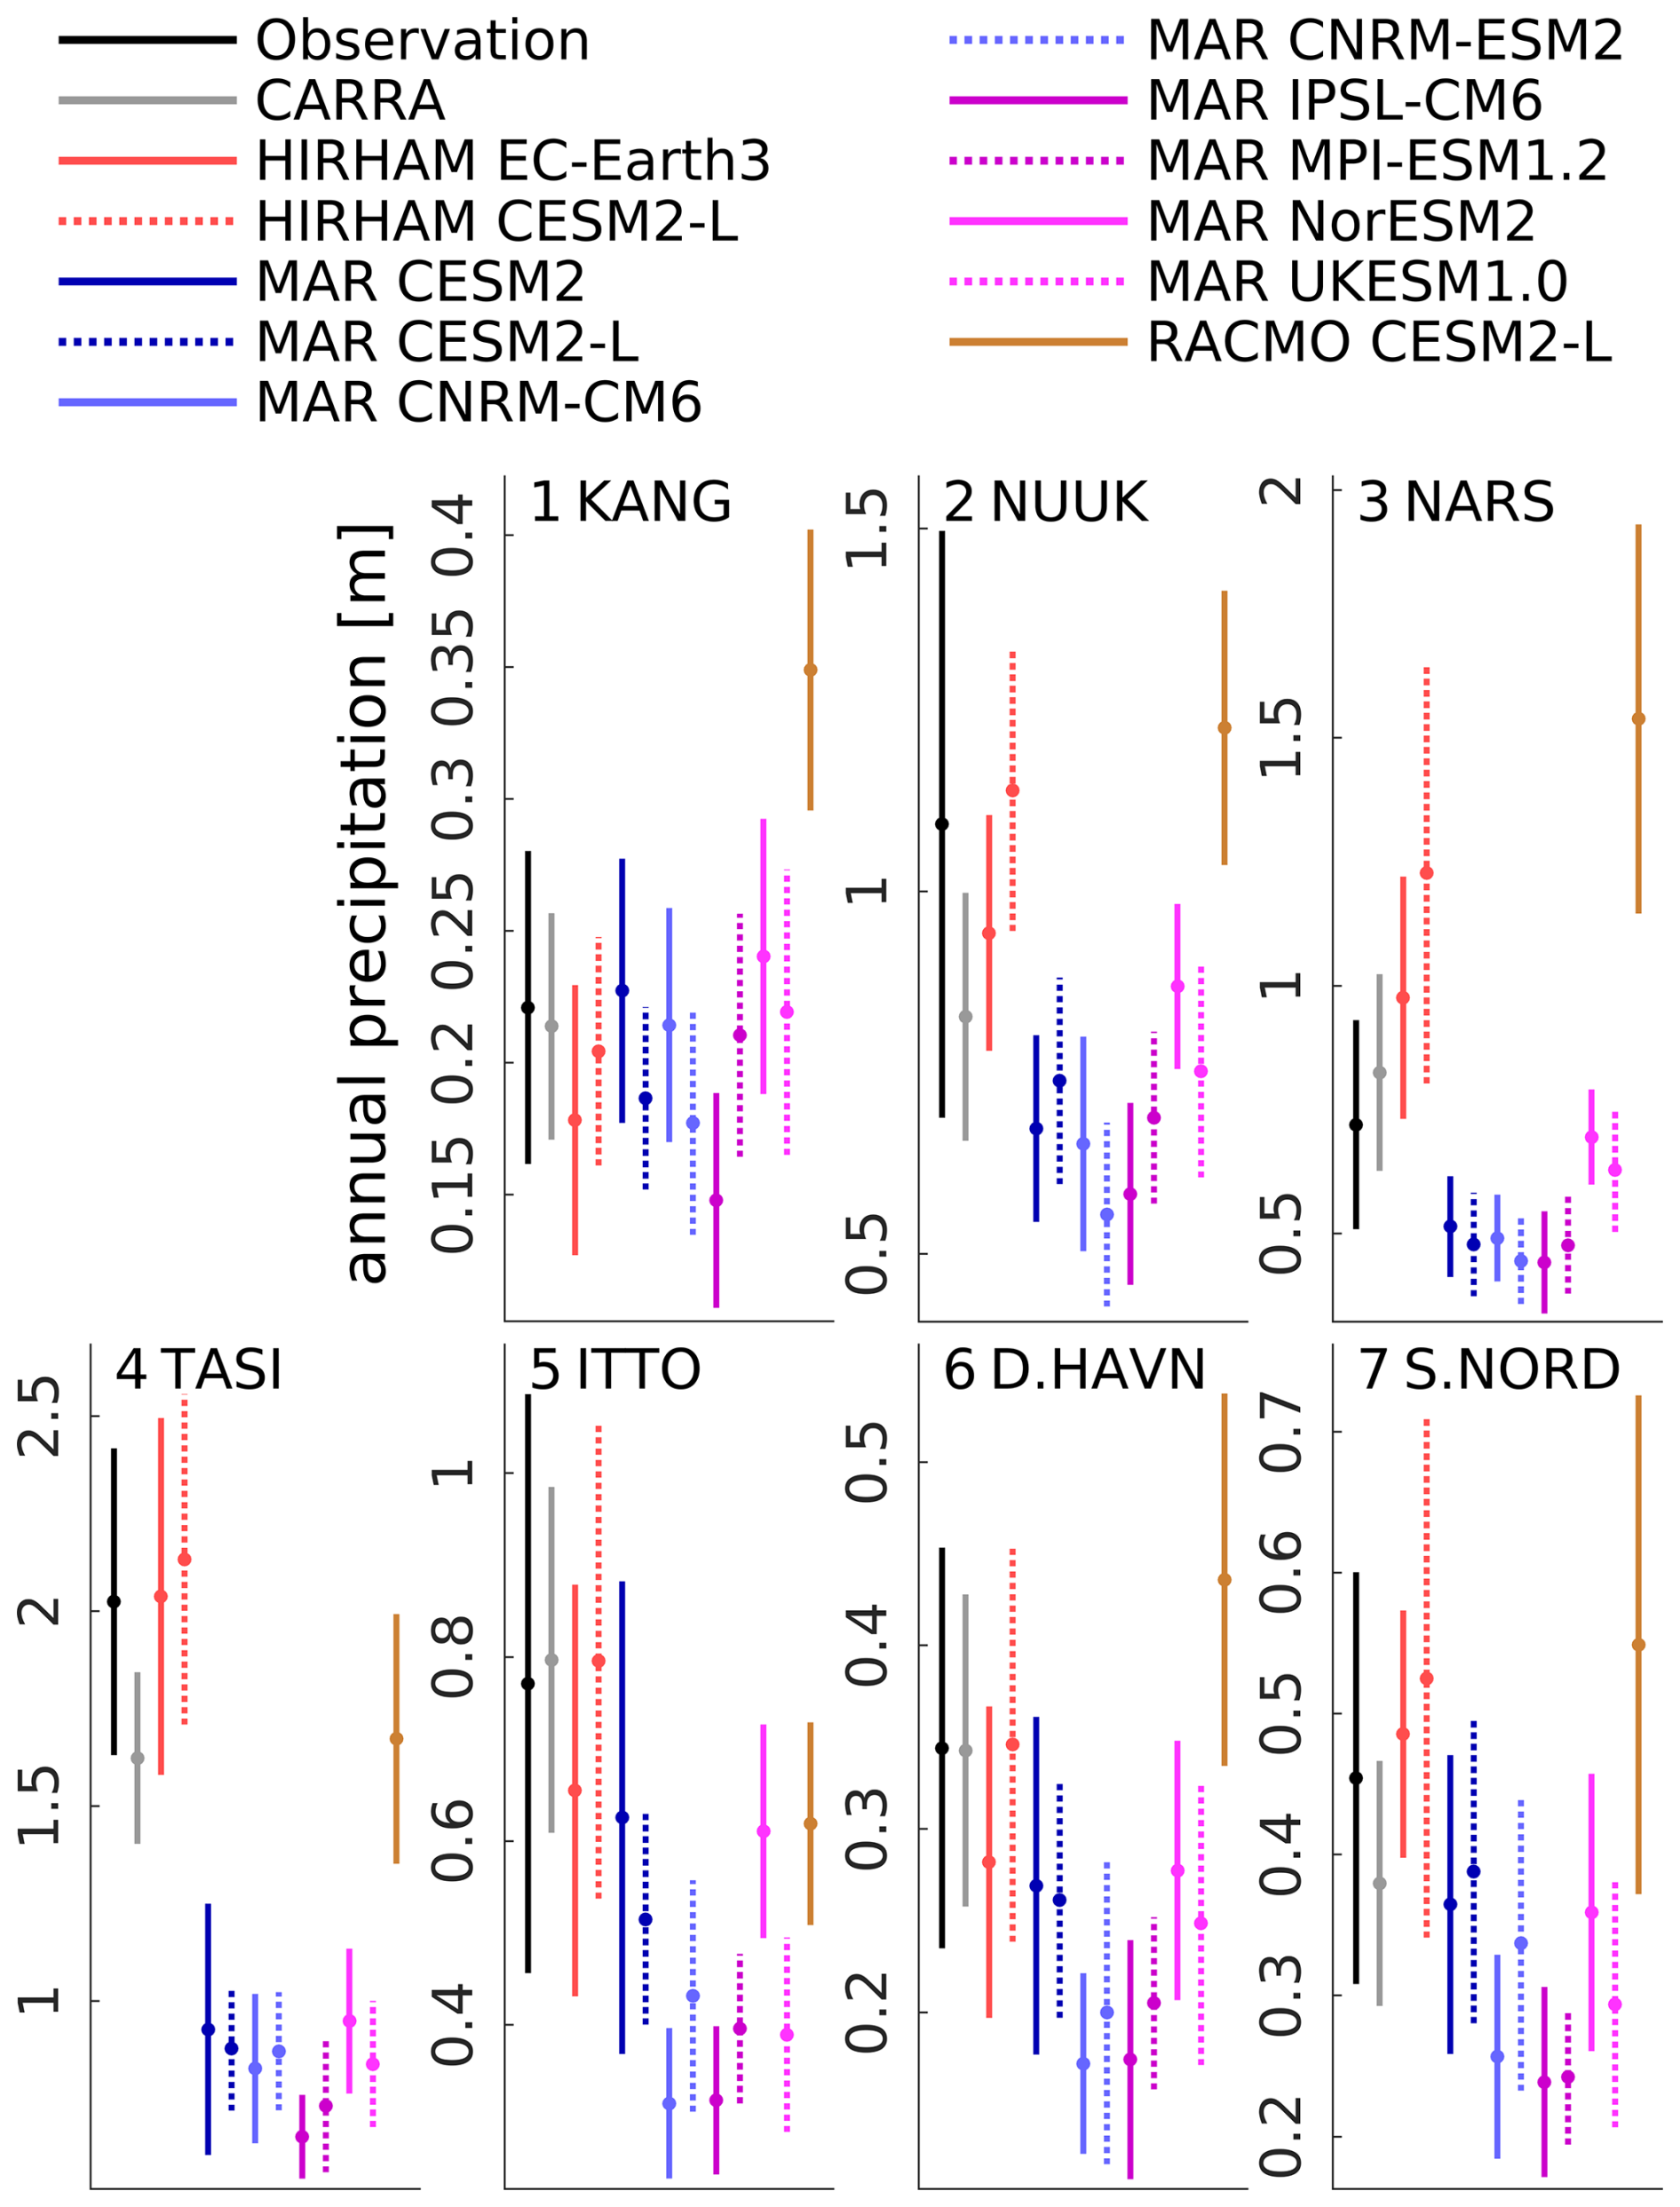
Figure 3Mean annual precipitation for 1991–2022 (dots) for seven weather station locations (cf. Fig. 1), showing observations, CARRA, two HIRHAM simulations, eight MAR simulations and one RACMO simulation. For the RCM data, 1991–2014 is taken from the historical run and 2015–2022 is taken from the SSP5-8.5 scenario run. The vertical lines show the standard deviation of the 32 yearly precipitation sums. The precipitation for CARRA and the HIRHAM, MAR and RACMO simulations are taken from the land grid point closest to the AWS locations.
Figure 3 compares station observations of precipitation with CARRA and the eleven RCM models for the grid point closest to the weather stations (cf. Fig. 1a). For station 1 all model simulations agree with observations except MAR, driven by IPSL, showing a dry bias while RACMO shows a clear wet bias of about 60 % (130 mm). For station 2 all MAR simulations show a dry bias of about −25 % (−250 mm) while the other simulations are closer to observations. For station 3, CARRA is close to observations while the two HIRHAM simulations have a wet bias in the range 35 % to 70 % (250 to 500 mm), RACMO show a wet bias of about 110 % (800 mm) and five of the MAR simulations have a dry bias of about −35 % (−250 mm). The two HIRHAM simulations are close to observations for station 4 while CARRA and RACMO show a dry bias close to −20 % (−350 mm) while all eight MAR simulations have a clear dry bias close to −65 % (−1300 mm). For station 5, CARRA and one HIRHAM simulation are close to observations while the other HIRHAM simulation together with two MAR simulations and RACMO have a dry bias of about −20 % (−180 mm). The other MAR simulations have a clear dry bias in the range −30 % to −60 % (−330 to −530 mm). A similar pattern is seen for station 6 with the exception for RACMO here showing a wet bias of about 25 % (90 mm). Finally, for station 7 one HIRHAM simulation is close to observations while the other HIRHAM simulation together with RACMO have a wet bias of about 15 % (80 mm) while CARRA has a dry bias of −15 % (70 mm) and all eight MAR simulations have a dry bias in the range −15 % to −45 % (−60 to −210 mm).
The two rightmost columns of Table 1 give the RMSE and mean bias for CARRA and the eleven RCM simulations, showing low RMSE values and low mean bias for the two HIRHAM simulations and CARRA while the MAR simulations have a relatively high RMSE and negative bias.
CARRA models different climate variables well compared with ERA5 (Isaksen et al., 2022; Box et al., 2023; Køltzow et al., 2022). However, when comparing CARRA with station observations (see Fig. 3 and Table 1) and RCM output, there are no clear evidence justifying a bias adjustment of the RCM data towards CARRA. Instead, we will use the raw model output in this study.
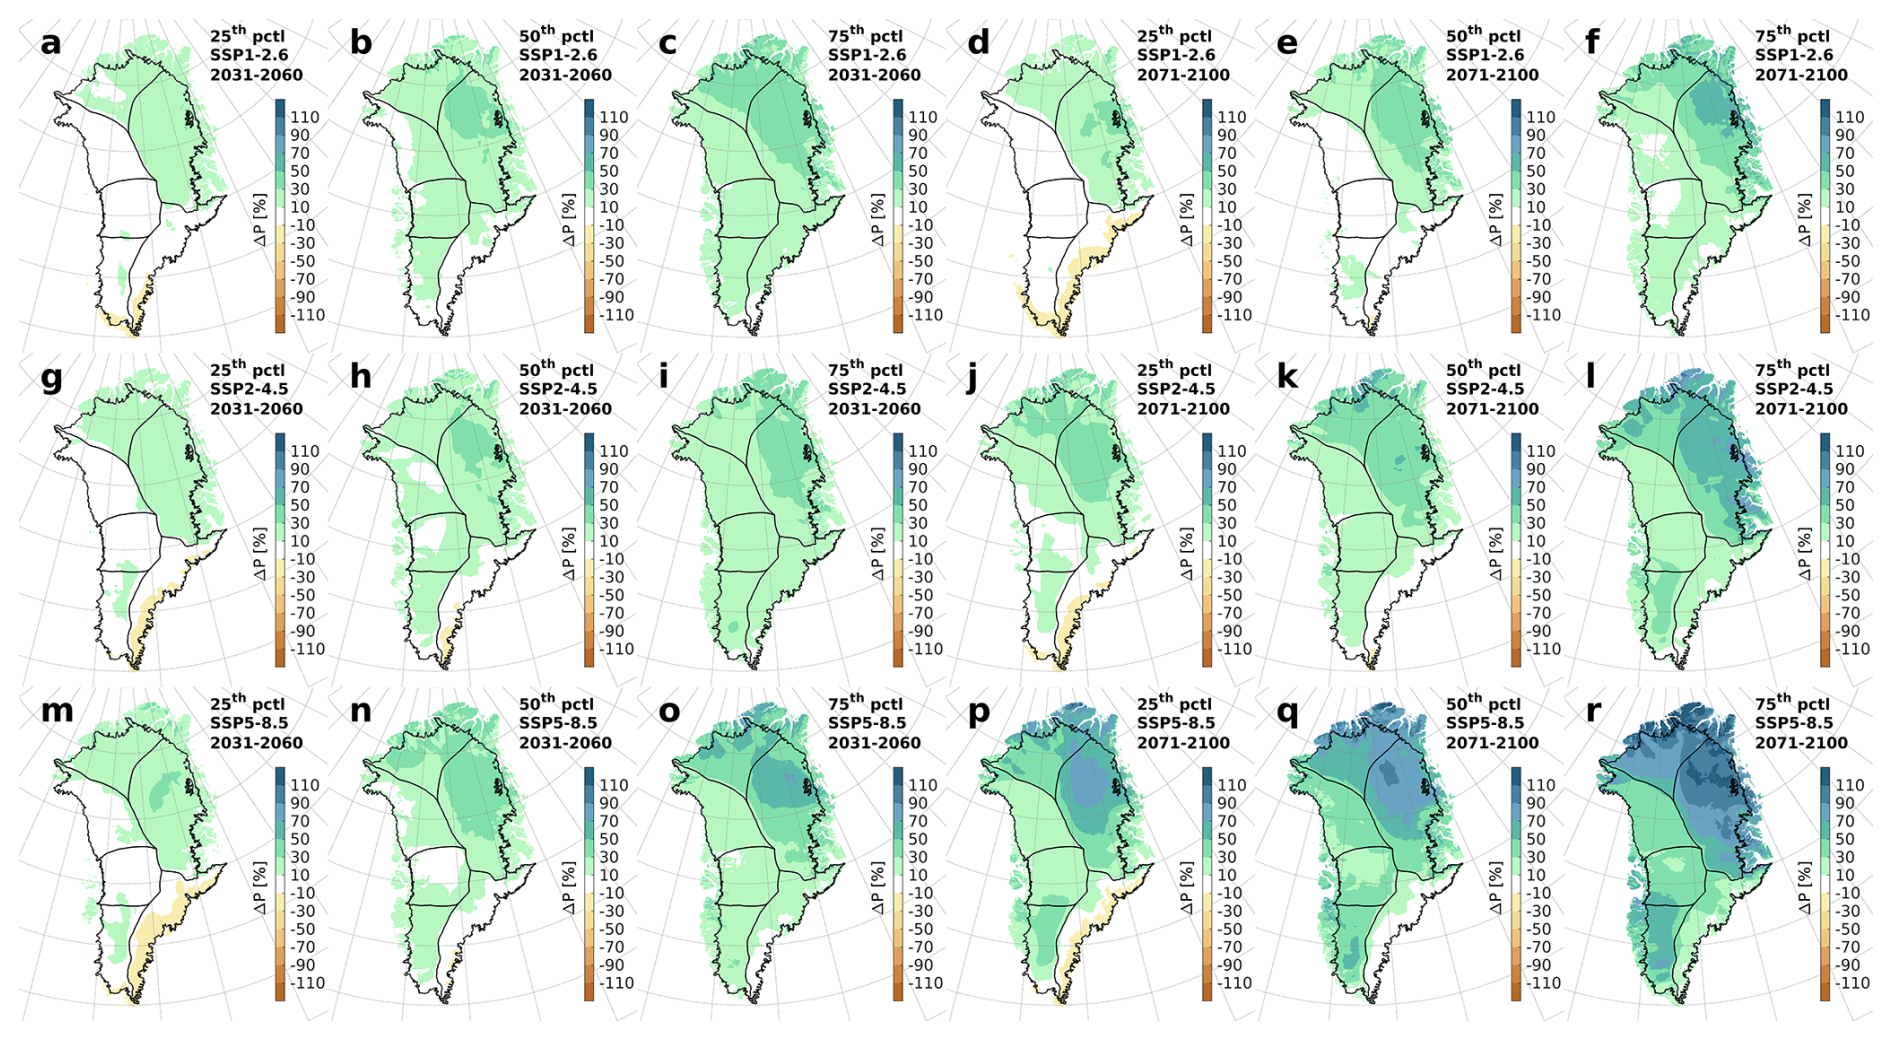
Figure 4Relative change in Greenland precipitation using the RCM ensembles for SSP1-2.6 (a–f), SSP2-4.5 (g–l) and SSP5-8.5 (m–r). Panels (a)–(c), (g)–(i) and (m)–(o) are for 2031–2060 relative 1971–2000 while panels (d)–(f), (j)–(l) and (p)–(r) are for 2071–2100 relative 1971–2000. First and fourth columns represent the 25th percentile, second and fifth columns are the median and the third and sixth columns represent the 75th percentile.
Figure 4 shows the model spread of the relative change in precipitation for a mid-century and an end of the century period relative to 1971–2000 using the RCM ensemble for all three SSP scenarios. For the mid-century median for all three scenarios (Fig. 4b, h and n) we see a positive change between 10 % and 50 % for most of Greenland except region SE with no clear change. For the mid-century 25th percentile (Fig. 4a, g and m) we mostly see a positive change (10 % to 30 %) for regions NE and NO and a negative change (−10 % to −30 %) in region SE. For the mid-century 75th percentile (Fig. 4c, i and o) all of Greenland shows a positive change that is most pronounced in regions NE and NO with values in the range 30 % to 70 %.
Towards the end of the century, we see an overall amplification of the mid-century signal. The ensemble median shows a reduction in precipitation compared with the mid-century values for the SSP1-2.6 scenario (Fig. 4e) while SSP2-4.5 (Fig. 4k) and SSP5-8.5 (Fig. 4q) show an increase (except region SE) with values reaching 100 % for region NE for SSP5-8.5. For the end of century 25th percentile (Fig. 4d, j and p), we see similar patterns except for region SE with a −10 % to −30 % change along the outer edge. For the end of century 75th percentile (Fig. 4f, l and r) we see a positive change for most of Greenland with values reaching 30 % to 70 % in region NE for SSP2-4.5 and values reaching 70 % to 110 % for SSP5-8.5.
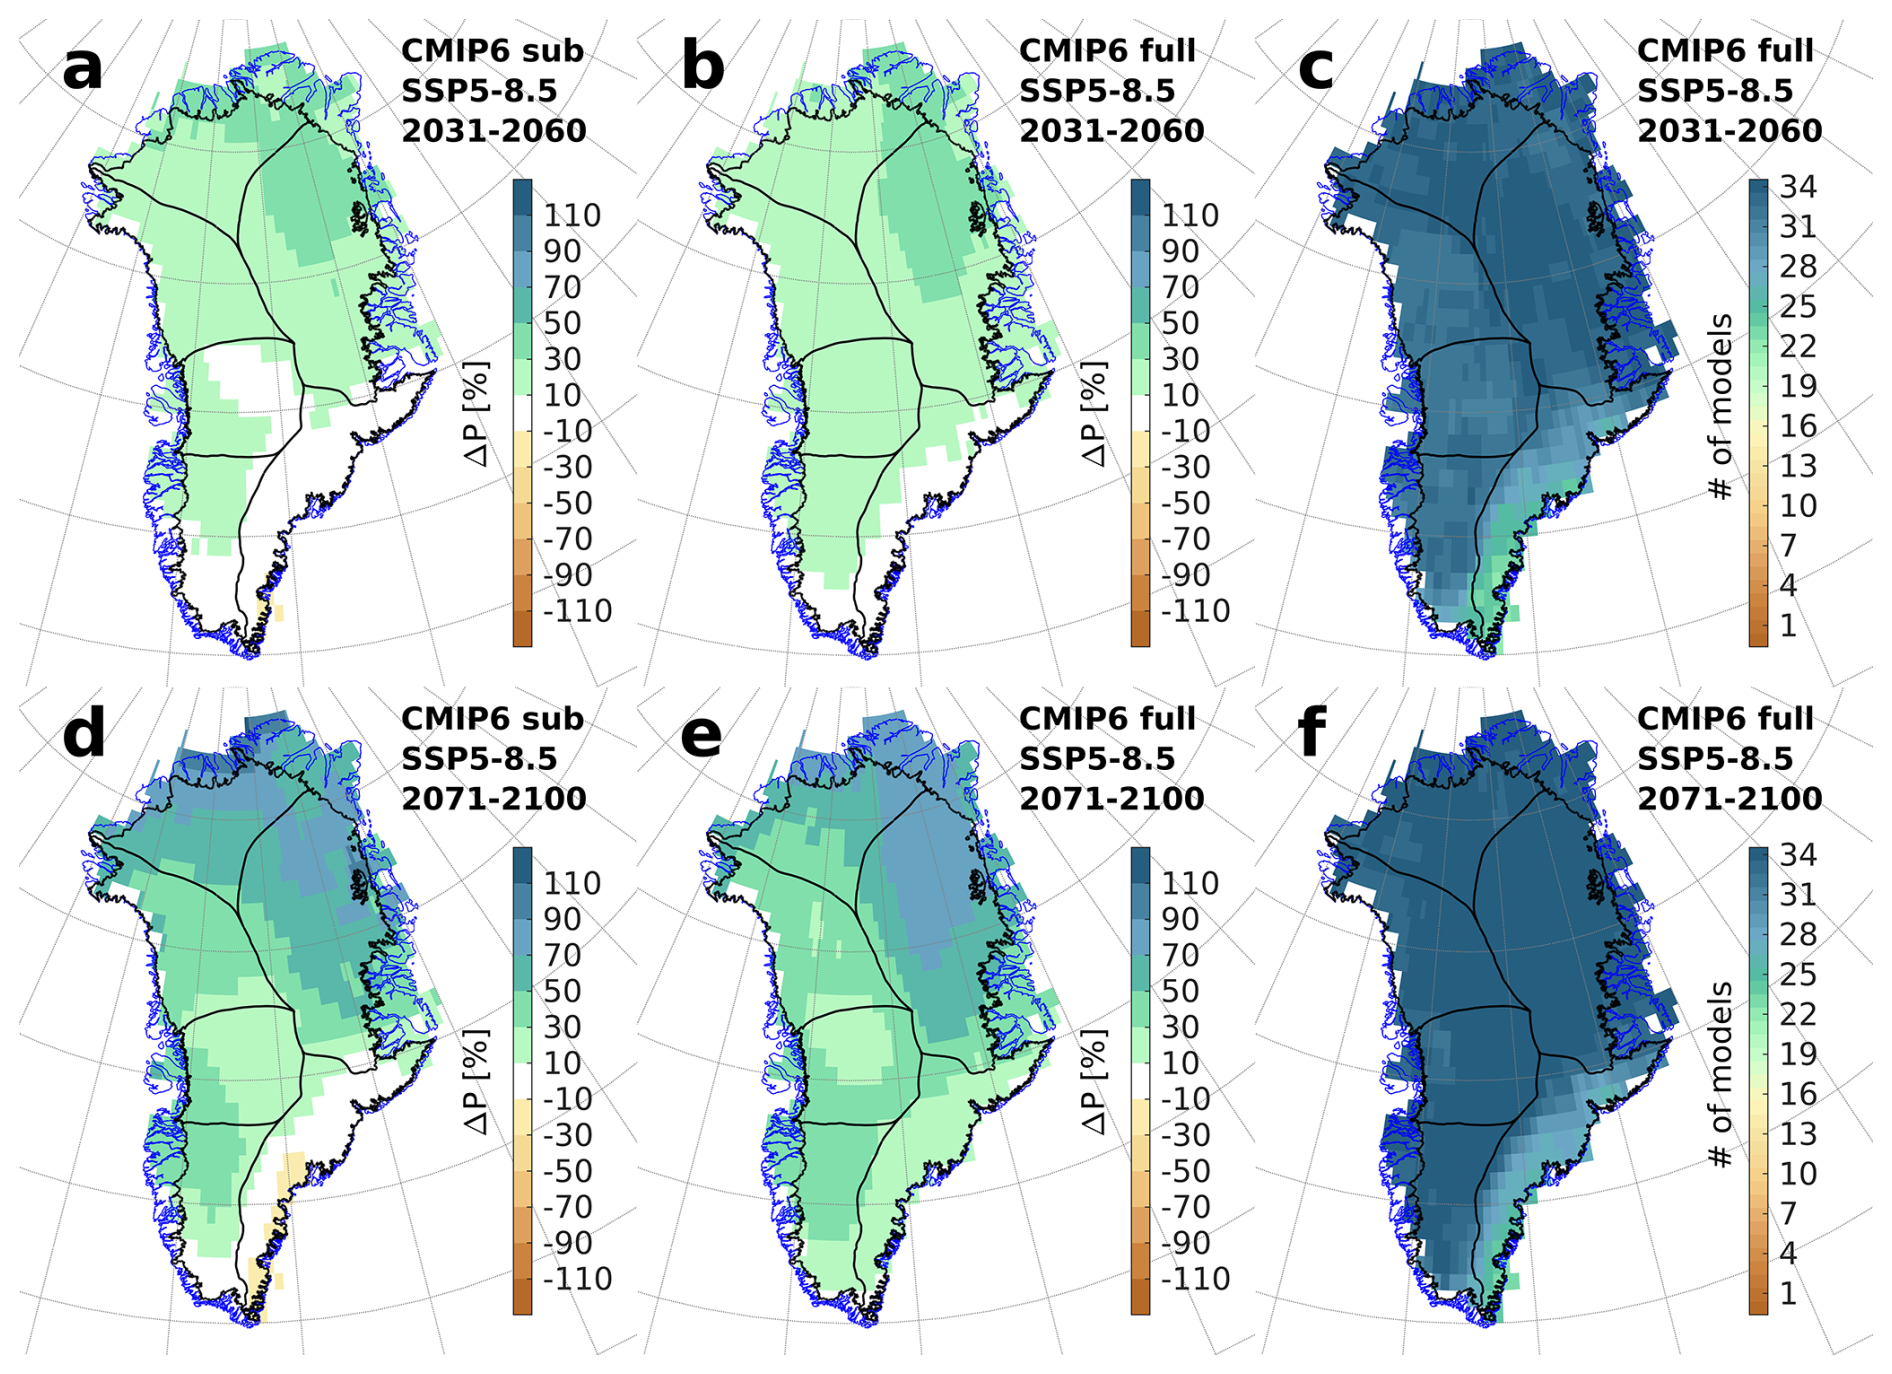
Figure 5Ensemble median relative change in precipitation using the subset of CMIP6 models used when downscaling the RCMs for 2031–2060 (a) and 2071–2100 (d) relative to 1971–2000 for the SSP5-8.5 scenario. The corresponding ensemble median relative change using the full set of 34 CMIP6 GCMs are shown in panels (b) and (e) for 2031–2060 and 2071–2100, respectively. The two panels (c) and (f) in the right column show number of CMIP6 models, using the full 34 model set, with a positive relative change in precipitation for 2031–2060 (c) and 2071–2100 (f) relative to 1971–2000 for the SSP5-8.5 scenario, respectively.
Figure 5a and d show the ensemble mean relative change, using the eight CMIP6 GCMs dynamically downscaled by the RCMs (cf. Table 2), for the SSP5-8.5 scenario for 2031–2060 and 2071–2100 relative 1971–2000, respectively. The mid-century relative change is between 10 % and 30 % for regions SW, NO and NE with areas reaching 50 % for region NE. For the end of the century, all regions except SE show a positive change with areas reaching 90 % in NO and NE. Figure 5b and e give the corresponding maps when using the full 34 CMIP6 GCM ensemble for the SSP5-8.5 scenario. Compared with the eight-model ensemble, the full model ensemble has larger changes for all six subregions but most pronounced for region SE where we now see a positive change in the range 10 % to 30 %. Figure 5c and f show the number of CMIP6 models that give positive changes in precipitation for the mid-century and end of century, pixel by pixel. The CMIP6 ensemble show good agreement for all drainage basins except for region SE where about 6 of the 34 members show a negative change for the end of the century, in line with Huai et al. (2025).
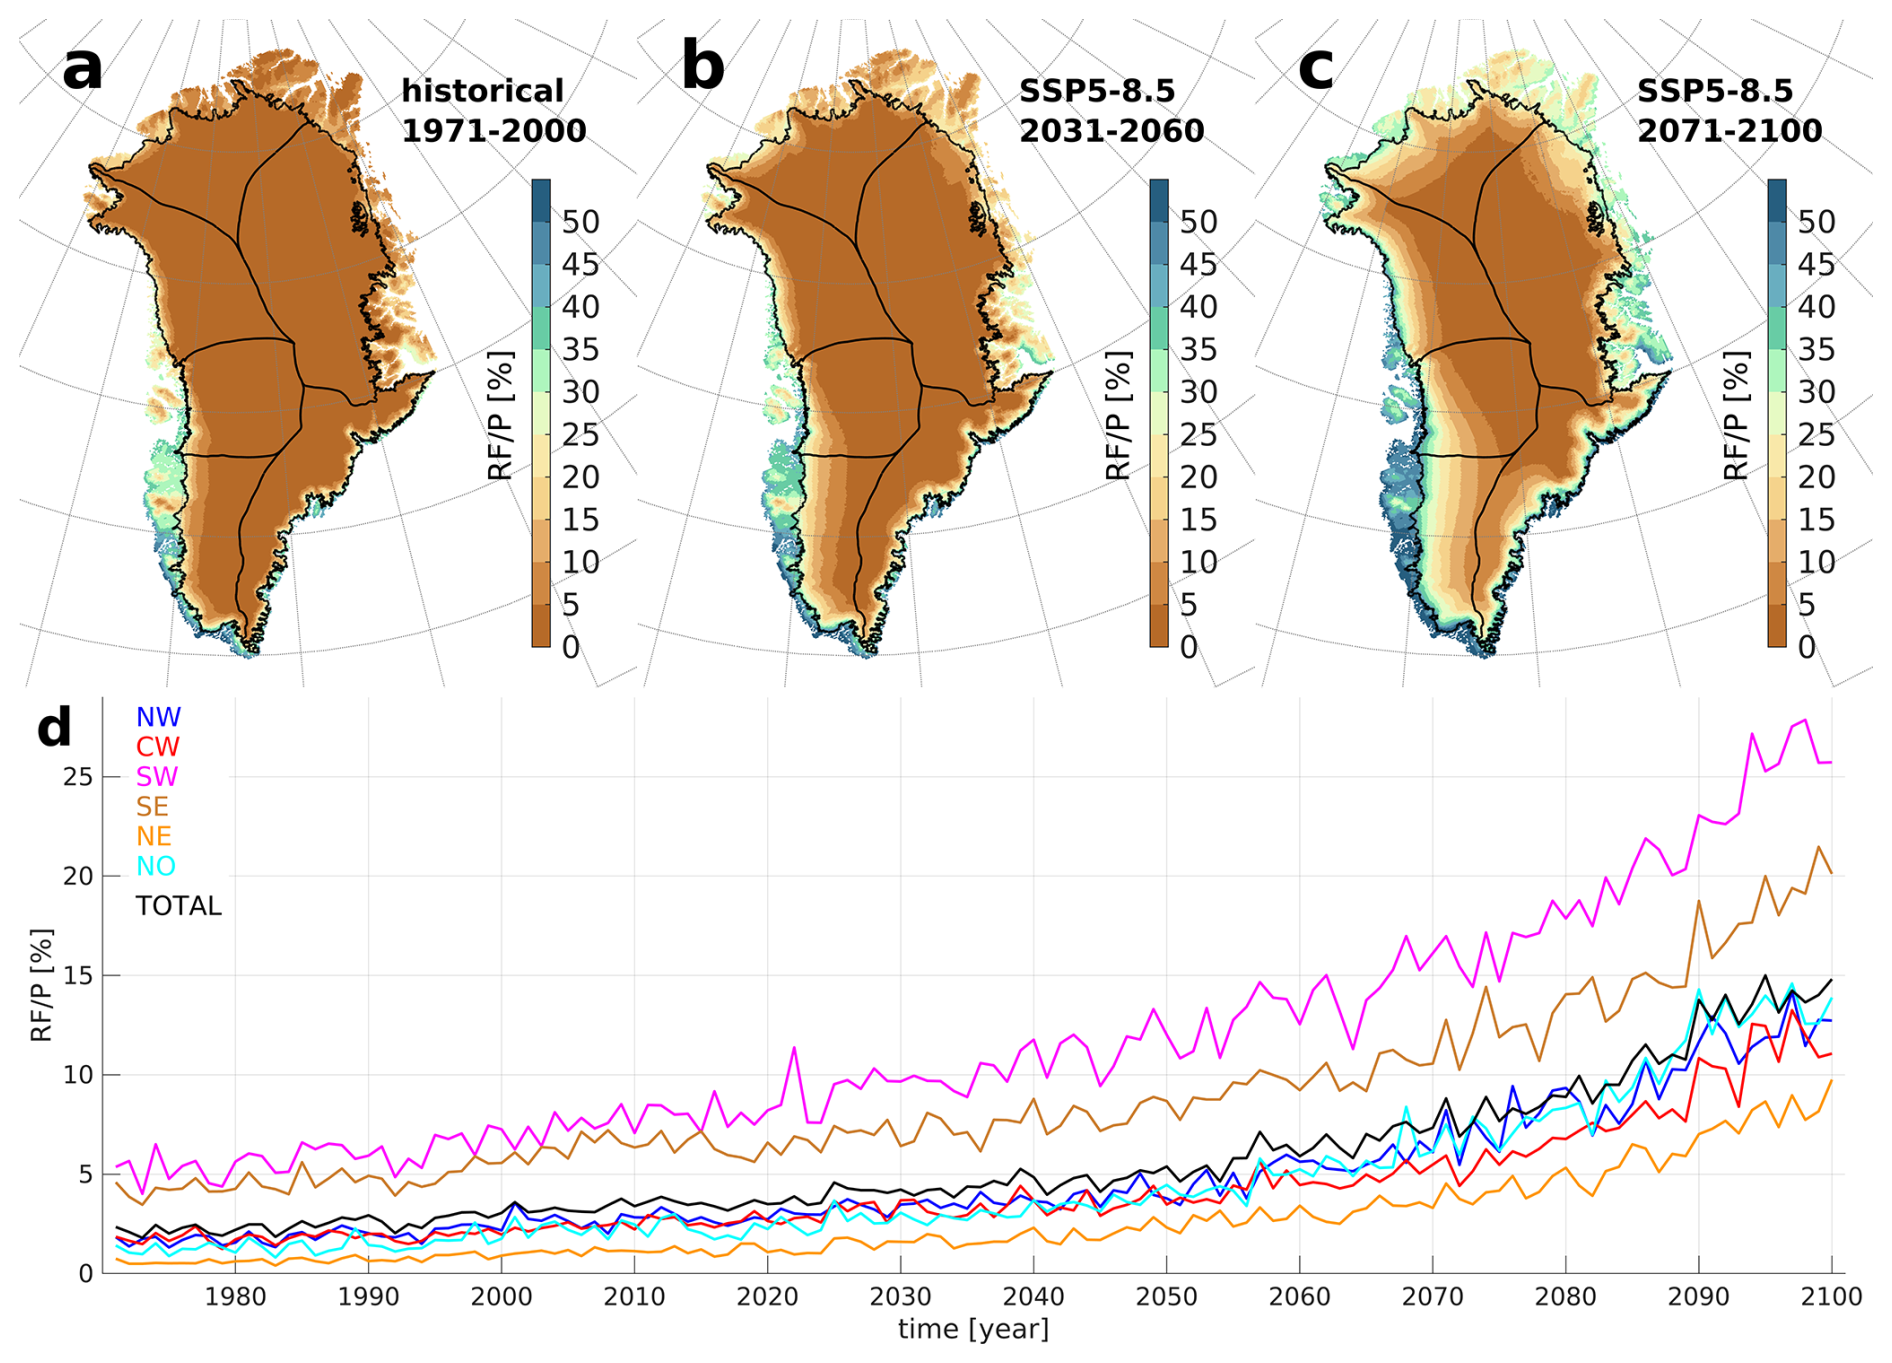
Figure 6Ensemble median rainfall fraction of total precipitation in Greenland, using the eleven-model ensemble for the historical period 1971–2000 (a) and the two SSP5-8.5 scenario periods 2031–2060 (b) and 2071–2100 (c). Also shown is a time series of ensemble median annual values of the rainfall fraction for all six drainage basins and the total ice sheet (d).
Figure 6 shows the change from solid to liquid precipitation for the SSP5-8.5 scenario, represented by the rainfall fraction (rainfall amount divided by the total precipitation amount) where a value of 50 % would mean that rainfall and snowfall contribute equal amounts to the total precipitation. This indicates that not only will there be an increase in precipitation in the future, but an increasing fraction of that will be rainfall, especially around the ice sheet margins. At the end of the century for the SSP5-8.5 scenario (Fig. 6c), we see that a large fraction of the precipitation is rainfall, especially in the south (basins SW and SE; cf. Fig. 1a). Figure 6d shows how the rainfall fraction of total precipitation for the six drainage basins changes with time. For the historical period, the mean rainfall fraction is around 5 % for basins SW and SE while the other basins show mean values below 2 %. At the end of the century for the SSP5-8.5 scenario, we see that a large fraction of the precipitation is rainfall (total ice sheet: around 15 %), especially for basins SW (above 25 %) and SE (around 20 %).
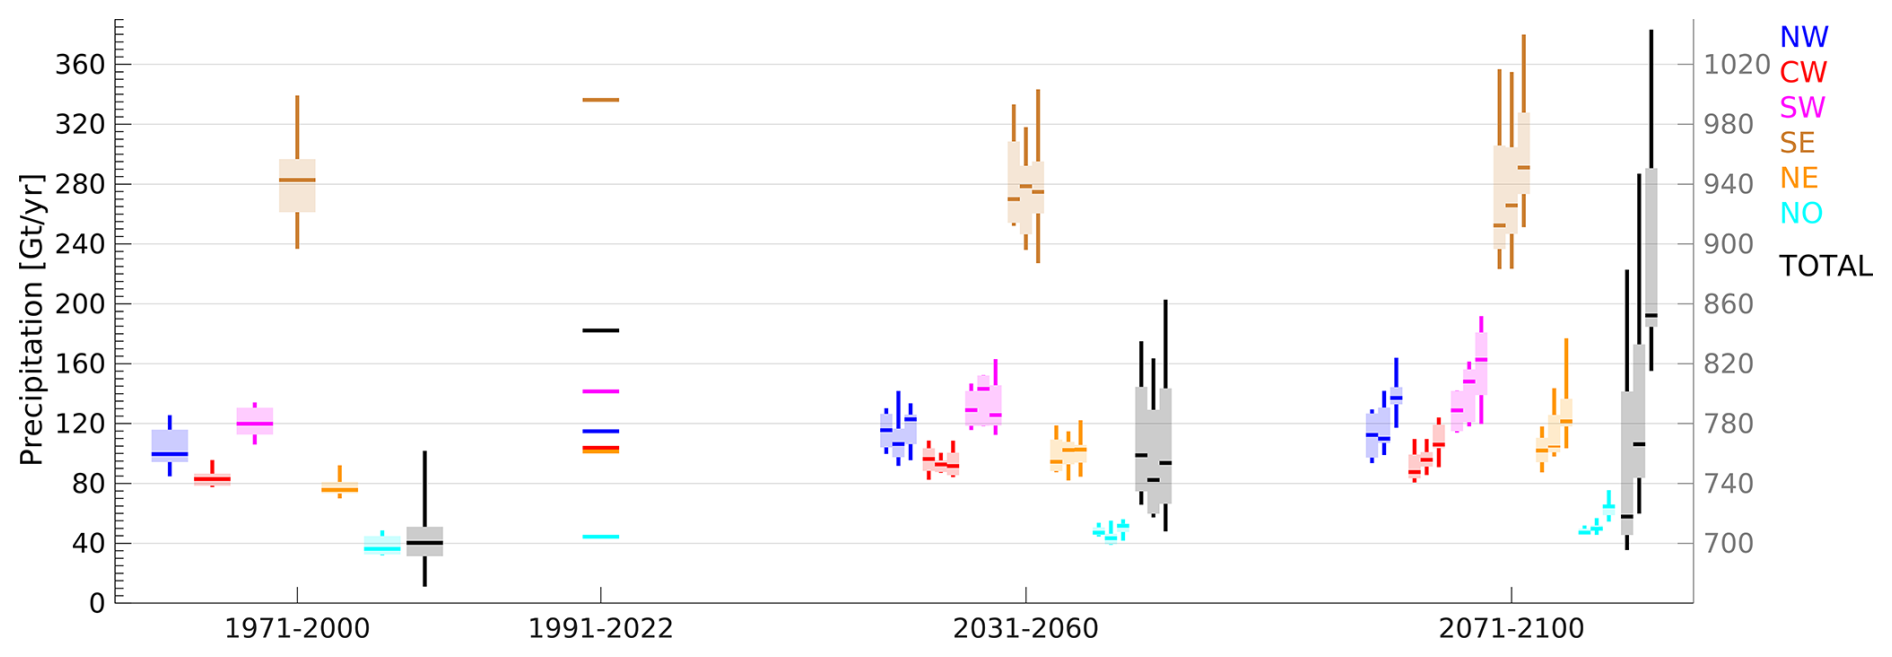
Figure 7Mean precipitation (in Gt per year) for the RCM simulations over the six drainage basins and the full ice sheet for the historical period 1971–2000, for CARRA (1991–2022) and the scenario periods 2031–2060 and 2071–2100. The horizontal lines denote the ensemble median, the boxes represent the 25th to 75th percentiles while the vertical bars show the full model spread. For the two scenario periods the boxes are split into three segments: the left for SSP1-2.6, the middle for SSP2-4.5 and the right for SSP5-8.5. The y axis to the right is used for the full ice sheet (black) while the values for the six individual drainage basins are given by the y axis to the left.
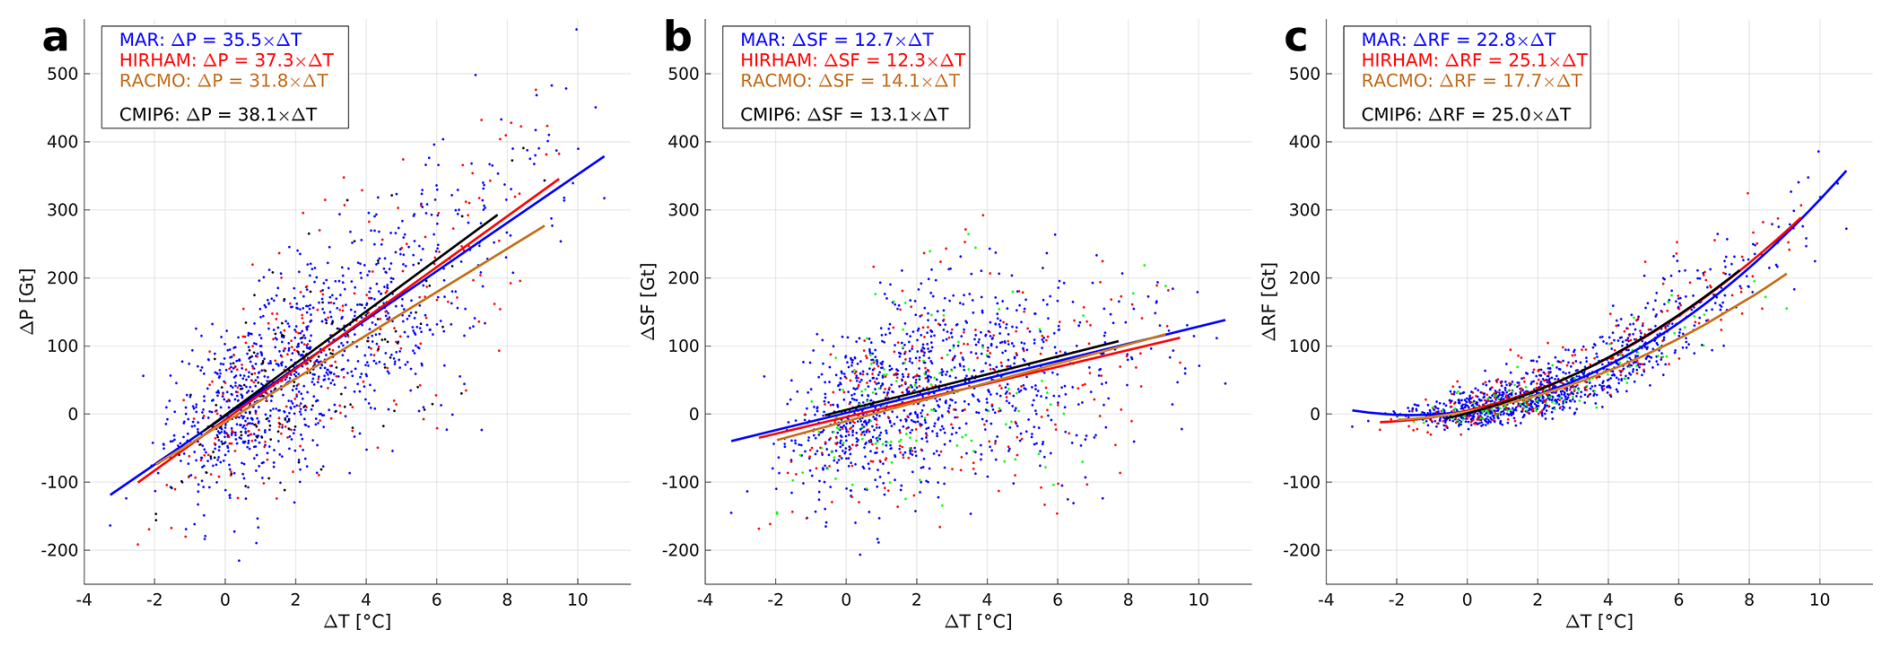
Figure 8Annual sum of precipitation (a), snowfall (b) and rainfall (c) over the Greenland ice sheet as a function of annual mean near-surface temperature for the period 1971–2100, using the SSP5-8.5 scenario, with respect to the 1971–2000 mean. The data are separated for each RCM (MAR: blue, HIRHAM: red and RACMO: brown), including a least square fit (linear for a and b, second degree polynomial for c). Also shown is the least square fit to the 34 CMIP6 model ensemble mean values (black).
Figure 7 shows the annual total precipitation for the six drainage basins (using the left y axis) as well as for the total ice sheet (using the right y axis) for CARRA and the RCM simulations. The vertical extent of each bar represents the model spread for each basin while the boxes show the 25th, 50th and the 75th percentiles of the ensemble. For the two scenario periods the bar is split into three segments to show the difference between the three SSPs. The largest uncertainties are, as expected, found in region SE. There is no clear difference between the SSPs for the 2031–2060 period while the 2071–2100 period has a clear difference in the ensemble median. The CARRA values match the higher end of the model spread for each basin, giving a total annual amount that is significantly higher than any of the other models for the reference period.
A warmer atmosphere has an exponentially higher saturation specific humidity (can hold more water vapour), termed the Clausius-Clapeyron relationship with a theoretical relationship on a global scale of about a 7 % increase per degree warming (Trenberth et al. 2003). However, many factors complicate the translation of vapour pressure to precipitation including local factors such as wind regimes and larger scale factors such as changes in atmospheric circulation as well as the role played by boundary layer inversions (see e.g. Nicola et al., 2023). We nonetheless note an increase in precipitation over the course of the century. Figure 8a shows the relationship between annual temperature and annual precipitation over the ice sheet for the three RCMs using data for the historical period and the SSP5-8.5 scenario only to have a more uniform distribution of the data points. Here we see that the integrated precipitation over the ice sheet increases with 31.8, 35.5, and 37.3 Gt per degree change in temperature for RACMO, MAR and HIRHAM respectively. Figure 8b and c show that the increase in rainfall per degree of warming is larger than the increase in snowfall per degree of warming. Snowfall is expected to increase by about 13 Gt per degree of warming while rainfall is expected to increase with above 20 Gt per degree of warming during the 21st century but with a non-linear trend indicating a much higher value at the end of the century.
In absolute terms (cf. Fig. 9a), for the end of century SSP5-8.5 scenario the largest changes are expected, using the RCM ensemble, in the south west of Greenland with values exceeding 200 mm yr−1 and along the outer edge of the ice sheet with values between 100 and 200 mm yr−1 (except for the south east with values close to 0). A similar pattern is seen using the subset of GCMs (cf. Fig. 9b) but with even lower (and negative) values in the south east. For the full set of GCMs (cf. Fig. 9c) we find increases for all of the ice sheet with the highest values in the south west and south east.
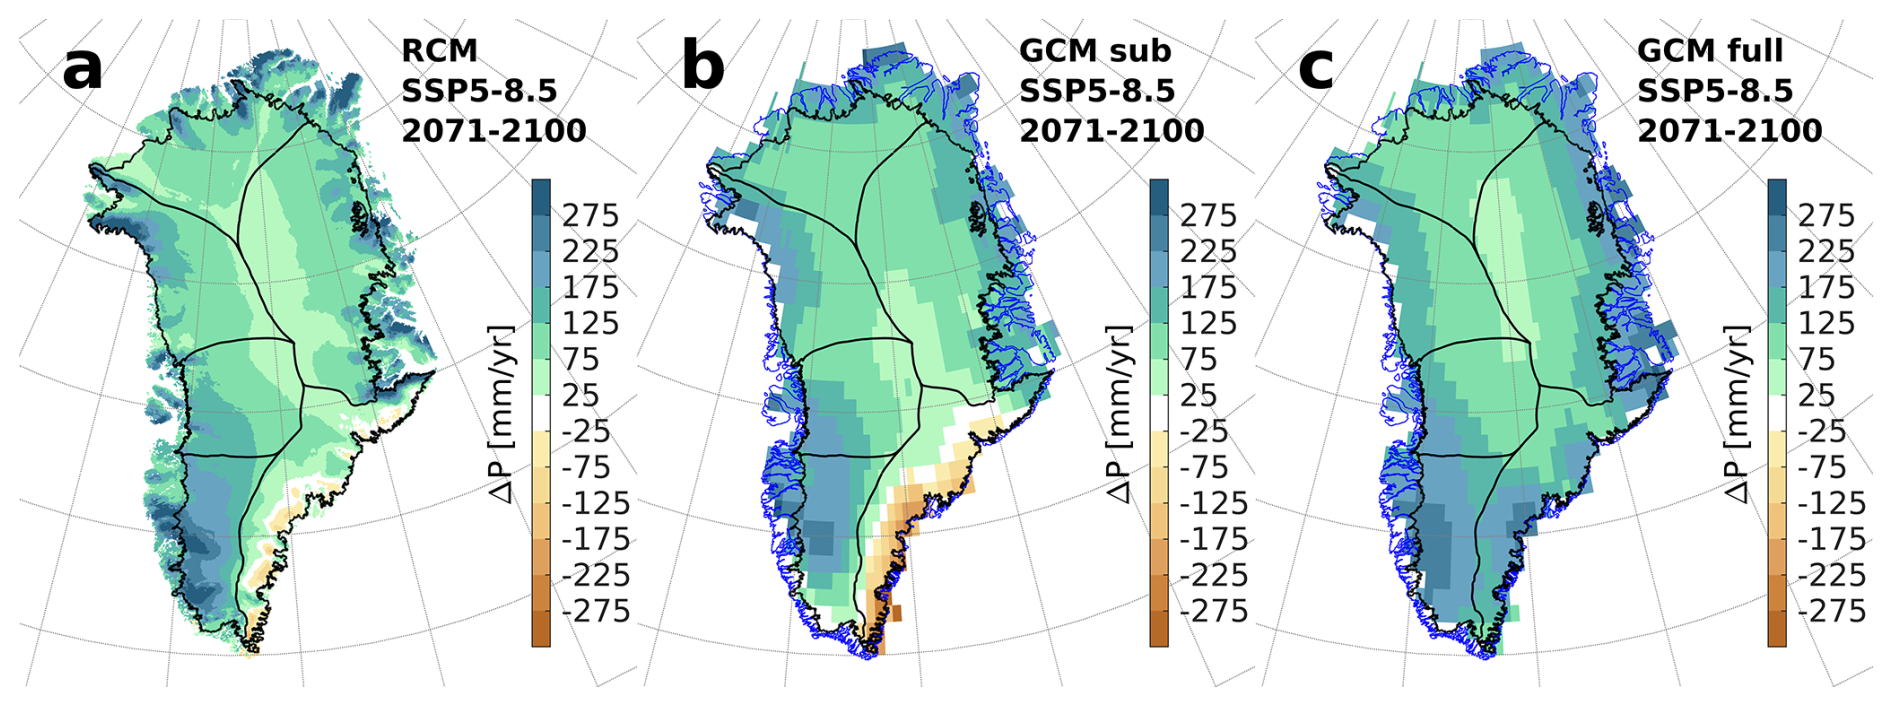
Figure 9Ensemble median absolute change in precipitation for SSP5-8.5 for 2071–2100 relative 1971–2000 using the RCM ensemble (a), the subset of downscaled GCMs (b) and the full set of GCMs (c).
4.1 Implications for mass budget
Using an ensemble of high resolution RCM simulations for the SSP1-2.6/SSP2-4.5/SSP5-8.5 scenarios, we predict an increase of precipitation on the ice sheet during the 21st century, though with a change in the relative distribution of precipitation as well as a change in the phase. By the end of the century, the ice sheet is expected to receive between 40 and 170 Gt more precipitation annually, depending on the climate scenario (cf. Table 1), an increase between 6 % and 24 % compared to the present day. The largest relative differences are predicted in the north east of Greenland, where all models see a marked increase. In the southeast by contrast, the RCM ensemble median give relative changes close to zero (cf. Figs. 4 and 7). Results from the GCM ensemble from CMIP6 (cf. Fig. 5) show that the north east signal is robust across most models while the south east signal is positive for 28 out of the 34 models for the end of the century (cf. Fig. 5f). The RCMs follow the forcing GCM climate in this respect but their higher resolution shows more detail on the local scale.
The precipitation phase is important because rainfall serves as a crucial climate indicator in polar regions and plays a multifaceted role in cryospheric processes. When heavy rain falls on low temperature snow or ice surfaces, its infiltration not only contributes directly to surface melt, but also initiates a sequence of physical changes in the snowpack (Box et al., 2022a). The freezing of rainwater within the firn releases latent heat, which further enhances snowpack collapse by warming the surrounding ice and snow (Harper et al., 2023). In addition, rainfall events lower the surface albedo making the surface more susceptible to future melting due to increased absorption of solar radiation (Noël et al., 2022; Firn Symposium team, 2024; Gilbert et al., 2025; Box et al., 2022b).
A reduction in Arctic sea ice cover, due to increases in atmospheric CO2, can enhance transfer of heat and moisture between the ocean and the atmosphere leading to an increase in temperature and precipitation over Greenland (Stroeve et al., 2017; Noël et al., 2014). This increase in temperature will increase the ice melt and thereby decreasing the surface albedo creating a positive feedback loop, resulting in a warmer atmosphere with the capacity to hold more water vapor and thereby intensifying the hydrological cycle (Zeitz et al., 2021).
4.2 Sources of spread in precipitation projections
Huai et al. (2025) used CMIP6 GCM outputs for the SSP5-8.5 scenario and found a northeastward shift of the Icelandic low leading to lower precipitation amounts in southeast Greenland. The future location of the Icelandic low has therefore an important influence on precipitation changes over southeast Greenland, as CMIP6 models have some important biases in the Iceland Low and representation of the North Atlantic Oscillation. Furthermore, Greenland blocking events are difficult to estimate by climate models (Davini et al., 2021) and can have a large impact on precipitation, especially during winter.
CARRA has shown clear advantages to other reanalysis products (Køltzow et al., 2022; Box et al., 2023) and CARRA performs well when compared with station observations outside the ice sheet (cf. Fig. 3). Compared with our RCM ensemble (cf. Fig. 7) over the ice sheet, CARRA overestimate precipitation for all basins except NO and NW. This may simply reflect the local conditions around the observation sites, which are typically located in or near topographically complex terrain, difficult to capture even at 2.5 km resolution. To accurately capture extreme weather events in Greenland, DMI use a sub-km resolution model for numerical weather prediction purposes (Yang, 2018, 2019).
Using the mean values of total precipitation, separated by RCM, in Table 1 for the period 1971–2000 together with the relationship between precipitation and temperature in Fig. 8, we get 4.9 %, 5.1 % and 4.5 % increase in precipitation per Kelvin for HIRHAM, MAR and RACMO, respectively. These values are lower than the app. 7 % K−1 predicted by the Clausius-Clapeyron relationship between the moisture holding capacity (actually the saturation water vapor pressure) and integrated temperature (Trenberth et al., 2003). However, the near-surface temperature is not an accurate measure of the vertically weighted atmospheric temperature where the moisture resides. Moreover, the total ice sheet precipitation is for an important part topographically forced, i.e. very sensitive to changes in the large-scale circulation. Bochow et al. (2024) used 32 GCMs within the CMIP6 project and found a mean value between 3 % K−1 and 6 % K−1 following the scenario used for the ice sheet but with a strong spatial dependence. A 5 % increase in precipitation per degree warming over the ice sheet were found by Gregory and Huybrechts (2006) and by Fettweis et al. (2013). There are several ways of determining the relationship between temperature and precipitation changes. Frieler et al. (2015) used a wide range of methods for Antarctica and derived a combined sensitivity of 5±1 % K−1. The individual forcing models in this study give similar values. Box et al. (2013) found 7 % K−1 using reconstructions of snow accumulation from ice cores together with the average near-surface air temperature in the Northern Hemisphere for the period 1880–1962 during which the temperature increase was relatively low (less than +1 °C) and during which changes in general circulation or natural variability could have also impacted this precipitation increase vs temperature increase. However, values close to the theoretical 7 % K−1 relationship are only expected for heavy rain conditions (Trenberth et al., 2003). The values around 5 % K−1 found in this study are in agreement with other studies for similar conditions and, as expected, smaller than the 7 % K−1 relationship between the water holding capacity (i.e. not precipitation) and integrated temperature (i.e. not near-surface temperature).
Figure 6 shows that a significant fraction of future precipitation, particularly over the southern ice sheet, will fall as rain. On the broad scale, rain replacing snow implies enhanced ablation over the ice sheet due to surface energy budget and firn processes (Box et al., 2023). On a local to regional scale, increased rainfall, particularly close to the end of the melt season, has also been shown to affect outlet glacier dynamics (Doyle et al., 2014) with local short-lived increases in ice velocity. The CMIP6 GCMs are unlikely to capture this transition from snow to rain, and along with the higher resolution show how RCMs add value to the GCMs when considering future climate change. Zhang et al. (2024) used 21 CMIP6 models for the SSP5-8.5 scenario giving a projected annual increase in precipitation over the ice sheet of 280 Gt for 2071–2100 relative 1986–2005. The RCM ensemble median gives 170 Gt with individual model values ranging from 120 to 360 Gt.
A clear limitation of this study is that RCMs often exhibit large biases in simulating point-wise precipitation, while the observations also have large uncertainties, especially when undercatch is prominent. The large-scale circulation and sea surface temperatures from forcing GCMs often have errors that are subsequently inherited by the RCMs. Furthermore, small-scale convective processes are not (fully) resolved by the RCMs used in this study. Also, the lack of a gridded observational product for Greenland makes it difficult to perform bias adjustment of the modeled precipitation. These limitations are, to some degree, compensated when looking at relative changes and not absolute values and the use of an RCM ensemble instead of looking at a single RCM.
Our work, consistent with theory, finds that the Greenland ice sheet faces a wetter future in all regions, with as a possible exception the southeast. The fraction of rain relative to the total precipitation increases exponentially with temperature during the 21st century. Our analysis clearly shows a linear relationship between annual precipitation amounts and annual mean temperature as well as a dependency on shared socioeconomic pathway (SSP). We also see a dependency on driving model; when all three RCMs downscale the same GCM (CESM2-L) we obtain similar results on change in precipitation for both scenario periods (cf. Table 1). For the historical period, the different MAR simulations show similar results while HIRHAM, and to some extent RACMO, present different characteristics (cf. Fig. 3). At the end of the century, HIRHAM, driven by EC-Earth3, and MAR, driven by IPSL-CM6 and UKESM1.0, give much higher changes in precipitation over the ice sheet than the other RCM simulations, indicating a dependency on the choice of GCM. The more detailed topography from the higher resolution RCMs shows a complexity in the distribution of precipitation suggesting that using emulation techniques on RCM output to expand future ensembles of climate simulations is feasible.
All GCM, RCM, CARRA and station observation data used in this study will be made available upon request. CARRA data can be downloaded from the Copernicus Arctic Regional Reanalysis webpage at https://climate.copernicus.eu/copernicus-arctic-regional-reanalysis-service (last access: 18 May 2026). The drainage basin information can be downloaded from http://imbie.org/imbie-2016/drainage-basins/ (last access: 18 May 2026).
FB designed the study with contributions from all co-authors. FB performed the HIRHAM simulations, the data collection and the analysis. XF and MvdB provided the MAR and RACMO data, respectively. FB wrote the paper with contributions from all co-authors.
At least one of the (co-)authors is a member of the editorial board of The Cryosphere. The peer-review process was guided by an independent editor, and the authors also have no other competing interests to declare.
Publisher's note: Copernicus Publications remains neutral with regard to jurisdictional claims made in the text, published maps, institutional affiliations, or any other geographical representation in this paper. The authors bear the ultimate responsibility for providing appropriate place names. Views expressed in the text are those of the authors and do not necessarily reflect the views of the publisher.
Fredrik Boberg, Nicolaj Hansen and Ruth Mottram are supported by the Danish State through the National Centre for Climate Research (NCKF). Finally, we would like to thank Thomas Mölg for editorial handling and Jason Box and an anonymous reviewer for helpful and supportive comments that improved this paper.
This research has been supported by the European Union's Horizon 2020 project PROTECT (grant no. 869304) and the Novo Nordisk Foundation project PRECISE (grant no. NNF23OC0081251).
This paper was edited by Thomas Mölg and reviewed by Jason Box and one anonymous referee.
Allerup, P., Madsen, H., and Vejen, F.: A comprehensive model for correcting point precipitation, Nord. Hydrol., 28, 1–20, 1997.
Bailey, H. and Hubbard, A.: Snow mass recharge of the Greenland ice sheet fueled by intense atmospheric river, Geophys. Res. Lett., 52, e2024GL110121, https://doi.org/10.1029/2024GL110121, 2025.
Boberg, F., Langen, P. L., Mottram, R. H., Christensen, J. H., and Olesen, M.: 21st-century climate change around Kangerlussuaq, west Greenland: From the ice sheet to the shores of Davis Strait, Arct. Antarct. Alp. Res., 50, https://doi.org/10.1080/15230430.2017.1420862, 2018.
Boberg, F., Mottram, R., Hansen, N., Yang, S., and Langen, P. L.: Uncertainties in projected surface mass balance over the polar ice sheets from dynamically downscaled EC-Earth models, The Cryosphere, 16, 17–33, https://doi.org/10.5194/tc-16-17-2022, 2022.
Bochow, N., Poltronieri, A., and Boers, N.: Projections of precipitation and temperatures in Greenland and the impact of spatially uniform anomalies on the evolution of the ice sheet, The Cryosphere, 18, 5825–5863, https://doi.org/10.5194/tc-18-5825-2024, 2024.
Box, J. E., Cressie, N., Bromwich, D. H., Jung, J., van den Broeke, M., van Angelen, J. H., Forster, R. R., Miège, C., Mosley-Thompson, E., Vinther, B., and McConnell, J. R.: Greenland ice sheet mass balance reconstruction. Part I: net snow accumulation (1600–2009), J. Climate, 26, 3919–3934, https://doi.org/10.1175/JCLI-D-12-00373.1, 2013.
Box, J. E., Hubbard, A., Bahr, D. B., Colgan, W. T., Fettweis, X., Mankoff, K. D., Wehrlé, A., Noël, B., van den Broeke, M. R., Wouters, B., Bjørk, A. A., and Fausto, R. S.: Greenland ice sheet climate disequilibrium and committed sea-level rise, Nat. Clim. Chang., 12, 808–813, https://doi.org/10.1038/s41558-022-01441-2, 2022a.
Box, J. E., Wehrlé, A., vanAs, D., Fausto, R. S., Kjeldsen, K. K., Dachauer, A., Ahlstrøm, A. P., and Picard, G.: Greenland ice sheet rainfall, heat and albedo feedback impacts from the mid-August 2021 atmospheric River, Geophys. Res. Lett., 49, e2021GL097356, https://doi.org/10.1029/2021GL097356, 2022b.
Box, J. E., Nielsen, K. P., Yang, X., Niwano, M., Wehrlé, A., van As, D., Fettweis, X., Køltzow, M. A. Ø., Palmason, B., Fausto, R. S., van den Broeke, M. R., Huai, B., Ahlstrøm, A. P., Langley, K., Dachauer, A., and Noël, B.: Greenland ice sheet rain climatology, extremes and atmospheric river rapids, Meteorol. Appl., 30, e2134, https://doi.org/10.1002/met.2134, 2023.
Davini, P.,Weisheimer, A., Balmaseda, M., Johnson, S. J., Molteni, F., Roberts, C. D., Senan, R., and Stockdale, T. N.: The representation of winter Northern Hemisphere atmospheric blocking in ECMWF seasonal prediction systems, Q. J. Roy. Meteor. Soc., 147, 1344–1363, https://doi.org/10.1002/qj.3974, 2021.
Döscher, R., Acosta, M., Alessandri, A., Anthoni, P., Arsouze, T., Bergman, T., Bernardello, R., Boussetta, S., Caron, L.-P., Carver, G., Castrillo, M., Catalano, F., Cvijanovic, I., Davini, P., Dekker, E., Doblas-Reyes, F. J., Docquier, D., Echevarria, P., Fladrich, U., Fuentes-Franco, R., Gröger, M., v. Hardenberg, J., Hieronymus, J., Karami, M. P., Keskinen, J.-P., Koenigk, T., Makkonen, R., Massonnet, F., Ménégoz, M., Miller, P. A., Moreno-Chamarro, E., Nieradzik, L., van Noije, T., Nolan, P., O'Donnell, D., Ollinaho, P., van den Oord, G., Ortega, P., Prims, O. T., Ramos, A., Reerink, T., Rousset, C., Ruprich-Robert, Y., Le Sager, P., Schmith, T., Schrödner, R., Serva, F., Sicardi, V., Sloth Madsen, M., Smith, B., Tian, T., Tourigny, E., Uotila, P., Vancoppenolle, M., Wang, S., Wårlind, D., Willén, U., Wyser, K., Yang, S., Yepes-Arbós, X., and Zhang, Q.: The EC-Earth3 Earth system model for the Coupled Model Intercomparison Project 6, Geosci. Model Dev., 15, 2973–3020, https://doi.org/10.5194/gmd-15-2973-2022, 2022.
Doyle, S. H., Hubbard, A., Fitzpatrick, A. A. W., van As, D., Mikkelsen, A. B., Pettersson, R., and Hubbard, B.: Persistent flow acceleration within the interior of the Greenland ice sheet, Geophys. Res. Lett., 41, 899–905, https://doi.org/10.1002/2013GL058933, 2014.
Fausto, R. S., van As, D., Mankoff, K. D., Vandecrux, B., Citterio, M., Ahlstrøm, A. P., Andersen, S. B., Colgan, W., Karlsson, N. B., Kjeldsen, K. K., Korsgaard, N. J., Larsen, S. H., Nielsen, S., Pedersen, A. Ø., Shields, C. L., Solgaard, A. M., and Box, J. E.: Programme for Monitoring of the Greenland Ice Sheet (PROMICE) automatic weather station data, Earth Syst. Sci. Data, 13, 3819–3845, https://doi.org/10.5194/essd-13-3819-2021, 2021.
Fausto, R. S., How, P., Vandecrux, B., Lund, M. C., Box, J. E., Mankoff, K. D., Andersen, S. B., van As, D., Bahbah, R., Citterio, M., Colgan, W., Jakobsgaard, H. T., Karlsson, N. B., Kjeldsen, K. K., Larsen, S. H., Olsen, C., Oraschewski, F. M., Rutishauser, A., Shields, C. L., Solgaard, A. M., Stevens, I. T., Svendsen, S. H., Langley, K., Messerli, A., Bjørk, A. A., Andersen, J. K., Abermann, J., Steiner, J., Prinz, R., Hynek, B., Lea, J. M., Brough, S., and Ahlstrøm, A. P.: PROMICE | GC-NET automatic weather station data, Earth Syst. Sci. Data, 18, 2829–2873, https://doi.org/10.5194/essd-18-2829-2026, 2026.
Fettweis, X., Franco, B., Tedesco, M., van Angelen, J. H., Lenaerts, J. T. M., van den Broeke, M. R., and Gallée, H.: Estimating the Greenland ice sheet surface mass balance contribution to future sea level rise using the regional atmospheric climate model MAR, The Cryosphere, 7, 469–489, https://doi.org/10.5194/tc-7-469-2013, 2013.
Firn Symposium team: The, Firn on ice sheets, Nat. Rev. Earth Environ., 5, 79–99, https://doi.org/10.1038/s43017-023-00507-9, 2024.
Frieler, K., Clark, P. U., He, F., Buizert, C., Reese, R., Ligtenberg, S. R. M., van den Broeke, M. R., Winkelmann, R. and Levermann, A.: Consistent evidence of increasing Antarctic accumulation with warming, Nat. Clim. Change, 5, 348–352, https://doi.org/10.1038/nclimate2574, 2015.
Gilbert, E., Pishniak, D., Torres, J. A., Orr, A., Maclennan, M., Wever, N., and Verro, K.: Extreme precipitation associated with atmospheric rivers over West Antarctic ice shelves: insights from kilometre-scale regional climate modelling, The Cryosphere, 19, 597–618, https://doi.org/10.5194/tc-19-597-2025, 2025.
Glaude, Q., Noel, B., Olesen, M., Van den Broeke, M., van de Berg, W. J., Mottram, R., Hansen, N., Delhasse, A., Amory, C., Kittel, C., Goelzer, H., and Fettweis, X.: A factor two difference in 21st-century Greenland ice sheet surface mass balance projections from three regional climate models under a strong warming scenario (SSP5-8.5), Geophys. Res. Lett., 51, e2024GL111902, https://doi.org/10.1029/2024GL111902, 2024.
Gregory, J. M. and Huybrechts, P.: Ice-sheet contributions to future sea-level change, Phil. T. R. Soc. A., 364, 1709–1732, https://doi.org/10.1098/rsta.2006.1796, 2006.
Harper, J., Saito, J., and Humphrey, N.: Cold season rain event has impact on Greenland's firn layer comparable to entire summer melt season, Geophys. Res. Lett., 50, e2023GL103654, https://doi.org/10.1029/2023GL103654, 2023.
Hofer, S., Lang, C., Amory, C.,Kittel, C., Delhasse, A., Tedstone, A., and Fettweis, X.: Greater Greenland Ice Sheet contribution to global sea level rise in CMIP6. Nat. Commun., 11, 6289, https://doi.org/10.1038/s41467-020-20011-8, 2020.
Huai, B., Van Den Broeke, M. R., Reijmer, C. H., and Cappellen, J.: Quantifying Rainfall in Greenland: A Combined Observational and Modeling Approach, J. Appl. Meteorol. Climatol., 60, 1171–1188, https://doi.org/10.1175/JAMC-D-20-0284.1, 2021.
Huai, B., Ding, M., van den Broeke, M. R.,Reijmer, C. H., Noël, B., Sun, W., and Wang, Y.: Future large-scale atmospheric circulation changes and Greenland precipitation, npj Clim. Atmos. Sci., 8, 10, https://doi.org/10.1038/s41612-025-00899-z, 2025.
Huybrechts, P., Letreguilly, A., and Reeh, N.: The Greenland ice sheet and greenhouse warming, Paleogeogr. Paleoclim. Paleoecol., 89, 399–412, 1991.
Isaksen, K., Nordli, Ø., Ivanov, B., Køltzow, M. A. Ø., Aaboe, S., Gjelten, H. M., Mezghani, A., Eastwood, S., Førland, E., Benestad, R. E., Hanssen-Bauer, I., Brækkan, R., Sviashchennikov, P., Demin, V., Revina, A., and Karandacheva, T.: Exceptional warming over the Barents area, Sci. Rep., 12, 9371, https://doi.org/10.1038/s41598-022-13568-5, 2022.
Køltzow, M., Schyberg, H., Støylen, E., and Yang, X.: Value of the Copernicus Arctic Regional Reanalysis (CARRA) in representing near-surface temperature and wind speed in the north-east European Arctic, Polar Res., 41, https://doi.org/10.33265/polar.v41.8002, 2022.
Nicola, L., Notz, D., and Winkelmann, R.: Revisiting temperature sensitivity: how does Antarctic precipitation change with temperature?, The Cryosphere, 17, 2563–2583, https://doi.org/10.5194/tc-17-2563-2023, 2023.
Niwano, M., Box, J. E., Wehrlé, A., Vandecrux, B., Colgan, W. T., and Cappelen, J.: Rainfall on the Greenland ice sheet: Present-day climatology from a high-resolution non-hydrostatic polar regional climate model, Geophys. Res. Lett., 48, e2021GL092942, https://doi.org/10.1029/2021GL092942, 2021.
Noël, B., Fettweis, X., van de Berg, W. J., van den Broeke, M. R., and Erpicum, M.: Sensitivity of Greenland Ice Sheet surface mass balance to perturbations in sea surface temperature and sea ice cover: a study with the regional climate model MAR, The Cryosphere, 8, 1871–1883, https://doi.org/10.5194/tc-8-1871-2014, 2014.
Noël, B., van de Berg, W. J., van Wessem, J. M., van Meijgaard, E., van As, D., Lenaerts, J. T. M., Lhermitte, S., Kuipers Munneke, P., Smeets, C. J. P. P., van Ulft, L. H., van de Wal, R. S. W., and van den Broeke, M. R.: Modelling the climate and surface mass balance of polar ice sheets using RACMO2 – Part 1: Greenland (1958–2016), The Cryosphere, 12, 811–831, https://doi.org/10.5194/tc-12-811-2018, 2018.
Noël, B., van Kampenhout, L., van de Berg, W. J., Lenaerts, J. T. M., Wouters, B., and van den Broeke, M. R.: Brief communication: CESM2 climate forcing (1950–2014) yields realistic Greenland ice sheet surface mass balance, The Cryosphere, 14, 1425–1435, https://doi.org/10.5194/tc-14-1425-2020, 2020.
Noël, B., Lenaerts, J. T., Lipscomb, W. H., Thayer-Calder, K., and van den Broeke, M. R.: Peak refreezing in the Greenland firn layer under future warming scenarios, Nat. Commun., 13, 6870, https://doi.org/10.1038/s41467-022-34524-x, 2022.
Rignot, E. and Mouginot, J.: Ice flow in Greenland for the International Polar Year 2008-2009: ICE FLOW GREENLAND 2009, Geophys. Res. Lett., 39, https://doi.org/10.1029/2012GL051634, 2012.
Roeckner, E., Bäuml, G., Bonaventura, L., Brokopf, R., Esch, M., Giorgetta, M., Hagemann, S., Kirchner, I., Kornblueh, L., Manzini, E., Rhodin, A., Schlese, U., Schulzweida, U., and Tompkins, A.: The atmospheric general circulation model ECHAM5. Part 1. Model description, Report no. 349, Max-Planck-Institut für Meteorologie (MPI-M), 2003.
Schyberg, H., Yang, X., Køltzow, M. A. Ø., Amstrup, B., Bakketun, Å., Bazile, E., Bojarova, J., Box, J. E., Dahlgren, P., Hagelin, S., Homleid, M., Horányi, A., Høyer, J., Johansson, Å., Killie, M. A., Körnich, H., Le Moigne, P., Lindskog, M., Manninen, T., Nielsen Englyst, P., Nielsen, K. P., Olsson, E., Palmason, B., Peralta Aros, C., Randriamampianina, R., Samuelsson, P., Stappers, R., Støylen, E., Thorsteinsson, S., Valkonen, T., and Wang, Z. Q.: Arctic regional reanalysis on single levels from 1991 to present, Copernicus Climate Change Service (C3S) Climate Data Store (CDS) [data set], https://doi.org/10.24381/cds.713858f6, 2020.
Steffen, K. and Box, J.: Surface climatology of the Greenland Ice Sheet: Greenland Climate Network 1995–1999, J. Geophys. Res.-Atmos., 106, 33951–33964, https://doi.org/10.1029/2001jd900161, 2001.
Stroeve, J. C., Mioduszewski, J. R., Rennermalm, A., Boisvert, L. N., Tedesco, M., and Robinson, D.: Investigating the local-scale influence of sea ice on Greenland surface melt, The Cryosphere, 11, 2363–2381, https://doi.org/10.5194/tc-11-2363-2017, 2017.
Trenberth, K. E., Dai, A., Rasmussen, R. M., and Parsons, D. B.: The changing character of precipitation, B. Am. Meteorol. Soc., 84, 1205–1217, 2003.
Undén, P., Rontu, L., Järvinen, H., Lynch, P., Calvo, J., Cats, G., Cuxart, J., Eerola, K, Fortelius, C., Garcia-Moya, J. A., Jones, C., Lenderlink, G., McDonald, A., McGrath, R., Navascues, B., Woetman Nielsen, N., Ødegaard, V., Rodrigues, E., Rummukainen, M., Room, R., Sattler, K., Hansen Sass, B., Savijärvi, H., Wichers Schreur, B., Sigg, R. The, H., and Tijm, A.: HIRLAM-5 Scientific Documentation, Technical report, Swedish Meteorological and Hydrological Institute, Norrköping, Sweden, 144 pp, 2002.
Yang, X.: Sub-km HARMONIE and on-demand setup for storm forecast, Joint ALADIN-HIRLAM Newsletter 10, 35–39, January 2018.
Yang, X.: TAS, an operational forecast model at hectometric scale, Joint ALADIN-HIRLAM Newsletter 12, 40–49, January 2019.
Yang, X., Schyberg, H., Palmason, B., Bojarova, J., Box, J., Pagh Nielsen, K., Amstrup, B., Peralta, C., Høyer, J., Nielsen Englyst, P., Homleid, M., Køltzow, M. A. Ø., Randriamampianina, R., Dahlgren, P., Støylen, E., Valkonen, T., Thorsteinsson, S., Kornich, H., Lindskog, M., and Mankoff, K.: C3S Arctic regional reanalysis – full system documentation, Copernicus Climate Change Service (C3S) Climate Data Store (CDS), https://doi.org/10.24381/cds.713858f6 (last access: 1 November 2021), 2020.
Zeitz, M., Reese, R., Beckmann, J., Krebs-Kanzow, U., and Winkelmann, R.: Impact of the melt–albedo feedback on the future evolution of the Greenland Ice Sheet with PISM-dEBM-simple, The Cryosphere, 15, 5739–5764, https://doi.org/10.5194/tc-15-5739-2021, 2021.
Zhang, Q., Huai, B., Ding, M., Sun, W., Liu, W., Yan, J., Zhao, S., Wang, Y., Wang, Y., Wang, L., Che, J., Dou, J., and Kang., L.: Projections of Greenland climate change from CMIP5 and CMIP6, Global Planet. Change, 232, 104340, https://doi.org/10.1016/j.gloplacha.2023.104340, 2024.