the Creative Commons Attribution 4.0 License.
the Creative Commons Attribution 4.0 License.
 | 27 Apr 2026
Review article: 30 years of airborne radar surveys on the Antarctic and Greenland ice sheets by the Alfred Wegener Institute
Steven Franke
Daniel Steinhage
Veit Helm
Tobias Binder
Uwe Nixdorf
Heinrich Miller
Angelika Humbert
Daniela Jansen
Graeme Eagles
Hannes Eisermann
Wilfried Jokat
Antonia Ruppel
Reinhard Drews
Alexandra Zuhr
Amelie Driemel
Andreas Walter
Peter Konopatzky
Robin Heß
Antonie Haas
Roland Koppe
Pascal H. Andreas
The Alfred Wegener Institute, Helmholtz Centre for Polar and Marine Research (AWI), has conducted airborne radar campaigns since 1994 across Antarctica and Greenland, utilizing six different radar systems to study ice sheets and their interactions with climate, ocean and the solid Earth. Over the past three decades, AWI has collected more than one million profile-kilometres of radar data, covering approximately one quarter of the Antarctic and the Greenland Ice Sheet, respectively. In this review article, we describe AWI's airborne radar systems and their deployments over the Greenland and Antarctic Ice Sheet. Moreover, we summarize application and usage of AWI's radar systems, which provided crucial insights into e.g., ice dynamics, mass balance, and ancient landscapes buried beneath the ice. The integration of radar data with other geophysical methods has enhanced bathymetric models, improving predictions of ice–ocean interactions and ice-shelf stability and contributed to a better understanding of crustal and geological evolution of the Antarctic continent. As part of this paper, and to support scientific progress, AWI made its airborne radar data publicly accessible through the Radar Data over Polar Ice Sheets viewer hosted by the Marine Data Portal (https://marine-data.de/viewers/, last access: 19 April 2026) and PANGAEA (https://doi.org/10.1594/PANGAEA.972094; Eisen et al., 2024), ensuring compliance with FAIR (Findable, Accessible, Interoperable, Reusable) data principles. Future research will expand on these contributions, focusing on refining ice-sheet models and exploring new areas of glaciological and geological interest.
- Article
(23262 KB) - Full-text XML
-
Supplement
(66762 KB) - BibTeX
- EndNote


The Greenland and Antarctic Ice Sheets (GrIS and AIS) are critical components of the Earth's climate system and play a vital role in regulating global sea level. Together, these ice sheets hold approximately 99 % of the world's freshwater ice (Church et al., 2013), with their combined potential contribution to sea level rise estimated at over 65 m if fully melted (Morlighem et al., 2017, 2020). In recent decades, the Greenland and Antarctic Ice Sheet have exhibited accelerated mass loss, driven by surface melting, ice dynamics, and interactions with warming oceans (The IMBIE Team, 2020). Beyond their implications for sea level, the ice sheets exert significant influence on the global radiation budget, and on atmospheric and oceanic circulation patterns, affecting regional and global climate dynamics (Rahmstorf, 2007).
A detailed characterization of ice sheet structure and dynamics is essential to determine the mechanisms of mass loss and constrain numerical models of future behavior. Geophysical investigations provide powerful tools for studying the ice sheets, offering insights into their internal and basal properties, thickness, and interactions with the underlying bedrock. Airborne radar enables high-resolution imaging of ice thickness (e.g., Robin et al., 1969; Steinhage et al., 2001), ice-sheet stratigraphy (e.g., Bingham et al., 2015; Winter et al., 2019; Bodart et al., 2021), subglacial features (e.g., Carter et al., 2024; Paxman et al., 2025) as well as detecting changes in crystal orientation fabric (COF; e.g., Eisen et al., 2007; Gerber et al., 2023). These data are critical for constraining ice-sheet models, which require accurate boundary conditions to simulate ice flow and predict the response of ice sheets to climatic and oceanic forcing.
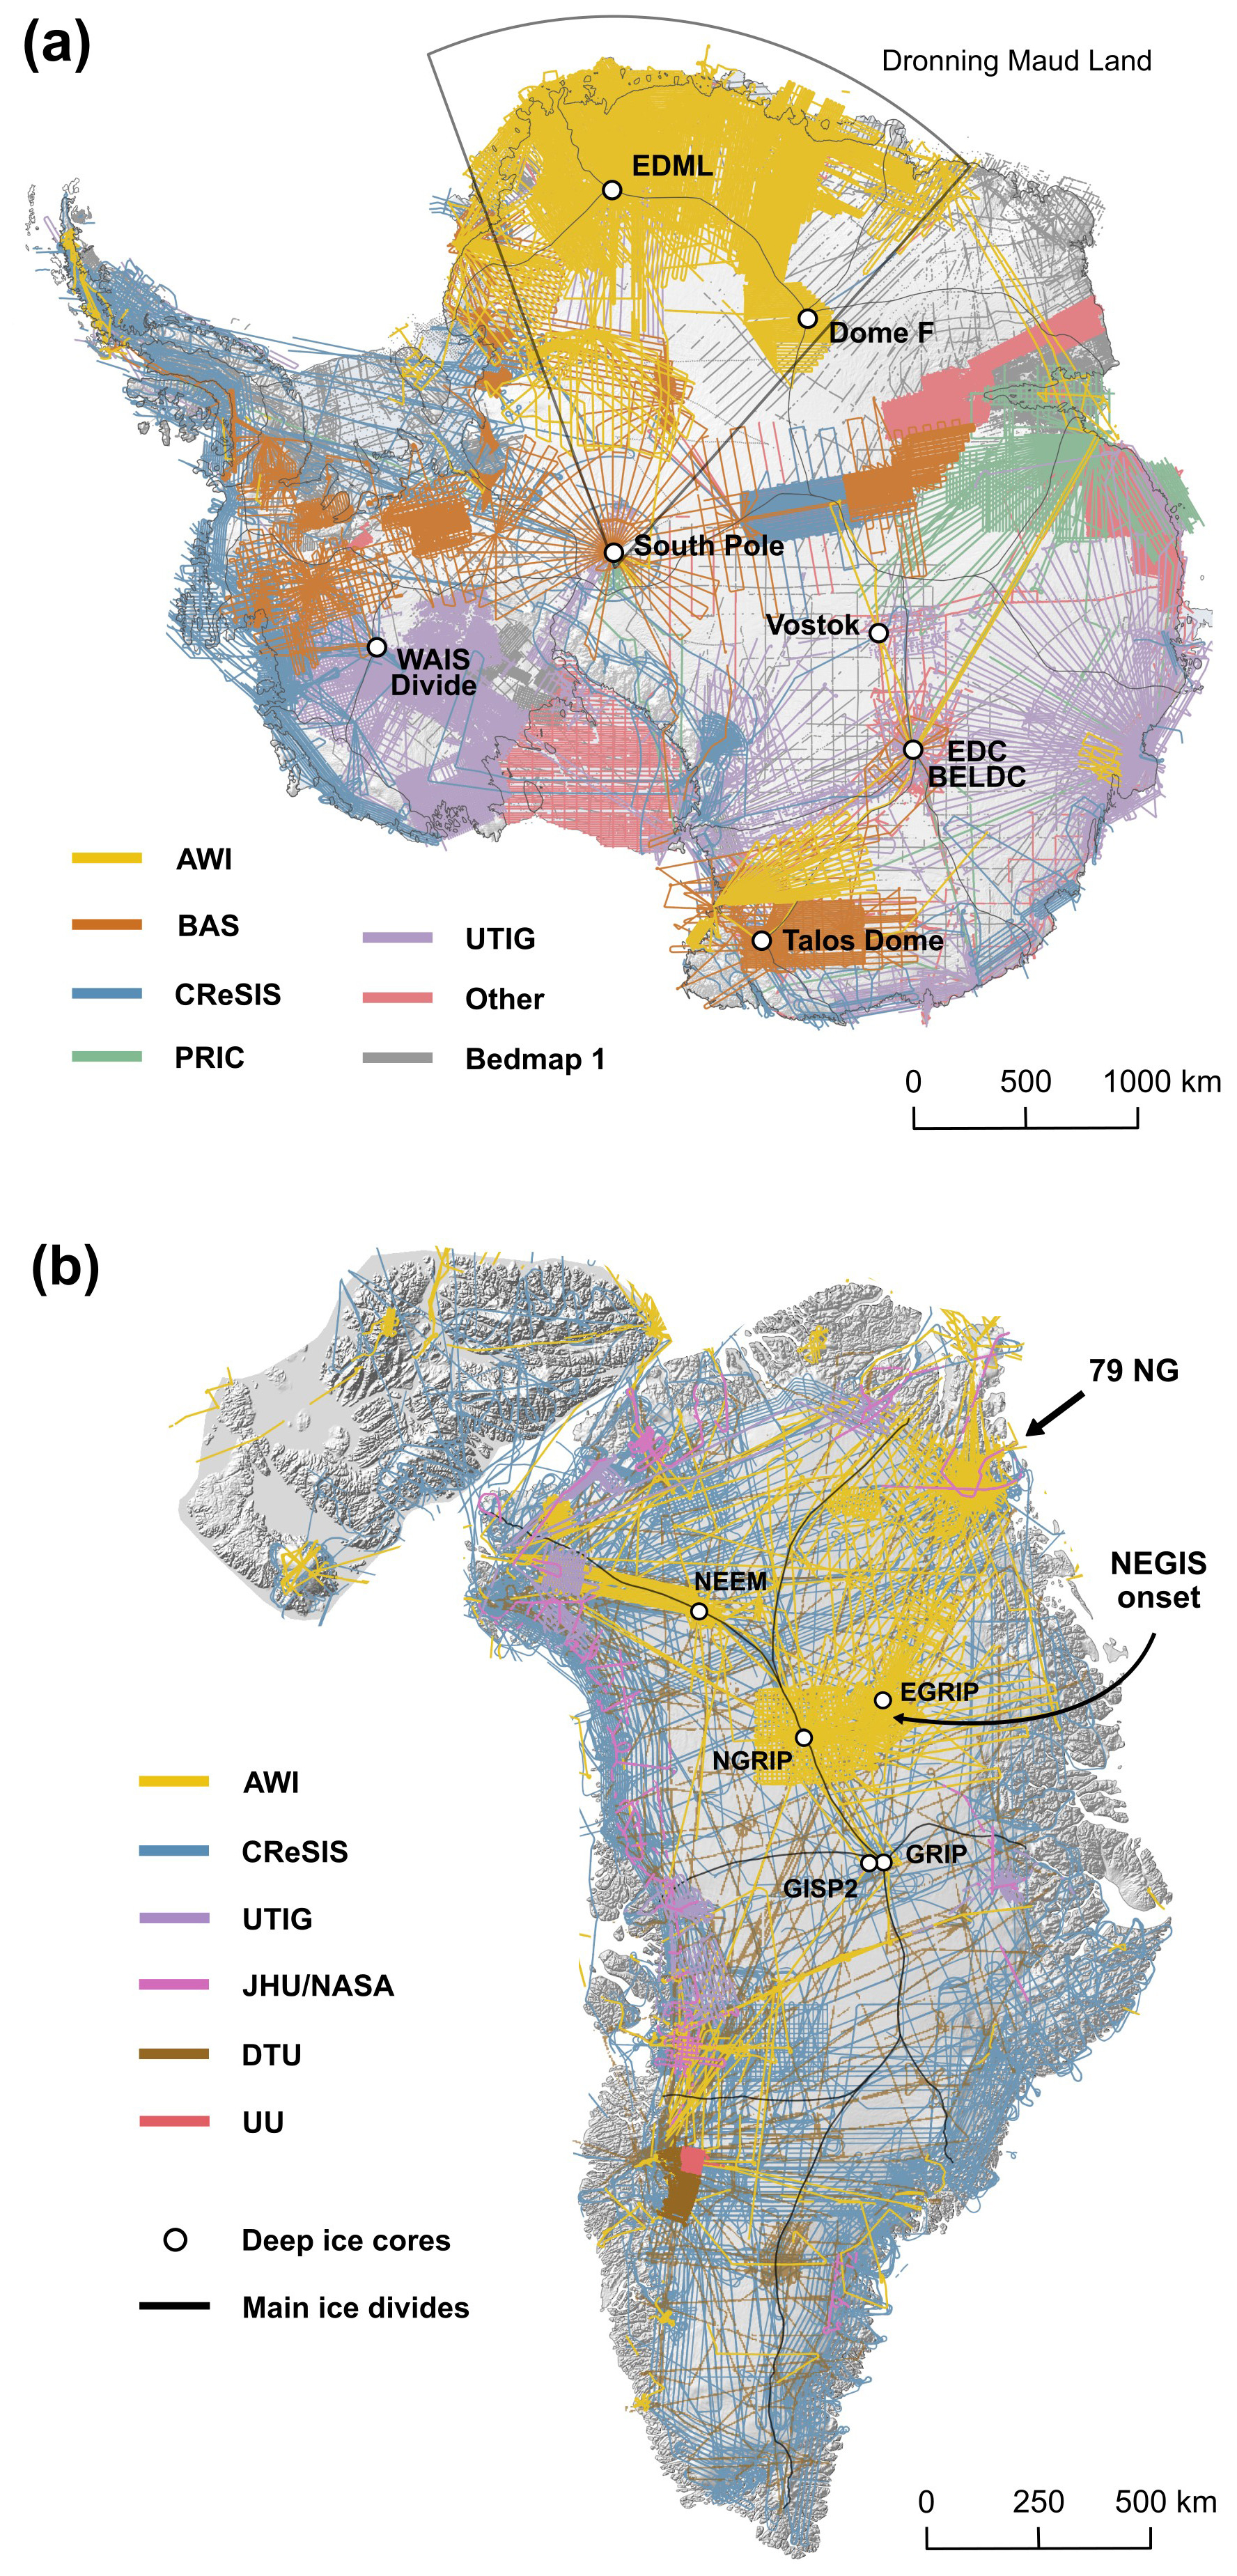
Figure 1Institutes with substantial radar profile coverage in (a) Antarctica and (b) the Arctic: Alfred Wegener Institute (AWI), British Antarctic Survey (BAS), Centre for Remote Sensing and Integrated Systems (CReSIS), Polar Research Institute of China (PRIC), University of Texas Institute of Geophysics (UTIG), John Hopkins University (JHU), Techical University of Denmark (DTU), Upsalla University (UU), and other institutes (see Morlighem et al., 2017, and Karlsson et al., 2024, for details in Greenland and Bingham et al., 2025, for details in Antarctica). For the AIS the radar data coverage of the Bedmap 1 period is shown in grey in the background. The black lines represent the main ice divides from Mouginot et al. (2017) and Rignot et al. (2019) and the white circles deep ice-core locations. Note that the spatial scale for Greenland is twice as large as for Antarctica. The two arrows in (b) highlight the Nioghalvfjerdsfjorden Glacier (79° NG) and the onset region of the Northeast Greenland Ice Stream (NEGIS).
Since 1994, the Alfred Wegener Institute, Helmholtz Centre for Polar and Marine Research (AWI) has operated airborne radar systems over Greenland and Antarctica (Fig. 1) using AWI's polar aircraft (Fig. 2; Alfred-Wegener-Institut, Helmholtz-Zentrum für Polar- und Meeresforschung, 2016b). The resulting archive of radar data constitutes a significant portion of the total global radar data archive for both ice sheets (Fig. 1). In Antarctica, the data primarily cover East Antarctica's Dronning Maud Land, while in Greenland, most profiles cover the northern and northeastern parts of the ice sheet as well as adjacent ice caps in the Canadian Arctic. The radar data were collected using six different systems (Fig. 2 and Table 1), each designed to study various aspects of the ice sheet, offering different spatial resolutions and penetration depths (Figs. 4, 5, and 6). Over the past 30 years, AWI's radar data served as a foundational data for numerous studies in glaciology, polar geology, and geodynamics.
This review paper aims to synthesize three decades of AWI's airborne radar surveys over the Antarctic and Greenland ice sheets, highlighting the technological advancements, scientific achievements, and collaborative efforts that have shaped our understanding of the polar ice sheets. Although AWI performed additional geophysical surveys (e.g., gravimetry and magnetics), this review is dedicated solely to radar systems and their data. We provide a comprehensive overview of AWI's radar systems, their technical specifications, and their diverse scientific applications that underscore the critical role these data have played in advancing glaciological, geological, and oceanographic research. The paper also marks the public release of AWI's airborne radar data over the polar ice sheets. We present the online viewer for Radar Data Over Polar Ice Sheets of the Marine Data Portal (https://marine-data.de/viewers, last access: 19 April 2026), a web platform that allows users to explore the archive of AWI radar data. Finally, we describe how to access AWI's radar data products via the PANGAEA Data Publisher (https://doi.org/10.1594/PANGAEA.972094; Eisen et al., 2024) from where the data can be freely downloaded. Ultimately, this review not only focuses on the legacy of AWI's contributions but also sets the stage for continued innovation in polar research, emphasizing the importance of open data sharing and interdisciplinary collaboration in addressing the challenges posed by climate change.
Airborne radar surveys conducted by AWI have been carried out since 1994 using polar aircraft of the types Dornier Do 228, and Basler BT-67 – a modern version of the Douglas DC-3 manufactured by Basler Turbo Conversions in Canada (Alfred-Wegener-Institut, Helmholtz-Zentrum für Polar- und Meeresforschung, 2016b, Fig. 2). The Basler BT-67 type has two engines, each with a power output of 955 kW, a range of approximately 3000 km (depending on payload and survey design), a maximum take-off weight of around 13 t (depending on takeoff altitude), and a cruising speed up to 315 km h−1.
Between 1994 and 2006, radar surveys were conducted with Polar 2 (Dornier Do228), since 2007 with Polar 5 and, from 2011 onward, also with Polar 6 (both Basler BT-67). All the aircraft are capable of operating on skis. The advantages of the Basler type are its greater range and, most notably, significantly higher capacity for carrying scientific instruments and cargo. This capability allows for combined geophysical surveys using a variety of instruments, such as radar, gravimetry, magnetics, laser scanners, and more. The position and orientation of the aircraft is determined by four NovAtel DL-V3 GPS receivers, which sample at 20 Hz. The GPS system operates with dual-frequency tracking so that the position accuracy can be enhanced during post-processing.
In addition to the aircraft platforms, AWI radar survey flights rely on extensive infrastructure in Antarctica and the Arctic, as well as in Bremerhaven and Bremen (Germany). In Antarctica, the three generations of the German Neumayer polar research station and Kohnen Station (Alfred-Wegener-Institut, Helmholtz-Zentrum für Polar- und Meeresforschung, 2016a) have served as a logistical hub for AWI research expeditions since 1981. Neumayer Station is occupied year-round by overwintering staff since 1981 (Franke et al., 2022b), allowing for the use of a prepared airfield throughout the entire Antarctic summer season. With the opening of Kohnen Station at the EPICA Dronning Maud Land (EDML) ice-core drill site in 2001, the range of AWI airborne surveys was significantly extended into the interior of the East Antarctic plateau. Additionally, through cooperation with other research stations, further airfields in Antarctica are utilized.
In Greenland, existing commercial or military airport infrastructure has been used, as well as permanent or temporary inland bases. The temporary bases were primarily associated with ice-core deep drilling projects, such as at NorthGRIP, NEEM, and EastGRIP, from which several extensive surveys were conducted.
The infrastructure network is complemented in Germany by logistics and coordination in Bremerhaven and at an aircraft hangar in Bremen (formerly in Bremerhaven), where equipment installations and from where test flights take place. The flight crew consists of engineers and researchers from AWI, along with pilots and mechanics from different contractors over time (e.g., Kenn Borek Air).
The following section provides a detailed overview of the various radar systems used by AWI, describing both their technical specifications, data processing, and their main areas of deployment over the years. We sort the radar systems by manufacturer and their chronological appearance over the past thirty years. We start with the EMR, ACCU, and SNOW systems developed at the Technical University Hamburg-Harburg, then move on to the ASIRAS system developed by the European Space Agency (ESA), and finally introduce the newer generation of AWI radar systems (UWB and UWBM) developed by the Center for Remote Sensing of Integrated Systems (CReSIS).
Technical parameters of the radar systems are presented in Table 1. Example radargrams from the individual systems can be found in Figs. 4, 5, and 6. An overview of the workflow from data acquisition to archiving, analysis, and public availability is illustrated in the flow chart diagram in Fig. 7. The coverage of radar profiles for each radar system is shown in Figs. 8 and 9 (organized by radar system) and in Figs. A1 and A2, as well as Tables A1 and A2 (organized by season and campaign).
For each system we first describe the technical specification followed by the applied processing steps and lastly, we briefly describe where the radar systems were deployed in Antarctica and Greenland.
3.1 Electromagnetic Reflection System (EMR)
3.1.1 Technical specifications
AWI's EMR (Electromagnetic Reflection) system was built in cooperation with Aerodata Flugmesstechnik GmbH, Technische Universität Hamburg-Harburg (Germany) and the German Aerospace Center (DLR). The EMR system has been operating in Antarctica and Greenland since 1994 (Nixdorf et al., 1999) and is still in operation today. The system comprises two short backfire antennas in bistatic mode, which are mounted underneath the wings of AWI's polar aircraft (Fig. 2). The transmission signal generation is controlled by a timing board based on an oscillator with a reference frequency of 10 MHz and allows transmission pulse lengths of between 60 and 600 ns with a pulse repetition frequency (PRF) of 20 kHz. Aircraft positioning is determined by an inertial navigation system (INS), barometric altimetry, global positioning system (GPS) and, since 1997, laser altimetry (Nixdorf et al., 1999). The EMR system records on three channels (two channels prior to 1998) with each data sample assigned to a channel based on signal strength (Nixdorf et al., 1999).
Since 1998, the EMR system has been able to operate in the “toggle mode”, switching between transmission pulse lengths of 60 and 600 ns, to image internal layers at shallow and intermediate depths at high resolution (∼ 5 m range resolution for the 60 ns pulse) and the bed reflection in deep ice at low resolution (∼ 50 m range resolution for the 600 ns pulse). The along-track trace spacing depends on trace coordinate precision and along-track stacking during the processing and typically lies in the range ∼ 50–100 m. In pre-1998 surveys, some EMR datasets may consist of a combination of short- and long-pulse data. The profile is then classified as either a short- or long-pulse profile, depending on which type of data predominates in the profile.
Over the three decades of acquisition, three different data acquisition systems were used, which we present in the following subsections.
Aerodata System (1994–2004)
Between 1994 and 2004, EMR data were acquired using the Aerodata system with Modams radar data acquisition system. Measurements were taken with a fixed time window of 50 µs, a sampling interval of 13.33 ns, a PRF of 20 kHz, and a data rate of 20 Hz. The data were vertically stacked by a fixed factor of 200. An exception is two flights during the Arctic season of 1998, which were measured with a PRF of 40 kHz. In 1997, the initial two-channel system was extended by a three-channel system, yielding better resolution for weaker signals.
Optimare System (2004–2012)
Between 2004 and 2012, the Optimare system with Medusa P data acquisition was used. As with the Aerodata system, a time window of 50 µs, a sampling interval of 13.33 ns, and a PRF of 20 kHz were employed. However, the vertical stacking factor was increased to 992, and a three-channel system was consistently utilized.
Werum System (since 2012)
Since 2012, an Aircraft Data Acquisition System (ADA) designed by Werum Software and Systems AG and S.E.A. Datentechnik GmbH has been introduced. This system comprises a new receiver designed by S.E.A., ADA-EMR, for EMR measurements. With the introduction of the ADA-EMR, the transmitter was modified so that the transmission signal is always generated with the same phase. The recording time window is 50 µs, the sampling interval is 4 ns, the data rate is 20 MHz, and the PRF is 20 kHz. The stacking is freely adjustable but is typically set to a factor of 1000. In addition to this configuration, three further modifications have been made to the system in this period: (i) a logarithmic detector (logdet) was installed; (ii) the same logdet was used, but with a time window of 64 µs, a PRF of 15 kHz, and a data rate of 15 Hz; and (iii) a new logdet was installed and used with the same settings as in (ii).
3.1.2 Deployments of the EMR System since 1994
The EMR system has been primarily deployed in Antarctica's Dronning Maud Land, particularly around the EDML ice-core deep drilling site and in the areas both south and north of the coastal escarpment to map ice thickness and englacial stratigraphy. Several campaigns also focused on connecting East Antarctic ice cores, such as between EDML and Dome Fuji and EDML and the South Pole, as well as between Vostok, EDC, and Talos Dome. Furthermore, EMR surveys extend east and west beyond Dronning Maud Land, and cover parts of the Ronne ice shelf and the Antarctic Peninsula.
The EMR system has been extensively used in Greenland, primarily in the northeast where it covers all major deep ice core drilling sites (NEEM, NorthGRIP, EastGRIP, and GRIP). Some surveys extend towards the northwest and southwest. In 1996, the NorthGRIP drilling site was covered by extensive grid surveys.
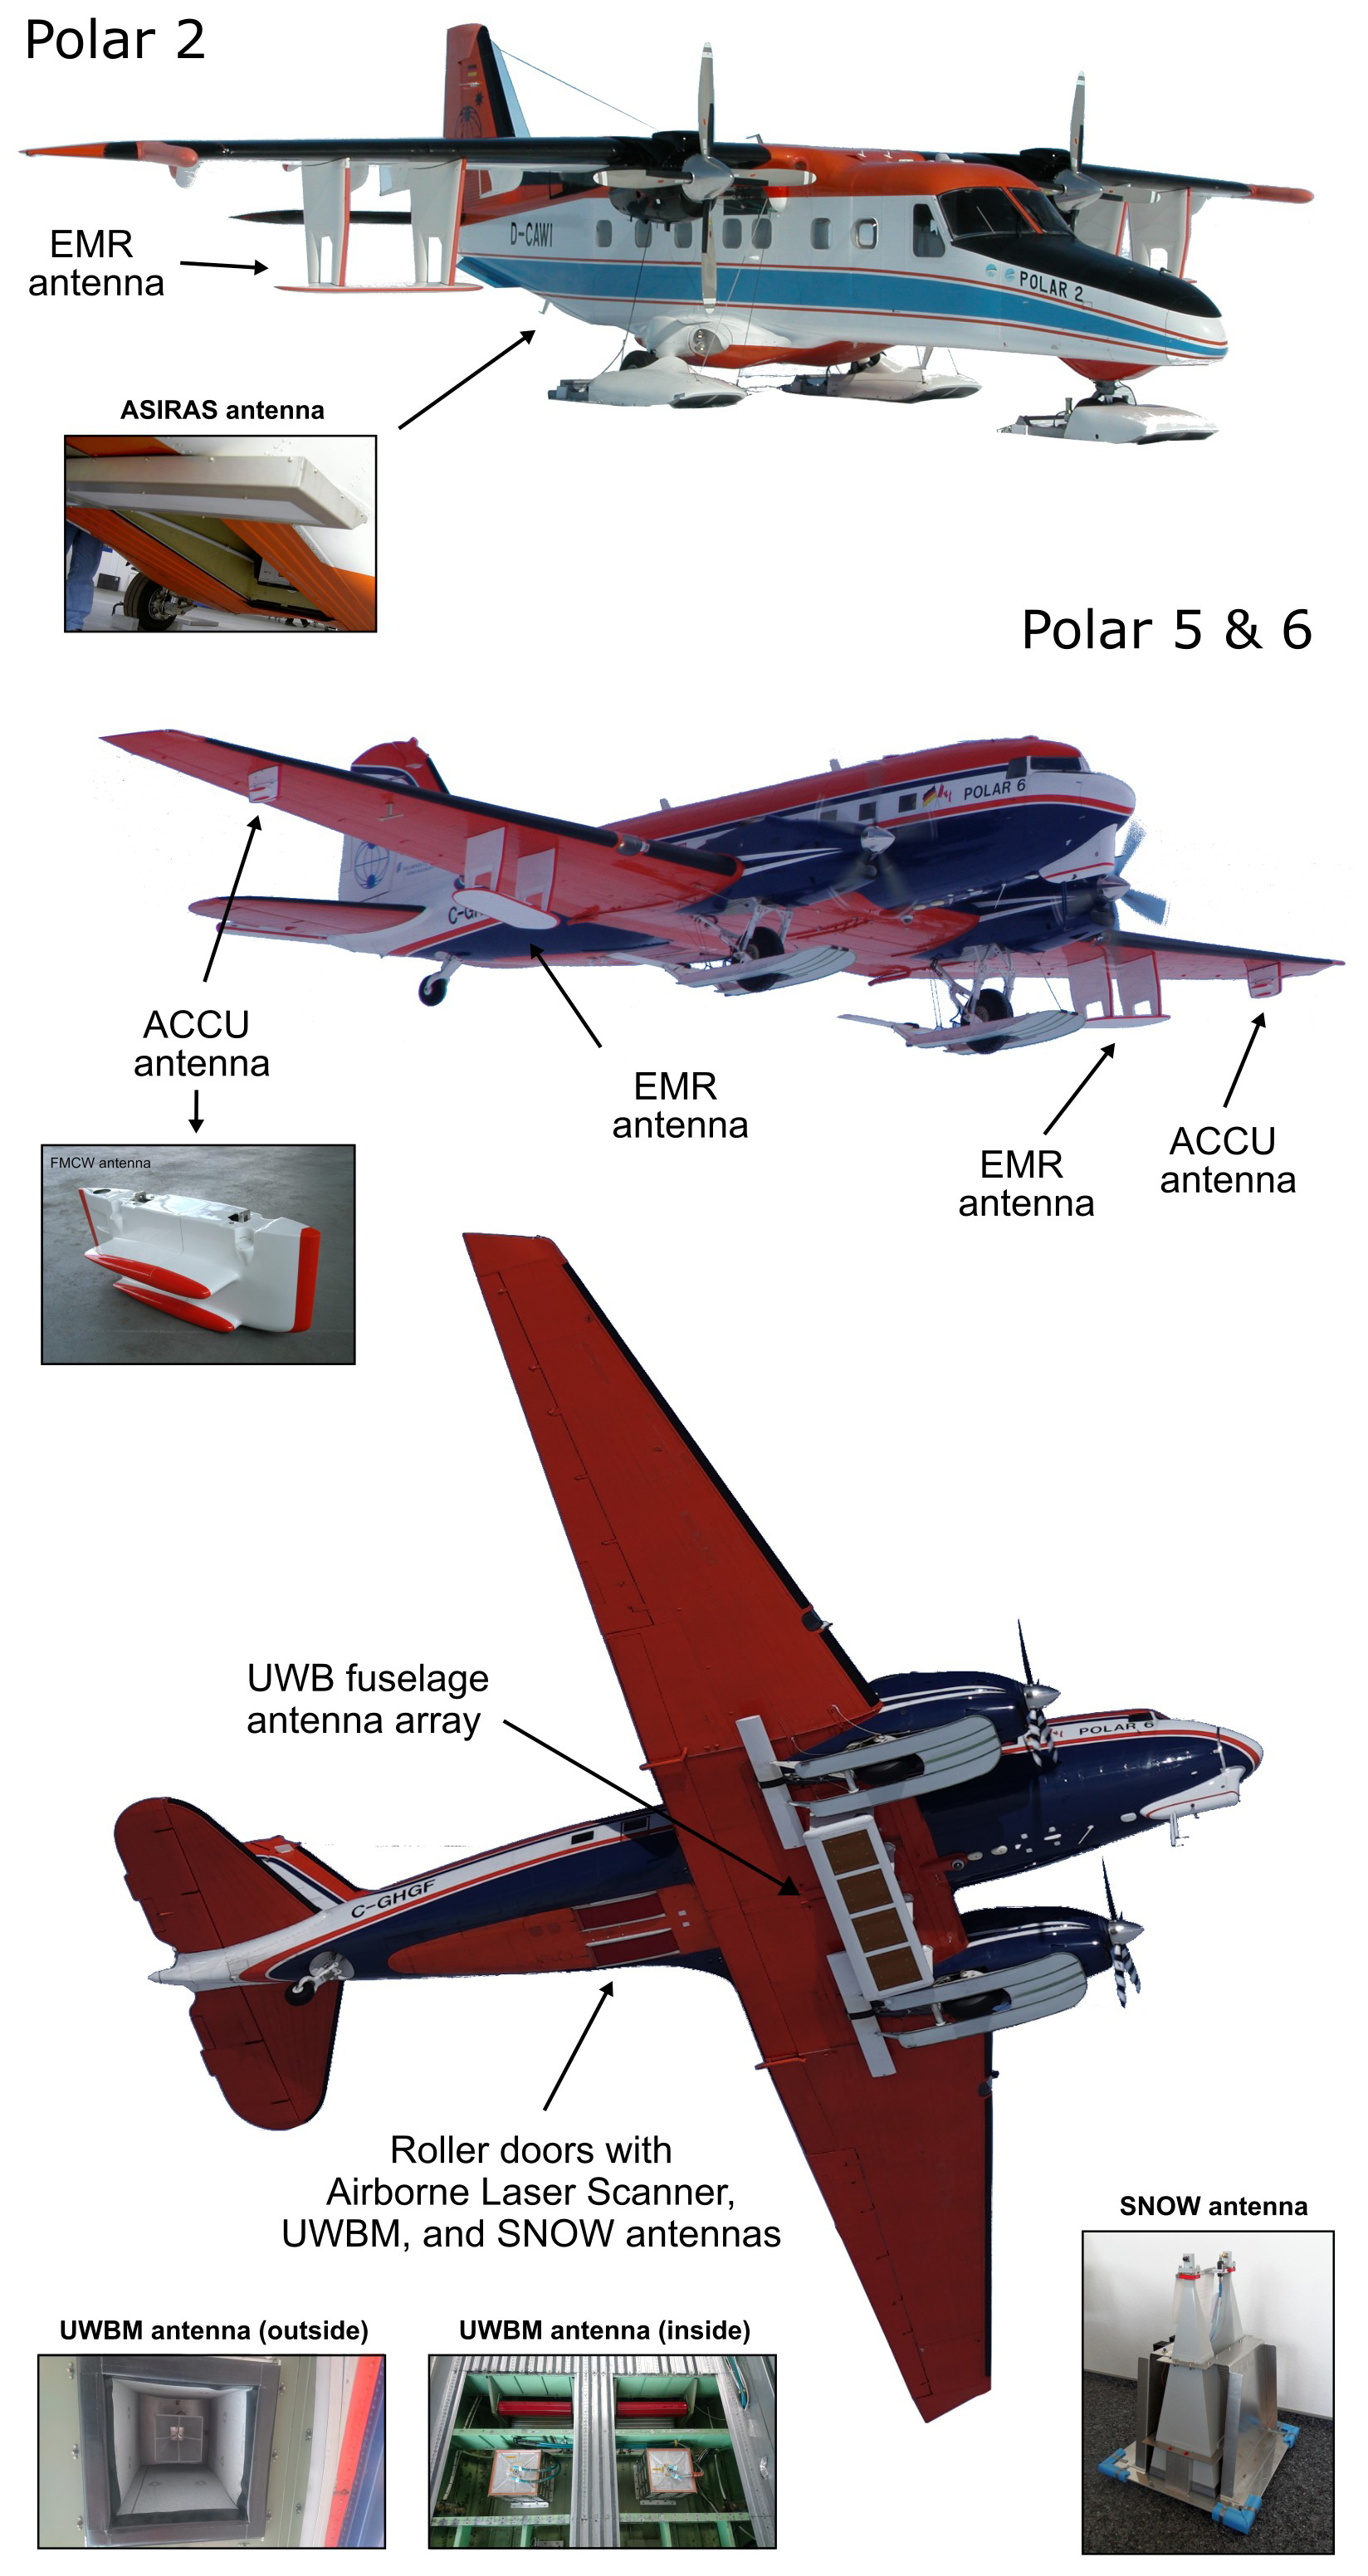
Figure 2AWI's polar aircraft Polar 2 (Dornier Do228; registration code: D-CAWI), Polar 5 (Basler BT-67; registration code: C-GAWI), and Polar 6 (Basler BT-67; registration code: C-G HGF) and the six AWI radar systems. The bottommost picture of the airplane shows the fuselage antenna of the UWB system, without wing antennas mounted. The bottommost photo of the Basler aircraft was taken by Sepp Kipfstuhl (AWI). All other photos were taken by the authors of this manuscript.
Table 1AWI radar system specifications. Abbreviations: TU HH = Technical University Hamburg-Harburg; RST = Radar Systemtechnik; MCoRDS = Multi-channel Coherent Radar Depth Sounder; FMCW = Frequency-Modulated-Continuous-Wave; IRH = Internal Reflection Horizon.
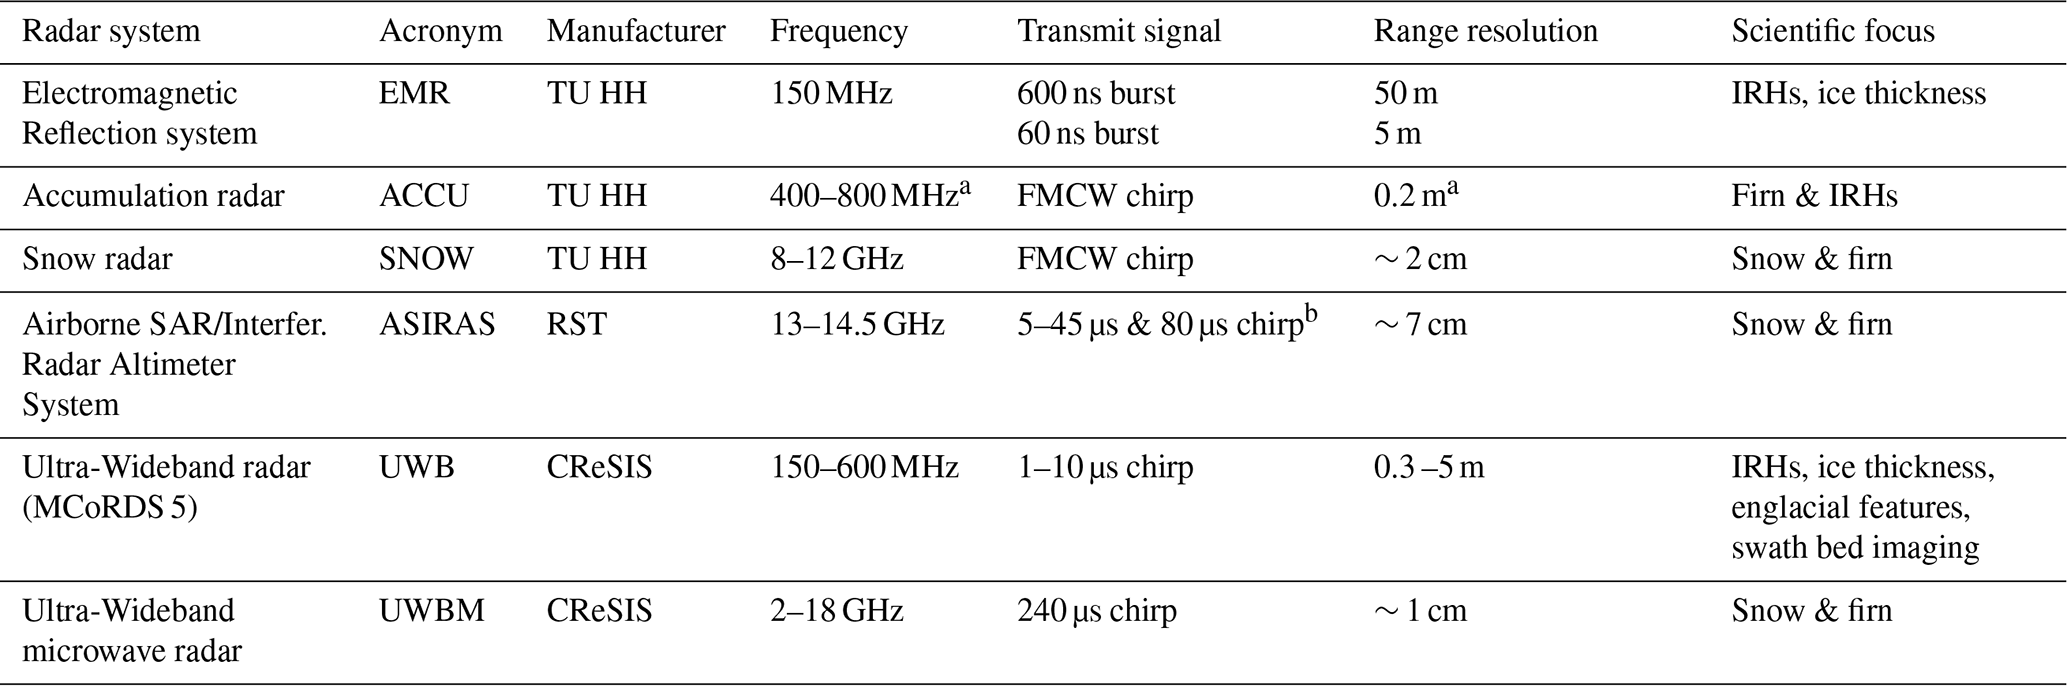
a During the ARK 2010 campaign a bandwidth of 500–700 MHz was used and the range resolution was 0.5 m. b In the high-altitude mode the ASIRAS system can operate in a linear frequency modulated chirp length between 5–45 µs. The low-altitude mode has a chirp length of 80 µs.
3.2 Accumulation radar (ACCU)
3.2.1 Technical specifications
The airborne Accumulation (ACCU) radar system is a Frequency Modulated Continuous Wave (FMCW) radar system operating in a frequency range of 500–700 MHz in the Arctic season in 2010 (Jenett and Steinhage, 2012) and was increased thereafter to 400–800 MHz. It is capable of detecting internal structure in the upper 200 m of the ice sheets with a vertical resolution of 1 m or better (Figs. 4d and 5a). Moreover, the ACCU system can detect the ice-shelf bottom down to 400 m depth or more. The trace spacing of the ACCU system depends on the trace coordinate accuracy and varies between 7–10 m. The radar was designed primarily to map shallow internal reflection horizons (IRHs) in Antarctica and Greenland.
3.2.2 Deployments of the ACCU system since 2010
Initial airborne measurements using this system were conducted in 2010 in Greenland during the NEEM campaign in northwest Greenland with Polar 5. In addition to the ACCU FMCW system, Polar 5 was complementarily equipped with two laser altimeters, ESA's ASIRAS radar altimeter, and the EMR to measure ice thickness. In 2012, the ACCU radar was used to map central Greenland's near-surface stratigraphy between the NEEM, NorthGRIP and EastGRIP deep ice core sites.
Between the Antarctic seasons 2011/12 and 2016/17 the ACCU radar was deployed in Antarctica's Dronning Maud Land running in parallel with the EMR and SNOW systems in the 2013/14 season.
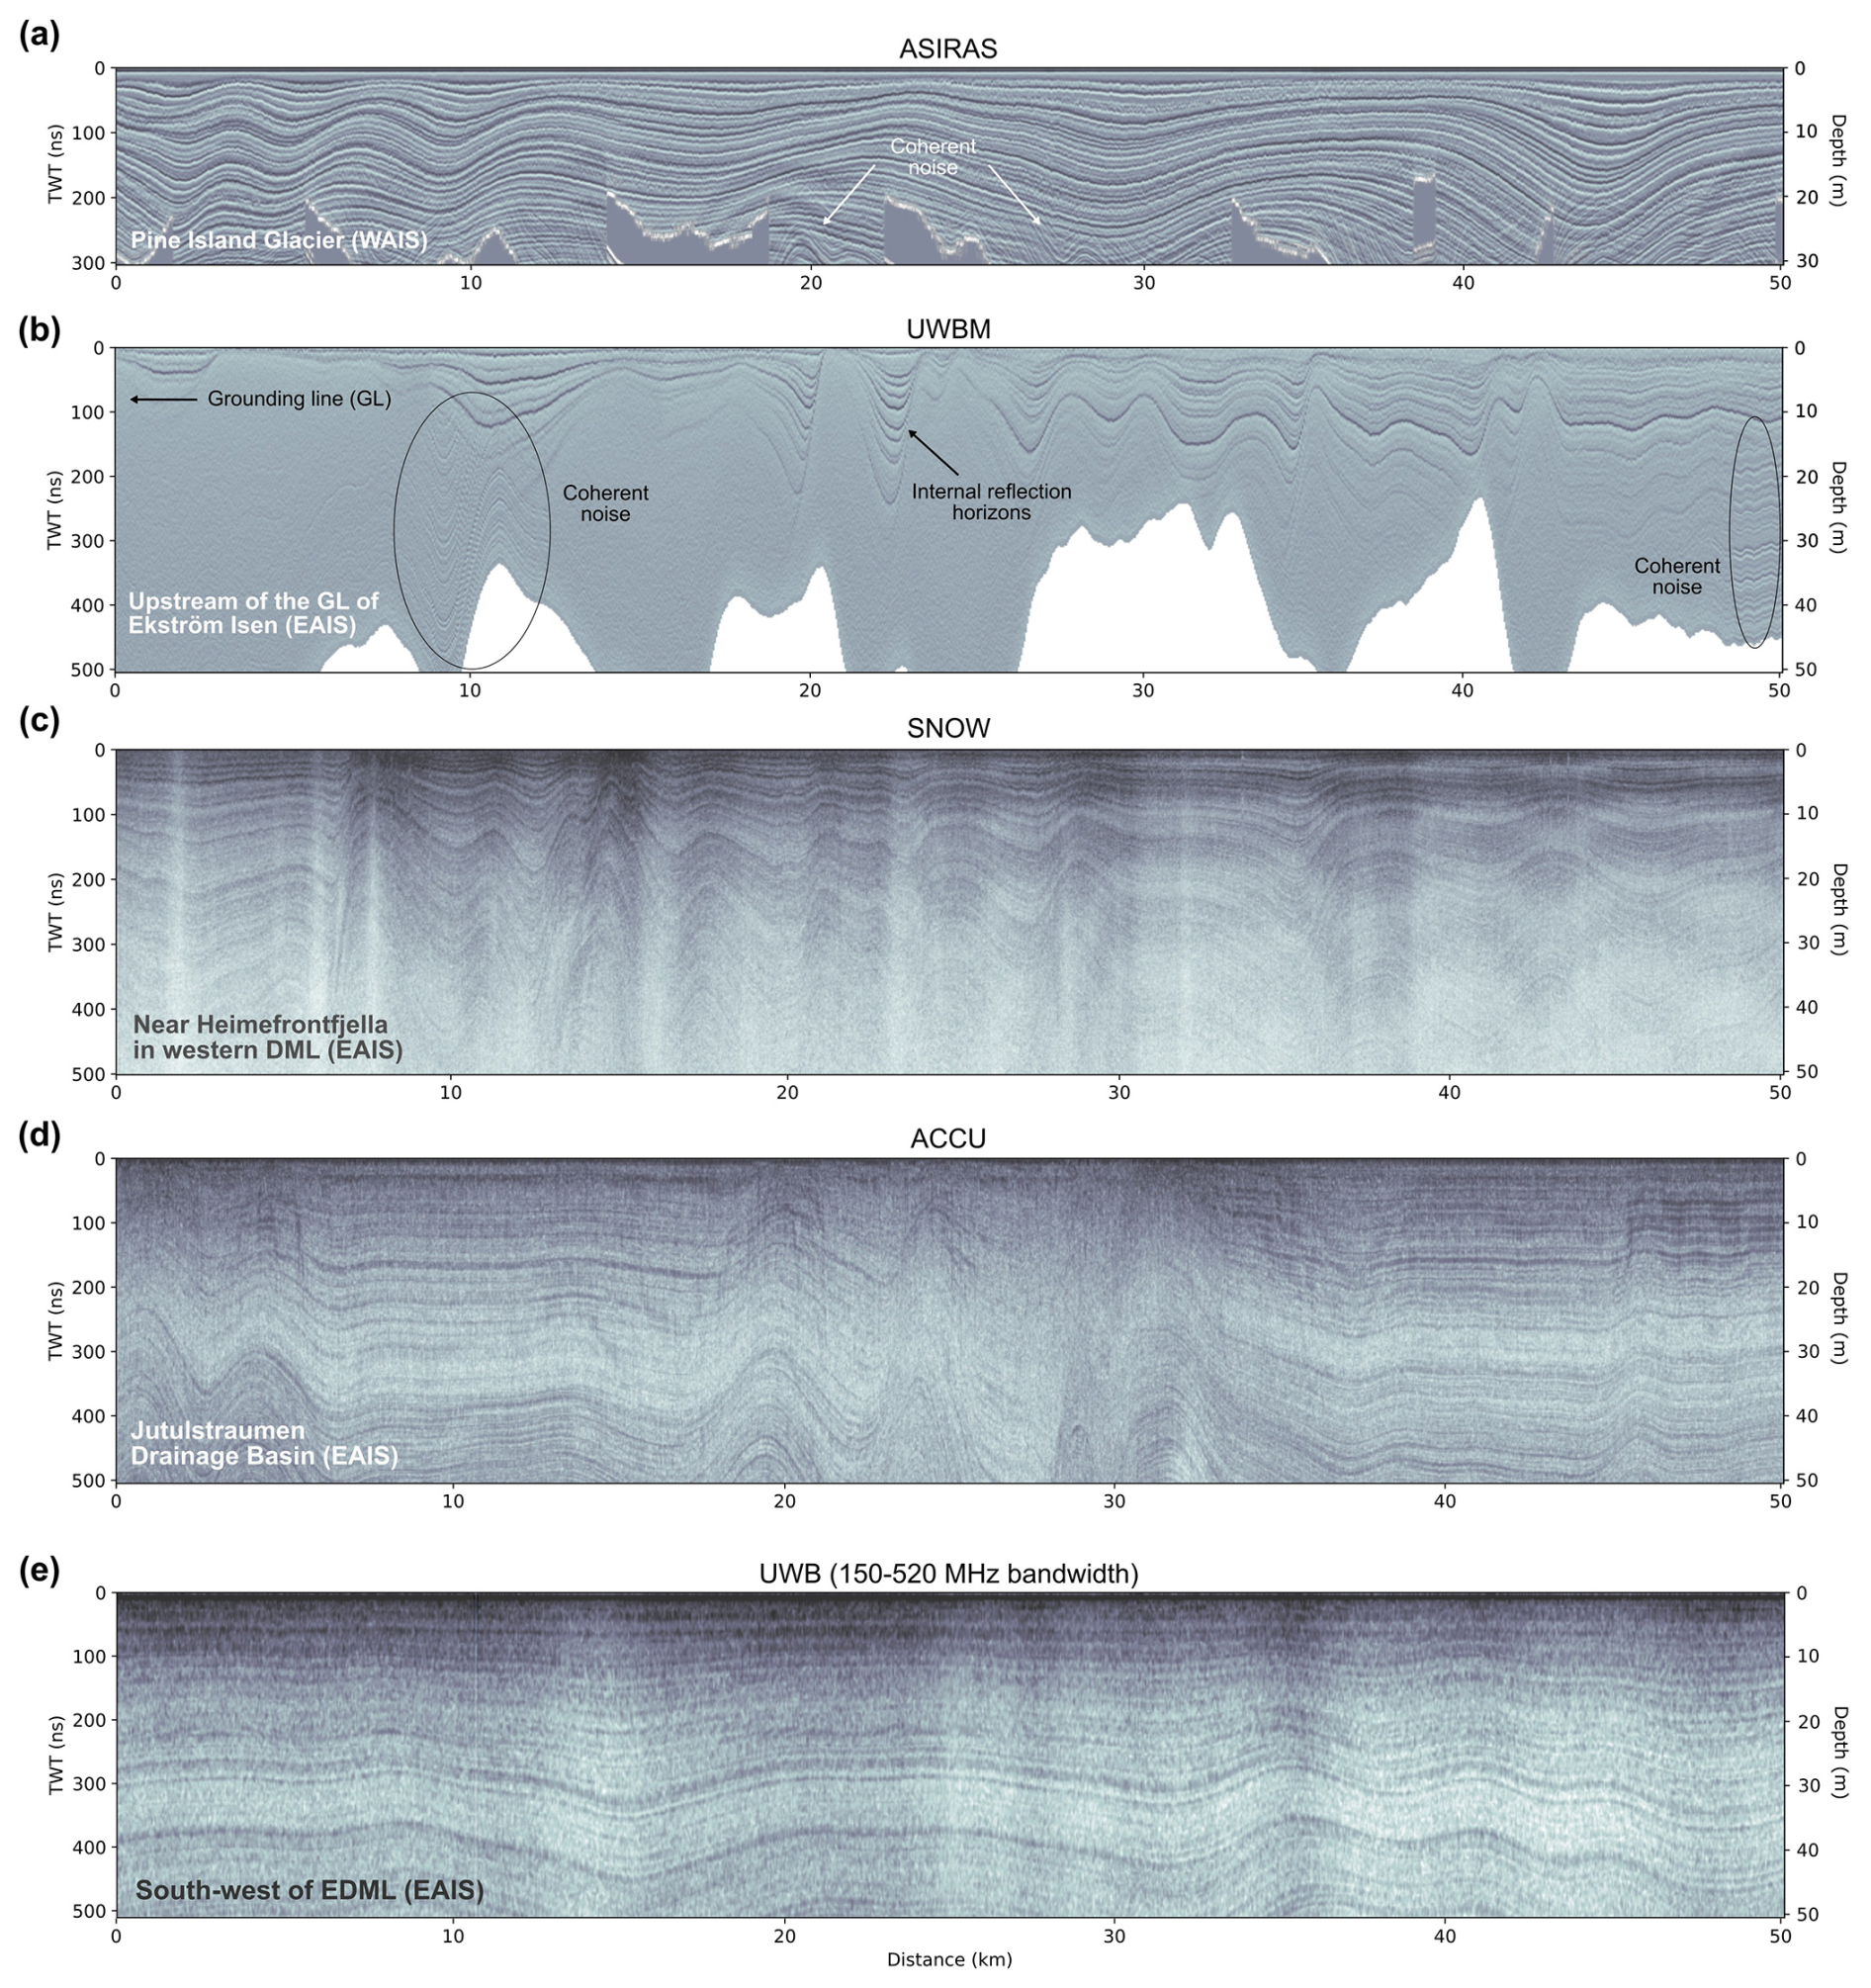
Figure 4Examples of radargrams focusing on the first 50 m depth below the surface. (a) ASIRAS; profile ID: ASR_L1B_01_20141203T130418_132058, (b) UWBM; profile ID: 20221205_99_[019–021], (c) SNOW; profile ID: SNOW_20140102T074743_081922, (d) ACCU; profile ID: ACCU_20131230T090855_094516, (e) UWB in wideband mode; profile ID: 20231211_02_006. For TWT-to-depth (two-way travel time) conversion we used an average electromagnetic wave speed in the upper 50 m of 2×10⁹ m s−1, which corresponds to an average ordinary relative dielectric permittivity of 2.25. The location of the radar profile is annotated in the lower left corner of the radargram and shown in Fig. 3. All radargrams are time-zeroed at the ice surface reflection.
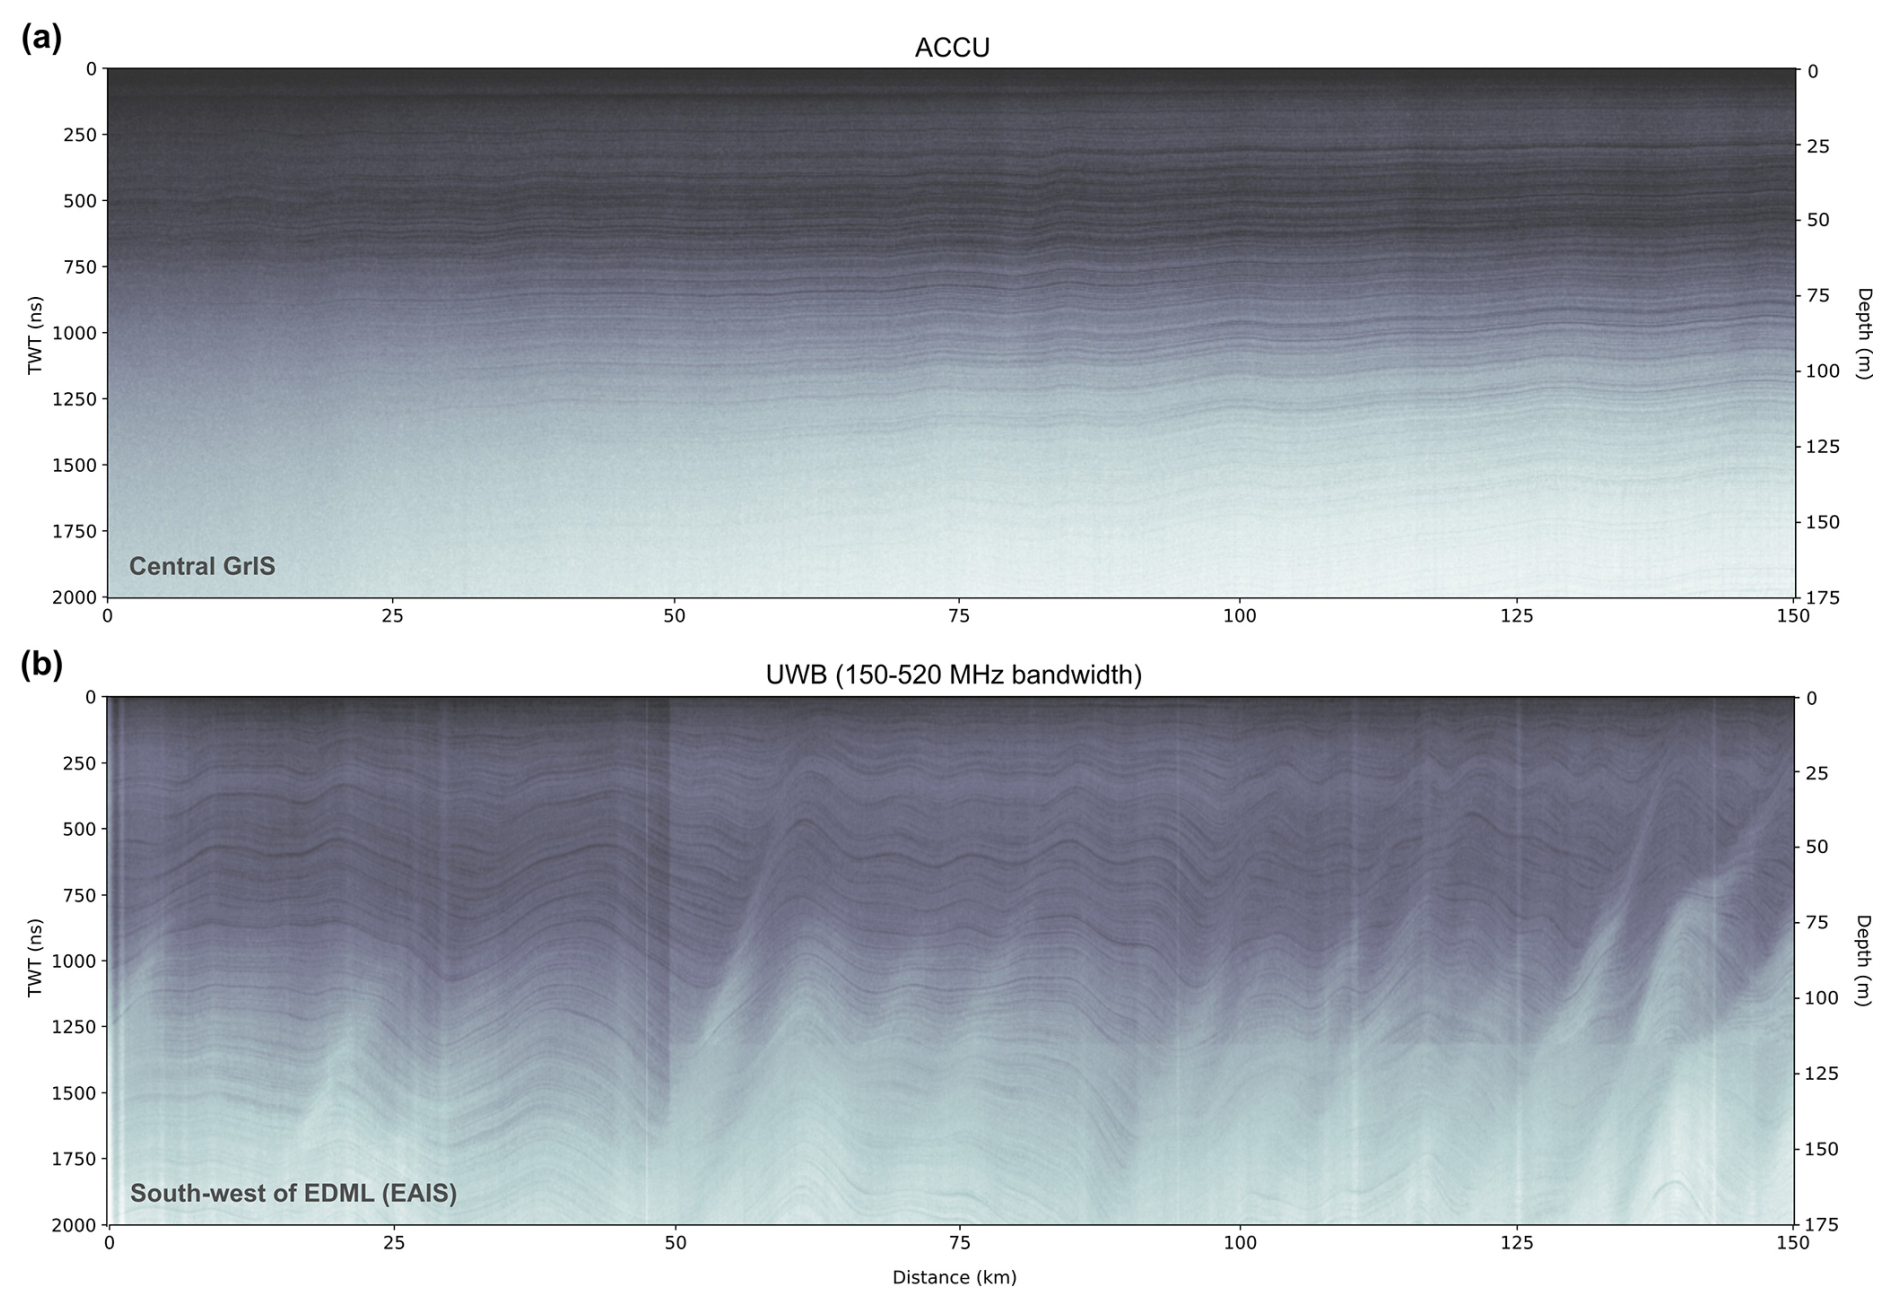
Figure 5Examples of radargrams focusing on the first ∼ 175 m depth below the surface. (a) ACCU; profile ID: ACCU_20100722T132929_140949, (b) UWB in wideband mode; profile ID: 20231211_02_[008–010]. For TWT-to-depth (two-way travel time) conversion we used an average electromagnetic wave speed in the upper 175 m of 1.75×10⁹ m s−1, which corresponds to an average ordinary relative dielectric permittivity of 3.0. The location of the radar profile is indicated in the lower left corner of the radargram and shown in Fig. 3. All radargrams are time-zeroed at the ice surface reflection.
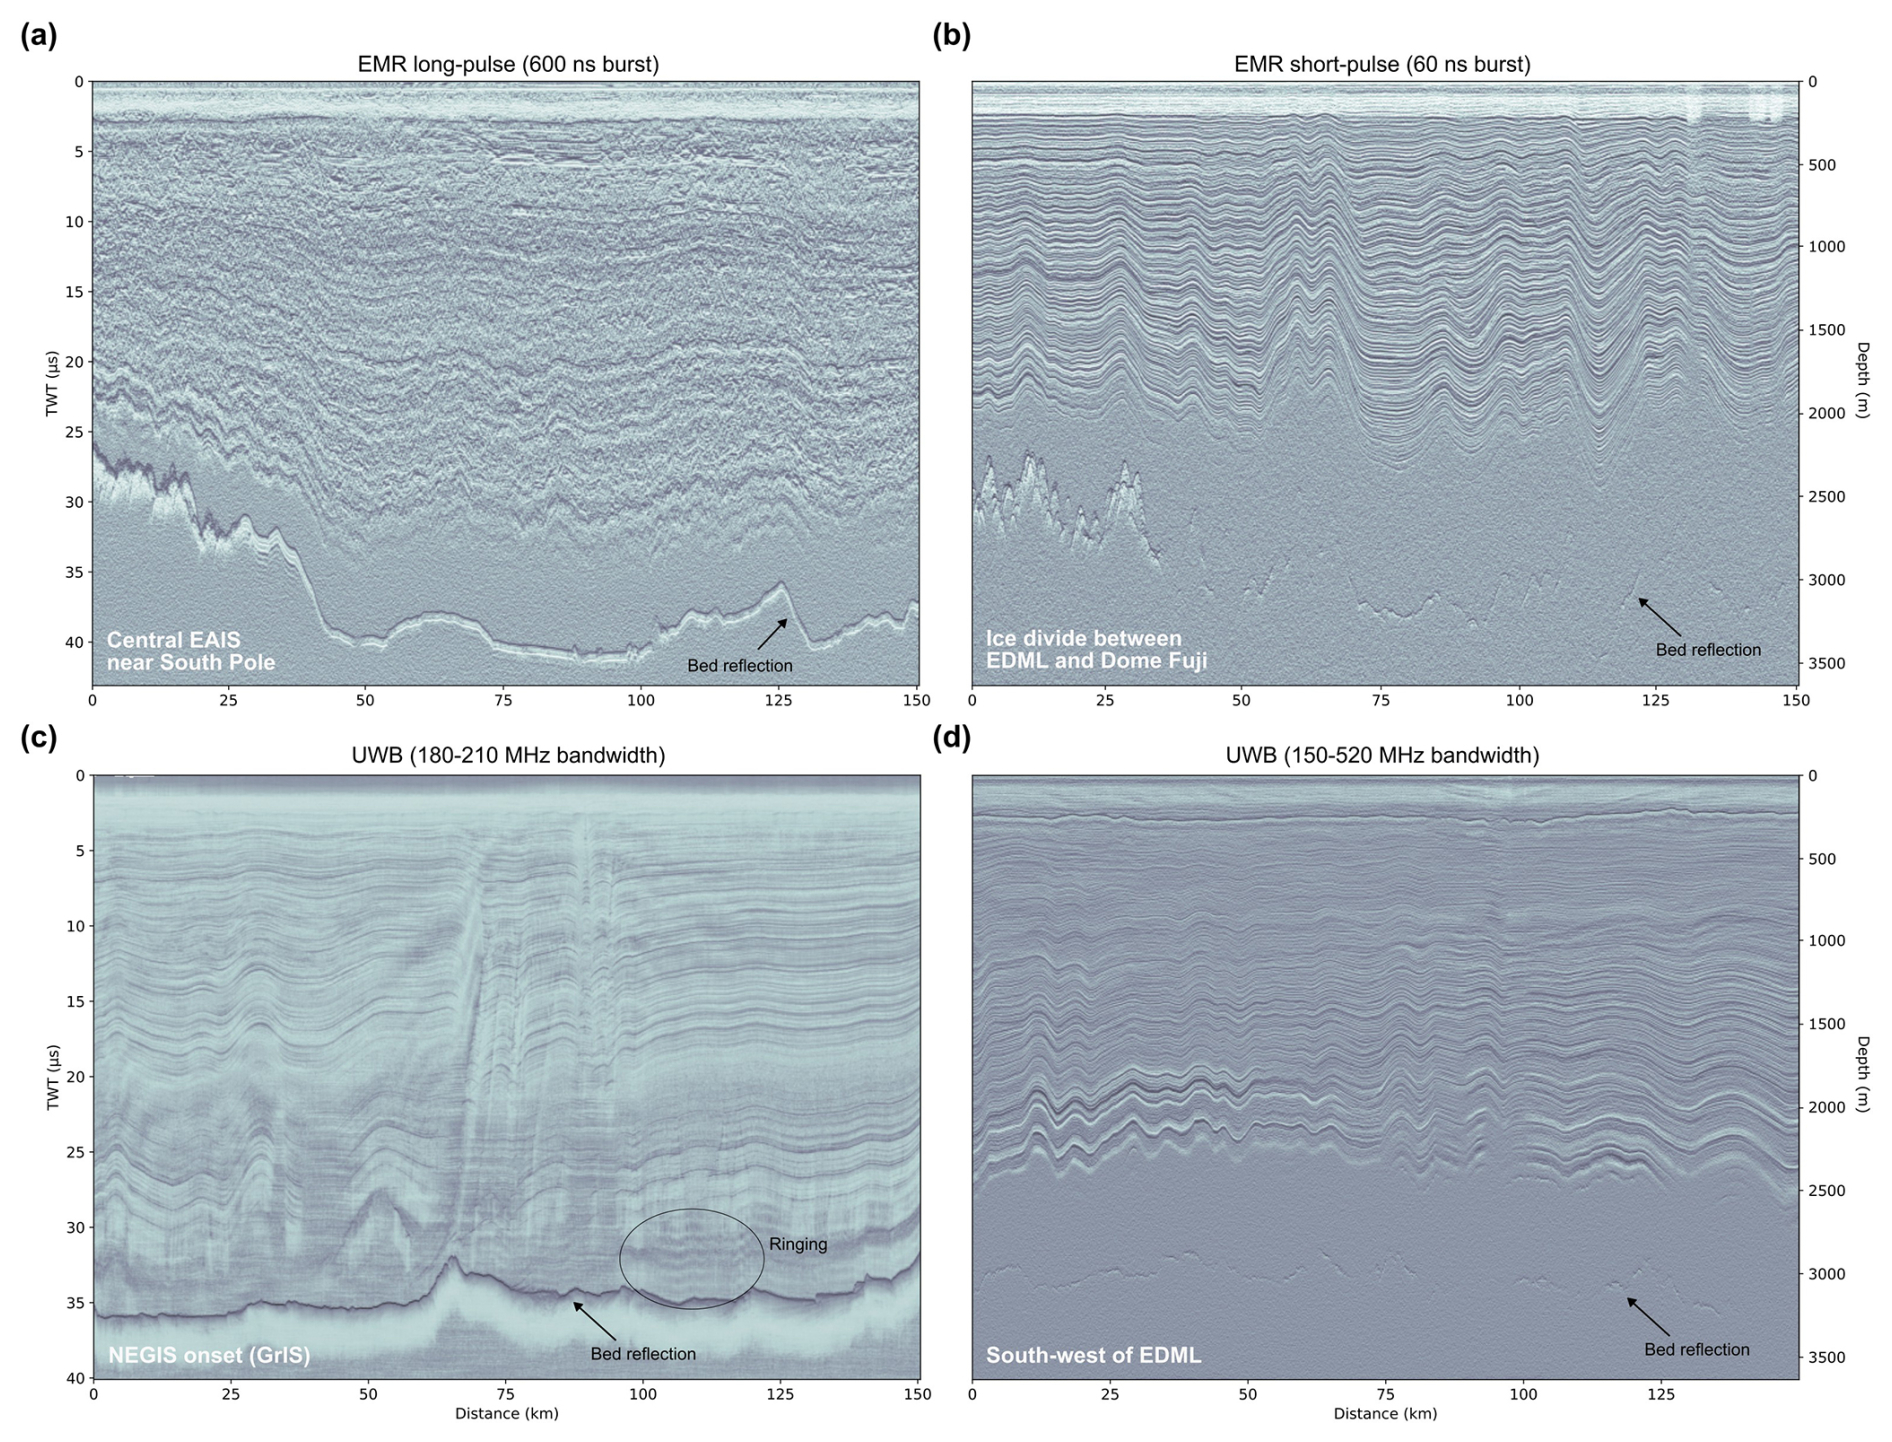
Figure 6Examples of deep-sounding radargrams. (a) EMR long-pulse; profile ID: 20112120, (b) EMR short-pulse; profile ID: 20033141, (c) UWB narrowband; profile ID: 20180510_01_013, (d) UWB wideband; profile ID: 20231211_02_006–008. For TWT-to-depth conversion we used an average electromagnetic wave speed of 1.689×10⁹ m s−1, which corresponds to an average ordinary relative dielectric permittivity of 3.15. The location of the radar profile is indicated in the lower left corner of the radargrams and shown in Fig. 3. All radargrams are time-zeroed at the ice surface reflection.
3.3 Snow radar (SNOW)
3.3.1 Technical specifications
The snow radar system (SNOW) is a FMCW system transmitting in a frequency range of 8–12 GHz. It was developed by the TU Hamburg-Harburg (Germany). The system operates with a transmit power of up to 3.2 W and a sampling rate of 500 MHz. The penetration depth is limited to the upper 10–20 m (Fig. 4c) with decreasing signal to noise ratio with depth. The theoretical range resolution is ∼ 2 cm and trace spacing depends on the trace coordinate accuracy and varies between 10 and 40 m.
3.3.2 Deployment of the SNOW system
The SNOW radar was used as an airborne system over land ice during the Antarctic season of 2013/14. Its profiles are centered on the EDML ice core and extend radially north and west towards the coast, south towards the Bailey and Slessor Ice Streams, and east along the ice divide between EDML and Dome Fuji (Fig. 8e). In addition, the SNOW system also operated over sea ice during the ANT 2014/15, ARK 2014, and ARK 2015 seasons.
3.4 Airborne SAR/Interferometric Radar Altimeter System (ASIRAS)
3.4.1 Technical specifications
The Airborne SAR/Interferometric Radar Altimeter System (ASIRAS) is a radar system developed by ESA as part of the CryoSat mission (Lentz et al., 2002). ASIRAS was built by the Swiss company Radar Systemtechnik (RST). Support was provided by AWI as well as the company Optimare for the integration and operation of the device in the research aircraft.
ASIRAS was designed to demonstrate the concept of a SAR-interferometric altimeter to measure polar ice thickness (Mavrocordatos et al., 2004) within the framework of the CryoSat Validation Experiment (CryoVEx). The system was developed to support ESA's CryoSat mission by providing airborne measurements that could be used to calibrate, validate and refine satellite data for ice and snow cover, helping improve the understanding of polar regions.
ASIRAS is one of ESA's first new-generation radar altimeters that employ pulse-width limited technology for higher precision. It operates similarly to a Ku-band altimeter, using a carrier frequency of 13.5 GHz and a bandwidth of 1 GHz. The range resolution of the system is ∼ 7 cm. The high pulse repetition frequency and pulse to pulse coherence allows delay/Doppler unfocused SAR processing (Raney, 1998) and thus a fine along-track resolution of <5 m to estimate highly detailed, accurate surface elevation data. ASIRAS also includes a dual-antenna system positioned across-track, functioning as a single-pass interferometer to enhance spatial resolution (Lentz et al., 2002; Hawley et al., 2006).
3.4.2 Data processing
The ASIRAS data processing follows the range-Doppler principle described by Raney (1998). ESA provides the processing software, allowing network-wide processing of ASIRAS data. Over time, numerous corrections and updates were made to the software based on joint testing by AWI and ESA, and these updates were integrated into the system (Helm, 2008).
The processing is divided into two stages: Level 1 and Level 1B (Helm, 2008). Level 1 georeferences radar bursts using interpolated GPS and INS data and applies corrections for sensor rotations. Its outputs feed into Level 1B processing, which transforms bursts into the range-Doppler domain via fast Fourier transformations, applies corrections like Doppler centroid and slant range adjustments, and enhances the signal to noise ratio through beam stacking. The final Level 1B product includes georeferenced radar echoes, preliminary terrain heights from an Offset Center Of Gravity (OCOG) retracker, and additional metrics such as power and phase. These data are stored in binary format and converted into FAIR (Findable, Accessible, Interoperable, Reusable) user-accessible data products (Wilkinson et al., 2016, Fig. 7).
3.4.3 Deployments of the ASIRAS system between 2004 and 2019
ASIRAS has been successfully flown on several measurement campaigns mostly by the CryoSat Validation and Retrieval Team. The system was deployed across significant portions of Greenland and the Canadian Arctic, with flights between 2004 and 2019 (Fig. 9f), where other radar systems of AWI were also used. Except for the 2004 campaign, none of these Arctic ASIRAS system flights used AWI aircraft. Instead, they were conducted by ESA and DTU (Technical University of Denmark). Hence, the individual flight seasons are not detailed in this paper. However, as the radar data from the ASIRAS system were processed at AWI and the radar data products are provided through AWI, they are included in the overview maps (Figs. 8g and 9f). Additionally, between 2007 and 2018, numerous flights were conducted across extensive parts of Antarctica (the majority with AWI polar aircraft), primarily focusing on the coastal regions (Fig. 8g).
3.5 Ultra-Wideband radar (UWB)
3.5.1 Technical specifications
AWI's ultra-wideband (UWB) airborne radar system is an improved version of the Multichannel Coherent Radar Depth Sounder (MCoRDS, version 5), which was developed at the Center for Remote Sensing of Integrated Systems (CReSIS) at the University of Kansas (Rodriguez-Morales et al., 2013; Hale et al., 2016). It has an improved hardware design compared to CReSIS' predecessor radar depth sounders (Gogineni et al., 1998; Wang et al., 2016). The basic radar configuration consists of an eight element antenna array mounted under AWI's Polar 5 or Polar 6 Basler BT-67 aircraft's fuselage (Fig. 2). The fuselage antenna elements function as transmit and receive channels using a transmit–receive switch. Additionally, two eight element receiver arrays can be mounted underneath the wings to increase the signal to noise ratio. This 24-channel configuration has so far only been used in 2016, in Northwest Greenland, for the Hiawatha survey (Kjær et al., 2018), and during test flights in the Antarctic 2016/17 season. The total transmit power is 6 kW, and the radar can be operated within the frequency range of 150–600 MHz. The PRF is 10 kHz, and the sampling frequency is 1.6 GHz. The characteristics of the transmission signals as well as the recording settings can be freely programmed to enable higher dynamic range. Usually the transmission signal is composed of staged linear modulated chirp signal of 2–5 waveforms (for instance 1 µs unamplified, 3 µs high-gain and 10 µs high-gain), which provides high-resolution imaging of different parts of the ice sheet. The range resolution of the UWB data products depend mainly on the chosen bandwidth and the along-track spacing typically ranges between 5 and 15 m.
3.5.2 UWB data processing
2D processing (sounding mode)
Standard processing techniques are performed with the OPR Toolbox (Open Polar Radar Toolbox; formerly termed CReSIS Toolbox; Open Polar Radar, 2023). The main steps comprise motion compensation, pulse compression, synthetic aperture radar (SAR) focusing and array processing. The SAR processing is based on the f–k (frequency–wavenumber) migration technique for layered sediment packages (Gazdag, 1978), which was adapted for radioglaciology (Leuschen et al., 2000). GPS data are post-processed by precise point positioning, with a final estimated accuracy (commercial software package Waypoint 8.4) of better than 3 cm for latitude and longitude, and better than 10 cm for altitude. For further details on radar data acquisition and processing, see Rodriguez-Morales et al. (2013), Hale et al. (2016), and Franke et al. (2022c). When combining the different images that highlight various depth ranges of the radargram, we also apply an amplitude correction to the individual images to reduce offsets at the image transitions. Moreover, we processed the data in a way that the TWT vector starts at 0 s.
3D processing (swath/imaging mode)
Swath processing is applied to produce a high-resolution digital elevation model of the bed topography. The information from side-transmitting off-nadir returns from sequential acquisitions, combined with phase differences in arrivals between receiver elements (Jezek et al., 2011; Holschuh et al., 2020), are used to estimate the direction of arrival for energy in both the along-track and across-track directions (Paden et al., 2010; Arenas-Pingarrón et al., 2023). These data are SAR processed and combined channel by channel, using the Multiple Signal Classification (MUSIC) algorithm in the OPR Toolbox (Open Polar Radar, 2023), for mapping of the subglacial topography in three dimensions along a single flight line. Moreover, along-track and fast-time averaging was applied to the SAR-processed data to enhance the signal to noise ratio for tracking the bed reflections and cross-track surface.
Bed elevation values from an existing bed topography DEM can be used to define the depth range for bed return, and together with the nadir bed return they serve as seed points for tracking cross-track reflectors. A Gaussian fit is applied to the bed return power to address broad distributions and multiple peaks, and tracking is constrained using a guided window based on a theoretical flat-bed hyperbola, minimizing interference from nearby englacial reflections. After tracking the cross-track surface, a static angle correction accounts for surface tilting (if needed), and the bed return hyperbola is range migrated, including for air-to-ice refraction, to convert surface tracking to depth (Carter et al., 2025a). Artifacts from upwarping at swath edges affect accuracy due to energy spreading. The range-migrated data are then converted into a point cloud and projected to geographic coordinates (latitude and longitude) using the true heading and flight trajectory from the radar data.
3.5.3 Deployments of the UWB system since 2016
The UWB system became fully operational in Greenland in 2016, deployed in northwest Greenland at the Hiawatha Glacier (Kjær et al., 2018) and in southwest Greenland at Jakobshavn Glacier. During this deployment, the system was flown in its 24-channel configuration with additional wing mounted arrays. This setup improved the signal to noise ratio but reduced the aircraft range. From 2018 onward, the UWB system was only used with a single array mounted under the fuselage of the Polar aircraft to increase the range of survey flights, as the surface clutter reduction offered by the 24-channel configuration was deemed less valuable than the extended survey range possible without it.
Between 2018 and 2022, UWB flights in Greenland focused on the area around the EastGRIP drilling site (e.g., Franke et al., 2022c) and the upstream region of the Nioghalvfjerdsfjorden Glacier (79° NG; Zeising et al., 2024). In 2018 and 2022, swath flights were conducted in the immediate vicinity of the EastGRIP ice core, producing a high-resolution (25 m horizontal resolution) DEM of the bed topography and landforms (Carter et al., 2025a). In the 2022 survey, radar profiles were collected in full polarimetric mode around NEGIS (Eisen et al., 2025) providing insights into englacial properties of this ice stream at comparable data quality of local ground-based polarimetric surveys in this region (Gerber et al., 2025; Nymand et al., 2025). Furthermore, in 2023, a campaign took place in the Canadian Arctic on the Müller Ice Cap to explore a suitable coring site (Lilien et al., 2024) and in 2024, flights were conducted both upstream of the 79° NG and in Southwest Greenland.
The first deployment in Antarctica was conducted during the 2016/17 season, primarily consisting of test flights. In the 2018/19 season, surveys focused on the onset of the Jutulstraumen Glacier (e.g., Franke et al., 2021a, 2025b) as well as the area around the grounding line of the Roi Baudouin Ice Shelf and nearby Derwael Ice Rise (e.g., Koch et al., 2023; Zhou et al., 2025). During the 2023/24 and 2024/25 seasons, additional measurement flights were conducted directly at the grounding line in Dronning Maud Land, their aims led by the goals of the SCAR Action Group RINGS (Matsuoka et al., 2025), as well as flights mapping deep englacial stratigraphy (Franke et al., 2025b) and near-surface stratigraphy (Zuhr et al., 2026).
3.6 Ultra-Wideband Microwave radar (UWBM)
3.6.1 Technical specifications
The ultra-wideband microwave radar (UWBM), is a 2–18 GHz airborne FMCW radar developed by CReSIS at the University of Kansas (Yan et al., 2017a, b; Arnold et al., 2020). The radar system uses a chirp generator based on a direct digital synthesizer (DDS) with a frequency multiplier and a down-converter, dual-polarized transmitter and receiver antennas, intermediate frequency section, and a digital acquisition unit. The radar has four channels with full polarimetric transmit and recording capability (VV, HH: co-polarized, VH, and HV: cross-polarized). The radar transmits with a pulse length of 240 µs at an effective PRF of approximately 3.9 kHz and records at a sampling frequency of 125 MHz. The approximate range resolution is ∼ 1 cm and the typical along-track spacing 1.35 m.
3.6.2 Data processing
UWBM data undergo extensive processing, which involves removing coherent noise, often visible as undulating lines in radargrams (Fig. 4b), using a low-pass boxcar filter. The system far-field response is extracted using Discrete Fourier Transform methods to detect strong reflectors (e.g., open water leads) that provide high signal to noise ratio targets. The impulse response from these reflectors is used to deconvolve the radar signal, enhancing range resolution and minimizing sidelobes (Yan et al., 2017a).
Furthermore, the processing includes post-processing steps that perform motion compensation using the NovAtel DL-V3 GPS data and filter out erroneous data based on aircraft altitude and pitch/roll parameters, snow depth constraints, and surface temperature readings. Validation exercises over landfast sea ice show that this radar processing achieves a mean bias below 1 cm (Jutila et al., 2022), demonstrating the reliability of the UWBM radar system for high-resolution snow depth measurement on Arctic sea ice (Jutila et al., 2021, 2022; Franke et al., 2025a) and grounded ice (Humbert et al., 2020).
3.6.3 Deployments of the UWBM system since 2016
After a testing phase between 2015–2016, the UWBM was first deployed on land ice alongside the UWB in the 2016 season in northwest and northeast Greenland. A second deployment of the same instrument combination was carried out in the 2018 Greenland season to map near-surface features (e.g., Humbert et al., 2020). The UWBM has also been used in the Arctic for several campaigns since 2017 over sea ice, in combination with other instruments such as the airborne laser scanner and EM Bird, as part of the AWI Icebird campaigns (Jutila et al., 2021, 2022). Since this article focuses on radar survey flights over land ice and ice shelves, the flights over sea ice are not included here.
During the Antarctic season 2022/23, the first UWBM deployment on Antarctic land ice took place in coastal western Dronning Maud Land. Data were collected near Neumayer Station over the Halvarryggen ice rise, and along the traverse between Neumayer and Kohnen stations, as well as on the fast ice of Atka Bay. In Atka Bay, the UWBM was able to map snow thickness and detected flooded sea ice regions on the sea ice and iceberg-induced snowdrifts (Franke et al., 2025a; Hames et al., 2026). In the Antarctic 2025/26 season, UWBM data were collected mainly on the plateau around Kohnen Station as well as individual profiles over Atka Bay and the Kottas traverse.
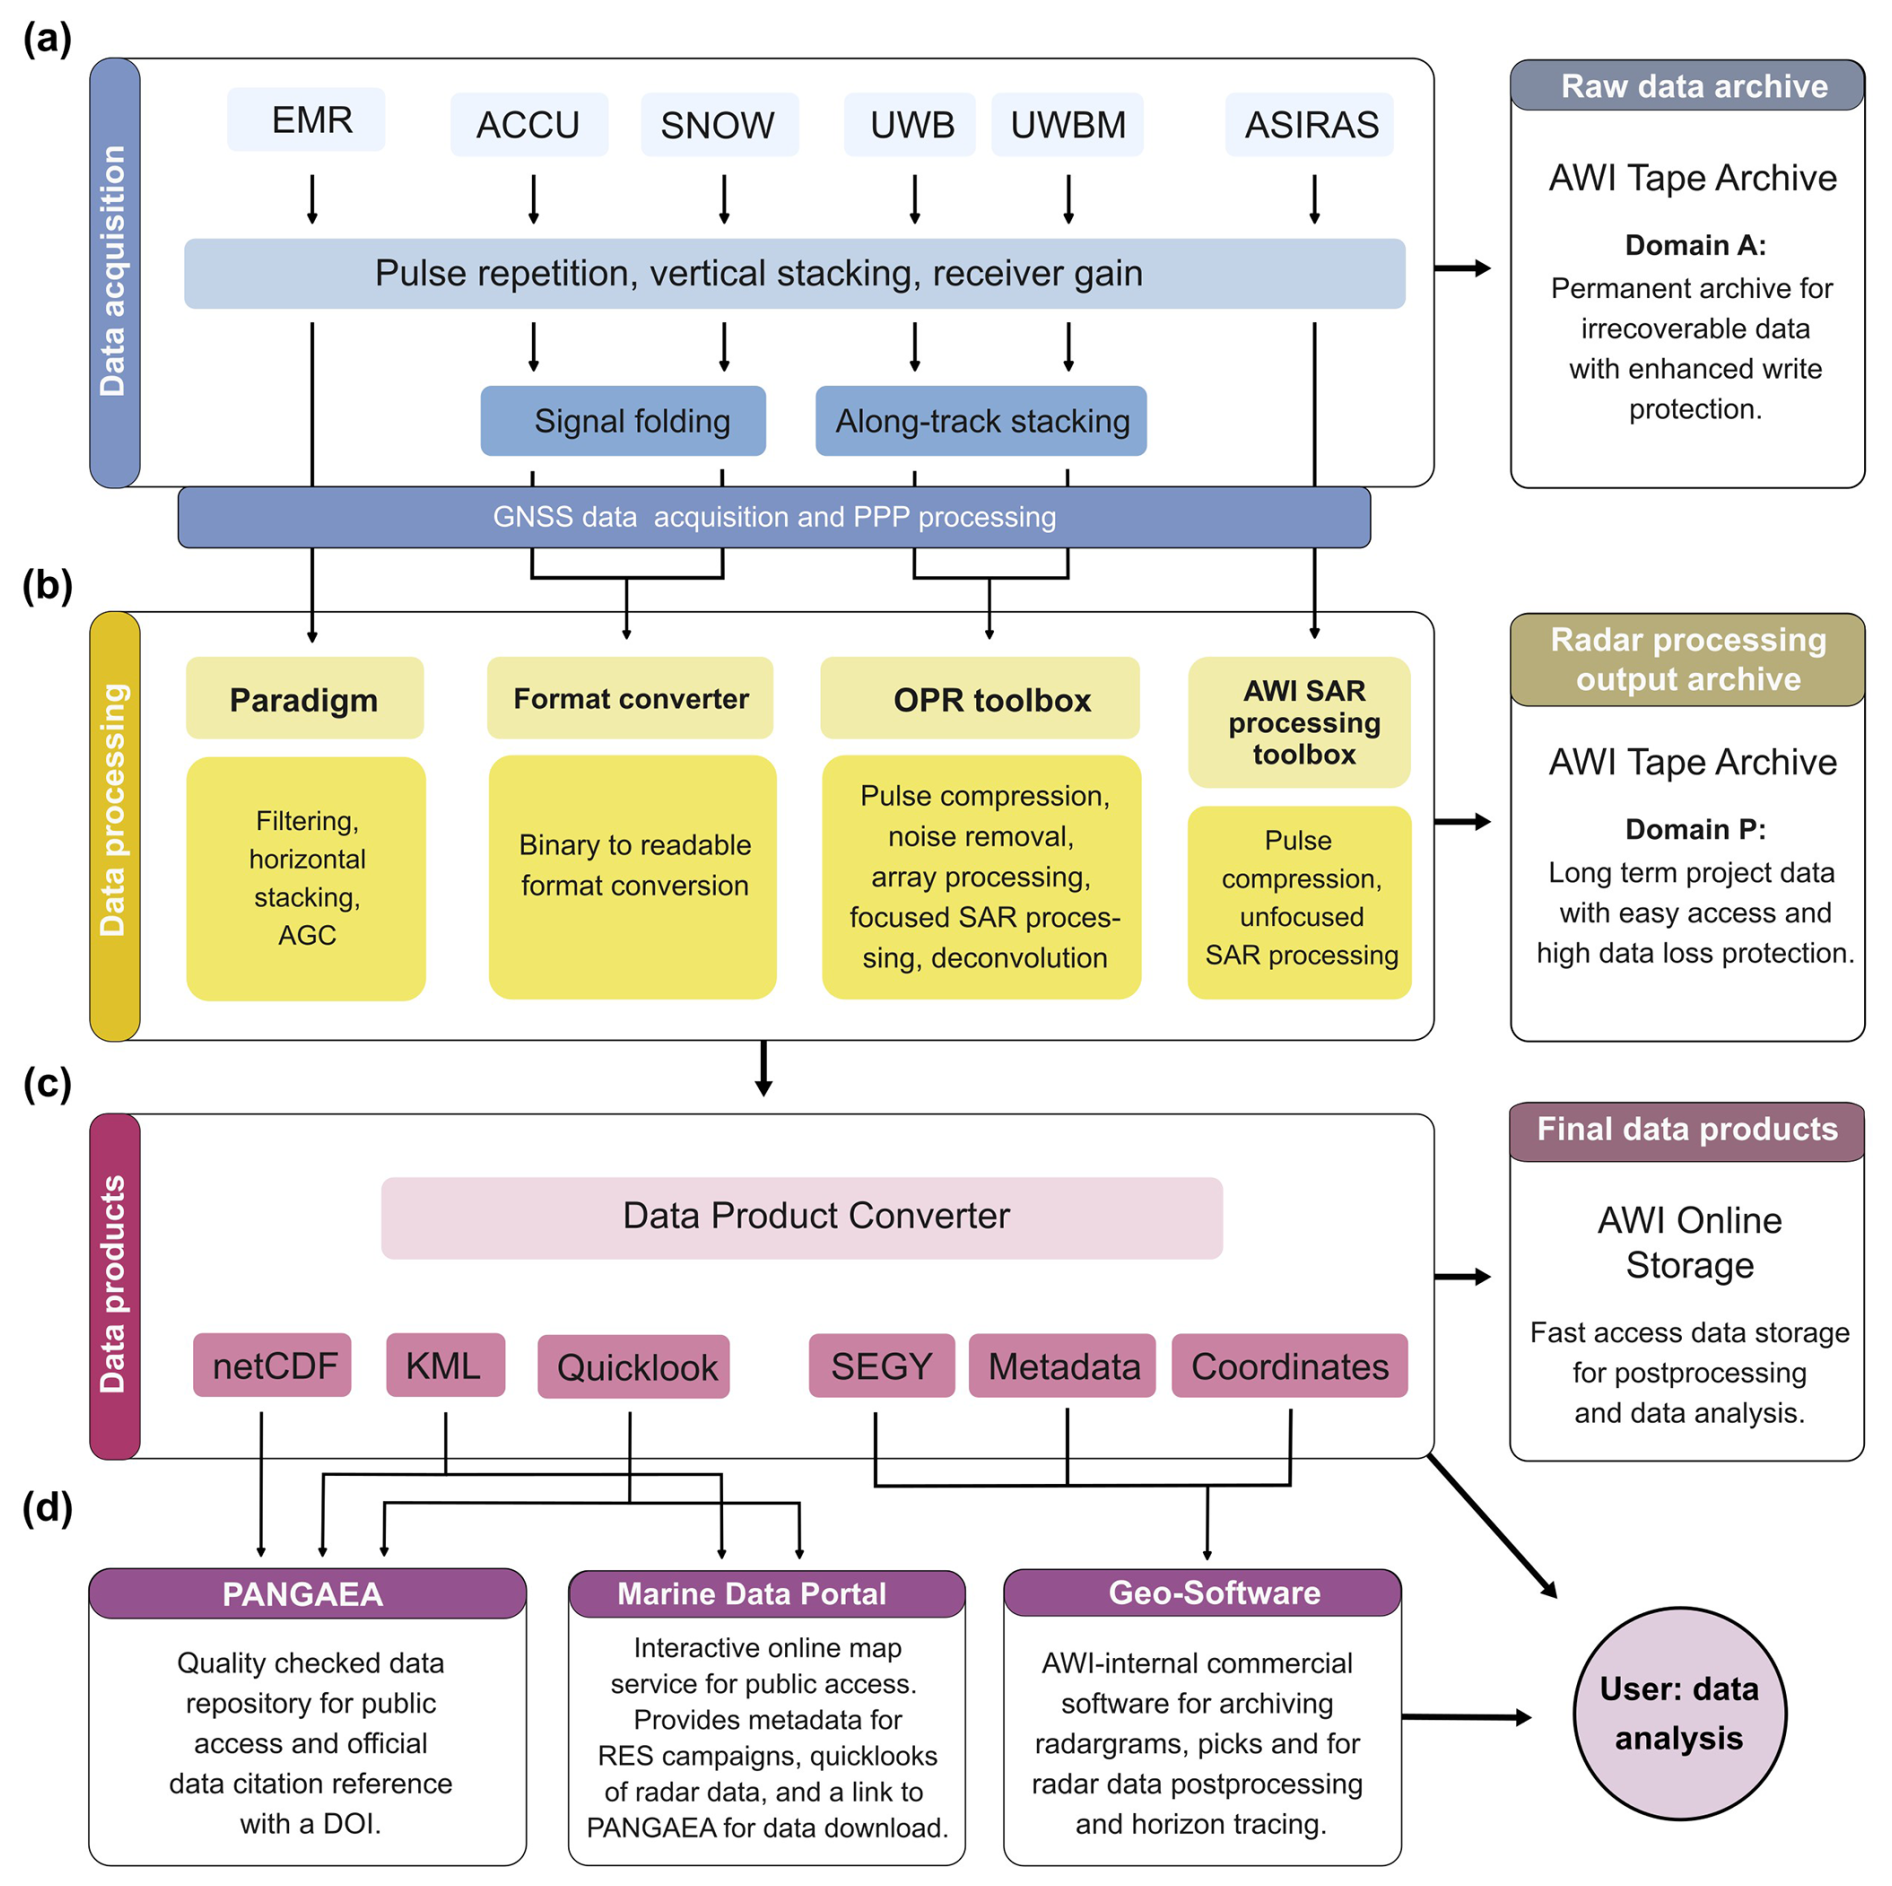
Figure 7Flow chart of AWI radar data from (a) acquisition, over (b) processing and (c) conversion, to (d) public data access and post-processing. The panels on the right represent the level of data backup for the respective data level.
4.1 Data acquisition, processing, format conversion and archiving
For the various airborne radar systems operated by AWI, data acquisition and processing rely on different hardware and software packages. These differing workflows converge into a unified framework after the creation of processed radar data products. In this way, standardized data formats are made available from all radar systems for end users, enabling efficient usage, broad accessibility, and consistent archiving. The fundamental workflow or data flow is illustrated in Fig. 7.
At the acquisition level of each radar system, data undergo preliminary processing before being written to storage. This step may include horizontal and vertical stacking or signal amplification. The raw data at acquisition are stored as primary data in the AWI tape archive within a protected, write-secure area. At the processing level, the raw data are input to various software packages, e.g., the OPR Toolbox (formerly CReSIS Toolbox; Open Polar Radar, 2023) for UWB and UWBM data, the FMCW Converter for ASIRAS, ACCU, and SNOW data, and the software Paradigm™ from AspenTech Subsurface Science & Engineering for EMR data. The processing outputs, depending on the software, are saved as primary data products in a dedicated section of the AWI tape archive designed for long-term storage, offering high security against data loss.
To ensure uniform data formats and simplified usability, the processed data products in their diverse formats are integrated into an IDL Data Converter. The output consists of standardized NetCDF files for radar data, geodata such as KML and shapefiles, quicklook images of radargrams, and standardized SEGY files and coordinate files for import into commercial seismic software (e.g. Paradigm™) for post-processing and horizon picking. These converted files are also stored on the AWI Hybrid-NAS-Storage, which offers fast connectivity to the internal network and high performance computing resources for analysis and post-processing.
Furthermore, the standardized radar data are made publicly available at two central repositories. Radar data (NetCDF files), radar profile coordinates (KML files), and quicklook radargram images (JPGs) are archived on PANGAEA (Felden et al., 2023; Eisen et al., 2024). Additionally, radar profile coordinates, quicklook radargrams, and other metadata are forwarded to the Marine Data Portal.
4.2 Ice surface reflection determination
To determine the surface reflection, we use a leading-edge retracker for all radar data products. This retracker applies the TCOG (Threshold Centre of Gravity) algorithm (Davis, 1997) within a specific window, capturing the leading edge with a threshold of 0.8. This approach provides a consistent method for determining surface reflection across all radar products by identifying it at the gradient's ascent toward the maximum.
We choose this approach instead of allocating surface reflection at the local maximum because the maximum can be broad, saturated, and potentially characterized by multiple peaks. In a few cases, the algorithm fails: for example, when sidelobes near the surface are too strong, when the tracking window migrates out of the surface reflection due to significant changes in flight altitude, when strong near-surface reflections occur, or when aircraft roll is large. These cases were manually corrected for EMR, UWB and UWBM data.
4.3 Ice base reflection determination
The picks of the ice base are provided for several radar data products and was traced using different criteria. For all UWB products with a vertical resolution of 5 m or better, the base reflection was predominantly picked at the local maximum of the base reflection. For the EMR products, which has a range resolution of ∼ 5–50 m, the pick was made at the steepest part of the gradient to the local maximum, as the basal reflection return is very broad for this radar product.
Ice base picks are not consistently provided for all radar data sets. Current and future efforts are being made to revise the ice base picks and ice thickness archive from AWI radar measurements. In the future, each dataset on PANGAEA and in the Radar Viewer will include a link to the corresponding curated ice base pick and ice thickness dataset.
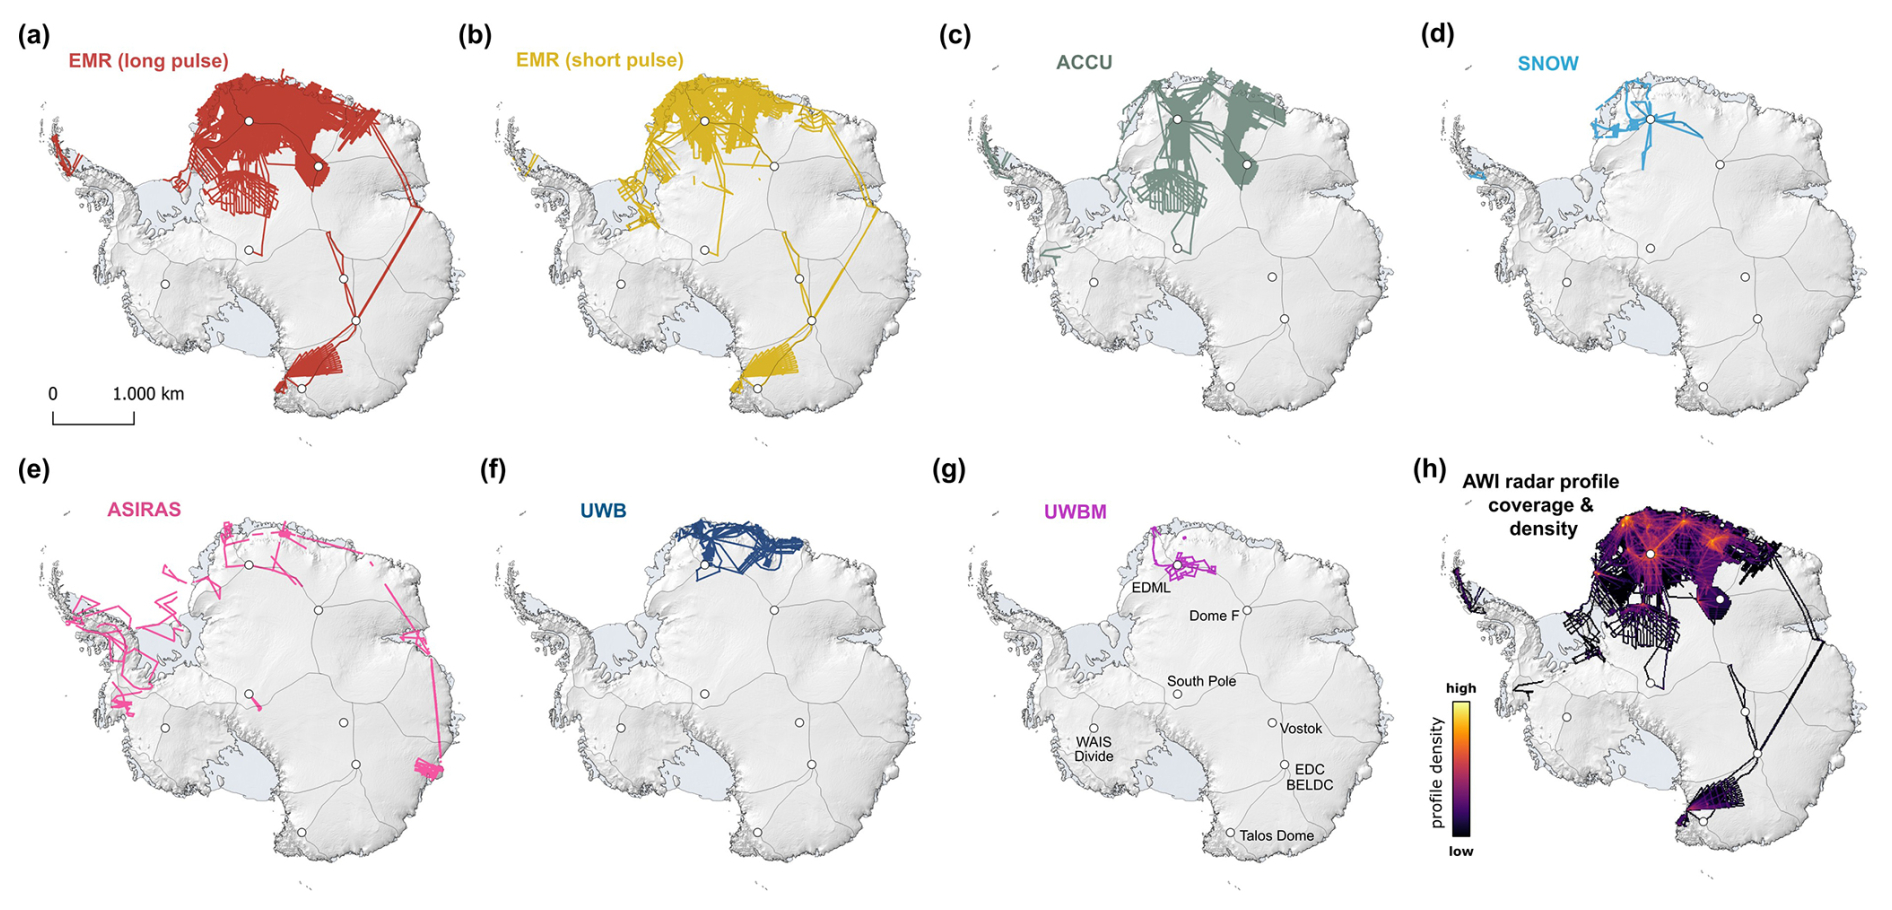
Figure 8AWI radar data coverage over the Antarctic Ice Sheet categorized by radar systems. (a) EMR long-pulse (600 ns), (b) EMR short-pulse (60 ns), (c) ACCU radar, (d) SNOW radar, (e) ASIRAS, and (f) UWB radar, (g) UWBM radar, (h) spatial profile density of all AWI radar systems. For the computation of the spatial profile density, we exclude the ASIRAS profiles. The white circles represent deep ice core locations and the black lines the IMBIE drainage basins (Rignot et al., 2019).
So far, AWI has collected more than one million profile-km of radar data, i.e., the sum of the length of all radar products from the different radar systems. This data have been used for a wide range of scientific objectives covering a variety of glaciological and geophysical problems in the polar regions. The vast majority of flights were conducted over the Antarctic and Greenland ice sheets, but individual ice caps and glaciers in both Greenland and the Canadian Arctic were also surveyed. In this section, we present a summary of key scientific targets and outcomes.
5.1 Ice thickness surveys in East Antarctica and Greenland
The initial historic reason for surveying the polar ice sheets with radar was to map the bed topography beneath the ice. Since 1994, AWI has conducted extensive radar surveys to determine the ice thickness of the Antarctic and Greenland ice sheets. In Antarctica, these surveys focused mainly on Dronning Maud Land (Steinhage et al., 1999, 2001; Riedel et al., 2012; Karlsson et al., 2018; Eisermann et al., 2020, 2021; Franke et al., 2021a). They have been contributing a considerable amount of data to continent-wide ice thickness and bed topography datasets such as Bedmap (Lythe and Vaughan, 2001; Fretwell et al., 2013; Frémand et al., 2023; Pritchard et al., 2025) and BedMachine Antarctica (Morlighem et al., 2020) as well as for modelling studies (e.g., Kleiner and Humbert, 2014, see Sect. 5.10 for details) and serve as a benchmark dataset for automatic ice-base extraction (Dreier et al., 2025).
In Greenland, the measured ice thickness primarily covers the northeastern part of the ice sheet (Mayer et al., 1999; Franke et al., 2020, 2022a; Zeising et al., 2024) and the area surrounding the NorthGRIP ice core (Nixdorf and Göktas, 2001). The bed topography derived from a survey with the UWB system led to the discovery of a large impact crater beneath Hiawatha Glacier in northwest Greenland (Kjær et al., 2018). All ice thickness data together form an essential component of Greenland-wide ice thickness and bed topography products (Bamber et al., 2013; Morlighem et al., 2017).
The majority of ice thickness measurements, both in Greenland and Antarctica, were obtained from surveys with the EMR radar, but was largely replaced by using the UWB radar since 2016 for most glaciological objectives and projects. For aerogeophysical surveys, the simpler and lighter EMR system remains a standard system for combination with gravity and magnetic sensors due to its generally reduced weight and thus greater range. Additionally, for logistical reasons, it can be advantageous to use the EMR when the UWB system is currently in use in the Arctic or not operational. Testing of a lighter gravimeter alongside EMR in 2022/23 (Johann et al., 2025) paved the way for gravimetry together with UWB for the first time in the Antarctic season of 2024/25. Despite the weight saving, this combination still offers a shorter range than is possible with the EMR system.
Both radar systems are capable of sounding ice more than three kilometres thick, but the improved configuration and processing capabilities of the UWB system provide better range and along-track resolution of the bed topography. For ice thickness determinations using the EMR radar, long-pulse data were used to identify the base reflection in profiles where (i) short-pulse data were not available or (ii) the base reflection was not visible in the short-pulse data. Since short-pulse data offer better vertical resolution, they were preferred for ice thickness determination where the base reflection is visible due to the higher vertical resolution of the data product.
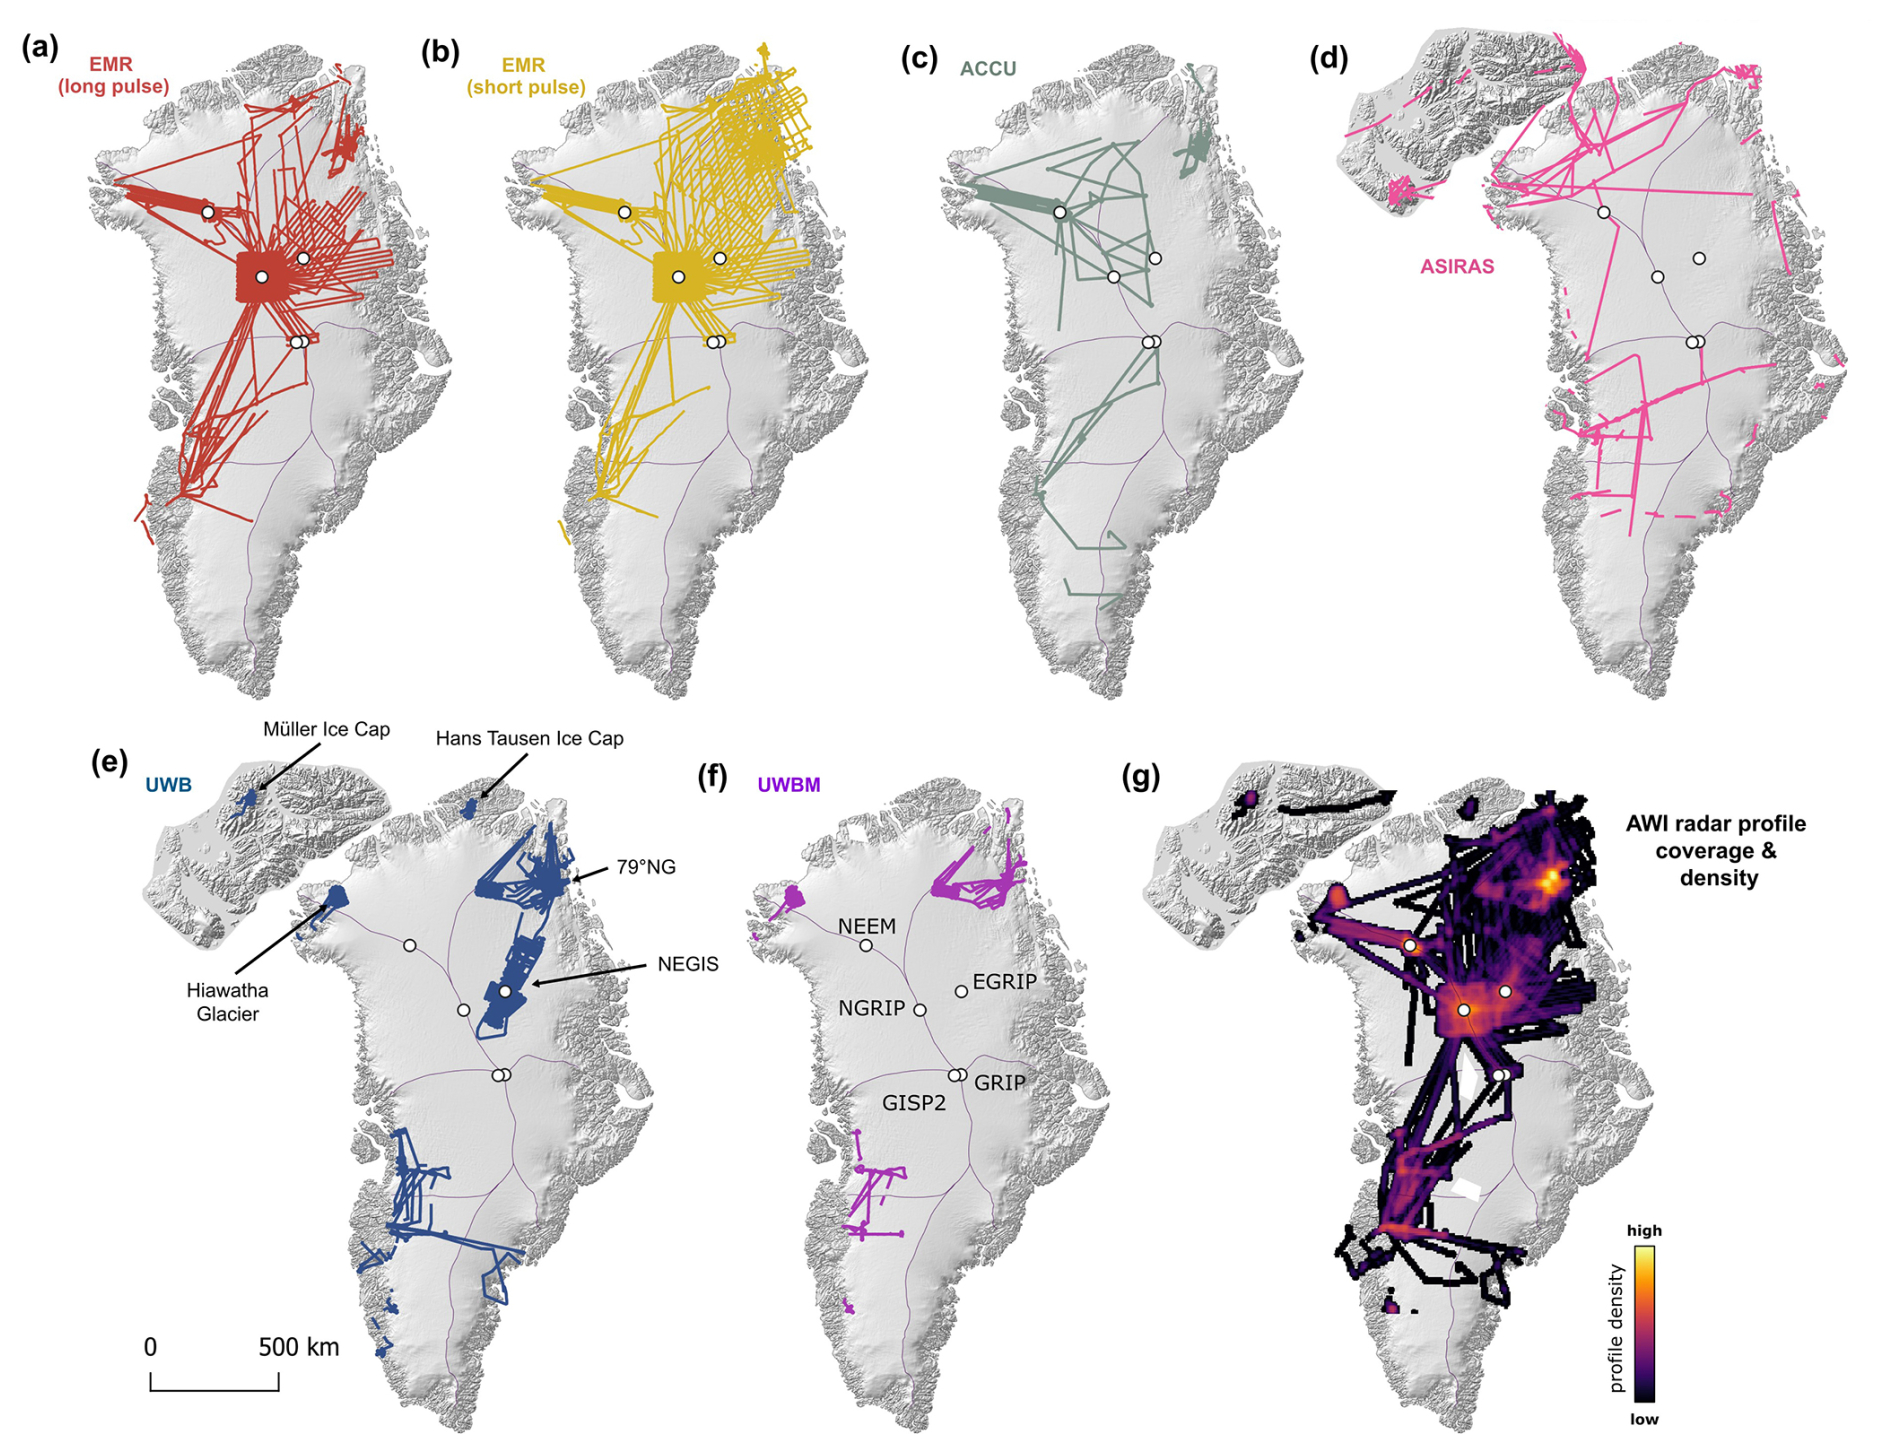
Figure 9AWI radar data coverage over the Greenland Ice Sheet and Canadian Arctic categorized by radar systems. (a) EMR long-pulse (600 ns) profiles, (b) EMR short-pulse (60 ns) data, (c) ACCU radar, (d) ASIRAS, (e) UWB radar, (f) UWBM radar, (g) spatial profile density of all radar surveys. For the computation of the spatial profile density, we exclude the ASIRAS profiles. The white circles represent deep ice core locations and the black lines the IMBIE drainage basins (Mouginot et al., 2017).
5.2 Basal properties
In addition to studies focusing on ice-thickness determination, AWI radar data have also been used to examine the detailed properties of the ice sheet base. In both Greenland and Antarctica, bed topography analyses have been employed to investigate valley structures and the roughness of the bed using various metrics (Eisen et al., 2020; Franke et al., 2021b, a). These studies range from a contribution of data in DML to continental-scale studies (Eisen et al., 2020), to local and regional contexts to explore the relationship between ice flow, its direction, and the direction-dependent basal roughness (Franke et al., 2021b) as well as landscape preservation and origin underneath the AIS and GrIS (Franke et al., 2021a; Carter et al., 2025b; Paxman et al., 2026). To further refine our understanding of bedrock roughness on smaller spatial scales, parameters like the waveform abruptness of the base reflection and characteristic side reflections parallel to flight tracks have been analyzed. For instance at the onset region of the Northeast Greenland Ice Stream (NEGIS) off-nadir reflections indicate the presence of elongated subglacial landforms oriented parallel to ice flow and shaped by ice stream activity (Franke et al., 2020, 2021b), and were categorized in a high-resolution DEM of the bed topography as mega-scale glacial lineations (Carter et al., 2025a).
Next to mapping bedrock topography and subglacial landscapes shaped by glacial activity, radar data are also important for analyzing the transport and storage of subglacial water. High-resolution ice thickness measurements are essential for modelling how subglacial water moves and identifying potential locations where it might pool, such as subglacial lakes (Goeller et al., 2016). While radar data alone are often not sufficient for unambiguous lake detection, they serve as a crucial foundation for combination with other measurements or models. For example, in western DML, radar data combined with SAR interferometry have shown how subglacial water moves between topographic depressions (Neckel et al., 2021).
In addition to radar signals at the ice–base interface, the reflection characteristics of basal ice are also valuable for understanding basal properties and processes. High-resolution ultra-wideband (UWB) data from a 2018 survey of Jutulstraumen Glacier revealed embedded point scatterers, which are likely sediment particles instead of liquid water inclusions (Franke et al., 2023b). Sediments are likely to become entrained when subglacial water freezes to the ice base, influencing not only the mechanical properties of the basal ice during flow but also providing insights into the basal temperature regime and the presence of subglacial water and upstream basal melting (Franke et al., 2024).
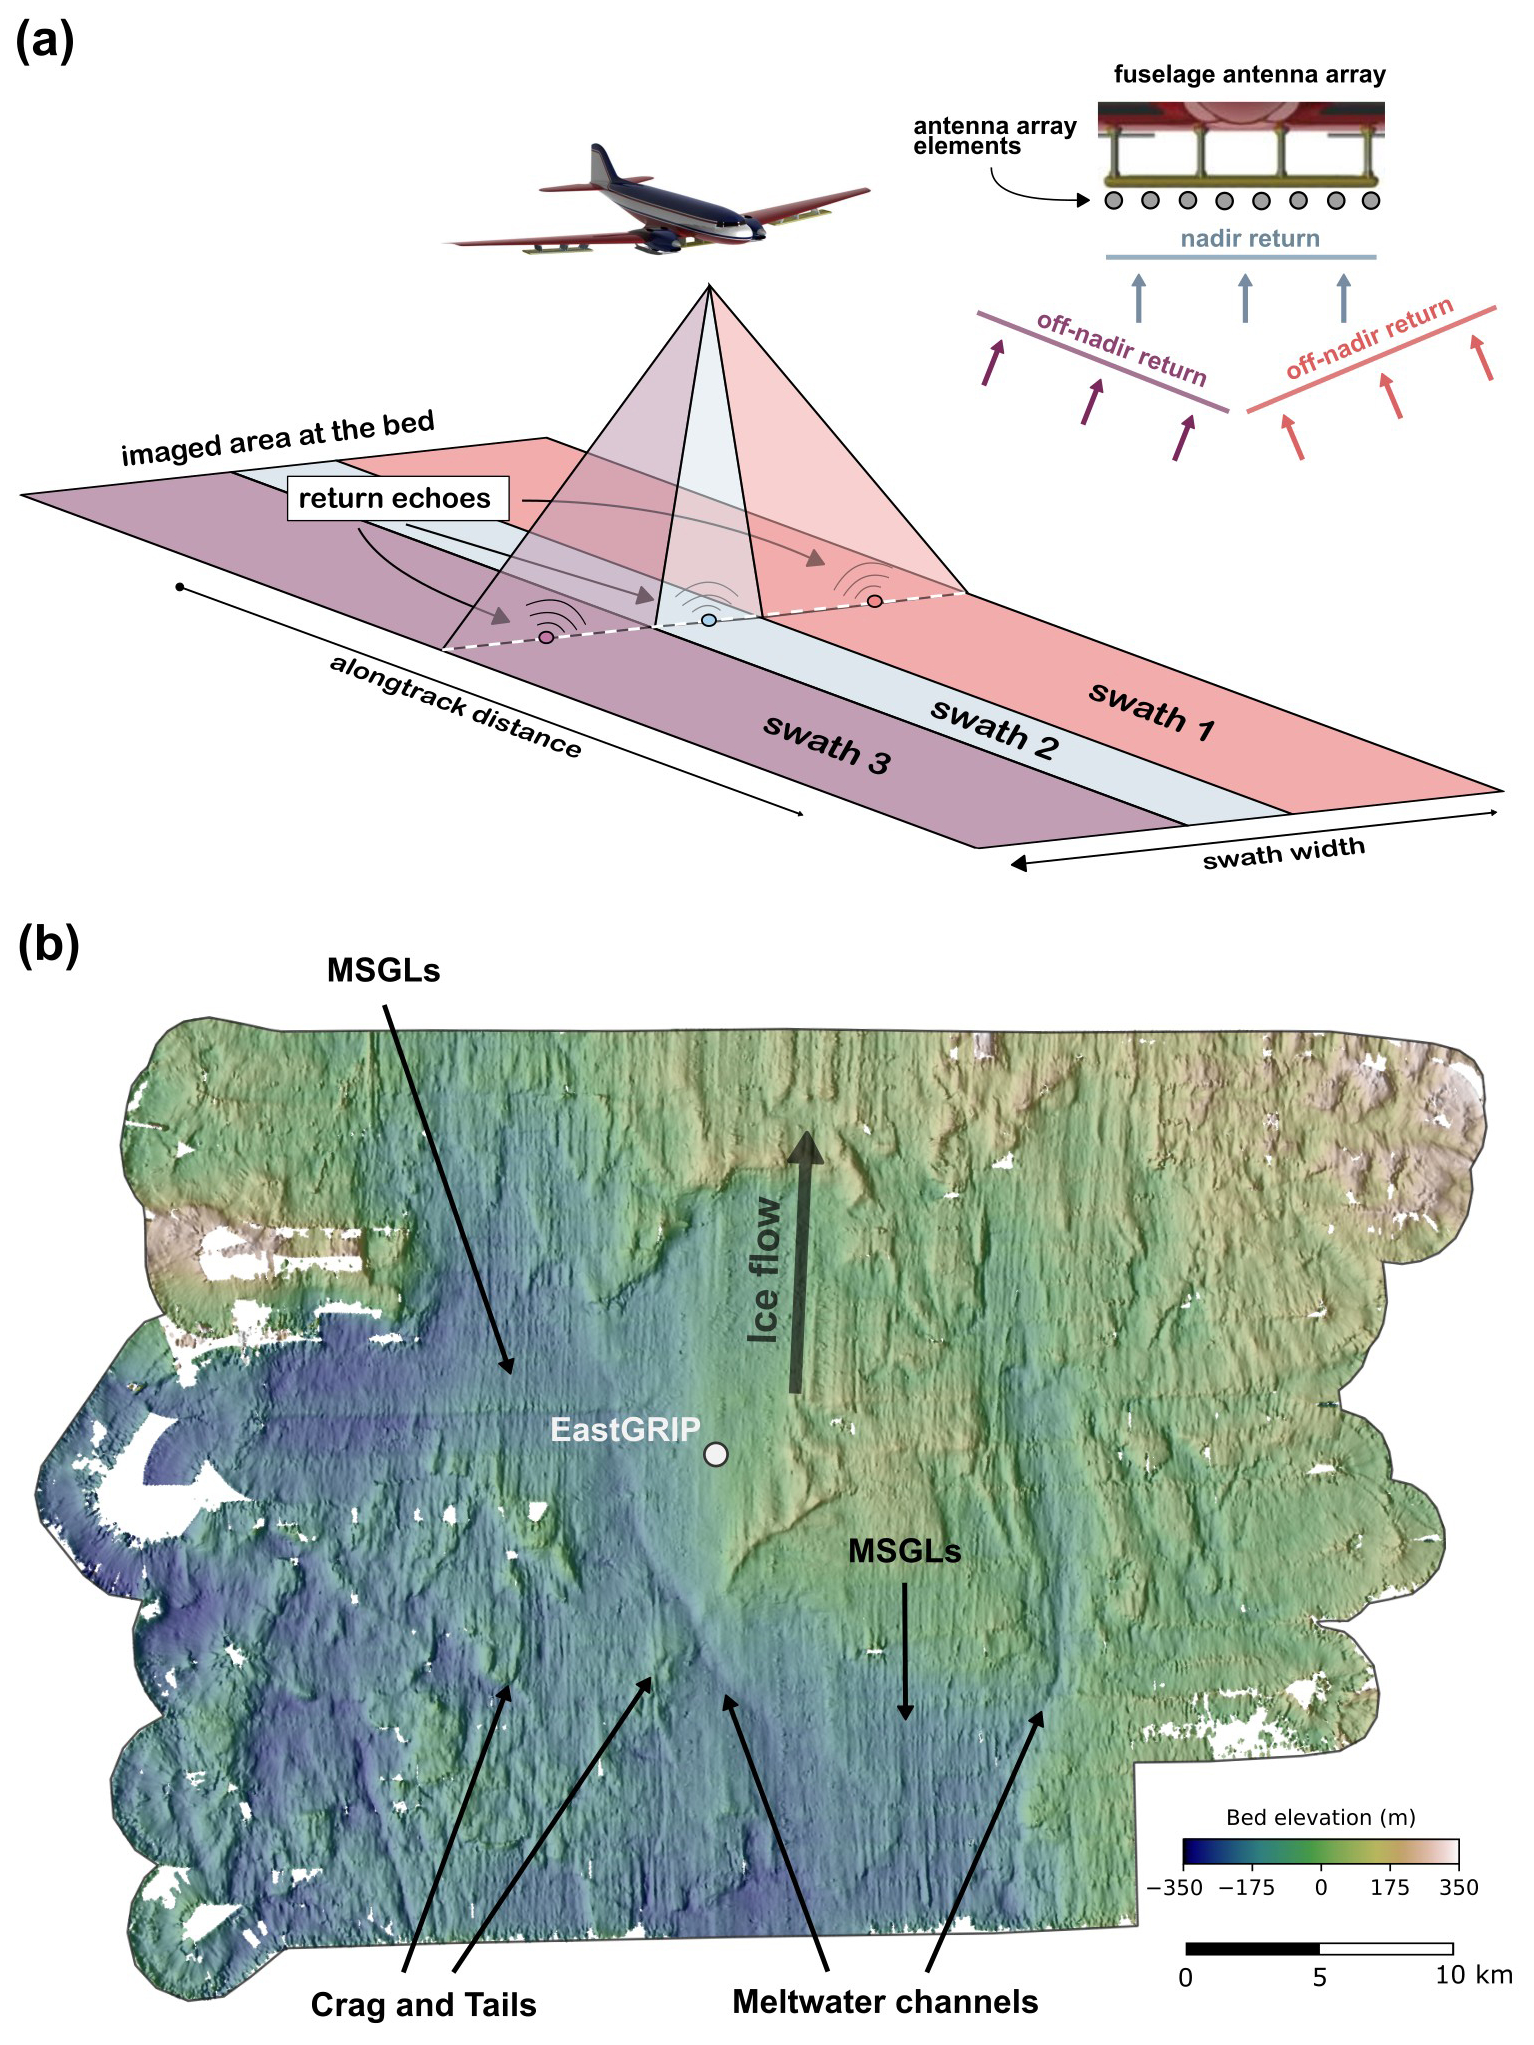
Figure 10AWI UWB swath radar capability to image high-resolution bed topography. (a) Sketch of the swath radar aquisition principle. (b) Digital elevation model of the bed topography around the EastGRIP drill site at the onset region of the NEGIS with a grid resolution of 25 m. The DEM highlights subglacial landforms, such as mega-scale glacial lineations (MSGLs), crag-and-tails, and basal meltwater channels (Carter et al., 2025a). Both figures are modified from Carter et al. (2025a).
5.3 Ice core reconnaissance
One of the fundamental reasons why radar surveys are conducted in Greenland and Antarctica is to identify suitable locations for deep ice core drilling (Bingham et al., 2025; Mutter and Holschuh, 2025). Moreover, radar measurements near core sites offer a way to extrapolate the information from dated ice cores laterally across a wider area. For this purpose, the European Project for Ice Coring in Antarctica (EPICA) pre-site surveys in western Dronning Maud Land used airborne EMR radar measurements between 1994 and 1999 to search for a region with undisturbed layering, a low flow velocity, and sufficient ice thickness for drilling, ideally at a summit or ice divide (Steinhage et al., 1999; Steinhage, 2001). Additionally, the bedrock topography played a crucial role in determining a suitable drilling location (Steinhage et al., 1999, 2001).
The ice-thickness data also formed the basis for further ice dynamic modelling leading to the selection of the EPICA DML drilling site near 75° S and 0° (Huybrechts et al., 2000; Wilhelms et al., 2014). Subsequently, Kohnen Station was established in 2001 at the drill site, providing a logistics base for deep ice core drilling of the EDML ice core (Wilhelms et al., 2014). To locate a suitable drill site for the oldest Antarctic ice core, Sutter et al. (2019) used radar-derived ice thickness data to perform 3-D continental ice-sheet modelling.
Moreover, AWI radar data were crucial in identifying promising sites for 1.5-million-year-old ice in Antarctica. AWI's surveys in the Dome Fuji region (2014/15 and 2016/17) revealed detailed subglacial topography, which refined thermokinematic models to predict frozen basal ice locations (Karlsson et al., 2018). In the Dome C region, AWI radar data, combined with other datasets, identified areas with low basal roughness and minimal subglacial water, which are key for preserving ancient ice (Young et al., 2017). These data were integrated with thermodynamic modeling to constrain geothermal heat flux thresholds, pinpointing Dome Fuji and Dome C as ideal candidates for retrieving old ice cores (Van Liefferinge et al., 2018).
In connection with the North Greenland Ice Core Project (NorthGRIP) for drilling in central Greenland between 1996 and 2001 (Dahl-Jensen et al., 2002), an extensive grid was flown around the drilling site to map internal stratigraphic layering, which might threaten the continuity of the ice core chronology (Nixdorf and Göktas, 2001), and to connect the new site to the existing GRIP ice core (Dahl-Jensen et al., 1997). The data suggested that, at the time, a continuous ice core record reaching back to the Eemian period (129–116 ka BP) in the last interglacial could be expected. Moreover, AWI UWB radar data were used together with NASA's Operation IceBridge data to determine a suitable ice core drill site on Müller Ice Cap on Umingmat Nunaat (Axel Heiberg Island), in the Canadian Arctic (Fig. 9c) to retrieve an undisturbed Holocene climate record (Lilien et al., 2024).
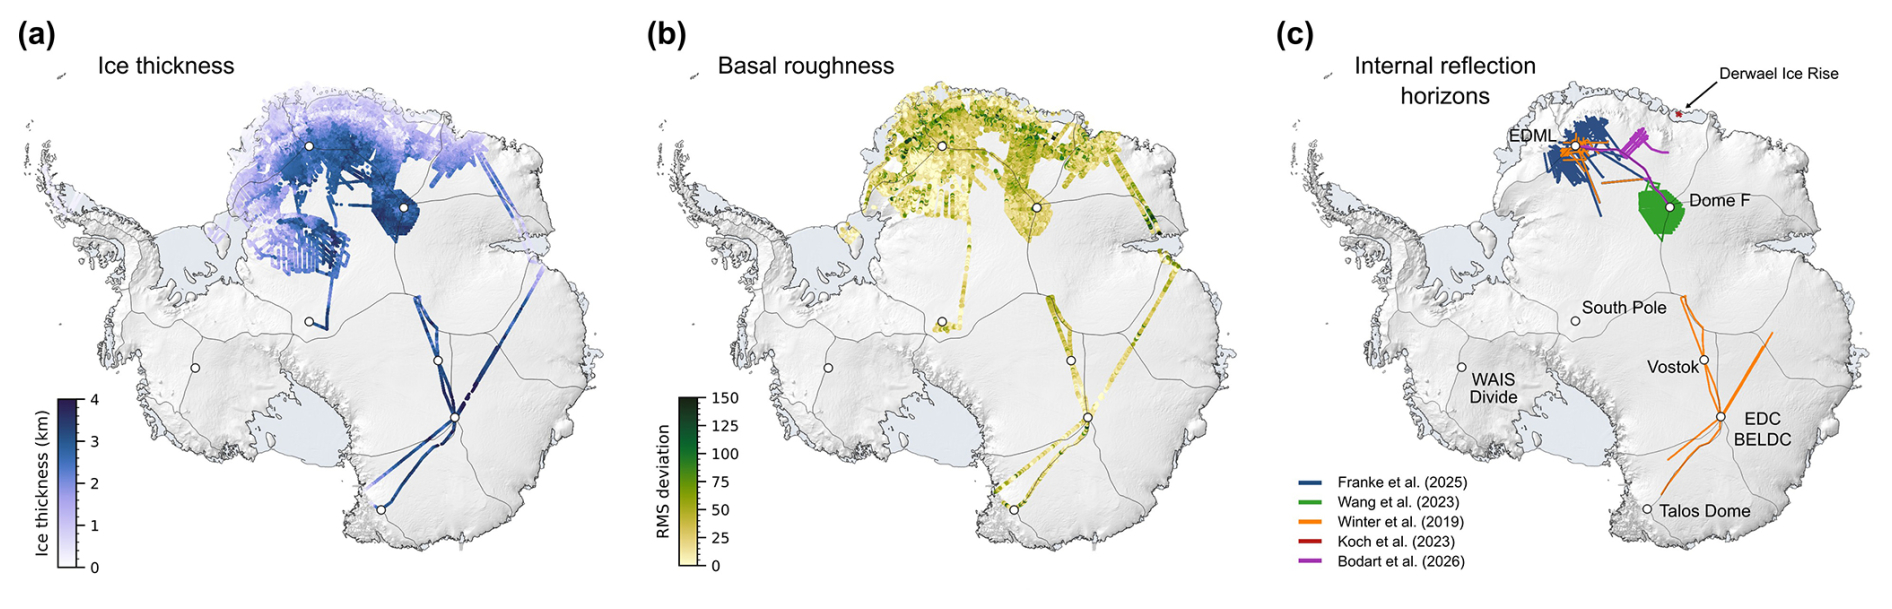
Figure 11Selection of results from AWI radar data over Antarctica: (a) Ice thickness (Steinhage et al., 2001; Frémand et al., 2023; Pritchard et al., 2025), (b) Basal roughness represented as RMS deviation (Eisen et al., 2020), (c) Internal Reflection Horizon (IRH) coverage from Franke et al. (2025b) (blue), Wang et al. (2023) (green), Winter et al. (2019) (orange), Koch et al. (2023) (red; at Derwael Ice Rise), and Bodart et al. (2026) (purple).
5.4 Age-depth distribution of the Antarctic and Greenland Ice sheets
Internal reflection horizons (IRHs) are crucial for understanding the age–depth structure of ice sheets and can often be precisely dated using ice cores. Prominent ice-sheet wide IRHs are typically caused by the deposits of global bipolar volcanic eruptions and can often be traced in radargrams across large areas of Antarctica and Greenland (Millar, 1981). However, a wide range of IRHs can also originate from local or non-bipolar volcanic eruptions. At several ice-core sites in Greenland (Hempel et al., 2000, at GRIP, Mojtabavi et al., 2022, at NorthGRIP, NEEM and EastGRIP) and Antarctica (Eisen et al., 2006; Franke et al., 2025b, at EDML and Winter et al., 2017, at EDC) electromagnetic forward modelling showed that many of the prominent IRHs in Antarctica and Greenland are linked to conductivity peaks in the ice. Consequently, IRHs are present and intercomparable in various radar data products available to the radioglaciology community (Winter et al., 2017; Franke et al., 2025b; Bodart et al., 2026). Moreover, IRHs represent consistent age markers, serving as archives of the historical development of the Antarctic and Greenland ice sheets. They are essential for reconstructing the mass balance at both the ice surface and base, as well as for understanding the deformation history of the ice, which is currently a major objective of the SCAR Action Group AntArchitecture (Bingham et al., 2025).
IRHs have been extensively traced and dated in AWI radar data across Dronning Maud Land and central East Antarctica (Steinhage et al., 2013; Winter et al., 2019; Wang et al., 2023; Franke et al., 2025b; Bodart et al., 2026, Fig. 11c). As part of the fourth International Polar Year AWI conducted the first Dome Connection flights to connect major ice domes in East Antarctica in 2007–2008 (Talos Dome–Dome Concordia–Vostok–Dome A; Winter et al., 2019). Moreover, IRHs were traced over coastal regions in eastern DML to investigate the dynamic imprints and histories of ice rises (e.g., Halfarryggen and Derwael Ice Rise; Drews et al., 2013; Koch et al., 2023; Ershadi et al., 2024; Henry et al., 2025b).
It has been demonstrated that some of the IRHs traced over large areas in radar data from Dronning Maud Land (Winter et al., 2019; Wang et al., 2023; Franke et al., 2025b) and Central East Antarctica (Winter et al., 2019) match to similar IRHs in both East and West Antarctica (Franke et al., 2025b). This represents a significant contribution to Antarctic-wide modelling approaches that use IRHs to calibrate their models (e.g., Sutter et al., 2021; Theofilopoulos and Born, 2023; Bodart et al., 2026) and to develop a three-dimensional, continent-wide age-depth architecture model (as for the Greenland Ice Sheet MacGregor et al., 2015, 2025), as pursued by the AntArchitecture initiative (Bingham et al., 2025).
Furthermore, AWI data have enabled IRHs to be extensively mapped in central and northeast Greenland (Nixdorf and Göktas, 2001; Franke et al., 2023a; Jansen et al., 2024, Fig. 13b) around the NorthGRIP ice core site and at the onset of the Northeast Greenland Ice Stream. When IRHs are mapped in closely-spaced survey grids, they can be used for constructing 3D surfaces of ice sheet structures (Bons et al., 2016; Franke et al., 2022a, 2023a; Jansen et al., 2024) providing crucial information on ice deformation.
Only a fraction of visible IRHs have been traced to date. The large archive of radar data over the polar ice sheets thus represents a considerable untapped opportunity for tracing IRHs using semi-automatic tracing methods as well as with the help of machine learning (Moqadam and Eisen, 2025; Moqadam et al., 2025).
5.5 Ice-sheet dynamics and stability
Besides exploring areas of the ice sheet that are dynamically stable with undisturbed internal stratigraphy, various AWI radar campaigns have focused on dynamic regions in Greenland and Antarctica, particularly with the aim to better understand ice-stream systems. From 2016 through 2022, surveys using the AWI UWB radar primarily targeted the onset region of NEGIS in the vicinity of the EastGRIP ice core drill site and the region of the 79° NG. The high-resolution radar data collected along and across the ice flow direction at NEGIS, as well as over its shear zones (Franke et al., 2022c), provided fundamental insights into the formation and temporal evolution of this ice stream (Jansen et al., 2024). The data help underscore the implausibility of the hypothesis linking the fast-flowing NEGIS to exceptional geothermal heat flux (Fahnestock et al., 2001; Smith-Johnsen et al., 2020; Bons et al., 2021; Zhang et al., 2025). Furthermore the data contributed towards a better understanding of the evolution of large scale folding (Zhang et al., 2024; Bons et al., 2025) with implications for ice stream dynamics in northeast Greenland during the Holocene (Franke et al., 2022a). Additionally, the AWI UWB operated in 2018 and 2022 near EastGRIP in swath mode, enabling a high-resolution reconstruction of bedrock topography at the NEGIS onset (Fig. 10; Carter et al., 2025a).
Callens et al. (2014) investigated the basal conditions of West Ragnhild Glacier in DML to characterize its ice flow regime using satellite remote sensing, AWI airborne radar data and ice sheet modelling. In coastal areas in eastern DML, AWI radar data collected over ice rises (Matsuoka et al., 2015; Koch et al., 2023) were used as ice dynamic proxies by interpreting the isochrone geometry beneath the local ice divides. Here, stratigraphic arches, referred to as Raymond Bumps (Raymond, 1983) are a metric for the stability of conditions at the ice-divide, which, in turn, is a proxy for the millenial timescale stability of the surrounding catchment. Examples of surveyed ice rises in Dronning Maud include Halvfarryggen (Drews et al., 2013), Derwael Ice Rise (Koch et al., 2023; Henry et al., 2025a, b), and Hammarryggen ice promontory (Ershadi et al., 2024).
Ice shelves, their interactions with the ocean, and their capacity to buttress tributary ice flows have also been investigated with radar data. This includes, for example, the role of smaller ice rumples which increase ice-shelf damage (Humbert and Steinhage, 2011), the use of highly resolved ice-shelf thickness maps to determine ocean-induced melt rates (Neckel et al., 2012), partitioning of the ice-shelf composition (Višnjević et al., 2022, 2025), and the imaging of subglacial water outlets near the grounding zone (Drews et al., 2017; Neckel et al., 2021; Zhou et al., 2025).
5.6 Ice-sheet and ice-shelf hydrology
Airborne radar data from AWI surveys have played a central role in advancing our understanding of ice sheet hydrology, from subglacial lakes beneath the Antarctic ice sheet (Livingstone et al., 2022; Goeller et al., 2016; Humbert et al., 2018) to englacial channels (Humbert et al., 2025) and surface melt features in Greenland. Since the early identification of bright, flat reflectors linked to subglacial lakes (Oswald and Robin, 1973), AWI radar systems have been instrumental in detecting both active and stable water bodies beneath ice sheets (Goeller et al., 2016; Humbert et al., 2018; Neckel et al., 2021). While surface elevation changes help identify actively filling or draining lakes (Neckel et al., 2021), stable subglacial lakes require radar confirmation using criteria such as high basal reflectivity, relative power contrasts, and echo specularity (Humbert et al., 2018). However, interpretation using these criteria is complicated by uncertain attenuation rates and the presence of basal ice with entrained water (Hills et al., 2024). Additional indicators, such as disrupted internal layering or slope changes in radar horizons, can further support subglacial lake identification (Gudlaugsson et al., 2016; Humbert et al., 2018).
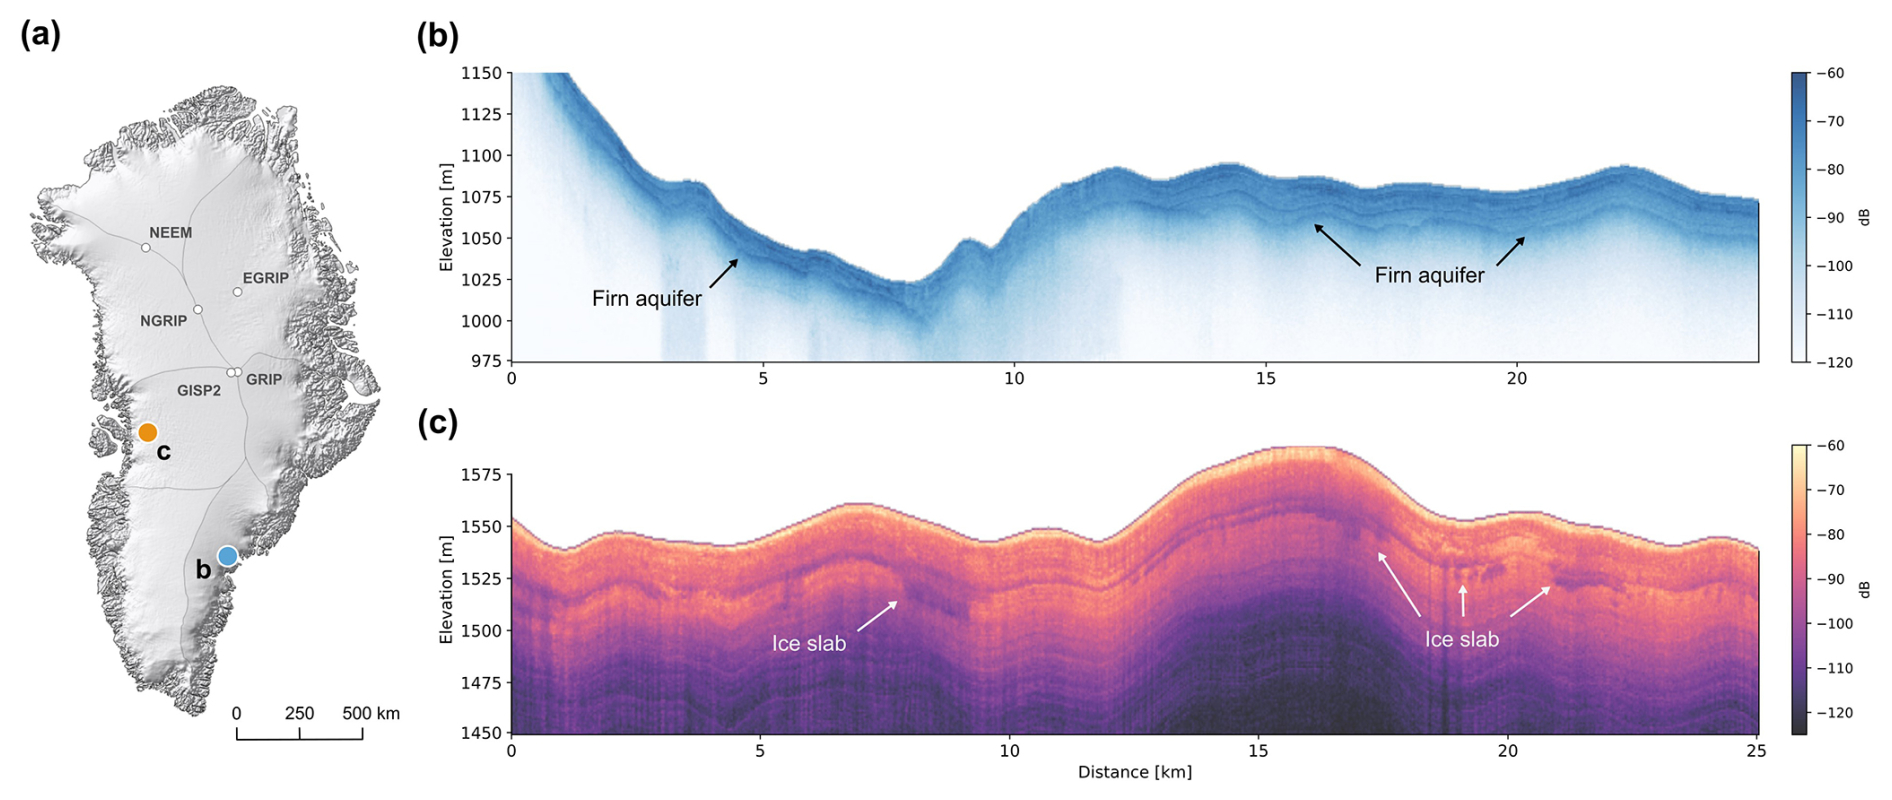
Figure 12Radar signatures of (b) englacial meltwater in firn (Profile ID: 20240821_01_010) and (c) refrozen ice slabs (Profile ID: 20240828_01_006). Both radar profiles were recorded with the UWB in a frequency range of 150–520 MHz during the ARK 2024 Greenland campaign. The locations of both radar profiles are indicated in (a).
In Greenland, AWI radar campaigns have contributed key insights into surface meltwater refreezing and firn saturation (Fig. 12). Increasing surface melt has led to the widespread formation of ice slabs – dense, refrozen layers (Culberg et al., 2021) within the firn that reduce permeability and enhance runoff (MacFerrin et al., 2019). During the 2024 Polarmonitor campaign, AWI used UWB radar in high resolution mode to image stratigraphic detail in these slabs (Fig. 12c). Tracking their expansion is critical for understanding changes in Greenland's water retention capacity and for benchmarking firn hydrology models. Moreover, firn aquifers act as long-term reservoirs of liquid water in southeastern Greenland's accumulation zone and were mapped using AWI radar data as areas showing strong firn-ice reflectors (Fig. 12b) and an absence of bed echoes due to signal attenuation due to the presence of water (Miège et al., 2016). Transects over regions like Køge Bugt demonstrated that detecting changes in aquifer extent is only possible through airborne radar, as these features are invisible in optical or surface elevation data.
In Antarctica, AWI radar data contributed to assess potential subglacial lake locations underneath the East Antarctic ice sheet (Goeller et al., 2016). Moreover, radar data in combination with remote sensing products and thermal modelling enabled the detection of (i) cascading subglacial water flow via filling and draining of subglacial lakes (Neckel et al., 2021) as well as (ii) freeze-on of subglacial water with entrained sediment (Franke et al., 2023b, 2024) at the onset of the Jutulstraumen Glacier.
AWI radar data also revealed the persistence of englacial channels (e.g. Zhou et al., 2025, near the grounding line (GL) of the Roi Baudouin Ice Shelf), as well as channels formed during supraglacial lake drainage at Greenland's 79° NG (Humbert et al., 2025). Here, a 21 km2 lake has repeatedly filled and drained over the past decade and repeated UWB surveys since 2016 revealed englacial features that remain detectable and mobile years after formation (Humbert et al., 2025). These observations offer rare insight into how long such drainage pathways remain open and how they interact with glacier motion. Additional radar observations have shown that lake ice in supraglacial lakes causes a pronounced thickness gradient, forming continuously at the upstream end as the glacier flows downstream (Schröder et al., 2020). This internal structure influences lake stability and drainage behavior, with implications for ice flow.
In addition, fractures and crevasses are important for both hydrology and ice mechanics and are well resolved in AWI radar data. Crack tips appear as hyperbolas in radargrams and can be analyzed to assess crevasse depth and geometry. Radar surveys have detected basal crevasses on the Ross Ice Shelf (Jezek et al., 1979) and surface fractures in Greenland (Forster et al., 2014; Thompson et al., 2020). These measurements have been used to estimate energy release and to identify fatigue cracks (Humbert et al., 2023a, b). Moreover, fractures linked to supraglacial lake drainage are clearly visible in radargrams, offering a new window into meltwater-induced fracturing processes (Humbert et al., 2025).
5.7 Mapping and understanding crustal and geological variability and evolution
AWI airborne radar data play an important role in a number of studies of large-scale geological variability and tectonic structure in Antarctica (e.g., Ruppel et al., 2018). Given that additional geophysical instruments, such as magnetometers and gravimeters, have been used less frequently in Greenland campaigns alongside radar systems (Figs. A3 and A4), this section will primarily focus on scientific findings from Antarctic campaigns. However, magnetic surveys were conducted in Greenland alongside AWI EMR measurements between 1997 and 2004 (e.g., Mayer et al., 1999), with data available in compilations such as the Greenland Magnetic Map (GREENMAG; Heincke et al., 2026).
Once adjusted for the loading effect of the ice sheet, which requires detailed analysis of coincident gravity anomaly data, the regional height of the upper rock surface can be related to variations in the thickness of the crust. In this way, Riedel et al. (2012) calculated considerable variability about a relatively thick mean crustal thickness in Dronning Maud Land, relating it to the amalgamation and later breakup of the supercontinent Gondwana by tectonic collisions and extension. They noted also that very thick (∼ 51 km) crust of the Wohlthat Massif appears to be subject to ongoing vertical isostatic motions in response to much more recent changes in the thickness of the East Antarctic ice sheet.
Radar-derived bed heights are essential for understanding and interpreting those components of the gravity anomaly signal that vary along with lithological variability, especially for calculating the Bouguer anomaly for certain areas. These calculations remove the gravity effects of density contrasts between rocks, ice, and air, showing the regional crustal thickness variability. Using this kind of approach, Riedel et al. (2012) identified long linear density contrasts that mark crustal suture zones: the lines of long-vanished oceans that were destroyed during the incorporation of what is now Antarctica into Gondwana, as well the lower density fill of Jurassic-aged extensional basins close to the coast.
Eagles et al. (2018) and Franke et al. (2021a) used radar-derived depths to the glacial bed to map networks of V-shaped valleys that they interpreted as evidence for the presence of ancient preserved fluvial landscapes in the deep interior of DML. Eagles et al. (2018) noted that some of the valleys appear to have been cut by erosion that was focused onto ancient tectonic structures. They considered the geological system's various roles in the history of sediment routing to the floor of the deep Southern Ocean, and in the long-term topographic evolution of Dronning Maud Land, in particular its seaward-facing great escarpment.
Radar data also play an important role in the interpretation of magnetic field anomaly variability (Mieth et al., 2014; Ruppel et al., 2018). The depth of the magnetic sources can be roughly estimated on its wavelength spectrum or more simply by comparative lineament analyses. Sources that lie deeper than the radar bed depth imply the presence of intervening layers of sedimentary rocks, whose magnetic susceptibilities tend to be small. In this way, Paxman et al. (2019) reported on the presence of a major, probably Jurassic-aged, sedimentary basin between the South Pole and Pensacola mountains. Nogi et al. (2013) and Guy et al. (2024) elaborated on the structure of the crustal suture zones around Lützow-Holm Bay and further south in DML, some of which were recognized earlier by Riedel et al. (2012) and Ruppel et al. (2018). Here, Guy et al. (2024) conclude that it comprises fragments both of billion year-old volcanic island arcs and at least one much older continental fragment. The remnants of the ancient volcanic system today cover an area ∼ 600 km wide and nearly 1500 km long, meaning that whilst active it may have been a feature comparable to today's Antarctic Peninsula (Ruppel et al., 2018).
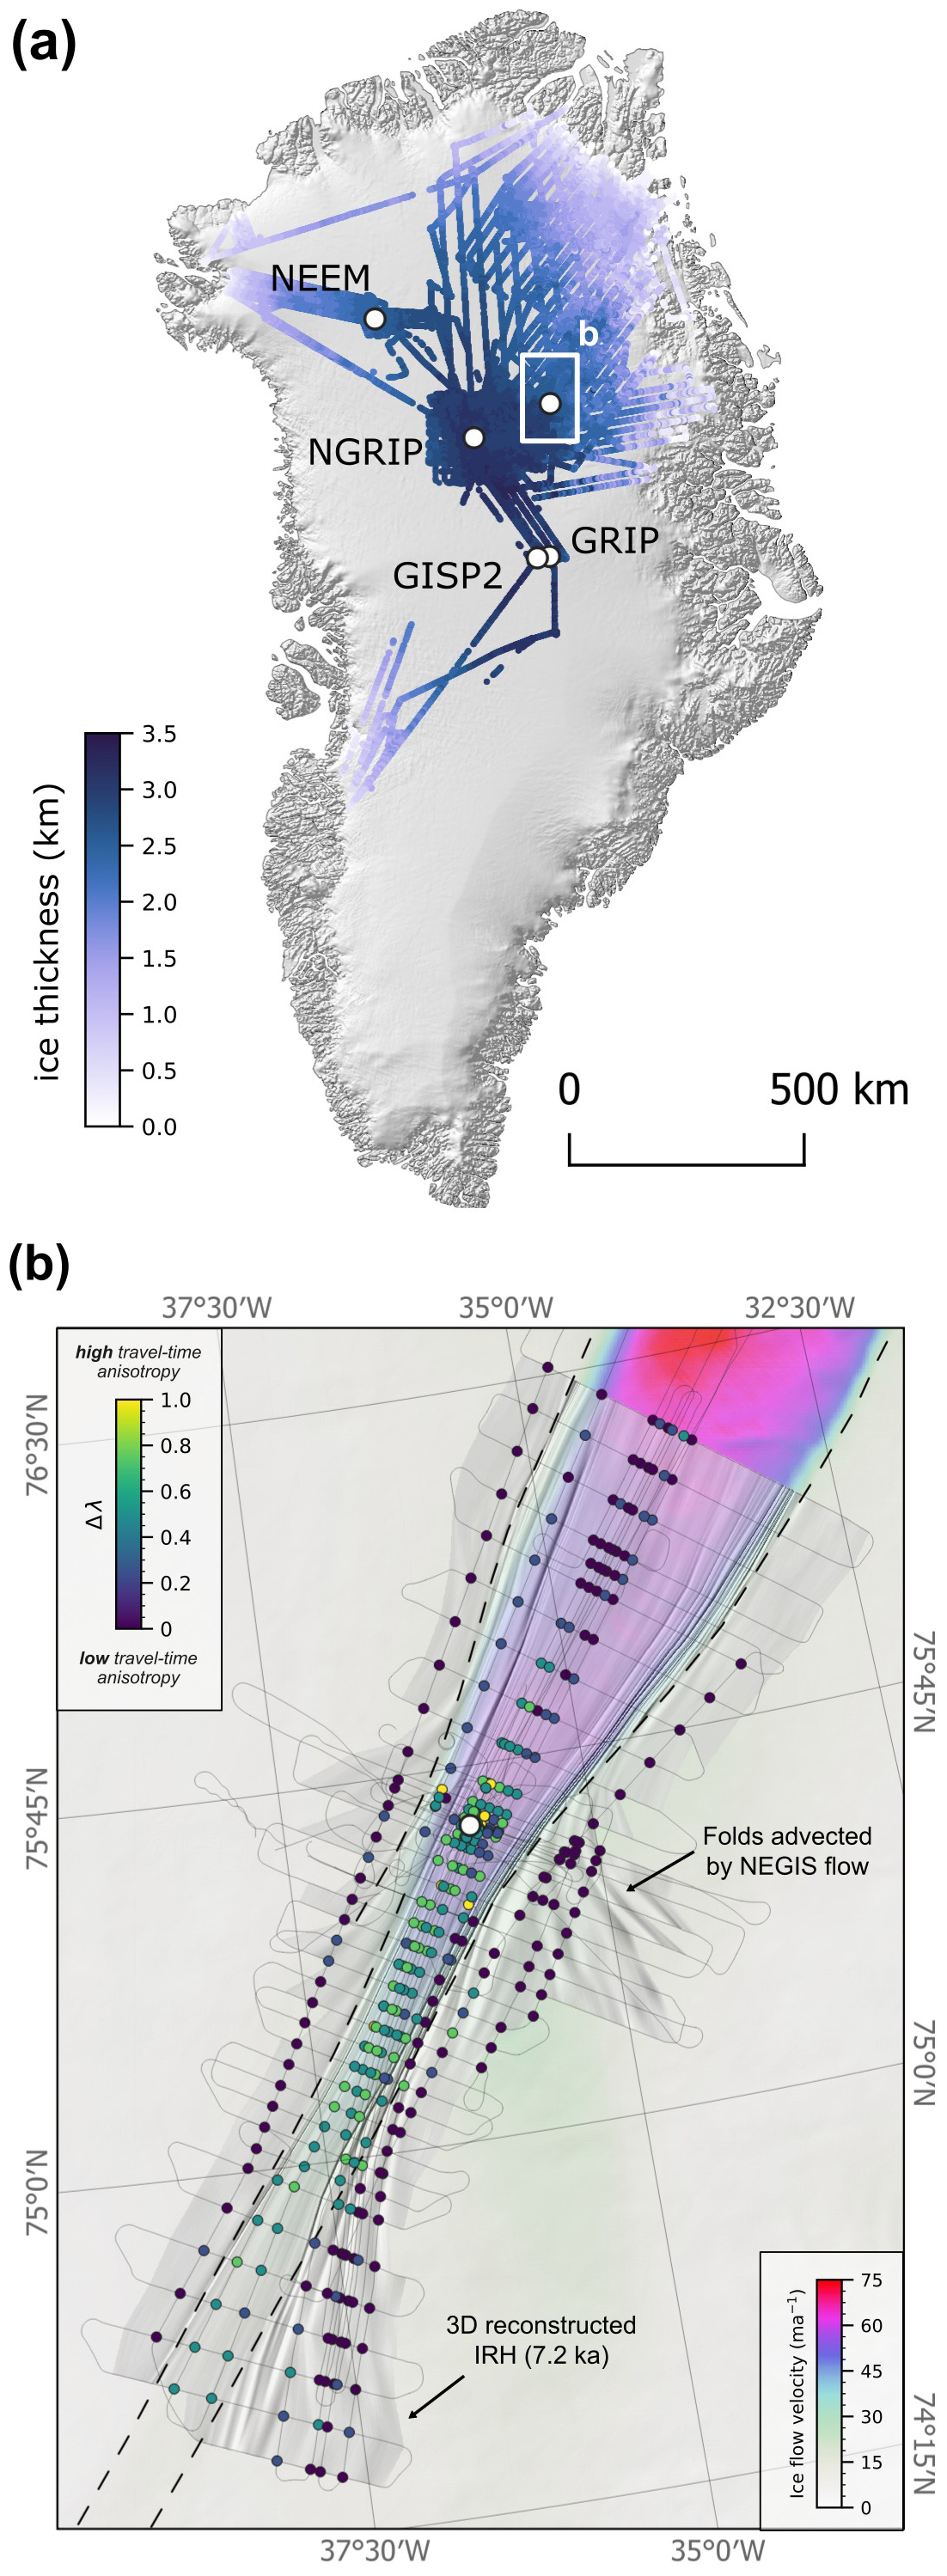
Figure 13Selection of results from AWI radar data over Greenland: (a) Ice thickness. (b) Zoom on the onset region of the Northeast Greenland Ice Stream (NEGIS) centred at the location of the EastGRIP ice core. The background is ice flow velocity (Joughin et al., 2018) overlain by a hillshaded version of the 7.2 ka IRH depth from Jansen et al. (2024). The colored dots represent the depth-averaged difference in horizontal eigenvalues (Δ λ) of the ice crystal orientation fabric derived from an analysis of travel-time differences of crossing radar profiles (Gerber et al., 2023). The fine black lines represent the radar profiles of the EGRIP-NOR-2018 survey (Franke et al., 2022c), and the approximate location of the shear margins is indicated with a dashed line.
5.8 Ice shelf bathymetry and stability
AWI airborne radar data have been crucial in enhancing our understanding of subglacial and bathymetric features beneath Antarctic ice shelves. Across multiple studies, these data have been employed to infer bathymetric models, assess ice shelf stability, and explore the dynamics of ice–ocean interactions.
Lambrecht et al. (1999) used AWI EMR radar data from the ANT 1994/95 season to investigate the mass-balance conditions in the southeastern Ronne Ice Shelf (RIS). Moreover, the radar data contributed to a comprehensive data set of ice thickness of the entire Filchner–Ronne Ice Shelf, with specific focus on grounding lines (e.g., of Foundation Ice Stream; Lambrecht et al., 1997) and marine ice (Lambrecht et al., 2007).
Eisermann et al. (2020, 2021) utilized radar data in coastal Dronning Maud Land to model subglacial topography beneath the Ekström, Atka, Jelbart, Fimbul, Vigrid, Borchgrevink and Roi Baudouin ice shelves. By integrating ice-shelf thickness derived from radar data with seismic, gravity, and multibeam bathymetric references, the studies revealed key topographic features such as deep troughs and sills that regulate the entry of Warm Deep Water into the cavities beneath ice shelves. These findings underscore the role of bathymetric features in modulating basal melting and shielding even small ice shelves from oceanic heat. Variations in warm water access between different ice shelves highlights the spatial variability of ice–ocean interactions, thereby providing insights into potential impacts of climate-driven changes in water temperature and circulation (e.g., Noble et al., 2020; Jourdain et al., 2022). Moreover, the refinement of the regional bathymetry over the Nivl and Lazarev ice shelves emphasizes the protective role of bathymetric ridges (Eisermann et al., 2024) and are important constraints for glaciological and oceanographic models.
These data also helped to determine subglacial water flow at the grounding line, estimating basal melting rates, and assess ice shelf morphology and stability (Drews et al., 2017, 2020; Višnjević et al., 2022, 2025; Henry et al., 2025a, b). On the Fimbul and Jelbart Ice Shelf, AWI radar data helped to constrain the dynamic ice shelf evolution based on their surface and basal structure (Humbert and Steinhage, 2011; Humbert et al., 2015). Moreover, radar-derived ice shelf and ice rise thickness measurements were key to determine the basal mass balance of Ekströmisen (Neckel et al., 2012) and the evolution of its drainage basin over the last 40 000 years (Schannwell et al., 2020).
In Greenland, the disintegration of the largest floating ice tongue at the 79° N Glacier in Northeast Greenland (Humbert et al., 2023b) was studied in greater detail. Using AWI airborne radar data, it was possible to determine significant temporal changes in the geometry of the ice shelf (Zeising et al., 2024) as well as the influencing factors and basal melt rates using an oceanographic plume model (Mohammadi-Aragh et al., 2025).
5.9 Mass balance
AWI's radar systems were used to analyze surface mass balance (SMB) and snow accumulation rates in different glaciological contexts. Accumulation distribution was mapped on Pine Island Glacier in West Antarctica with the ASIRAS system, demonstrating identification of annual resolution from IRHs on a regional scale (Kowalewski et al., 2021). The integration of these radar-derived layers with ground-based neutron probe measurements facilitated precise dating and density profiling, covering over 2300 km, eventually resulting in SMB estimates. The results highlighted SMB distribution trends, such as the pronounced orographic precipitation shadow effects in specific regions, and provided critical inputs for modelling total mass input to the basin without evidence of a long-term trend in accumulation rates (Kowalewski et al., 2021).
Similarly, in Greenland, AWI's use of the ASIRAS provided high-resolution measurements of winter snow accumulation rates in the percolation zone (Helm et al., 2007). By detecting subsurface reflection horizons corresponding to previous summer melt surfaces, ASIRAS captured spatial variability influenced by topographic undulations and snow redistribution by winds. This method offered accumulation estimates comparable to field measurements and demonstrated the potential for extended regional and temporal monitoring of accumulation rates (Helm et al., 2007) similar to the usage of ground-based radar systems in Greenland (Steinhage et al., 2005; Karlsson et al., 2020).
Most studies that focused on SMB reconstruction in DML used the radar stratigraphy from shallow ground-penetrating radar surveys (Rotschky et al., 2004; Anschütz et al., 2006, 2008) in combination with data from firn cores. However, with its capability to resolve near-surface IRHs when operated in wideband mode (Figs. 4e and 5b), the AWI UWB radar supports SMB reconstructions over wider areas (Zuhr et al., 2026) and in combination with deep-sounding surveys (Fig. 6d).
At the onset of the Jutulstraumen Glacier in western Dronning Maud Land, the UWB radar was used to investigate basal reflection units that likely result from the refreezing of basal meltwater originating from further upstream. These units contribute to a positive contribution of basal mass balance in this area (Franke et al., 2024).
5.10 Ice-flow Modelling
AWI radar data have significantly advanced ice sheet modelling by providing detailed insights into the internal structure and dynamics of ice sheets. A key application has been to identify potential drill sites for retrieving the oldest ice in Antarctica. By combining radar derived isochrone stratigraphy with 1D to 3D thermo-mechanical ice flow models, Wang et al. (2023) were able to refine the age-depth scales and basal thermal conditions in the Dome Fuji region. In combination with ground-based radar data, Chung et al. (2023) revealed spatial variability in basal melt rates and areas with stagnant ice, helping to constrain models of basal thermal states and accumulation rates (e.g., Karlsson et al., 2018).
Radar-derived IRHs also play a critical role in calibrating ice-sheet models in both ice sheets (Gerber et al., 2021; Sutter et al., 2021; Višnjević et al., 2022, 2025). IRHs provide 3D observational constraints that highlight discrepancies in surface mass balance, basal drag parameterizations and flow dynamics. By validating models with observed internal stratigraphy, it can be demonstrated how localized variations in e.g., geothermal heat flux, subglacial topography, and surface mass balance affect long-term ice-sheet evolution (Sutter et al., 2021; Bodart et al., 2026). Moreover, models were used to predict the age stratigraphy of locally accumulated ice on the Roi Baudouin ice shelf for a given set of oceanic and atmospheric boundary conditions (Višnjević et al., 2022, 2025).
At the onset of NEGIS, Gerber et al. (2021) utilized isochrones traced from AWI radar data to constrain a two-dimensional ice flow model, revealing that upstream flow introduces climatic biases in ice cores due to advection of snow deposited under different conditions. By modelling backward particle trajectories, they determined source locations and past accumulation rates, highlighting the significant roles of basal melting and sliding in NEGIS dynamics. Based on the englacial folds at NEGIS (Jansen et al., 2024), Zhang et al. (2024) modeled the effect of ice anisotropy and density variations on fold amplification into large‐scale folds during flow. Moreover, Gerber et al. (2023) used radar data and ice-flow modelling to infer the influence of the mechanical anisotropy of NEGIS (further details in Sect. 5.11).
AWI's radar-derived ice thickness data alone were widely used for ice sheet modelling efforts (Humbert et al., 2010; Kleiner and Humbert, 2014; Morlighem et al., 2017, 2020; Rückamp et al., 2019a, b, 2020; Schannwell et al., 2019, 2020; Mohammadi-Aragh et al., 2025). While many modelling studies require accurate geometries and hence ice thickness data over larger domains, up to the continental-scale, other modelling approaches are benefiting substantially from ice thickness profiles along glacier streamlines. Modelling shows that precise overflight of a streamline is important for the accuracy of the results. Along-flow modelling approaches require bedrock topography data along the precise streamline of the glacier for two reasons: (i) the influence of the roughness and small scale topography on sliding needs to be represented well and/or (ii) the gravitational load has to be realistic. This may not be given in gridded, interpolated datasets from which a transect is extracted (see e.g., Humbert et al., 2015; Christmann et al., 2021; Bodart et al., 2026).
AWI radar data have been instrumental in constraining ice material behavior and evaluating glacier dynamics. For both an Antarctic ice shelf and a grounded-floating transition zone (Humbert et al., 2015; Christmann et al., 2021), radar transects aligned with flowlines were combined with surface elevation or in-situ motion data. This setup allowed simulations to test different constitutive relations under controlled conditions, excluding lateral effects.
In model validation efforts, AWI radar-derived ice geometry was used to assess the adequacy of the Blatter-Pattyn higher-order approximation compared to full-Stokes simulations (Rückamp et al., 2022). Results showed that when model resolution is coarser than a certain fraction of ice thickness, complex physics offers no advantage, underscoring the need for dense geometry data. The study also emphasized that reliable conclusions can only be drawn when ice thickness is accurately resolved, as shown by contrasting simulations of two adjacent outlet glaciers, only one of which had dense radar profile coverage.
At Greenland's 79° NG, AWI radar data enabled high-resolution viscoelastic modelling of tidal forcing, basal lubrication, and elastic deformation (Christmann et al., 2021). The study revealed how variations in bed topography influence basal sliding and stress transmission kilometres upstream of the grounding line – demonstrating the critical role of elastic processes and the value of high-resolution radar-derived geometry for capturing short-term glacier dynamics.
5.11 Ice crystal fabric
The orientation of crystal lattice axes in ice grains, referred to as the COF, significantly affects both the propagation of electromagnetic waves through ice and the mechanical properties of ice. This anisotropy affects the mechanical properties of ice but also influences the propagation of radar waves and is, thus, a key focus in the analysis of AWI radar data. In Dronning Maud Land in East Antarctica, radar data combined with the EDML ice core were used to investigate the effect of COF variations on radar wave propagation (Drews et al., 2012). Studies showed that changes in COF, observed at different depths, corresponded to consistent radar reflections (Eisen et al., 2007). These observations also helped explore the origin of the so-called echo-free zone discussing the role of COF (Drews et al., 2009).
In Northeast Greenland at the onset of NEGIS, UWB radar measurements in 2018 (Franke et al., 2022c) were pivotal in improving our understanding of how COF around the EGRIP drill site (Westhoff et al., 2021; Stoll et al., 2025) impacts the ice stream's mechanical anisotropy (Gerber et al., 2023), influencing the directional flow and deformation properties of the ice (Fig. 13b). Travel time delays of internal reflection horizons from intersecting radar profiles and the radar beat signatures revealed the effect of COF anisotropy on the ice's hardness during deformation (Gerber et al., 2023). The study further suggests that compared to isotropic ice, certain parts of the ice stream are significantly harder for along-flow extension and compression, while the shear margins could be softened for horizontal-shear deformation by a factor of two. Subsequent analysis of the characteristic wavelength of folds in cloudy bands of the EGRIP ice core in the cm-scale and folds in radargrams in the km-scale confirms the strong mechanical anisotropy of ice due to the lattice preferred orientation at NEGIS (Bons et al., 2025).
The data quality of AWI's airborne radar systems reflects both the technological evolution of the instruments and the environmental challenges inherent in surveys over polar ice sheets. Over the past three decades, AWI has maintained a high standard of data integrity across its six radar systems, though variations exist due to system-specific characteristics, hardware improvements, and operational conditions. Generally, the datasets are robust and well-suited for scientific analysis, with only isolated profiles occasionally affected by technical issues or electromagnetic noise.
The EMR system, which has undergone continuous development since 1994, exhibits some variability in data quality. For example, defects in hardware components led to a degradation in data quality for the EMR system, particularly during the ANT 2012/13 season and partly during the ANT 2013/14 season. In occasional cases, EMR profiles may contain a mix of results from the short-pulse and long-pulse product.
The ACCU and SNOW systems occasionally show horizontal stripes or aliasing effects, particularly impacting the visibility of internal reflection horizons in regions with low accumulation rates. In several seasons, particularly from 2015 onward, persistent horizontal stripes affect parts of the radargrams in ACCU data. Additionally, radargrams occasionally exhibit aliasing effects when signals fall outside the range gate, resulting in horizontally flipped sections.
The UWB and UWBM systems, representing the latest generation of AWI's radar systems, consistently deliver the highest data quality, with exceptional resolution and minimal noise. The UWB system, in particular, has demonstrated reliable performance in both deep and shallow sounding modes, enabling detailed imaging of englacial and subglacial features. Only some profiles from the ANT 2016/17 season in the 24-channel configuration and ARK 2016 season were acquired for testing purposes and may be of reduced quality. The UWBM system, while limited to a smaller number of flights over grounded ice, provides ultra-high-resolution data, though it is occasionally affected by coherent noise due to its GHz frequency range. The ASIRAS system, primarily used for near-surface studies, generally offers excellent data quality, though some profiles may suffer from poor signal-to-noise ratios or coherent noise interference.
The AWI radar data are publicly available and can be accessed as follows: (1) The inventory of the radar data archive and the location of radar profiles in Antarctica and the Arctic can be viewed via the Radar Data Viewer over Polar Ice Sheets in the Marine Data Portal (https://marine-data.de/viewers/, last access: 19 April 2026). (2) The radar data files are archived and accessible via PANGAEA (Felden et al., 2023; Eisen et al., 2024, https://doi.org/10.1594/PANGAEA.972094). Radar data from future campaigns will be continuously added to both the Radar Data Viewer and PANGAEA. A sample Python Jupyter Notebook with code for loading and plotting AWI radar NetCDF files is available as supplementary material to this article.
7.1 Marine Data Portal (Viewer and Metadata)
7.1.1 General Features and Capabilities
AWI's radar data are visualized in the Radar Data over Polar Ice Sheets viewer of the Marine Data Portal (https://marine-data.de/viewers, last access: 19 April 2026) through an interactive web map that allows users to explore and access the data. The Radar Data Viewer is modeled after existing online portals that visualize radar data in polar regions, such as the Polar Airborne Geophysics Data Portal (https://www.bas.ac.uk/project/nagdp/, last access: 19 April 2026) of the British Antarctic Survey (BAS; Frémand et al., 2022) or the Open Polar Server GeoPortal (https://ops.cresis.ku.edu/, last access: 19 April 2026) of the Center for Remote Sensing and Integrated Systems (CReSIS) at the University of Kansas. The Marine Data Portal is a brand of the Earth Data Portal (Heß et al., 2023) with a focus on content from the marine community and is coordinated by the German Marine Research Alliance (Deutsche Allianz Meeresforschung). Using an interoperable Web Map Service (WMS) hosted by the Observations to Archives and Analysis (O2A) Spatial Data Infrastructure (SDI) (Konopatzky et al., 2023), the map displays the locations of AWI radar profiles, categorized by radar system, and includes profiles from CReSIS and BAS to provide context with data from other institutes and different background maps. The external profiles from BAS and CReSIS are not available for download directly from our data portal but help to create a comprehensive overview of radar data in the Arctic and Antarctic.
7.1.2 Radar Profiles, Metadata and Radargram Visualization
Users can filter displayed profiles by data acquisition period and radar system using the left-side panel (Fig. A3). The bottom panel enables toggling between different base layers, and a globe icon allows switching between a global perspective and polar stereographic projections for the Arctic (EPSG 3413) and Antarctica (EPSG 3031).
Selecting a radar profile segment opens a popup window with selected metadata such as the radar system, campaign name, principal investigator (PI), project name, and the profile ID. The “show more” option in the popup opens a side panel on the right (Fig. A4), which provides detailed metadata, a quicklook radargram of the selected radar profile and DOI link for downloading the dataset from PANGAEA. Quicklooks can be enlarged by selecting them, and all quicklooks from a radar campaign can be viewed using the “View Gallery” option.
For UWB and UWBM systems, quicklooks are shown in decibels (dB), while EMR, ACCU, SNOW, and ASIRAS systems are displayed in automatic gain control (AGC) mode. EMR, ACCU and SNOW profiles can be several hundreds of kilometres long. The quicklooks in the radar viewer are thus subdivided into 100 km-long segments. The data for download are however provided in the full profile length. Picks for the surface and, where available, base reflections are included. If a profile selection on the map is ambiguous, multiple matching profiles are shown, which users can browse using the “next” and “previous” buttons.
7.1.3 Background Maps and Auxiliary Data
To place the radar data in a glaciological context, we provide background maps of subglacial bed topography and ice surface flow velocities for both Antarctica and Greenland. In the Radar Viewer, the Antarctic background layers currently include the Bedmap3 bed topography (Pritchard et al., 2025) and MEaSUREs ice flow velocity data (Rignot et al., 2017). Additionally, the Landsat Image Mosaic of Antarctica (LIMA; Bindschadler et al., 2008) can be selected as a background map. For Greenland, users can choose the BedMachine bed topography (Morlighem et al., 2017) and the MEaSUREs Multi-year Greenland Ice Sheet Velocity Mosaic (Joughin et al., 2018) as background maps.
7.2 PANGAEA (Archive and Download)
AWI's radar data products are published in PANGAEA and are directly available for download. The data are organized by campaign or season as consolidated entries, with datasets linked to official AWI campaign and flight numbers (events), sensor types, and general geographic locations. The dataset titles include fixed terms indicating the Arctic or Antarctic season (e.g., ARK 1998 or ANT 2018/19), the radar system used (e.g., radar data for the EMR system, ultra-wideband (microwave) radar data for the UWB(M) systems, accumulation radar data for the ACCU system, and snow radar data for the SNOW system), as well as the survey region. Searchable keywords cover specific radar systems (e.g., AWI EMR, AWI UWB, AWI UWBM, AWI ACCU, AWI SNOW, ASIRAS), geographic locations, and ice core sites if profiles are near an ice core.
The DOIs for the datasets can be found via (1) the Marine Data Portal, (2) through the “Collection of datasets from AWI's radar systems on ice sheets and glaciers” (Eisen et al., 2024), or (3) by using relevant keywords in PANGAEA's search interface (e.g., https://www.pangaea.de/, last access: 19 April 2026, to search for “AWI EMR” related datasets). Data downloads are facilitated through the “View dataset as HTML” option, which allows users to download individual files or the complete dataset as a compressed ZIP archive or an uncompressed TAR archive (Fig. A5). Related data publications, such as those on ice thickness, bed topography, internal reflection horizons, and basal roughness, are also listed. All data sets and also complementary data sets from expeditions with AWI's polar aircraft and are available via PANGAEA's Expedition Portal (https://www.PANGAEA.de/expeditions/, last access: 19 April 2026 – see links below “Aircrafts” for a comprehensive campaign list and links to campaign data).
The radar products are available in NetCDF format. For a description of the variables in the NetCDF files, we refer readers to the description in the respective PANGAEA entries and to Table A5. In addition to the primary data matrix, supplementary information is included such as the two-way travel time (TWT) to the ice surface and, where available, the ice base reflection along with metadata like sensor height above ground, along-track distance, and more. KML files for radar profile locations and quicklook images are also provided.
For the EMR, ACCU, SNOW, and ASIRAS systems, one data product is provided. For the UWB and UWBM systems, multiple products are available. UWB data include an unfocused (qlook) and a SAR-focused (standard) product. If the UWB system operated in polarimetric mode (e.g., during the ARK 2022 season at the NEGIS onset), data for all four polarizations (VV, VH, HH, HV) are provided. Similarly, the UWBM datasets include products for all four polarizations.
7.3 Data usage requirements
AWI radar data can be freely used, but only for scientific purposes under a CC-BY-NC license. Any other use must be requested and explicitly approved by the radar data administrators. A requirement for publishing with AWI radar data is to cite the corresponding dataset, available on PANGAEA, this paper, and, if available, a relevant original scientific publication. We also recommend acknowledging the AWI grant IDs associated with the specific campaigns used, as noted in the respective PANGAEA entries. All publications associated with the datasets are linked to the individual PANGAEA datasets. For datasets that do not yet have a PANGAEA entry (e.g., those that are relatively new or under embargo), but are visible in the Radar Viewer, the overarching PANGAEA entry for the collection is referenced (Eisen et al., 2024). For those cases, and for all other issues, the Principal Investigators of the respective campaigns should be contacted directly.
An example of how to reference AWI radar data in a Data Availability statement could be: “AWI's airborne radar data quicklooks and accompanying metadata are available in the Radar Data over Polar Ice Sheets viewer of the Marine Data Portal (https://marine-data.de/viewer/; Franke et al., 2026 [this paper]). Processed radar data products are available on PANGAEA (https://doi.org/10.1594/PANGAEA.972094; Eisen et al., 2024). The radar data from the [Campaign Acronym] campaign can be downloaded here: [PANGAEA DOI] ([PANGAEA Citation])”.
An example of how to acknowledge AWI radar data could be: “We acknowledge support from the AWI [Campaign or Project Acronym] radar campaign via the AWI funding grant AWI_PA_XXXXX”. Ultimately, any other format is acceptable as long as the overarching references mentioned above, the specific campaign reference and funding statements are included.
With the ongoing advancement of radar applicability, in particular higher spatial resolution with radar swath imaging (Holschuh et al., 2026a, b), polarimetry (Hills et al., 2025) and repeat surveys, future survey with AWI's airborne radar system will include newer approaches, but also continue to be deployed for conventional applications. Given the scientific objectives of changing mass balance, high vertical resolution imaging of firn structure for mass balance and hydrology studies will be one major priority, in particular in Greenland in the period towards the 5th International Polar Year (2032–2033). In Antarctica, the determination of basal topography in high spatial resolution (i.e. radar swath imaging for ice thicknesses and geomorphology) in the interior as well as near grounding lines (Matsuoka et al., 2025) will continue as well as the mapping of internal layers to obtain continuous stratigraphy for age–depth reconstruction (Bingham et al., 2025), determining spatio-temporal variation of accumulation (Zuhr et al., 2026) or paleo-dynamics of fast-flowing regions (Jansen et al., 2024).
Repeat mapping of englacial stratigraphy to infer vertical displacement (comparable to the application of pRES) and ultimately the profile shape of the vertical velocity will be a focus in various ice-dynamic settings, ranging from domes to fast-flowing ice streams like NEGIS. In addition, the investigation of anomalous parts of the ice sheet (e.g. in the basal unit; Franke et al., 2024; Young et al., 2025), englacial features (e.g. meltwater drainage channels; Humbert et al., 2025) and mapping of ice sheet anisotropy (Gerber et al., 2023; Hills et al., 2025; Zeising et al., 2025) will be considered in various surveys.
AWI's radar data viewer provides access to a live data archive that is continuously supplemented and expanded. In future steps, the addition of important high-level products derived from the radar data is planned, for example, revised bed reflections and ice thicknesses. Furthermore, the integration and publication of additional data from other acquisition systems collected in parallel to radar data collection is being pursued, such as laser scanner, gravimetric and magnetic measurements (Tables A3 and A4). AWI's Antarctic magnetic data are available in the ADMAP (A Digital Magnetic Anomaly Map of the Antarctic) compilation (Golynsky et al., 2018) and similar compilations exist for Greenland (e.g., the Greenland Magnetic Map; GREENMAG; Heincke et al., 2026). Moreover, it is anticipated to incorporate airborne laser scanner data to derive surface topography and reflectivity, as well as orthophotos from various nadir-looking optical camera systems like the Modular Airborne Camera System (MACS; Neckel et al., 2023). These will provide valuable insights into snow and ice surface characteristics, which help in better analyzing radar reflections. Examples include surface crevasses, supraglacial lakes, and topographic surface roughness.
Over the past 30 years, since 1994, AWI has conducted more than 40 seasons of scientific airborne radar campaigns in Antarctica and Greenland collecting more than one million profile-km of radar data. Six different radar systems have been utilized with capabilities meeting a range of demands in the fields of ice thickness sounding and high-resolution imaging of englacial layers. The AWI radar systems cover a wide range of penetration depths, reaching down to 4 km with the EMR and UWB systems (with range resolutions between 0.35–50 m), and high-resolution shallow-sounding radars, such as the Accumulation Radar (ACCU), Snow Radar (SNOW), and UWBM, with provide range resolutions between 1–50 cm.
In Antarctica, the radar surveys have primarily focused on East Antarctica's Dronning Maud Land and the central East Antarctic region. In Greenland, AWI radar surveys predominantly cover the northern and northeastern areas, with numerous surveys also conducted in southwest Greenland. The platforms used to operate the radar systems are AWI's Polar aircraft Polar 2, 5, and 6. These aircraft have been equipped with wheels and skis, allowing them to operate flexibly on ice sheets.
The initial scientific objectives in Antarctica and Greenland primarily focused on determining ice thickness and conducting reconnaissance surveys for the EDML drilling site (Antarctica) and e.g., NorthGRIP (Greenland). At present, however, research questions now span all subdiciplines of glaciology and polar geology, including ice thickness determination, basal properties of ice sheets, internal stratigraphic architecture, ice dynamics, crustal properties and their evolution, ice shelf characteristics and stability, as well as the underlying bathymetry, surface and basal mass balance, ice-sheet modelling, and the analysis of ice crystal fabric and its effects on ice flow.
AWI's radar data are publicly available and adhere to a common data standard, simplifying public access, use, and analysis. Through the Radar Data over Polar Ice Sheets viewer of the Marine Data Portal, all radar surveys can be viewed on an interactive online map with quicklook radargrams, and the data can be downloaded from the PANGAEA Data Publisher. The radar data are provided in a FAIR-compliant data format (e.g., NetCDF files) along with the profile locations and include relevant supplementary information, such as ice surface reflection, flight altitude, and bed reflection (if available).
AWI radar data in Antarctica primarily cover Dronning Maud Land, parts of central East Antarctica, and small sections of West Antarctica (Fig. 8). Detailed information about individual campaigns for each Antarctic season, including their coverage, campaign names, survey regions, platforms, radar systems used, and flown survey kilometres, is provided in Fig. A1 and Table A1.
In general, the data show that the EMR system was exclusively used until 2011. Between 2012 and 2017, this was supplemented by flights using the Accumulation Radar (ACCU) and Snow Radar (SNOW). Since 2018, surveys have predominantly been conducted with newer systems such as UWB and UWBM. It is important to note that the ASIRAS system is not included in the campaign-wise overview, as it was mostly used in collaborations with other institutes. Only in a few exceptional cases was the ASIRAS system mounted on one of AWI's Polar aircraft.
AWI radar surveys in the Arctic have been almost exclusively focused on Greenland, with one exception in 2023, when flights were conducted over the Canadian Müller Ice Cap (Fig. A2 and Table A2). Between 1996 and 2012, surveys primarily targeted northern central Greenland and were carried out using the EMR and ACCU systems. Moreover, in this publication we exclude survey flights over Arctic sea ice.
Since 2013, surveys have shifted to near-coastal regions, particularly in the northeast, but also in the northwest and southwest. In 2018 and 2022, two extensive surveys concentrated on the onset region of NEGIS around the EastGRIP ice core drill site, using the UWB system. Additionally, in 2018, the UWBM system was deployed upstream of the 79° NG. It is important to note that the ASIRAS system is not included in the campaign-wise overview, as in the Arctic the system was mainly flown by The Technical University of Denmark (DTU).
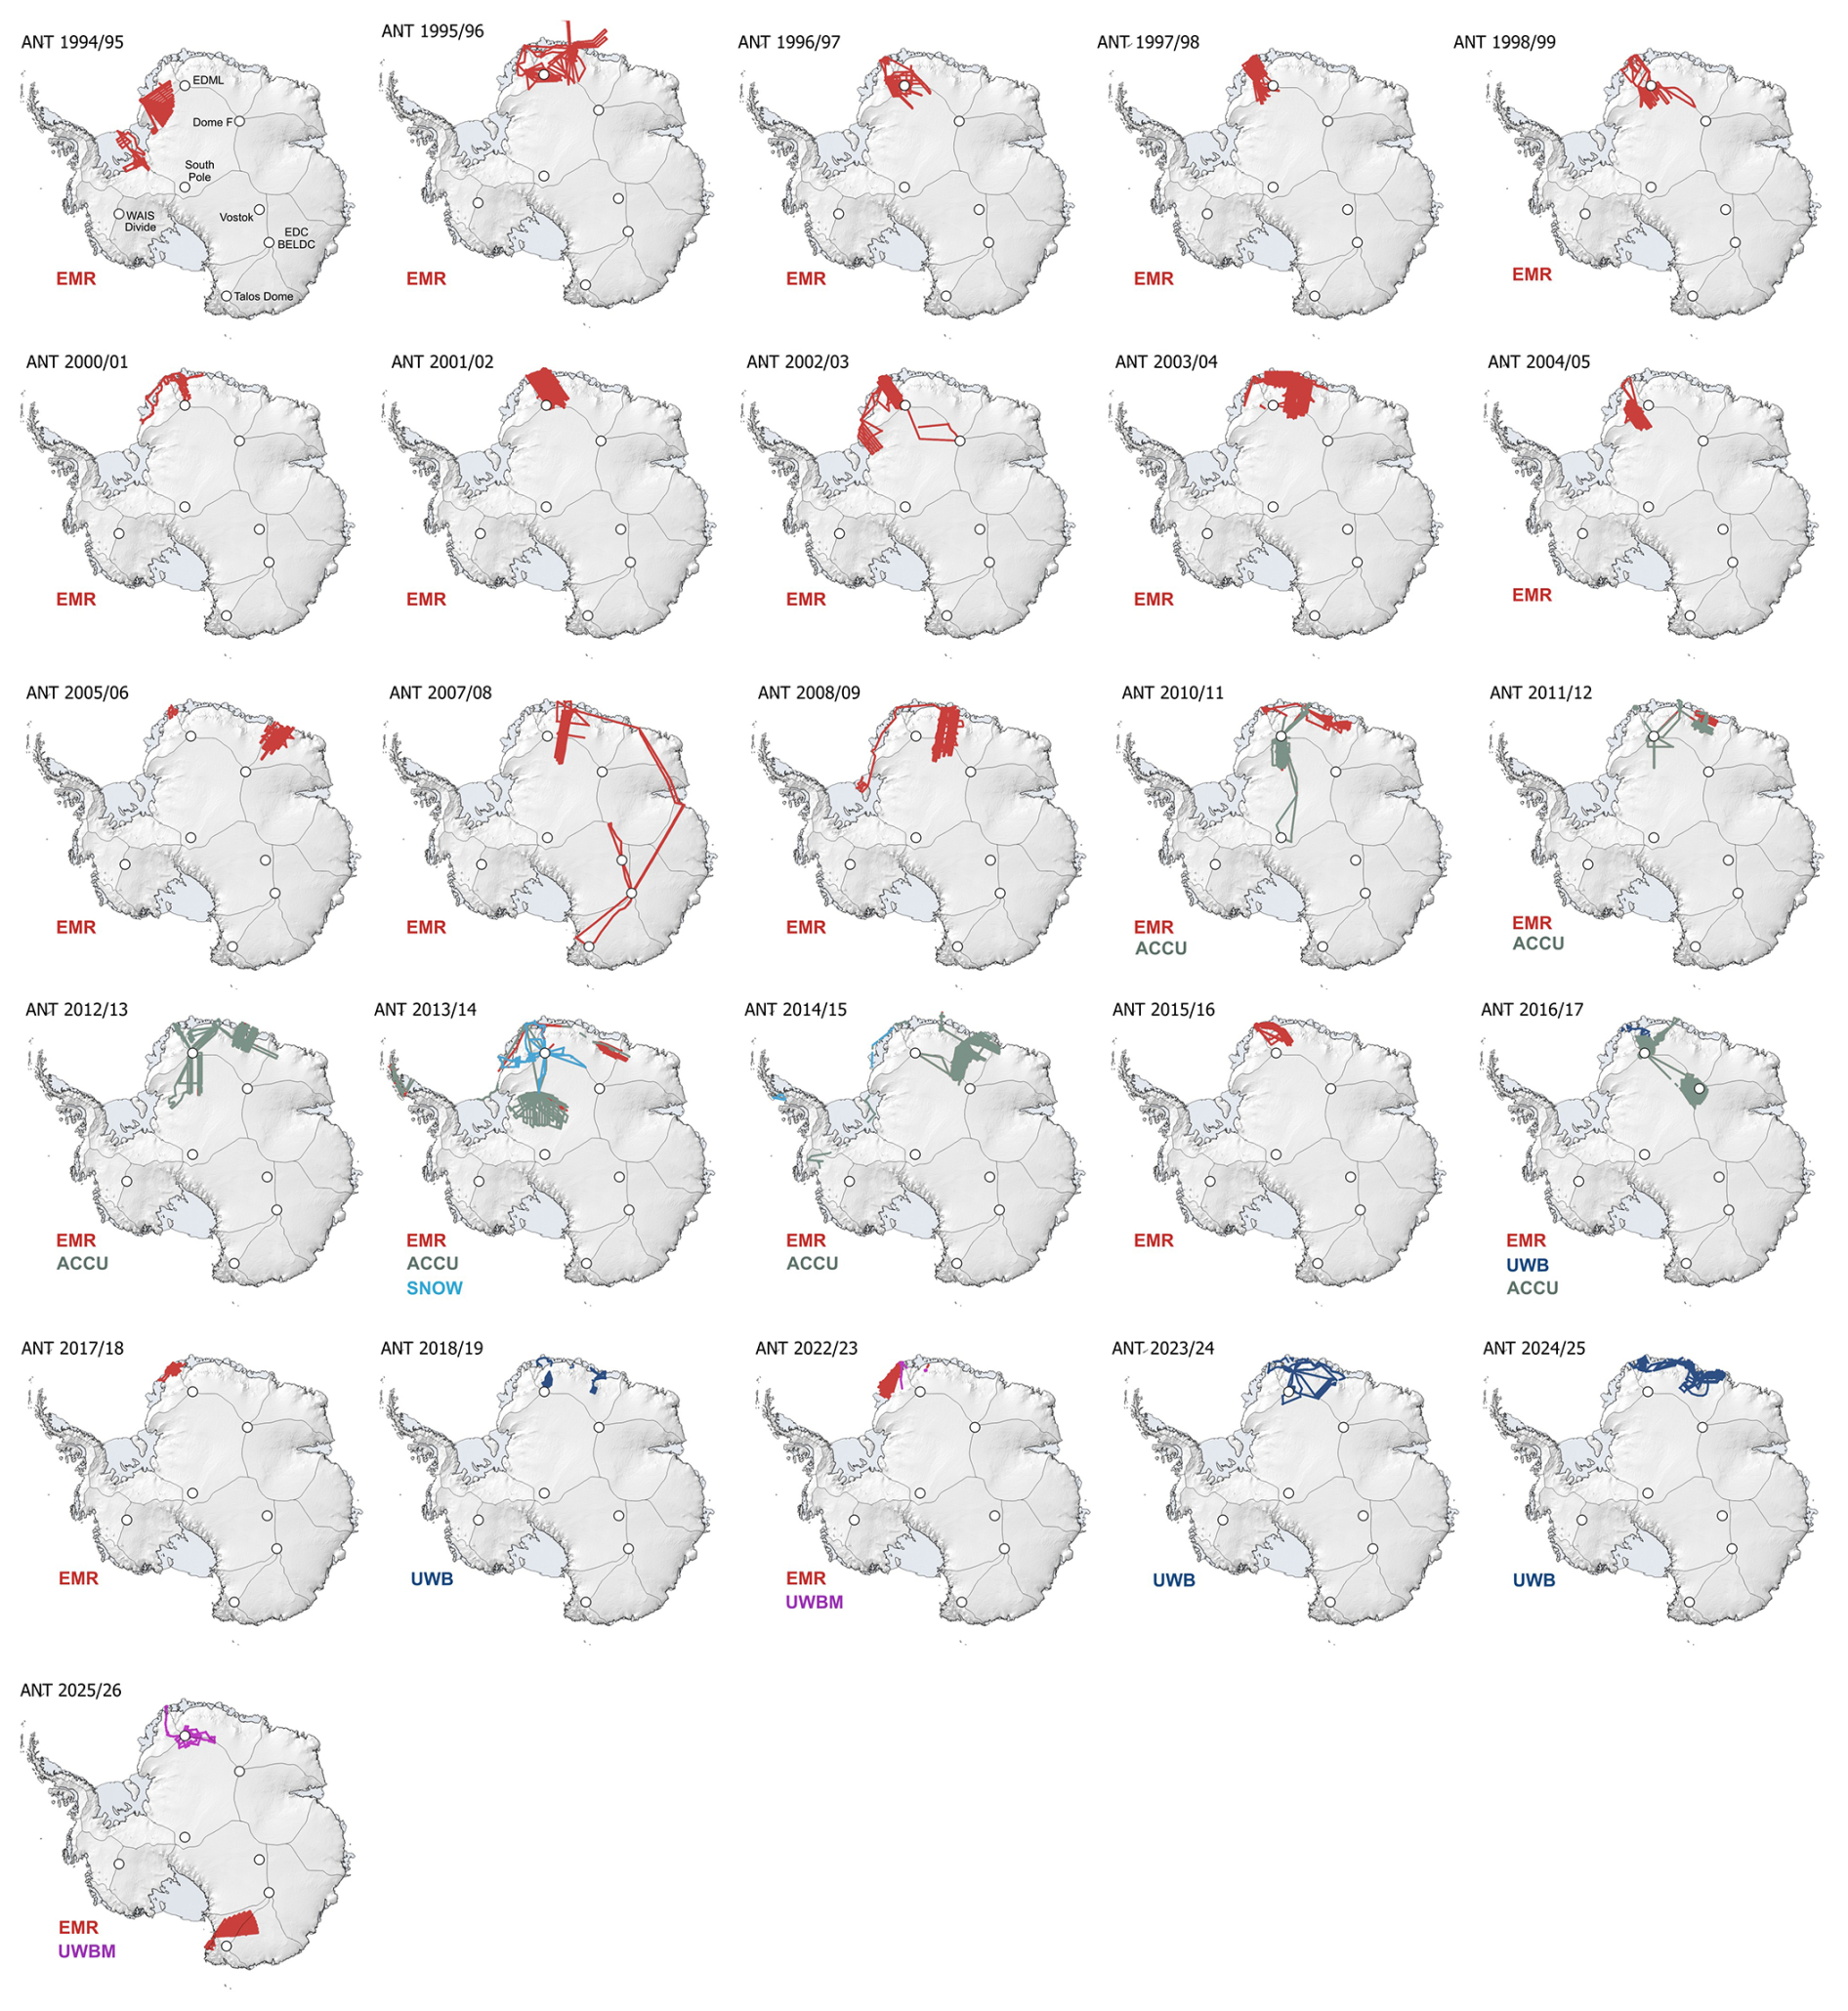
Figure A1Season-wise maps of AWI radar sounding campaigns in Antarctica with the different radar systems (EMR = red, ACCU = green, SNOW = cyan, UWB = dark blue, UWBM = purple). Note that the profile lines of the ASIRAS system are not represented here. The white dots represent deep ice core sites and the black lines the IMBIE drainage basins (Rignot et al., 2019).
Table A1Season-wise overview of airborne radar surveys in Antarctica with the campaign acronyms, approximate survey region, radar instrument and platform used as well as the respective survey-km flown per instrument.
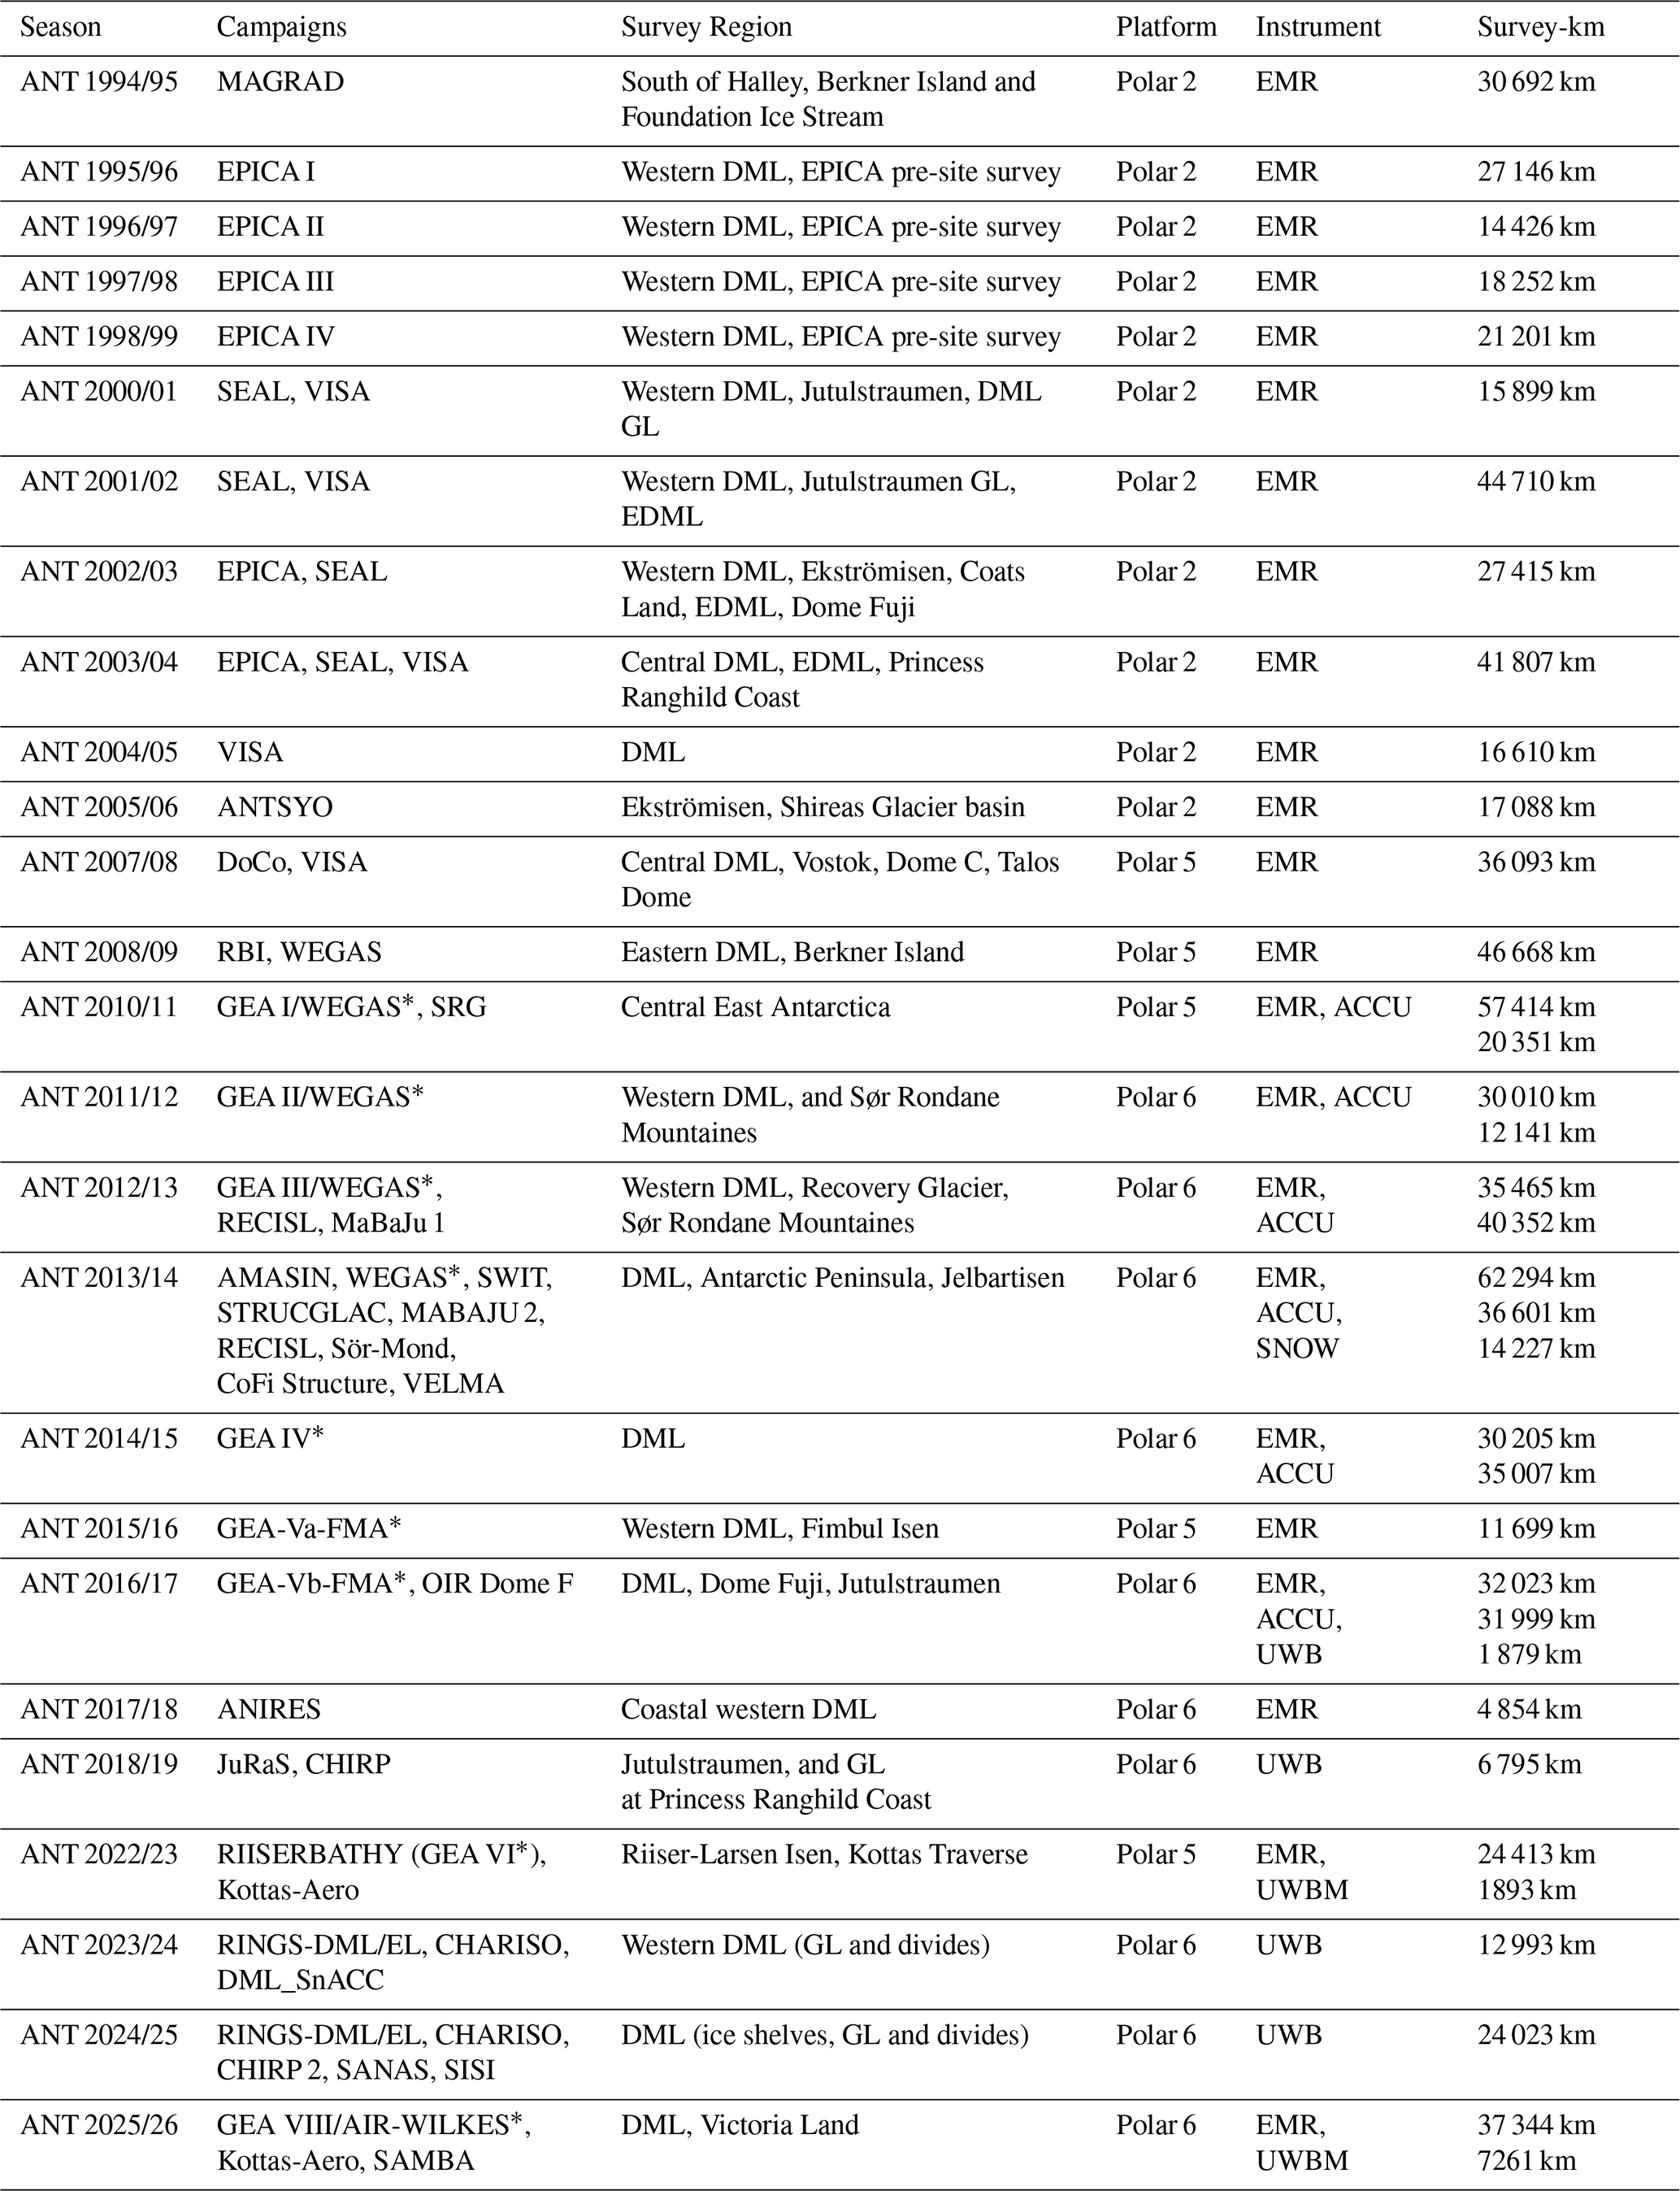
∗ GEA/WEGAS survey are financed by 50 % by the Federal Institute for Geosciences and Natural Resources (BGR), Hanover, Germany
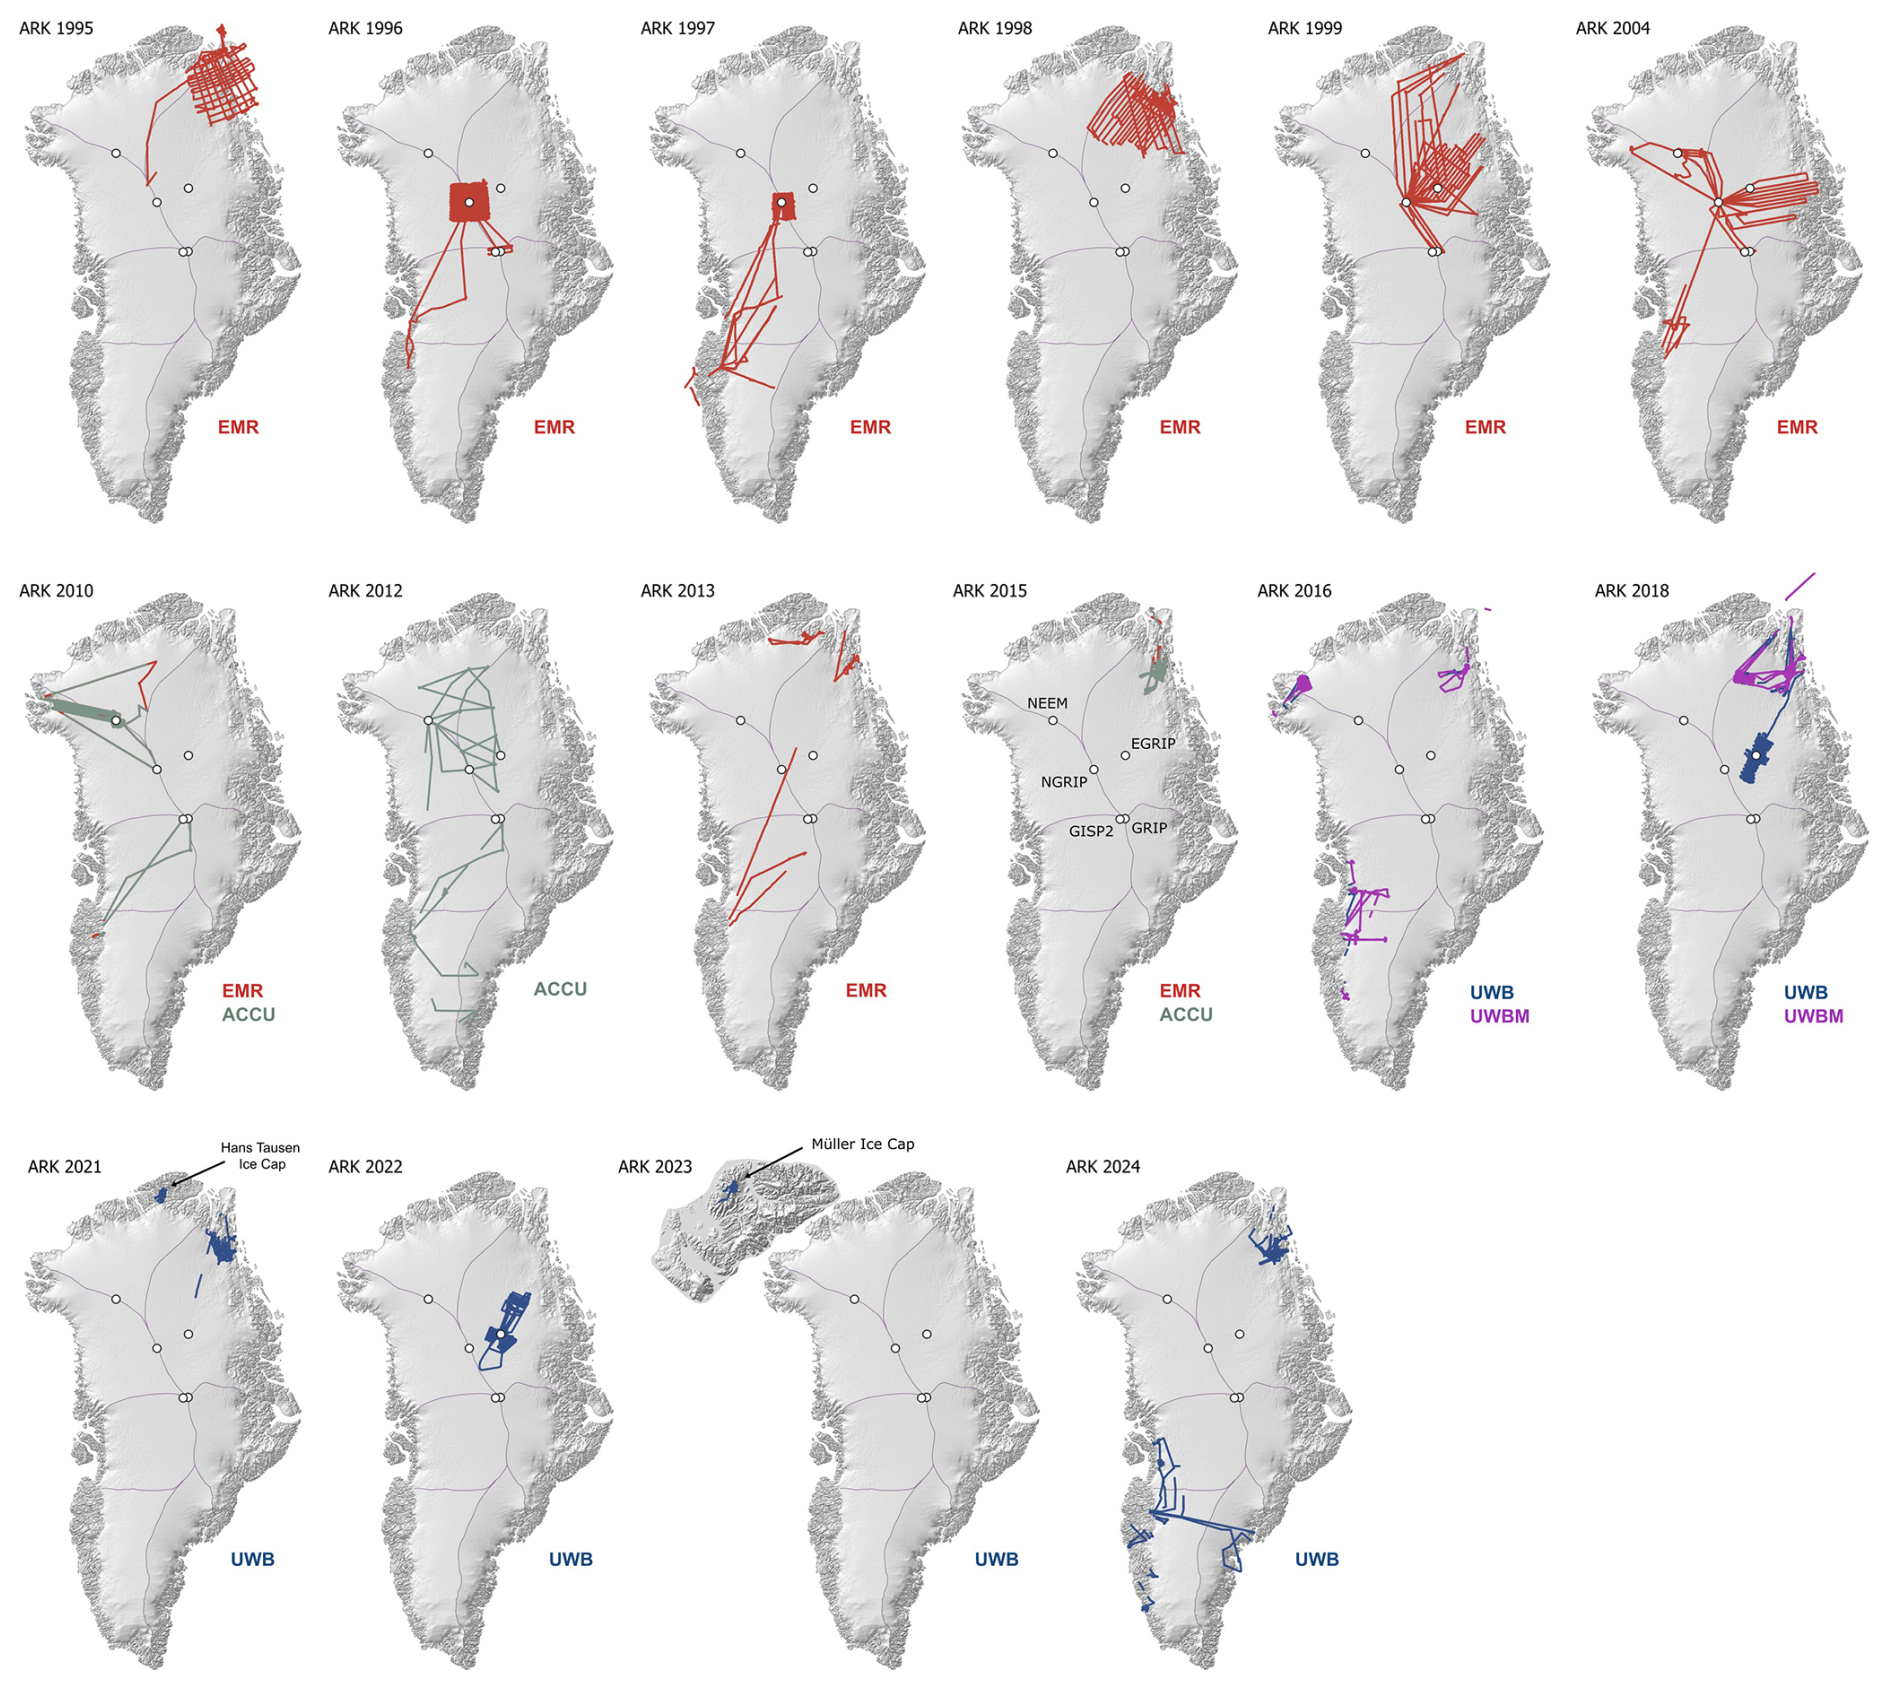
Figure A2Season-wise maps of AWI radar sounding campaigns in the Arctic with the different radar systems (EMR = red, ACCU = green, SNOW = cyan, UWB = dark blue, UWBM = purple). Note that the profile lines of the ASIRAS system are not represented here. The white dots represent deep ice core sites and the black lines the IMBIE drainage basins (Mouginot et al., 2017).
Table A2Season-wise overview of airborne radar surveys the Arctic (Greenland and Canada) with the Campaign acronyms, approximate survey region, radar instrument and platform used as well as the respective survey-km flown per instrument.
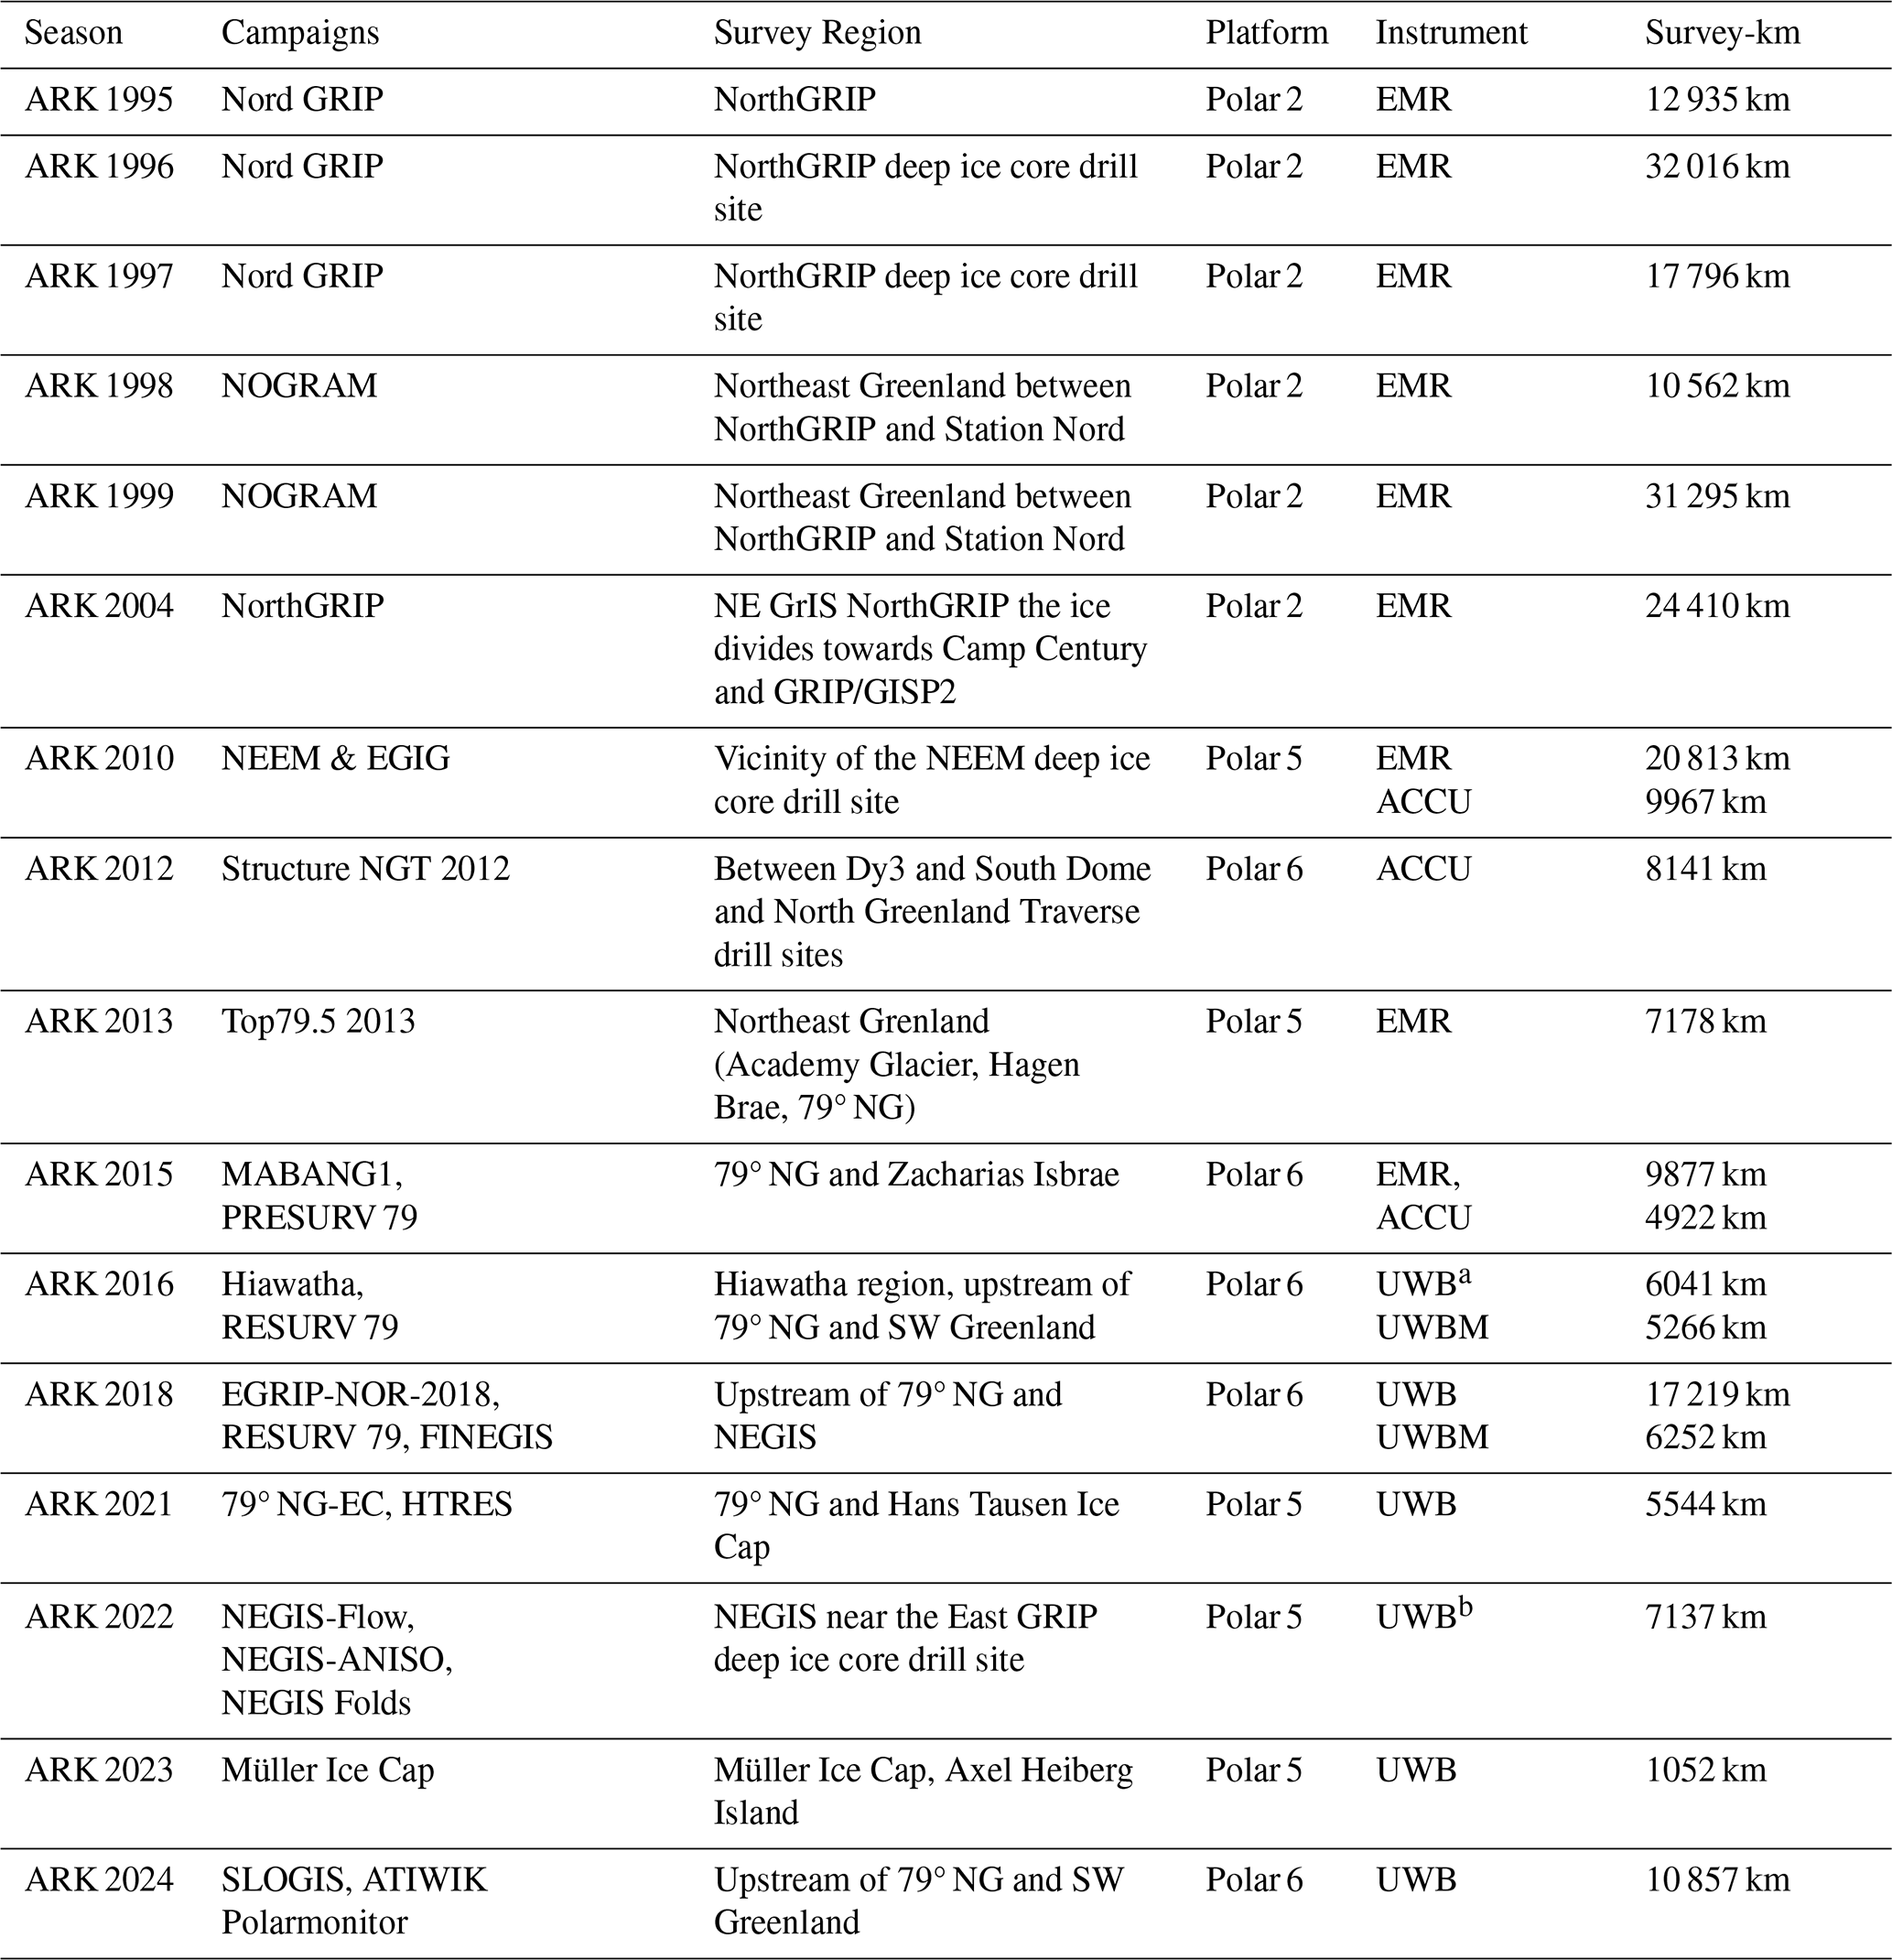
a The UWB was flown in a 24-channel configuration this season. bParts of the ARK 2022 UWB survey at NEGIS onset were flown in a polarimetric mode.
Table A3Overview of Antarctic field seasons in which an AWI radar was deployed alongside additional geophysical instruments. Note that radar systems listed in parentheses, e.g. (EMR + ACCU), were operated simultaneously on the same flights. Systems separated by an ampersand (e.g., EMR & UWBM) were used during the same field season but on different flights. Up until the ANT 2011/12 campaign, laser altimeters were used, and specific device names are not provided here. Thereafter, laser scanners with swath capability were employed, and precise device names are available for these. For further information on the geophysical instruments, please refer to the references in the right column, if available. For additional information about the Modular Airborne Camera System (MACS), see Neckel et al. (2023). Abbreviations are: LCR = LaCoste & Romberg, GT = Gravimeteric Technologies, TFM = Triaxial Fluxgate Magnetometer.
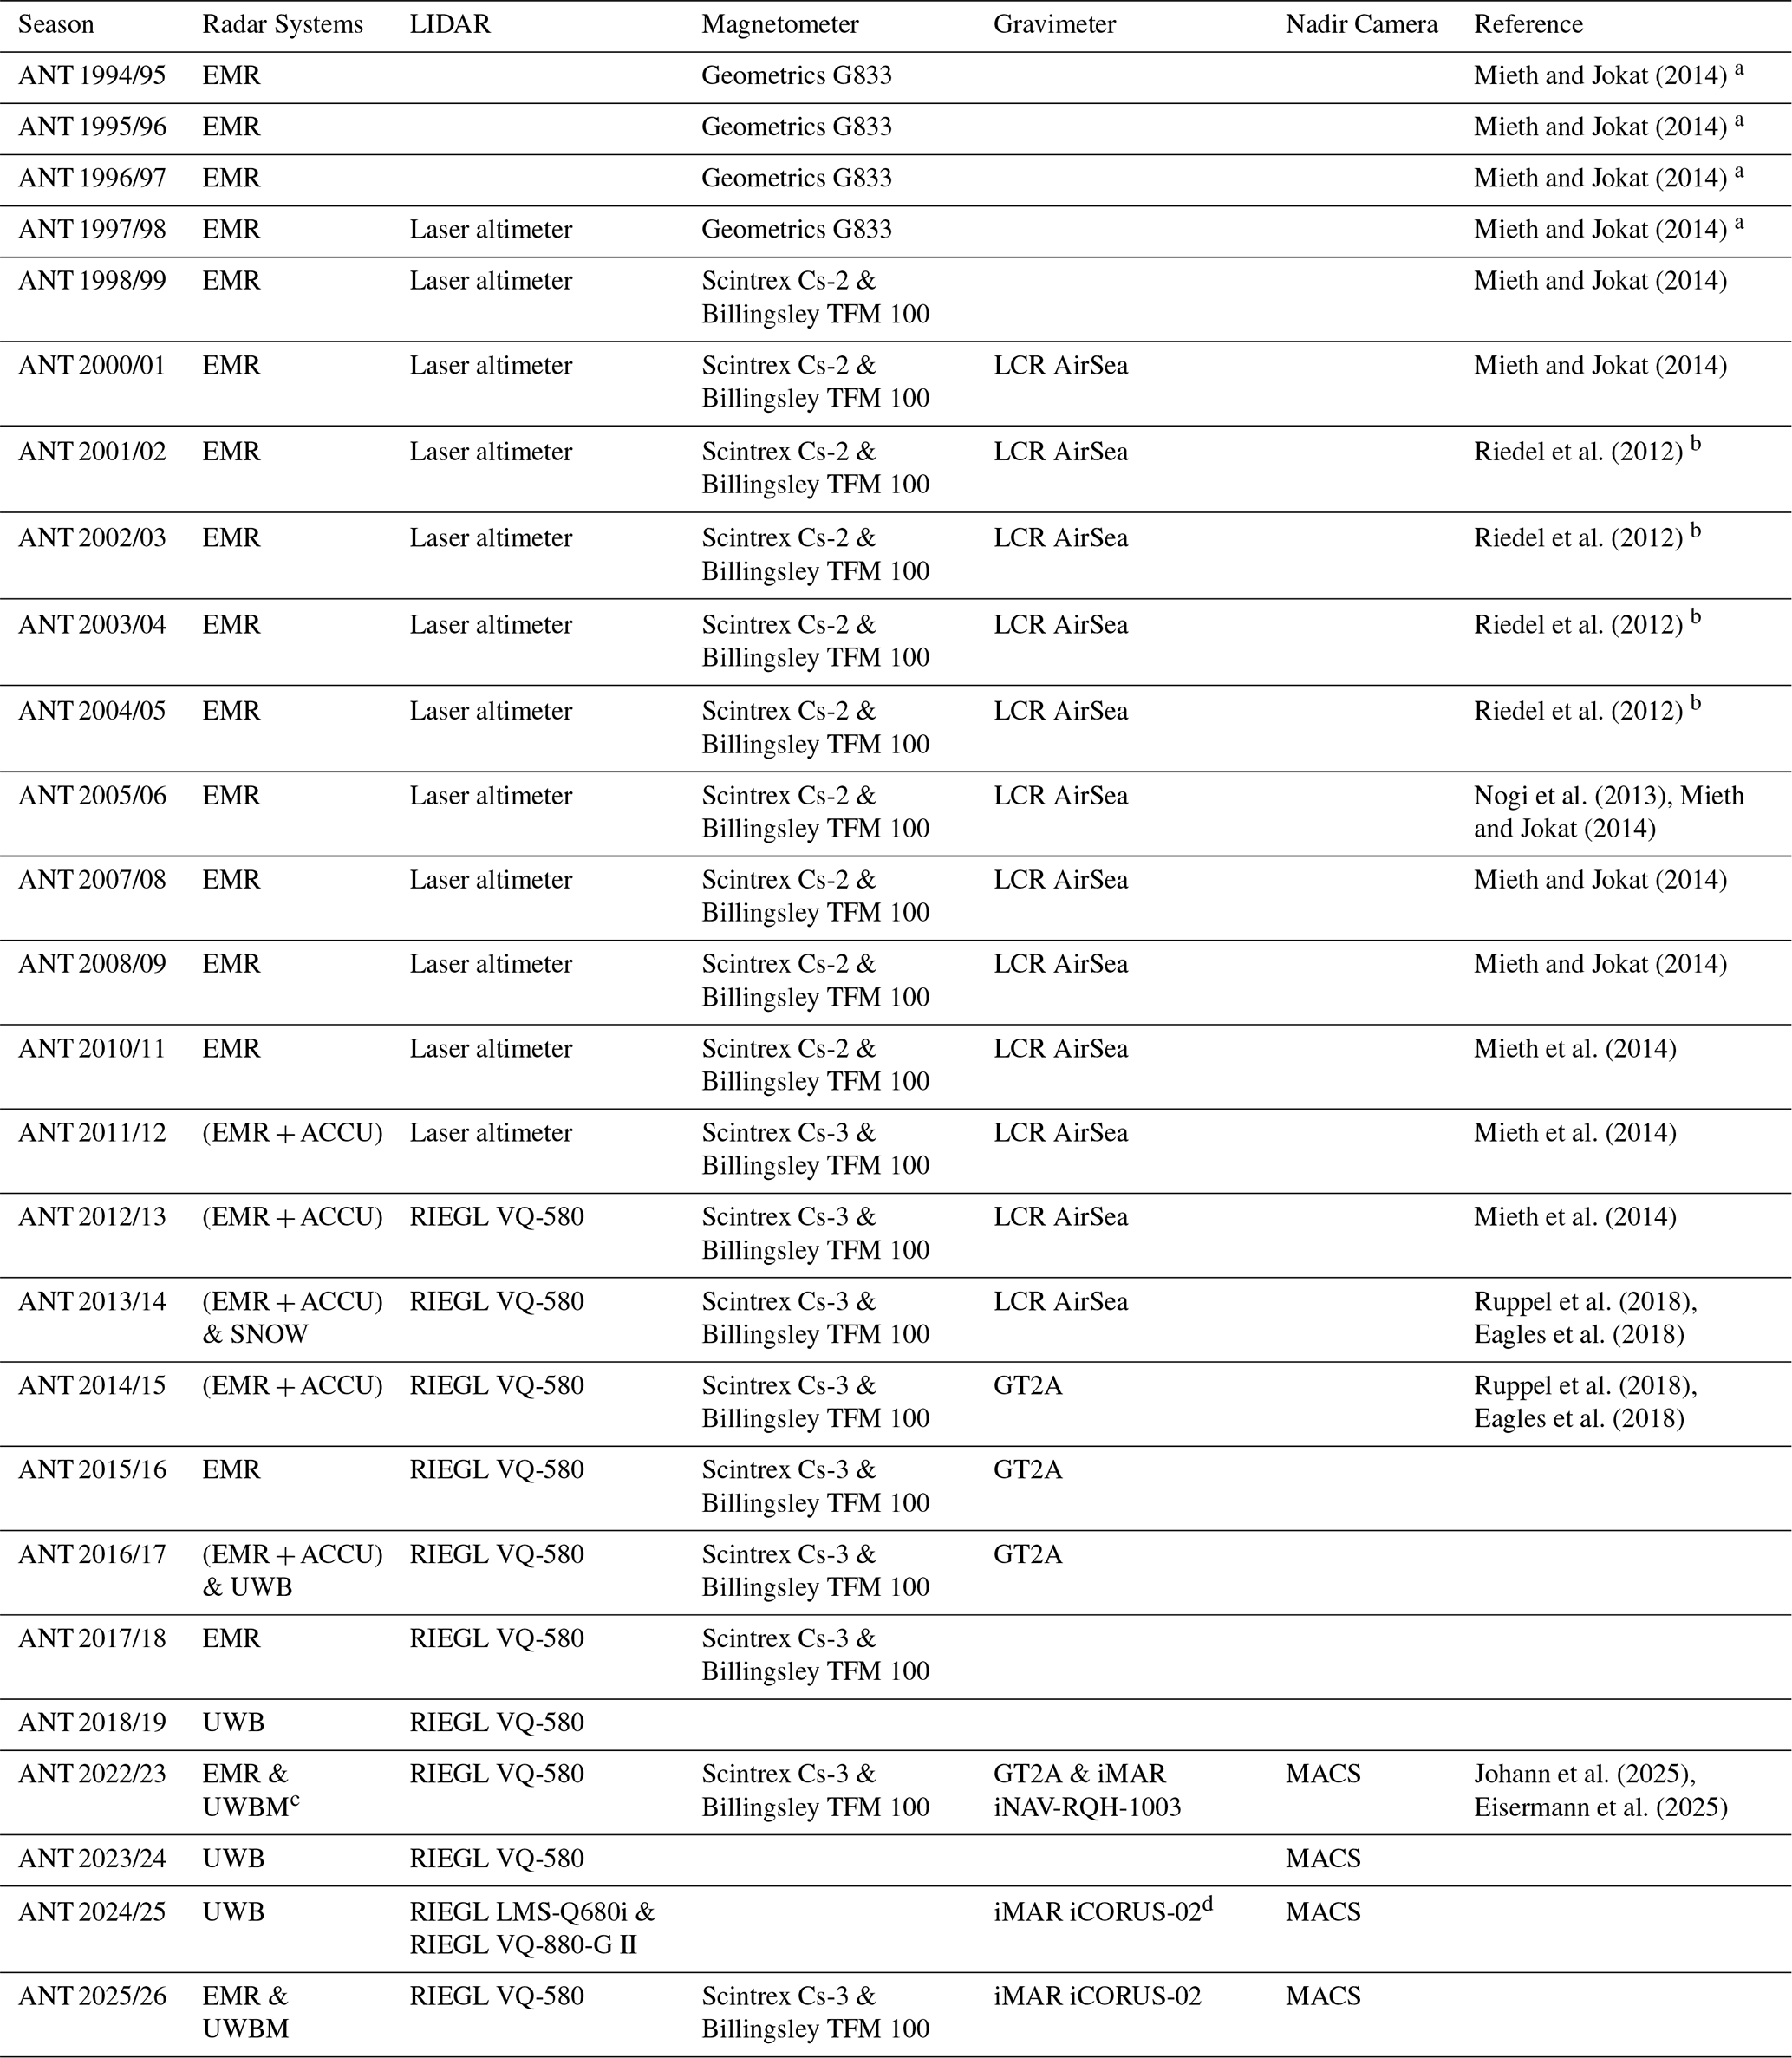
a Please note that Mieth and Jokat (2014) incorrectly state in their paper that a Scintrex Cs-2 Caesium magnetometer was used during that season. b Please note that Riedel et al. (2012) incorrectly state in their paper that two Geometric Cs-2 magnetometer were used during that season. c Gravimeter and magnetometer were used during the EMR campaign but not together with the UWBM. d First setup with AWI UWB and gravimeter.
Table A4Overview of Arctic field seasons in which an AWI radar was deployed alongside additional geophysical instruments. Note that radar systems listed in parentheses, e.g. (EMR + ACCU), were operated simultaneously on the same flights. Up until the ARK 2010 campaign, laser altimeters were used, and specific device names are not provided here. Thereafter, laser scanners with swath capability were employed, and precise device names are available for these. For further information on the geophysical instruments, please refer to the references in the right column, if available. For additional information about the Modular Airborne Camera System (MACS), see Neckel et al. (2023). Abbreviations are: TFM = Triaxial Fluxgate Magnetometer.
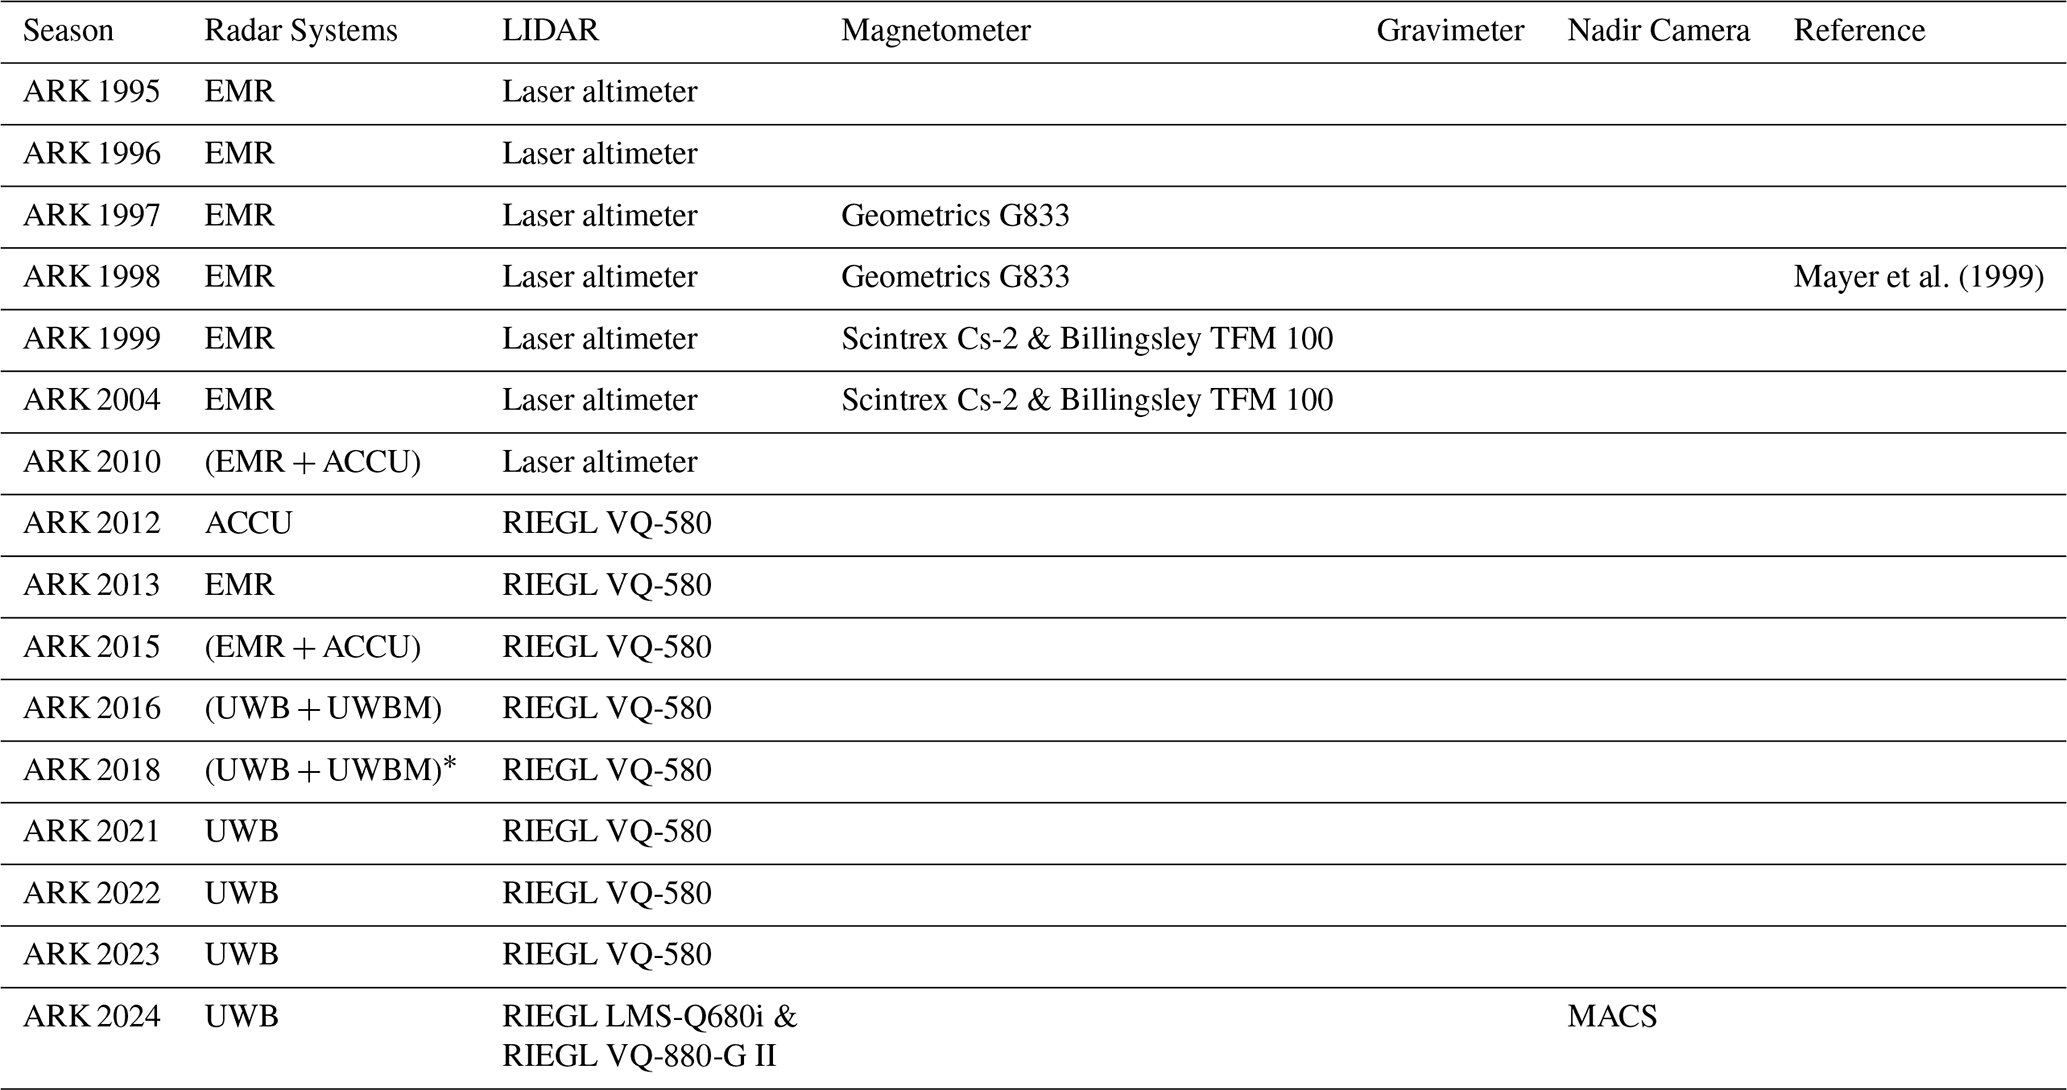
∗ No UWBM data for EGRIP-NOR-2018 survey at NEGIS onset.
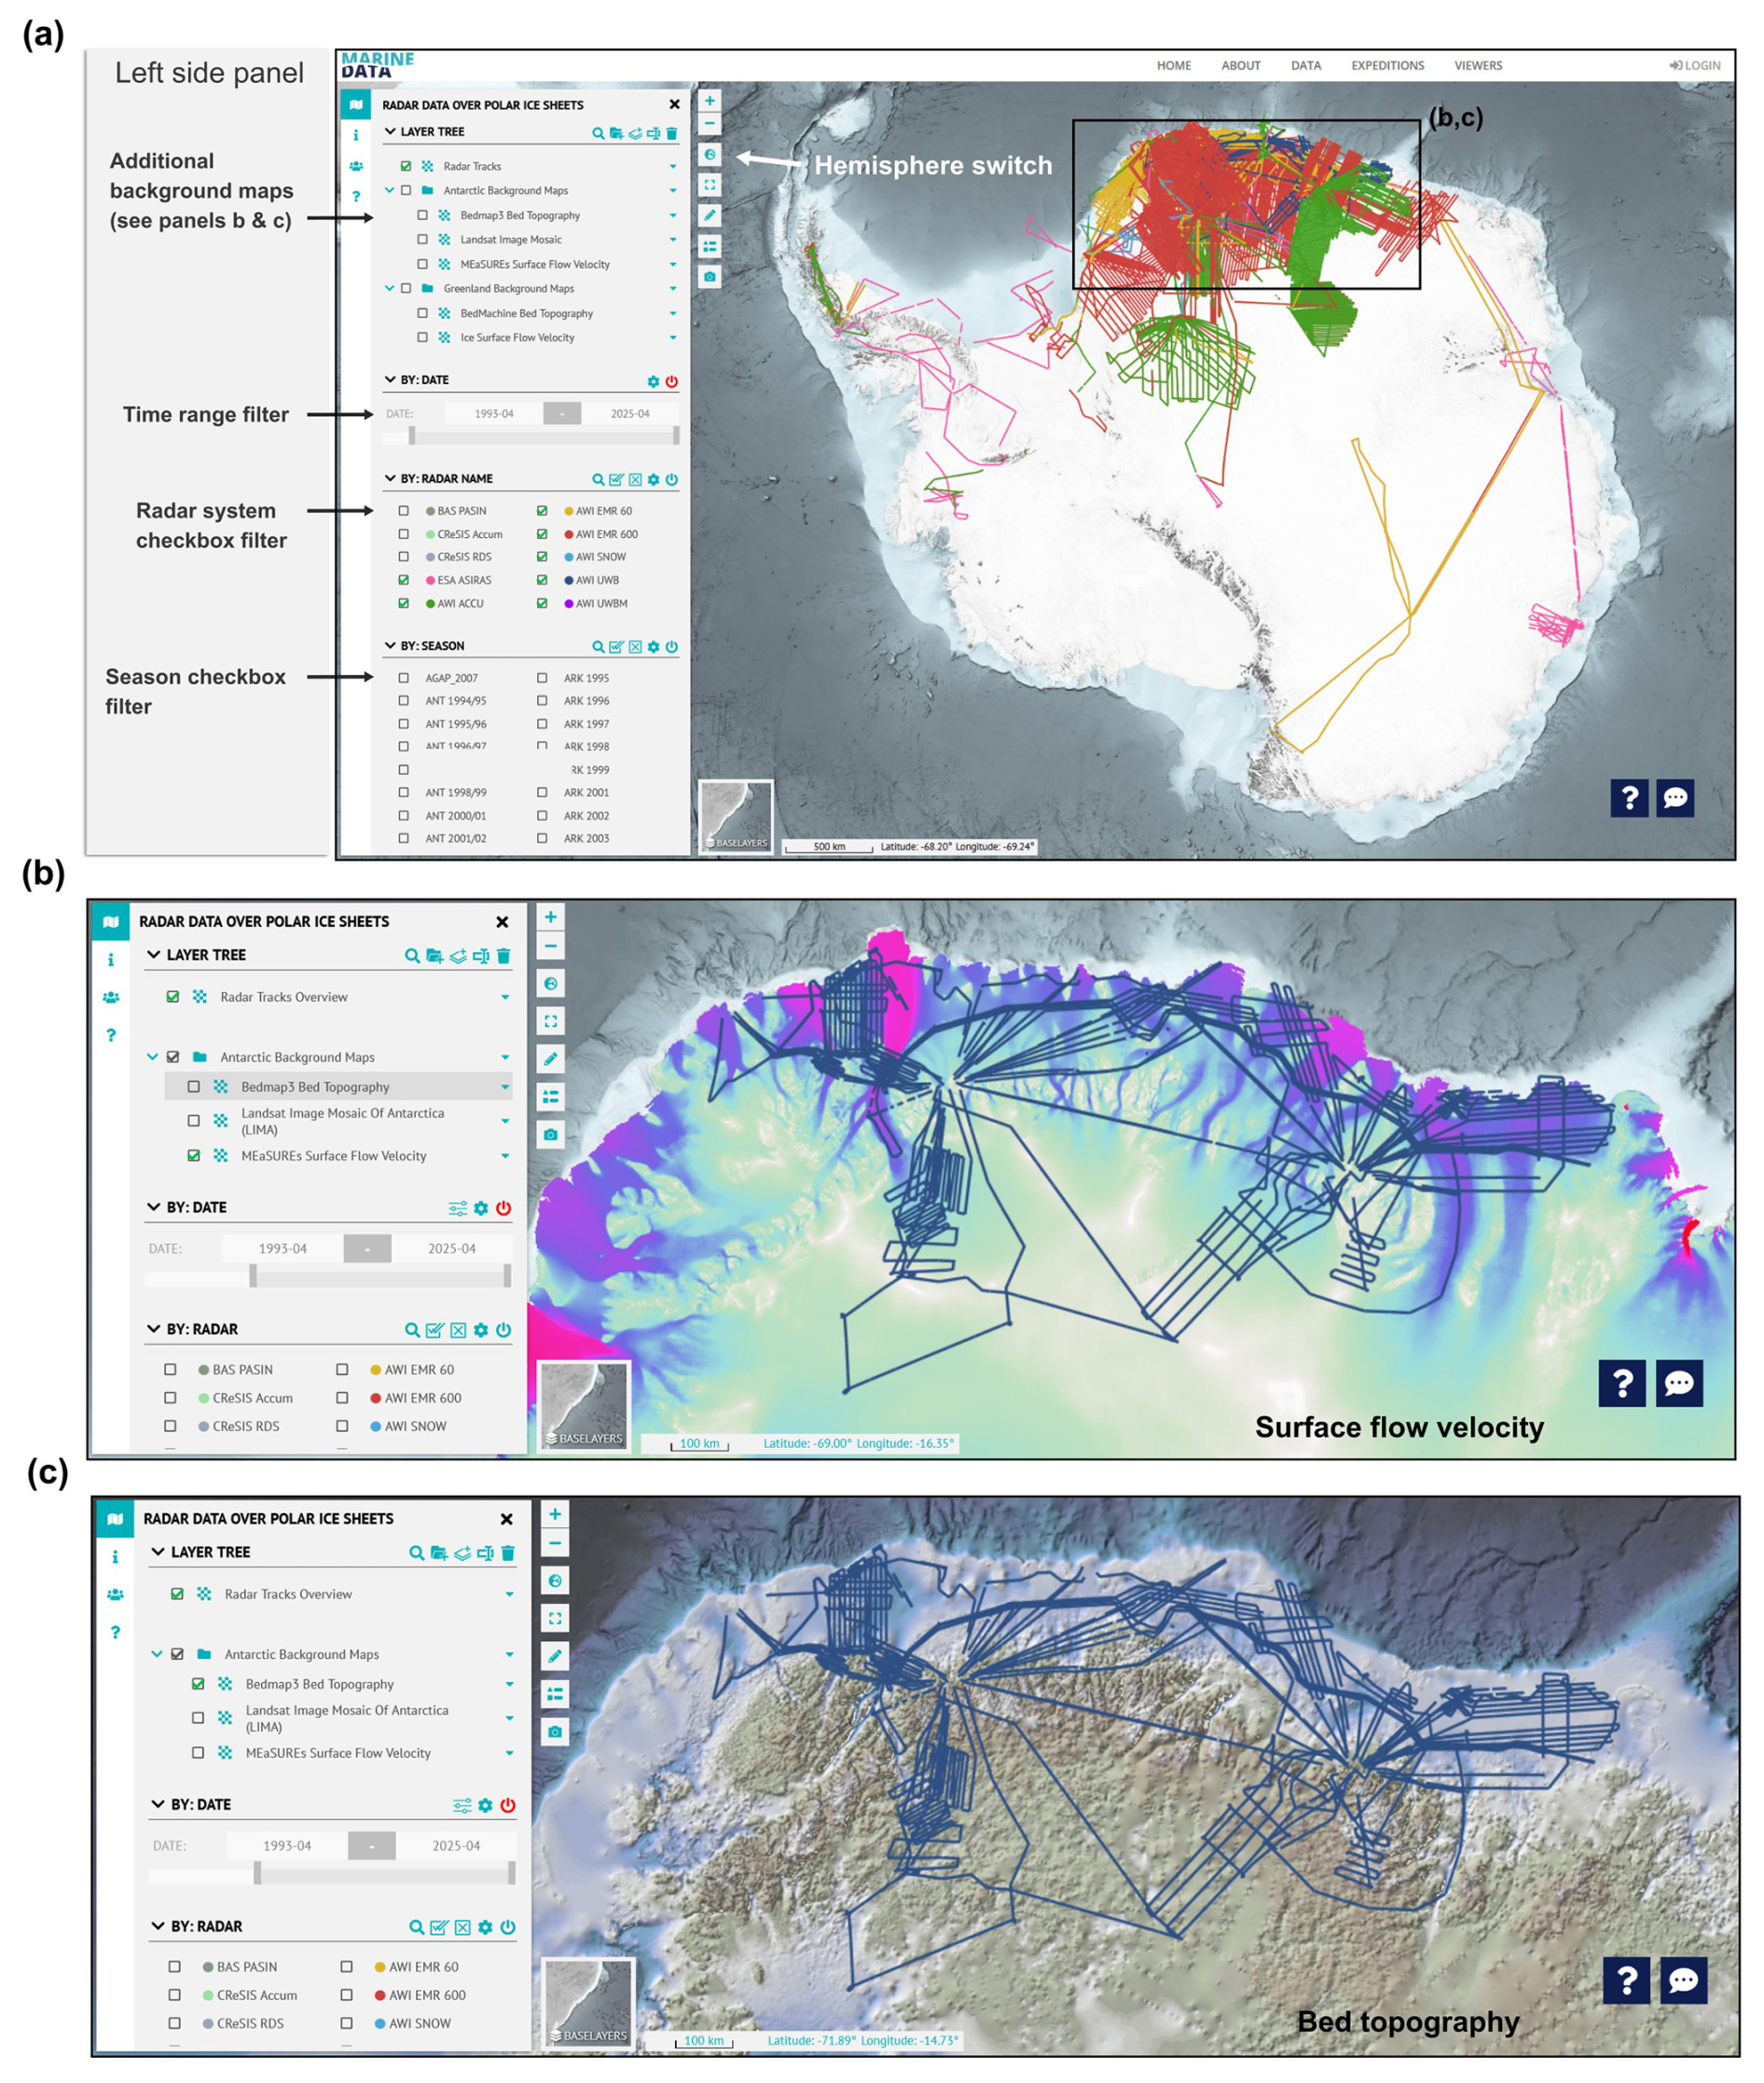
Figure A3Screenshots from the Marine Data Portal Radar Data Viewer. (a) Highlights the initial view and key features in the left side panel. (b) Shows AWI UWB profiles in Antarctica's Dronning Maud Land with ice flow velocity (Rignot et al., 2017) in the background. (c) Shows the same setting as in (b) but with bed topography (Pritchard et al., 2025) in the background.
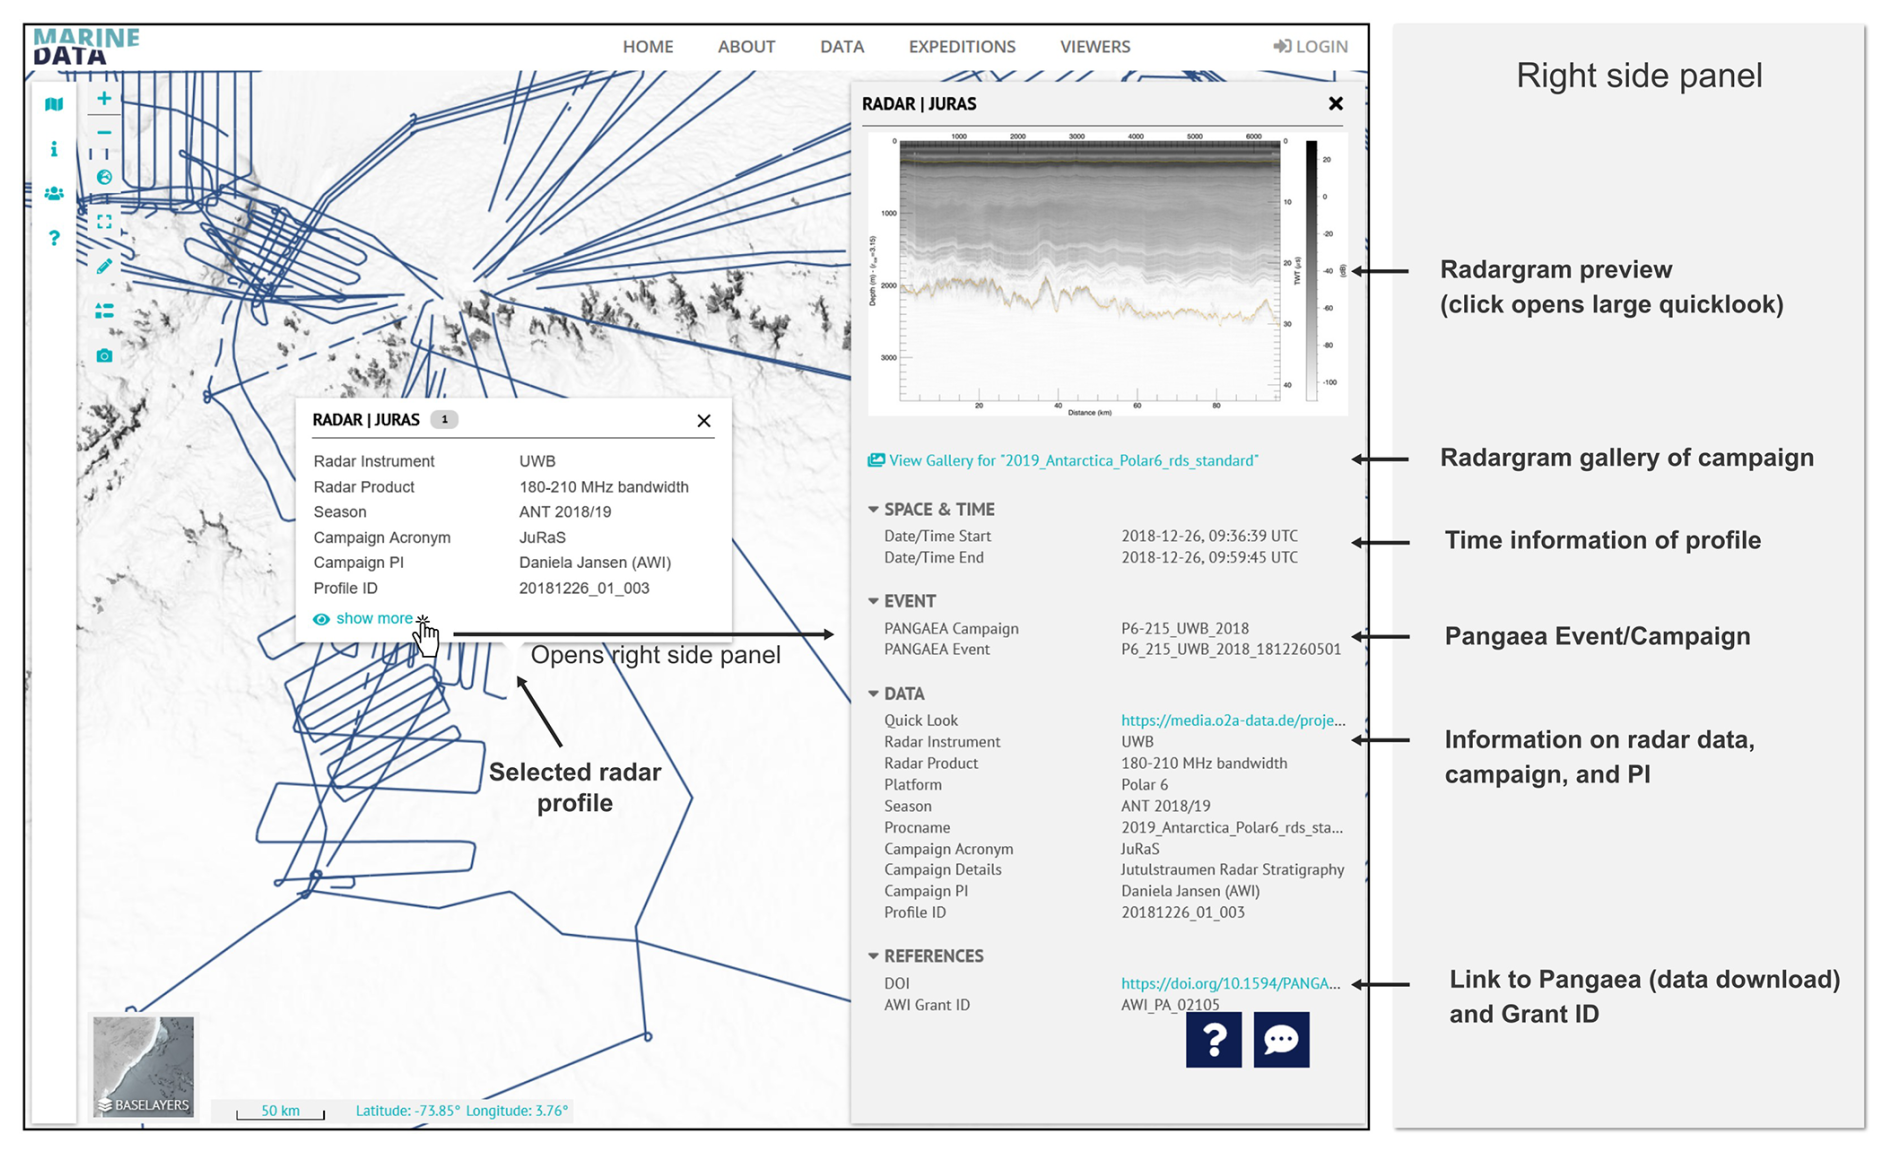
Figure A4Screenshots from the Marine Data Portal Radar Data over Polar Ice Sheets viewer highlighting detailed profile information.
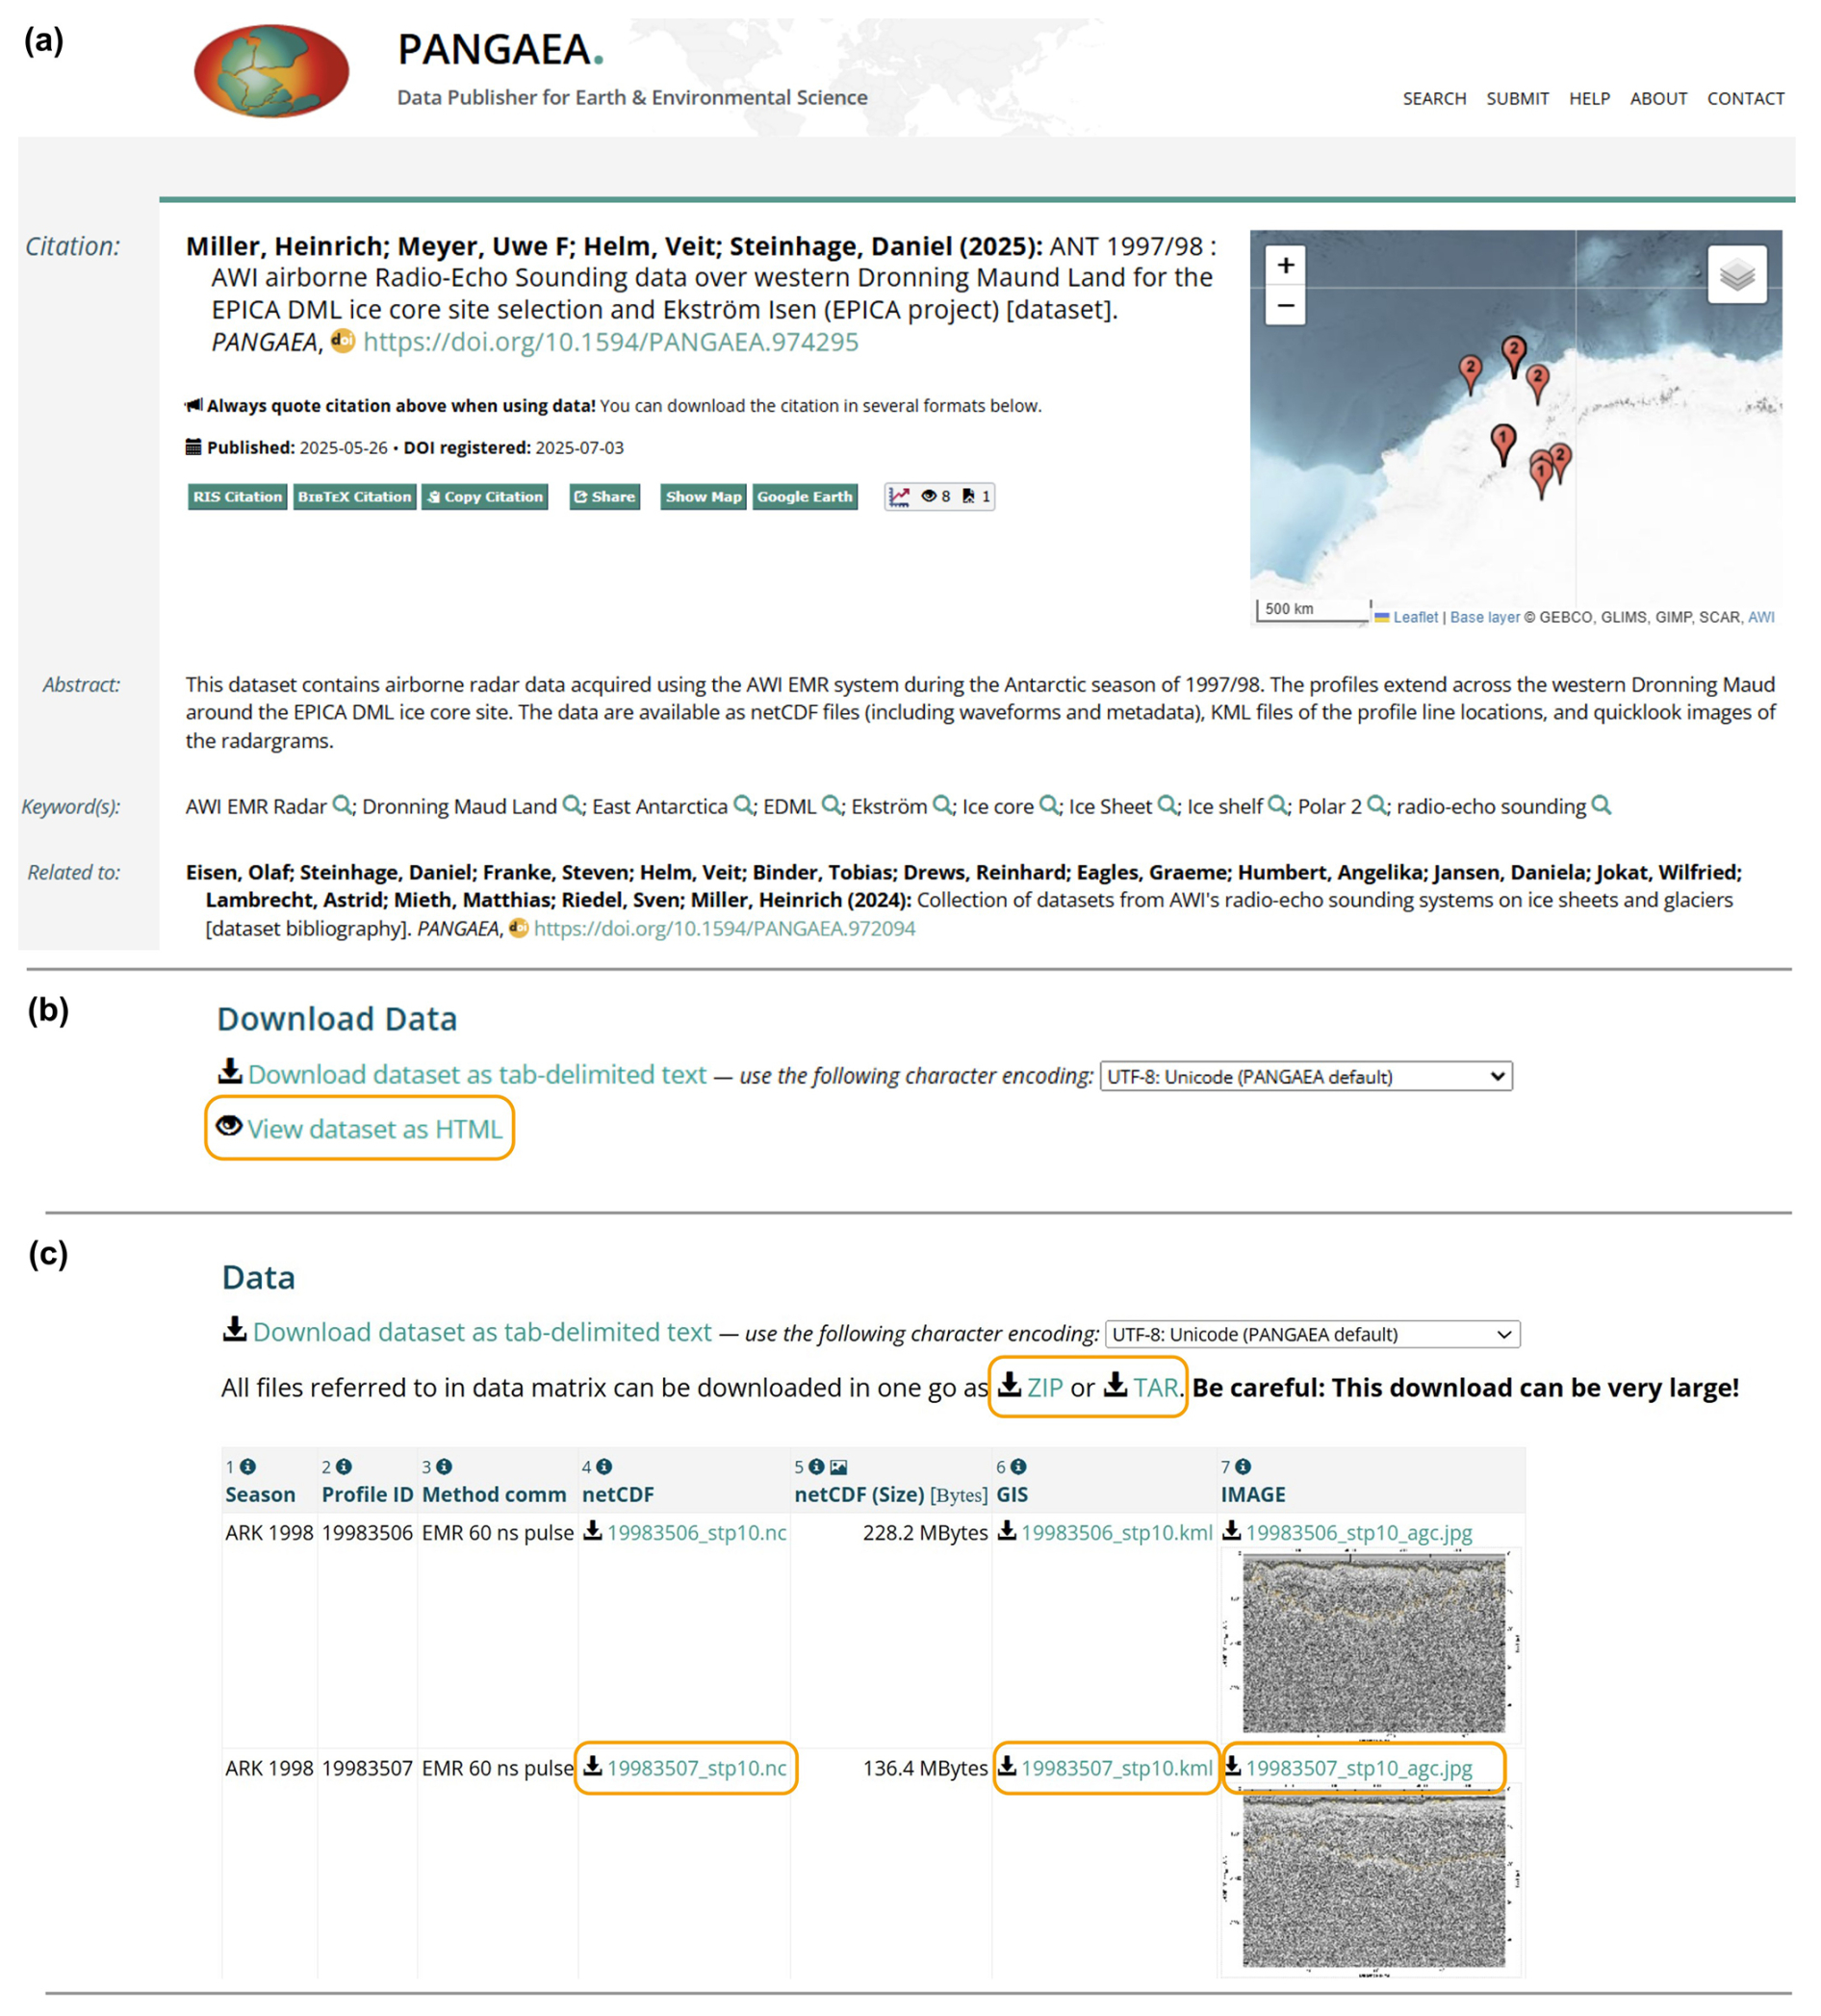
Figure A5PANGAEA entry for data download using the example of the ANT 1997/98 EMR survey. Panels (a) to (c) each represent sections of the full PANGAEA entry, containing more information than is displayed here. (a) Header section of the PANGAEA entry with a citable reference, abstract, keywords, related publications and PANGAEA entries, etc. (b) Data download section, where the “View dataset as HTML” button allows access to the data view. Note that the Data section will only appear if the “View dataset as HTML” button is used. (c) Data presentation with options to download the entire dataset as a compressed ZIP or uncompressed TAR archive, or as individual files. Important items for the data download are highlighted with an orange outline.
Table A5Attributes for each variable stored in the NetCDF files. For each attribute name, we provide the long name, a comment, the dimension (1- or 2-D, x or y axis), and the unit of the measurement.
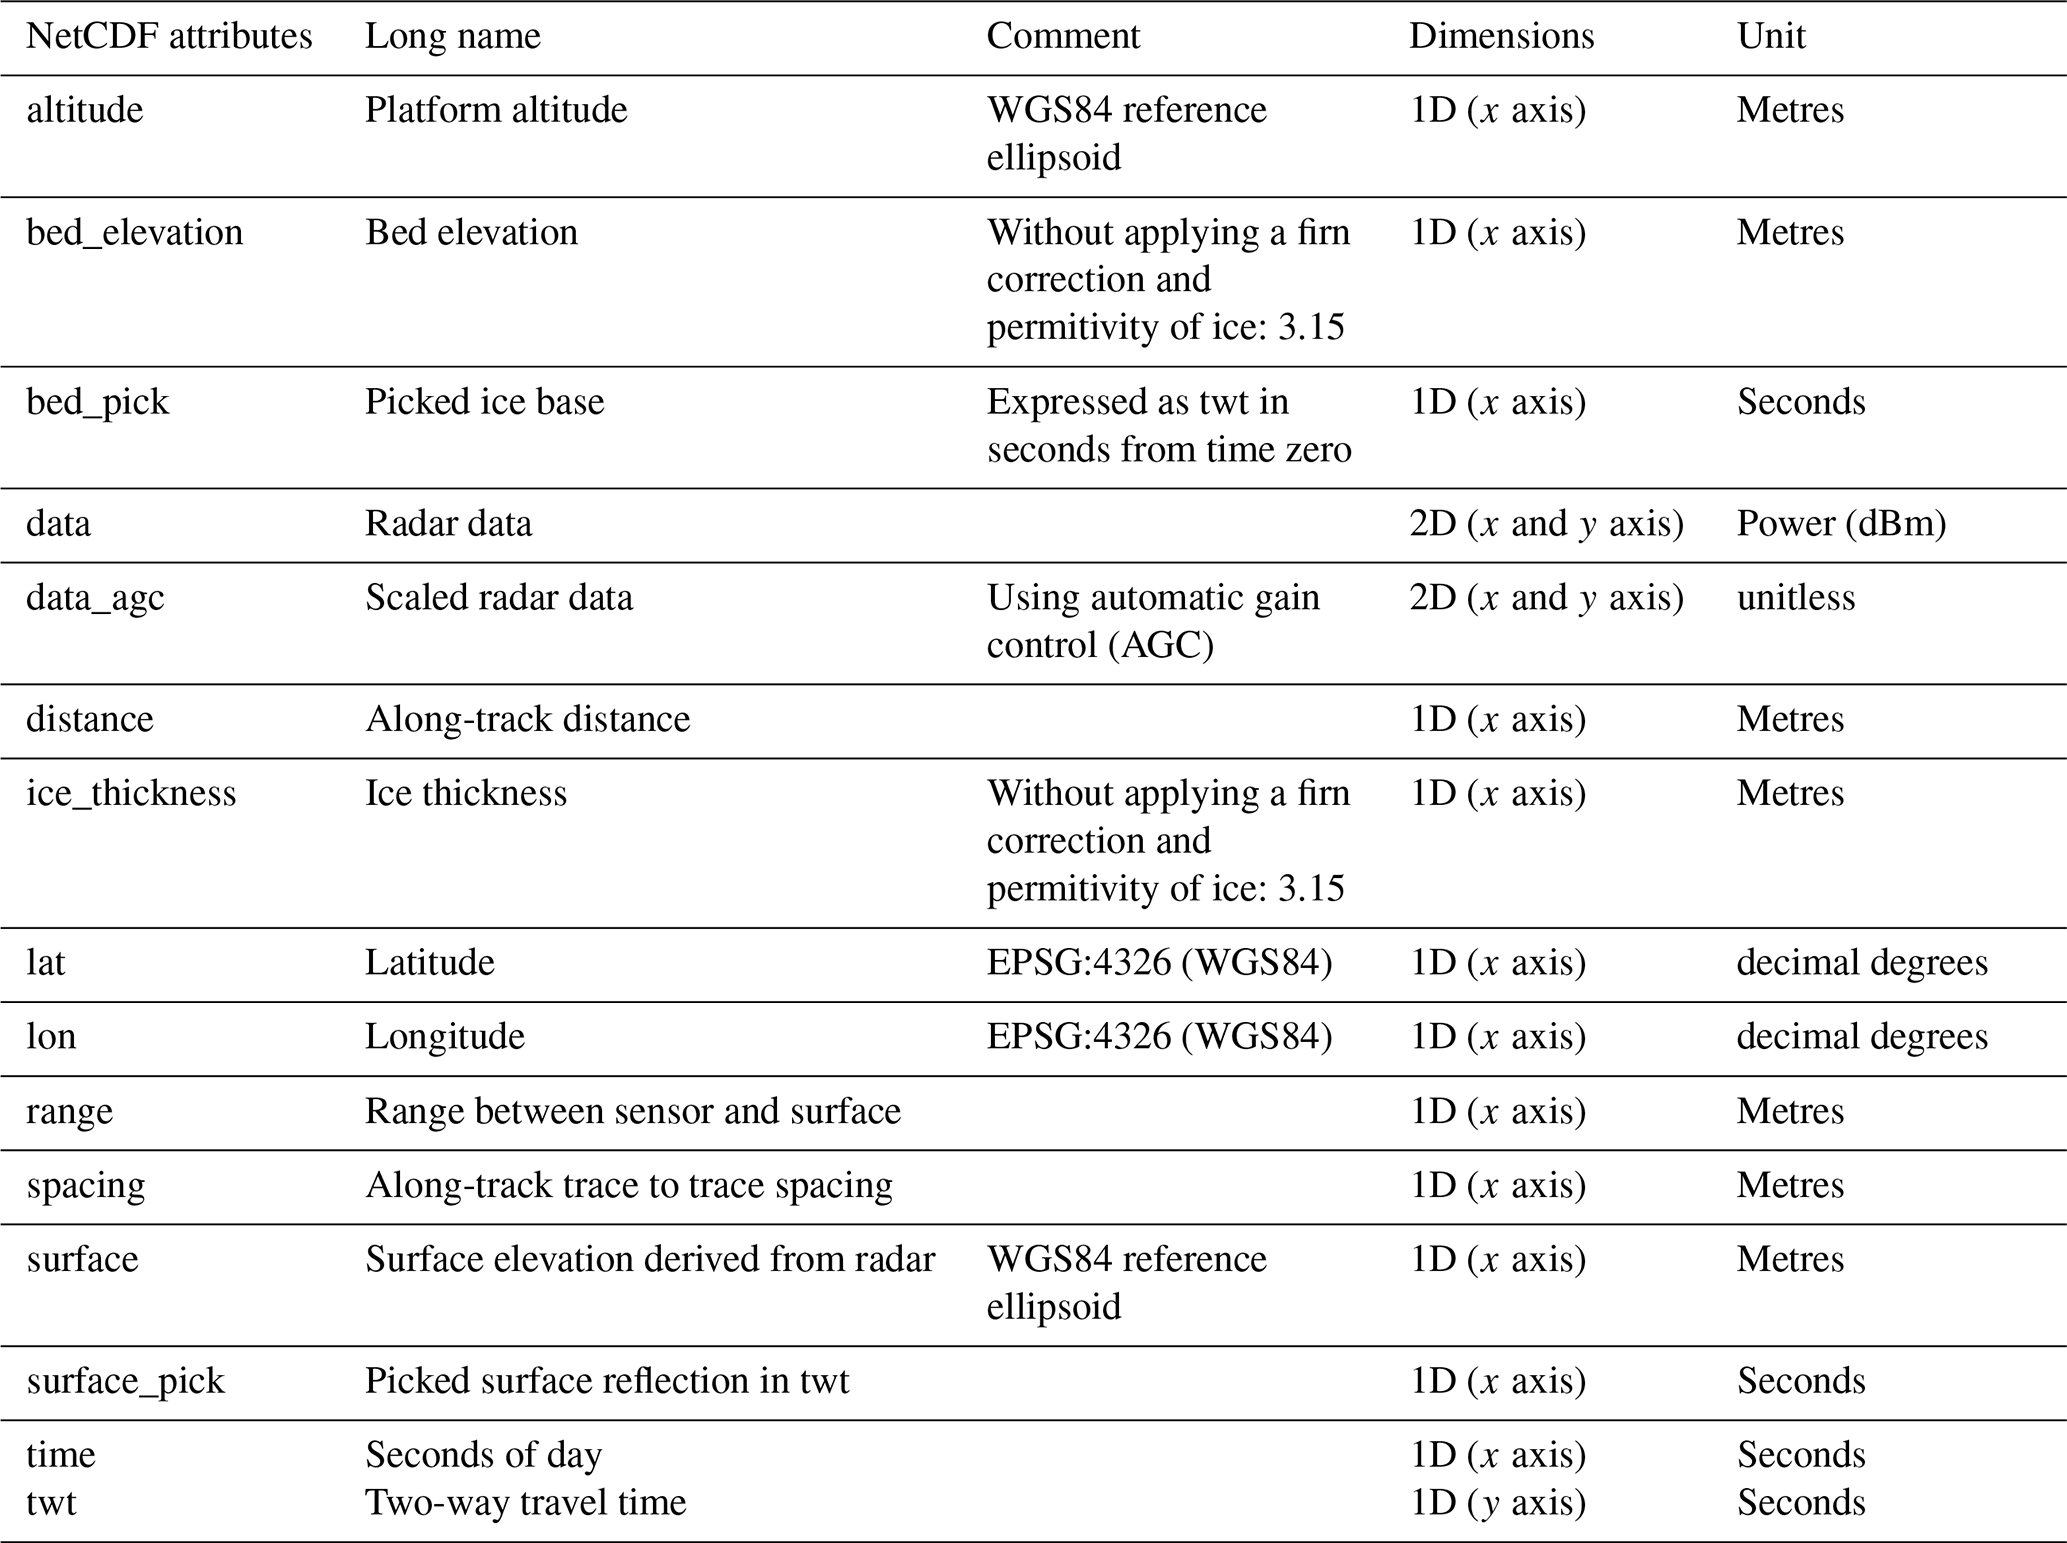
The OPR Toolbox (Open Polar Radar, 2023) for radar data processing is available at https://gitlab.com/openpolarradar/opr/ (last access: 19 April 2026). AWI's airborne radar data and metadata can be viewed through the Radar Data over Polar Ice Sheets viewer of the Marine Data Portal (https://marine-data.de/viewer/, last access: 19 April 2026). A comprehensive collection of datasets from AWI's radar systems on ice sheets and glaciers is available in the PANGAEA dataset bibliography by Eisen et al. (2024): https://doi.org/10.1594/PANGAEA.972094. Spatial maps were generated with QGIS (QGIS Development Team, 2025; Graser et al., 2025).
AWI's radar data archive is continuously extended and updated with data from new campaigns, improved processing products of existing data, harmonization for better usability, and the integration of ice surface and ice base picks. At the time of this publication, a large portion of the radar campaigns in Antarctica and the Arctic are available for download on PANGAEA. The remaining data are being progressively added. However, all data can also be provided upon request to the corresponding authors of this article. Radar data acquired within the most recent 2–3 years (after processing) of a request may be subject to an embargo.
The supplement related to this article is available online at https://doi.org/10.5194/tc-20-2485-2026-supplement.
SF wrote the paper with contributions from DS, VH, OE, AH, WJ, RD, AZ, AR, HM and GE. DS, VH, SF, and PHA compiled AWI radar data and performed quality checks. VH provided software for data format conversion. DS, VH, UN, OE, SF, DJ, TB processed AWI radar data. TB implemented the AWI UWB system with support from DJ. AD provided support for the data integration into the PANGAEA Data Publisher. AW, PK, RH, AH, RK, and VH implemented the Radar Data Viewer in the Marine Data Portal. OE coordinated the implementation of the Radar Data Viewer with support from SF, VH and DS.
At least one of the (co-)authors is a member of the editorial board of The Cryosphere. The peer-review process was guided by an independent editor, and the authors also have no other competing interests to declare.
Publisher's note: Copernicus Publications remains neutral with regard to jurisdictional claims made in the text, published maps, institutional affiliations, or any other geographical representation in this paper. The authors bear the ultimate responsibility for providing appropriate place names. Views expressed in the text are those of the authors and do not necessarily reflect the views of the publisher.
Logistical support in the field in Antarctica over the past three decades has been provided by the three generations of Neumayer Stations (Germany), Troll Station (Norway), Filchner Station, Kohnen Station (Germany), Princess Elisabeth Station (Belgium), Novolazarevskaya Airbase (Russia), SANAE Stations (South Africa), Halley and Rothera Station (UK), Syowa Station and S17 (Japan), Vostok Station (Russia), Concordia Station (France & Italy), Mario Zucchelli Station (Italy), and Zhongshan Station (China). In Greenland we received logistical support by Station Nord (Arctic Command, Denmark) and the deep ice drill sites NGRIP, NEEM, and EGRIP (international consortia led by Denmark). We thank the entire AWI hangar team, their technician support in the field as well as support from Aerodata, Optimare, and Fielax during airborne radar campaigns. In addition, we thank the AWI logistics team for enabling airborne radar surveys on both hemispheres. We acknowledge financial and logistical support from the German Federal Institute for Geosciences and Natural Resources (BGR) to conduct the GEA and WEGAS surveys. This publication is a contribution to the SCAR Action Group AntArchitecture, the SCAR Action Groups AntArchitecture, RINGS and Bedmap3.
We acknowledge the use of software from Open Polar Radar generated with support from the University of Kansas, NASA grants 80NSSC20K1242 and 80NSSC21K0753, and NSF grants OPP-2027615, OPP-2019719, OPP-1739003, IIS-1838230, RISE-2126503, RISE-2127606, and RISE-2126468. The authors would like to thank Aspen Technology, Inc. for providing software licenses and support. We acknowledge support via airborne radar campaign funding grants AWI_PA_02001, AWI_PA_02002, AWI_PA_02003, AWI_PA_02009, AWI_PA_02010, AWI_PA_02011, AWI_PA_02017, AWI_PA_02020, AWI_PA_02027, AWI_PA_02028, AWI_PA_02030, AWI_PA_02031, AWI_PA_02034, AWI_PA_02037, AWI_PA_02039, AWI_PA_02040, AWI_PA_02041, AWI_PA_02043, AWI_PA_02047, AWI_PA_02050, AWI_PA_02051, AWI_PA_02054, AWI_PA_02055, AWI_PA_02056, AWI_PA_02058, AWI_PA_02066, AWI_PA_02068, AWI_PA_02072, AWI_PA_02073, AWI_PA_02077, AWI_PA_02078, AWI_PA_02079, AWI_PA_02080, AWI_PA_02083, AWI_PA_02084, AWI_PA_02085, AWI_PA_02090, AWI_PA_02092, AWI_PA_02095, AWI_PA_02096, AWI_PA_02097, AWI_PA_02105, AWI_PA_02106, AWI_PA_02118, AWI_PA_02121, AWI_PA_02124, AWI_PA_02128, AWI_PA_02129, AWI_PA_02130, AWI_PA_02133, AWI_PA_02135, AWI_PA_02137, AWI_PA_02138, AWI_PA_02140, AWI_PA_02145, AWI_PA_02146, AWI_PA_02147, AWI_PA_02148.
We thank John Paden and the CReSIS team for long-term support with AWI's airborne UWB and UWBM system. Furthermore, we thank Arttu Jutila and Luisa Wagner for support during UWBM campaigns. In addition, we thank Mathieu Morlighem, Joe MacGregor and Julien Bodart for providing radar survey line coverage data for Greenland and Antarctica. Moreover, we thank Charlotte Carter and Hameed Moqadam for contributing checking and fixing ice surface picks.
Finally, we wish to remember our dear colleague and co-author Pascal H. Andreas, who passed away unexpectedly and far too soon in January 2026. He would have turned 30 in April 2026. Pascal, we miss you and we will not forget you.
This research has been supported by the Deutsche Forschungsgemeinschaft (grant nos. 506043073, 541978456, and 522419679).
The article processing charges for this open-access publication were covered by the Alfred-Wegener-Institut Helmholtz-Zentrum für Polar- und Meeresforschung.
This paper was edited by Joseph MacGregor and reviewed by Rene Forsberg and Julien Bodart.
Alfred-Wegener-Institut, Helmholtz-Zentrum für Polar- und Meeresforschung: Neumayer III and Kohnen Station in Antarctica operated by the Alfred Wegener Institute, Journal of Large-Scale Research Facilities JLSRF, 2, 85, https://doi.org/10.17815/jlsrf-2-152, 2016a. a
Alfred-Wegener-Institut, Helmholtz-Zentrum für Polar- und Meeresforschung: Polar aircraft Polar5 and Polar6 operated by the Alfred Wegener Institute, Journal of Large-Scale Research Facilities JLSRF, 2, 87, https://doi.org/10.17815/jlsrf-2-153, 2016b. a, b
Anschütz, H., Eisen, O., Rack, W., and Scheinert, M.: Periodic surface features in coastal East Antarctica, Geophys. Res. Lett., 33, https://doi.org/10.1029/2006gl027871, 2006. a
Anschütz, H., Steinhage, D., Eisen, O., Oerter, H., Horwath, M., and Ruth, U.: Small-scale spatio-temporal characteristics of accumulation rates in western Dronning Maud Land, Antarctica, J. Glaciol., 54, 315–323, https://doi.org/10.3189/002214308784886243, 2008. a
Arenas-Pingarrón, Á., Corr, H. F. J., Robinson, C., Jordan, T. A., and Brennan, P. V.: Polarimetric airborne scientific instrument, mark 2, an ice-sounding airborne synthetic aperture radar for subglacial 3D imagery, IET Radar Sonar Nav., 17, 1391–1404, https://doi.org/10.1049/rsn2.12428, 2023. a
Arnold, E., Leuschen, C., Rodriguez-Morales, F., Li, J., Paden, J., Hale, R., and Keshmiri, S.: CReSIS airborne radars and platforms for ice and snow sounding, Ann. Glaciol., 61, 58–67, https://doi.org/10.1017/aog.2019.37, 2020. a
Bamber, J. L., Griggs, J. A., Hurkmans, R. T. W. L., Dowdeswell, J. A., Gogineni, S. P., Howat, I., Mouginot, J., Paden, J., Palmer, S., Rignot, E., and Steinhage, D.: A new bed elevation dataset for Greenland, The Cryosphere, 7, 499–510, https://doi.org/10.5194/tc-7-499-2013, 2013. a
Bindschadler, R., Vornberger, P., Fleming, A., Fox, A., Mullins, J., Binnie, D., Paulsen, S. J., Granneman, B., and Gorodetzky, D.: The Landsat Image Mosaic of Antarctica, Remote Sens. Environ., 112, 4214–4226, https://doi.org/10.1016/j.rse.2008.07.006, 2008. a
Bingham, R. G., Rippin, D. M., Karlsson, N. B., Corr, H. F. J., Ferraccioli, F., Jordan, T. A., Brocq, A. M. L., Rose, K. C., Ross, N., and Siegert, M. J.: Ice-flow structure and ice dynamic changes in the Weddell Sea sector of West Antarctica from radar-imaged internal layering, J. Geophys. Res.-Earth Surf., 120, 655–670, https://doi.org/10.1002/2014jf003291, 2015. a
Bingham, R. G., Bodart, J. A., Cavitte, M. G. P., Chung, A., Sanderson, R. J., Sutter, J. C. R., Eisen, O., Karlsson, N. B., MacGregor, J. A., Ross, N., Young, D. A., Ashmore, D. W., Born, A., Chu, W., Cui, X., Drews, R., Franke, S., Goel, V., Goodge, J. W., Henry, A. C. J., Hermant, A., Hills, B. H., Holschuh, N., Koutnik, M. R., Leysinger Vieli, G. J.-M. C., MacKie, E. J., Mantelli, E., Martín, C., Ng, F. S. L., Oraschewski, F. M., Napoleoni, F., Parrenin, F., Popov, S. V., Rieckh, T., Schlegel, R., Schroeder, D. M., Siegert, M. J., Tang, X., Teisberg, T. O., Winter, K., Yan, S., Davis, H., Dow, C. F., Fudge, T. J., Jordan, T. A., Kulessa, B., Matsuoka, K., Nyqvist, C. J., Rahnemoonfar, M., Siegfried, M. R., Singh, S., Višnjević, V., Zamora, R., and Zuhr, A.: Review article: AntArchitecture – building an age–depth model from Antarctica's radiostratigraphy to explore ice-sheet evolution, The Cryosphere, 19, 4611–4655, https://doi.org/10.5194/tc-19-4611-2025, 2025. a, b, c, d, e
Bodart, J. A., Bingham, R. G., Ashmore, D. W., Karlsson, N. B., Hein, A. S., and Vaughan, D. G.: Age-Depth Stratigraphy of Pine Island Glacier Inferred From Airborne Radar and Ice-Core Chronology, J. Geophys. Res.-Earth Surf., 126, https://doi.org/10.1029/2020jf005927, 2021. a
Bodart, J. A., Višnjević, V., Franke, S., Helm, V., Eisen, O., Hermant, A., Zuhr, A. M., Steinhage, D., and Sutter, J. C. R.: Radar isochrones as constraints on paleo–ice-sheet model simulations in two off-divide regions of East Antarctica, The Cryosphere, 20, 1379–1404, https://doi.org/10.5194/tc-20-1379-2026, 2026. a, b, c, d, e, f
Bons, P. D., Jansen, D., Mundel, F., Bauer, C. C., Binder, T., Eisen, O., Jessell, M. W., Llorens, M.-G., Steinbach, F., Steinhage, D., and Weikusat, I.: Converging flow and anisotropy cause large-scale folding in Greenland's ice sheet, Nat. Commun., 7, 11427, https://doi.org/10.1038/ncomms11427, 2016. a
Bons, P. D., de Riese, T., Franke, S., Llorens, M.-G., Sachau, T., Stoll, N., Weikusat, I., Westhoff, J., and Zhang, Y.: Comment on “Exceptionally high heat flux needed to sustain the Northeast Greenland Ice Stream” by Smith-Johnsen et al. (2020), The Cryosphere, 15, 2251–2254, https://doi.org/10.5194/tc-15-2251-2021, 2021. a
Bons, P. D., Hu, Y., Llorens, M.-G., Franke, S., Stoll, N., Weikusat, I., Westhoff, J., and Zhang, Y.: Folding due to anisotropy in ice, from drill-core-scale cloudy bands to km-scale internal reflection horizons, The Cryosphere, 19, 5095–5109, https://doi.org/10.5194/tc-19-5095-2025, 2025. a, b
Callens, D., Matsuoka, K., Steinhage, D., Smith, B., Witrant, E., and Pattyn, F.: Transition of flow regime along a marine-terminating outlet glacier in East Antarctica, The Cryosphere, 8, 867–875, https://doi.org/10.5194/tc-8-867-2014, 2014. a
Carter, C. M., Bentley, M. J., Jamieson, S. S. R., Paxman, G. J. G., Jordan, T. A., Bodart, J. A., Ross, N., and Napoleoni, F.: Extensive palaeo-surfaces beneath the Evans–Rutford region of the West Antarctic Ice Sheet control modern and past ice flow, The Cryosphere, 18, 2277–2296, https://doi.org/10.5194/tc-18-2277-2024, 2024. a
Carter, C. M., Franke, S., Jansen, D., Stokes, C. R., Helm, V., Paden, J., and Eisen, O.: Formation of mega-scale glacial lineations far inland beneath the onset of the Northeast Greenland Ice Stream, The Cryosphere, 19, 5299–5315, https://doi.org/10.5194/tc-19-5299-2025, 2025a. a, b, c, d, e, f
Carter, C. M., Franke, S., Paxman, G. J. G., Jamieson, S. S., Bentley, M. J., Jansen, D., Paden, J., and Eisen, O.: Topographic and geologic controls on the Northeast Greenland Ice Stream, Ann. Glaciol., 66, e29, https://doi.org/10.1017/aog.2025.10028, 2025b. a
Christmann, J., Helm, V., Khan, S. A., Kleiner, T., Müller, R., Morlighem, M., Neckel, N., Rückamp, M., Steinhage, D., Zeising, O., and Humbert, A.: Elastic deformation plays a non-negligible role in Greenland's outlet glacier flow, Commun. Earth Environ., 2, 232, https://doi.org/10.1038/s43247-021-00296-3, 2021. a, b, c
Chung, A., Parrenin, F., Steinhage, D., Mulvaney, R., Martín, C., Cavitte, M. G. P., Lilien, D. A., Helm, V., Taylor, D., Gogineni, P., Ritz, C., Frezzotti, M., O'Neill, C., Miller, H., Dahl-Jensen, D., and Eisen, O.: Stagnant ice and age modelling in the Dome C region, Antarctica, The Cryosphere, 17, 3461–3483, https://doi.org/10.5194/tc-17-3461-2023, 2023. a
Church, J. A., Clark, P. U., Cazenave, A., Gregory, J. M., Jevrejeva, S., Levermann, A., Merrifield, M. A., Milne, G. A., Nerem, R. S., Nunn, P. D., Payne, A. J., Pfeffer, W. T., Stammer, D., and Unnikrishnan, A. S.: Sea Level Change, in: Climate Change 2013: The Physical Science Basis. Contribution of Working Group I to the Fifth Assessment Report of the Intergovernmental Panel on Climate Change, edited by: Stocker, T. F., Qin, D., Plattner, G.-K., Tignor, M., Allen, S. K., Boschung, J., Nauels, A., Xia, Y., Bex, V., and Midgley, P. M., Cambridge University Press, Cambridge, United Kingdom and New York, NY, USA, 2013. a
Culberg, R., Schroeder, D. M., and Chu, W.: Extreme melt season ice layers reduce firn permeability across Greenland, Nat. Commun., 12, 2336, https://doi.org/10.1038/s41467-021-22656-5, 2021. a
Dahl-Jensen, D., Gundestrup, N., Keller, K., Johnsen, S., Gogineni, S., Allen, C., Chuah, T., Miller, H., Kipfstuhl, S., and Waddington, E.: A search in north Greenland for a new ice-core drill site, J. Glaciol., 43, 300–306, https://doi.org/10.3189/s0022143000003245, 1997. a
Dahl-Jensen, D., Gundestrup, N. S., Miller, H., Watanabe, O., Johnsen, S. J., Steffensen, J. P., Clausen, H. B., Svensson, A., and Larsen, L. B.: The NorthGRIP deep drilling programme, Ann. Glaciol., 35, 1–4, https://doi.org/10.3189/172756402781817275, 2002. a
Davis, C.: A robust threshold retracking algorithm for measuring ice-sheet surface elevation change from satellite radar altimeters, IEEE T. Geosci. Remote, 35, 974–979, https://doi.org/10.1109/36.602540, 1997. a
Dreier, M., Koch, M., Gourmelon, N., Blindow, N., Steinhage, D., Wu, F., Seehaus, T., Braun, M., Maier, A., and Christlein, V.: IceAnatomy: a benchmark dataset and methodology for automatic ice boundary extraction from radio-echo sounding data, The Cryosphere, 19, 5337–5359, https://doi.org/10.5194/tc-19-5337-2025, 2025. a
Drews, R., Eisen, O., Weikusat, I., Kipfstuhl, S., Lambrecht, A., Steinhage, D., Wilhelms, F., and Miller, H.: Layer disturbances and the radio-echo free zone in ice sheets, The Cryosphere, 3, 195–203, https://doi.org/10.5194/tc-3-195-2009, 2009. a
Drews, R., Eisen, O., Steinhage, D., Weikusat, I., Kipfstuhl, S., and Wilhelms, F.: Potential mechanisms for anisotropy in ice-penetrating radar data, J. Glaciol., 58, 613–624, https://doi.org/10.3189/2012jog11j114, 2012. a
Drews, R., Martín, C., Steinhage, D., and Eisen, O.: Characterizing the glaciological conditions at Halvfarryggen ice dome, Dronning Maud Land, Antarctica, J. Glaciol., 59, 9–20, https://doi.org/10.3189/2013jog12j134, 2013. a, b
Drews, R., Pattyn, F., Hewitt, I. J., Ng, F. S. L., Berger, S., Matsuoka, K., Helm, V., Bergeot, N., Favier, L., and Neckel, N.: Actively evolving subglacial conduits and eskers initiate ice shelf channels at an Antarctic grounding line, Nat. Commun., 8, 15228, https://doi.org/10.1038/ncomms15228, 2017. a, b
Drews, R., Schannwell, C., Ehlers, T. A., Gladstone, R., Pattyn, F., and Matsuoka, K.: Atmospheric and Oceanographic Signatures in the Ice Shelf Channel Morphology of Roi Baudouin Ice Shelf, East Antarctica, Inferred From Radar Data, J. Geophys. Res.-Earth Surf., 125, https://doi.org/10.1029/2020jf005587, 2020. a
Eagles, G., Karlsson, N. B., Ruppel, A., Steinhage, D., Jokat, W., and Läufer, A.: Erosion at extended continental margins: Insights from new aerogeophysical data in eastern Dronning Maud Land, Gondwana Res., 63, 105–116, https://doi.org/10.1016/j.gr.2018.05.011, 2018. a, b, c, d
Eisen, O., Wilhelms, F., Steinhage, D., and Schwander, J.: Improved method to determine radio-echo sounding reflector depths from ice-core profiles of permittivity and conductivity, J. Glaciol., 52, 299–310, https://doi.org/10.3189/172756506781828674, 2006. a
Eisen, O., Hamann, I., Kipfstuhl, S., Steinhage, D., and Wilhelms, F.: Direct evidence for continuous radar reflector originating from changes in crystal-orientation fabric, The Cryosphere, 1, 1–10, https://doi.org/10.5194/tc-1-1-2007, 2007. a, b
Eisen, O., Winter, A., Steinhage, D., Kleiner, T., and Humbert, A.: Basal roughness of the East Antarctic Ice Sheet in relation to flow speed and basal thermal state, Ann. Glaciol., 61, 162–175, https://doi.org/10.1017/aog.2020.47, 2020. a, b, c
Eisen, O., Steinhage, D., Franke, S., Helm, V., Binder, T., Drews, R., Eagles, G., Humbert, A., Jansen, D., Jokat, W., Lambrecht, A., Mieth, M., Riedel, S., and Miller, H.: Collection of datasets from AWI's radio-echo sounding systems on ice sheets and glaciers, PANGAEA [dataset bibliography], https://doi.org/10.1594/PANGAEA.972094, 2024. a, b, c, d, e, f, g, h
Eisen, O., Jansen, D., Franke, S., Helm, V., Zeising, O., Carter, C., Gerber, T., Nymand, N., Dahl-Jensen, D., Paden, J., and Steinhage, D.: Airborne radar polarimetry over the Northeast Greenland Ice Stream, EGU General Assembly 2025, Vienna, Austria, 27 April–2 May 2025, EGU25-1197, https://doi.org/10.5194/egusphere-egu25-1197, 2025. a
Eisermann, H., Eagles, G., Ruppel, A., Smith, E. C., and Jokat, W.: Bathymetry Beneath Ice Shelves of Western Dronning Maud Land, East Antarctica, and Implications on Ice Shelf Stability, Geophys. Res. Lett., 47, https://doi.org/10.1029/2019gl086724, 2020. a, b
Eisermann, H., Eagles, G., Ruppel, A. S., Läufer, A., and Jokat, W.: Bathymetric Control on Borchgrevink and Roi Baudouin Ice Shelves in East Antarctica, J. Geophys. Res.-Earth Surf., 126, https://doi.org/10.1029/2021jf006342, 2021. a, b
Eisermann, H., Eagles, G., and Jokat, W.: Coastal bathymetry in central Dronning Maud Land controls ice shelf stability, Sci. Rep., 14, 1367, https://doi.org/10.1038/s41598-024-51882-2, 2024. a
Eisermann, H., Ruppel, A., Hattermann, T., Matsuoka, K., Darelius, S. F. E., Johann, F., Finucane, G., Helm, V., Steinhage, D., Leinen, S., Läufer, A., and Eagles, G.: Uncovered bathymetry under Antarctica's fourth largest ice shelf reveals potential for seasonal warm water inflow, Research Square [preprint], https://doi.org/10.21203/rs.3.rs-6328160/v1, 2025. a
Ershadi, M. R., Drews, R., Tison, J.-L., Martin, C., Henry, A. C. J., Oraschewski, F. M., Tsibulskaya, V., Sun, S., Wauthy, S., Koch, I., Bons, P., Eisen, O., and Pattyn, F.: Investigating the dynamic history of a promontory ice rise using radar data, J. Glaciol., 71, 1–35, https://doi.org/10.1017/jog.2024.70, 2024. a, b
Fahnestock, M., Abdalati, W., Joughin, I., Brozena, J., and Gogineni, P.: High Geothermal Heat Flow, Basal Melt, and the Origin of Rapid Ice Flow in Central Greenland, Science, 294, 2338–2342, https://doi.org/10.1126/science.1065370, 2001. a
Felden, J., Möller, L., Schindler, U., Huber, R., Schumacher, S., Koppe, R., Diepenbroek, M., and Glöckner, F. O.: PANGAEA – Data Publisher for Earth & Environmental Science, Sci. Data, 10, 347, https://doi.org/10.1038/s41597-023-02269-x, 2023. a, b
Forster, R. R., Box, J. E., Broeke, M. R. van den, Miège, C., Burgess, E. W., Angelen, J. H. van, Lenaerts, J. T. M., Koenig, L. S., Paden, J., Lewis, C., Gogineni, S. P., Leuschen, C., and McConnell, J. R.: Extensive liquid meltwater storage in firn within the Greenland ice sheet, Nat. Geosci., 7, 95–98, https://doi.org/10.1038/ngeo2043, 2014. a
Franke, S., Jansen, D., Binder, T., Dörr, N., Helm, V., Paden, J., Steinhage, D., and Eisen, O.: Bed topography and subglacial landforms in the onset region of the Northeast Greenland Ice Stream, Ann. Glaciol., 61, 143–153, https://doi.org/10.1017/aog.2020.12, 2020. a, b
Franke, S., Eisermann, H., Jokat, W., Eagles, G., Asseng, J., Miller, H., Steinhage, D., Helm, V., Eisen, O., and Jansen, D.: Preserved landscapes underneath the Antarctic Ice Sheet reveal the geomorphological history of Jutulstraumen Basin, Earth Surf. Proc. Land., 46, 2728–2745, https://doi.org/10.1002/esp.5203, 2021a. a, b, c, d, e
Franke, S., Jansen, D., Beyer, S., Neckel, N., Binder, T., Paden, J., and Eisen, O.: Complex Basal Conditions and Their Influence on Ice Flow at the Onset of the Northeast Greenland Ice Stream, J. Geophys. Res.-Earth Surf., 126, https://doi.org/10.1029/2020jf005689, 2021b. a, b, c
Franke, S., Bons, P. D., Westhoff, J., Weikusat, I., Binder, T., Streng, K., Steinhage, D., Helm, V., Eisen, O., Paden, J. D., Eagles, G., and Jansen, D.: Holocene ice-stream shutdown and drainage basin reconfiguration in northeast Greenland, Nat. Geosci., 15, 995–1001, https://doi.org/10.1038/s41561-022-01082-2, 2022a. a, b, c
Franke, S., Eckstaller, A., Heitland, T., Schaefer, T., and Asseng, J.: The role of Antarctic overwintering teams and their significance for German polar research, Polarforschung, 90, 65–79, https://doi.org/10.5194/polf-90-65-2022, 2022b. a
Franke, S., Jansen, D., Binder, T., Paden, J. D., Dörr, N., Gerber, T. A., Miller, H., Dahl-Jensen, D., Helm, V., Steinhage, D., Weikusat, I., Wilhelms, F., and Eisen, O.: Airborne ultra-wideband radar sounding over the shear margins and along flow lines at the onset region of the Northeast Greenland Ice Stream, Earth Syst. Sci. Data, 14, 763–779, https://doi.org/10.5194/essd-14-763-2022, 2022c. a, b, c, d, e
Franke, S., Bons, P. D., Streng, K., Mundel, F., Binder, T., Weikusat, I., Bauer, C. C., Paden, J. D., Dörr, N., Helm, V., Steinhage, D., Eisen, O., and Jansen, D.: Three-dimensional topology dataset of folded radar stratigraphy in northern Greenland, Sci. Data, 10, 525, https://doi.org/10.1038/s41597-023-02339-0, 2023a. a, b
Franke, S., Gerber, T., Warren, C., Jansen, D., Eisen, O., and Dahl-Jensen, D.: Investigating the Radar Response of Englacial Debris Entrained Basal Ice Units in East Antarctica Using Electromagnetic Forward Modeling, IEEE T. Geosci. Remote, 61, 1–16, https://doi.org/10.1109/tgrs.2023.3277874, 2023b. a, b
Franke, S., Wolovick, M., Drews, R., Jansen, D., Matsuoka, K., and Bons, P. D.: Sediment Freeze-On and Transport Near the Onset of a Fast-Flowing Glacier in East Antarctica, Geophys. Res. Lett., 51, https://doi.org/10.1029/2023gl107164, 2024. a, b, c, d
Franke, S., Neudert, M., Helm, V., Jutila, A., Hames, O., Neckel, N., Arndt, S., and Haas, C.: Iceberg influence on snow distribution and slush formation on Antarctic landfast sea ice from airborne multi-sensor observations, The Cryosphere, 19, 6319–6339, https://doi.org/10.5194/tc-19-6319-2025, 2025a. a, b
Franke, S., Steinhage, D., Helm, V., Zuhr, A. M., Bodart, J. A., Eisen, O., and Bons, P.: Age–depth distribution in western Dronning Maud Land, East Antarctica, and Antarctic-wide comparisons of internal reflection horizons, The Cryosphere, 19, 1153–1180, https://doi.org/10.5194/tc-19-1153-2025, 2025b. a, b, c, d, e, f, g, h
Fretwell, P., Pritchard, H. D., Vaughan, D. G., Bamber, J. L., Barrand, N. E., Bell, R., Bianchi, C., Bingham, R. G., Blankenship, D. D., Casassa, G., Catania, G., Callens, D., Conway, H., Cook, A. J., Corr, H. F. J., Damaske, D., Damm, V., Ferraccioli, F., Forsberg, R., Fujita, S., Gim, Y., Gogineni, P., Griggs, J. A., Hindmarsh, R. C. A., Holmlund, P., Holt, J. W., Jacobel, R. W., Jenkins, A., Jokat, W., Jordan, T., King, E. C., Kohler, J., Krabill, W., Riger-Kusk, M., Langley, K. A., Leitchenkov, G., Leuschen, C., Luyendyk, B. P., Matsuoka, K., Mouginot, J., Nitsche, F. O., Nogi, Y., Nost, O. A., Popov, S. V., Rignot, E., Rippin, D. M., Rivera, A., Roberts, J., Ross, N., Siegert, M. J., Smith, A. M., Steinhage, D., Studinger, M., Sun, B., Tinto, B. K., Welch, B. C., Wilson, D., Young, D. A., Xiangbin, C., and Zirizzotti, A.: Bedmap2: improved ice bed, surface and thickness datasets for Antarctica, The Cryosphere, 7, 375–393, https://doi.org/10.5194/tc-7-375-2013, 2013. a
Frémand, A. C., Bodart, J. A., Jordan, T. A., Ferraccioli, F., Robinson, C., Corr, H. F. J., Peat, H. J., Bingham, R. G., and Vaughan, D. G.: British Antarctic Survey's aerogeophysical data: releasing 25 years of airborne gravity, magnetic, and radar datasets over Antarctica, Earth Syst. Sci. Data, 14, 3379–3410, https://doi.org/10.5194/essd-14-3379-2022, 2022. a
Frémand, A. C., Fretwell, P., Bodart, J. A., Pritchard, H. D., Aitken, A., Bamber, J. L., Bell, R., Bianchi, C., Bingham, R. G., Blankenship, D. D., Casassa, G., Catania, G., Christianson, K., Conway, H., Corr, H. F. J., Cui, X., Damaske, D., Damm, V., Drews, R., Eagles, G., Eisen, O., Eisermann, H., Ferraccioli, F., Field, E., Forsberg, R., Franke, S., Fujita, S., Gim, Y., Goel, V., Gogineni, S. P., Greenbaum, J., Hills, B., Hindmarsh, R. C. A., Hoffman, A. O., Holmlund, P., Holschuh, N., Holt, J. W., Horlings, A. N., Humbert, A., Jacobel, R. W., Jansen, D., Jenkins, A., Jokat, W., Jordan, T., King, E., Kohler, J., Krabill, W., Kusk Gillespie, M., Langley, K., Lee, J., Leitchenkov, G., Leuschen, C., Luyendyk, B., MacGregor, J., MacKie, E., Matsuoka, K., Morlighem, M., Mouginot, J., Nitsche, F. O., Nogi, Y., Nost, O. A., Paden, J., Pattyn, F., Popov, S. V., Rignot, E., Rippin, D. M., Rivera, A., Roberts, J., Ross, N., Ruppel, A., Schroeder, D. M., Siegert, M. J., Smith, A. M., Steinhage, D., Studinger, M., Sun, B., Tabacco, I., Tinto, K., Urbini, S., Vaughan, D., Welch, B. C., Wilson, D. S., Young, D. A., and Zirizzotti, A.: Antarctic Bedmap data: Findable, Accessible, Interoperable, and Reusable (FAIR) sharing of 60 years of ice bed, surface, and thickness data, Earth Syst. Sci. Data, 15, 2695–2710, https://doi.org/10.5194/essd-15-2695-2023, 2023. a, b
Gazdag, J.: Wave equation migration with the phase-shift method, Geophysics, 43, 1342–1351, https://doi.org/10.1190/1.1440899, 1978. a
Gerber, T. A., Hvidberg, C. S., Rasmussen, S. O., Franke, S., Sinnl, G., Grinsted, A., Jansen, D., and Dahl-Jensen, D.: Upstream flow effects revealed in the EastGRIP ice core using Monte Carlo inversion of a two-dimensional ice-flow model, The Cryosphere, 15, 3655–3679, https://doi.org/10.5194/tc-15-3655-2021, 2021. a, b
Gerber, T. A., Lilien, D. A., Rathmann, N. M., Franke, S., Young, T. J., Valero-Delgado, F., Ershadi, M. R., Drews, R., Zeising, O., Humbert, A., Stoll, N., Weikusat, I., Grinsted, A., Hvidberg, C. S., Jansen, D., Miller, H., Helm, V., Steinhage, D., O'Neill, C., Paden, J., Gogineni, S. P., Dahl-Jensen, D., and Eisen, O.: Crystal orientation fabric anisotropy causes directional hardening of the Northeast Greenland Ice Stream, Nat. Commun., 14, 2653, https://doi.org/10.1038/s41467-023-38139-8, 2023. a, b, c, d, e, f
Gerber, T. A., Lilien, D. A., Nymand, N. F., Steinhage, D., Eisen, O., and Dahl-Jensen, D.: Anisotropic scattering in radio-echo sounding: insights from northeast Greenland, The Cryosphere, 19, 1955–1971, https://doi.org/10.5194/tc-19-1955-2025, 2025. a
Goeller, S., Steinhage, D., Thoma, M., and Grosfeld, K.: Assessing the subglacial lake coverage of Antarctica, Ann. Glaciol., 57, 109–117, https://doi.org/10.1017/aog.2016.23, 2016. a, b, c, d
Gogineni, S., Chuah, T., Allen, C., Jezek, K., and Moore, R. K.: An improved coherent radar depth sounder, J. Glaciol., 44, 659–669, https://doi.org/10.3189/s0022143000002161, 1998. a
Golynsky, A. V., Ferraccioli, F., Hong, J. K., Golynsky, D. A., Frese, R. R. B. v., Young, D. A., Blankenship, D. D., Holt, J. W., Ivanov, S. V., Kiselev, A. V., Masolov, V. N., Eagles, G., Gohl, K., Jokat, W., Damaske, D., Finn, C., Aitken, A., Bell, R. E., Armadillo, E., Jordan, T. A., Greenbaum, J. S., Bozzo, E., Caneva, G., Forsberg, R., Ghidella, M., Galindo-Zaldivar, J., Bohoyo, F., Martos, Y. M., Nogi, Y., Quartini, E., Kim, H. R., and Roberts, J. L.: New Magnetic Anomaly Map of the Antarctic, Geophys. Res. Lett., 45, 6437–6449, https://doi.org/10.1029/2018gl078153, 2018. a
Graser, A., Sutton, T., and Bernasocchi, M.: The QGIS project: Spatial without compromise, Patterns, 6, 101265, https://doi.org/10.1016/j.patter.2025.101265, 2025. a
Gudlaugsson, E., Humbert, A., Kleiner, T., Kohler, J., and Andreassen, K.: The influence of a model subglacial lake on ice dynamics and internal layering, The Cryosphere, 10, 751–760, https://doi.org/10.5194/tc-10-751-2016, 2016. a
Guy, A., Eagles, G., and Eisen, O.: Tectonic structures of the Dome Fuji region, East Antarctica, based on new magnetic data, Sci. Rep., 14, 18607, https://doi.org/10.1038/s41598-024-69471-8, 2024. a, b
Hale, R., Miller, H., Gogineni, S., Yan, J. B., Rodriguez-Morales, F., Leuschen, C., Paden, J., Li, J., Binder, T., Steinhage, D., Gehrmann, M., and Braaten, D.: Multi-Channel Ultra-Wideband Radar Sounder and Imager, 2016 IEEE International Geoscience and Remote Sensing Symposium (IGARSS), 2112–2115, https://doi.org/10.1109/igarss.2016.7729545, 2016. a, b
Hames, O., Bouzdine, I., Helm, V., Haas, C., and Lehning, M.: Iceberg-induced snowdrift formation on Antarctic landfast sea ice: effects of wind and iceberg size, J. Glaciol., 72, e25, https://doi.org/10.1017/jog.2026.10139, 2026. a
Hawley, R. L., Morris, E. M., Cullen, R., Nixdorf, U., Shepherd, A. P., and Wingham, D. J.: ASIRAS airborne radar resolves internal annual layers in the dry-snow zone of Greenland, Geophys. Res. Lett., 33, https://doi.org/10.1029/2005gl025147, 2006. a
Heincke, B. H., Szwillus, W., Freienstein, J., Ebbing, J., Gaina, C., Ruppel, A., Dilixiati, Y., and Wansing, A.: A new magnetic anomaly map for Greenland based on a combination of equivalent source modeling and spherical harmonic expansion, Earth Syst. Sci. Data, 18, 1943–1967, https://doi.org/10.5194/essd-18-1943-2026, 2026. a, b
Helm, V.: Airborne SAR/Interferometric Radar Altimeter System (ASIRAS) – Kalibrierung, Validierung und Interpretation der Messergebnisse, Phd Thesis, http://nbn-resolving.de/urn:nbn:de:gbv:46-diss000111668 (last access: 19 April 2026), 2008. a, b
Helm, V., Rack, W., Cullen, R., Nienow, P., Mair, D., Parry, V., and Wingham, D. J.: Winter accumulation in the percolation zone of Greenland measured by airborne radar altimeter, Geophys. Res. Lett., 34, https://doi.org/10.1029/2006gl029185, 2007. a, b
Hempel, L., Thyssen, F., Gundestrup, N., Clausen, H. B., and Miller, H.: A comparison of radio-echo sounding data and electrical conductivity of the GRIP ice core, J. Glaciol., 46, 369–374, https://doi.org/10.3189/172756500781833070, 2000. a
Henry, A. C. J., Martín, C., and Drews, R.: Modelling the three-dimensional, diagnostic fabric anisotropy field of an ice rise, J. Glaciol., 71, e31, https://doi.org/10.1017/jog.2025.14, 2025a. a, b
Henry, A. C. J., Schannwell, C., Višnjević, V., Millstein, J., Bons, P. D., Eisen, O., and Drews, R.: Predicting the Three-Dimensional Stratigraphy of an Ice Rise, J. Geophys. Res.-Earth Surf., 130, https://doi.org/10.1029/2024jf007924, 2025b. a, b, c
Heß, R., Albers, K., Konopatzky, P., Koppe, R., and Walter, A.: The Earth Data Portal for Finding and Exploring Research Content, EGU General Assembly 2023, Vienna, Austria, 24–28 April 2023, EGU23-9952, https://doi.org/10.5194/egusphere-egu23-9952, 2023. a
Hills, B. H., Siegfried, M. R., and Schroeder, D. M.: Entrained Water in Basal Ice Suppresses Radar Bed-Echo Power at Active Subglacial Lakes, Geophys. Res. Lett., 51, https://doi.org/10.1029/2024gl109248, 2024. a
Hills, B. H., Young, T. J., Lilien, D. A., Babcock, E., Bienert, N., Blankenship, D., Bradford, J., Brighi, G., Brisbourne, A., Dall, J., Drews, R., Eisen, O., Ershadi, M. R., Gerber, T. A., Holschuh, N., Jansen, D., Jordan, T. M., Karlsson, N. B., Li, J., Martín, C., Matsuoka, K., May, D., Oraschewski, F. M., Paden, J., Rathmann, N. M., Ross, N., Schroeder, D. M., Siegert, M., Siegfried, M. R., Smith, E., and Zeising, O.: Radar Polarimetry in Glaciology: Theory, Measurement Techniques, and Scientific Applications for Investigating the Anisotropy of Ice Masses, Rev. Geophys., 63, https://doi.org/10.1029/2024rg000842, 2025. a, b
Holschuh, N., Christianson, K., Paden, J., Alley, R. B., and Anandakrishnan, S.: Linking postglacial landscapes to glacier dynamics using swath radar at Thwaites Glacier, Antarctica, Geology, 48, 268–272, https://doi.org/10.1130/g46772.1, 2020. a
Holschuh, N., Christianson, K., Dienstfrey, W., Hills, B., Hoffman, A. O., Paden, J., Winter, K., and Zuraw, R.: Entrained debris records regrowth of the Greenland Ice Sheet after the last interglacial, Nat. Geosci., 1–8, https://doi.org/10.1038/s41561-026-01950-1, 2026a. a
Holschuh, N., Eisen, O., Carter, C., Franke, S., Helm, V., Hoffman, A. O., Paden, J., and Christianson, K.: Radar swath imaging of glaciers and ice sheets, Phil. Trans. R. Soc. A, 384, 20240549, https://doi.org/10.1098/rsta.2024.0549, 2026b. a
Humbert, A. and Steinhage, D.: The evolution of the western rift area of the Fimbul Ice Shelf, Antarctica, The Cryosphere, 5, 931–944, https://doi.org/10.5194/tc-5-931-2011, 2011. a, b
Humbert, A., Gross, D., Müller, R., Braun, M., Wal, R. v. d., Broeke, M. v. d., Vaughan, D., and Berg, W. v. d.: Deformation and failure of the ice bridge on the Wilkins Ice Shelf, Antarctica, Ann. Glaciol., 51, 49–55, https://doi.org/10.3189/172756410791392709, 2010. a
Humbert, A., Steinhage, D., Helm, V., Hoerz, S., Berendt, J., Leipprand, E., Christmann, J., Plate, C., and Müller, R.: On the link between surface and basal structures of the Jelbart Ice Shelf, Antarctica, J. Glaciol., 61, 975–986, https://doi.org/10.3189/2015jog15j023, 2015. a, b, c
Humbert, A., Steinhage, D., Helm, V., Beyer, S., and Kleiner, T.: Missing Evidence of Widespread Subglacial Lakes at Recovery Glacier, Antarctica, J. Geophys. Res.-Earth Surf., 123, 2802–2826, https://doi.org/10.1029/2017jf004591, 2018. a, b, c, d
Humbert, A., Schröder, L., Schultz, T., Müller, R., Neckel, N., Helm, V., Zindler, R., Eleftheriadis, K., Salzano, R., and Salvatori, R.: Dark Glacier Surface of Greenland's Largest Floating Tongue Governed by High Local Deposition of Dust, Remote Sens., 12, 3793, https://doi.org/10.3390/rs12223793, 2020. a, b
Humbert, A., Gross, D., Sondershaus, R., Müller, R., Steeb, H., Braun, M., Brauchle, J., Stebner, K., and Rückamp, M.: Fractures in glaciers – Crack tips and their stress fields by observation and modeling, PAMM, 23, e202300260, https://doi.org/10.1002/pamm.202300260, 2023a. a
Humbert, A., Helm, V., Neckel, N., Zeising, O., Rückamp, M., Khan, S. A., Loebel, E., Brauchle, J., Stebner, K., Gross, D., Sondershaus, R., and Müller, R.: Precursor of disintegration of Greenland's largest floating ice tongue, The Cryosphere, 17, 2851–2870, https://doi.org/10.5194/tc-17-2851-2023, 2023b. a, b
Humbert, A., Helm, V., Zeising, O., Neckel, N., Braun, M. H., Khan, S. A., Rückamp, M., Steeb, H., Sohn, J., Bohnen, M., and Müller, R.: Insights into supraglacial lake drainage dynamics: triangular fracture formation, reactivation and long-lasting englacial features, The Cryosphere, 19, 3009–3032, https://doi.org/10.5194/tc-19-3009-2025, 2025. a, b, c, d, e
Huybrechts, P., Steinhage, D., Wilhelms, F., and Bamber, J.: Balance velocities and measured properties of the Antarctic ice sheet from a new compilation of gridded data for modelling, Ann. Glaciol., 30, 52–60, https://doi.org/10.3189/172756400781820778, 2000. a
Jansen, D., Franke, S., Bauer, C. C., Binder, T., Dahl-Jensen, D., Eichler, J., Eisen, O., Hu, Y., Kerch, J., Llorens, M.-G., Miller, H., Neckel, N., Paden, J., Riese, T. d., Sachau, T., Stoll, N., Weikusat, I., Wilhelms, F., Zhang, Y., and Bons, P. D.: Shear margins in upper half of Northeast Greenland Ice Stream were established two millennia ago, Nat. Commun., 15, 1193, https://doi.org/10.1038/s41467-024-45021-8, 2024. a, b, c, d, e, f
Jenett, M. and Steinhage, D.: Hochauflösendes, flugzeuggestütztes FMCW-Radargerät zur Bestimmung interner Eisschichtungen in den oberen 200 m polarer Eisschilde, Georadar – Erfahrungen und Perspektiven, I/2012, 26–31, 2012. a
Jezek, K., Wu, X., Gogineni, P., Rodríguez, E., Freeman, A., Rodriguez-Morales, F., and Clark, C. D.: Radar images of the bed of the Greenland Ice Sheet, Geophys. Res. Lett., 38, https://doi.org/10.1029/2010gl045519, 2011. a
Jezek, K. C., Bentley, C. R., and Clough, J. W.: Electromagnetic Sounding of Bottom Crevasses on the Ross Ice Shelf, Antarctica, J. Glaciol., 24, 321–330, https://doi.org/10.3189/S0022143000014842, 1979. a
Johann, F., Eisermann, H., and Eagles, G.: A comparison and combination of stable platform and strapdown airborne gravimeters, J. Appl. Geophys., 241, 105826, https://doi.org/10.1016/j.jappgeo.2025.105826, 2025. a, b
Joughin, I., Smith, B. E., and Howat, I. M.: A complete map of Greenland ice velocity derived from satellite data collected over 20 years, J. Glaciol., 64, 1–11, https://doi.org/10.1017/jog.2017.73, 2018. a, b
Jourdain, N. C., Mathiot, P., Burgard, C., Caillet, J., and Kittel, C.: Ice Shelf Basal Melt Rates in the Amundsen Sea at the End of the 21st Century, Geophys. Res. Lett., 49, e2022GL100629, https://doi.org/10.1029/2022GL100629, 2022. a
Jutila, A., Hendricks, S., Ricker, R., von Albedyll, L., Krumpen, T., and Haas, C.: Retrieval and parameterisation of sea-ice bulk density from airborne multi-sensor measurements, The Cryosphere, 16, 259–275, https://doi.org/10.5194/tc-16-259-2022, 2022. a, b
Jutila, A., King, J., Paden, J., Ricker, R., Hendricks, S., Polashenski, C., Helm, V., Binder, T., and Haas, C.: High-Resolution Snow Depth on Arctic Sea Ice From Low-Altitude Airborne Microwave Radar Data, IEEE T. Geosci. Remote, 60, 1–16, https://doi.org/10.1109/tgrs.2021.3063756, 2022. a, b, c
Karlsson, N. B., Binder, T., Eagles, G., Helm, V., Pattyn, F., Van Liefferinge, B., and Eisen, O.: Glaciological characteristics in the Dome Fuji region and new assessment for “Oldest Ice”, The Cryosphere, 12, 2413–2424, https://doi.org/10.5194/tc-12-2413-2018, 2018. a, b, c
Karlsson, N. B., Razik, S., Hörhold, M., Winter, A., Steinhage, D., Binder, T., and Eisen, O.: Surface accumulation in Northern Central Greenland during the last 300 years, Ann. Glaciol., 61, 214–224, https://doi.org/10.1017/aog.2020.30, 2020. a
Karlsson, N. B., Schroeder, D. M., Sørensen, L. S., Chu, W., Dall, J., Andersen, N. H., Dobson, R., Mackie, E. J., Köhn, S. J., Steinmetz, J. E., Tarzona, A. S., Teisberg, T. O., and Skou, N.: A newly digitized ice-penetrating radar data set acquired over the Greenland ice sheet in 1971–1979, Earth Syst. Sci. Data, 16, 3333–3344, https://doi.org/10.5194/essd-16-3333-2024, 2024. a
Kjær, K. H., Larsen, N. K., Binder, T., Bjørk, A. A., Eisen, O., Fahnestock, M. A., Funder, S., Garde, A. A., Haack, H., Helm, V., Houmark-Nielsen, M., Kjeldsen, K. K., Khan, S. A., Machguth, H., McDonald, I., Morlighem, M., Mouginot, J., Paden, J. D., Waight, T. E., Weikusat, C., Willerslev, E., and MacGregor, J. A.: A large impact crater beneath Hiawatha Glacier in northwest Greenland, Sci. Adv., 4, eaar8173, https://doi.org/10.1126/sciadv.aar8173, 2018. a, b, c
Kleiner, T. and Humbert, A.: Numerical simulations of major ice streams in Western Dronning Maud Land, Antarctica, under wet and dry basal conditions, J. Glaciol., 60, 215–232, https://doi.org/10.3189/2014jog13j006, 2014. a, b
Koch, I., Drews, R., Franke, S., Jansen, D., Oraschewski, F. M., Muhle, L. S., Višnjević, V., Matsuoka, K., Pattyn, F., and Eisen, O.: Radar internal reflection horizons from multisystem data reflect ice dynamic and surface accumulation history along the Princess Ragnhild Coast, Dronning Maud Land, East Antarctica, J. Glaciol., 70, 1–19, https://doi.org/10.1017/jog.2023.93, 2023. a, b, c, d, e
Konopatzky, P., Heß, R., Koppe, R., and Walter, A.: A flexible yet sustainable Spatial Data Infrastructure for the Integration of Distributed Research Data, EGU General Assembly 2023, Vienna, Austria, 24–28 April 2023, EGU23-17052, https://doi.org/10.5194/egusphere-egu23-17052, 2023. a
Kowalewski, S., Helm, V., Morris, E. M., and Eisen, O.: The regional-scale surface mass balance of Pine Island Glacier, West Antarctica, over the period 2005–2014, derived from airborne radar soundings and neutron probe measurements, The Cryosphere, 15, 1285–1305, https://doi.org/10.5194/tc-15-1285-2021, 2021. a, b
Lambrecht, A., Mayer, C., Hempel, L., Nixdorf, U., and Oerter, H.: Glaciological Investigations in the Grounding Line Area of the Foundation Ice Stream, Antarctica, Polarforschung, 65, 15–25, http://hdl.handle.net/10013/epic.29738.d001, 1997. a
Lambrecht, A., Mayer, C., Oerter, H., and Nixdorf, U.: Investigations of the mass balance of the southeastern Ronne Ice Shelf, Antarctica, Ann. Glaciol., 29, 250–254, https://doi.org/10.3189/172756499781820996, 1999. a
Lambrecht, A., Sandhäger, H., Vaughan, D., and Mayer, C.: New ice thickness maps of Filchner–Ronne Ice Shelf, Antarctica, with specific focus on grounding lines and marine ice, Antarct. Sci., 19, 521–532, https://doi.org/10.1017/s0954102007000661, 2007. a
Lentz, H., Braun, H.-M., Younis, M., Fischer, C., Wiesbeck, W., and Mavrocordatos, C.: Concept and Realization of an Airborne SAR/Interferometric Radar Altimeter System (ASIRAS), IEEE Int. Geosci. Remote Se., 6, 3099–3101, https://doi.org/10.1109/igarss.2002.1027097, 2002. a, b
Leuschen, C., Gogineni, S., and Tammana, D.: SAR processing of radar echo sounder data, IGARSS 2000. IEEE 2000 International Geoscience and Remote Sensing Symposium. Taking the Pulse of the Planet: The Role of Remote Sensing in Managing the Environment. Proceedings (Cat. No.00CH37120), 6, 2570–2572 vol.6, https://doi.org/10.1109/igarss.2000.859643, 2000. a
Lilien, D. A., Nymand, N. F., Gerber, T. A., Steinhage, D., Jansen, D., Thomson, L., Myers, M., Franke, S., Taylor, D., Gogineni, P., Lemes, M., Vinther, B. M., and Dahl-Jensen, D.: Potential to recover a record of Holocene climate and sea ice from Müller Ice Cap, Canada, J. Glaciol., 70, e72, https://doi.org/10.1017/jog.2024.75, 2024. a, b
Livingstone, S. J., Li, Y., Rutishauser, A., Sanderson, R. J., Winter, K., Mikucki, J. A., Björnsson, H., Bowling, J. S., Chu, W., Dow, C. F., Fricker, H. A., McMillan, M., Ng, F. S. L., Ross, N., Siegert, M. J., Siegfried, M., and Sole, A. J.: Subglacial lakes and their changing role in a warming climate, Nat. Rev. Earth Environ., 3, 1–19, https://doi.org/10.1038/s43017-021-00246-9, 2022. a
Lythe, M. B. and Vaughan, D. G.: BEDMAP: A new ice thickness and subglacial topographic model of Antarctica, J. Geophys. Res.-Sol. Ea., 106, 11335–11351, https://doi.org/10.1029/2000jb900449, 2001. a
MacFerrin, M., Machguth, H., As, D. V., Charalampidis, C., Stevens, C. M., Heilig, A., Vandecrux, B., Langen, P. L., Mottram, R., Fettweis, X., Broeke, M. R. v. d., Pfeffer, W. T., Moussavi, M. S., and Abdalati, W.: Rapid expansion of Greenland's low-permeability ice slabs, Nature, 573, 403–407, https://doi.org/10.1038/s41586-019-1550-3, 2019. a
MacGregor, J. A., Fahnestock, M. A., Catania, G. A., Paden, J. D., Gogineni, S. P., Young, S. K., Rybarski, S. C., Mabrey, A. N., Wagman, B. M., and Morlighem, M.: Radiostratigraphy and age structure of the Greenland Ice Sheet, J. Geophys. Res.-Earth Surf., 120, 212–241, https://doi.org/10.1002/2014jf003215, 2015. a
MacGregor, J. A., Fahnestock, M. A., Paden, J. D., Li, J., Harbeck, J. P., and Aschwanden, A.: A revised and expanded deep radiostratigraphy of the Greenland Ice Sheet from airborne radar sounding surveys between 1993 and 2019, Earth Syst. Sci. Data, 17, 2911–2931, https://doi.org/10.5194/essd-17-2911-2025, 2025. a
Matsuoka, K., Hindmarsh, R. C. A., Moholdt, G., Bentley, M. J., Pritchard, H. D., Brown, J., Conway, H., Drews, R., Durand, G., Goldberg, D., Hattermann, T., Kingslake, J., Lenaerts, J. T. M., Martín, C., Mulvaney, R., Nicholls, K. W., Pattyn, F., Ross, N., Scambos, T., and Whitehouse, P. L.: Antarctic ice rises and rumples: Their properties and significance for ice-sheet dynamics and evolution, Earth Sci. Rev., 150, 724–745, 2015. a
Matsuoka, K., Moholdt, G., Arthur, J. F., Bodart, J. A., Cui, X., Ferraccioli, F., Forsberg, R., Goel, V., Jordan, T. A., McCormack, F. S., Mottram, R., Pritchard, H. D., Shackleton, C., Tinto, K., Boberg, F., Cavitte, M. G. P., Drews, R., Dutrieux, P., Ebbing, J., Eisen, O., Eisermann, H., Gardner, A. S., Greene, C. A., Holschuh, N., Jamieson, S. S. R., Kim, B.-H., Krauzig, N., Kulessa, B., Leuschen, C., Li, J., Li, L., Liebsch, J., MacGregor, J. A., MacKie, E., Mahagaonkar, A., Maton, J., Morlighem, M., Navarro, F., Neff, P., Otosaka, I. N., Pattyn, F., Ruppel, A., Sanderson, R. J., Seroussi, H., Shepherd, A., Siegfried, M. R., Slater, T., Stroeven, A. P., Studinger, M., Teisberg, T., Venturelli, R. A., Winberry, P. J., Zhao, C., An, L., Bamber, J. L., Bell, R. E., Bingham, R. G., Brehmer-Moltmann, J., Eagles, G., Greenbaum, J., Gronset, J., Lee, W. S., Le Meur, E., Jon, L. M., Lindbäck, K., Lidström, S., Lösing, M., Minowa, M., Pandey, M., Ray, Y., Scheinert, M., Schroeder, D. M., Seehaus, T., Shahateet, K., Steinhage, D., Tang, X., Taylor, D., Verboncoeur, H., Yang, J., and Young, D. A.: Towards an improved understanding of the Antarctic coastal zone and its contribution to future global sea level, Rev. Geophys., in review, https://doi.org/10.22541/essoar.175241971.19851046/v1, 2025. a, b
Mavrocordatos, C., Attema, E., Davidson, M., Lentz, H., and Nixdorf, U.: Development of ASIRAS (airborne SAR/Interferometric altimeter system), in: IGARSS 2004. 2004 IEEE Int. Geosci. Remote Se., 4, 2465–2467, 2004. a
Mayer, U., Damaske, D., Steinhage, D., Nixdorf, U., and Miller, H.: First highlights from NOGRAM'98 – Northern Gravity, RadioEcho Sounding and Magnetics, Polarforschung, 69, 25–33, 1999. a, b, c
Mieth, M. and Jokat, W.: New aeromagnetic view of the geological fabric of southern Dronning Maud Land and Coats Land, East Antarctica, Gondwana Res., 25, 358–367, https://doi.org/10.1016/j.gr.2013.04.003, 2014. a, b, c, d, e, f, g, h, i, j
Mieth, M., Jacobs, J., Ruppel, A., Damaske, D., Läufer, A., and Jokat, W.: New detailed aeromagnetic and geological data of eastern Dronning Maud Land: Implications for refining the tectonic and structural framework of Sør Rondane, East Antarctica, Precambrian Res., 245, 174–185, https://doi.org/10.1016/j.precamres.2014.02.009, 2014. a, b, c, d
Millar, D. H. M.: Radio-echo layering in polar ice sheets and past volcanic activity, Nature, 292, 441–443, https://doi.org/10.1038/292441a0, 1981. a
Miège, C., Forster, R. R., Brucker, L., Koenig, L. S., Solomon, D. K., Paden, J. D., Box, J. E., Burgess, E. W., Miller, J. Z., McNerney, L., Brautigam, N., Fausto, R. S., and Gogineni, S.: Spatial extent and temporal variability of Greenland firn aquifers detected by ground and airborne radars, J. Geophys. Res.-Earth Surf., 121, 2381–2398, https://doi.org/10.1002/2016jf003869, 2016. a
Mohammadi-Aragh, M., Zeising, O., Reinert, M., Klingbeil, K., Humbert, A., McPherson, R., Morlighem, M., Timmermann, R., Wekerle, C., and Burchard, H.: Impact of Ice Topography, Basal Channels and Subglacial Discharge on Basal Melting Under the Floating Ice Tongue of 79N Glacier, Northeast Greenland, J. Adv. Model. Earth Sy., 17, e2024MS004735, https://doi.org/10.1029/2024MS004735, 2025. a, b
Mojtabavi, S., Eisen, O., Franke, S., Jansen, D., Steinhage, D., Paden, J., Dahl-Jensen, D., Weikusat, I., Eichler, J., and Wilhelms, F.: Origin of englacial stratigraphy at three deep ice core sites of the Greenland Ice Sheet by synthetic radar modelling, J. Glaciol., 68, 799–811, https://doi.org/10.1017/jog.2021.137, 2022. a
Moqadam, H. and Eisen, O.: Review article: Feature tracing in radio-echo sounding products of terrestrial ice sheets and planetary bodies, The Cryosphere, 19, 2159–2196, https://doi.org/10.5194/tc-19-2159-2025, 2025. a
Moqadam, H., Steinhage, D., Wilhelm, A., and Eisen, O.: Going Deeper With Deep Learning: Automatically Tracing Internal Reflection Horizons in Ice Sheets – Methodology and Benchmark Data Set, J. Geophys. Res.-Machine Learning and Computation, 2, e2024JH000493, https://doi.org/10.1029/2024JH000493, 2025. a
Morlighem, M., Williams, C. N., Rignot, E., An, L., Arndt, J. E., Bamber, J. L., Catania, G., Chauché, N., Dowdeswell, J. A., Dorschel, B., Fenty, I., Hogan, K., Howat, I., Hubbard, A., Jakobsson, M., Jordan, T. M., Kjeldsen, K. K., Millan, R., Mayer, L., Mouginot, J., Noël, B. P. Y., O'Cofaigh, C., Palmer, S., Rysgaard, S., Seroussi, H., Siegert, M. J., Slabon, P., Straneo, F., Broeke, M. R. v. d., Weinrebe, W., Wood, M., and Zinglersen, K. B.: BedMachine v3: Complete Bed Topography and Ocean Bathymetry Mapping of Greenland From Multibeam Echo Sounding Combined With Mass Conservation, Geophys. Res. Lett., 44, 11051–11061, https://doi.org/10.1002/2017gl074954, 2017. a, b, c, d, e
Morlighem, M., Rignot, E., Binder, T., Blankenship, D., Drews, R., Eagles, G., Eisen, O., Ferraccioli, F., Forsberg, R., Fretwell, P., Goel, V., Greenbaum, J. S., Gudmundsson, H., Guo, J., Helm, V., Hofstede, C., Howat, I., Humbert, A., Jokat, W., Karlsson, N. B., Lee, W. S., Matsuoka, K., Millan, R., Mouginot, J., Paden, J., Pattyn, F., Roberts, J., Rosier, S., Ruppel, A., Seroussi, H., Smith, E. C., Steinhage, D., Sun, B., Broeke, M. R. v. d., Ommen, T. D. v., Wessem, M. v., and Young, D. A.: Deep glacial troughs and stabilizing ridges unveiled beneath the margins of the Antarctic ice sheet, Nat. Geosci., 13, 132–137, https://doi.org/10.1038/s41561-019-0510-8, 2020. a, b, c
Mouginot, J., Rignot, E., Scheuchl, B., and Millan, R.: Comprehensive Annual Ice Sheet Velocity Mapping Using Landsat-8, Sentinel-1, and RADARSAT-2 Data, Remote Sens., 9, https://doi.org/10.3390/rs9040364, 2017. a, b, c
Mutter, E. L. and Holschuh, N.: Advancing interpretation of incoherent scattering in ice-penetrating radar data used for ice core site selection, The Cryosphere, 19, 3159–3176, https://doi.org/10.5194/tc-19-3159-2025, 2025. a
Neckel, N., Drews, R., Rack, W., and Steinhage, D.: Basal melting at the Ekström Ice Shelf, Antarctica, estimated from mass flux divergence, Ann. Glaciol., 53, 294–302, https://doi.org/10.3189/2012aog60a167, 2012. a, b
Neckel, N., Franke, S., Helm, V., Drews, R., and Jansen, D.: Evidence of Cascading Subglacial Water Flow at Jutulstraumen Glacier (Antarctica) Derived From Sentinel-1 and ICESat-2 Measurements, Geophys. Res. Lett., 48, https://doi.org/10.1029/2021gl094472, 2021. a, b, c, d, e
Neckel, N., Fuchs, N., Birnbaum, G., Hutter, N., Jutila, A., Buth, L., Albedyll, L. v., Ricker, R., and Haas, C.: Helicopter-borne RGB orthomosaics and photogrammetric digital elevation models from the MOSAiC Expedition, Sci. Data, 10, 426, https://doi.org/10.1038/s41597-023-02318-5, 2023. a, b, c
Nixdorf, U. and Göktas, F.: Spatial depth distribution of the subglacial bed and internal layers in the ice around NGRIP, Greenland, derived with airborne RES, J. Appl. Geophys., 47, 175–182, https://doi.org/10.1016/s0926-9851(01)00062-3, 2001. a, b, c
Nixdorf, U., Steinhage, D., Meyer, U., Hempel, L., Jenett, M., Wachs, P., and Miller, H.: The newly developed airborne radio-echo sounding system of the AWI as a glaciological tool, Ann. Glaciol., 29, 231–238, https://doi.org/10.3189/172756499781821346, 1999. a, b, c
Noble, T. L., Rohling, E. J., Aitken, A. R. A., Bostock, H. C., Chase, Z., Gomez, N., Jong, L. M., King, M. A., Mackintosh, A. N., McCormack, F. S., McKay, R. M., Menviel, L., Phipps, S. J., Weber, M. E., Fogwill, C. J., Gayen, B., Golledge, N. R., Gwyther, D. E., Hogg, A. M., Martos, Y. M., Pena-Molino, B., Roberts, J., van de Flierdt, T., and Williams, T.: The Sensitivity of the Antarctic Ice Sheet to a Changing Climate: Past, Present, and Future, Rev. Geophys., 58, e2019RG000663, https://doi.org/10.1029/2019RG000663, 2020. a
Nogi, Y., Jokat, W., Kitada, K., and Steinhage, D.: Geological structures inferred from airborne geophysical surveys around Lützow-Holm Bay, East Antarctica, Precambrian Res., 234, 279–287, https://doi.org/10.1016/j.precamres.2013.02.008, 2013. a, b
Nymand, N. F., Lilien, D. A., Gerber, T. A., Hvidberg, C. S., Steinhage, D., Gogineni, P., Taylor, D., and Dahl-Jensen, D.: Double Reflections in Polarized Radar Data Reveal Ice Fabric in the North East Greenland Ice Stream, Geophys. Res. Lett., 52, https://doi.org/10.1029/2024gl110453, 2025. a
Open Polar Radar: Open Polar Radar. opr (Version 3.0.1), Zenodo [computer software], https://doi.org/10.5281/zenodo.5683959, 2023. a, b, c, d
Oswald, G. K. A. and Robin, G. D. Q.: Lakes Beneath the Antarctic Ice Sheet, Nature, 245, 251–254, https://doi.org/10.1038/245251a0, 1973. a
Paden, J., Akins, T., Dunson, D., Allen, C., and Gogineni, P.: Ice-sheet bed 3-D tomography, J. Glaciol., 56, 3–11, https://doi.org/10.3189/002214310791190811, 2010. a
Paxman, G. J. G., Jamieson, S. S. R., Ferraccioli, F., Jordan, T. A., Bentley, M. J., Ross, N., Forsberg, R., Matsuoka, K., Steinhage, D., Eagles, G., and Casal, T. G.: Subglacial Geology and Geomorphology of the Pensacola-Pole Basin, East Antarctica, Geochem. Geophys. Geosyst., 20, 2786–2807, https://doi.org/10.1029/2018gc008126, 2019. a
Paxman, G. J. G., Jamieson, S. S. R., Ross, N., Bentley, M. J., Carter, C. M., Jordan, T. A., Cui, X., Lang, S., Sugden, D. E., and Siegert, M. J.: Extensive fluvial surfaces at the East Antarctic margin have modulated ice-sheet evolution, Nat. Geosci., 18, 724–731, https://doi.org/10.1038/s41561-025-01734-z, 2025. a
Paxman, G. J. G., Jordan, T. A., Bentley, M. J., Small, D., Jamieson, S. S. R., and Steinhage, D.: Subglacial Topography of Coats Land Records Post-Gondwanan Landscape Evolution and Early Ice-Sheet Behavior in East Antarctica, J. Geophys. Res.-Earth Surf., 131, https://doi.org/10.1029/2025jf008590, 2026. a
Pritchard, H. D., Fretwell, P. T., Fremand, A. C., Bodart, J. A., Kirkham, J. D., Aitken, A., Bamber, J., Bell, R., Bianchi, C., Bingham, R. G., Blankenship, D. D., Casassa, G., Christianson, K., Conway, H., Corr, H. F. J., Cui, X., Damaske, D., Damm, V., Dorschel, B., Drews, R., Eagles, G., Eisen, O., Eisermann, H., Ferraccioli, F., Field, E., Forsberg, R., Franke, S., Goel, V., Gogineni, S. P., Greenbaum, J., Hills, B., Hindmarsh, R. C. A., Hoffman, A. O., Holschuh, N., Holt, J. W., Humbert, A., Jacobel, R. W., Jansen, D., Jenkins, A., Jokat, W., Jong, L., Jordan, T. A., King, E. C., Kohler, J., Krabill, W., Maton, J., Gillespie, M. K., Langley, K., Lee, J., Leitchenkov, G., Leuschen, C., Luyendyk, B., MacGregor, J. A., MacKie, E., Moholdt, G., Matsuoka, K., Morlighem, M., Mouginot, J., Nitsche, F. O., Nost, O. A., Paden, J., Pattyn, F., Popov, S., Rignot, E., Rippin, D. M., Rivera, A., Roberts, J. L., Ross, N., Ruppel, A., Schroeder, D. M., Siegert, M. J., Smith, A. M., Steinhage, D., Studinger, M., Sun, B., Tabacco, I., Tinto, K. J., Urbini, S., Vaughan, D. G., Wilson, D. S., Young, D. A., and Zirizzotti, A.: Bedmap3 updated ice bed, surface and thickness gridded datasets for Antarctica, Sci. Data, 12, 414, https://doi.org/10.1038/s41597-025-04672-y, 2025. a, b, c, d
QGIS Development Team: QGIS Geographic Information System, QGIS Association, https://www.qgis.org (last access: 19 April 2026), 2025. a
Rahmstorf, S.: A semi-empirical approach to projecting future sea-level rise, Science, 315, 368–370, https://doi.org/10.1126/science.1135456, 2007. a
Raney, R.: The delay/Doppler radar altimeter, IEEE T. Geosci. Remote, 36, 1578–1588, https://doi.org/10.1109/36.718861, 1998. a, b
Raymond, C. F.: Deformation in the Vicinity of Ice Divides, J. Glaciol., 29, 357–373, https://doi.org/10.3189/S0022143000030288, 1983. a
Riedel, S., Jokat, W., and Steinhage, D.: Mapping tectonic provinces with airborne gravity and radar data in Dronning Maud Land, East Antarctica, Geophys. J. Int., 189, 414–427, https://doi.org/10.1111/j.1365-246x.2012.05363.x, 2012. a, b, c, d, e, f, g, h, i
Rignot, E., Mouginot, J., and Scheuchl, B.: MEaSUREs InSAR-Based Antarctica Ice Velocity Map, Version 2, Boulder, Colorado USA, NASA National Snow and Ice Data Center Distributed Active Archive Center [data set], https://doi.org/10.5067/D7GK8F5J8M8R, 2017. a, b
Rignot, E., Mouginot, J., Scheuchl, B., Broeke, M. v. d., Wessem, M. J. v., and Morlighem, M.: Four decades of Antarctic Ice Sheet mass balance from 1979–2017, P. Natl. Acad. Sci. USA, 116, 1095–1103, https://doi.org/10.1073/pnas.1812883116, 2019. a, b, c
Robin, G. D. Q., Evans, S., and Bailey, J. T.: Interpretation of radio echo sounding in polar ice sheets, Philos. T. R. Soc. Lond. A, 265, 437–505, https://doi.org/10.1098/rsta.1969.0063, 1969. a
Rodriguez-Morales, F., Byers, K., Crowe, R., Player, K., Hale, R. D., Arnold, E. J., Smith, L., Gifford, C. M., Braaten, D., Panton, C., Gogineni, S., Leuschen, C. J., Paden, J. D., Li, J., Lewis, C. C., Panzer, B., Alvestegui, D. G.-G., and Patel, A.: Advanced Multifrequency Radar Instrumentation for Polar Research, IEEE T. Geosci. Remote, 52, 2824–2842, https://doi.org/10.1109/tgrs.2013.2266415, 2013. a, b
Rotschky, G., Eisen, O., Wilhelms, F., Nixdorf, U., and Oerter, H.: Spatial distribution of surface mass balance on Amundsenisen plateau, Antarctica, derived from ice-penetrating radar studies, Ann. Glaciol., 39, 265–270, https://doi.org/10.3189/172756404781814618, 2004. a
Ruppel, A., Jacobs, J., Eagles, G., Läufer, A., and Jokat, W.: New geophysical data from a key region in East Antarctica: Estimates for the spatial extent of the Tonian Oceanic Arc Super Terrane (TOAST), Gondwana Res., 59, 97–107, https://doi.org/10.1016/j.gr.2018.02.019, 2018. a, b, c, d, e, f
Rückamp, M., Greve, R., and Humbert, A.: Comparative simulations of the evolution of the Greenland ice sheet under simplified Paris Agreement scenarios with the models SICOPOLIS and ISSM, Polar Sci., 21, 14–25, https://doi.org/10.1016/j.polar.2018.12.003, 2019a. a
Rückamp, M., Neckel, N., Berger, S., Humbert, A., and Helm, V.: Calving Induced Speedup of Petermann Glacier, J. Geophys. Res.-Earth Surf., 124, 216–228, https://doi.org/10.1029/2018jf004775, 2019b. a
Rückamp, M., Goelzer, H., and Humbert, A.: Sensitivity of Greenland ice sheet projections to spatial resolution in higher-order simulations: the Alfred Wegener Institute (AWI) contribution to ISMIP6 Greenland using the Ice-sheet and Sea-level System Model (ISSM), The Cryosphere, 14, 3309–3327, https://doi.org/10.5194/tc-14-3309-2020, 2020. a
Rückamp, M., Kleiner, T., and Humbert, A.: Comparison of ice dynamics using full-Stokes and Blatter–Pattyn approximation: application to the Northeast Greenland Ice Stream, The Cryosphere, 16, 1675–1696, https://doi.org/10.5194/tc-16-1675-2022, 2022. a
Schannwell, C., Drews, R., Ehlers, T. A., Eisen, O., Mayer, C., and Gillet-Chaulet, F.: Kinematic response of ice-rise divides to changes in ocean and atmosphere forcing, The Cryosphere, 13, 2673–2691, https://doi.org/10.5194/tc-13-2673-2019, 2019. a
Schannwell, C., Drews, R., Ehlers, T. A., Eisen, O., Mayer, C., Malinen, M., Smith, E. C., and Eisermann, H.: Quantifying the effect of ocean bed properties on ice sheet geometry over 40 000 years with a full-Stokes model, The Cryosphere, 14, 3917–3934, https://doi.org/10.5194/tc-14-3917-2020, 2020. a, b
Schröder, L., Neckel, N., Zindler, R., and Humbert, A.: Perennial Supraglacial Lakes in Northeast Greenland Observed by Polarimetric SAR, Remote Sens., 12, 2798, https://doi.org/10.3390/rs12172798, 2020. a
Smith-Johnsen, S., de Fleurian, B., Schlegel, N., Seroussi, H., and Nisancioglu, K.: Exceptionally high heat flux needed to sustain the Northeast Greenland Ice Stream, The Cryosphere, 14, 841–854, https://doi.org/10.5194/tc-14-841-2020, 2020. a
Steinhage, D.: Beitrage aus geophysikalischen Messungen in Dronning Maud Land, Antarktis, zur Auffindung eines optimalen Bohrpunktes für eine Eiskerntiefbohrung, Berichte zur Polar und Meeresforschung, 384, 91, https://doi.org/10.2312/BzPM_0384_2001, 2001. a
Steinhage, D., Nixdorf, U., Meyer, U., and Miller, H.: New maps of the ice thickness and subglacial topography in Dronning Maud Land, Antarctica, determined by means of airborne radio-echo sounding, Ann. Glaciol., 29, 267–272, https://doi.org/10.3189/172756499781821409, 1999. a, b, c
Steinhage, D., Nixdorf, U., Meyer, U., and Miller, H.: Subglacial topography and internal structure of central and western Dronning Maud Land, Antarctica, determined from airborne radio echo sounding, J. Appl. Geophys., 47, 183–189, https://doi.org/10.1016/s0926-9851(01)00063-5, 2001. a, b, c, d
Steinhage, D., Eisen, O., and Clausen, H. B.: Regional and temporal variation of accumulation around NorthGRIP derived from ground-penetrating radar, Ann. Glaciol., 42, 326–330, https://doi.org/10.3189/172756405781812574, 2005. a
Steinhage, D., Kipfstuhl, S., Nixdorf, U., and Miller, H.: Internal structure of the ice sheet between Kohnen station and Dome Fuji, Antarctica, revealed by airborne radio-echo sounding, Ann. Glaciol., 54, 163–167, https://doi.org/10.3189/2013aog64a113, 2013. a
Stoll, N., Weikusat, I., Jansen, D., Bons, P., Darányi, K., Westhoff, J., Llorens, M.-G., Wallis, D., Eichler, J., Saruya, T., Homma, T., Rasmussen, S. O., Sinnl, G., Svensson, A., Drury, M., Wilhelms, F., Kipfstuhl, S., Dahl-Jensen, D., and Kerch, J.: Linking crystallographic orientation and ice stream dynamics: evidence from the EastGRIP ice core, The Cryosphere, 19, 3805–3830, https://doi.org/10.5194/tc-19-3805-2025, 2025. a
Sutter, J., Fischer, H., Grosfeld, K., Karlsson, N. B., Kleiner, T., Van Liefferinge, B., and Eisen, O.: Modelling the Antarctic Ice Sheet across the mid-Pleistocene transition – implications for Oldest Ice, The Cryosphere, 13, 2023–2041, https://doi.org/10.5194/tc-13-2023-2019, 2019. a
Sutter, J., Fischer, H., and Eisen, O.: Investigating the internal structure of the Antarctic ice sheet: the utility of isochrones for spatiotemporal ice-sheet model calibration, The Cryosphere, 15, 3839–3860, https://doi.org/10.5194/tc-15-3839-2021, 2021. a, b, c
The IMBIE Team: Mass balance of the Greenland and Antarctic ice sheets from 1992 to 2018, Nature, 579, 233–239, https://doi.org/10.1038/s41586-019-1855-2, 2020. a
Theofilopoulos, A. and Born, A.: Sensitivity of isochrones to surface mass balance and dynamics, J. Glaciol., 69, 311–323, https://doi.org/10.1017/jog.2022.62, 2023. a
Thompson, S., Cook, S., Kulessa, B., Winberry, J., Fraser, A., and Galton-Fenzi, B.: Comparing satellite and helicopter-based methods for observing crevasses, application in East Antarctica, Cold Reg. Sci. Technol., 178, 103128, https://doi.org/10.1016/j.coldregions.2020.103128, 2020. a
Van Liefferinge, B., Pattyn, F., Cavitte, M. G. P., Karlsson, N. B., Young, D. A., Sutter, J., and Eisen, O.: Promising Oldest Ice sites in East Antarctica based on thermodynamical modelling, The Cryosphere, 12, 2773–2787, https://doi.org/10.5194/tc-12-2773-2018, 2018. a
Višnjević, V., Drews, R., Schannwell, C., Koch, I., Franke, S., Jansen, D., and Eisen, O.: Predicting the steady-state isochronal stratigraphy of ice shelves using observations and modeling, The Cryosphere, 16, 4763–4777, https://doi.org/10.5194/tc-16-4763-2022, 2022. a, b, c, d
Višnjević, V., Moss, G., Henry, A. C. J., Wild, C. T., Steinhage, D., and Drews, R.: Mapping the Composition of Antarctic Ice Shelves as a Metric for Their Susceptibility to Future Climate Change, Geophys. Res. Lett., 52, https://doi.org/10.1029/2024gl112585, 2025. a, b, c, d
Wang, Z., Gogineni, S., Rodriguez-Morales, F., Yan, J.-B., Paden, J., Leuschen, C., Hale, R. D., Li, J., Carabajal, C. L., Gomez-Garcia, D., Townley, B., Willer, R., Stearns, L., Child, S., and Braaten, D.: Multichannel Wideband Synthetic Aperture Radar for Ice Sheet Remote Sensing: Development and the First Deployment in Antarctica, IEEE J. Sel. Top. Appl. Earth Obs., 9, 980–993, https://doi.org/10.1109/jstars.2015.2403611, 2016. a
Wang, Z., Chung, A., Steinhage, D., Parrenin, F., Freitag, J., and Eisen, O.: Mapping age and basal conditions of ice in the Dome Fuji region, Antarctica, by combining radar internal layer stratigraphy and flow modeling, The Cryosphere, 17, 4297–4314, https://doi.org/10.5194/tc-17-4297-2023, 2023. a, b, c, d
Westhoff, J., Stoll, N., Franke, S., Weikusat, I., Bons, P., Kerch, J., Jansen, D., Kipfstuhl, S., and Dahl-Jensen, D.: A stratigraphy-based method for reconstructing ice core orientation, Ann. Glaciol., 62, 191–202, https://doi.org/10.1017/aog.2020.76, 2021. a
Wilhelms, F., Miller, H., Gerasimoff, M. D., Drücker, C., Frenzel, A., Fritzsche, D., Grobe, H., Hansen, S. B., Hilmarsson, S. Ã., Hoffmann, G., Hörnby, K., Jaeschke, A., Jakobsdóttir, S. S., Juckschat, P., Karsten, A., Karsten, L., Kaufmann, P. R., Karlin, T., Kohlberg, E., Kleffel, G., Lambrecht, A., Lambrecht, A., Lawer, G., Schärmeli, I., Schmitt, J., Sheldon, S. G., Takata, M., Trenke, M., Twarloh, B., Valero-Delgado, F., and Wilhelms-Dick, D.: The EPICA Dronning Maud Land deep drilling operation, Ann. Glaciol., 55, 355–366, https://doi.org/10.3189/2014aog68a189, 2014. a, b
Wilkinson, M. D., Dumontier, M., Aalbersberg, I. J., Appleton, G., Axton, M., Baak, A., Blomberg, N., Boiten, J.-W., Santos, L. B. d. S., Bourne, P. E., Bouwman, J., Brookes, A. J., Clark, T., Crosas, M., Dillo, I., Dumon, O., Edmunds, S., Evelo, C. T., Finkers, R., Gonzalez-Beltran, A., Gray, A. J., Groth, P., Goble, C., Grethe, J. S., Heringa, J., Hoen, P. A. â., Hooft, R., Kuhn, T., Kok, R., Kok, J., Lusher, S. J., Martone, M. E., Mons, A., Packer, A. L., Persson, B., Rocca-Serra, P., Roos, M., Schaik, R. v., Sansone, S.-A., Schultes, E., Sengstag, T., Slater, T., Strawn, G., Swertz, M. A., Thompson, M., Lei, J. v. d., Mulligen, E. v., Velterop, J., Waagmeester, A., Wittenburg, P., Wolstencroft, K., Zhao, J., and Mons, B.: The FAIR Guiding Principles for scientific data management and stewardship, Sci. Data, 3, 160018, https://doi.org/10.1038/sdata.2016.18, 2016. a
Winter, A., Steinhage, D., Arnold, E. J., Blankenship, D. D., Cavitte, M. G. P., Corr, H. F. J., Paden, J. D., Urbini, S., Young, D. A., and Eisen, O.: Comparison of measurements from different radio-echo sounding systems and synchronization with the ice core at Dome C, Antarctica, The Cryosphere, 11, 653–668, https://doi.org/10.5194/tc-11-653-2017, 2017. a, b
Winter, A., Steinhage, D., Creyts, T. T., Kleiner, T., and Eisen, O.: Age stratigraphy in the East Antarctic Ice Sheet inferred from radio-echo sounding horizons, Earth Syst. Sci. Data, 11, 1069–1081, https://doi.org/10.5194/essd-11-1069-2019, 2019. a, b, c, d, e, f
Yan, J.-B., Alvestegui, D. G.-G., McDaniel, J. W., Li, Y., Gogineni, S., Rodriguez-Morales, F., Brozena, J., and Leuschen, C. J.: Ultrawideband FMCW Radar for Airborne Measurements of Snow Over Sea Ice and Land, IEEE T. Geosci. Remote, 55, 834–843, https://doi.org/10.1109/tgrs.2016.2616134, 2017a. a, b
Yan, J.-B., Gogineni, S., Rodriguez-Morales, F., Gomez-Garcia, D., Paden, J., Li, J., Leuschen, C. J., Braaten, D., Richter-Menge, J., Farrell, S. L., Brozena, J., and Hale, R. D.: Airborne Measurements of Snow Thickness, IEEE Geoscience and Remote Sensing Magazine, 5, 57–76, https://doi.org/10.1109/mgrs.2017.2663325, 2017b. a
Young, D. A., Roberts, J. L., Ritz, C., Frezzotti, M., Quartini, E., Cavitte, M. G. P., Tozer, C. R., Steinhage, D., Urbini, S., Corr, H. F. J., van Ommen, T., and Blankenship, D. D.: High-resolution boundary conditions of an old ice target near Dome C, Antarctica, The Cryosphere, 11, 1897–1911, https://doi.org/10.5194/tc-11-1897-2017, 2017. a
Young, D. A., Paden, J. D., Yan, S., Kerr, M. E., Singh, S., González, A. V., Kaundinya, S. R., Greenbaum, J. S., Chan, K., Ng, G., Buhl, D. P., Kempf, S. D., and Blankenship, D. D.: Coupled Ice Sheet Structure and Bedrock Geology in the Deep Interior of East Antarctica: Results From Dome A and the South Pole Basin, Geophys. Res. Lett., 52, https://doi.org/10.1029/2025gl115729, 2025. a
Zeising, O., Neckel, N., Dörr, N., Helm, V., Steinhage, D., Timmermann, R., and Humbert, A.: Extreme melting at Greenland's largest floating ice tongue, The Cryosphere, 18, 1333–1357, https://doi.org/10.5194/tc-18-1333-2024, 2024. a, b, c
Zeising, O., Arenas-Pingarrón, Á., Brisbourne, A. M., and Martín, C.: Brief communication: Reduced bandwidth improves the depth limit of the radar coherence method for detecting ice crystal fabric asymmetry, The Cryosphere, 19, 2355–2363, https://doi.org/10.5194/tc-19-2355-2025, 2025. a
Zhang, Y., Sachau, T., Franke, S., Yang, H., Li, D., Weikusat, I., and Bons, P. D.: Formation Mechanisms of Large-Scale Folding in Greenland's Ice Sheet, Geophys. Res. Lett., 51, https://doi.org/10.1029/2024gl109492, 2024. a, b
Zhang, Y., Franke, S., Sachau, T., Jansen, D., Yang, H., Li, D., Hu, Y., Weikusat, I., and Bons, P.: How to make an ice stream, Nat. Commun. [preprint], https://doi.org/10.21203/rs.3.rs-5581877/v1, 2025. a
Zhou, Y., Franke, S., Kleiner, T., Drews, R., Humbert, A., Jansen, D., Steinhage, D., and Eisen, O.: Reactivation of a Subglacial Channel Around the Grounding Zone of Roi Baudouin Ice Shelf, Antarctica, Geophys. Res. Lett., 52, e2024GL112476, https://doi.org/10.1029/2024GL112476, 2025. a, b, c
Zuhr, A., Franke, S., Eisen, O., Steinhage, D., Hörhold, M., Freitag, J., Helm, V., Wilhelms, F., and Drews, R.: Airborne radar reveals area-wide decadal increase of surface mass balance on the Plateau in Dronning Maud Land, East Antarctica., Geophys. Res. Lett., 53, e2025GL118985, https://doi.org/10.1029/2025GL118985, 2026. a, b, c
- Abstract
- Introduction
- AWI airborne platforms and logistical infrastructure for radar surveys
- AWI airborne radar systems
- AWI radar workflow
- AWI radar surveys
- Data quality
- Data access and usage
- Future directions and extending the impact of AWI's radar data archive
- Conclusions
- Appendix A: AWI radar survey seasons in Antarctica and Greenland
- Code and data availability
- Author contributions
- Competing interests
- Disclaimer
- Acknowledgements
- Financial support
- Review statement
- References
- Supplement