the Creative Commons Attribution 4.0 License.
the Creative Commons Attribution 4.0 License.
 | 27 Apr 2026
Simulating the effect of natural convection in a tundra snow cover
Michael Lehning
As a direct solution to improve the one-dimensional physics-based multi-layer snow model SNOWPACK, a C interface is implemented for a tight coupling between SNOWPACK and OpenFOAM with the aim to investigate natural convection in real snow covers. OpenFOAM simulates convection in two dimensions based on SNOWPACK snow profiles and feeds the convective vapor fluxes back to SNOWPACK. Among different snow covers and conditions, significant convection events that are well synchronized with cold events are numerically simulated by the SNOWPACK-OpenFOAM coupler for a herb tundra permafrost at Bylot Island only if we neglect wind slab formation for surface layers. We find significant sublimation in downward flow regions and that convection generates a low-density path extending vertically almost through the whole snow column. The strong footprint of convection on snow density and temperature with significant lateral variations up to 90 kg m−3 and 5 K respectively makes a consistent representation in the SNOWPACK one-dimensional profile difficult. But the most prominent effect of convection on the snow density profile, namely a low density foot and high density top, corresponds qualitatively to observations. Further work is required to achieve the full magnitude of observed density differences and to adapt physical parameterizations in conventional snow models to represent this effect in particular for snow settling and metamorphism.
- Article
(25679 KB) - Full-text XML
- BibTeX
- EndNote


Water vapor transport is a significant dynamical process for shaping snow layers in snowpacks under strong temperature gradients, such as the Arctic and subarctic ones (Trabant and Benson, 1972; Johnson and Bens, 1987; Alley et al., 1990; Sturm and Johnson, 1991; Domine et al., 2016, 2018). Strong temperature gradients (i.e., low surface temperatures and comparably high base temperatures) in the snowpack produce strong gradients in water vapor density to develop a snow cover with a significant fraction of depth hoar layers (Derksen et al., 2009; Sturm and Benson, 1997; Taillandier et al., 2006; Domine et al., 2015). Measurements (Trabant and Benson, 1972; Alley et al., 1990; Sturm and Benson, 1997) suggest a continuous vapor flux from the soil into the basal snow layers, which are then losing vapor to upper layers. Sturm and Benson (1997) suggest that water vapor fluxes between snow layers result in mass change over finite distances and also changes in layer density.
Water vapor diffusion alone is not sufficient for significant mass transfer at the base (Jafari et al., 2020; Domine et al., 2016) and convection within the snowpack is often hypothesized as a dominant mechanism (Trabant and Benson, 1972; Johnson and Bens, 1987; Alley et al., 1990; Sturm and Johnson, 1991; Domine et al., 2016, 2018) for substantial mass transfer, which is an order of magnitude higher than calculated diffusive vapor fluxes (Trabant and Benson, 1972). However, convection of water vapor, the buoyant movement of air and moisture driven by temperature and air density gradients, is not captured in conventional snow models leading to large errors in simulated snow properties. Domine et al. (2016) have underlined the difficulties of existing snowpack models to accurately simulate high Arctic snowpack layering, namely high density layers on top and lower density layers at the bottom. This is significant as such a profile enhances the insulating properties of the winter snow cover (Armstrong and Brun, 2009) and facilitates movement of animals over the hard surface snow (Vikhamar-Schuler et al., 2013). Recent field experiments further support that subnivean space created by low-conductivity basal snow is a critical thermal refuge for Arctic small mammals (Poirier et al., 2021). Moreover, snowpack stratigraphy directly affects species’ winter habitat choice and predator avoidance (Reid et al., 2011; Duchesne et al., 2011), highlighting the ecological importance of accurately modeling snow density layering.
Jafari et al. (2020) studied the effects of diffusive water vapor transport on snow density for different snow covers by implementing vapor diffusion in SNOWPACK, a one-dimensional physics-based multi-layer snow model (Lehning et al., 1999; Bartelt and Lehning, 2002; Lehning et al., 2002b, a). However, the combined effects of convection and diffusion for water vapor transport have never been numerically investigated in combination with a full snow evolution model. In their study of a two-dimensional idealized snowpack, Jafari et al. (2022) employed a new physical model, named as snowpackBuoyantPimpleFoam (Jafari and Lehning, 2021), implemented in OpenFOAM 5.0 (https://www.openfoam.org, last access: 26 February 2026), to analyze how convection of water vapor changes the snow structure laterally and vertically.
Significant differences remain between the observed and simulated snow density profiles, even when convection effects are included (as described later in Sect. 3). This indicates that the snow model itself requires adjustments for Arctic and subarctic conditions, specifically through improvements in processes such as snow settling and wind compaction (Jafari, 2022). The convection model used in this paper is a direct numerical solution (DNS) that solves the full set of coupled mass and energy transport equations, offering a high-fidelity alternative to traditional parameterizations. Arctic snowpacks are substantially influenced by wind compaction – a process for which no physically accurate, widely accepted model exists. The current parameterizations, including those proposed by Gouttevin et al. (2018) and recent studies by Keenan et al. (2021) and Wever et al. (2023) for drifting-snow compaction, offer only a rough approximation (partially physically accurate). Including wind compaction in the simulation results in a high-density surface layer that suppresses the formation of convection cells, rendering natural convection driven by buoyancy forces less active.
Since modeling convection in one-dimensional snow models is not possible as one-dimensional models cannot capture the spontaneous formation and lateral flow fields of two dimensional convection cells, a direct solution to take into account the effects of convection for snow covers is to couple SNOWPACK with OpenFOAM. In this regard, the work presented in this paper brings us valuable insights: (1) the details in flow velocity, thermal, and phase change regimes can be analyzed for later parameterization of convection in one-dimensional snow models with no need to directly use OpenFOAM, (2) the effects of convection do not only substantially change the snow density vertically, but also induce a considerable and transient lateral heterogeneity in snow structure, (3) the induced lateral heterogeneity has a direct feedback on snow properties linked to the snow density such as the effective thermal conductivity and compaction, (4) the large difference between the temperature profiles in the upward and downward flow of a convection cell causes the temperature-dependent processes such as metamorphism and melting-refreezing to vary and actually also take place laterally in the snowpack. In this paper, we focus on two core research questions: To what extent does two-dimensional natural convection, simulated by the full SNOWPACK-OpenFOAM model, modify the one-dimensional temperature and density profiles of an Arctic tundra snow cover compared to standard diffusion-only models? and how do realistic snow physics, specifically wind slab formation (drifting-snow compaction), influence the occurrence and overall impact of natural convection in Arctic tundra snowpacks, thereby defining a lower bound for convective effects?.
As a direct solution to improve the one-dimensional physics-based multi-layer snow model, a C interface (dynamic library) is implemented for a tight coupling between SNOWPACK and OpenFOAM named as SNOWPACKFoam. Note that the detailed explanations, derivations, and model choices constituting the final set of equations for the convection simulation can be found in Jafari et al. (2022). As presented in Fig. 1, the coupling procedure works as: (1) one SNOWPACK time step is solved taking into account all important processes such as settling, metamorphism, and melting-refreezing (Lehning et al., 1999; Bartelt and Lehning, 2002; Lehning et al., 2002b, a), (2) the snow height in OpenFOAM is dynamically synchronized with the new snow height from the SNOWPACK solution. Note that the dynamic mesh strategy used in the OpenFOAM solution is adding or removing layers only from the top. The minimum and maximum layer thicknesses are the thresholds given by the user to control the process for removing and adding a layer. Since the changes in both ice and water contents are updated from the SNOWPACK solution, there is no need to change the size of computational elements in the OpenFOAM, (3) the snow density change will be interpolated from the SNOWPACK solution to the OpenFOAM domain uniformly in the lateral direction as will be explained later in item (ii) below, (4) after the information exchange between the two solvers, the two-dimensional natural convection is solved by OpenFOAM to update the snow density change due to vapor transport and (5) the horizontal average of the snow density change rate in OpenFOAM is interpolated for each element of SNOWPACK. The assumptions and limitations considered for SNOWPACK-OpenFOAM coupling are explained as follows:
- i.
The overall simulation period runs from the beginning of September to the 1st of July for all six years. SNOWPACK is initialized using a .sno file that defines the initial conditions for the soil of three meters, with an initial temperature of 274.87 K and specified volumetric fractions for air of 12.5 %, water of 25 %, ice of 0 %, and soil of 62.5 % and no pre-existing snow cover. SNOWPACK primarily acts as the one-dimensional thermo-mechanical driver. In a single SNOWPACK time step, it solves for processes like settlement, liquid water transport, compaction (including drifting-snow compaction), and the long-term temperature evolution in both the soil and the snowpack (Lehning et al., 1999, 2002a, b; Bartelt and Lehning, 2002). We explicitly delegate all vapor transport processes (diffusion and convection) solely to the OpenFOAM solver, which provides a spatially-resolved two-dimensional solution.
OpenFOAM only models the snowpack part of the domain, as convection in the underlying soil is assumed negligible. The temperature profile computed by SNOWPACK is used to set the thermal boundary conditions (at the top and base of the snow layer) and to initialize the internal temperature field for the two-dimensional OpenFOAM domain. The side boundaries in OpenFOAM two-dimensional domain are defined as cyclic or periodic. Synchronization is achieved via a dynamic mesh strategy implemented using the SNOWPACK-OpenFOAM coupling library. The vertical snow density and layer heights computed by SNOWPACK are continuously used to reconstruct OpenFOAM's computational mesh. Physical information transferred to OpenFOAM includes the updated mesh geometry, the updated temperature profile, and the updated density field and volumetric content of air, ice, and water components in snow. After OpenFOAM solves for the two-dimensional air flow and vapor transport (sublimation and vapor deposition), the resulting density change is averaged horizontally across the two-dimensional domain for each specified height and fed back to SNOWPACK to update its internal state for the next mechanical/thermal step.
- ii.
For previously formed snow elements, applying the mass and volume changes from the two models is intricate because we must preserve the lateral two-dimensional variability generated by OpenFOAM's convection solution while simultaneously updating the background state using SNOWPACK's one-dimensional processes (settling, compaction, melting, etc). To achieve this necessary separation of processes, we implement a tracking procedure:
First, SNOWPACK calculates the new total ice/water content (θi,SN) based only on its one-dimensional thermo-mechanical processes. Please note that the subscript OF and SN refer to OpenFOAM and SNOWPACK, respectively. Simultaneously, the OpenFOAM coupling library tracks the cumulative two-dimensional change in ice/water content due exclusively to vapor transport () at every mesh cell. The final ice/water content in the OpenFOAM domain (θi,OF) is then calculated by applying the one-dimensional change from SNOWPACK to the initial OpenFOAM density distribution and then re-adding OpenFOAM’s locally tracked cumulative two-dimensional vapor change. This intricate tracking ensures that the spatial footprint of convection is preserved without double-counting the vapor transport effect, as the mesh is continually updated.
For new snow elements in the OpenFOAM domain, all snow parameters are directly interpolated from the SNOWPACK output with uniform distribution in the lateral direction. Adding or removing layers is governed by criteria of minimum and maximum layer thicknesses (0.005 and 0.01 m, respectively). This range is chosen to maintain layer properties in the profiles when interpolating between SNOWPACK and OpenFOAM.
- iii.
Currently, OpenFOAM provides only the laterally-averaged snow density change rate (due to vapor transport) to SNOWPACK. Future work will enhance this by incorporating the laterally-averaged temperature profiles from OpenFOAM back into SNOWPACK's initial conditions and using the density change rate directly in SNOWPACK's metamorphism calculation. It is theoretically possible to use multiple parallel SNOWPACK columns across the OpenFOAM domain to capture lateral heterogeneity. However, the resulting differences in compaction and snow height would create surface discontinuities, complicating the current dynamic mesh strategy. Numerically, this challenge can be addressed by using separate, disconnected meshes for each SNOWPACK domain, though careful attention would be required for defining boundary conditions and information exchange across these discontinuities. This includes taking into account the different soil columns modeled by the different SNOWPACK domains. It will be possible to represent the lateral thermal variations at the bottom of snowpack for the OpenFOAM solution as suggested by Jafari and Lehning (2023a). Note that in the SNOWPACK-OpenFOAM coupling, the soil part is only considered in SNOWPACK as convection is unlikely to occur in the soil.
- iv.
In case of melting-refreezing and water transport, (1) the water transport is only modelled by SNOWPACK, (2) the phase change calculation for melting-refreezing process in SNOWPACK is treated explicitly and therefore the temperature is forced to be the melting temperature in SNOWPACK, (3) however, in OpenFOAM, thermal equilibrium is assumed between the ice and water while the local thermal non-equilibrium model is still considered between the ice-water mixture and the gas phase. Similarly, for melting-refreezing process in OpenFOAM, melting temperature is assigned for the ice-water mixture. Note that in case the short wave radiation is large enough to increase the ice temperature in OpenFOAM above melting, we limit it by the melting temperature (as it is explicitly done in SNOWPACK for melting-refreezing process) and therefore we do not directly use the heat source/sink term from melting-refreezing in OpenFOAM. The heat transfer equations for the ice-water mixture and the gas phase are similar to those presented in Jafari et al. (2022), but have been modified to account for the presence of water and the heat source/sink term from shortwave radiation absorption, which is taken from the SNOWPACK simulation. The resulting modified energy equations for the gas phase and ice-water mixture, essential for the reproducibility of our coupled solver, are presented as:
In the above equations, respectively, ϵi, ϵw, ϵg are the volume fractions for ice, water, and gas phase, and are the rates of phase change from water to vapor and from ice to vapor, ρi, ρw, ρg are the densities for ice, water, and gas phase, cpi, cpw, and cpg are the specific heat capacities for ice, water, and gas phase, 〈Jv〉 is the diffusive water vapor flux, is the temperature of water-ice mixture and it is the ice temperature if the water is absent, keff,i, keff,w, and keff,g are the effective thermal conductivities of ice, water, and the gas phase in snow, 〈Ug〉 is the bulk gas-phase velocity vector, is the gas pressure, hc is the heat transfer coefficient, as is the specific surface area, Tref=273.15 K is the reference temperature,and finally Qswr is the heat source due to shortwave radiation absorption. Many of the parameters defined here are the same as presented in Jafari et al. (2022). Note that (1) the thermal conductivities are calculated by a parametrization presented in Lehning et al. (2002b) and used in SNOWPACK and they are indeed extracted from the definition of the effective thermal conductivity of snow as (Calonne et al., 2012; Hansen and Foslien, 2015), (2) the calculation of the mass transfer coefficient between ice and vapor, introduced as hm in Jafari et al. (2022), is also assumed the same between water and vapor, and (3) the specific surface area as is calculated as explained in Jafari et al. (2020) when both water and ice are present.
- v.
For the calculation of all parameters dependent on the grain diameter such as specific surface area, the pore Reynolds number and snow permeability, we use the “classical” grain size not the optical grain diameter. SNOWPACK provides both the classical (heuristic) grain size as rg and optical grain size as rosg which is directly linked to the specific surface area (Calonne et al., 2012) but only a parameterized quantity in SNOWPACK. Based on the simulations in this paper, the values for rosg are often smaller in particular at the bottom of snowpack by a factor of two. For the calculation of permeability and other flow properties, classical grain size is considered more pertinent than optical grain size.
- vi.
Within one time step of SNOWPACK (15 min is chosen in this study), OpenFOAM integrates over several smaller adjustable time steps based on the maximum Courant number of 5. Note that it is possible to use the PIMPLE algorithm (a hybrid pressure-velocity coupling algorithm for solving incompressible flows) for higher values of the maximum Courant number in OpenFOAM as employed in Jafari et al. (2022), but as the thermal boundary condition is changing through the SNOWPACK solution and therefore there is a transient thermal process, it is faster to use the smaller maximum Courant number of 5 (numerically stable) with the PISO algorithm (Moukalled et al., 2016). Note that within a 15 min time interval for coupling, for the first few minutes in OpenFOAM there are transient changes for the thermal regime and the flow velocity and after that it will be often (not always) a near steady-state process till the end of 15 min time interval. Therefore, to avoid computational cost, it is possible to freeze the thermal and flow calculation in OpenFOAM for the steady-state part of a 15 min time interval and only update the snow density change due to vapor transport. We call this strategy a “flow-freezing” time integration and we use the threshold of 60 s after which the thermal and flow calculation in OpenFOAM is stopped till the end of 15 min time interval. We performed simulations with full transient time integration and compared it to “flow freezing” for only the first two months of a winter season in Bylot herb tundra. We found that (1) the simulation required approximately 21 h of wall-clock time using four MPI processes (i.e., about 84 core-hours in total), whereas the “flow-freezing” approach reduced this to about 5 h of wall-clock time, and (2) the averaged cumulative density changes exhibited acceptably small differences as shown later in Fig. 12 the maximum difference in snow density is only between 5 and 10 kg m−3. As introduced by Jafari et al. (2020), cumulative density change is the summation of snow density change due to the sublimation and deposition of water vapor for each element over all time steps. It is further important to mention that the calculated snow density change rate due to vapor transport from OpenFOAM to SNOWPACK is chosen at the end of 15 min time interval and not averaged over 15 min, based on the same assumption that a quasi-steady state situation is attained. Time averaged snow density change rates over 15 min time interval in OpenFOAM would be a better choice if transient effects within the 15 min time step are important.
- vii.
Thermal dispersion and hydrodynamic dispersion (for mass transfer) are not considered in this study. Thermal and hydrodynamic dispersion coefficients are often considered as an additional tensorial term added to the effective thermal conductivity and vapor diffusivity, respectively. These coefficients are important for strong advection and convection, i.e. when the pore Péclet number with Sc the Schmidt number and Rep the pore Reynolds number (Bear, 1961, 1988; Calonne et al., 2015). For convection in idealized snowpacks as reported by Jafari et al. (2022), the pore Reynolds number and consequently Péclet number are smaller than 1. However, based on the results in this paper for convection in real snowpacks (Bylot herb tundra), for the first few centimeters from the bottom of the snowpack in downward flow and only when convection forms low density patches there, the pore Péclet number can reach values up to 10. Note that as mentioned in item (v) above, these results are based on the classical grain size which often induces larger snow permeability and flow velocity. Using the optical grain size (lower snow permeability and flow velocity), the pore Péclet number would remain smaller than 2.8. For the gas flow in the porous medium with randomly packed spheres based on Delgado (2007), the ratio of hydrodynamic dispersivity to diffusivity is on the order of the Péclet number for . Thus, effects of dispersion could be locally important and should further be explored. Nield and Bejan (2017); Kvernvold and Tyvand (1980) discuss that thermal dispersion does not affect the critical Rayleigh number which is based of effective molecular diffusivity but it can influence the flow structure in a convection cell (Nield and Bejan, 2017; Wen et al., 2018; Fahs et al., 2020).
- viii.
We neglect the effect of wind pumping (forced advection) in all our simulations. As concluded in the quantitative analysis by Jafari et al. (2022), the effect of ventilation (wind pumping) on the snow density change profile is minor compared to the effect of natural convection. This is because typical ventilation velocities are at least one order of magnitude smaller than the natural convective velocity scale (Uconv). Given the low-permeability hard slab in our lower-bound scenario, the minimal penetration of wind pumping is further guaranteed, which justifies its exclusion and allows us to focus solely on the effects of natural convection.
- ix.
Forcing data of snow depth and surface temperature from field observations (Domine et al., 2021) are used to drive the SNOWPACK model.
In summary, for the OpenFOAM solution as presented in detail in Jafari et al. (2022), an Eulerian–Eulerian two-phase approach is used to solve mass conservation equations for the gas mixture (humid air), water vapor component, and mixture of ice and water phases, the momentum equation for the gas mixture, and finally the temperature-based energy equations for the gas, and mixture of ice and water phases. Therefore, the numerical output from the OpenFOAM solver provides solutions for water vapor and air densities, snow porosity and density, the gas flow velocity, the diffusive water vapor flux, the phase change rate between the mixture of ice and water phases and vapor, and finally the temperature for the gas and mixture of ice and water phases.
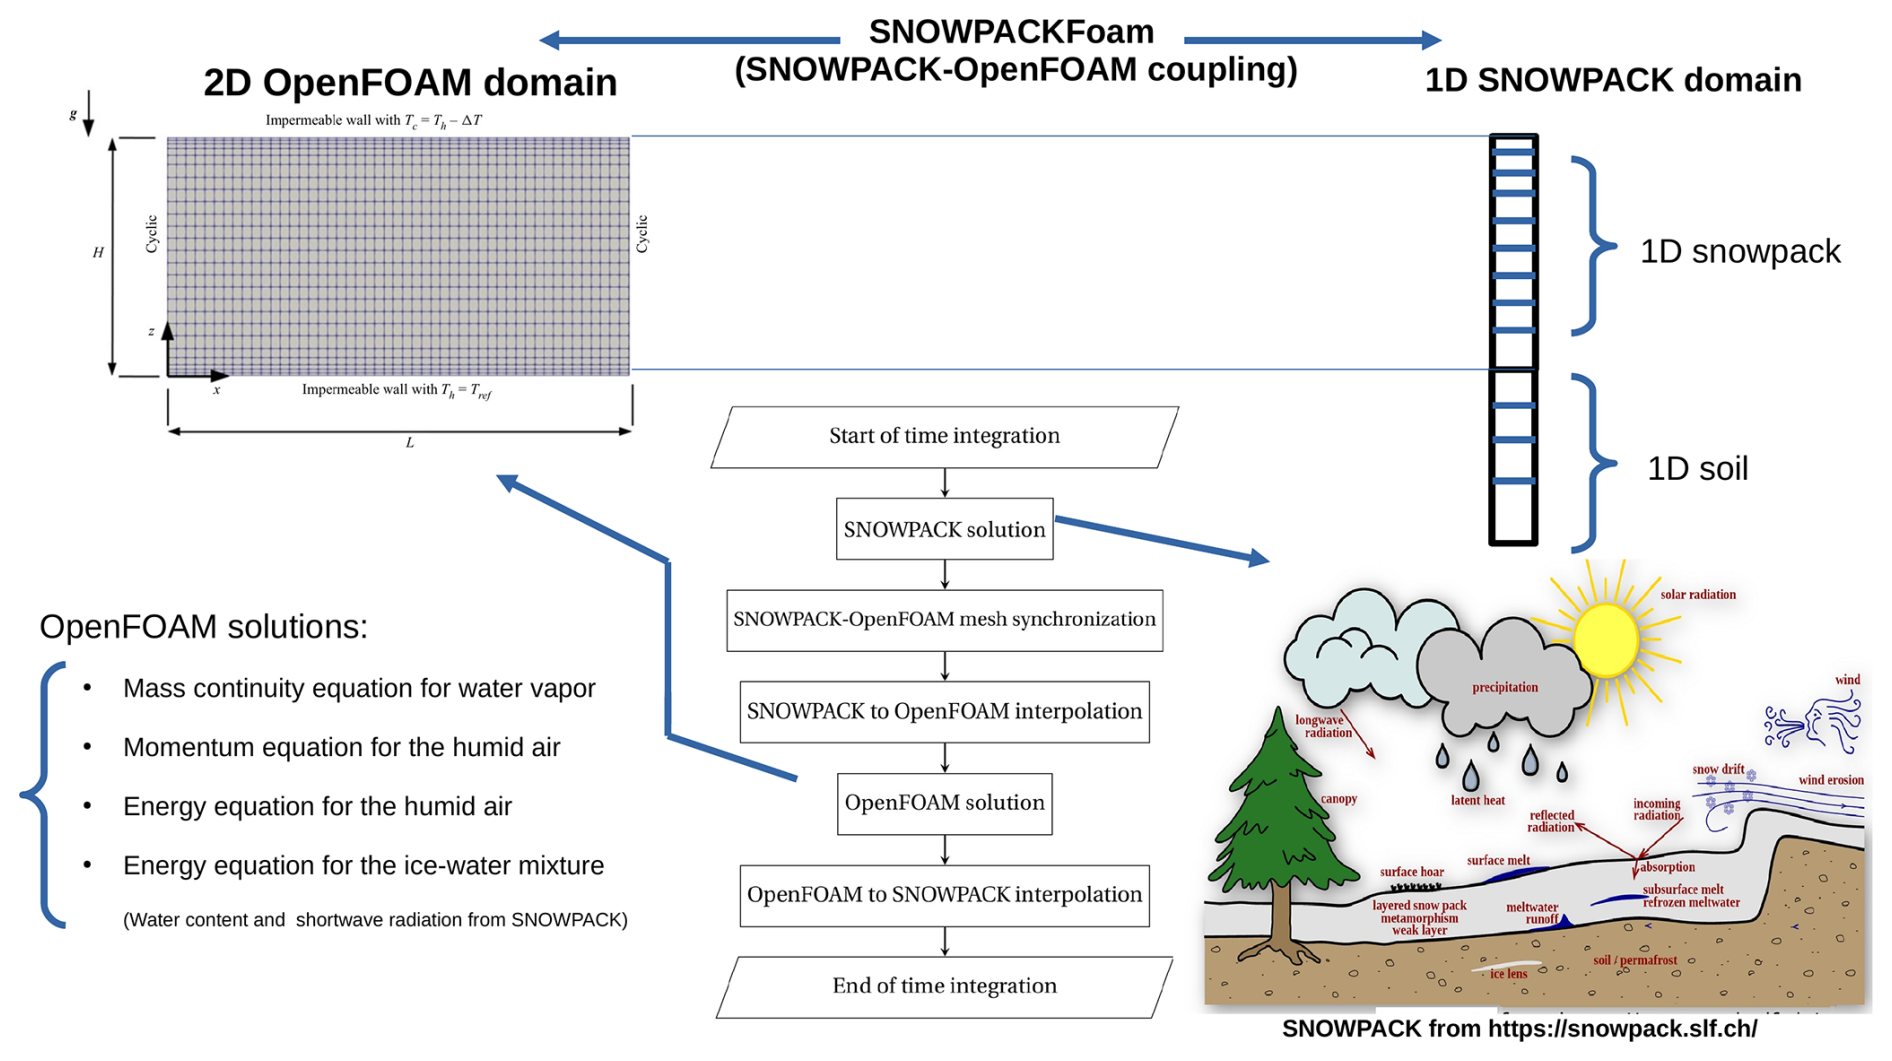
Figure 1The coupling procedure between SNOWPACK and OpenFOAM.
For thick snow covers (e.g., Alpine and sub-arctic), no convection of water vapor has been observed in our numerical analysis because of both insufficient temperature gradients and high snow density. However, for a herb tundra permafrost site, situated at Bylot Island, Canadian High Arctic, conditions to trigger convection are at least partially fulfilled. This finding is consistent with observations from subarctic sites, where water vapor convection was reported as continuous in thin snowpacks but as sporadic in years with thicker snowpacks (Sturm and Johnson, 1991). We used the measured snow heights and surface temperatures to drive the SNOWPACK model. Using the precipitation and heat fluxes to drive SNOWPACK often leads to much colder temperature regimes.
The following analysis aims to identify the physical limits of convection within tundra snowpacks. Based on both simulations and field measurements, two distinct regimes emerge. First, snowpacks without wind slabs – where drifting-snow compaction is absent – retain a more open and permeable structure, allowing convection to develop freely. These represent the upper bound of convection. Second, snowpacks containing wind slabs formed by drifting-snow compaction are dense and mechanically stiff, thereby restricting convective flow. These represent the lower bound of convection.
As it is shown in Fig. 2, both the SNOWPACK–OpenFOAM simulations (with convection and drifting-snow compaction) and the SNOWPACK-only simulations (with vapor diffusion, without drifting-snow compaction) deviate somewhat from the measurements. However, the coupled model reproduces the measured density structure slightly better, particularly in capturing high-density layers associated with wind slabs. During the 2017–2018 winter, the purely diffusive SNOWPACK simulation without drifting-snow compaction as shown in Fig. 2d agreed reasonably well with observations except near the surface. Also, for the snow height, both the SNOWPACK–OpenFOAM simulations (with convection and drifting-snow compaction) and the SNOWPACK-only simulations (with vapor diffusion, without drifting-snow compaction) agreed reasonably well with observations except for the melting period in the winter season 2013–2014 as shown in Fig. 3a. We note that even with the massive computational effort of the coupled framework, the density profiles initially had error compared to field measurements. This discrepancy is why we chose to work with (1) a upper bound scenario for which the wind compaction is not considered and (2) the lower bound scenario where convection is limited with drifting-snow compaction. This finding demonstrates a key result of this work: accurate convection modeling requires that snow conditions (wind compaction) be captured.
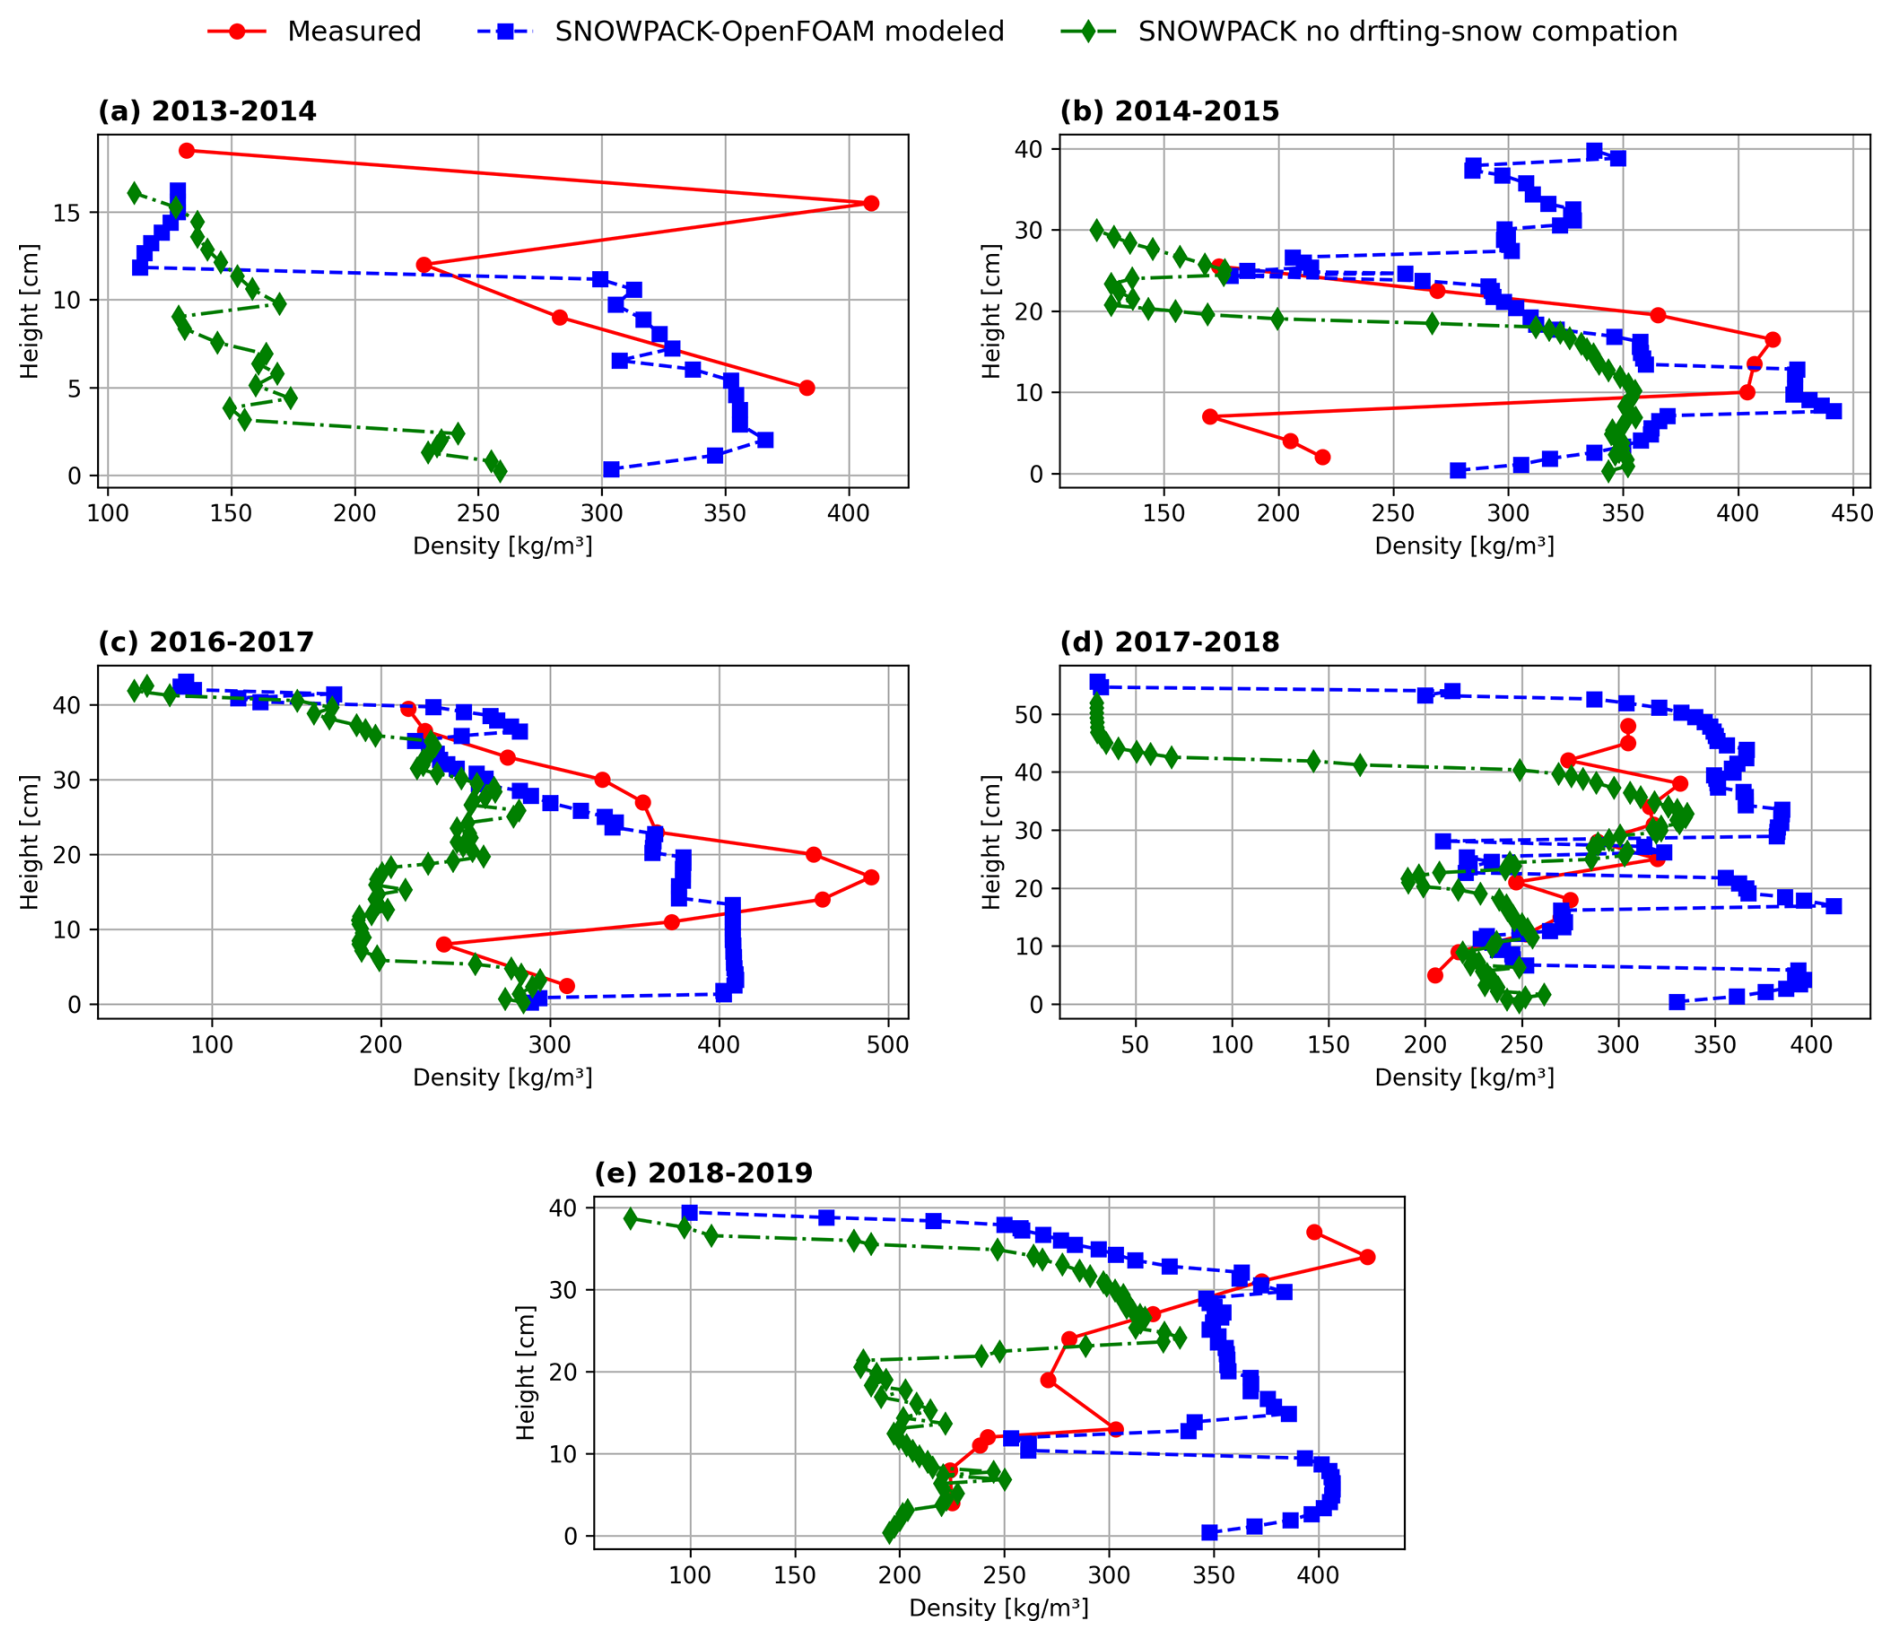
Figure 2The snow density profiles for SNOWPACK-OpenFOAM simulations with convection and drifting-snow compaction model active in SNOWPACK, SNOWPACK simulations with only diffusion of water vapor with no drifting-snow compaction active, and measurement.
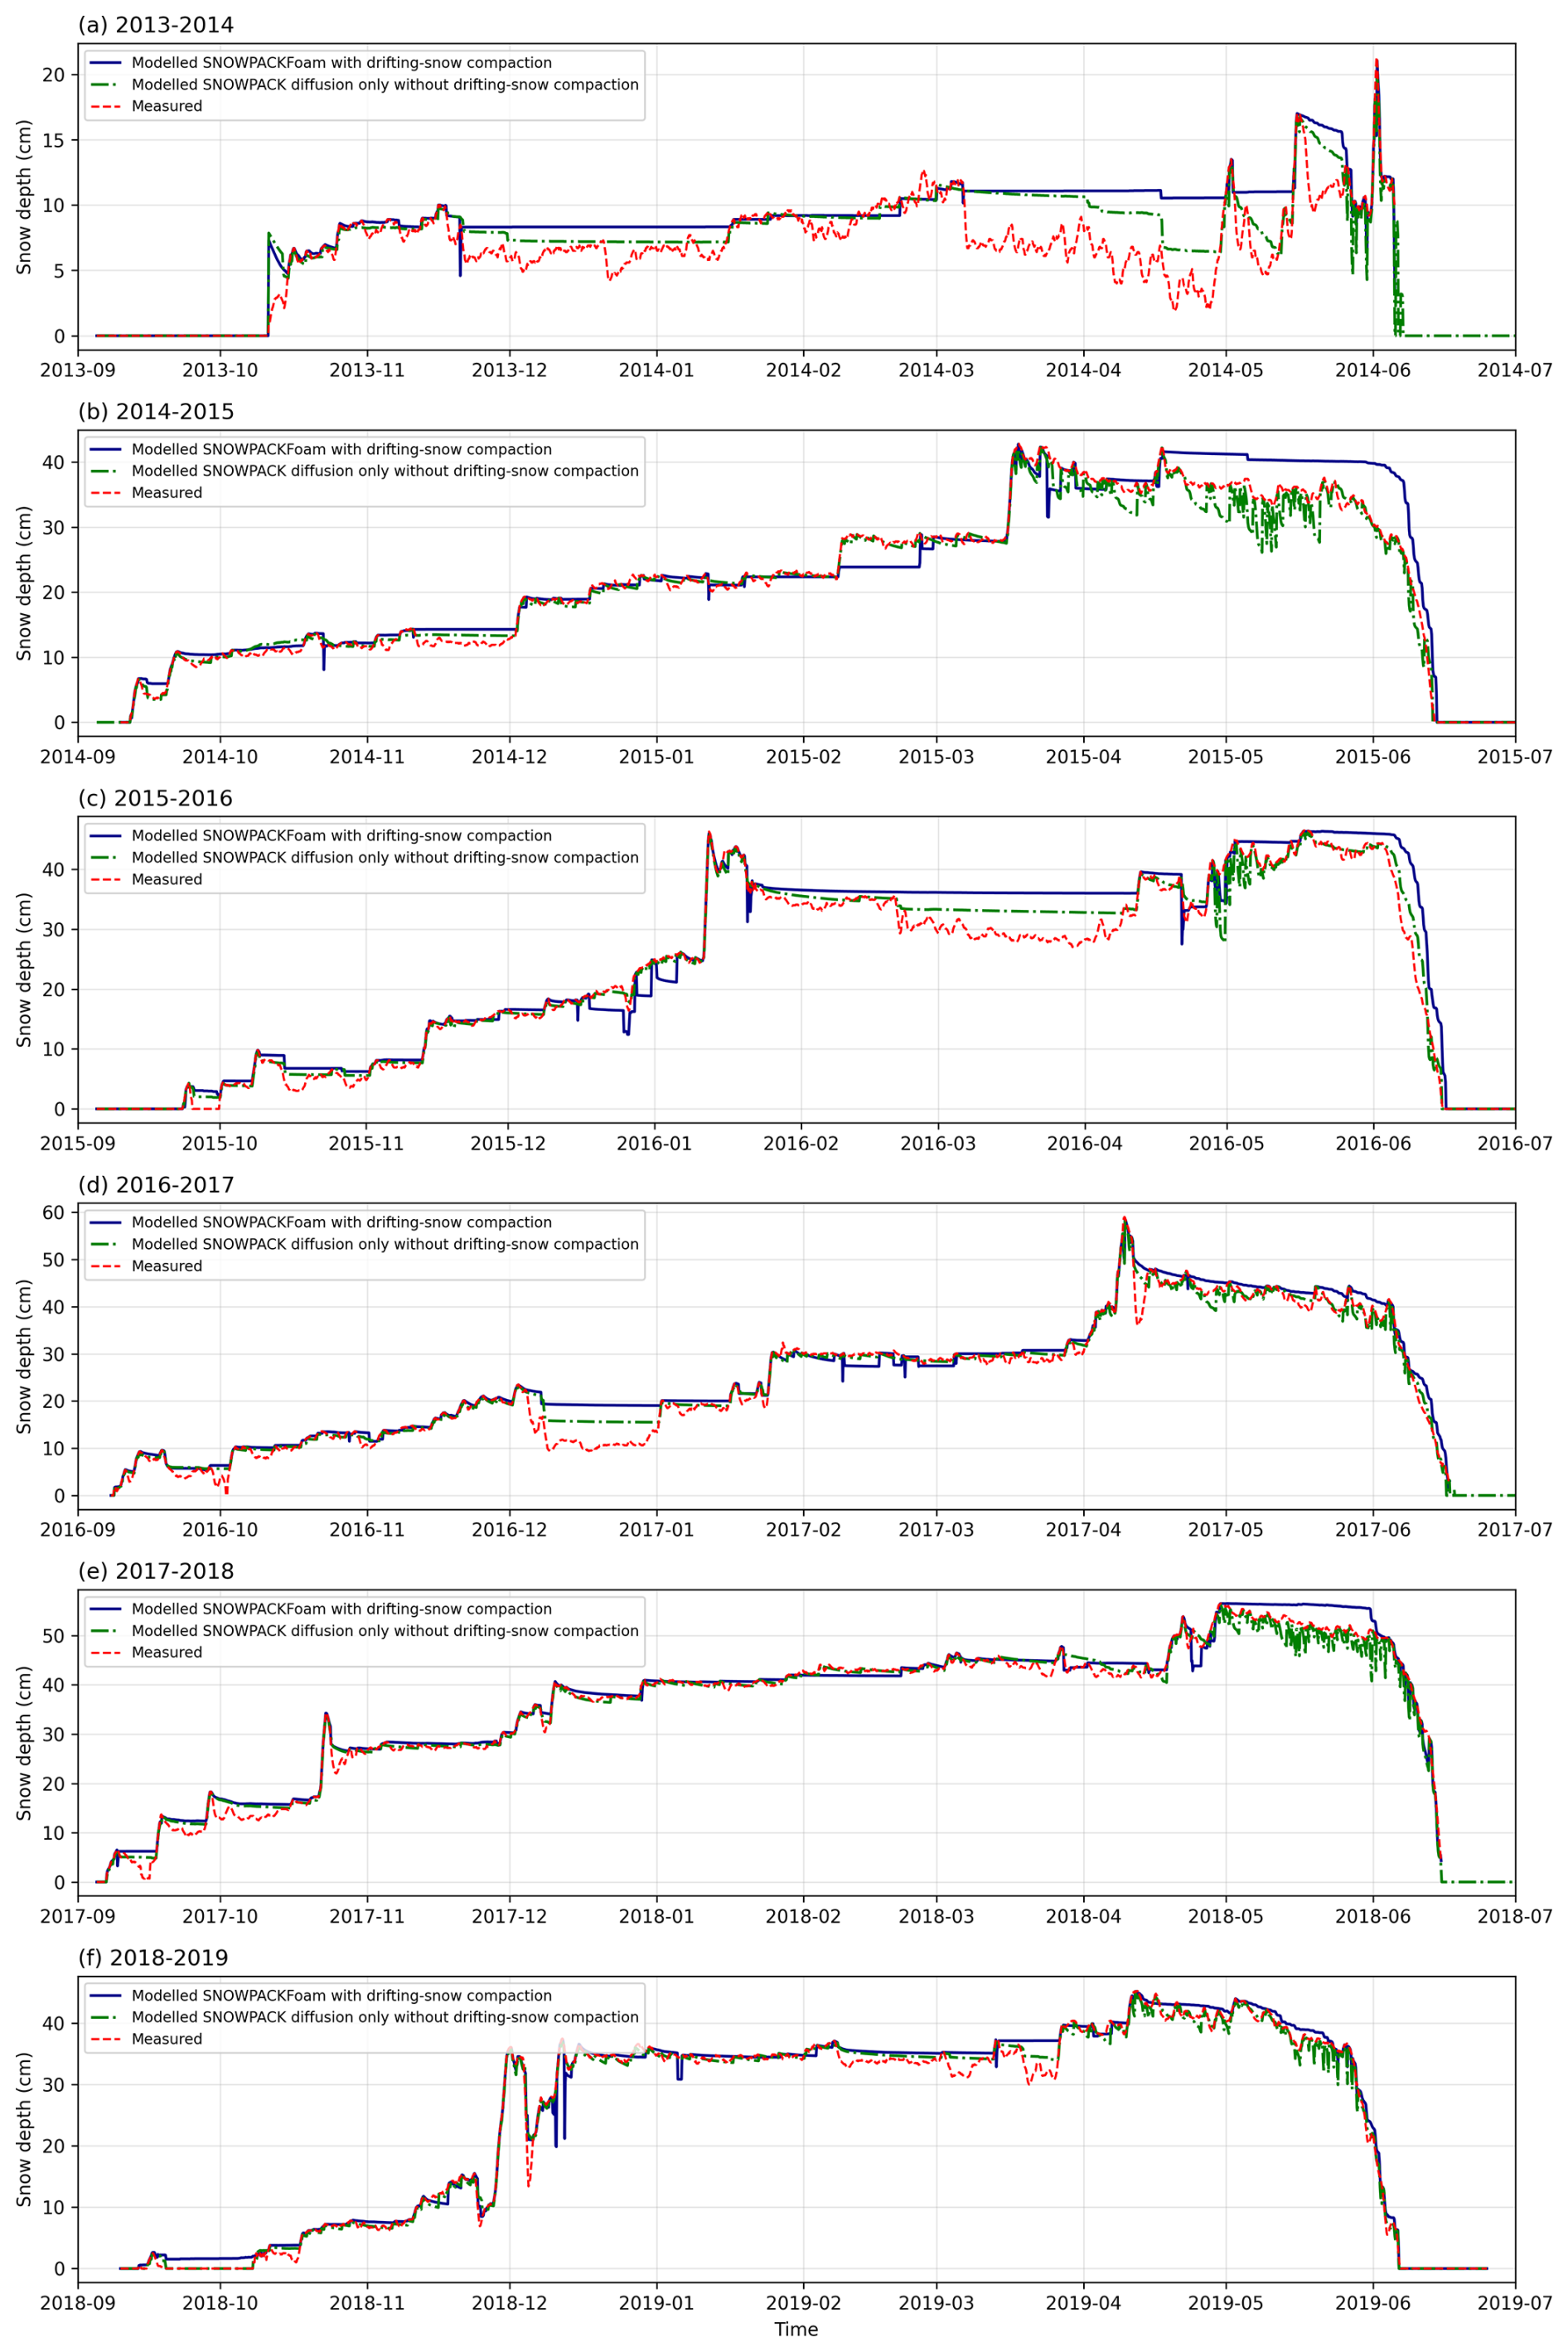
Figure 3The time series of snow height for six winter years from 2013–2014 till 2018–2019 in Bylot herb tundra, the SNOWPACK–OpenFOAM simulations (with convection and drifting-snow compaction) and the SNOWPACK-only simulations (with vapor diffusion, without drifting-snow compaction).
3.1 Upper bound of convection without drifting-snow compaction model
Here, we analyze the effects of convective water-vapor transport at Bylot over tundra permafrost for three winter seasons. The time series for the temperature profiles from purely diffusive SNOWPACK simulations are shown in Fig. 4. As seen in this figure, several persistent cold events occurred, some lasting multiple months. For instance, during the 2017–2018 winter, three major cold events were recorded, the second beginning on 15 December and lasting roughly three and a half months, with almost no change in snow height.
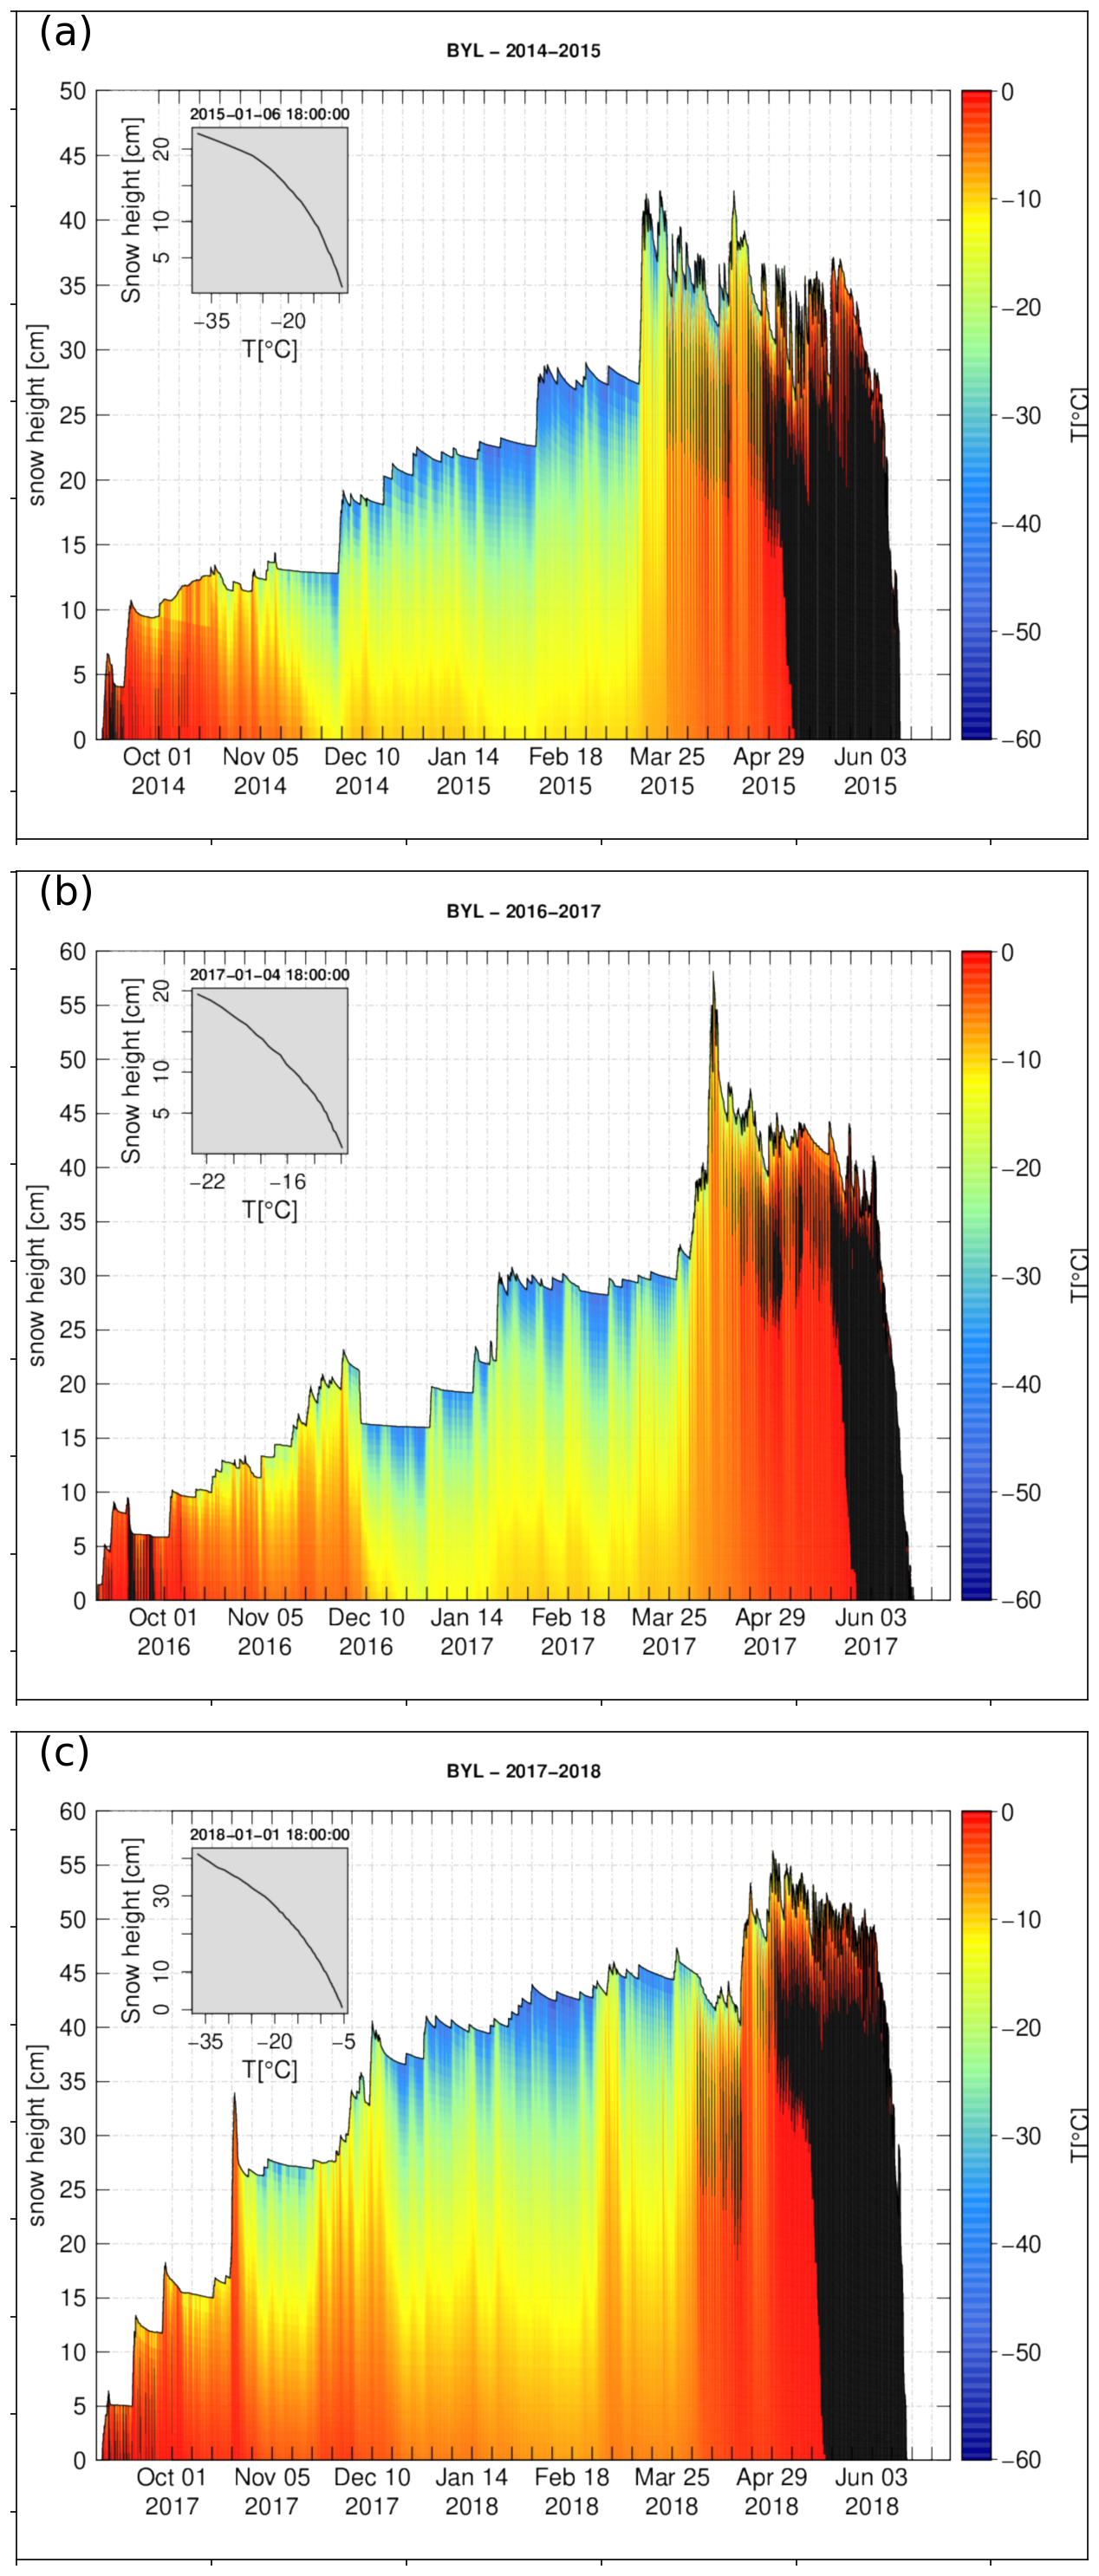
Figure 4The time series of snow temperature from SNOWPACK simulation with only diffusion in Bylot herb tundra for (a) winter season 2014–2015, (b) winter season 2016–2017, and (c) winter season 2017–2018. The insets show the vertical profiles on early January for all three years. Black color refers to zero values.
SNOWPACK simulations with only diffusion are compared to those with convection from SNOWPACK-OpenFOAM simulations, as shown in Fig. 5 for cumulative density change and in Fig. 6 for density change rate due to water vapor transport. As introduced by Jafari et al. (2020), cumulative density change is the summation of snow density change due to the sublimation and deposition of water vapor for each element over all time steps. At Bylot, a large enough temperature difference and low enough snow density fulfill the conditions for significant and persistent convection events that are well synchronized with cold events. For example, during these cold events, SNOWPACK-OpenFOAM simulations show higher values of snow density change rate compared to SNOWPACK simulations (comparing Fig. 6a with Fig. 6c for winter season 2016–2017, and Fig. 6b with Fig. 6d for winter season 2017–2018). This also shows a meaningful difference in snow density change when compared to diffusion from SNOWPACK simulations, particularly for the snow density increase in the deposition zone. For example, the cumulative snow density change is increased by 35 kg m−3 in the winter season 2017–2018 whereas the increase by diffusion from SNOWPACK simulations is small and around 5 kg m−3 (comparing Fig. 5b to d). This would be even larger and around 55 kg m−3 for local cumulative density change as is shown in Fig. 9f for two-dimensional profiles.
More cumulative density change with a different profile is also observed from SNOWPACK-OpenFOAM results compared to diffusion alone from SNOWPACK simulations. This can be seen by comparing the subplots of Fig. 5a and c for winter season 2016–2017 and Fig. 5b and d for winter season 2017–2018. Moreover, an effective depth of about 10–20 cm is observed for decreased snow density by convective vapor transport (Fig. 7a and e) while for diffusive vapor transport, the reduced snow density is mainly observed for a thin layer close to the ground (Fig. 7a, c and e). Similarly, the density profiles observed before the melt season from SNOWPACK-OpenFOAM simulations, have an obvious shift and decrease compared to diffusion-only results (Fig. 7b, d and f). A decrease in density is not limited only to layers close to the ground and it can be seen almost through the whole lower snow column, amounting up to 60 kg m−3 (Fig. 7a, d, and f).
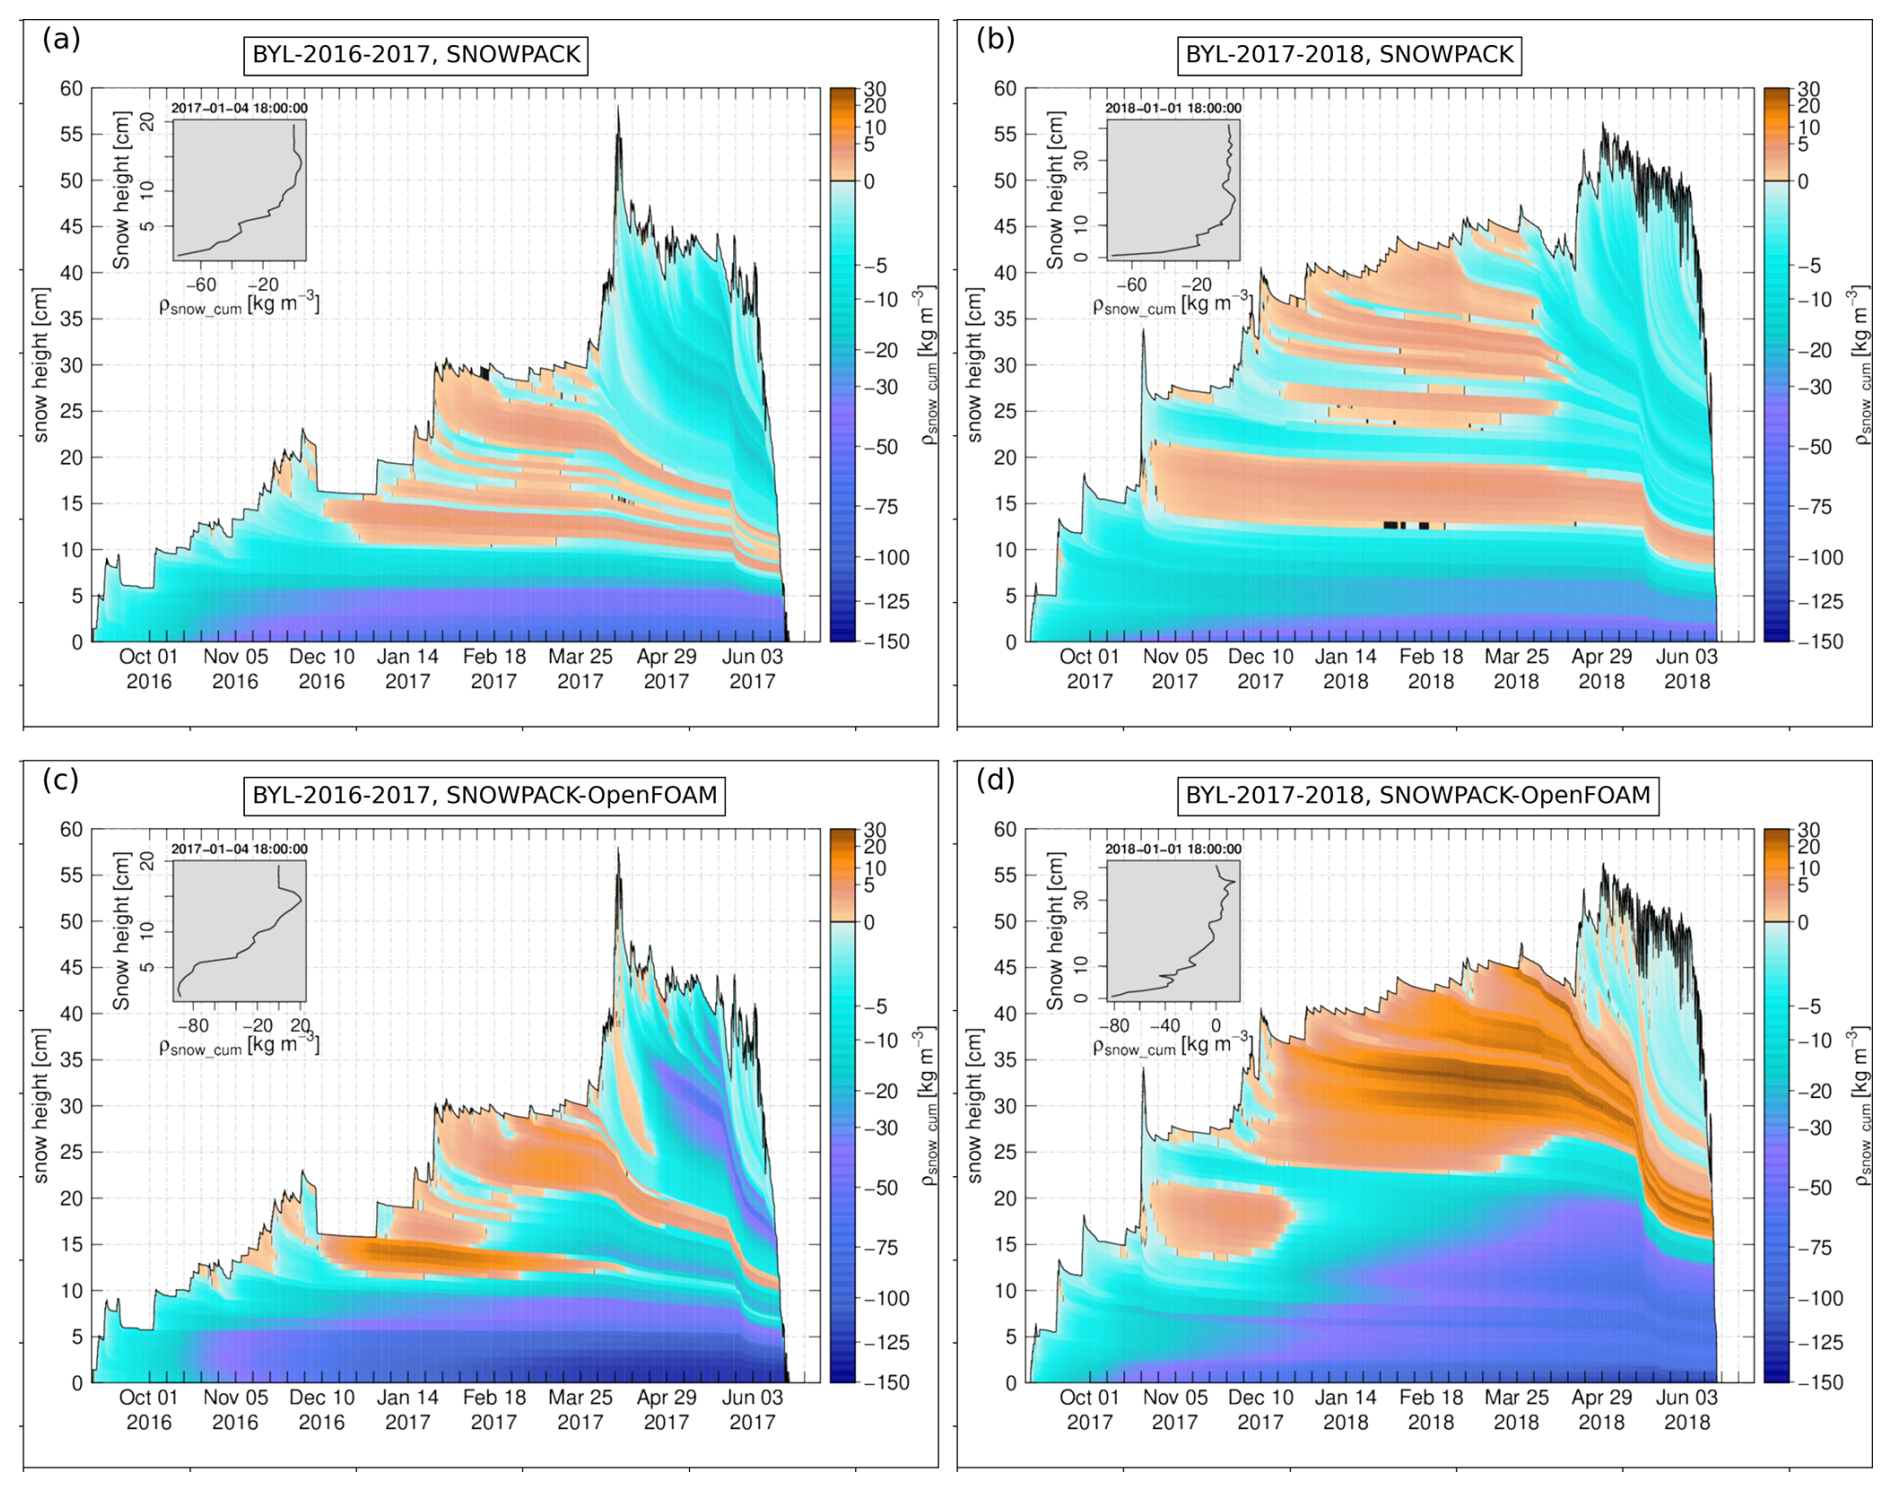
Figure 5The time series of cumulative density change in Bylot herb tundra for (a) winter 2016–2017 and (b) winter 2017–2018 for SNOWPACK simulation with diffusion and for (c) winter 2016–2017 and (d) winter 2017–2018 for SNOWPACK-OpenFOAM simulation with convection. The insets in (a), (b), (c), and (d) show the vertical profiles on early January for both years. Black color refers to zero values.
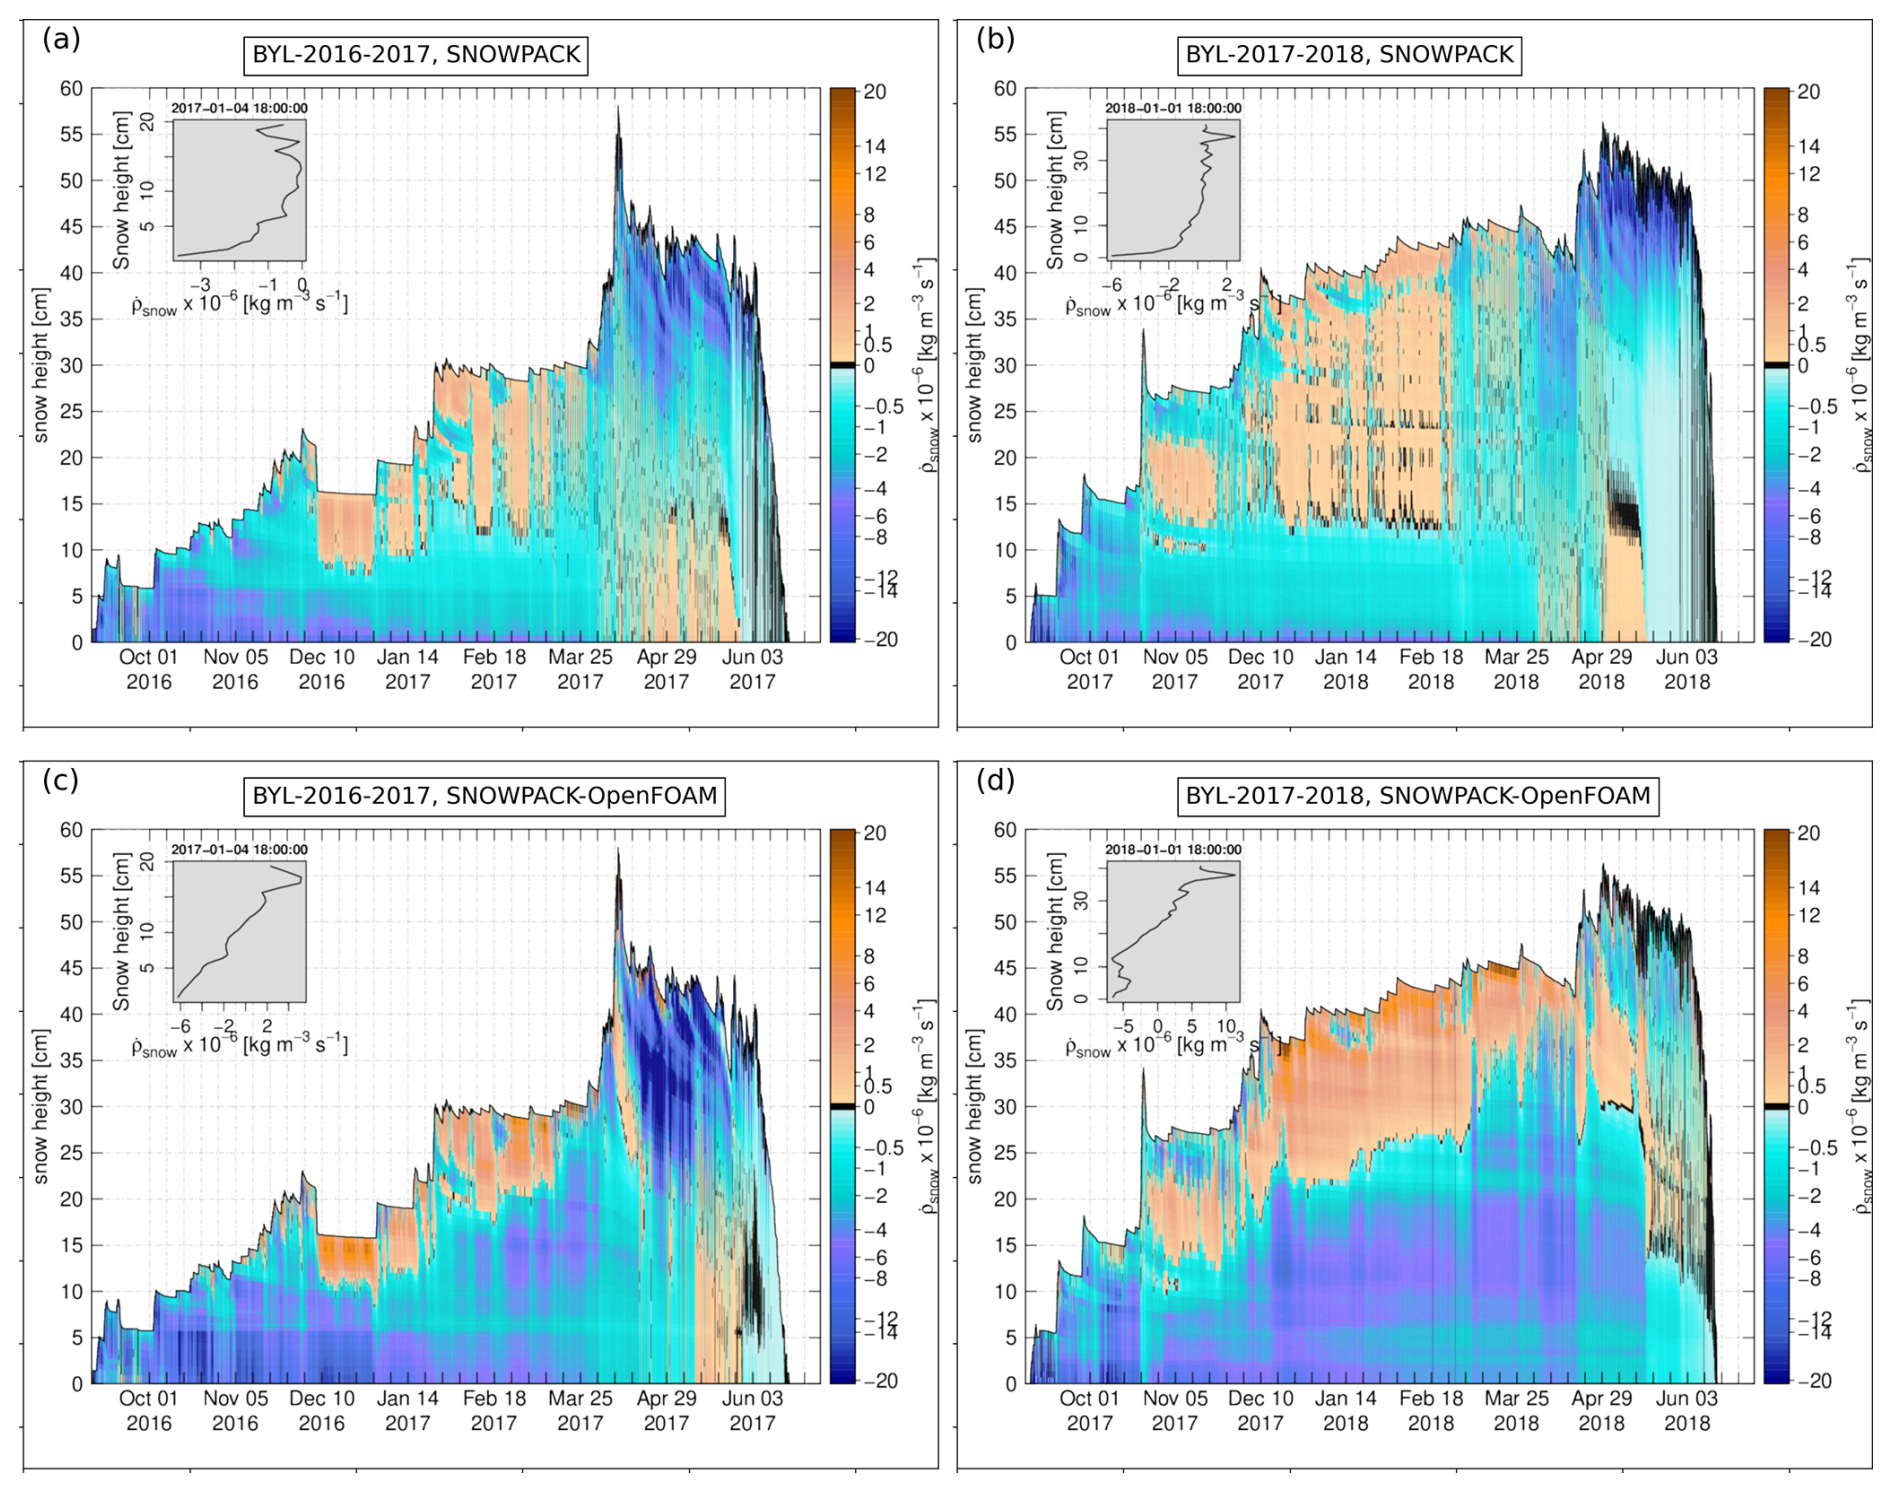
Figure 6The time series of snow density change rate due to vapor transport in Bylot herb tundra for (a) winter 2016–2017 and (b) winter 2017–2018 for SNOWPACK simulation with diffusion and for (c) winter 2016–2017 and (d) winter 2017–2018 for SNOWPACK-OpenFOAM simulation with convection. The insets in (a), (b), (c), and (d) show the vertical profiles on early January for both years. Black color refers to zero values.
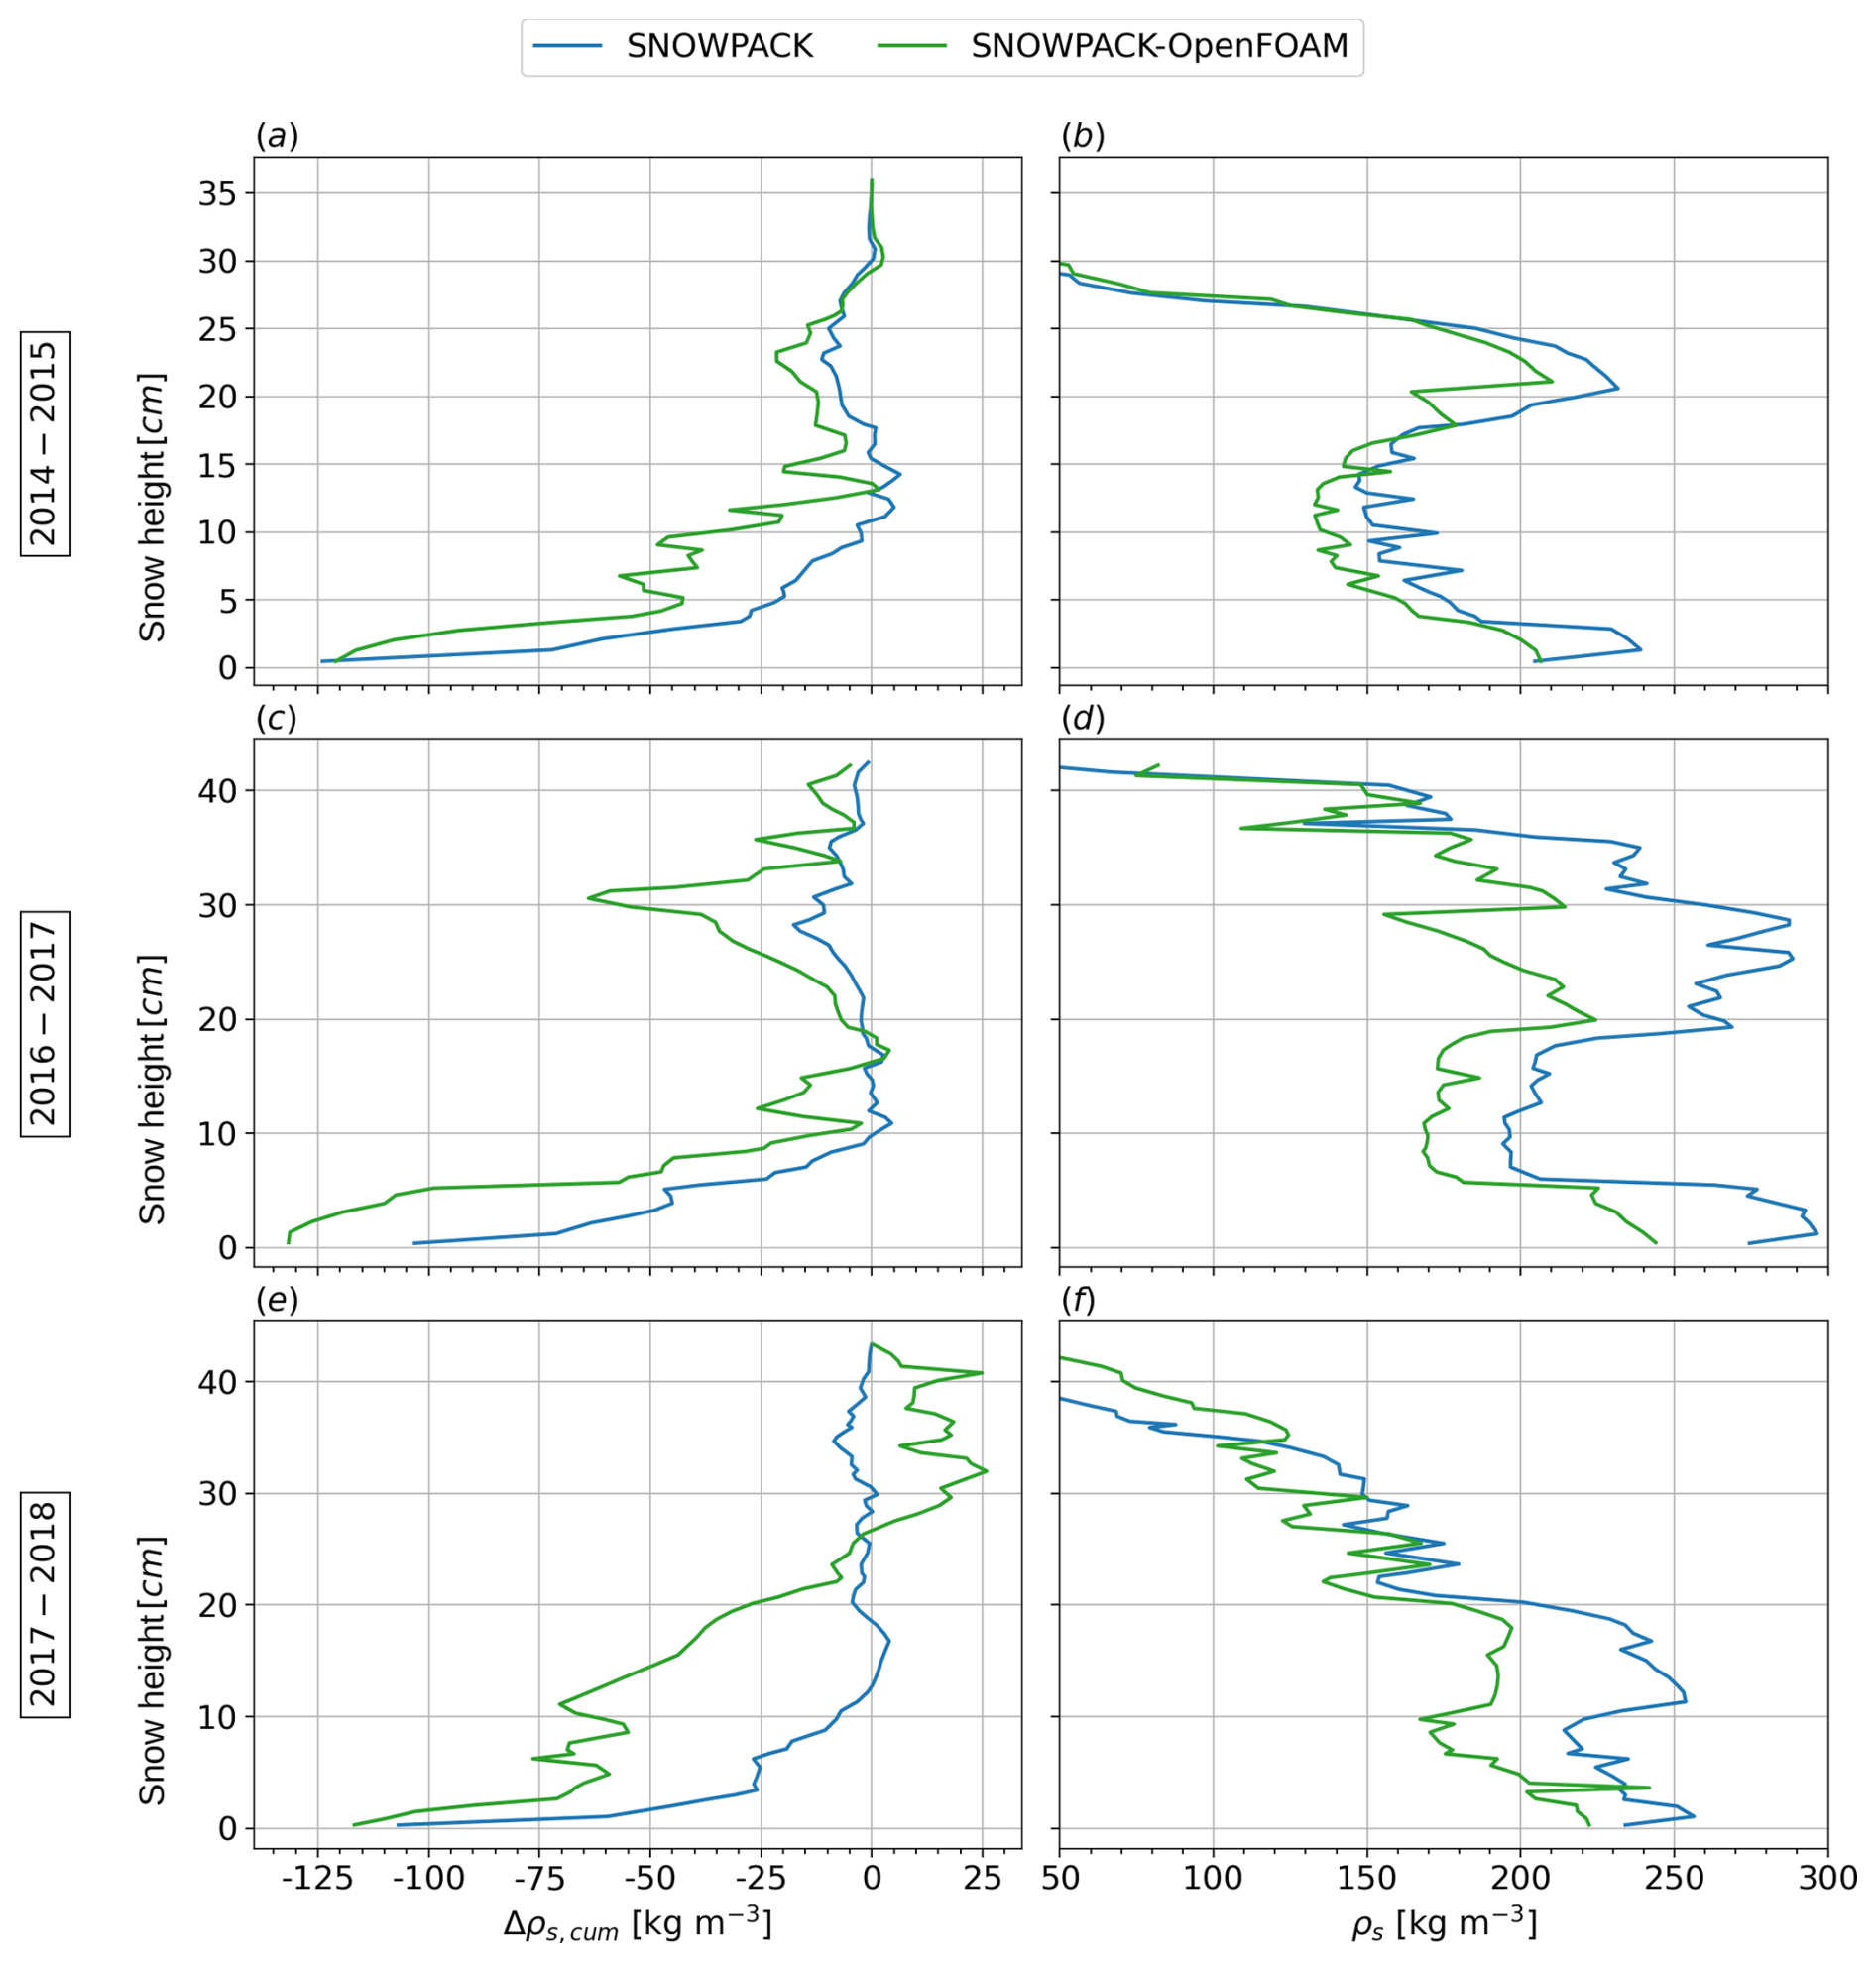
Figure 7Comparison between diffusion from SNOWPACK simulation (without drifting-snow compaction) and convection from SNOWPACK-OpenFOAM simulation (without drifting-snow compaction) for cumulative snow density change (Δρs,cum) and snow density (ρs) profiles on 12 April 2015, 12:00:00 for winter season 2014–2015, 13 May 2017, 12:00:00 for winter season 2016–2017, and 14 April 2018, 12:00:00 for winter season 2017–2018.
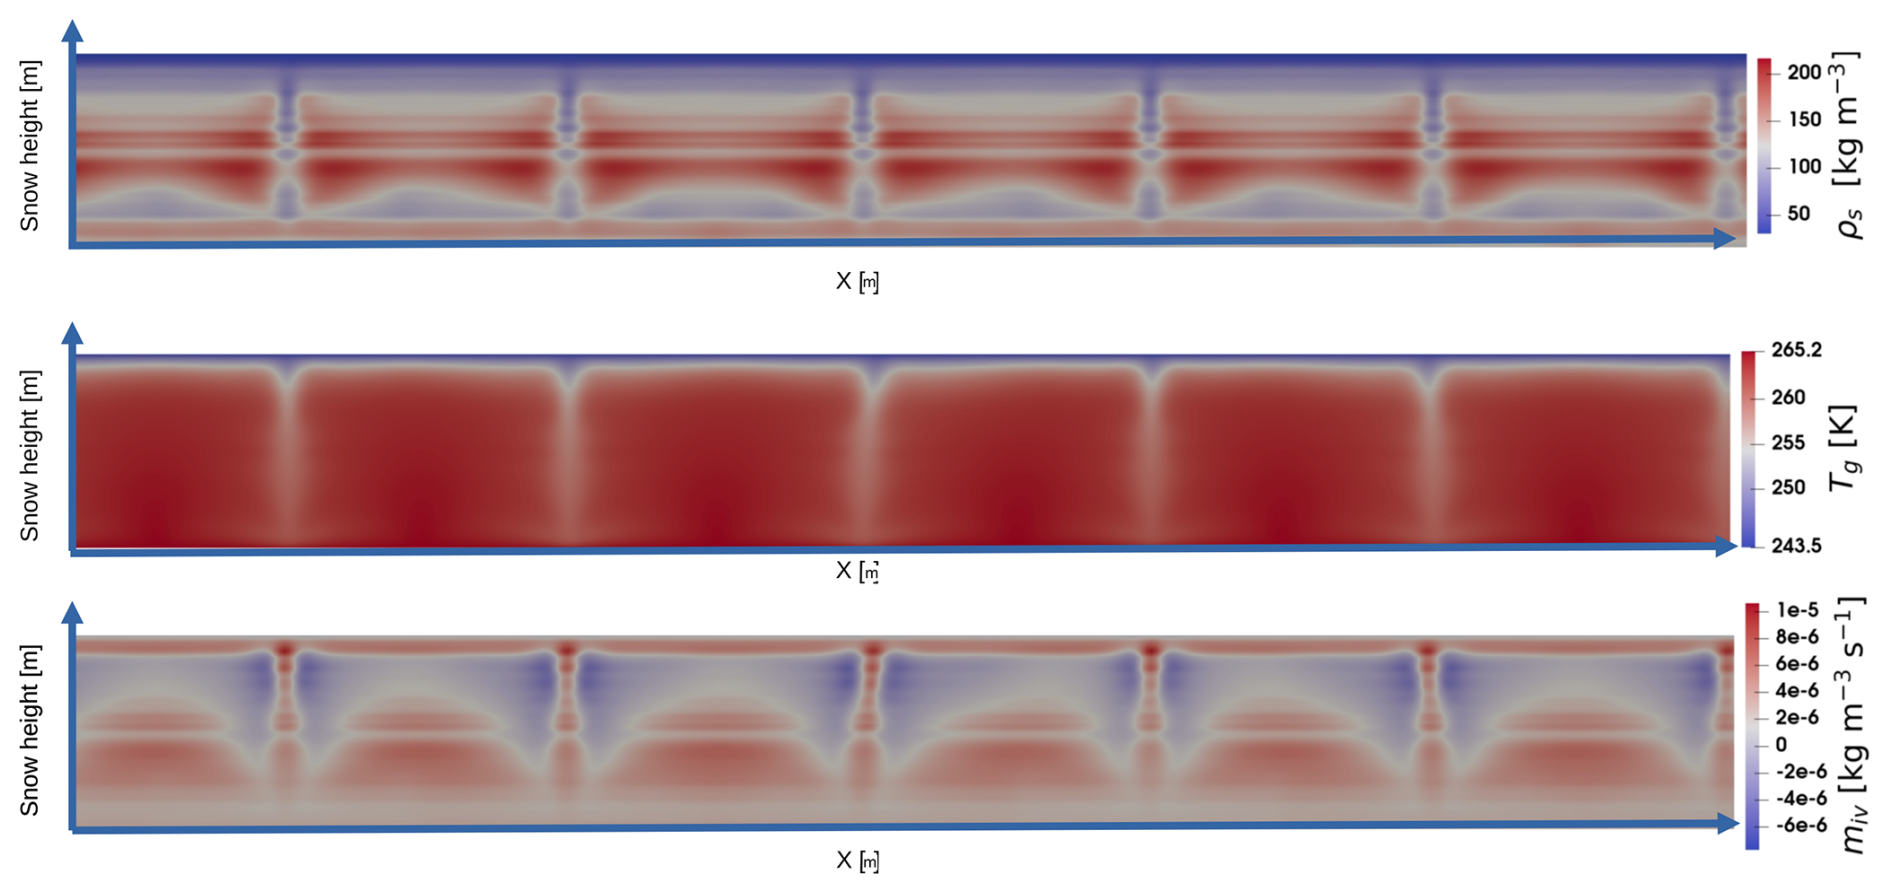
Figure 8Simulated two-dimensional plots from SNOWPACK-OpenFOAM coupling on 11 March 2018 12:00:00 for (a) snow density, (b) the gas phase temperature, and (c) the phase change rate from ice to vapor.
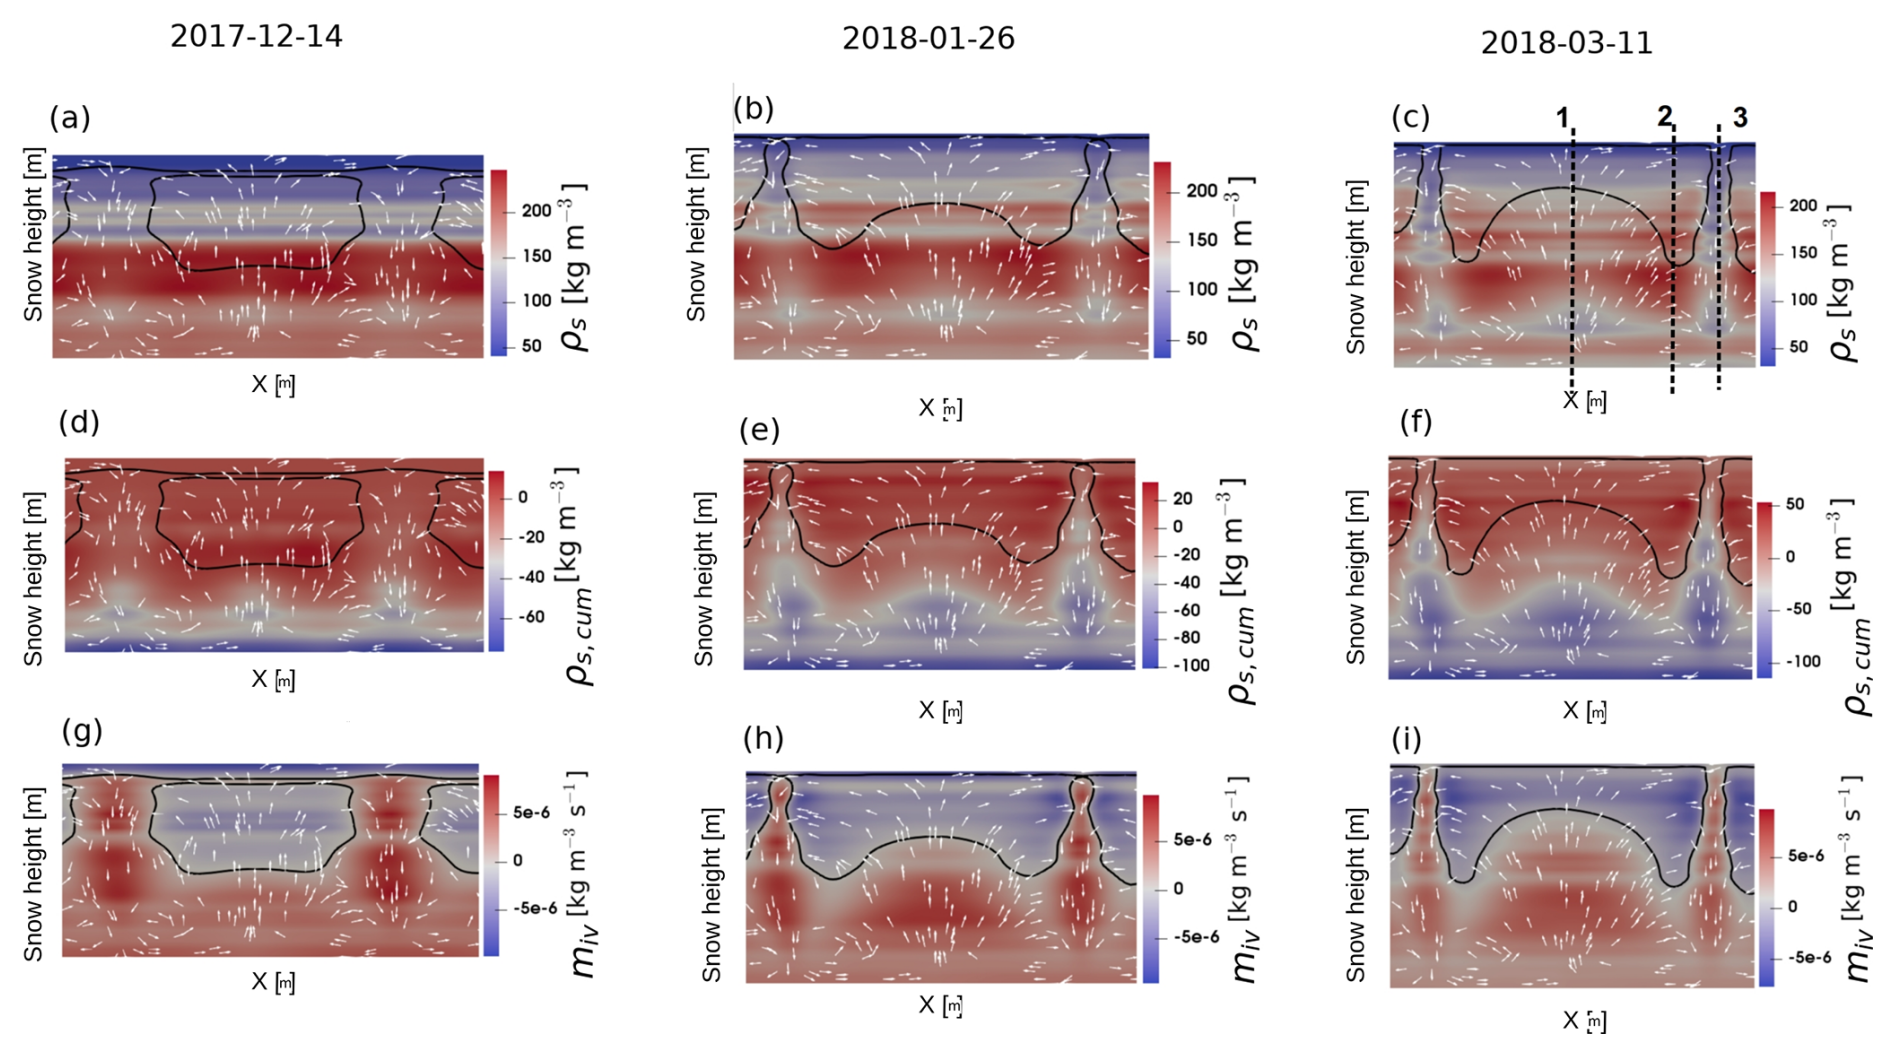
Figure 9Evolution of snow density, cumulative snow density change, and phase change rate from ice to vapor for different dates as 14 December, 26 January, and 11 March in the winter season 2017–2018. The white arrows show the flow direction and are not scaled with the velocity magnitude.
As an example, we focus on the winter season 2017–2018 to explore the effects of convection on the thermal and phase change regimes and how it laterally and vertically changes the snow density and temperature. To do this, the two-dimensional profiles for snow density are shown in Fig. 8 at the end of second cold event on 11 March. As can be seen, the convection cells have the same lateral pattern for shaping the snow density profile. Time snapshots to show the evolution in snow density due to convective water vapor transport for the beginning (14 December), middle (26 January), and end (11 March) of the second cold event are shown in Fig. 9. For the first snapshot, we do not see a large footprint of convection in the snow density (Fig. 9a) but we can already observe the initial changes in the cumulative snow density (Fig. 9d). As indicated in Fig. 9 for phase change from ice to vapor, for all three snapshots, we can see that sublimation is significant for the whole downward flow and not only for the layer close to the ground. This is different from what we observed for the effective sublimation zone in idealized snowpacks discussed in Jafari et al. (2022). For the second time snapshot (middle of the second cold event on 14 December), the sublimation can already create a vertical low density path through a significant depth of the snow to consequently have increased flow velocity in the whole downward flow. This process continues till the end of the second cold event such that the convection cells gets stronger and more stable over time and stay at their initial location. Here, we do not see the lateral displacement of the convection cells, which is again different from what we indicated for idealized snowpacks in Jafari et al. (2022).
One more different observation for convection in SNOWPACK generated snow covers from the one in idealized snowpacks is that the deposition zone often expected to be on top in the upward flow is increasingly distorted toward the region of downward flow as time progresses. Although the convection cells do not migrate laterally, the flow-blocking process in upward flow due to deposition still distorts the deposition zone toward the region on top between downward and upward flows (Fig. 9c).
Furthermore, as can also be seen from Fig. 10, significant lateral variations within a convection cell are present on OpenFOAM-SNOWPACK coupling for snow density, cumulative snow density change, and snow temperature. In Fig. 10, profiles are plotted over three different vertical lines (as drawn in Fig. 9c) i.e. line 1 for upward flow, line 2 between upward and downward flows, and finally line 3 for downward flow. For example, lateral differences up to 90 kg m−3 (115 %) are observed for snow density (Fig. 10b and c) and up to 5 K (30 %) for snow temperature (Fig. 10f and g) at the end (10 March) of the second cold event in the winter season 2017–2018. These large lateral temperature differences are consistent with the observations of Sturm and Johnson (1991).
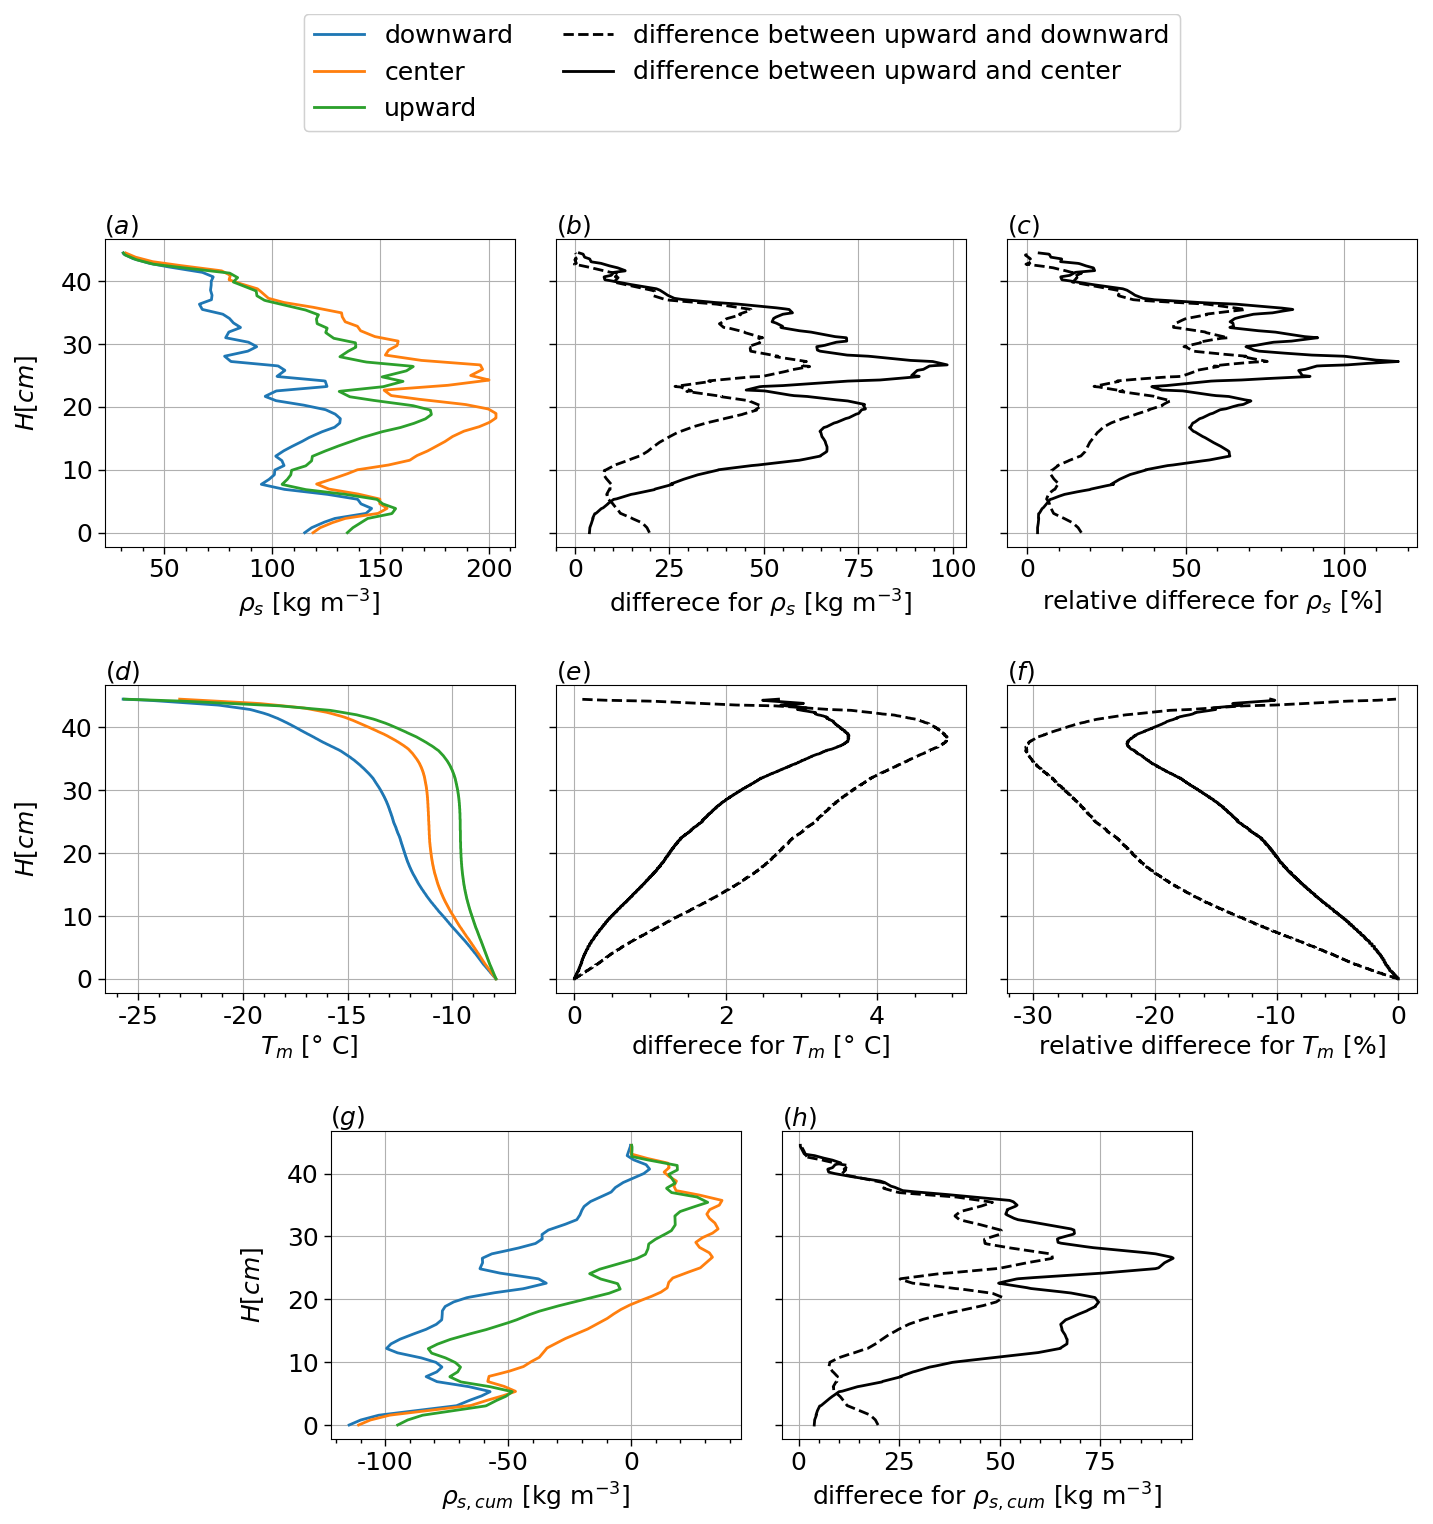
Figure 10Lateral variations in a convection cell for the snow density, temperature, and cumulative snow density change due to water vapor transport. These profiles are plotted over three vertical lines as drawn in Fig. 9c on 11 March in winter seasons 2017–2018.
The sensitivity analysis on the horizontal domain length shows that the smaller domain length has a small effect on snow density (Fig. 11). This is important as it helps considerably to reduce computational time. As explained in item (vi) of Sect. 2, to reduce computational time, the “flow freezing” strategy is used. Figure 12 shows that the difference from “full integration” case is small for snow density and cumulative snow density change, with the maximum difference in snow density being only between 5 and 10 kg m−3 (1.3 %–3.6 % of the hard slab density). We point out, however, that the snow density change rate and flow velocity are similar only for moderate convection events and they are quite different for the strong convection events observed at the end of the second month in the winter season. These values are smaller for “flow-freezing” again in particular at the bottom of the snowpack (smaller by a factor of two), where strong grain growth leads to stronger convection. This implies that we may underestimate the effects of convection when using “flow-freezing”. Further sensitivity studies are needed to explore this effect together with the grain size representation.
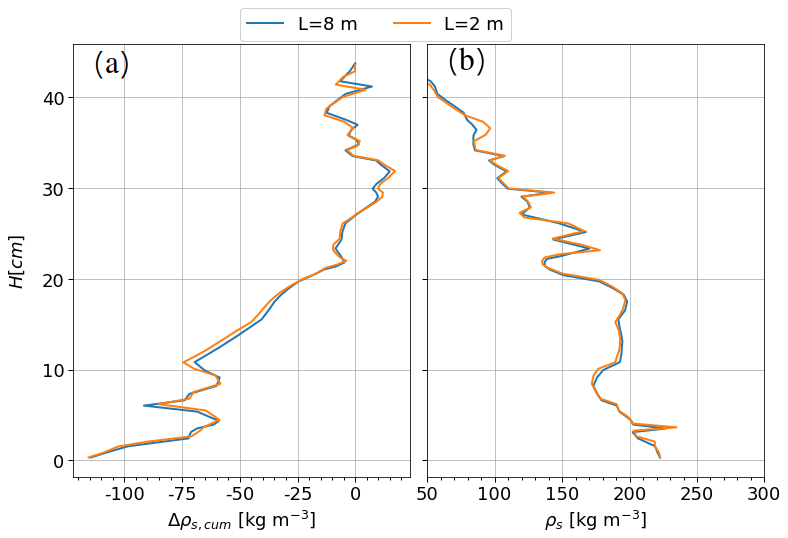
Figure 11The sensitivity analysis on the horizontal domain length for winter 2017–2018 on 14 April 2018, 12:00:00 in Bylot herb tundra, (a) cumulative density change and (b) snow density. Here, L is the horizontal domain length.
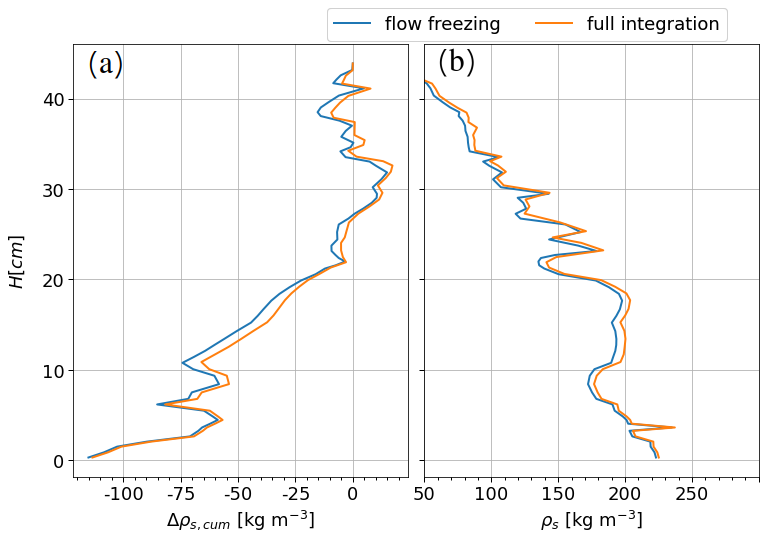
Figure 12The sensitivity analysis for the difference between “flow freezing” and “full integration” strategies for winter 2017–2018 on 14 April 2018, 12:00:00 in Bylot herb tundra, (a) cumulative density change and (b) snow density.
3.2 Lower bound of convection with drifting-snow compaction model
Having established the upper bound of convection intensity, we now examine the lower bound obtained under Arctic conditions with drifting-snow compaction. In this scenario, the snow surface does not remain loosely structured, thereby preventing the development of natural convection due to mechanical suppression by wind slabs. The resulting simulations highlight the minimum potential effects of convective vapor transport on snow density, temperature, and associated snowpack properties.
To represent the lower bound of convection intensity, simulations were carried out with the drifting-snow compaction model activated in SNOWPACK. The drifting-snow compaction scheme, introduced by Keenan et al. (2021); Wever et al. (2023), removes a few centimetres of surface snow and redeposits it into a denser layer. The resulting snow density depends primarily on the local wind speed. We analyzed six winter seasons (2013–2014 to 2018–2019) at the Bylot tundra permafrost site (Domine et al., 2021), focusing on the time series of snow density and the averaged convective-flow velocity shown in Figs. 13 and 15 respectively all from the coupled SNOWPACK–OpenFOAM simulations. The time series for wind speed for these six years are shown in Fig. 14. For wind speeds exceeding about 7 m s−1, rapid and localized increases in snow density shown in Fig. 13 are consistently observed and these are clear signatures of wind-compaction events. These dense wind slabs dominate the vertical snow-structure evolution. Occasional density increases from early melt episodes were also identified but had a secondary effect compared with wind compaction.
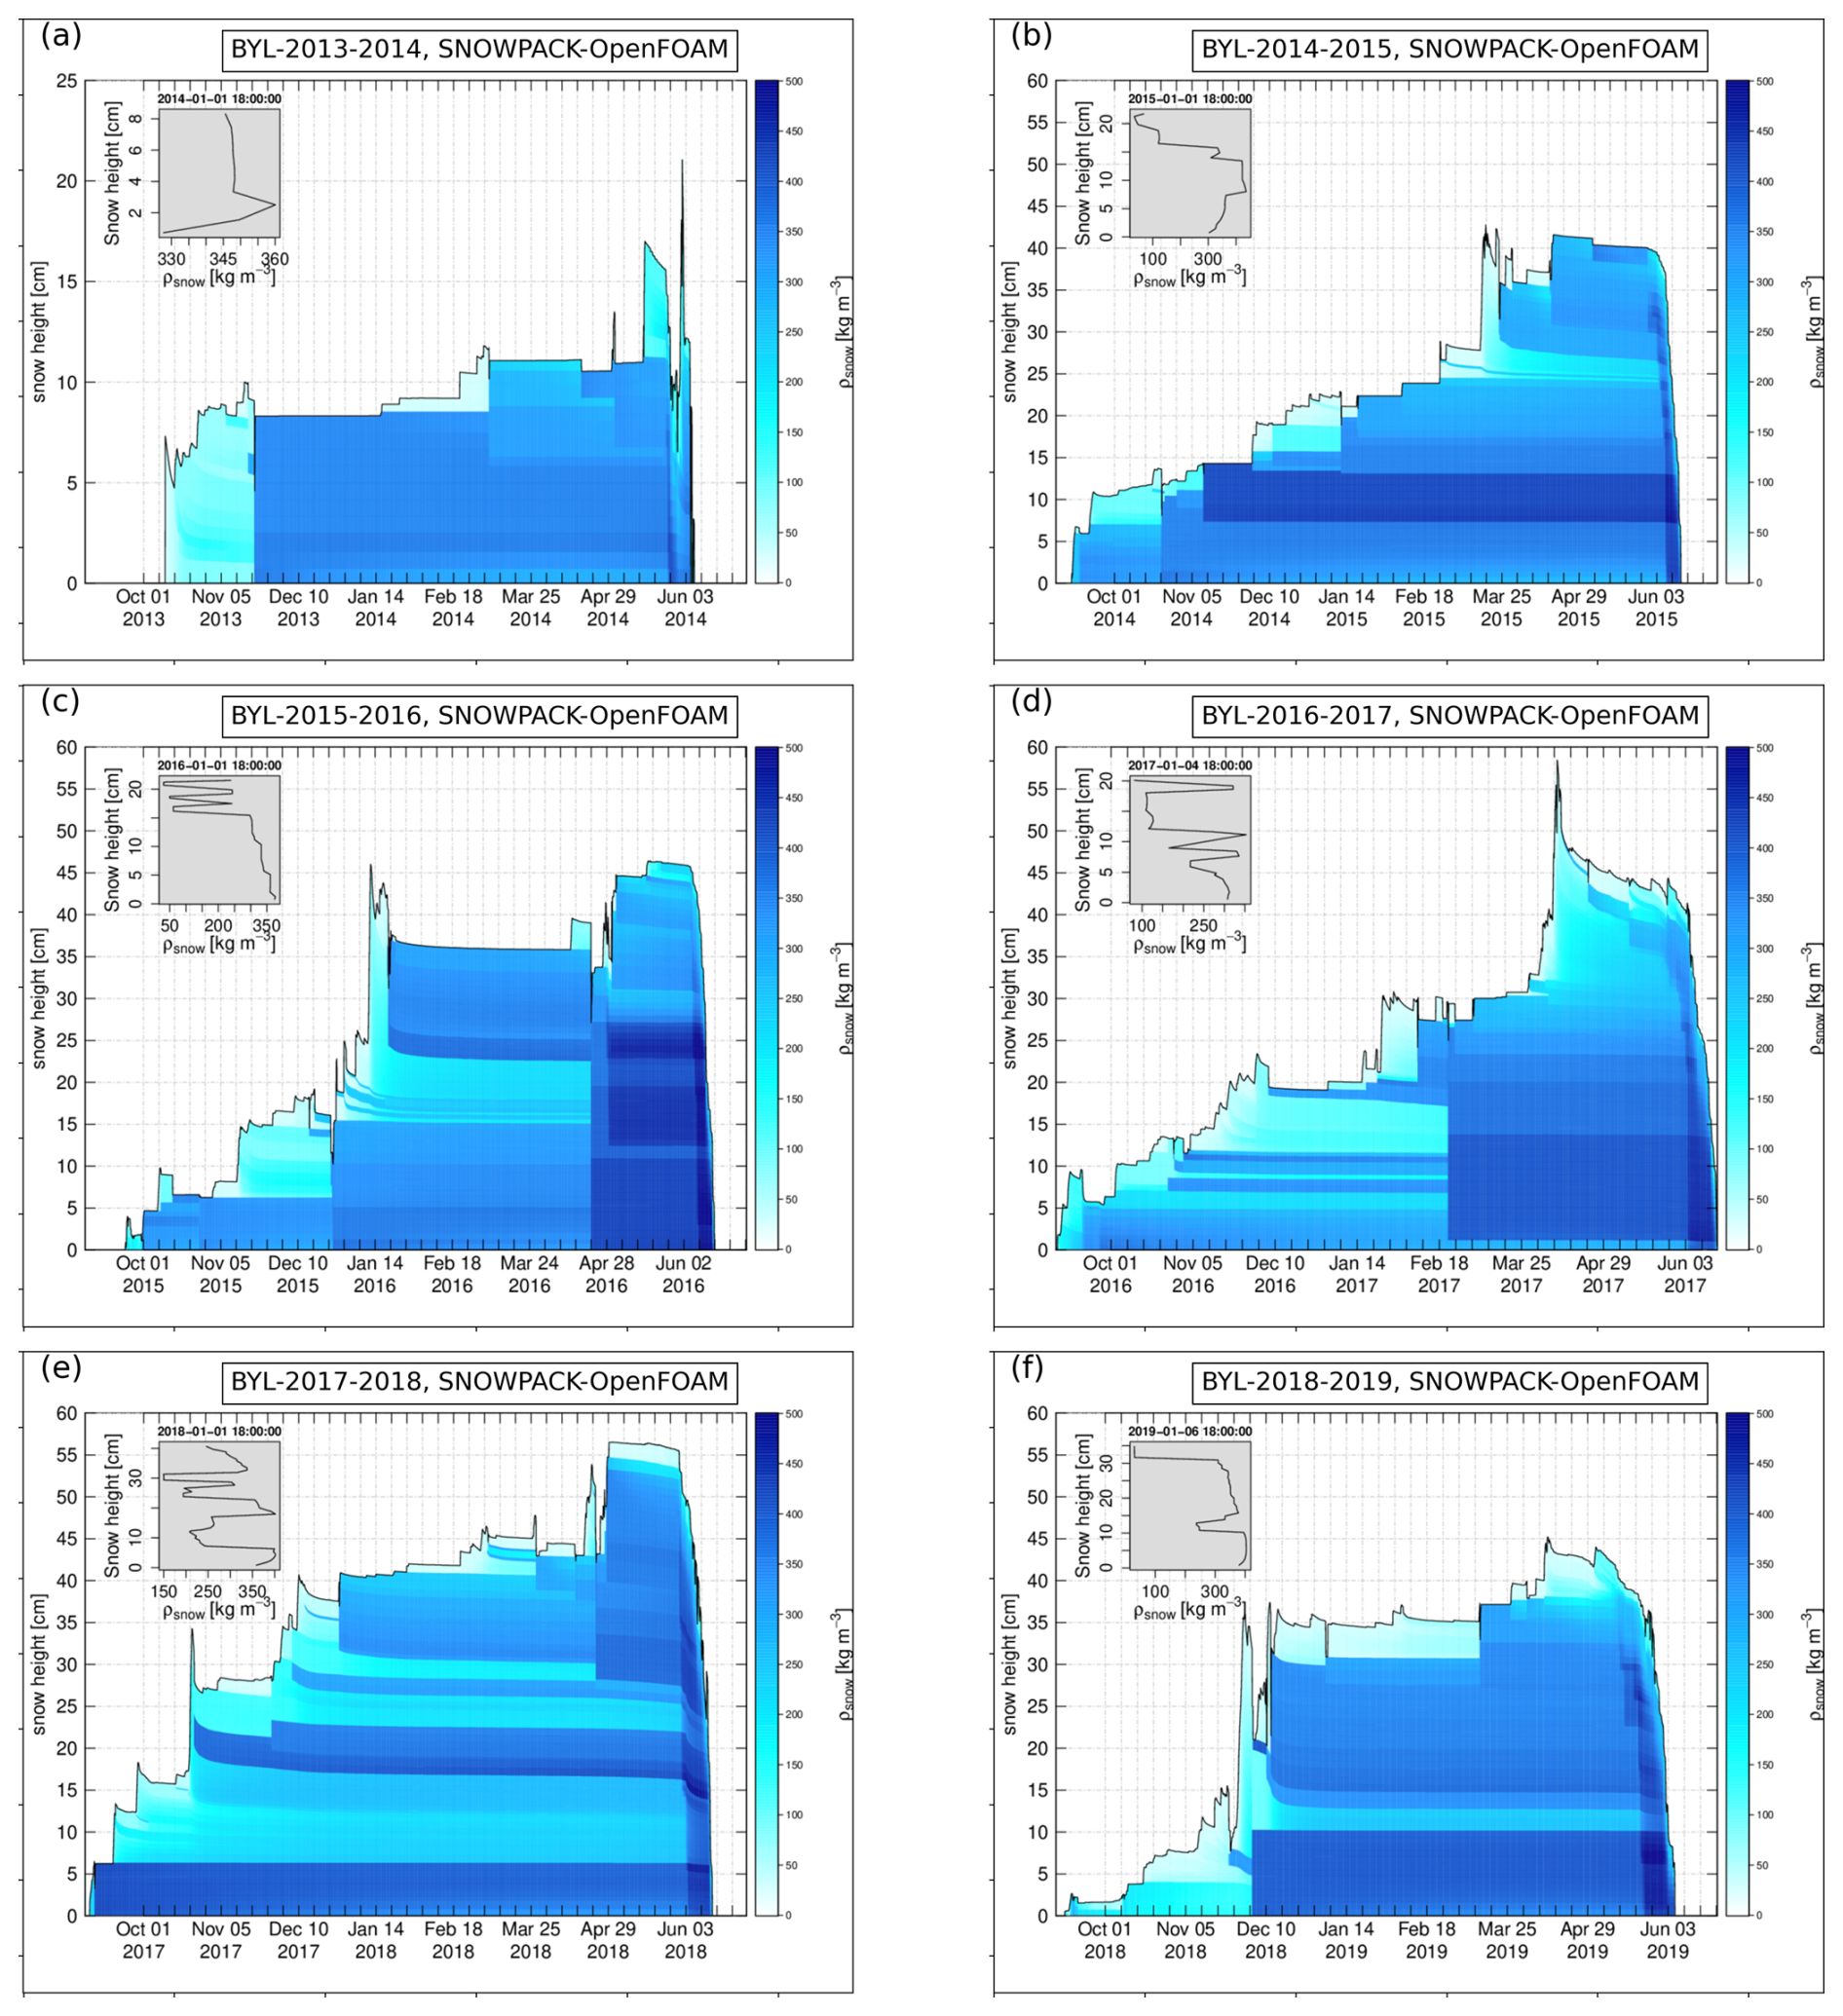
Figure 13The time series of snow density for six winter years from 2013–2014 till 2018–2019 in Bylot herb tundra, SNOWPACK-OpenFOAM simulations with convection and drifting-snow compaction model active in SNOWPACK. The insets show vertical profiles on early January for all six years.
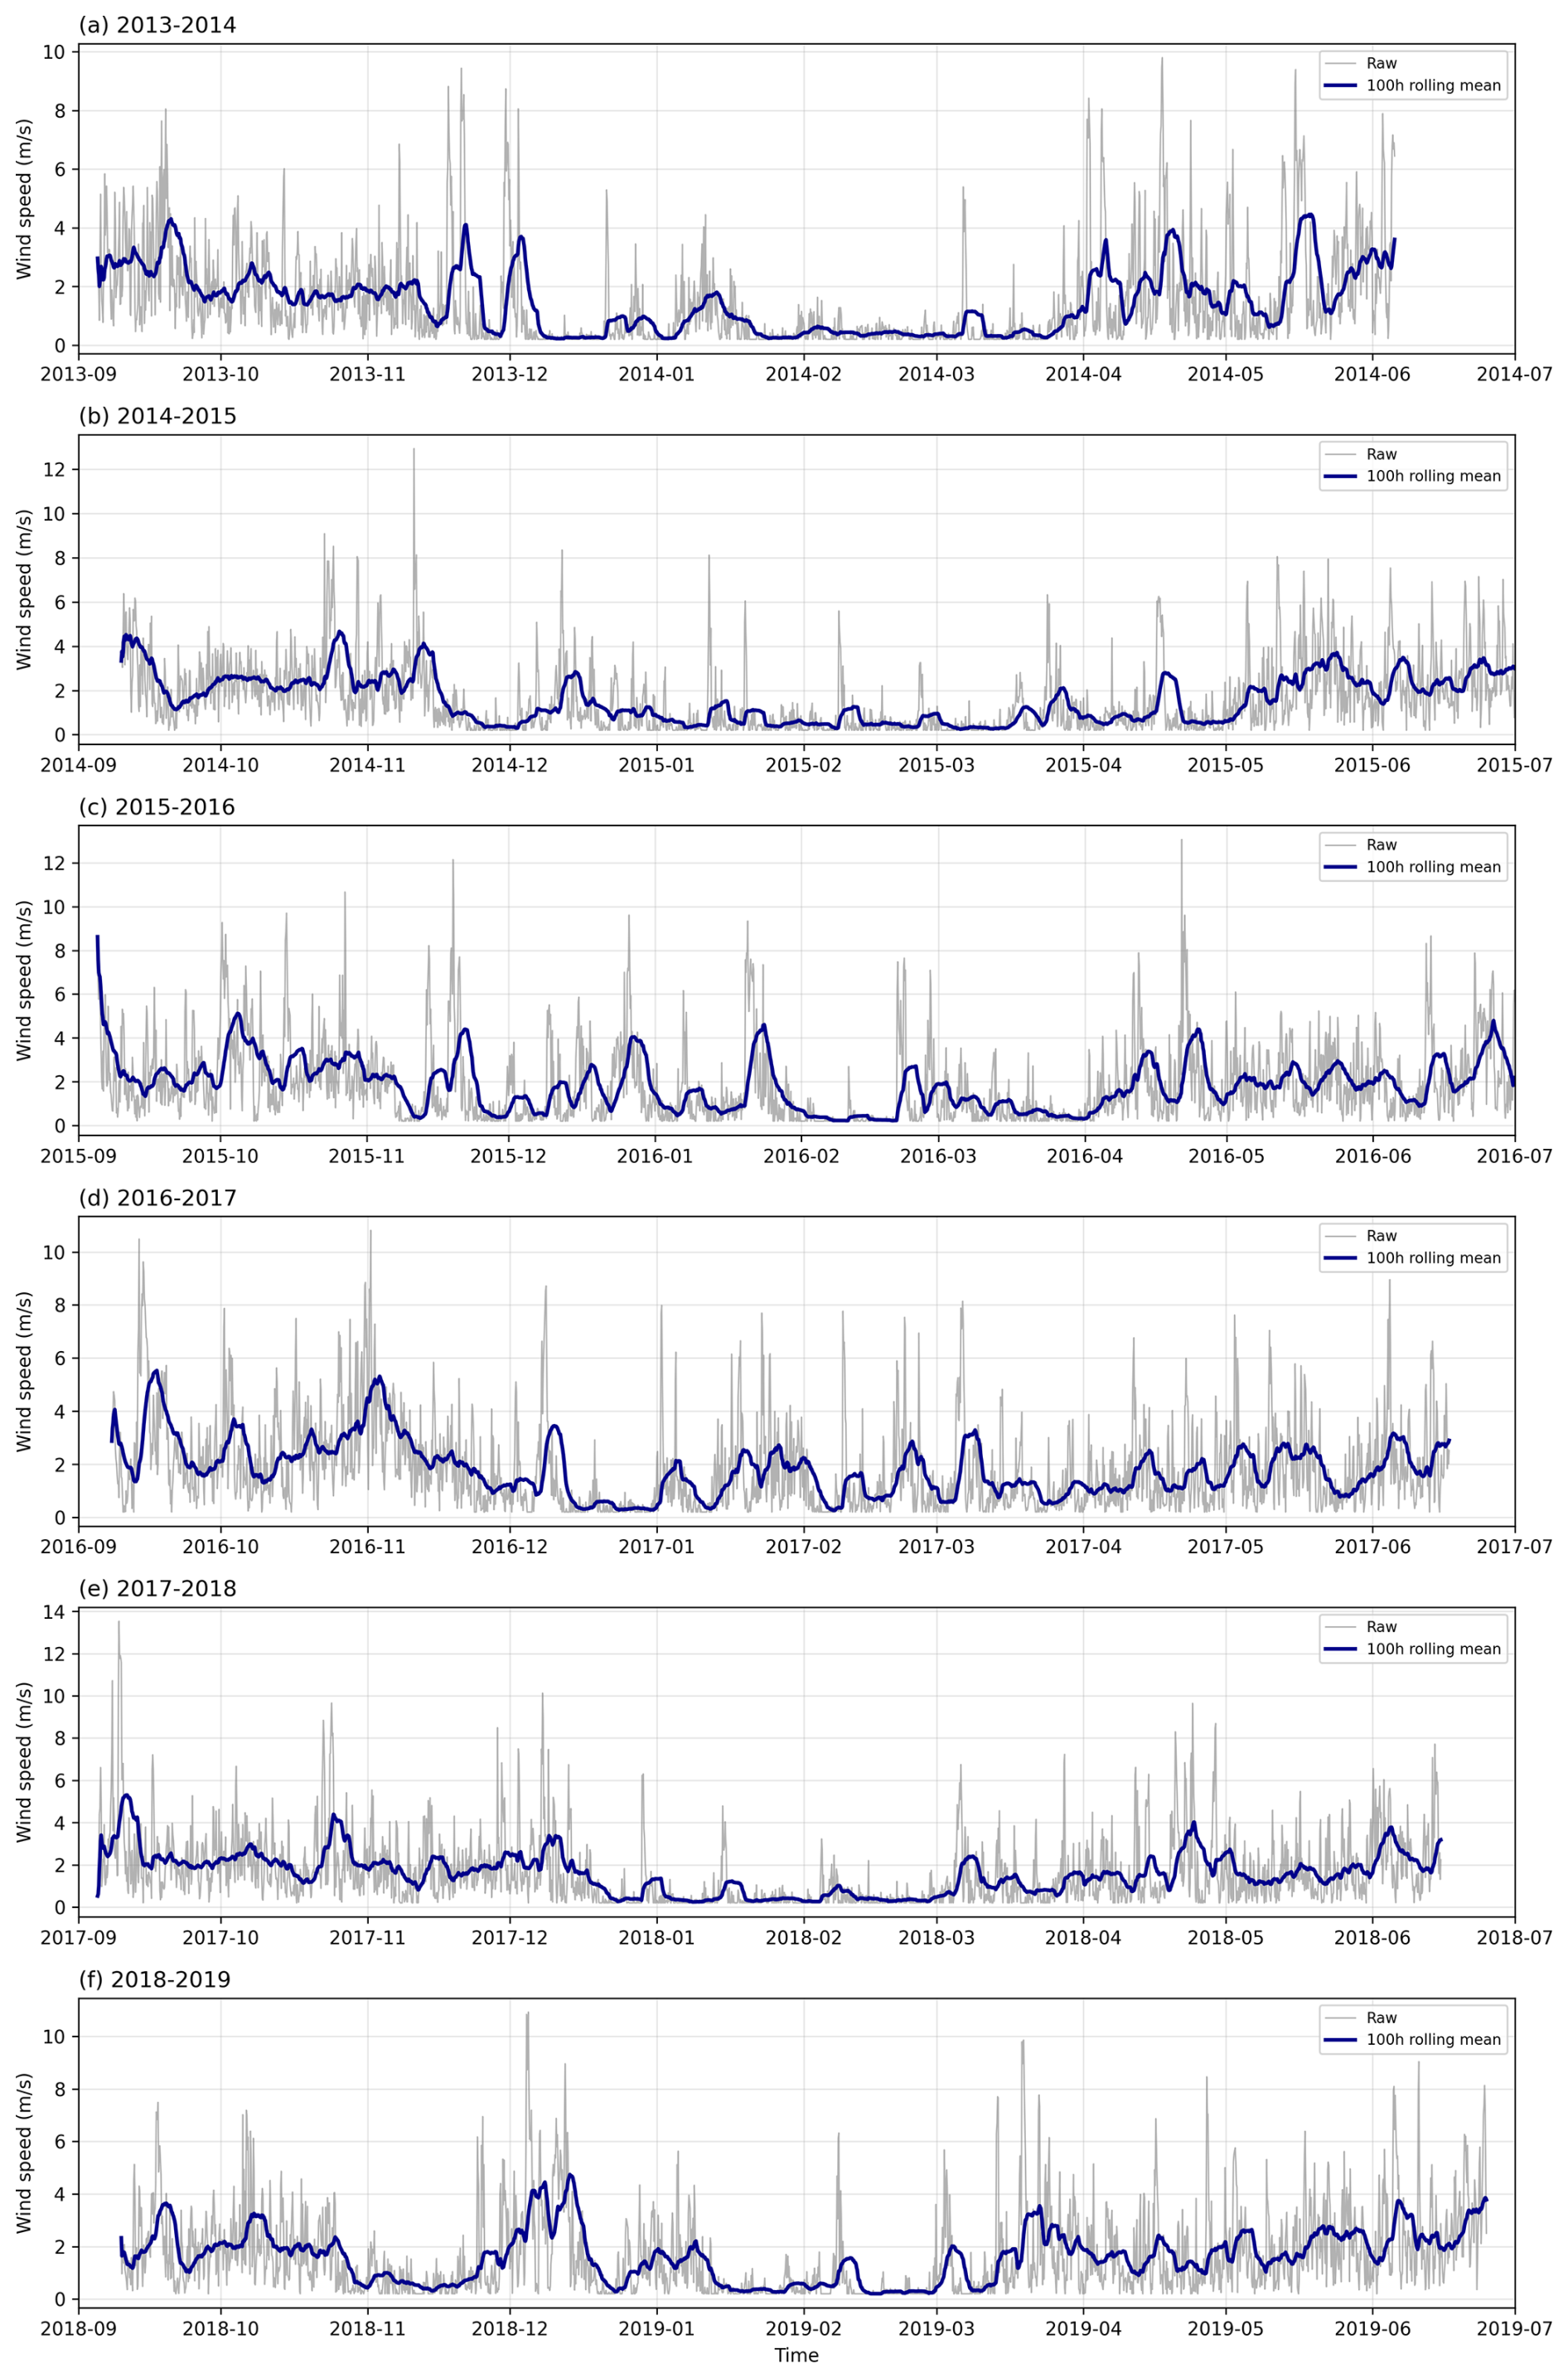
Figure 14The time series of wind speed from forcing data required by SNOWPACK for six winter years from 2013–2014 till 2018–2019 in Bylot herb tundra. The label “100 h rolling mean” refers to a 100 h rolling average and the label “Raw” refers to hourly forcing data.
The drifting-snow compaction process is transient, producing abrupt density increases within short timescales, comparing Fig. 14 for time series of wind speed from the forcing data (Domine et al., 2021) with the time series of snow density from the SNOWPACK-OpenFOAM simulations shown in Fig. 13. In contrast, convective vapour transport is gradual and of much lower magnitude. Examination of the time series of snow density (Fig. 13) and averaged convection velocity (Fig. 15) shows that convection plays a minor role compared with wind compaction. Only during prolonged cold periods with calm intervals between strong wind events – and when the averaged convective velocity exceeds about 0.015 mm s−1 – small-scale convective patterns appear within the snow column.
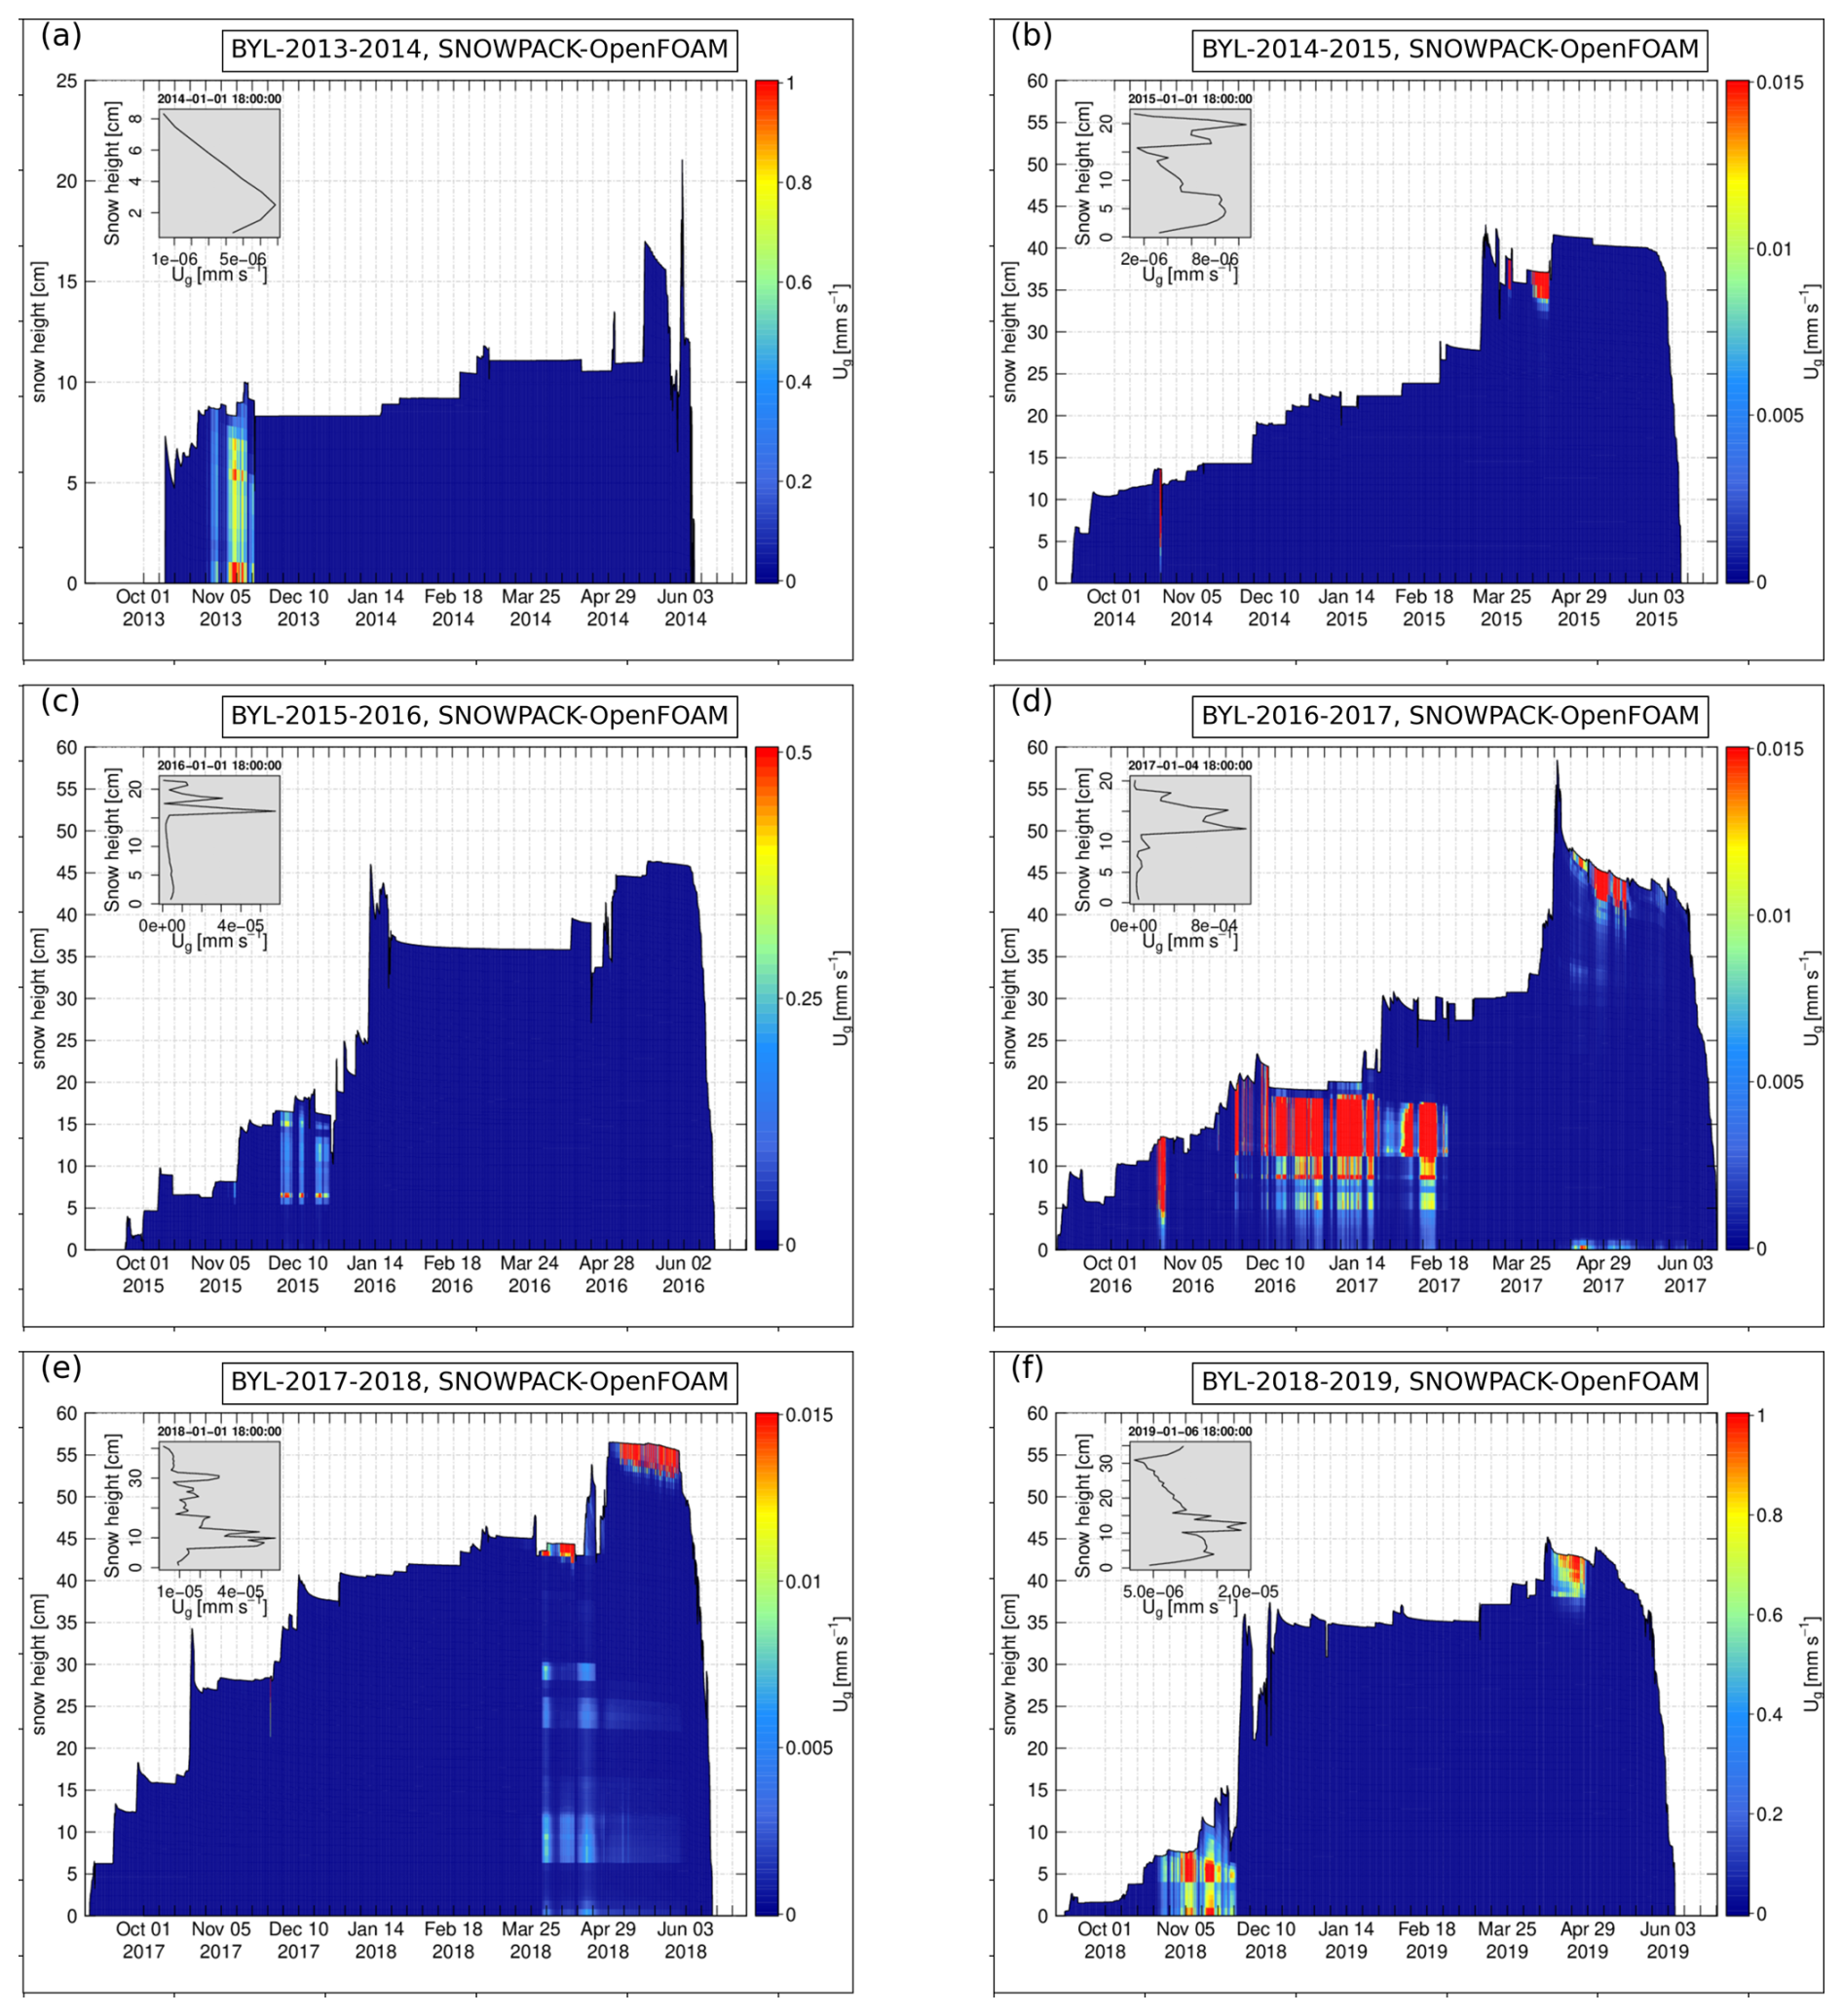
Figure 15The time series of averaged convection flow velocity for six winter years from 2013–2014 till 2018–2019 in Bylot herb tundra, SNOWPACK-OpenFOAM simulations with convection and drifting-snow compaction model active in SNOWPACK. The insets show vertical profiles on early January for all six years.
By comparing the time series of snow density profiles with those of the averaged convective-flow velocity (Fig. 13 compared to Fig. 15), we find that convection generally occurs early in the season when the snow density is still low, before the onset of strong wind events. Once wind events stronger than about 7 m s−1 occur, the newly formed high-density slabs suppress convection. Nevertheless, individual convection episodes can be identified and visualized through the two-dimensional SNOWPACK-OpenFOAM fields of flow velocity, air temperature, snow density, and cumulative snow density change due to vapor transport for specific winter seasons and they are analyzed as follows:
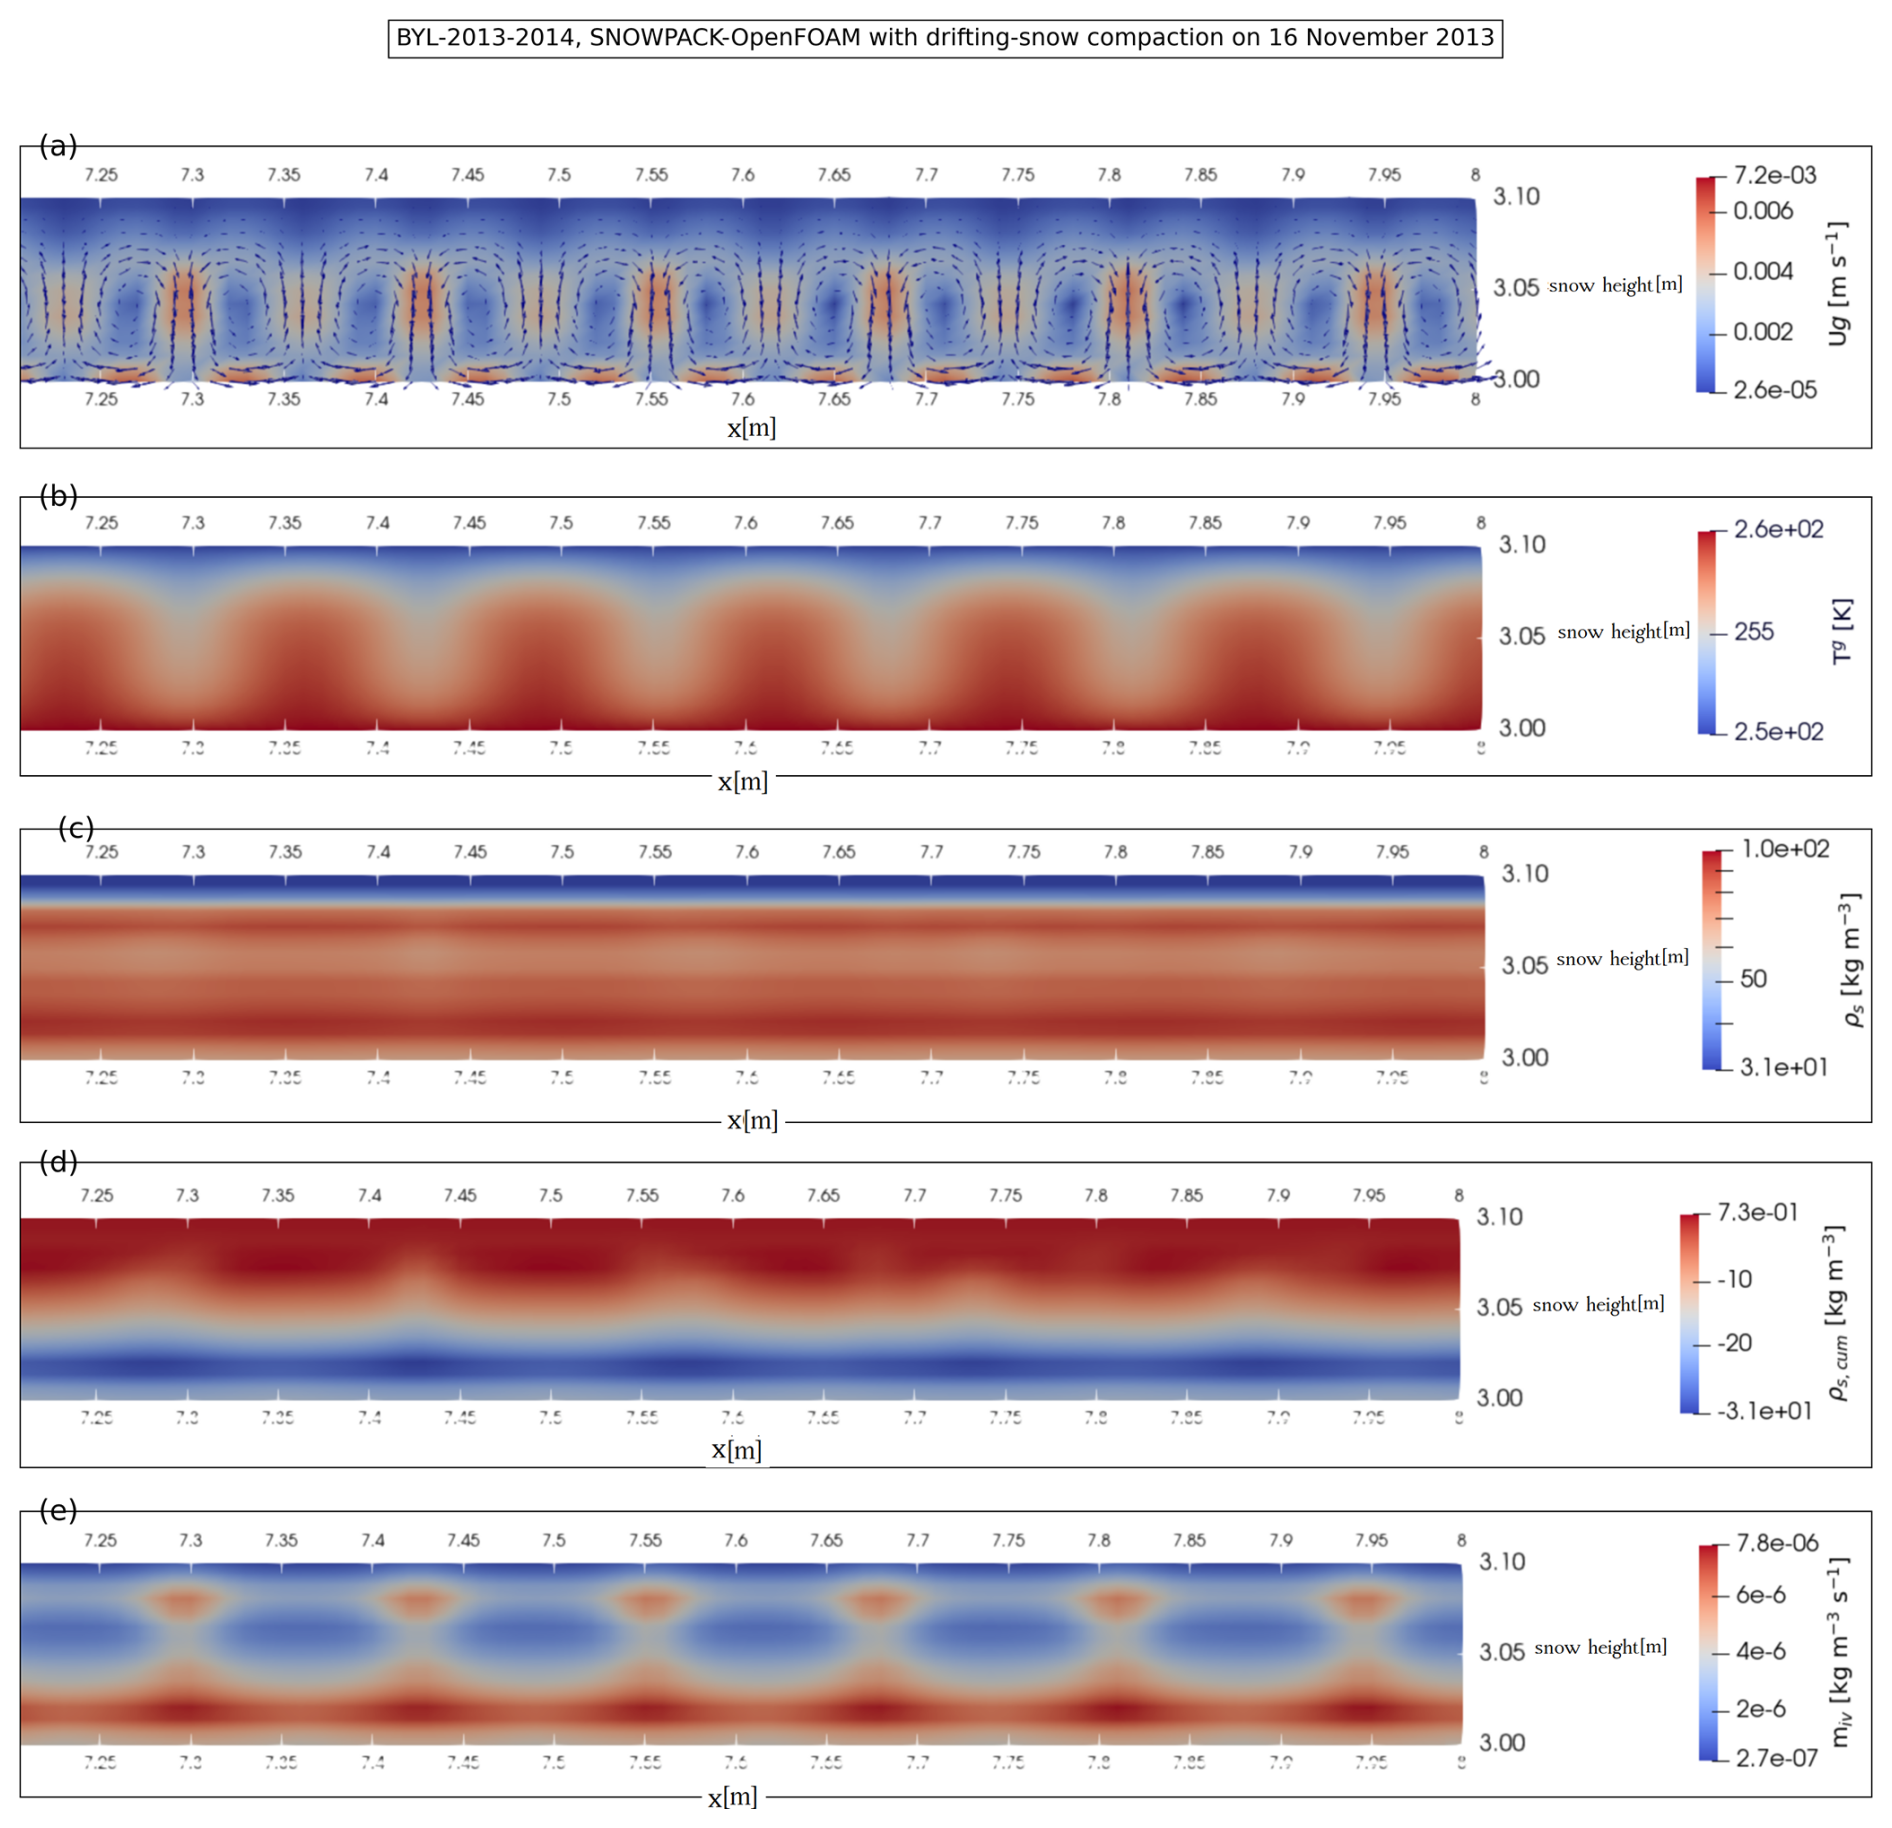
Figure 16Simulated two-dimensional plots on 16 November 2013 from SNOWPACK-OpenFOAM simulations with convection and with drifting-snow compaction model active in SNOWPACK for (a) the convective flow velocity vector scaled by a factor of 3, (b) the gas phase temperature, (c) the snow density, (d) the cumulative snow density change due to water vapor transport, and (e) the phase change rate from ice to vapor.
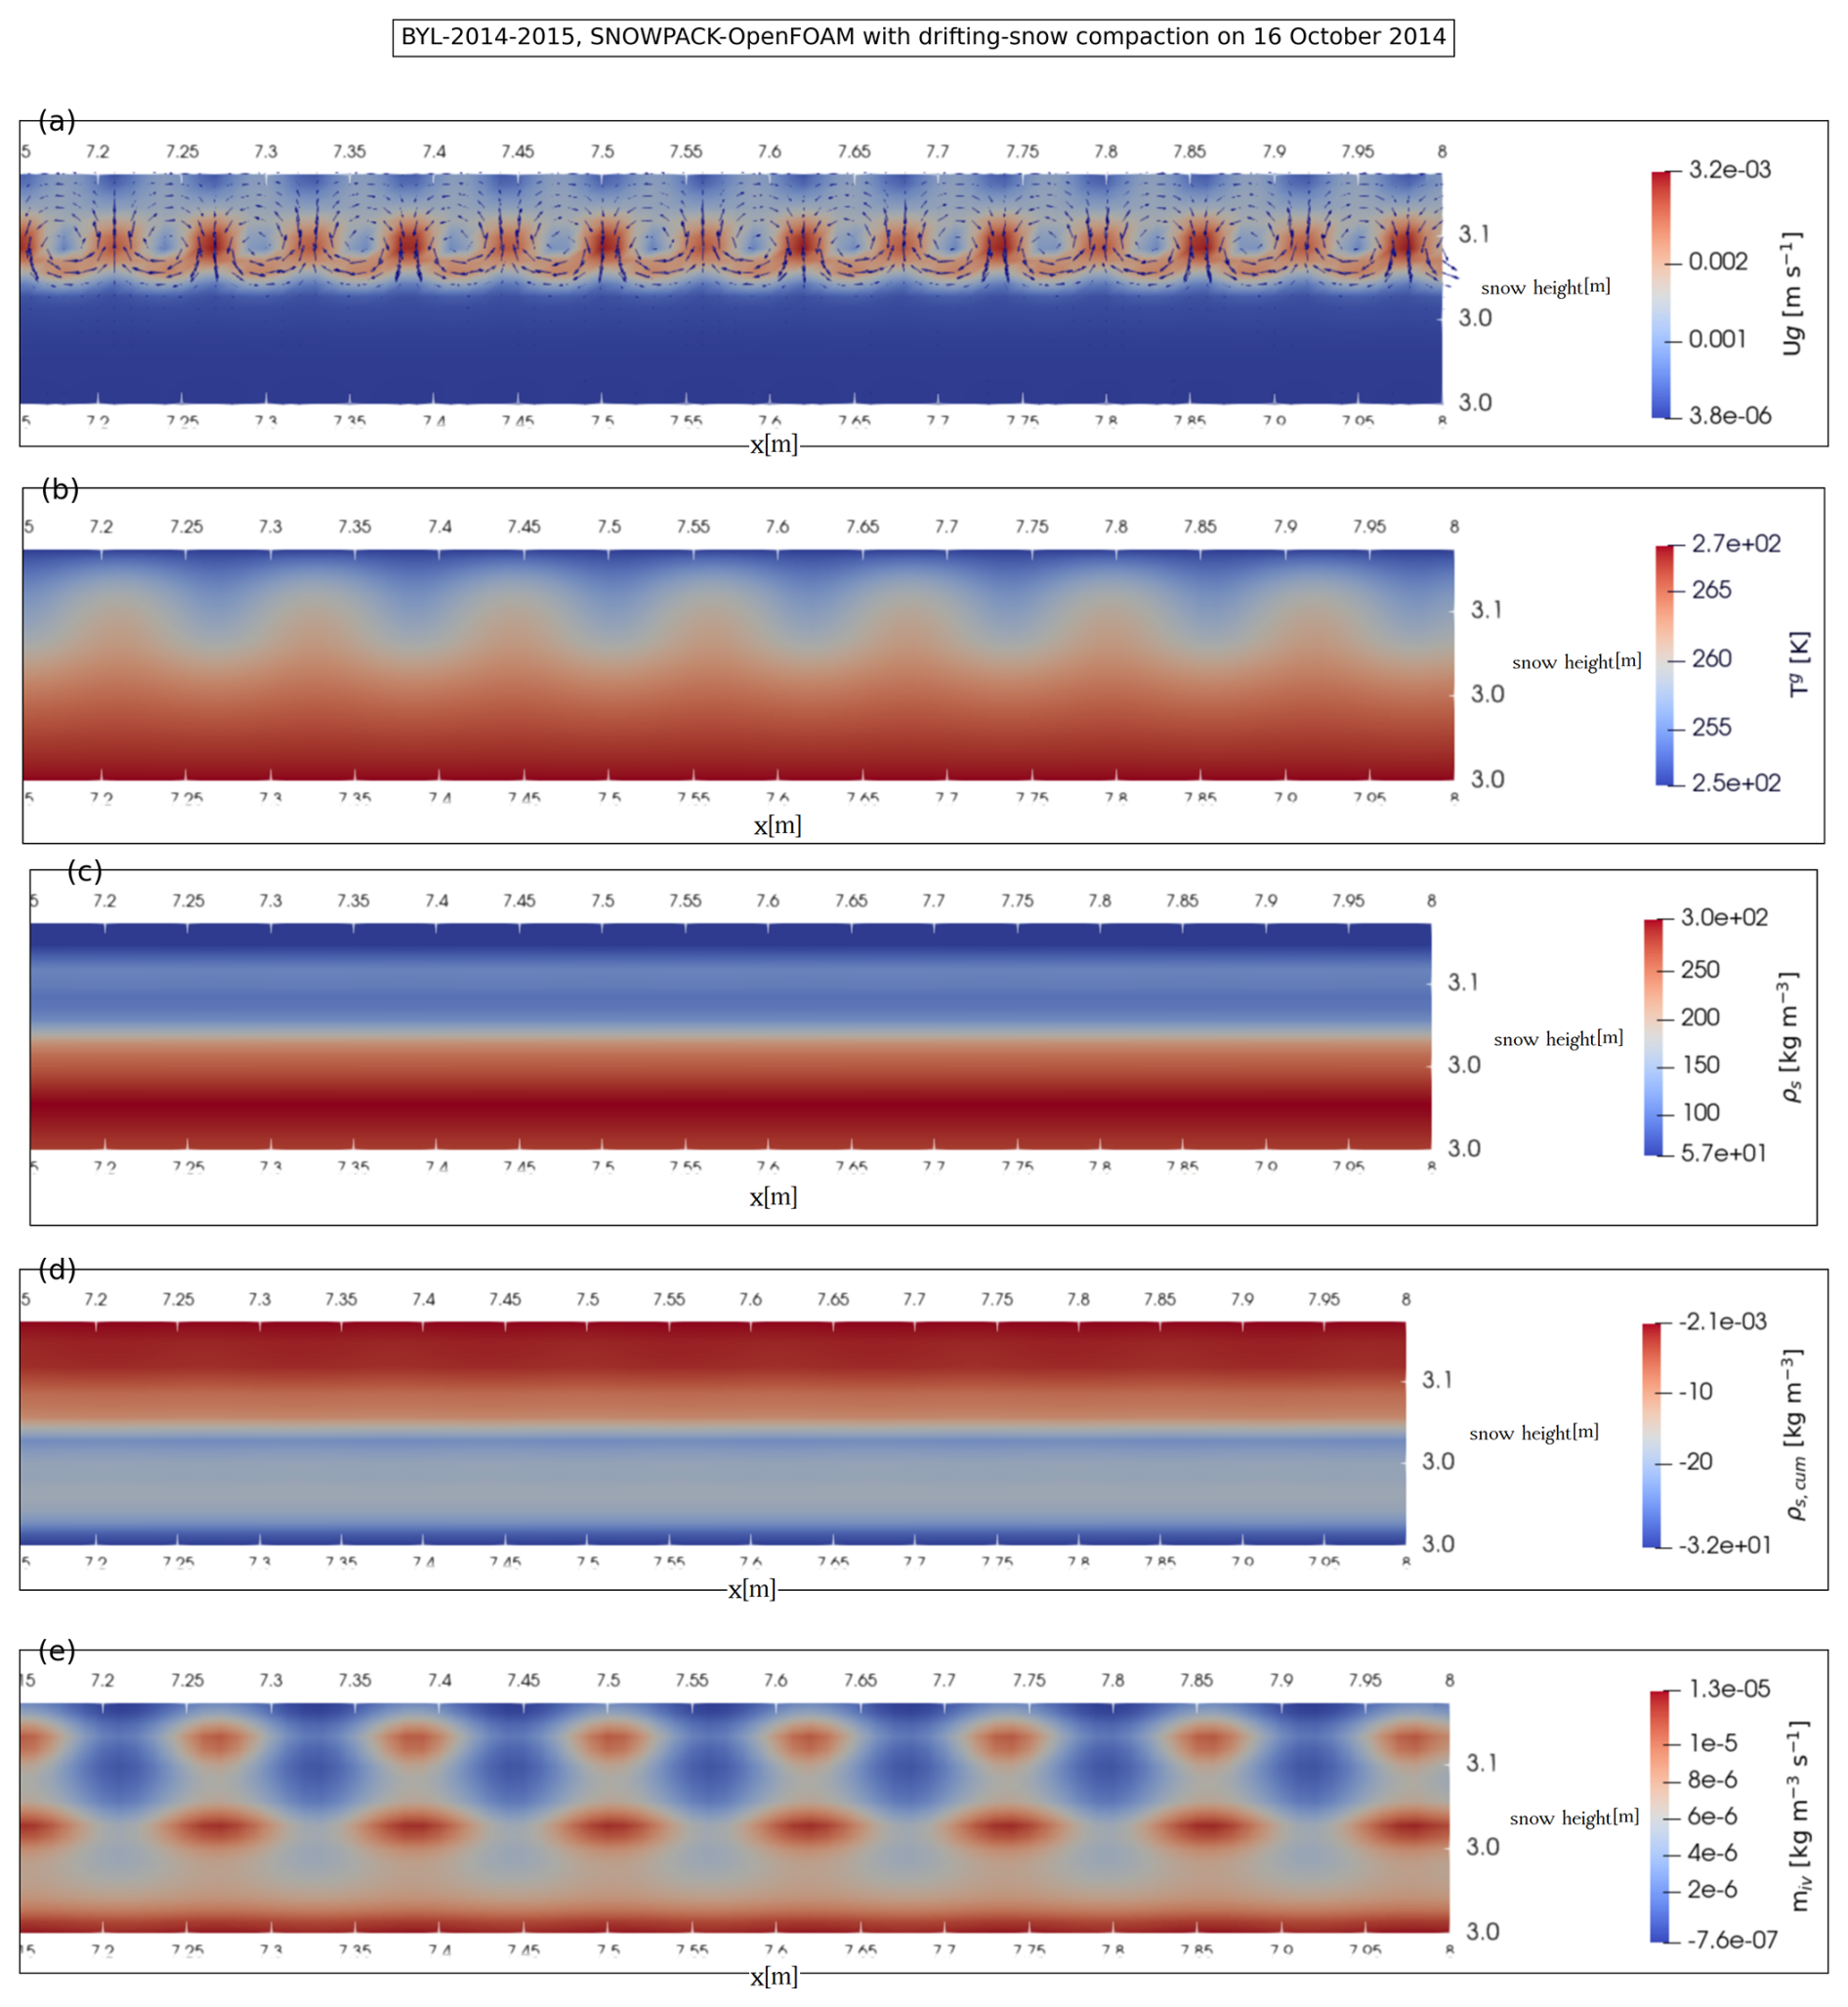
Figure 17Simulated two-dimensional plots on 16 October 2014 from SNOWPACK-OpenFOAM simulations with convection and with drifting-snow compaction model active in SNOWPACK for (a) the convective flow velocity vector scaled by a factor of 5, (b) the gas phase temperature, (c) the snow density, (d) the cumulative snow density change due to water vapor transport, and (e) the phase change rate from ice to vapor.
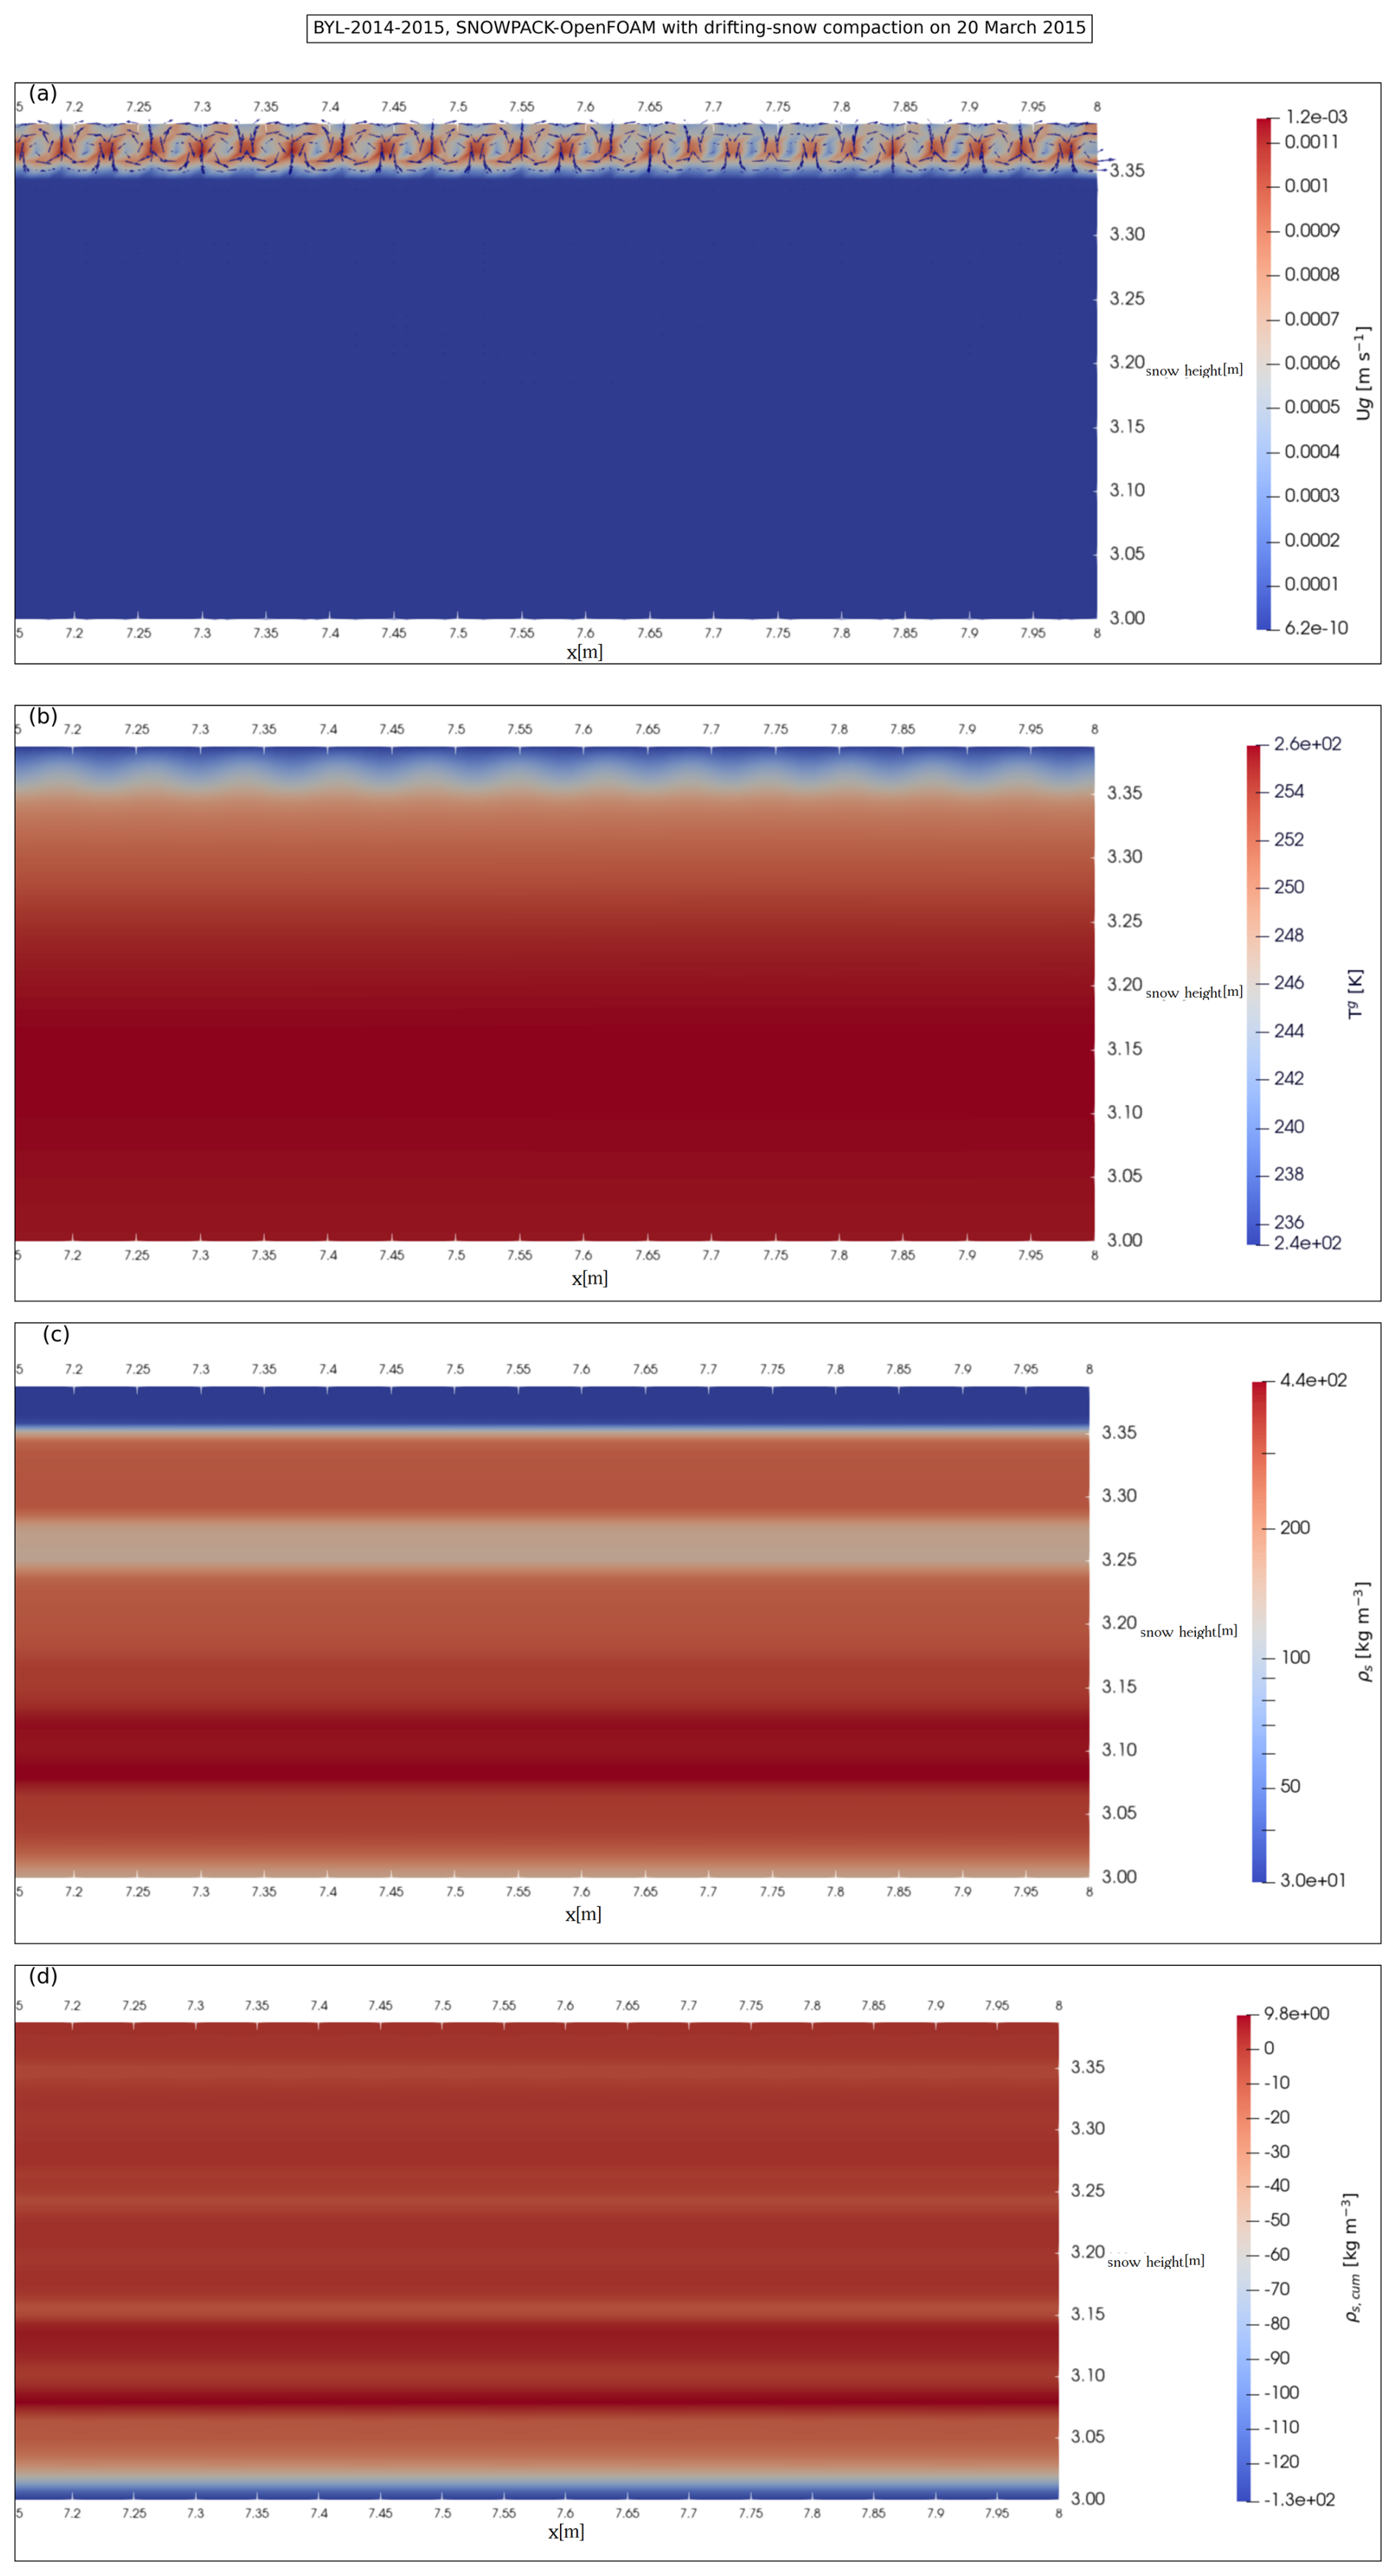
Figure 18Simulated two-dimensional plots on 20 March 2015 from SNOWPACK-OpenFOAM simulations with convection and with drifting-snow compaction model active in SNOWPACK for (a) the convective flow velocity vector scaled by a factor of 15, (b) the gas phase temperature, (c) the snow density, (d) the cumulative snow density change due to water vapor transport.
- i.
2013–2014. A distinct convection cell developed throughout the snow column on 16 November 2013 (as shown for snow density in Fig. 13a and for averaged convective flow velocity in Fig. 15a), shortly before a wind event suppressed further convection. The horizontal cell scale was approximately equal to the snow height (10 cm) as shown Fig. 16a for the two-dimensional SNOWPACK-OpenFOAM fields of flow velocity.
- ii.
2014–2015. Two short convection episodes were found, one around 16 October 2014 and another ending 20 March 2015 (comparing averaged convective flow velocity in Fig. 15b with the corresponding snow density in Fig. 13b). The first affected mainly the upper half of the snowpack and showed lateral variations in flow velocity and air temperature (Fig. 17a and b respectively) but little imprint on snow density. The second convection event formed gear-shaped cells (2.5 cm radius) within a low-density surface layer (around 50 kg m−1) as shown in Fig. 18a.
- iii.
2015–2016. A single convection event was observed between 2 and 25 December 2015. As shown in Fig. 19, convection cells formed above a 5 cm-thick high-density layer (likely a wind slab) and extended to the surface. Lateral gradients in air temperature and vapour-induced density change were visible, although the event ended before leaving a strong structural imprint.
- iv.
2016–2017. Three convection episodes occurred – starting 23 October, a persistent one from 23 November 2016 to 21 February 2017, and a third around 28 April 2017 as shown in Fig. 15d. The second and third events (Fig. 20 and figure 21 respectively) were strong enough to leave a clear signature in snow density and cumulative vapour-transport-induced densification, showing that even with drifting-snow compaction active, convection can still generate noticeable lateral and vertical variability in snow density, temperature, and related properties such as effective conductivity.
- v.
2018–2019. Two pronounced convection events were detected, centred on 12 November 2018 and 21 April 2019 (comparing averaged convective flow velocity in Fig. 15f with the corresponding snow density in Fig. 13f). The first produced well-defined convection cells near the base of the snowpack (shown in Fig. 22), while the late-season event (shown in Fig. 23), after roughly five months of quiescence, generated small gear-like cells (around 2.5 cm radius) within a 5 cm-thick low-density surface layer.
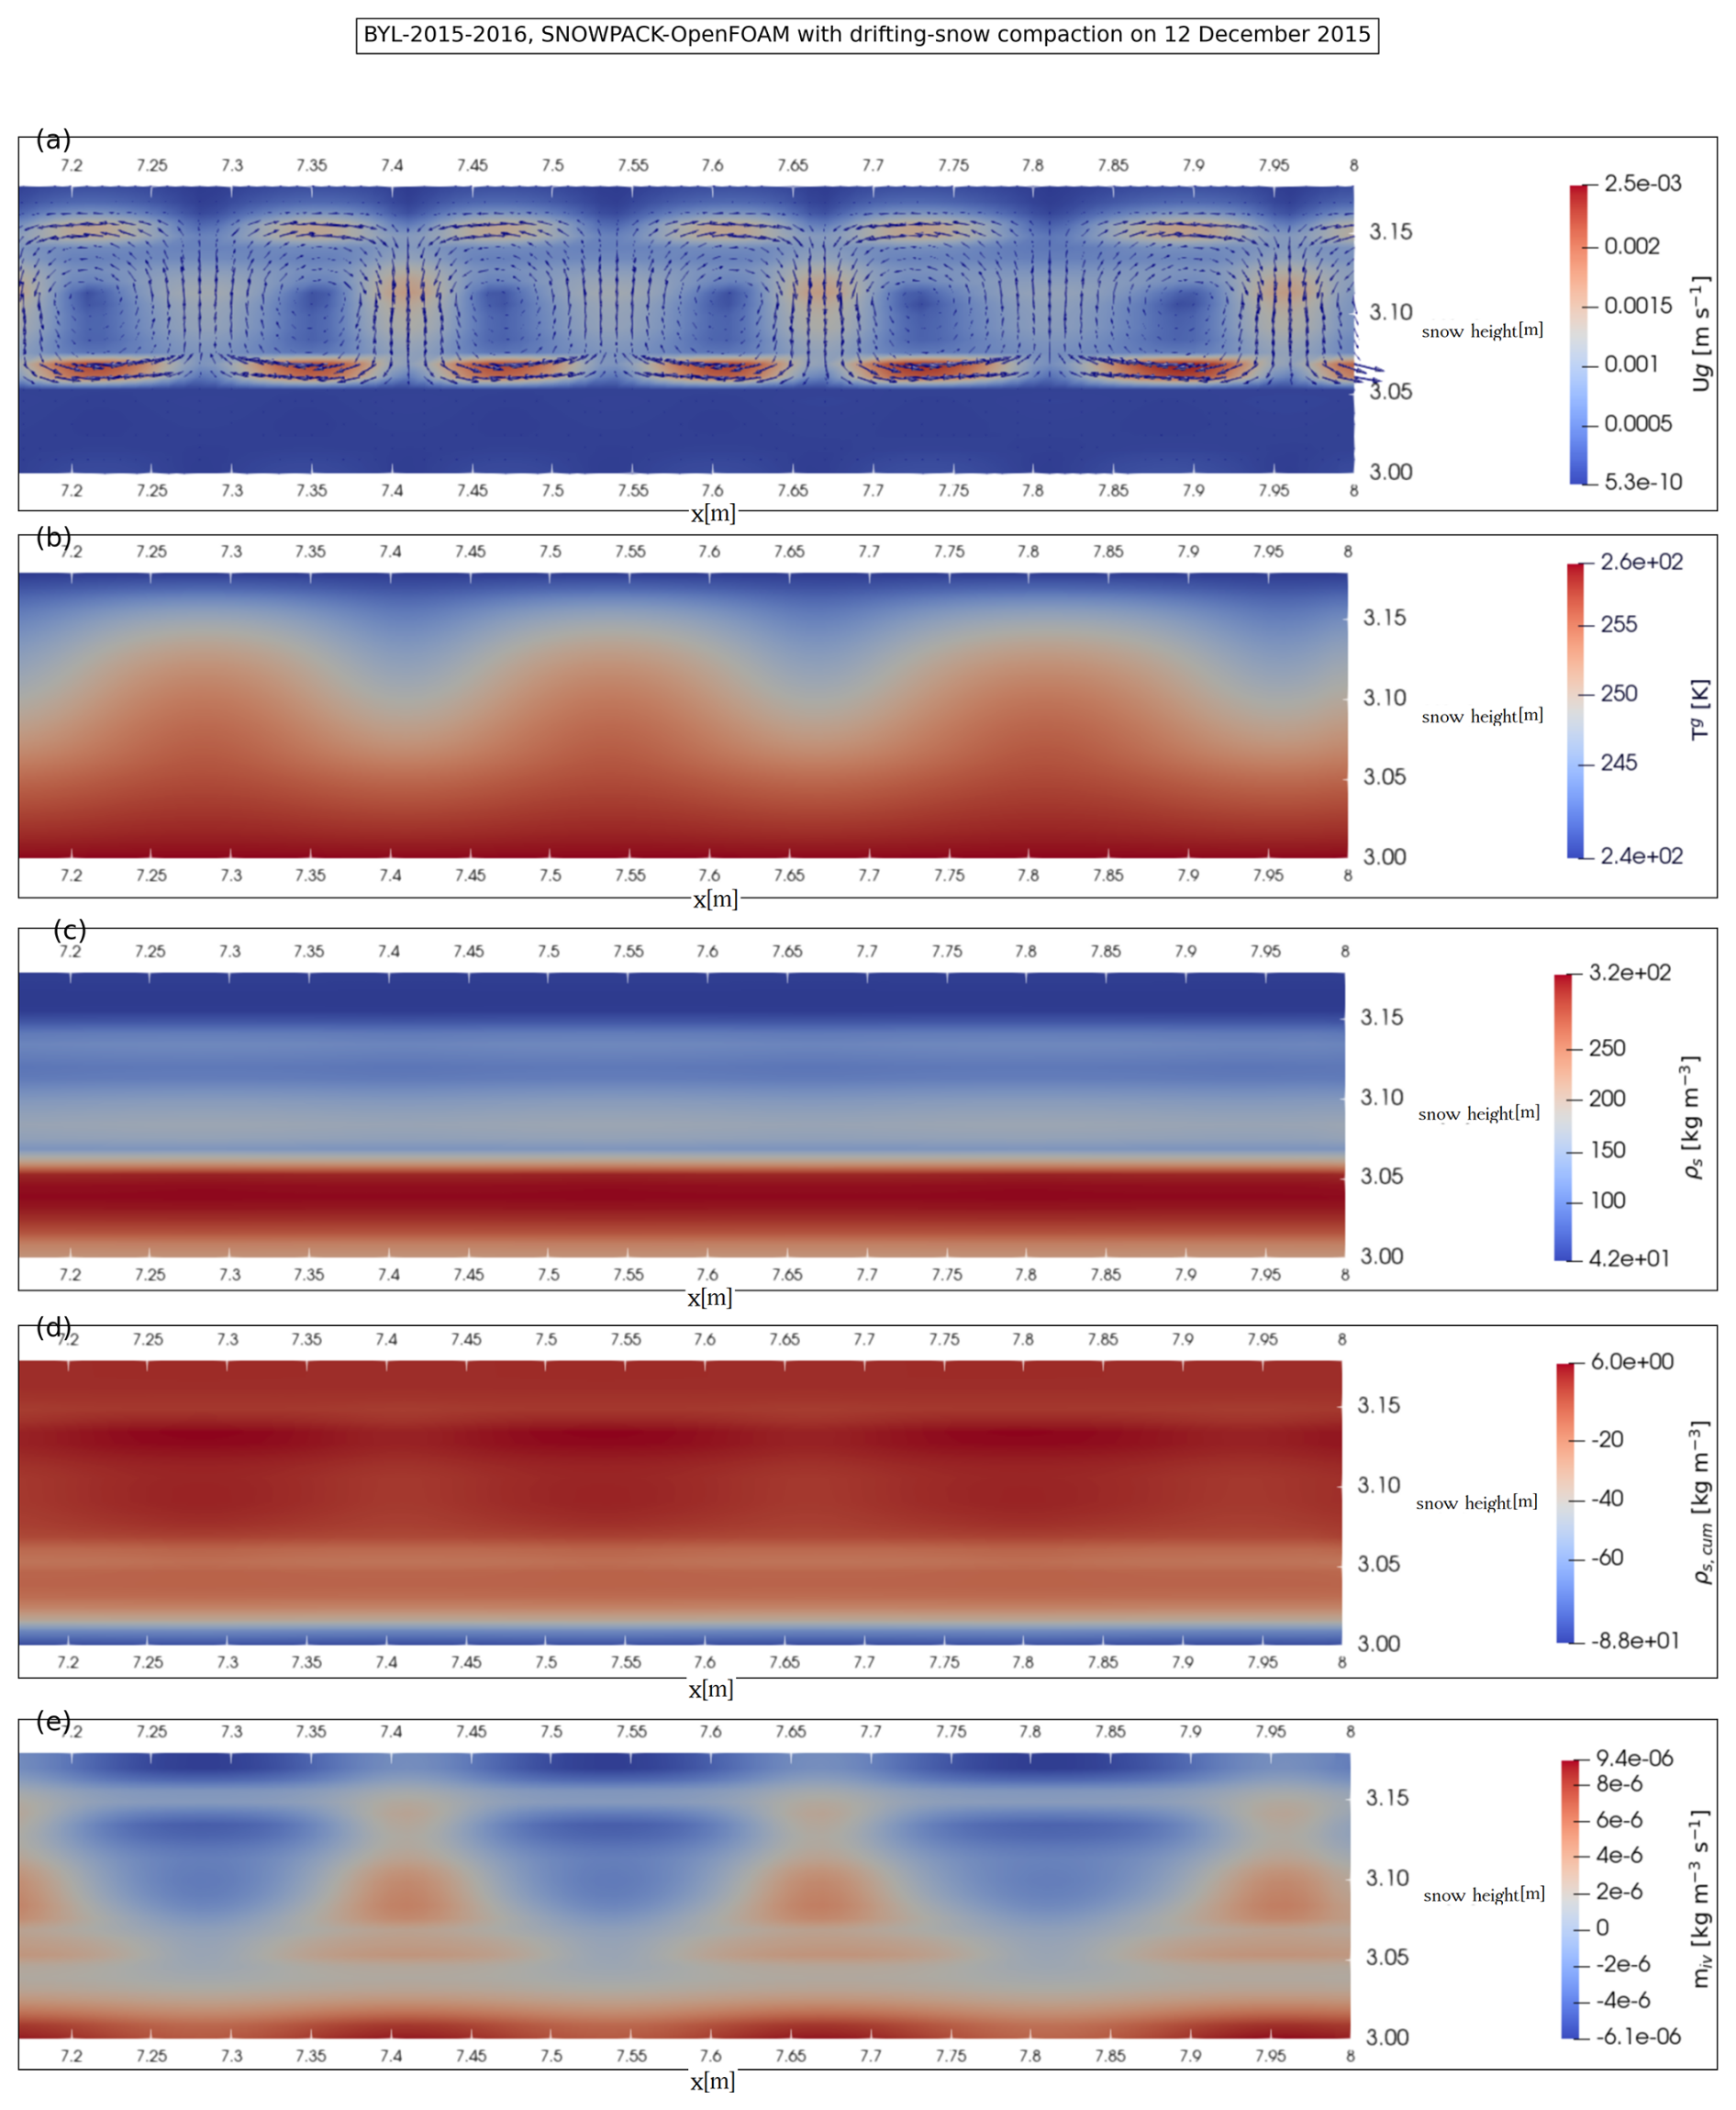
Figure 19Simulated two-dimensional plots on 12 December 2015 from SNOWPACK-OpenFOAM simulations with convection and with drifting-snow compaction model active in SNOWPACK for (a) the convective flow velocity vector scaled by a factor of 10, (b) the gas phase temperature, (c) the snow density, (d) the cumulative snow density change due to water vapor transport.
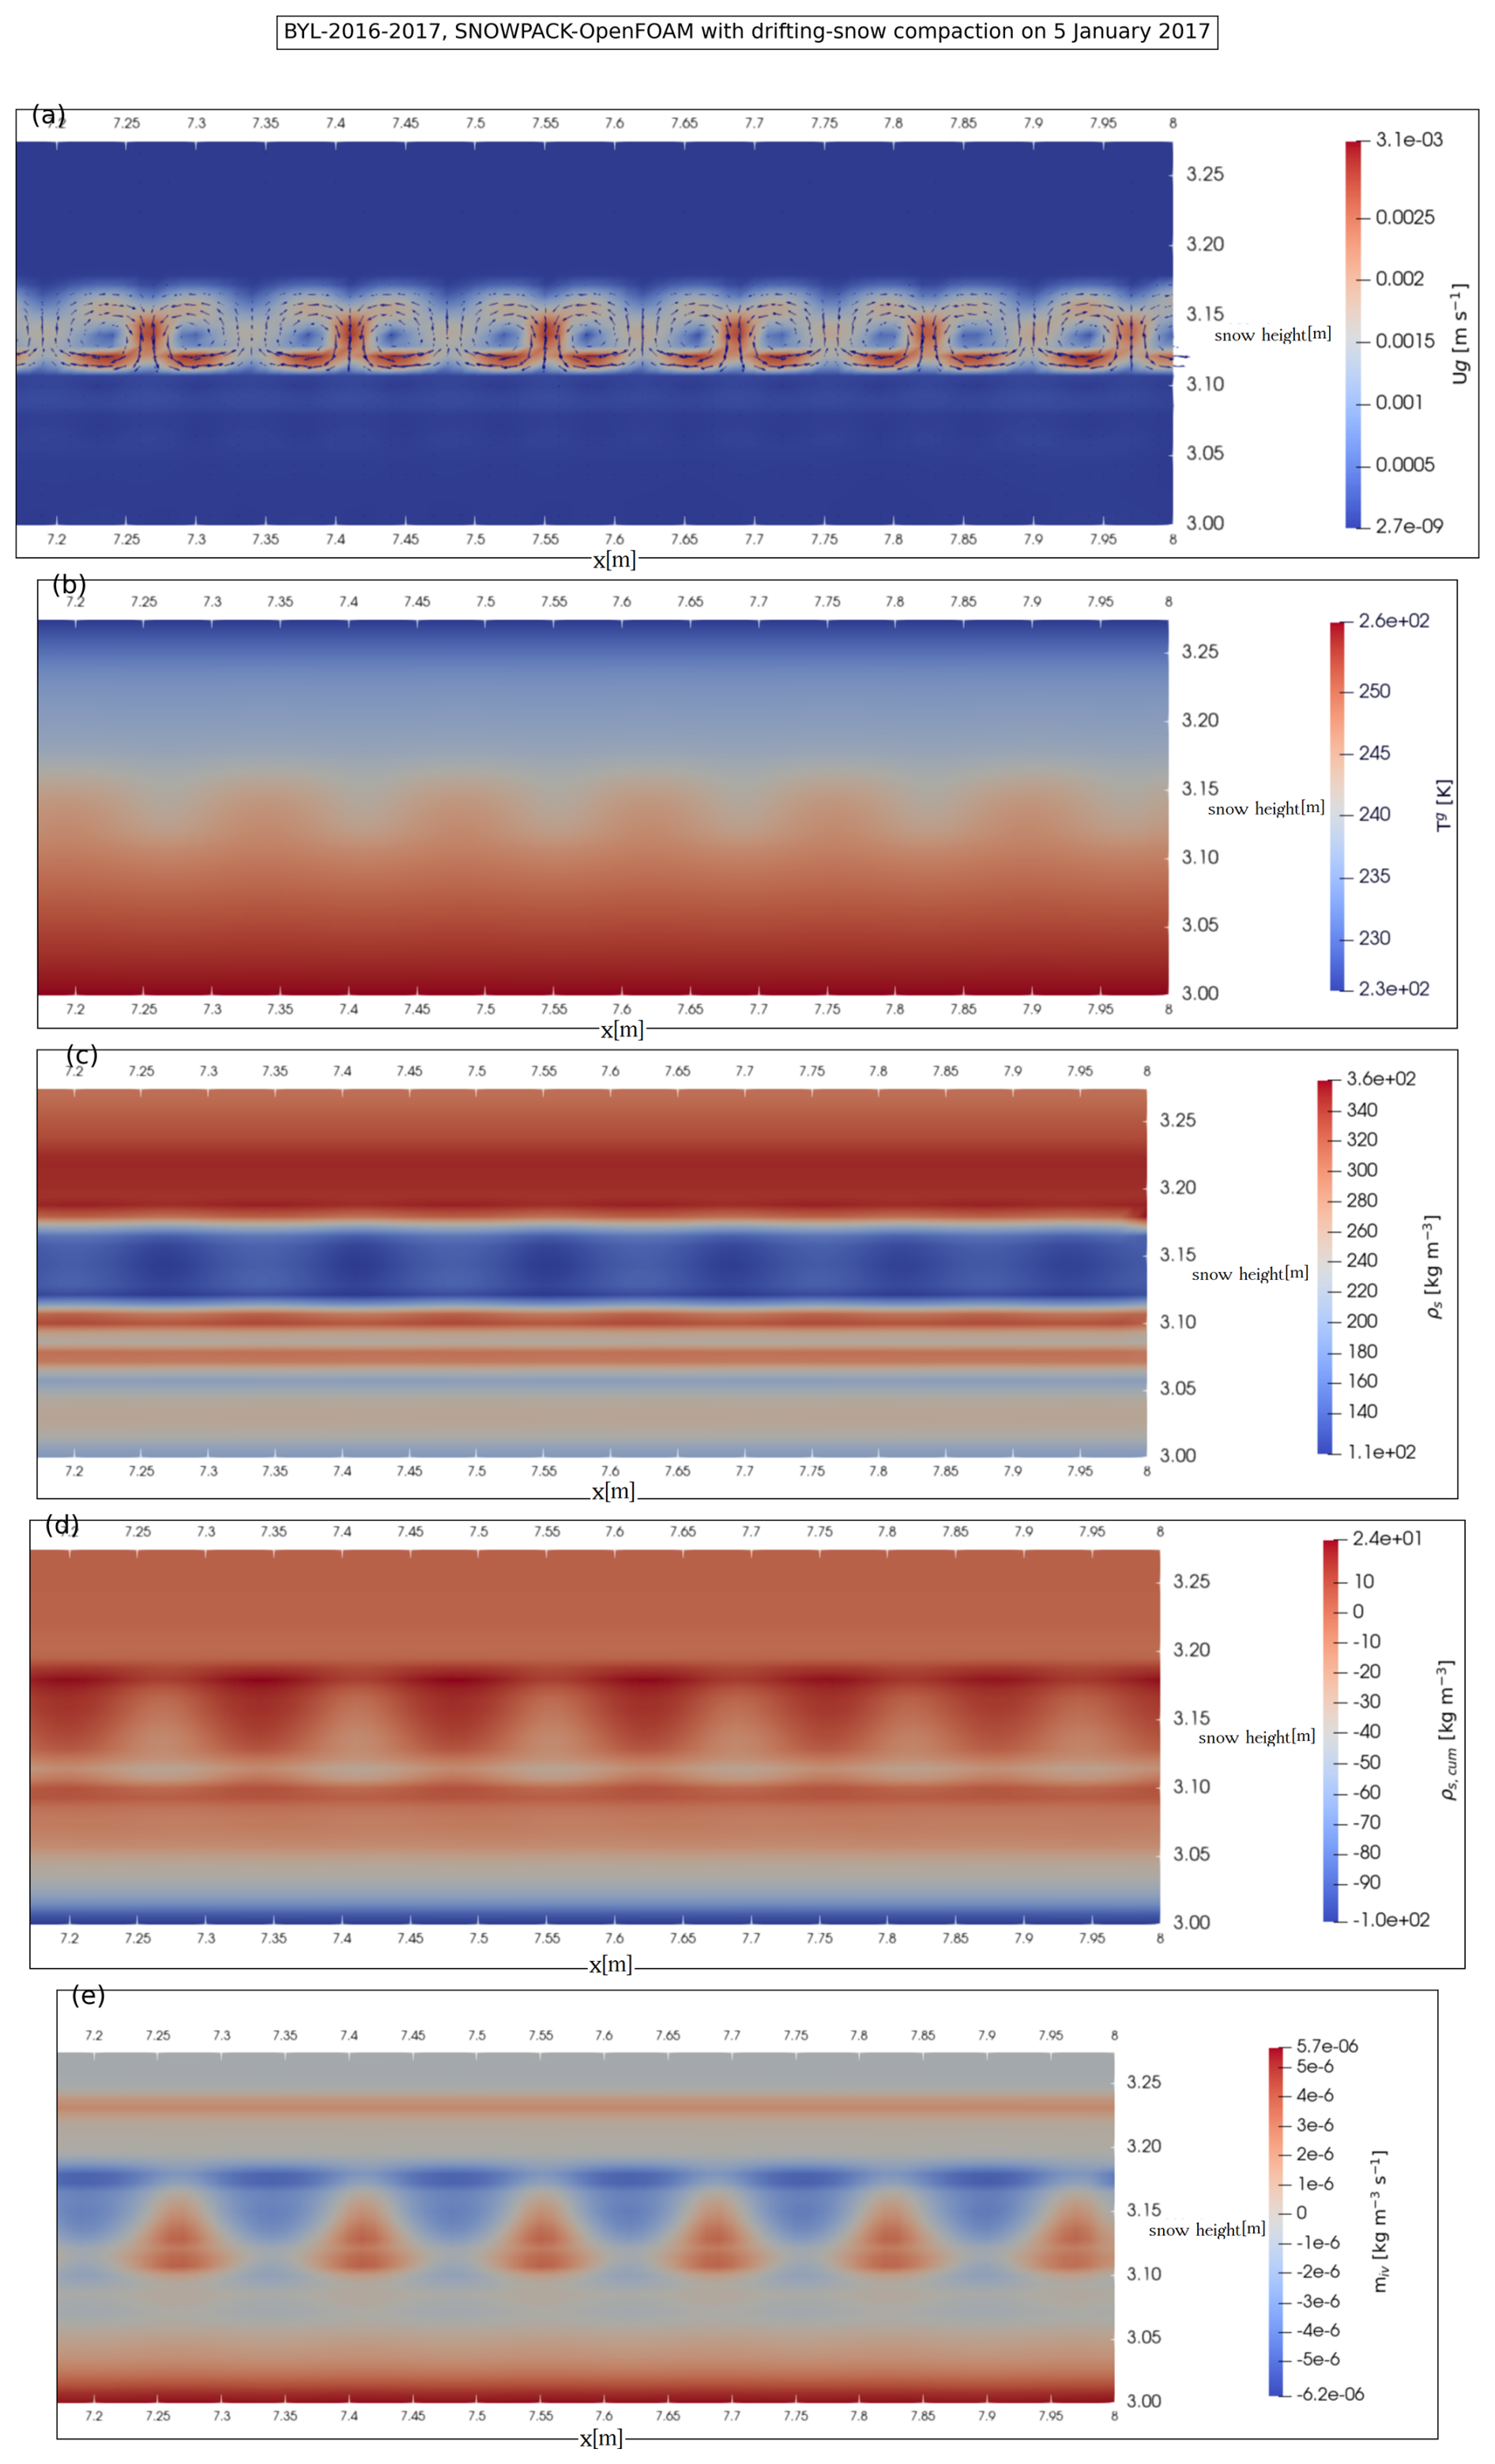
Figure 20Simulated two-dimensional plots on 5 January 2017 from SNOWPACK-OpenFOAM simulations with convection and with drifting-snow compaction model active in SNOWPACK for (a) the convective flow velocity vector scaled by a factor of 5, (b) the gas phase temperature, (c) the snow density, (d) the cumulative snow density change due to water vapor transport.
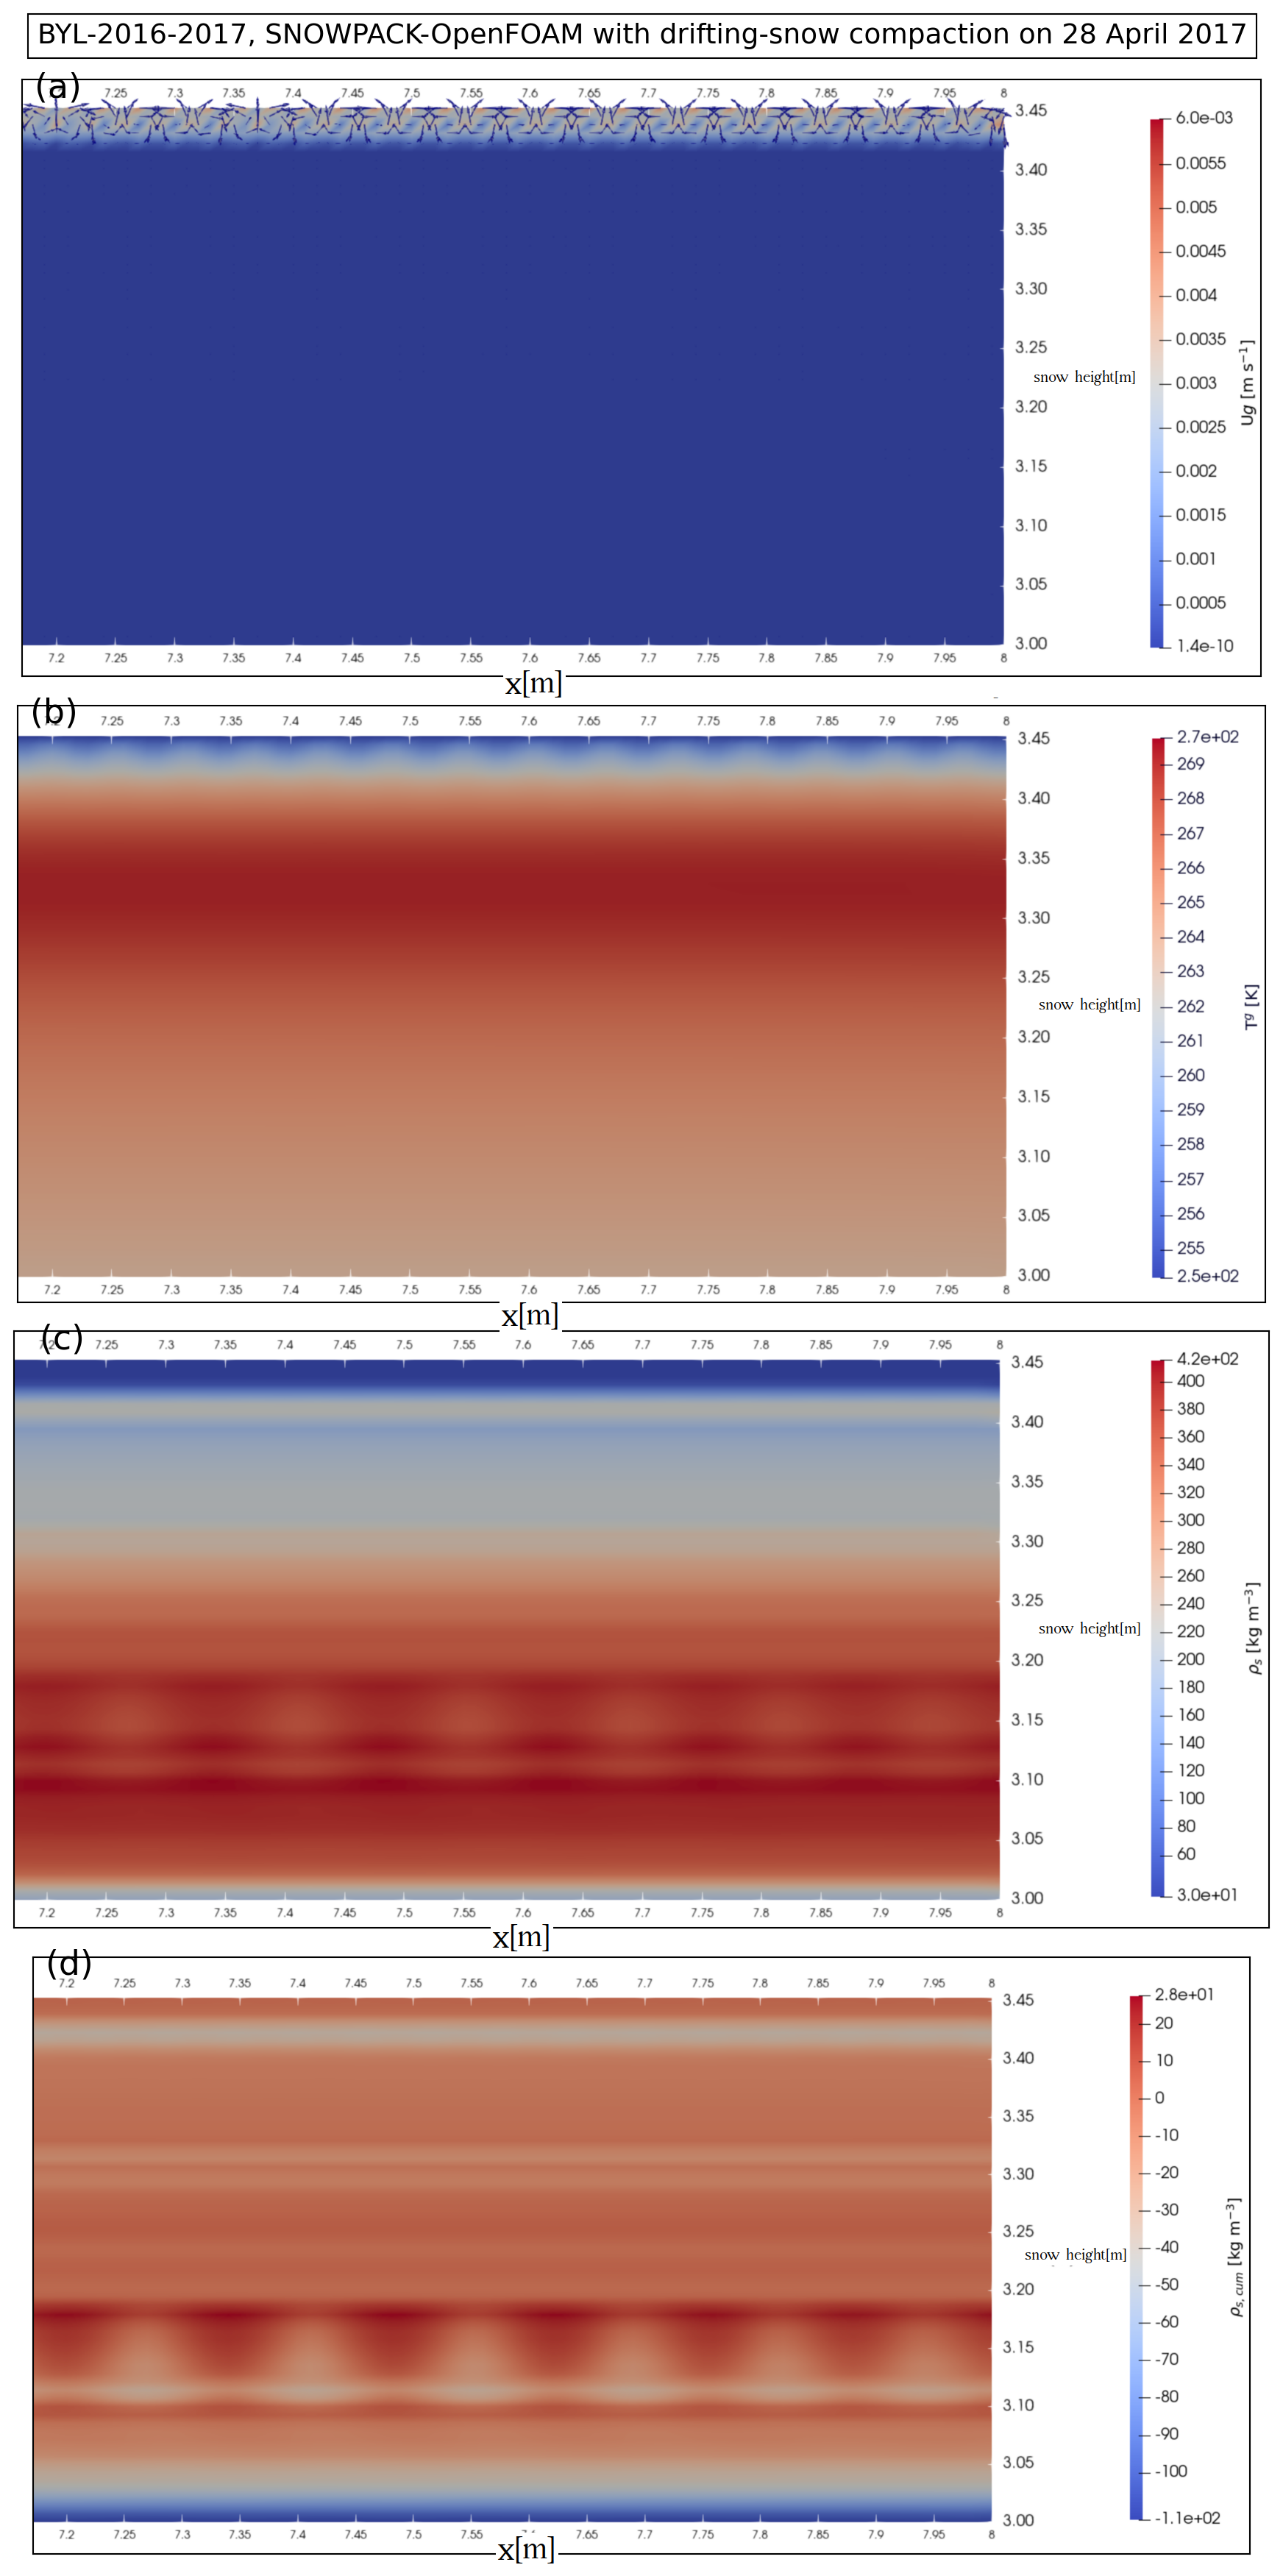
Figure 21Simulated two-dimensional plots on 28 April 2017 from SNOWPACK-OpenFOAM simulations with convection and with drifting-snow compaction model active in SNOWPACK for (a) the convective flow velocity vector scaled by a factor of 5, (b) the gas phase temperature, (c) the snow density, (d) the cumulative snow density change due to water vapor transport.
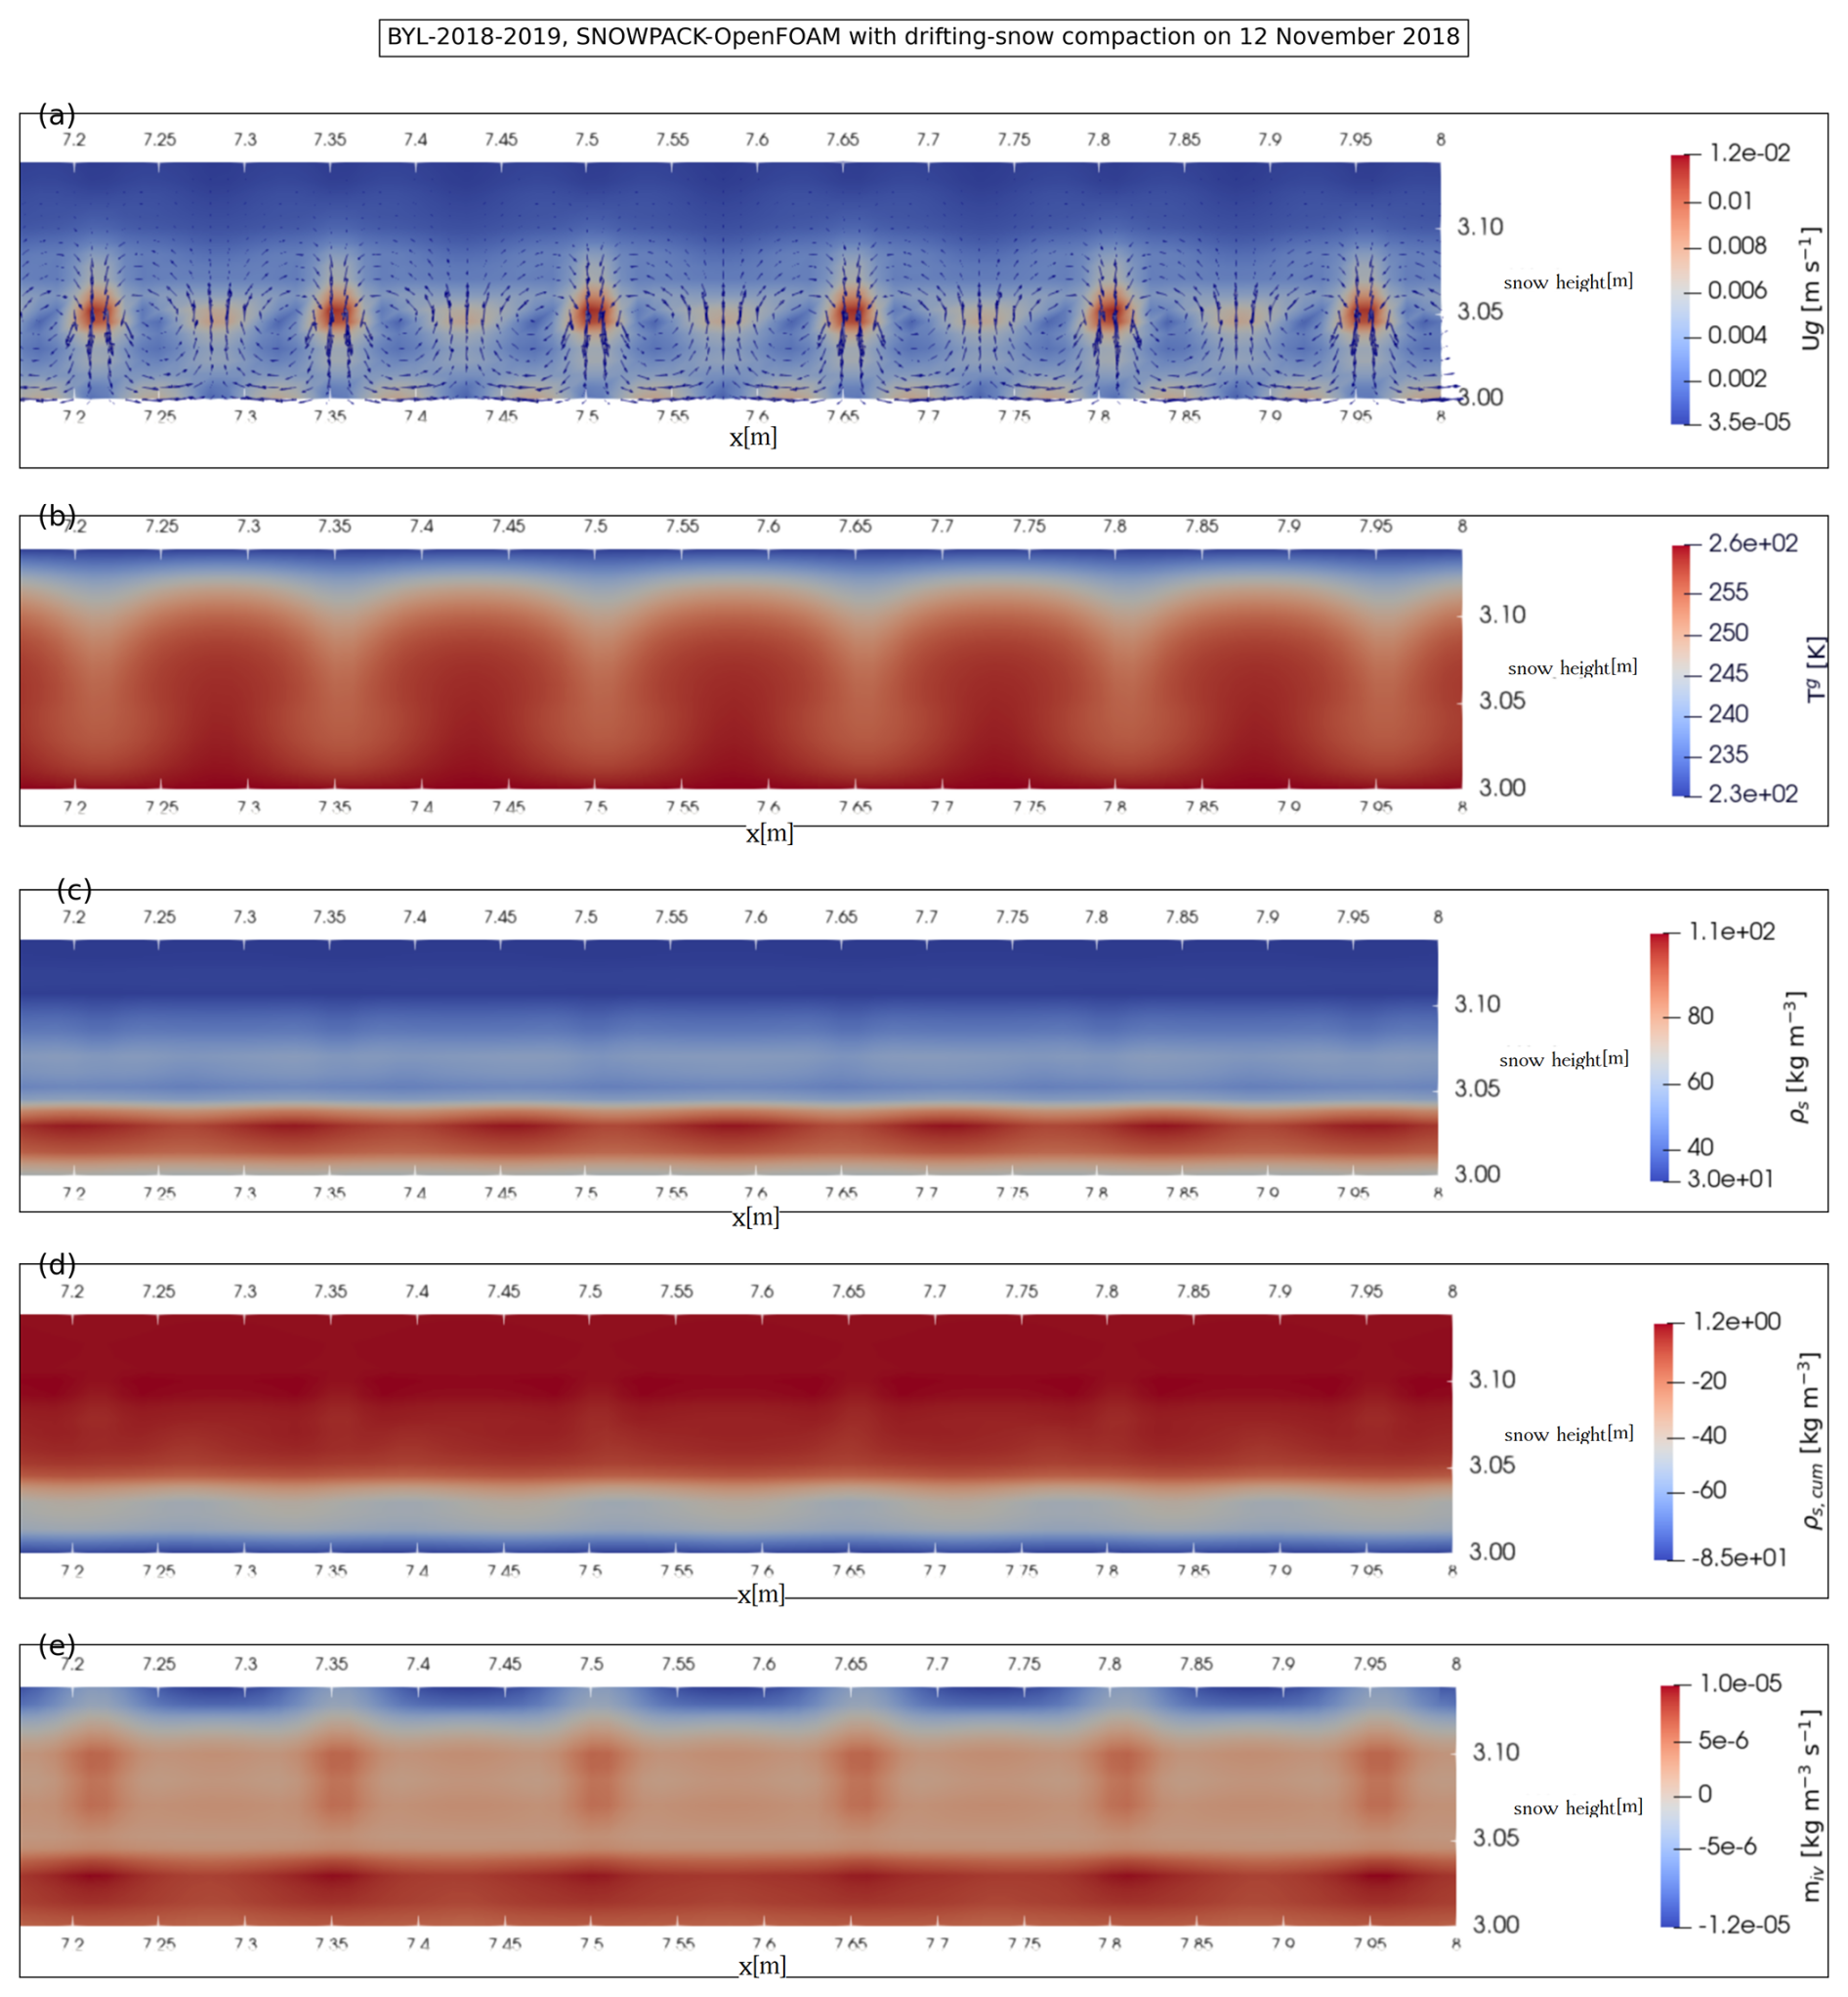
Figure 22Simulated two-dimensional plots on 12 November 2018 from SNOWPACK-OpenFOAM simulations with convection and with drifting-snow compaction model active in SNOWPACK for (a) the convective flow velocity vector scaled by a factor of 2, (b) the gas phase temperature, (c) the snow density, (d) the cumulative snow density change due to water vapor transport.
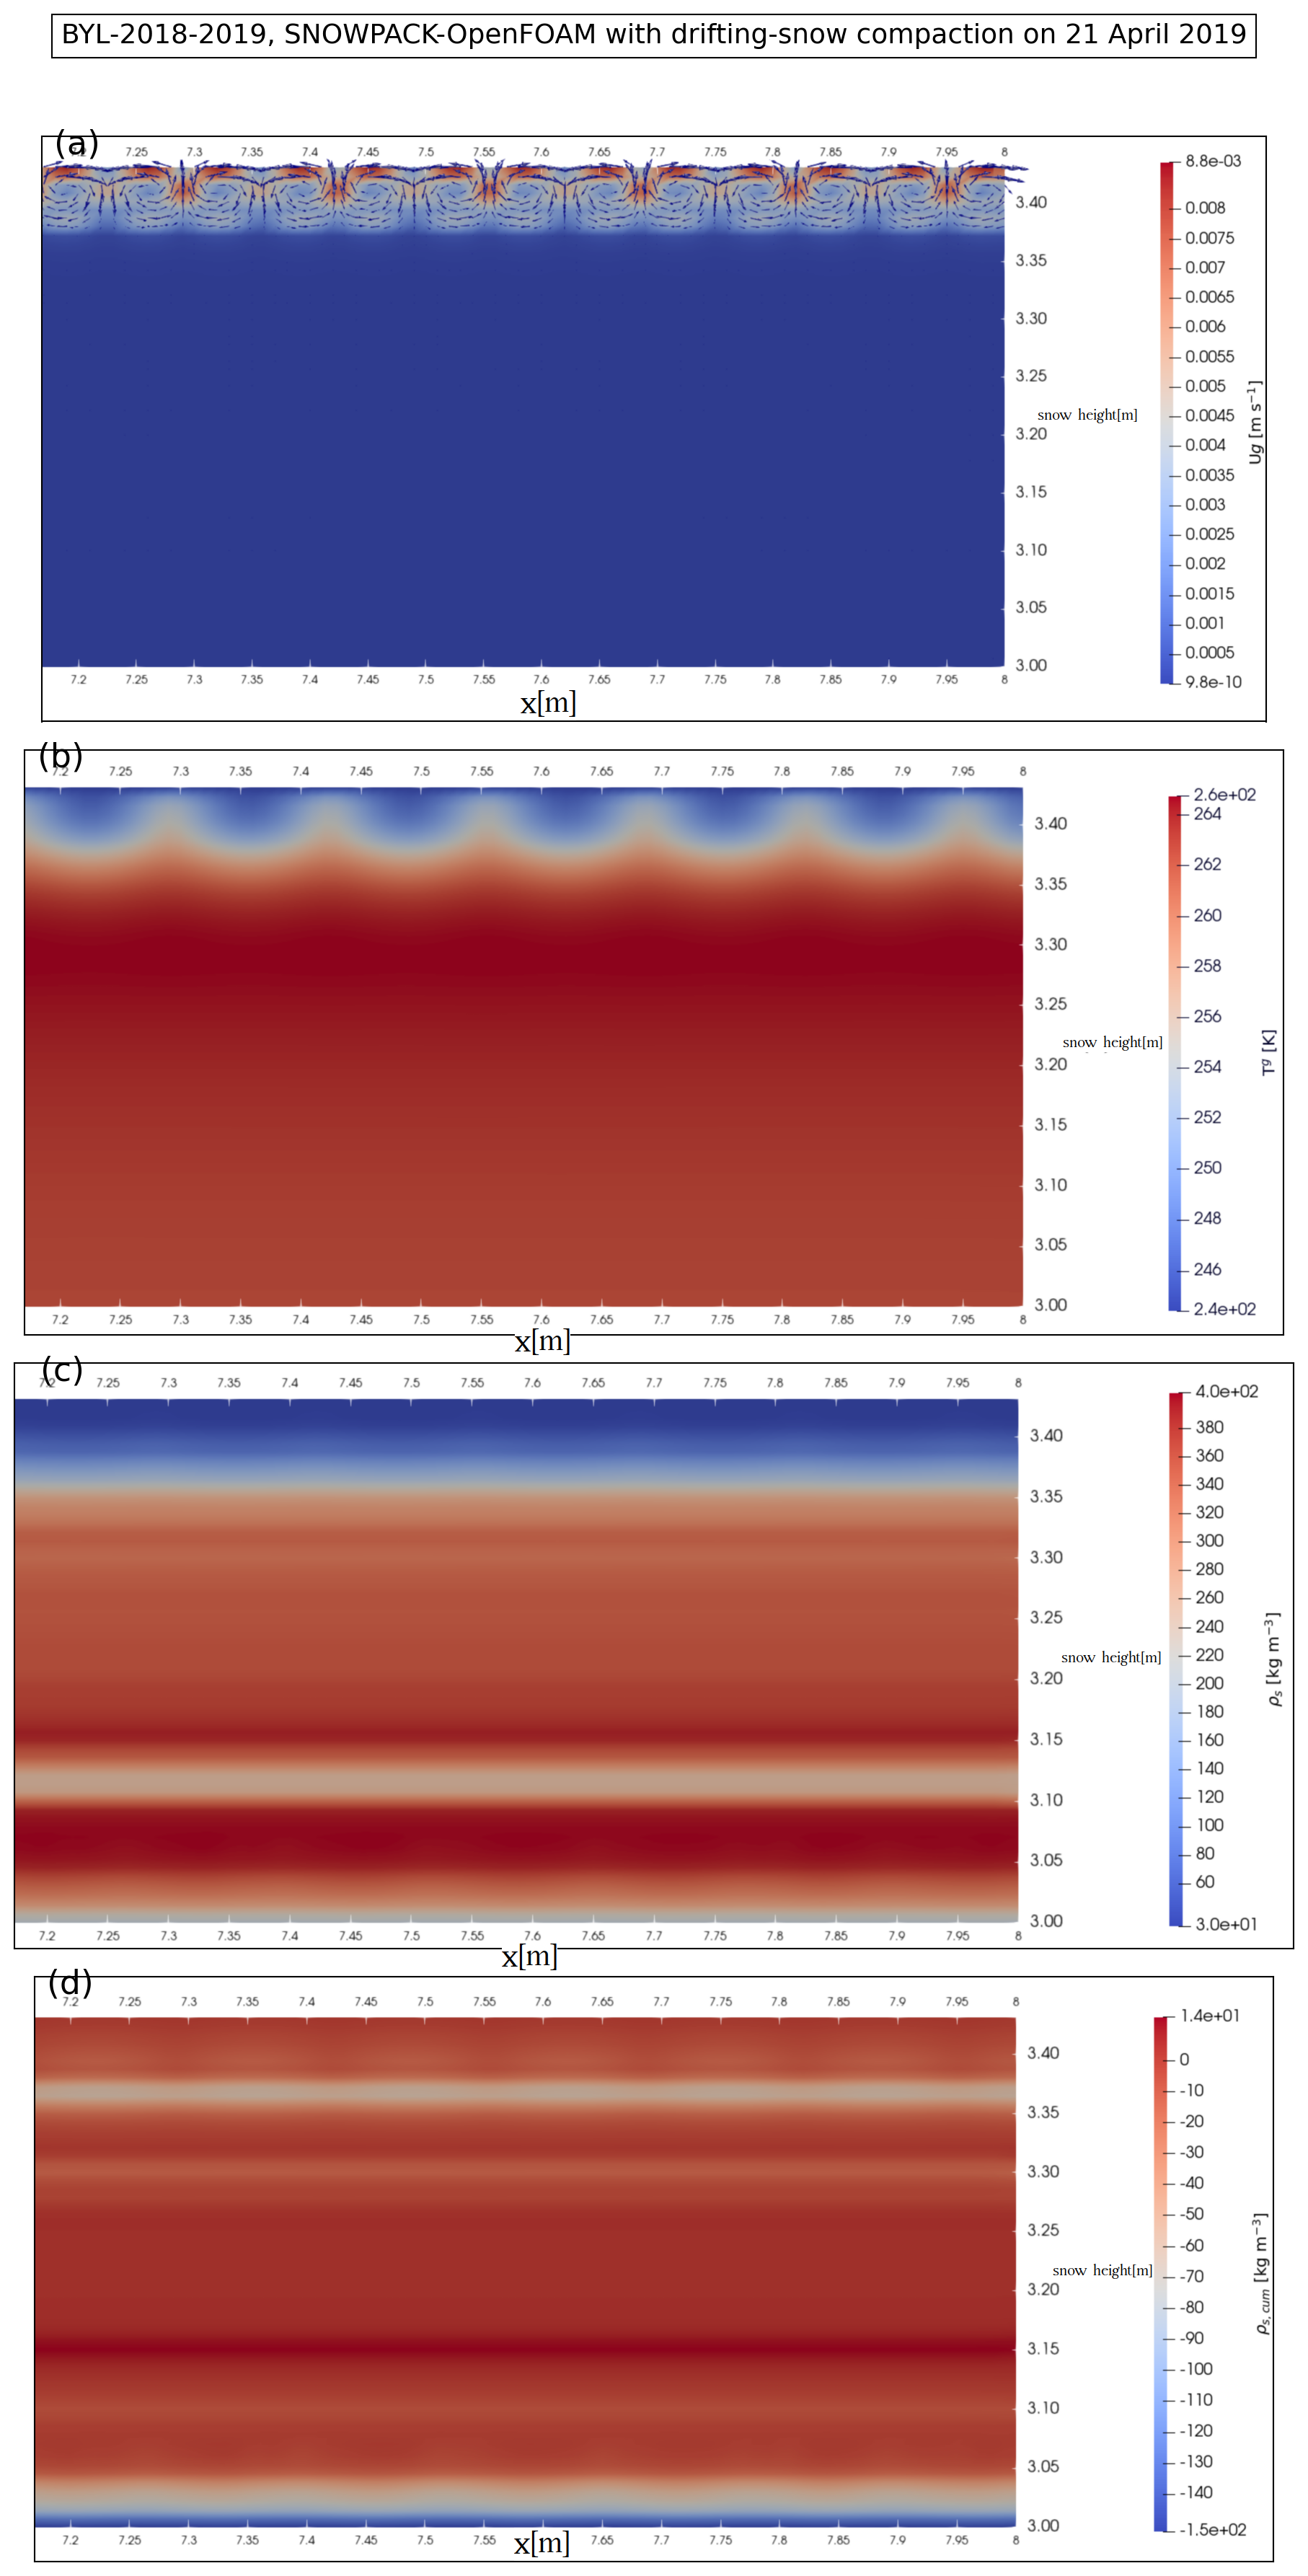
Figure 23Simulated two-dimensional plots on 21 April 2019 from SNOWPACK-OpenFOAM simulations with convection and with drifting-snow compaction model active in SNOWPACK for (a) the convective flow velocity vector scaled by a factor of 3, (b) the gas phase temperature, (c) the snow density, (d) the cumulative snow density change due to water vapor transport.
Overall, these observations show that convection events can arise even under the restrictive influence of drifting-snow compaction, but they are intermittent, short-lived, and easily suppressed by subsequent wind activity. From this comparison, we conclude that activating the drifting-snow compaction model effectively constrains convective transport, defining the lower bound of convection activity. The snowpack remains largely diffusion-dominated, with density stratification controlled mainly by wind-slab formation rather than by convective redistribution of water vapor.
Convection in snow has long been hypothesised to be at least partially responsible for the typical high-latitude snow profile with a weak (low density) foot and a sturdy (high density) top. Such profiles are to date not successfully reproduced by numerical snow models. Recent progress in idealised simulations of convection in snow (Jafari et al., 2022) now opens the possibility to investigate the process in more realistic settings. This paper makes a first step by guiding two-dimensional simulations of convection in OpenFOAM through a detailed SNOWPACK simulation for full snow seasons at the Arctic Bylot site. Using a SNOWPACK version where surface wind compaction has been turned-off, we show that significant convection happens throughout the season but that this does not move sufficient mass to form the hard and dense surface snow slab as observed. When using the SNOWPACK variant with wind-induced surface compaction (Keenan et al., 2021; Wever et al., 2023), convection is inhibited significantly but still occurs over extended periods of time and for cells with varying vertical extent. We regard the tests without wind compaction as showing the upper bound of potential convection effects and the ones with wind compaction as showing the lower bound. Our simulations also indirectly confirm the importance of wind for the hard surface slab (Sommer et al., 2018).
Investigating lateral and vertical effects of convection on the thermal and phase change regimes for Bylot, it is found that convection cells qualitatively have similar lateral and vertical footprints on the snowpack structure. Different from what observed for convection in idealized snowpacks, it is further found that (1) sublimation is significant for the whole downward flow not only for the layer close to the ground, (2) the convection cells become more stable over time and do not move laterally, and (3) flow-blocking due to deposition may still move the deposition zone toward the region on top between downward and upward flows. Lateral variations up to 90 kg m−3 (115 %) for snow density and up to 5 K (30 %) for snow temperature indicate major gradients within a convection cell, which may substantially influence secondary processes such as metamorphism and melt-refreeze to laterally vary in the snowpack.
Looking at time series of temperature profiles, it is found that strong snow density change rates due to sustained convection are strongly linked to persistent cold events observed for Bylot tundra. Compared to diffusion only, a larger increase in cumulative snow density change up to 55 kg m−3 is observed close to the snow surface. Furthermore, it is shown that a significant decrease in snow density due to convective vapor transport (up to 60 kg m−3) is not limited only to a small layer at the base but it has an effective depth of about 10–20 cm, which corresponds better to observations. However, even under the unrealistic assumption of low density surface snow, the density changes both negative at the foot and positive at the surface are insufficient to fully explain observed profiles. This could be due to limitations of the study set-up. We recall that the coupling between SNOWPACK and OpenFOAM cannot be made fully consistent as the one-dimensional SNOWPACK profile changes need to be uniformly applied to the two-dimensional OpenFOAM domain, which is not realistic. Another limitation is that the current set-up does not use the convective vapor fluxes from OpenFOAM to drive metamorphism, in particular grain growth, in SNOWPACK. This could clearly lead to rapid growth of grains at the foot of the snow cover facilitating convection. In general, all process representations in SNOWPACK would have to be adapted to be consistent with the explicit consideration of convective vapor fluxes. This concerns next to metamorphism also settling. We have further neglected wind pumping (forced convection) throughout this study, as quantitative analysis by Jafari et al. (2022) shows its effect on snow density change profiles to be minor compared to natural convection, especially in the presence of a low-permeability hard slab.
Therefore, we propose as next steps to investigate whether larger effects can be obtained by considering the influence of vegetation (grass and shrubs), which reduce initial density close to the ground (Jafari and Lehning, 2023b), or by improving the consistency between the one- and two-dimensional domains in terms of improved metamorphism modelling. As a second step, one could attempt to parameterize the effect for the one-dimensional SNOWPACK model (or other such models).
We acknowledge that a simple parameterization based on classical dimensionless numbers (like the Rayleigh number, Ra) for the entire snow column is problematic. Snow properties (the snow porosity, the effective thermal conductivity, and the intrinsic permeability) vary in space and time for a real convection case, making it difficult to define a single, representative Ra for a one-dimensional model. The practical step forward is to use high-fidelity SNOWPACK-OpenFOAM solution as a “truth set”. We will extract the resulting effective convective vapor flux and corresponding density change as a function of local one-dimensional snow properties (density, grain type, the snow element temperature difference as ΔT) within snow layers. This generated data can then be used to calibrate a water vapor diffusion enhancement factor (αv) to be employed in one dimensional models. The substantial two-dimensional variations observed-up to 90 kg m−3 (115 %) in localized snow density and up to 5 K (30 %) in temperature – demonstrate that ignoring the two-dimensional nature of natural convection introduces over 100 % uncertainty in localized density prediction and up to 30 % uncertainty in snow temperature in conventional one-dimensional models, underscoring the necessity of addressing this process.
The full source code of SNOWPACKFoam, a coupled SNOWPACK–OpenFOAM solver developed for modeling water vapor convection in snowpacks, is openly available on GitHub at https://github.com/cryos-snowBedFoam/SNOWPACKFoam (last access: 26 February 2026) and archived on Zenodo (https://doi.org/10.5281/zenodo.18788998; Jafari, 2026). The repository also contains the complete simulation setup used for the experiments described in this paper.
MJ started the project by implementing the convective vapor transport in snowpacks by coupling SNOWPACK with OpenFOAM and performed and analyzed the simulations. MJ also prepared the manuscript with the contribution of the second co-author, ML. ML has proposed the main idea behind the project as the supervisor. ML thoroughly revised the paper for submission.
The contact author has declared that neither of the authors has any competing interests.
Publisher's note: Copernicus Publications remains neutral with regard to jurisdictional claims made in the text, published maps, institutional affiliations, or any other geographical representation in this paper. The authors bear the ultimate responsibility for providing appropriate place names. Views expressed in the text are those of the authors and do not necessarily reflect the views of the publisher.
High performance computing support by the Swiss National Supercomputing Facility CSCS (grant no. S938 is acknowledged.
This research has been supported by the Swiss National Science Foundation SNF (grant nos. 200021E-154248 and 200020_215406).
This paper was edited by Cécile Ménard and reviewed by Kevin Fourteau and one anonymous referee.
Alley, R., Saltzman, E., Cuffey, K., and Fitzpatrick, J.: Summertime formation of depth hoar in central Greenland, Geophys. Res. Lett., 17, 2393–2396, 1990. a, b, c
Armstrong, R. L. and Brun, E.: Snow and Climate: Physical Processes, Surface Energy Exchange and Modeling, Cambridge University Press, ISBN-13 978-0521130653, 2009. a
Bartelt, P. and Lehning, M.: A physical SNOWPACK model for the Swiss avalanche warning: Part I: numerical model, Cold Reg. Sci. Technol., 35, 123–145, https://doi.org/10.1016/S0165-232X(02)00074-5, 2002. a, b, c
Bear, J.: On the tensor form of dispersion in porous media, J. Geophys. Res., 66, 1185–1197, 1961. a
Bear, J.: Dynamics of fluids in porous media, Courier Corporation, 1988. a
Calonne, N., Geindreau, C., Flin, F., Morin, S., Lesaffre, B., Rolland du Roscoat, S., and Charrier, P.: 3-D image-based numerical computations of snow permeability: links to specific surface area, density, and microstructural anisotropy, The Cryosphere, 6, 939–951, https://doi.org/10.5194/tc-6-939-2012, 2012. a, b
Calonne, N., Geindreau, C., and Flin, F.: Macroscopic modeling of heat and water vapor transfer with phase change in dry snow based on an upscaling method: Influence of air convection, J. Geophys. Res.-Earth, 120, 2476–2497, https://doi.org/10.1002/2015JF003605, 2015. a
Delgado, J.: Longitudinal and transverse dispersion in porous media, Chem. Eng. Res. Des., 85, 1245–1252, 2007. a
Derksen, C., Silis, A., Sturm, M., Holmgren, J., Liston, G. E., Huntington, H., and Solie, D.: Northwest Territories and Nunavut snow characteristics from a subarctic traverse: Implications for passive microwave remote sensing, J. Hydrometeorol., 10, 448–463, 2009. a
Domine, F., Barrere, M., Sarrazin, D., Morin, S., and Arnaud, L.: Automatic monitoring of the effective thermal conductivity of snow in a low-Arctic shrub tundra, The Cryosphere, 9, 1265–1276, https://doi.org/10.5194/tc-9-1265-2015, 2015. a
Domine, F., Barrere, M., and Sarrazin, D.: Seasonal evolution of the effective thermal conductivity of the snow and the soil in high Arctic herb tundra at Bylot Island, Canada, The Cryosphere, 10, 2573–2588, https://doi.org/10.5194/tc-10-2573-2016, 2016. a, b, c, d
Domine, F., Belke-Brea, M., Sarrazin, D., Arnaud, L., Barrere, M., and Poirier, M.: Soil moisture, wind speed and depth hoar formation in the Arctic snowpack, J. Glaciol., 64, 990–1002, https://doi.org/10.1017/jog.2018.89, 2018. a, b
Domine, F., Lackner, G., Sarrazin, D., Poirier, M., and Belke-Brea, M.: Meteorological, snow and soil data (2013–2019) from a herb tundra permafrost site at Bylot Island, Canadian high Arctic, for driving and testing snow and land surface models, Earth Syst. Sci. Data, 13, 4331–4348, https://doi.org/10.5194/essd-13-4331-2021, 2021. a, b, c
Duchesne, D., Gauthier, G., and Berteaux, D.: Habitat selection, reproduction and predation of wintering lemmings in the Arctic, Oecologia, 167, 967–980, https://doi.org/10.1007/s00442-011-2045-6, 2011. a
Fahs, M., Graf, T., Tran, T. V., Ataie-Ashtiani, B., Simmons, C. T., and Younes, A.: Study of the effect of thermal dispersion on internal natural convection in porous media using Fourier series, Transport Porous Med., 131, 537–568, 2020. a
Gouttevin, I., Langer, M., Löwe, H., Boike, J., Proksch, M., and Schneebeli, M.: Observation and modelling of snow at a polygonal tundra permafrost site: spatial variability and thermal implications, The Cryosphere, 12, 3693–3717, https://doi.org/10.5194/tc-12-3693-2018, 2018. a
Hansen, A. C. and Foslien, W. E.: A macroscale mixture theory analysis of deposition and sublimation rates during heat and mass transfer in dry snow, The Cryosphere, 9, 1857–1878, https://doi.org/10.5194/tc-9-1857-2015, 2015. a
Jafari, M.: Water vapor transport in snowpacks, EPFL, PhD thesis, p. 154, https://doi.org/10.5075/epfl-thesis-9659, 2022. a
Jafari, M.: cryos-snowBedFoam/SNOWPACKFoam: SNOWPACKFoam v1.0.0 (paper snapshot for egusphere-2025-3035) (v1.0.0), Zenodo [software], https://doi.org/10.5281/zenodo.18788998, 2026. a
Jafari, M. and Lehning, M.: snowpackBuoyantPimpleFoam: an OpenFOAM Eulerian–Eulerian two-phase solver for modelling convection of water vapor in snowpacks, EnviDat [data set], https://doi.org/10.16904/envidat.265, 2021. a
Jafari, M. and Lehning, M.: Convection of snow: when and why does it happen?, Front. Earth Sci., 11, https://doi.org/10.3389/feart.2023.1167760, 2023a. a
Jafari, M. and Lehning, M.: Convection of snow: when and why does it happen?, Front. Earth Sci., 11, https://doi.org/10.3389/feart.2023.1167760, 2023b. a
Jafari, M., Gouttevin, I., Couttet, M., Wever, N., Michel, A., Sharma, V., Rossmann, L., Maass, N., Nicolaus, M., and Lehning, M.: The Impact of Diffusive Water Vapor Transport on Snow Profiles in Deep and Shallow Snow Covers and on Sea Ice, Front. Earth Sci., 8, 249, https://doi.org/10.3389/feart.2020.00249, 2020. a, b, c, d, e
Jafari, M., Sharma, V., and Lehning, M.: Convection of water vapour in snowpacks, J. Fluid Mech., 934, A38, https://doi.org/10.1017/jfm.2021.1146, 2022. a, b, c, d, e, f, g, h, i, j, k, l, m
Johnson, J. B., Sturm, M. A., Perovich, D. K., and Bens, C. S.: Field observations of thermal convection in a subarctic snow cover, International Association of Hydrological Sciences Publication, 162, 105–118, 1987. a, b
Keenan, E., Wever, N., Dattler, M., Lenaerts, J. T. M., Medley, B., Kuipers Munneke, P., and Reijmer, C.: Physics-based SNOWPACK model improves representation of near-surface Antarctic snow and firn density, The Cryosphere, 15, 1065–1085, https://doi.org/10.5194/tc-15-1065-2021, 2021. a, b, c
Kvernvold, O. and Tyvand, P. A.: Dispersion effects on thermal convection in porous media, J. Fluid Mech., 99, 673–686, https://doi.org/10.1017/S0022112080000821, 1980. a
Lehning, M., Bartelt, P., Brown, B., Russi, T., Stöckli, U., and Zimmerli, M.: SNOWPACK model calculations for avalanche warning based upon a network of weather and snow stations, Cold Reg. Sci. Technol., 30, 145–157, https://doi.org/10.1016/S0165-232X(99)00022-1, 1999. a, b, c
Lehning, M., Bartelt, P., Brown, B., and Fierz, C.: A physical SNOWPACK model for the Swiss avalanche warning Part III: Meteorological forcing, thin layer formation and evaluation, Cold Reg. Sci. Technol., 35, 169–184, https://doi.org/10.1016/S0165-232X(02)00072-1, 2002a. a, b, c
Lehning, M., Bartelt, P., Brown, B., Fierz, C., and Satyawali, P.: A physical SNOWPACK model for the Swiss avalanche warning: Part II. Snow microstructure, Cold Reg. Sci. Technol., 35, 147–167, 2002b. a, b, c, d
Moukalled, F., Mangani, L., and Darwish, M.: The finite volume method in computational fluid dynamics, vol. 6, Springer, https://doi.org/10.1007/978-3-319-16874-6, 2016. a
Nield, D. and Bejan, A.: Convection in Porous Media, Springer International Publishing, ISBN 9783319495620, https://books.google.ch/books?id=WptcDgAAQBAJ (last access: 30 March 2026), 2017. a, b
Poirier, M., Fauteux, D., Gauthier, G., Domine, F., and Lamarre, J.-F.: Snow hardness impacts intranivean locomotion of arctic small mammals, Ecosphere, 12, e03835, https://doi.org/10.1002/ecs2.3835, 2021. a
Reid, D. G., Bilodeau, F., Krebs, C. J., Gauthier, G., Kenney, A., Gilbert, B., Leung, M., Duchesne, D., and Hofer, E.: Lemming winter habitat choice: a snow-fencing experiment, Behav. Ecol., 22, 1056–1062, https://doi.org/10.1093/beheco/arr086, 2011. a
Sommer, C. G., Wever, N., Fierz, C., and Lehning, M.: Investigation of a wind-packing event in Queen Maud Land, Antarctica, The Cryosphere, 12, 2923–2939, https://doi.org/10.5194/tc-12-2923-2018, 2018. a
Sturm, M. and Benson, I. C. S.: Vapor transport, grain growth and depth-hoar development in the subarctic snow, J. Glaciol., 43, https://doi.org/10.3189/S0022143000002793, 1997. a, b, c
Sturm, M. and Johnson, J. B.: Natural convection in the subarctic snow cover, J. Geophys. Res.-Sol. Ea., 96, 11657–11671, https://doi.org/10.1029/91JB00895, 1991. a, b, c, d
Taillandier, A.-S., Domine, F., Simpson, W. R., Sturm, M., Douglas, T. A., and Severin, K.: Evolution of the snow area index of the subarctic snowpack in central Alaska over a whole season. Consequences for the air to snow transfer of pollutants, Environ. Sci. Technol., 40, 7521–7527, 2006. a
Trabant, D. and Benson, C.: Field experiments on the development of depth hoar, Geol. Soc. Am. Mem., 135, 309–322, 1972. a, b, c, d
Vikhamar-Schuler, D., Hanssen-Bauer, I., Schuler, T. V., Mathiesen, S. D., and Lehning, M.: Use of a multilayer snow model to assess grazing conditions for reindeer, Ann. Glaciol., 54, 214–226, https://doi.org/10.3189/2013AoG62A306, 2013. a
Wen, B., Chang, K. W., and Hesse, M. A.: Rayleigh-Darcy convection with hydrodynamic dispersion, Physical Review Fluids, 3, 123801, https://doi.org/10.1103/PhysRevFluids.3.123801, 2018. a
Wever, N., Keenan, E., Amory, C., Lehning, M., Sigmund, A., Huwald, H., and Lenaerts, J. T. M.: Observations and simulations of new snow density in the drifting snow-dominated environment of Antarctica, J. Glaciol., 69, 823–840, https://doi.org/10.1017/jog.2022.102, 2023. a, b, c