the Creative Commons Attribution 4.0 License.
the Creative Commons Attribution 4.0 License.
 | 24 Apr 2026
Determining TTOP model parameter importance and overall performance across northern Canada
Madeleine C. Garibaldi
Philip P. Bonnaventure
Robert G. Way
Alexandre Bevington
Sharon L. Smith
Scott F. Lamoureux
Jean E. Holloway
Antoni G. Lewkowicz
Hannah Ackerman
Modelling current permafrost distribution and response to a changing climate depends on understanding which factors most strongly control ground temperatures. The Temperature at the Top of Permafrost (TTOP) model provides an analytical framework for estimating permafrost presence and thermal state, yet its sensitivity to key parameters remains poorly quantified across diverse northern environments. This study evaluates the relative influence of TTOP model parameters using ground and air temperature data from 330 sites across northern Canada. A leave-one-out cross-validation approach to determine model sensitivity was combined with random forest analysis to rank variable importance. Results show that TTOP performance is dominated by freezing-season conditions – particularly the freezing n-factor and freezing degree days – while thaw-season parameters exert less control. Sensitivity varies by region, with thawing parameters becoming more influential where the duration of the freezing and thawing seasons is similar. Machine learning results also highlighted the importance of thermal offset and mean surface temperatures which are strongly influenced by substrate properties. While the model generally reproduces observed ground temperatures well (RMSE of 0.2 °C), parameters derived from landcover classes were not transferable between sites, underscoring the importance of locally calibrated inputs. Overall, this study is the first empirically-based Canada-wide assessment of how different climatic and environmental factors affect the accuracy of permafrost temperature modelling and provides practical guidance for improving parameterization in regional and global permafrost models.
- Article
(5557 KB) - Full-text XML
-
Supplement
(1431 KB) - BibTeX
- EndNote


© His Majesty the King in Right of Canada, as represented by the Minister of Natural Resources Canada, 2026.
Permafrost is an important element of the cryosphere, impacting, for example, terrain stability (Romanovsky et al., 2017; Smith et al., 2022; O'Neill et al., 2023), carbon storage (Miner et al., 2022), and solute movement (Roberts et al., 2017; Lafrenière and Lamoureux, 2019). Unlike other elements of the cryosphere (e.g., glaciers and sea ice), direct observation of permafrost is rare (Kääb, 2008) and modelling is often used to predict permafrost temperature and distribution.
The Temperature at Top of Permafrost (TTOP) model (Riseborough and Smith, 1998) has been used to estimate permafrost temperature and presence at continental to local scales (Henry and Smith, 2001; Gisnås et al., 2013; Way and Lewkowicz, 2016; Obu et al., 2019; Vegter et al., 2024) and in a variety of permafrost environments including in the High Arctic and in mountains (Bevington and Lewkowicz, 2015; Garibaldi et al., 2021, 2024a). Its extensive use for spatial modelling is principally because it requires fewer input site condition and meteorological variables than more complex one-dimensional numerical or surface energy balance models. It has also been shown to be transferable to a variety of permafrost environments without the need for extensive recalibration unlike empirical-statistical models (Juliussen and Humlum, 2007; Riseborough et al., 2008). The primary challenge of using the TTOP modelling approach is parameterization of the scaling factors (n-factors) and soil thermal conductivities (Juliussen and Humlum, 2007). In modelling studies, these scaling factors have typically been assigned based on landcover class or topographic class using field measurements or values presented in the literature (Riseborough et al., 2008; Gisnås et al., 2013; Obu et al., 2019). Few studies have examined the uncertainties arising from mischaracterization of the TTOP model parameter values or the relative importance of each parameter which may vary substantially in different permafrost environments (Riseborough, 2004; Way and Lewkowicz, 2018).
Way and Lewkowicz (2016) demonstrated that utilizing freezing n-factors (nf) from western Canada when running the TTOP model for Labrador-Ungava reduced the accuracy of model outputs throughout the region's Subarctic forests. Theoretical and field data have both been used to assess TTOP model variable importance (Smith and Riseborough, 2002; Bevington and Lewkowicz, 2015). These studies highlighted the importance of nf, especially in High Arctic environments, but also noted the increasing influence of differential thermal conductivity (rk – the ratio between thawed and frozen thermal conductivity) near the southern limit of permafrost. However, these studies relied either on theoretical inputs or measurements covering relatively small study areas, potentially limiting the applicability of the conclusions to other locations or broader scales. As the parameterization of the scaling factors and rk remain one of the main challenges in applying the TTOP model, understanding the relative importance and sensitivity of the model to these parameters using empirical data is essential. Quantifying the impacts of input parameter selection will also aid model parameterization for future permafrost modelling studies.
TTOP parameters are also evaluated using a machine learning approach (random forest). Random forest is a supervised machine learning technique which combines randomized decision trees with bagging and aggregates their predictions though averaging or majority vote (Breiman, 2001; Biau and Scornet, 2016). Random forest also allows determination of variable importance rankings which can be used to either identify important variables for explanatory or interpolation purposes or to identify a small number of variables that provide a good prediction (Díaz-Uriarte and Alvarez de Andrés, 2006; Grömping, 2009; Genuer et al., 2010). In permafrost environments, these importance rankings have been applied in analysis of snow depth and landslide potential (Behnia and Blais-Stevens, 2018; Meloche et al., 2022) and have begun to be applied to analysis of ground surface temperatures at a regional scale (Colyn et al., 2025). Continued adoption of machine learning-based approaches to permafrost science and potential expansion of its use in parameterizing process-based models highlights the need to improve our understanding of how these models perform with real-world field data collected from across a variety of environments.
The objectives of this study are: (1) to use both a sensitivity analysis and machine learning (random forest) to evaluate TTOP model parameter importance using field observations and (2) to assess the accuracy of the TTOP model using measured parameters across permafrost regions of Canada. These results will support future efforts to improve TTOP model parameter calculations and to assess the performance of the TTOP model across differing environments.
2.1 Study Area
In situ data used to assess the TTOP model parameters were collected from a variety of Canadian permafrost environments ranging from Subarctic to polar desert, in lowlands and mountains (Fig. 1).
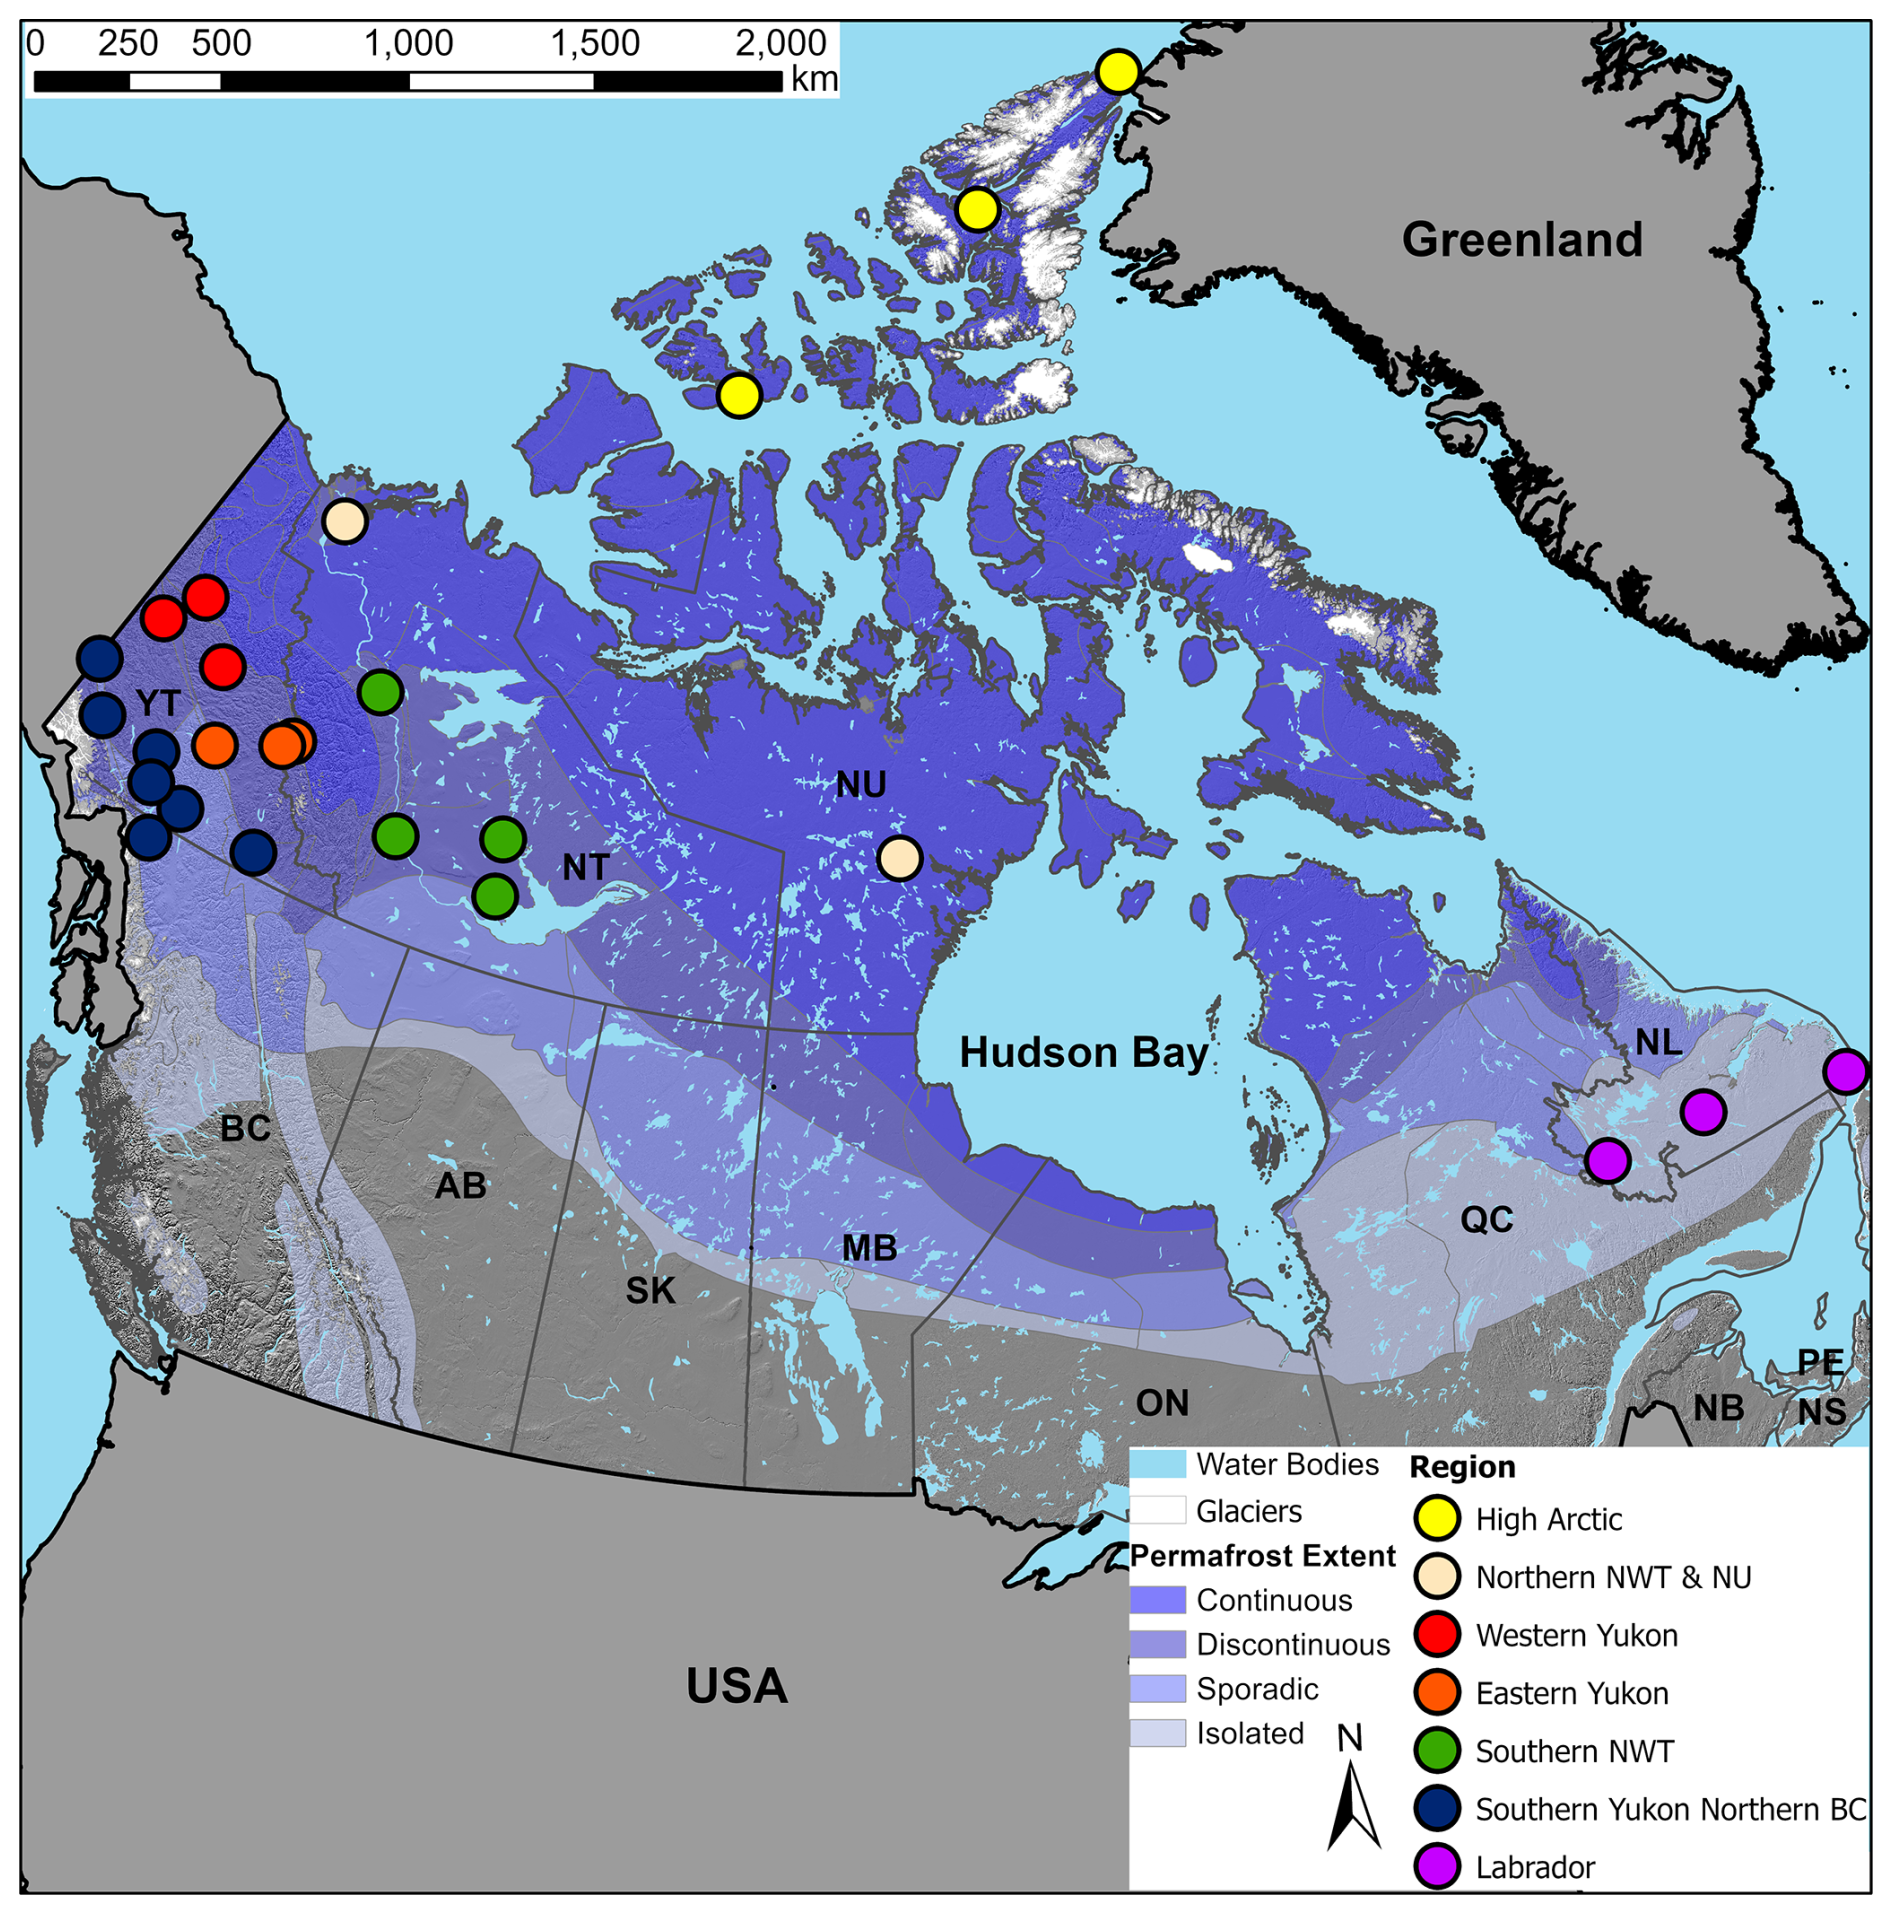
Figure 1Study area map showing the general location of the study sites used in the TTOP sensitivity analysis and random forest. The sites were grouped into seven regions for analysis (indicated by colour): High Arctic (Queen Elizabeth Islands), Northern NWT and NU, Western Yukon, Eastern Yukon, Southern NWT, Southern Yukon-Northern British Columbia, and Labrador. Permafrost extent from Brown et al. (2002). Contains information licenced under the Open Government Licence – Canada (Government of Canada, 2016, 2017).
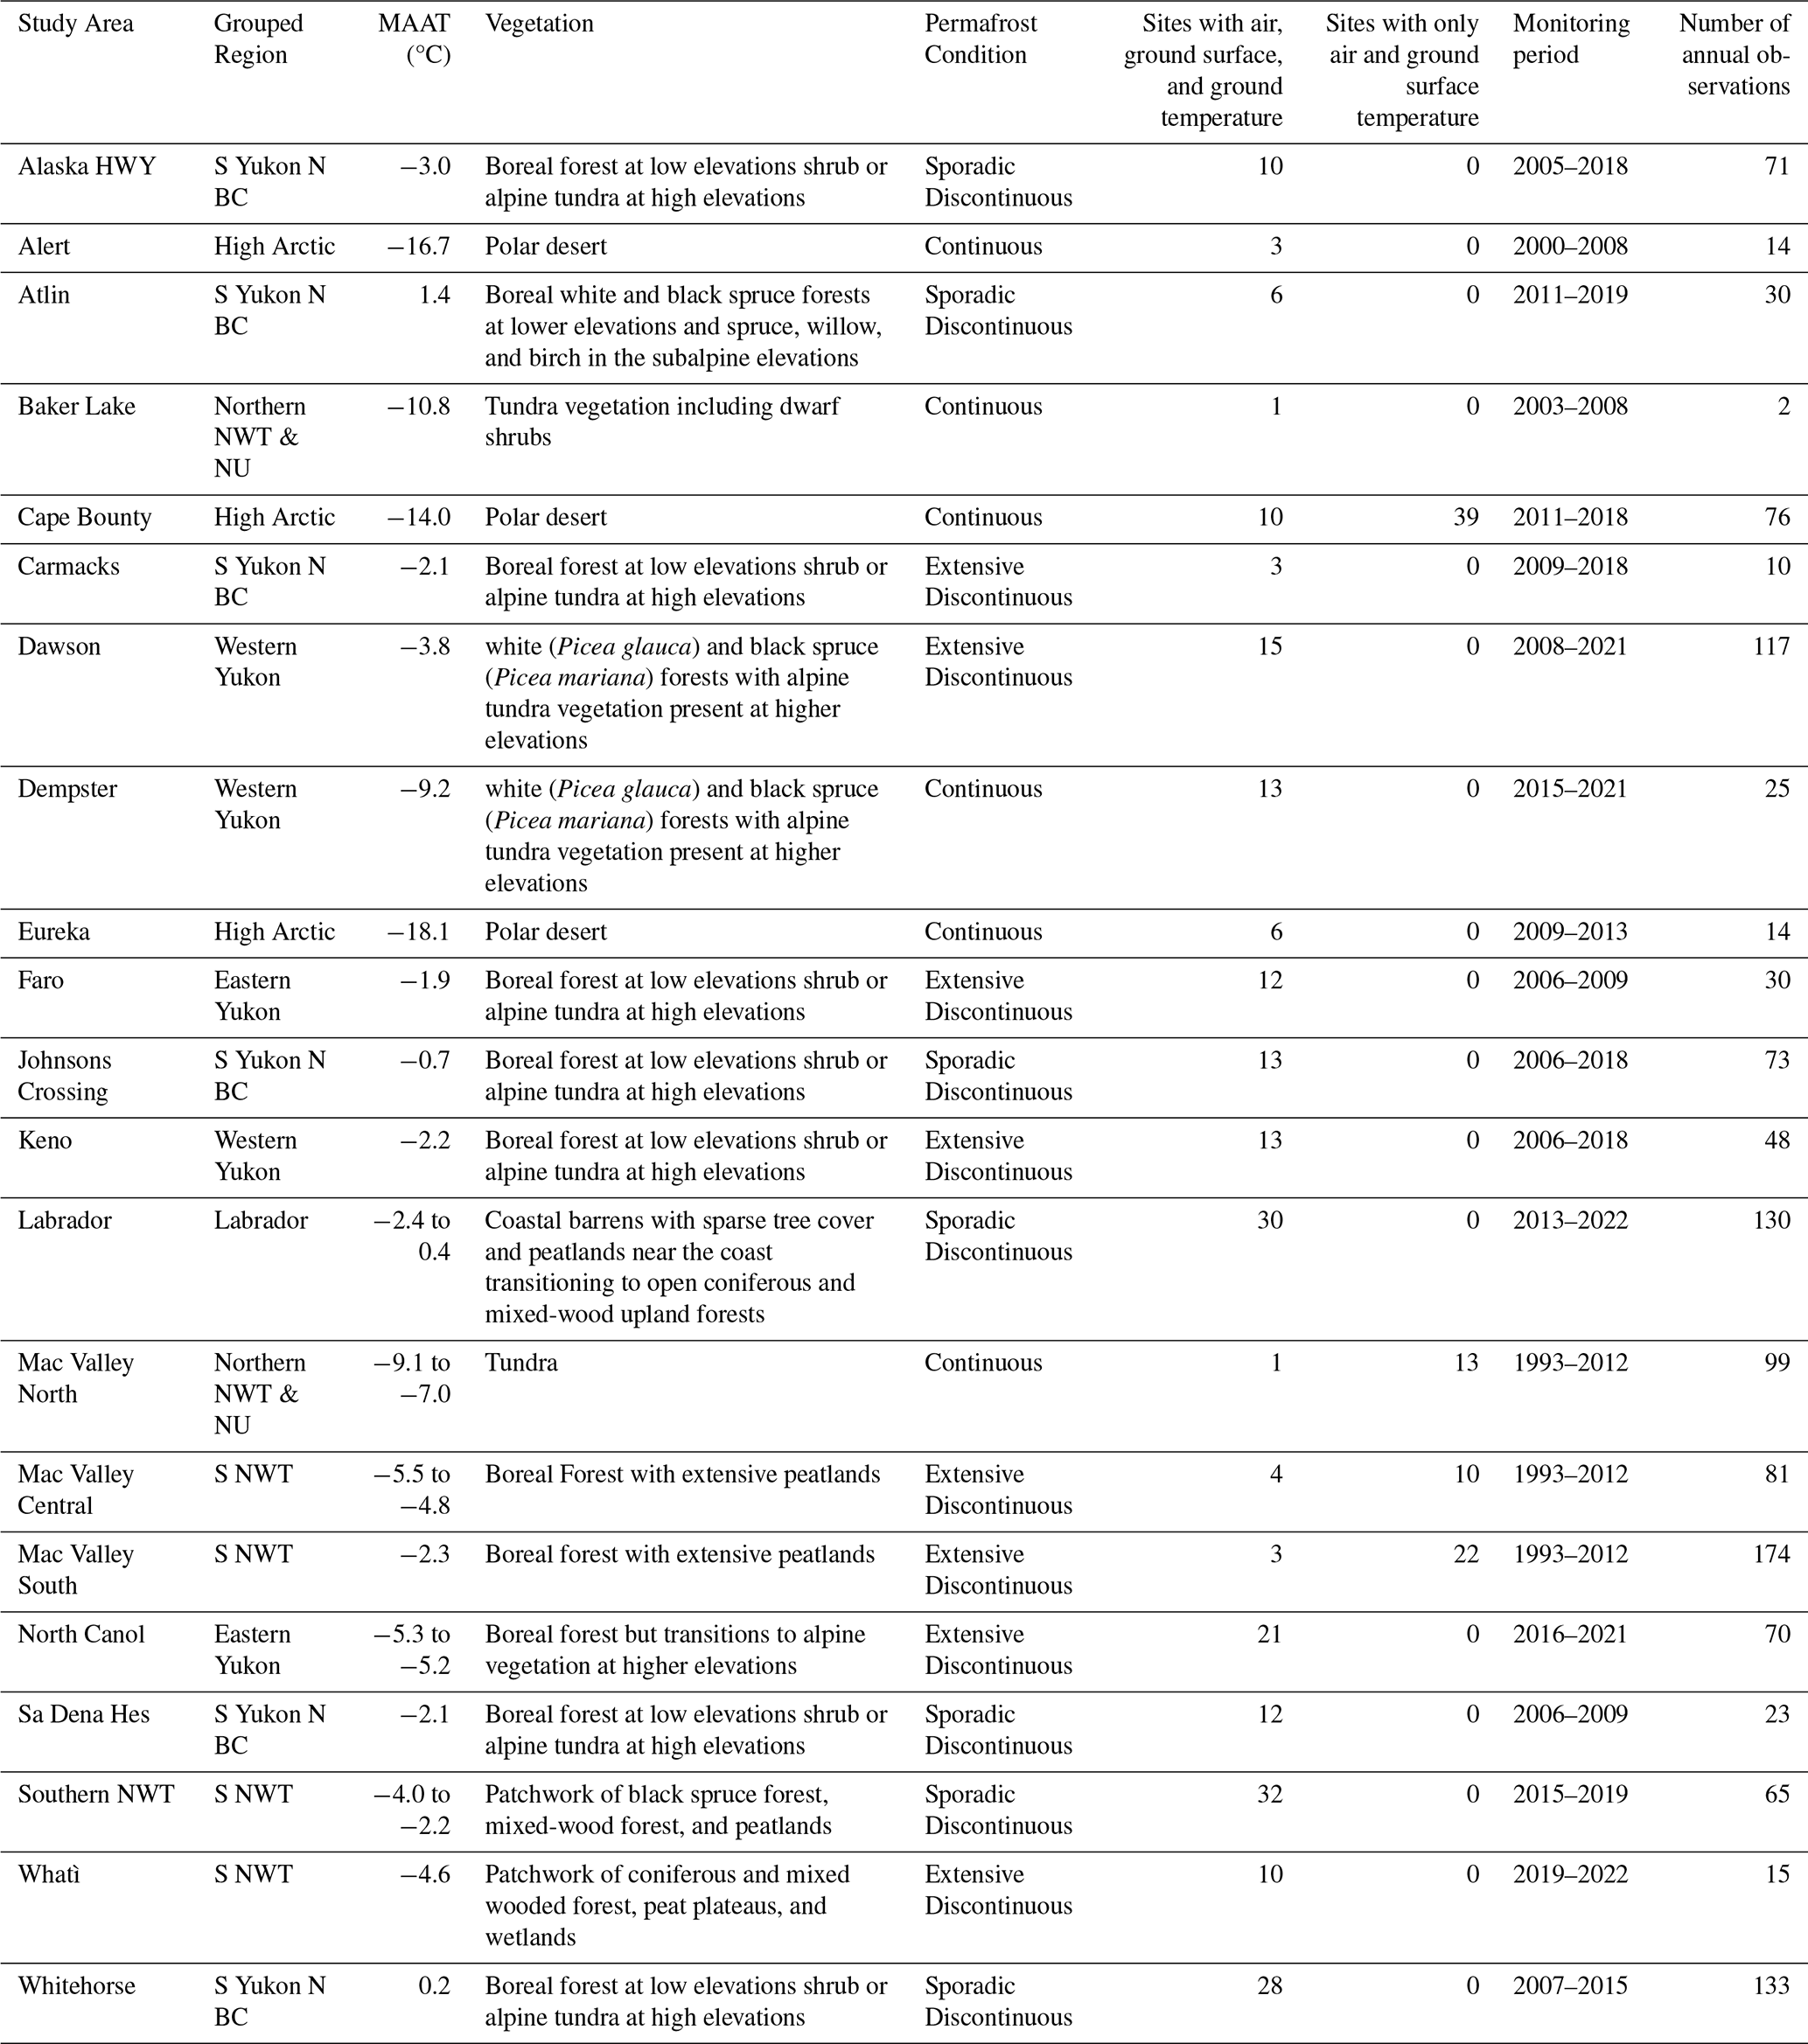
The sampling locations were initially grouped into 21 study areas based on the data source and proximity (Table 1). The latter were then combined into seven main study regions based on similarity in environmental and permafrost conditions and on statistically significant differences in model parameters (Table S1): High Arctic, Northern NWT and NU, Southern NWT, Western Yukon, Eastern Yukon, Southern Yukon-Northern BC, and Labrador.
Table 1Environmental and sampling details for each study area including permafrost condition, mean annual air temperature (MAAT) for the 1991–2020 climate normal from closest EC station (if available), vegetation characteristics, number of sampling locations and length of monitoring period. Total number of observations is the number of individual years of data for each site in the region (Stanek et al., 1980; Heginbottom et al., 1995; Aylsworth and Kettles, 2000; Smith et al., 2009; Gregory, 2011; Medeiros et al., 2012; Bevington and Lewkowicz, 2015; Duchesne et al., 2015; Holloway, 2020; Daly et al., 2022; Environment and Climate Change Canada, 2021; Lewkowicz, 2021; Ackerman, 2022; Tutton et al., 2021; Garibaldi et al., 2024a, b; Forget et al., 2024; Vegter et al., 2024).
2.2 Data Collection
Air, ground surface and ground temperature at depth measurements were recorded at 1 to 8 h intervals at 330 sites (Table 1). Record lengths ranged from 2 to 16 years. This dataset, spanning over two decades, is the product of long-term federal, territorial, and academic monitoring networks, only possible through funding and support from the Geological Survey of Canada and several Canadian universities.
Air temperatures were generally measured ∼1.5 to ∼2 m above the ground surface with an Onset Hobo U23-002 (±0.25–0.4 °C accuracy, 0.04 °C resolution) thermistors or Vemco loggers (accuracy and precision 0.1 °C) (previously owned by AMIRIX Systems Inc.) housed in a radiation shield (Onset RS1). At newer sites, a Hobo U23-001 (±0.25 °C accuracy, 0.04 °C resolution) was housed in a radiation shield. At all sites except the Southern NWT, ground surface temperature was measured 2–5 cm below the ground surface with the Hobo U23-002 internal thermistor. The slight difference in surface sampling depth (∼3 cm) did not have an impact on the results as the temperature difference is outside the logger accuracy. The Southern NWT ground surface temperatures were measured with Maxim Integrated TM Thermochron iButton temperature loggers (model no. DS1922L; accuracy ±0.5 °C).
For most sites, ground temperature at depth was measured using the Hobo U23-002 or Hobo Pro U12-008 external thermistors, while for the remaining sites, ground temperatures at depth were recorded using multi-sensor cables with RBR loggers. For a majority of sites, the ground depth sensor was positioned close to or at the top of the frost table at the time of installation. For sites with multiple ground temperature observations, the sensor closest to the depth of the frost table was used. However, for less than a quarter of observations (23 %), annual mean ground temperature (AMGT) may not correspond to the temperature at the top of the frost table due to installation depth limitations. These sites are generally confined to coarse grained, dry, rocky sediment where the thermal gradient is typically small (Lewkowicz et al., 2012). Based on estimations of active layer or frost depth and temperature extrapolation (see Sect. S1 in the Supplement), the difference between the true TTOP and the temperature at the monitoring depth was generally less than 0.5 °C (90 % observations, average =0.2 °C). Therefore, at these sites, AMGT was still compared directly to the modelled TTOP value.
The data were assessed for sensor drift, erroneous measurements, and missing intervals. Short data gaps (<3 consecutive days) were filled using linear interpolation, while larger gaps were flagged. Average air, ground surface and ground temperatures were only calculated for years ≥85 % daily data completeness once erroneous values were removed and data gaps were considered.
2.3 TTOP Model Sensitivity
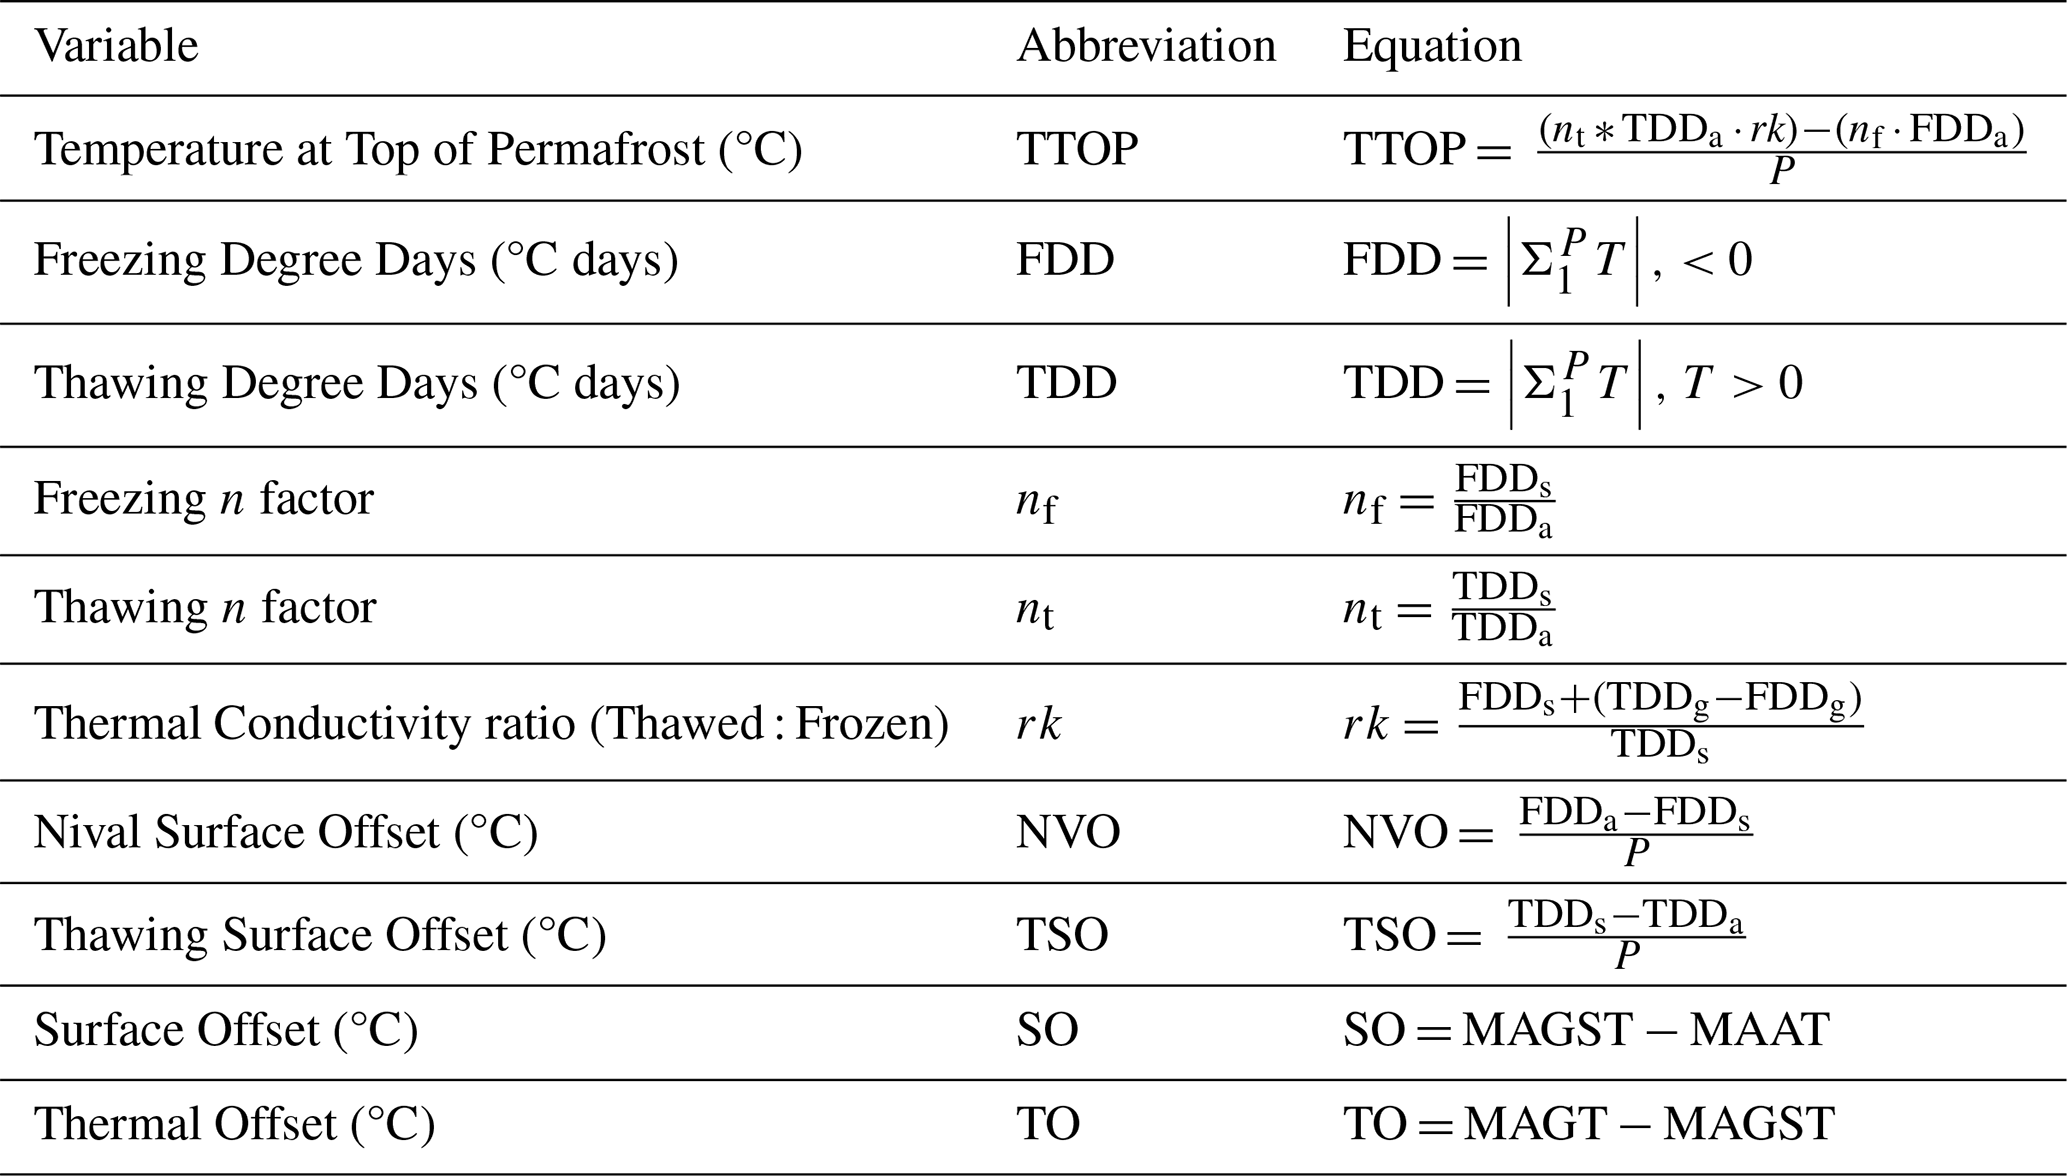
The TTOP model calculates equilibrium permafrost temperature using air freezing and thawing degree days, n-factors and the thermal conductivity ratio (Table 2). The TTOP model is often used spatially as the meteorological input parameters are commonly able to be estimated from meteorological stations (Juliussen and Humlum, 2007). However, as an equilibrium model, TTOP is not ideal for modelling transient changes in permafrost temperature and distribution. TTOP model errors are often largest near 0 °C due to latent heat effects, which the model does not consider (Riseborough, 2007).
Table 2Variables and equations used in the TTOP sensitivity and random forest analysis. Freezing (FDD) and thawing (TDD) degree-days were calculated for air (a), ground surface (s), and ground at or close to top of permafrost (g). P is the period, usually 365 d.
To assess the TTOP model sensitivity to input parameters we first calculated baseline input parameters for the TTOP model and the reference TTOP value (TTOP model output when using values for baseline parameters derived from the measured field data) were calculated for each site.
To allow for direct comparison of model sensitivity in all environments with measured data, the TTOP model equation for permafrost was also applied to sites considered to be seasonally frozen (Way and Lewkowicz, 2018; Obu et al., 2019; Garibaldi et al., 2021). For each year and each site, FDD and TDD were calculated using daily average air (Ta) and ground surface temperatures (Ts) from 1 September to 31 August of the subsequent year. Freezing and thawing n-factors were then calculated for each measurement location (Table 2). The ratio of thawed to frozen thermal conductivity (rk) for sites with a deeper ground temperature measurement was calculated using FDD and TDD for both the ground surface (s) and the ground temperature observation at or near the frost table (g) (Table 2). For sites without a depth sensor, rk, was assigned based on vegetation class for the High Arctic and substrate for the Mackenzie Valley (n = 38) (Kersten, 1949; Gregory, 2011; Obu et al., 2019; Garibaldi et al., 2021). These sites were included even though rk needed to be assigned as they filled a substantial latitudinal gap in the dataset (Fig. S2). Using the observed thermal offset to determine rk may not necessarily be possible given the materials that are present due to potential disequilibrium. However, for the purposes of this study we assumed equilibrium conditions for each observation.
Once the parameters and reference TTOP values were determined, the sensitivity of the model to changes in each parameter was assessed by iteratively substituting values for one parameter while holding all other inputs constant and then calculating the TTOP value for each substitution. The substituted values used percentiles (minimum, 10th, 25th, 50th, 75th, 90th and maximum) calculated using the parameters across the entire study dataset. We selected percentile-based substitution to test TTOP Model sensitivity as it allowed us to increase and decrease parameter values within observed ranges while avoiding introducing negative values. Additionally, percentile substitution allows for a direct comparison of sensitivity to each parameter across regions as the parameters at all sites were changed to the same value. Each year of data for each site was treated as its own observation and run through the sensitivity analysis resulting in 9100 different TTOP values for each parameter. Sensitivity analysis TTOPs were then compared to the reference (i.e. observed) TTOP values to assess the influence of the TTOP model to changes in each parameter.
Since vegetation is often used when assigning n-factors and rk in regions without observations, the TTOP sensitivity analysis was re-run using the median value for these parameters based on vegetation class and region. These TTOP outputs were then compared to the reference TTOP value for each site.
2.4 Random Forest Variable Importance Ranking
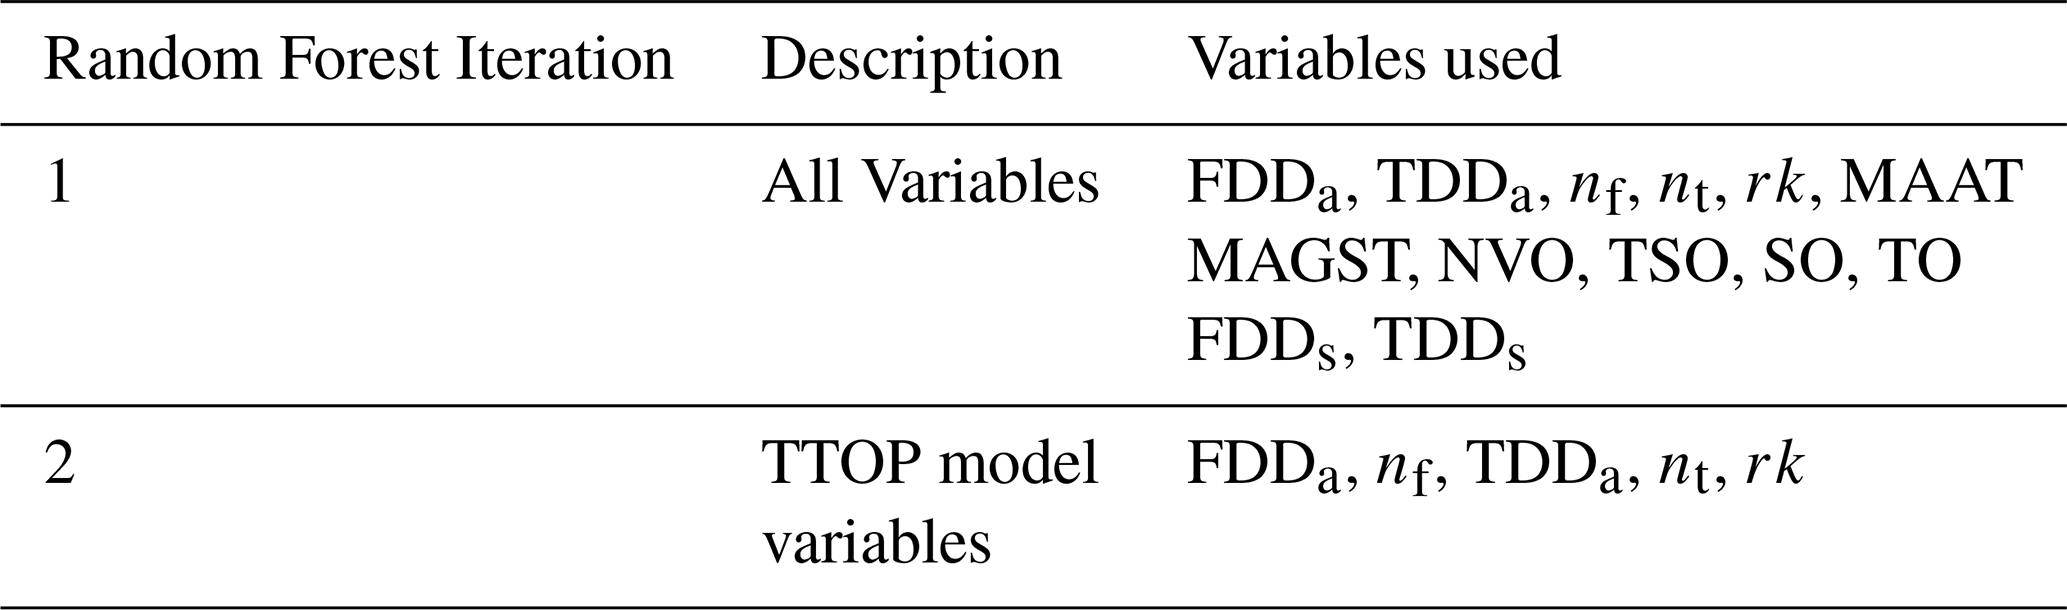
Algorithm inputs included TTOP model and additional parameters (see Table 2). Samples were randomly split into testing and training data (40 % and 60 % respectively both for the overall dataset and individual regions) with individual years treated as independent observations. Two random forest models were created, one using all the input variables and the other using only the TTOP model parameters (Table 3). The target variable for each random forest model was mean annual ground temperature at TTOP (MAGT). The random forests were generated in R Studio and run using the default settings for the number of variables sampled for splitting at each node (4 and 2 for iterations 1 and 2 respectively) and number of trees (500). For each iteration, the same training and test dataset was used to ensure comparability. The Northern NWT and NU regions were not included in this analysis because they lacked sufficient deeper ground temperature measurements.
Table 3Random forest trials including a description of variable selection, and variables used.
Random forest provides variable importance rankings through two methods: permutation accuracy importance (mean square error (MSE) reduction) or Gini importance (Strobl et al., 2008). The former, used here, has been more widely employed in variable importance studies due to biases in Gini importance when predictor parameters vary in number and scale (Díaz-Uriarte and Alvarez de Andrés, 2006; Strobl et al., 2008; Grömping, 2009; Genuer et al., 2010). Reduction in MSE involves the random permutation of each variable individually to simulate its absence in the model prediction. Variable importance is then determined based on the difference in prediction accuracy before and after the permutation. Variable importance plots were created for each random forest model both for the entire dataset (averaged across all sites) and for each region individually (averaged for all sites within each region) (e.g. Colyn et al., 2025).
2.5 TTOP model performance
For sites with measured ground temperature, the performance of the TTOP model was assessed by comparing the calculated TTOP and the measured AMGT at or near the top of permafrost (observed TTOP). For the few sites where the observed AMGT was not near the top of the frost table, the observed AMGT was still compared to TTOP as the thermal offset at these sites was low (Sect. S1 in the Supplement). TTOP model performance was based on model root mean square error (RMSE), r2, and bias compared to measured temperatures for individual years and sites.
3.1 TTOP Sensitivity
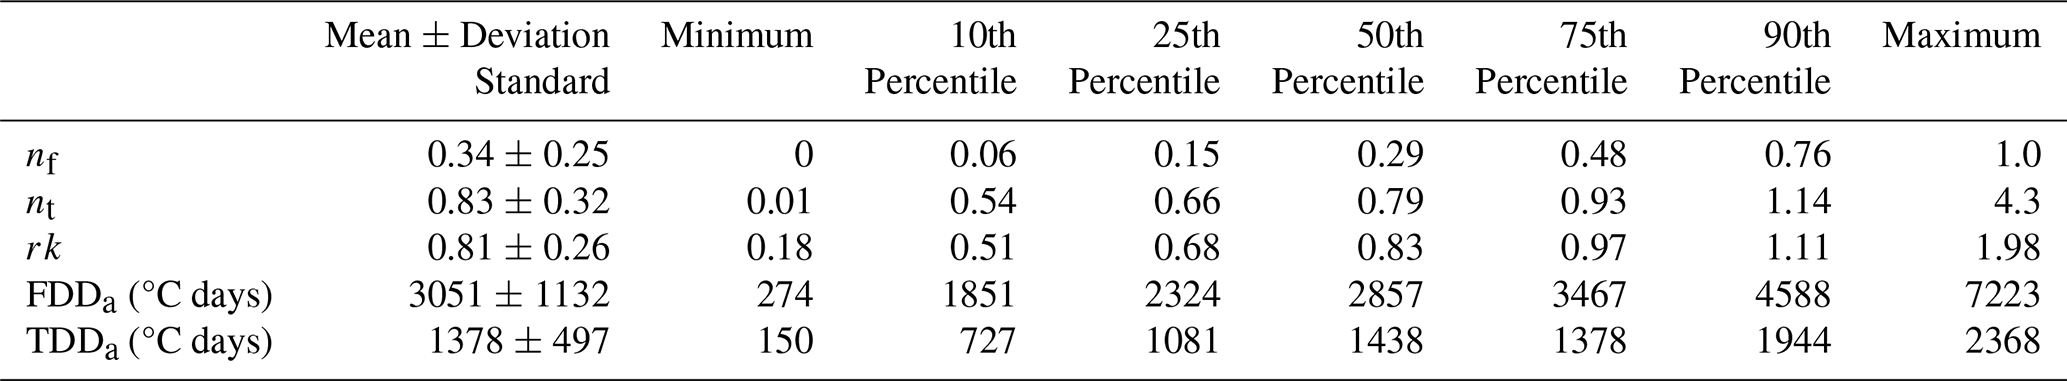
To test TTOP model sensitivity, percentile values for each parameter (calculated over the entire dataset) were directly substituted for the measured parameter value (Table 4). As the range of measured values differed for each parameter, the values and range of the substituted percentiles were also different. The potential impact of this on the interpretation of the sensitivity is discussed below.
Table 4Substituted percentile values for each parameter replacing the measured parameter value for each iteration of this trial method. These values were determined based on the observation data.
For a majority (>53 %) of sample points, changes to FDDa, nt, TDDa, and rk resulted in < 1 °C difference between the reference and perturbed TTOP output (Fig. 2b–e). However, for nf less than half (< 27 %) remained within 1 °C of the initial TTOP value (Fig. 2a). FDDa showed more sensitivity than TDDa, nt, and rk with less than 70 % of sample points remaining within 2 °C of the initial observation value (compared to > 75 %).
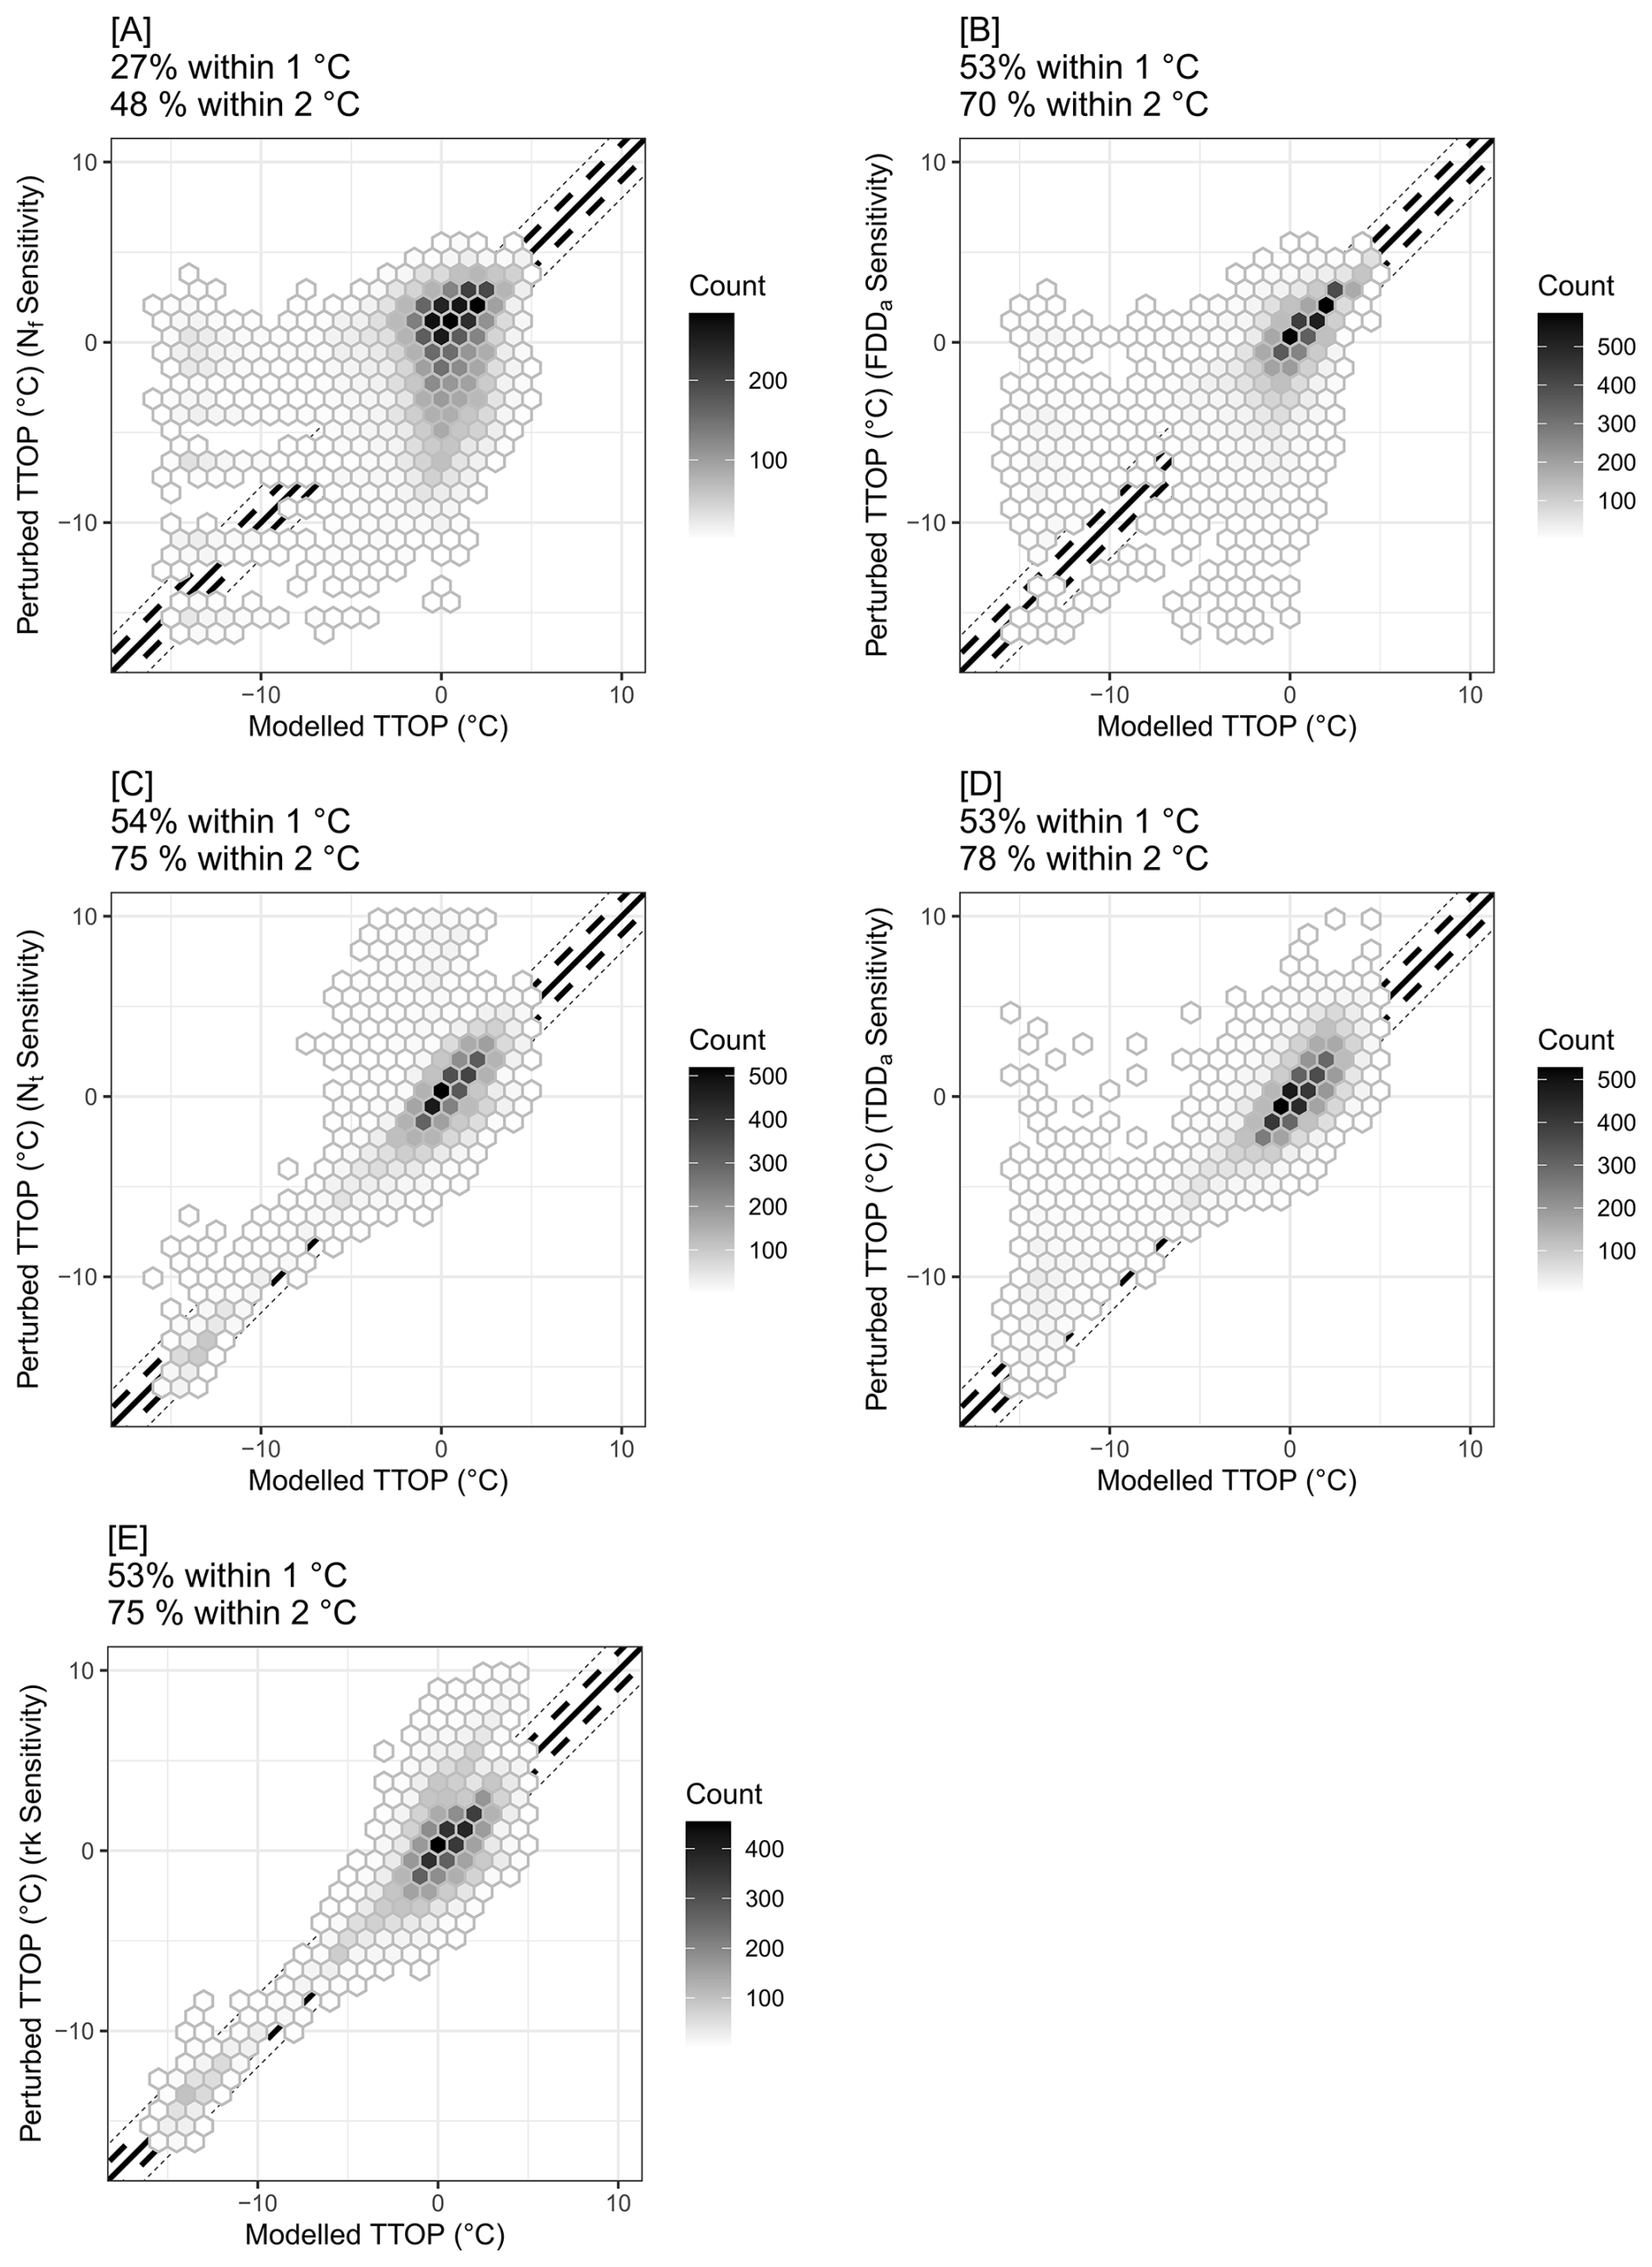
Figure 2Reference TTOP model values compared to perturbed TTOP model values for the direct substitution of the minimum, 5th, 25th, 50th, 75th, 95th, and maximum percentile value for [A] nf, [B] FDDa, [C] nt, [D] TDDa, and [E] rk. Large dashes indicate a ±1 °C difference while small dashes indicated a ±2 °C difference.
Latitudinal trends in sensitivity were observed with the region with the coldest permafrost (High Arctic) showing a much greater response to changes in winter parameters (FDDa and nf) and muted response to changes in summer parameters (nt) and the thermal conductivity ratio (rk) (Table 5, Fig. 3). However, the High Arctic region was also disproportionately sensitive to changes in TDDa when compared to more southern regions. Moving from north to south the difference between the reference and perturbed TTOP generally increased for the thawing parameters and decreased for the freezing parameters. In the southernmost regions (Southern Yukon-Northern BC and Labrador) all parameters had similar sensitivity. All sites had the greatest sensitivity to changes in nf or nt and the least sensitivity to changes in FDDa and rk. The sensitivity to rk was most similar between regions compared to the other parameters.
Table 5Average absolute difference between the reference TTOP and the perturbed TTOP for each parameter within each region. Regions are High Arctic, Northern NWT and NU, Western Yukon, Eastern Yukon, Southern NWT, Southern Yukon-Northern BC, and Labrador. Values followed by the same superscript letter are not significantly different (P > 0.05) between regions (along a row). Values followed by a subscript italicized letter are not significantly different (P > 0.05) within a region (down a column).
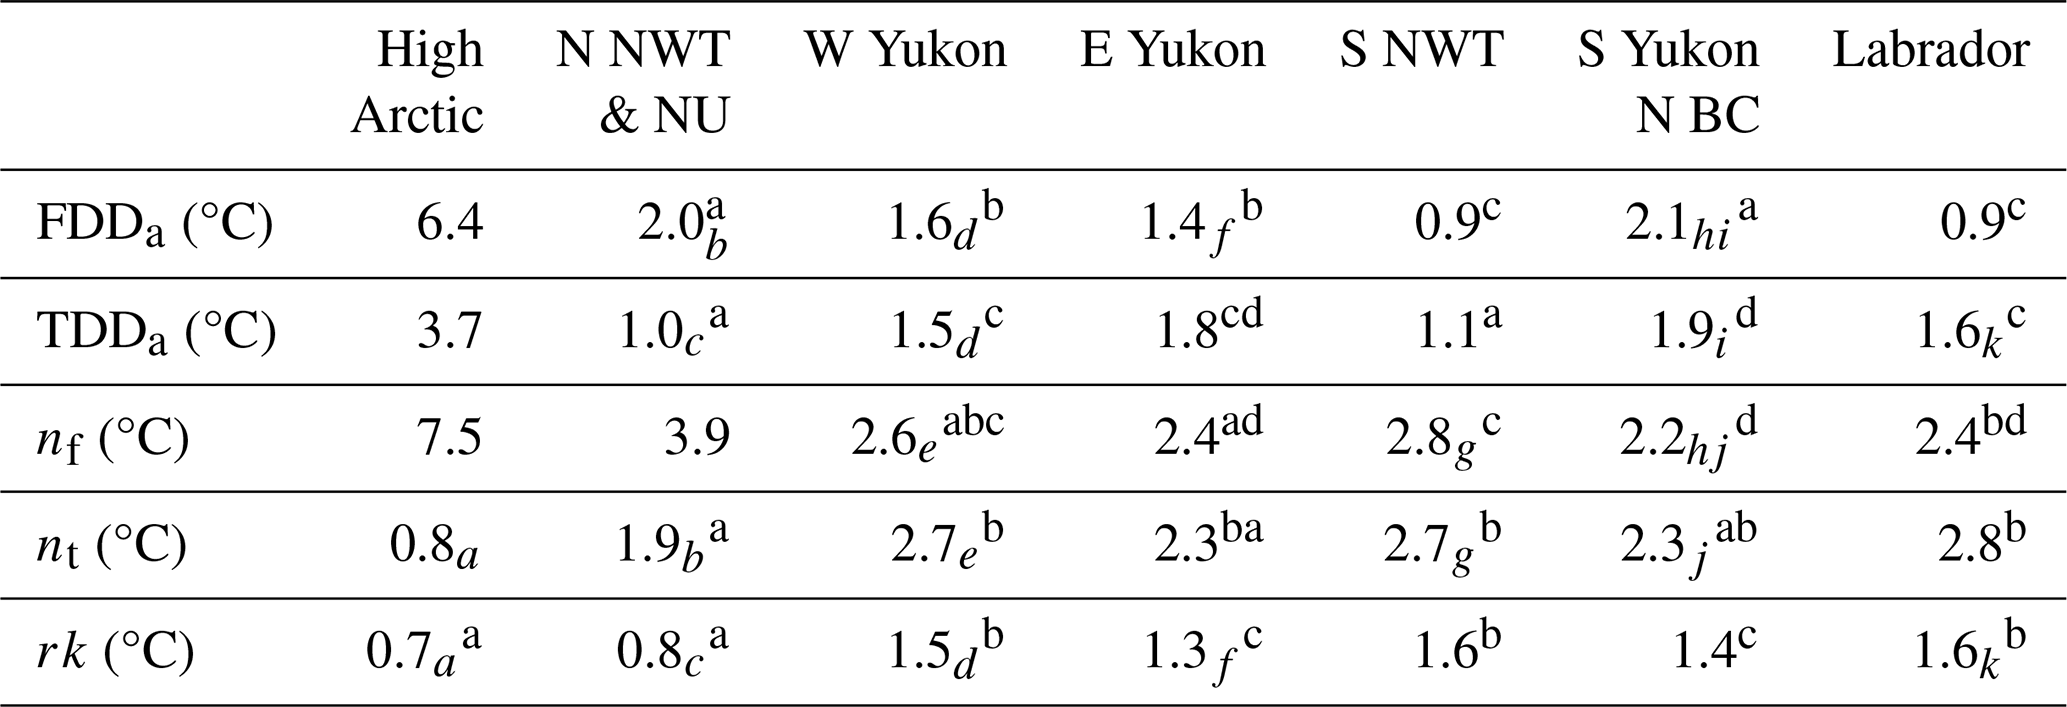
a in column 2 indicates that the difference in TTOP for nt and rk is not significantly different in the High Arctic.
a in the second row indicates that the difference in TTOP for changes in FDDa is not significantly different for the Northern NWT & NU and the Southern Yukon-Northern BC regions.
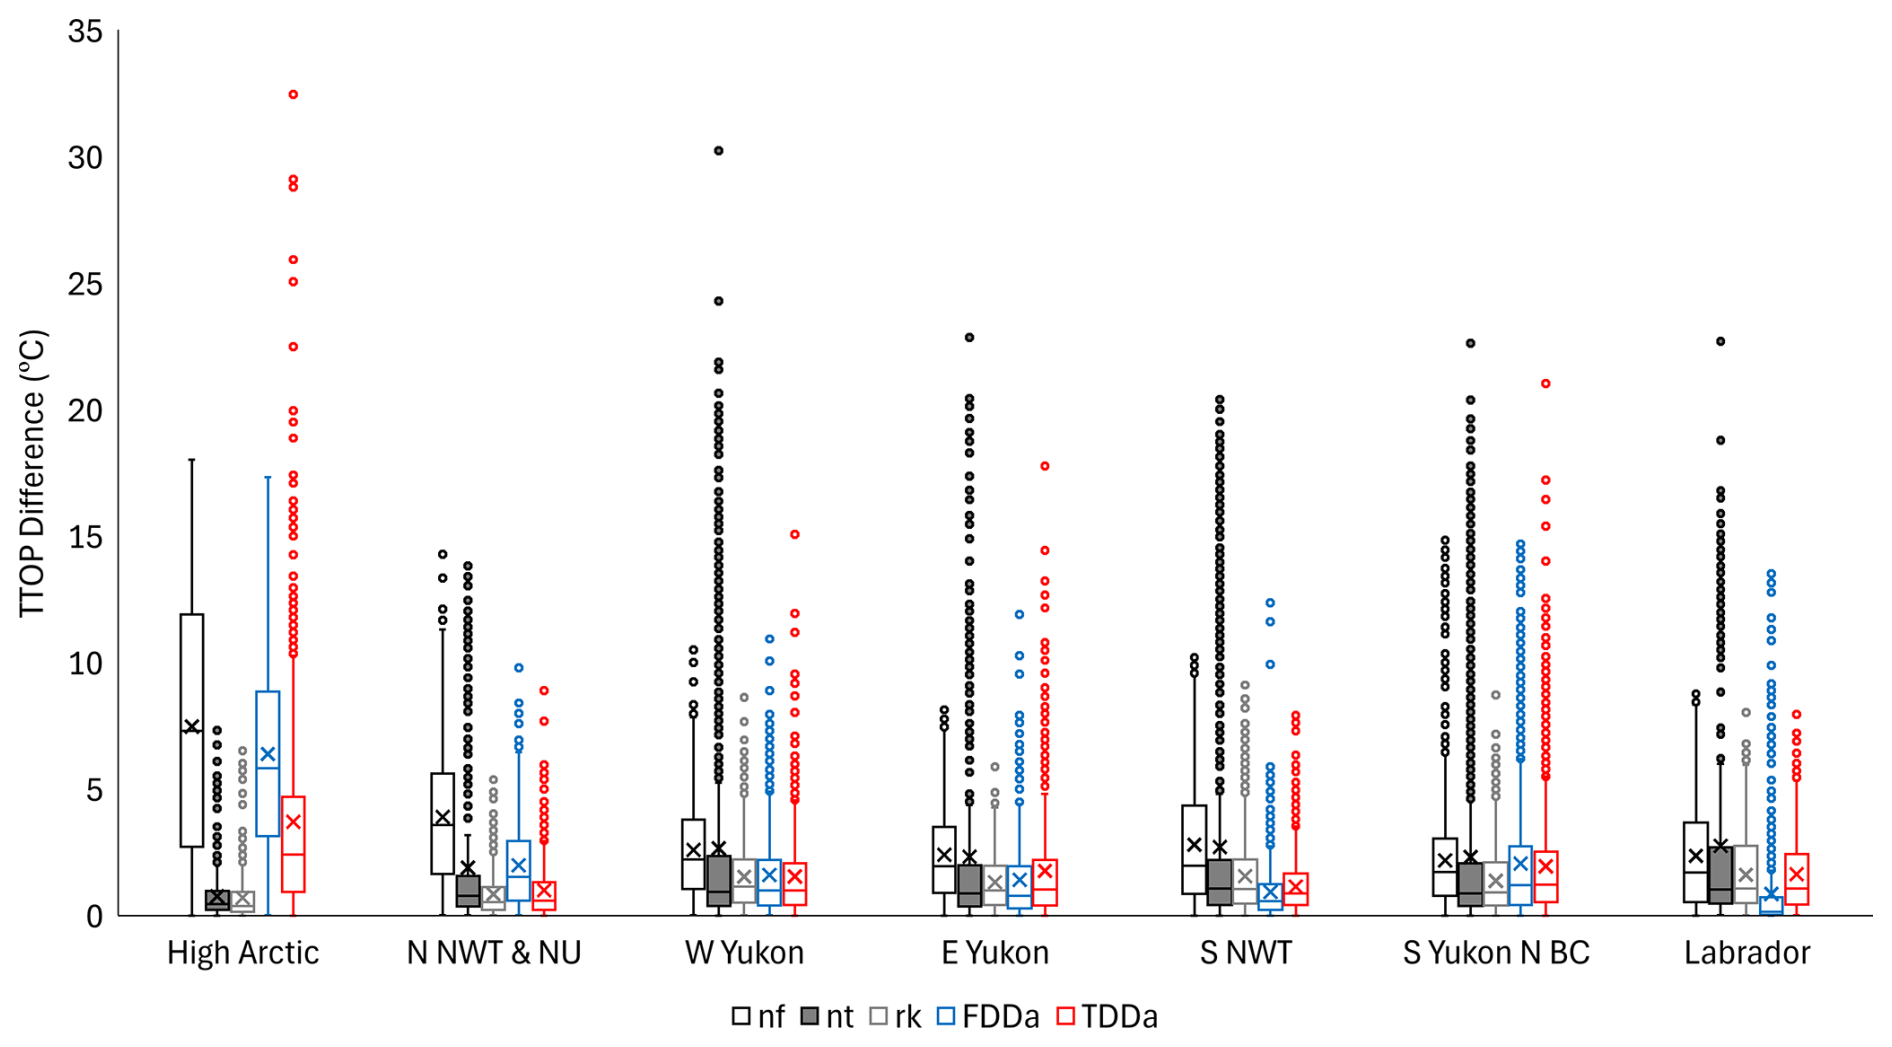
Figure 3Boxplots for the regional absolute difference between the reference TTOP and TTOP calculated when parameters were directly substituted to a percentile value. Mean values are represented by an X, outliers are shown as circles, and the ends of the whiskers show the value for one and a half times the interquartile range. The ends of the box show the first (25 %) and third (75 %) quartiles and the black line within the box shows the median.
Using the internal median parameter value (based on measured values for each landcover class within each region) resulted in a lower error than using the external median parameter value for every region and landcover class (Fig. 4). These differences were especially pronounced for nf. For each region the shrub landcover class showed the least difference when using the internal vs. external parameters.
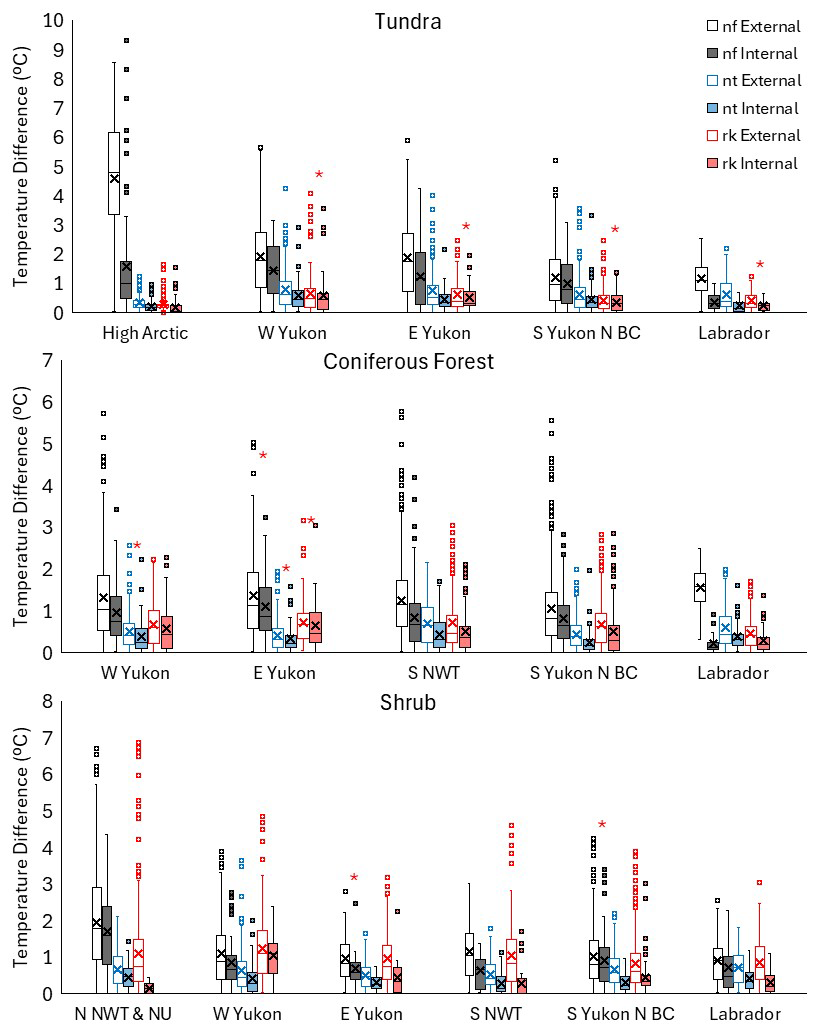
Figure 4Boxplots for the difference between the measured ground temperature and the TTOP model using the internal parameter value (median value for the landcover type within the region) and the external parameter value (median value for the landcover type outside the region). Red asterisk (*) indicates the difference resulting from using the internal and external parameter value was not significant (P > 0.05). Mean values are represented by an X, outliers are shown as circles, and the ends of the whiskers show the value for one and a half times the interquartile range. The ends of the box show the first (25 %) and third (75 %) quartiles and the black line within the box shows the median.
3.2 Random Forest
For the random forest iterations 1 and 2 (Table 3), several parameters were consistently ranked as the most and least important by virtue of the percent increase in MSE (Fig. 5). When all variables were used within the entire dataset, TO, rk and FDDs were ranked as the most important. The least important were NVO, nt and TDDa. Regionally, freezing season parameters (FDDs and nf) and MAGST were consistently ranked as the most important parameters. Surprisingly, TDDs was ranked as highly important only in the High Arctic and Labrador.
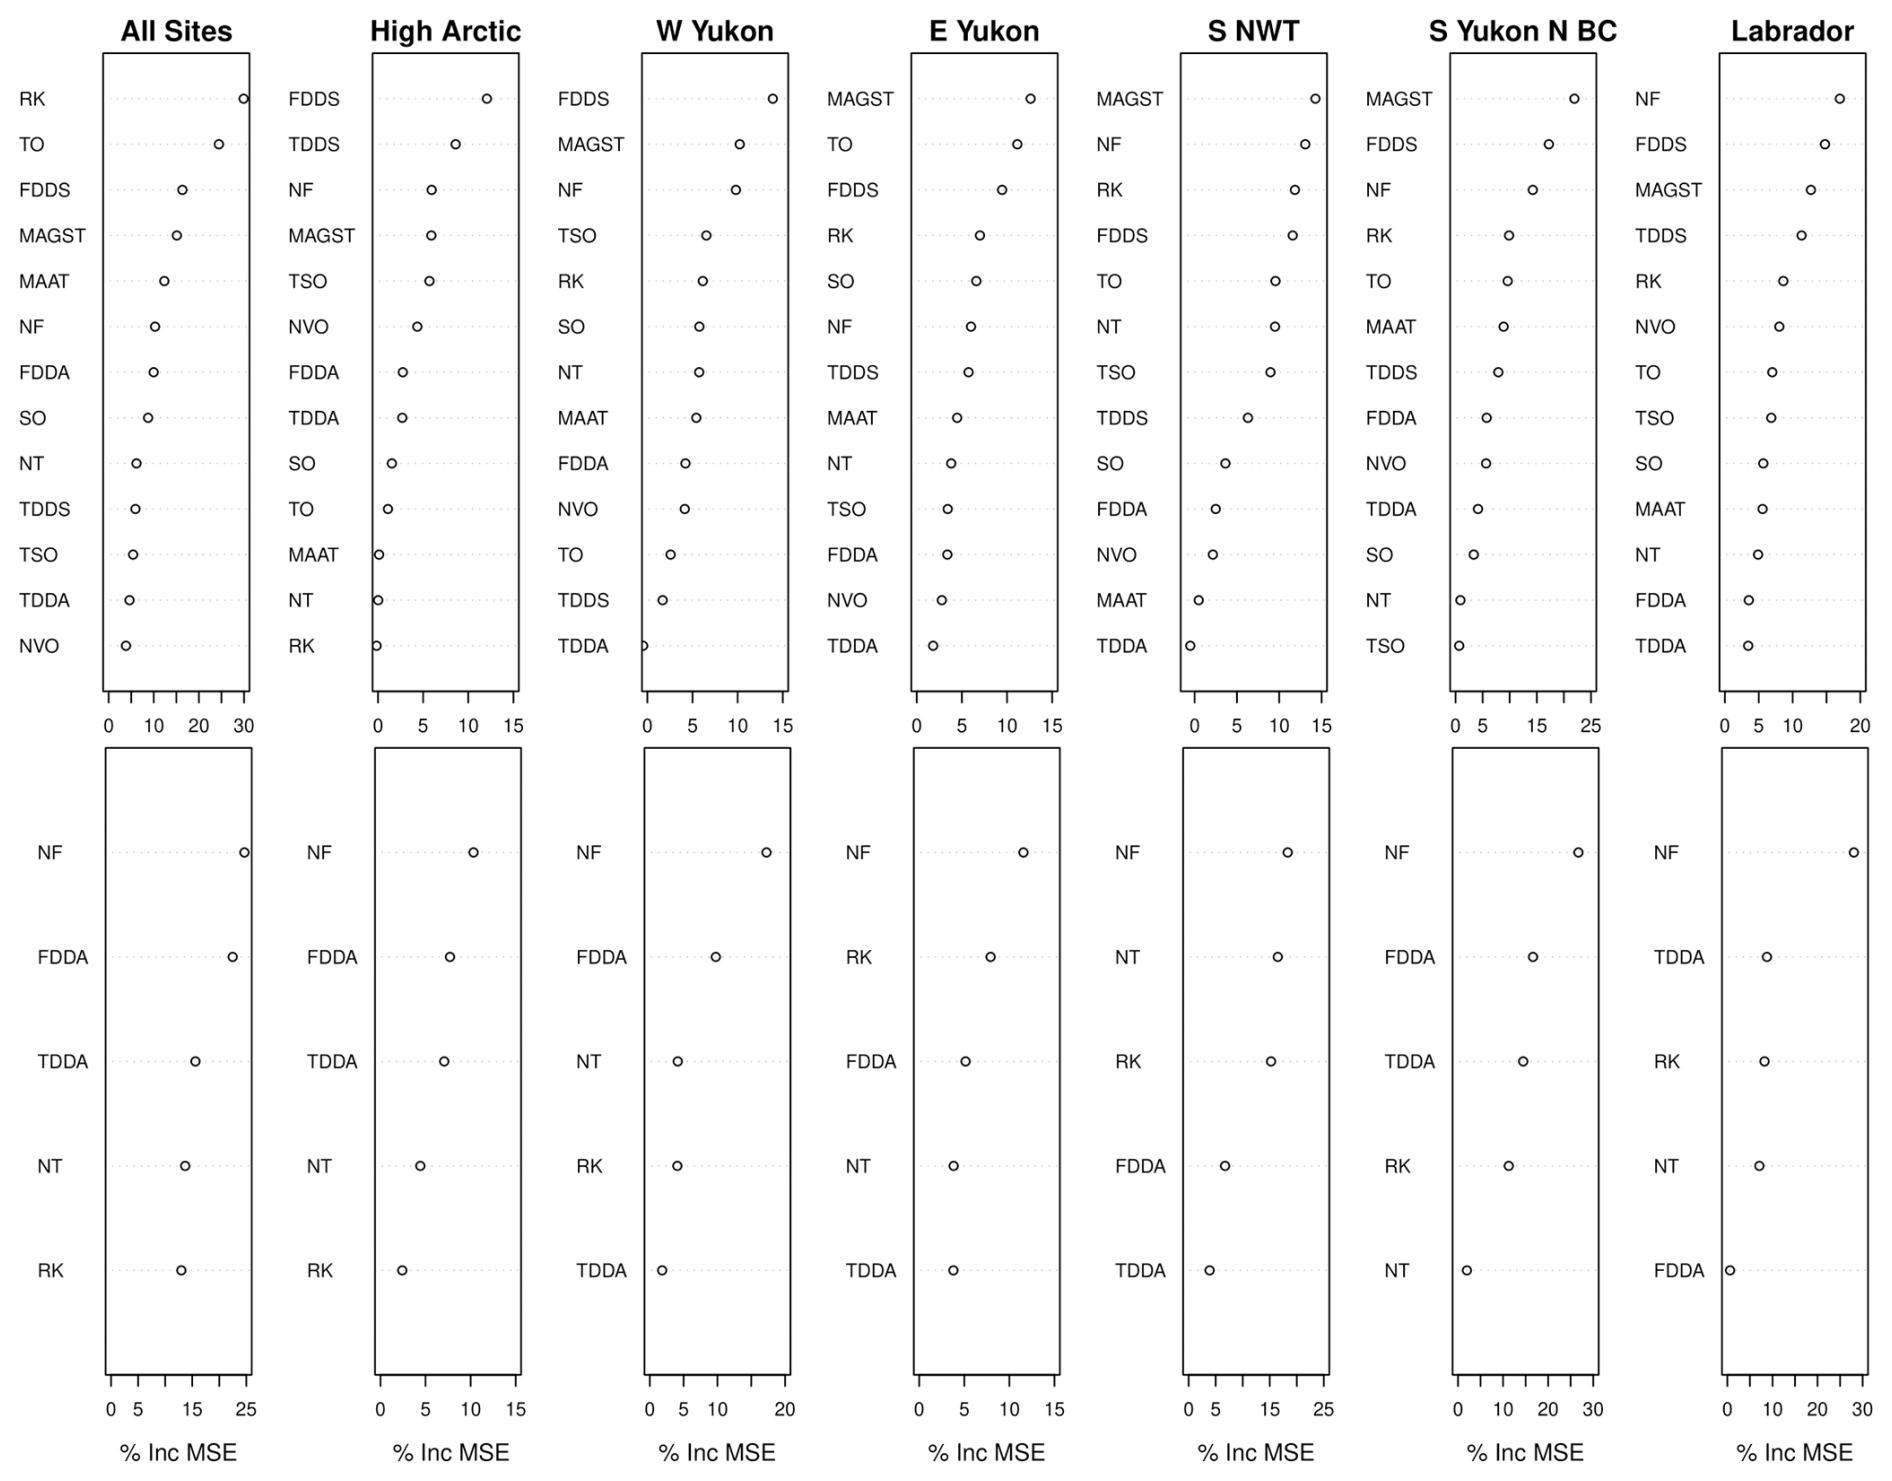
Figure 5Variable importance plots for random forest models run using all variables (top row) or only parameters used in the standard form of the TTOP model (bottom row) for all sites and individual regions.
When using only the TTOP model parameters, nf was ranked as the most important for every region, while nt, rk, and TDDa most often ranked lower in importance. TDDa was the second most important parameter for the High Arctic region but was not deemed to be of high importance for any other region. Overall, the variable importance rankings once again highlight the prominence of freezing season conditions compared to thawing.
3.3 Random Forest Variable Importance Rankings Compared to TTOP Sensitivity Results
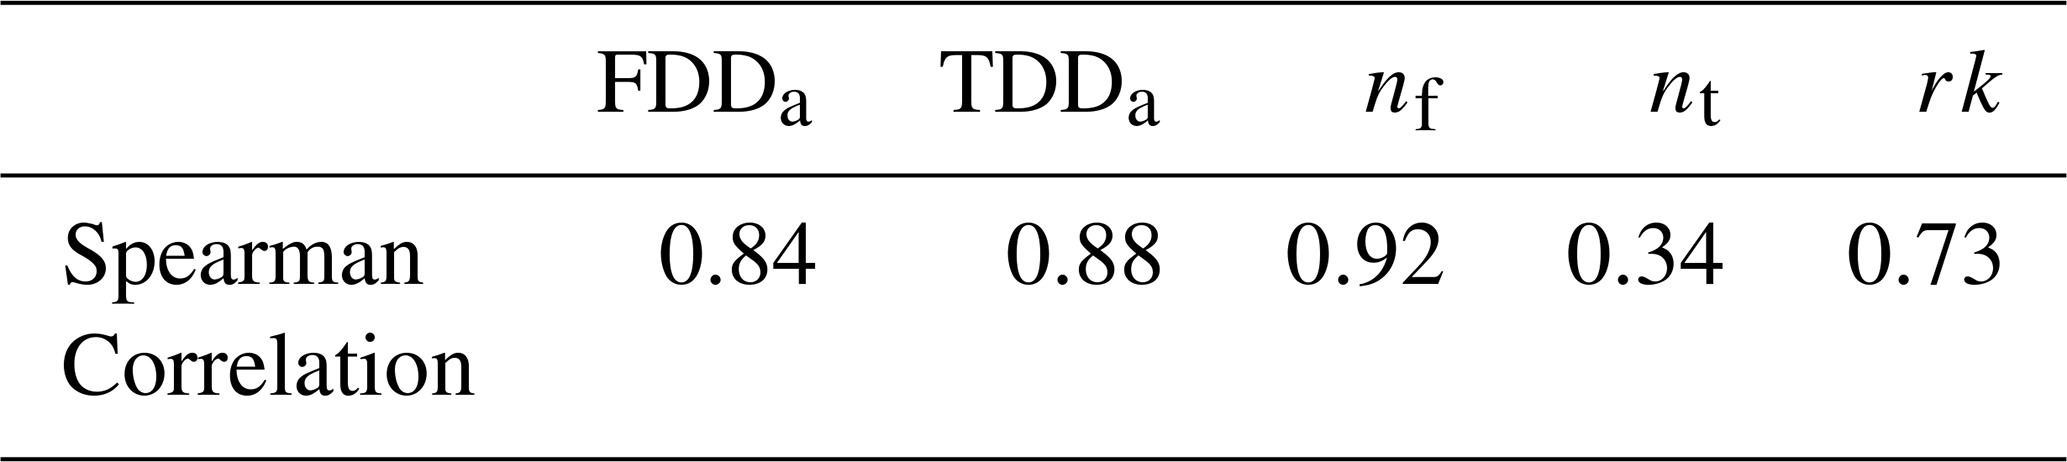
The variable importance conclusions from the TTOP sensitivity and random forest using only the TTOP parameters did not match perfectly, but there were commonalities for certain parameters. When comparing parameter rankings between the TTOP sensitivity analysis and random forest all but nt showed strong correlation (Table 6). Both analyses highlighted the importance of the freezing parameters (especially nf) which had the highest (almost perfect) correlation. There were greater discrepancies in parameter importance rankings, particularly for nt and rk which had the lowest correlations, especially nt which was the only parameter to have a weak ranking correlation. Despite the methodological differences between the two analyses, the parameter ranking showed good agreement, capturing the trends in the overall and regional differences in parameter importance.
Table 6Spearman correlation between the parameter importance rankings for the TTOP sensitivity analysis and the random forest.
3.4 TTOP Model Performance
The TTOP model performed well compared to the observed AMGT overall with an RMSE of 0.2 °C, but with regional differences in model performance (Fig. 6). The model also has a slight warm bias (0.02 °C) and a high r2 (0.99). Model error was low in most regions, except for the High Arctic. However, the Southern NWT region included an outlier with a large error.
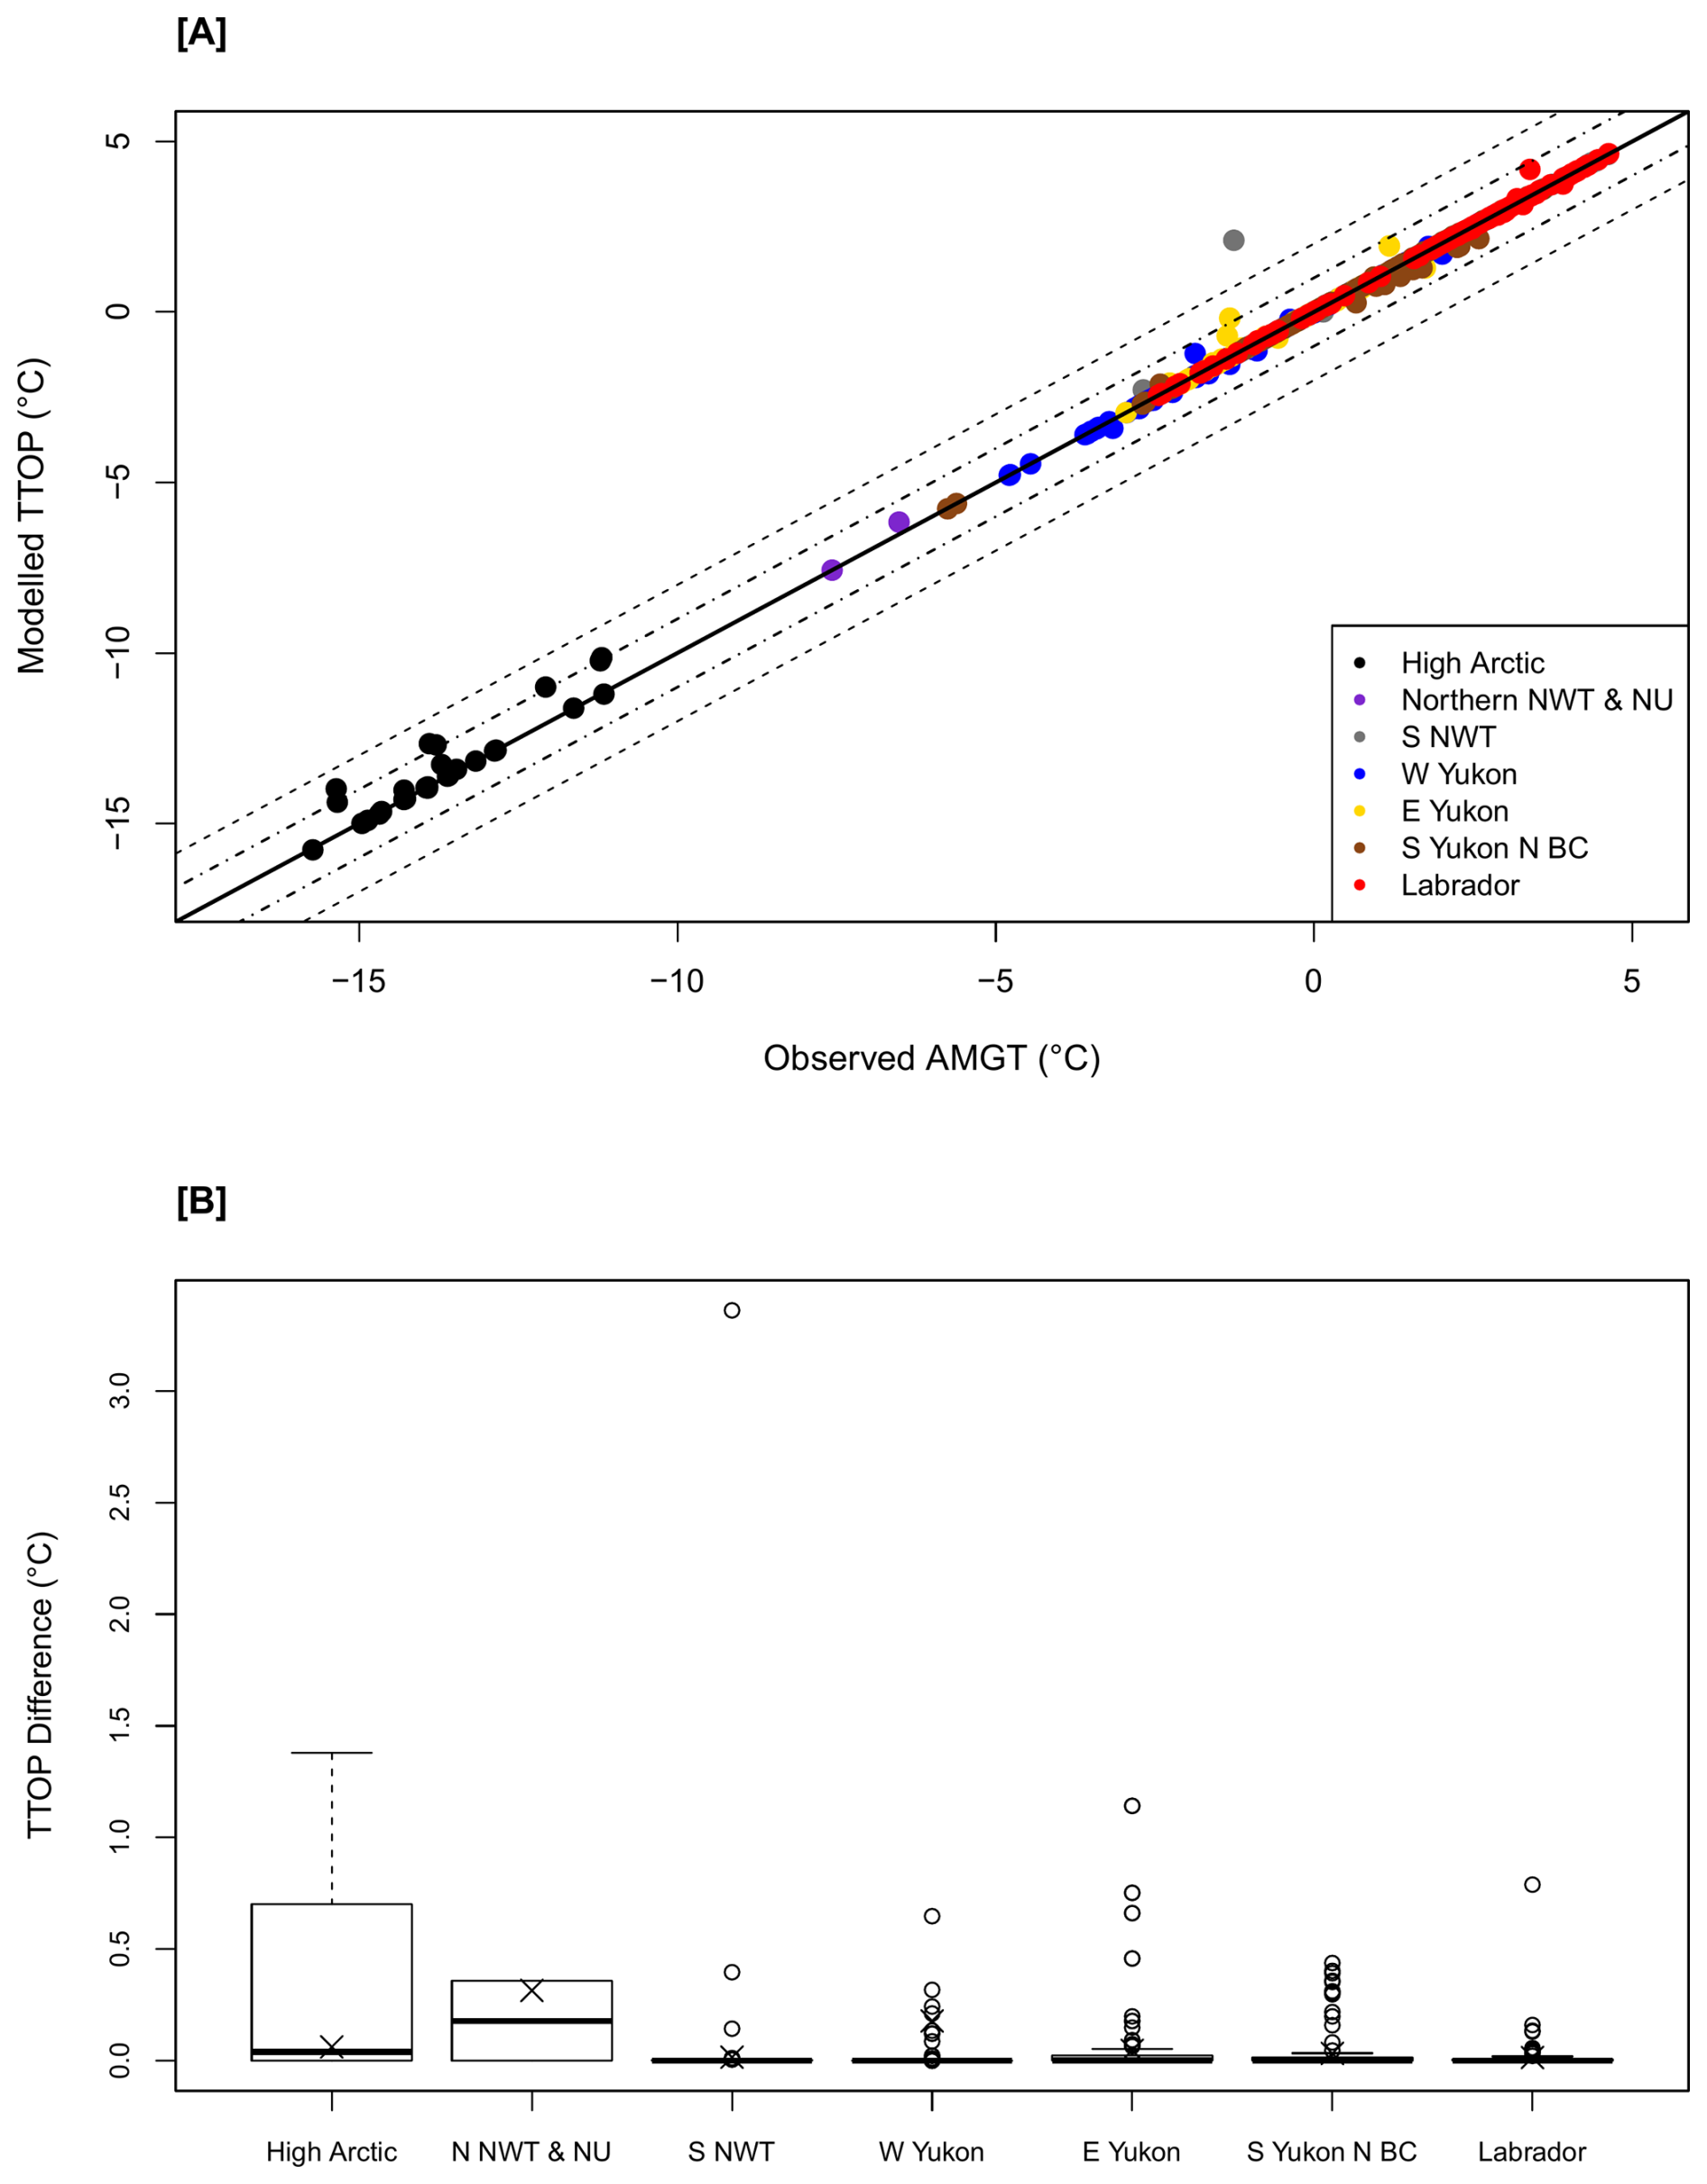
Figure 6[A] Comparison of TTOP model outputs to the measured annual mean ground temperature (AMGT). The solid line in panel [A] is the 1 : 1 relation between modelled and observed while the dashed lines indicate 1 and 2 °C differences. [B] Boxplots for the absolute difference between the modelled TTOP and the measured AMGT close to the frost table across the entire study area and for individual regions. Mean values are represented by an X, outliers are shown as circles, and the ends of the whiskers show the value for one and a half times the interquartile range. The ends of the box show the first (25 %) and third (75 %) quartiles and the black line within the box shows the median.
Additionally, the model only misclassified permafrost presence (TTOP < 0 °C) or absence (TTOP > 0 °C) at 3 of the 612 observations. Two of the three observations were in the Southern Yukon-Northern BC region both of which were false positives for permafrost (no permafrost in observation but negative modelled temperature). The third observation was in the SNWT region where permafrost was observed but the model indicated its absence.
4.1 TTOP Model Parameter Sensitivity
The sensitivity of the TTOP model to changes in specific parameters is affected by the structure of the model and the values of the parameters. The model across all regions was most sensitive to changes in nf, due to the higher number of FDDa (compared to TDDa), which amplified the response to changes (Smith and Riseborough, 1996, 2002; Bevington and Lewkowicz, 2015). Additionally, nf represents the impact of freezing season air temperature and snow depth which has an important influence on the ground thermal regime and therefore permafrost occurrence in the discontinuous zone (Riseborough and Smith ,1998; Smith and Riseborough, 2002, Gisnås et al., 2014; Way and Lapalme, 2021; Tutton et al., 2021; von Oppen et al., 2022). Therefore, it is unsurprising that it was consistently ranked as an important parameter.
Regionally, the sensitivity of the model to changes in the thawing parameters, especially TDDa and nt increased southward as the difference between FDDa and TDDa decreased. The exception to this was the High Arctic, where the model was disproportionately sensitive to changes in TDDa despite the large contrast in the number of FDDa and TDDa in this region (up to five times as many FDDa as TDDa). The increased sensitivity to changes in TDDa likely results from the high values of nt and rk, with values regularly approaching or exceeding 1.0. As a result, changes in TDDa were amplified in this region. This also potentially highlights the sensitivity of this region to changes in summer climate as the lack of tall vegetation reduces the potential buffering effect of warmer temperatures on the ground thermal regime compared to other regions with more well-developed surface cover (Shur and Jorgenson, 2007; Throop et al., 2012; Smith et al., 2022).
It is also important to note this study perturbed TTOP model parameters using the entire measured dataset. Therefore, sensitivity to certain parameters may be higher than for studies with altered parameters based on values measured within a region which may have limited variability (Way and Lewkowicz, 2018). As a result, our results may highlight relatively higher sensitivity for different parameters such as nt compared to nf in Labrador (Way and Lewkowicz, 2018). However, the sensitivity and random forest analysis results also agreed with variable importance rankings overall across northern Canada, especially regarding the importance of nf (Bevington and Lewkowicz, 2015; Colyn et al., 2025).
The sensitivity analysis also showed that TTOP model parameters are not necessarily transferable between regions with the same landcover class. This is especially true for nf and nt as using the median values for the same landcover class from a different region resulted in a significantly greater error than using the median value corresponding to the site's actual region. This could be a result of the large range of environments sampled in this analysis as previous studies have shown transferability of nt between rock and forest landcovers of Labrador and Southern Yukon (Way and Lewkowicz, 2018). However, utilizing nf from Southern Yukon in Labrador increased TTOP model errors (Way and Lewkowicz, 2016), which supports our findings. The lack of transferability of nf likely stems from differences in snow depth and density across Canada (Bormann et al., 2013; Way and Lewkowicz, 2016; Simpson et al., 2022). As a result, utilizing snow redistribution algorithms are likely a more viable way to accurately capture permafrost presence and temperature on national and circumpolar scales (Gisnås et al., 2014; L'Hérault et al., 2017; Obu et al., 2019). However, using landcover as a proxy even when parameter values were outside of the region still resulted in a smaller error range than when values from the entire dataset (regardless of landcover type) were used.
Rk appears to be generally more transferable, especially for the limited number of tundra sites which might be the result of restricted soil (and organic) development and moisture in this landcover (Throop et al., 2012). Additionally, rk may have a smaller influence on ground temperature in certain environments (Karjalainen et al., 2019) and therefore the importance (or lack of transferability) may be masked by the large dataset. These results demonstrate the need for caution in assuming the regional transferability of parameters, especially in environments where values may differ substantially.
4.2 Random Forest Variable Importance Rankings
The variable importance rankings for the overall and regional datasets were a product of differences in values of the measured field inputs. TO and rk were ranked as the most important parameters when all variables were used. TO has previously been suggested as the most important parameter for determining the southern extent of permafrost, under equilibrium conditions, as a high TO can protect permafrost from higher air temperatures (Smith and Riseborough, 2002). However, neither were ranked as the most important parameters in any of the regional analyses. TO and rk had lower correlation with the other parameters (0.06–0.49), which may have artificially elevated their importance, but they are highly correlated with each other (0.93) which may explain why both have elevated importance (Fig. S4).
NVO has also been highlighted in the literature as an important parameter, determining the northern and southern limit of discontinuous permafrost and influencing permafrost existence within the discontinuous zone (Nicholson and Granberg, 1973; Smith and Riseborough, 2002). However, in this study NVO ranked as middle to low importance overall and for every region, even those spanning the continuous to discontinuous permafrost transition. Finally, overall and regionally, MAGST was deemed to be an important parameter for accurate predictions of MAGT. While this may be true for sites with a negligible thermal offset (Luo et al., 2019; Garibaldi et al., 2021), MAGST alone cannot accurately predict the thermal state of permafrost without additional information on the thermal properties, especially at sites with larger thermal offsets (James et al., 2013; Guo et al., 2024; Brown and Gruber, 2025). Therefore, the elevated importance of this parameter may indicate that sites with small thermal offsets are over-represented in the dataset (Fig. S3c).
4.3 TTOP model performance
The TTOP model generally performed well compared to observed AMGT, resulting in minimal errors in predicted TTOP even at seasonally frozen sites. The RMSE for the TTOP model for this study was similar to or smaller than those from previous TTOP modelling results in the same region (Obu et al., 2019; Garibaldi et al., 2021). This is likely a product of the use of directly measured and calculated input parameters rather than the characterization of parameters from environmental variables such as vegetation or spatial interpolation. This highlights the importance of in situ data for validation of parameters for accurate predictions of permafrost and ground temperatures.
The TTOP model did not perform as well in the High Arctic for certain observations, especially those from Cape Bounty during 2016–2017, when the predicted TTOP was higher than the observed values. The AMGST for 2016–2017 was substantially higher than those from the previous years. Although the AMAT showed only a slight deviation, nf at these sites decreased substantially, indicating greater snow depths. As a result, the TTOP model parameters were not in equilibrium with ground temperature for this year, yielding a larger discrepancy. Additionally, one year at one site in the Southern NWT region was also an outlier. At this site the relatively warm ground conditions during the freezing season led to a low nf (0.1) during this year compared to the other 12 years (0.46 on average). However, despite the warm winter conditions the annual mean ground temperature remained comparable to the other years, only increasing slightly. As a result, the TTOP model produced a larger error for this site during this year but produced low error at this location for the remaining years.
The TTOP model using measured parameters performed surprisingly well in locations of warmer, more marginal permafrost or locations with seasonal frost, despite these locations potentially being in disequilibrium with the current climate. However, these regions, also showed slightly increased error and more outliers (Fig. 6a, b) reflecting a lack of consistency in model performance. These results may indicate sites with more ecosystem-protected permafrost and high apparent TOs or disequilibrium conditions (Shur and Jorgenson, 2007; James et al., 2013; Vegter et al., 2024). It should be noted that even small temperature errors can result in the misclassification of permafrost presence where ground temperatures are close to 0 °C (Daly et al., 2022; Vegter et al., 2024) whereas the classification would be unaffected even with a larger temperature error in the High Arctic. However, the model accurately predicted permafrost presence or absence for the vast majority of observations (> 98 %) in this study even though 38 % of observations were within −1 to +1 °C.
4.4 Sources of Uncertainty
The methods used to rank the importance of variables have their own uncertainties that could affect the reliability of the results. First, since the percentiles were derived from the observed data the range of values for each parameter differed and would vary if a different dataset was used. Second, although random forest is able to cope with highly correlated variables for prediction (Boulesteix et al., 2012), there are conflicting conclusions on the reliability of variable importance rankings (Strobl and Zeileis, 2008; Nicodemus et al., 2010; Tolosi and Lengauer, 2011; Gregorutti et al., 2017). For this study, a majority of the input parameters are highly correlated with at least one other parameter as some parameters are used to derive others (Figs. S4–6). This may have led the variable importance rankings of the random forest to be unreliable when all parameters where used. Additionally, although the random forest model using all variables performed relatively well (MSE 0.2 °C; variance explained 98 %), the regional models had lower percentages of variance explained (43 %–93 %) even though MSE was similar (0.2–0.8 °C). This may have impacted the reliability of the variable importance rankings for these models, as they may have accurately predicted ground temperature. Finally, it is important to note that due to the nature of random forest, the variable importance rankings are not perfectly repeatable. However, in several random forest runs the most important and least important parameters were consistent even if they were not in the exact same order each time. Despite the possible errors and uncertainty in the results of this, the variable importance analyses were in general agreement for the two methods and supported findings from previous studies.
Variation in variable importance rankings between the two methods may also have resulted from the difference in approaches. As the TTOP model utilized multiplicative factors, the importance of the parameters was elevated by nature of the model equation. For example, changes to FDDa may be elevated through multiplication with nf. The random forest variable importance ranking was not dependent on this equation and as a result, the importance was potentially different based on the predictive method alone. Additionally, the TTOP model sensitivity analysis was determined through perturbation of the model parameters, thereby ranking the parameters' importance based on the response. Contrastingly, the random forest variable importance ranking was determined based on the current thermal conditions. This may also have resulted in some discrepancy in the rankings. However, both methods showed similar rankings and regional trends overall. Lastly, parameters sensitivity rankings do not inherently relate to statistical importance. TTOP model sensitivity to changes in a parameter value may not be statistically different from the sensitivity to changes in another (Table 5). This is especially true for certain regions (N NWT and NU and the more southern regions), where there are few statistically different sensitivities between parameters.
4.5 Parameter classification recommendations
Since the TTOP model was deemed more sensitive to certain model parameters in the entire dataset and in certain regions, accurate parameterization of the most important variables for the study location is vital. Overall, the freezing season parameters were generally deemed the most important; therefore, adequate characterization is essential for accurate predictions of TTOP at national or circumpolar scales. This is especially true for nf which is typically the most difficult to parameterize since it is dependent on a wide range of conditions including timing, depth, and morphology of snow and substrate conditions including soil moisture and is not necessarily transferable between regions (Smith and Riseborough, 2002; Zhang, 2005; Throop et al., 2012; Way and Lewkowicz, 2016).
Regionally, in locations where FDDa ≫ TDDa, the impact of inadequate characterization of nt and rk, was shown to be minimal. Therefore, more general assumptions and classifications will not result in a substantial increase in uncertainty and greater focus should be put on accurate characterization of FDDa and nf. In locations where FDDa and TDDa are similar (i.e., AMAT is close to 0 °C), the sensitivity of the model to changes in thawing parameters is elevated and accurate characterization of nt and rk becomes more important. For several continental and circumpolar modelling studies, a uniform value of 1.0 was utilized as the input for nt across the study area (Henry and Smith, 2001; Obu et al., 2019). While this assumption is unlikely to increase uncertainty in areas above treeline and tundra it is likely to result in errors in boreal forested areas due to the elevated importance of nt in this landcover. Additionally, nf and to some extent nt varied regionally even within the same landcover type due to microclimatic differences, vegetation and wind exposure, which influence both summer and winter conditions (Smith and Riseborough, 2002). As such regional transferability of these parameters between regions may be limited especially over large geographic and climatological gradients.
Finally, many studies that determine TTOP characterize rk using vegetation, assigning values between 0.0 and 1.0 (Smith and Riseborough, 1996; Riseborough and Smith, 1998; Way and Lewkowicz, 2016; Obu et al., 2019; Garibaldi et al., 2021). However, recent studies (including the data analyzed for this study) have shown rk values exceeding 1.0 (Bevington and Lewkowicz, 2015; Lin et al., 2015; Zou et al., 2017). This likely occurs as a product of extremely dry conditions in winter and higher soil moisture during summer, resulting in greater thermal conductivity in the warm season. This is typically observed at sites with rocky or bedrock substrates and limited vegetation cover and soil moisture (Lin et al., 2015; Luo et al., 2018). In southern permafrost environments, the assumption of rk < 1 at these sites (such as high elevation rocky slopes, Fig. 2b) likely results in mischaracterization of the permafrost condition. The varying sensitivity of the TTOP model to specific parameters in different environments demonstrates the need for accurate parameterization and validation of TTOP model parameters to ensure valid outputs. This highlights the need for in situ parameter data to increase the accuracy of future TTOP modelling studies to validate remotely-derived parameter values.
The results of this analysis highlight the overall sensitivity of the TTOP model to changes in the freezing parameters (nf and FDDa) compared to the response to changes in the thawing parameters (nt, TDDa) and rk. Across all sites, regions, and perturbation methods, the model was most sensitive to changes in nf with 73 % of TTOP outputs changing by at least 1 °C from the original TTOP value followed by FDDa at 30 % changing by at least 2 °C. The model was least sensitive to changes in TDDa with only 22 % of TTOP model outputs exceeding 2 °C difference from the reference TTOP value, followed by nt and rk at 25 %. Differing sensitivity patterns emerged regionally, mainly showing the diminishing response to changes in nf and the increasing response to changes in TDDa, nt, and rk at more southerly sites, although sensitivity to changes in nf remained high.
The random forest variable importance rankings also highlighted the importance of the freezing season parameters using both a wide variety of temperature parameters and only those used in the standard form of the TTOP model. The increasing importance of the thawing and annual parameters moving south was also shown. Although the random forest variable importance rankings showed some differences from the TTOP sensitivity results, potentially due to high correlation between variables, they indicated similar regional trends in variable importance.
The results of this study highlight the importance of correct parameterization, specifically of the freezing parameters in small-scale national or circumpolar modelling studies, and the increased importance of parameterization of the thawing parameters in locations where the magnitude of FDDa and TDDa are similar. Although these conclusions had been theorized, a robust network of in situ data provided essential empirical support. Ultimately, the findings of this study will help future modelling studies determine parametrization allocation effort based on location and scale and may help explain sources of error and uncertainty in modelled results.
The R code and corresponding data for this study are available upon request to the corresponding author (madeleinegaribaldi9@gmail.com). A portion of the data is not currently publicly available. Without this data, the code consists of pre-existing plotting R packages.
The supplement related to this article is available online at https://doi.org/10.5194/tc-20-2375-2026-supplement.
MCG – Conceptualization, Data Curation, Formal Analysis, Investigation, Methodology, Visualization, Writing (original draft preparation). PPB – Conceptualization, Funding Acquisition, Investigation, Methodology, Supervision, Writing (review and editing). RGW – Conceptualization, Funding Acquisition, Investigation, Methodology, Writing (review and editing). AB – Conceptualization, Investigation, Methodology, Writing (review and editing). SLS – Funding Acquisition, Investigation, Writing (review and editing). SFL – Funding Acquisition, Investigation, Writing (review and editing). JEH – Data Curation, Investigation, Writing (review and editing). AGL – Conceptualization, Funding Acquisition, Investigation, Methodology, Writing (review and editing). HA – Data Curation, Writing (review and editing).
The contact author has declared that none of the authors has any competing interests.
Publisher's note: Copernicus Publications remains neutral with regard to jurisdictional claims made in the text, published maps, institutional affiliations, or any other geographical representation in this paper. The authors bear the ultimate responsibility for providing appropriate place names. Views expressed in the text are those of the authors and do not necessarily reflect the views of the publisher.
We acknowledge sites used in this research are located on the Akaitcho, Dehcho, Dënéndeh, Gwich'in, Gwich'in Nành, Hän, Inuit Nunangat, Inuvialuit, Kaska Dena Kayeh, Kluane, Kwanlin Dün, Metis, Na-cho Nyak Dun, Nitassinan, Nunatsiavut, Sahtu, Shita Got'ine, Tagé Cho Hudän, Tagish, Taku River Tlingit, Teslin Tlingit Council, Tr'ondëk Hwëch'in, Tłi̧cho̧ Ndè, Vunlut Gwich'in settlement regions and traditional territories. Logistic support was provided by Polar Continental Shelf Program and Aurora Research Institute. Data collection at Alert would not be possible without support from Environment and Climate Change Canada and Department of National Defence. We would also like to thank the numerous colleagues who have contributed to data collection over the years. Finally, we would like to thank HB O’Neill for review before submission.
This research has been supported by the Natural Sciences and Engineering Research Council of Canada (grant nos. RGPIN-2017-04096 and DDG-2024-00003), the Canada Research Chair Program (grant no. CRC-2023-00156), ArcticNet Inc, the Canadian Foundation for Innovation, the Government of the Northwest Territories, Natural Resources Canada, the Northern Scientific Training Program, Polar Knowledge Canada, Queen's University, the Royal Canadian Geographical Society, the University of Ottawa, the University of Lethbridge, and the W. Garfield Weston Foundation.
This paper was edited by Jeannette Noetzli and reviewed by two anonymous referees.
Ackerman, H.: Spatial modelling of monthly climate across mountainous terrain in southern Yukon and northern British Columbia, MSc thesis, University of Ottawa, https://doi.org/10.20381/ruor-28468, 2022.
Aylsworth, J. and Kettles, I.: The Physical Environment of the Mackenzie Valley, Northwest Territories: A Base Line for the Assessment of Environmental Change, Bull. Geol. Surv. Canada, 547, 49–55, 2000.
Behnia, P. and Blais-Stevens, A.: Landslide susceptibility modelling using the quantitative random forest method along the northern portion of the Yukon Alaska Highway Corridor, Canada, Nat. Hazards, 90, 1407–1426, 2018.
Bevington, A. and Lewkowicz, A. G.: Assessment of a land cover driven TTOP model for mountain and lowland permafrost using field data, southern Yukon and northern British Columbia, Canada, Proceedings of GEOQuébec: 68th Canadian Geotechnical Conference and 7th Canadian Permafrost Conference, Quebec City, Canada, Paper 724, https://members.cgs.ca/documents/conference2015/GeoQuebec/prof348.html (last access: July 2019), 2015.
Biau, G. and Scornet, E.: A random forest guided tour, TEST, 25, 197–227, https://doi.org/10.1007/s11749-016-0481-7, 2016.
Bormann, K. J., Westra, S., Evans, J. P., and McCabe, M. F.: Spatial and temporal variability in seasonal snow density, J. Hydrol., 484, 63–73, https://doi.org/10.1016/j.jhydrol.2013.01.032, 2013.
Boulesteix, A.-L., Janitza, S., Kruppa, J., and König, I. R.: Overview of random forest methodology and practical guidance with emphasis on computational biology and bioinformatics, WIREs Data Min. Knowl. Discov., 2, 493–507, https://doi.org/10.1002/widm.1072, 2012.
Breiman, L.: Random Forests, Mach. Learn. 45, 5–32, https://doi.org/10.1023/A:1010933404324, 2001.
Brown, J., Ferrians, O., Heginbottom, J. A., and Melnikov, E.: Circum-Arctic Map of Permafrost and Ground-Ice Conditions (GGD318, Version 2), [data set], National Snow and Ice Data Center, Boulder, Colorado, USA, https://doi.org/10.7265/skbg-kf16, 2002.
Brown, N. and Gruber, S.: Beyond MAGT: learning more from permafrost thermal monitoring data with additional metrics, EGUsphere [preprint], https://doi.org/10.5194/egusphere-2025-2658, 2025.
Colyn, V., Way, R., Wang, Y., Beer, J., Trant, A., Hermanutz, L., Forget, A., Tutton, R., Barone, K., Power, M., Fedder, L., Rendell, E., Gaul, N., and Le, N.: Investigating spatial variability of ground temperatures across coastal and continental highlands in Labrador, northeastern Canada, Arct. Sci., 11, 1–26, https://doi.org/10.1139/as-2024-0079, 2025.
Daly, S. V., Bonnaventure, P. P., and Kochtitzky, W.: Influence of ecosystem and disturbance on near-surface permafrost distribution, Whati, Northwest Territories, Canada, Permafr. Periglac. Process., 33, 339–352, https://doi.org/10.1002/ppp.2160, 2022.
Díaz-Uriarte, R. and Alvarez de Andrés, S.: Gene selection and classification of microarray data using random forest, BMC Bioinform., 7, 3, https://doi.org/10.1186/1471-2105-7-3, 2006.
Duchesne, C., Smith, S. L., Ednie, M., and Bonnaventure, P. P.: Active layer variability and change in the Mackenzie Valley, Northwest Territories, Proceedings of GEOQuébec: 68th Canadian Geotechnical Conference and 7th Canadian Permafrost Conference, Quebec City, Canada, Paper 67, https://members.cgs.ca/documents/conference2015/GeoQuebec/index.html (last access: January 2019), 2015.
Environment and Climate Change Canada: Environment Canada, Historical Data – Climate, Environment and Climate Change Canada [data set], https://climate.weather.gc.ca/historical_data/search_historic_data_e.html (last access: September 2024), 2021.
Forget, A., Way, R., Wang, Y., Beer, J., Colyn, V., Tutton, R., Trant, A., and Hermanutz, L.: Evaluating local drivers of ground surface temperature variability in coastal Labrador, Proceedings of the 12th International Conference on Permafrost, Canadian Permafrost Association, Whitehorse, Yukon, Canada, 94–102, https://doi.org/10.52381/ICOP2024.209.1, 2024.
Garibaldi, M. C., Bonnaventure, P. P., and Lamoureux, S. F.: Utilizing the TTOP model to understand spatial permafrost temperature variability in a High Arctic landscape, Cape Bounty, Nunavut, Canada, Permafr. Periglac. Process., 32, 19–34, https://doi.org/10.1002/ppp.2086, 2021.
Garibaldi, M. C., Bonnaventure, P. P., Noad, N. C., and Kochtitzky, W.: Modelling air, ground surface, and permafrost temperature variability across four dissimilar valleys, Yukon, Canada, Arct. Sci., 10, 611–629, https://doi.org/10.1139/as-2023-0067, 2024a.
Garibaldi, M. C., Bonnaventure, P. P., Noad, N. C., and Kochtitzky, W.: Exploring the impact of surface lapse rate change scenarios on mountain permafrost distribution in four dissimilar valleys in Yukon, Canada, Arctic Science, 10, 749–763, https://doi.org/10.1139/as-2023-0066, 2024b.
Genuer, R., Poggi, J.-M., and Tuleau-Malot, C.: Variable selection using random forests, Pattern Recognit. Lett., 31, 2225–2236, https://doi.org/10.1016/j.patrec.2010.03.014, 2010.
Gisnås, K., Etzelmüller, B., Farbrot, H., Schuler, T. V., and Westermann, S.: CryoGRID 1.0: Permafrost Distribution in Norway estimated by a Spatial Numerical Model, Permafr. Periglac. Process., 24, 2–19, https://doi.org/10.1002/ppp.1765, 2013.
Gisnås, K., Westermann, S., Schuler, T. V., Litherland, T., Isaksen, K., Boike, J., and Etzelmüller, B.: A statistical approach to represent small-scale variability of permafrost temperatures due to snow cover, The Cryosphere, 8, 2063–2074, https://doi.org/10.5194/tc-8-2063-2014, 2014.
Government of Canada: Provinces/Territories, Cartographic Boundary File – 2016 Census, Statistics Canada [data set], https://open.canada.ca/data/en/dataset/a883eb14-0c0e-45c4-b8c4-b54c4a819edb (last access: May 2019), 2016.
Government of Canada: Lakes, Rivers, and Glaciers in Canada – CanVec Series – Hydrographic Features, Natural Resources Canada [data set], https://open.canada.ca/data/en/dataset/9d96e8c9-22fe-4ad2-b5e8-94a6991b7446 (last access: May 2019), 2017.
Gregorutti, B., Michel, B., and Saint-Pierre, P.: Correlation and variable importance in random forests, Stat. Comput., 27, 659–678, https://doi.org/10.1007/s11222-016-9646-1, 2017.
Gregory, F. M.: Biophysical Remote Sensing and Terrestrial CO2 Exchange at Cape Bounty, Melville Island, MSc thesis, Department of Geography, Queen's University, http://hdl.handle.net/1974/6953 (last access: September 2017), 2011.
Grömping, U.: Variable Importance Assessment in Regression: Linear Regression versus Random Forest, Am. Stat., 63, 308–319, https://doi.org/10.1198/tast.2009.08199, 2009.
Guo, L., Ran, Y., Li, X., Jin, H. and Cheng, G.: Sensitivity of Permafrost Degradation to Geological and Climatic Conditions, Permafr. Periglac. Process., 35, 450–460, https://doi.org/10.1002/ppp.2245, 2024.
Heginbottom, J. A., Dubreuil, M. A., and Harker, P. A.: Canada, permafrost: National Atlas of Canada, MCR 4177 Canada Map Office, Contains information licensed under the Open Government Licence – Canada, 1995.
Henry, K. and Smith, M.: A model-based map of ground temperatures for the permafrost regions of Canada, Permafr. Periglac. Process., 12, 389–398, https://doi.org/10.1002/ppp.399, 2001.
Holloway, J.: Impacts of forest fire on permafrost in the discontinuous zones of northwestern Canada, PhD thesis, Université d'Ottawa/University of Ottawa, https://doi.org/10.20381/ruor-25410, 2020.
James, M., Lewkowicz, A. G., Smith, S. L., and Miceli, C. M.: Multi-decadal degradation and persistence of permafrost in the Alaska Highway corridor, northwest Canada, Environ. Res. Lett., 8, 045013, https://doi.org/10.1088/1748-9326/8/4/045013, 2013.
Juliussen, H. and Humlum, O.: Towards a TTOP ground temperature model for mountainous terrain in central-eastern Norway, Permafr. Periglac. Process., 18, 161–184, https://doi.org/10.1002/ppp.586, 2007.
Kääb, A.: Remote sensing of permafrost‐related problems and hazards. Permafrost Periglac., 19, 107–136, https://doi.org/10.1002/ppp.619, 2008.
Karjalainen, O., Luoto, M., Aalto, J., and Hjort, J.: New insights into the environmental factors controlling the ground thermal regime across the Northern Hemisphere: a comparison between permafrost and non-permafrost areas, The Cryosphere, 13, 693–707, https://doi.org/10.5194/tc-13-693-2019, 2019.
Kersten, M. S.: Laboratory research for the determination of the thermal properties of soils, Technical Report 23, Research Laboratory Investigations, Eng. Experiment Station, University of Minnesota, Minneapolis, https://hdl.handle.net/11681/6576 (last access: March 2018), 1949.
Lafrenière, M. J. and Lamoureux, S. F.: Effects of changing permafrost conditions on hydrological processes and fluvial fluxes, Earth-Sci. Rev., 191, 212–223, https://doi.org/10.1016/j.earscirev.2019.02.018, 2019.
Lewkowicz, A. G.: Archiving University of Ottawa northern climate data, Report to Department of Environment and Natural Resources, Government of the Northwest Territories, 2021.
Lewkowicz, A. G., Bonnaventure, P. P., Smith, S. L., and Kuntz, Z.: Spatial and thermal characteristics of mountain permafrost, northwest Canada, Geogr. Ann. A, 94, 195–213, https://doi.org/10.1111/j.1468-0459.2012.00462.x, 2012.
Lin, Z., Burn, C. R., Niu, F., Luo, J., Liu, M., and Yin, G.: The Thermal Regime, including a Reversed Thermal Offset, of Arid Permafrost Sites with Variations in Vegetation Cover Density, Wudaoliang Basin, Qinghai-Tibet Plateau, Permafr. Periglac. Process., 26, 142–159, https://doi.org/10.1002/ppp.1840, 2015.
Luo, D., Jin, H., Wu, Q., Bense, V. F., He, R., Ma, Q., Gao., S., Jin, X., and Lü, L.: Thermal regime of warm-dry permafrost in relation to ground surface temperature in the Source Areas of the Yangtze and Yellow rivers on the Qinghai-Tibet Plateau, SW China, Sci. Total Environ., 618, 1033–1045, https://doi.org/10.1016/j.scitotenv.2017.09.083, 2018.
Luo, D., Jin, H., and Bense, V. F.: Ground surface temperature and the detection of permafrost in the rugged topography on NE Qinghai-Tibet Plateau, Geoderma, 333, 57–68, https://doi.org/10.1016/j.geoderma.2018.07.011, 2019.
L'Hérault, E., Boisson, A., Allard, M., Aubé-Maurice, S., Sarrazin, D., Roger, J., and Barrette, C.: Détermination et analyse des vulnérabilités du Nunavik en fonction des composantes environnementales et des processus physique naturels liés au climate: Phase 1, Rapport produit pour le compte du Ministère des Forêts, de la Faune et des Parcs. Université Laval, Québec City, Canada, 2017.
Medeiros, A. S., Friel, C. E., Finkelstein, S. A., and Quinlan, R.: A high resolution multi-proxy record of pronounced recent environmental change at Baker Lake, Nunavut, J. Paleolimnol., 47, 661–676, https://doi.org/10.1007/s10933-012-9589-2, 2012.
Meloche, J., Langlois, A., Rutter, N., McLennan, D., Royer, A., Billecocq, P., and Ponomarenko, S.: High-resolution snow depth prediction using Random Forest algorithm with topographic parameters: A case study in the Greiner watershed, Nunavut, Hydrol. Process., 36, e14546, https://doi.org/10.1002/hyp.14546, 2022.
Miner, K. R., Turetsky, M. R., Malina, E., Bartsch, A., Tamminen, J., McGuire, A. D., Fix, A., Sweeney, C., Elder, C. D., and Miller, C. E.: Permafrost carbon emissions in a changing Arctic, Nat. Rev. Earth Environ., 3, 55–67, https://doi.org/10.1038/s43017-021-00230-3, 2022.
Nicholson, F. H. and Granberg, H. B: Permafrost and snow cover relationships near Schefferville, Proceedings of the Second International Conference on Permafrost, North American Contribution, National Academy of Sciences, Washington, DC, 151–158, 1973.
Nicodemus, K. K., Malley, J. D., Strobl, C., and Ziegler, A.: The behaviour of random forest permutation-based variable importance measures under predictor correlation, BMC Bioinform., 11, 110, https://doi.org/10.1186/1471-2105-11-110, 2010.
Obu, J., Westermann, S., Bartsch, A., Berdnikov, N., Christiansen, H. H., Dashtseren, A., Delaloye, R., Elberling, B., Etzelmüller, B., Kholodov, A., Khomutov, A., Kääb, A., Leibman, M. O., Lewkowicz, A. G., Panda, S. K., Romanovsky, V., Way, R. G., Westergaard-Nielsen, A., Wu, T., Yamkhin, J., and Zou, D.: Northern Hemisphere permafrost map based on TTOP modelling for 2000–2016 at 1-km2 scale, Earth-Sci. Rev., 193, 299–316, https://doi.org/10.1016/j.earscirev.2019.04.023, 2019.
O'Neill, H. B., Smith, S. L., Burn, C. R., Duchesne, C., and Zhang, Y.: Widespread permafrost degradation and thaw subsidence in northwest Canada, J. Geophys. Res. Earth Surf., 128, e2023JF007262, https://doi.org/10.1029/2023JF007262, 2023.
Riseborough, D.: The effect of transient conditions on an equilibrium permafrost-climate model, Permafr. Periglac. Process., 18, 21–32, https://doi.org/10.1002/ppp.579, 2007.
Riseborough, D. W.: Exploring the parameters of a simple model of the permafrost-climate relationship, PhD thesis, Carleton University, 2004.
Riseborough, D. and Smith, M.: Exploring the limits of permafrost, Proceedings Permafrost: 7th International Conference, Yellowknife, Canada, edited by: Lewkowicz, A. G., and Allard, M., Nordicana, 54, 935–941, 1998.
Riseborough, D., Shiklomanov, N., Etzelmüller, B., Gruber, S., and Marchenko, S.: Recent advances in permafrost modelling, Permafr. Periglac. Process., 19, 137–156, https://doi.org/10.1002/ppp.615, 2008.
Roberts, K. E., Lamoureux, S. F., Kyser, T. K., Muir, D. C. G., Lafrenière, M. J., Iqaluk, D., Pieńkowski, A. J., and Normandeau, A.: Climate and permafrost effects on the chemistry and ecosystems of High Arctic Lakes, Sci. Rep., 7, 13292, https://doi.org/10.1038/s41598-017-13658-9, 2017.
Romanovsky, V., Isaksen, K., Drozdov, D., Anisimov, O., Instanes, A., Leibman, M., McGuire, A. D., Shiklomanov, N., Smith, S., and Walker, D.: Changing permafrost and its impacts, in: Snow, Water, Ice and Permafrost in the Arctic (SWIPA) 2017, Arctic Monitoring and Assessment Program (AMAP) Oslo, Norway, 65–102, ISBN 978-82-7971-101-8, https://www.amap.no/documents/doc/snow-water-ice-and-permafrost-in-the-arctic-swipa-2017/1610 (last access: May 2019), 2017.
Shur, Y. L. and Jorgenson, M. T.: Patterns of permafrost formation and degradation in relation to climate and ecosystems, Permafr. Periglac. Process., 18, 7–19, https://doi.org/10.1002/ppp.582, 2007.
Simpson, I. R., Lawrence, D. M., Swenson, S. C., Hannay, C., McKinnon, K. A., and Truesdale, J. E.: Improvements in wintertime surface temperature variability in the Community Earth System Model version 2 (CESM2) related to the representation of snow density, J. Adv. Model. Earth Syst., 14, https://doi.org/10.1029/2021MS002880, 2022.
Smith, M. W. and Riseborough, D. W.: Permafrost monitoring and detection of climate change, Permafr. Periglac. Process., 7, 301–309, https://doi.org/10.1002/(SICI)1099-1530(199610)7:4<301::AID-PPP231>3.0.CO;2-R, 1996.
Smith, M. W. and Riseborough, D. W.: Climate and the limits of permafrost: a zonal analysis, Permafr. Periglac. Process., 13, 1–15, https://doi.org/10.1002/ppp.410, 2002.
Smith, S. L., Wolfe, S. A., Riseborough, D. W., and Nixon, F. M.: Active-layer characteristics and summer climatic indices, Mackenzie Valley, Northwest Territories, Canada, Permafr. Periglac. Process., 20, 201–220, https://doi.org/10.1002/ppp.651, 2009.
Smith, S. L., O'Neill, H. B., Isaksen, K., Noetzli, J., and Romanovsky, V. E.: The changing thermal state of permafrost, Nat. Rev. Earth Environ., 3, 10–23, https://doi.org/10.1038/s43017-021-00240-1, 2022.
Stanek, W., Alexander, K., and Simmons, C. S.: Reconnaissance of vegetation and soils along the Dempster Highway, Yukon Territory: 1. Vegetation types, Report Pacific Forest Research Centre (Canada), no. BC-X-217, 1980.
Strobl, C. and Zeileis, A.: Danger: High power! – exploring the statistical properties of a test for random forest variable importance, COMPSTAT 2008: Proc. Comput. Stat., II, 59–66, 2008.
Strobl, C., Boulesteix, A.-L., Kneib, T., Augustin, T., and Zeileis, A.: Conditional variable importance for random forests, BMC Bioinform., 9, 307, https://doi.org/10.1186/1471-2105-9-307, 2008.
Throop, J., Lewkowicz, A. G., and Smith, S. L.: Climate and ground temperature relations at sites across the continuous and discontinuous permafrost zones, northern Canada, Can. J. Earth Sci., 49, 865–876, https://doi.org/10.1139/e11-075, 2012.
Tolosi, L. and Lengauer, T.: Classification with correlated features: unreliability of feature ranking and solutions, Bioinformatics, 27, 1986–1994, https://doi.org/10.1093/bioinformatics/btr300, 2011.
Tutton, R. J., Way, R. G., Beddoe, R., Zhang, Y., and Trant, A. J.: Soil temperature sensitivity to variable snow and vegetation conditions in low-relief coastal mountains, Nunatsiavut and NunatuKavut, Labrador, in: Proceedings of the 2021 Regional Conference on Permafrost and 19th International Conference on Cold Regions Engineering, American Society of Civil Engineers, Boulder, Colorado, USA, 71–81, https://doi.org/10.1061/9780784483589.007, 2021.
Vegter, S., Bonnaventure, P. P., Daly, S., and Kochtitzky, W.: Modelling Permafrost Distribution using the Temperature at Top of Permafrost Model in the Boreal Forest Environment of Whatì, NT, Arct. Sci., 10, 455–475, https://doi.org/10.1139/as-2023-0010, 2024.
von Oppen, J., Assman, J. J., Bjorkman, A. D., Treier, U. A., Elberling, B., Nabe-Nielsen, J., and Normand, S.: Cross-scale regulation of seasonal microclimate by vegetation and snow in the Arctic tundra, Glob. Change Biol., 28, 7296–7312, https://doi.org/10.1111/gcb.16426, 2022.
Way, R. G. and Lapalme, C. M.: Does tall vegetation warm or cool the ground surface? Constraining the ground thermal impacts of upright vegetation in northern environments, Environ. Res. Lett., 16, 054077, https://doi.org/10.1088/1748-9326/abef31, 2021.
Way, R. G. and Lewkowicz, A. G.: Modelling the spatial distribution of permafrost in Labrador–Ungava using the temperature at the top of permafrost, Can. J. Earth Sci., 53, 1010–1028, https://doi.org/10.1139/cjes-2016-0034, 2016.
Way, R. G. and Lewkowicz, A. G.: Environmental controls on ground temperature and permafrost in Labrador, northeast Canada, Permafr. Periglac. Process., 29, 73–85, https://doi.org/10.1002/ppp.1972, 2018.
Zhang, T.: Influence of the seasonal snow cover on the ground thermal regime: An overview, Rev. Geophys., 43, https://doi.org/10.1029/2004RG000157, 2005.
Zou, D., Zhao, L., Sheng, Y., Chen, J., Hu, G., Wu, T., Wu, J., Xie, C., Wu, X., Pang, Q., Wang, W., Du, E., Li, W., Liu, G., Li, J., Qin, Y., Qiao, Y., Wang, Z., Shi, J., and Cheng, G.: A new map of permafrost distribution on the Tibetan Plateau, The Cryosphere, 11, 2527–2542, https://doi.org/10.5194/tc-11-2527-2017, 2017.