the Creative Commons Attribution 4.0 License.
the Creative Commons Attribution 4.0 License.
 | 23 Apr 2026
Assessment of snow model uncertainty in relation to the effect of a 1 °C warming using the snow modelling framework openAMUNDSEN
Brage Storebakken
Michael Warscher
Florian Hanzer
Elena Bertazza
Ulrich Strasser
Novel climate model data at the kilometer-scale, innovative downscaling techniques, sophisticated snow modelling frameworks, and increasing computational capacities are among the elements currently paving the way for a new phase in high resolution and physically based climate impact studies on snow hydrology in complex mountain terrain. While the assessment of climate model uncertainty is well established, the uncertainty arising from snow model selection typically receives far less attention. To investigate the uncertainty induced by the selection of the snow model configuration, we simulate the seasonal snow cover in the complex mountain area of the Berchtesgaden National Park mountains (Germany) under historical conditions (October 2013–September 2023) and for a 10 year period characterized by a 1 °C warming, using a large number of openAMUNDSEN snow model configurations (n=108) with degree-day as well as physically based snowmelt methods and varying land cover maps and spatial resolutions. The analysis of the resulting snow cover durations and snow disappearance days indicates that differences due to the choice of snowmelt method, land cover map and spatial resolution can be comparable in magnitude to the effect of a 1 °C warming, with uncertainties particularly pronounced in the forested areas and in the high elevations of the study area. Our results support the identification of critical snow model settings that need careful consideration, especially when employing energy balance instead of degree-day snow models to investigate climate change impacts on snow hydrology in complex mountain terrain.
- Article
(15213 KB) - Full-text XML
- BibTeX
- EndNote


Climatic changes are expected to strongly affect the build-up and melt of seasonal snow covers in mountain regions. Because snow cover regulates the seasonal rhythm of mountain ecosystems and represents a key component of the hydrological cycle, a detailed knowledge of its past, current and future state is of great significance (Gobiet et al., 2014; Beniston et al., 2018; Matiu et al., 2021; Rumpf et al., 2022; Kotlarski et al., 2023; Vormoor et al., 2025). In addition to in-situ observations and remote sensing data, snow models are often used to assess the current state of the snow cover and the effects of climatic changes. Such impacts of climatic changes are typically evaluated by forcing the snow-hydrological models with bias adjusted scenario data from ensembles of climate models (e.g. Bürger et al., 2011; Marke et al., 2015; Vormoor et al., 2015; Muelchi et al., 2021). Thereby, empirical snow models using degree day factors (DDFs) are often used in climate change impact studies because they require little input data and are computationally very efficient. These temperature index (T-Index) approaches are typically optimized using seasonally and/or spatially varying DDFs (Hock, 2003; Zhou et al., 2021). Hanus et al. (2021), for example, use a semi-distributed hydrological model with an improved degree-day method including a seasonally variable DDF (Girons Lopez et al., 2020) to assess runoff changes in Alpine catchments in Austria. In the SNOWGRID-CL model, which was applied to the Ötztal Alps (Austria) presented in the climate change impact study by Kotlarski et al. (2023), an extended degree-day approach that accounts for air temperature and shortwave radiation was used (Olefs et al., 2020). The degree-day approach is also utilized in the semi-distributed HBV model (Bergström, 1995; Seibert and Bergström, 2022) or in the GR models (Coron et al., 2017) (e.g. Vormoor et al., 2015; Adhikari et al., 2022; Dakhlaoui et al., 2022; Ten Berge et al., 2025). To better describe rain-on-snow events, the mesoscale Hydrological model (mHM), which has been applied to assess changes in low flows and river floods at different warming levels (Thober et al., 2018; Marx et al., 2018; Rottler et al., 2021), accounts for energy input from liquid rain; DDFs are thereby increased depending on the amount of liquid precipitation (Samaniego et al., 2010).
In addition to degree-day approaches, energy balance based snow models, which explicitly represent the relevant energy and mass fluxes, are used to simulate the seasonal snow cover. These physically based modelling approaches require more input data and go along with a higher computational effort. Despite the increased complexity and effort, first studies have already employed energy balance based melt process description methods to assess the climate change impact on the seasonal snow cover. Hanzer et al. (2018), for example, use an energy balance based snowmelt modelling approach to assess cryospheric and hydrological impacts in the Ötztal Alps (Austria). They process an ensemble of climate model data using statistical bias correction methods as well as temporal disaggregation tools to conduct their energy balance based simulations. Marty et al. (2017) force the Alpine3D snow pack model with an ensemble of downscaled climate data for three emission scenarios in two Swiss catchments. A semi-distributed approach using representative elementary areas and the Crocus snow model (Brun et al., 2012; Vionnet et al., 2012) has been used to simulate the snow cover dynamics in French mountain massifs for historical conditions (Vernay et al., 2022) and to assess potential climate change impacts (Verfaillie et al., 2018; Kotlarski et al., 2023). A multi-physics ensemble approach for Crocus, which supports the representation of modelling errors, is presented in Lafaysse et al. (2017).
When designing a climate change impact study for complex mountain terrain, not only the selection of the snowmelt modelling method needs to be considered, also the need for lateral snow redistribution (Freudiger et al., 2017; Hanzer et al., 2016; Mott et al., 2018; Quéno et al., 2024) and snow-canopy processes (Pomeroy et al., 2012; Sun et al., 2022; Sanmiguel-Vallelado et al., 2022; Essery et al., 2025) have to be addressed. The selection of the model configuration should be tailored to the specific research goal. In practice, however, the data availability and computational resources are often limited. Currently, newly available ensembles of kilometer-scale climate data (e.g. Ban et al., 2021; Pichelli et al., 2021; Collier et al., 2024) are paving the way for a new generation of climate change impact studies in mountain areas. However, while the uncertainty in the climate scenario data is typically addressed using an ensemble of model runs, the snow model uncertainty receives only little attention. Further studies that quantify the effect of different snow model configurations are therefore required to support the development of robust modelling approaches for climate change impact studies in seasonally snow covered mountain areas.
In this study, we use the open source, intermediate complexity mountain snow model openAMUNDSEN (Strasser et al., 2024) to simulate the build-up and melt of the seasonal snow cover in the complex mountain terrain of the Berchtesgaden National Park (BGNP) under historical conditions (October 2013–September 2023) and for a 10 year period characterized by a 1 °C warming. The warming period is obtained using a stochastic block bootstrap resampler (climate generator), which is available as external pre-processing routine of openAMUNDSEN. We conduct snow simulations under historic and warming conditions using degree-day as well as energy balance based snow simulation routines, different land cover maps and grid geometries for the modelling with varying spatial resolutions (Fig. 1). For the historical period, model runs are evaluated against snow coverage maps derived from Sentinel-2 and MODIS data. For each model run, we calculate snow cover durations (SCDs) and snow disappearance days (SDDs) across the entire elevation range of the BGNP. Our main goal is to assess differences in the snow modelling results induced by different snow model configurations relative to the effect of a 1 °C warming. The results support the need for careful consideration in the choice of snow model type, input data, and spatial resolution. The simulated effects of a climate change signal need to be interpreted having these uncertainties in mind.
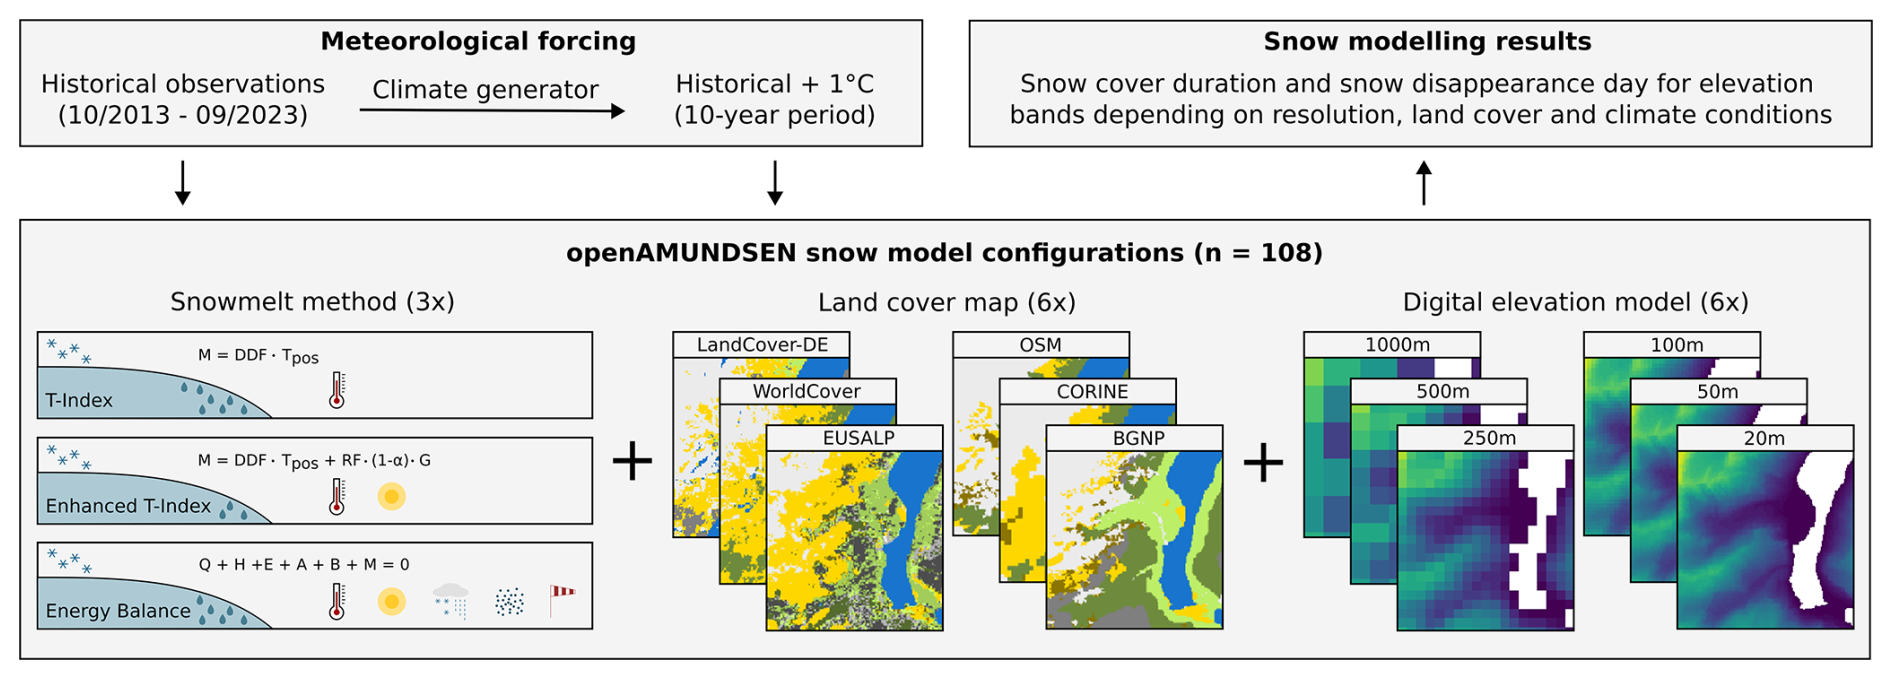
Figure 1Schematic overview of the modelling set-up illustrating the snow cover simulations conducted with the mountain snow model openAMUNDSEN for the BGNP area under historical and 1 °C warming conditions using different snowmelt simulation methods, land cover maps and spatial resolutions.
We identified the BGNP as an ideal study site for our snow modelling experiment. The BGNP covers an area of 208 km2 and is located in the state of Bavaria (Germany) in the North-East of the European Alps. It is the only German national park in the Alps and is characterized by a complex mountain landscape with an extreme topography covering elevations between 603–2713 m a.s.l. (meter above sea level) (Figs. 2 and 3). The open areas with bare rock and Alpine grassland in the higher elevations transition into coniferous, mixed and deciduous forest toward the lower elevations. Annual precipitation ranges from 1500 mm in the lower elevations to roughly 2600 mm in the peak regions, and the build-up and melt of a seasonal snow cover dominates the hydrology in the area (e.g. Strasser, 2008; Warscher et al., 2013; Storebakken et al., 2025). In cooperation with the Bavarian Avalanche Warning Service, the administration of the BGNP operates a dense network of automatic weather stations (AWSs) in the area. A detailed description of the station network including station names, locations, measured variables, example time series, and a description of the pre-processing of the AWS data is presented in Storebakken et al. (2025). The BGNP administration also provides a digital elevation model (DEM) in 10 m resolution, which we resample to resolutions between 20 and 1000 m (Fig. 3), and the BGNP habitat map (Fig. 2a). This habitat map was reclassified to seven classes, the three forest classes being the most important because forest types govern snow-canopy interactions and thus the entire seasonal dynamics of the snow cover in the forested areas. In addition to the BGNP land cover map, we process five other land cover maps for the area, all based on freely available and widely used datasets (Fig. 2b–f). Our aim is to capture the uncertainty that can be introduced into the distributed snow modelling with the selection of the land cover map. For comparability, we re-classify the data to similar land cover types. With regard to the forest representation, some data sources only have one forest class, whereas others distinguish different forest types and densities (Fig. 2). The land cover maps that we processed are based on the following data: (i) CORINE Land Cover 2018 obtained from the European Union's Copernicus Land Monitoring Service (https://doi.org/10.2909/960998c1-1870-4e82-8051-6485205ebbac, last access: 8 July 2025), (ii) OpenStreetMap (OSM) (https://www.openstreetmap.org/, last access: 8 July 2025), which we download using the R package “osmdata” (https://github.com/ropensci/osmdata, last access: 8 July 2025) (Padgham et al., 2017), (iii) WorldCover from the European Space Agency (ESA) (https://esa-worldcover.org/, last access; 8 July 2025) (Zanaga et al., 2022), (iv) Land Use/Cover Map for the European Alps developed by Marsoner et al. (2023) and (v) Land Cover Germany from the German Aerospace Agency (DLR) described in Weigand et al. (2020) (https://doi.org/10.15489/1ccmlap3mn39, last access: 7 July 2025).
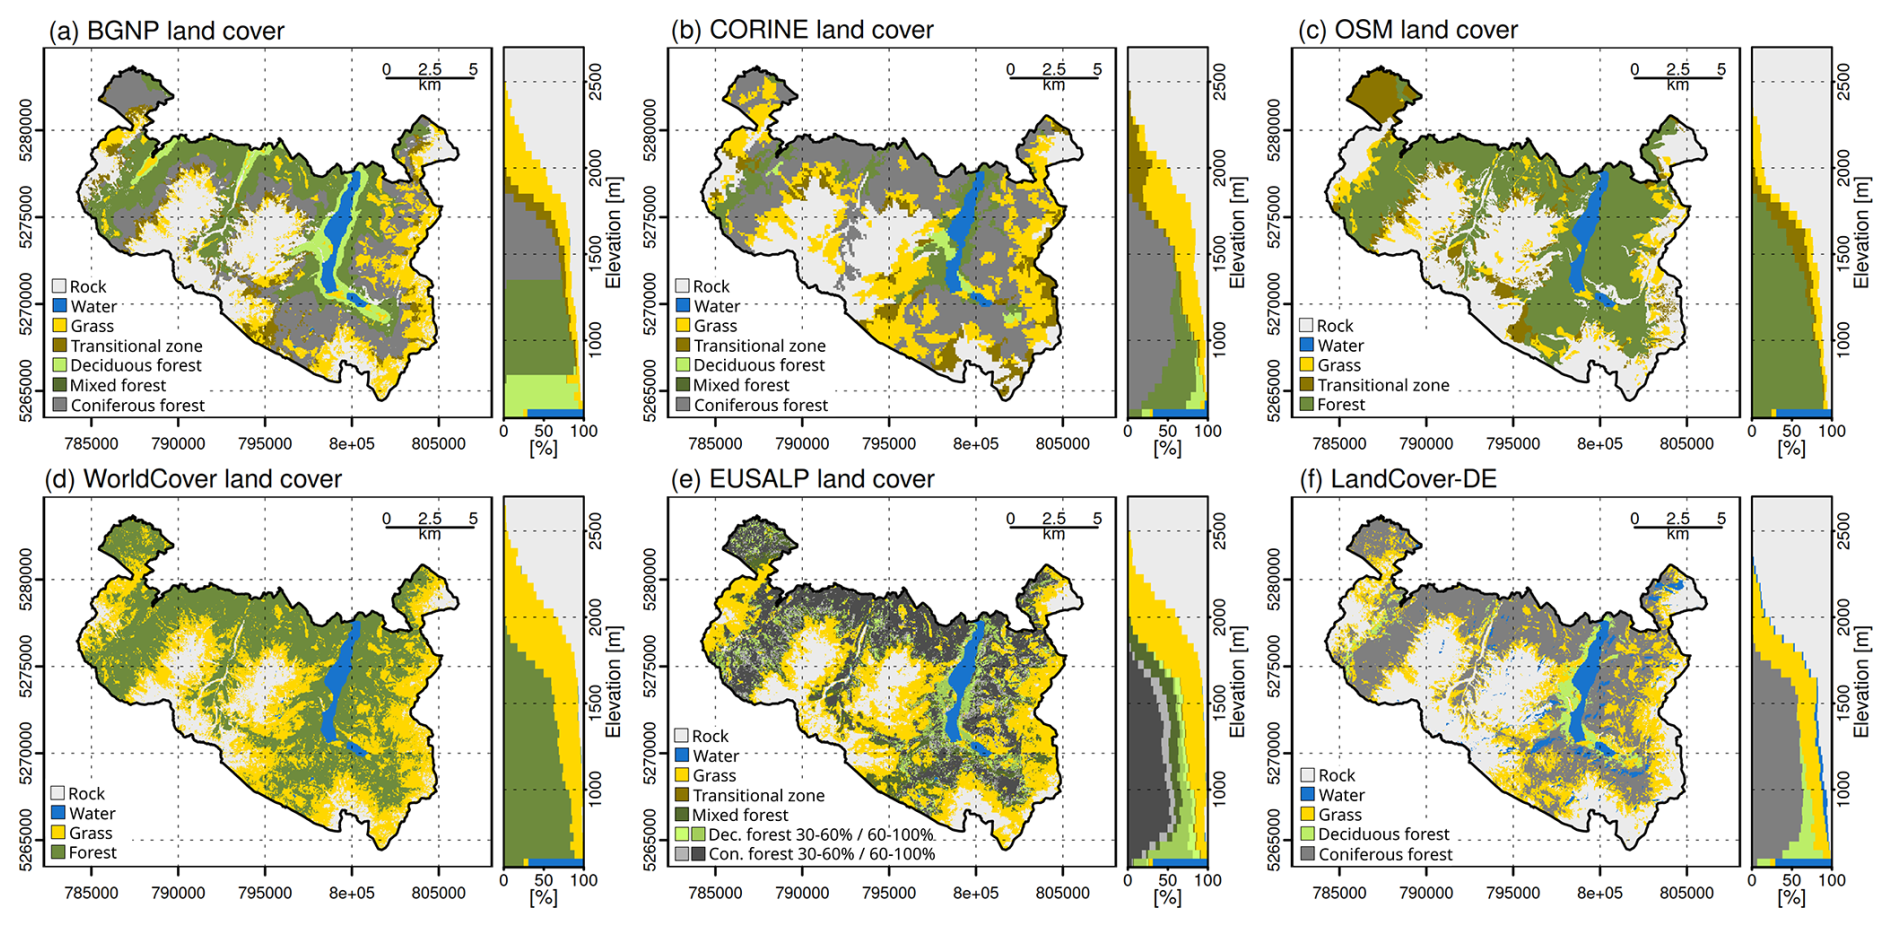
Figure 2Land cover maps for the BGNP based on the National Park habitat map (a; BGNP), CORINE land cover data (b; CORINE), OpenStreetMap data (c; OSM; https://www.openstreetmap.org/copyright, last access: 14 April 2026), ESA WorldCover data (d; WorldCover), the land use/land cover map for the European Alps developed by Marsoner et al. (2023) (e; EUSALP) and the Land Cover DE data from the German Aerospace Center (DLR) (f; LandCover-DE). The percentage coverage of each land cover class within 50 m elevation bands is shown right of each map.
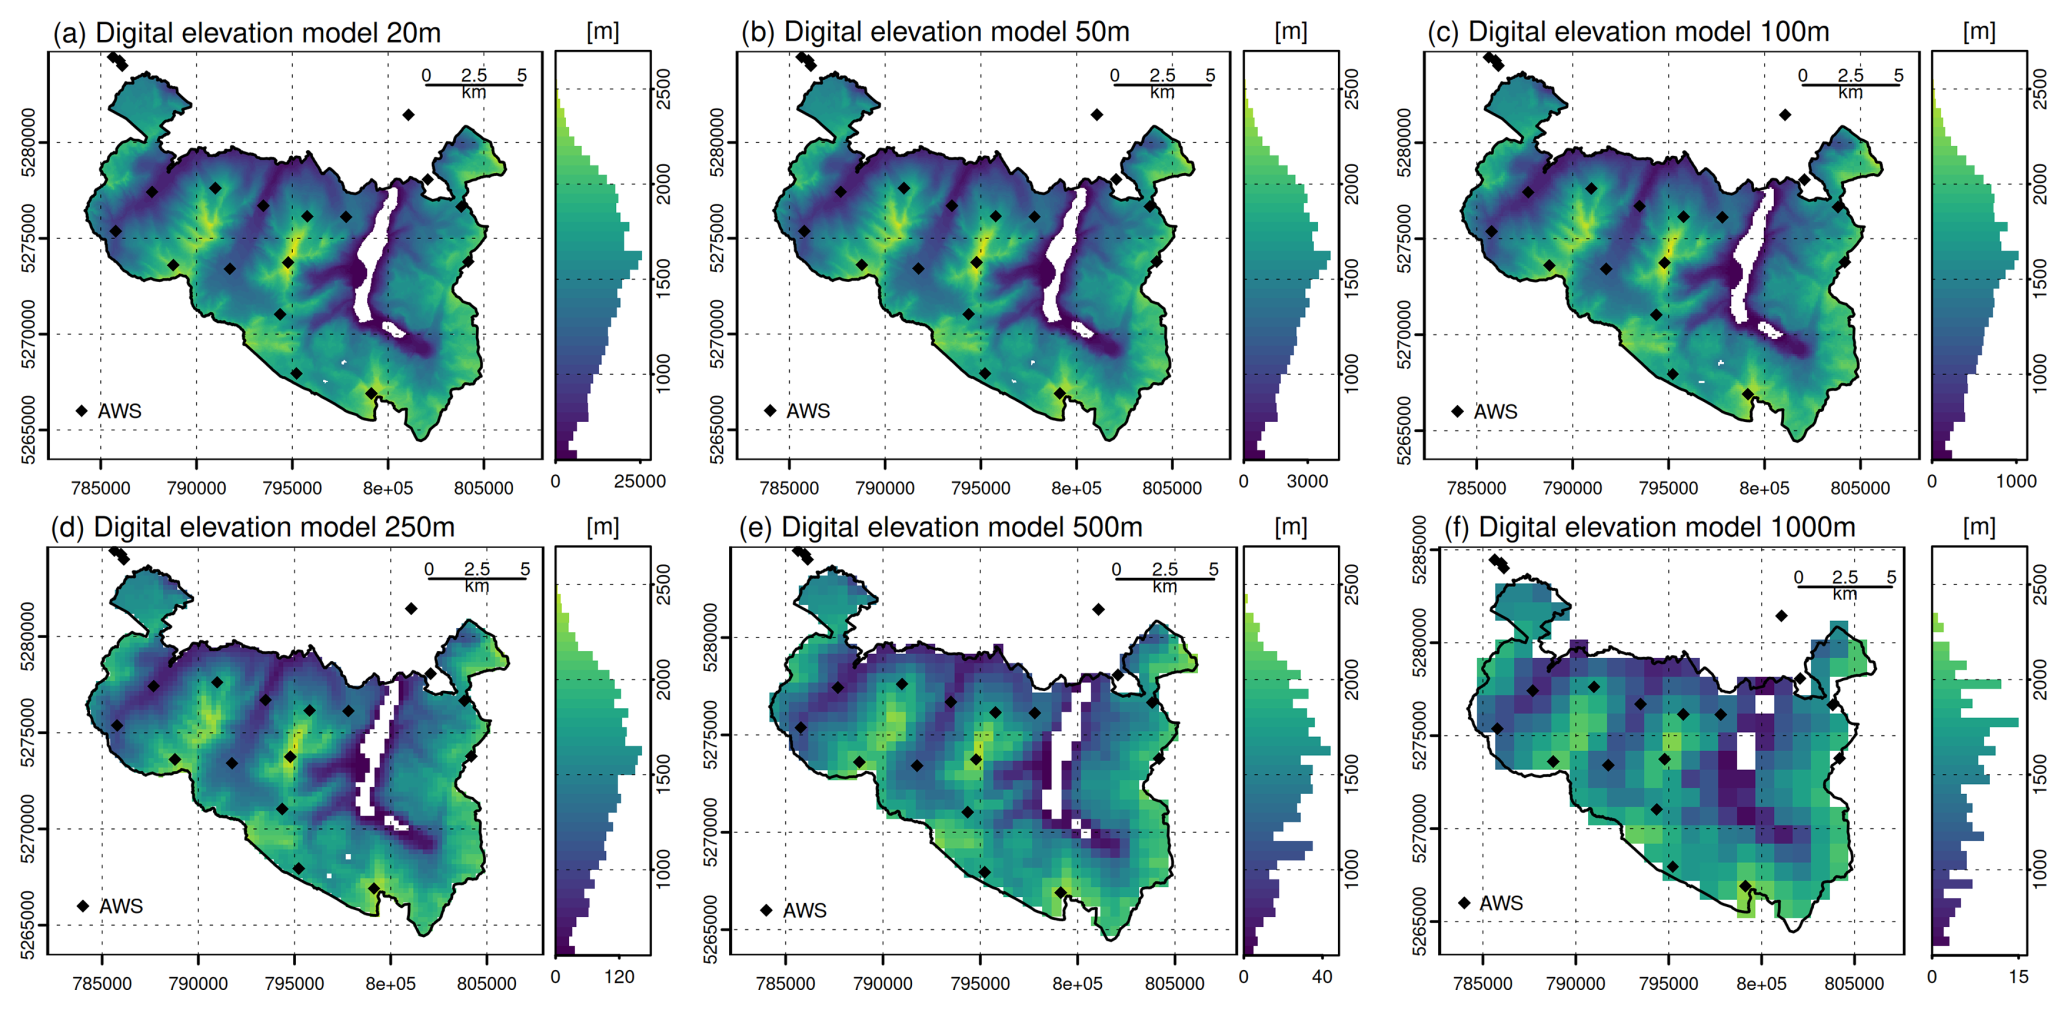
Figure 3Digital elevation models for the BGNP in different resolutions including the location of automatic weather stations (AWS): 20 m (a), 50 m (b), 100 m (c), 250 m (d), 500 m (e) and 1000 m (f). The elevation distribution within 50 m elevation bands is shown right of each map.
3.1 Intermediate complexity snow modelling
We use the open source snow-hydrological model openAMUNDSEN v1.0.4 to simulate the seasonal snow cover of the BGNP. openAMUNDSEN is a fully distributed snow model primarily designed to simulate the mass and energy balance of a seasonal snow cover in complex mountain terrain. On top of that, two different degree-day snowmelt modelling approaches are available as alternatives, namely the T-Index and the enhanced T-Index method. A comprehensive model description including these T-Index methods and all important process representations is presented in Strasser et al. (2024), the source code of the model is available on GitHub (https://github.com/openamundsen/openamundsen, last access: 7 July 2025). In the T-Index simulations presented here, we run the model in daily resolution with a constant DDF of 2.1 . This DDF was selected based on comparisons between model results with satellite-based snow data (see Sect. 3.3). No automated calibration was conducted, but a robust value for DDF was selected following a series of model experiments. In addition to the T-Index approach, which only takes temperature into account, we also use the enhanced T-Index approach available within openAMUNDSEN, which also includes solar radiation (either measured radiation or potential clear-sky radiation) and modelled snow surface albedo (Pellicciotti et al., 2005). The incorporation of a radiation-driven melt component supports seasonally and spatially varying snowmelt dynamics and enables simulations to be run at the sub-daily scale. The enhanced T-Index snow model runs was conducted in a 3 hourly time step with a DDF of 1.3 and a short-wave radiation factor (RF) of 0.1 . In openAMUNDSEN, the T-Index and enhanced T-Index snowmelt modelling approaches are combined with the “cryolayers” snow layering scheme, which enables to distinguish new snow, old snow, firn and ice. On the contrary, our 3 hourly openAMUNDSEN energy balance model runs engage a multilayer snowpack scheme following Essery (2015), distinguishing up to three snow layers (Strasser et al., 2024). For all model runs, we corrected precipitation for wind-induced measurement errors following the approach presented by Kochendorfer et al. (2017). The station-based meteorological forcing data was spatially interpolated using a combined lapse rate/inverse distance weighting scheme. First, lapse rates were applied to generate a distributed elevation-dependent field for each meteorological variable (i.e., the regression field). Next, residuals between the regression field and station observations were computed and interpolated to the grid using inverse distance weighting (IDW), yielding the residual field. The superposition of the regression and residual fields produces the final meteorological input grid. This interpolation procedure is performed at each model time step. We accounted for the lateral snow redistribution process with a simple snow redistribution parameterization using snow redistribution factors (SRF), calculated based on the concept of negative topographic openness (Yokoyama et al., 2002). An evaluation of this approach with airborne laser scanning data is presented in Hanzer et al. (2016) and a description of an elevation-dependent adjustment of the SRF, tailored for the BGNP and also used in this study, is available in Storebakken et al. (2025). We assessed SRFs for different resolutions and used them to redistribute the amount of solid precipitation from areas of erosion to areas of deposition (Fig. A1). All model input data and parameter settings used in this study are available in the BGNP model set-up data repository (https://doi.org/10.23728/B2SHARE.530A7560A736474599 69F5C21639E8CB, last access: 28 July 2025).
3.2 Stochastic climate generator
To assess snow model uncertainty in relation to a climate warming signal, we used the stochastic block bootstrap resampler (climate generator) from openAMUNDSEN to construct a 10 year period characterized by a 1 °C warming compared to the historical 10 year period. A detailed description of the climate generator is presented in Strasser (2008) and Strasser et al. (2024). The source code is available along with the openAMUNDSEN model (https://github.com/openamundsen/openamundsen-climategenerator, last access: 21 July 2025). The openAMUNDSEN climate generator is designed to construct time series with predefined mean temperature and precipitation. Therefore, the observational time series are split up into blocks of a defined length (one week in our case) and then – week by week – rearranged to obtain the new time series with the desired characteristics. For the selection of a week in the new time series, the algorithm cannot draw from all weeks of the year, but can only choose weeks observed up to two weeks before or after the week to be filled. The week 20 in the constructed time series, for example, can be selected from the weeks 18–22 in the observations. The width of this selection window is chosen by the user allowing a tailored compromise between a large data pool for selection and keeping seasonal characteristics consistent. Prior to the selection process, a random variability is added to the observations. Once an observed week has been selected by the algorithm to be used in the new time series, all measured variables (i.e., air temperature, precipitation, global radiation, relative humidity, and wind speed) are copied into the new data time series. This approach enables the generation of high temporal resolution (hourly in our case) and physically consistent station time series that directly can be used to force the snow model simulations. However, while stochastic block bootstrapping procedures can be very useful in the context of a snow model sensitivity study like the one presented here, we do not recommend their application in sophisticated climate change impact studies.
3.3 Model evaluation using satellite-based snow data
We evaluated the historical snow simulations using snow cover maps derived from Sentinel-2 and MODIS satellite data. The Sentinel-2 constellation allows for the determination of fractional snow cover (FSC) in high spatial resolution (i.e. 20 m×20 m). In this study, we use the Copernicus FSC obtained via the European Union's Copernicus Land Monitoring Service (https://doi.org/10.2909/3e2b4b7b-a460-41dd-a373-962d032795f3, last access: 30 July 2025). Copernicus FSC data is available from September 2016 onward. The available scenes for the study area were downloaded and pre-processed by cutting out the BGNP and re-sampling to the different model grids. We performed a pixel-by-pixel comparison for all scenes with less than 50 % cloud cover in the non-forested areas. The comparison of modelled and satellite-based data has four possible outcomes: true positive (TP), true negative (TN), false positive (FP) and false negative (FN). We determined the accuracy (ACC), overestimation error (OE) and underestimation error (UE) using the following equations:
In comparison to, e.g., Hao et al. (2019) and Rottler et al. (2024), we adapted the OE and UE so that the errors are assessed as a fraction of the total amount of non-matching pixels. In this way, OE and UE sum up to 1 and deviations of the ACC from a perfect match can be attributed more directly to either an OE or UE. Alternative performance measures supporting snow model evaluation using satellite-based snow data, inter alia, are presented in Warscher et al. (2013) and Hofmeister et al. (2022). With regard to the model evaluation using FSC data, we present results on a monthly basis for February to July. Thereby we only take non-forested areas into account, as the satellite-based observation of snow on the ground inside forests is obstructed by the canopy (e.g. Xin et al., 2012; Bair et al., 2021; Keuris et al., 2023). The FSC and SWE values were translated to a binary classification using a threshold of 20 % for FSC and 20 mm for SWE. A sensitivity assessment with regard to this threshold selection is presented, e.g., in Rottler et al. (2024).
In addition to FSC maps, we use MODIS-based snow cover extent (SCE) to evaluate historical snow model simulations. We downloaded and processed the daily and cloud-free “Global SnowPack” product from the German Aeorospace Center (DLR) using DLR's GeoService (https://geoservice.dlr.de/, last access: 30 July 2025). This SCE product has a spatial resolution of 500 m. A description of this SCE product and examples of its applications in research studies are available in Dietz et al. (2012, 2013, 2014, 2015), Rößler et al. (2021) and Roessler and Dietz (2023). We calculated the seasonal course of the snow coverage in the non-forested areas of the BGNP for the 10 year period October 2013–September 2023 and compared the satellite-based estimates with openAMUNDSEN simulations.
The evaluation of the openAMUNDSEN snow simulations in non-forested areas, using the satellite-based snow data, indicates that all model configurations can well capture the build-up and melt of the seasonal snow cover in the study area. A detailed description of the snow model evaluations is provided in the Appendix B. The pixel-by-pixel comparison of simulated snow with FSC from Sentinel-2 (Figs. B1 and B2) as well as the comparison with MODIS snow cover extent data (Figs. B3 and B4) confirm the model's ability to capture the seasonal snow cover dynamics in the BGNP.
The stochastic block bootstrap resampler (climate generator) generated a 10 year period characterized by 1 °C warmer temperatures (Fig. 4a). Due to the stochastic nature of the approach as well as the inherent natural variability of the observational data, not every month exhibits the exact same warming. Temperatures in December, for example, are on average 1.25 °C warmer, whereas March shows a more moderate warming of 0.61 °C. With regard to precipitation amounts, slight increases/decreases show up (Fig. 4). Again, theses differences reflect the stochastic nature of the method as well as the inherent variability in the data. We consider this variability in the signal appropriate for 10 year averages. In our experience, similar variabilities in the signal can show up in the comparison of 10 year periods of observations and data from climate models.
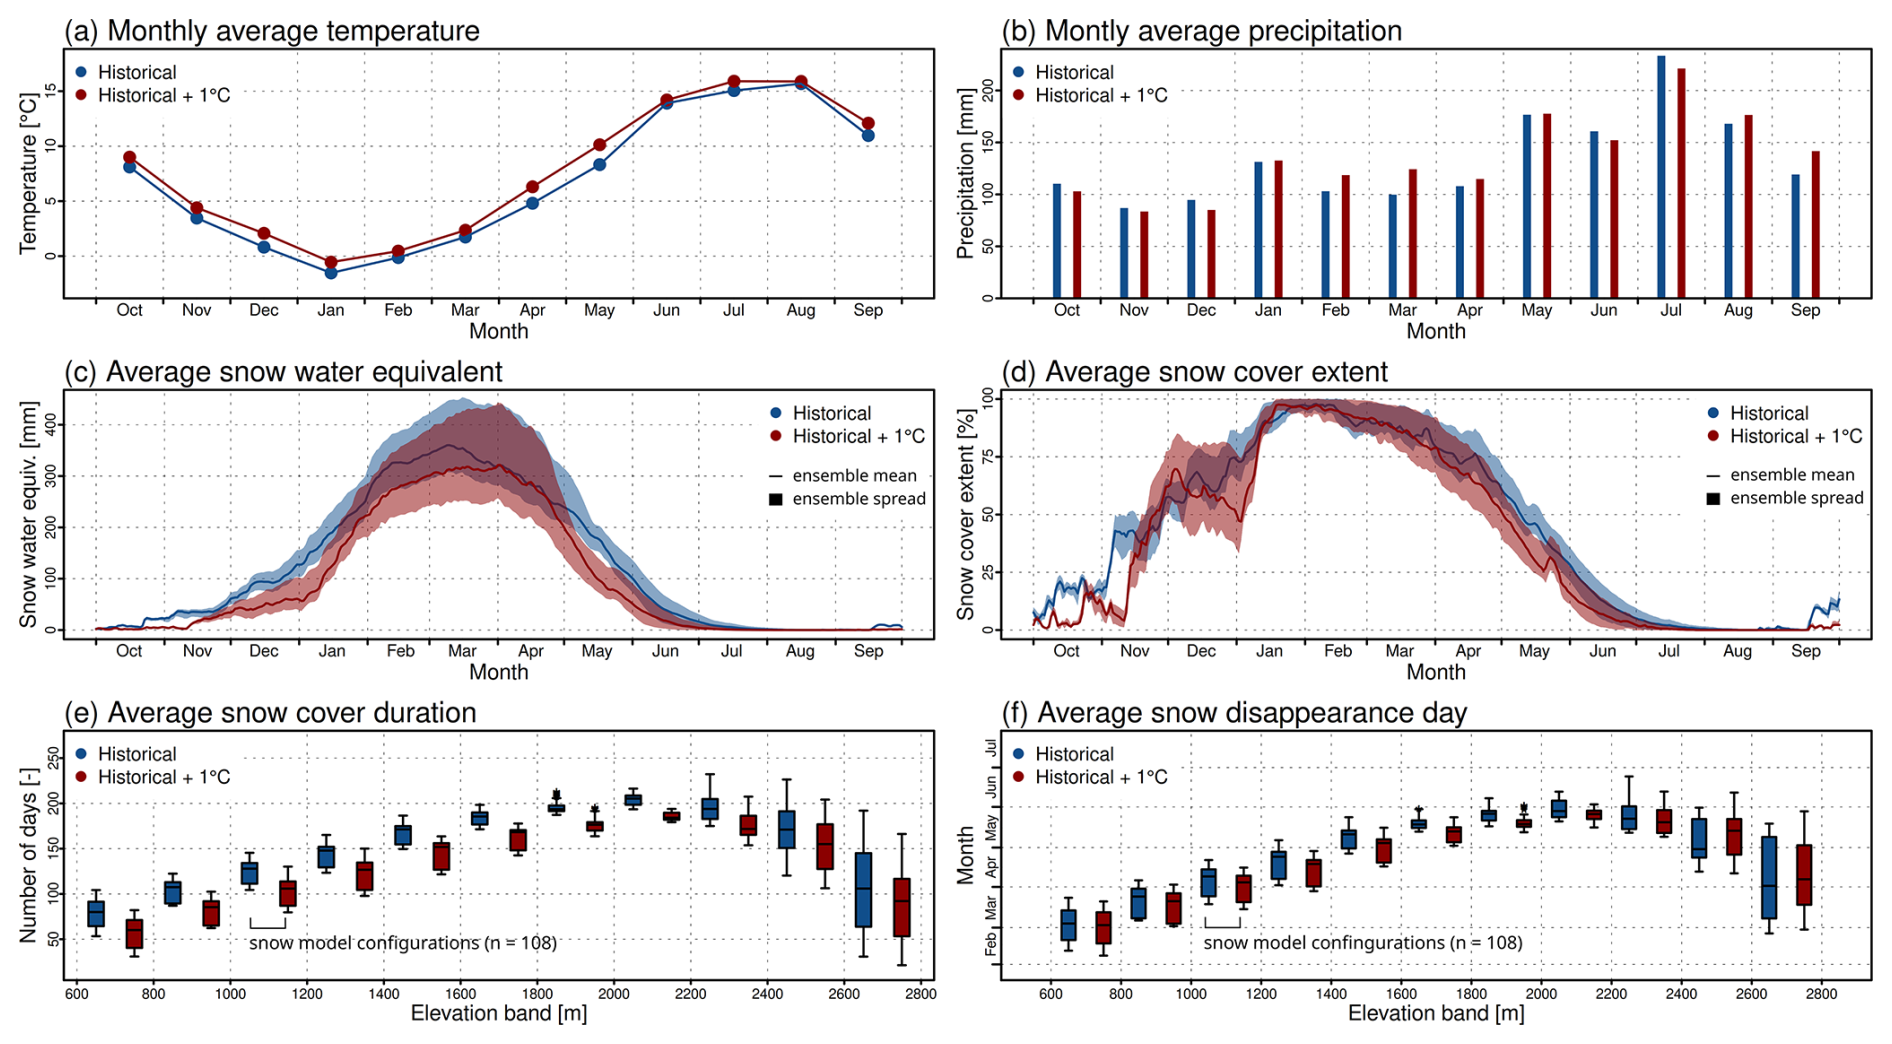
Figure 4Monthly average temperatures (a) and precipitation totals (b) for the BGNP based on historical observations (October 2013–September 2023) and a 10 year period characterized by a 1 °C warming generated using the openAMUNDSEN climate generator. The average seasonal cycle of simulated snow water equivalent (c) and snow cover extent (d) as well as the average snow cover duration (e) and snow disappearance day (f) for 200 m elevation bands is assessed for all openAMUNDSEN model configurations (i.e. 108 for historic and for 1 °C warming conditions).
With regard to SWE, the snow model spread caused by the usage of different model configurations increases with progressing snow season and reaches its maximum between February and April. The average SWE in the BGNP can differ by more than 100 mm. Although the ensemble mean of the average SWE in warming conditions is below the ensemble mean of the historical simulations, there is a strong overlap of the shaded areas that indicated the spread caused by the usage of different snow model configurations (Fig. 4c). All model simulations under historical as well as warming conditions suggest that the BGNP is almost fully snow-covered in January and February (Fig. 4d). Furthermore, our snow simulations hint at an earlier disappearance of snow in the BGNP under a 1 °C warming by approx. one week. However, the strong overlap of the shaded areas indicates that the model spread in the second half of the main snowmelt season (May–June) is large compared to the magnitude of this shift. The model spread in this part of the year is characterized by values of approx. 50 mm for SWE and 12.5 % for the snow cover extent (Fig. 4c and d).
SCDs reach the highest values of approx. 200 d in elevation zones between 1800 and 2400 m (Fig. 4e). Our simulations suggest that a 1 °C warming can cause an average decrease in SCD of 20.5 d in the BGNP. For SDD, our modelling experiment suggests that changes due to a 1 °C warming can be small compared to the differences arising from the different model configurations (Fig. 4f). In general, our model results suggest that for SCD and SDD small differences between model configurations show up in elevations between 1600–2200 m. A larger spread in the snow model results can be detected below 1600 m and above 2200 m (Fig. 4e and f).
Our analysis of the effect of the spatial resolution suggests that results are largely consistent for resolutions between 20 and 250 m and up to elevations of 2000 m (Fig. 5). Simulation results for coarser spatial resolutions (i.e., 500 or 1000 m) can deviate from the ones obtained for higher resolution model runs. The median SCD for the elevation band 2200–2400 m simulated using the T-Index approach (Fig. 5a), for example, is 229, 218, 207 and 192 d using a spatial resolution of 20, 50, 100 and 250 m, respectively.
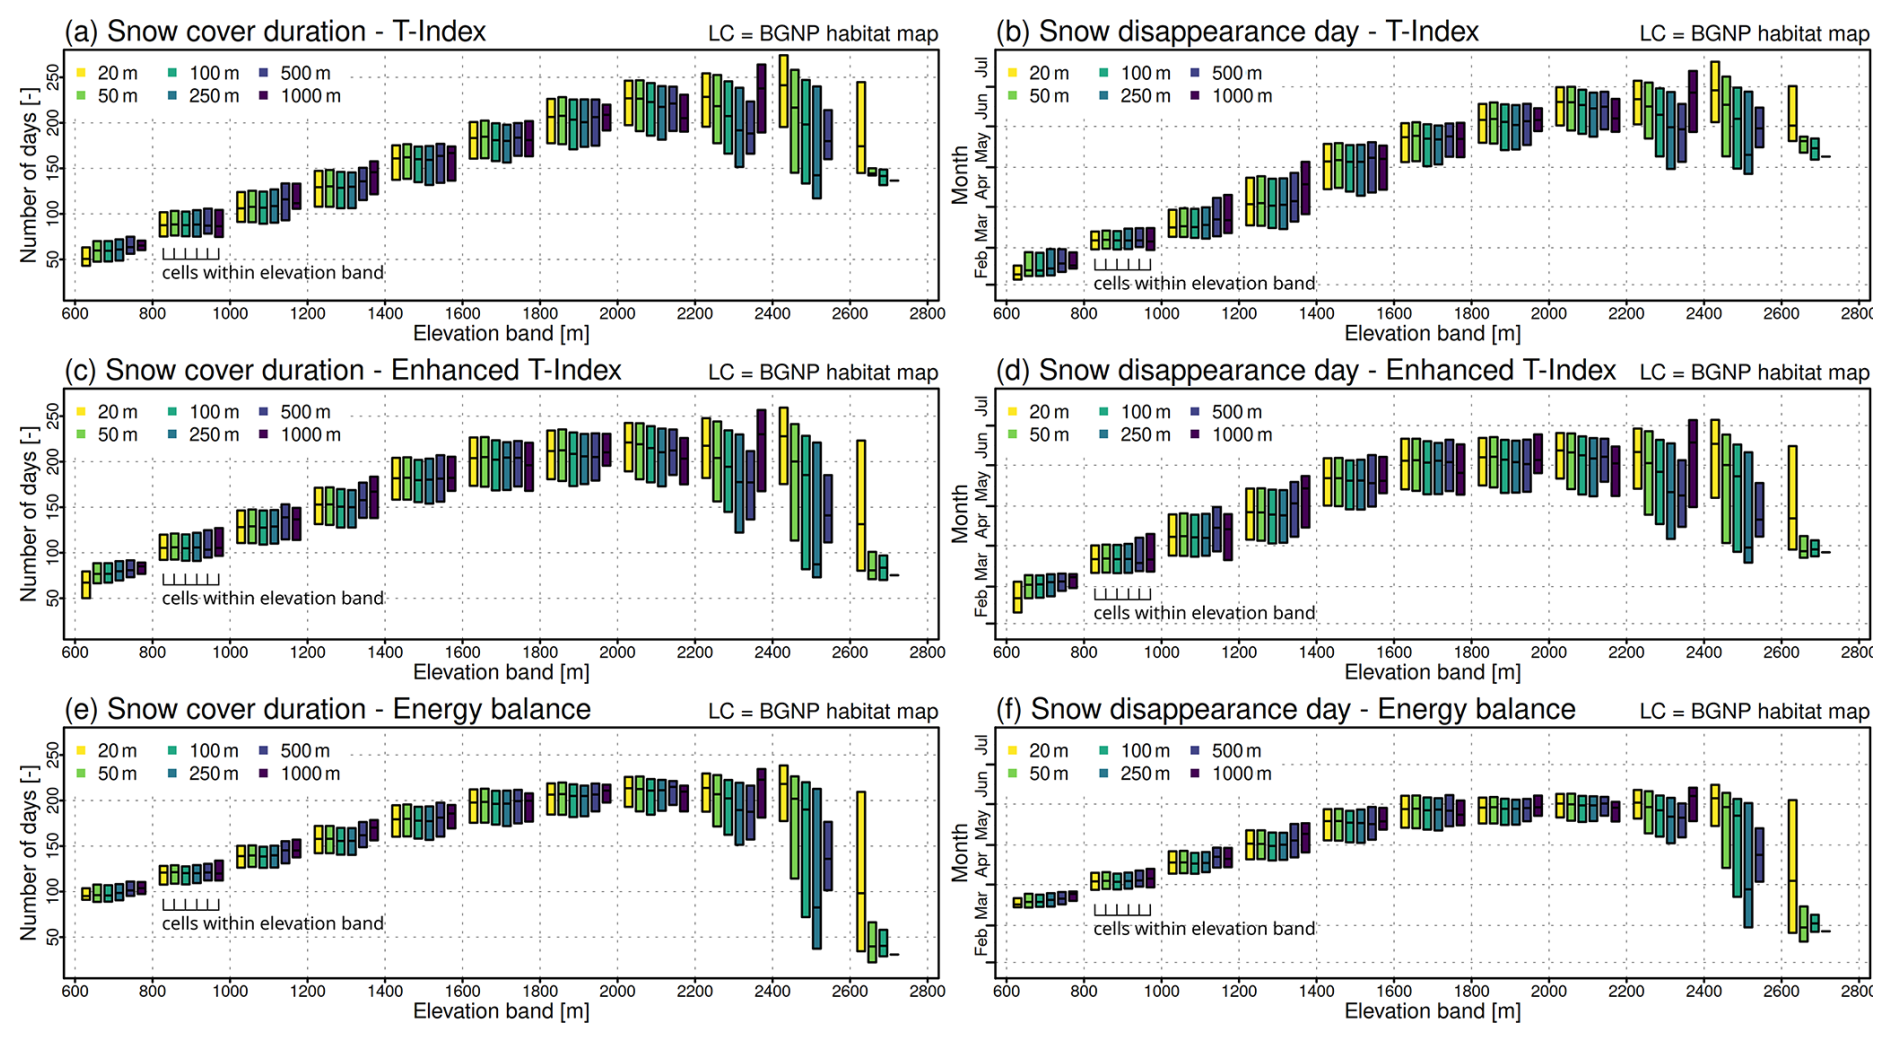
Figure 5Simulated snow cover durations and snow disappearance days in the BGNP for different grid resolutions using the land cover map derived from the BGNP habitat data and the T-Index (a, b), enhanced T-Index (c, d) and energy balance (e, f) approaches available in the openAMUNDSEN snow model. Results are aggregated by 200 m elevation bands. Boxplots are displayed without whiskers and outliers.
The analysis of the model simulations with regard to the usage of different land cover maps indicates that the T-Index approach is largely insensitive to land cover (Fig. 6a and b). However, when using the enhanced T-index or energy balance based snowmelt approach, differences in SCD and SDD can show up in elevation zones with forest classes (Fig. 6c–f). The median SCD or SDD for elevations bands can be shifted by up to one week when using different land cover maps. In high elevations with no or only very small forested areas, the selection of the land cover map has no or only a negligible effect on the modelling results.
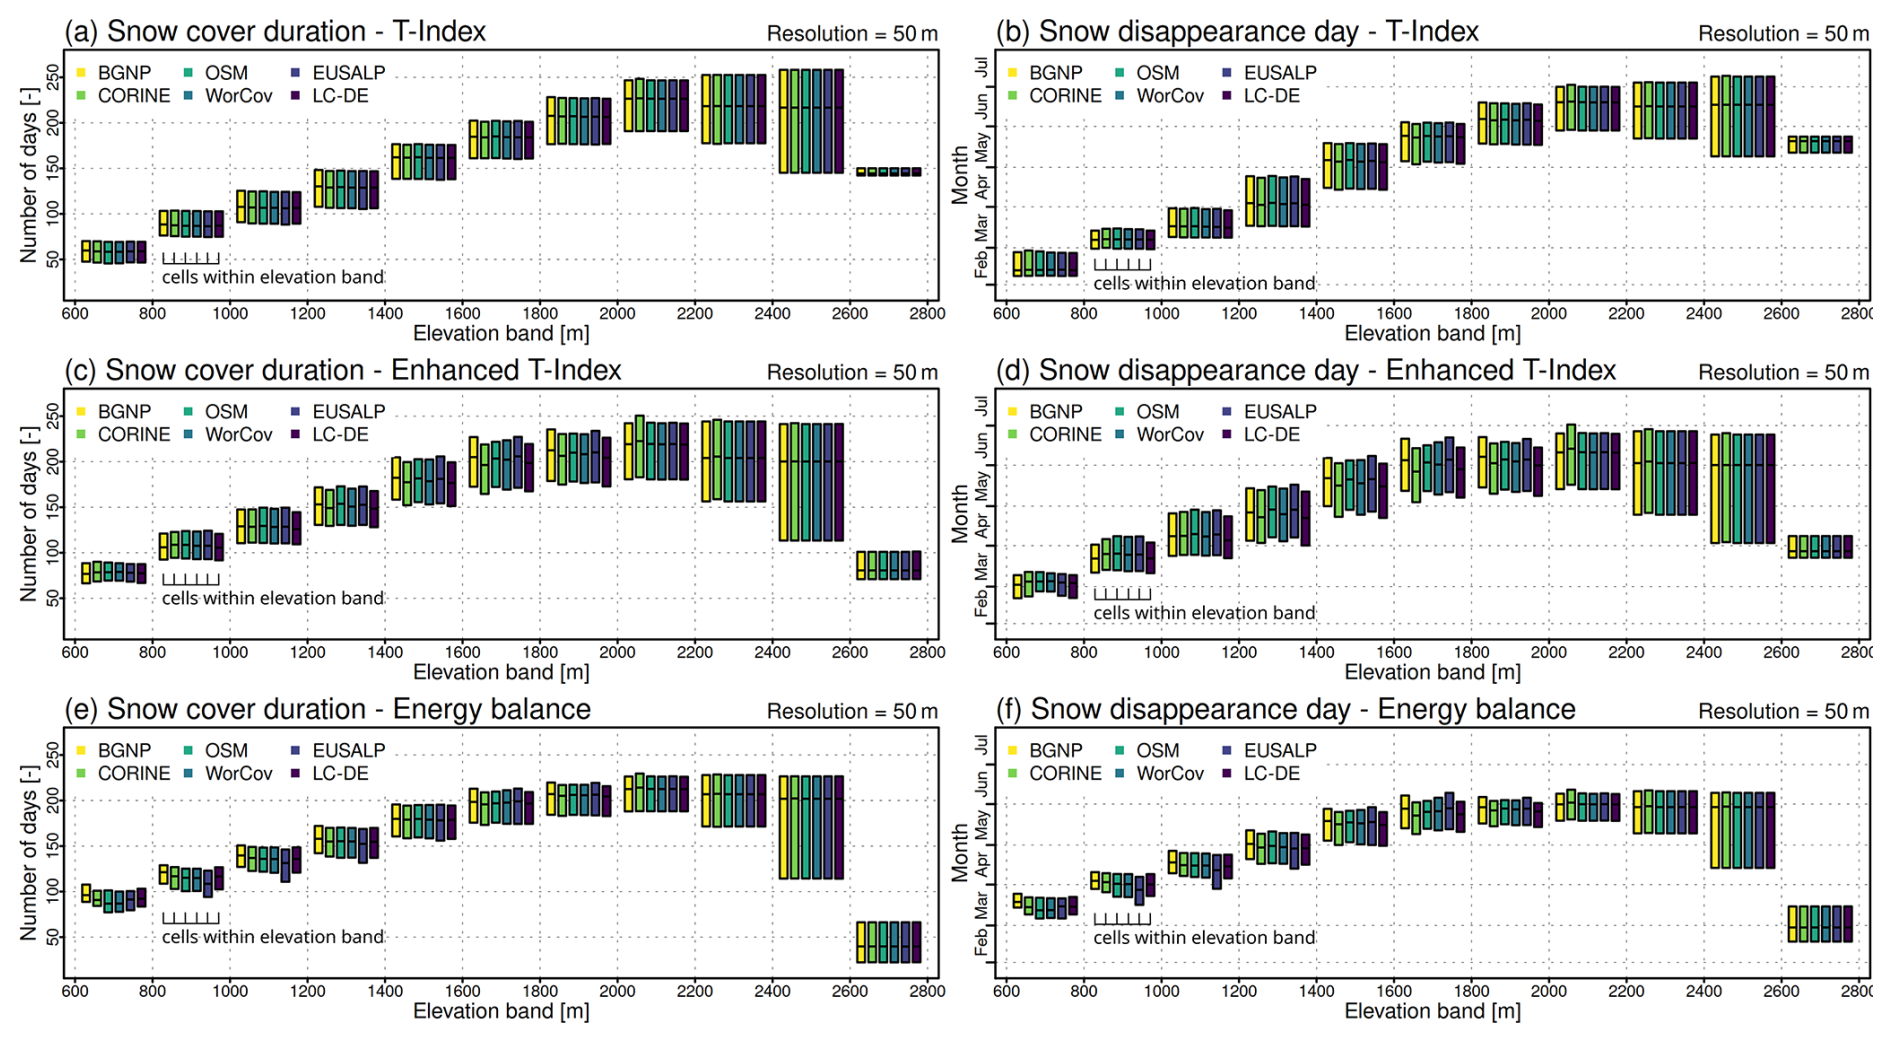
Figure 6Simulated snow cover durations and snow disappearance days in the BGNP for different land cover maps using a 50 m spatial grid resolution and the T-Index (a, b), enhanced T-Index (c, d) and energy balance (e, f) approach available in the openAMUNDSEN snow model. Results are aggregated by 200 m elevation bands. Boxplots are displayed without whiskers and outliers.
Our model experiments indicate that a 1 °C warming can cause a reduction in SCD of more than 20 d in the BGNP (Fig. 7a, c and f). With regard to SDD, the change signal in our model experiment is smaller with values of a few days up to ten days (Fig. 9b, d and f). The changes induced by higher temperatures and assessed for elevation bands seem consistent for spatial resolutions between 20–250 m. Deviations between model configuration using different spatial resolutions mainly show up at coarser modelling resolutions (i.e., 500 or 1000 m) and for elevations below 800 m and above 2200 m. Our results also indicate that the magnitude of the difference can vary strongly within an elevation band. The length of the boxes, which cover 50 % of the cells within the elevation band, can easily span across a range of 10 d (Fig. 7).
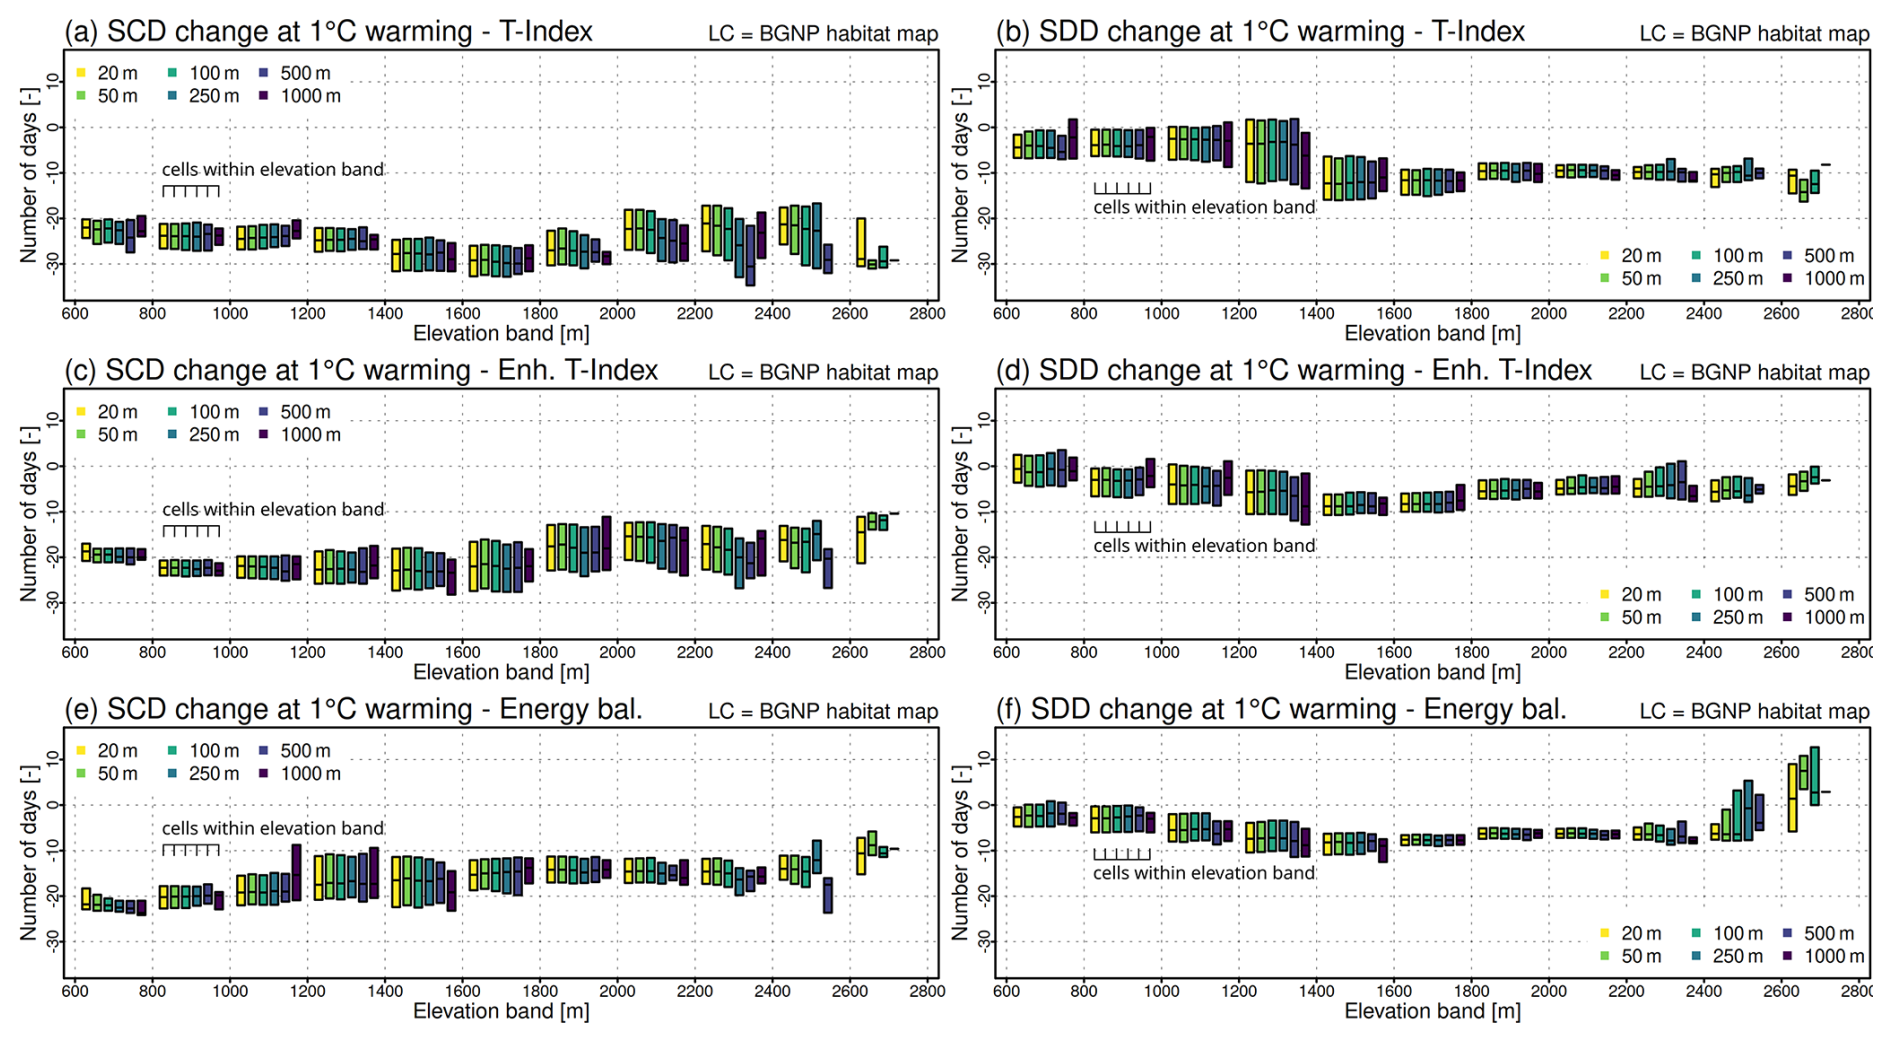
Figure 7Changes in simulated snow cover durations and snow disappearance days in the BGNP induced by a 1 °C warming using the land cover map based on the BGNP habitat map for different grid resolutions using the T-Index (a, b), enhanced T-Index (c, d) and energy balance (e, f) approach available within the openAMUNDSEN snow model. Results are aggregated by 200 m elevation bands. Boxplots are displayed without whiskers and outliers.
Our analyses of the effect of using different land cover maps on a potential climate change signal indicate that when using the T-Index approach, only small differences show up (Fig. 8a and b). When using the enhanced T-Index or energy balance approach, the usage of different land cover maps characterized by different extents and distributions of forest type classes can be stronger and alter results for elevation bands with forest (Fig. 8c–f).
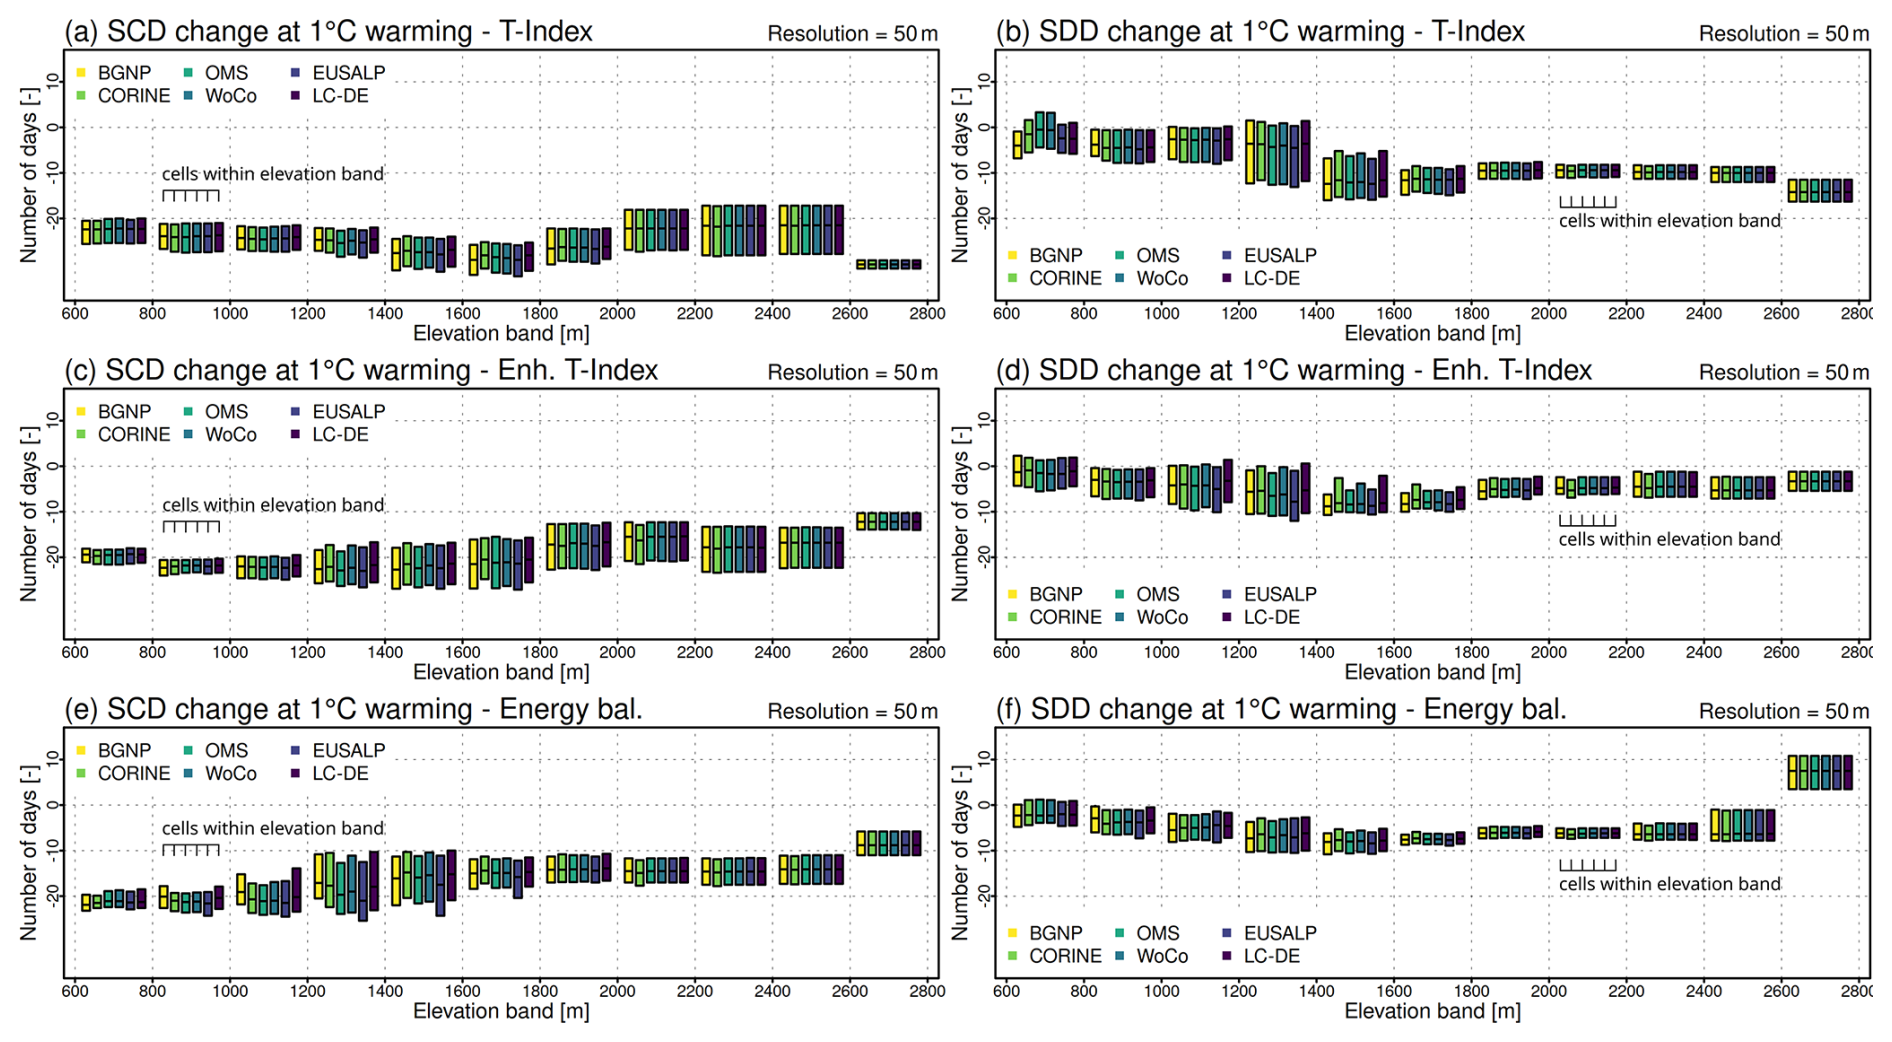
Figure 8Changes in simulated snow cover durations and snow disappearance days in the BGNP induced by a 1 °C warming for different different land cover maps using a 50 m spatial grid resolution and the T-index (a, b), enhanced T-index (c, d) and energy balance (e, f) approach available within the openAMUNDSEN snow model. Results are aggregated by 200 m elevation bands. Boxplots are displayed without whiskers and outliers.
Next, we directly compare results for SCDs and SDDs using different snowmelt simulation methods and assess results with respect to differences stemming from different aspect, land cover map and a 1 °C warming (Fig. 9). The aspects for the different model resolutions are presented in Appendix A (Fig. A2). Our results point out that the selection of the snowmelt modelling method can strongly influence SCD and SDD. Differences between the snowmelt modelling methods are most prominent below approx. 1600 m with simulations using the T-Index approach resulting in considerable shorter SCDs (Fig. 9a, c and e) and earlier SDDs (Fig. 9b, d and f). Energy balance based simulations, however, produce longer SCDs and later SDDs for this elevation zone, while results from the enhanced T-Index approach tend to be between those of the other two approaches. This signal reverses at high elevations (>2000 m) and the T-Index approach suggests longer SCDs and later SDDs than the other two snowmelt modelling approaches. Our modelling results indicate that at elevations below approx. 1600 m and above approx. 2200 m the differences induced by different snowmelt modelling approaches are stronger than the signal of change induced by a 1 °C warming (Fig. 9e and f). For elevation bands between 1600 and 2200 m, the results for SCDs and SDDs are more consistent and the change induced by a 1 °C warming exceeds the spread caused by different snowmelt simulation methods. Also the usage of different land cover maps can induce changes in SCDs and SDDs that can be within the same range as the change induced by a 1 °C warming (Fig. 9c and d), however, differences are less pronounced than differences resulting from the different snowmelt modelling methods, and are limited to elevations with differences in the forest representation in the land cover maps. While the enhanced T-Index and the energy balance approach can capture the differences in SCDs and SDDs depending on the exposition within elevation bands, the T-Index approach cannot account for such variabilities (Fig. 9a and b). Also the difference between northern and southern slopes is of the same magnitude as the signal induced by a 1 °C warming (Fig. 9).
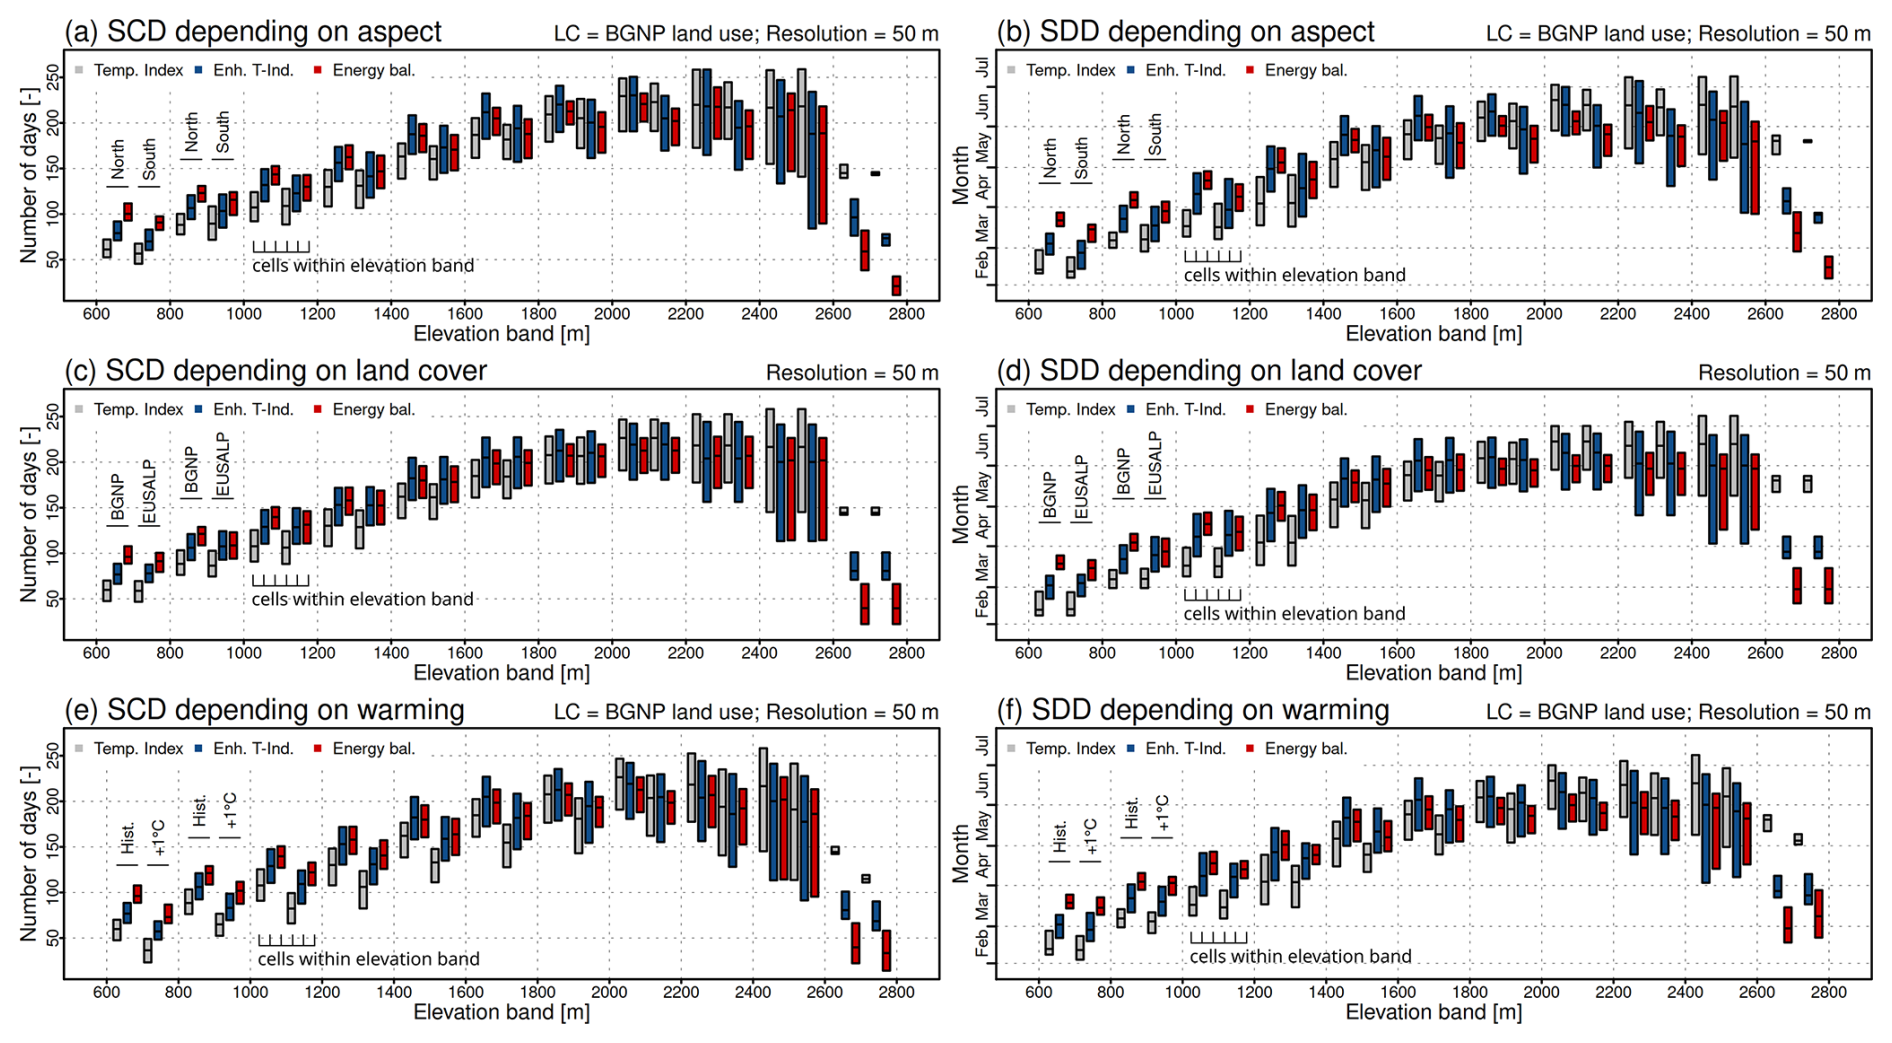
Figure 9Simulated snow cover durations and snow disappearance days in the BGNP using the T-index, enhanced T-index and energy balance approach available in the openAMUNDSEN snow model depending on aspect (a, b), land cover maps based on National Park habitat data (BGNP) and the land use/land cover map for the European Alps developed by Marsoner et al. (2023) (EUSALP) (c, d) and a warming of 1 °C (e, f). Results are aggregated by 200 m elevation bands. Boxplots are displayed without whiskers and outliers.
The open source snow model openAMUNDSEN proved to be a versatile snow modelling framework offering a wide range of configuration options including degree-day and physically based snowmelt modelling approaches. The stochastic block bootstrap resampler (climate generator), an external pre-processing routine, is a useful extension of openAMUNDSEN and enables the generation of physically consistent meteorological times series with pre-defined warming trends. The incorporation of the climate generator into the modelling experiment enables us to analyse the snow model uncertainty in the context of a potential climate warming. While using the climate generator for our particular purpose – comparison of the results of different snow model configuration simulations in relation to a potential warming signal – is appropriate, we do not recommend employing a stochastic block bootstrapping procedure to produce climate change scenario data for impact studies, in particular, when the goal is the investigation of snow-hydrological extremes, as no new extreme events can be produced by simple re-organization of observational time slices. Moreover, it needs to be noted that the climate generator cannot adequately produce elevation- and season-dependent features of long-term climatic changes.
In our study, we compare averages of meteorological and snow-related variables for two 10 year periods. The average monthly temperatures and precipitation totals as well as the average seasonal cycles indicate that the inter-annual variability of the data is affecting the averages investigated (Fig. 4a–d). Our analysis highlights the need for caution when quantifying climate change signals obtained using such short time frames. However, in our study, we deliberately decided to compare 10 year periods, as this is the type of data currently being available from ensemble climate simulations at kilometer-scale resolution. These high resolution climate model runs better capture the topographic forcing of precipitation and allow for an explicit, physical description of deep convection without having to use parameterization schemes (Lucas-Picher et al., 2021). Ban et al. (2021), for example, conduct the first multi-model ensemble climate simulations for the greater Alpine region at the kilometer-scale for the ten year period 2000–2009. Multi-model 10 year kilometer-scale scenarios for the greater Alpine domain are presented in Pichelli et al. (2021). First case study simulations and results for a hydrological year for the “Third Pole”, using a multi-model and multi-physics ensemble at the kilometer-scale, are presented in Prein et al. (2023) and Collier et al. (2024), respectively. On the contrary, high resolution regional climate model runs covering longer time frames (e.g. 30 years or more) often are limited to a single model only (e.g. Warscher et al., 2019; Collier and Mölg, 2020). Furthermore, depending on the complexity of the terrain, resolutions below 1 km are required to adequately represent the processes that cause the spatial variability of the simulated snow cover, such as lateral redistribution of snow by wind or snow-canopy interaction. Consequently, further dynamical or statistical downscaling of kilometer-scale climate model data is required to assess changes in the seasonal snow cover dynamics in complex mountain terrain such as the BGNP. Recent studies have demonstrated that the combination of high resolution weather model output, e.g. from the Weather Research and Forecasting (WRF) model, with physically-based snow energy balance models is feasible and can provide new insights into snow dynamics at the regional scale (e.g. Corripio and López-Moreno, 2017; Liu et al., 2019; Alonso-González et al., 2021; Raparelli et al., 2023; Zhou et al., 2023). Ongoing improvements of the snow process descriptions in the weather models may eventually make the coupling to an additional snow model unnecessary in the future (e.g. Luo et al., 2021; Saigger et al., 2024).
The recent progress in climate and snow modelling research suggests that, step by step, computational hurdles will be overcome, and that future climate change impact studies using models that better capture the topographic forcing of precipitation and explicit treatment of deep convection, and physically based snow models including lateral redistribution and snow canopy processes can adequately describe the snow cover dynamics in complex mountain terrain for potential future warming conditions. In this study, we show that the selection of the snowmelt simulation method is a very important aspect to consider when conceptualizing climate change impact studies in complex mountain areas. Our modelling experiments indicate that the snow model uncertainty can be of the same magnitude or even larger than changes in the snow cover induced by a 1 °C warming (Fig. 9e and f). A particular focus is required for forested areas, as additional snow-canopy processes need to be taken into account. In contrast to degree-day approaches, which usually only consider temperature and a calibrated degree-day factor and are largely insensitive to different land cover types, energy balance snow cover models do react sensitively to the choice of the land cover map and the forest representation therein (Fig. 6), given the meteorological forcing is properly adjusted to inside-canopy conditions. The comparison of model simulations with different spatial resolutions suggests that for a robust quantification of changes in snow patterns in the highest elevations, spatial resolutions considerably below 1 km are required (Fig. 7). In our simulations, we use a simple snow redistribution parameterization to account for the lateral snow redistribution processes (Strasser et al., 2024) (Fig. A1). More process-oriented approaches incorporating wind fields and explicit representation of gravitational snow redistribution processes exist and need to be considered in future developments of the openAMUNDSEN model (e.g. Warscher et al., 2013; Freudiger et al., 2017; Quéno et al., 2024).
Our study contributes to the broader research objective of quantifying snow model uncertainty and follows up on the investigations by Essery and Etchevers (2004), Essery et al. (2013), and Günther et al. (2019, 2020) who assessed uncertainties in snow model results arising from snow model complexity, parameter errors and errors in the forcing data. The effect of process representations on the results are also presented in Magnusson et al. (2015). Particular consideration of snow in forested area was given in the second phase of the Snow Model Intercomparison Project (SnowMIP2) where output from 33 different models was compared (Essery et al., 2009). These studies highlight that the accuracy of the forcing data is more critical than parameter selection, while the type of the model seems of less importance. In addition, human errors are an important aspect affecting snow model performance (Menard et al., 2021). Our snow modelling experiments complement existing research by defining a large set of configurations for distributed snow model simulations in complex mountain terrain with open and forested areas, resulting in a large number of openAMUNDSEN model configurations (n=108) with both degree-day and physically based snowmelt simulations, varying land cover maps and different spatial resolutions. The assessment of results under a 1 °C warming allows for a quantification of snow model uncertainty relative to a potential warming signal.
As many seasonally snow covered areas are also forest covered, further research is needed to better understand the effect of the snow-canopy processes in the context of a changing climate. A direct coupling of forest and snow models will thereby be an important next step in this regard, since not only climate will change, but also species composition and hence the snow hydrological processes inside the canopy. The complex mountain research site BGNP seems to be an ideal study site for such a task, given the dense measurement network and the existing expertise in forest processes modelling (e.g. Albrich et al., 2022; Senf et al., 2017; Thom et al., 2022; Dollinger et al., 2023; Braziunas et al., 2024) as well as snow modelling (e.g. Strasser, 2008; Strasser et al., 2011; Bernhardt et al., 2012; Kraller et al., 2012; Warscher et al., 2013; Storebakken et al., 2025). At the same time, however, the evaluation of snow models inside forests remains challenging, particularly, as forest canopies obstruct the satellite-based detection of snow on the ground. An alternative approach, the evaluation of openAMUNDSEN snow modelling results inside the forest using a network of microclimate sensors, is presented in Storebakken et al. (2025). Further research will support the development of new approaches for the evaluation of distributed snow models applied to forested areas, e.g. with respect to plant physiological simulation of LAI or improved scaling function for the meteorological variables from the location of the measurement to inside-canopy conditions. In our view, such new techniques for snow model evaluation are required to prepare a new generation of distributed and physically-based snow models for the application in the climate change impact context. There is no physical bases for assuming that DDFs used to simulate historical conditions are valid under future climatic conditions, and recent investigations of DDFs based on energy flux components (Ismail et al., 2023) show that DDFs cannot be treated as constant factors. They are changing with progressing melt season and need to be specifically adapted. Also our results suggest that degree-day snowmelt modelling approaches have their limitations, i.e. the DDF needs careful calibration and varies with elevation. We found that in higher elevations the best DDF is larger than in the valley region, where intermittent melting of the shallow snow cover in early winter can be very fast. Accordingly, the most consistent results and only small differences between model configurations show up in elevations between 1600–2200 m (Figs. 4e, f and 9e, f). The spatially and seasonally variable snowmelt dynamics from the enhanced T-Index approach seem to improve results by accounting for aspect- and season-dependent variations in radiation. However, the differences in SCDs and SDDs between the enhanced T-Index and the energy balance simulation runs can be substantial (Fig. 9). At lower elevations, the different forest representation in each particular land cover map causes additional uncertainties in the results, while SCDs and SDDs in the highest elevations react very sensitively to the selection of the spatial resolution (Figs. 6 and 5). Results are only consistent for spatial resolutions between 20 and 250 m and at elevations up to 2000 m.
openAMUNDSEN is a versatile snow modelling framework that supports distributed snow cover simulations in complex mountain areas, including snow-canopy interaction and lateral snow redistribution, using degree-day as well as energy balance snowmelt methods. In this study, we employ a large number of openAMUNDSEN model configurations (n=108) characterized by different snowmelt modelling methods, land cover maps and spatial resolutions to simulate the seasonal snow cover in the complex mountain terrain of the BGNP for the historical period October 2013–September 2023 and a 10 year period characterized by a 1 °C warming. The data describing the warming period was obtained using a stochastic block bootstrap resampler (climate generator), which is available as external pre-processing routine of openAMUNDSEN. The incorporation of the climate generator into our modelling experiment enabled us to assess snow model uncertainty in relation to the effect of a potential warming signal. The complex and diverse mountain landscape of the BGNP proved to be an ideal study area for snow modelling research and the presented investigation of snow model uncertainty. Our analyses suggest that differences in the resulting SCDs and SDDs, arising from the selected snowmelt simulation method, the used land cover map and the chosen spatial resolution can be comparable to the impact of a 1 °C warming. The uncertainties in the results are pronounced in the forest covered areas and in the high elevations of the study area. Our results emphasize the importance of evaluating the uncertainty of a given snow modelling setup when quantifying the effect of a warmer climate. Sources of uncertainty like the selection of the snowmelt method, land cover map, or the chosen resolution can have effects on the results in the same order of magnitude as the climate change signal. Future snow modelling studies investigating the effect of climatic changes on the seasonal snow cover in complex mountain terrain can build on our findings by carefully selecting snow model configurations and related uncertainties.
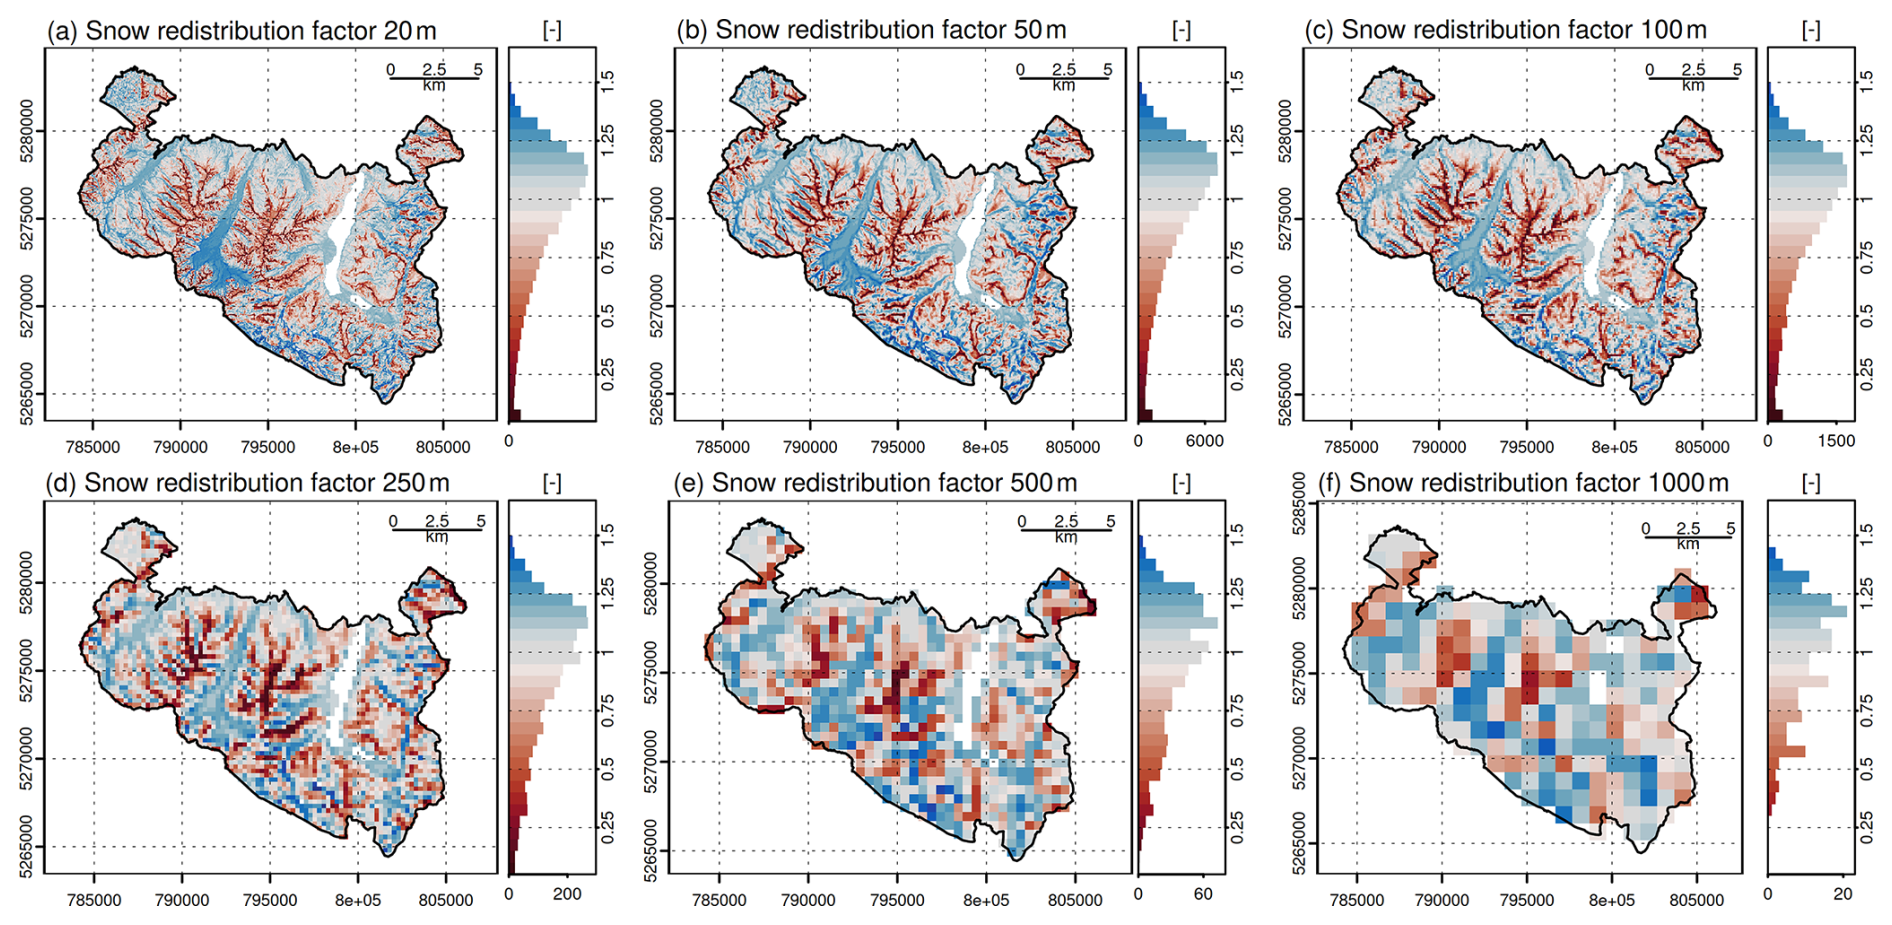
Figure A1Snow redistribution factors for the BGNP for different spatial resolutions: 20 m (a), 50 m (b), 100 m (c), 250 m (d), 500 m (e) and 1000 m (f). The frequency of different snow redistribution factors is shown in the panel to the right of each map.
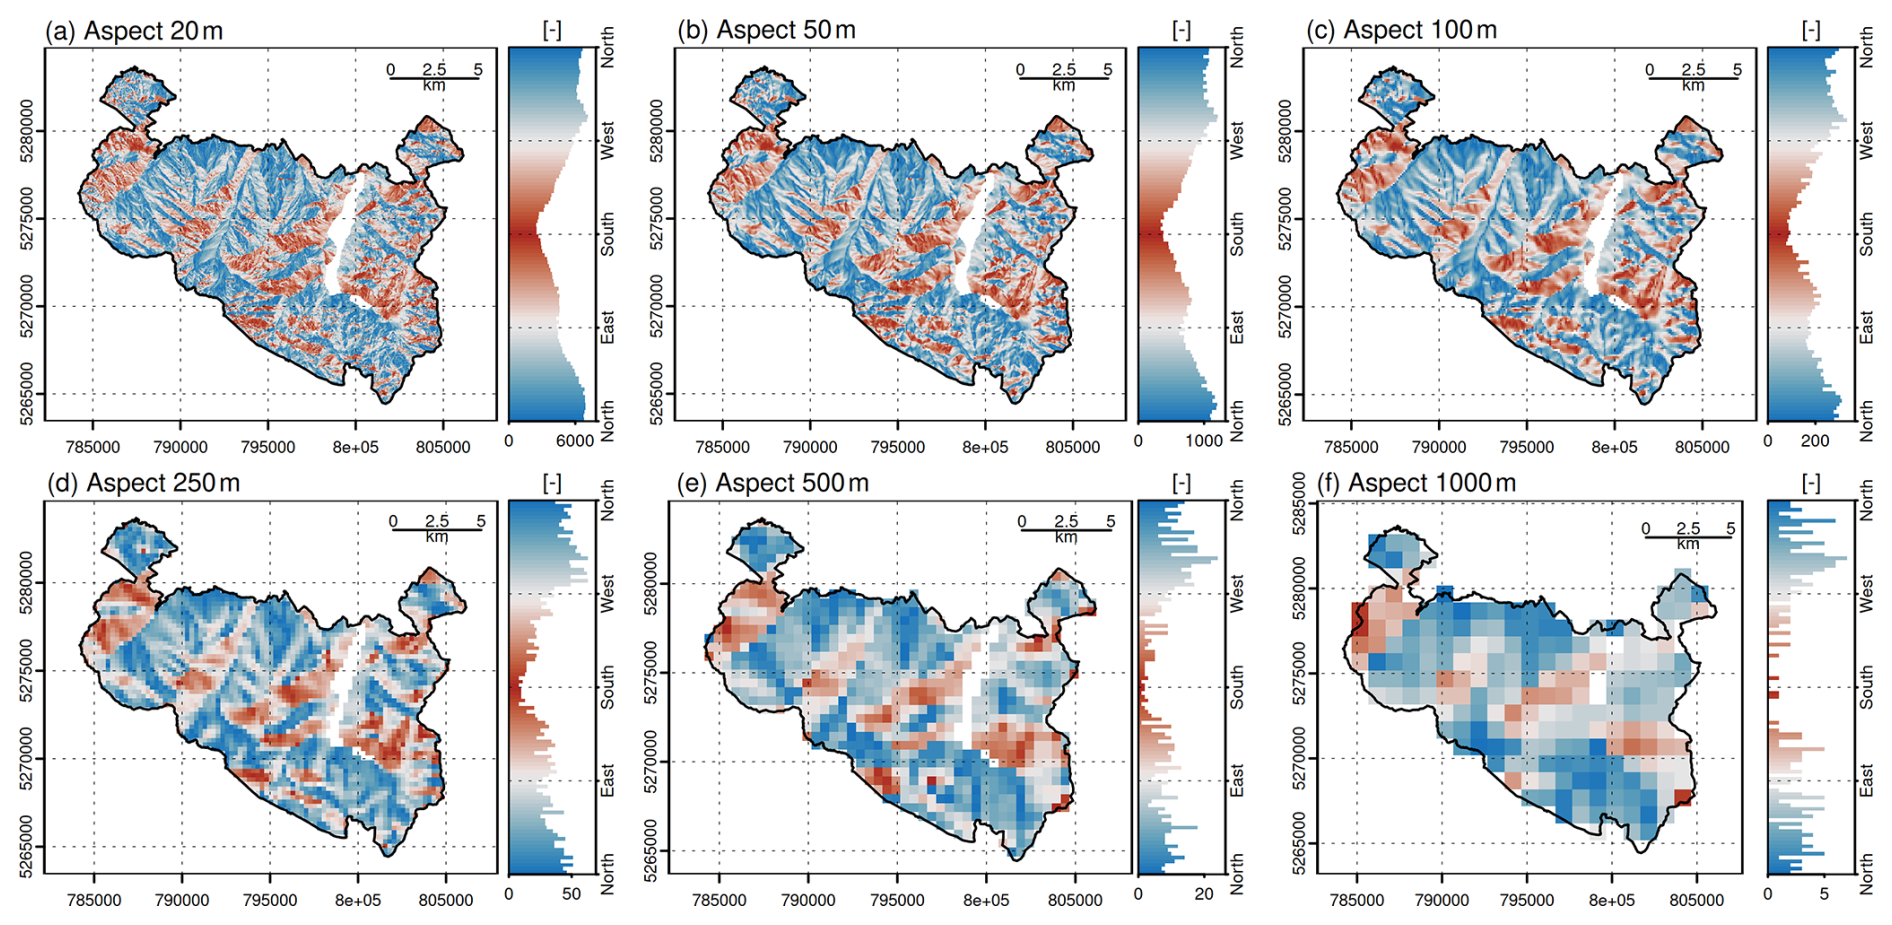
Figure A2Aspects for the BGNP for different spatial resolutions: 20 m (a), 50 m (b), 100 m (c), 250 m (d), 500 m (e) and 1000 m (f). The frequency of different aspects is shown in the panel to the right of each map.
The pixel-by-pixel comparison based on FSC maps derived from Sentinel-2 images indicates an average accuracy for the months February to July between 0.82 and 0.93 (Fig. B2). Our results indicate that the coarser the spatial resolution of the model run and the re-sampled satellite image, the higher the accuracy obtained by this pixel-by-pixel comparison (Figs. B1 and B2). Using the energy balance approach, an overestimation of the snow cover shows up at the beginning of the snowmelt season. The deviations between simulated and observed snow cover at the end of the snowmelt seasons, however, are due to an underestimation error, i.e., too little snow covered area in the model simulations (Fig. B2c1–c6). The comparison of the simulated build-up and melt of the seasonal snow cover with MODIS snow cover extent data for the 10 year period October 2013–September 2023 indicates a good agreement between simulated and satellite-based data (Figs. B3 and B4). Looking at the evolution of the seasonal snow cover as the extent over the entire non-forested area, only very little differences show up between the different spatial resolutions, and the snow cover extent curves largely overlap for all snowmelt modelling approaches (Fig. B4). For individual years (e.g., 2015 and 2016), the empirical snowmelt modelling approaches seem to produce a too late melt of the snow cover in the high elevations (Fig. B4a and b). The calculated NSE values range from 0.86–0.93.
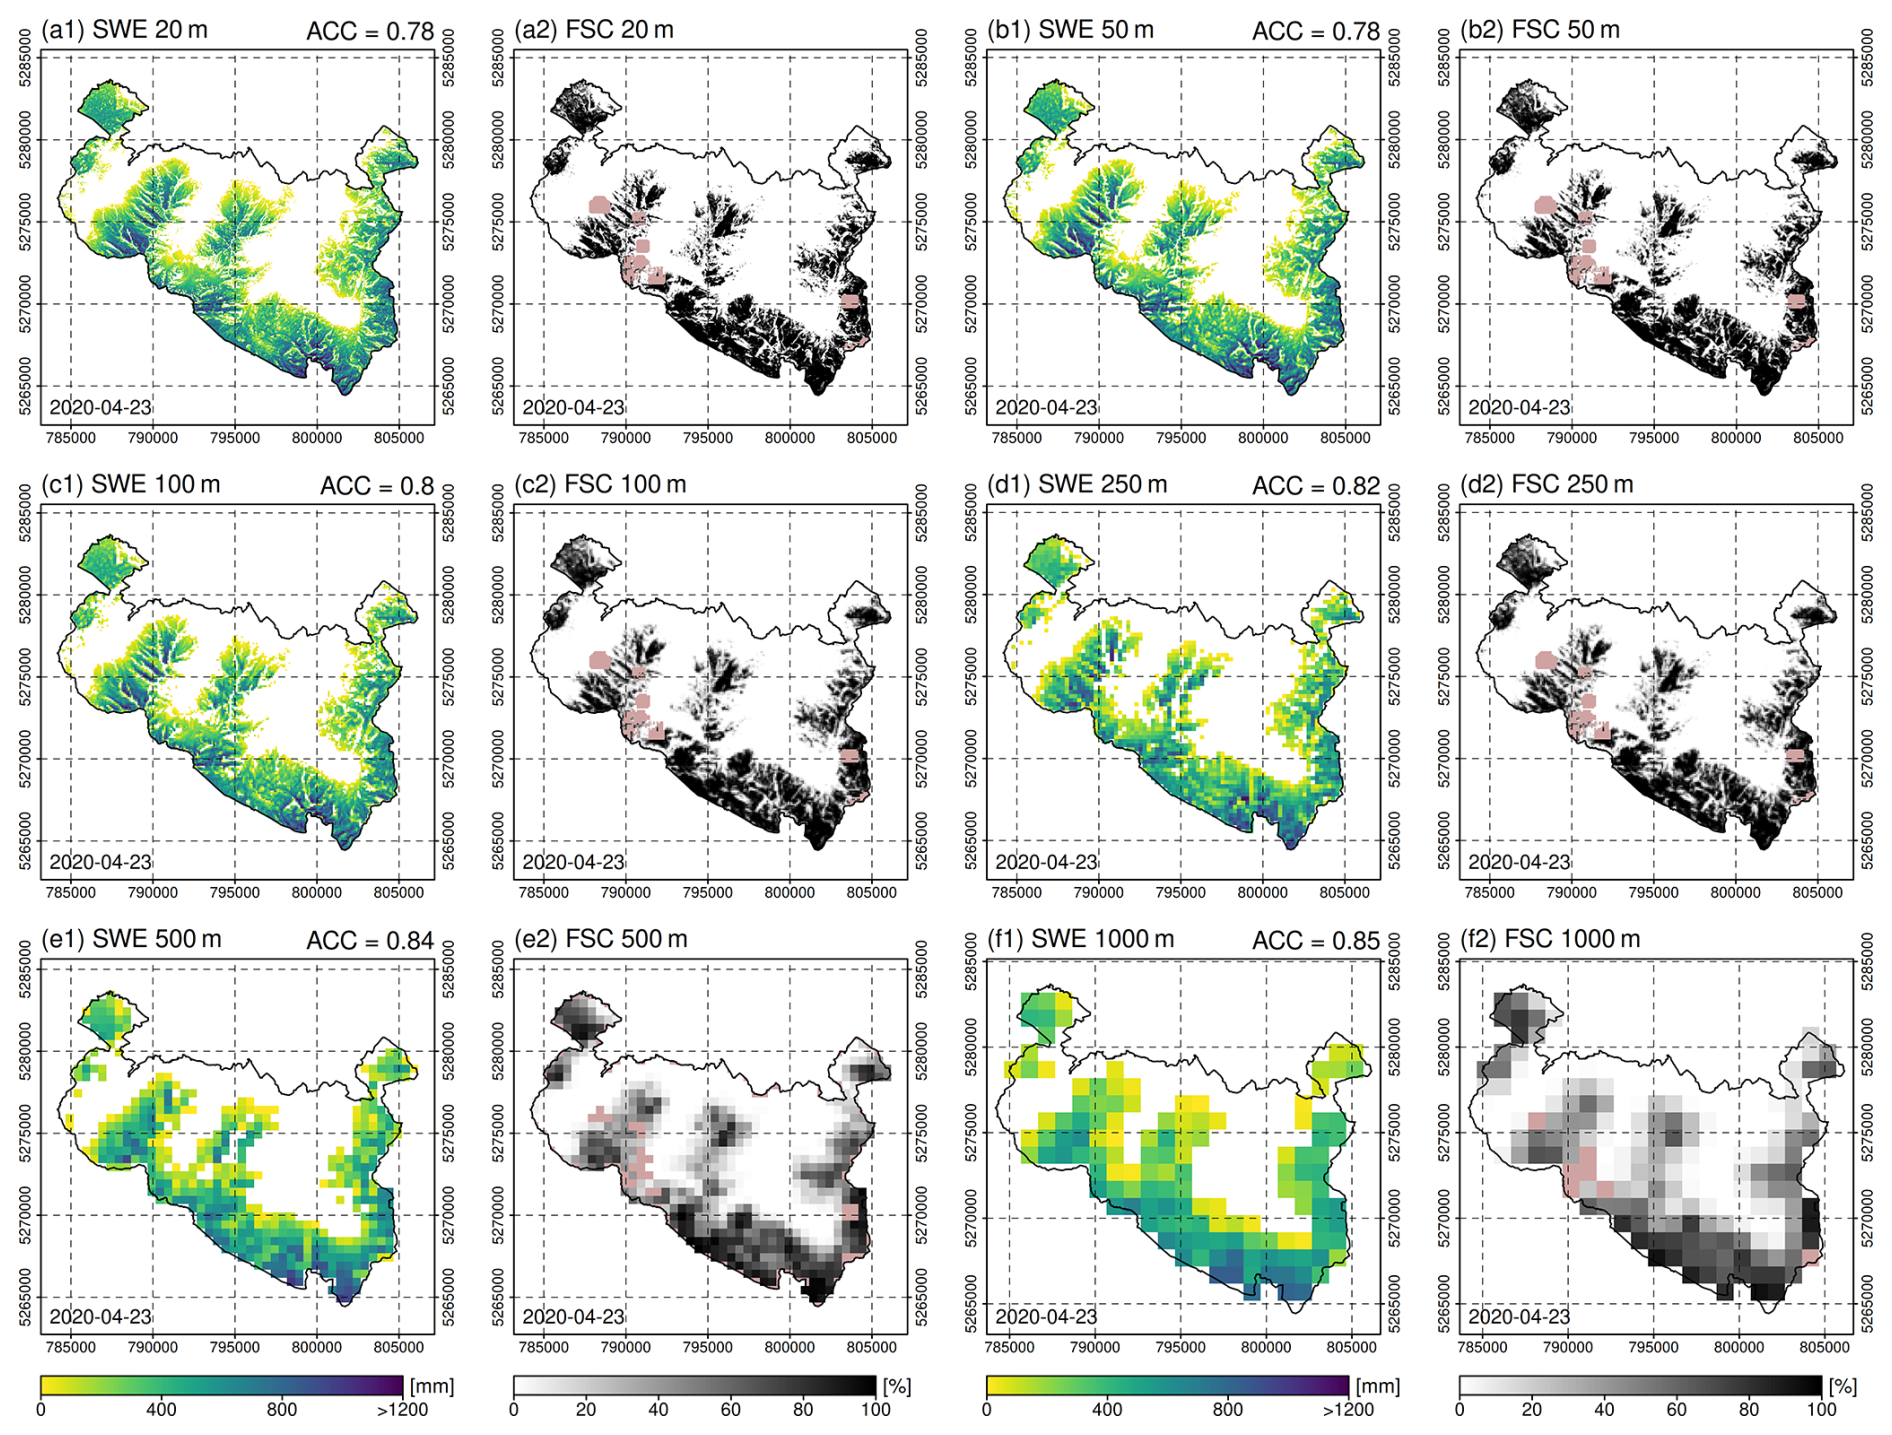
Figure B1Simulated snow water equivalent (SWE) using the energy balance approach available in openAMUNDSEN and satellite-based fractional snow cover (FSC) maps derived from Sentinel-2 data for the BGNP on 23 April 2020 for different grid resolutions: 20 m (a), 50 m (b), 100 m (c), 250 m (d), 500 m (e) and 1000 m (f). The accuracy (ACC) assessed comparing the simulated SWE with the corresponding re-sampled satellite-based FSC observation is noted on the top-right of each SWE map.
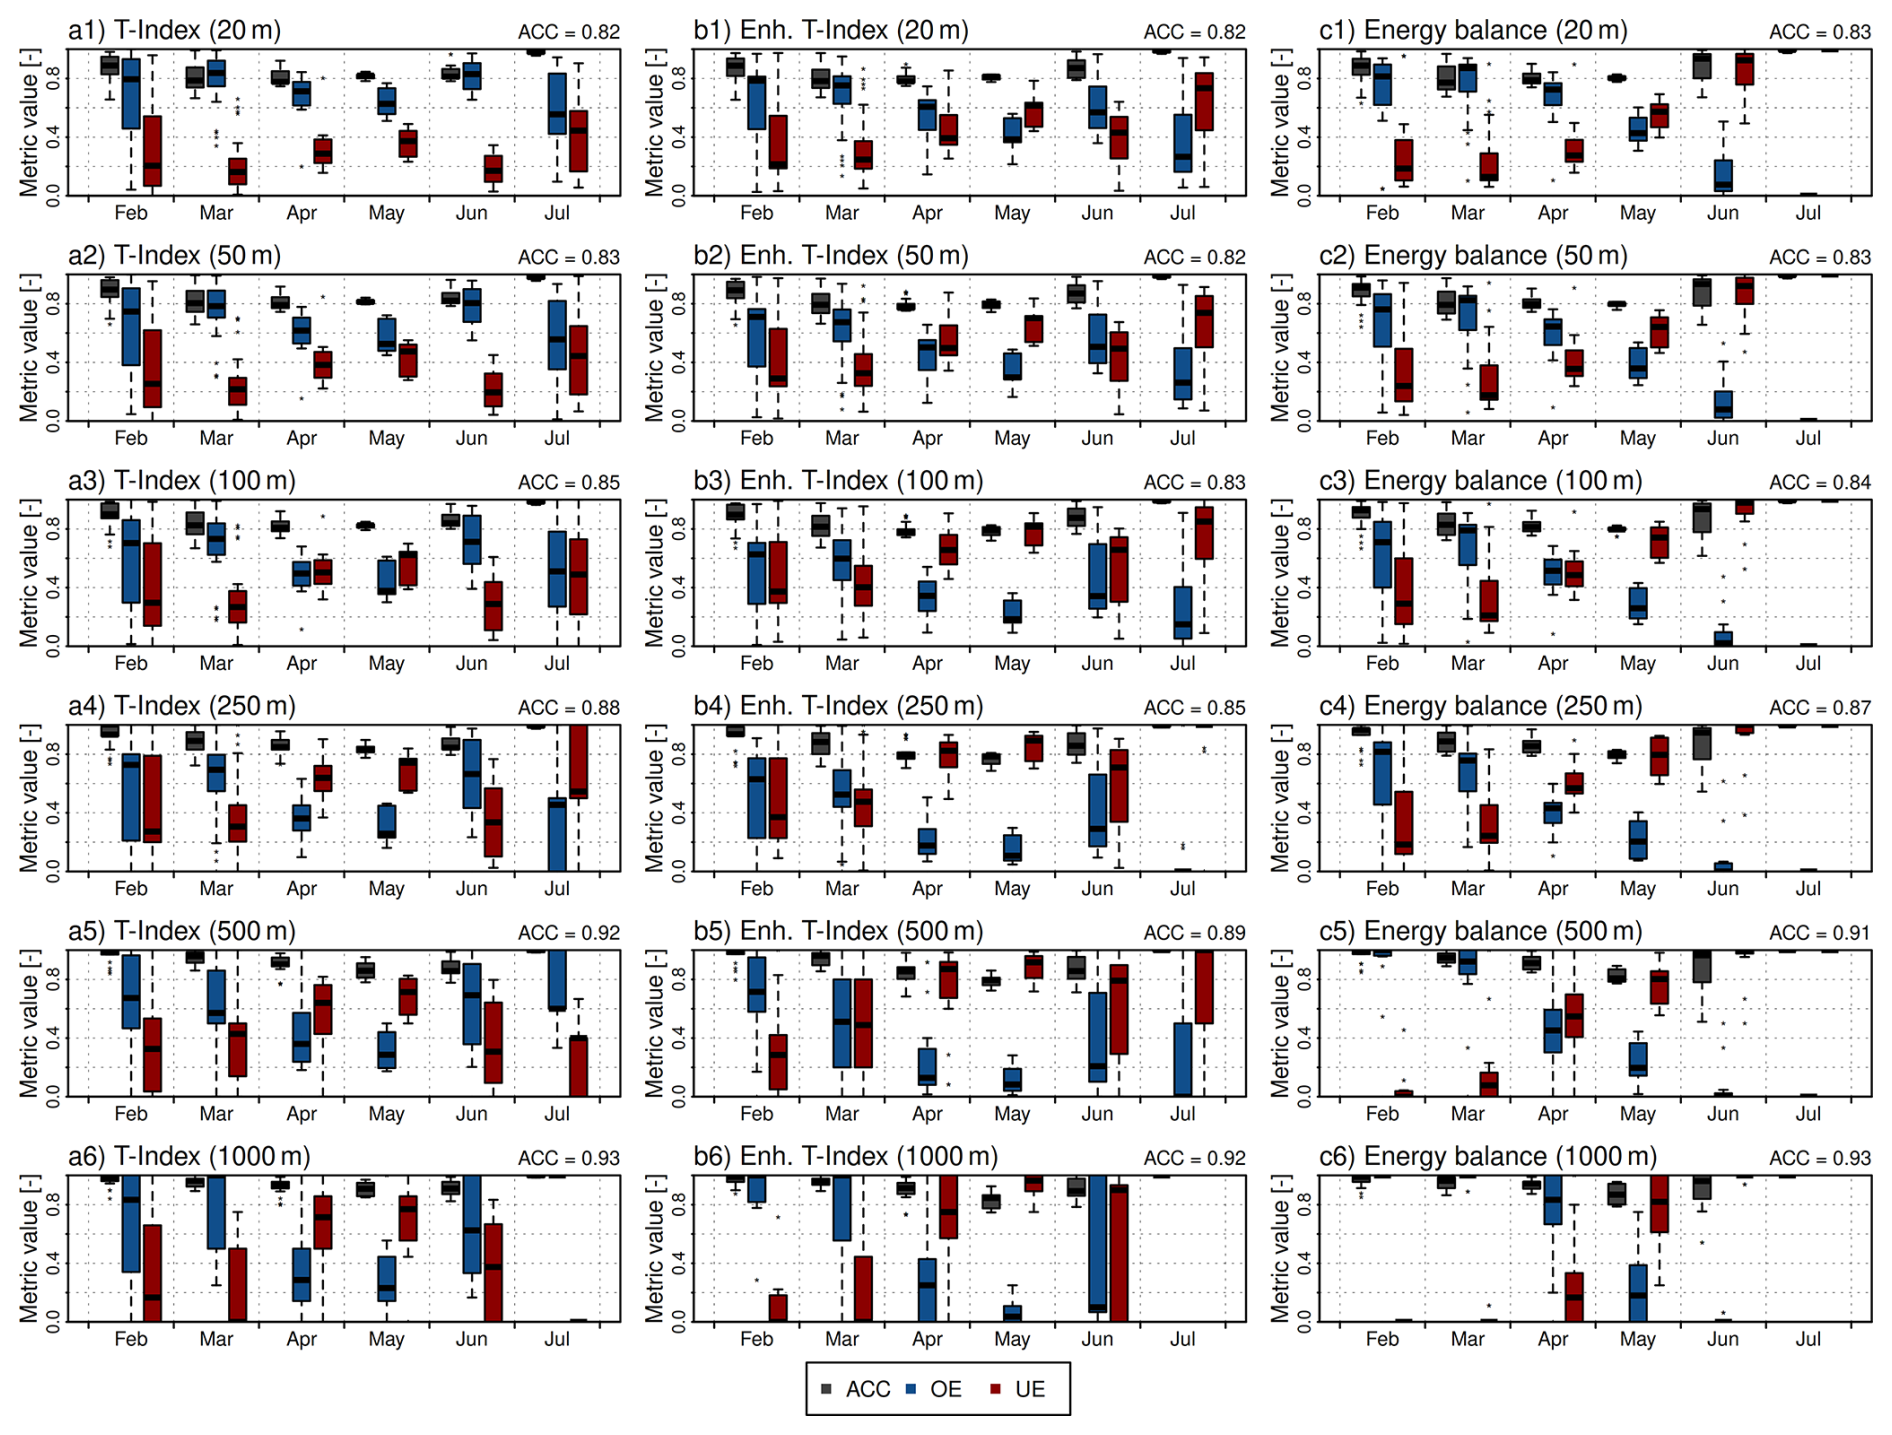
Figure B2Evaluation of openAMUNDSEN snow simulations in different spatial resolutions for non-forested areas in the BGNP between February and July using fractional snow cover (FSC) maps derived from Sentinel-2 data by means of accuracy (ACC), overestimation error (OE) and underestimation error (UE) for images with not more than 50 % cloud coverage. The average ACC for all scenes is noted on the top-right of the plot panels.
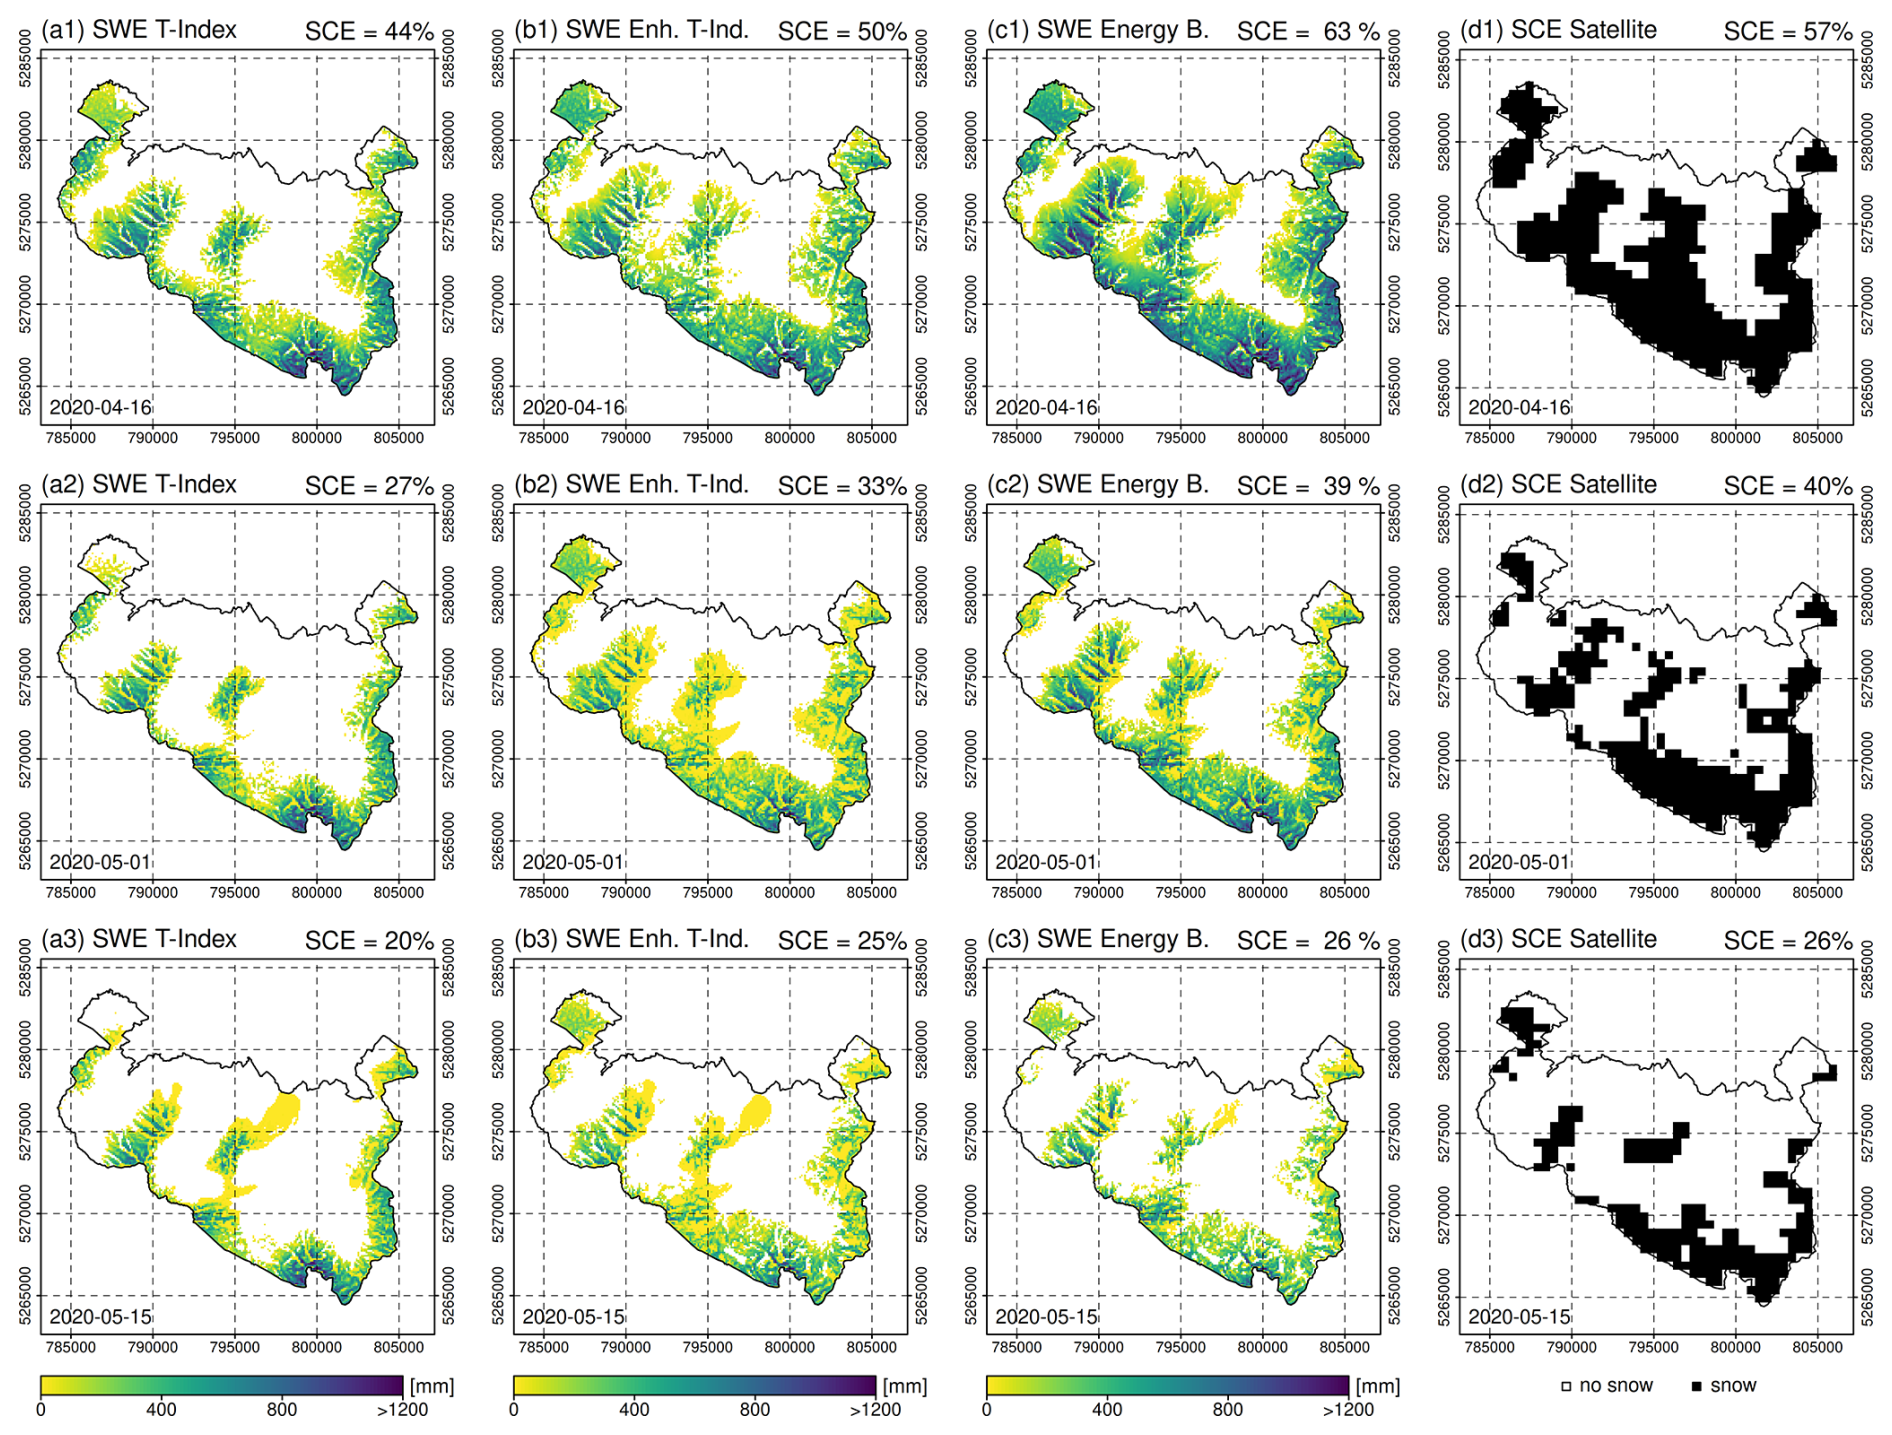
Figure B3Simulated snow water equivalent (SWE) using the T-Index (a), enhanced T-index (b) and energy balance (c) snowmelt simulation approaches available in the openAMUNDSEN snow model with a spatial resolution of 100 m and satellite-based snow cover extend maps (SCE) derived from MODIS snow cover data (d) for the BGNP and the three selected days: (1) 16 April 2020, (2) 1 May 2020 and (3) 15 April 2020. The total snow covered extent (SCE) is noted on the top-right of each map.

Figure B4Evaluation of the openAMUNDSEN snow simulations for non-forested areas of the BGNP conducted using the T-index (a), enhanced T-index (b) and energy balance (c) snowmelt simulation approaches available in the openAMUNDSEN snow model by comparing the evolution of the simulated snow cover extent with the snow cover extent from MODIS satellite data for the time period October 2013–September 2023. The Nash–Sutcliffe-Efficiency (NSE) for model runs with different spatial resolutions is noted on the top-right of each panel.
The openAMUNDSEN model source code including sample data and instruction on how to install and run the model is available on GitHub (https://github.com/openamundsen/openamundsen, last access: 28 July 2025, Hanzer et al., 2026a). The source code of the stochastic block bootstrap resampler (climate generator) is available as pre-processing routine along with the openAMUNDSEN model (https://github.com/openamundsen/openamundsen-climategenerator, last access: 28 July 2025, Hanzer et al., 2026b). The model set-up of the BGNP used including model configuration files with all parameter settings, different land cover maps, scripts used to prepare land cover maps as well as a script to run the model is available at: https://doi.org/10.23728/B2SHARE.530A7560A73647459969F5C 21639E8CB (Rottler et al., 2025).
ER designed and carried out the snow modelling and data analysis, produced the figures and wrote the first draft of the manuscript. All co-authors contributed to the concept of the study design and the discussion of the snow model results, and all co-authors contributed to the paper-writing process. In addition, BS supported the pre-processing of the openAMUNDSEN input data and the evaluation of the snow model performance, US developed the original versions of the openAMUNDSEN snow model and the climate generator, and FH implemented the latter in its current Python-based version into the openAMUNDSEN model framework.
The contact author has declared that none of the authors has any competing interests.
Publisher's note: Copernicus Publications remains neutral with regard to jurisdictional claims made in the text, published maps, institutional affiliations, or any other geographical representation in this paper. The authors bear the ultimate responsibility for providing appropriate place names. Views expressed in the text are those of the authors and do not necessarily reflect the views of the publisher.
We thank the administration and the research department of the Berchtesgaden National Park and the colleagues of the MiKRoNP project for the provision of data and for their support. The project MiKRoNP (Project-No. 80489), which aims to identify microclimatic refugia and hotspots in a changing climate in the Bavarian National Parks, is financed by the Bavarian State Ministry of the Environment and Consumer Protection. The co-author Brage Storebakken receives support for his PhD from this project. The co-author Elena Bertazza has received funding from the Austrian Climate Research Programme (ACRP) within the project VecParClim (Project-No. FO999913123), which aims to assess the impact of climate change on arthropod vectors and selected parasites in Alpine Pastures. Furthermore, we thank the European Union's Copernicus Land Monitoring Service (CLMS) for the provision of the fractional snow cover data and the colleagues from the German Aerospace Center (DLR) for the “Global SnowPack” data. The University of Innsbruck generously supported the development and provision of the openAMUNDSEN model as an open-source project to the scientific community. We used GPT-5 (from Academic AI offered by the University of Innsbruck and based on OpenAI's ChatGPT, last access: 2 April 2026) to improve language and grammar during the revision of the manuscript. It was solely used to suggest rephrasing of existing text, mainly single sentences. No content, analyses, or interpretations were generated by the tool. All text was reviewed and edited by the authors, who take full responsibility for the manuscript. Furthermore, we thank the Vice Rectorate for Research and the Faculty of Geo- and Atmospheric Sciences to support the open-access publication of this paper. The scientific analyses in this study were conducted in the framework of the research area “Mountain Regions”.
This research has been supported by the Bayerisches Staatsministerium für Umwelt und Verbraucherschutz (grant-no. 80489) and the Österreichische Forschungsförderungsgesellschaft (grant-no. FO999913123).
This paper was edited by Philip Marsh and reviewed by Richard L. H. Essery and Maheswor Shrestha.
Adhikari, T. R., Talchabhadel, R., Shrestha, S., Sharma, S., Aryal, D., and Pradhanang, S. M.: The evaluation of climate change impact on hydrologic processes of a mountain river basin, Theor. Appl. Climatol., 150, 749–762, https://doi.org/10.1007/s00704-022-04204-3, 2022. a
Albrich, K., Seidl, R., Rammer, W., and Thom, D.: From sink to source: changing climate and disturbance regimes could tip the 21st century carbon balance of an unmanaged mountain forest landscape, Forestry, 96, 399–409, https://doi.org/10.1093/forestry/cpac022, 2022. a
Alonso-González, E., Gutmann, E., Aalstad, K., Fayad, A., Bouchet, M., and Gascoin, S.: Snowpack dynamics in the Lebanese mountains from quasi-dynamically downscaled ERA5 reanalysis updated by assimilating remotely sensed fractional snow-covered area, Hydrol. Earth Syst. Sci., 25, 4455–4471, https://doi.org/10.5194/hess-25-4455-2021, 2021. a
Bair, E. H., Stillinger, T., and Dozier, J.: Snow Property Inversion From Remote Sensing (SPIReS): A Generalized Multispectral Unmixing Approach With Examples From MODIS and Landsat 8 OLI, IEEE T. Geosci. Remote, 59, 7270–7284, https://doi.org/10.1109/TGRS.2020.3040328, 2021. a
Ban, N., Caillaud, C., Coppola, E., et al.: The first multi-model ensemble of regional climate simulations at kilometer-scale resolution, part I: evaluation of precipitation, Clim. Dynam., 57, 275–302, https://doi.org/10.1007/s00382-021-05708-w, 2021. a, b
Beniston, M., Farinotti, D., Stoffel, M., Andreassen, L. M., Coppola, E., Eckert, N., Fantini, A., Giacona, F., Hauck, C., Huss, M., Huwald, H., Lehning, M., López-Moreno, J.-I., Magnusson, J., Marty, C., Morán-Tejéda, E., Morin, S., Naaim, M., Provenzale, A., Rabatel, A., Six, D., Stötter, J., Strasser, U., Terzago, S., and Vincent, C.: The European mountain cryosphere: a review of its current state, trends, and future challenges, The Cryosphere, 12, 759–794, https://doi.org/10.5194/tc-12-759-2018, 2018. a
Bergström, S.: The HBV model, in: Computer models of watershed hydrology, edited by: Singh, V. P., Highlands Ranch, CO, Water Resources Publications, 443–476, 1995. a
Bernhardt, M., Schulz, K., Liston, G., and Zängl, G.: The influence of lateral snow redistribution processes on snow melt and sublimation in alpine regions, J. Hydrol., 424–425, 196–206, https://doi.org/10.1016/j.jhydrol.2012.01.001, 2012. a
Braziunas, K. H., Geres, L., Richter, T., Glasmann, F., Senf, C., Thom, D., Seibold, S., and Seidl, R.: Projected climate and canopy change lead to thermophilization and homogenization of forest floor vegetation in a hotspot of plant species richness, Glob. Change Biol., 30, e17121, https://doi.org/10.1111/gcb.17121, 2024. a
Brun, É., Vionnet, V., Morin, S., Boone, A., Martin, É., Faroux, S., Le Moigne, P., and Willemet, J.-M.: Le modèle de manteau neigeux Crocus et ses applications, La Météorologie, 44–54, https://doi.org/10.4267/2042/47245, 2012. a
Bürger, G., Schulla, J., and Werner, A. T.: Estimates of future flow, including extremes, of the Columbia River headwaters, Water Resour. Res., 47, https://doi.org/10.1029/2010WR009716, 2011. a
Collier, E. and Mölg, T.: BAYWRF: a high-resolution present-day climatological atmospheric dataset for Bavaria, Earth Syst. Sci. Data, 12, 3097–3112, https://doi.org/10.5194/essd-12-3097-2020, 2020. a
Collier, E., Ban, N., Richter, N., Ahrens, B., Chen, D., Chen, X., Lai, H.-W., Leung, R., Li, L., Medvedova, A., Ou, T., Pothapakula, P. K., Potter, E., Prein, A. F., Sakaguchi, K., Schroeder, M., Singh, P., Sobolowski, S., Sugimoto, S., Tang, J., Yu, H., and Ziska, C.: The first ensemble of kilometer-scale simulations of a hydrological year over the third pole, Clim. Dynam., 62, 7501–7518, https://doi.org/10.1007/s00382-024-07291-2, 2024. a, b
Coron, L., Thirel, G., Delaigue, O., Perrin, C., and Andréassian, V.: The suite of lumped GR hydrological models in an R package, Environ. Modell. Softw., 94, 166–171, https://doi.org/10.1016/j.envsoft.2017.05.002, 2017. a
Corripio, J. G. and López-Moreno, J. I.: Analysis and Predictability of the Hydrological Response of Mountain Catchments to Heavy Rain on Snow Events: A Case Study in the Spanish Pyrenees, Hydrology, 4, https://doi.org/10.3390/hydrology4020020, 2017. a
Dakhlaoui, H., Hakala, K., and Seibert, J.: Hydrological Impacts of Projected Climate Change on Northern Tunisian Headwater Catchments – An Ensemble Approach Addressing Uncertainties, Springer International Publishing, 499–519, https://doi.org/10.1007/978-3-030-78566-6_24, 2022. a
Dietz, A. J., Wohner, C., and Kuenzer, C.: European Snow Cover Characteristics between 2000 and 2011 Derived from Improved MODIS Daily Snow Cover Products, Remote Sens.-Basel, 4, 2432–2454, https://doi.org/10.3390/rs4082432, 2012. a
Dietz, A. J., Kuenzer, C., and Conrad, C.: Snow-cover variability in central Asia between 2000 and 2011 derived from improved MODIS daily snow-cover products, Int. J. Remote Sens., 34, 3879–3902, https://doi.org/10.1080/01431161.2013.767480, 2013. a
Dietz, A. J., Conrad, C., Kuenzer, C., Gesell, G., and Dech, S.: Identifying Changing Snow Cover Characteristics in Central Asia between 1986 and 2014 from Remote Sensing Data, Remote Sens.-Basel, 6, 12752–12775, https://doi.org/10.3390/rs61212752, 2014. a
Dietz, A. J., Kuenzer, C., and Dech, S.: Global SnowPack: a new set of snow cover parameters for studying status and dynamics of the planetary snow cover extent, Remote Sens. Lett., 6, 844–853, https://doi.org/10.1080/2150704X.2015.1084551, 2015. a
Dollinger, C., Rammer, W., and Seidl, R.: Climate change accelerates ecosystem restoration in the mountain forests of Central Europe, J. Appl. Ecol., 60, 2665–2675, https://doi.org/10.1111/1365-2664.14520, 2023. a
Essery, R.: A factorial snowpack model (FSM 1.0), Geosci. Model Dev., 8, 3867–3876, https://doi.org/10.5194/gmd-8-3867-2015, 2015. a
Essery, R. and Etchevers, P.: Parameter sensitivity in simulations of snowmelt, J. Geophys. Res.-Atmos., 109, https://doi.org/10.1029/2004JD005036, 2004. a
Essery, R., Rutter, N., Pomeroy, J., Baxter, R., Stähli, M., Gustafsson, D., Barr, A., Bartlett, P., and Elder, K.: SNOWMIP2: An Evaluation of Forest Snow Process Simulations, B. Am. Meteorol. Soc., 90, 1120–1136, https://doi.org/10.1175/2009BAMS2629.1, 2009. a
Essery, R., Morin, S., Lejeune, Y., and B Ménard, C.: A comparison of 1701 snow models using observations from an alpine site, Adv. Water Resour., 55, 131–148, https://doi.org/10.1016/j.advwatres.2012.07.013, 2013. a
Essery, R., Mazzotti, G., Barr, S., Jonas, T., Quaife, T., and Rutter, N.: A Flexible Snow Model (FSM 2.1.1) including a forest canopy, Geosci. Model Dev., 18, 3583–3605, https://doi.org/10.5194/gmd-18-3583-2025, 2025. a
Freudiger, D., Kohn, I., Seibert, J., Stahl, K., and Weiler, M.: Snow redistribution for the hydrological modeling of alpine catchments, WIREs Water, 4, e1232, https://doi.org/10.1002/wat2.1232, 2017. a, b
Girons Lopez, M., Vis, M. J. P., Jenicek, M., Griessinger, N., and Seibert, J.: Assessing the degree of detail of temperature-based snow routines for runoff modelling in mountainous areas in central Europe, Hydrol. Earth Syst. Sci., 24, 4441–4461, https://doi.org/10.5194/hess-24-4441-2020, 2020. a
Gobiet, A., Kotlarski, S., Beniston, M., Heinrich, G., Rajczak, J., and Stoffel, M.: 21st century climate change in the European Alps – A review, Sci. Total Environ., 493, 1138–1151, https://doi.org/10.1016/j.scitotenv.2013.07.050, 2014. a
Günther, D., Marke, T., Essery, R., and Strasser, U.: Uncertainties in Snowpack Simulations – Assessing the Impact of Model Structure, Parameter Choice, and Forcing Data Error on Point-Scale Energy Balance Snow Model Performance, Water Resour. Res., 55, 2779–2800, https://doi.org/10.1029/2018WR023403, 2019. a
Günther, D., Hanzer, F., Warscher, M., Essery, R., and Strasser, U.: Including Parameter Uncertainty in an Intercomparison of Physically-Based Snow Models, Front. Earth Sci., 8, https://doi.org/10.3389/feart.2020.542599, 2020. a
Hanus, S., Hrachowitz, M., Zekollari, H., Schoups, G., Vizcaino, M., and Kaitna, R.: Future changes in annual, seasonal and monthly runoff signatures in contrasting Alpine catchments in Austria, Hydrol. Earth Syst. Sci., 25, 3429–3453, https://doi.org/10.5194/hess-25-3429-2021, 2021. a
Hanzer, F., Helfricht, K., Marke, T., and Strasser, U.: Multilevel spatiotemporal validation of snow/ice mass balance and runoff modeling in glacierized catchments, The Cryosphere, 10, 1859–1881, https://doi.org/10.5194/tc-10-1859-2016, 2016. a, b
Hanzer, F., Förster, K., Nemec, J., and Strasser, U.: Projected cryospheric and hydrological impacts of 21st century climate change in the Ötztal Alps (Austria) simulated using a physically based approach, Hydrol. Earth Syst. Sci., 22, 1593–1614, https://doi.org/10.5194/hess-22-1593-2018, 2018. a
Hanzer, F., Kollert, A., and Warscher, M.: openamundsen/openamundsen: v1.2.1 (v1.2.1), Zenodo [data set], https://doi.org/10.5281/zenodo.19108928, 2026a. a
Hanzer, F., Kollert, A., and Warscher, M.: openAMUNDSEN climate generator v0.2.0 (v0.2.0), Zenodo [data set], https://doi.org/10.5281/zenodo.19662555, 2026b. a
Hao, S., Jiang, L., Shi, J., Wang, G., and Liu, X.: Assessment of MODIS-Based Fractional Snow Cover Products Over the Tibetan Plateau, IEEE J. Sel. Top. Appl., 12, 533–548, https://doi.org/10.1109/JSTARS.2018.2879666, 2019. a
Hock, R.: Temperature index melt modelling in mountain areas, J. Hydrol., 282, 104–115, https://doi.org/10.1016/S0022-1694(03)00257-9, 2003. a
Hofmeister, F., Arias-Rodriguez, L. F., Premier, V., Marin, C., Notarnicola, C., Disse, M., and Chiogna, G.: Intercomparison of Sentinel-2 and modelled snow cover maps in a high-elevation Alpine catchment, J. Hydrol. X, 15, 100123, https://doi.org/j.hydroa.2022.100123, 2022. a
Ismail, M. F., Bogacki, W., Disse, M., Schäfer, M., and Kirschbauer, L.: Estimating degree-day factors of snow based on energy flux components, The Cryosphere, 17, 211–231, https://doi.org/10.5194/tc-17-211-2023, 2023. a
Keuris, L., Hetzenecker, M., Nagler, T., Mölg, N., and Schwaizer, G.: An Adaptive Method for the Estimation of Snow-Covered Fraction with Error Propagation for Applications from Local to Global Scales, Remote Sens.-Basel, 15, https://doi.org/10.3390/rs15051231, 2023. a
Kochendorfer, J., Rasmussen, R., Wolff, M., Baker, B., Hall, M. E., Meyers, T., Landolt, S., Jachcik, A., Isaksen, K., Brækkan, R., and Leeper, R.: The quantification and correction of wind-induced precipitation measurement errors, Hydrol. Earth Syst. Sci., 21, 1973–1989, https://doi.org/10.5194/hess-21-1973-2017, 2017. a
Kotlarski, S., Gobiet, A., Morin, S., Olefs, M., Rajczak, J., and Samacoïts, R.: 21st Century alpine climate change, Clim. Dynam., 60, 65–86, https://doi.org/10.1007/s00382-022-06303-3, 2023. a, b, c
Kraller, G., Warscher, M., Kunstmann, H., Vogl, S., Marke, T., and Strasser, U.: Water balance estimation in high Alpine terrain by combining distributed modeling and a neural network approach (Berchtesgaden Alps, Germany), Hydrol. Earth Syst. Sci., 16, 1969–1990, https://doi.org/10.5194/hess-16-1969-2012, 2012. a
Lafaysse, M., Cluzet, B., Dumont, M., Lejeune, Y., Vionnet, V., and Morin, S.: A multiphysical ensemble system of numerical snow modelling, The Cryosphere, 11, 1173–1198, https://doi.org/10.5194/tc-11-1173-2017, 2017. a
Liu, L., Ma, Y., Menenti, M., Zhang, X., and Ma, W.: Evaluation of WRF Modeling in Relation to Different Land Surface Schemes and Initial and Boundary Conditions: A Snow Event Simulation Over the Tibetan Plateau, J. Geophys. Res.-Atmos., 124, 209–226, https://doi.org/10.1029/2018JD029208, 2019. a
Lucas-Picher, P., Argüeso, D., Brisson, E., Tramblay, Y., Berg, P., Lemonsu, A., Kotlarski, S., and Caillaud, C.: Convection-permitting modeling with regional climate models: Latest developments and next steps, WIREs Clim. Change, 12, e731, https://doi.org/10.1002/wcc.731, 2021. a
Luo, L., Zhang, J., Hock, R., and Yao, Y.: Case Study of Blowing Snow Impacts on the Antarctic Peninsula Lower Atmosphere and Surface Simulated With a Snow/Ice Enhanced WRF Model, J. Geophys. Res.-Atmos., 126, e2020JD033936, https://doi.org/10.1029/2020JD033936, 2021. a
Magnusson, J., Wever, N., Essery, R., Helbig, N., Winstral, A., and Jonas, T.: Evaluating snow models with varying process representations for hydrological applications, Water Resour. Res., 51, 2707–2723, https://doi.org/10.1002/2014WR016498, 2015. a
Marke, T., Strasser, U., Hanzer, F., Stötter, J., Wilcke, R. A. I., and Gobiet, A.: Scenarios of Future Snow Conditions in Styria (Austrian Alps), J. Hydrometeorol., 16, 261–277, https://doi.org/10.1175/JHM-D-14-0035.1, 2015. a
Marsoner, T., Simion, H., Giombini, V., Egarter Vigl, L., and Candiago, S.: A detailed land use/land cover map for the European Alps macro region, Sci. Data, 10, 468, https://doi.org/10.1038/s41597-023-02344-3, 2023. a, b, c
Marty, C., Schlögl, S., Bavay, M., and Lehning, M.: How much can we save? Impact of different emission scenarios on future snow cover in the Alps, The Cryosphere, 11, 517–529, https://doi.org/10.5194/tc-11-517-2017, 2017. a
Marx, A., Kumar, R., Thober, S., Rakovec, O., Wanders, N., Zink, M., Wood, E. F., Pan, M., Sheffield, J., and Samaniego, L.: Climate change alters low flows in Europe under global warming of 1.5, 2, and 3 °C, Hydrol. Earth Syst. Sci., 22, 1017–1032, https://doi.org/10.5194/hess-22-1017-2018, 2018. a
Matiu, M., Crespi, A., Bertoldi, G., Carmagnola, C. M., Marty, C., Morin, S., Schöner, W., Cat Berro, D., Chiogna, G., De Gregorio, L., Kotlarski, S., Majone, B., Resch, G., Terzago, S., Valt, M., Beozzo, W., Cianfarra, P., Gouttevin, I., Marcolini, G., Notarnicola, C., Petitta, M., Scherrer, S. C., Strasser, U., Winkler, M., Zebisch, M., Cicogna, A., Cremonini, R., Debernardi, A., Faletto, M., Gaddo, M., Giovannini, L., Mercalli, L., Soubeyroux, J.-M., Sušnik, A., Trenti, A., Urbani, S., and Weilguni, V.: Observed snow depth trends in the European Alps: 1971 to 2019, The Cryosphere, 15, 1343–1382, https://doi.org/10.5194/tc-15-1343-2021, 2021. a
Menard, C. B., Essery, R., Krinner, G., Arduini, G., Bartlett, P., Boone, A., Brutel-Vuilmet, C., Burke, E., Cuntz, M., Dai, Y., Decharme, B., Dutra, E., Fang, X., Fierz, C., Gusev, Y., Hagemann, S., Haverd, V., Kim, H., Lafaysse, M., Marke, T., Nasonova, O., Nitta, T., Niwano, M., Pomeroy, J., Schädler, G., Semenov, V. A., Smirnova, T., Strasser, U., Swenson, S., Turkov, D., Wever, N., and Yuan, H.: Scientific and Human Errors in a Snow Model Intercomparison, B. Am. Meteorol. Soc., 102, E61–E79, https://doi.org/10.1175/BAMS-D-19-0329.1, 2021. a
Mott, R., Vionnet, V., and Grünewald, T.: The Seasonal Snow Cover Dynamics: Review on Wind-Driven Coupling Processes, Front. Earth Sci., 6, https://doi.org/10.3389/feart.2018.00197, 2018. a
Muelchi, R., Rössler, O., Schwanbeck, J., Weingartner, R., and Martius, O.: River runoff in Switzerland in a changing climate – changes in moderate extremes and their seasonality, Hydrol. Earth Syst. Sci., 25, 3577–3594, https://doi.org/10.5194/hess-25-3577-2021, 2021. a
Olefs, M., Koch, R., Schöner, W., and Marke, T.: Changes in Snow Depth, Snow Cover Duration, and Potential Snowmaking Conditions in Austria, 1961–2020 – A Model Based Approach, Atmosphere-Basel, 11, https://doi.org/10.3390/atmos11121330, 2020. a
Padgham, M., Rudis, B., Lovelace, R., and Salmon, M.: osmdata, Journal of Open Source Software, 2, 305, https://doi.org/10.21105/joss.00305, 2017. a
Pellicciotti, F., Brock, B., Strasser, U., Burlando, P., Funk, M., and Corripio, J.: An enhanced temperature-index glacier melt model including the shortwave radiation balance: development and testing for Haut Glacier d'Arolla, Switzerland, J. Glaciol., 51, 573–587, https://doi.org/10.3189/172756505781829124, 2005. a
Pichelli, E., Coppola, E., Sobolowski, S., et al.: The first multi-model ensemble of regional climate simulations at kilometer-scale resolution part 2: historical and future simulations of precipitation, Clim. Dynam., 56, 3581–3602, https://doi.org/10.1007/s00382-021-05657-4, 2021. a, b
Pomeroy, J., Fang, X., and Ellis, C.: Sensitivity of snowmelt hydrology in Marmot Creek, Alberta, to forest cover disturbance, Hydrol. Process., 26, 1891–1904, https://doi.org/10.1002/hyp.9248, 2012. a
Prein, A. F., Ban, N., Ou, T., Tang, J., Sakaguchi, K., Collier, E., Jayanarayanan, S., Li, L., Sobolowski, S., Chen, X., Zhou, X., Lai, H.-W., Sugimoto, S., Zou, L., ul Hasson, S., Ekstrom, M., Pothapakula, P. K., Ahrens, B., Stuart, R., Steen-Larsen, H. C., Leung, R., Belusic, D., Kukulies, J., Curio, J., and Chen, D.: Towards ensemble-based kilometer-scale climate simulations over the third pole region, Clim. Dynam., 60, 4055–4081, https://doi.org/10.1007/s00382-022-06543-3, 2023. a
Quéno, L., Mott, R., Morin, P., Cluzet, B., Mazzotti, G., and Jonas, T.: Snow redistribution in an intermediate-complexity snow hydrology modelling framework, The Cryosphere, 18, 3533–3557, https://doi.org/10.5194/tc-18-3533-2024, 2024. a, b
Raparelli, E., Tuccella, P., Colaiuda, V., and Marzano, F. S.: Snow cover prediction in the Italian central Apennines using weather forecast and land surface numerical models, The Cryosphere, 17, 519–538, https://doi.org/10.5194/tc-17-519-2023, 2023. a
Roessler, S. and Dietz, A. J.: Development of Global Snow Cover – Trends from 23 Years of Global SnowPack, Earth, 4, 1–22, https://doi.org/10.3390/earth4010001, 2023. a
Rottler, E., Bronstert, A., Bürger, G., and Rakovec, O.: Projected changes in Rhine River flood seasonality under global warming, Hydrol. Earth Syst. Sci., 25, 2353–2371, https://doi.org/10.5194/hess-25-2353-2021, 2021. a
Rottler, E., Warscher, M., Hanzer, F., and Strasser, U.: Spatio-temporal wet snow dynamics from model simulations and remote sensing: A case study from the Rofental, Austria, Hydrol. Process., 38, e15279, https://doi.org/10.1002/hyp.15279, 2024. a, b
Rottler, E., Storebakken, B., Warscher, M., Hanzer, F., Bertazza, E., and Strasser, U.: Assessment of snow model uncertainty in relation to the effect of a 1 °C warming using the snow modelling framework openAMUNDSEN, B2SHARE v2 [data set], https://doi.org/10.23728/b2share.530a7560a73647459969f5c21639e8cb, 2025. a
Rumpf, S. B., Gravey, M., Brönnimann, O., Luoto, M., Cianfrani, C., Mariethoz, G., and Guisan, A.: From white to green: Snow cover loss and increased vegetation productivity in the European Alps, Science, 376, 1119–1122, https://doi.org/10.1126/science.abn6697, 2022. a
Rößler, S., Witt, M. S., Ikonen, J., Brown, I. A., and Dietz, A. J.: Remote Sensing of Snow Cover Variability and Its Influence on the Runoff of Sápmi's Rivers, Geosciences, 11, https://doi.org/10.3390/geosciences11030130, 2021. a
Saigger, M., Sauter, T., Schmid, C., Collier, E., Goger, B., Kaser, G., Prinz, R., Voordendag, A., and Mölg, T.: A Drifting and Blowing Snow Scheme in the Weather Research and Forecasting Model, J. Adv. Model. Earth Sy., 16, e2023MS004007, https://doi.org/10.1029/2023MS004007, 2024. a
Samaniego, L., Kumar, R., and Attinger, S.: Multiscale parameter regionalization of a grid-based hydrologic model at the mesoscale, Water Resour. Res., 46, https://doi.org/10.1029/2008WR007327, 2010. a
Sanmiguel-Vallelado, A., McPhee, J., Carreño, P. E. O., Morán-Tejeda, E., Camarero, J. J., and López-Moreno, J. I.: Sensitivity of forest–snow interactions to climate forcing: Local variability in a Pyrenean valley, J. Hydrol., 605, 127311, https://doi.org/10.1016/j.jhydrol.2021.127311, 2022. a
Seibert, J. and Bergström, S.: A retrospective on hydrological catchment modelling based on half a century with the HBV model, Hydrol. Earth Syst. Sci., 26, 1371–1388, https://doi.org/10.5194/hess-26-1371-2022, 2022. a
Senf, C., Pflugmacher, D., Hostert, P., and Seidl, R.: Using Landsat time series for characterizing forest disturbance dynamics in the coupled human and natural systems of Central Europe, ISPRS J. Photogramm., 130, 453–463, https://doi.org/10.1016/j.isprsjprs.2017.07.004, 2017. a
Storebakken, B., Rottler, E., Warscher, M., and Strasser, U.: Modelling of the Seasonal Snow Cover Dynamics for Open and Forested Areas in the Berchtesgaden National Park (Germany) Using the openAMUNDSEN Mountain Snow Cover Model, Hydrol. Process., 39, e70197, https://doi.org/10.1002/hyp.70197, 2025. a, b, c, d, e
Strasser, U.: Modelling of the Mountain Snow Cover in the Berchtesgaden National Park, https://www.nationalpark-berchtesgaden.de/service/publikationen/forschungsberichte/doc/fb_55.pdf (last access: 7 July 2026), 2008. a, b, c
Strasser, U., Warscher, M., and Liston, G. E.: Modeling snow–canopy processes on an idealized mountain, J. Hydrometeorol., 12, 663–677, https://doi.org/10.1175/2011JHM1344.1, 2011. a
Strasser, U., Warscher, M., Rottler, E., and Hanzer, F.: openAMUNDSEN v1.0: an open-source snow-hydrological model for mountain regions, Geosci. Model Dev., 17, 6775–6797, https://doi.org/10.5194/gmd-17-6775-2024, 2024. a, b, c, d, e
Sun, N., Yan, H., Wigmosta, M. S., Lundquist, J., Dickerson-Lange, S., and Zhou, T.: Forest Canopy Density Effects on Snowpack Across the Climate Gradients of the Western United States Mountain Ranges, Water Resour. Res., 58, e2020WR029194, https://doi.org/10.1029/2020WR029194, 2022. a
Ten Berge, A. A., Booij, M. J., and Rientjes, T. H.: Robustness of hydrological models for simulating impacts of climate change on high and low streamflow, J. Hydrol., 133734, https://doi.org/10.1016/j.jhydrol.2025.133734, 2025. a
Thober, S., Kumar, R., Wanders, N., Marx, A., Pan, M., Rakovec, O., Samaniego, L., Sheffield, J., Wood, E. F., and Zink, M.: Multi-model ensemble projections of European river floods and high flows at 1.5, 2, and 3 degrees global warming, Environ. Res. Lett., 13, 014003, https://doi.org/10.1088/1748-9326/aa9e35, 2018. a
Thom, D., Rammer, W., Laux, P., Smiatek, G., Kunstmann, H., Seibold, S., and Seidl, R.: Will forest dynamics continue to accelerate throughout the 21st century in the Northern Alps?, Glob. Change Biol., 28, 3260–3274, https://doi.org/10.1111/gcb.16133, 2022. a
Verfaillie, D., Lafaysse, M., Déqué, M., Eckert, N., Lejeune, Y., and Morin, S.: Multi-component ensembles of future meteorological and natural snow conditions for 1500 m altitude in the Chartreuse mountain range, Northern French Alps, The Cryosphere, 12, 1249–1271, https://doi.org/10.5194/tc-12-1249-2018, 2018. a
Vernay, M., Lafaysse, M., Monteiro, D., Hagenmuller, P., Nheili, R., Samacoïts, R., Verfaillie, D., and Morin, S.: The S2M meteorological and snow cover reanalysis over the French mountainous areas: description and evaluation (1958–2021), Earth Syst. Sci. Data, 14, 1707–1733, https://doi.org/10.5194/essd-14-1707-2022, 2022. a
Vionnet, V., Brun, E., Morin, S., Boone, A., Faroux, S., Le Moigne, P., Martin, E., and Willemet, J.-M.: The detailed snowpack scheme Crocus and its implementation in SURFEX v7.2, Geosci. Model Dev., 5, 773–791, https://doi.org/10.5194/gmd-5-773-2012, 2012. a
Vormoor, K., Lawrence, D., Heistermann, M., and Bronstert, A.: Climate change impacts on the seasonality and generation processes of floods – projections and uncertainties for catchments with mixed snowmelt/rainfall regimes, Hydrol. Earth Syst. Sci., 19, 913–931, https://doi.org/10.5194/hess-19-913-2015, 2015. a, b
Vormoor, K., Herzog, A., Francke, T., and Bronstert, A.: Patterns and Processes of Diel Streamflow Cycles Along the Longitudinal Profile of an Alpine Headwater Stream, Hydrol. Process., 39, e70189, https://doi.org/10.1002/hyp.70189, 2025. a
Warscher, M., Strasser, U., Kraller, G., Marke, T., Franz, H., and Kunstmann, H.: Performance of complex snow cover descriptions in a distributed hydrological model system: A case study for the high Alpine terrain of the Berchtesgaden Alps, Water Resour. Res., 49, 2619–2637, https://doi.org/10.1002/wrcr.20219, 2013. a, b, c, d
Warscher, M., Wagner, S., Marke, T., Laux, P., Smiatek, G., Strasser, U., and Kunstmann, H.: A 5 km Resolution Regional Climate Simulation for Central Europe: Performance in High Mountain Areas and Seasonal, Regional and Elevation-Dependent Variations, Atmosphere, 10, https://doi.org/10.3390/atmos10110682, 2019. a
Weigand, M., Staab, J., Wurm, M., and Taubenböck, H.: Spatial and semantic effects of LUCAS samples on fully automated land use/land cover classification in high-resolution Sentinel-2 data, Int. J. Appl. Earth Obs., 88, 102065, https://doi.org/10.1016/j.jag.2020.102065, 2020. a
Xin, Q., Woodcock, C. E., Liu, J., Tan, B., Melloh, R. A., and Davis, R. E.: View angle effects on MODIS snow mapping in forests, Remote Sens. Environ., 118, 50–59, https://doi.org/10.1016/j.rse.2011.10.029, 2012. a
Yokoyama, R.: Visualizing topography by openness: A new application of image processing to digital elevation models, Photogramm. Eng. Remote Sens., 68, 257–265, 2002. a
Zanaga, D., Van De Kerchove, R., Daems, D., De Keersmaecker, W., Brockmann, C., Kirches, G., Wevers, J., Cartus, O., Santoro, M., Fritz, S., Lesiv, M., Herold, M., Tsendbazar, N.-E., Xu, P., Ramoino, F., and Arino, O.: ESA WorldCover 10 m 2021 v200, https://doi.org/10.5281/zenodo.7254221, 2022. a
Zhou, G., Cui, M., Wan, J., and Zhang, S.: A Review on Snowmelt Models: Progress and Prospect, Sustainability, 13, https://doi.org/10.3390/su132011485, 2021. a
Zhou, X., Ding, B., Yang, K., Pan, J., Ma, X., Zhao, L., Li, X., and Shi, J.: Reducing the Cold Bias of the WRF Model Over the Tibetan Plateau by Implementing a Snow Coverage-Topography Relationship and a Fresh Snow Albedo Scheme, J. Adv. Model. Earth Sy., 15, e2023MS003626, https://doi.org/10.1029/2023MS003626, 2023. a
- Abstract
- Introduction
- Study area and data
- Methods
- Results
- Discussion
- Conclusions
- Appendix A: Snow redistribution factors and aspects
- Appendix B: Model evaluation using satellite-based snow data
- Code and data availability
- Author contributions
- Competing interests
- Disclaimer
- Acknowledgements
- Financial support
- Review statement
- References