the Creative Commons Attribution 4.0 License.
the Creative Commons Attribution 4.0 License.
 | 16 Apr 2026
Satellite-observed surging dynamics of North Kunchhang Glacier I in the Eastern Karakoram
Fanyu Zhao
Chenqi Fang
Yiming Wang
Xingwu Duan
Frequent glacier surges are a distinctive characteristic of Karakoram glaciers, with their occurrence increasing recently, significantly impacting glacier morphology and dynamics. However, more observations are needed to improve our understanding of surging dynamics and their underlying mechanisms. This study employs extensive multisource remote sensing data to investigate long-term, multi-phase changes in flow velocity, surface elevation, and terminus position of North Kunchhang Glacier I (NKG I) in the Eastern Karakoram. By examining 25 years of changes, we identified the timing of glacier surges, analysed the surging dynamics, and estimated mass transfer during surging events. Historical interpretation of terminus dynamics dating back to 1972 revealed a prior main trunk surge around 1980, enabling an exploration of potential climate change impacts on surge behaviour. Our results indicate that the 2017 main trunk surge lasted four years (June 2015–June 2019), transferring 0.53 ± 0.013 km3 of glacier mass, inducing significant downstream elevation gain, and leading to a delayed terminus advance starting in 2018. In contrast, the 2004 surge of NKG V (within the NKG basin and connected to NKG I after surge) lasted 2.5 years (November 2002–April 2005), transferring 0.27 ± 0.011 km3 of glacier mass, destroying a proglacial lake, and raising the glacier surface elevation by ∼ 180 m. Flow velocity, surface elevation, and terminus position derived from various sources exhibit strong consistency in both trends and values, confirming the reliability of our results. Notably, the 2017 surge exhibited a shorter rapid advance period compared to the 1980 surge, suggesting that climate change may be influencing surge mechanisms, leading to smaller-scale but more frequent events. These findings provide new insights into the surging dynamics of NKG I and contribute to a deeper understanding of Karakoram glacier behaviours. The integration of multisource remote sensing demonstrates its critical value in deciphering complex glacier dynamics and their responses to a changing climate.
- Article
(17921 KB) - Full-text XML
- BibTeX
- EndNote


Frequent glacier surges and slight mass gains over recent decades are defining characteristics of Karakoram glaciers (Farinotti et al., 2020; Bazai et al., 2021). Glacier surges are periodic events marked by a rapid acceleration in flow velocity, generally increasing by 1–2 orders of magnitude compared to quiescent phases (Meier and Post, 1969; Raymond, 1987; Sharp, 1988; Jiskoot, 2011; Truffer et al., 2021; Guo et al., 2022). Glaciers exhibiting such behaviour are referred to as surge-type glaciers. Notably, 12.6 % of the 150 glaciers in the central Karakoram are surge-type (Barrand and Murray, 2006), a percentage significantly higher than that observed elsewhere in High Mountain Asia (HMA), such as the Himalayas, Tien Shan, Kunlun Shan, and Southeastern Tibetan Plateau. Although the Karakoram region contains only 181 surge-type glaciers, these glaciers collectively cover nearly 10 thousand km2, accounting for 51 % of the total area of surge-type glaciers across HMA (Pfeffer et al., 2014; Leclercq et al., 2021; Guillet et al., 2022; Guo et al., 2023; Yao et al., 2023; Ke et al., 2024).
Glacier surges involve a dramatic redistribution of ice and moraines, transferring mass from the reservoir area to the receiving area. This process leads to significant surface elevation changes and can result in terminus advance of several kilometres. For instance, the surge of the Kutiah Glacier in Pakistan caused a remarkable 12 km terminus advance within three months in 1953 (Bhambri et al., 2017). Surges also create distinct geomorphic features, such as looped and folded moraines and widespread surface crevasses. These events pose significant risks to downstream communities by triggering natural disasters, including glacier-lake outburst floods (Komatsu and Watanabe, 2014; Bazai et al., 2021; Gao et al., 2021; Muhammad et al., 2021; Lovell and Muhammad, 2024), ice avalanches (Kääb et al., 2018; Berthier and Brun, 2019; Leinss et al., 2019; Wu et al., 2025), and glacier-induced debris flows (Evans et al., 2009; Yao et al., 2019; Xu et al., 2023). Therefore, understanding the dynamics and mechanisms of glacier surges is critical not only for advancing glaciological science but also for improving disaster risk management in vulnerable regions.
Glacier surges are closely related to the mass and enthalpy balance, englacial and subglacial thermal regimes, hydrological processes, and basal conditions (Crompton et al., 2018; Benn et al., 2019; Guo et al., 2022). Two main mechanisms are widely used to explain glacier surges: hydrological control mechanisms observed in Alaska's Variegated Glacier (Kamb et al., 1985) and thermal control mechanisms found in the Trapridge Glacier in Canada (Clarke et al., 1984). However, surging behaviours in the Karakoram region vary markedly among different glaciers in adjacent areas (Paul et al., 2022), or even among different tributaries of the same glacier (Gao et al., 2024). This variability suggests that these glaciers do not conform neatly to either thermal or hydrological control mechanisms and may involve a combination of both (Quincey et al., 2015; Paul et al., 2022; Gao et al., 2024). This heterogeneity highlights significant gaps in our understanding of glacier surging dynamics in the region (Wu et al., 2020), emphasizing the need for detailed studies to better elucidate the underlying processes.
Remote sensing has emerged as an indispensable tool for studying glacier surges due to its ability to capture dramatic changes in surface morphology and dynamics over large spatial and temporal scales (Guillet et al., 2022; Guo et al., 2022, 2023; Ye et al., 2024). For instance, satellite imagery can identify surge-type glaciers based on changes in length or surface features (Copland et al., 2011; Vale et al., 2021; Wytiahlowsky et al., 2023), while image cross-correlation feature-tracking techniques enable monitoring of glacier velocity (Gao et al., 2022; Li et al., 2024; Zhang et al., 2024b). Additionally, digital elevation model (DEM) differencing provides insights into surface elevation changes (Brun et al., 2017; Chen et al., 2021; Wu et al., 2021; Zhao et al., 2022). However, remote sensing studies are often limited by temporal coverage, sensor capabilities (Lin et al., 2024), or reliance on specific data types, which can lead to incomplete assessments of surface processes.
In this study, we utilize a multisource remote sensing approach to investigate the surging dynamics of North Kunchhang Glacier I (NKG I) in the eastern Karakoram. By combining multiple data types and analysis techniques, we aim to capture long-term and continuous changes in glacier flow velocity, surface elevation, terminus position, and glacial lake levels during different surge stages. Specifically, we analyse glacier flow velocity using the ITS_LIVE dataset to identify the timing and extent of the surges, examine surface elevation changes using satellite altimetry and DEMs, and track terminus position changes using a newly developed algorithm applied to Sentinel-1 Single Look Complex (SLC) images. Additionally, we analyse longer-term terminus changes using historical Landsat and KH-9 imagery, and assess lake level variations in a newly formed ice-dammed lake. By integrating these time-series datasets, we provide a detailed overview of the evolution of NKG I during its surge cycles. Compared to previous studies, our multisource remote sensing approach offers a more comprehensive understanding of surge dynamics, emphasizing the interconnectedness of flow velocity, elevation, terminus position, and lake level changes. This study not only enhances our understanding of NKG I's surging dynamics but also provides valuable insights into the mechanisms driving glacier surges in the Karakoram region.
2.1 Study area
The Karakoram, located in western High Mountain Asia (HMA), is characterized by its rugged topography and abundance of towering peaks exceeding 7000 m. This region boasts some of the most extensive and well-developed mountain glaciers in mid-to-low latitudes (Kumar et al., 2019; Xie et al., 2023), with glaciers covering approximately 25.6 % of its area. It encompasses 11 586 glaciers, including 278 that each span more than 10 km2. The total glacierized area is 21 475 km2, representing 22 % of the glacierized area in HMA (Pfeffer et al., 2014). The Karakoram contains a glacier volume of 3411 km3, accounting for 31 % of HMA's total glacier volume (Millan et al., 2022). Notably, the Karakoram ranks second in the number of surge-type glaciers and first in the total area of these glaciers within HMA (Guo et al., 2022). This makes the region a critical hotspot for studying glacier surges, offering unique insights into glacier dynamics and behaviour under the influence of a rapidly changing climate.
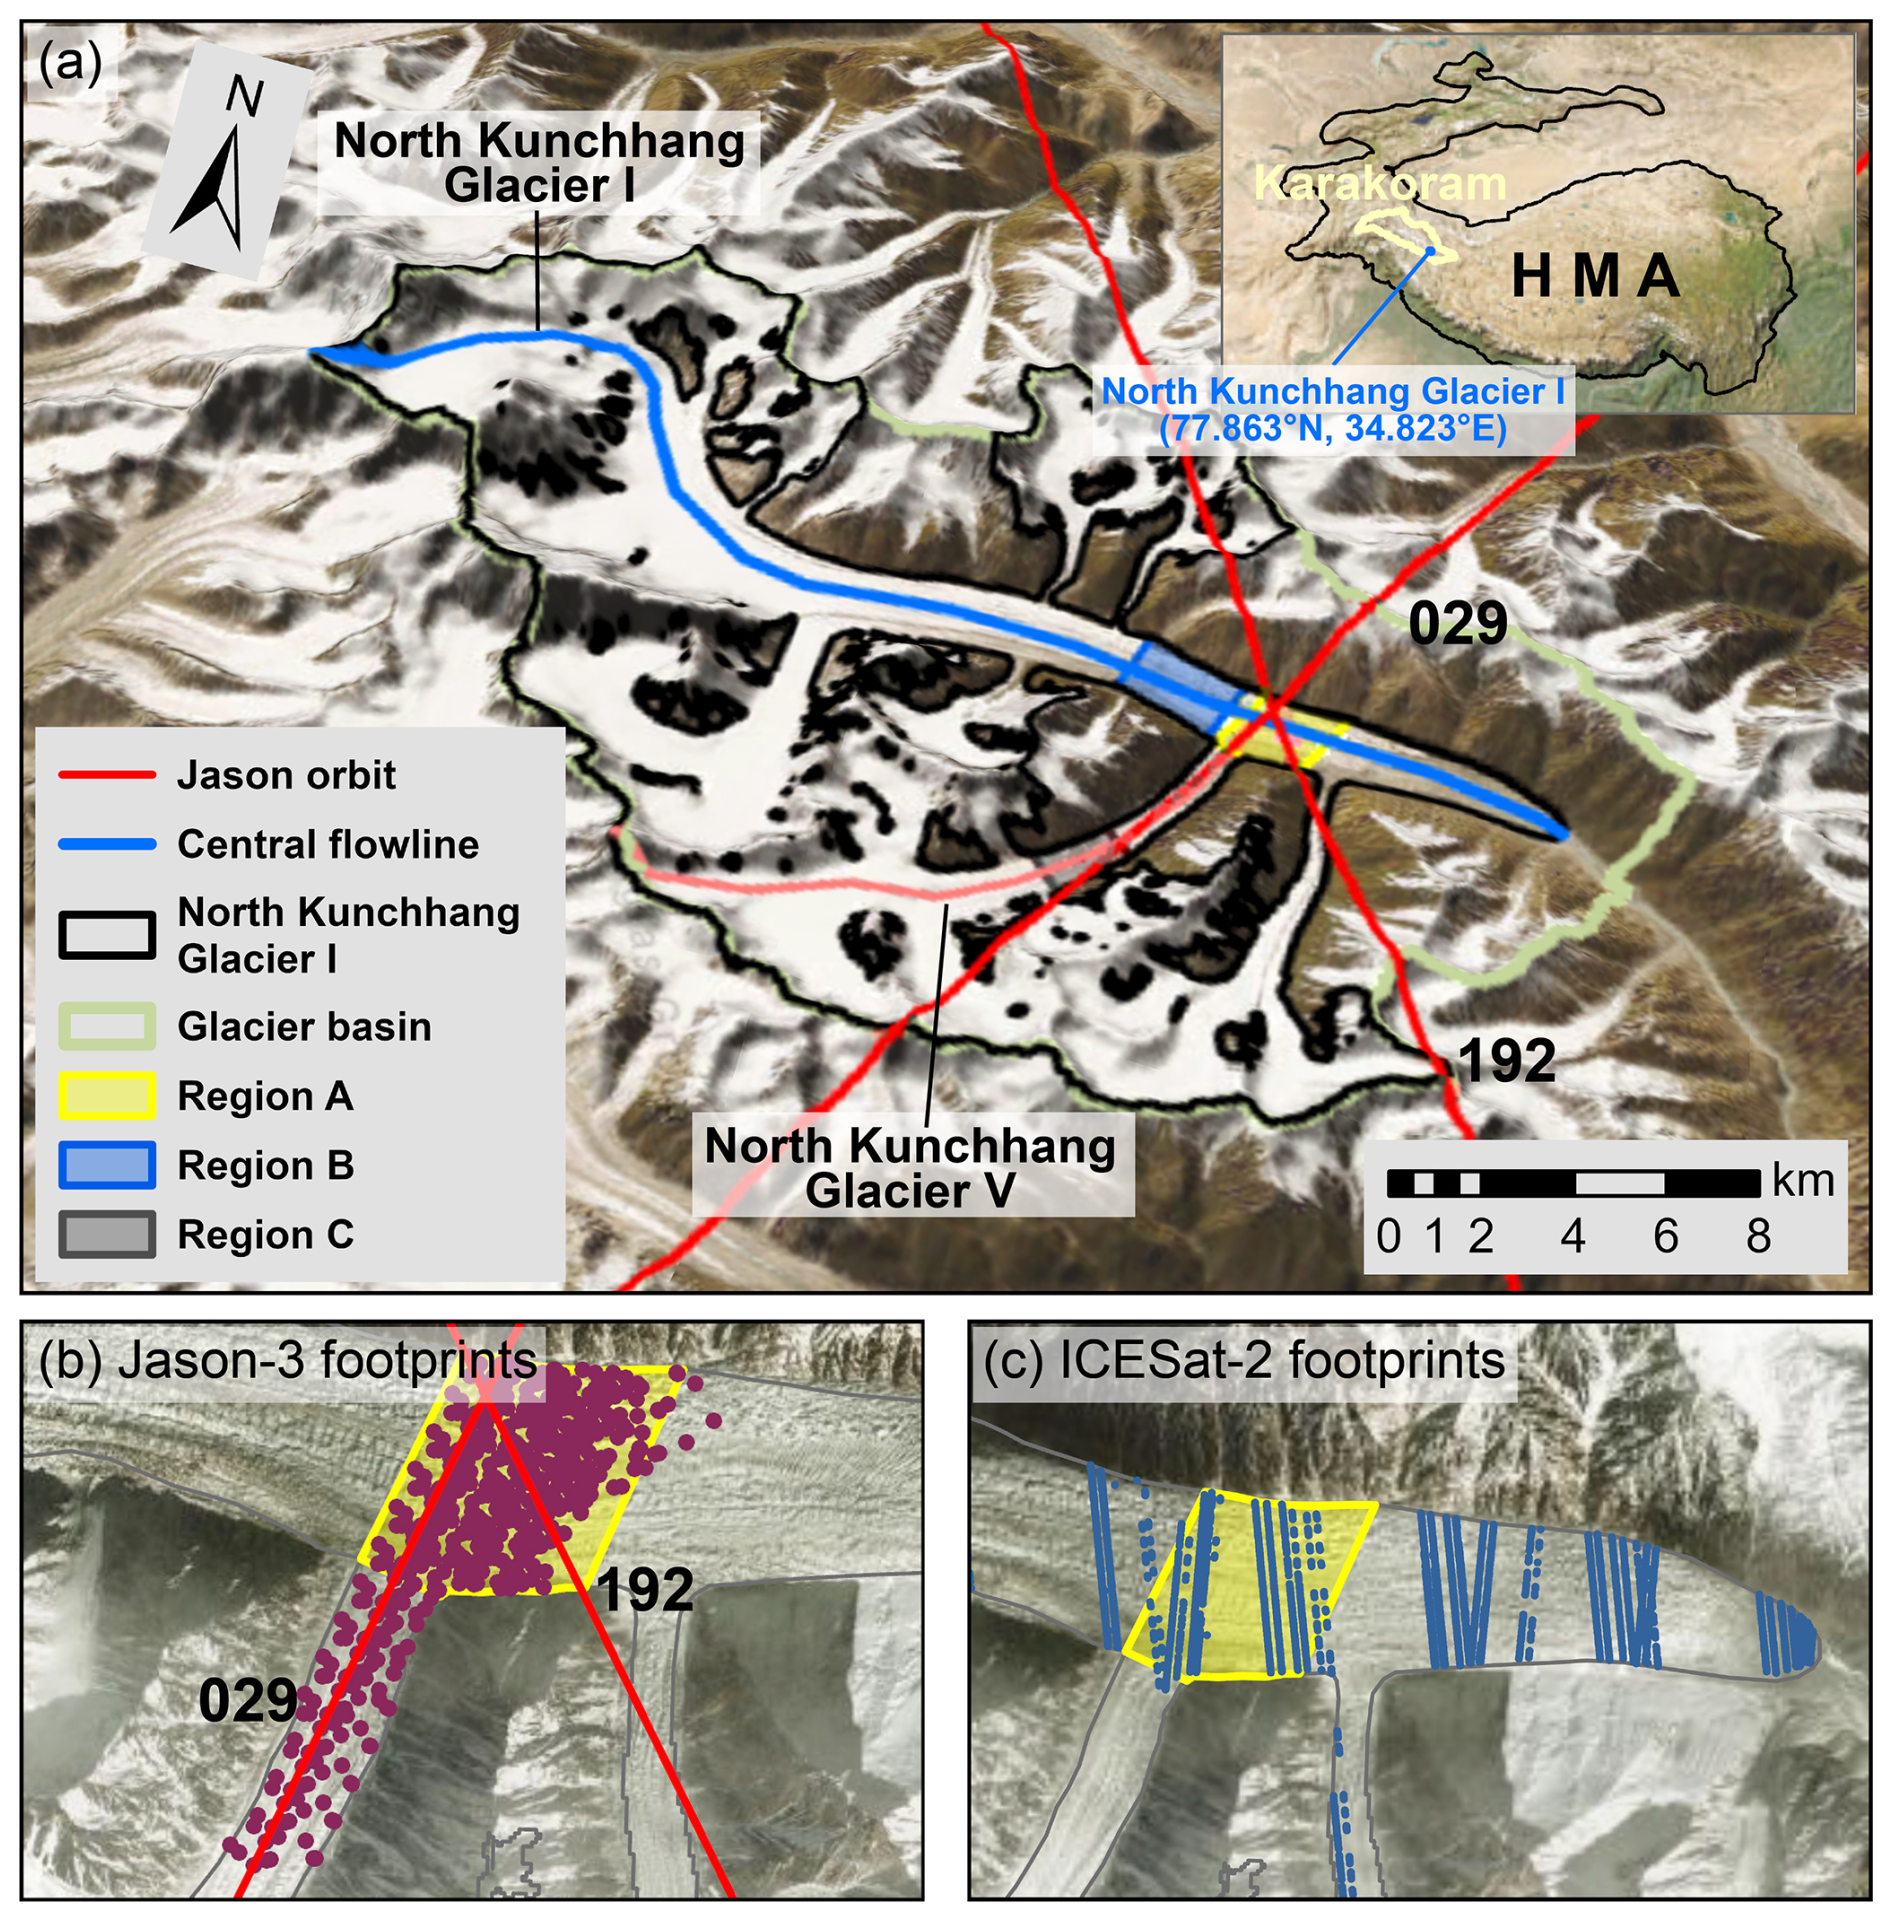
Figure 1Location of NKG I and footprints of Jason-3 and ICESat-2. Panel (a) shows the central flowlines of NKG I (blue) and NKG V (coral), which are used for analysing surface velocity and elevation. The red lines represent the ground tracks of Jason-3. Region A marks the section of the main trunk intersected by Jason-3 footprints, while Regions B and C highlight the areas with the fastest velocities during the surges of the main trunk and the tongue of NKG V, respectively. The inset in the upper-right corner of (a) illustrates the location of HMA, the Karakoram, and NKG I. Panels (b) and (c) present the detailed footprints of Jason-3 and ICESat-2 on NKG I, respectively. The basemaps in panels (a), (b), and (c) are derived from ESRI World Imagery and Hillshade (Sources: Esri, NASA, NGA, USGS, Earthstar Geographics, Sources: Esri, TomTom, Garmin, FAO, NOAA, USGS, © OpenStreetMap contributors, and the GIS User Community | Powered by Esri).
North Kunchhang Glacier I (NKG I, RGI60-14.08555) is situated in the Eastern Karakoram at central coordinates 34.823° N, 77.863° E (Fig. 1). Following the surge of North Kunchhang Glacier V (NKG V, RGI60-14.08634) around 2004, NKG V advanced and connected with the main trunk of NKG I. For this study, the two glaciers are treated as a single glacier system with a total area of 182.5 km2, making it the 21st largest glacier in HMA (Pfeffer et al., 2014). The highest peak of the glacier system is Saser Kangri I, which reaches an elevation of 7672 m, while its terminus lies at 4712 m. NKG I is a large dendritic valley glacier, flowing predominantly from west to east. It is a typical surge-type glacier, characterized by pronounced looped moraines. The region has a mean annual temperature of −2.54 °C and a mean annual precipitation of approximately 500 mm (1950–2024) (Muñoz-Sabater et al., 2021). The steep slopes in its reservoir area make the glacier highly susceptible to avalanches and associated hazards.
NKG I's wide main trunk intersects with two Jason ground tracks, providing valuable satellite altimetry data. Additionally, historical records indicate multiple surges in different sections of NKG I over the past few decades (Yang et al., 2021), including a major surge of the southern NKG V around 2004 and a significant surge of the main trunk around 2017. These events are well-captured by satellite observations, making NKG I an ideal natural laboratory for investigating glacier surge dynamics using remote sensing techniques.
2.2 Data and tools
This study integrates multisource remote sensing data, including altimetry, optical and synthetic aperture radar (SAR) imagery, DEMs, and velocity maps, to investigate the surging dynamics of NKG I. The publicly available ITS_LIVE product (Gardner et al., 2024, 2025) was used to analyse annual and monthly glacier velocity changes. These velocity maps were derived using autoRIFT (Gardner et al., 2018; Lei et al., 2021) from Landsat 5/7/8/9, Sentinel 1A/B, and Sentinel 2A/B imagery. Glacier surface elevation changes were extracted from Jason-3 close-loop mode altimetry data (Ray et al., 2024) and ICESat-2 Land Ice Height data (ATL06) (Smith et al., 2023). Additionally, 137 ASTER DEMs spanning 2000 to 2019 (Hugonnet et al., 2021a, b) and a GF-7 DEM in 2024 were utilized to reconstruct elevation time series for glacier and proglacial lake surfaces. NASADEM (Crippen et al., 2016), reflecting glacier conditions in 2000, served as the reference DEM, while the Randolph Glacier Inventory (RGI) 6.0 (Pfeffer et al., 2014) was used as the reference glacier mask.
This study also leveraged 1238 Sentinel-1 SLC image pairs collected since 2014 to map glacier extents and terminus positions with high temporal resolution. To supplement these datasets, manual delineation of NKG I's terminus since 1972 was performed using 36 cloud-free Landsat 5/7/8/9 images captured during summer months (June and September), three Landsat 1/2/3 Multispectral Scanner (MSS) images, and four KH-9 images (Surazakov and Aizen, 2010; Zhou et al., 2017). In addition, three Sentinel-1A Ground Range Detected (GRD) images facilitated the identification of glacial lakes. To explore the climatic divers influencing glacier surges, ERA5-Land monthly aggregated data (Muñoz-Sabater et al., 2021) on temperature, precipitation, and radiation were analysed.
For data processing, various advanced tools were employed. The Python package PyFlwDir (https://deltares.github.io/pyflwdir/latest/index.html, last access: 2 December 2024) was utilized to delineate the NKG basin and vectorize binary coherence maps. A Fast Time-Series InSAR Processing Software (ESIS) (Yu et al., 2024) and the Alaska Satellite Facility's Hybrid Pluggable Processing Pipeline (ASF HyP3) service (https://hyp3-docs.asf.alaska.edu/, last access: 3 December 2024) were used to estimate the coherence of Sentinel-1 image pairs. This comprehensive dataset and associated tools provided a robust foundation for investigating the surging behaviour, kinematics, and underlying climatic drivers of NKG I. A detailed summary of the datasets and tools is provided in Table 1.
Table 1Detailed information on data and tools used in this study.
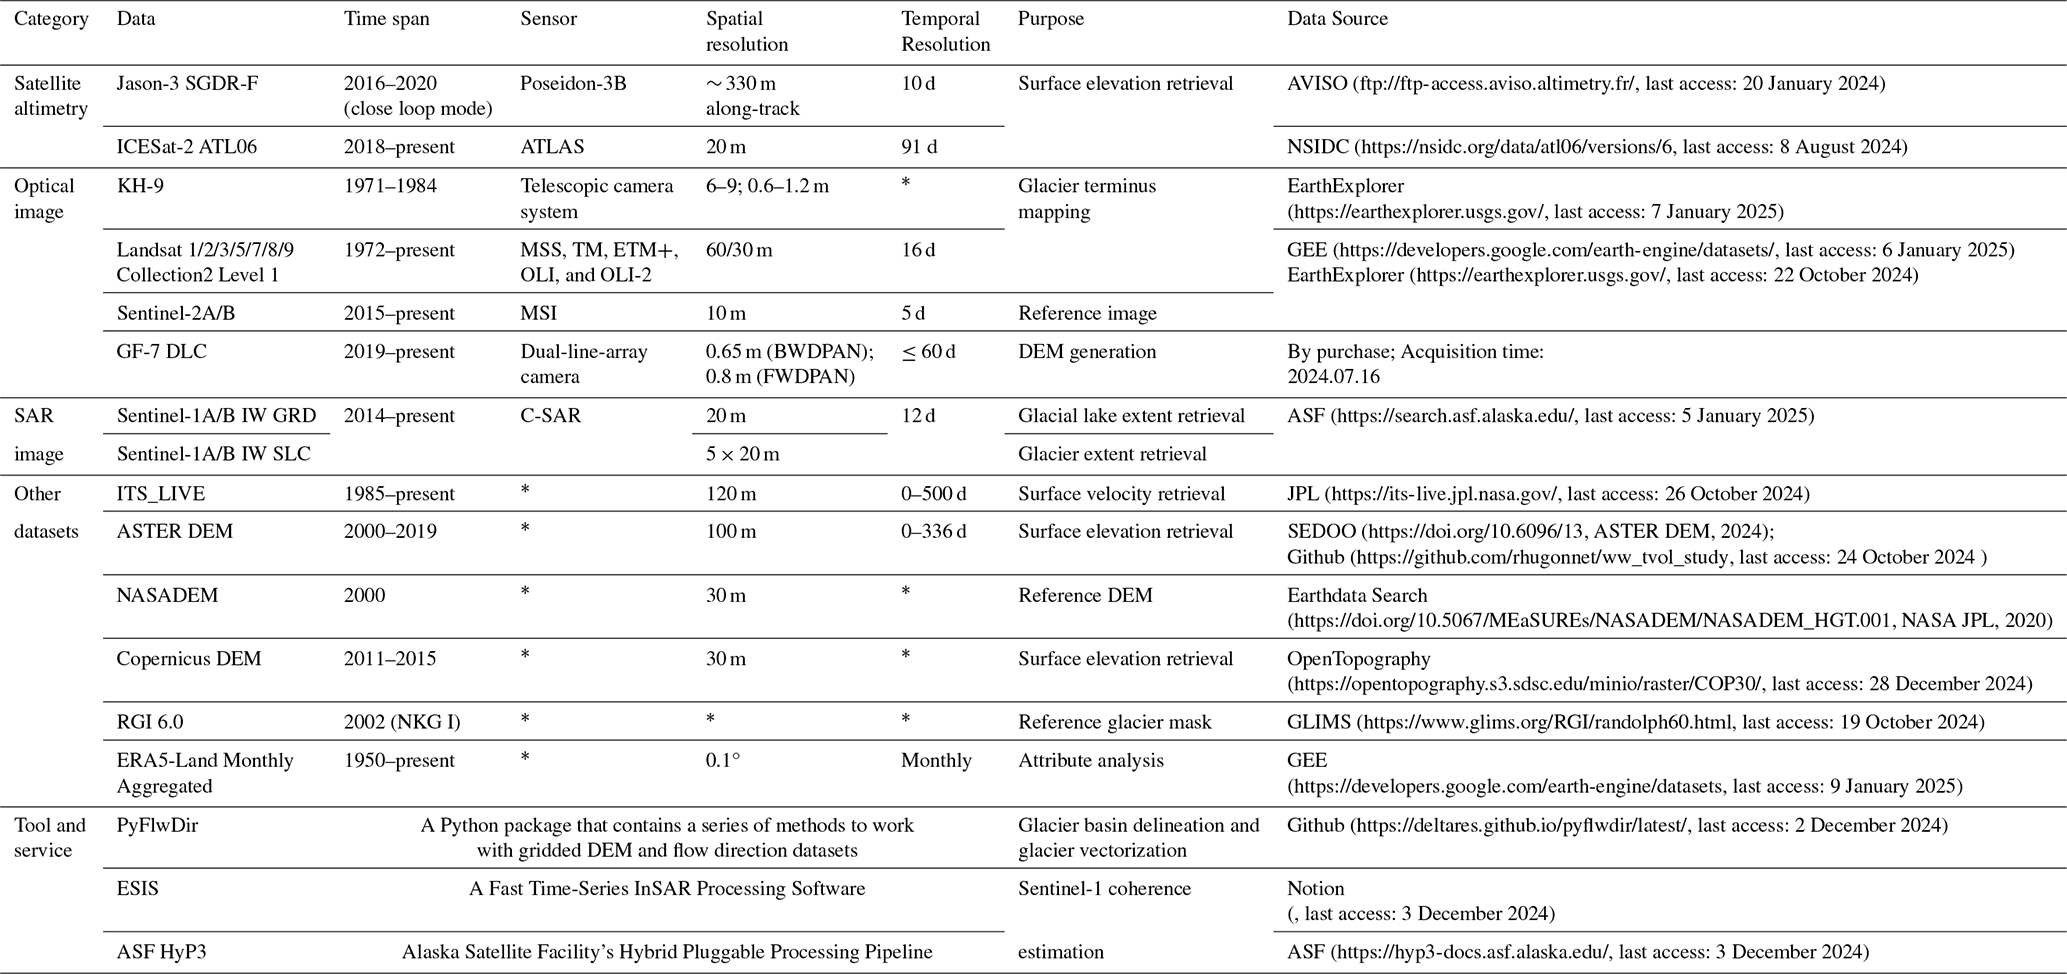
* Denotes that this attribute is not applicable to the data.
3.1 Processing of ITS_LIVE glacier velocity data
A total of 6260 glacier velocity maps with time intervals between image acquisitions not exceeding 90 d were downloaded using the ITS_LIVE API. During the preliminary analysis, it was observed that excessively short intervals led to significant velocity fluctuations and high uncertainties in velocity measurements, while longer intervals often resulted in underestimated peak velocities. To address this, only data with time intervals ranging from 3 to 45 d were retained for the final analysis to ensure correct representation of surge signals within the velocity estimates.
Given that the ITS_LIVE dataset does not always provide complete spatial coverage (Lei et al., 2021, 2022) of NKG I, we aggregated the data to annual and monthly timescales to calculate mean glacier velocities for each period. For a given pixel, the mean velocity in a specific month or year was obtained by averaging all valid values from velocity maps with center-date falling within that period. This approach enabled us to investigate the spatiotemporal characteristics of glacier velocity in detail. Additionally, focused analyses were conducted in regions of interest, including: Region A, which overlaps with Jason-3 footprints and serves as a key area for surface elevation analysis, and Regions B and C, where the highest glacier velocities were observed during surge periods, representing the main trunk of NKG I and tongue of NKG V, respectively.
3.2 GF-7 DEM generation and ASTER DEM processing
A stereo image pair from the GF-7 satellite, acquired on 16 July 2024, was utilized to generate a high-resolution (1 m) DEM. Using the rational function model, 10 ground control points and 28 tie points were manually selected in PCI Geomatica for accurate geometric correction. The resulting DEM was resampled to a 30 m spatial resolution and co-registered to NASADEM using Nuth and Kääb (2011)'s approach. Due to the 26° off-nadir viewing angle of GF-7 (Zhu et al., 2021) and image oversaturation in high-altitude areas, elevation measurements in these regions have high uncertainties, which manifest as increased noise in the elevation difference data. Thus, we applied a slope threshold of 15° to exclude elevations with large uncertainties.
In addition to the GF-7 DEM, 137 ASTER DEMs (Hugonnet et al., 2021a, b) spanning 2000 to 2019 were employed to construct a surface elevation time series for various regions, including Regions A, B, and C. ASTER DEMs were first filtered based on valid value coverage and cross-referenced against elevations derived from NASADEM, Copernicus DEM, and GF-7 DEM to identify and exclude anomalous data. A threshold of 200 m was applied to account for significant elevation changes associated with surging events, ensuring robust data selection. All DEMs were converted to the EGM96 vertical reference to maintain consistency across datasets. Additionally, a Hampel filter (Pearson et al., 2016) was applied to the elevation time series to exclude outliers. Four ASTER DEMs acquired as close as possible to the initiation and termination of the surge and covering the surge extent, were analysed separately to estimate mass transfer during the surges. Additionally, surface elevations along central flowlines and cross-sectional profiles were extracted from selected DEMs to quantify elevation changes and derive insights into the redistribution of glacier mass.
3.3 Altimetry data processing
Jason-3 is designed to produce global sea surface height measurements every 10 d with an accuracy better than 4 cm (Biancamaria et al., 2018). For observing inland water bodies, ice sheets, or mountain glaciers, 20 Hz data and waveform retracking are essential. Figure 2a and b illustrate the altimeter signals over glacier and glacial lake surfaces, respectively. The glacier surface elevation at the footprint of the altimeter radar pulse is calculated as follows (Hwang et al., 2021):
where Hg is the glacier surface elevation above mean sea level (m.s.l.), Alt is the Jason-3 altimeter ellipsoid height above the WGS84 ellipsoid, Range is the radar range measurement, and Hgeoid is the geoid height relative to the WGS84 ellipsoid. The correction term Cor contains multiple components:
where Cwet, Cdry, Ciono, Csolid, and Cpole are corrections for wet tropospheric delay, dry tropospheric delay, ionosphere delay, solid Earth tide, and pole tide, respectively, all of which are provided in the Jason-3 SGDR-F dataset. The Cretrack term is the radar range correction by waveform retracking. In this study, we employed the threshold retracking method (Davis, 1993; Hwang et al., 2006) with a 50 % threshold value (Hwang et al., 2021). Jason-3 waveforms consist of 104 gates, with the default gate being 32.5. The Cretrack value is computed as the difference between the default gate and the retracked gate, multiplied by a gate-to-meter factor (0.46875 m). Our analysis revealed that only a limited number of radar waveforms could be retracked to improve altimetry-derived glacier surface elevations in Region A (Fig. 1).
After waveform retracking, we filtered out outliers by cross-referencing NASADEM, Copernicus DEM, and GF-7 DEM, along with waveform amplitude and shape characteristics. The time series of mean glacier surface elevations for Region A was obtained by averaging all glacier elevations for each cycle. However, given Jason-3's large footprint, some recorded elevations in Region A were influenced by the tongue of NKG V. To address this, we divided the time series into two subsets based on the distinct elevation trends of the main trunk and the glacier tongue of NKG V. After bias correction, these two subsets showed strong agreement with both DEM and ICESat-2 elevation time series.
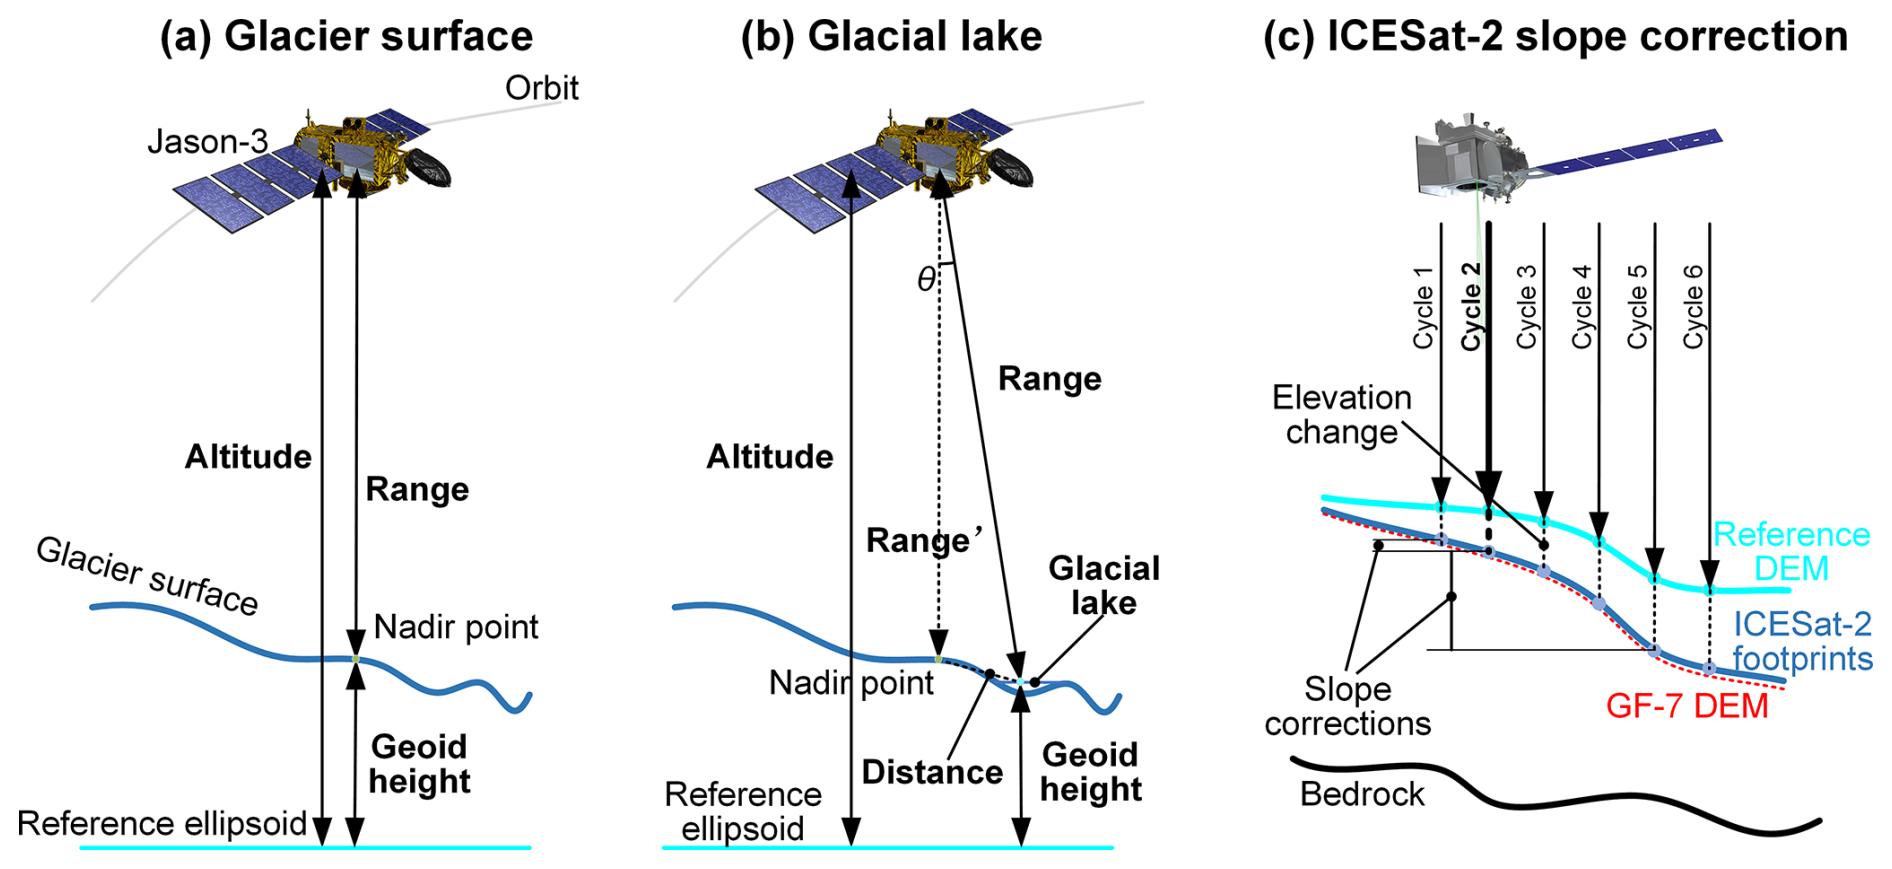
Figure 2(a) Altimeter signals over the glacier surface. (b) Altimeter signals over the glacial lake surface. (c) Schematic diagram of ICESat-2 observations on the glacier surface. The blue lines represent glacier surface profiles at different times, while the red dashed line depicts the glacier surface derived from the GF-7 DEM acquired on 16 July 2024. The vertical dashed lines in (c) indicate potential elevation differences observed across various observation cycles.
During outlier removal, we identified 177 footprints with anomalously low elevations compared to the reference DEMs. These footprints exhibited strong radar signals with waveform shapes typical of inland water bodies, such as narrow rivers or small lakes smaller than the altimeter footprint. Upon further examination, we determined that these low elevations corresponded to the water level of a small ice-dammed lake located approximately 1.2 km downstream of Region A. This phenomenon arises because the radar signal reflected from water surfaces is significantly stronger than from glacier or land surfaces (Huang et al., 2019). When the glacial lake is sufficiently large, the radar signal primarily captures the adjacent lake surface rather than the glacier surface at the nadir point.
However, these elevations correspond to non-nadir reflections, necessitating additional corrections to ensure accuracy. Considering the possibility of glacial lake freezing (Li et al., 2021, 2023), we modified the waveform retracking threshold to 10 %. Non-nadir correction values were calculated as follows:
where θ is the angle of incidence and d is the distance between the nadir point and the glacial lake. Consequently, the correction term Cor for glacial lake elevations in Eq. (2) is updated as:
For ICESat-2 observations, the mean elevation of all footprints within each cycle was calculated. However, due to the 1.5 km width of Region A and the combined influence of glacier surface slope, movement, and ablation, substantial discrepancies were observed in elevation measurements at different locations and times. These discrepancies were particularly evident in high-spatial-resolution ICESat-2 data (Fig. 2c).
We then applied slope corrections to the ICESat-2 data. To minimize the influence of glacier movement and ablation on the slope correction, we selected the GF-7 DEM, which is temporally aligned with ICESat-2 observations. A relationship between longitude and elevation along the central flowline in Region A was modelled using a third-order polynomial. Expected elevations of a specific cycle was computed form the mean longitude of that cycle. The slope correction for a specific cycle was then calculated by subtracting the reference cycle elevation from the expected elevation:
where lon is the mean longitude of a specific cycle, and lon0 is the reference cycle longitude. Elelon and Ele are expected elevations of the specific cycle and the reference cycle, respectively. f is the fitted third-order polynomial.
3.4 Glacier extent and terminus position extraction
Accurate mapping of glacier extent using optical images, such as Landsat or Sentinel-2, is often hindered by the presence of thick moraines on glacier tongues (Lin et al., 2023) and frequent cloud cover. Alternatively, SAR imagery provides an effective solution, as the coherence of SAR image pairs is notably lower over glaciers compared to surrounding terrain due to glacier flow (Shi et al., 2019; Mannerfelt et al., 2025). SAR satellites also have advantage of being unaffected by cloud cover and can operate during nighttime, making them particularly suitable for monitoring glacier changes. Leveraging multitemporal SAR coherence maps offers a practical approach for tracking glacier extent and terminus position changes. However, SAR imagery is subject to challenges. Issues such as foreshortening, layover (Matsuo, 1993), shadowing, and salt-and-pepper noise (Guillet et al., 2025) in mountainous regions can introduce errors in delineating glacier extents. To mitigate these challenges, we employed a new approach utilizing both ascending and descending Sentinel-1 SLC images. This strategy effectively reduces the impact of SAR imaging artefacts and enables the accurate extraction of glacier terminus positions and extents at high temporal resolution. Given the high sensitivity of SAR coherence to surface changes (Liang et al., 2022; Wu et al., 2023), this method has additional potential for applications such as detecting small water bodies, wetlands, and snow cover with minor modifications.
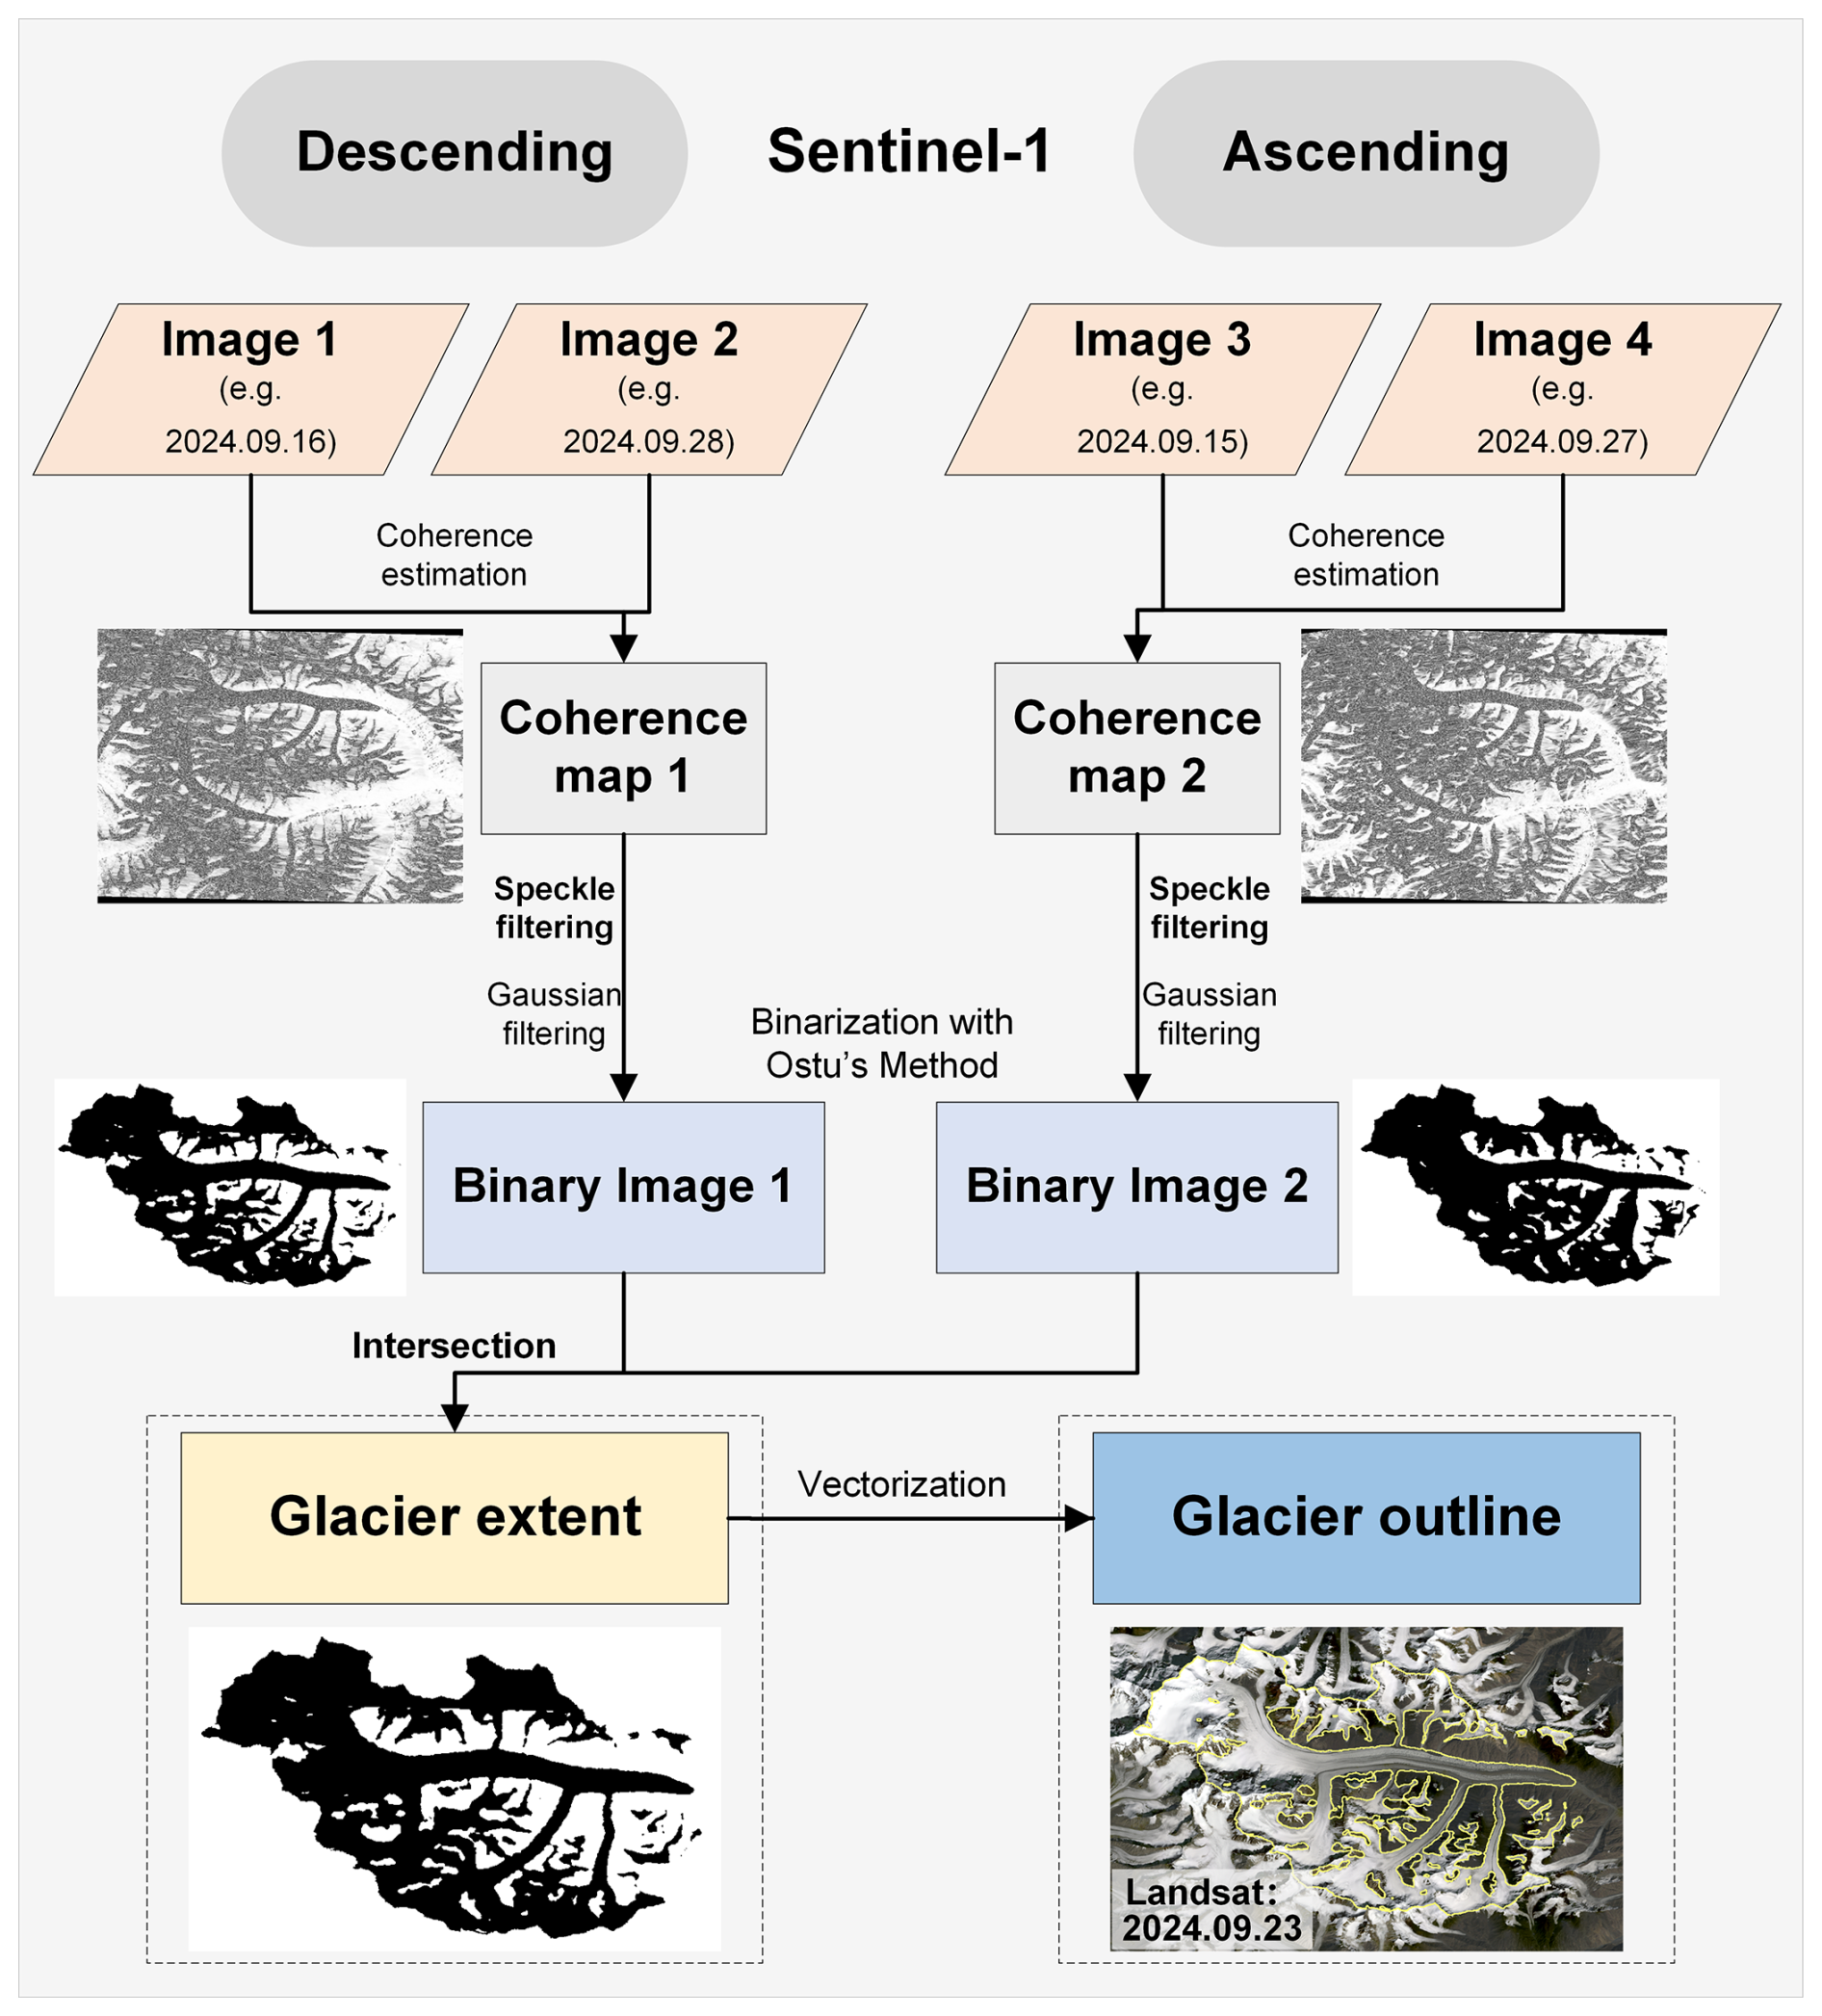
Figure 3Flowchart for extracting glacier outlines using Senitnel-1 SLC images. The base map of the glacier outline is a Landsat 8 image acquired on 23 September 2024.
Since glacier extents over time may differ from those in RGI 6.0, we processed all relevant data within the NKG basin, ultimately focusing our analysis on the NKG I glacier. The basin was delineated using the PyFlwDir tool and NASADEM. Figure 3 illustrates the workflow for extracting glacier extents using Sentinel-1 imagery. Initially, we performed coherence estimation on image pairs of descending and ascending passes acquired within similar timeframes (typically 12 d apart). Using the ESIS tool and the ASF HyP3 service, we generated two sets of coherence maps. To reduce salt-and-pepper noise, we applied speckle filtering (Aja-Fernández and Alberola-López, 2006) followed by Gaussian filtering to the coherence maps. These filtered maps were then binarized using Otsu's method (Otsu, 1979). The binary maps from ascending and descending passes were intersected to generate the final glacier extent corresponding to the acquisition time of the descending image. Lastly, the binary image was vectorized using the PyFlwDir tool to produce glacier outlines.
Due to data gaps during specific periods, we derived 184 glacier outlines representing various time points, with annual counts ranging from 3 to 25 since 2014. After obtaining these outlines, we extended the central flowline of NKG I and extracted its intersection points with the glacier outlines to determine terminus positions at different times. To further capture long-term changes in the terminus position of NKG I, we manually mapped terminus positions using both Landsat images and declassified KH-9 images, enabling us to extend the analysis back to 1972. To ensure consistency, the KH-9 images were georeferenced to the Landsat images. This comprehensive approach allowed us to document terminus position changes over five decades, providing critical insights into historical glacier dynamics.
3.5 Glacial lake level and drainage analysis
Over the past few decades, two ice-dammed lakes have formed in the NKG I region. The first glacial lake, a proglacial lake of NKG V, disappeared at the end of 2004 due to the surge of NGK V. Its extent was manually delineated based on a Landsat 7 image acquired on 20 July 2003. The second glacial lake emerged when the main trunk blocked the meltwater outlet of a tributary glacier and NKG V, located approximately 1.2 km downstream of Region A. This lake is relatively small and our Jason-3 results observed an abrupt decrease in its lake level during summer 2018. To investigate the abrupt level decrease, we manually delineated the lake's outlines from July to October 2018 using a combination of Landsat 8, Sentinel-2, and Sentinel-1 GRD images. Additionally, we selected a representative cross-section near the lake's outlet on the main trunk and extracted elevations along this cross-section from multiple sources, including NASADEM, ASTER DEMs, and GF-7 DEM, spanning different time periods.
3.6 Uncertainty analysis
Based on the product error provided by the ITS_LIVE dataset, ASTER DEM, Sentinel-1 images, and Landsat images, we estimated the uncertainties in the flow velocity, surface elevation, terminus position, and glacier area change of NKG I. Among them, the processing of flow velocity mainly involves two steps: temporal averaging and spatial averaging. Therefore, the uncertainty of glacier velocity can be derived by Eqs. (6)–(8).
where is the velocity uncertainty of a specific grid (i, j) after temporal averaging (e.g., a month or a year). is the kth velocity error of grid (i, j) in the selected velocity maps. n is the sample size.
Following Hugonnet et al. (2022), the uncertainty in flow velocity during period t () is calculated as:
where γ1(d) is the variogram with unit sill, is the spatial lag. is the average variance of the velocity of grid (i, j) in the area A, and is the double integral of the variogram over the area A.The effective sample number (Neff) is only a function of spatial correlations γ1 and the area of integration A:
Surface elevation of NKG I was derived from ASTER DEM, GF-7 DEM, Jason-3, and ICESat-2. The ASTER DEMs provided the root mean square error (RMSE) of stable terrain differences as uncertainty (σEle) for a specific DEM. Thus, uncertainty in the surface elevation () derived from ASTER DEM was calculated as follows:
where A is the area of the region and Acor=πL2, with L being the decorrelation length, taken here as 500 m (Brun et al., 2017).
As for the uncertainty in the surface elevation derived from GF-7 DEM and ICESat-2, we estimated them by the standard error (SD) of valid elevations:
Previous studies rarely directly estimated the uncertainty of Jason-3 elevation without in-situ observations (Hwang et al., 2021). In this study, waveform retracking is the main step to improve the elevation accuracy of Jason-3 in glacier areas and an important factor influencing the uncertainty of Jason-3 elevations. Thus, we utilized the mean elevation difference between the threshold retracking method and the traditional offset centre of gravity (OCOG) method (Wingham et al., 1986) as the uncertainty of Jason-3 elevations.
where Elethr and EleOCOG are the elevations derived by the threshold retracking method and the OCOG method. n is the number of valid footprints.
Moreover, to quantify uncertainties in velocity and elevation change rates, we performed piecewise linear regression on the corresponding time series. The standard deviation of the regression slope was utilized to represent the uncertainty for each assessed period.
The uncertainty in glacier terminus positions (σt) was derived from Sentinel-1 SLC and optical images by considering both the image geolocation uncertainty (σco) and the algorithm uncertainty (σal) (Guan, 2024). The geolocation uncertainty was taken from Senitnel-1's annual performance report (https://sentiwiki.copernicus.eu/web/document-library#DocumentLibrary-AnnualReports, last access: 8 June 2025) and Landsat image's metadata. Particularly, since the KH-9 images were registered to a Landsat-8 image, the geolocation uncertainty of KH-9 images was taken as three times the mean geolocation uncertainty of Landsat-8 images. The processing uncertainty was assumed to be half a pixel of corresponding images:
The uncertainty in terminus position change (σtc) was then calculated by combining the positional uncertainties from both time periods (σt1 and σt2):
The uncertainty in glacier area and glacial lake area (σA) was estimated by considering both the resolution of the data source and the clarity of glacier outlines (Minora et al., 2016; Guan, 2024).
where l is the glacier boundary length (excluding ridgelines), LREyr denotes the resolution-related error (assumed as half a pixel), and σco indicates the geolocation accuracy of the imagery.
Similarly, the uncertainty in area change (σAc) was then calculated by combining the positional uncertainties from both time periods (σA1 and σA2):
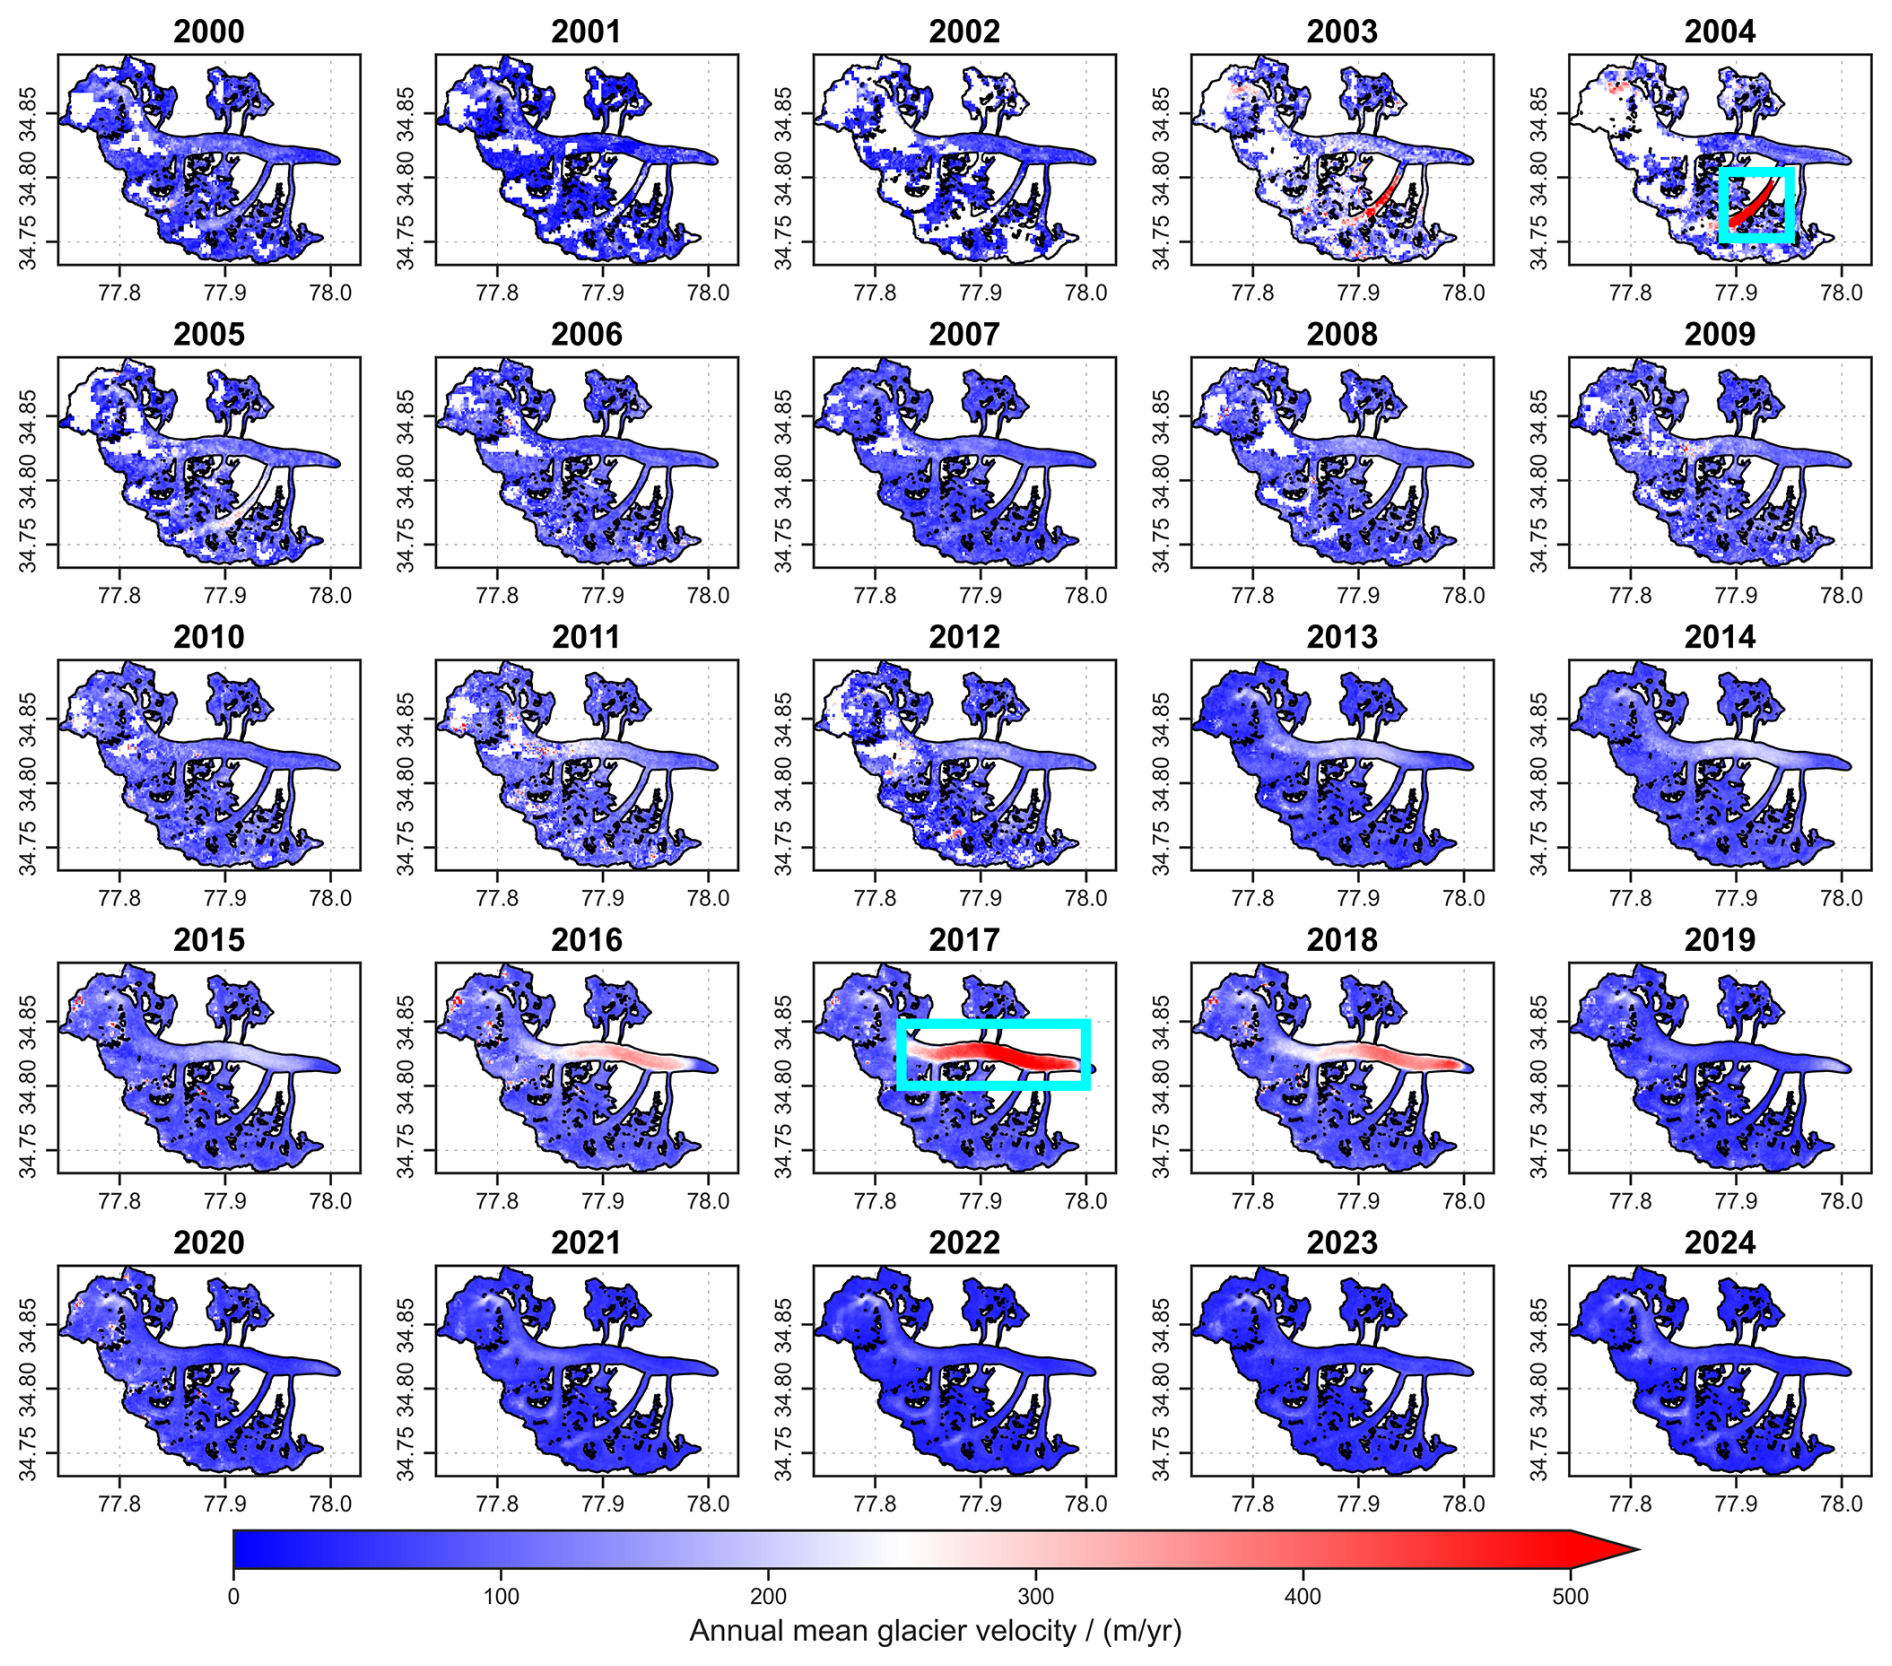
Figure 4Annual mean velocities of NKG I from 2000 to 2024. Redder colours indicate higher glacier velocities, while bluer colours indicate lower velocities. The two cyan rectangles highlight the extents of the identified glacier surges, showing where velocities increased by 20-fold (2004) and 5-fold (2017) of magnitude over quiescent rates (∼ 50 m yr−1 in 2023). Glacier outlines are derived from RGI 6.0, with NKG V manually connected to NKG I.
4.1 Glacier surges and surface velocity dynamics
To analyse glacier surges and their associated velocity variations, we averaged the 3295 velocity maps that met our selection criteria to derive annual mean velocities for NKG I from 2000 onward. This analysis revealed two major glacier surges, along with several smaller rapid motion events over the past 25 years (Fig. 4). The first surge occurred between 2003 and 2005, primarily affecting NKG V. During this period, glacier velocity peaked in 2004, exceeding 1700 m yr−1. However, this surge had minimal impact on the main trunk of NKG I, with the affected regions mainly confined to NKG V and the ice-dammed lake in front of it. The second surge, occurring between 2016 and 2018, was significantly larger in scale, centred on the main trunk of NKG I. The peak velocity was recorded in 2017, with an annual mean velocity of around 600 m yr−1 and a peak velocity exceeding 1100 m yr−1.
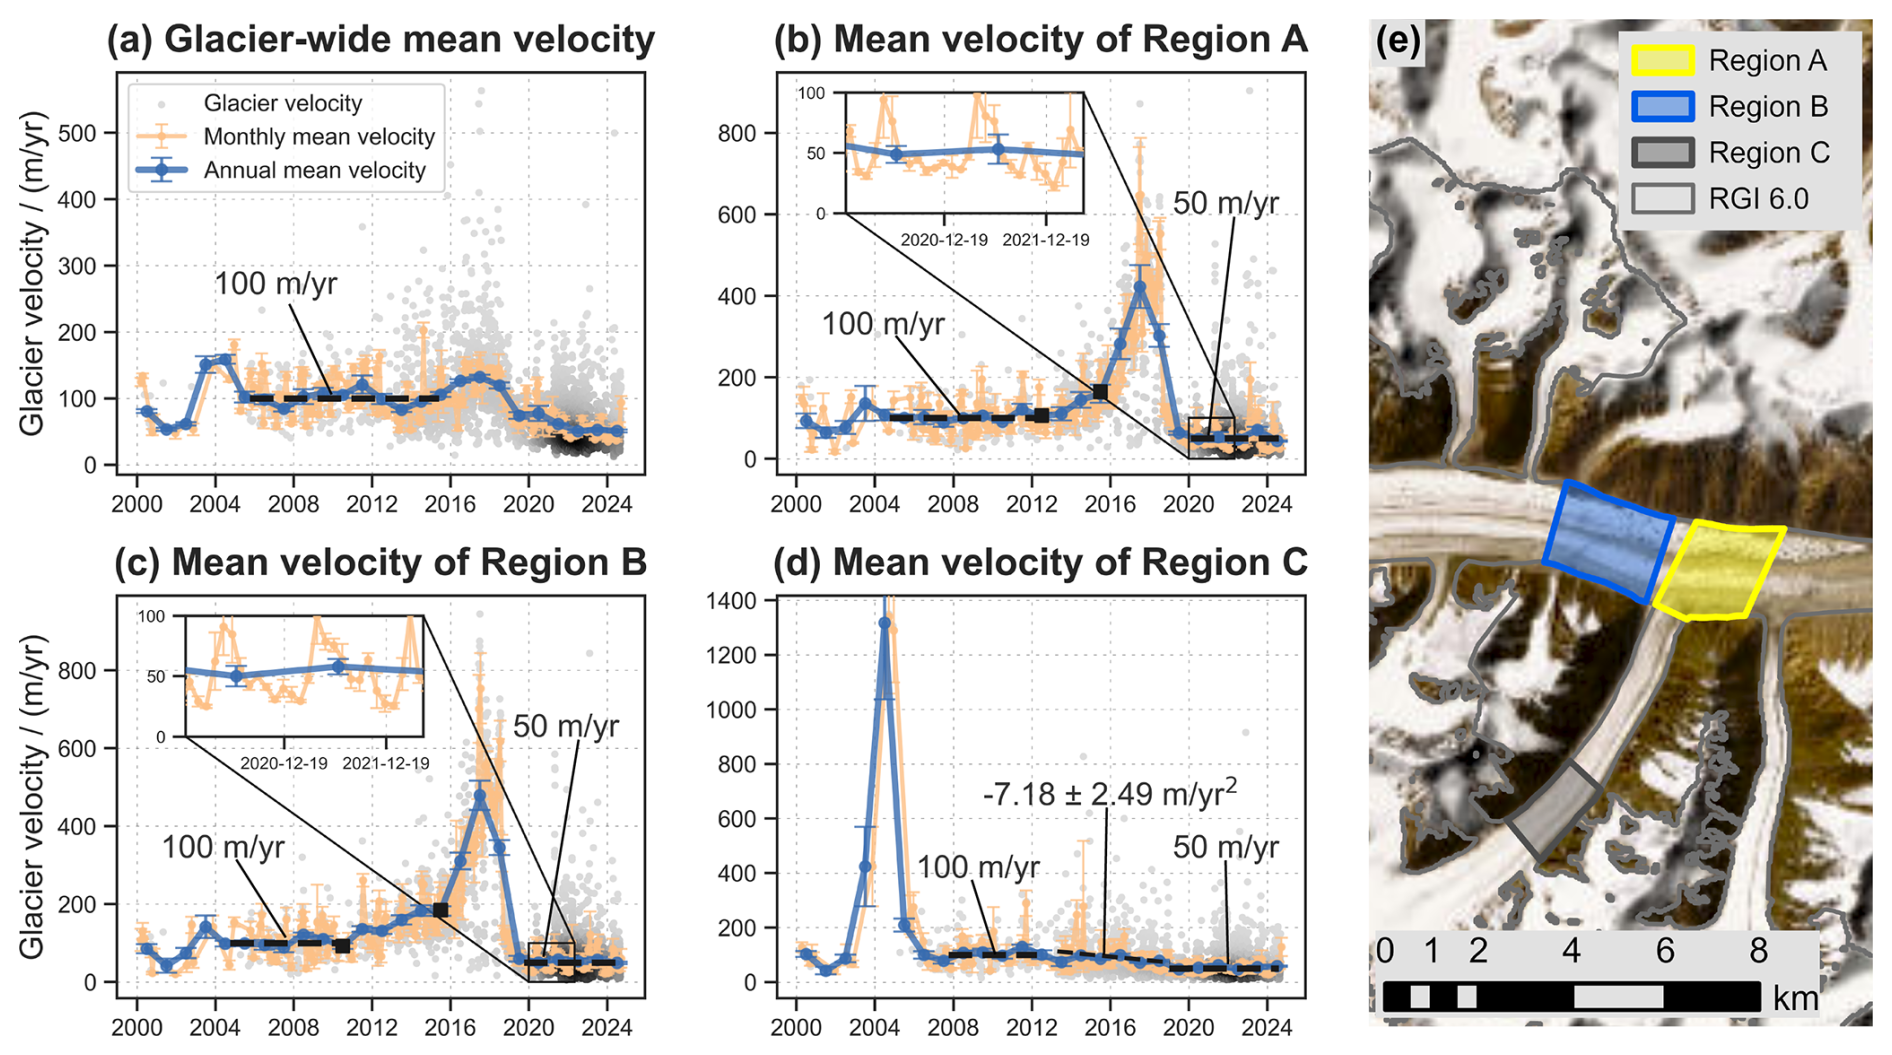
Figure 5Glacier velocity time series for NKG I and Regions A, B, and C. The orange line represents monthly mean glacier velocity, while the blue line denotes annual mean velocity. Each grey dot corresponds to an individual velocity observation, with darker colours indicating more observations at that position. Panel (e) shows the locations of Regions A, B, and C. Note that the y-axis scales differ between panel (a)–(e). The base map in panel (e) is derived from the ESRI World Imagery and Hillshade (Sources: ESRI, NASA, NGA, USGS, Earthstar Geographics, Sources: ESRI, TomTom, Garmin, FAO, NOAA, USGS, © OpenStreetMap contributors, and the GIS User Community | Powered by Esri).
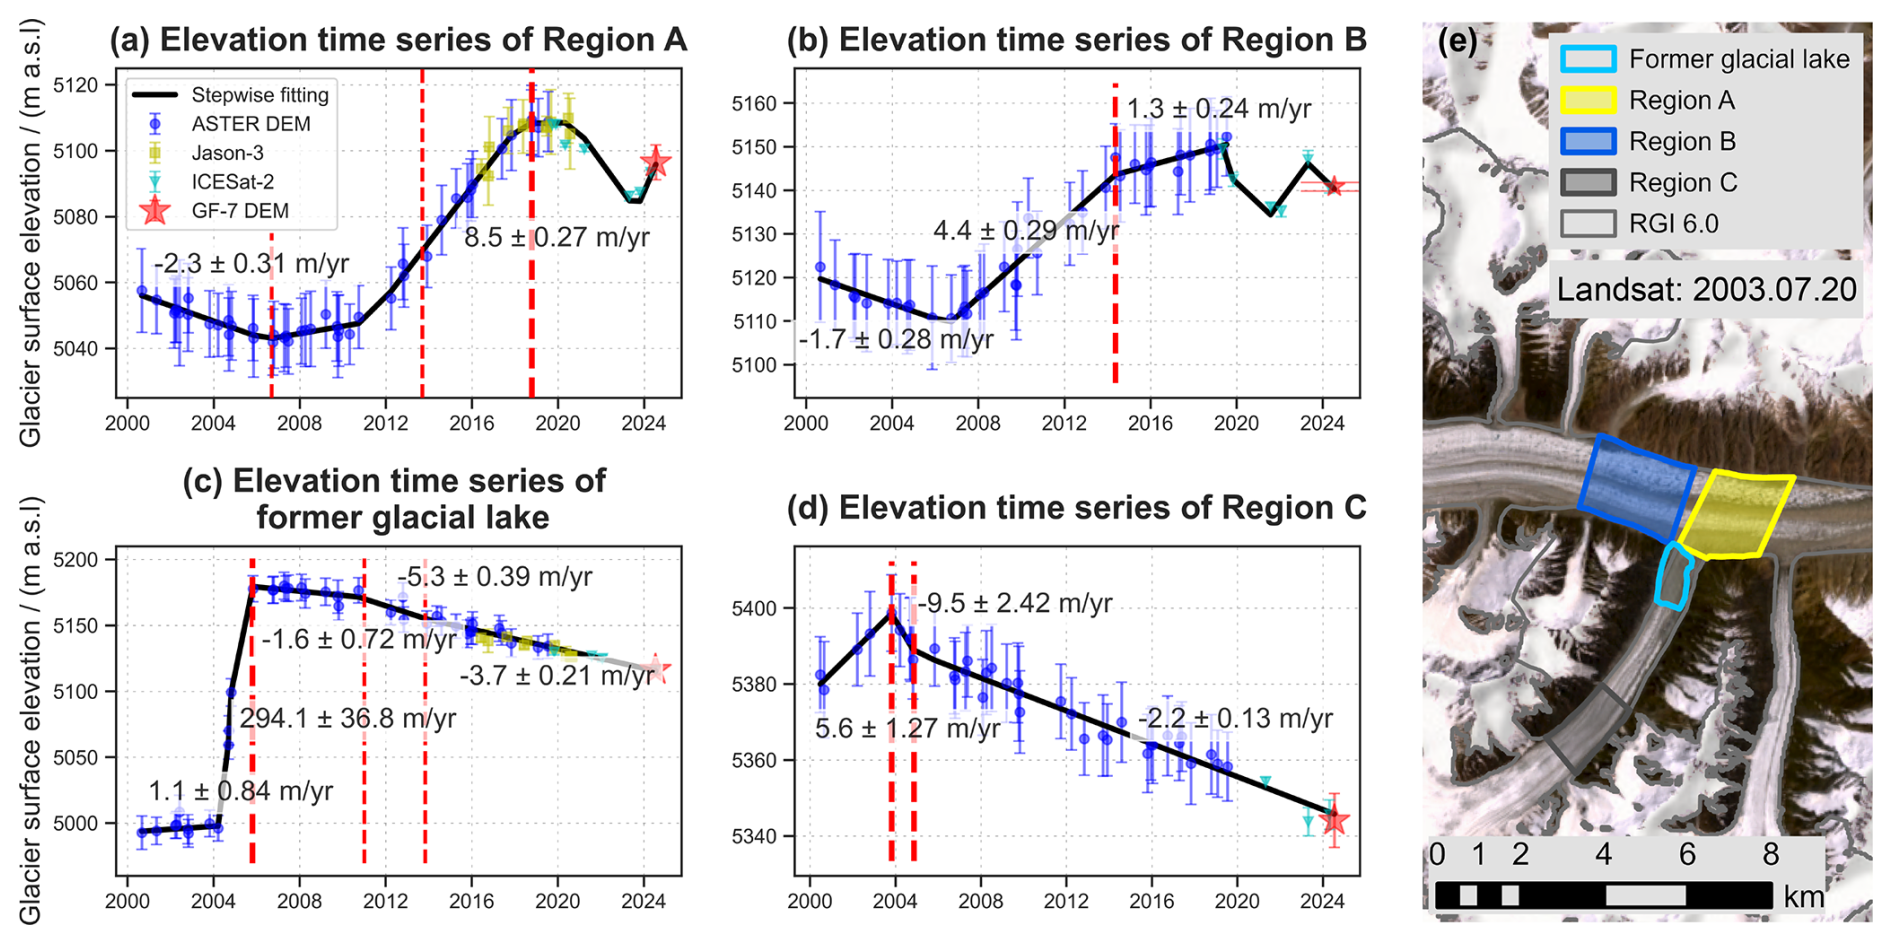
Figure 6Glacier surface elevation time series of Regions A, B, C, and the former glacial lake from 2000 to 2024. (a)–(d) Black lines indicate elevation change trends, with each dot representing an individual elevation observation. Vertical red lines mark transition points in elevation change patterns. (e) Locations of Regions A, B, C, and the former glacial lake. The base map in panel (e) is a Landsat 7 image acquired on 20 July 2003.
To refine the timing of these surges, we calculated monthly mean velocity for the entire glacier as well as for key regions (Fig. 5). Regions B and C correspond to areas exhibiting the highest velocities during the second and first surges, respectively, and were used to investigate the temporal characteristics of these surge events. The glacier-wide mean velocity exhibited two distinct peaks in 2004 and 2017, aligning with the surges of NKG V and the main trunk, respectively. In Region B, glacier flow velocities remained relatively stable before June 2010, after which acceleration commenced. A notable increase (from 182 ± 12 m yr−1 in June 2015 to 479±38 m yr−1 in June 2017) started in June 2015, marking the onset of the active phase. During the active phase, three distinct acceleration and deceleration events occurred, with peak velocity reaching 754 ± 90 m yr−1 in July 2017. Additional peaks were recorded in November 2017 (562±30 m yr−1) and July 2018 (618 ± 52 m yr−1). Following July 2018, glacier velocity declined sharply until September 2018, eventually stabilizing by June 2019. This suggests that the surge persisted for approximately four years, from June 2015 to June 2019. High-altitude velocity dynamics also confirm that, despite brief periods of increased flow exceeding 300 m yr−1 in 2011 and 2014, the surge of the main trunk began in June 2015. Region A, located downstream of Region B, exhibited a similar velocity pattern but with a delayed acceleration in June 2012.
In Region C, which was primarily affected during the first surge, velocity increases were first observed in November 2002, followed by rapid acceleration in November 2003. The surge peaked at 1341 ± 283 m yr−1 by September 2004 before rapidly declining, with velocities returning to a low level by April 2005. This indicates a surge duration of approximately 2.5 years (November 2002–April 2005). However, data gaps between 2002 and 2005 introduce some uncertainty in precisely constraining the surge timing. Overall, while there are slight differences in the peak velocity and surge duration of the main trunk and NKG V, our results are largely consistent with those of Guillet et al. (2025), particularly regarding the relatively low peak velocity and symmetrical velocity profile compared to regions such as Alaska-Yukon and Svalbard-Russian Arctic.
A comparative analysis of the two surges revealed distinctive post-surge behaviour patterns. Following the surge, the main trunk of NKG I exhibited a significant reduction in flow velocity, decreasing from a pre-surge stable-phase velocity of approximately 100 to around 50 m yr−1 post-surge. In contrast, NKG V initially returned to pre-surge velocities after its surge but subsequently began a steady decline at a rate of 7.2 m yr−2 from 2012 onward and eventually stabilized at approximately 50 m yr−1 in 2019. Our analysis also identified clear intra-annual velocity variations (Fig. 5b and c). During quiescence (e.g., 2020), glacier velocity follows a seasonal pattern, peaking in May and June (90–95 m yr−1), followed by continuous deceleration until renewed acceleration begins in January of the following year. Additionally, a secondary velocity peak in September–October (∼ 50 m yr−1) is evident, possibly linked to seasonal variations in glacier meltwater storage and drainage (Truffer et al., 2021).
4.2 Glacier surface elevation evolution
By integrating multisource remote sensing datasets, including Jason-3 (2016–2020), ICESat-2 (2019–2024), ASTER DEMs (2000–2019), and GF-7 DEM from July 2024, we reconstructed a time series of glacier surface elevation changes for NKG I. This analysis allowed us to capture distinct elevation variations across different glacier regions. Region A (Fig. 6a) exhibited the most complex elevation change patterns, characterized by six to seven distinct phases. Initially, from 2000 to September 2006, the surface elevation declined at a rate of −2.3 ± 0.31 m yr−1. This was followed by a four-year period of relative stability. Beginning in July 2010, the region experienced rapid elevation gain at a rate of 8.5 ± 0.27 m yr−1, though this increase was slightly slower before 2013. Between October 2018 and April 2020, surface elevation remained stable, after which it declined sharply over the following three years. In October 2023, a new phase of elevation increase commenced. Upstream Region B (Fig. 6b) exhibited a similar trend. Initially, surface elevation decreased at a rate of m yr−1 until January 2007. This was followed by a period of rapid elevation increase at 4.4 ± 0.29 m yr−1 until May 2014, after which the growth rate moderated to 1.3 ± 0.24 m yr−1.
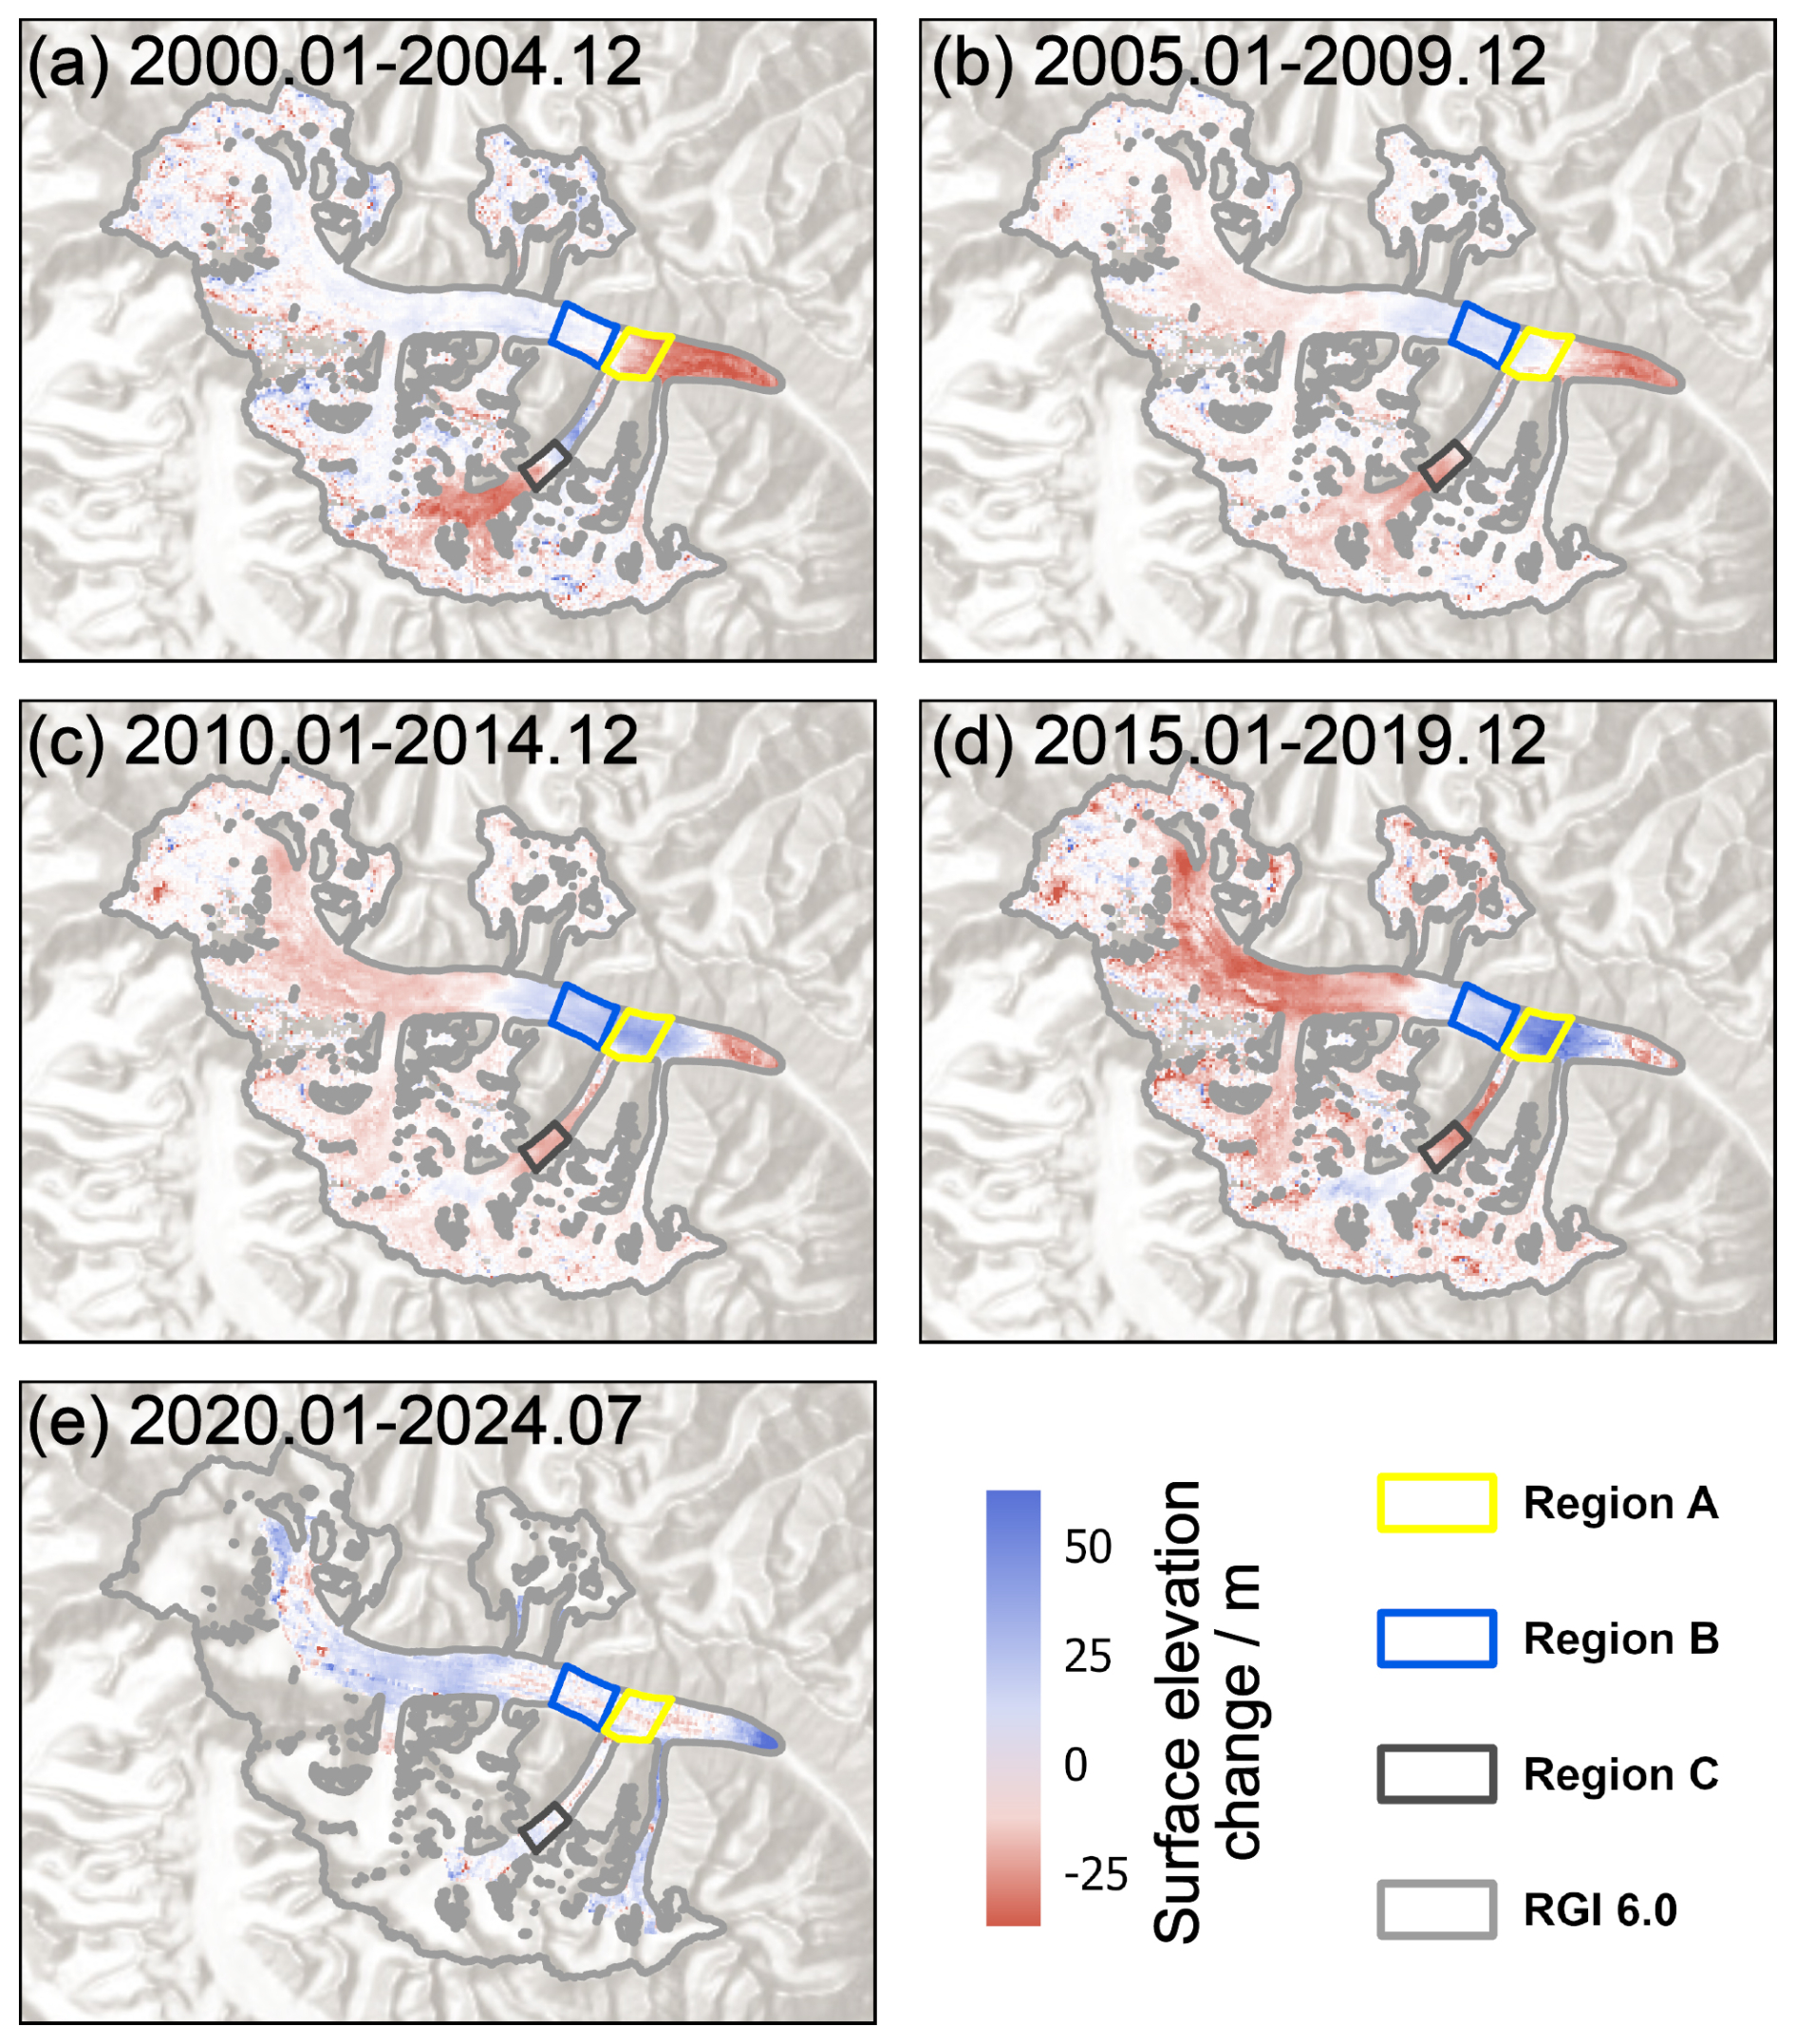
Figure 7Glacier elevation change maps of NKG I over different time periods. Blue areas indicate elevation gain, while red areas indicate elevation loss. Elevation change maps shown in panels (a)–(d) were sourced from Hugonnet et al. (2021a). The map in panel (e) shows the elevation difference between our GF-7 DEM and an ASTER DEM acquired around 2020. For panel (e), values associated with high uncertainties in high-altitude regions were excluded. The base maps in panels (a)–(e) are derived from ESRI World Hillshade (Sources: ESRI, CGIAR, USGS | Powered by Esri).
The former glacial lake, which was drained by the NKG V surge, displayed a distinct sequence of changes (Fig. 6c). Before 2004, the lake level rose gradually at a rate of 1.1 ± 0.84 m yr−1 mainly due to glacier advance. However, following the substantial mass transfer during the surge, the main trunk's obstruction led to an extreme increase in surface elevation in this region, with rates approaching 300 m yr−1, peaking in October 2005. Over the subsequent five years, the surface elevation declined steadily at a rate of −1.6 ± 0.72 m yr−1. A sharp acceleration in surface lowering began in early 2012, reaching −5.3 ± 0.39 m yr−1, corresponding with the observed deceleration in glacier flow velocity in Region C (see Sect. 4.1). Region C exhibited a distinct pattern of elevation changes (Fig. 6d). It experienced rapid elevation gain (5.6 ± 1.3 m yr−1) until October 2003, followed by an abrupt decline (−9.5 ± 2.4 m yr−1) lasting one year. The rate of decline moderated (−2.2 ± 0.13 m yr−1) significantly after October 2004.
A spatial analysis of glacier elevation changes over the past 25 years, segmented into five-year intervals, revealed distinct temporal and spatial patterns of glacier evolution (Fig. 7). During the first five-year period (2000–2005), the surge of NKG V led to significant elevation loss in its high-altitude regions, while middle- and lower-altitude regions experienced elevation gains due to mass redistribution. Meanwhile, the main trunk of NKG I followed regular glacier behaviour, with Region A and downstream areas undergoing surface lowering due to ablation, while upstream regions remained stable or experienced minor elevation increases.
Over the subsequent decade (2005–2015), the impact of the NKG V surge progressively propagated toward lower elevations. The areas that initially experienced elevation loss in the main trunk saw progressive downslope compression due to glacier movement, while subtle elevation decreases appeared in the upper regions. During the fourth five-year period (2015–2020), the main trunk surge caused substantial elevation reductions across extensive high-altitude regions. Concurrently, Region A experienced significant elevation gains, while the extent of elevation loss near the terminus further shrank. In the most recent five-year period (2020–2024), accumulated glacier mass in Region A migrated downstream toward the terminus, while glacier surface elevations in high-altitude regions increased rapidly. By this time, the influence of the NKG V surge on its surface elevation had largely dissipated.
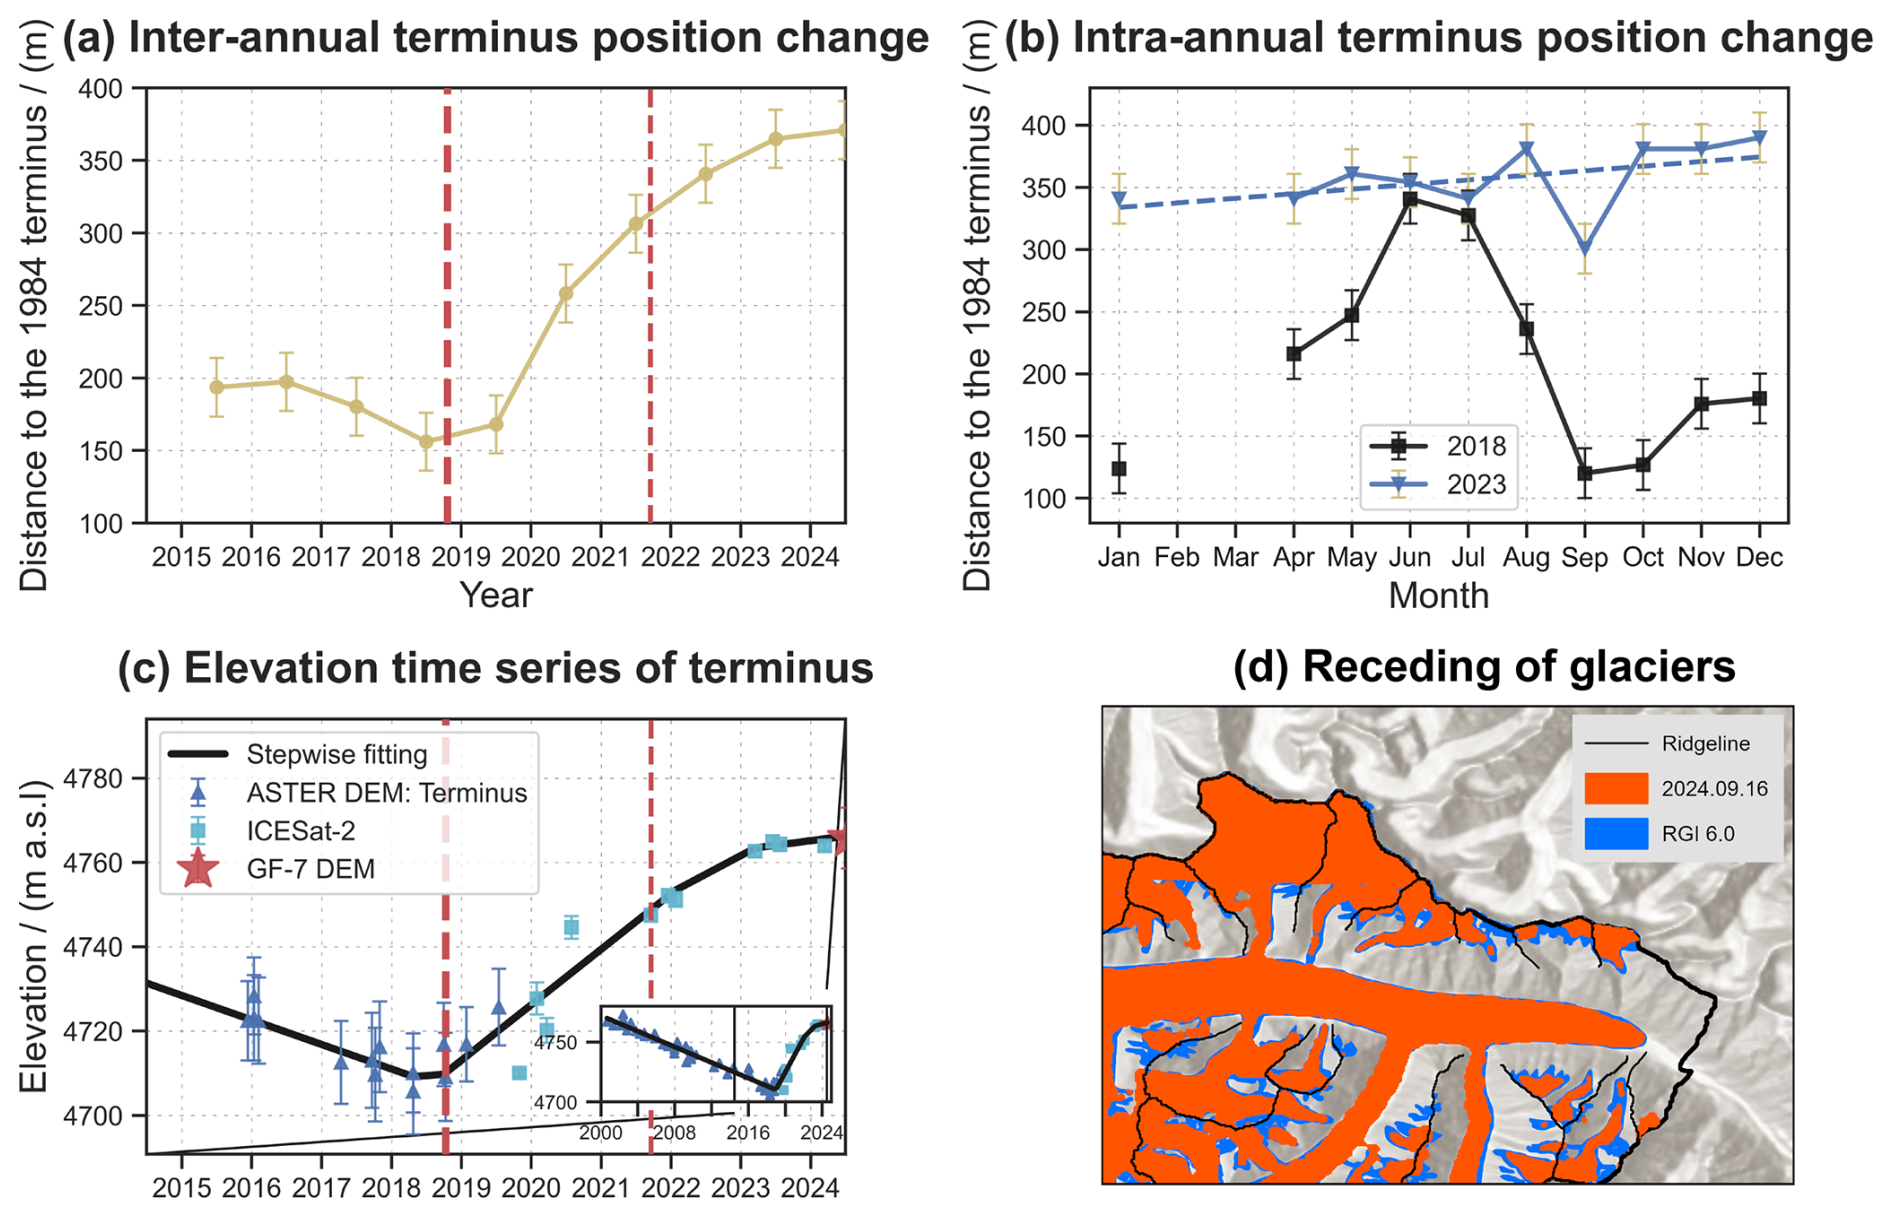
Figure 8Terminus position and surface elevation changes over time. (a) Inter-annual terminus position changes derived from Sentinel-1 imagery; (b) Intra-annual terminus position variations derived from Sentinel-1 imagery; (c) Surface elevation time series at the glacier terminus, with the lower right subfigure displaying elevation changes from 2000 to 2024; (d) Glacier recession of NKG I, where blue represents the glacier extent derived from the RGI 6.0 inventory (2 August 2002) and red depicts its configuration as of 16 September 2024. For panels (a) and (b), since the glacier length in 1984 was shorter than in all subsequent years after 2000, the glacier termini extracted from Sentinel-1 images (2015–2024) are all ahead of the 1984 terminus. Therefore, an increase in distance from the 1984 terminus indicates glacier advance, while a decrease in distance indicates glacier retreat. The base map in panel (d) is derived from ESRI World Hillshade (Sources: ESRI, NASA, NGA, USGS | Powered by Esri).
4.3 Glacier extent and terminus position change
Glacier surges can result in significant terminus advances (Bhambri et al., 2017; Guillet et al., 2022). Using Sentinel-1 SLC images, we analysed the extent and terminus position changes of NKG I over the past decade. Annual terminus positions were averaged from measurements taken in August, September, and October (Fig. 8a). Between 2015 and 2018, the glacier experienced a minor retreat of approximately 40 ± 28 m. This was followed by a rapid advance of 180 ± 29 m between 2018 and 2022, after which the advance rate slowed down. Surface elevation changes at the terminus (Fig. 8c) exhibits a clear correlation with terminus position changes. Between 2000 and October 2018, the terminus elevation declined steadily at a rate of −3.3 ± 0.10 m yr−1. This trend reversed between October 2018 and December 2021, with an accelerated elevation gain of 14.1±2.15 m yr−1. Post-2022, while elevation continued to increase, the rate slowed to 6.0 ± 0.70 m yr−1.
The high temporal resolution of Sentinel-1 data enabled a detailed analysis of intra-annual terminus variations (Fig. 8b). In 2018, before the main trunk surge reached the terminus, seasonal oscillations were evident: the terminus advanced to its farthest extent in June–July, retreated until September–October, and then resumed advancing in November. This pattern coincided with intra-annual velocity fluctuations. Initial calculations suggested an annual terminus displacement of 216 m in 2018, but comparison with Sentinel-2 (14 July 2018) and Landsat 8 (25 October 2018) images indicated a more modest change of approximately 50 m. Overestimation in Sentinel-1-derived positions was likely influenced by the grey band (crevasse) near longitude 78.0055° and seasonal snow cover in June and July. In contrast, year 2023 displayed a steady advance throughout the year, culminating in a ∼ 57 ± 13 m net advance. The stark differences in intra-annual terminus behaviours between 2018 and 2023 highlight the pronounced impact of glacier surging on seasonal terminus fluctuations.
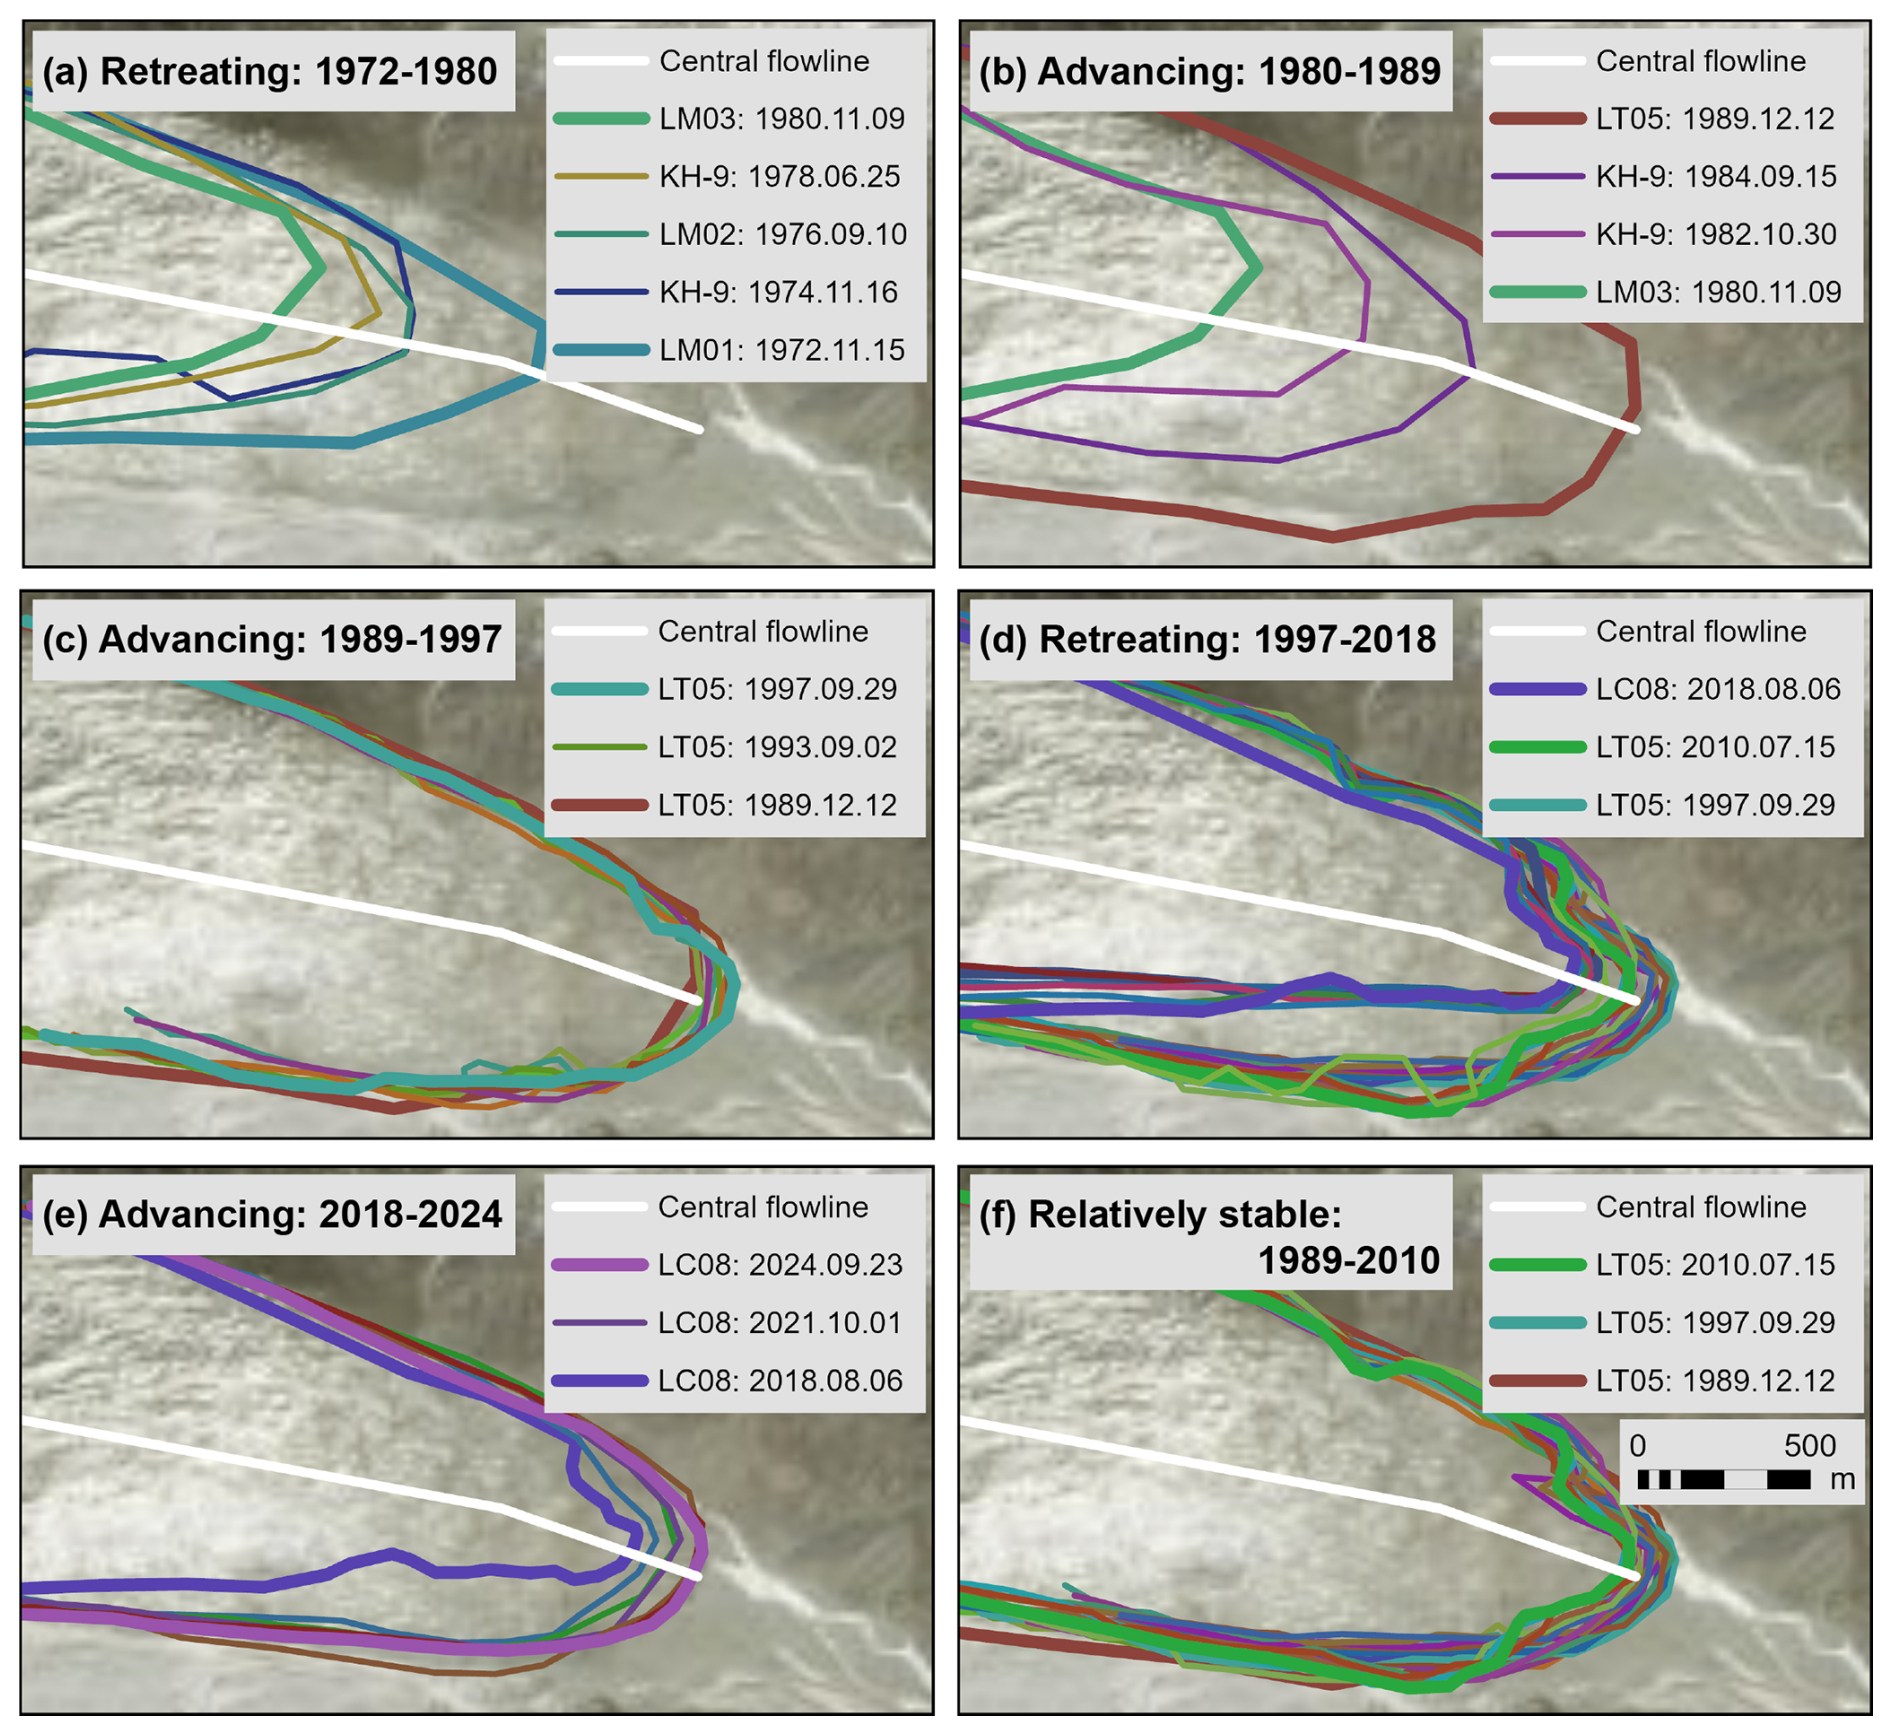
Figure 9Temporal evolution of the NKG I terminus position from 1972 to 2024. (a) Terminus retreat from 1972 to 1980; (b) Rapid terminus advance between 1980 and 1989; (c) Slow terminus advance from 1989 to 1997; (d) Terminus retreat from 1997 to 2018; (e) Terminus advance from 2018 to 2024; and (f) Period of relative terminus stability between 1989 and 2010. Coloured lines represent terminus positions and morphological changes at different time steps. The base maps in panels (a)–(f) are derived from ESRI World Imagery and Hillshade (Sources: ESRI, NASA, NGA, USGS, Maxar | Powered by Esri).
Over the past two decades, the glacier extent has undergone notable changes (−4.8 ± 11.2 km2) (Fig. 8d). While the main trunk and terminus remained relatively stable (−51.1 ± 16.3 m), significant retreat (−21.3 ± 10.9 km2) occurred in the permanent snow cover at higher elevations and in peripheral glaciers within the basin, suggesting substantial glacier mass loss due to rising temperatures. With mass redistribution to lower elevations, NKG I is likely to experience greater mass loss in the coming years.
To mitigate potential biases in Sentinel-1-derived terminus positions caused by slow movement and seasonal snow cover, we manually delineated terminus positions using historical Landsat and KH-9 images from 1972 onward (Fig. 9), indicating two surges of the main trunk. The glacier retreated by approximately 600 ± 58 m between 1972 and 1980, followed by an advance of 1100 ± 46 m over 18 years (1980–1997). The second retreat (1997–2018) was more modest at 254 ± 23 m. Post-2018, the terminus began advancing again, gaining 162 ± 22 m and nearly returning to its 2000 position. Comparisons suggest that the 1980 surge was of greater magnitude than the 2017 surge. Notably, between 1989 and 2010, the terminus remained remarkably stable (Fig. 9f), with minimal changes in both position and morphology (Fig. 9f).
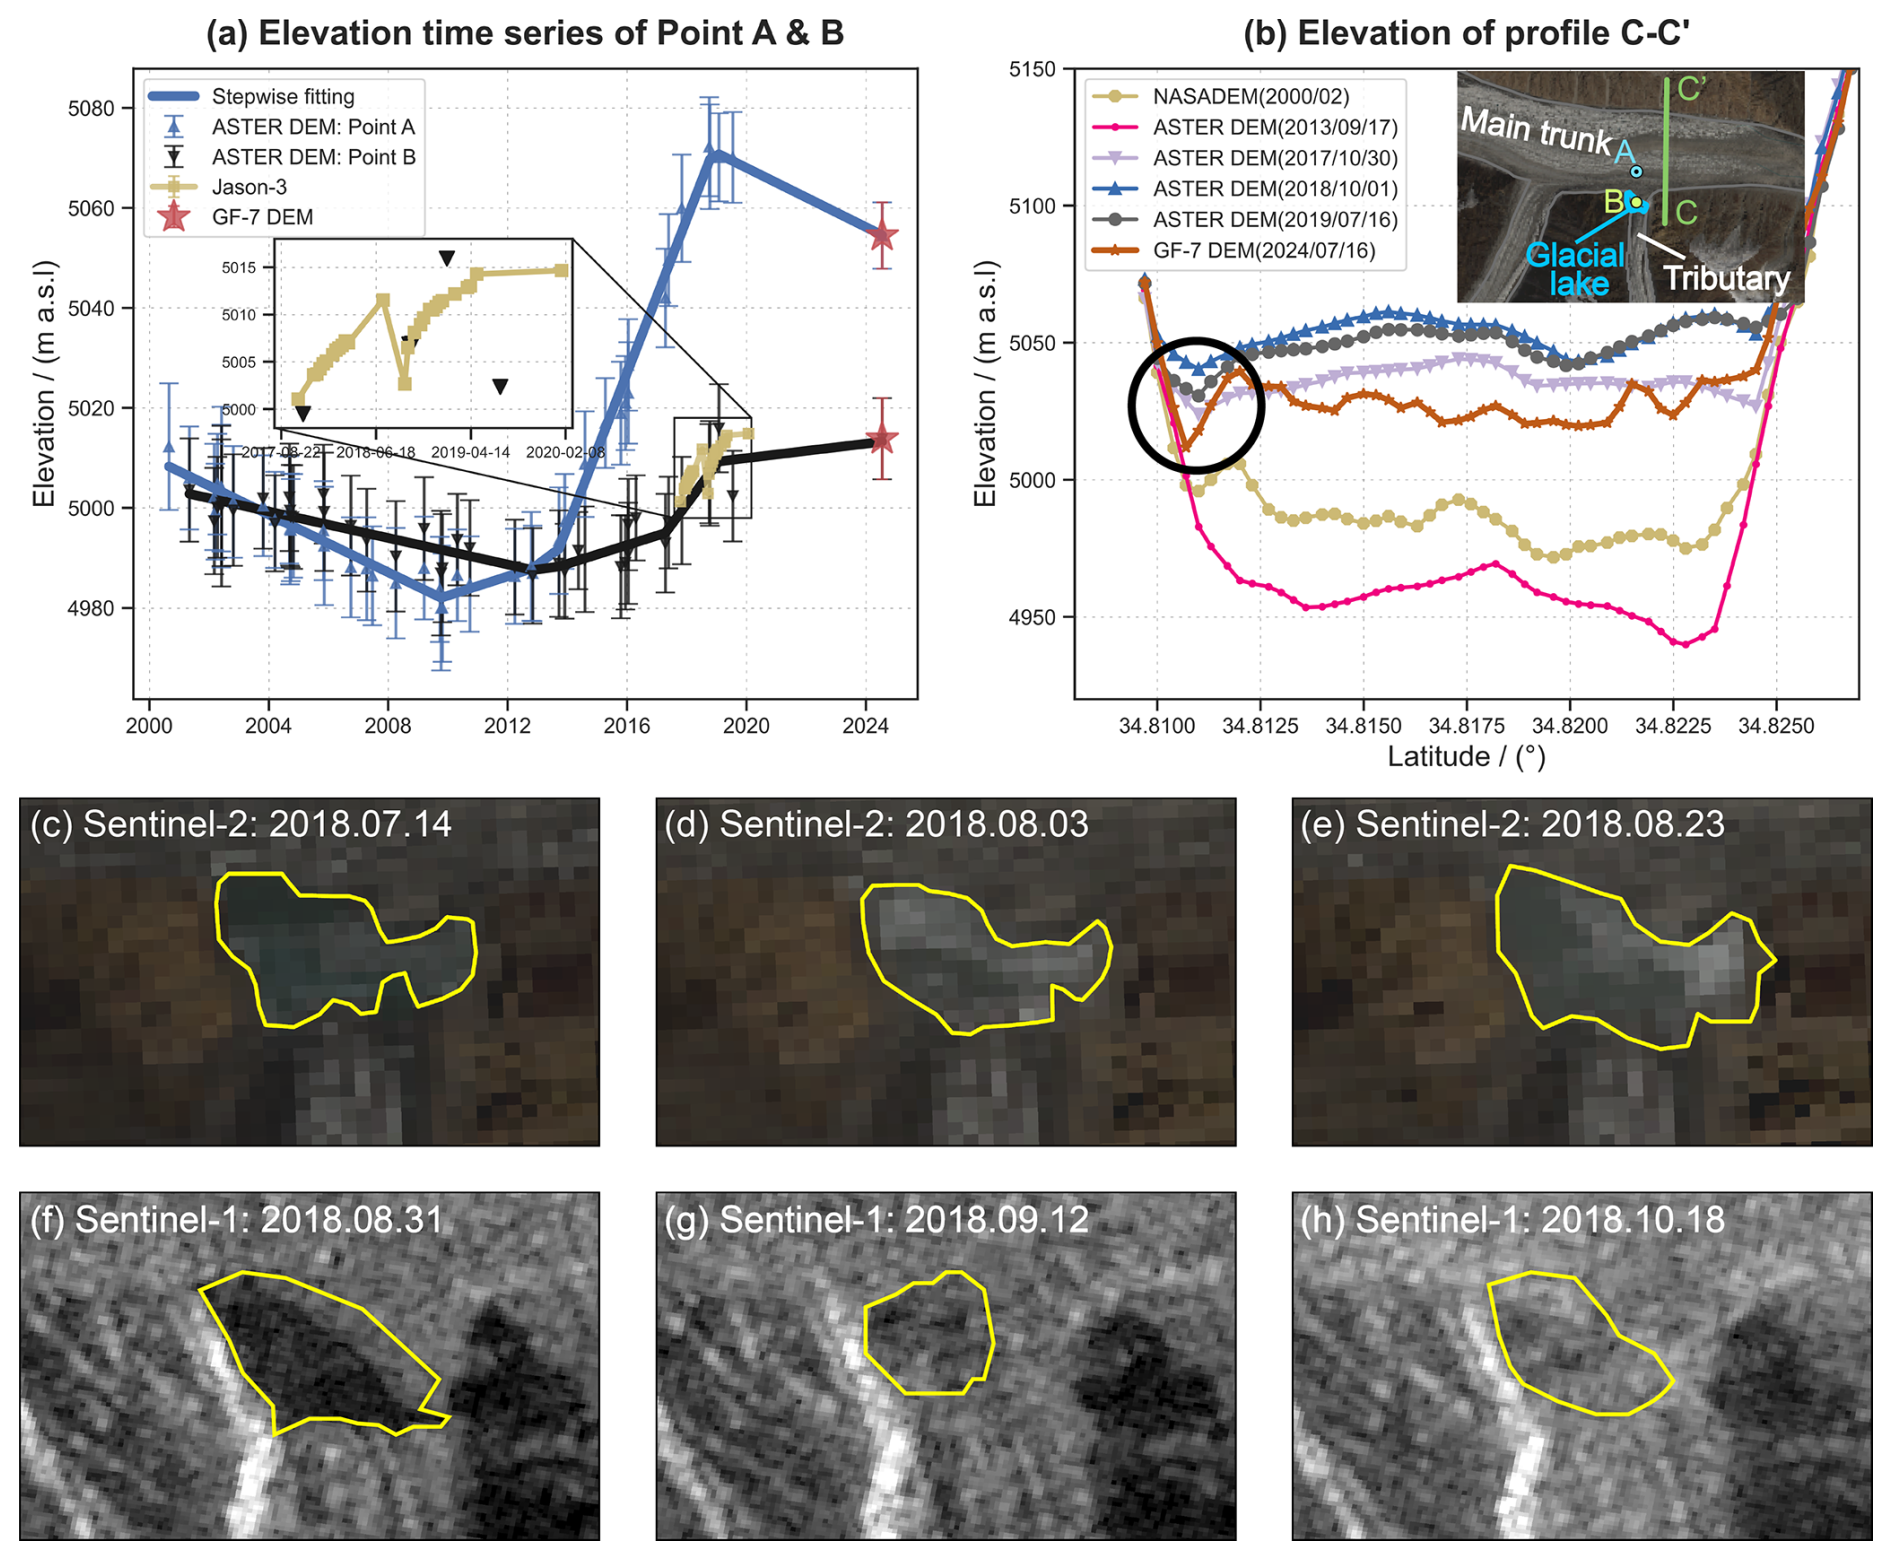
Figure 10Evolution of the glacial lake. (a) Surface elevation time series at Points A and B. The inset highlights lake level variations observed by Jason-3. (b) Elevation profile along cross-section C-C' at different time periods. (c)–(e) Glacial lake extents derived from Sentinel-2 images. (f)–(h) Glacial lake extents retrieved from Sentinel-1 GRD images. Profile C-C' denotes the cross-section of the main trunk adjacent to the glacial lake drainage channel. The black circle in panel (c) marks the deep trough that appeared near the outlet of ice-dammed lake in the 2024 GF-7 DEM. Base map of the inset map in panel (b) is a Sentinel-2 image acquired on 23 August 2018.
4.4 Surge-induced glacial lake evolution
During our analysis of Jason-3 data, we identified the formation of a small ice-dammed lake in front of the downstream tributary glacier (see the inset map of Fig. 10b), triggered by the glacier flow of the main trunk. Prior to 2012, the tributary glacier (Point B, see the inset map of Fig. 10b) maintained a slightly higher surface elevation than the main trunk, allowing for natural drainage of meltwater and precipitation (Fig. 10a). However, after 2012, the surface elevation of the main trunk (Point A, see the inset map of Fig. 10b) progressively exceeded that of the tributary glacier. This elevation disparity was further exacerbated by the 2017 surge of the main trunk, which altered the local topography and obstructed meltwater drainage from the tributary glacier, ultimately leading to lake formation.
Jason-3 observations captured a sudden drop in lake level during the summer of 2018, a phenomenon corroborated by the ASTER DEM time series, which documented a similar rapid decline in summer 2019. To further investigate these events, we utilized high-resolution Sentinel-1 and Sentinel-2 images to delineate lake boundaries between July and October 2018 (Fig. 10c–h). The lake remained relatively stable at approximately 0.11 ± 0.009 km2 from July to early August before expanding rapidly to 0.145 ± 0.009 km2 by late August, coinciding with peak water levels. During this period, floating ice masses moved northeastward, suggesting that the discharge process had commenced. By mid-September, the lake experienced a rapid reduction in area, with no subsequent recovery observed through mid-October. Additionally, we selected a cross-section profile (C-C') of the main trunk to investigate the drainage of the glacial lake. Analysis of the C-C' elevation profile (Fig. 10b) suggests that a drainage event occurred in early September, consistent with the findings of Lovell and Muhammad (2024). A similar drainage event likely explains the abrupt water level reduction observed in 2019.
Analysis of the July 2024 GF-7 DEM revealed that the glacial lake maintained a water level of 5013.8 m during the summer of 2024, comparable to peak levels recorded in 2018 and 2019. These observations indicate that the lake functions as a small, seasonally cyclic glacial lake system, characterized by water accumulation during autumn through spring, followed by discharge events in the summer. Additionally, observations from July 2024 indicate that the surface elevation of the main trunk at Point A has decreased relative to 2019, with an elevation change rate of −3.0 m yr−1. Given the current elevation patterns, the persistence of this glacial lake in coming years appears likely. Furthermore, the GF-7 DEM cross-section (black circle in Fig. 10b) revealed a deep trough adjacent to the ice-dammed lake, with a minimum elevation of 5011.8 m, slightly lower than contemporary peak lake levels. This topographic configuration suggests that any further rise in lake level could potentially trigger future discharge events or overflow conditions.
Additionally, analysis of historical KH-9 and Landsat 2 images provides more context for the region's glacial lake evolution. The former proglacial lake fronting NKG V emerged around 1978 and persisted for an extended period. The June 1978 KH-9 image indicates that its formation resulted from a rise in the main trunk elevation, which impeded meltwater drainage, a mechanism analogous to that observed in the tributary glacier. As the NKG V terminus underwent sustained meltwater inundation and progressive ablation, the lake expanded to 0.61 ± 0.038 km2 by August 1991 and remained at approximately 0.6 km2 throughout the following decade. However, the surge of NKG V led to the complete disappearance of this glacial lake by the end of 2004, with accumulated meltwater releasing gradually over the course of less than a year.
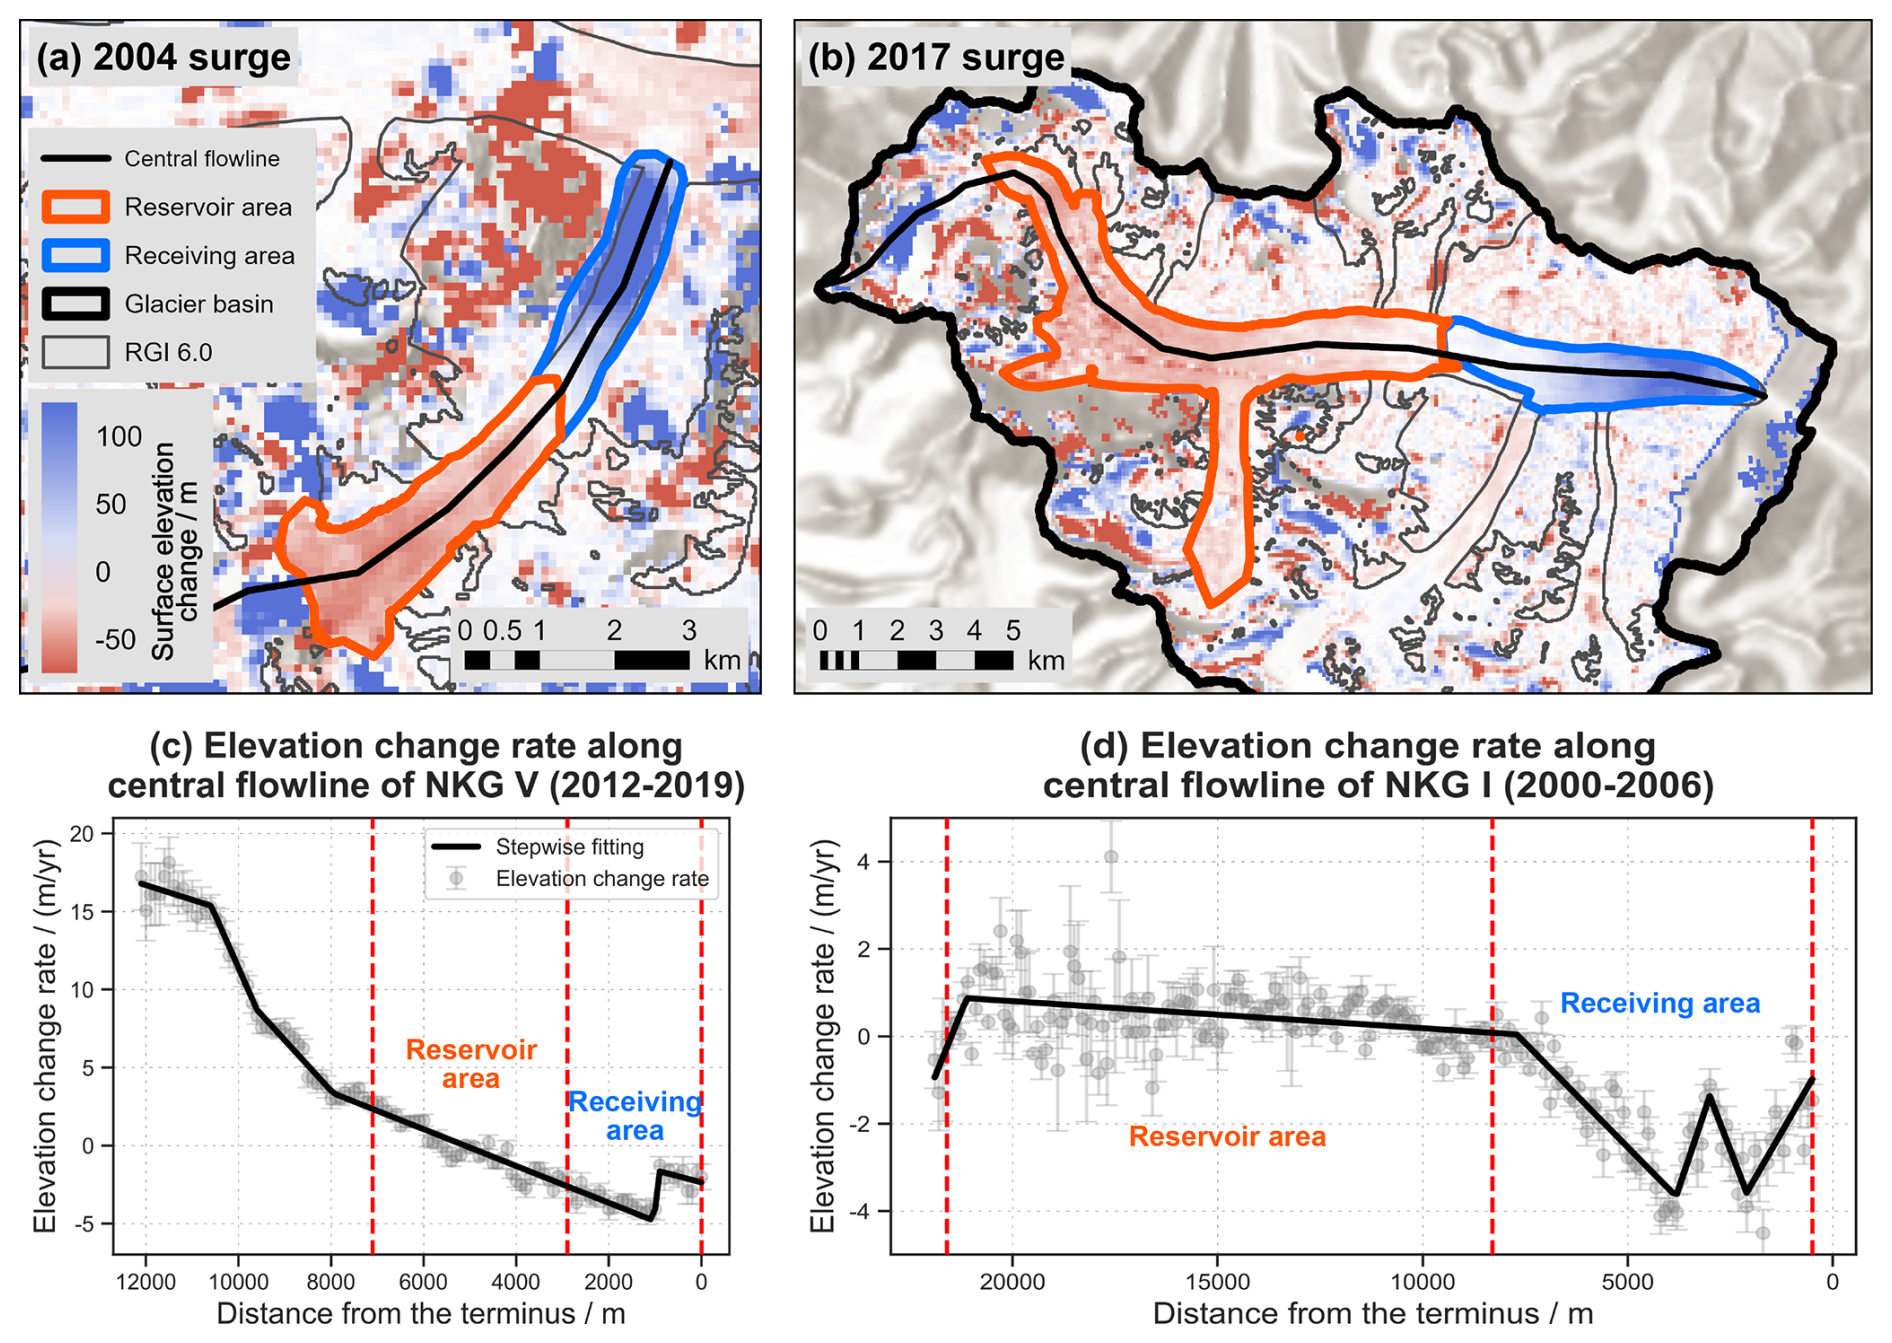
Figure 11Glacier elevation changes during surges and elevation change rates along central flowlines during stable periods. (a) Elevation changes of NKG V between 2002 and 2006; (b) Elevation changes of NKG I between 2015 and 2019; (c) Elevation change rates along the central flowline of NKG V during the period (2012–2019); (d) Elevation change rates along the central flowline of NKG I during the period (2000–2006). The areas between the vertical dashed lines in (c) and (d) correspond to the reservoir and receiving areas shown in (a) and (b). The base map in panel (b) is derived from ESRI World Hillshade (Sources: ESRI, NASA, NGA, USGS | Powered by Esri).
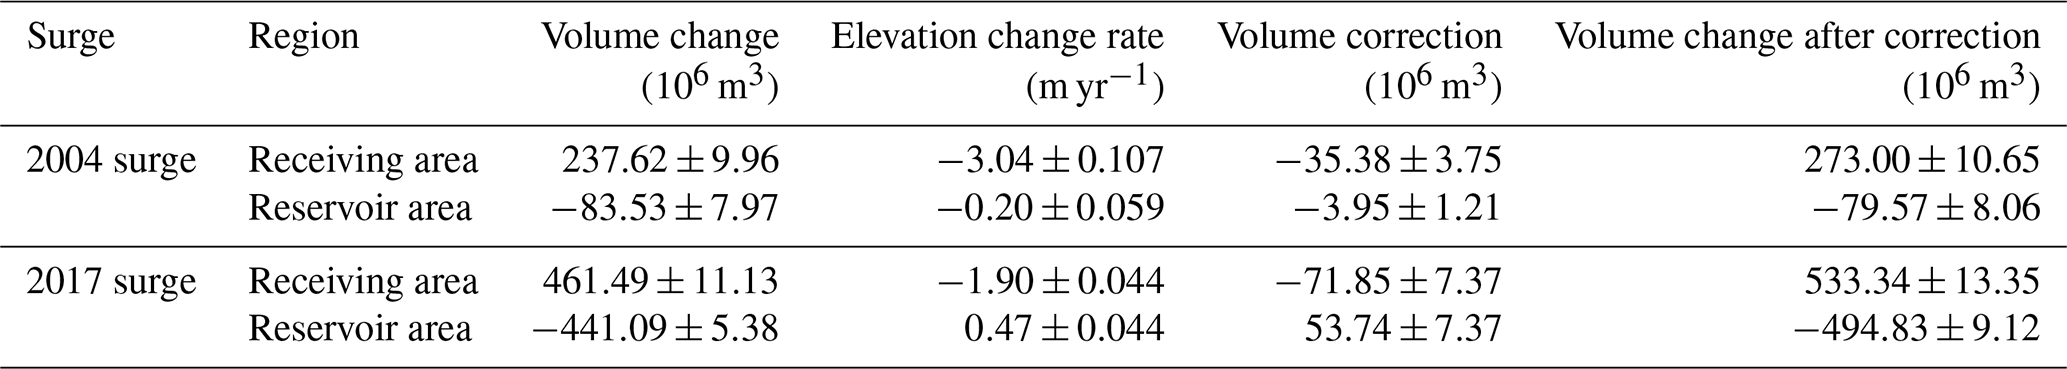
4.5 Surge-induced glacier mass transfer
To assess mass transfer during the two glacier surges, we selected four ASTER DEMs captured before and after each event. The pre-surge DEM for NKG V was acquired on 21 October 2002, and the post-surge DEM on 16 October 2006. For the main trunk of NKG I, the pre-surge DEM was obtained on 16 October 2015, while the post-surge DEM was from 16 July 2019. By analysing elevation changes between these periods, we manually delineated the reservoir and receiving areas of the surges (Fig. 11a and b). However, given the presence of data gaps and errors in the DEMs, particularly in high-altitude regions (Paul et al., 2017), the delineated reservoir areas may deviate from actual reservoir extents. As a result, our estimation of mass transfer primarily relies on the receiving areas, where elevation change signals are more clearly captured.
During the 2004 surge of NKG V (November 2002–April 2005), the volume of ice transported downstream was estimated at 0.24 ± 0.010 km3. Similarly, the 2017 surge of the main trunk (June 2015–June 2019) resulted in a larger volume transfer of 0.46 ± 0.011 km3 (Table 2). However, glacier surges are accompanied not only by mass transport but also other concurrent accumulation and ablation processes. To account for these, we extracted and fitted the elevation change rates during stable periods along the central flowlines (i.e., 2012–2019 for NKG V and 2000–2006 for the main trunk), and used these rates to approximate the elevation change patterns attributed to precipitation and melting during the surges (Fig. 11c and d). Given the relatively minor temperature fluctuations in the NKG region between 2000 and 2019, the uncertainties in our ablation estimates remain within acceptable limits. After these corrections, the glacier volume change in the receiving areas was revised upward by 14.9 % (0.27 ± 0.011 km3) for NKG V and 15.6 % (0.53 ± 0.013 km3) for the main trunk (Table 2). The impacts of these transferred materials, however, differed significantly. In the case of NKG V, the main trunk acted as a barrier, preventing substantial mass transport beyond the former glacial lake site. Consequently, the surge's influence on the entire NKG I system remained relatively limited. In contrast, the main trunk's surge resulted in a more extensive and impactful mass redistribution.
With a considerable volume of ice now reaching the terminus and regional temperatures continuing to rise (Fig. 13a), we anticipate a significant increase in glacier runoff in the coming years. This could heighten flood risks, particularly during the summer months when glacier discharge is at its peak. Additionally, we observed a rapid rise in surface elevation in the high-altitude regions of NKG V after 2012 (Fig. 11c), suggesting that the firn basin is still accumulating mass and that the glacier remains in a quiescent phase. In contrast, the surface elevation changes in the high-altitude areas of the main trunk between 2000 and 2006 were minimal (Fig. 11d), indicating substantial ice accumulation in the reservoir area. If this accumulation continues to exceed the critical threshold (e.g., the driving stress exceeds the basal shear stress or resistance), it could potentially trigger another glacier surge, as observed when the main trunk entered its active phase in 2015.
5.1 Mechanisms on the surge behaviour of NKG I
Anomalous increases in glacier velocity are a distinct characteristic of glacier surges (Huang et al., 2023; Nanni et al., 2023; Li et al., 2024; Troilo et al., 2024). To investigate the surge mechanism of NKG, we excluded data with excessive missing values with a threshold of 50 % from the velocity maps and further analysed the velocity changes in Region B between 2015 and 2019. During the four-year active phase of the main trunk, the flow velocity time series exhibited four distinct peaks (Fig. 12). The first peak occurred from June 2016 to May 2017, lasting approximately one year; the second from May 2017 to September 2017, lasting about four months; the third from September 2017 to May 2018, lasting eight months; and the fourth from May 2018 to September 2018, lasting about four months. Among the four peaks, Peak 1 exhibited slow acceleration and deceleration. In contrast, Peak 2 and Peak 4 accelerated and decelerated rapidly. Peak 3 accelerated relatively quickly, falling between Peak 1 and Peak 2/4, and its deceleration process slowed down further in the latter stage.
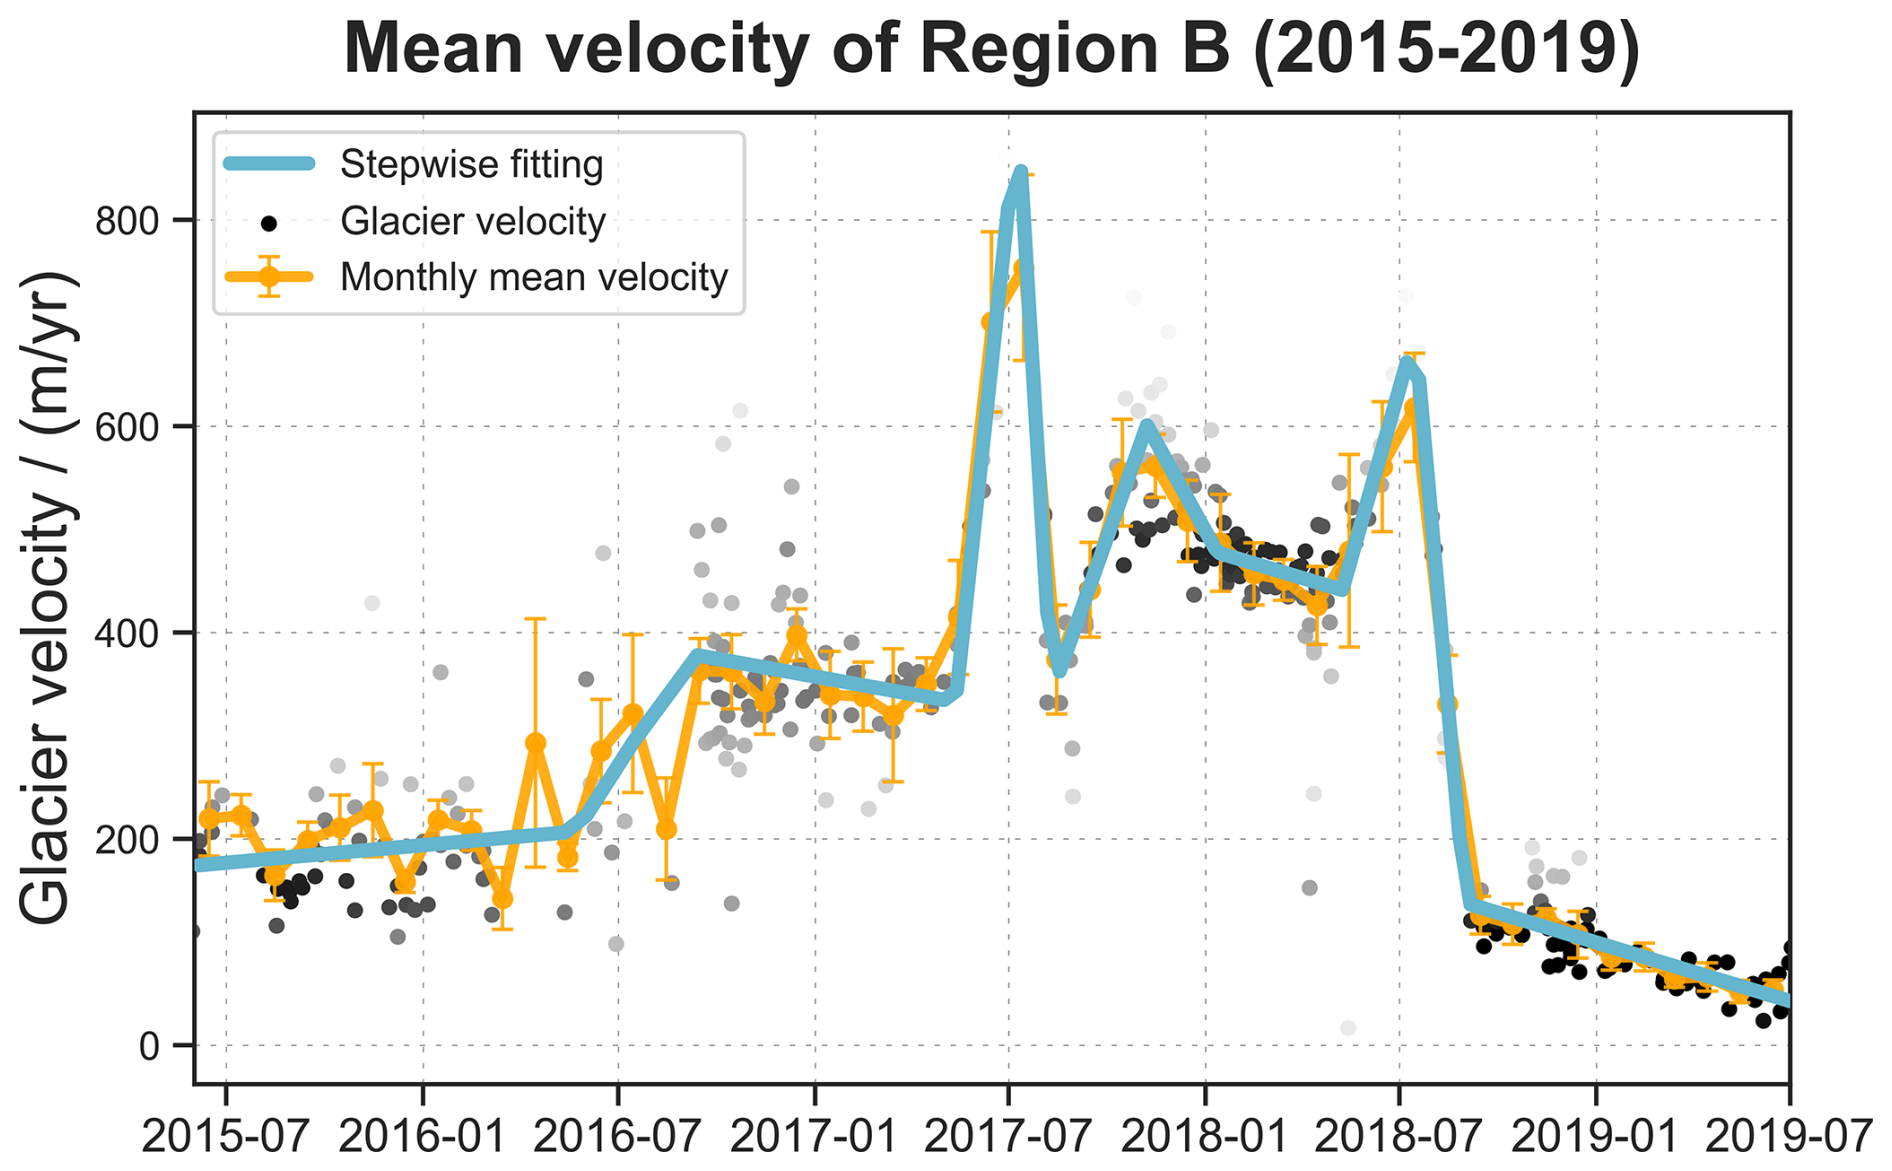
Figure 12Glacier velocity time series for Regions B (2015–2019). The orange line represents monthly mean glacier velocity, while the cyan line denotes velocity change trends. Each grey dot corresponds to an individual velocity observation, with darker colours indicating more observations at that position.
Peak 1 is likely attributable to the accumulation of high-pressure water beneath the ice following mass accumulation (Guan, 2024), which reduced resistance to glacier motion and led to a relatively slow increase in velocity. The subsequent deceleration phase was primarily driven by internal deformation resulting from reduced meltwater input.
Given that both Peak 2 and Peak 4 occurred during summer when meltwater input is at its highest, the rapid acceleration may have been influenced by surface meltwater (Round et al., 2017; Gao et al., 2025). Surface meltwater infiltrating the glacier bed may have further destabilized the glacier. The lubrication and buoyancy effects of meltwater reduced the resistance to motion, leading to a sharp increase in glacier velocity and the formation of subglacial drainage channels. As meltwater drained, increasing resistance caused a rapid decrease in glacier velocity. The difference between Peak 2 and Peak 4 might lie in the residual heat: after Peak 2 decelerated, substantial heat remained within the glacier, allowing it to sustain fast motion, whereas after Peak 4 decelerated, the accumulated heat was essentially dissipated, causing a rapid decrease in velocity and a return to a slow-flow state.
Peak 3 was also influenced by surface meltwater, possibly due to the abnormally high temperatures in October 2017. During this month, the mean air temperature in the NKG region reached −0.3 °C, close to the melting point and 2.4 °C higher than the October climatology between 2000 and 2020 (Muñoz-Sabater et al., 2021). This elevated temperature generated substantial surface melt. Although meltwater production was lower than in summer, the water that did infiltrate reached the glacier bed and significantly enhanced basal motion. Once this meltwater was drained through subglacial channels or refroze, glacier velocity decreased. As meltwater continued to diminish, glacier motion became increasingly dominated by internal deformation, similar to the post-peak behaviour observed for Peak 1, resulting in a gradual deceleration.
Considering the conditions associated with all four peaks, the surge behaviour of NKG I cannot be fully explained by either a purely hydraulic or purely thermal mechanism. A more comprehensive framework is needed. Future work could incorporate enthalpy-based model (Benn et al., 2019, 2022; Guillet et al., 2025) or other unified modelling approaches that couple subglacial hydrological processes with basal sliding dynamics (Tsai et al., 2022). Integrating high-resolution optical images, L/P-band radar capable of penetrating glacier ice, and targeted field measurements would further enable detailed diagnostics of surge mechanisms.
5.2 Response of glacier surge and movement to climate change
We analysed long-term changes in temperature, precipitation, snowfall, snow albedo, net radiation, and net solar radiation in the NKG region since 1950 using ERA5-Land Monthly Aggregated data (Fig. 13). Results indicate that between 1984 and 1999, increased snowfall contributed to substantial glacier mass accumulation in the region. During this period, both NKG V and the main trunk of NKG I experienced significant mass gain and increased driving stress. Additionally, elevated temperatures in 2015/2016, increased snowfall in 2015, and heightened net radiation from 2015 to 2017 likely played a crucial role in modifying the glacier's enthalpy budget, enhancing glacier meltwater availability and accelerating glacier flow (Beaud et al., 2022), thereby triggering the main trunk surge. Significantly higher net radiation in 2000/2001 also likely played a key role in triggering the NKG V surge.
Under similar climatic conditions, NKG V surged earlier than the main trunk, indicating that climatic condition was not a major factor driving the difference in the timing of the two surges. However, NKG V has a steeper surface slope (4.75°) compared with the main trunk (2.21°) and has been strongly eroded by its proglacial lake (Zhang et al., 2024a). Assuming that the driving stress of glacier movement equals to the basal shear stress (Gao et al., 2024), and given comparable ice thicknesses (NKG I: 176.2 ± 156.2 m; NKG V: 113.5±45.9 m) (Millan et al., 2022), the driving stress of NKG V (84.4 kPa) is significantly greater than that (61.0 kPa) of NKG I. Additionally, the strong erosion by the proglacial lake, together with the lubricating and buoyancy effects of lake water, reduces the resistance that the low-elevation tongue of NKG V provided. These mean that NKG V requires less mass accumulation to reach surge initiation conditions. They also explain why its peak velocity during the active phase was significantly higher than that of the main trunk (Fig. 5). In contrast, for the main trunk, ice thickness in the reservoir area was still slowly increasing between 2000 and 2006 (Fig. 11d) and had not yet reached the critical point to trigger the surge.
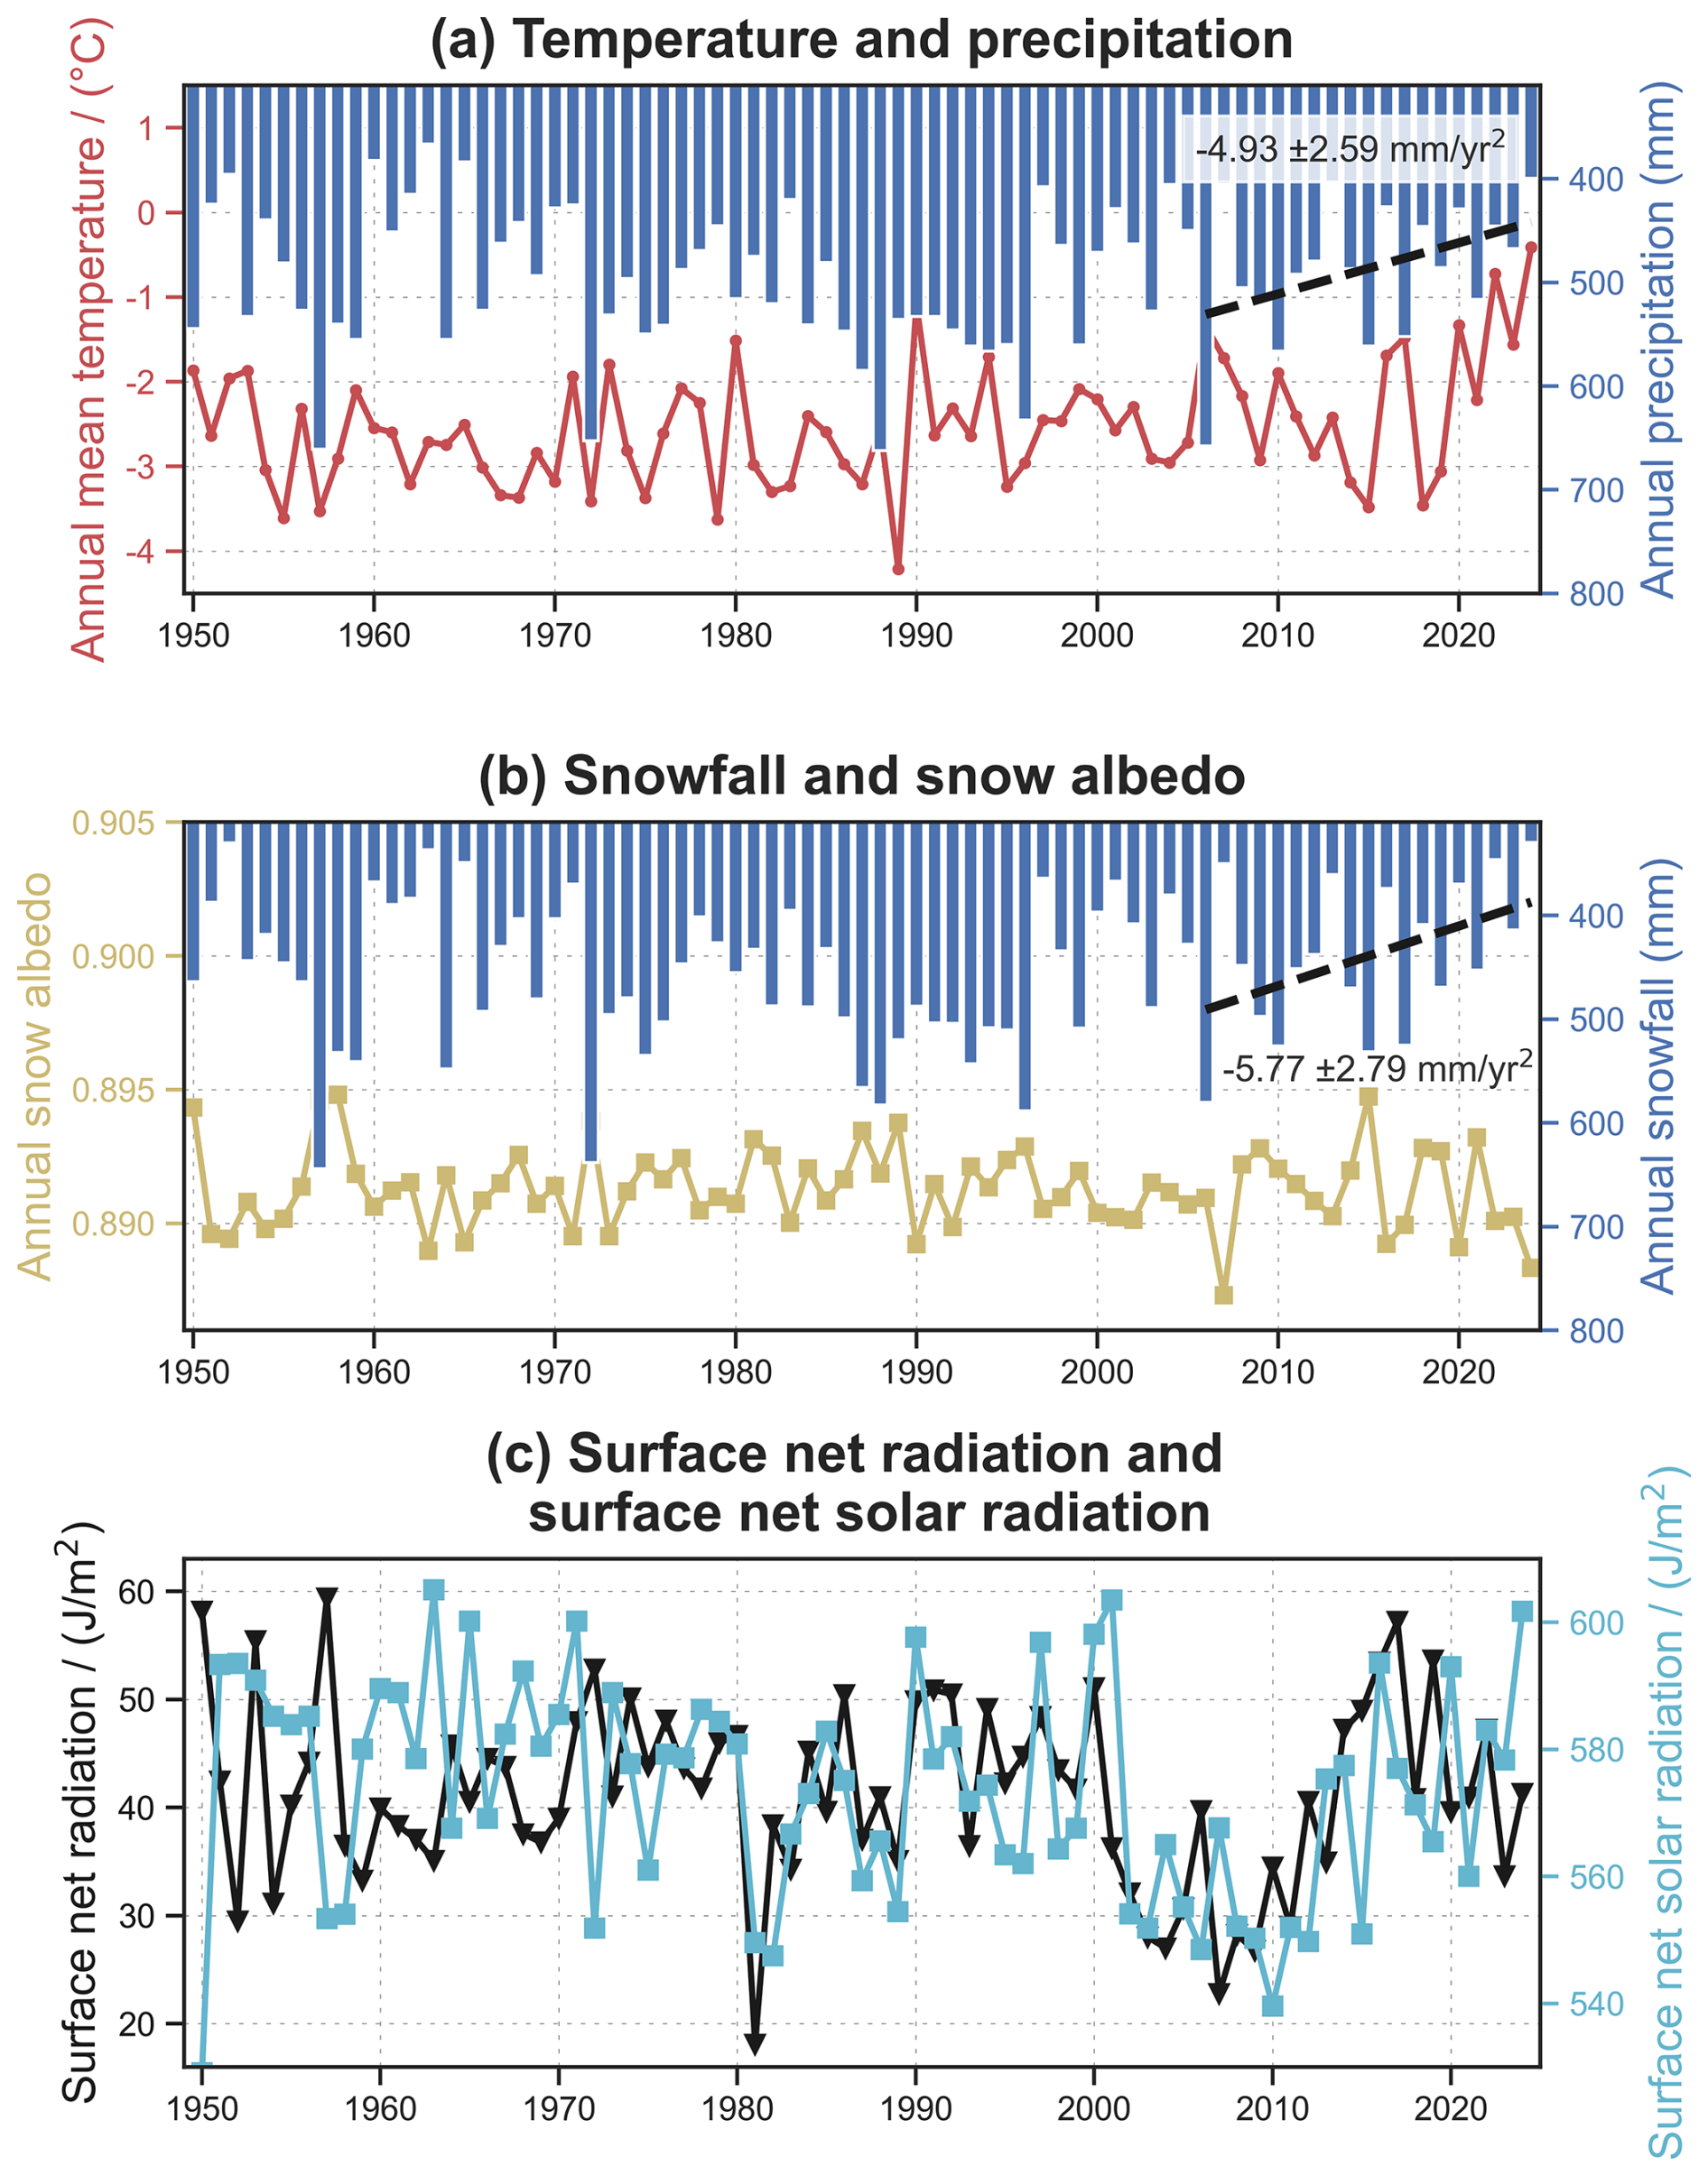
Figure 13Changes in meteorological variables in the NKG region since 1950. (a) Temperature and precipitation, (b) Snowfall and snow albedo, and (c) Surface net radiation and surface net solar radiation. Lines of different colours represent different meteorological variables, each corresponding to its respective y-axis label. Bars in (a) and (b) denote annual total precipitation and snowfall, respectively.
A comparison of the two surges of the main trunk in 1980 and 2017 reveals distinct differences in terminus behaviour following each event. After the initiation of the 1980 surge, the terminus continued to advance for nearly ten years before stabilization, and it then remained stable for almost two decades. In contrast, following the 2017 surge, rapid terminus advance lasted only about four years before slowing down. By late 2024, the terminus position showed minimal movement compared to 2023 (Fig. 9). Several factors likely contributed to the difference. First, the main trunk was significantly shorter in 1980 than in 2017. Second, post-2019 warming, coupled with reduced precipitation and snowfall since 2010, played a crucial role in limiting terminus advance in recent years. As temperatures continue to rise and precipitation phases shift, meltwater and rainfall infiltration into glaciers would increase during warm seasons, elevating basal water pressures and inducing hydrological complexity (Harrison and Post, 2003). The movement of the main trunk is likely to become increasingly influenced by hydrological processes, allowing the main trunk to reach surge-triggering conditions more easily. Thus, reduced resistance could shorten the surge cycle and decreased mass accumulation would further diminish the surge magnitude. Given the significant warming and climate extremes recently (Seneviratne et al., 2021; Wang et al., 2024), the likelihood of glacier-related hazards may increase not only in NKG I but also across the Karakoram region and broader HMA (Kääb et al., 2018). These findings highlight the growing need for improved glacier hazard monitoring, disaster prevention strategies, and mitigation efforts in response to evolving glacial dynamics in a warming climate.
5.3 Potential of Jason-3 and multisource remote sensing in monitoring mountain glaciers and glacial lakes
Originally designed for monitoring global sea levels, wave heights, and ocean surface wind speeds, Jason-3 has increasingly been applied to inland water bodies, rivers, and ice sheet elevations (Biancamaria et al., 2017, 2018; Crétaux et al., 2018; Huang et al., 2018). However, its application in mountain glacier research remains limited (Hwang et al., 2021). Our study demonstrates that, with appropriate waveform retracking, waveform selection, and observation point filtering, Jason-3 is capable of effectively monitoring large glaciers and small glacial lakes in HMA. Despite its relatively low spatial resolution, Jason-3's high temporal resolution (10 d) and fixed ground tracks offer significant advantages. Under certain conditions, its observation frequency can even surpass that of satellites like ICESat-2.
In the case of NKG I, our analysis of 653 Jason-3 footprints from 2016 to 2020 identified 177 valid footprints for glacial lake monitoring and 96 for glacier surface elevation monitoring, yielding an overall validity rate of 42 %. This demonstrates Jason-3's potential for capturing both glacier and glacial lake dynamics over time. Furthermore, by integrating historical data from TOPEX/Poseidon (T/P), Jason-1/2, and contemporary Jason-CS (Sentinel-6) with Jason-3 observations (Tao et al., 2023), it is possible to achieve continuous, long-term monitoring spanning over 30 years in suitable regions (Schröder et al., 2019).
Beyond the T/P-Jason series, incorporating data from DEMs (e.g., ASTER DEM and TerraSAR/TanDEM DEM (Wu et al., 2018)), and other altimetry satellites (e.g., ICESat-2, GEDI, SWOT, Sentinel-3, CryoSat-2, and ICESat) further enhances observation frequency and spatial coverage. This multisource approach enables the effective monitoring of short-term events such as glacial lake outburst floods and ice avalanches while also facilitating cross-validation with data from different sensors, thereby improving the accuracy and reliability of measurements. For glacier surges that unfold over several years, this approach can aid in detecting early-stage surface activity (Jiang et al., 2021), predicting surge propagation dynamics, and assessing potential downstream impacts-critical insights for disaster prevention and risk mitigation. These capabilities are particularly valuable in data-scarce and logistically challenging regions like HMA, where in-situ measurements are often limited. Additionally, in areas with extensive ground-based observations, this approach serves as an important independent validation tool, complementing existing datasets and improving overall monitoring accuracy.
Using multisource remote sensing data, we analysed the dynamics of flow velocity, surface elevation, terminus position, and surge-induced glacial lake during two surge events of NKG I across different spatial and temporal scales. Our results revealed distinct patterns in these variables for NKG I and its different subregions, demonstrating that multisource remote sensing can be effectively applied to monitor the surge dynamics of mountain glaciers. During the surge, glacier flow velocity increases markedly, transporting substantial glacier mass to the receiving area. This leads to a rapid or even abrupt rise in surface elevation in downstream regions, forward advance of the terminus, and the indirect drainage or formation of glacial lakes within the basin. The 2017 surge of the main trunk reached peak velocities more than 10 times higher than during the quiescent phase, transferred nearly 0.53 ± 0.013 km3 of glacier mass to the receiving area, and caused an elevation increase of ∼ 30 m in downstream region. By contrast, the 2004 surge of NKG V exhibited a significantly higher peak velocity and elevation increase but transported less glacier mass. The velocity characteristics of the main trunk during its surge highlight the complexity of the surge mechanism of NKG I, while the differing surge behaviours of the main trunk and NKG V indicate that factors such as topography and glacial lakes also play an important role in surge initiation. Historical terminus fluctuations also revealed a surge event of the main trunk around 1980 that was larger in magnitude and sustained a longer rapid advance phase than the 2017 surge. Taken together with observed changes in meteorological conditions, these differences suggest that ongoing climate change may alter surge mechanisms, potentially decreasing surge magnitudes while increasing surge frequency. However, further observations and case studies are needed to validate these trends.
This study enhances our understanding of glacier surges in NKG I and the Karakoram region, providing valuable insights into surge dynamics and their climate-driven triggers. The integration of multisource remote sensing datasets, including satellite altimetry, DEMs, optical imagery, and SAR observations, demonstrates the power of comprehensive remote sensing analyses for glacier studies. Our findings also contribute critical insights for future research on glacier surging mechanisms and offer validation data for numerical models of glacier surge behaviour.
The publicly available datasets are summarized in Table 1. The data processing and visualization codes, glacier velocity and surface elevation data for the NKG region, and vector data (i.e., glacier outlines, termini, and centerlines) have been deposited to the Zenodo repository (https://doi.org/10.5281/zenodo.19437339, Zhao et al., 2026).
DL conceived the project and conceptualized the paper. FZ and DL developed the methodology, curated the data, made the figures, and prepared the original draft. DL, CF, YW, and XD reviewed and edited the paper.
The contact author has declared that none of the authors has any competing interests.
Publisher's note: Copernicus Publications remains neutral with regard to jurisdictional claims made in the text, published maps, institutional affiliations, or any other geographical representation in this paper. The authors bear the ultimate responsibility for providing appropriate place names. Views expressed in the text are those of the authors and do not necessarily reflect the views of the publisher.
We acknowledge AVISO for providing the Jason-3 SGDR-F data; NSIDC for the ICESat-2 L3A land ice height (ATL06) dataset; ASF for the Sentinel-1 SLC/GRD images and HyP3 service; USGS and GEE for Landsat, Sentinel-2, and KH-9 images; JPL/NASA for the ITS_LIVE dataset and NASADEM; and OpenTopography for the Copernicus DEM. We thank Dr. Romain Hugonnet (University of Washington) for providing the bias-corrected ASTER DEMs spanning 2000–2019. We also gratefully acknowledge the reviewers and the editor for their constructive comments, which significantly improved the manuscript.
This research has been supported by the National Natural Science Foundation of China (grant no. 52325901).
This paper was edited by Wesley Van Wychen and reviewed by Benoît Lauzon and Gregoire Guillet.
Aja-Fernández, S. and Alberola-López, C.: On the estimation of the coefficient of variation for anisotropic diffusion speckle filtering, IEEE T. Image Process., 15, 2694–2701, https://doi.org/10.1109/Tip.2006.877360, 2006.
Barrand, N. E. and Murray, T.: Multivariate controls on the incidence of glacier surging in the Karakoram Himalaya, Arct. Antarct. Alp. Res., 38, 489–498, https://doi.org/10.1657/1523-0430(2006)38[489:Mcotio]2.0.Co;2, 2006.
Bazai, N. A., Cui, P., Carling, P. A., Wang, H., Hassan, J., Liu, D. Z., Zhang, G. T., and Jin, W.: Increasing glacial lake outburst flood hazard in response to surge glaciers in the Karakoram, Earth-Sci. Rev., 212, 103432, https://doi.org/10.1016/j.earscirev.2020.103432, 2021.
Beaud, F., Aati, S., Delaney, I., Adhikari, S., and Avouac, J.-P.: Surge dynamics of Shisper Glacier revealed by time-series correlation of optical satellite images and their utility to substantiate a generalized sliding law, The Cryosphere, 16, 3123–3148, https://doi.org/10.5194/tc-16-3123-2022, 2022.
Benn, D. I., Hewitt, I. J., and Luckman, A. J.: Enthalpy balance theory unifies diverse glacier surge behaviour, Ann. Glaciol., 63, 88–94, https://doi.org/10.1017/aog.2023.23, 2022.
Benn, D. I., Fowler, A. C., Hewitt, I., and Sevestre, H.: A general theory of glacier surges, J. Glaciol., 65, 701–716, https://doi.org/10.1017/jog.2019.62, 2019.
Berthier, E. and Brun, F.: Karakoram geodetic glacier mass balances between 2008 and 2016: persistence of the anomaly and influence of a large rock avalanche on Siachen Glacier, J. Glaciol., 65, 494–507, https://doi.org/10.1017/jog.2019.32, 2019.
Bhambri, R., Hewitt, K., Kawishwar, P., and Pratap, B.: Surge-type and surge-modified glaciers in the Karakoram, Sci. Rep., 7, 15391, https://doi.org/10.1038/s41598-017-15473-8, 2017.
Biancamaria, S., Frappart, F., Leleu, A. S., Marieu, V., Blumstein, D., Desjonquères, J. D., Boy, F., Sottolichio, A., and Valle-Levinson, A.: Satellite radar altimetry water elevations performance over a 200 m wide river: Evaluation over the Garonne River, Adv. Space Res., 59, 128–146, https://doi.org/10.1016/j.asr.2016.10.008, 2017.
Biancamaria, S., Schaedele, T., Blumstein, D., Frappart, F., Boy, F., Desjonquères, J. D., Pottier, C., Blarel, F., and Niño, F.: Validation of Jason-3 tracking modes over French rivers, Remote Sens. Environ., 209, 77–89, https://doi.org/10.1016/j.rse.2018.02.037, 2018.
Brun, F., Berthier, E., Wagnon, P., Kaab, A., and Treichler, D.: A spatially resolved estimate of High Mountain Asia glacier mass balances from 2000 to 2016, Nat. Geosci., 10, 668–673, https://doi.org/10.1038/Ngeo2999, 2017.
Chen, W. F., Yao, T. D., Zhang, G. Q., Li, S. H., and Zheng, G. X.: Accelerated glacier mass loss in the largest river and lake source regions of the Tibetan Plateau and its links with local water balance over 1976-2017, J. Glaciol., 67, 577–591, https://doi.org/10.1017/jog.2021.9, 2021.
Clarke, G. K. C., Collins, S. G., and Thompson, D. E.: Flow, Thermal Structure, and Subglacial Conditions of a Surge-Type Glacier, Can. J. Earth Sci., 21, 232–240, https://doi.org/10.1139/e84-024, 1984.
Copland, L., Sylvestre, T., Bishop, M. P., Shroder, J. F., Seong, Y. B., Owen, L. A., Bush, A., and Kamp, U.: Expanded and Recently Increased Glacier Surging in the Karakoram, Arct. Antarct. Alp. Res., 43, 503–516, https://doi.org/10.1657/1938-4246-43.4.503, 2011.
Crétaux, J. F., Bergé-Nguyen, M., Calmant, S., Jamangulova, N., Satylkanov, R., Lyard, F., Perosanz, F., Verron, J., Montazem, A. S., Le Guilcher, G., Leroux, D., Barrie, J., Maisongrande, P., and Bonnefond, P.: Absolute Calibration or Validation of the Altimeters on the Sentinel-3A and the Jason-3 over Lake Issykkul (Kyrgyzstan), Remote Sens., 10, 1679, https://doi.org/10.3390/rs10111679, 2018.
Crippen, R., Buckley, S., Agram, P., Belz, E., Gurrola, E., Hensley, S., Kobrick, M., Lavalle, M., Martin, J., Neumann, M., Nguyen, Q., Rosen, P., Shimada, J., Simard, M., and Tung, W.: Nasadem Global Elevation Model: Methods and Progress, Int. Arch. Photogramm., 41, 125–128, https://doi.org/10.5194/isprsarchives-XLI-B4-125-2016, 2016.
Crompton, J. W., Flowers, G. E., and Stead, D.: Bedrock Fracture Characteristics as a Possible Control on the Distribution of Surge-Type Glaciers, J. Geophys. Res.-Earth, 123, 853–873, https://doi.org/10.1002/2017JF004505, 2018.
Davis, C. H.: A surface and volume scattering retracking algorithm for ice sheet satellite altimetry, IEEE T. Geosci. Remote, 31, 811–818, https://doi.org/10.1109/36.239903, 1993.
Evans, S. G., Tutubalina, O. V., Drobyshev, V. N., Chernomorets, S. S., McDougall, S., Petrakov, D. A., and Hungr, O.: Catastrophic detachment and high-velocity long-runout flow of Kolka Glacier, Caucasus Mountains, Russia in 2002, Geomorphology, 105, 314–321, https://doi.org/10.1016/j.geomorph.2008.10.008, 2009.
Farinotti, D., Immerzeel, W. W., de Kok, R. J., Quincey, D. J., and Dehecq, A.: Manifestations and mechanisms of the Karakoram glacier Anomaly, Nat. Geosci., 13, 8–16, https://doi.org/10.1038/s41561-019-0513-5, 2020.
Gao, Y., Wang, J., Liu, S., Qi, M., Liang, P., and Mu, J.: Mechanisms of glacier surges in the Central Himalayas uncovered using remote sensing and glacier modelling, Geomorphology, 482, 109816, https://doi.org/10.1016/j.geomorph.2025.109816, 2025.
Gao, Y. P., Liu, S. Y., Qi, M. M., Xie, F. M., Wu, K. P., and Zhu, Y.: Glacier-Related Hazards Along the International Karakoram Highway: Status and Future Perspectives, Front. Earth Sci., 9, 611501, https://doi.org/10.3389/feart.2021.611501, 2021.
Gao, Y. P., Liu, S. Y., Qi, M. M., Yao, X. J., Zhu, Y., Xie, F. M., Wu, K. P., and Saifullah, M.: The Evolution of the Glacier Surges in the Tuanjie Peak, the Qilian Mountains, Remote Sens., 14, 852, https://doi.org/10.3390/rs14040852, 2022.
Gao, Y. P., Liu, S. Y., Wang, J. L., Yao, X. J., Qi, M. M., Liang, P. B., Mu, J. X., Ma, X. G., Zhu, Y., Xie, F. M., Jiang, Z. L., and Zhang, Z.: Characteristics of Musta Glacier surges and their responses to climate change between 1976 and 2023, Advances in Climate Change Research, https://doi.org/10.1016/j.accre.2024.12.007, 2024.
Gardner, A. S., Fahnestock, M. A., and Scambos, A. T. A.: MEaSUREs ITS_LIVE Landsat Image-Pair Glacier and Ice Sheet Surface Velocities: Version 1, National Snow and Ice Data Center [data set], https://doi.org/10.5067/IMR9D3PEI28U, 2024.
Gardner, A. S., Moholdt, G., Scambos, T., Fahnstock, M., Ligtenberg, S., van den Broeke, M., and Nilsson, J.: Increased West Antarctic and unchanged East Antarctic ice discharge over the last 7 years, The Cryosphere, 12, 521–547, https://doi.org/10.5194/tc-12-521-2018, 2018.
Gardner, A. S., Greene, C. A., Kennedy, J. H., Fahnestock, M. A., Liukis, M., López, L. A., Lei, Y., Scambos, T. A., and Dehecq, A.: ITS_LIVE global glacier velocity data in near-real time, The Cryosphere, 19, 3517–3533, https://doi.org/10.5194/tc-19-3517-2025, 2025.
Guan, W. J.: Distribution and characteristics of surge-type glaciers in High Mountain Asia, Lanzhou University, https://doi.org/10.27204/d.cnki.glzhu.2024.000034, 2024.
Guillet, G., Benn, D. I., King, O., Shean, D., Schytt Mannerfelt, E., and Hugonnet, R.: Global detection of glacier surges from surface velocities, elevation change and SAR backscatter data between 2000 and 2024: a test of surge mechanism theories, J. Glaciol., 71, e88, https://doi.org/10.1017/jog.2025.10065, 2025.
Guillet, G., King, O., Lv, M., Ghuffar, S., Benn, D., Quincey, D., and Bolch, T.: A regionally resolved inventory of High Mountain Asia surge-type glaciers, derived from a multi-factor remote sensing approach, The Cryosphere, 16, 603–623, https://doi.org/10.5194/tc-16-603-2022, 2022.
Guo, L., Li, J., Dehecq, A., Li, Z., Li, X., and Zhu, J.: A new inventory of High Mountain Asia surging glaciers derived from multiple elevation datasets since the 1970s, Earth Syst. Sci. Data, 15, 2841–2861, https://doi.org/10.5194/essd-15-2841-2023, 2023.
Guo, W., Zhang, Z., Wu, K., Liu, S., Shangguan, D., Xu, J., Jiang, Z., and Wang, X.: A review on the advances in surge-type glacier study, Journal of Glaciology and Geocryology, 44, 954–970, 2022.
Harrison, W. D. and Post, A. S.: How much do we really know about glacier surging?, Ann. Glaciol., 36, 1–6, https://doi.org/10.3189/172756403781816185, 2003.
Huang, D., Zhang, Z., Jiang, L., Zhang, R., Lu, Y., Shahtahmassebi, A., and Huang, X.: Variability of Glacier Velocity and the Influencing Factors in the Muztag-Kongur Mountains, Eastern Pamir Plateau, Remote Sens., 15, 620, https://doi.org/10.3390/rs15030620, 2023.
Huang, Q., Li, X., Han, P., Long, D., Zhao, F., and Hou, A.: Validation and application of water levels derived from Sentinel-3A for the Brahmaputra River, Science China Technological Sciences, 62, 1760–1772, https://doi.org/10.1007/s11431-019-9535-3, 2019.
Huang, Q., Long, D., Du, M. D., Zeng, C., Li, X. D., Hou, A. Z., and Hong, Y.: An improved approach to monitoring Brahmaputra River water levels using retracked altimetry data, Remote Sens. Environ., 211, 112–128, https://doi.org/10.1016/j.rse.2018.04.018, 2018.
Hugonnet, R., Brun, F., Berthier, E., Dehecq, A., Mannerfelt, E. S., Eckert, N., and Farinotti, D.: Uncertainty Analysis of Digital Elevation Models by Spatial Inference From Stable Terrain, IEEE J. Sel. Top. Appl., 15, 6456–6472, https://doi.org/10.1109/JSTARS.2022.3188922, 2022.
Hugonnet, R., McNabb, R., Berthier, E., Menounos, B., Nuth, C., Girod, L., Farinotti, D., Huss, M., Dussaillant, I., and Brun, F. K., A.: Accelerated global glacier mass loss in the early twenty-first century – Dataset, Theia [data set], https://doi.org/10.6096/13, 2021a.
Hugonnet, R., McNabb, R., Berthier, E., Menounos, B., Nuth, C., Girod, L., Farinotti, D., Huss, M., Dussaillant, I., Brun, F., and Kaab, A.: Accelerated global glacier mass loss in the early twenty-first century, Nature, 592, 726–731, https://doi.org/10.1038/s41586-021-03436-z, 2021b.
Hwang, C., Guo, J., Deng, X., Hsu, H.-Y., and Liu, Y.: Coastal Gravity Anomalies from Retracked Geosat/GM Altimetry: Improvement, Limitation and the Role of Airborne Gravity Data, J. Geodesy, 80, 204–216, https://doi.org/10.1007/s00190-006-0052-x, 2006.
Hwang, C., Wei, S. H., Cheng, Y. S., Abulaitijiang, A., Andersen, O. B., Chao, N. F., Peng, H. Y., Tseng, K. H., and Lee, J. C.: Glacier and lake level change from TOPEX-series and Cryosat-2 altimeters in Tanggula: Comparison with satellite imagery, Terr. Atmos. Ocean. Sci., 32, 1–20, https://doi.org/10.3319/Tao.2020.11.15.01, 2021.
Jiang, Z. L., Wu, K. P., Liu, S. Y., Wang, X., Zhang, Y., Tahir, A. A., and Long, S. C.: Surging dynamics of South Rimo Glacier, Eastern Karakoram, Environ. Res. Lett., 16, 114044, https://doi.org/10.1088/1748-9326/ac3175, 2021.
Jiskoot, H.: Glacier Surging, in: Encyclopedia of Snow, Ice and Glaciers, edited by: Singh, V. P., Singh, P., and Haritashya, U. K., Springer Netherlands, Dordrecht, 415–428, https://doi.org/10.1007/978-90-481-2642-2_559, 2011.
Kääb, A., Leinss, S., Gilbert, A., Buhler, Y., Gascoin, S., Evans, S. G., Bartelt, P., Berthier, E., Brun, F., Chao, W. A., Farinotti, D., Gimbert, F., Guo, W. Q., Huggel, C., Kargel, J. S., Leonard, G. J., Tian, L. D., Treichler, D., and Yao, T. D.: Massive collapse of two glaciers in western Tibet in 2016 after surge-like instability, Nat. Geosci., 11, 114–120, https://doi.org/10.1038/s41561-017-0039-7, 2018.
Kamb, B., Raymond, C. F., Harrison, W. D., Engelhardt, H., Echelmeyer, K. A., Humphrey, N., Brugman, M. M., and Pfeffer, T.: Glacier Surge Mechanism – 1982–1983 Surge of Variegated Glacier, Alaska, Science, 227, 469–479, https://doi.org/10.1126/science.227.4686.469, 1985.
Ke, L. H., Wang, R. Z., Zhang, J. S., and Ding, X.: Remote-sensing characterization of surging glaciers in High Mountain Asia in the past two decades, Front. Earth Sci., 12, 1499882, https://doi.org/10.3389/feart.2024.1499882, 2024.
Komatsu, T. and Watanabe, T.: Glacier-Related Hazards and Their Assessment in the Tajik Pamir: A Short Review, Geographical Studies, 88, 117–131, https://doi.org/10.7886/hgs.88.117, 2014.
Kumar, A., Negi, H. S., Kumar, K., Shekhar, C., and Kanda, N.: Quantifying mass balance of East-Karakoram glaciers using geodetic technique, Polar Sci., 19, 24–39, https://doi.org/10.1016/j.polar.2018.11.005, 2019.
Leclercq, P. W., Kääb, A., and Altena, B.: Brief communication: Detection of glacier surge activity using cloud computing of Sentinel-1 radar data, The Cryosphere, 15, 4901–4907, https://doi.org/10.5194/tc-15-4901-2021, 2021.
Lei, Y., Gardner, A., and Agram, P.: Autonomous Repeat Image Feature Tracking (autoRIFT) and Its Application for Tracking Ice Displacement, Remote Sens., 13, 749, https://doi.org/10.3390/rs13040749, 2021.
Lei, Y., Gardner, A. S., and Agram, P.: Processing methodology for the ITS_LIVE Sentinel-1 ice velocity products, Earth Syst. Sci. Data, 14, 5111–5137, https://doi.org/10.5194/essd-14-5111-2022, 2022.
Leinss, S., Willimann, C., and Hajnsek, I.: Glacier Detachment Hazard Analysis in the West Kunlun Shan Mountains, Int. Geosci. Remote Se., 4565–4568, https://doi.org/10.1109/igarss.2019.8900320, 2019.
Li, G., Chen, Z. Q., Mao, Y. T., Yang, Z. B., Chen, X., and Cheng, X.: Different glacier surge patterns revealed by Sentinel-2 imagery derived quasi-monthly flow velocity at west Kunlun Shan, Karakoram, Hindu Kush and Pamir, Remote Sens. Environ., 311, 114298, https://doi.org/10.1016/j.rse.2024.114298, 2024.
Li, X., Long, D., Huang, Q., and Zhao, F.: The state and fate of lake ice thickness in the Northern Hemisphere, Sci. Bull., 537–546, https://doi.org/10.1016/j.scib.2021.10.015, 2021.
Li, X., Long, D., Cui, Y., Liu, T., Lu, J., Hamouda, M. A., and Mohamed, M. M.: Ice thickness and water level estimation for ice-covered lakes with satellite altimetry waveforms and backscattering coefficients, The Cryosphere, 17, 349–369, https://doi.org/10.5194/tc-17-349-2023, 2023.
Liang, X., Lin, Y., and Zhang, H.: Mapping Urban Impervious Surface With an Unsupervised Approach Using Interferometric Coherence of SAR Images, IEEE J. Sel. Top. Appl., 15, 2734–2744, https://doi.org/10.1109/JSTARS.2022.3149813, 2022.
Lin, M., Jin, M., Li, J. Z., and Bai, Y. Q.: GEOSatDB: global civil earth observation satellite semantic database, Big Earth Data, 8, 522–539, https://doi.org/10.1080/20964471.2024.2331992, 2024.
Lin, R. S., Mei, G., and Xu, N. X.: Accurate and automatic mapping of complex debris-covered glacier from remote sensing imagery using deep convolutional networks, Geol. J., 58, 2254–2267, https://doi.org/10.1002/gj.4615, 2023.
Lovell, H. and Muhammad, S.: Multiple phases of ice-dammed lake formation and drainage associated with a surge of Shisper Glacier, western Karakoram, J. Glaciol., 71, e10, https://doi.org/10.1017/jog.2024.80, 2024.
Mannerfelt, E. S., Schellenberger, T., and Kääb, A. M.: Tracking glacier surge evolution using interferometric SAR coherence – examples from Svalbard, J. Glaciol., 71, e43, https://doi.org/10.1017/jog.2025.27, 2025.
Matsuo, M.: A Verification of the Fore-shortening and Layover Phenomena in SAR Imagery, Journal of the Remote Sensing Society of Japan, 13, 249–255, https://doi.org/10.11440/rssj1981.13.249, 1993.
Meier, M. F. and Post, A.: What Are Glacier Surges, Can. J. Earth Sci., 6, 807–817, https://doi.org/10.1139/e69-081, 1969.
Millan, R., Mouginot, J., Rabatel, A., and Morlighem, M.: Ice velocity and thickness of the world's glaciers, Nat. Geosci., 15, 124–129, https://doi.org/10.1038/s41561-021-00885-z, 2022.
Minora, U., Bocchiola, D., D'Agata, C., Maragno, D., Mayer, C., Lambrecht, A., Vuillermoz, E., Senese, A., Compostella, C., Smiraglia, C., and Diolaiuti, G. A.: Glacier area stability in the Central Karakoram National Park (Pakistan) in 2001–2010: The ”Karakoram Anomaly” in the spotlight, Prog. Phys. Geog., 40, 629–660, https://doi.org/10.1177/0309133316643926, 2016.
Muhammad, S., Li, J., Steiner, J. F., Shrestha, F., Shah, G. M., Berthier, E., Guo, L., Wu, L. X., and Tian, L. D.: A holistic view of Shisper Glacier surge and outburst floods: from physical processes to downstream impacts, Geomat. Nat. Haz. Risk, 12, 2755–2775, https://doi.org/10.1080/19475705.2021.1975833, 2021.
Muñoz-Sabater, J., Dutra, E., Agustí-Panareda, A., Albergel, C., Arduini, G., Balsamo, G., Boussetta, S., Choulga, M., Harrigan, S., Hersbach, H., Martens, B., Miralles, D. G., Piles, M., Rodríguez-Fernández, N. J., Zsoter, E., Buontempo, C., and Thépaut, J.-N.: ERA5-Land: a state-of-the-art global reanalysis dataset for land applications, Earth Syst. Sci. Data, 13, 4349–4383, https://doi.org/10.5194/essd-13-4349-2021, 2021.
Nanni, U., Scherler, D., Ayoub, F., Millan, R., Herman, F., and Avouac, J.-P.: Climatic control on seasonal variations in mountain glacier surface velocity, The Cryosphere, 17, 1567–1583, https://doi.org/10.5194/tc-17-1567-2023, 2023
NASA JPL: NASADEM Merged DEM Global 1 arc second V001, NASA EOSDIS Land Processes Distributed Active Archive Center [data set], https://doi.org/10.5067/MEaSUREs/NASADEM/NASADEM_HGT.001, 2020.
Nuth, C. and Kääb, A.: Co-registration and bias corrections of satellite elevation data sets for quantifying glacier thickness change, The Cryosphere, 5, 271–290, https://doi.org/10.5194/tc-5-271-2011, 2011.
Otsu, N.: A Threshold Selection Method from Gray-Level Histograms, IEEE T. Syst., Man Cyb., 9, 62–66, https://doi.org/10.1109/TSMC.1979.4310076, 1979.
Paul, F., Piermattei, L., Treichler, D., Gilbert, L., Girod, L., Kääb, A., Libert, L., Nagler, T., Strozzi, T., and Wuite, J.: Three different glacier surges at a spot: what satellites observe and what not, The Cryosphere, 16, 2505–2526, https://doi.org/10.5194/tc-16-2505-2022, 2022.
Paul, F., Bolch, T., Briggs, K., Kaab, A., McMillan, M., McNabb, R., Nagler, T., Nuth, C., Rastner, P., Strozzi, T., and Wuite, J.: Error sources and guidelines for quality assessment of glacier area, elevation change, and velocity products derived from satellite data in the Glaciers_cci project, Remote Sens. Environ., 203, 256–275, https://doi.org/10.1016/j.rse.2017.08.038, 2017.
Pearson, R. K., Neuvo, Y., Astola, J., and Gabbouj, M.: Generalized Hampel Filters, Eurasip J. Adv. Sig. Pr., 87, https://doi.org/10.1186/s13634-016-0383-6, 2016.
Pfeffer, W. T., Arendt, A. A., Bliss, A., Bolch, T., Cogley, J. G., Gardner, A. S., Hagen, J. O., Hock, R., Kaser, G., Kienholz, C., Miles, E. S., Moholdt, G., Molg, N., Paul, F., Radic, V., Rastner, P., Raup, B. H., Rich, J., Sharp, M. J., Andeassen, L. M., Bajracharya, S., Barrand, N. E., Beedle, M. J., Berthier, E., Bhambri, R., Brown, I., Burgess, D. O., Burgess, E. W., Cawkwell, F., Chinn, T., Copland, L., Cullen, N. J., Davies, B., De Angelis, H., Fountain, A. G., Frey, H., Giffen, B. A., Glasser, N. F., Gurney, S. D., Hagg, W., Hall, D. K., Haritashya, U. K., Hartmann, G., Herreid, S., Howat, I., Jiskoot, H., Khromova, T. E., Klein, A., Kohler, J., Konig, M., Kriegel, D., Kutuzov, S., Lavrentiev, I., Le Bris, R., Li, X., Manley, W. F., Mayer, C., Menounos, B., Mercer, A., Mool, P., Negrete, A., Nosenko, G., Nuth, C., Osmonov, A., Pettersson, R., Racoviteanu, A., Ranzi, R., Sarikaya, M. A., Schneider, C., Sigurdsson, O., Sirguey, P., Stokes, C. R., Wheate, R., Wolken, G. J., Wu, L. Z., Wyatt, F. R., and Consortium, R.: The Randolph Glacier Inventory: a globally complete inventory of glaciers, J. Glaciol., 60, 537–552, https://doi.org/10.3189/2014JoG13J176, 2014.
Quincey, D. J., Glasser, N. F., Cook, S. J., and Luckman, A.: Heterogeneity in Karakoram glacier surges, J. Geophys. Res.-Earth, 120, 1288–1300, https://doi.org/10.1002/2015jf003515, 2015.
Ray, R., Zelensky, N., Lemoine, F., Brown, S., Desai, S., and Mitchum, G.: Integrated Multi-Mission Ocean Altimeter Data for Climate Research TOPEX/Poseidon, Jason-1, 2, & 3 User's Handbook Version 5.2, https://doi.org/10.5067/ALTTS-TJA52, 2024.
Raymond, C. F.: How do glaciers surge? A review, J. Geophys. Res.-Sol. Ea., 92, 9121–9134, https://doi.org/10.1029/JB092iB09p09121, 1987.
Round, V., Leinss, S., Huss, M., Haemmig, C., and Hajnsek, I.: Surge dynamics and lake outbursts of Kyagar Glacier, Karakoram, The Cryosphere, 11, 723–739, https://doi.org/10.5194/tc-11-723-2017, 2017.
Schröder, L., Horwath, M., Dietrich, R., Helm, V., van den Broeke, M. R., and Ligtenberg, S. R. M.: Four decades of Antarctic surface elevation changes from multi-mission satellite altimetry, The Cryosphere, 13, 427–449, https://doi.org/10.5194/tc-13-427-2019, 2019.
Seneviratne, S. I., Zhang, X., Adnan, M., Badi, W., Dereczynski, C., Di Luca, A., Ghosh, S., Iskandar, I., Kossin, J., Lewis, S., Otto, F., Pinto, I., Satoh, M., Vicente-Serrano, S. M., Wehner, M., and Zhou, B.: Weather and Climate Extreme Events in a Changing Climate, in: Climate Change 2021 – The Physical Science Basis: Working Group I Contribution to the Sixth Assessment Report of the Intergovernmental Panel on Climate Change, edited by: Masson-Delmotte, V., Zhai, P., Pirani, A., Connors, S. L., Péan, C., Berger, S., Caud, N., Chen, Y., Goldfarb, L., Gomis, M. I., Huang, M., Leitzell, K., Lonnoy, E., Matthews, J. B. R., Maycock, T. K., Waterfield, T., Yelekçi, O., Yu, R., and Zhou, B., Cambridge University Press, Cambridge, United Kingdom and New York, NY, USA, 1513–1766, https://doi.org/10.1017/9781009157896.013, 2021.
Sharp, M.: Surging Glaciers – Behavior and Mechanisms, Prog. Phys. Geogr., 12, 349–370, https://doi.org/10.1177/030913338801200302, 1988.
Shi, Y. L., Liu, G. X., Wang, X. W., Liu, Q., Zhang, R., and Jia, H. G.: Assessing the Glacier Boundaries in the Qinghai-Tibetan Plateau of China by Multi-Temporal Coherence Estimation with Sentinel-1A InSAR, Remote Sens., 11, 392, https://doi.org/10.3390/rs11040392, 2019.
Smith, B., Adusumilli, S., Csathó, B. M., Felikson, D., Fricker, H. A., Gardner, A., Holschuh, N., Lee, J., Nilsson, J., Paolo, F. S., Siegfried,M. R., Sutterley, T., and the ICESat-2 Science Team: ATLAS/ICESat-2 L3A Land Ice Height, Version 6, Boulder, Colorado USA, NASA National Snow and Ice Data Center Distributed Active Archive Center [data set], https://doi.org/10.5067/ATLAS/ATL06.006, 2023.
Surazakov, A. and Aizen, V.: Positional Accuracy Evaluation of Declassified Hexagon KH-9 Mapping Camera Imagery, Photogramm. Eng. Rem. S., 76, 603–608, https://doi.org/10.14358/Pers.76.5.603, 2010.
Tao, D. L., Cheng, Y. S., Hwang, C., Sun, W. K., and Lee, H.: The Rise and Fall of Alaska and Yukon Glaciers Detected by TOPEX/Poseidon and Jason-2 Altimeters Using a Novel Glacier-Threshold Method, J. Geophys. Res.-Earth, 128, e2022JF006977, https://doi.org/10.1029/2022JF006977, 2023.
Troilo, F., Dematteis, N., Zucca, F., Funk, M., and Giordan, D.: Monthly velocity and seasonal variations of the Mont Blanc glaciers derived from Sentinel-2 between 2016 and 2024, The Cryosphere, 18, 3891–3909, https://doi.org/10.5194/tc-18-3891-2024, 2024.
Truffer, M., Kääb, A., Harrison, W. D., Osipova, G. B., Nosenko, G. A., Espizua, L., Gilbert, A., Fischer, L., Huggel, C., Craw Burns, P. A., and Lai, A. W.: Chapter 13 – Glacier surges, in: Snow and Ice-Related Hazards, Risks, and Disasters (Second Edition), edited by: Haeberli, W. and Whiteman, C., Elsevier, 417–466, https://doi.org/10.1016/B978-0-12-817129-5.00003-2, 2021.
Tsai, V. C., Smith, L. C., Gardner, A. S., and Seroussi, H.: A unified model for transient subglacial water pressure and basal sliding, J. Glaciol., 68, 390–400, https://doi.org/10.1017/jog.2021.103, 2022.
Vale, A. B., Arnold, N. S., Rees, W. G., and Lea, J. M.: Remote Detection of Surge-Related Glacier Terminus Change across High Mountain Asia, Remote Sens., 13, 1309, https://doi.org/10.3390/rs13071309, 2021.
Wang, H., Wang, B.-B., Cui, P., Ma, Y.-M., Wang, Y., Hao, J.-S., Wang, Y., Li, Y.-M., Sun, L.-J., Wang, J., Zhang, G.-T., Li, W.-M., Lei, Y., Zhao, W.-Q., Tang, J.-B., and Li, C.-Y.: Disaster effects of climate change in High Mountain Asia: State of art and scientific challenges, Advances in Climate Change Research, 15, 367–389, https://doi.org/10.1016/j.accre.2024.06.003, 2024.
Wingham, D. J., Rapley, C. G., and Griffiths, H.: New techniques in satellite altimeter tracking systems, Digest – International Geoscience and Remote Sensing Symposium (IGARSS), Zurich, 1339–1344, https://www.researchgate.net/publication/269518510_New_Techniques_in_Satellite_Altimeter_Tracking_Systems (last access: 9 August 2025), 1986.
Wu, J. H., Li, J., Guo, L., Li, L., Li, Z. Q., Zhong, W. J., Feng, J. J., and Kong, L. S.: Remote sensing monitoring and surge mechanisms analysis of the Amney Machen mountain Glaciers, Chinese J. Geophys.-Ch., 68, 1695–1710, https://doi.org/10.6038/cjg2024S0211, 2025.
Wu, K., Liu, S., Jiang, Z., Xu, J., Wei, J., and Guo, W.: Recent glacier mass balance and area changes in the Kangri Karpo Mountains from DEMs and glacier inventories, The Cryosphere, 12, 103–121, https://doi.org/10.5194/tc-12-103-2018, 2018.
Wu, K. P., Liu, S. Y., Jiang, Z. L., Liu, Q., Zhu, Y., Yi, Y., Xie, F. M., Tahir, A. A., and Saifullah, M.: Quantification of glacier mass budgets in the Karakoram region of Upper Indus Basin during the early twenty-first century, J. Hydrol., 603, 127095, https://doi.org/10.1016/j.jhydrol.2021.127095, 2021.
Wu, K. P., Liu, S. Y., Jiang, Z. L., Zhu, Y., Xie, F. M., Gao, Y. P., Yi, Y., Tahir, A. A., and Muhammad, S.: Surging Dynamics of Glaciers in the Hunza Valley under an Equilibrium Mass State since 1990, Remote Sens., 12, 2922, https://doi.org/10.3390/rs12182922, 2020.
Wu, W., Guo, S., Shao, Z., and Li, D.: Urban Impervious Surface Extraction Based on Deep Convolutional Networks Using Intensity, Polarimetric Scattering and Interferometric Coherence Information from Sentinel-1 SAR Images, Remote Sens., https://doi.org/10.3390/rs15051431, 2023.
Wytiahlowsky, H., Stokes, C. R., and Evans, D. J. A.: Remote sensing of glacier change (1965-2021) and identification of surge-type glaciers on Severnaya Zemlya, Russian High Arctic, J. Glaciol., 69, 1764–1784, https://doi.org/10.1017/jog.2023.60, 2023.
Xie, F., Liu, S., Gao, Y., Zhu, Y., Bolch, T., Kääb, A., Duan, S., Miao, W., Kang, J., Zhang, Y., Pan, X., Qin, C., Wu, K., Qi, M., Zhang, X., Yi, Y., Han, F., Yao, X., Liu, Q., Wang, X., Jiang, Z., Shangguan, D., Zhang, Y., Grünwald, R., Adnan, M., Karki, J., and Saifullah, M.: Interdecadal glacier inventories in the Karakoram since the 1990s, Earth Syst. Sci. Data, 15, 847–867, https://doi.org/10.5194/essd-15-847-2023, 2023.
Xu, H. D., Li, J., Wu, L. X., Guo, L., Gu, Y. Y., and Zhong, W. J.: Monitoring the glaciers with remote sensing techniques to investigate the triggering mechanism of debris flow in Tianmo gully, Tibet, Chinese J. Geophys-Ch., 66, 2370–2385, https://doi.org/10.6038/cjg2022Q0370, 2023.
Yang, J. R., Jiang, Z. L., Liu, S. Y., Wang, X., Zhang, Y., Zhang, Z., and F., W. J.: Characteristics of recent surging of Kunchhang Glacier, East Karakoram, Journal of Glaciology and Geocryology, 43, 1732–1745, 2021.
Yao, X., Iqbal, J., Li, L. J., and Zhou, Z. K.: Characteristics of mountain glacier surge hazard: learning from a surge event in NE Pamir, China, J. Mt. Sci.-Engl., 16, 1515–1533, https://doi.org/10.1007/s11629-018-5282-x, 2019.
Yao, X. J., Zhou, S. G., Sun, M. P., Duan, H. Y., and Zhang, Y.: Surging Glaciers in High Mountain Asia between 1986 and 2021, Remote Sens., 15, 4595, https://doi.org/10.3390/rs15184595, 2023.
Ye, Q. H., Wang, Y. Z., Liu, L., Guo, L. N., Zhang, X. Q., Dai, L. Y., Zhai, L. M., Hu, Y. F., Ali, N., Ji, X. H., Ran, Y. H., Qiu, Y. B., Shi, L. J., Che, T., Wang, N. L., Li, X., and Zhu, L. P.: Remote Sensing and Modeling of the Cryosphere in High Mountain Asia: A Multidisciplinary Review, Remote Sens., 16, 1709, https://doi.org/10.3390/rs16101709, 2024.
Yu, Z. G., Zhang, G. H., Zhang, C. X., Zhang, Z. P., and Wang, Q. B.: PySide-based Time-Series InSAR processing visualization and experimental application for deformation monitoring, Engineering of Surveying and Mapping, 33, 41–48, https://doi.org/10.19349/j.cnki.issn1006-7949.2024.06.006, 2024.
Zhang, G., Carrivick, J. L., Emmer, A., Shugar, D. H., Veh, G., Wang, X., Labedz, C., Mergili, M., Mölg, N., Huss, M., Allen, S., Sugiyama, S., and Lützow, N.: Characteristics and changes of glacial lakes and outburst floods, Nature Reviews Earth & Environment, 5, 447–462, https://doi.org/10.1038/s43017-024-00554-w, 2024a.
Zhang, Z. J., Ahmad, Z., Xiong, S. Q., and Zhang, W. C.: Glacier velocity and surge detection in the Karakoram region, Pakistan: using remotely sensed data with cross-correlation feature tracking, Int. J. Digit Earth, 17, 2441928, https://doi.org/10.1080/17538947.2024.2441928, 2024b.
Zhao, F. Y., Long, D., Li, X. D., Huang, Q., and Han, P. F.: Rapid glacier mass loss in the Southeastern Tibetan Plateau since the year 2000 from satellite observations, Remote Sens. Environ., 270, 112853, https://doi.org/10.1016/j.rse.2021.112853, 2022.
Zhao, F., Long, D., Fang, C., and Wang, Y.: Data for the paper “Satellite-observed surging dynamics of North Kunchhang Glacier I in the Eastern Karakoram”, Zenodo [data set], https://doi.org/10.5281/zenodo.19437339, 2026.
Zhou, Y. S., Li, Z., and Li, J.: Slight glacier mass loss in the Karakoram region during the 1970s to 2000 revealed by KH-9 images and SRTM DEM, J. Glaciol., 63, 331–342, https://doi.org/10.1017/jog.2016.142, 2017.
Zhu, X. Y., Tang, X. M., Zhang, G., Liu, B., and Hu, W. M.: Accuracy Comparison and Assessment of DSM Derived from GFDM Satellite and GF-7 Satellite Imagery, Remote Sens., 13, 4791, https://doi.org/10.3390/rs13234791, 2021.