the Creative Commons Attribution 4.0 License.
the Creative Commons Attribution 4.0 License.
 | 16 Apr 2026
Seasonal characteristics and trends in precipitation partitioning in the Arctic
Zaria Ireon Cast
Mark C. Serreze
Elizabeth N. Cassano
Andrew P. Barrett
Driven by growing impacts of changing precipitation amounts and phase on the Arctic's natural and built environment, we examine seasonal patterns and trends in Arctic precipitation and partitioning between its liquid and solid forms. Use is made of data from ERA5 reanalysis, Automated Surface Observing System stations over land, and a climatology based on present weather reports over the Arctic Ocean. In the Atlantic sector of the Arctic, most precipitation falls in liquid form in all seasons in its southern limits, but snowfall is high over its northern parts. Precipitation over the dry central Arctic Ocean and terrestrial polar deserts almost always falls as snow. Even during the summer, typically 50 % of precipitation over the central Arctic Ocean falls as snow. Over land, nearly all summer precipitation falls in liquid form, except in the Canadian Arctic Archipelago where summer snowfall is still common. Annual precipitation has increased since 1979, primarily in the Barents Sea sector, accompanied by generally downward trends in snowfall and, hence, upward trends in liquid precipitation. Across much of the Arctic, the liquid to total precipitation ratio has increased only in summer and autumn, while in the Atlantic sector, the liquid to total precipitation ratio has increased in fall and winter.
- Article
(21037 KB) - Full-text XML
- BibTeX
- EndNote


Arctic surface air temperatures are increasing more rapidly than for the globe as a whole (Rantanen et al., 2022). This Arctic Amplification of warming is associated with changing precipitation patterns. Historically, most of the annual precipitation in the Arctic (apart from the warm Atlantic sector) has fallen as snow. However, as the Arctic warms, one expects both an increase in total precipitation (due to more atmospheric water vapor and a stronger poleward moisture flux convergence), a shift towards more rainfall, and larger precipitation events (e.g., Dou et al., 2022; McCrystall et al., 2021). Indeed, annual precipitation for the Arctic viewed as a whole now appears to have a detectable upward trend (Moon et al., 2024).
This paper focuses on the seasonal and spatial variability of Arctic precipitation, its phase (liquid versus snowfall) and how precipitation totals and phase are changing. It makes primary use of ERA5 variables of total precipitation, snowfall, and liquid precipitation (calculated as total precipitation minus snowfall) over the period 1979–2023. Additional data sources, used primarily for validation of ERA5, include Automated Surface Observing System (ASOS) reports of precipitation phase over land, an early climatological analysis of precipitation phase on the Arctic Ocean from present weather reports (Clark et al., 1996; Serreze et al., 1996) and published studies of ERA5 precipitation. This paper represents a contribution to the Arctic Rain on Snow (AROSS) study, part of the National Science Foundation Navigating the New Arctic (NNA) Initiative. AROSS focuses on understanding impacts of rain on snow (ROS) and extreme precipitation events on the Arctic natural and built environment, with a special focus on reindeer herding practices (Serreze et al., 2021). A consequence of ROS events is that rainfall, when followed by a temperature drop, can result in the formation of hard, icy crusts. Impacts can be immediate (such as on travel), evolving or cumulative. There have been recorded events of starvation-induced die-offs of tens of thousands of reindeer, caribou, and musk oxen. Voveris and Serreze (2023) describe the meteorology behind some of these ROS events and point out that even a small precipitation event can have large consequences. Thus, a greater understanding of how Arctic precipitation is changing will inform how these events may also be changing, by either a reduction in snowpack or increasing rain events.
The present study addresses the following question: What are the present-day seasonal and spatial patterns of precipitation and partitioning (liquid versus snowfall) across the Arctic, and how have these patterns changed over the study period in response to the warming Arctic climate?
2.1 ERA5 Reanalysis
Atmospheric reanalyses are widely used in the research community (Zhao et al., 2010). The European Centre for Medium-Range Weather Forecast (ECMWF) Reanalysis version 5 (ERA5) (Hersbach et al., 2020) employs four-dimensional variational data assimilation (4D-Var) (Rabier, 2005). Observations assimilated into the ERA5 system include surface data, radiosonde profiles, ship-based measurements, aircraft reports and satellite data. Precipitation is generally not assimilated. While ERA5 extends back to 1950, we use data from 1979 to 2023. The availability of satellite observations from 1979 onward significantly improves estimates of precipitation and atmospheric conditions in the Arctic (Xiong et al., 2022). As with any reanalysis, one must be aware that the assimilation database has changed over time (Hersbach et al., 2020) which can introduce biases, especially in earlier records with fewer observational constraints (Simmons et al., 2021).
We use monthly data at 31 km horizontal resolution of total precipitation, snowfall and turbulent latent heat fluxes. Total precipitation represents the accumulation of all forms of precipitation. Liquid precipitation is obtained by subtracting snowfall from total precipitation. Along with rainfall, this may also include sleet and freezing rain. After a forecast is generated, ERA5 applies a post-processing step to adjust precipitation fields based on available surface observations. However, these observations are not incorporated into the model during the assimilation phase. As a result, ERA5 precipitation estimates are primarily influenced by the model's internal physics and parameterizations (Hersbach et al., 2020). Accuracy of precipitation fields in ERA5 hence depends largely on the model's ability to simulate precipitation processes effectively (Bromwich et al., 2016). The determination of precipitation phase in ERA5 is based on a combination of near-surface air temperature, atmospheric moisture, and model-based calculations within the forecast system. Wet bulb temperature is a key factor in the determination. In some cases, mixed-phase precipitation may occur within a small temperature range with temperatures just above freezing (Hersbach et al., 2020; Xiong et al., 2022).
While ERA5 is known to have a warm bias over sea ice, ERA5 is considered one of the most reliable reanalysis datasets for Arctic precipitation (Graham et al., 2019) and performs well in capturing precipitation phase (Xiong et al., 2022). Loeb et al. (2022) concludes that ERA5 effectively captures the spatial distribution and frequency of precipitation events in the eastern Canadian Arctic and Greenland. Serreze et al. (2022) show that ERA5 successfully represents broad precipitation trends and seasonal variations over the Canadian Arctic. Barrett et al. (2020) compared precipitation estimates from six atmospheric reanalyses (NASA MERRA, NASA MERRA2, NOAA CFSR/CFSv2, ECMWF ERA-Interim, ECMWF ERA5, and JMAO JRA55) against records from the Russian North Pole series of drifting camps over the central Arctic Ocean. They find that the time series of annual precipitation over the central Arctic Ocean correlates well between all reanalyses, and that all of the reanalyses capture the basic spatial and seasonal patterns of Arctic precipitation. All reanalyses are prone to a problem of spurious drizzle over the Arctic Ocean, with daily amounts less than 1 mm d−1. However, Barrett et al. (2020), show (from comparisons with data from the North Pole drifting stations) that a 1 mm cutoff used in many past studies misses a significant amount of precipitation. As part of the present study, we compare ERA5 depictions of precipitation partitioning against the ASOS database and an Arctic Ocean climatology described in more detail below.
2.2 ASOS Database
As part of the AROSS project, a database of Arctic precipitation phase was compiled using reports from stations in the Automated Surface Observing System (ASOS) networks of the United States, Canada, Greenland, Iceland, Norway, Sweden, Finland and Russia. The database has records from 244 stations. Records used here span the period 1979 to 2023.
Precipitation type codes in reports are used to identify rain, freezing rain and solid precipitation. These codes are based on automated precipitation type sensors. Manual observations may be used to override automated reports when human observers are on station and when precipitation type reports are deemed erroneous. Reports were quality controlled to ensure logical consistency between near-surface air and dew point temperatures and reported precipitation type. For example, records with freezing or solid rain reports but with air temperature of 20 °C or higher were discarded. At the finest temporal resolution reported (minutes to 1 h), rain events were reported 765 610 times. Freezing rain was reported 18 174 times. For the present study, data were resampled to an hourly frequency. If a given precipitation type was reported during 1 h reporting period, that hour was assigned the precipitation type. Hours could be assigned multiple precipitation types if different precipitation types occurred within that hour. For example, if precipitation type transitioned from rain, to freezing rain, to snow in 1 h, that hour would be assigned rain, freezing rain and solid precipitation. Figure 1 shows the number of complete years of data for the period 1979 to 2023 for ASOS sites in the database. A difficulty with using the ASOS record is that stations only report precipitation type if there is a precipitation event. We use 2 m air temperature to screen for months with less than 90 % of days reporting to identify when stations are off-line. Months that do not meet this criterion are set to missing. We then count the number of precipitation events of all precipitation types in each month that pass the screening. A year is considered to have a complete record if there is at least 1 h in each of the twelve months. The reason for this low threshold is that it is not unreasonable that a month can have just 1 d with precipitation, where the rain event lasts only 1 h. A heatmap of the number of hours with liquid precipitation in each month for the 1979 to 2023 period organized by country is shown in Fig. 2.
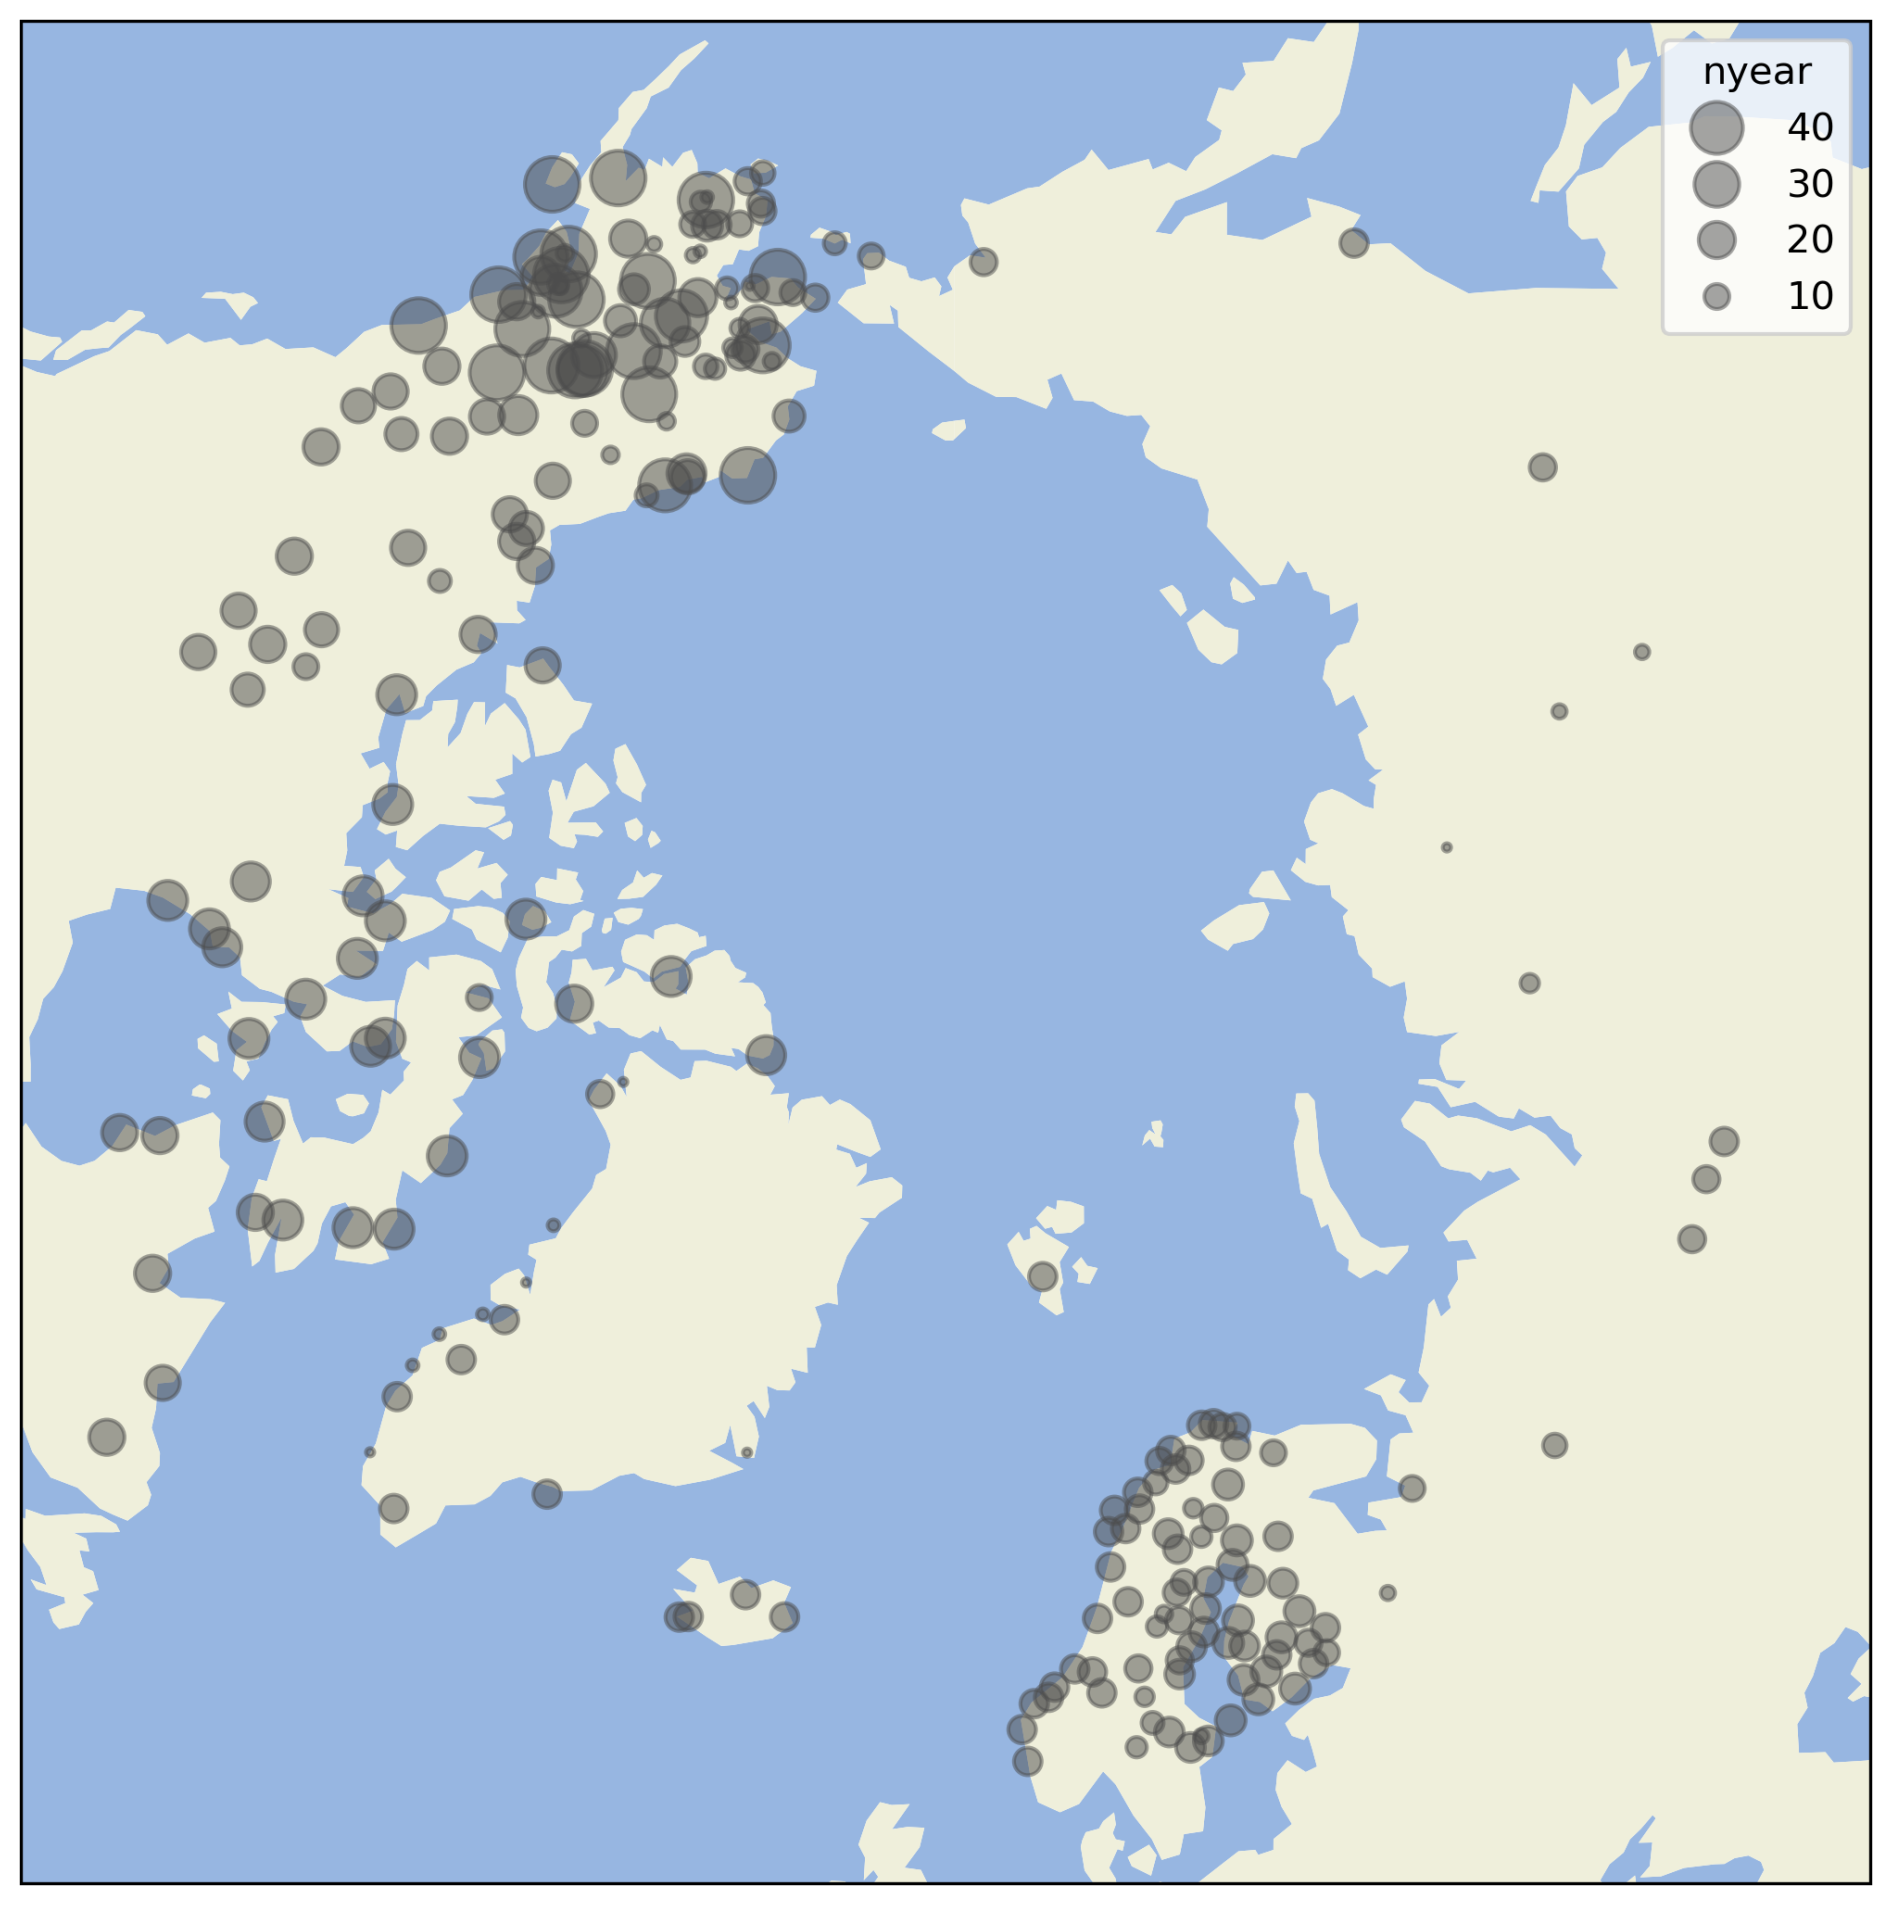
Figure 1Number of complete years with data shown as proportional circles for ASOS stations. A complete year is defined as having at least one precipitation event of any phase reported in all twelve months.
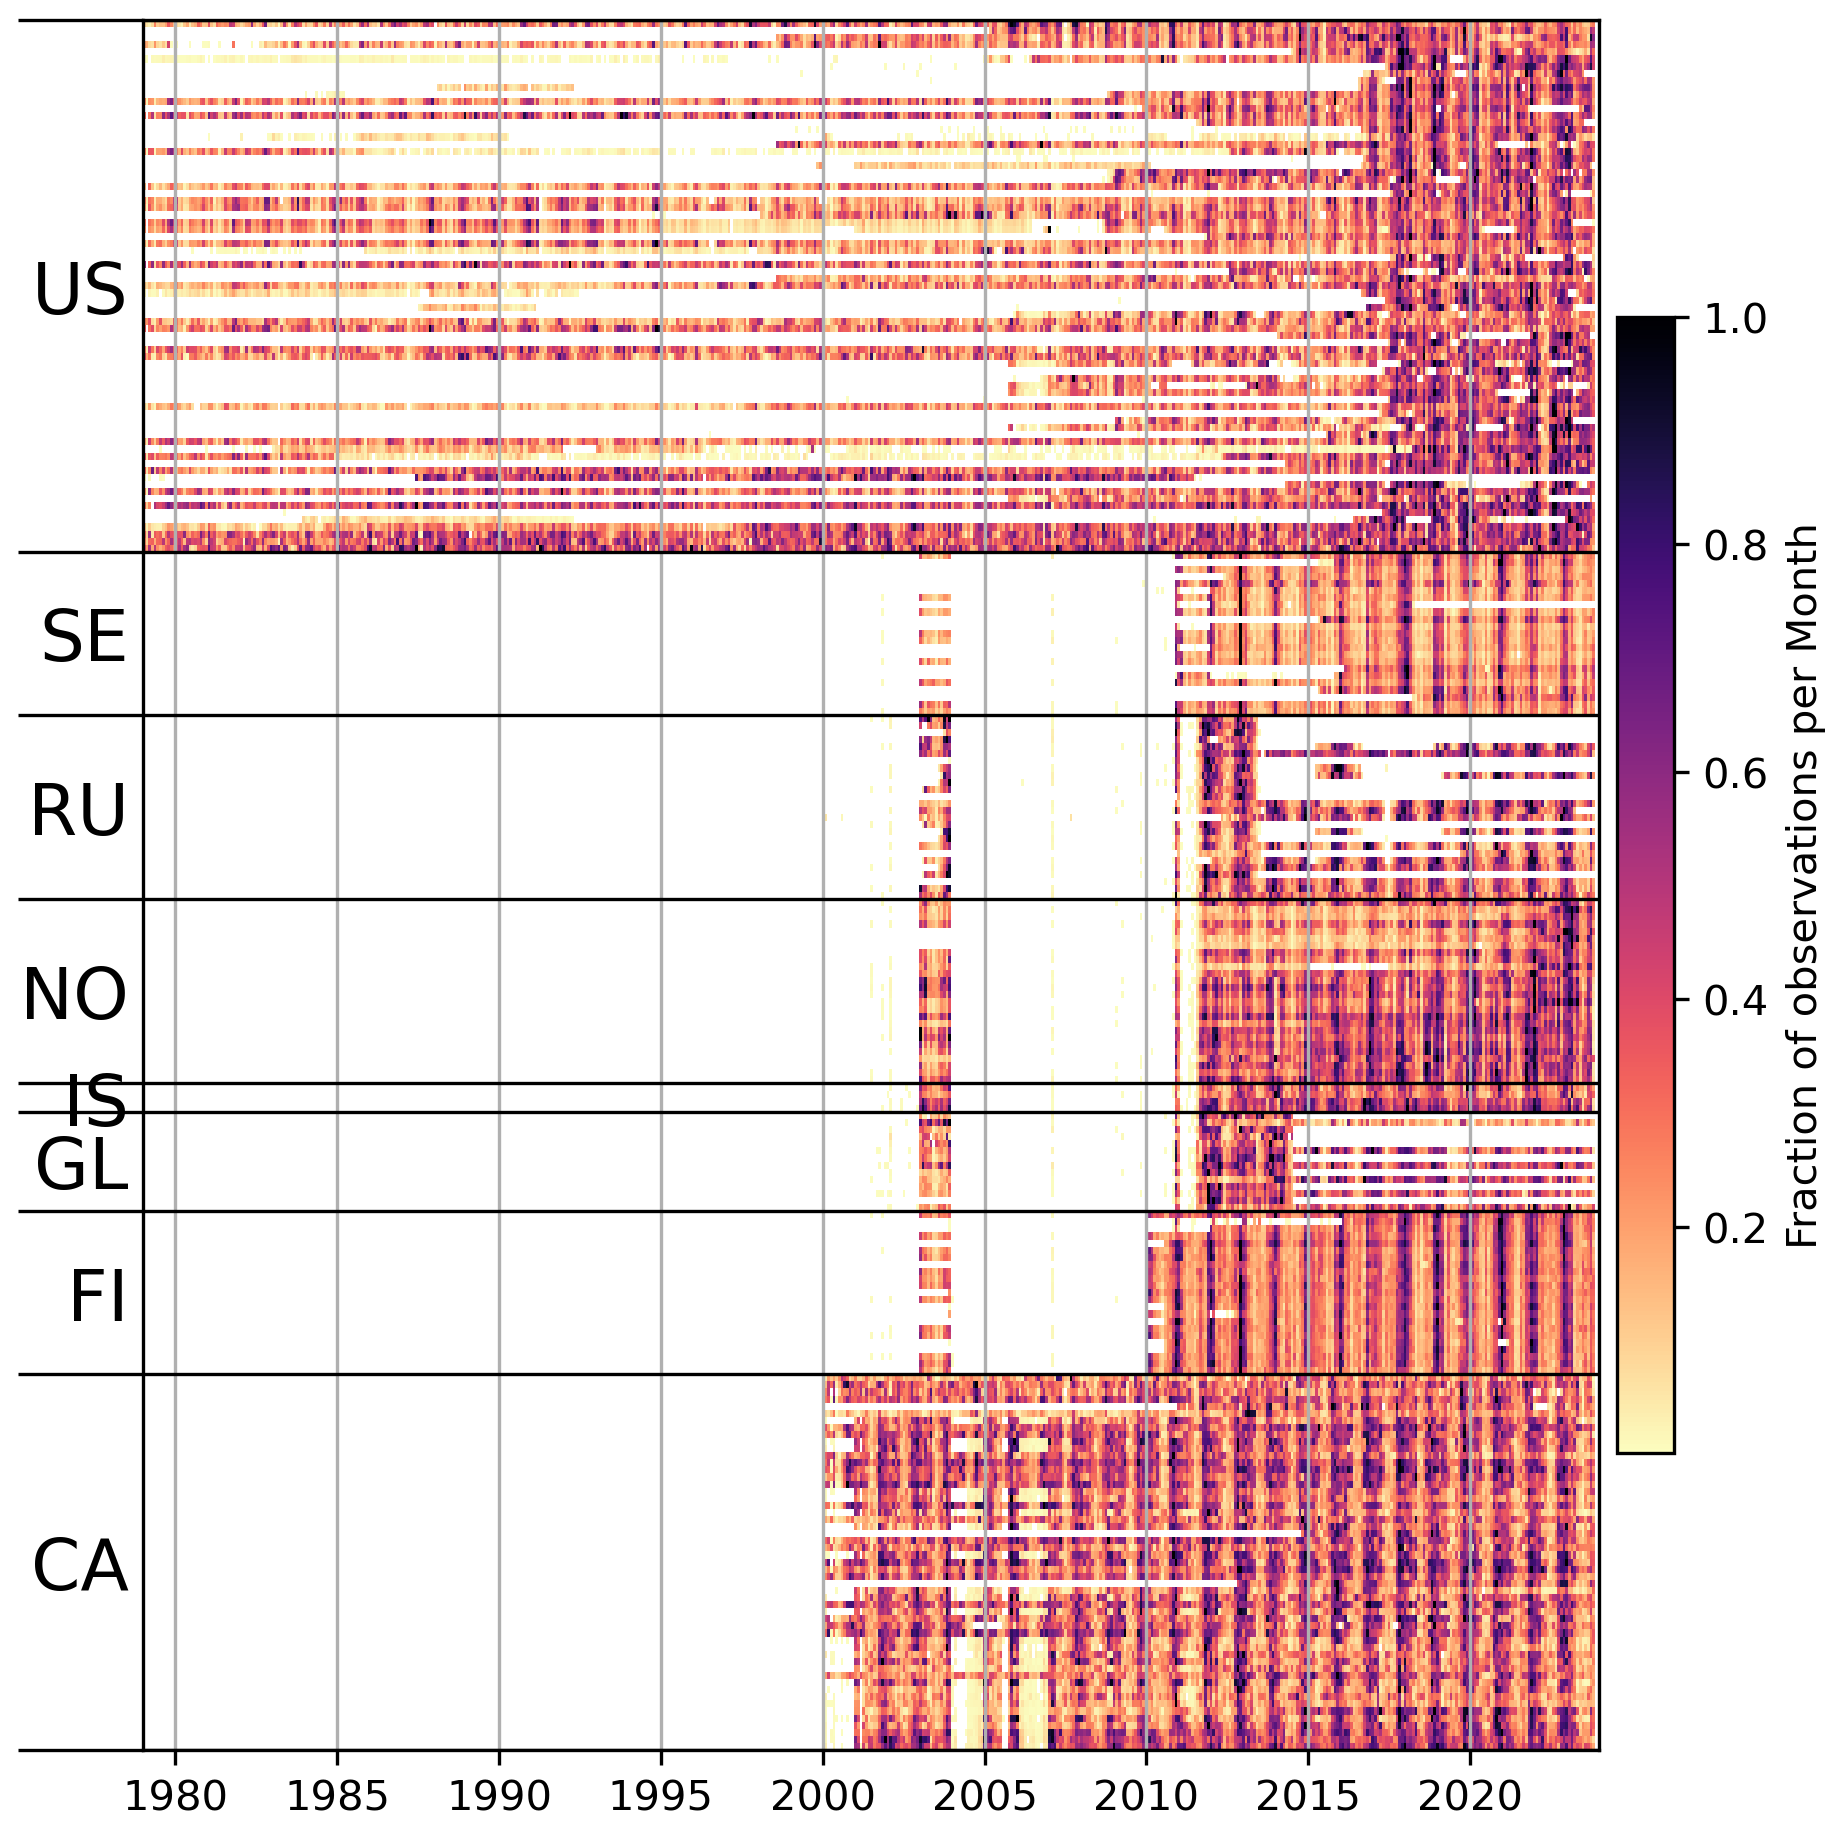
Figure 2Heatmap of liquid precipitation events by month for the 1979 to 2023 from the ASOS database. Colors represent the hours in each month in the 1979 to 2023 period that a station reported liquid precipitation. Reports are organized vertically by country and latitude. Country codes are US United States, SE Sweden, RU Russia, NO Norway, IS Iceland, GL Greenland, FI Finland, CA Canada. Latitude is in ascending order for each country grouping.
2.3 ICOADS Study
Direct measurements of precipitation are particularly sparse over the Arctic Ocean. However, Serreze et al. (1996), as part of a NSIDC Special Report, provide figures for each month of precipitation phase and intensity over the Arctic Ocean based on present weather codes included within the Integrated Comprehensive Ocean-Atmosphere Data Set (ICOADS). Clark et al. (1996) use these data in a study of Arctic Ocean climate characteristics. Over the central Arctic Ocean, most of the observations are from the Russian North Pole series of camps. These camps were deployed on ice floes or tabular icebergs to gather oceanographic and meteorological data. The record examined spans the period of 1950–1995. For the NSIDC special report and Serreze and Barry (2014), observations were interpolated into a coarse grid array covering the Arctic Ocean for January and July. Precipitation frequency is the percent of all reports for which any precipitation was observed. Frequency is also given for reports of “medium” and “heavy” precipitation, the designation being up to the observer and hence somewhat subjective. Phase is based on the percentage of all ICOADS reports for which liquid or solid precipitation was observed. While these data are from an old study and the climate has changed since then, they still provide valuable information on precipitation characteristics that, along with the ASOS database, can be compared to ERA5. Because of past inattention to data preservation we do not have the digital records – only the figures.
3.1 Annual
We look first at long-term (1979–2023) mean annual totals of total precipitation, snowfall, liquid precipitation and the liquid/total precipitation ratio from ERA5 (Fig. 3). As is well known, total precipitation is highest in the North Atlantic sector, particularly in the Greenland, Norwegian and Barents Seas (top left panel). This reflects the frequent passage of extratropical cyclones and within-region cyclogenesis associated with the North Atlantic cyclone track (e.g., Serreze et al., 1993). As discussed shortly, cold-season evaporation rates are also very high in this region. Locally, orographic uplift, such as what occurs along the southeast coast of Greenland, enhances precipitation (Serreze et al., 1997; Tsukernik et al., 2007). Precipitation is much lower over the central Arctic Ocean and Canadian Arctic Archipelago, the latter region classified as polar desert (Serreze and Barry, 2014). Note the especially low precipitation over the high elevation Greenland Ice Sheet.
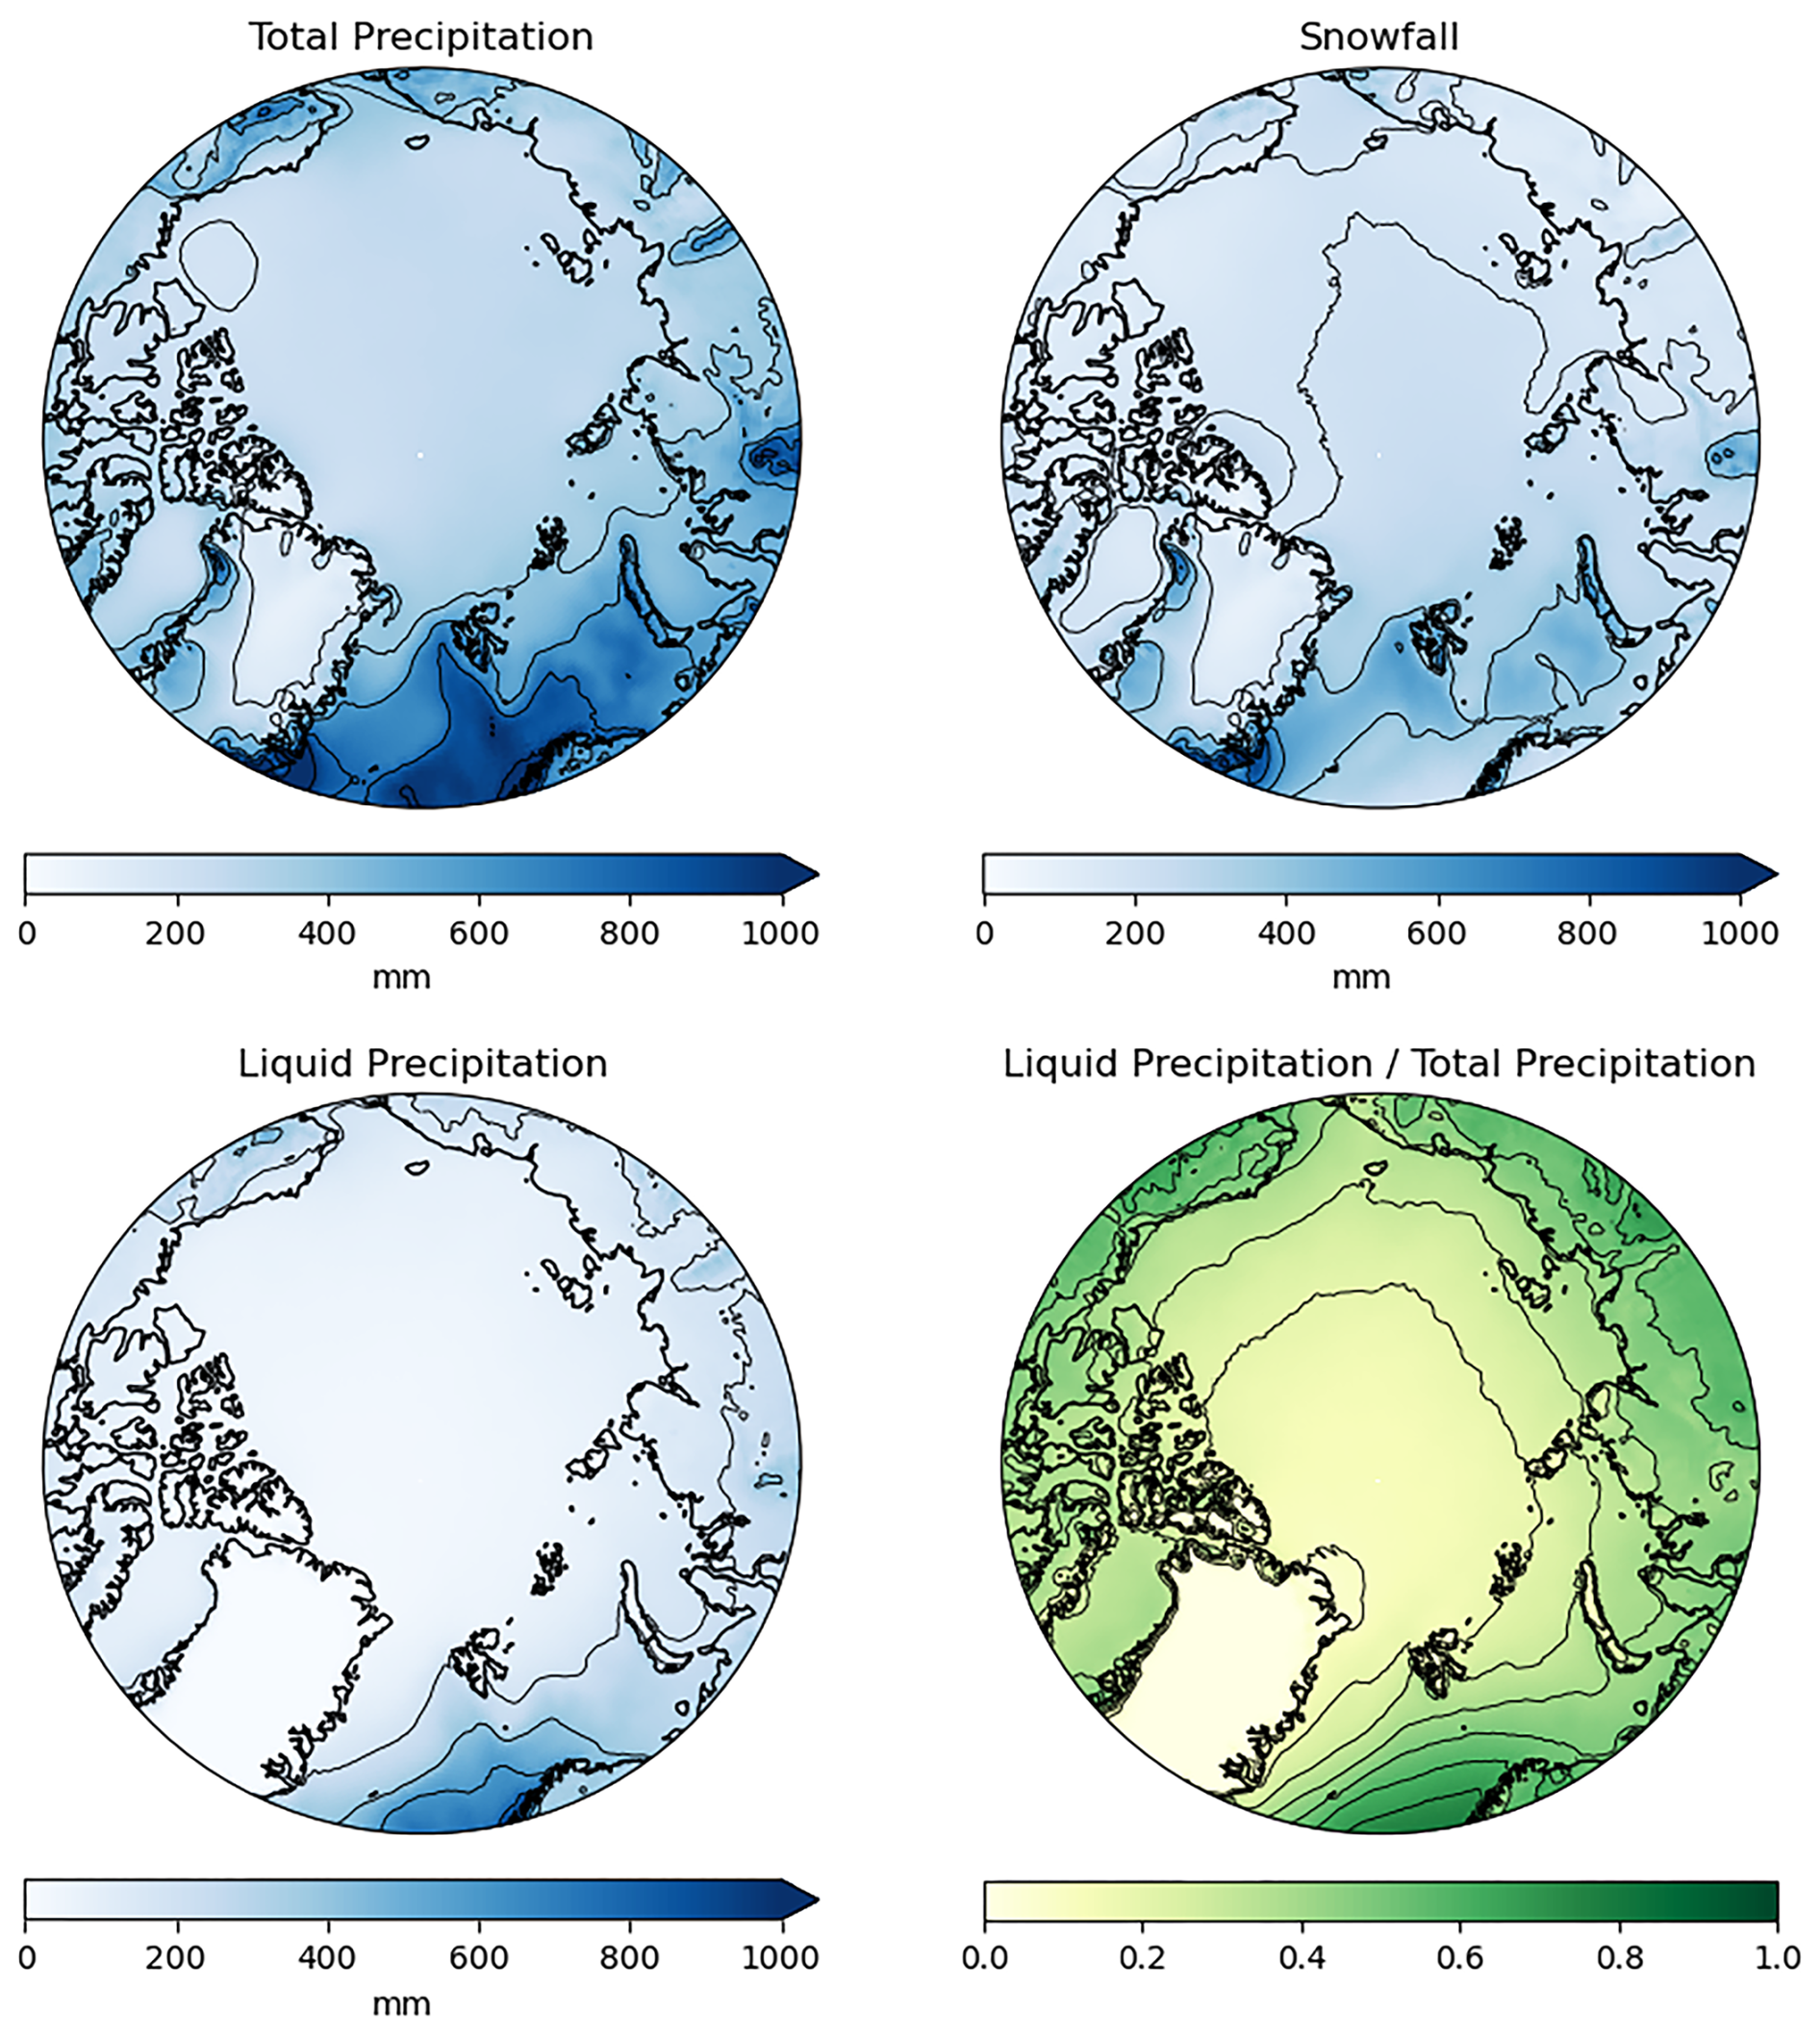
Figure 3Spatial distribution of average annual totals (1973–2023) of total precipitation, snowfall, liquid precipitation and the liquid/total precipitation ratio from ERA5. Black contours are drawn on the figures for ease of viewing and occur every 200 mm for the total precipitation, snowfall, and liquid precipitation and every 0.1 for the liquid/total precipitation plot in the lower right panel.
Snowfall is low over the central Arctic Ocean and polar desert regions (Fig. 3, upper right panel). Snowfall is in turn greatest in the northern North Atlantic sector where total precipitation is high. While the Atlantic sector is the warmest part of the Arctic, reflecting the lack of a sea ice cover and the influence of the warm North Atlantic Drift current, temperatures over its northern portion are still generally cold enough in the lower troposphere (according to ERA5) for most precipitation to fall as snow. There is much less snowfall in the southern part of this sector, reflecting, of course, a higher incidence of liquid precipitation off the coast of northern Norway.
It follows that the highest liquid to total precipitation ratios are in the North Atlantic sector (Fig. 3, lower right panel). By contrast, the central Arctic Ocean and the Greenland Ice Sheet have the lowest liquid to total precipitation ratios. Over most of the central Arctic Ocean, 20 %–25 % of annual precipitation falls as rain (Fig. 3, lower left panel).
Over the central part of the Greenland ice sheet, liquid precipitation is extremely rare. However, in August 2021, Summit Station, located at the highest point of the ice sheet (3216 m above sea level), experienced its first recorded rainfall event (European Space Agency, 2021). According to the National Snow and Ice Data Center (NSIDC), this was the first known instance of rainfall at Summit Station. Warm air intrusions in 2012 and 2019 resulted in brief surface melting, but temperatures were not high enough for rainfall to occur in those years (Hermann et al., 2020; Tedesco and Fettweis, 2020).
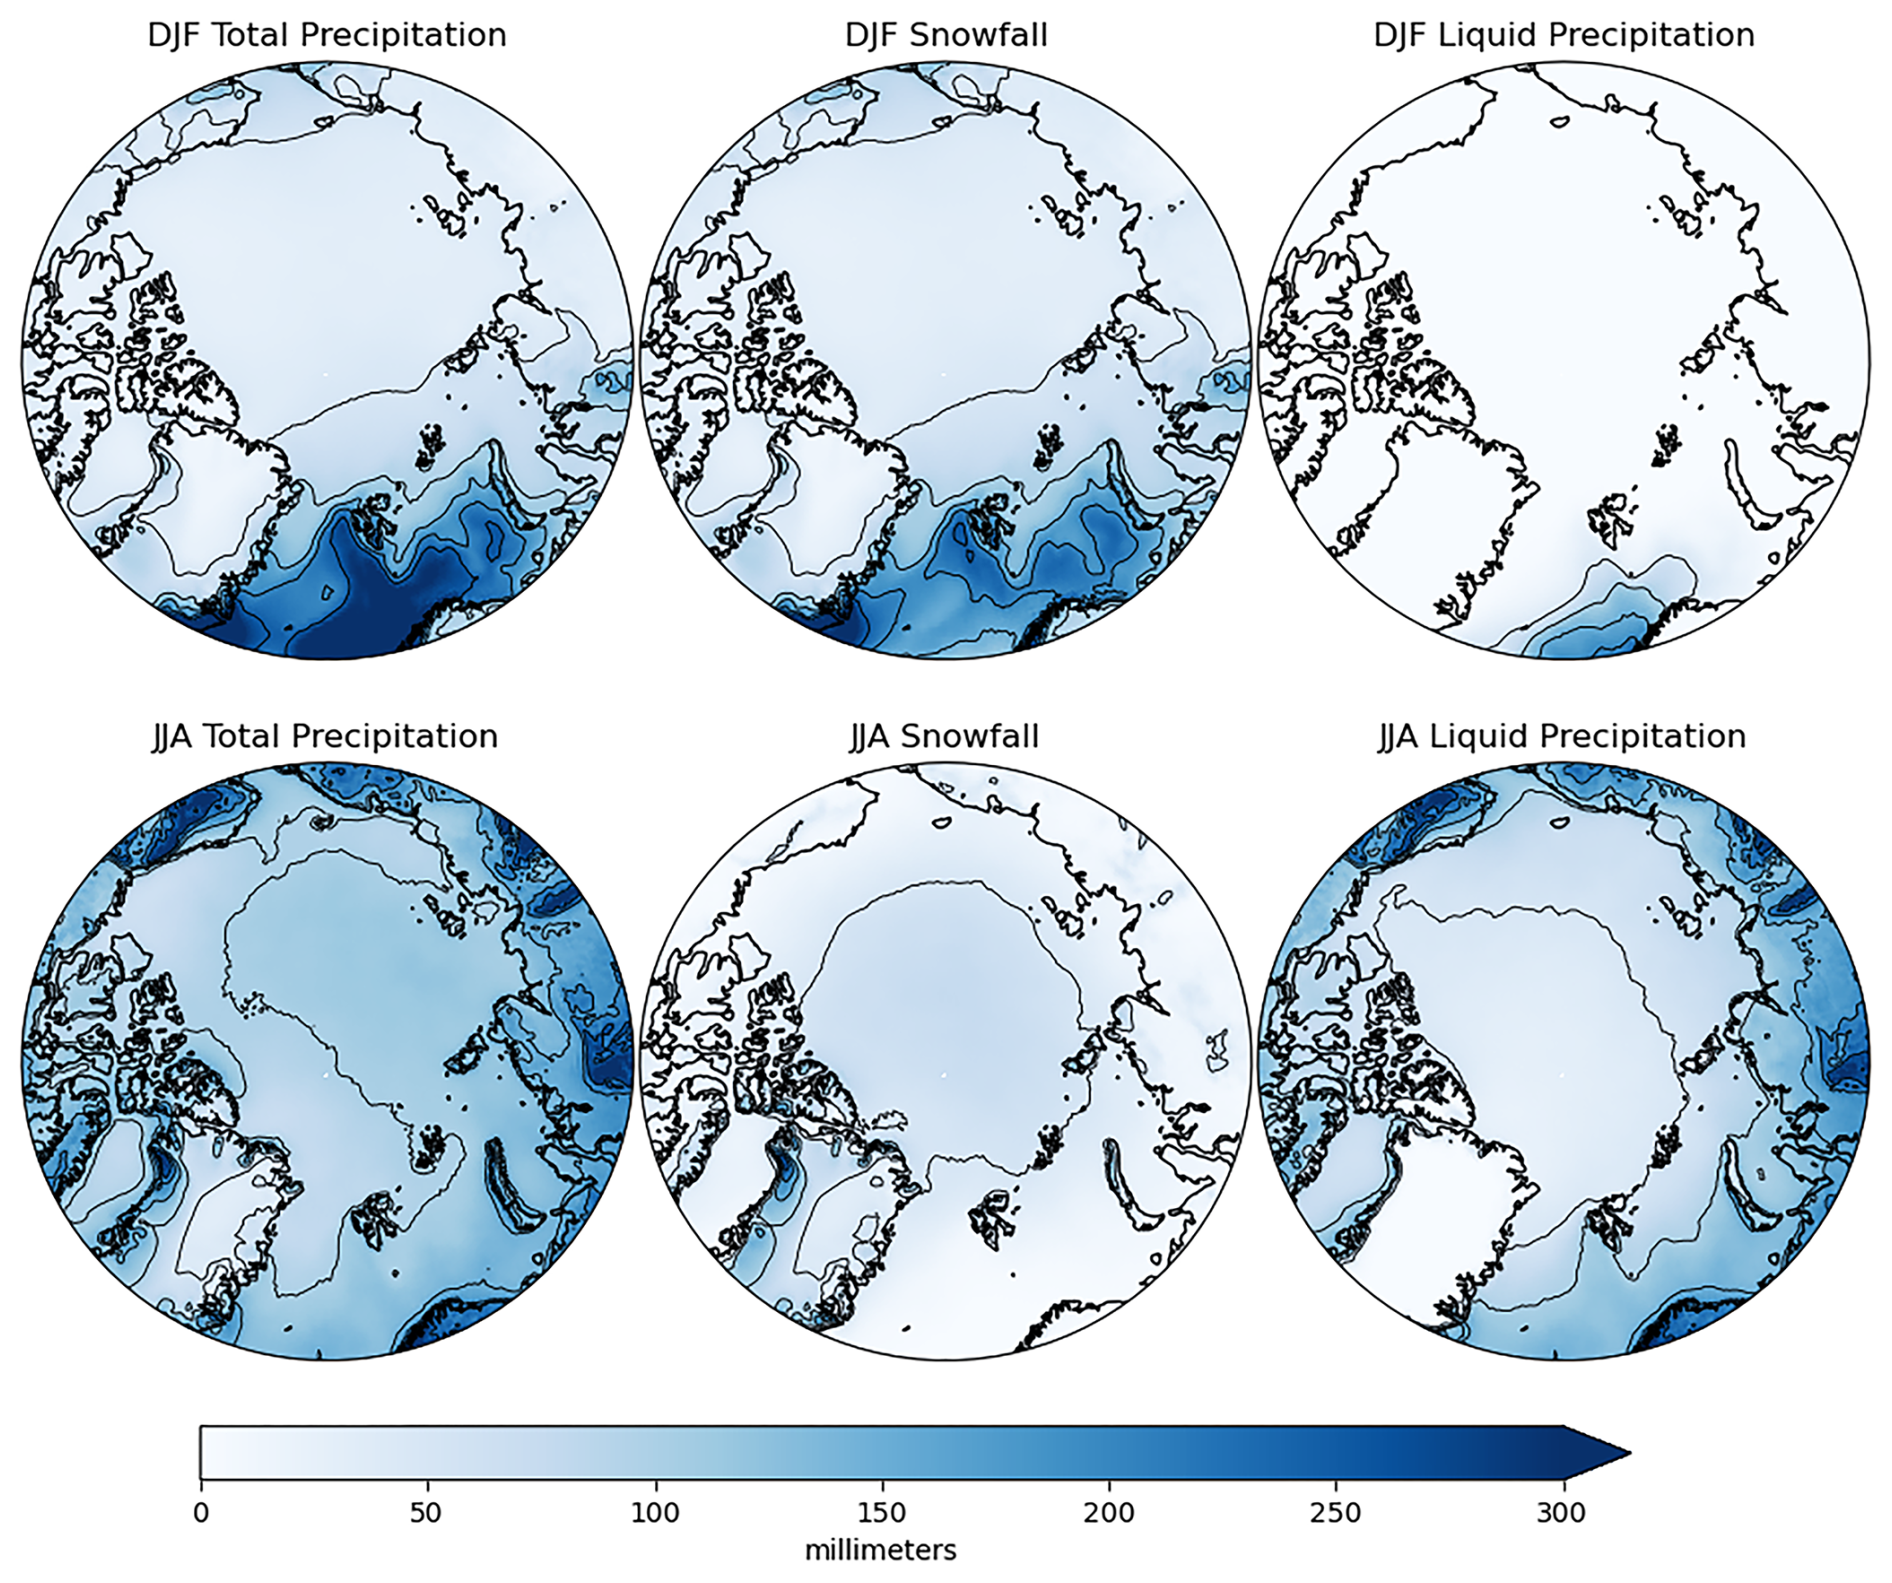
Figure 4Average seasonal totals of total precipitation, snowfall, and liquid precipitation for winter (December, January, February (DJF); top) and summer (June, July, August (JJA); bottom) from ERA5 (1979–2023).
3.2 Seasonality
Attention now turns to seasonality, looking first at contrasts between winter (December, January, February (DJF)) and summer (June, July, and August (JJA)) of precipitation, snowfall and liquid precipitation (Fig. 4). Winter precipitation is particularly low over the central Arctic Ocean and most land areas, reflecting low temperatures (hence little atmospheric moisture) and distance from Atlantic moisture sources. The much higher winter precipitation over the North Atlantic sector clearly stands out. The North Atlantic cyclone track is most active at this time of year. Cyclones are passing over open ocean and can pick up ample moisture. Average winter latent heat fluxes over the ice-free Atlantic sector as depicted in ERA5 are on the order of 80 W m−2 or even higher, compared to much lower values over the ice-covered central Arctic Ocean and land areas (Fig. 5). Ólafsson and Økland (1994) describe how Arctic air masses moving over these warm Atlantic sector waters develop convective boundary layers that enhance precipitation.
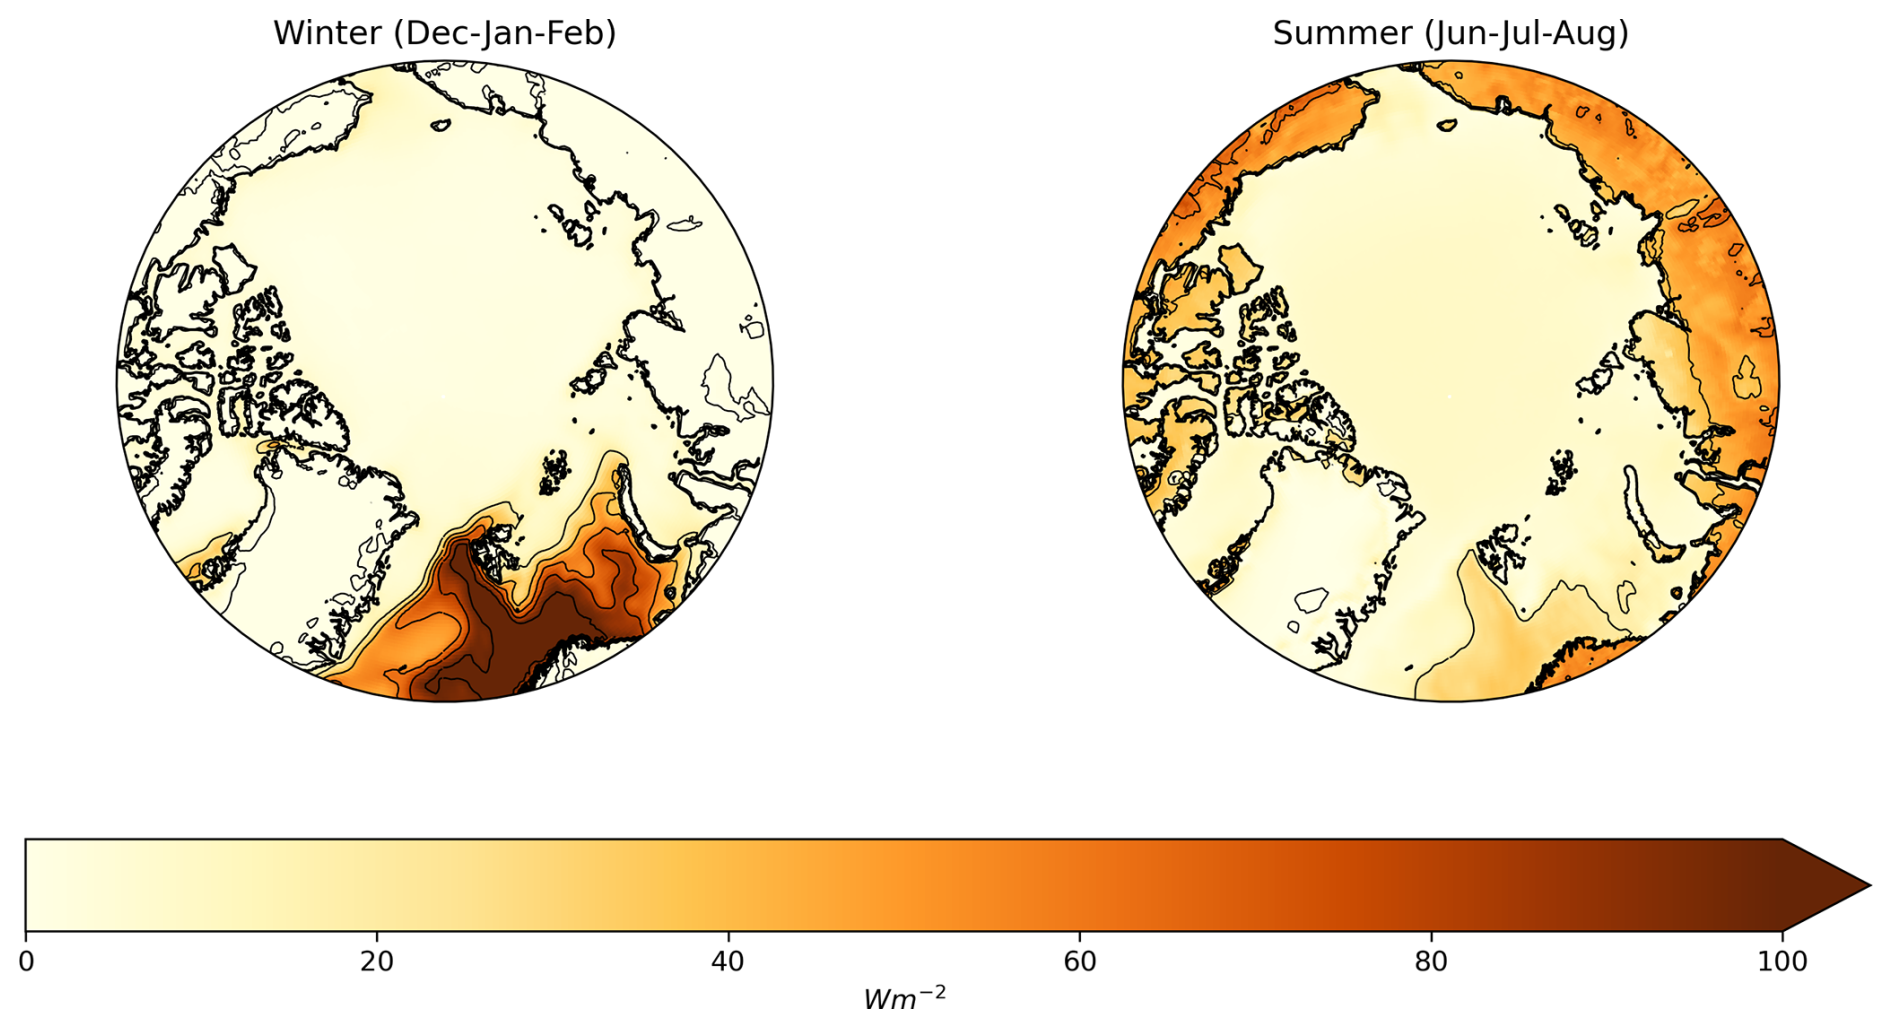
Figure 5Average latent heat fluxes for winter (left) and summer (right), 1979–2023, from ERA5. These are created by using monthly averages of hourly data.
Precipitation over the North Atlantic sector is much lower in the summer. Figure 5 shows Atlantic sector latent heat fluxes are much lower, and the North Atlantic cyclone track and associated Icelandic Low are also much weaker at this time of year (Serreze et al., 1997). Summer precipitation is at its seasonal maximum over most land areas, reflecting the seasonal maximum atmospheric moisture due to higher temperatures, surface heating fostering strong latent heat fluxes and, in some areas, convective activity, along with increased cyclone activity. The summer precipitation peak over the central Arctic Ocean reflects the seasonal peak in atmospheric water vapor, and a summer/early autumn maximum in cyclone activity. These systems move into the area from the Atlantic and Eurasia, and some form over the Arctic Ocean itself (Serreze and Barrett, 2008). Note that summertime latent heat fluxes are small over the Arctic Ocean due to the melting sea ice cover, limiting saturation vapor pressure and the vertical vapor gradient (Serreze and Barry, 2014).
As is clear from Fig. 4, there are prominent contrasts between winter and summer in snowfall and liquid precipitation. The amount of snowfall is a function of both precipitation amount and temperature, which bears on whether precipitation is in liquid or solid form. For example, over the central Arctic Ocean, the low winter snowfall is primarily a function of low precipitation, while over the land areas in summer, the low snowfall (close to zero in some areas) is due to temperature. Over much of the North Atlantic sector, high winter precipitation leads to ample snowfall.
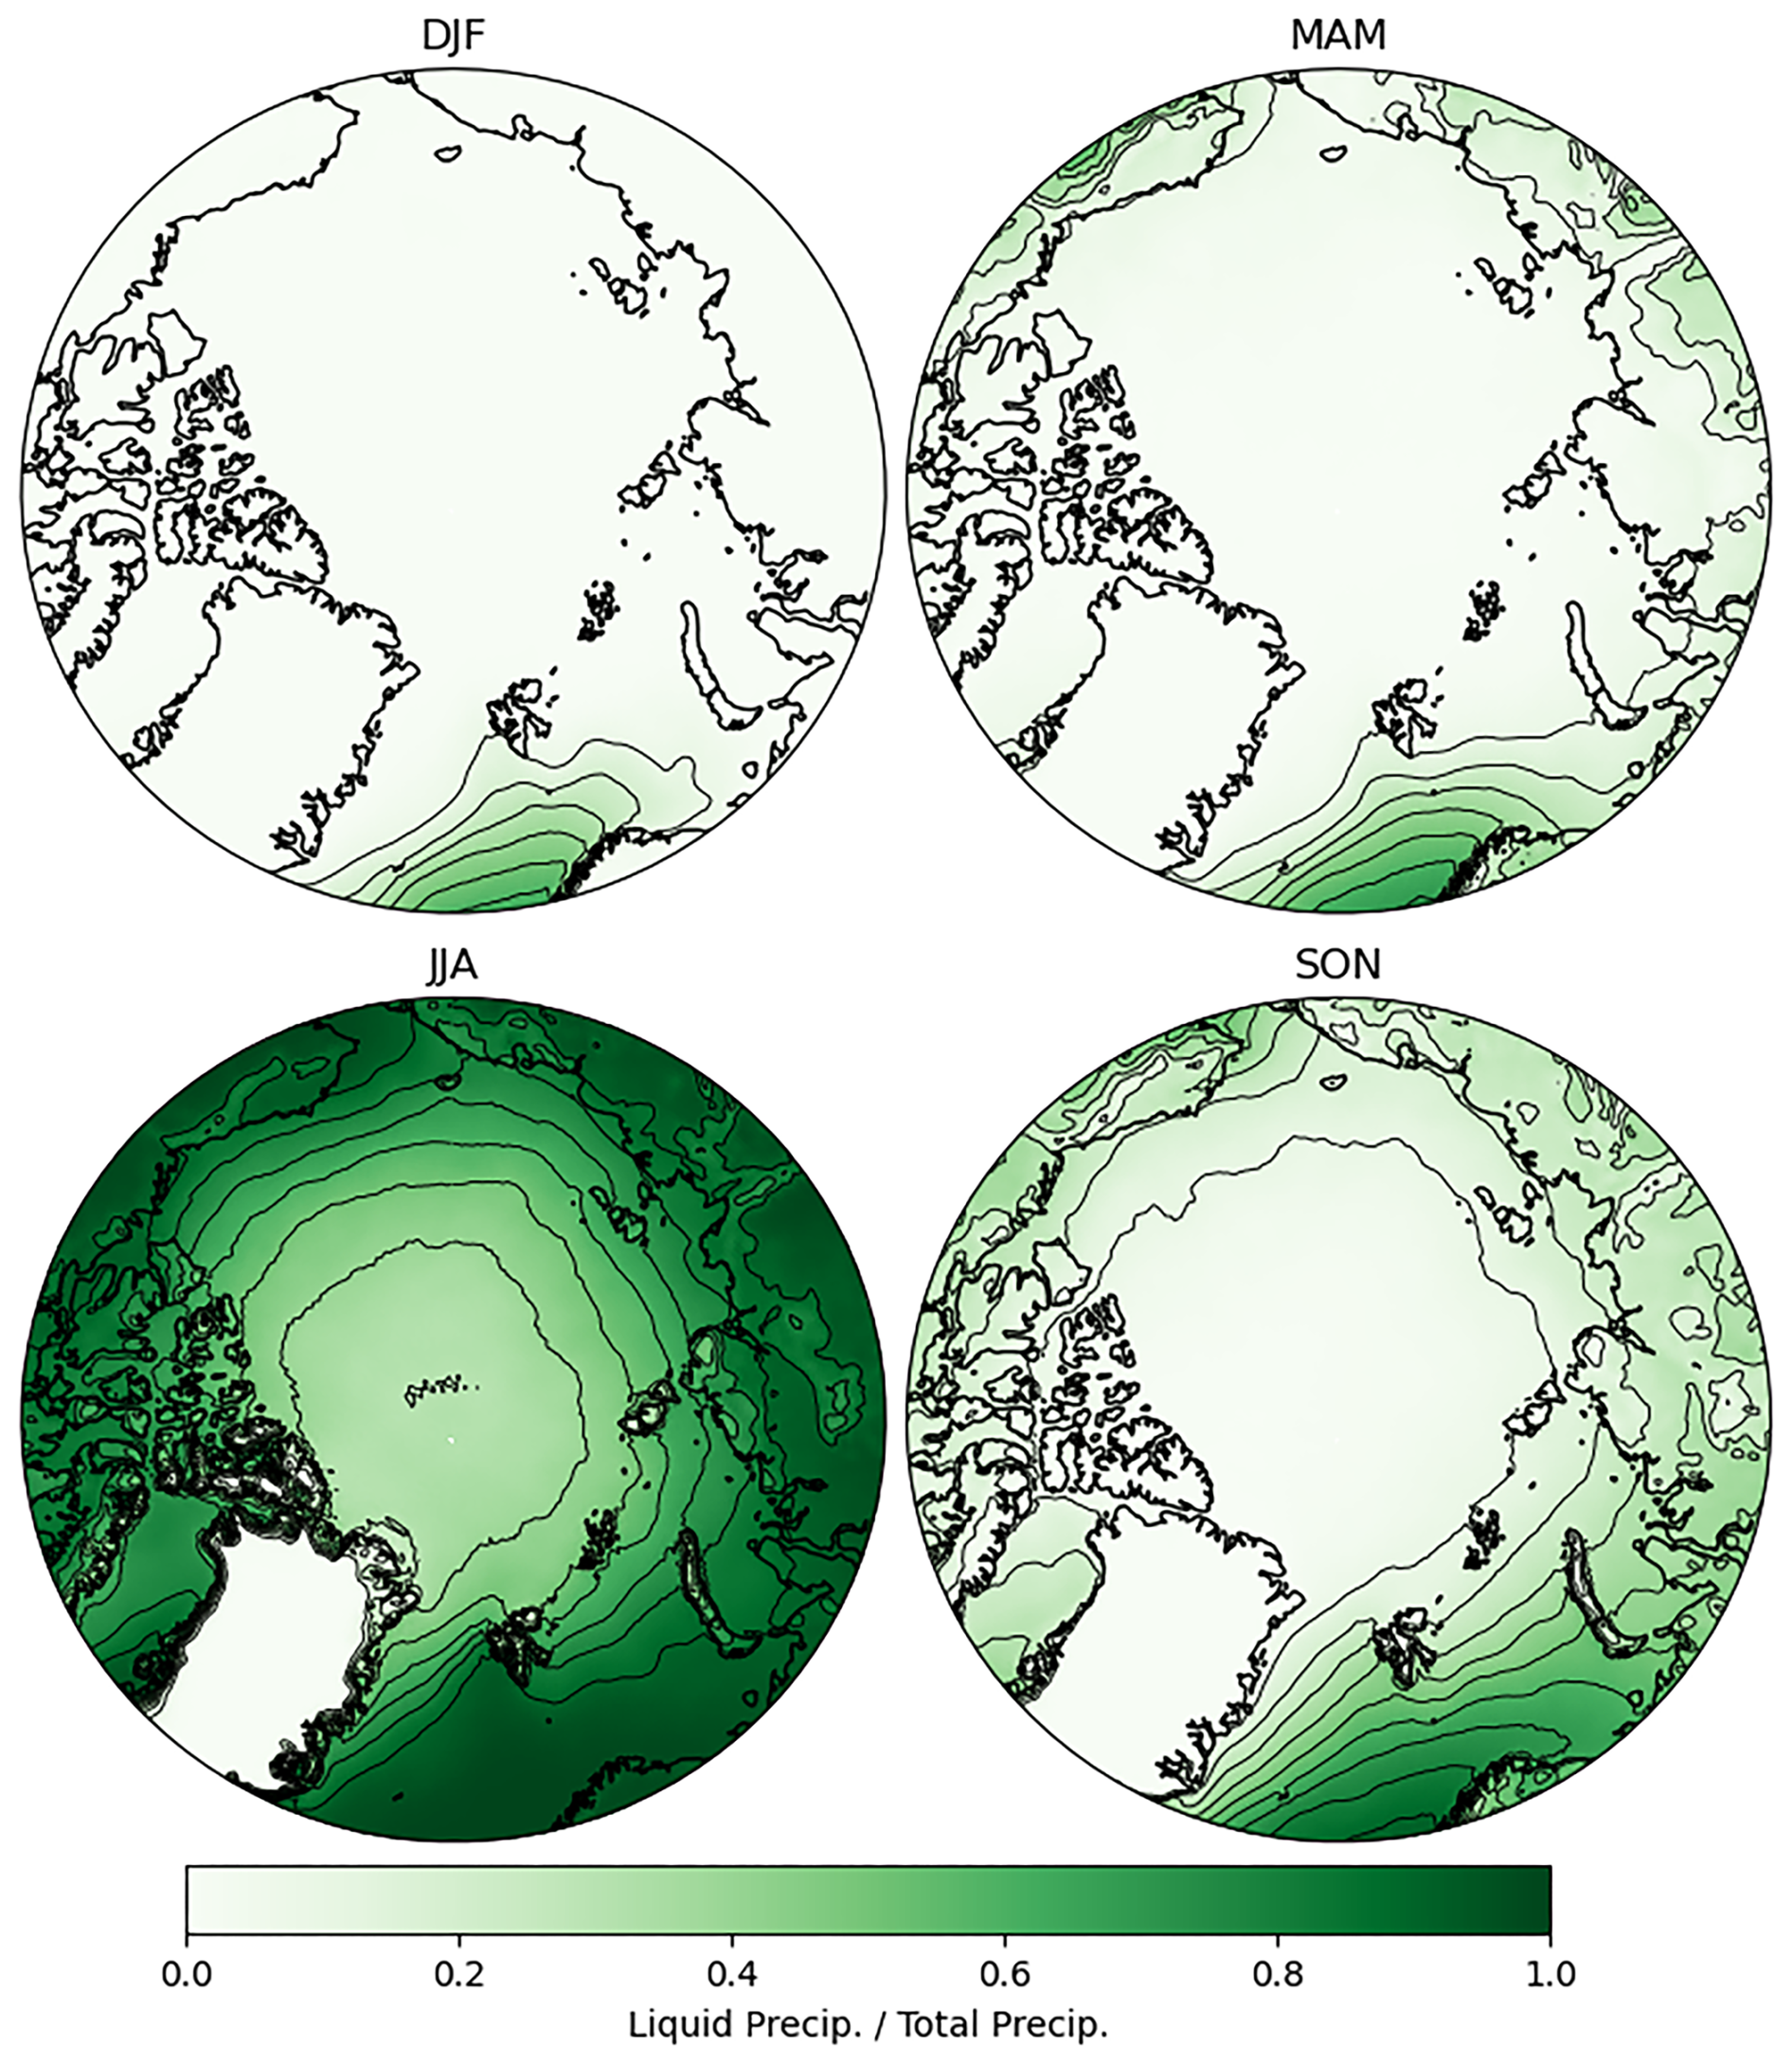
Figure 6Average seasonal distribution of the liquid-to-total precipitation ratio from ERA5, 1979 to 2023.
With such controls in mind, attention turns to Fig. 6, the liquid to total precipitation ratio for each season. During winter (upper left panel), liquid precipitation is a large fraction of total precipitation only in the very southernmost regions of the North Atlantic. This is consistent with observations that even Bergen, Norway, lying at about 60° N along the west coast of Norway, seldom sees snowfall in winter. This is due to the North Atlantic Drift Current, which results in high air temperature relative to latitude. While winter liquid precipitation fractions are shown as near zero over most land areas and the Arctic Ocean, it is known that occasional warm air intrusions can allow for brief wintertime rain or freezing rain events over the central Arctic Ocean. In recent years, there have been extreme cases of wintertime warming. For example, on 2 February 2025, temperatures near the North Pole reached the melting point, more than 20 °C above average (The Guardian, 2025).
During spring (Fig. 6, upper right panel), the liquid precipitation fraction increases over land areas. However, snowfall is still by far the dominant precipitation type over much of the Arctic Ocean away from land areas and the Atlantic sector. The highest ratios of course occur during the summer (lower left panel). Over the Atlantic sector, essentially all summer precipitation falls as liquid precipitation. Liquid precipitation is also dominant over land areas, the obvious exception being the high, cold Greenland ice sheet. Note, however, that over the central Arctic Ocean, about half of all summer precipitation still falls as snow according to ERA5.
As summer fades to autumn, the liquid precipitation fraction decreases as temperatures fall (Fig. 6, lower right panel). However, early autumn (September) still shows high liquid precipitation fractions over the northern North Atlantic (not shown). This area remains ice-free year-round, and temperatures remain high for the latitude. By contrast, the seasonal shift from liquid precipitation to snowfall is prominent over the ice-covered central Arctic Ocean where autumn temperatures sharply drop.
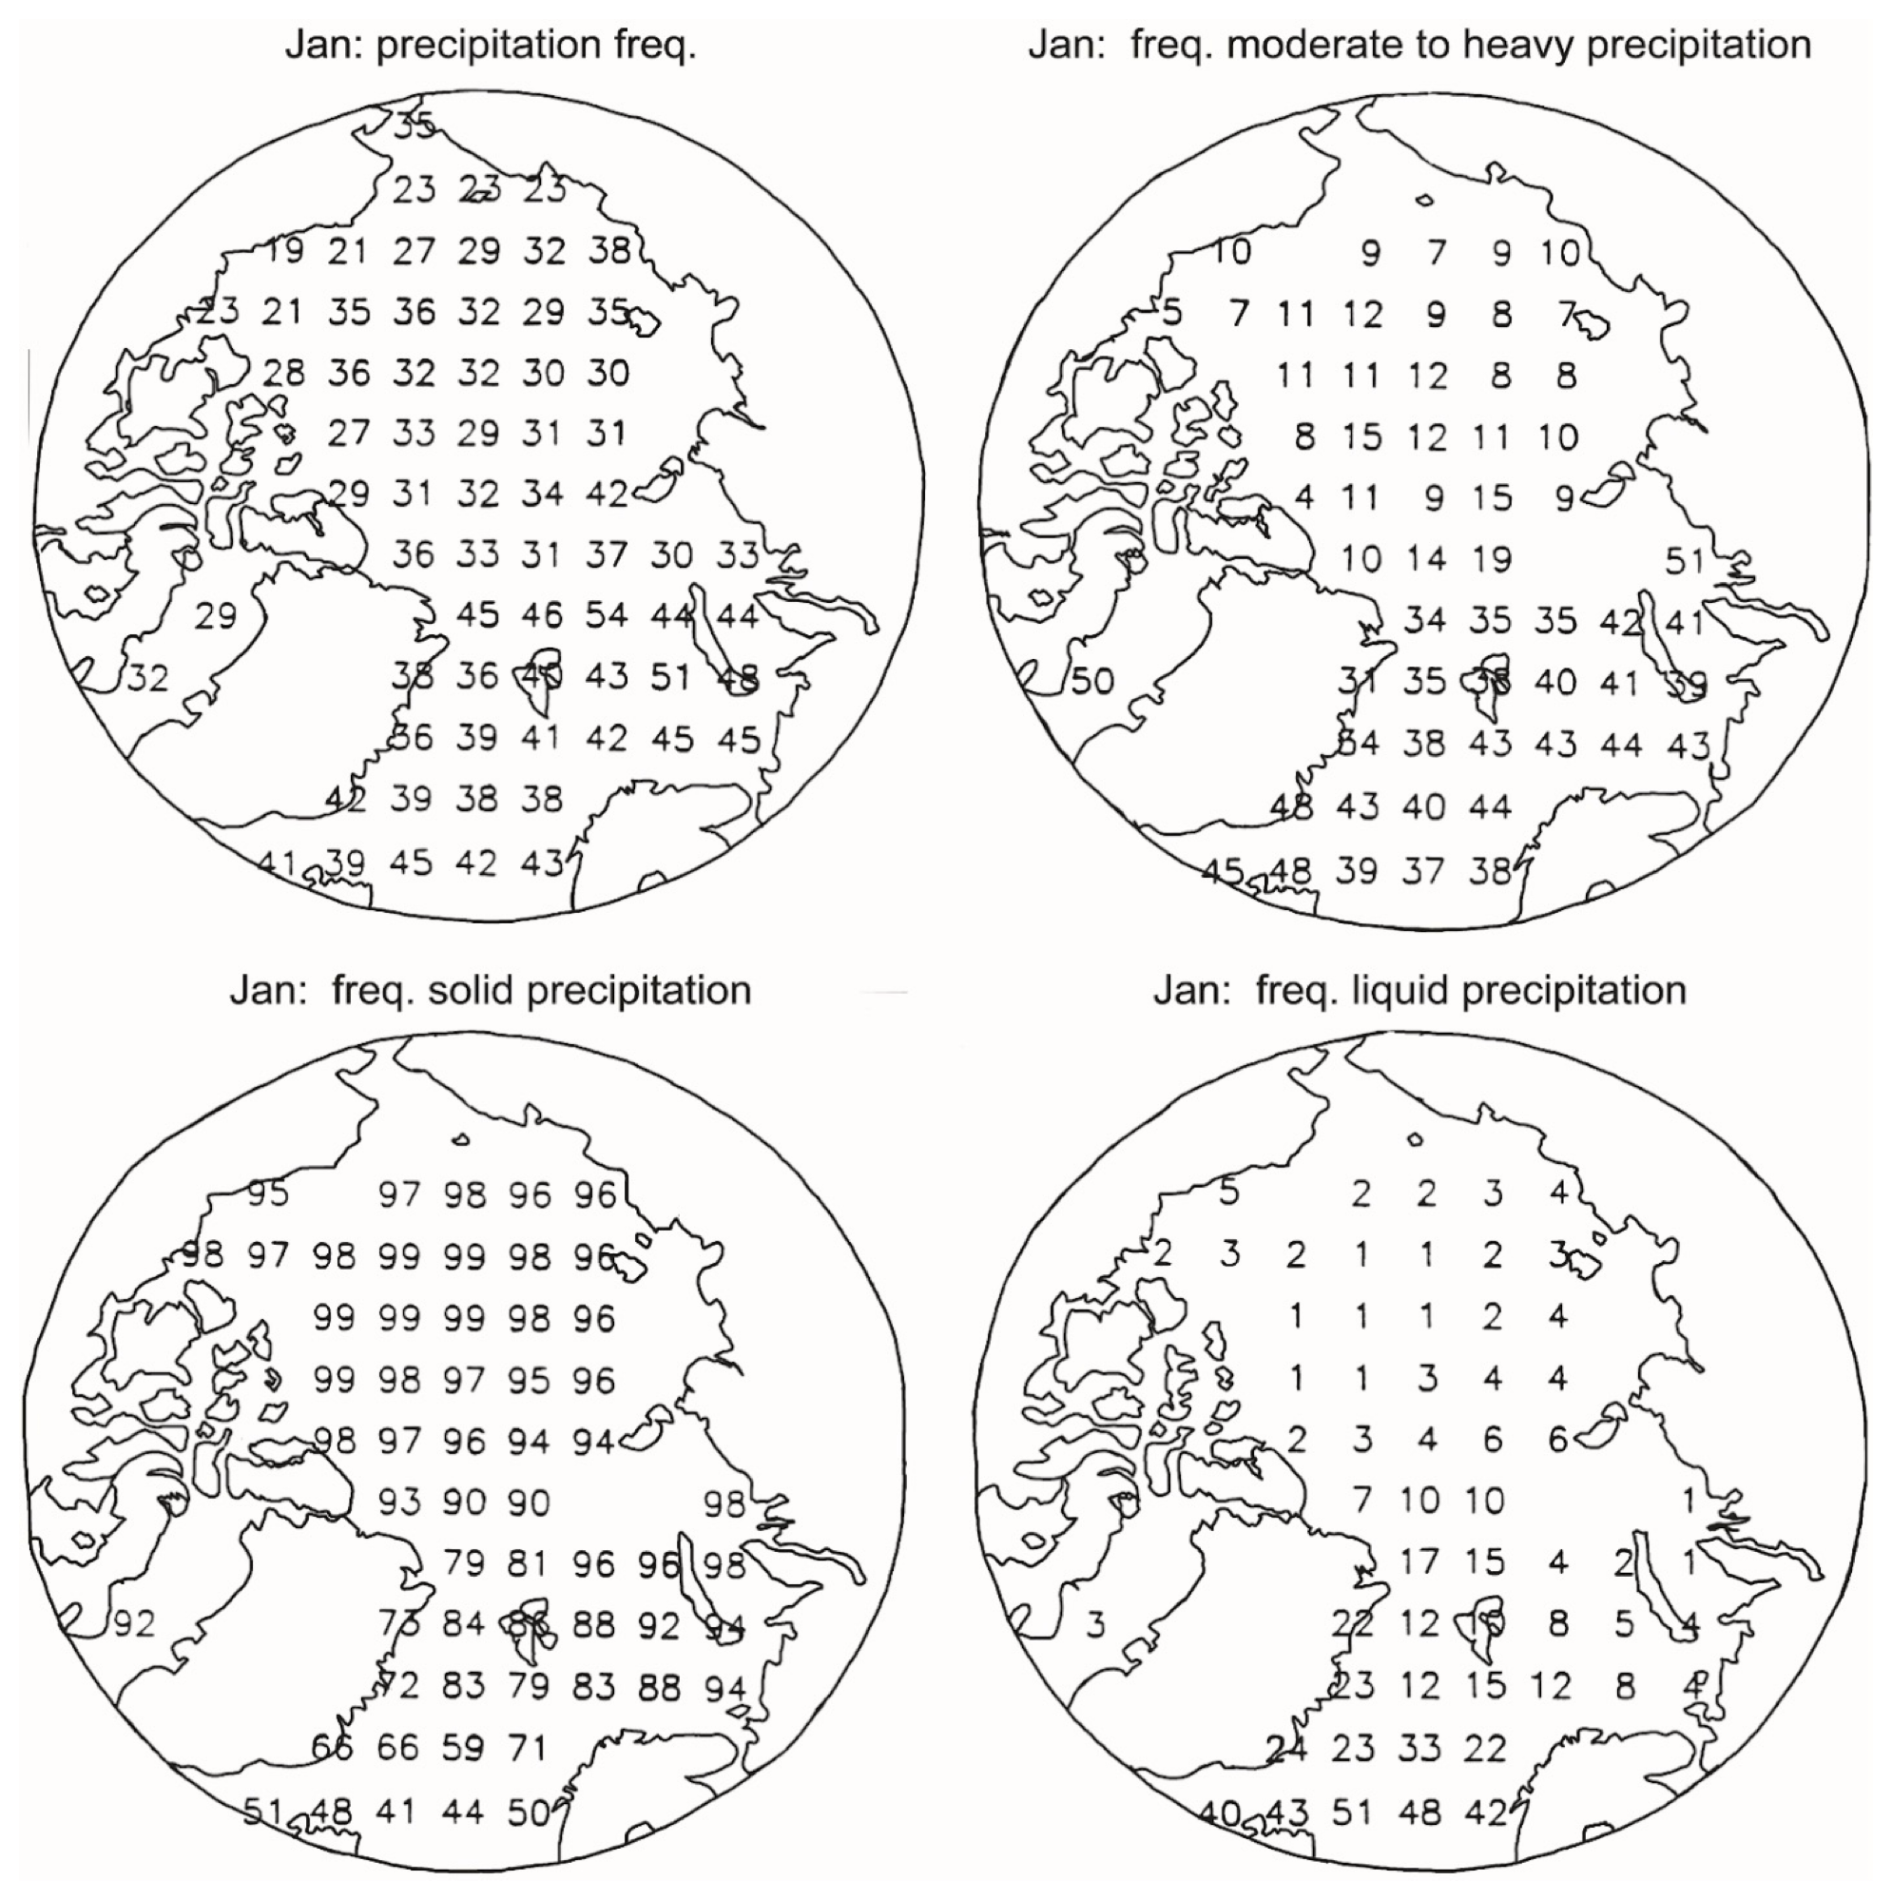
Figure 7Precipitation frequency (top left panel), the frequency of moderate to heavy precipitation (top right panel), and the frequency of precipitation phase – solid (lower left panel) and liquid (lower right panel) over the Arctic Ocean for January, based on ICOADS data, reproduced from Serreze et al. (1996) (units %).
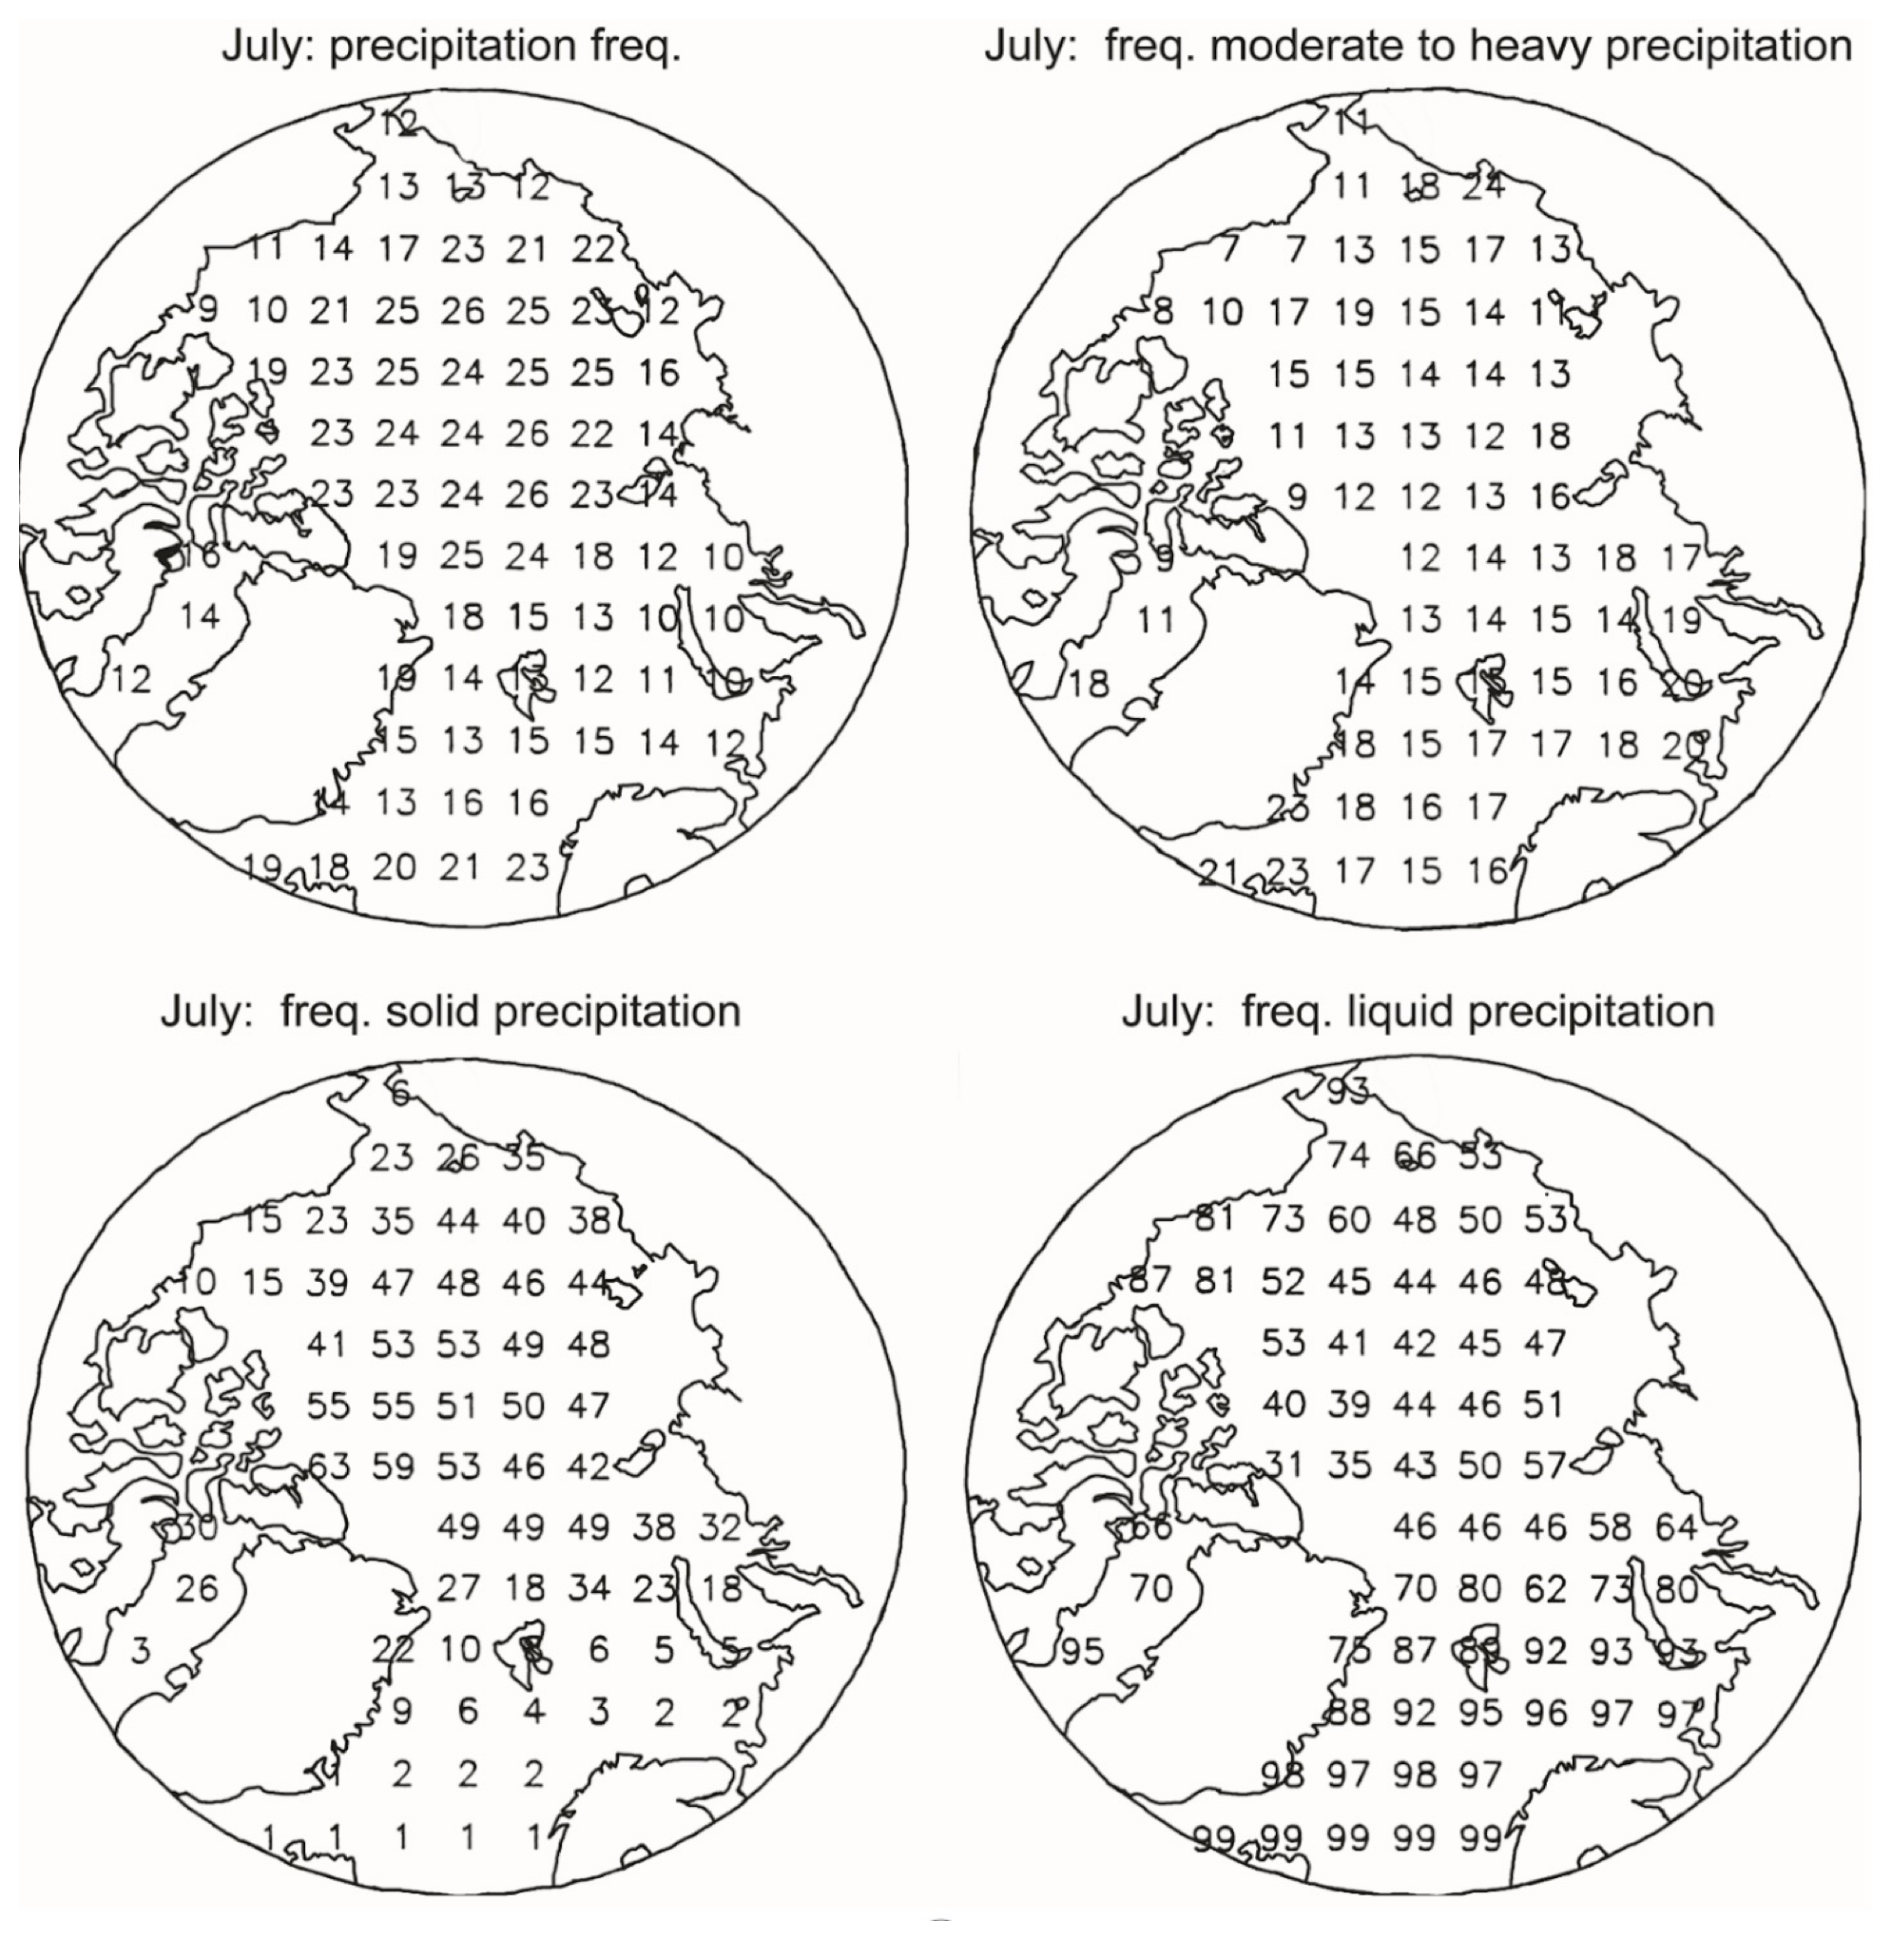
Figure 8Precipitation frequency (top left panel), the frequency of moderate to heavy precipitation (top right panel), and the frequency of precipitation phase – solid (lower left panel) and liquid (lower right panel) over the Arctic Ocean for July, based on ICOADS data, reproduced from Serreze et al. (1996) (units %).
3.3 Comparisons with ICOADS Records
The Serreze et al. (1996) study, based on the ICOADS data base over the period 1950–1995, while certainly dated, provides valuable independent estimates of precipitation phase as well as intensity over the Arctic Ocean and North Atlantic sector. Figures 7 and 8 show the key results for January and July reproduced from that study. The ICOADS data (as with the ASOS data described below) are expressed as the percent of all precipitation observations in liquid or solid form, the percent of all observations in which precipitation occurred and (for ICOADS) when the precipitation was coded as moderate to heavy. While this differs from the ERA5 analysis which shows the ratio between liquid and total precipitation, results from the two studies are still comparable. As far as we are aware, there is no specific threshold regarding what qualifies as moderate to heavy precipitation in the ICOADS reports – the designation depends on the manual observer.
The ICOADS records from 1950–1995 show 95 %–99 % of all January precipitation events over the central Arctic Ocean falling as snow. This broadly corresponds to a liquid to total precipitation ratio of 0.01 to 0.05 in ERA5 data which shows an overwhelming dominance of solid precipitation during winter, even in today's warmer climate. The ICOADS maps for December and February are very similar to those for January. The January maps can hence be viewed as representative for winter as a whole. As mentioned earlier, there have been some recent rainfall events over the central Arctic Ocean in winter, associated with intrusions of warm moist air originating in the Atlantic. It is of interest, however, that even in the older ICOADS records, there were still occasional liquid precipitation events in winter. Consistent with the much higher precipitation totals over the northern North Atlantic shown in ERA5 and other studies, the ICOADS records show this region as having a much higher frequency of moderate to heavy precipitation as compared to the central Arctic Ocean, where most precipitation events are small. Hence, in summary, in at least a qualitative sense, winter results from ERA5 are consistent with the spatial patterns from the ICOADS record.
For July (Fig. 8), the ICOADS records depict approximately 40 %–60 % of precipitation events over the central Arctic Ocean as snow, and only infrequent snowfall over the northern North Atlantic, in overall agreement with the ERA5 summer results. The August ICOADS map is similar to that for July, while the map for June shows a lower fraction of events as liquid (20 %–25 %). All of the summer months show the seasonal reduction over the North Atlantic sector in the frequency of moderate to heavy precipitation, consistent with the lower amounts of summer precipitation shown in ERA5 due to the weaker north Atlantic cyclone track. An updated analysis of the ICOADS records would be highly valuable for better validating ERA5.
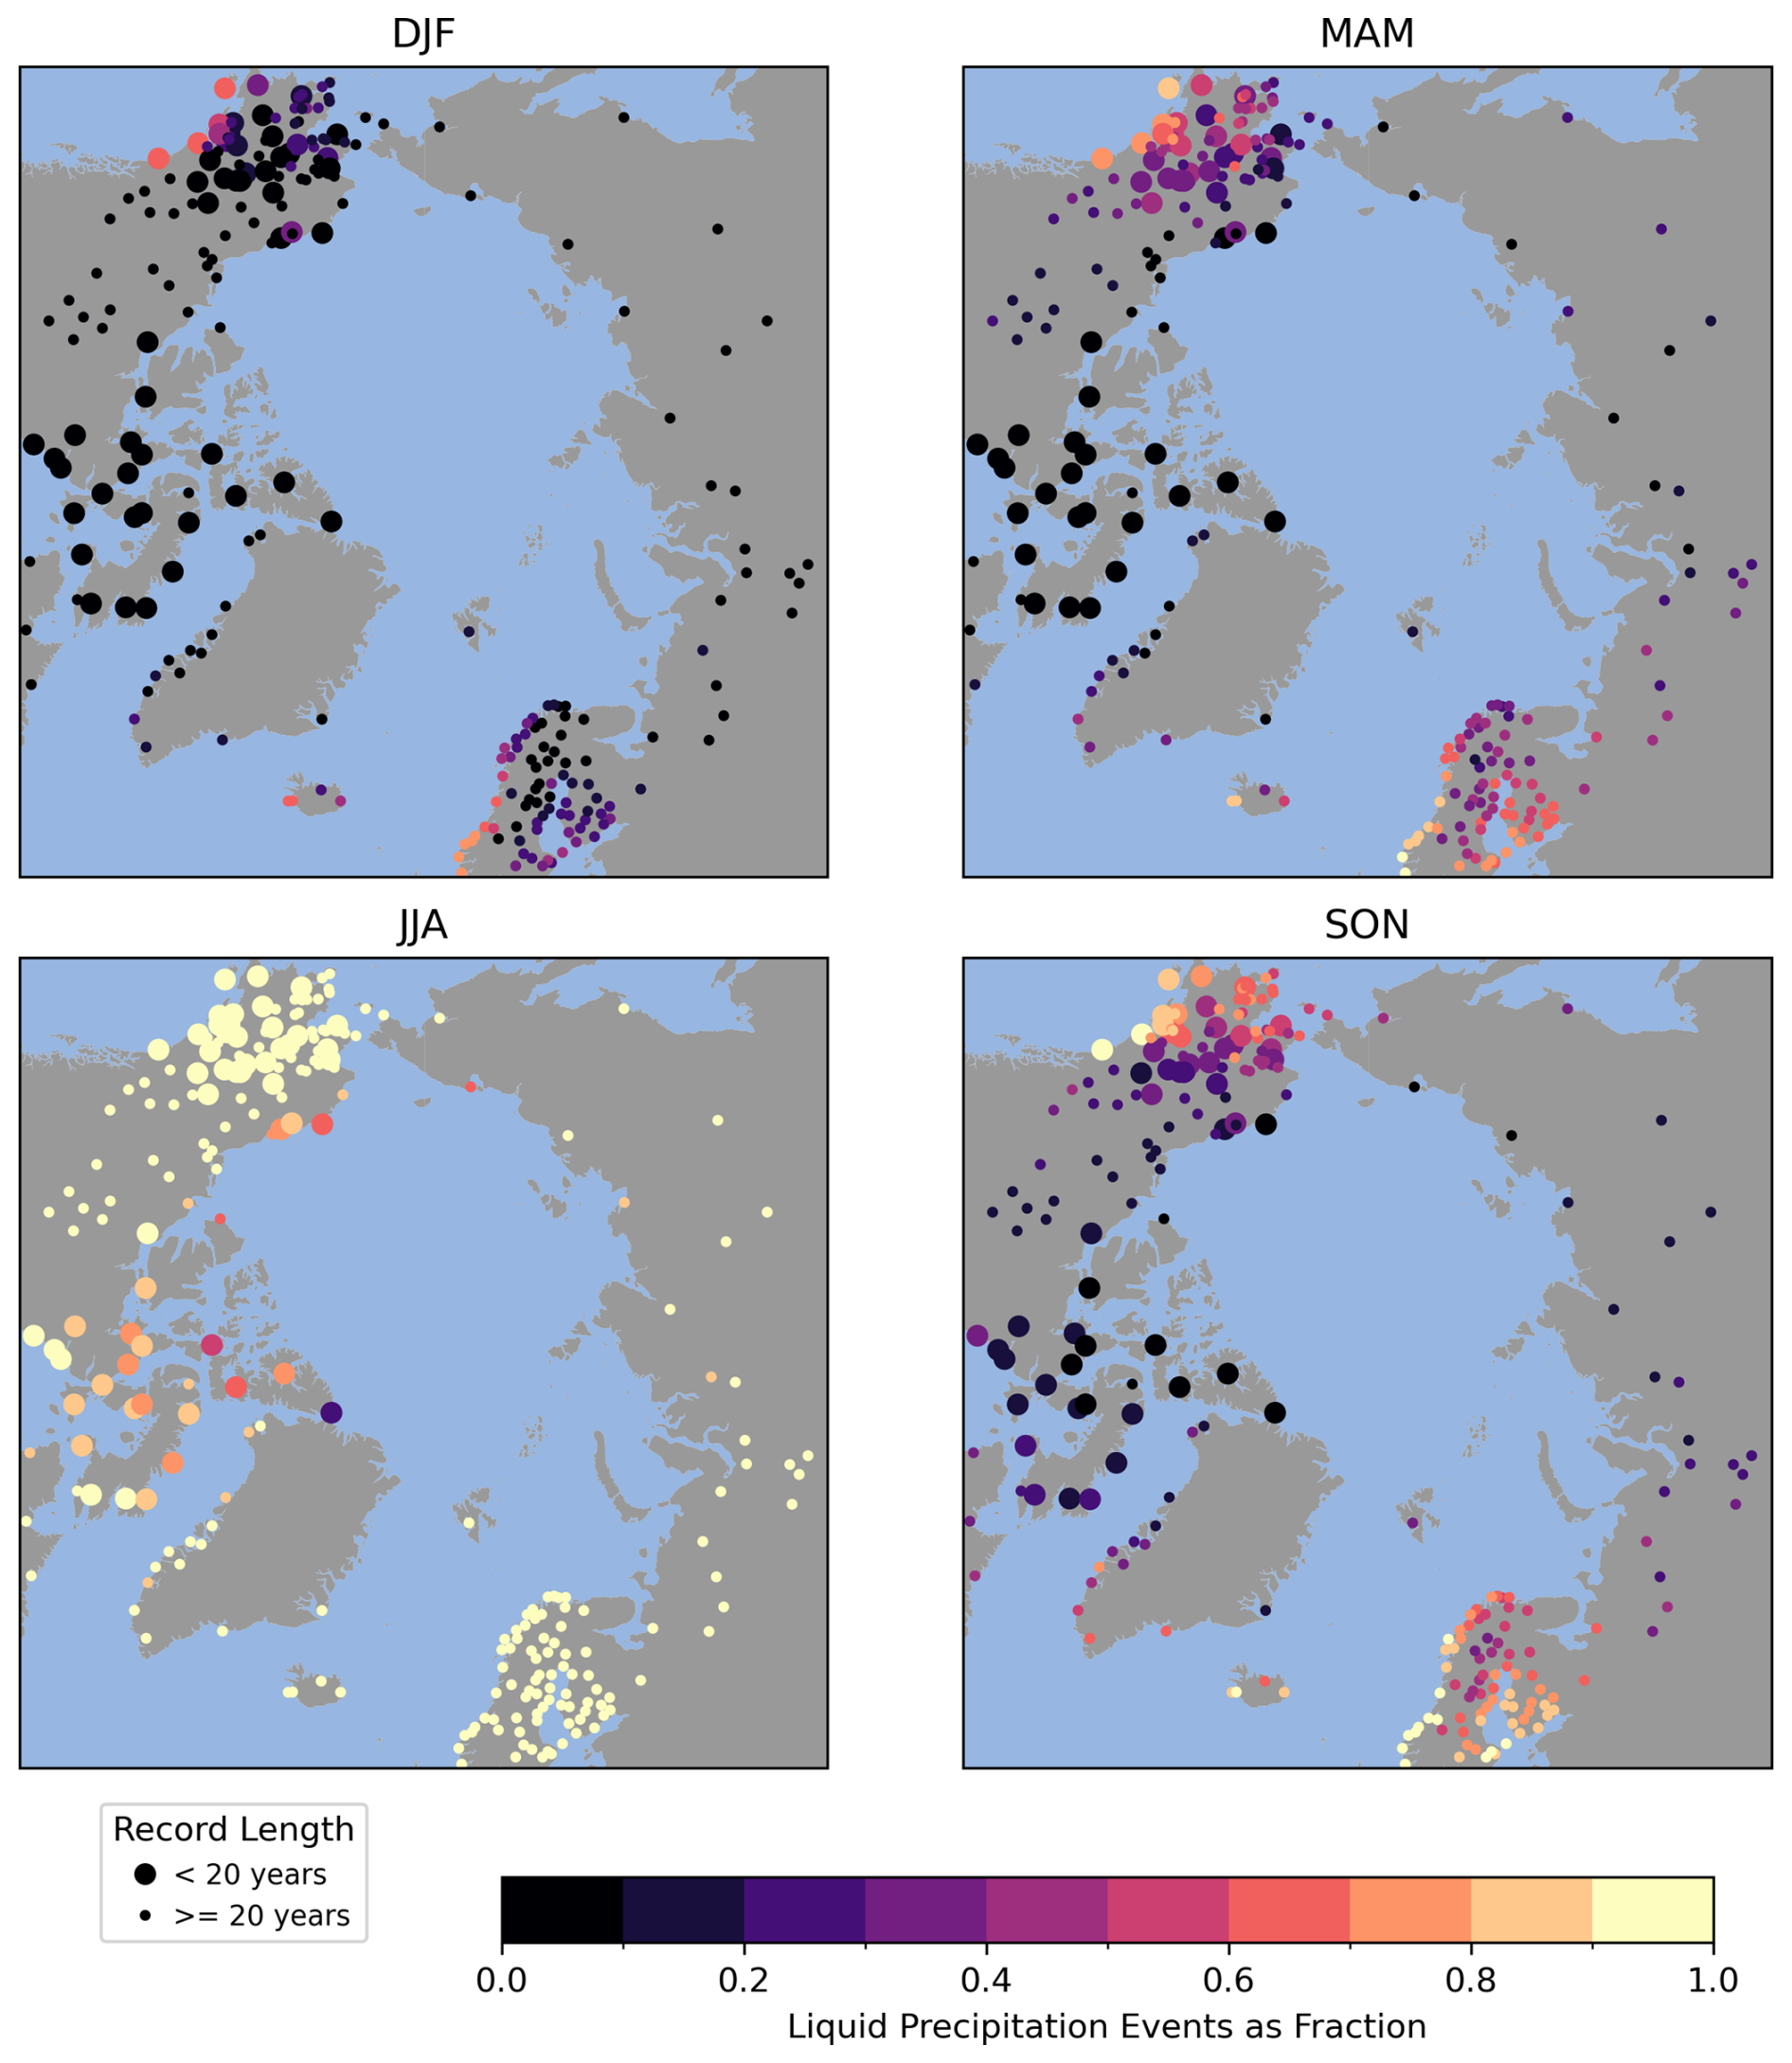
Figure 9Number of hours with liquid precipitation expressed as a fraction of the total number of hours with any type of precipitation for the climatological seasons from the ASOS database. Large symbols represent stations with more than 20 years of data for the 1979 to 2023 period. Small symbols are for stations with shorter records.
3.4 Comparisons with ASOS Records
Figure 9 shows the number of hours with a report of liquid precipitation expressed as a fraction of the total number of hours with either liquid or solid precipitation reported by season for stations in the ASOS database. This is essentially equivalent to the liquid to solid precipitation ratios just examined. The winter results are qualitatively consistent with results from ERA5 liquid/total precipitation ratios. The ASOS database shows that few events are liquid in winter, the exceptions being sites in extreme southern Alaska and along the Norwegian coast. The pattern for spring is similar, except sites in southern Alaska and the Norwegian coast are more numerous and the liquid fractions are higher. In the summer months, liquid precipitation is the majority almost everywhere, the exception being over the Canadian Arctic Archipelago, where snow events can still be common. Autumn marks the transition back to the winter pattern, as decreasing temperatures reduce the fraction of liquid precipitation.
From an analysis of Ku-Band Quikscat radar data over November through February from 2000–2009 (Bartsch et al., 2010, Bartsch, 2010a, b), Scandinavia and northwestern Russia emerge as “hotspots” for rain on snow events (in some places up to 12 events per year). This is consistent with the fairly high frequency of liquid precipitation events in this area from the ASOS data for winter, spring and autumn, and is also clear when we look at the correspondence between rain events in the ASOS database and the occurrence of snow on the ground (not shown). It is unfortunate that few ASOS records are available over much of central and eastern Russia, but the few stations that do exist point to a low frequency of rain events in the cold season, consistent with the QuikScat analysis indicating one or zero ROS events per year in this area characterized by a highly continental climate.
An event of particular note occurred 8–10 November 2013 over the Yamal Peninsula of Russia as well as neighboring coastal regions east of the area of highest ROS frequency seen in the Quikscat analysis. This event is described by Forbes et al. (2016), who note that several other Yamal events have been recorded in recent years. After the 2016 event, ice covered an area of approximately 27 000 km2 and completely blocked reindeer from foraging, leading to the death of 61 000 animals between November 2013 and June 2014.
4.1 Precipitation
As the Arctic warms, one expects more rain events, and while this implies more ROS events, a caveat is that the snow-covered season will shorten, therefore rain will increasingly fall on bare ground. Climate models are in near universal agreement that Arctic precipitation will increase (McCrystall et al., 2021), driven by rising atmospheric moisture availability, which enhances precipitation as warming temperatures allow for greater evaporation, a greater moisture holding capacity of the atmosphere, and hence a poleward moisture transport. There is emerging evidence that, at least assessed for the Arctic region as a whole, Arctic precipitation is indeed increasing (Walsh et al., 2023).
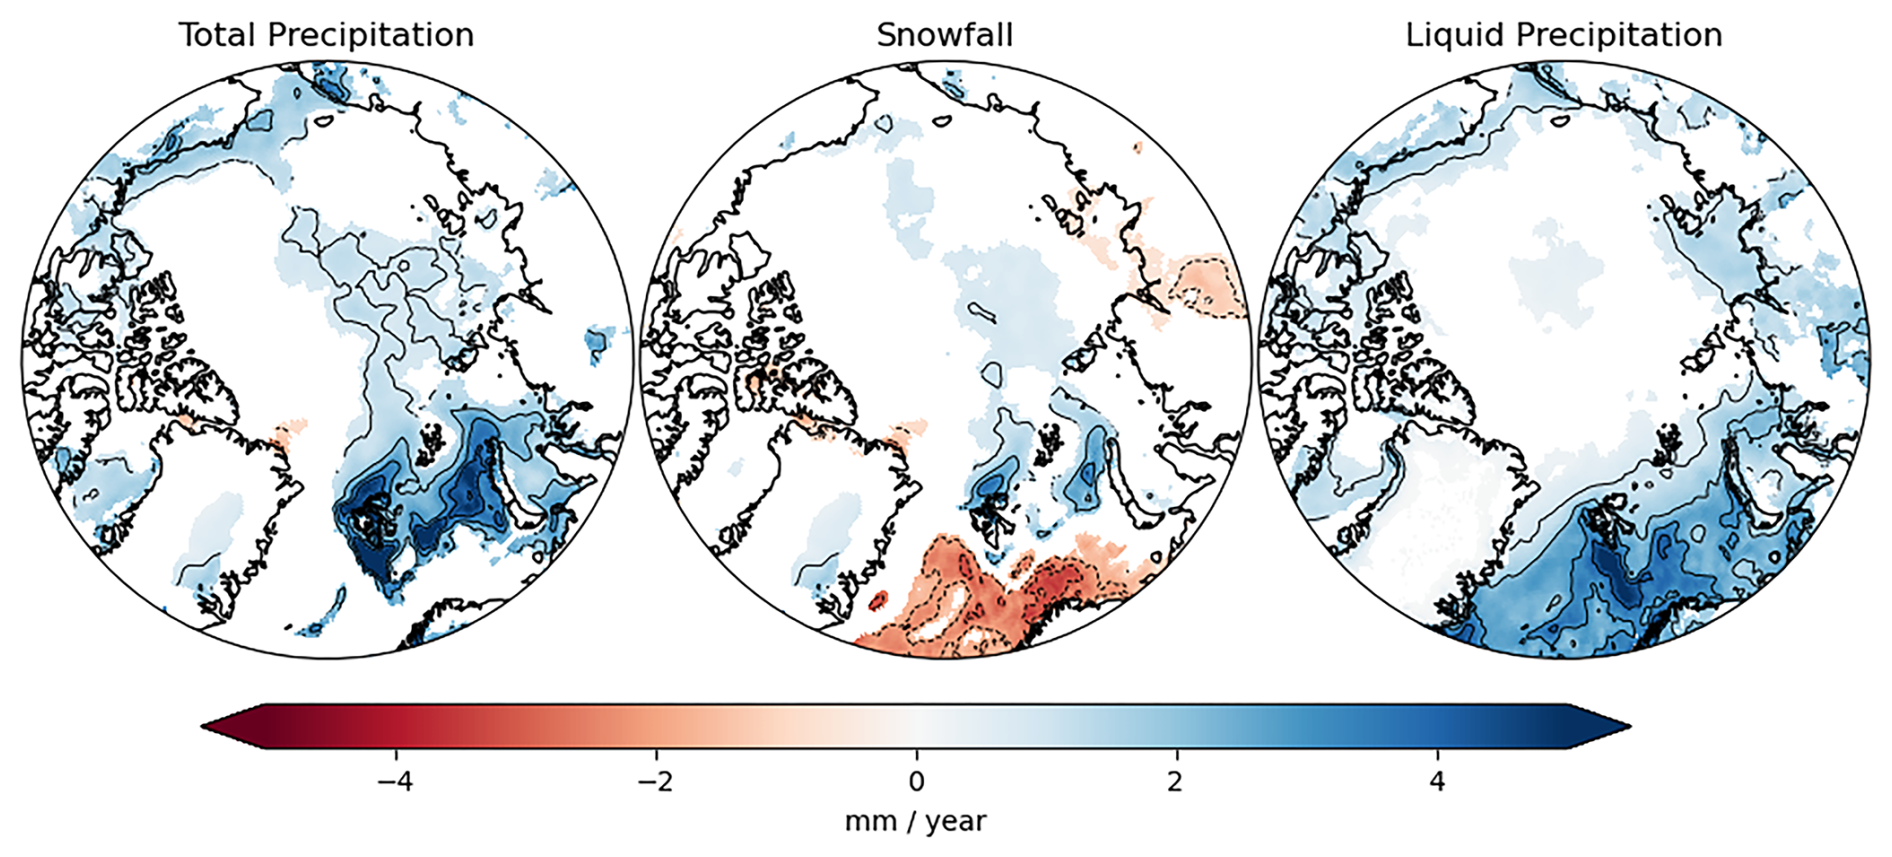
Figure 10Linear trends in annual total precipitation, snowfall, and liquid precipitation from 1979 to 2023 from ERA5. Only trends that are statistically significant at the 95 % confidence level are shown by colors.
Figure 10 shows linear trends in annual precipitation, snowfall and liquid precipitation over the period 1979–2023. Of particular note are the statistically significant increases over the Barents and Kara Seas Sea and around and north of the Svalbard archipelago, locally 3–4 mm per year. It hence seems that the conclusion that increased Arctic precipitation, considered for the region as a whole (Walsh et al., 2023), is largely due to increases in this area.
In explanation, this is the one area of the Arctic that has experienced substantial reductions in winter sea ice extent, linked to a stronger inflow of warm and salty Atlantic water (Lien et al., 2017). This warm Atlantic water, underlying very cold air, can result in large latent heat fluxes to the atmosphere and unstable low level boundary layers, favoring increased precipitation. Digging into this further, the increase in winter precipitation as depicted by ERA5 in the Barents and Kara Seas appears to be in part convective precipitation. Analysis of the full-length ERA5 record indicates, based on linear trends, statistically significant 4 %–5 % increases over the entire time period since 1950 in the ratio between convective and total precipitation in this area (not shown), with smaller increases in autumn and spring. Convective-type precipitation is known to occur in winter in the Norwegian Sea where warm water underlies cold air, fostering high evapotranspiration and unstable boundary layers (Ólafsson and Økland, 1994), and it appears that such wintertime convective precipitation is now moving into higher latitudes as winter sea ice retreats.
Annual snowfall has fairly pronounced downward trends only over the warm Atlantic side of the Arctic, but largely south of the area with the largest precipitation trends. Liquid precipitation by contrast has widespread positive annual trends over most of the North Atlantic sector pointing to the warming conditions.
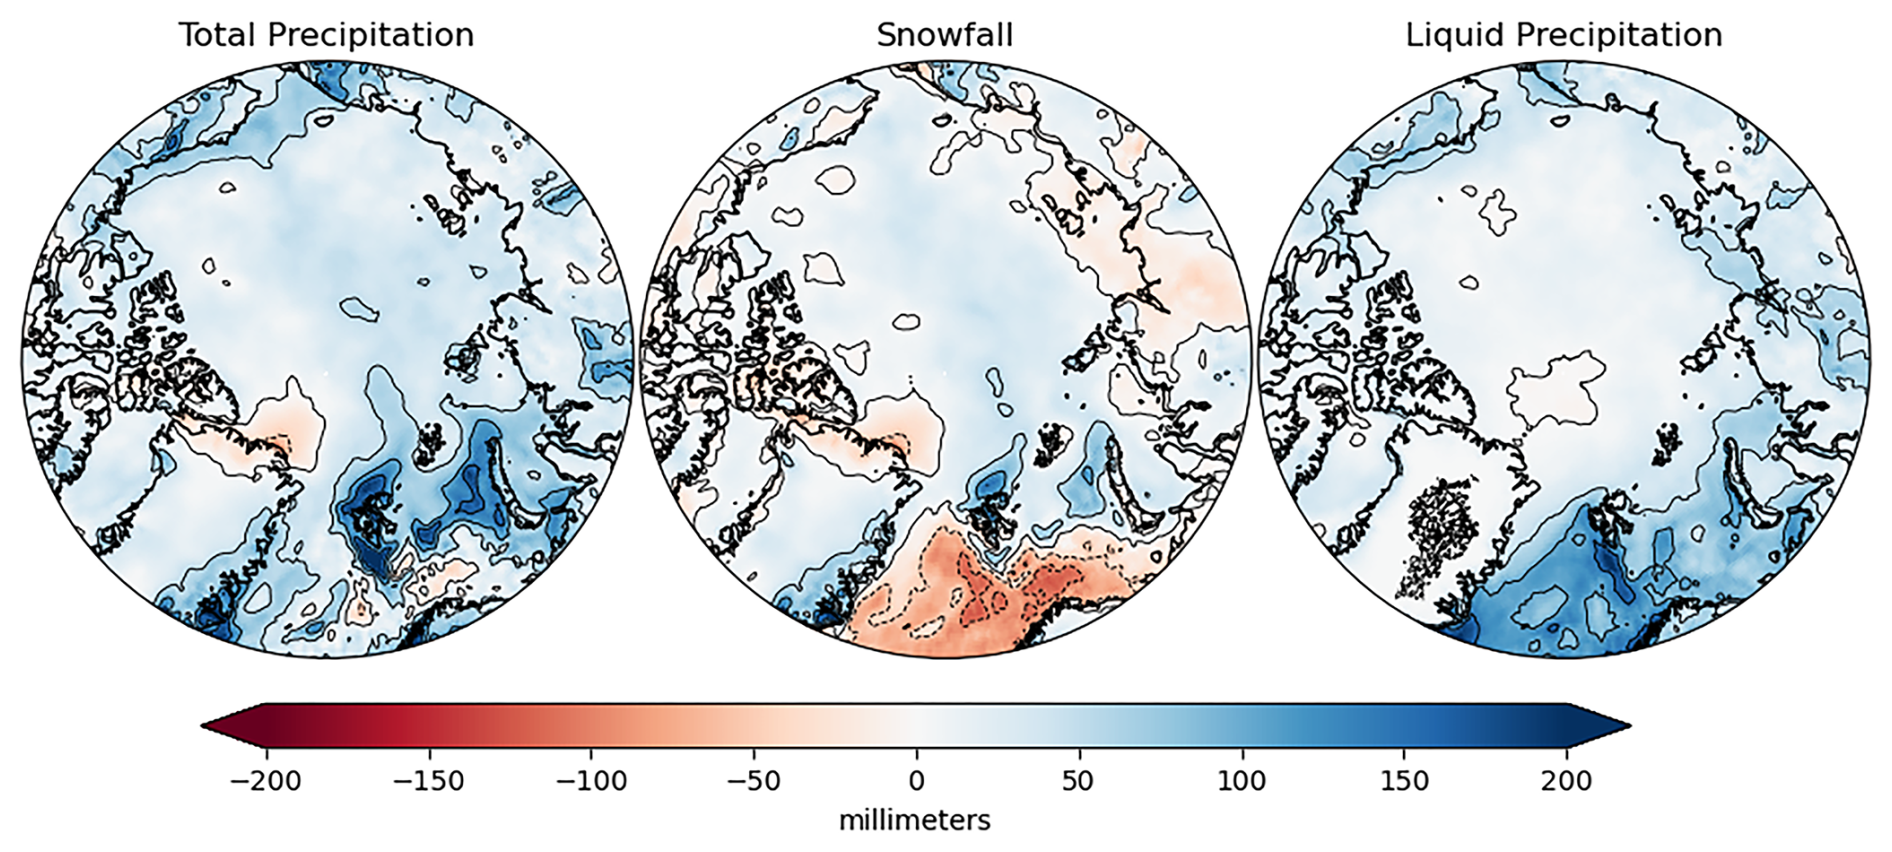
Figure 11The difference in annual total precipitation (left), snowfall (middle), and liquid precipitation (right) between the recent period (2014–2023) and an earlier baseline period (1979–1988) from ERA5.
As linear trends can sometimes be misleading, Fig. 11 shows the difference in annual total precipitation, snowfall and liquid precipitation between the first (1979–1988) and last (2014–2023) decades of the study period. The overall conclusion is that the decadal differences largely follow changes shown in the trends. The larger amount of liquid precipitation over the north Atlantic sector is particularly striking. While the spatial pattern of trends in liquid precipitation (Fig. 10) is similar to the pattern of decadal differences shown in Fig. 11, the latter suggests more recent increases in liquid precipitation and decadal variability over land areas not captured in linear trends. Note in turn the large differences in snowfall over the Atlantic sector, locally 100 mm lower in the most recent decade, paired with more liquid precipitation.
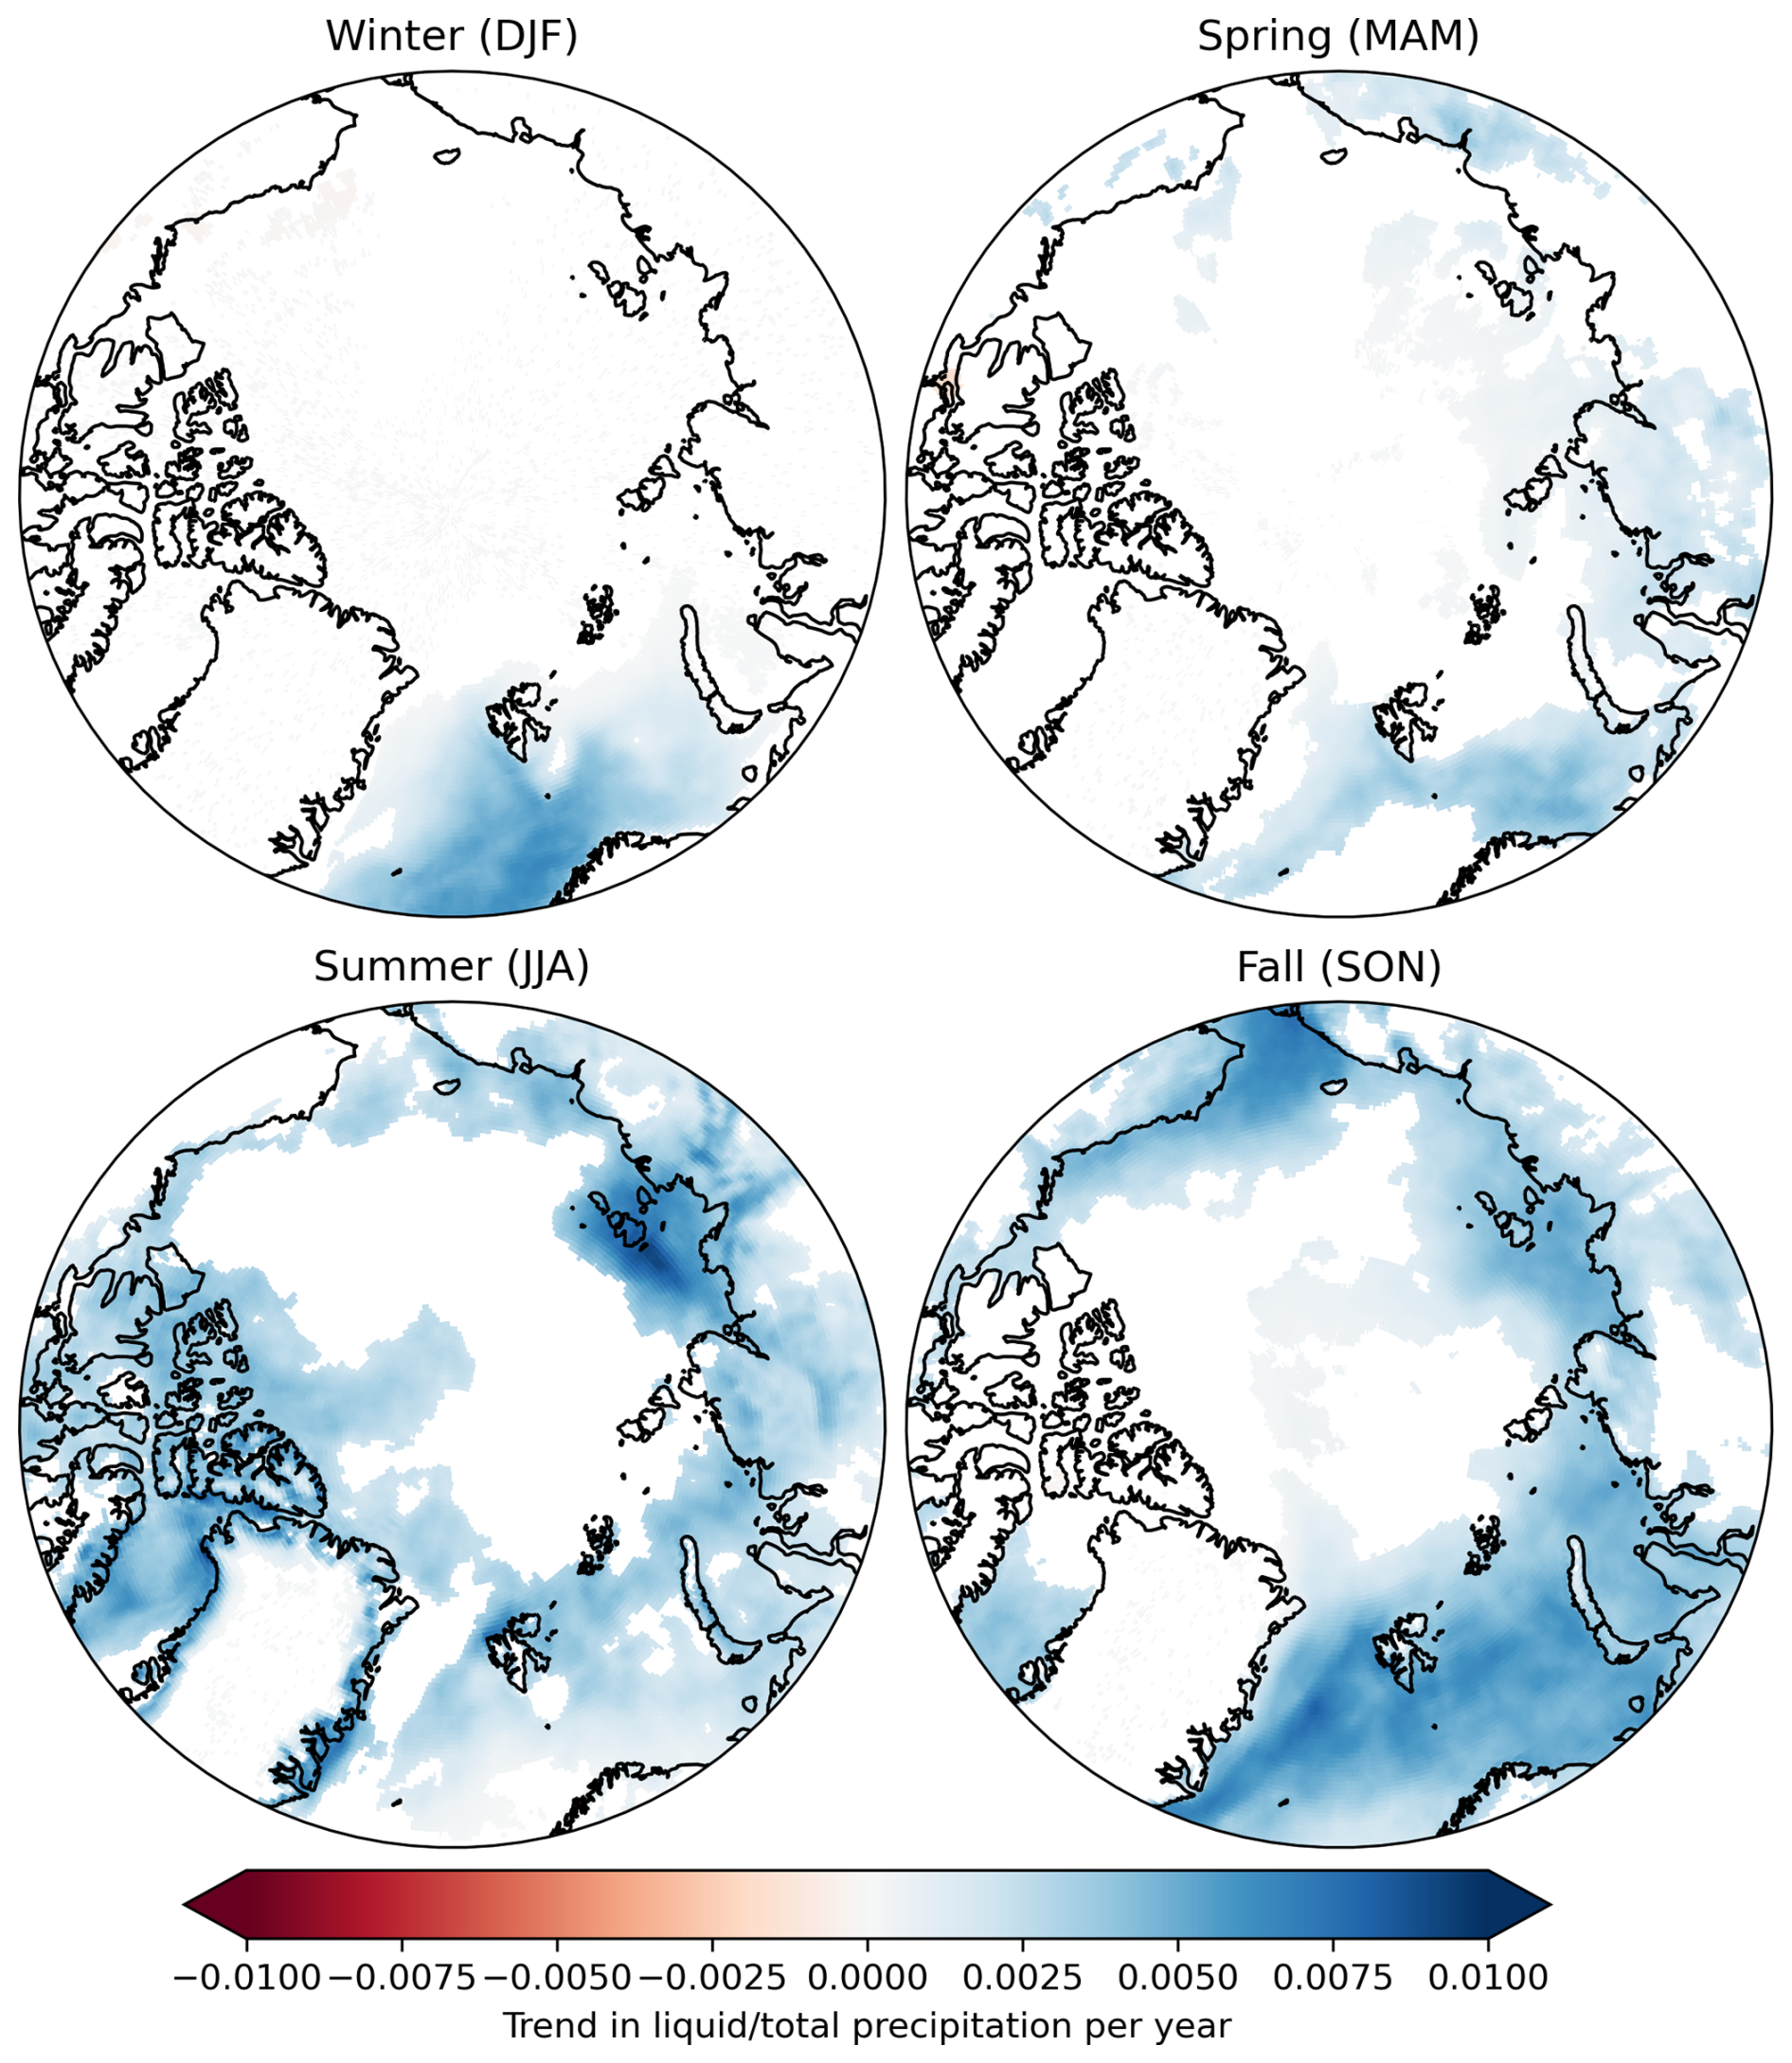
Figure 12Seasonal trends in liquid to total precipitation ratios (1979–2023) from ERA5. Only trends that are statistically significant at the 95 % confidence level are shown by colors.
4.2 Liquid to Total Precipitation Ratio
Seasonal trends in the liquid to total precipitation ratio follow in Fig. 12. Statistically significant positive trends are fairly widespread in summer and especially in autumn, but there are large areas over the Arctic Ocean where no significant trends are present in the summer season. Even in summer, trends over the Greenland Ice Sheet are essentially zero. Statistically significant positive trends in winter and spring are largely limited to the North Atlantic sector. Phrased differently, away from the Atlantic sector, it has yet to warm sufficiently to see a change in the ratio over much of the Arctic except during summer and autumn, and even in summer, ratios over large areas of the ocean are essentially unchanged. Winter precipitation has increased over the Atlantic sector, but then the increase in the liquid precipitation fraction dominates, yielding an upward trend in the winter liquid to total precipitation ratio.
What are the present-day seasonal and spatial patterns of precipitation partitioning (liquid versus snowfall) across the Arctic, and how have these patterns changed through the warming Arctic climate?
To address this question, it was first necessary to ask: Is ERA5 up to the task of providing sufficiently reliable estimates of precipitation and its phase? Prior validation studies, as well as the work presented here based on the ASOS and ICOADS climatologies, argue that the answer is a qualified yes. While uncertainty remains, ERA5 has demonstrated consistency with the ICOADS records and the ASOS records (the AROSS database) in capturing precipitation phase. The study by Edel et al. (2020), based on CloudSat data, provides further supporting evidence, at least in a qualitative sense, showing that on an annual basis, the frequency of solid precipitation is greater than 70 % over the Arctic Ocean, 95 % over Greenland, with mixed precipitation (50 % solid) over the North Atlantic. However, this study was limited to a four year period (January 2007 to December 2010) and CloudSat provides no coverage poleward of about 82° N.
The general agreement between data sources is important given that the Arctic's surface station network is sparse and insufficient for capturing spatial precipitation patterns (Thoman et al., 2023). Therefore, reanalysis data remain the best tool for evaluating large-scale precipitation patterns (including phase) and trends across the region. However, this must be viewed with the caveats that the available observations for validation either cover a different time period than the reanalyses or do not provide full spatial coverage. Time coincident data is wanted. While further analysis of the AROSS database is warranted, this data set unfortunately provides no coverage over the Arctic Ocean for which to assess either seasonal patterns or trends in precipitation partitioning. Similarly, while for the Arctic as a whole, both the gauge network and ERA5 show that precipitation in the Arctic is increasing, the gauge network is insufficient to make meaningful comparisons with the spatial patterns of ERA5 trends. Yet another issue to be aware of is the known warm bias in surface air temperatures over the sea ice cover in ERA5 (Tian et al., 2024), which, especially if affecting a deeper part of the atmosphere, could influence precipitation phase.
This said, analysis of the ERA5 data records over the period 1979–2023 reveals a complex picture of a seasonally varying and evolving hydrological regime. Over most of the study region, annual precipitation falls mainly as snow, the clear exception being the Atlantic sector where temperatures are fairly high, reflecting the ice-free conditions. During summer, roughly half of precipitation still falls as snow, surprisingly similar to snowfall fractions based on ICOADS records for 1950–1999 when the Arctic was cooler. Analysis of the ERA5 data shows an increase in annual precipitation, primarily in the Norwegian, Barents and Kara Seas. Reports that precipitation increases for the Arctic viewed as a whole, in line with climate model predictions, must be tempered by recognition of these strong regional expressions of change. At least some of these regional increases likely have a convective component linked to winter sea ice loss. Apart from the north Atlantic sector, the liquid-to-total precipitation ratio has appreciably increased across much of the Arctic only during summer. Increases outside of the northern North Atlantic sector in other seasons are much more limited.
With continuing warming, we can expect a more pronounced change in the precipitation ratios, which even in the absence of changing precipitation amounts raises the concerns about cascading effects of rain on snow events on Arctic ecology and the built environment. A key issue in this regard is that as the climate warms, the length of the snow-covered season will decrease, implying an increase in rain on bare ground. A next step is to make further use of the database compiled from the ASOS sites to provide comprehensive assessment of changes in rain on snow events.
The code used for data processing and plotting is available here: https://doi.org/10.5281/zenodo.19503278 (zcasty and Barrett, 2026).
The ERA5 data were obtained from the Copernicus Climate Data Store (CDS): https://cds.climate.copernicus.eu/ (last access: December 2024). The data from the ASOS database are available here: https://doi.org/10.18739/A2VT1GR83 (Barrett, 2024).
ZIC and MCS planned the campaign; ZIC, APB and ENC created the figures; ZIC, MCS, ENC, and APB analyzed the data; ZIC, MCS and ENC wrote the manuscript draft; ZIC, MCS, ENC, and APB reviewed and edited the manuscript.
The contact author has declared that none of the authors has any competing interests.
Publisher's note: Copernicus Publications remains neutral with regard to jurisdictional claims made in the text, published maps, institutional affiliations, or any other geographical representation in this paper. The authors bear the ultimate responsibility for providing appropriate place names. Views expressed in the text are those of the authors and do not necessarily reflect the views of the publisher.
The authors thank two anonymous reviewers for their valuable insights and suggestions.
This research has been supported by the Cooperative Institute for Research in Environmental Sciences (grant no. NSF NNA 1928230).
This paper was edited by Stephen Howell and reviewed by two anonymous referees.
Barrett, A.: Arctic Rain on Snow Dataset, 1931–2023, Arctic Data Center [data set], https://doi.org/10.18739/A2VT1GR83, 2024.
Barrett, A. P., Stroeve, J. C., and Serreze, M. C.: Arctic Ocean precipitation from atmospheric reanalyses and comparisons with North Pole drifting station records, J. Geophys. Res.-Oceans, 125, e2019JC015415, https://doi.org/10.1029/2019JC015415, 2020.
Bartsch, A.: Spring snowmelt and midwinter thaw and refreeze north of 60° N based on SeaWinds QuikSCAT 2000–2009, PANGAEA [data set], https://doi.org/10.1594/PANGAEA.834198, 2010a.
Bartsch, A.: Ten years of SeaWinds on QuikSCAT for snow applications, Remote Sens., 2, 1142–1156, https://doi.org/10.3390/rs2041142, 2010b.
Bartsch, A., Kumpula, T., Forbes, B. C., and Stammler, F.: Detection of snow surface thawing and refreezing in the Eurasian Arctic with QuikSCAT: implications for reindeer herding, Ecol. Appl., 20, 2346–2358, 2010.
Bromwich, D. H., Wilson, A. B., Bai, L., Liu, Z., Barlage, M., Shih, C.-F., Maldonado, S., Hines, K.M., Wang, S.-H., Woollen, J., Kuo, B., Lin, H.-C., Wee, T.-K., Serreze, M. C., and Walsh, J. E.: Arctic system reanalysis version 2, J. Climate, 29, 3537–3560, 2016.
Clark, M. P., Serreze, M. C., and Barry, R. G.: Characteristics of Arctic Ocean climate based on COADS data, 1980–1991, Geophys. Res. Lett., 23, 1953–1956, 1996.
Dou, T. F., Pan, S. F., Bintanja, R., and Xiao, C. D.: More frequent, intense, and extensive rainfall events in a strongly warming Arctic, Earth's Future, 10, e2021EF002378, https://doi.org/10.1029/2021EF002378, 2022.
Edel, L., Claud, C., Genthon, C., Palerme, C., Wood, N., L'Ecuyer, T., and Bromwich, D.: Arctic Snowfall from CloudSat Observations and Reanalyses, J. Climate, 33, 2093–2109, https://doi.org/10.1175/jcli-d-19-0105.1, 2020.
European Space Agency: Historic Greenland Ice Sheet rainfall unravelled, https://www.esa.int/Applications/Observing_the_Earth/FutureEO/Historic_Greenland_ice_sheet_rainfall_unravelled (last access: December 2024), 2021.
Forbes, B. C., Kumpula, T., Meschtyb, N., Laptander, R., Macias-Eauria, M., Zetterberg, P., Verdonen, M., Skarin, A., Kim, K.-Y., Boisvert, L. N., Stroeve, J. C., and Bartsch, A.: Sea ice, rain-on-snow and tundra reindeer nomadism in Arctic Russia, Biol. Lett., 12, https://doi.org/10.1098/rsbl.2016.0466, 2016.
Graham, R. M., Rinke, A., and Maturilli, M.: Evaluation of Arctic precipitation from global atmospheric reanalyses, J. Climate, 32, 6945–6963, https://doi.org/10.1175/JCLI-D-18-0643.1, 2019
Hermann, M., Papritz, L., and Wernli, H.: A Lagrangian analysis of the dynamical and thermodynamic drivers of large-scale Greenland melt events during 1979–2017, Weather Clim. Dynam., 1, 497–518, https://doi.org/10.5194/wcd-1-497-2020, 2020.
Hersbach, H., Bell, B., Berrisford, P., Hirahara, S., Horányi, A., Muñoz-Sabater, J., Nicolas, J., Peubey, C., Radu, R., Schepers, D., Simmons, A., Soci, C., Abdalla, S., Abellan, X., Balsamo, G., Bechtold, P., Biavati, G., Bidlot, J., Bonavita, M., De Chiara, G., Dahlgren, P., Dee, D., Diamantakis, M., Dragani, R., Flemming, J., Forbes, R., Fuentes, M., Geer, A., Haimberger, L., Healy, S., Hogan, R. J., Hólm, E., Janisková, M., Keeley, S., Laloyaux, P., Lopez, P., Lupu, C., Radnoti, G., de Rosnay, P., Rozum, I., Vamborg, F., Villaume, S., and Thépaut, J.-N.: The ERA5 global reanalysis, Q. J. Roy. Meteor. Soc., 146, 1999–2049, https://doi.org/10.1002/qj.3803, 2020.
Lien, V. S., Schlichtholz, P., Skagseth, Ø., and Vikebø, F. B.: Wind-driven Atlantic water flow as a direct mode for reduced Barents Sea ice cover, J. Climate, 30, 803–812, https://doi.org/10.1175/JCLI-D-16-0025.1, 2017.
Loeb, N. A., Crawford, A., Stroeve, J. C., and Hanesiak, J.: Extreme precipitation in the eastern Canadian Arctic and Greenland: An evaluation of atmospheric reanalyses, Front. Environ. Sci., 10, https://doi.org/10.3389/fenvs.2022.866929, 2022.
McCrystall, M. R., Stroeve, J. C., Serreze, M., Forbes, B. C., and Screen, J. A.: New climate models reveal faster and larger increases in Arctic precipitation than previously projected, Nat. Commun., 12, 6765, https://doi.org/10.1038/s41467-021-27031-y, 2021.
Moon, T. A., Druckenmiller, M. L., and Thoman, R. L. (Eds.): Arctic Report Card 2024, https://doi.org/10.25923/b7c7-6431, 2024.
Ólafsson, H. and Økland, E.: Precipitation from convective boundary layers in Arctic air masses, Tellus A, 46, 4–13, https://doi.org/10.3402/tellusa.v46i1.15422, 1994.
Rabier, F.: Overview of global data assimilation developments in numerical weather-prediction centres, Q. J. Roy. Meteor. Soc., 131, 3215–3233, https://doi.org/10.1256/qj.05.129, 2005.
Rantanen, M., Karpechko, A. Y., Lipponen, A., Nordling, K., Hyvärinen, O., Ruosteenoja, K., Vihma, T., and Laaksonen, A.: The Arctic has warmed nearly four times faster than the globe since 1979, Commun. Earth Environ., 3, 168, https://doi.org/10.1038/s43247-022-00498-3, 2022.
Serreze, M. C. and Barrett, A. P.: The summer cyclone maximum over the central Arctic Ocean, J. Climate, 21, 1048–1065, https://doi.org/10.1175/2007JCLI1810.1, 2008.
Serreze, M. C. and Barry, R. G.: The Arctic Climate System, 2nd edn., Cambridge University Press, edited by: Serreze, M. C. and Barry, R. G., https://doi.org/10.1017/CBO9781139583817, 2014.
Serreze, M. C., Box, J. E., Barry, R. G., and Walsh, J. E.: Characteristics of Arctic synoptic activity, 1952–1989, Met. Atmos. Phys., 1, 147–164, 1993.
Serreze, M. C., Maslanik, J. A., and Key, J. R.: Atmospheric and Sea Ice Characteristics of the Arctic Ocean and the SHEBA Field Region in the Beaufort Sea, NSIDC Special Report-4, https://nsidc.org/sites/default/files/nsidc_special_report_4.pdf (last access: October 2024), 1996.
Serreze, M. C., Carse, F., Barry, R. G., and Rogers, J. C.: Icelandic Low cyclone activity: Climatological features, linkages with the NAO, and relationships with recent changes in the Northern Hemisphere circulation, J. Climate, 10, 453–464, 1997.
Serreze, M. C., Gustavson, J., Barrett, A. P., Druckenmiller, M. L., Fox, S., Voveris, J., Stroeve, J., Sheffield, B., Forbes, B. C., Rasmus, S., Laptander, R., Brook, M., Brubaker, M., Temte, J., McCrystall, M. R., and Bartsch, A.: Arctic rain-on-snow events: Bridging observations to understand environmental and livelihood impacts, Environ. Res. Lett., 16, https://doi.org/10.1088/1748-9326/ac269b, 2021.
Serreze, M. C., Voveris, J., Barrett, A. P., Fox, S., Blanken, P. D., and Crawford, A.: Characteristics of extreme daily precipitation events over the Canadian Arctic, Int. J. Climatol., 42, 10353–10372, https://doi.org/10.1002/joc.7907, 2022.
Simmons, A. J., Hersbach, H., Dee, D. P., Berrisford, P., and Poli, P.: Low-frequency variability and trends in surface air temperature and precipitation analyses of the ECMWF ERA5 reanalysis, Q. J. Roy. Meteor. Soc., 147, 3076–3100, https://doi.org/10.1002/qj.4121, 2021.
Tedesco, M. and Fettweis, X.: Unprecedented atmospheric conditions (1948–2019) drive the 2019 exceptional melting season over the Greenland ice sheet, The Cryosphere, 14, 1209–1223, https://doi.org/10.5194/tc-14-1209-2020, 2020.
The Guardian: Temperatures at North Pole 20 °C above average and beyond ice melting point, The Guardian, https://www.theguardian.com/environment/2025/feb/04/ temperatures-at-north-pole-20c-above-average-and-beyond-ice-melting-point (last access: December 2024), 2025.
Thoman, R. L., Moon, T. A., and Drukenmiller, M. L. (Eds.): Arctic report card 2023, https://doi.org/10.25923/5vfa-k694, 2023.
Tian, T., Yang, S., Høyer, J. L., Nielsen-Englyst, P., and Singha, S.: Cooler Arctic surface temperatures simulated by climate models are closer to satellite-based data than the ERA5 reanalysis, Commun. Earth Environ., 5, https://doi.org/10.1038/s43247-024-01276-z, 2024.
Tsukernik, M., Kindig, D. N., and Serreze, M. C.: Characteristics of winter cyclone activity in the northern North Atlantic: Insights from observations and regional modeling, J. Geophys. Res., 112, D03101, https://doi.org/10.1029/2006JD007184, 2007.
Voveris, J. and Serreze, M.: A tale of two events: Arctic rain-on-snow meteorological drivers, Ann. Glaciol., 64, 194–205, https://doi.org/10.1017/aog.2023.25, 2023.
Walsh, J. E., Bigalke, S., McAfee, S. A., Lader, R., Serreze, M. C., and Ballinger, T. J.: Precipitation, in: NOAA Arctic Report Card 2023, https://doi.org/10.25923/hcm7-az41, 2023.
Xiong, W., Tang, G., Wang, T., Ma, Z., and Wan, W.: Evaluation of IMERG and ERA5 precipitation-phase partitioning on the global scale, Water, 14, 1122, https://doi.org/10.3390/w14071122, 2022.
zcasty and Barrett, A.: nsidc/Precip.-Partitioning: Cast Precipitation Partitioing (v0.1.0-alpha), Zenodo [software], https://doi.org/10.5281/zenodo.19503278, 2026.
Zhao, T., Fu, C., Ke, Z., and Guo, W.: Global atmosphere reanalysis datasets: Current status and recent advances, Adv. Earth Sci., 25, 241, 2010.