the Creative Commons Attribution 4.0 License.
the Creative Commons Attribution 4.0 License.
 | 13 Apr 2026
A thinner-than-present West Antarctic Ice Sheet in the southern Weddell Sea Embayment during the Holocene
Réka-H. Fülöp
Rachel K. Smedley
Thomas Lees
Stephan Trabucatti
Derek Fabel
Maria Miguens-Rodriguez
Andrew M. Smith
Grant V. Boeckmann
Making accurate measurements and predictions of the West Antarctic Ice Sheet's (WAIS) contribution to present and future sea-level rise fundamentally depends on knowing its trajectory over the last few thousand years. We present new in situ 14C concentrations from subglacial bedrock cores collected from the southern Weddell Sea sector of the WAIS. Critically, these concentrations are above levels that can be produced under present-day ice thicknesses at the core sites. The cosmogenic nuclide inventories provide clear evidence for the ice sheet being thinner-than present at some point during the Holocene following initial thinning from its Last Glacial Maximum configuration. Forward modelling of nuclide concentrations indicates that our results are best explained by ice-surface lowering of at least 20 m. This period of thinner ice persisted for 300–3800 years and occurred after 6–4 ka. We suggest that thinning at our core sites is most likely to reflect a regional, dynamic response to grounding-line retreat rather than a localised change in ice-surface elevation. Our data are the first direct geological evidence for a thinner-than-present WAIS in the Weddell Sea sector and are consistent with Holocene retreat that culminated inboard of present-day limits. Glacio-isostatic adjustment has been inferred as a driving mechanism, causing re-grounding of floating ice and increased buttressing allowing the grounding line to stabilise and readvance. These data allow dynamic retreat-readvance behaviour of this nature to be tested in ice-sheet models, improving predictions of future sea-level rise in this critical sector of West Antarctica.
- Article
(11990 KB) - Full-text XML
-
Supplement
(15782 KB) - BibTeX
- EndNote


Constraining the recent (i.e. Holocene) trajectory of the West Antarctic Ice Sheet (WAIS) is critical for making accurate measurements of current ice loss and for making predictions of its future evolution. In the first case, glacio-isostatic adjustment (GIA) is a key correction for current estimates of mass loss by satellite gravimetry (e.g. Caron and Ivins, 2020). Depending on the recent ice-sheet history the magnitude and/or sign of the GIA signal (i.e. uplift vs. subsidence) can be different (Bradley et al., 2015; Gomez et al., 2018; King et al., 2022). With sparse observations recent ice-loading histories are required for the GIA models that are used to correct satellite gravimetric estimates of current ice mass loss. In the second case numerical ice-sheet models used to make predictions of future sea-level change are tested (and tuned) against their ability to accurately reproduce known scenarios of past ice-sheet change (DeConto and Pollard, 2016; Albrecht et al., 2020; Pittard et al., 2022).
There is increasing evidence that parts of the WAIS retreated inboard of their pre-industrial limits before readvancing to these limits in the mid-late Holocene (for a review see Johnson et al., 2022; Jones et al., 2022). Direct geological evidence for retreat-readvance, in the form of measurable amounts of radiocarbon in subglacial sediments and inventories of cosmogenic nuclides in subglacial bedrock (Fig. 1), has been observed in both the Ross and Amundsen Sea sectors of the WAIS (Kingslake et al., 2018; Venturelli et al., 2023; Balco et al., 2023). Several numerical models also retrodict major retreat-readvance in the southern Weddell Sea Embayment (WSE) of West Antarctica (Kingslake et al., 2018; Albrecht et al., 2020 Pittard et al., 2022) where ice is only lightly grounded over the deep Robin Subglacial Basin (Ross et al., 2012). Indirect evidence, such as low present-day uplift rates (Bradley et al., 2015) and (sub-) surface morphology of ice rises (Siegert et al., 2013; Kingslake et al., 2018; Brisbourne et al., 2019), is consistent with retreat-readvance but could also be explained by major flow re-organisation without grounding line retreat (Siegert et al., 2019). Consequently, the Holocene trajectory of the WAIS in the WSE is yet to be unequivocally constrained. This is of critical importance as the Weddell Sea is a key sector for both the WAIS and EAIS, draining ∼20 % of their total grounded ice area with a SLE of >12 m (Rignot et al., 2019), and a key locale for global oceanic circulation with up to ∼50 % of Antarctic Bottom Water formation occurring there (Zhou et al., 2023).
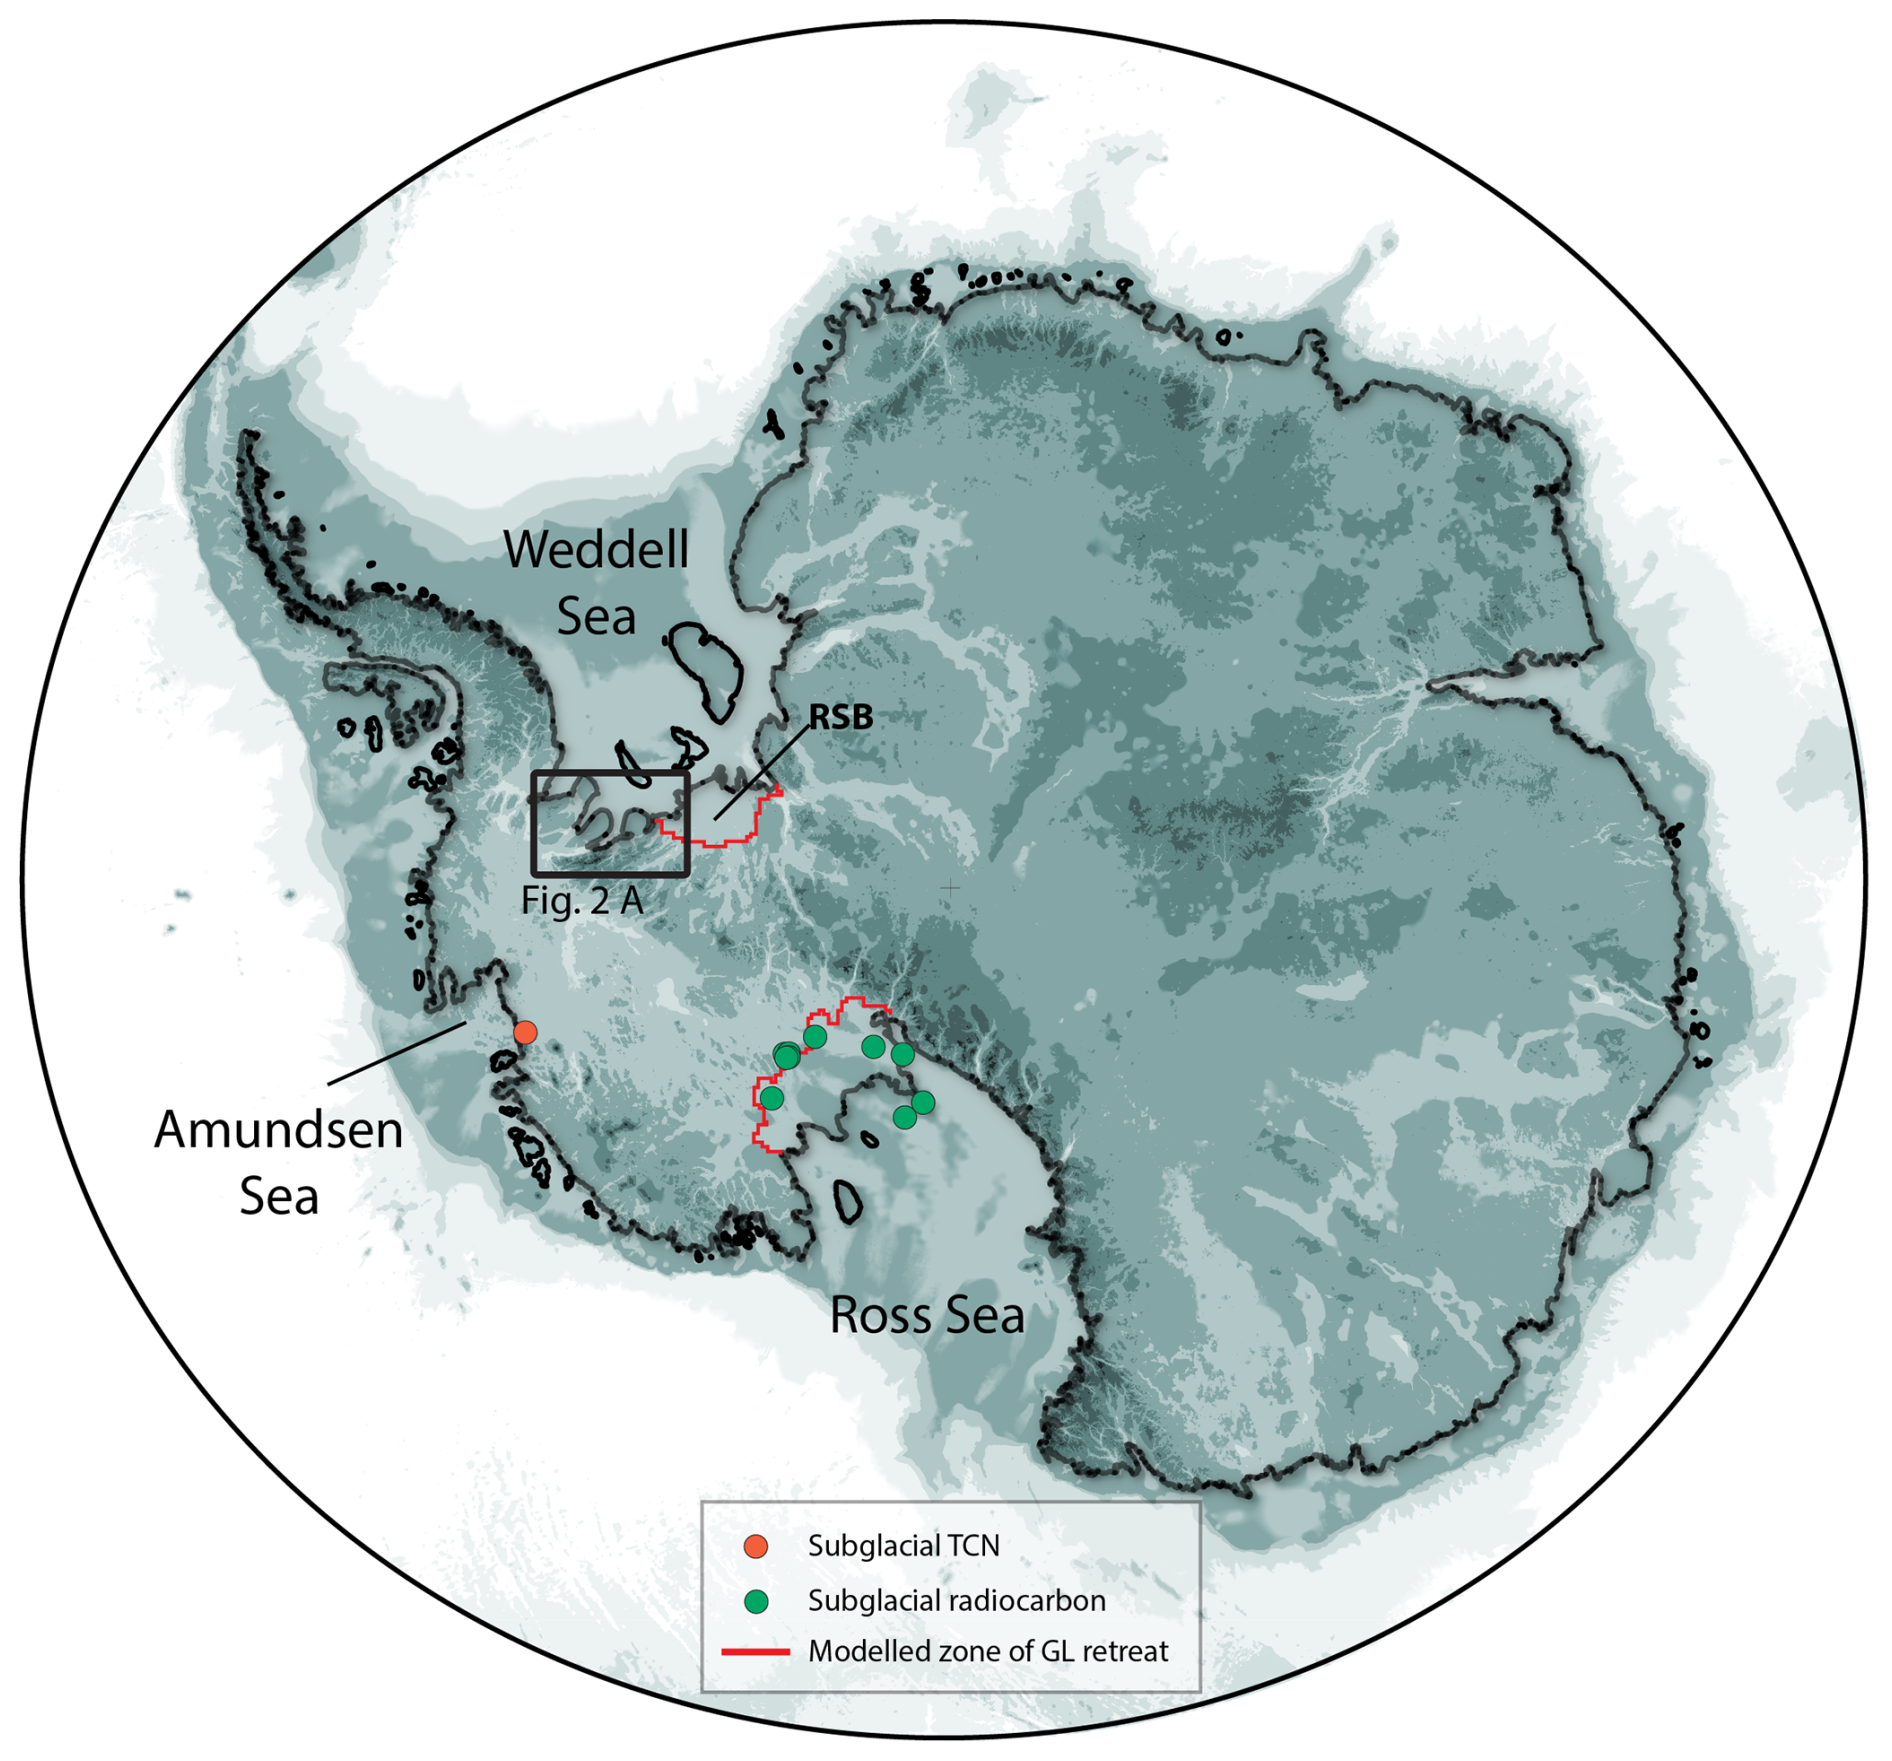
Figure 1Overview map of Antarctica showing locations where geological evidence of Holoence retreat inboard of the present day grounding line has been recovered. Modelled zones of retreat in the Ross and Weddell Sea embayments are taken from Kingslake et al. (2018), other models show similar patterns. Black box shows location of Fig. 2a. RSB: Robin subglacial basin. Base image is BEDMAP3 subglacial topography (Pritchard et al., 2025).
Here we present the first analyses from subglacial bedrock cores collected from the southern WSE to directly test for Holocene retreat-readvance of the WAIS in this sector. The basic premise (cf. Balco et al., 2023) of our approach is that dynamic thinning associated with grounding line retreat would expose bedrock that is presently buried by several tens of metres of glacier ice, at locations upstream from the present-day grounding line. Any Holocene thinning would result in significantly increased production rates of cosmogenic nuclides and potential exposure of bedrock surfaces to sunlight. In situ 14C (produced in rocks) has a half-life of 5730 years which means that any 14C present at the onset of the Last Glacial Maximum (LGM) would have been removed by radioactive decay during complete shielding by a thick LGM ice sheet. Thus, measurable 14C in subglacial bedrock requires production to have occurred following thinning of the LGM ice sheet (i.e. during the Holocene). Complementing this, luminescence measurements in rock surfaces are sensitive to exposure to light (Sohbati et al., 2012), thus measurements can constrain ice thinning beyond present. We present results of in situ 14C and luminescence analyses from four bedrock cores collected during the 2022–2023 Austral summer in the Enterprise Hills, a constituent massif of the Heritage Range within the Ellsworth Mountains, southern Weddell Sea Embayment.
The Enterprise Hills are located within the Heritage Range, ∼30 km from the present-day grounding line at Hercules Inlet (Fig. 2a and b). While further rock outcrops closer to the grounding line, available satellite imagery suggests extensive snow/firn at these sites which prevents deployment of the Winkie Drill as modified at Durham University (cf. Boeckmann et al., 2021; Braddock et al., 2025). The Enterprise Hills delimit the northern flank of Horseshoe Valley within which ice flows in a general north-westerly direction towards the grounding line. Several glaciers breach the northern bounding escarpment of Horseshoe Valley and merge with extensive areas of blue ice found on the leeward side of the Enterprise Hills (Fig. 2b). At the mouth of one such glacier (Plummer Glacier) is a small nunatak, informally named Plummer Nunatak, that reaches ∼60 m above present-day ice. Plummer Nunatak is flanked by a small outlier (∼10 m high) on its northern side. A further ∼250 m from this outlier is a small patch of exposed bedrock (Fig. 2c). This outcrop (informally referred to as Patch Rock) is surrounded by a small snow field that, where probed was always <2 m thick and directly/unconformably overlies blue ice (i.e. there is no snow-firn-ice transition). The Enterprise Hills are composed of quartzose sandstone (sometimes referred to as quartzites) of the Crashsite Formation (Spörli, 1992) and thus contain quartz suitable for cosmogenic nuclide analyses.
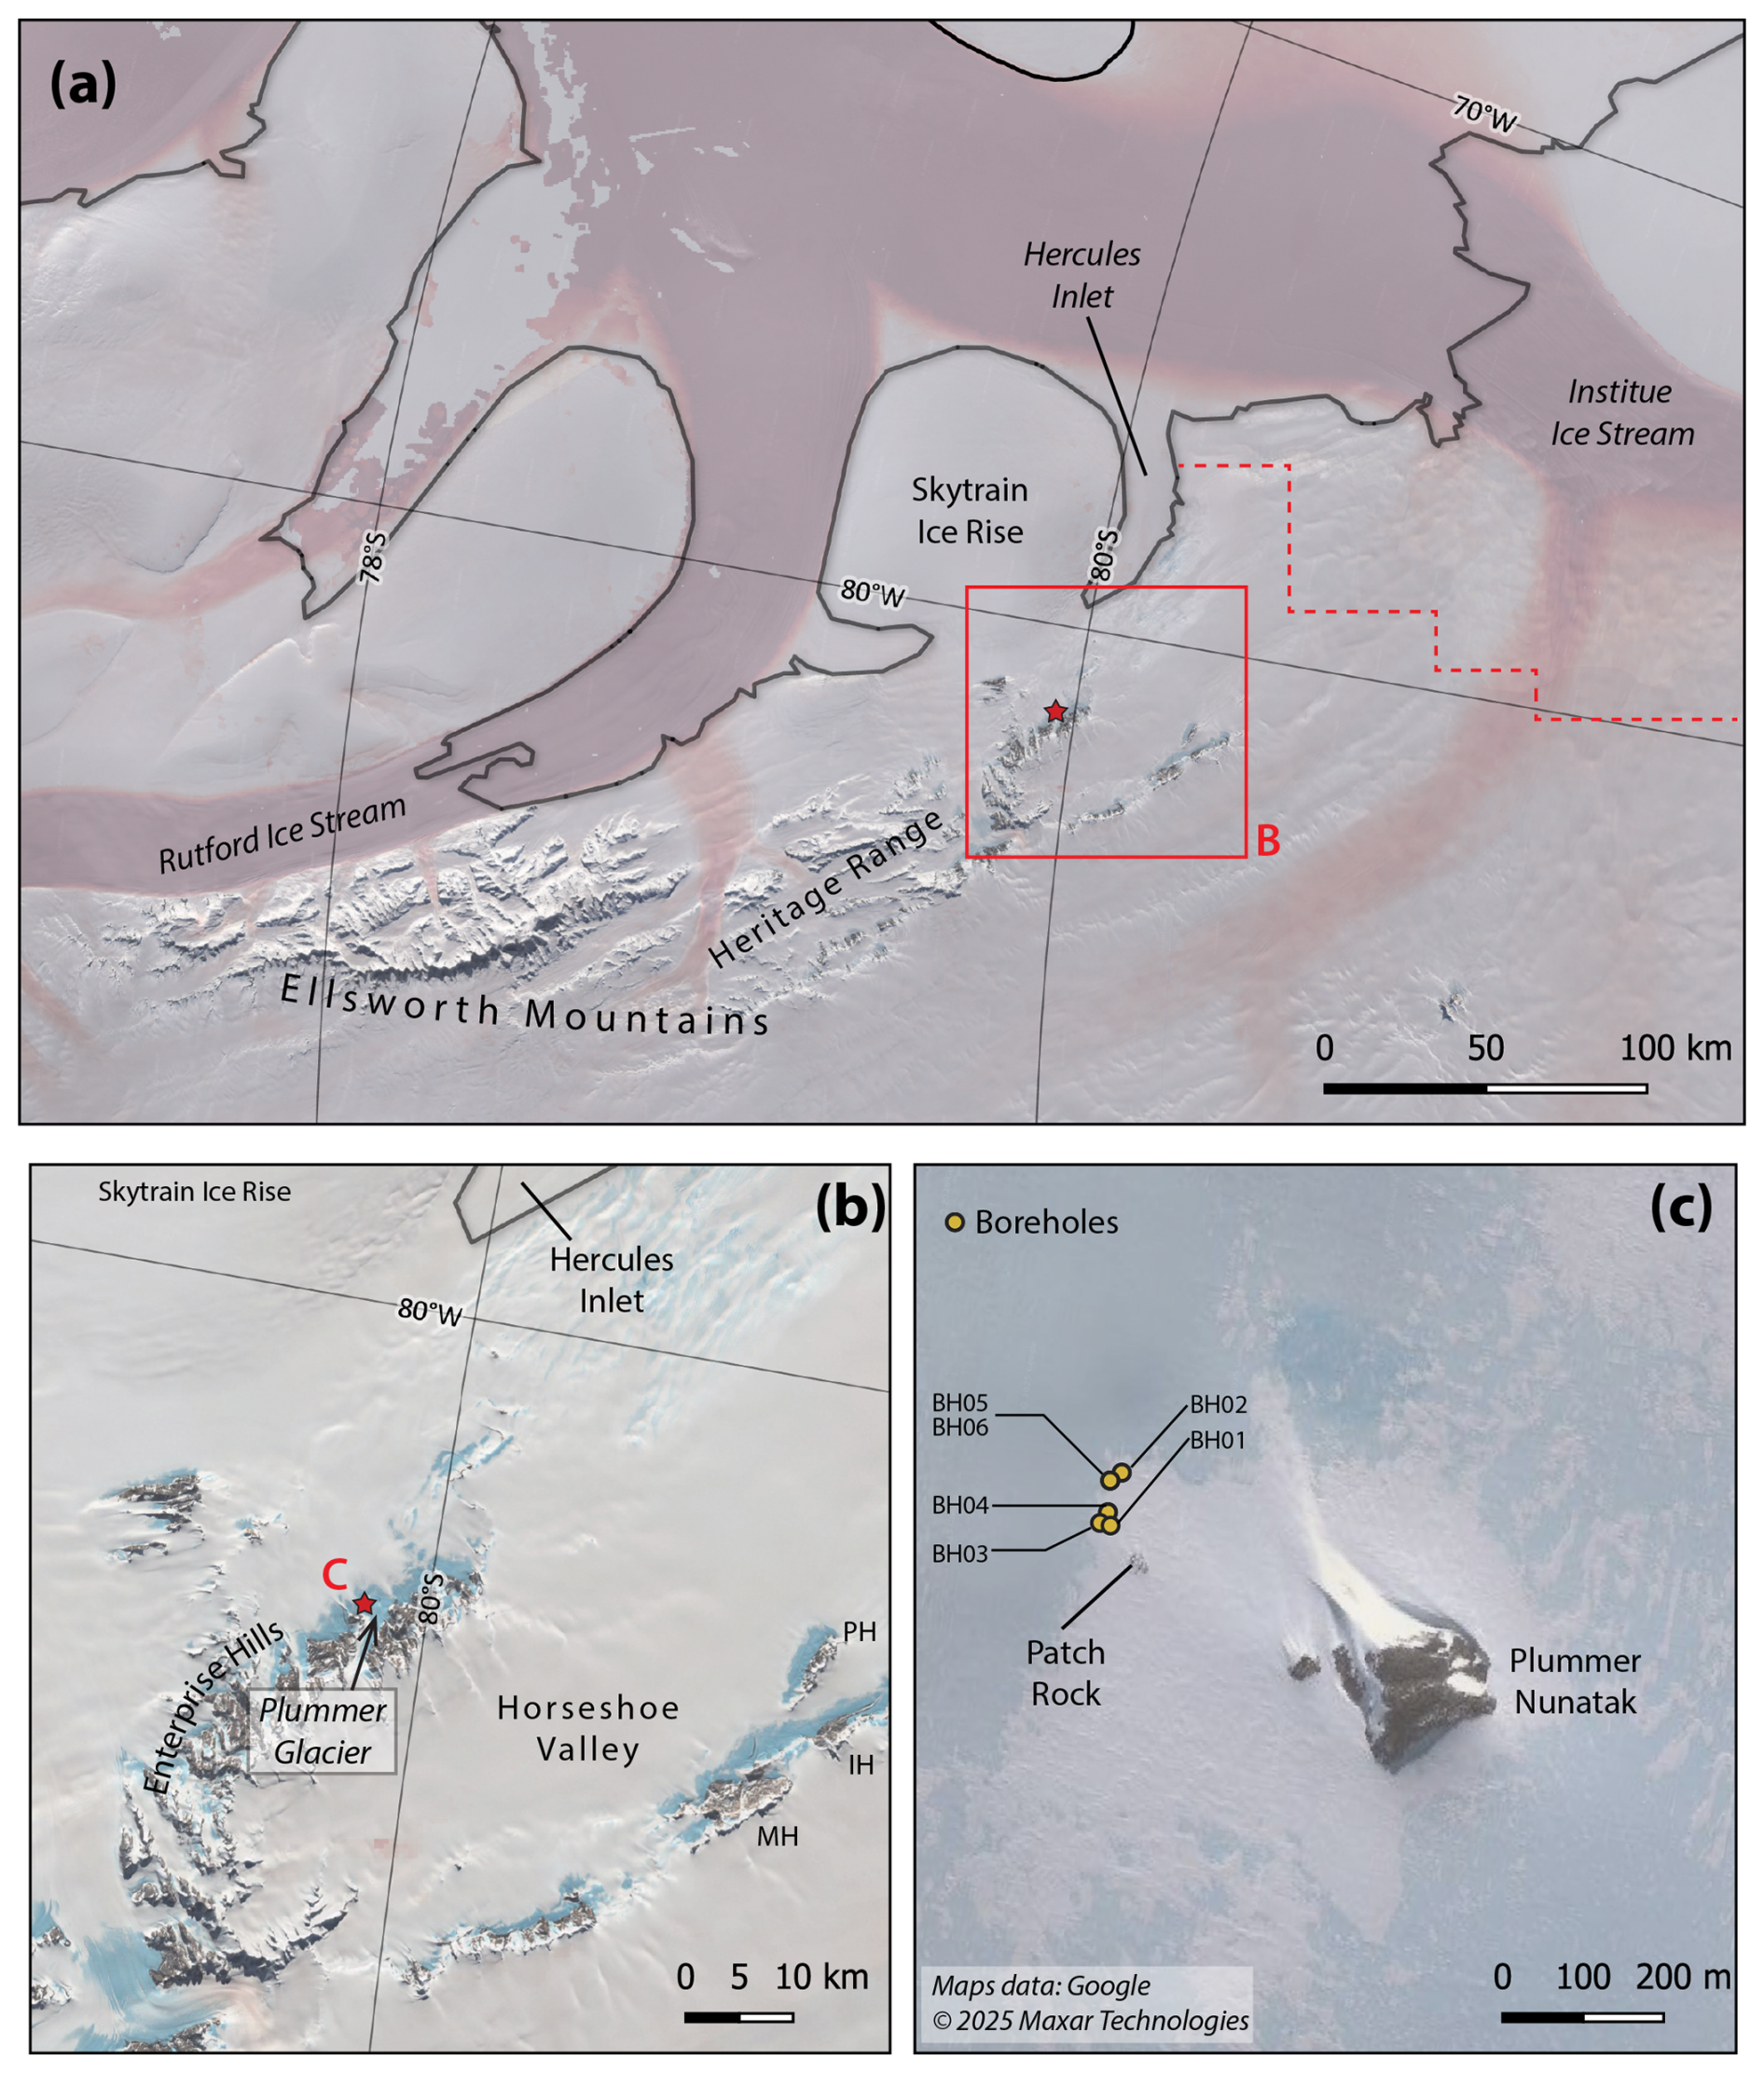
Figure 2(a) Map of the southern WSE showing major ice streams and geographical features mentioned in the text. The dashed line is zone of modelled retreat (Kingslake et al., 2018). Red star is location of our drill site. (b) Location map of Horseshoe Valley and Enterprise Hills. Location of Plummer glacier is shown. Red star is location of our drill site. Hills where cosmogenic nuclide data evidences post LGM thinning. (c) Google Earth image (Maps data © Google, © 2025 Maxar Technologies) of Plummer Nunatak. Patch Rock is visible and locations of boreholes shown. Figure generated in Quantarctica version 3 (Matsuoka et al., 2021).
Following the LGM the WAIS in the region of the southern Heritage Range thinned rapidly by ca. 400 m during the mid-Holocene with ice reaching present day elevations by ca. 6–4 ka as evidenced by exposure age data from the Marble, Patriot, and Independence Hills (Bentley et al., 2010; Hein et al., 2016). Additional evidence from an ice core at Skytrain Ice Rise also suggests rapid surface lowering of ca. 450 m at 8 ka (Griemann et al., 2024). Given the consistency between these records, it seems reasonable to infer a similar and consistent ice-sheet history across the Heritage Range, including at our site in the Enterprise Hills. Specifically, this history is inferred to be a significantly (ca. 400 m) thicker ice sheet at the LGM which subsequently thinned rapidly during the Holocene to reach present day ice levels by ca. 6–4 ka. The two alternate scenarios for the subsequent ice history are (1) ice remained at that level for the remainder of the Holocene, or (2) ice thinned below present post 6–4 ka (cf. Johnson et al., 2022; Jones et al., 2022; Balco et al., 2023).
3.1 Subglacial bedrock sampling
To aid site selection we used a PulseEkko Pro Ground Penetrating Radar (GPR) system equipped with 100 MHz antennas, arranged in a perpendicular broadside configuration. The antennas, transmitter, and receiver were attached to a plastic sledge and hand-towed across the survey area at . Due to equipment failure, we could not co-record locational information, so survey lines were marked out by flags at 25 m intervals to allow the data to be rubber-banded in post-processing (see Supplement). Following initial survey immediately prior to commencing drilling activities, we identified suitably shallow bedrock extending north from a small exposure of bedrock close to the main outcrop of Plummer Nunatak (Fig. 3). The ridge crest maintained a consistent depth beneath the ice surface (ca. 7–10 m) before it passed below a steep ramp of blue ice. As a result, and to obtain cores from a range of depths, we decided to drill at two locations offset from the main ridge crest (BH02 and BH03). This introduced additional uncertainty in our estimates of ice depths due to off-nadir reflectors and restricted time for post-processing. That said, as the depths involved were comfortably within range of the Winkie Drill this was not considered to be a critical issue.
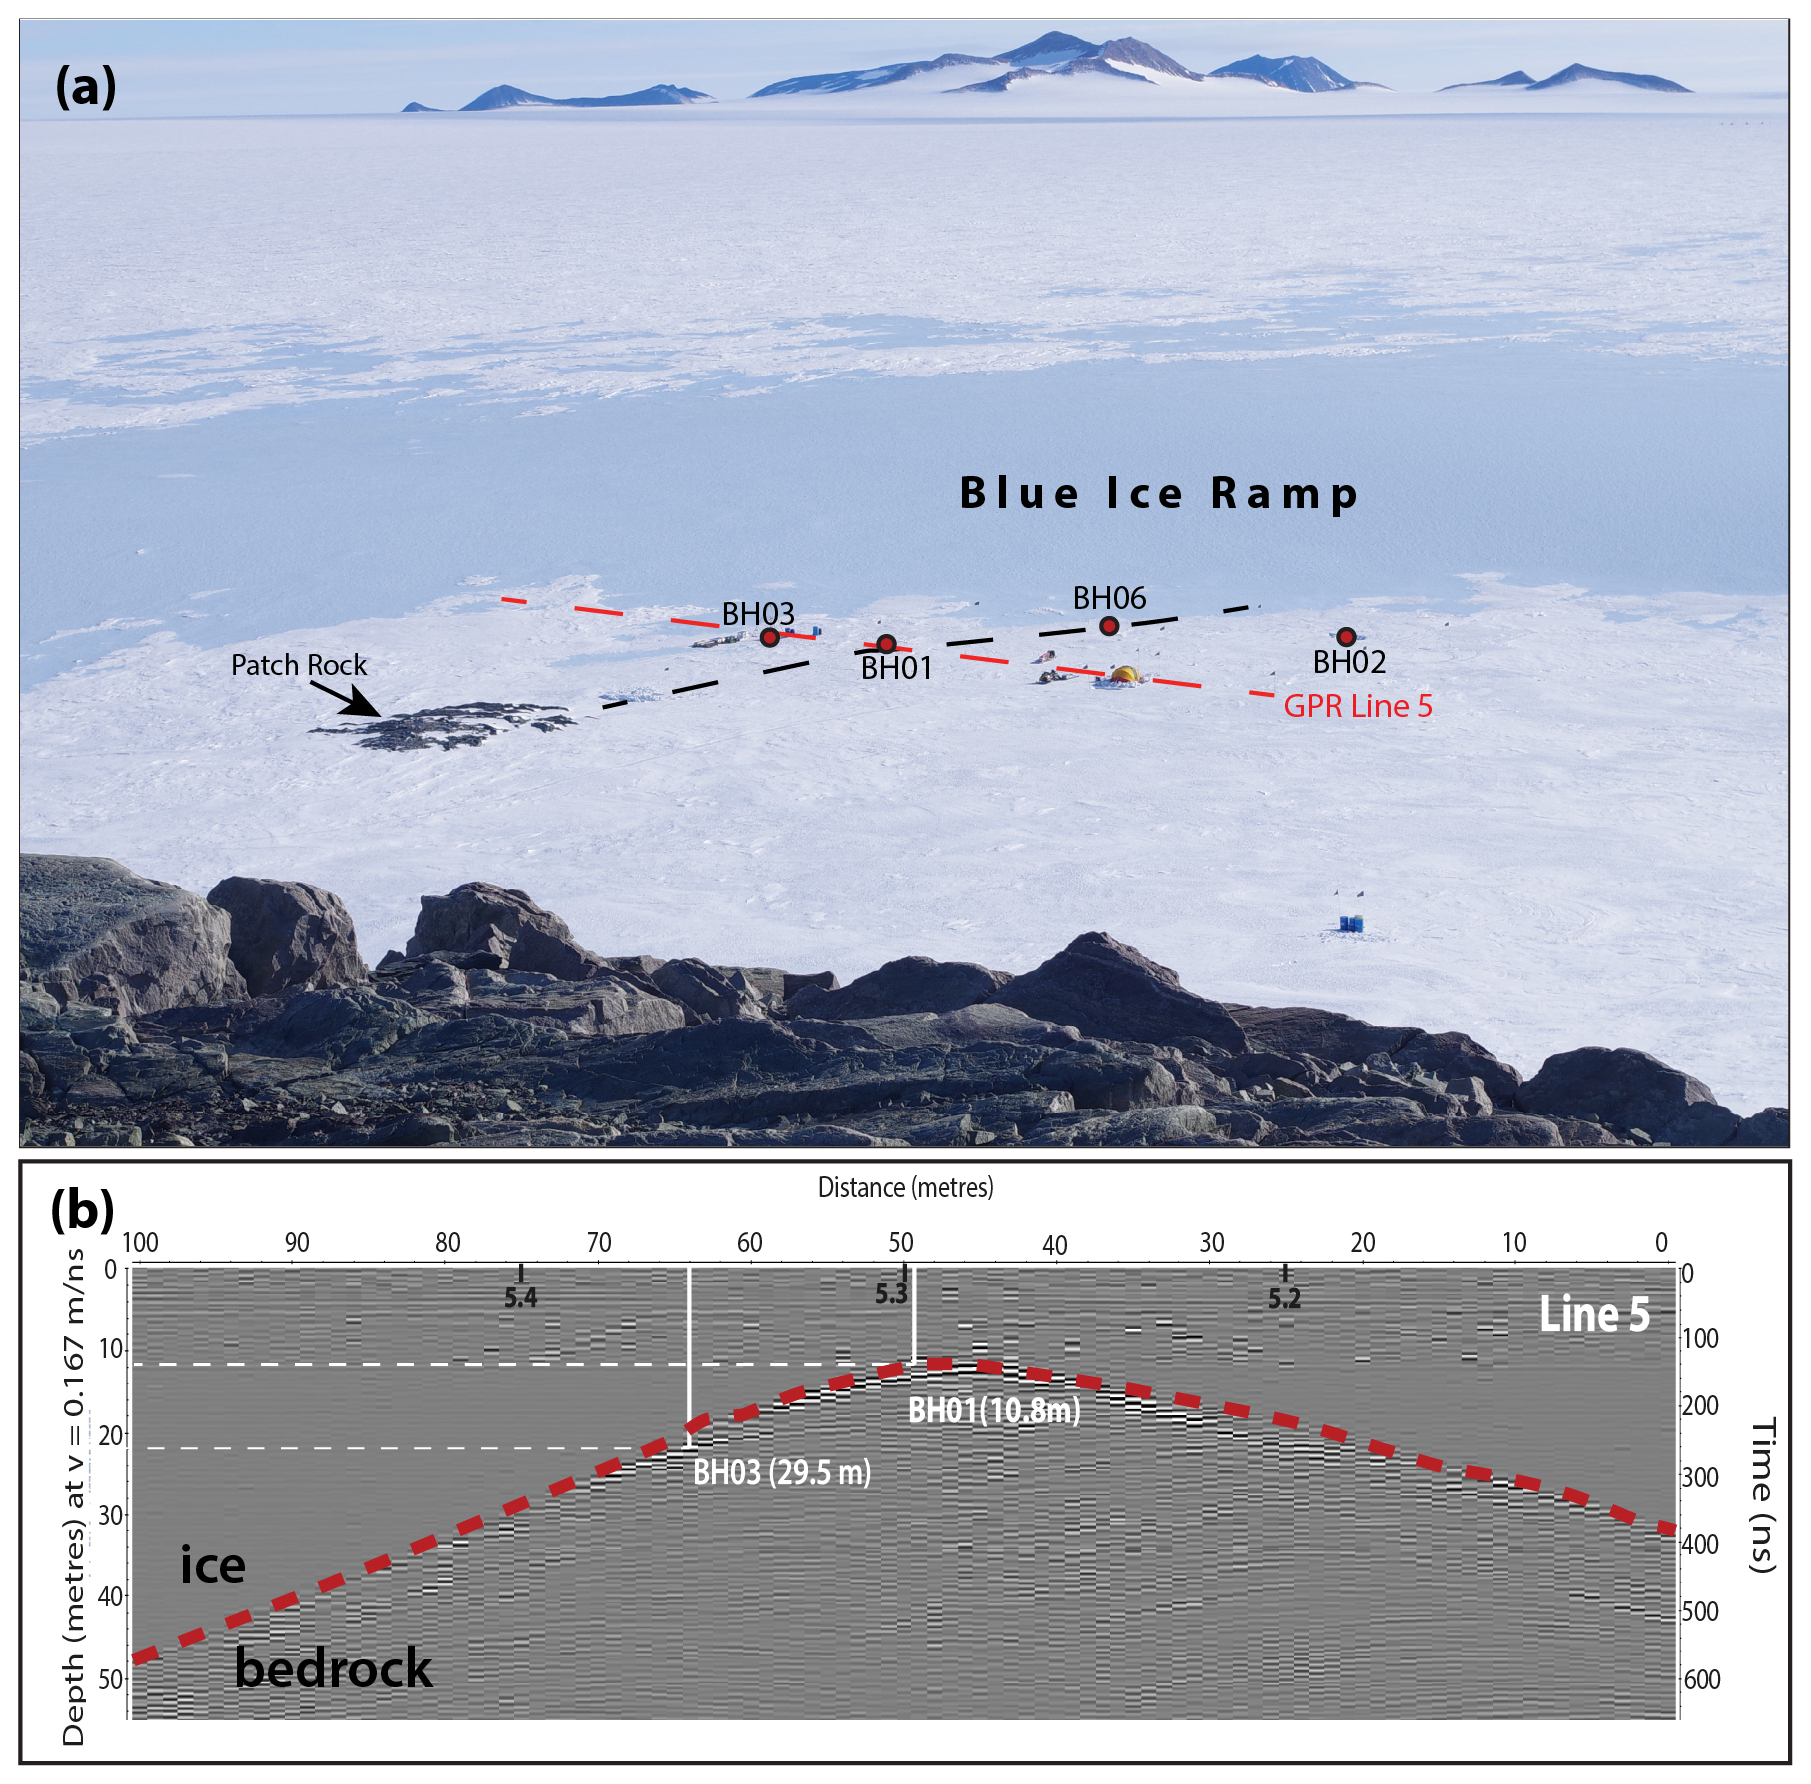
Figure 3(a) Patch Rock viewed from the top of Plummer Nunatak. The locations of the bedrock cores are shown. The black dashed line denotes the approximate trace of the subglacial ridge as surveyed before it passes underneath the blue ice ramp. Vertical relief of the ramp is ca. 10 m. GPR Line 5 is shown as a red dashed line in (a). (b) Interpreted radargram of GPR Line 5 showing locations of cores BH01 and BH03 along with measured depths to bedrock (n.b. for BH03 this is greater than depth extrapolated from two-way-travel time). The numbers 5.2 etc. denote locations of flags used as fiducial markers. GPR Lines 1–4 were located at 10 m intervals in increasing proximity to Patch Rock (see Supplement).
We used a modified Winkie Drill to collect subglacial bedrock samples from depths up to 29.5 m below present-day ice levels. Our drill set-up is similar to the US Ice Drilling Program Winkie Drill deployed to the Ohio Range in 2016/2017 (Boeckmann et al., 2021; Braddock et al., 2025) being powered by a 2-stroke internal combustion engine rather than an electric powerhead. As all of our boreholes were drilled directly into blue ice we used modified Kovacs ice augers attached to the Winkie Drill transmission to make our access holes. The augers performed well at depths up to 29.5 m, clearing>95 % of chippings from the boreholes. Unlike some previous drilling campaigns we did not encounter any sediment-laden ice at the base of our boreholes (cf. Braddock et al., 2025). We attribute this to some combination of persistent cold-based conditions in the blue ice area (i.e., ice thickness during the LGM was not sufficient to produce erosive warm-based ice) and the nature of the quartzite bedrock which is highly cemented and thus unlikely to produce fine grained weathering products. Once bedrock was reached, we replaced the augers with an AW34 drill rod string and cored bedrock using an IAWS core barrel using D60 drill fluid in a forward fluid circulation configuration. As all our boreholes were created directly into blue ice there was no requirement to case the hole. We would also note that working in a blue ice area almost entirely negates hazards from unidentified crevasses.
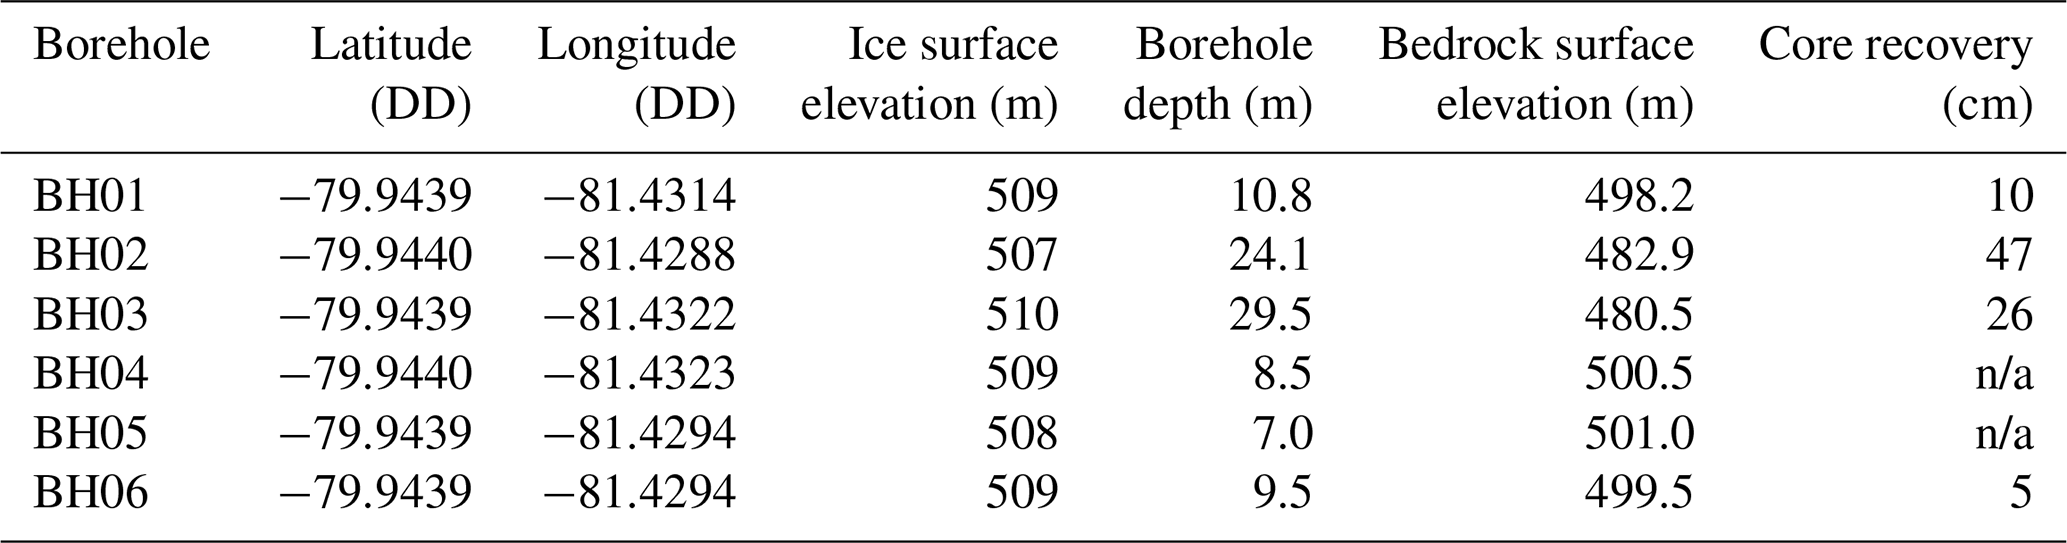
In a total of 11 d of drilling activity we drilled six access holes to depths of 7.0–29.5 m below present-day ice (Table 1). We successfully recovered bedrock cores from four of these boreholes, BH01, BH02, BH03, and BH06 (Table 1 and Fig. S2 in the Supplement). All cores were composed of medium-fine grained quartz arenites of the Crashsite formation. In BH04 we were unable to establish fluid circulation, presumably due to fluid escaping in through a fracture in the bedrock. At BH05 we hit bedrock at an unexpectedly shallow depth (7 m) and decided against sampling. At BH01 we recovered 10 cm of bedrock in our first core run but during the second core run the core barrel became irretrievably stuck. This was due to inefficient clearance of chippings following premature cessation of fluid circulation (pack off).
Table 1Borehole locations, elevations, and core recovery. n/a –not applicable
3.2 Luminescence measurements of BH01
BH01 was recovered in the dark to facilitate analysis using rock surface luminescence (Sohbati et al., 2011). The sample was prepared at the University of Liverpool luminescence laboratory under subdued-lighting conditions to prevent sunlight contamination of the luminescence signal. Due to the irregular core-top morphology of BH01, only a single luminescence-sample core could be drilled in the luminescence laboratory (i.e. a sub-sample of the larger core collected by the Winkie Drill). This subsample was sliced to a thickness of ∼0.7 mm and slices mounted in stainless steel cups for luminescence measurements. In hand specimen our samples appeared to be dominated by quartz thus luminescence measurements followed standard protocols employed at the University of Liverpool luminescence laboratory utilising the blue signals of quartz detected in UV wavelengths (see Supplement). Luminescence depth profiles were determined by measuring the natural signal (Ln) normalised using the signal measured in response to a test-dose (Tn), termed the signal. Dose-recovery experiments were consistent with a suitable analysis protocol (see extended discussion in the Supplement).
3.3 In situ cosmogenic 14C analyses
Of the remaining cores, BH02 and BH03 were sliced at 5 cm intervals while BH06 was processed as a single sample. After crushing and milling at the University of Durham quartz was purified at the Scottish Universities Environmental Research Centre (SUERC) Cosmogenic Nuclide Facility. Given the assumed high quartz content and low feldspar content of the samples froth flotation was not performed. Samples were subject to a total of 3–5 successive 48 h leaches in 1 % . Sample purity was assessed using ICP-OES with Al contents<200 ppm considered sufficiently pure. A total of ten samples were sent to the ANSTO-University of Wollongong (ANSTO-UoW) in situ 14C extraction laboratory (Fülöp et al., 2019) for carbon extraction. Prior to extraction samples underwent an additional pre-cleaning using a protocol modified from Fülöp et al. (2019). The 14C extraction scheme at ANSTO exploits the high temperature phase transformation of quartz to cristobalite to quantitatively extract the carbon as CO2. As part of this process samples are pre-heated to 600 °C for 1 h to remove meteoric 14C. Impurities of chlorite and/or glauconite produced reactions in two of our samples (BH02 0–5 cm and BH02 10–15 cm) presumably due to presence of Cl and/or K. As a result two sample tubes cracked during in vacuo cleaning. Following recovery of these samples from the coil-heaters and subsequent carbon extraction distinct discolouration of the residual material suggested contamination by the coil-heater itself and the initial samples were disregarded (Fig. S10). For one sample (BH02 0–5 cm; OZ12602) additional material was recovered from the fine (75–125 µm) fraction which was subsequently extracted. All other extractions were carried out on the 125–500 µm fraction. We thus present results from a total of nine samples (Table 2). Following extraction CO2 gas is converted to graphite targets and analysed using ANSTO's ANTARES 10MV tandem accelerator (Fink et al., 2004; Smith et al., 2010). Samples are normalised to small OX-II standards, corrected for a global graphitisation blank by 1/m analysis and data subsequently reduced according to Hippe and Lifton (2014).
Table 2Results of in situ 14C analyses of samples from bedrock cores. Total inventories are not blank corrected; concentrations include global blank correction of 15 500±9500 atoms.
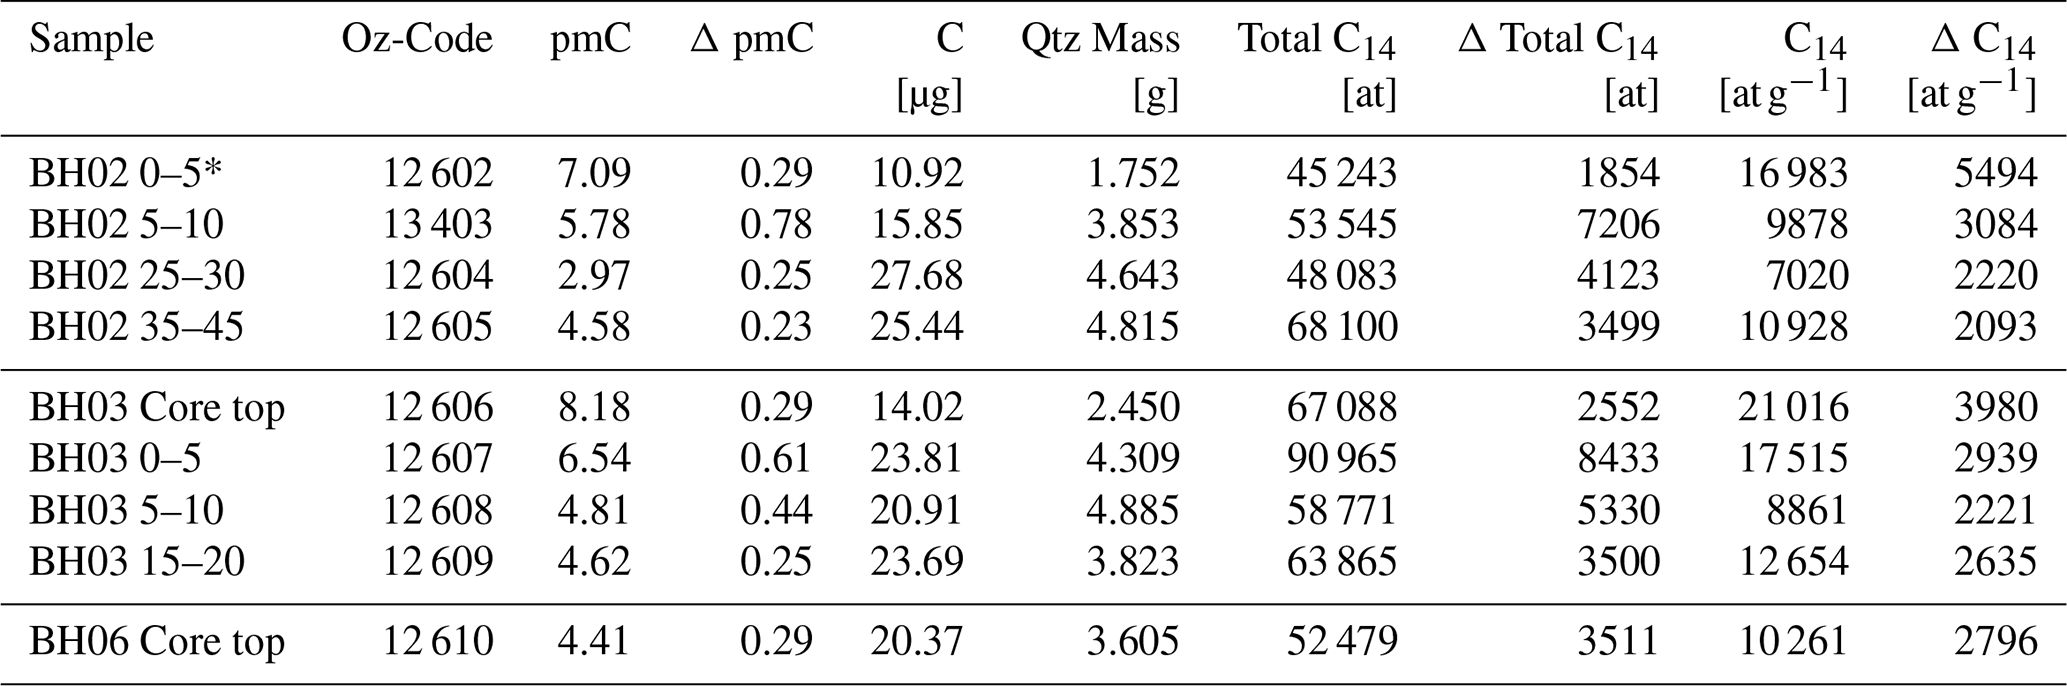
* 75–125 µm size fraction, all other samples utilised 125–500 µm.
3.4 Forward modelling of in situ 14C concentrations
To explore scenarios of ice thickness change that are consistent with the measured concentrations we use a simple forward model for cosmogenic nuclide production under 10 000 random three-stage ice histories (Fig. 4). Stage 1 has a random start time () and represents the early Holocene when the regional ice-sheet history mandates that our site was covered by an ice that was thicker-than-present. During Stage 1 ice thickness (HS1) is constrained to be no thinner than 50 m to allow for some production by deeply penetrating muons to assess sensitivity of the model to initial ice thickness. Stage 2 (T2−T3) is a period of thinner-than-present ice that begins at a random time after T1. In all boreholes we observed a clean ice-rock transition at the bed. Balco et al. (2023) used the presence of a dirty ice layer at the base of their boreholes to infer that ice had not thinned beyond their core top elevations during the Holocene. The absence of such a layer at our sites would, by the same logic, imply that ice could have thinned below our core top elevations but does not mandate that it did so. Consequently, during Stage 2 ice thickness (HS2) is allowed to randomly vary between 0 m (i.e. total exposure of our cores) and its present-day thickness with 10 % of model iterations set to zero thickness. This allows our model to explore what duration of complete exposure is consistent with our measured concentration and what thickness of residual ice cover is possible if the assumption of complete exposure is incorrect. Finally, Stage 3 (T3−T4) represents the current period of burial by ice with its present-day thickness (HS3). The start-time of Stage 3 is also random but with a minimum value of 60 a as available TMA aerial imagery shows ice at our site was in its present-day configuration in 1962 (Fig. S3).
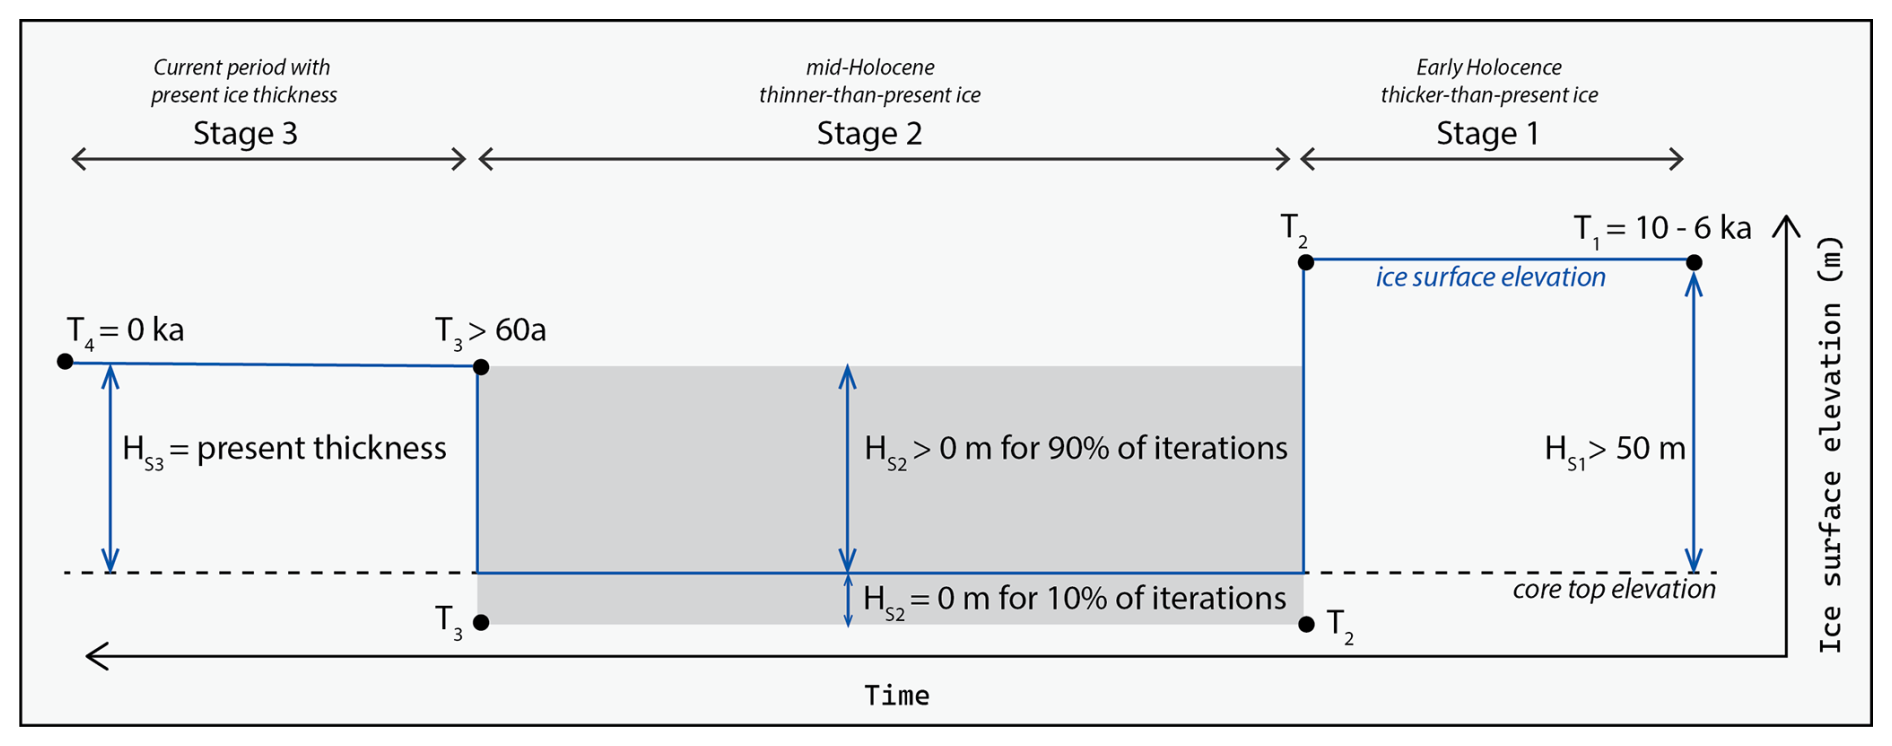
Figure 4Schematic of the forward model we use to predict downcore nuclide concentrations under varying ice thickness histories. T1 is when the model begins, T2 is the onset of hypothesised Holocene low stand, T3 is end of low stand, and T4 is the present day. HS1, HS2, and HS3 refer to the thickness of the ice column during Stages 1, 2, and 3 (S1–3) respectively.
For each stage (Sx) we calculate total mass depths in the core () where z(i) is the mass depth (g cm−2) at the bottom of an ice column H (cm) thick with a density (ρice) of 0.917 g cm−3:
the mass depths in the core (z(c)) are constant for each stage of the model and defined by:
where D(x) is the depth in the core (cm) and ρrock is an assumed rock density (2.68 g cm−3). The total mass depths (zsum) are used alongside the surface elevation of the ice sheet during the corresponding stage to calculate downcore nuclide production rates during each stage of our model (PS1, PS2, PS3 in ). Production rates are calculated as the sum of spallogenic and muonogenic production as implemented by Balco et al. (2023) using the scaling method of Stone (2000).
The resulting nuclide concentration for each stage of our model (NSx) are calculated at each depth in our core as:
Where NSx−1 is the nuclide concentration at the end of the preceding stage (assumed to be zero at the start of the model), λ is the decay constant of 14C (), TSx is the duration of the stage (Sx) in years (e.g., ), and PSx is the depth specific production rate for the relevant stage of the model ().
In all boreholes we encountered ice that was completely frozen to its bed. Considering low mean annual temperatures at our site (; cf. Wang et al., 2023), basal melting under present-day ice thickness is glaciologically implausible making the occurrence of significant erosion during the most recent period of (thin) ice cover (Stage 3) unlikely. Similarly, while sub-aerial erosion does occur in Antarctica quantified rates are generally very low (), including in quartzites (Marrero et al., 2018). Combined with observations of striations on polished bedrock surfaces above ice we consider it likely that sub-aerial erosion during any period of Holocene exposure (Stage 2) was negligible. Finally, any erosion during thick ice cover (Stage 1) is not relevant to our model as the short half-life of 14C (5730 years) requires any pre-LGM inventory to have decayed regardless of whether erosion occurred. Consequently we assume zero erosion in all stages of our model.
4.1 Luminescence depth profile (BH01)
The results of the luminescence measurements (Fig. 5a) are inconsistent with the regional ice-sheet history. Specifically, we calculate an apparent burial age of ca. 21.4±1.6 ka (Fig. 5b) for slices 2 and 3. Such an age would imply exposure to light during the LGM when the ice-sheet surface across the WSE was several hundred metres thicker than present and the grounding line was >300 km outboard of its present-day limits (Bentley et al., 2010; Hillenbrand et al., 2014; Hein et al., 2016; Nicholls et al., 2019; Johnson et al., 2019). Although the sample passed dose-recovery experiments, we conclude that the luminescence signals of these rock slices were not dominated by quartz and thus were not suitable for measuring burial ages using the applied protocol. Previous studies have reported dim luminescence signals measured for quartz from rock slices (e.g. Sohbati et al., 2011) similar to the signals reported here for sample BH01 (Fig. S8); this is likely due to the lack of sensitisation of the signal prior to burial within a rock. The SEM-EDS measurements of sample BH01 (Fig. S6) show that K is present in the rock slices which is potentially related to the presence of K-feldspar. The presence of this mineral would be consistent with our measurements of high fading rates (). It has previously been shown that feldspars emit detectable signals when stimulated with blue wavelengths and detected in UV (e.g. Thomsen et al., 2008). In such a scenario, the dim quartz signals give greater opportunity for minerals with less suitable luminescence properties (e.g. feldspar when stimulated and detected in blue and UV wavelengths, respectively) to dominate the signal used for dating.
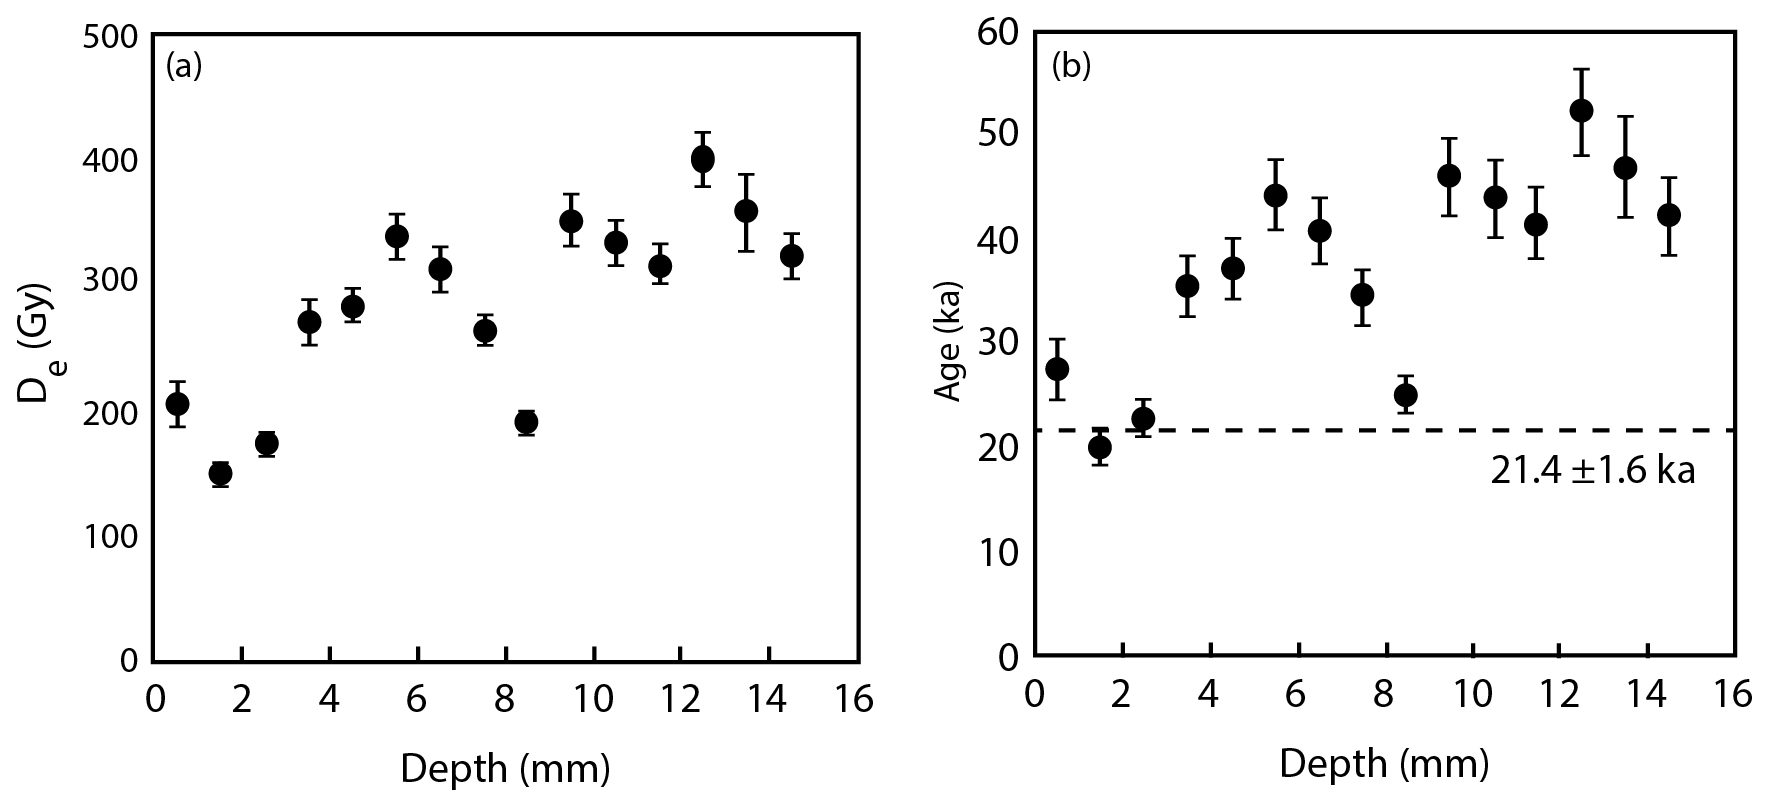
Figure 5Luminescence depth plots for sample BH01 showing De values (a) and apparent burial ages (b) measured using the OSL signal of quartz. Note that only Discs 2 and 3 (depths 1.5 and 2.5 mm, respectively) were used for age calculation.
Our measured signal it is not a quartz signal or a K-feldspar signal stimulated by infra-red wavelengths typically used for dating. The unsuitable luminescence properties could thus manifest in both age underestimation (because of the high fading rate), but also in age overestimation as the signal may not deplete rapidly in response to sunlight exposure (i.e., for these minerals, at this wavelength) While the rock appeared to be dominated by quartz in hand specimen it is notably fine grained and other K bearing minerals are clearly present. In future, the mineralogy should be more confidently quantified prior to choice of measurement protocol given the difficulty in collecting such samples. Ultimately, and unfortunately, the luminescence results from BH01 are not interpretable.
4.2 In situ 14C concentrations in bedrock cores
The nine samples analysed for in situ 14C yielded total inventories of 14C (Table 2). The reported total inventories of 14C are times higher than the long-term ANSTO-UoW global blank value of 14C which represents the average and standard deviation of all process blanks measured at ANSTO over the last 6 years. We processed and measured 15 individual process blanks alongside the samples presented here. The values from these 15 blanks are indistinguishable from the global blank value and show no time-dependence (Figs. 6 and S11). None of the samples overlap with any individual blank or with the long-term blank value at 68 % confidence. Only one sample overlaps with the global blank at 95 % confidence. As argued by Balco et al. (2022), a key point is that if upper core samples contain inventories of 14C that are above background then, given production systematics, 14C must be present in down core samples even if those samples have inventories that are close to blank levels. The uppermost samples from BH02 (5–10 cm), BH03 (Core top), and the single sample from BH06 are 2.9, 4.3, and 3.4 times above blank respectively, and do not overlap with the blank at 95 % confidence. We thus conclude that in situ 14C is present in our cores. The generally observed downcore decrease in concentrations of 14C (atoms g−1) in both BH02 and BH03 is consistent with production systematics of cosmogenic nuclides and further support this conclusion.
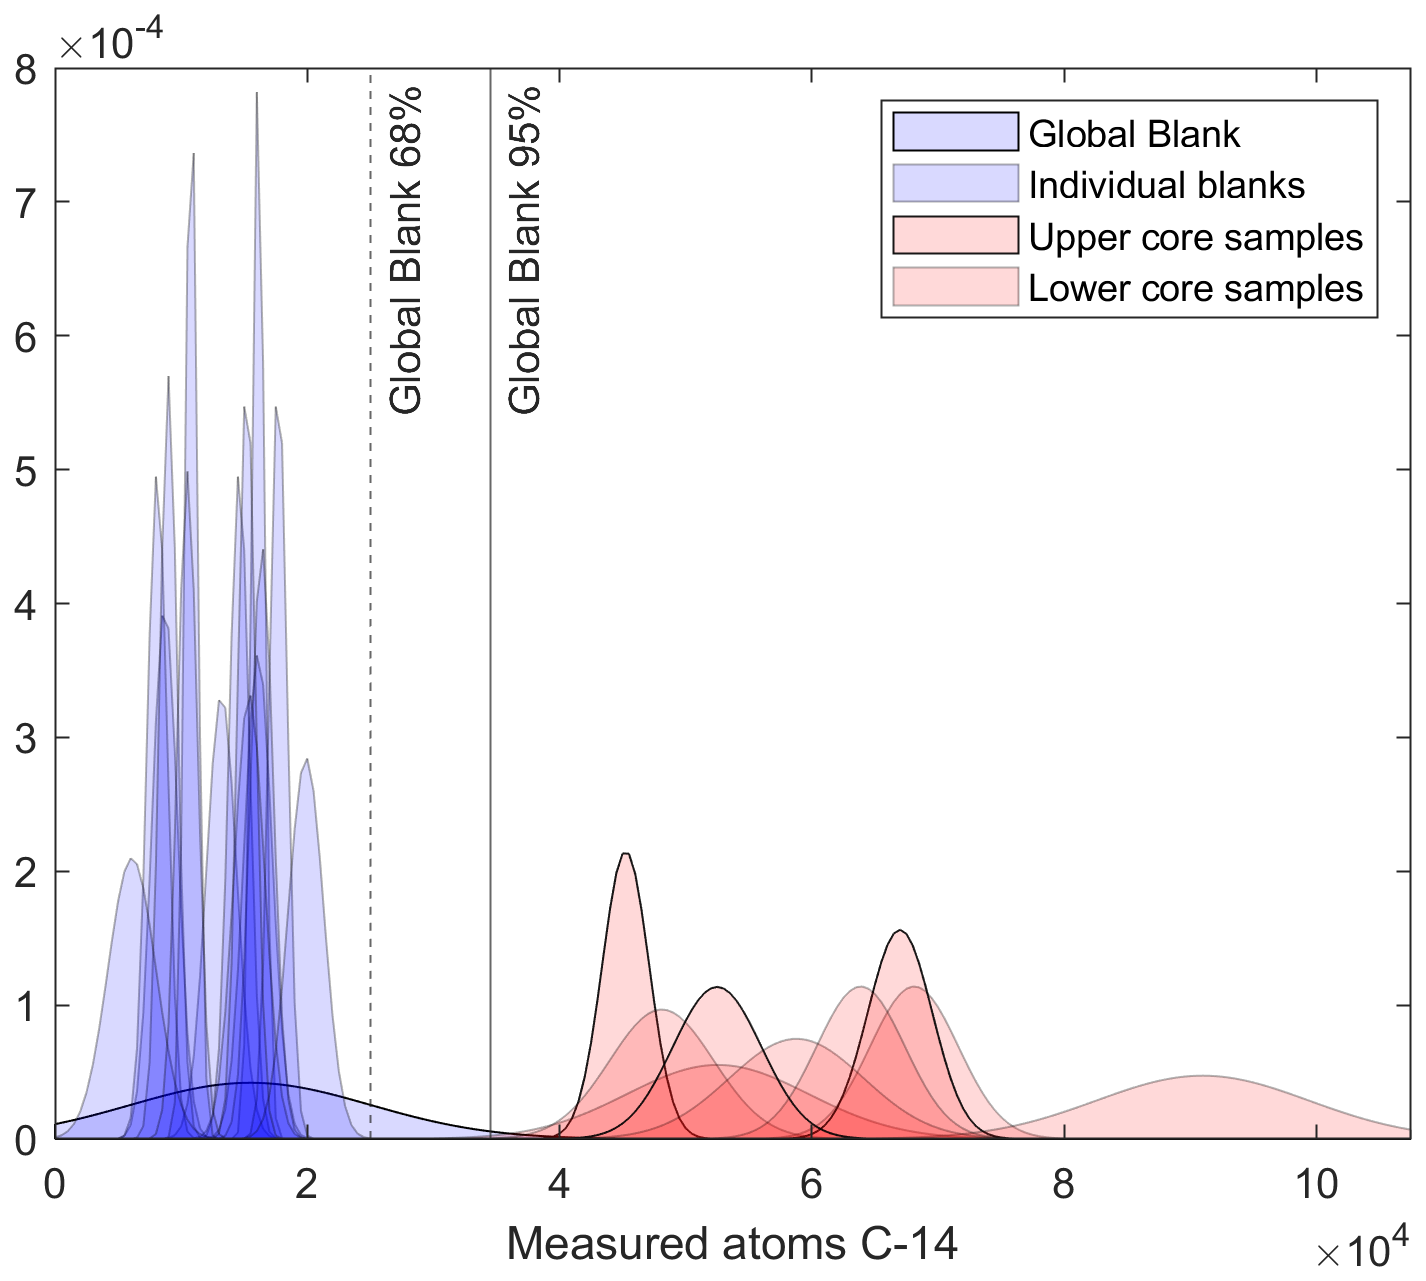
Figure 6Probability distribution functions showing total measured inventories (total number of atoms) of 14C in bedrock samples (red) alongside the 15 individual process blanks and the six-year global blank value of 15 500±9500 atoms (blue). Upper core samples are highlighted.
5.1 Was ice thinner-than-present during the Holocene?
In situ 14C can be produced at depths of tens of metres by deeply penetrating muons (cf. Lupker et al., 2015). Thus, it is possible that at least some of our measured concentrations could be produced without ice thinning beyond present if the duration of any quasi-constant ice cover was sufficiently long. To test this scenario we modelled expected downcore nuclide concentrations under constant (present-day) ice thickness for periods of 2, 6 and 8 ka. This represents a conservative time range as defined by existing constraints on ice-sheet history in the region (Bentley et al., 2010; Hein et al., 2016; Griemann et al., 2024). Notably, the predicted concentrations are significantly lower than the measured concentrations of the upper samples in both BH02 and BH03 (Fig. 7). In addition, the “straight” shape of the modelled profiles reflects the dominance of muonogenic production under of ice (i.e. the present thickness at the sites of BH02/BH03). In contrast, the data from BH02 and, in particular, BH03 define a production profile with a spallogenic contribution. These two observations support an inference that the nuclide concentrations in our bedrock cores result from production during a period when ice at our core sites was thinner-than-present allowing for increased production to occur.
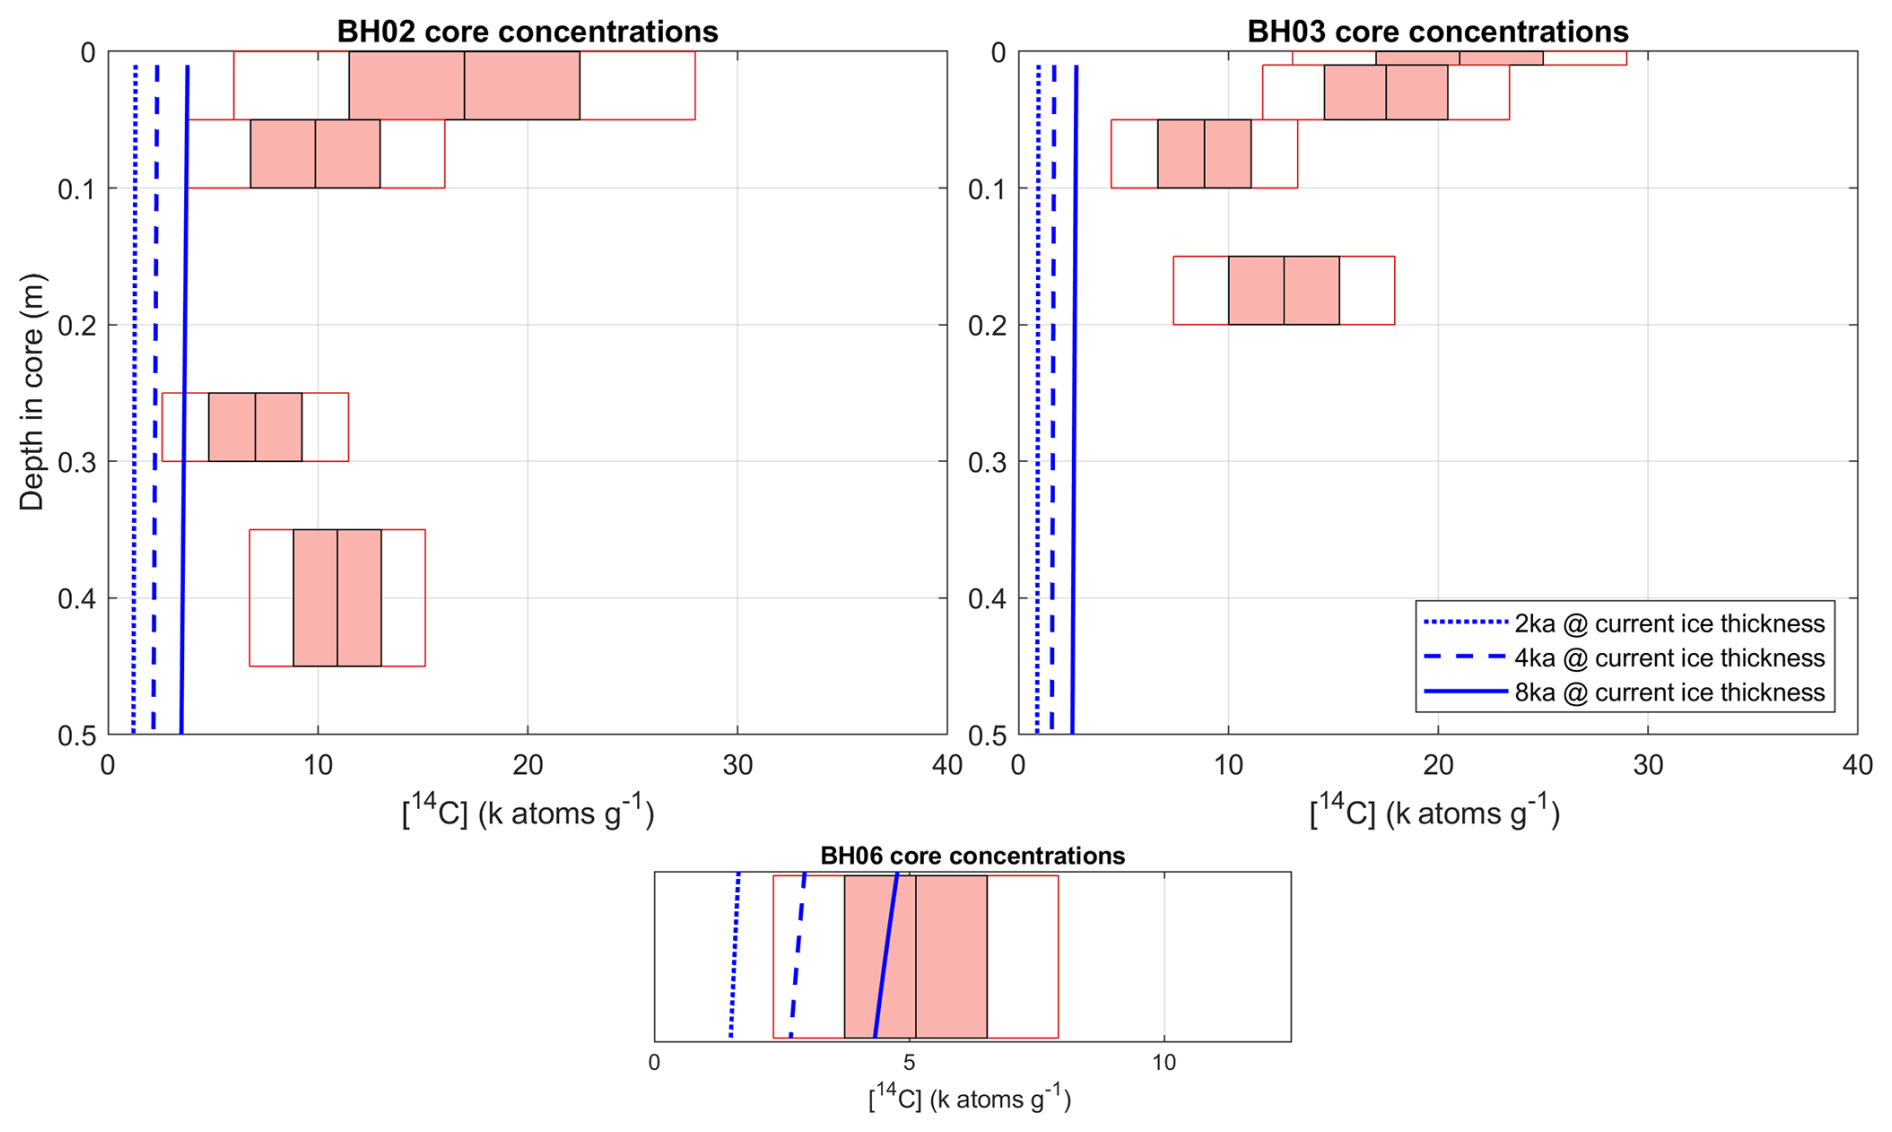
Figure 7Downcore measured nuclide concentrations for and predicted depth profiles under invariant ice cover for durations of 2 ka, 4 and 8 ka for samples from BH02 (a), BH03 (b) and the single sample from BH06 (b). Solid box and outline denote 68 % and 95 % uncertainties on measured nuclide concentrations respectively.
Unlike the samples from BH02 and BH03, the 14C concentration measured in the single sample from BH06 is consistent with, but does not mandate, production during prolonged (8–6 ka) burial by ice of present-day thickness which at this site is 9.5 m. However, given their respective locations, if ice thinning exposed the BH02/03 core sites then the BH06 core site must also have been ice free. Similarly, while the OSL results presented here cannot be interpreted with respect to past exposure of the BH01 core surface to sunlight, as with BH06 which is at a comparable depth, if ice thinning occurred at the sites of BH02 and BH03 then ice thinning must also have occurred at the site of BH01. We cannot exclude the possibility that BH06 was shielded by sediment and/or snow during any Holocene low stand, However, without observations such a scenario remains speculative. Importantly, we emphasise that the nuclide concentrations in both BH02 and BH03 show an unambiguous signal of increased production above that possible due to muonogenic production under present-day ice thicknesses thus requiring ice to be thinner at our core sites at some time during the Holocene.
5.2 Ice surface histories inferred from forward model of nuclide concentrations
Our simple forward model of nuclide accumulation allows us to predict downcore nuclide concentrations in our bedrock cores under various synthetic ice histories (Fig. 8). Regardless of the relative contributions of different production pathways in situ 14C production rates decrease with depth (cf. Gosse and Philips, 2001). Consequently, as all depths in any individual core have inherently experienced the same exposure-burial history the actual (i.e. not measured) concentrations must decrease with depth. To do an assessment of model fit we calculate a reduced chi-squared misfit between the concentrations predicted by any individual synthetic ice-sheet history and the measured concentrations in our cores. Histories that can't be rejected at 98 % confidence (i.e., with a reduced χ2<3.279 for 3 degrees of freedom) were retained for further analysis and discussion. This results in a total of 1493 and 244 fitting iterations for BH02 and BH03 respectively. We acknowledge that the 98 % threshold is a relatively conservative criterion. However, use of a narrower threshold (e.g., 95 %) reduces the number of fitting iterations for BH03 to effectively zero (n=2) primarily because, as pointed out by Balco (2025), the three uppermost measurements in BH03 have concentrations that randomly decrease with depth more rapidly than a surface spallation profile. Given that an overall pattern of decreasing concentrations with depth is observed (e.g., the upper two and lowermost samples are physically consistent with production systematics) we suggest that BH03 contains more useful information on the range of ice histories that are broadly consistent with its profile than we can meaningfully discuss from only 2 fitting iterations at the 95 % threshold.
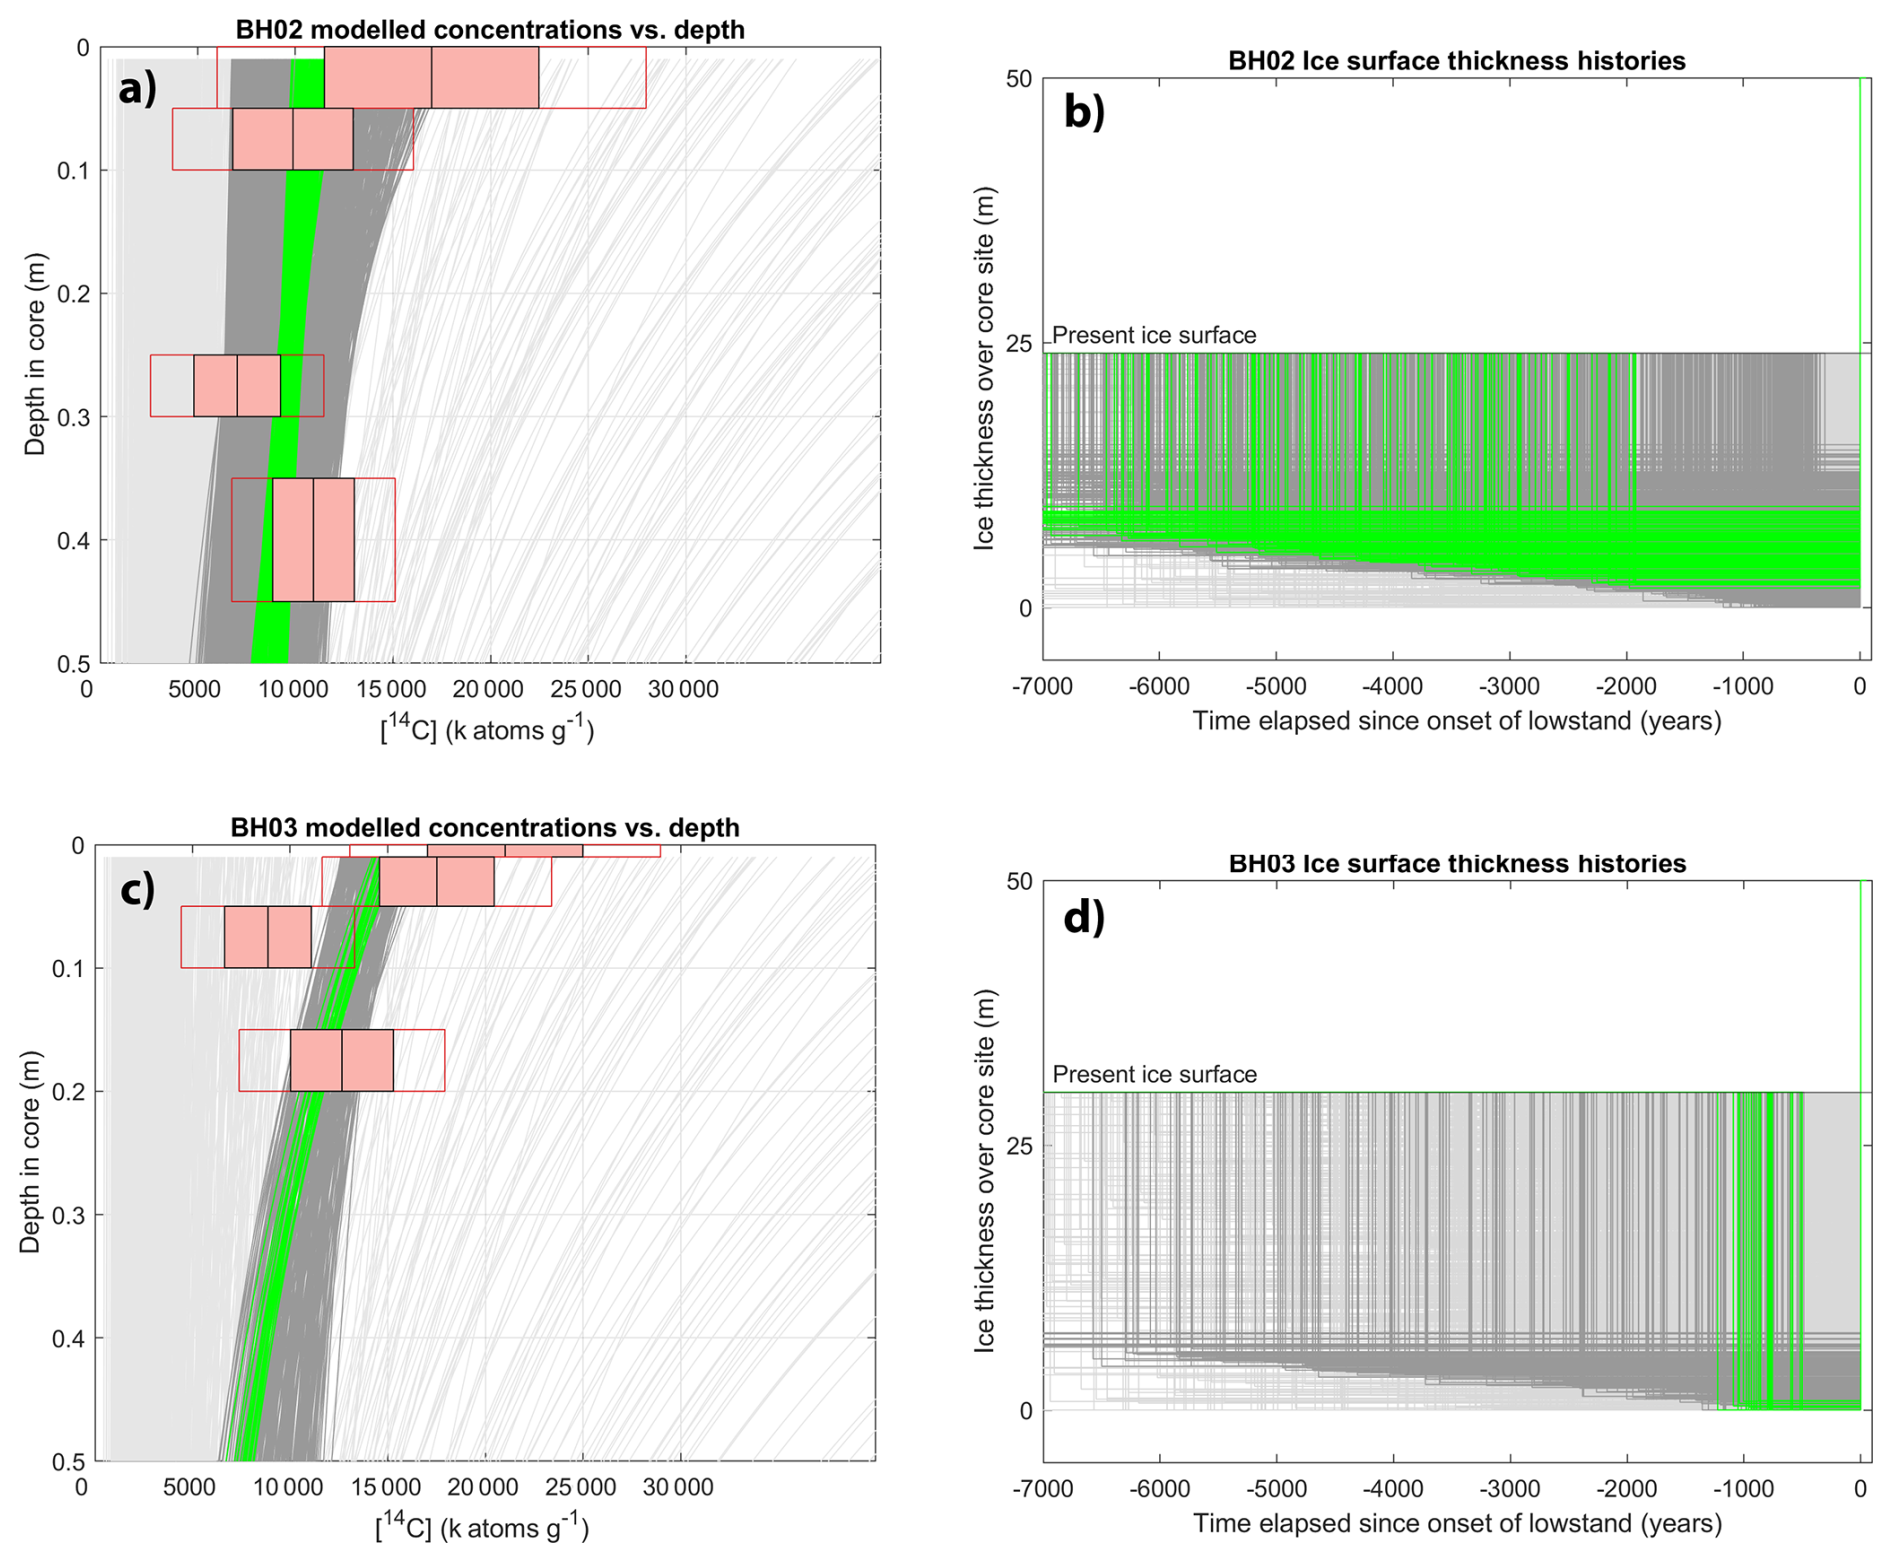
Figure 8(a) Predicted nuclide concentrations plotted against depth in core BH02. Measured concentrations shown as in Fig. 7. Concentrations predicted by the best (10th percentile) of fitting iterations shown in green, all fitting iterations shown in dark grey, random selection (n=1000) of remaining iterations shown in light grey. (b) Three stage ice histories used to produce modelled concentrations, colours correspond to the same sub-sets of iterations as panel (a). The histories, which all have different starting times in the model, have been aligned to the onset of the low stand for visualisation. (c, d) are the same figures but for BH03.
While some accepted scenarios for both cores are consistent with a Holocene low stand during which our drill sites were completely ice free (Fig. 9) our forward model, which is under constrained, also allows for scenarios with thin residual ice cover, but relatively longer low stand durations. Put simply, if production rates in the cores are reduced due to thin residual ice cover, then a longer time is required to accumulate the concentrations subsequently measured. For BH02 fitting iterations of our forward model predict low stand durations of 300–9200 years corresponding to residual ice thicknesses of 0–15 m. For BH03 the forward model predicts a narrower range of ice histories with low stand durations of 550–8250 years corresponding to residual ice thicknesses of 0–7 m. For BH02 the model appears to favour scenarios with intermediate residual ice thicknesses () whereas for BH03 scenarios with complete exposure of the core top produce lower misfit scores (larger symbols in Fig. 9). This difference is potentially due to randomness within the measured concentrations from the limited number of samples available thus we prefer to present the results of the forward model conservatively in terms of the overall range of low stand durations and ice cover thickness represented by the fitting iterations. Considering the full population of accepted scenarios the range of possible low stand durations is with the upper 10th percentile of this range requiring residual ice thicknesses of (Fig. 9). This overall range of possible solutions can be narrowed further by considering the total time available for thinning and re-thickening as constrained by the most proximal cosmogenic nuclide data from the Heritage Range. This data suggests ice thinned to near its present-day thickness by 4 ka (cf. Bentley et al., 2010; Hein et a., 2016) which would limit the range of accepted solutions to encompass low stand durations of 300–3800 years and maximum residual ice thicknesses of ∼7 m (Fig. 10).
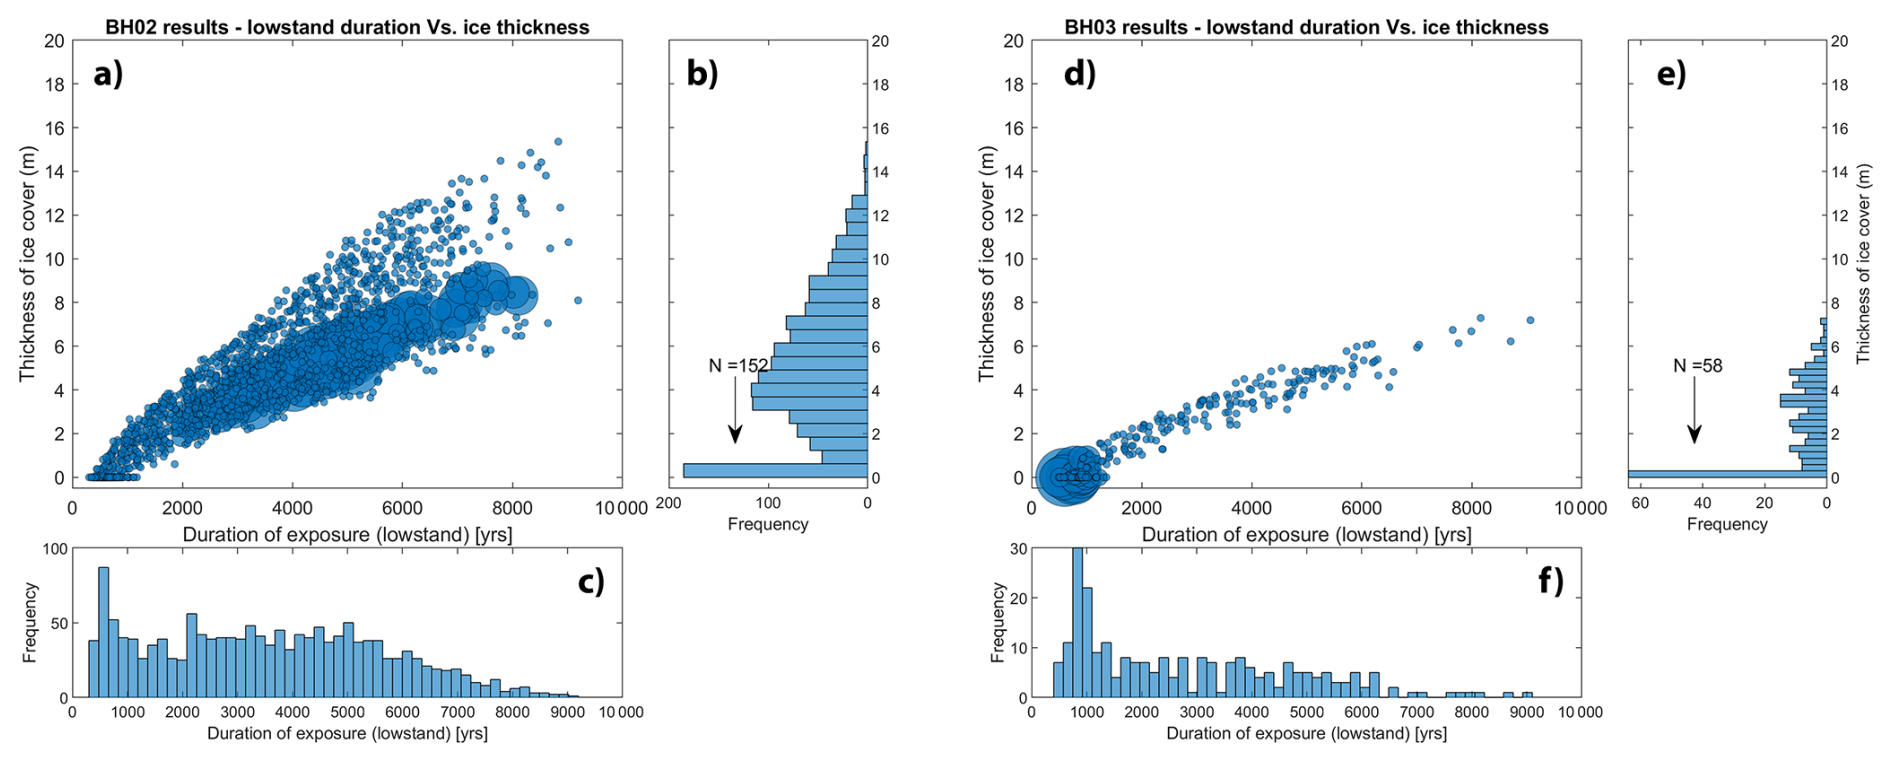
Figure 9(a, d) Low stand duration plotted against thickness of residual ice cover for fitting model results from BH02 (a) and BH03 (b). The 10th percentile of best fitting scenarios has symbol sizes scaled in order of goodness-of-fit showing that scenarios of thin ice better fit the measured concentrations in BH03. (b, e) and (c, f) are the respective histograms for the two variables, again showing that shorter, “none-or-thin” ice histories are preferred.
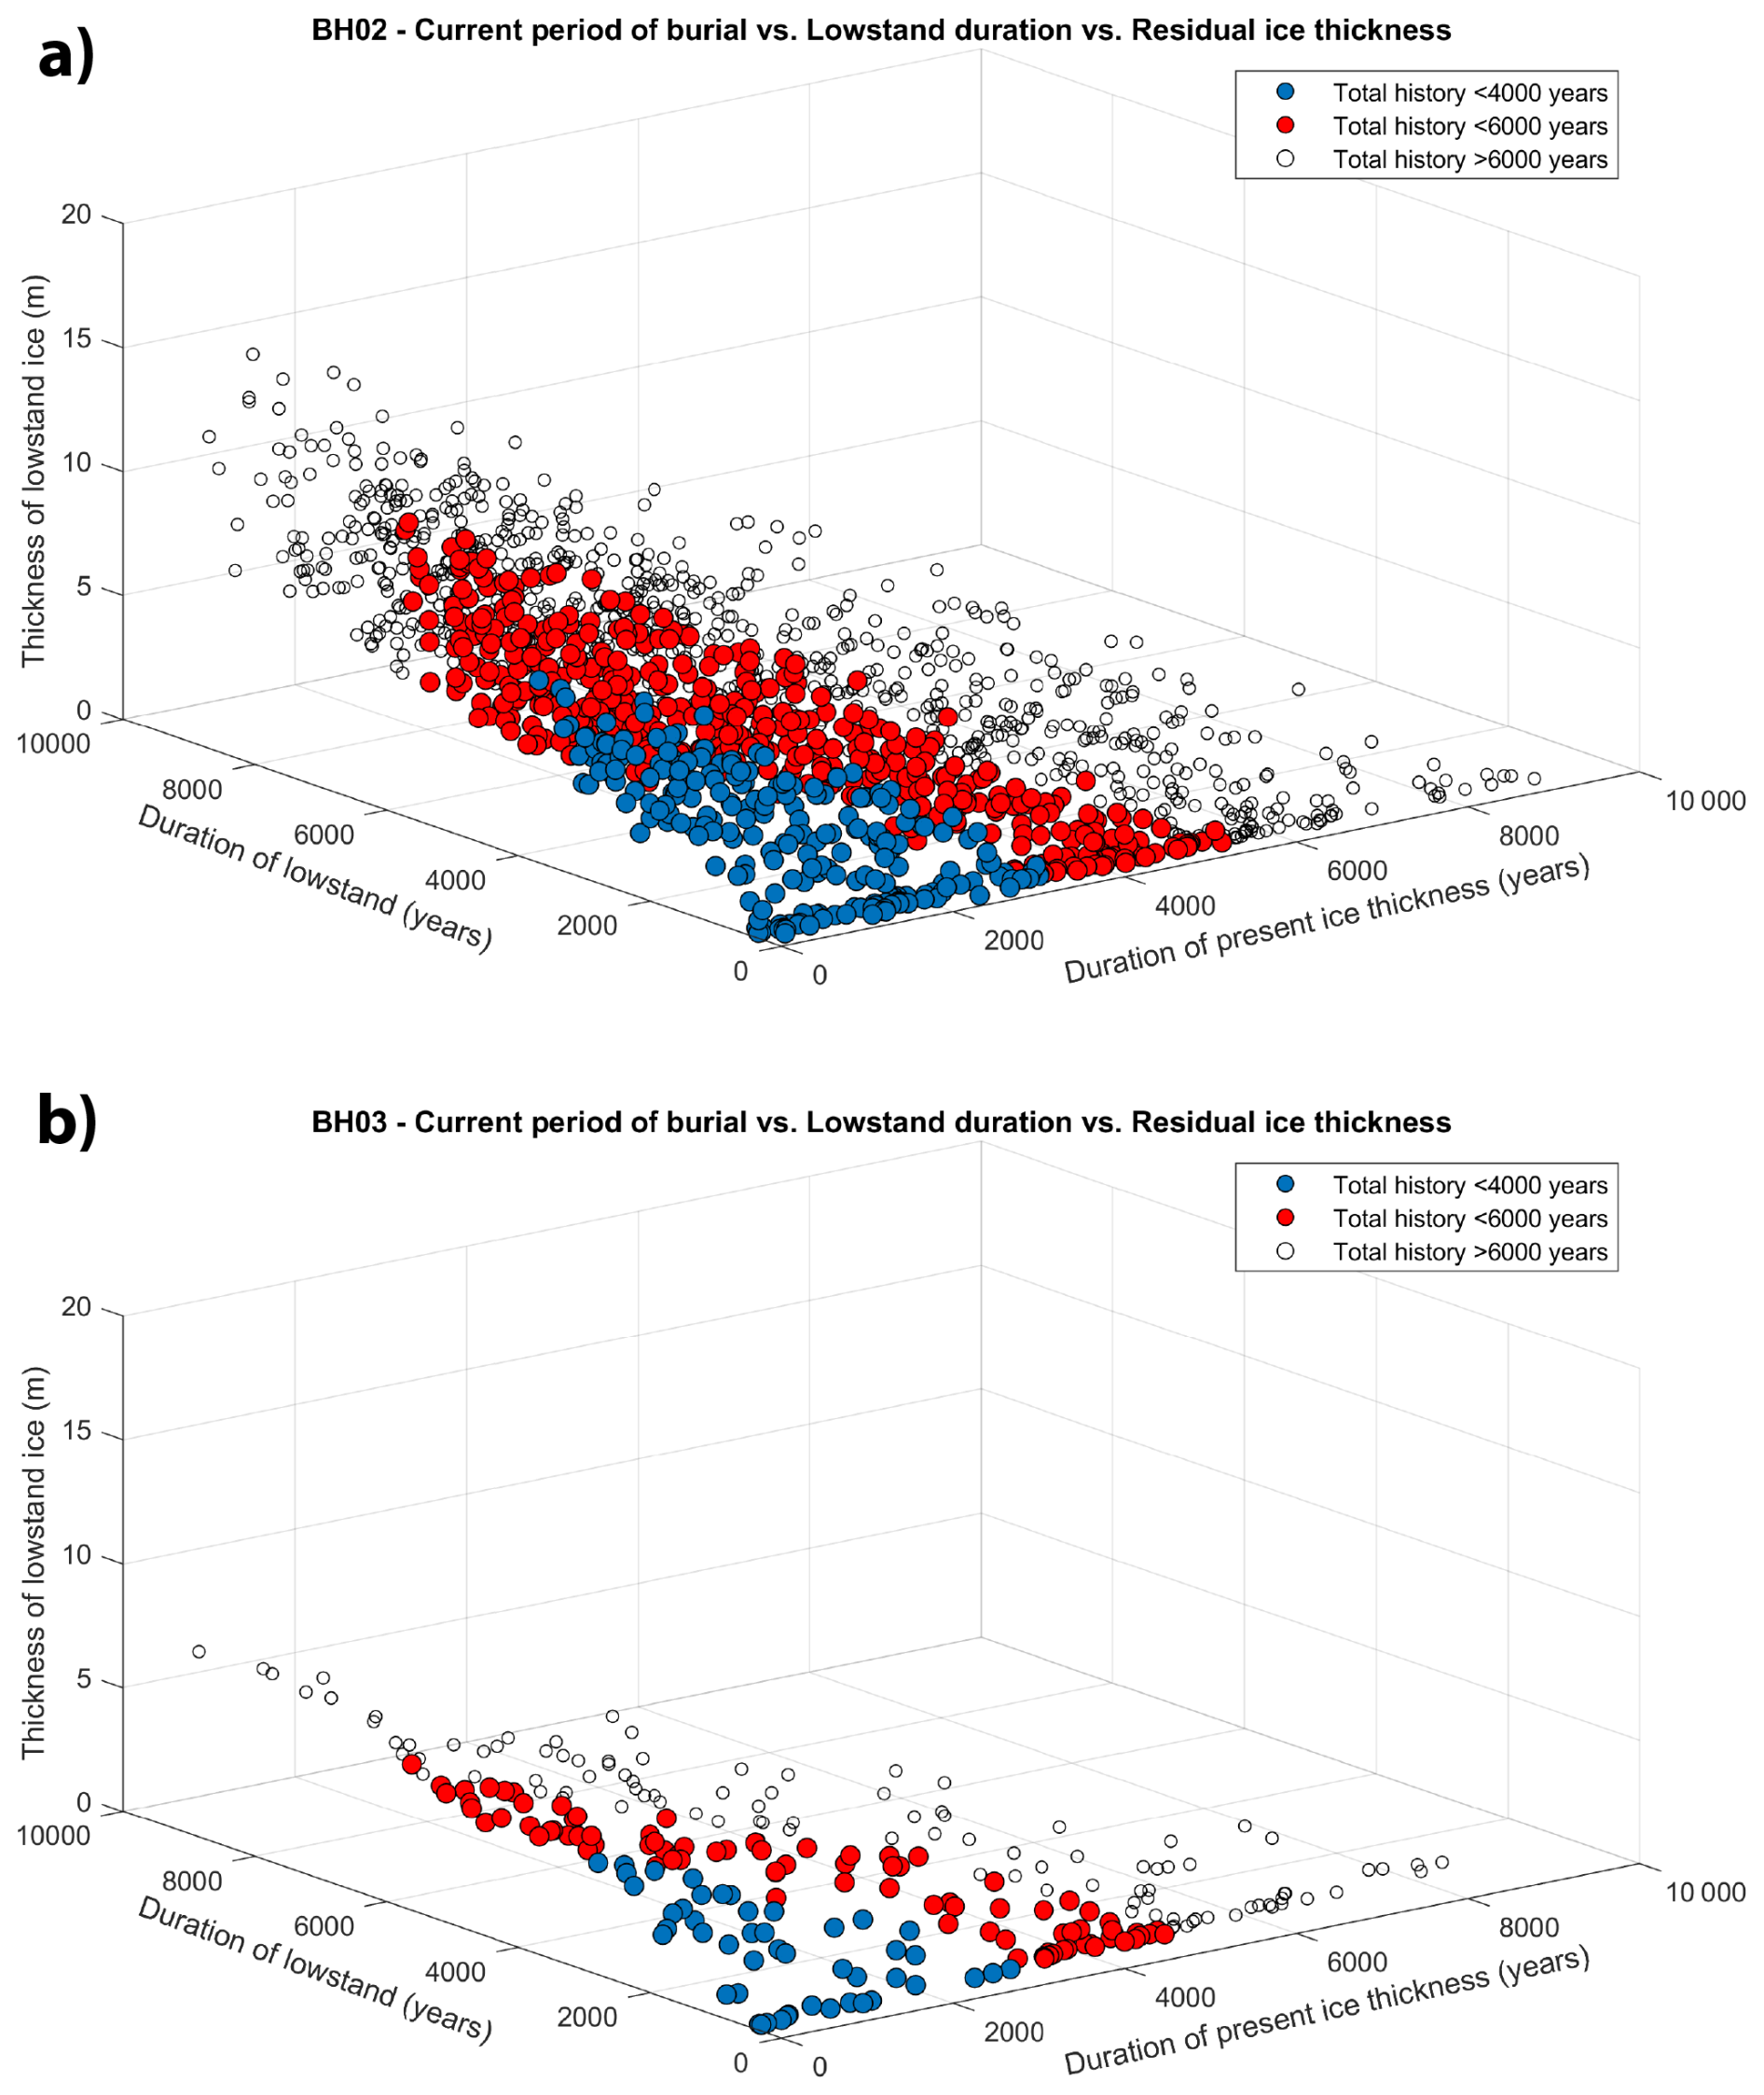
Figure 10XYZ plot of durations of low stand (Stage 2) and period of present ice thickness (Stage 3) against residual ice thickness during Stage 2 for cores BH02 (a) and BH03 (b). Nearest exposure age data imply ice surface reached modern elevations at ca. 6–4 ka thus total duration of Stage 2 and Stage 3 would be shorter than this. Such constraints narrow the range of possible low stand durations and residual ice thicknesses as shown for periods of 4000 years (blue markers) and 6000 years (red markers). Remaining accepted scenarios shown with white markers.
5.3 Wider implications for Holocene ice-sheet history in the Weddell Sea Embayment
In summary, the data requires thinner-than-present ice and is most consistent with ice thinning at our core sites of at least ca. 20 m defined by the total time available for thinning and re-thickening. Our data does not exclude the possibility that our core sites were completely exposed so this value is considered a minimum constraint for mid-late Holocene (i.e., post 4 ka) ice-sheet thinning at our sites. Given that drill site choice is dominated by logistical parameters there will always be a trade-off between where we would ideally go to answer a scientific question and where drilling is likely to be successful. A question that must be addressed therefore is whether ice-sheet thinning at any given location (as represented by data such as ours) represents a broader lowering of the regional ice surface (i.e. due to dynamic thinning associated with grounding-line retreat) or a (very) localised change due to site-specific factors such as wind scoop development and/or locally enhanced ablation in the BIA due to stronger katabatic winds. Ultimately resolving this question, for example by using nested higher resolution grids around potential drill sites in ice sheet models to quantitatively link ice surface lowering to grounding line position is a challenge that remains to be addressed. However, there are multiple lines of evidence to support a scenario of thinning at our site being representative of a regional response.
Firstly, wind scoops are depressions eroded by vortexes formed when prevailing winds are obstructed (e.g., by protruding nunataks). Large examples can be eroded into glacier ice and can have floors several tens of metres below the adjacent ice surface (cf. Ackert et al., 2007). Wind scoops often form on the upwind side of obstructions, but their overall distribution reflects complex interactions of varying wind directions and local (meso-scale) topography. Presently, there is very limited wind scoop development around Plummer Nunatak, and none around the small outlier or Patch Rock. Given the lack of vertical relief around Patch Rock (i.e., <2 m above ice) it is difficult to envisage development (and subsequent disappearance) of a wind scoop of sufficient size to expose our sample sites. Additionally, BH02 and BH03 are located on opposite sides of the subglacial ridge thus even if a wind scoop did develop it is unlikely that one would form on both sides of such a low relief outcrop.
Secondly, our core sites are located in an extensive Type 1 (cf. Bintanja, 1999) blue ice area (BIA) on the leeward side of the Enterprise Hills (Fig. 2b). Type 1 BIAs form where katabatic winds, enhanced by topography, focus sublimation on the lee side of nunataks (Bintanja, 1999). The first order control on the surface elevation of BIAs is regional thinning/thickening of the ice sheet over glacial timescales (cf. Woodward et al., 2022). Once a close approximation of the current ice-sheet configuration was reached (i.e. ca. 6–4 ka) the predominant mechanism for localised lowering of the BIA surface elevation (in the absence of dynamic thinning) would be a situation where katabatic winds are enhanced, leading to the rate of surface ice loss exceeding the rate of compensating ice flow. Katabatic wind strength is the product of continuous cooling over a sloping ice-sheet surface (Van den Broeke and Bintanja, 1995; Bintanja et al., 2014) thus wind strength increases with surface gradient. Minor elevation changes (<100 m) at the WAIS divide during the Holocene (cf. Koutnik et al., 2016) would result in negligible changes in surface gradient over the >500 km between the WAIS divide and the Enterprise Hills. Additionally, modelled future changes in katabatic wind strength due to anthropogenic forcing are small (Bintanja et al., 2014). This implies that, in the absence of major ice-sheet elevation changes, variations in Holocene wind strength, when atmospheric forcing was of a similar (or smaller) magnitude, would also be minor.
Thus, we suggest that the most parsimonious explanation for a thinning, and subsequent re-thickening, of the ice surface at our sites is a dynamic change associated with fluctuations of the grounding line. If this is the case, then the surface elevation change observed at our sites is indicative of broader retreat-readvance of the WAIS in the southern WSE. The timescales involved in thinning and re-thickening of the ice surface, as constrained by the cosmogenic nuclide data from BH03, are consistent with observations of late Holocene (<4 ka) flow reorganisation over Bungenstock and Korff Ice Rises (Siegert et al., 2013; Brisbourne et al., 2019). Similarly, the modelled duration of the low stand (500–3800 years) agrees with predictions from GIA modelling constrained by GPS observations in the southern WSE (Bradley et al., 2015). Notably, Bradley et al. (2015) observe that their GIA model could potentially produce a better fit to GPS observations if there was “an increase in the spatial extent of the retreat-readvance”. The ice-loading histories used as inputs to their GIA model focus retreat over the RSB, ca. 200 km south of our site. Ice-sheet model simulations of past, and potential future retreat in the southern WSE also focus grounding line retreat in the RSB but generally not in the near vicinity of our site (Kingslake et al., 2018; Albrecht et al., 2020; Hill et al., 2021; Pittard et al., 2022). Our data therefore implies that Holocene retreat-readvance of the WAIS in the southern WSE may have been more extensive than previously hypothesised. Constraining the overall extent of this change is a future research priority (Ross et al., 2025) and data from sites near the southernmost portion of the WSE, at the margin of the Foundation Ice Stream, are forthcoming (Small et al., 2024).
5.4 Comparison to evidence for retreat-readvance from other sectors of West Antarctica
While being mindful that different methods constrain different glaciological phenomena (i.e., grounding line retreat vs. ice-surface elevation change) it is worth comparing our data with evidence for Holocene retreat-readvance in other sectors of the WAIS. In the Ross Sea, radiocarbon dating of sub-glacial organic carbon recovered at and inboard of the Siple Coast grounding line indicates ca. 250 km of grounding line retreat in the mid- Holocene ca. 6.3–7.2 cal kyr BP, before readvance to the present-day position at an unconstrained time (Kingslake et al., 2018; Venturelli et al., 2020, 2023). In the Amundsen Sea cosmogenic nuclide data from exposed nunataks, subglacial bedrock, and a controlled moraine (cf. Evans, 2009) constrains a minimum low stand duration of 3000 years that occurred sometime after ca. 7.1 ka with readvance occurring at ca. 1.4 ka (Adams et al., 2022; Balco et al., 2023; Nichols et al., 2024).
Our new data from subglacial bedrock cores in the WSE is consistent with these previous studies although we cannot constrain the timing of ice-thinning directly. Indirectly, the nearest available above-ice cosmogenic nuclide data suggests that the ice surface initially reached it present elevation at ca. 6.0–4.0 ka (cf. Bentley et al., 2010; Hein et al., 2016). If this was the case then excess thinning in the WSE must post-date this time, broadly in line with the timings in both the Ross Sea and Amundsen Sea sectors. The most likely duration of the low stand in the WSE (300–3800 years) is, towards its lower limit, somewhat shorter than in the Amundsen Sea (>3000 years) although we note that our sites are located at higher elevations ( vs. (meter above sea level)) and further from the present-day grounding line (∼30 km vs. ∼2 km) than the core sites of Balco et al. (2023). Thus, the difference in modelled low stand duration may reflect a real variation or simply a delay between grounding-line retreat-readvance and corresponding ice-surface elevation changes at our upstream core sites. Our data, therefore, does not preclude the possibility that there was near synchronous Holocene retreat-readvance of the WAIS in three of its main drainage catchments. Similarly, our data (and the other data constraining WAIS retreat-readvance) are consistent with recent global mean sea level (GMSL) reconstructions based on GIA modelling that suggest excess ice loss from Antarctica contributed to a higher than present GMSL since 7 ka (Creel et al., 2024).
The measured concentrations of in situ 14C in two of our subglacial bedrock cores, combined with the observed downcore decreases in these concentrations, provides diagnostic evidence for a thinner-than-present ice sheet at our core sites during the Holocene. Our concentrations and their depth profiles cannot be explained by an ice surface that was maintained at its present elevation following the cessation of post-LGM thinning. A forward model of nuclide concentrations produced under synthetic ice histories constrains the duration of the ice surface low stand and thickness of any residual ice cover. Low stand durations of ca. 300–9000 years, and residual ice thicknesses of up to 15 m can explain our data however the best fit is provided by a low stand lasting 300–3800 years and ice no thicker than ∼7 m. While we cannot exclude the possibility that ice surface change at our site is due to local factors, the lack of an obvious mechanism for such localised change, alongside the wider evidence for major ice-sheet change in the WSE during the Holocene, leads us to suggest that the thinning, and subsequent re-thickening demonstrated by our data reflects dynamic thinning associated with retreat of the grounding line inboard of present-day limits in the southern WSE. The areal extent of this retreat is greater than predicted by existing ice-sheet models simulations. Direct geological evidence for Holocene retreat-readvance is now observed in the Ross Sea (Kingslake et al., 2018; Venturelli et al., 2020, 2023), Amundsen Sea (Balco et al., 2023; Nichols et al., 2024) and Weddell Sea (this study) sectors of the WAIS. Retreat-readvance of the WAIS can explain a higher than present GMSL in the mid-late Holocene but the relative contributions (i.e., future vulnerabilities) of the main sectors of the WAIS have yet to be fully determined.
Finally, modelling studies have suggested that following excess retreat inboard of present limits in the WSE, ongoing glacio-isostatic adjustment led to re-grounding of ice rises, increasing buttressing and promoting grounding-line advance on a reverse bed-slope (Kingslake et al., 2018; Pittard et al., 2022). This mechanism has been proposed as a negative feedback on potential future sea-level rise from Antarctica (Gomez et al., 2015; Kachuck et al., 2020). Our data provides a testable scenario of retreat-readvance, along with potential timeframes involved, which should be used to test numerical ice-sheet models that include representations of this mechanism and are used to make predictions of future sea-level rise from Antarctica. To maximise the utility of data such as ours requires an approach to quantifying the magnitude of grounding-line retreat that explains point measurements of ice-sheet thinning at logistically constrained drill sites.
All data is presented within this paper and in the accompanying Supplement.
The supplement related to this article is available online at https://doi.org/10.5194/tc-20-2035-2026-supplement.
DS conceived the study and obtained funding. DS, TL and ST conducted fieldwork and sample collection. DF, MM-R and R-HF prepared samples to clean quartz. R-HF carried out carbon extraction. AS and R-HF produced the cosmogenic nuclide measurement. RKS performed luminescence measurements. GVB oversaw training DS on use of the Winkie Drill and provided extensive guidance on its modification. DS developed the model for data analysis. DS prepared the initial manuscript with input from R-HF and RKS. All authors reviewed the final version of the manuscript.
The contact author has declared that none of the authors has any competing interests.
Publisher's note: Copernicus Publications remains neutral with regard to jurisdictional claims made in the text, published maps, institutional affiliations, or any other geographical representation in this paper. The authors bear the ultimate responsibility for providing appropriate place names. Views expressed in the text are those of the authors and do not necessarily reflect the views of the publisher.
Fieldwork was supported through the British Antarctic Survey and particular gratitude is given to the pilots and crew of the BAS Air Unit. David Small, Thomas Lees and Stephan Trabucatti would also like to acknowledge our BAS field guide, Sam Hunt for his extensive efforts in facilitating the fieldwork. Antarctic Logistics and Expeditions are also thanked for logistical support. This work would not have been possible, or successful, without extensive support and onsite training for which David Small thanks the U.S. Ice Drilling Program for support activities through NSF Cooperative Agreement no. 1836328. David Small would like to thank Ian Garrett for his help with electrical components during fieldwork preparations. We acknowledge the financial support from the Australian Government for the Centre for Accelerator Science at ANSTO through the National Collaborative Research Infrastructure Strategy (NCRIS). Thank you to Archana A. Joshi for preparing small carbon standards for the AMS run. We also thank Valerie Olive for making ICP-MS measurements. Finally, we would like to thank Florence Colleoni for editorial handling and Greg Balco and an anonymous reviewer for helpful and supportive comments that improved this paper.
This research has been supported by a Natural Environment Research Council Independent Research Fellowship (grant-nos. NE/T011963/1) and the NERC Geophysical Equipment Facility Loan (1144).
This paper was edited by Florence Colleoni and reviewed by Greg Balco and one anonymous referee.
Ackert Jr., R. P., Mukhopadhyay, S., Parizek, B. R., and Borns, H. W.: Ice elevation near the West Antarctic Ice Sheet divide during the last glaciation, Geophys. Res. Lett., 34, L21506, https://doi.org/10.1029/2007GL031412, 2007.
Adams, J. R., Johnson, J. S., Roberts, S. J., Mason, P. J., Nichols, K. A., Venturelli, R. A., Wilcken, K., Balco, G., Goehring, B., Hall, B., Woodward, J., and Rood, D. H.: New 10Be exposure ages improve Holocene ice sheet thinning history near the grounding line of Pope Glacier, Antarctica, The Cryosphere, 16, 4887–4905, https://doi.org/10.5194/tc-16-4887-2022, 2022.
Albrecht, T., Winkelmann, R., and Levermann, A.: Glacial-cycle simulations of the Antarctic Ice Sheet with the Parallel Ice Sheet Model (PISM) – Part 2: Parameter ensemble analysis, The Cryosphere, 14, 633–656, https://doi.org/10.5194/tc-14-633-2020, 2020.
Balco, G.: Reviewer comment on “A thinner-than-present West Antarctic Ice Sheet in the southern Weddell Sea Embayment during the Holocene”, RC1, https://doi.org/10.5194/egusphere-2025-4794-RC1, 2025.
Balco, G., Brown, N., Nichols, K., Venturelli, R. A., Adams, J., Braddock, S., Campbell, S., Goehring, B., Johnson, J. S., Rood, D. H., Wilcken, K., Hall, B., and Woodward, J.: Author comment on “Reversible ice sheet thinning in the Amundsen Sea Embayment during the Late Holocene”, AC2, https://doi.org/10.5194/tc-2022-172-AC2, 2022.
Balco, G., Brown, N., Nichols, K., Venturelli, R. A., Adams, J., Braddock, S., Campbell, S., Goehring, B., Johnson, J. S., Rood, D. H., Wilcken, K., Hall, B., and Woodward, J.: Reversible ice sheet thinning in the Amundsen Sea Embayment during the Late Holocene, The Cryosphere, 17, 1787–1801, https://doi.org/10.5194/tc-17-1787-2023, 2023.
Bentley, M. J., Fogwill, C. J., Le Brocq, A. M., Hubbard, A. L., Sugden, D. E., Dunai, T. J., and Freeman, S. P.: Deglacial history of the West Antarctic Ice Sheet in the Weddell Sea embayment: Constraints on past ice volume change, Geology, 38, 411–414, https://doi.org/10.1130/G30754.1, 2010.
Bintanja, R.: On the glaciological, meteorological, and climatological significance of Antarctic blue ice areas, Rev. Geophys., 37, 337–359, https://doi.org/10.1029/1999RG900007, 1999.
Bintanja, R., Severijns, C., Haarsma, R., and Hazeleger, W.: The future of Antarctica's surface winds simulated by a high-resolution global climate model: 2. Drivers of 21st century changes, J. Geophys. Res.-Atmos., 119, 7160–7178, https://doi.org/10.1002/2013JD020848, 2014.
Boeckmann, G. V., Gibson, C. J., Kuhl, T. W., Moravec, E., Johnson, J. A., Meulemans, Z., and Slawny, K.: Adaptation of the Winkie Drill for subglacial bedrock sampling, Ann. Glaciol., 62, 109–117, https://doi.org/10.1017/aog.2020.73, 2021.
Bradley, S. L., Hindmarsh, R. C., Whitehouse, P. L., Bentley, M. J., and King, M. A.: Low post-glacial rebound rates in the Weddell Sea due to Late Holocene ice-sheet readvance, Earth Planet. Sc. Lett., 413, 79–89, https://doi.org/10.1016/j.epsl.2014.12.039, 2015.
Braddock, S., Venturelli, R. A., Nichols, K., Moravec, E., Boeckmann, G. V., Campbell, S., Balco, G., Ackert, R., Small, D., Johnson, J. S., Dunbar, N., Woodward, J., Mukhopadhyay, S., and Goehrong, G.: Lessons learned from shallow subglacial bedrock drilling campaigns in Antarctica, Ann. Glaciol., 65, 1–11, https://doi.org/10.1017/aog.2024.12, 2024.
Brisbourne, A. M., Martin, C., Smith, A. M., Baird, A. F., Kendall, J. M., and Kingslake, J.: Constraining recent ice flow history at Korff Ice Rise, West Antarctica, using radar and seismic measurements of ice fabric, J. Geophys. Res.-Earth, 124, 175–194, https://doi.org/10.1029/2018JF004776, 2019.
Caron, L. and Ivins, E. R.: A baseline Antarctic GIA correction for space gravimetry, Earth Planet. Sc. Lett., 531, 115957, https://doi.org/10.1016/j.epsl.2019.115957, 2020.
Creel, R. C., Austermann, J., Kopp, R. E., Khan, N. S., Albrecht, T., and Kingslake, J.: Global mean sea level likely higher than present during the Holocene, Nat. Commun., 15, 10731, https://doi.org/10.1038/s41467-024-54535-0, 2024.
DeConto, R. M. and Pollard, D.: Contribution of Antarctica to past and future sea-level rise, Nature, 531, 591–597, https://doi.org/10.1038/nature17145, 2016.
Evans, D. J.: Controlled moraines: origins, characteristics and palaeoglaciological implications, Quaternary Sci. Rev., 28, 183–208, https://doi.org/10.1016/j.quascirev.2008.10.024, 2009.
Fink, D., Hotchkis, M., Hua, Q., Jacobsen, G., Smith, A. M., Zoppi, U., Child, D., Mifsud, C., van der Gaast, H., Williams, A., and Williams, M.: The ANTARES AMS facility at ANSTO, Nucl. Instrum. Meth. B, 223, 109–115, https://doi.org/10.1016/j.nimb.2004.04.025, 2004.
Fülöp, R. H., Fink, D., Yang, B., Codilean, A. T., Smith, A., Wacker, L., Levchenko, V., and Dunai, T. J.: The ANSTO-University of Wollongong in-situ 14C extraction laboratory, Nucl. Instrum. Meth. B, 438, 207–213, https://doi.org/10.1016/j.nimb.2018.04.018, 2019.
Grieman, M. M., Nehrbass-Ahles, C., Hoffmann, H. M., Bauska, T. K., King, A. C., Mulvaney, R., Rhodes, R. H., Rowell, I. F., Thomas, E. R., and Wolff, E. W.: Abrupt Holocene ice loss due to thinning and ungrounding in the Weddell Sea Embayment, Nat. Geosci., 17, 227–232, https://doi.org/10.1038/s41561-024-01375-8, 2024.
Gomez, N., Pollard, D., and Holland, D.: Sea-level feedback lowers projections of future Antarctic Ice-Sheet mass loss, Nat. Commun., 6, 8798, https://doi.org/10.1038/ncomms9798, 2015.
Gomez, N., Latychev, K., and Pollard, D.: A coupled ice sheet–sea level model incorporating 3D Earth structure: variations in Antarctica during the last deglacial retreat, J. Climate, 31, 4041–4054, https://doi.org/10.1175/JCLI-D-17-0352.1, 2018.
Gosse, J. C. and Phillips, F. M.: Terrestrial in situ cosmogenic nuclides: theory and application, Quaternary Sci. Rev., 20, 1475–1560, https://doi.org/10.1016/S0277-3791(00)00171-2, 2001.
Hein, A. S., Marrero, S. M., Woodward, J., Dunning, S. A., Winter, K., Westoby, M. J., Freeman, S. P., Shanks, R. P., and Sugden, D. E.: Mid-Holocene pulse of thinning in the Weddell Sea sector of the West Antarctic ice sheet, Nat. Commun, 7, 12511, https://doi.org/10.1038/ncomms12511, 2016.
Hill, E. A., Rosier, S. H. R., Gudmundsson, G. H., and Collins, M.: Quantifying the potential future contribution to global mean sea level from the Filchner–Ronne basin, Antarctica, The Cryosphere, 15, 4675–4702, https://doi.org/10.5194/tc-15-4675-2021, 2021.
Hillenbrand, C. D., Bentley, M. J., Stolldorf, T. D., Hein, A. S., Kuhn, G., Graham, A. G., Fogwill, C. J., Kristoffersen, Y., Smith, J. A., Anderson, J. B., and Larter, R. D.: Reconstruction of changes in the Weddell Sea sector of the Antarctic Ice Sheet since the Last Glacial Maximum, Quaternary Sci. Rev., 100, 111–136, https://doi.org/10.1016/j.quascirev.2013.07.020, 2014.
Hippe, K. and Lifton, N. A.; Calculating isotope ratios and nuclide concentrations for in situ cosmogenic 14C analyses, Radiocarbon, 56, 1167–1174, https://doi.org/10.2458/56.17917, 2014.
Johnson, J. S., Nichols, K. A., Goehring, B. M., Balco, G., and Schaefer, J. M.: Abrupt mid-Holocene ice loss in the western Weddell Sea Embayment of Antarctica, Earth Planet. Sc. Lett., 518, 127–135, https://doi.org/10.1016/j.epsl.2019.05.002, 2019.
Johnson, J. S., Venturelli, R. A., Balco, G., Allen, C. S., Braddock, S., Campbell, S., Goehring, B. M., Hall, B. L., Neff, P. D., Nichols, K. A., Rood, D. H., Thomas, E. R., and Woodward, J.: Review article: Existing and potential evidence for Holocene grounding line retreat and readvance in Antarctica, The Cryosphere, 16, 1543–1562, https://doi.org/10.5194/tc-16-1543-2022, 2022.
Jones, R. S., Johnson, J. S., Lin, Y., Mackintosh, A. N., Sefton, J. P., Smith, J. A., Thomas, E. R., and Whitehouse, P. L.: Stability of the Antarctic Ice Sheet during the pre-industrial Holocene, Nat. Rev. Earth Environ., 3, 500–515, https://doi.org/10.1038/s43017-022-00309-5, 2022.
Kachuck, S. B., Martin, D. F., Bassis, J. N., and Price, S. F.: Rapid viscoelastic deformation slows marine ice sheet instability at Pine Island Glacier, Geophys. Res. Lett., 47, e2019GL086446, https://doi.org/10.1029/2019GL086446, 2020.
King, M. A., Watson, C. S., and White, D.: GPS rates of vertical bedrock motion suggest Late Holocene Ice-Sheet readvance in a critical sector of East Antarctica, Geophys. Res. Lett., 49, e2021GL097232, https://doi.org/10.1029/2021GL097232, 2022.
Kingslake, J., Scherer, R. P., Albrecht, T., Coenen, J., Powell, R. D., Reese, R., Stansell, N. D., Tulaczyk, S., Wearing, M. G., and Whitehouse, P. L.: Extensive retreat and re-advance of the West Antarctic Ice Sheet during the Holocene, Nature, 558, 430–434, https://doi.org/10.1038/s41586-018-0208-x, 2018.
Koutnik, M. R., Fudge, T. J., Conway, H., Waddington, E. D., Neumann, T. A., Cuffey, K. M., Buizert, C., and Taylor, K. C.: Holocene accumulation and ice flow near the West Antarctic Ice Sheet Divide ice core site, J. Geophys. Res.-Earth, 121, 907–924, https://doi.org/10.1002/2015JF003668, 2016.
Luo, M., Chen, J., Liu, J., Qin, J., Owen, L. A., Han, F., Yang, H., Wang, H., Zhang, B., Yin, J., and Li, Y.: A test of rock surface luminescence dating using glaciofluvial boulders from the Chinese Pamir, Radiat. Meas., 120, 290–297, https://doi.org/10.1016/j.radmeas.2018.07.017, 2018.
Luo, M., Chen, J., Owen, L. A., Qin, J., Yin, J., Yang, H., Liu, J., Gong, Z., and Luo, J.: A novel approach for reconstructing slip histories for bedrock fault scarps using rock surface luminescence dating, Geophys. Res. Lett., 49, p.e2022GL099526, https://doi.org/10.1029/2022GL099526, 2022.
Lupker, M., Hippe, K., Wacker, L., Kober, F., Maden, C., Braucher, R., Bourlès, D., Romani, J. V., and Wieler, R.,: Depth-dependence of the production rate of in situ 14C in quartz from the Leymon High core, Spain, Quat. Geochronol., 28, 80–87, https://doi.org/10.1016/j.quageo.2015.04.004, 2015.
Marrero, S. M., Hein, A. S., Naylor, M., Attal, M., Shanks, R., Winter, K., Woodward, J., Dunning, S., Westoby, M., and Sugden, D.: Controls on subaerial erosion rates in Antarctica, Earth Planet. Sc. Lett., 501, 56–66, https://doi.org/10.1016/j.epsl.2018.08.018, 2018.
Matsuoka, K., Skoglund, A., Roth, G., de Pomereu, J., Griffiths, H., Headland, R., Herried, B., Katsumata, K., Le Brocq, A., Licht, K., Morgan, F., Neff, P. D., Ritz, C., Scheinert, M., Tamura, T. Van de Putte, A., van den Broeke, M., von Deschwanden, A., Deschamps-Berger, C., Van Liefferinge, B., Tronstad, S., and Melvær, Y.: Quantarctica, an integrated mapping environment for Antarctica, the Southern Ocean, and sub-Antarctic islands, Environ. Modell. Softw., 140, 105015, https://doi.org/10.1016/j.envsoft.2021.105015, 2021.
Nichols, K. A., Goehring, B. M., Balco, G., Johnson, J. S., Hein, A. S., and Todd, C.: New Last Glacial Maximum ice thickness constraints for the Weddell Sea Embayment, Antarctica, The Cryosphere, 13, 2935–2951, https://doi.org/10.5194/tc-13-2935-2019, 2019.
Nichols, K. A., Adams, J. R., Brown, K., Creel, R. C., McKenzie, M. A., Venturelli, R. A., Johnson, J. S., Rood, D. H., Wilcken, K., Woodward, J., and Roberts, S. J.: Direct geologic constraints on the timing of Late Holocene ice thickening in the Amundsen Sea Embayment, Antarctica, Geophys. Res. Lett., 51, e2024GL110350, https://doi.org/10.1029/2024GL110350, 2024.
Ou, X. J., Roberts, H. M., Duller, G. A. T., Gunn, M. D., and Perkins, W. T.: Attenuation of light in different rock types and implications for rock surface luminescence dating, Radiat. Meas., 120, 305–311., https://doi.org/10.1016/j.radmeas.2018.06.027 2018.
Pittard, M. L., Whitehouse, P. L., Bentley, M. J., and Small, D.: An ensemble of Antarctic deglacial simulations constrained by geological observations, Quaternary Sci. Rev., 298, 107800, https://doi.org/10.1016/j.quascirev.2022.107800, 2022.
Pritchard, H. D., Fretwell, P. T., Fremand, A. C., Bodart, J. A., Kirkham, J. D., Aitken, A., Bamber, J., Bell, R., Bianchi, C., Bingham, R. G. Blankenship, D. D., Casassa, G., Christianson, K., Conway, H., Corr, H. J. F., Cui, X., Damaske, D., Damm, V., Dorschel, B., Drews, R., Eagles, G., Eisen, O., Eisermann, H., Ferraccioli, F., Field, E., Forsberg, R., Franke, S., Goel, V., Gogineni, S. P., Greenbaum, J., Hills, B., Hindmarsh, R. C.A, Hoffman, A. O., Holschuh, N., Holt, J. W., Humbert, A., Jacobel, R. W., Jansen, D., Jenkins, A., Jokat, W., Jong, L., Jordan, T. A., King, E. C., Kohler, J., Krabill, W., Maton, J., Gillespie, K. M., Langley, K., Lee, J., Leitchenkov, G., Leuschen, C., Luyendyk, B., MacGregor, J.A, MacKie, E., Moholdt, G., Matsuoka, K., Morlighem, M., Mouginot, J., Nitsche, F. O. Nost, O. A., Paden, J., Pattyn, F., Popov, S., Rignot, E., Rippin, D. M., Rivera, A., Roberts, J. L., Ross, N., Ruppel, A., Schroeder, D. M., Siegert, M. J., Smith, A. M., Steinhage, D., Studinger, M., Sun, B., Tabacco, I., Tinto, K. J., Urbini, S., Vaughan, D. G., Wilson, D. S., Young, D. A., and Zirizzotti, A.: Bedmap3 updated ice bed, surface and thickness gridded datasets for Antarctica, Sci. Data, 12, 414, https://doi.org/10.1038/s41597-025-04672-y, 2025.
Rignot, E., Mouginot, J., Scheuchl, B., Van Den Broeke, M., Van Wessem, M. J., and Morlighem, M.: Four decades of Antarctic Ice Sheet mass balance from 1979–2017, P. Natl. Acad. Sci. USA, 116, 1095–1103, https://doi.org/10.1073/pnas.1812883116, 2019.
Ross, N., Bingham, R. G., Corr, H. F., Ferraccioli, F., Jordan, T. A., Le Brocq, A., Rippin, D. M., Young, D., Blankenship, D. D., and Siegert, M. J.: Steep reverse bed slope at the grounding line of the Weddell Sea sector in West Antarctica, Nat. Geosci., 5, 393–396, https://doi.org/10.1038/ngeo1468, 2012.
Ross, N., Sanderson, R. J., Kulessa, B., Siegert, M., Paxman, G. J. G., Nichols, K. A., Siegfried, M. R., Jamieson, S. S. R., Bentley, M. J., Jordan, T. A., Batchelor, C. L., Small, D., Eisen, O., Winter, K., Bingham, R. G., Callard, S. L., Carr, R., Dow, C. F., Fricker, H. A., Hill, E., Hills, B. H., Hofstede, C., Jeofry, H., Napoleoni, F., and Sauthoff, W.: Review Article: The Foundation-Patuxent-Academy ice stream system, Antarctica, EGUsphere [preprint], https://doi.org/10.5194/egusphere-2025-3625, 2025.
Siegert, M., Ross, N., Corr, H., Kingslake, J., and Hindmarsh, R.: Late Holocene ice-flow reconfiguration in the Weddell Sea sector of West Antarctica, Quaternary Sci. Rev., 98–107, https://doi.org/10.1016/j.quascirev.2013.08.004, 2013.
Siegert, M. J., Kingslake, J., Ross, N., Whitehouse, P. L., Woodward, J., Jamieson, S. S., Bentley, M. J., Winter, K., Wearing, M., Hein, A. S., and Jeofry, H.: Major ice sheet change in the Weddell Sea sector of West Antarctica over the last 5000 years, Rev. Geophys., 57, 1197–1223, https://doi.org/10.1029/2019RG000651, 2019.
Small, D., Smedley, R., Dunai, T., Lees, T., Trabucatti, S., and Boeckmann, G.: New geological constraints on Holocene retreat-readvance of the West Antarctic Ice Sheet in the Weddell Sea Embayment, EGU General Assembly 2024, Vienna, Austria, 14–19 Apr 2024, EGU24-12136, https://doi.org/10.5194/egusphere-egu24-12136, 2024.
Smith, A. M., Hua, Q., Williams, A., Levchenko, V., and Yang, B.: Developments in micro-sample 14C AMS at the ANTARES AMS facility, Nucl. Instrum. Meth. B, 268, 919–923, https://doi.org/10.1016/j.nimb.2009.10.064, 2010.
Sohbati, R., Murray, A. S., Jain, M., Buylaert, J. P., and Thomsen, K. J.: Investigating the resetting of OSL signals in rock surfaces, Geochronometria, 38, 249–258, https://doi.org/10.2478/s13386-011-0029-2, 2011.
Sohbati, R., Murray, A. S., Chapot, M. S., Jain, M., and Pederson, J.: Optically stimulated luminescence (OSL) as a chronometer for surface exposure dating, J. Geophys. Res.-Sol. Ea., 117, B09202, https://doi.org/10.1029/2012JB009383, 2012.
Spörli, K. B.: Stratigraphy of the Crashsite Group, Ellsworth Mountains, West Antarctica, Memoir of the Geological Society of America, 170, 21–35, https://doi.org/10.1130/MEM170-p21, 1992.
Stone, J. O.: Air pressure and cosmogenic isotope production, J. Geophys. Res.-Sol. Ea., 105, 23753–23759, https://doi.org/10.1029/2000JB900181, 2000.
Thomsen, K. J., Jain, M., Murray, A. S., Denby, P. M., Roy, N., and Bøtter-Jensen, L.: Minimizing feldspar OSL contamination in quartz UV-OSL using pulsed blue stimulation, Radiat. Meas., 43, 752–757, https://doi.org/10.1016/j.radmeas.2008.01.020, 2008.
Van Den Broeke, M. and Bintanja, R.: The interaction of katabatic winds and the formation of blue-ice areas in East Antarctica, J. Glaciol., 41, 395–407, https://doi.org/10.3189/S0022143000016269, 1995.
Venturelli, R. A., Siegfried, M. R., Roush, K. A., Li, W., Burnett, J., Zook, R., Fricker, H. A., Priscu, J. C., Leventer, A., and Rosenheim, B. E.: Mid-Holocene grounding line retreat and readvance at Whillans Ice Stream, west Antarctica, Geophys. Res. Lett., 47, e2020GL088476, https://doi.org/10.1029/2020GL088476, 2020.
Venturelli, R. A., Boehman, B., Davis, C., Hawkings, J. R., Johnston, S. E., Gustafson, C. D., Michaud, A. B., Mosbeux, C., Siegfried, M. R., Vick-Majors, T. J., Galy, V., Spencer, R. G. M., Warny, S., Christner, B. C., Fricker, H. A., Harwood, D. M., Leventer, A., Priscu, J. C., Rosenheim, B. E., and SALSA Science Team: Constraints on the timing and extent of deglacial grounding line retreat in West Antarctica, AGU Adv., 4, e2022AV000846, https://doi.org/10.1029/2022AV000846, 2023.
Wang, Y., Zhang, X., Ning, W., Lazzara, M. A., Ding, M., Reijmer, C. H., Smeets, P. C. J. P., Grigioni, P., Heil, P., Thomas, E. R., Mikolajczyk, D., Welhouse, L. J., Keller, L. M., Zhai, Z., Sun, Y., and Hou, S.: The AntAWS dataset: a compilation of Antarctic automatic weather station observations, Earth Syst. Sci. Data, 15, 411–429, https://doi.org/10.5194/essd-15-411-2023, 2023.
Woodward, J., Hein, A., Winter, K., Westoby, M. J., Marrero, S., Dunning, S. A., Lim, M., Rivera, A., and Sugden, D.: Blue-ice moraines formation in the Heritage Range, West Antarctica: Implications for ice sheet history and climate reconstruction, Quat. Sci. Adv., 6, 100051, https://doi.org/10.1016/j.qsa.2022.100051, 2022.
Zhou, S., Meijers, A. J., Meredith, M. P., Abrahamsen, E. P., Holland, P. R., Silvano, A., Sallée, J. B., and Østerhus, S.: Slowdown of Antarctic Bottom Water export driven by climatic wind and sea-ice changes, Nat. Clim. Change, 13, 701–709, https://doi.org/10.1038/s41558-023-01695-4, 2023.