the Creative Commons Attribution 4.0 License.
the Creative Commons Attribution 4.0 License.
 | 01 Apr 2026
Past and future changes in avalanche problems in northern Norway estimated with machine-learning models
Rune Grand Graversen
Snow-avalanche hazard in mountainous areas may change in frequency and severity due to climatic change, especially in Arctic regions such as northern Norway where temperature change is amplified. Expanding earlier work, we train machine-learning (ML) models on dynamically downscaled reanalysis data including snow-cover simulations to predict avalanche danger for the Troms county in northern Norway. In contrast to earlier work, the trained ML models can distinguish between avalanche types, in particular those of dry and wet snow. Due to insufficient avalanche observations, we construct a binary metric (avalanche day/non-avalanche day) based on the avalanche danger warnings published in the Norwegian avalanche bulletin. The ML models provide a hindcast of the frequency of avalanche days for the period 1970–2024 (based on reanalysis) and a projection into the future for the 21st century (based on climate model simulations). Over the historical period the results confirm earlier studies showing that while multi-decadal linear trends are marginal, the interannual variability of the avalanche-day frequency is linked to the Arctic Oscillation. The projected future changes indicate a general decrease of avalanche danger, especially for dry-snow avalanches. In contrast, wet-snow avalanche danger exhibits changes dependent on elevation, increasing at all elevations until mid-century, but thereafter continuing the increase only at higher elevation, while at lower elevation reversing to a decrease. Our results are in line with an emerging consensus of an overall decline of avalanche danger in the 21st century and a shift in avalanche characteristics towards fewer dry and more wet-snow avalanches. Such a shift can be challenging for avalanche-prone populations as the current knowledge of the local avalanche conditions may become less relevant and increasingly fail to provide protection from the avalanche hazard.
- Article
(4740 KB) - Full-text XML
-
Supplement
(1022 KB) - BibTeX
- EndNote


Changes in climatic conditions, as observed during the 20th and as projected for the 21st century, impact the occurrence and character of natural hazards (Hock et al., 2019). This is especially true for the types of natural hazards that are strongly influenced by meteorological parameters, such as snow avalanches. In the mountainous regions of Arctic Norway, snow avalanches are one of the most important natural hazards, threatening life, property, and infrastructure. According to data acquired from Norway's national mass-movement database (Nasjonale Skredhendelsesdatabasen, NSDB), from 1748 to the winter season 2024/2025 snow avalanches have caused 354 fatalities in the northern-Norwegian county of Troms as shown in Fig. 1. Given the likely accelerated climate change in the Arctic due to Arctic amplification (i.e., the Arctic warming at a higher pace than the global average; e.g., Manabe and Stouffer, 1980; Graversen et al., 2008; Serreze et al., 2009; IPCC, 2023), enhanced impacts on snow avalanches in this region relative to, for instance, the Alps are to be expected.
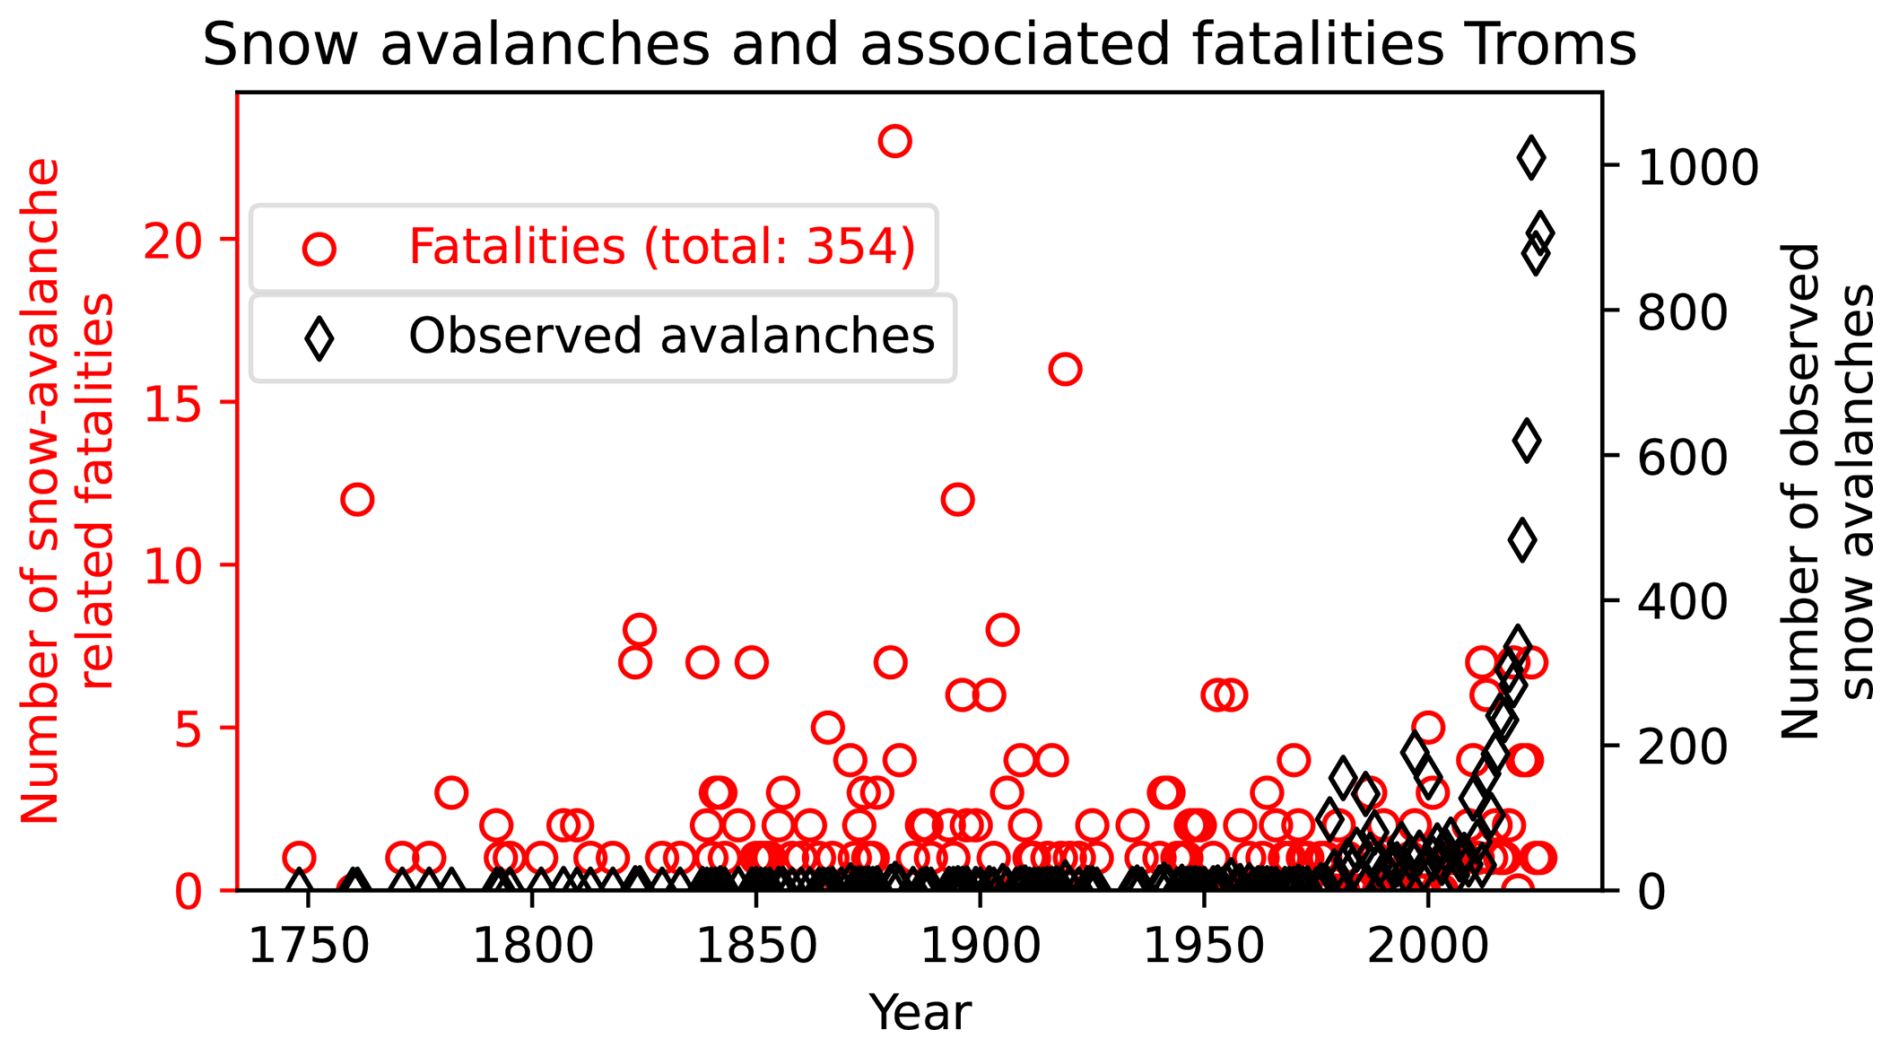
Figure 1Time series of snow-avalanche related fatalities (red) and observed snow avalanches (black) in Troms county, Norway. The data are provided by the Norwegian Water Resources and Energy Directorate (NVE) and can be downloaded from https://nedlasting.nve.no/gis/ (last access: 5 August 2025).
Generally, the effects of climate change on snow avalanches appear to result in a decrease of the avalanche danger, especially at low elevations, in the form of a decreasing number, size, seasonality and active paths of avalanches, as summarised in the recent comprehensive review by Eckert et al. (2024). However, they also noted that increased snowfall at higher elevation may lead to increased snow-avalanche activity there, and that a shift from dry to wet avalanches due to increased warming is likely. Despite these rather clear effects, Eckert et al. (2024) observed that historical trends of avalanche frequency remain “elusive” (see also Førland et al., 2007; Sinickas et al., 2016; Gądek et al., 2017; Hao et al., 2023; Eiselt and Graversen, 2025) due to avalanche cycles and strong decadal variability. Negative historical trends have been found for the Swiss Alps (Teich et al., 2012), the French Alps (Eckert et al., 2013), and the Rocky Mountains (Peitzsch et al., 2021), while for the Himalayas (Ballesteros-Cánovas et al., 2018), and the Tianshan Mountains in China (Hao et al., 2023) positive trends were reported (in the latter region being not statistically significant). As noted by Eckert et al. (2024), the different trends are reconciled by elevation dependence and the simultaneous rise in temperature and precipitation. That is, warming and more liquid precipitation at low elevations cause a decline in snow cover and consequently in avalanche activity, while at higher elevation the increased precipitation is still mostly snow, leading to more, but, due to higher temperatures, wetter snow cover, increasing avalanche activity, in particular of the wet type.
To study possible future trends of avalanche activity, future climate-model projections may be employed. The phases 3, 5, and 6 of the Coupled Model Intercomparison Project (CMIP; Meehl et al., 2007; Taylor et al., 2012; Eyring et al., 2016, respectively) now provide a large archive of future climate projections based on numerical global climate models (GCMs) run for the Special Report on Emission Scenarios (SRES) future emission scenarios (IPCC, 2000), the Representative Concentration Pathways (RCPs; Moss et al., 2010; van Vuuren et al., 2011), and the Shared Socioeconomic Pathways (SSPs; Riahi et al., 2017). However, the resolution of these GCMs on 𝒪(100) km is too coarse to provide meaningful data for robust projection of avalanche activity. Thus, to exploit the GCM outputs for purposes that require finer resolution, statistical and dynamical downscalings may be utilised. Due to the large computational costs of high-resolution dynamical downscalings, they are typically confined to specific regions, using the GCM simulation outputs as boundary conditions. For Norway, such a dynamical downscaling is provided in the form of the Nordic Convection Permitting Climate Projections (NorCP; Lind et al., 2020, 2023), making available high-resolution (3 km) 21st-century climate projections for Scandinavia. In order to use the climate data for the investigation of future avalanche activity, statistical models may be invoked to find linkages between meteorological variables and avalanche occurrence. The statistical prediction of avalanche activity based on meteorological data has a long history and has recently gained momentum, likely spurred by advances in artificial intelligence technology (for reviews see Dkengne Sielenou et al., 2021; Eiselt and Graversen, 2025). The statistical models trained on historical meteorological data and avalanche records can then be applied to the GCM downscalings such as NorCP to project the avalanche activity into the future.
To the authors' knowledge, Martin et al. (2001) was the first study investigating the change of avalanche activity under changing climatic conditions based on a statistical linkage between meteorological parameters and avalanches. By implementing constant positive perturbations of temperature and precipitation in their statistical model, they found for a study area in the French Alps that while new-snow avalanches declined, wet-snow avalanches increased in frequency (at least relatively). Lazar and Williams (2008) were likely the first to employ future emission scenarios to investigate the future development of avalanche activity or danger, although they simply defined their avalanche periods based on a temperature threshold. They employed the SRES scenarios B1, A1B, and A1F1 (low, mid-range, and high emissions, respectively; IPCC, 2000) and a dynamical-statistical downscaling of the GCM outputs for the Aspen ski area in the Rocky Mountains, Colorado, to obtain the required high-resolution data for avalanche prediction. Additionally, they used a snowmelt runoff model as well as a snow-mass-balance model to derive more information on the snowpack and snow cover. By investigating changes in the timing of wet avalanche activity for the years 2030 and 2100, they found that already by 2030 wet avalanche periods started several days earlier than in the historical average (1980–2000). By 2100 the changes in timing depended strongly on the emission scenario, with wet avalanche periods starting over a month earlier than in the historical average in the high-emission A1F1 scenario. A further important study of future avalanche activity change was conducted by Castebrunet et al. (2014), who used emission scenarios (B1, A1B, A2) similar to Lazar and Williams (2008), in a dynamical-statistical downscaling for the French Alps. Based on these data, they employed the French model chain SAFRAN-Crocus-MEPRA (Durand et al., 1999, 2009) to provide sophisticated snow and meteorological conditions to feed statistical models to predict avalanche activity. The avalanche activity was investigated for the periods 2021–2050 and 2071–2100 and compared to the historical period 1961–1990. Similar to Lazar and Williams (2008), Castebrunet et al. (2014) found that wet avalanches tend to appear earlier in the season in the future climate. In general, they observed a decrease of the avalanche activity by 20 %–30 % throughout the 21st century compared to 1961–1990, both as regards the mean and the interannual variability. However, there were differences depending on season (spring, winter) and elevation. The decrease in activity was pronounced in spring and at low elevation, while winter avalanche activity in fact increased at high elevation. Latitudinal variation (at least across the study region of the French Alps) had only a small effect. Finally, Castebrunet et al. (2014) found only a relatively small dependence of the avalanche activity changes on the selected emission scenario, which, however, was still large enough that they noted that the current climate policies may have some effect on future avalanche activity. More recently, Katsuyama et al. (2023) studied weak layers in the snowpack in a +4 °C climate in Japan based on an ensemble of GCM projections using a regional dynamical downscaling and the snow model SNOWPACK (Bartelt and Lehning, 2002; Lehning et al., 2002a, b; Morin et al., 2020). They found a general elevation-independent decrease of the probability of weak layer formation in the 4 °C warmer climate, mostly due to higher air temperatures, the decrease being only partly counteracted by an increase in snowfall intensity. However, as they pointed out, only dry avalanches were considered in their study, meaning that a potential wet avalanche increase as reported in some other studies could not be found by design. The most recent study on avalanche activity change in the future climate is Mayer et al. (2024), expanding on Mayer et al. (2023a). They utilised the Swiss CH2018 climate change scenarios (CH2018, 2018; Fischer et al., 2022) based on the EURO-CORDEX dynamical downscalings (Jacob et al., 2014) for several RPCs (RPC2.6, RPC4.5, RPC8.5, implying low, medium, and high emissions, respectively) to project avalanche activity in the Swiss Alps throughout the 21st century. The data were further downscaled statistically to the locations of individual weather stations across the Swiss Alps. Both dry and wet avalanche activity were considered, based on the newly-developed statistical models of Mayer et al. (2023b) and Hendrick et al. (2023), respectively. A clear decline of dry avalanche activity was found for all stations and scenarios, strongest (up to about 65 %) in RCP8.5 by the end of the 21st century. In contrast, the wet avalanche activity change was elevation dependent, with decreases below 2300 m a.s.l. (meter above sea level) and increases above. In total, above 2300 m a.s.l. the dry and wet activity changes mostly compensated each other (only about 10 % net decline). For both wet and dry activity, differences between the RCPs were found, with avalanche activity changes generally levelling off by mid-century in RCP2.6 and RCP4.5, while in RCP8.5 the decline was monotonic throughout the century. In an analysis of the grain types simulated with SNOWPACK, Mayer et al. (2024) further indicated that the occurrence of persistent weak layers associated with dry-snow avalanches also declines in the 21st century, consistent with the results of Katsuyama et al. (2023).
The aim of the present study is to perform analyses of past and future avalanche activity change for the northern-Norwegian county of Troms. For this purpose we have the necessary historical and climate projection data available from the 3 km Norwegian Reanalysis (NORA3) and the NorCP archive, respectively. However, we first need to generate a suitable statistical model that can predict the avalanche activity or a related quantity from these data. In Norway, avalanche records are few and the recording methodology has changed over time, resulting in inhomogeneous data sets (Førland et al., 2007; Jaedicke et al., 2009). This is especially so in the sparsely populated county of Troms. Figure 1, in addition to the above-mentioned fatalities, also depicts the number of observed snow avalanches in Troms, which exhibits an exponential increase after the year 2000. Rather than an actual trend in avalanche occurrence, this increase likely reflects the increasing usage of the database (Jaedicke et al., 2009), the establishment of the Norwegian Avalanche Warning Service (NAWS) in 2013 (Engeset, 2013; Müller et al., 2013), and the increasing winter recreational activity in Norway (Engeset et al., 2018b), with people in the field reporting avalanches via online platforms (Engeset et al., 2018a). Given the insufficient observational data, we here follow Eiselt and Graversen (2025) and train statistical models based on the information from the Norwegian avalanche bulletin published daily on the online platform Varsom (https://www.varsom.no, last access: 23 March 2026). In contrast to Eiselt and Graversen (2025) we not only investigate the general avalanche danger level (ADL) but also the danger levels (DLs) of the individual avalanche problems (APs) wind slab, persistent weak layer (PWL) slab, and wet snow. The DLs in the Norwegian avalanche bulletin are in accordance with the European Avalanche Warning Services' (EAWS) standard five-level scale. To derive a measure related to avalanche activity, we apply the binary classification from Eiselt and Graversen (2025) to differentiate avalanche days (AvDs) and non-avalanche days (non-AvDs) based on the DLs. The number of AvDs per season is called the avalanche-day frequency (ADF) and used as the metric to gauge the avalanche activity in the past and future northern-Norwegian climate. Concurring with earlier work (e.g., Pérez-Guillén et al., 2022; Mayer et al., 2023b; Hendrick et al., 2023; Eiselt and Graversen, 2025), random forest (RF) models (Breiman, 2001) are employed to predict the AvDs for the three APs and the general avalanche problem, using predictive features generated from NORA3 and NorCP, including simulations with the physics-based snow-cover model SNOWPACK to obtain more information on the snow stratigraphy.
The remainder of the study is structured as follows: Section 2 describes the data, comprised of the Norwegian avalanche bulletin (Sect. 2.1), the NORA3 reanalysis (Sect. 2.2), the NorCP archive (Sect. 2.3), the SNOWPACK simulations (Sect. 2.4), and the predictive features (Sect. 2.5). Section 3, after briefly informing about the RF model (Sect. 3.1) and the class balancing (Sect. 3.2), explains the RF model optimisation and feature selection procedure (Sect. 3.3). Section 4 gives a brief analysis of the model performance and the feature importances. The results are presented in Sect. 5, first covering the past (Sect. 5.1) and subsequently the future (Sect. 5.2). Section 6 offers a discussion on the model performance (Sect. 6.1), the past changes (Sect. 6.2), the future changes (Sect. 6.3) and the limitations of the study (Sect. 6.4). Finally, Sect. 7 summarises and concludes the study.
2.1 Norwegian avalanche bulletin
The Norwegian avalanche bulletin is published daily (before 16:00 LT) from 1 December–31 May on the online platform Varsom (https://www.varsom.no; Johnsen, 2013; Engeset, 2013; Varsom, 2025) for the current day (nowcast) and the two following days (forecast). The main feature of the bulletin is the ADL on the five-level scale in accordance with the EAWS' standards (EAWS, 2025a; Varsom, 2025a) for 23 warning regions on mainland Norway (the average warning-region size is about 9000 km2; Eiselt and Graversen, 2025). To determine the ADL, the forecasters first identify the relevant APs, which are also published as part of the avalanche bulletin. In Norway, the following seven different APs are considered (Varsom, 2025b), again following the EAWS' standards (EAWS, 2025b): new snow (loose and slab), wind slab, PWL slab, wet (loose and slab), and gliding snow. For each of the identified problems, a DL is determined based on the estimated avalanche size and likelihood, the latter being derived from the spatial distribution of hazardous sites and the sensitivity to triggers (Müller et al., 2016a, b; Statham et al., 2018; Müller et al., 2023). The final general ADL is then issued as the maximum DL of the individual APs. However, this procedure is not strictly applied and the setting of the final ADL is subject to the judgement of the forecasters, meaning that the published ADL does not always correspond to the maximum DL found across the APs. Note that only the general ADL is published on Varsom, while for the individual APs danger levels are not provided publicly.
Like Eiselt and Graversen (2025), we here consider the five northern-Norwegian warning regions of Nord-Troms, Lyngen, Tromsø, Sør-Troms, and Indre Troms (average size about 6800 km2; see also Eiselt and Graversen, 2025) as shown in Fig. 2. These regions differ in terms of continentality (Fig. 2a; see also Dyrrdal et al., 2020) and elevation (Fig. 2b). Lyngen and especially Nord-Troms and Indre Troms exhibit much higher elevations than Tromsø and Sør-Troms. Accordingly, where relevant, the latter two will be referred to in the following as “low-elevation” regions and the former three as “high-elevation” regions.
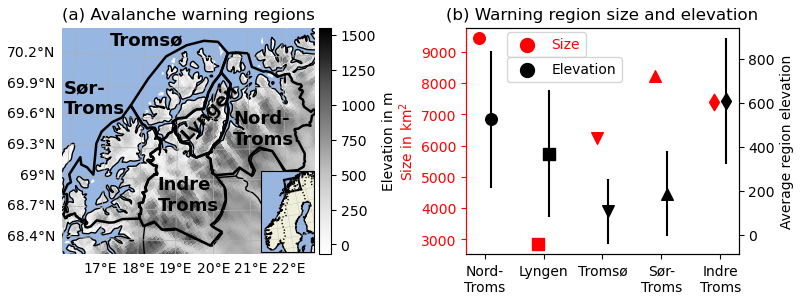
Figure 2(a) Study region with NORA3 topography information and the borders of the individual warning regions (the figure is adapted from Fig. 1 in Eiselt and Graversen, 2025). (b) The size (red) of each warning region in km2 and the average elevation (black) of each study region, including the standard deviation indicated by the error bars.
Instead of solely relying on the general ADL as in Eiselt and Graversen (2025), in this study the three APs wind slab, PWL slab, and wet (loose and slab combined) snow are also considered. The NAWS initiated the avalanche bulletin in 2013. However, since in the winter of 2016/2017 the warning-region setup was changed (Karsten Müller, personal communication, 2024), continuous data availability encompasses the winters 2016/2017 through 2024/2025. For the present study, the general ADL was available for the entire period, but because of an issue regarding the reporting, we could only obtain data from 2017/2018 and onward for the individual APs. The nowcast data were downloaded from the Norwegian Water Resources and Energy Directorate's (NVE) platform Regobs (https://www.regobs.no/, last access: 5 August 2025, Engeset et al., 2018a) which is conveniently accessible with the Python library Regobslib (https://pypi.org/project/regobslib/, last access 5 August 2025). As shown in Fig. 3, the most frequently identified AP in northern Norway is the wind slab, followed by the PWL slab. The least frequent APs are new loose and new slab snow and the glide slab; because of their infrequency they were not considered in this study. Figure 3 further shows that the general ADL averaged across all available values in the five considered warning regions is about 2.2, being very similar to the average wind slab and wet snow DL. The PWL slab DL is on average somewhat higher at about 2.5, while the highest average DL is about 2.8 for the wet slab. However, the latter AP is only seldom identified and for the purposes of the current study is combined with the wet loose AP to obtain what is here referred to as the wet snow AP.
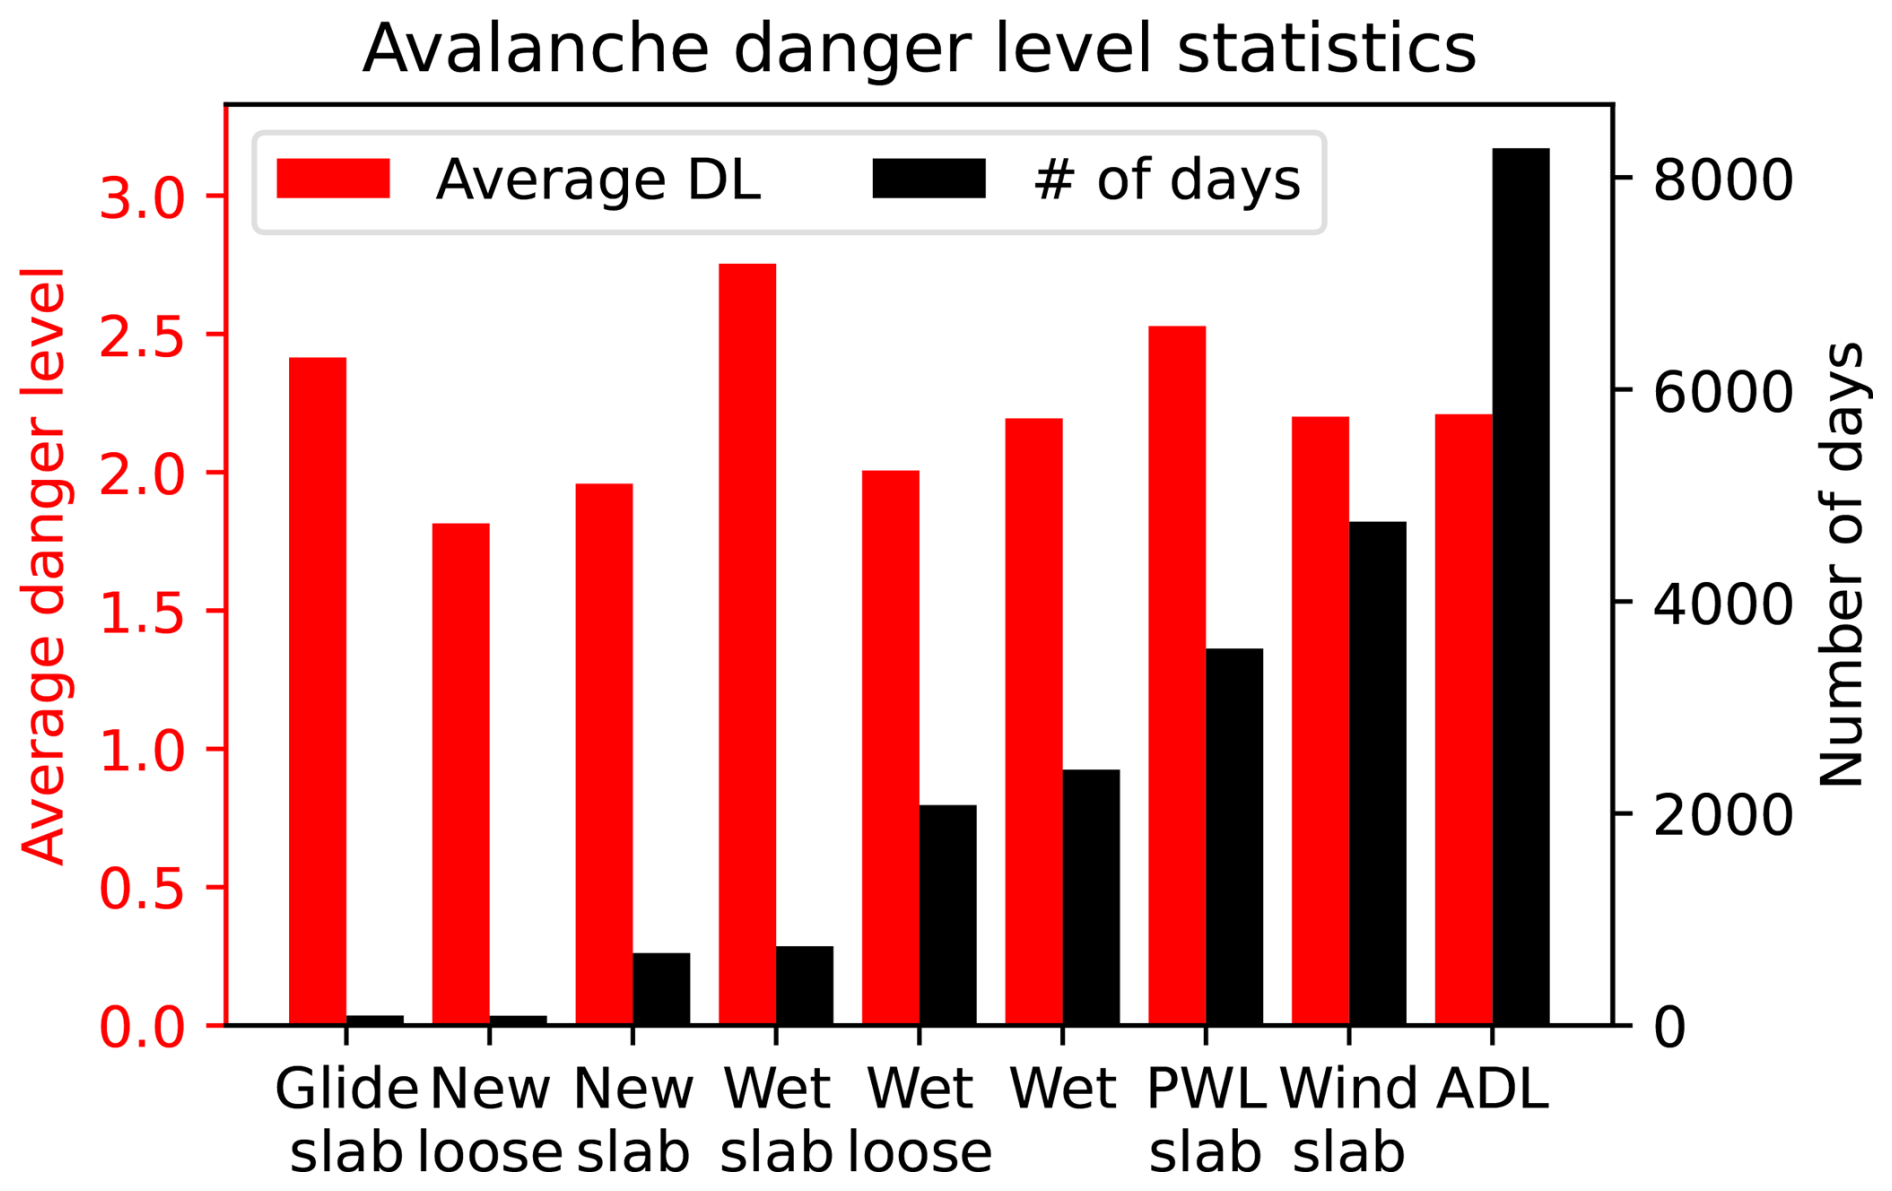
Figure 3Average danger level per avalanche problem (AP; red) and the number of days on which the AP was identified by the forecasters (black) in northern Norway. The average danger level was calculated only for the days the specific AP was identified. The ADL (avalanche danger level) on the x axis refers to the general avalanche problem. The data cover the period from winter 2016/2017–2024/2025 for the general avalanche problem and 2017/2018–2024/2025 for the other APs.
The AP data downloaded from Regobs do not provide the DLs for the APs directly, but rather the parameters size, sensitivity and distribution. We use the methodology presented in Müller et al. (2016a, 2023) to first convert sensitivity and distribution into the likelihood and to subsequently determine the DL from likelihood and size (the procedure is available from Eiselt, 2026a).
To obtain a metric relating avalanche activity to the avalanche warnings, we follow Eiselt and Graversen (2025) and aggregate the DLs 1 and 2 to “non-avalanche days” (non-AvDs) and DLs≥3 to “avalanche days” (AvDs; see also Pérez-Guillén et al., 2024; Techel et al., 2024). The number of AvDs per season is referred to as the avalanche-day frequency (ADF) and is here interpreted as a metric that gives an indication of avalanche activity. However, we caution against over-interpreting our metric as a proxy for avalanche occurrence, since even higher DLs (especially DL 3) do not necessarily correspond to a consistent probability of avalanche release across time and space. The AvD/non-AvD aggregation was performed for the general ADL as well as for the three individual APs, wind slab, PWL slab, and wet snow.
2.2 NORA3
For historical meteorological data, we utilise the 3 km Norwegian Reanalysis (NORA3). In fact, NORA3 appears as a mixture of a hindcast and a conventional reanalysis as it includes data assimilation only for surface parameters (Haakenstad et al., 2021; Haakenstad and Breivik, 2022). It provides a regional dynamical downscaling to 3 km horizontal resolution for northern Europe of the latest version of the European Centre for Medium-Range Weather Forecasts (ECMWF) reanalysis, ERA5, which has a 31 km horizontal resolution (Hersbach et al., 2020). To produce NORA3, the non-hydrostatic convection-permitting numerical weather model HARMONIE-AROME (Bengtsson et al., 2017) was run on a 3 km horizontal resolution and with 65 vertical layers, using ERA5 fields as initial and boundary conditions. At the time of writing, data availability covers the period from January 1970–November 2024. Thus, our historical analysis comprises the winters 1970/1971 through 2023/2024. NORA3 is constantly updated with six to seven months lag; an extension backward in time to 1960 is planned (Norwegian Meteorological Institute, 2025b). For a more detailed summary on NORA3 see Eiselt and Graversen (2025).
2.3 NorCP
To investigate potential future changes in avalanche danger, we exploit the Nordic Convection Permitting Climate Projections (NorCP; Lind et al., 2020, 2023). NorCP provides a regional 3 km downscaling for northern Europe with a focus on Fenno-Scandinavia, of output from two members of the Coupled Model Intercomparison Project Phase 5 (CMIP5) as boundary conditions. The simulations were performed with cycle 38 of the HARMONIE-Climate model (HCLIM38) on a 3 km horizontal grid using the AROME physics package, which is designed for models run at convection-permitting resolutions (Lind et al., 2020; for more details on HCLIM38 see Belušić et al., 2020). Because of the large computational resource requirements of HCLIM38, no ensemble runs were performed (Lind et al., 2023), and instead the two CMIP5 members (CMIP6 had not yet been available at the start of the NorCP project) were chosen such as to represent “middle-of-the-road” climate-response models with EC-Earth (Hazeleger et al., 2010, 2012) and models having a stronger warming and precipitation response with GFDL-CM3 (Griffies et al., 2011; Donner et al., 2011). For EC-Earth, the two future emission scenarios RCP4.5 and RCP8.5 (Moss et al., 2010; van Vuuren et al., 2011) were simulated, while, due to computational limitations, for GFDL-CM3, only RCP8.5 was run (Lind et al., 2023). The simulations were performed for a mid-century (2040–2060) and a late-century (2080–2100) period, in addition to a historical run (1985–2005). The RCP8.5 scenario is typically referred to as the “business-as-usual” scenario, i.e. resembling a continuation of current global emission policies (Hausfather and Peters, 2020a). However, following recent developments, the Intergovernmental Panel on Climate Change (IPCC) acknowledged in their latest Assessment Report (AR6) that the likelihood of RCP8.5 should be considered low (IPCC, 2023, p. 238f.), as was also the original rationale (Moss et al., 2010). According to Hausfather and Peters (2020b), RCP4.5 should be seen as the more likely scenario, although this consideration is not without debate (Schwalm et al., 2020).
In their evaluation of the NorCP model setup using ERA-Interim (Dee et al., 2011) as boundary conditions, Lind et al. (2020) found that this downscaling especially improves the simulated precipitation, in particular with a more realistic representation of high-intensity events (which is similar to the improvements reported for NORA3; see Haakenstad et al., 2021; Haakenstad and Breivik, 2022). However, some important biases were also found, mainly too-low near-surface temperature (mostly in summer) and a too-high amount of winter precipitation, especially over complex orography.
While the NORA3 and NorCP spatial resolutions are identical, the geographical coordinate systems are still different. Thus, to ensure that the same grid-cell locations are selected for both datasets the NorCP data are re-gridded to the NORA3 coordinate system using the bilinear interpolation function remapbil from the Climate Data Operators (CDO) software (Schulzweida, 2023).
2.4 SNOWPACK simulations
To obtain more detailed information on the snow cover, we run version 3.6.0 of the physics-based, multi-layer snow model SNOWPACK (Bartelt and Lehning, 2002; Lehning et al., 2002a, b). The model solves the governing conservation equations (for mass, energy, and momentum) within the snowpack and simulates the snow cover one-dimensionally. We run SNOWPACK with a 15 min computation time step, Neumann boundary conditions at the snow–atmosphere boundary, and the bucket scheme approach (Bartelt and Lehning, 2002) to simulate liquid water flow through the snow and soil. For atmospheric stability, the simplified Richardson-number correction is applied. For soil evaporation, the standard resistance approach is employed, and fitted values are used for soil thermal conductivity.
Several approximations are implemented to derive the necessary input data for SNOWPACK from NORA3 and NorCP. From NORA3, the 2 m air temperature (TAS), relative humidity (RH), wind speed, wind direction, the net short-wave radiation at surface (NSW), and the precipitation amount are available as hourly values. For the ground temperature, we make the simplification of using as a constant value the temporal mean of the TAS. For the surface temperature (TS), we build a linear model from ERA5 data predicting TS from TAS, wind speed, and long and short-wave net radiation at surface. This model is described in Sect. S1 in the Supplement. For NorCP, instead of the NSW and TS we use the incoming short- and long-wave radiation at surface. The RH in the NorCP data is 3 hourly and is here interpolated linearly to hourly values. The remaining parameters are the same as for NORA3.
To reduce computational resource requirements, and given the large warning regions, we perform a spatial aggregation of the 3 km NORA3 and NorCP data as follows: Four elevation bands (0–300 m a.s.l., 300–600, 600–900, and 900–1200 m) are defined, and for each elevation band, the data for the respective grid cells are averaged per warning region. These averages were then used as input for SNOWPACK, assuming flat terrain, leading to four SNOWPACK simulations per warning region. This means that in our study region of Troms county, 20 SNOWPACK simulations are performed, both for the NORA3 historical data and for each NorCP future climate scenario.
2.5 Predictive features for avalanche danger
The predictive features used as input for the machine-learning (ML) models are presented in Tables C1 and C2 in Appendix C. They are selected based on basic physical understanding and on the results from earlier work (Zeidler and Jamieson, 2004; Mitterer and Schweizer, 2013; Conlan and Jamieson, 2016; Pérez-Guillén et al., 2022; Hendrick et al., 2023; Eiselt and Graversen, 2025). The meteorological features are mostly similar to Eiselt and Graversen (2025), but with important differences regarding the snow-cover information. Here the complex snow model SNOWPACK is utilised instead of the simple model seNorge (Saloranta, 2012, 2014, 2016). The predictive features derived from the SNOWPACK output include the snow depth (SD) as well as several stability indices (see Table C2). To derive these stability indices, the threshold sum approach (TSA; Monti et al., 2012), with the thresholds given in Monti et al. (2014), was performed on the SNOWPACK output to find the weak layers in the snowpack. Following Pérez-Guillén et al. (2022), we then determine one or two weak layers to extract the SNOWPACK-calculated stability indices Sk38 (skier stability index, Föhn, 1987; Jamieson and Johnston, 1998; Monti et al., 2016), Sn38 (natural stability index, Föhn, 1987; Jamieson and Johnston, 1998; Monti et al., 2016), and the structural stability index (SSI; Schweizer et al., 2006). If a weak layer is found within the first 100 cm of the snowpack, the suffix _100 is appended to the index name and the search is continued to find a deeper weak layer. The indices from the deeper layer (if found) are denoted with the suffix _2. Generally, larger values of these indices indicate a more stable snowpack.
A further important difference compared to Eiselt and Graversen (2025) is the spatial aggregation of the features. They tested averages and percentiles over different elevation bands and found that this only had a small effect on the results. Here we attempt to integrate more information in the predictive features. After averaging the NORA3 and NorCP data for each individual warning region separately over the four elevation bands 0–300 m a.s.l., 300–600, 600–900, and 900–1200 m, we take the maximum and minimum of the features over all elevation bands (this is indicated with the suffixes _x and_n, respectively).
3.1 Machine learning – random forest
To establish the statistical linkage between meteorological data and avalanche danger we employ the widely used random forest (RF) model (Breiman, 2001), which “grows” a number of decision trees (DTs; Breiman et al., 1984) that “vote” on the final prediction result. Like Eiselt and Graversen (2025) we use the RF implementation from the Python library scikit-learn version 1.3.0 (https://scikit-learn.org/, last access: 23 September 2025). One RF model is trained for each AP, resulting in four different RF models. The hyperparameter setups for the individual RF models are presented in Table E1 in Appendix E. To produce the data set for the RF model training, the AvD/non-AvD data from the Norwegian avalanche bulletin (Sect. 2.1) are combined with the predictive features derived from NORA3 and SNOWPACK (Sect. 2.5). Note that this restricts the available data for model training to the period 2016/2017–2023/2024. The data were split into a test (winters ending in 2021 and 2023) and training (remaining winters) data set.
3.2 Class balancing – synthetic minority over-sampling
To account for the imbalanced class frequencies in our data (shown in Fig. S6 in the Supplement), which may lead to biased model training, we follow Eiselt and Graversen (2025) in using the synthetic minority over-sampling technique (SMOTE; Chawla et al., 2002; Fernandéz et al., 2018) to oversample the minority class. The SMOTE algorithm generates new samples of the minority class by interpolating between existing samples. Like Eiselt and Graversen (2025), we use the implementation of the SMOTE algorithm in the Python library imbalanced-learn version 0.12.3 (https://imbalanced-learn.org/, last access: 23 September 2025).
3.3 Random forest optimisation and feature selection
When investigating different combinations of hyperparameters for the RF model, we found a large variation of model skill. This variation mostly derives from the hyperparmeters min_samples_leaf (MSL) and min_samples_split (MSS), representing the number of samples that are allowed to remain at a leaf and after a split, respectively. The other hyperparameters (see Table E1 in Appendix E) appear to have a much smaller influence (not shown). We note that MSL and MSS have a similar effect, both determining the number of samples at the leaves of the DTs in the RF. In fact, MSL is the “finer” tuning parameter and MSS has no impact if MSS≤MSL. Given these hyperparameter dependencies we deviate from the model optimisation and feature selection procedure conducted in earlier work (e.g. Pérez-Guillén et al., 2022; Hendrick et al., 2023; Eiselt and Graversen, 2025); that is, we do not perform a randomised grid search over all the different hyperparameters, but instead only test different values of MSL, while holding the other hyperparamters constant (Table E1 in Appendix E).
Following the notion of Winkler and Murphy (1992) that “the search for a single `best' measure is doomed to failure,” the decision is here made to not focus solely on one performance measure. That is, while we follow earlier work (Pérez-Guillén et al., 2022; Eiselt and Graversen, 2025) and use the F1-macro score as the main metric, we also consider such measures as the accuracy or percentage correct (PC), the false alarm rate (FAR), and the true skill score (TSS). The metrics are presented in Appendix D. Furthermore, we examine the deviation of the sizes of the predicted from the true class sizes. While using several metrics to optimise the model may introduce some inconsistency into the procedure, it lowers the danger of optimising a single performance metric at the expense of others. For instance, optimising the model to a high PC may come at the expense of an unacceptably high FAR.
The procedure of hyperparameter and feature selection applied here works in the following five steps:
-
A k-fold cross-validation (one fold corresponds to one winter) is performed across the training data using all available predictive features (see Tables C1 and C2) to find the best MSL hyperparameter. Since five winters (six for the general avalanche problem) of training data are available, the model is trained on four winters (five for the general problem), while one winter is excluded and used for validation. This is repeated for each winter and we here consider the average of the above-listed performance metrics over the excluded validation winters. Note that we average over the winters but not over the performance metrics. As mentioned above, we have repeated this procedure with different values of other hyperparameters (max_depth and n_estimators), but the impact on the results was marginal.
-
An initial RF model is trained employing the hyperparameter combination from step one. This gives a best-features ranking based on feature importances. The ranking is used to perform an iterative feature search. In the search, those features exhibiting a correlation of R>0.9 (Pearson R) with a feature of higher importance are excluded. Thus, redundant features are removed and a new list of less interdependent features is produced.
-
The first step is repeated with the reduced set of best predictive features found in the second step.
-
The RF model must be trained again with the hyperparameter set found in step three and the list of features from step two to produce a new feature-importance ranking.
-
The ranking from step four is used to find the best number of predictive features by again investigating the performance metrics mentioned above for different numbers of features.
We optimise and train four different RF models, each for one specific AP including the general ADL. This is necessary as the different APs are linked to different weather and snowpack conditions. More specifically, earlier research on statistical prediction of avalanches has shown that different predictive features are important for the different APs (compare the different most important features found in Pérez-Guillén et al., 2022; Hendrick et al., 2023; Zeidler and Jamieson, 2004).
Figure 4 shows the confusion matrices for the four RF models trained for the four different APs. It is clear that the model skill depends on the AP. However, in general, all RF models are better at predicting non-AvDs than AvDs. Considering both non-AvD and AvD, the best and most balanced performances are achieved for the wind slab AP and the general avalanche problem with correctly predicted AvDs and non-AvDs between 67 % and 83 %. For the PWL slab and especially for the wet-snow AP the non-AvDs are also mostly correctly predicted (81 % and 91 %, respectively). However, while for the wet AP the AvD prediction works reasonably well (58 %), for the PWL slab AP the performance is weak (37 %). Furthermore, comparing the true and predicted values in Fig. 4 (see also Fig. S7) it is clear that for the wind slab, the RF model overpredicts AvDs compared to non-AvDs, while the opposite is true for the PWL slab. In contrast, for both the wet and especially the general AP, the prediction is more balanced.
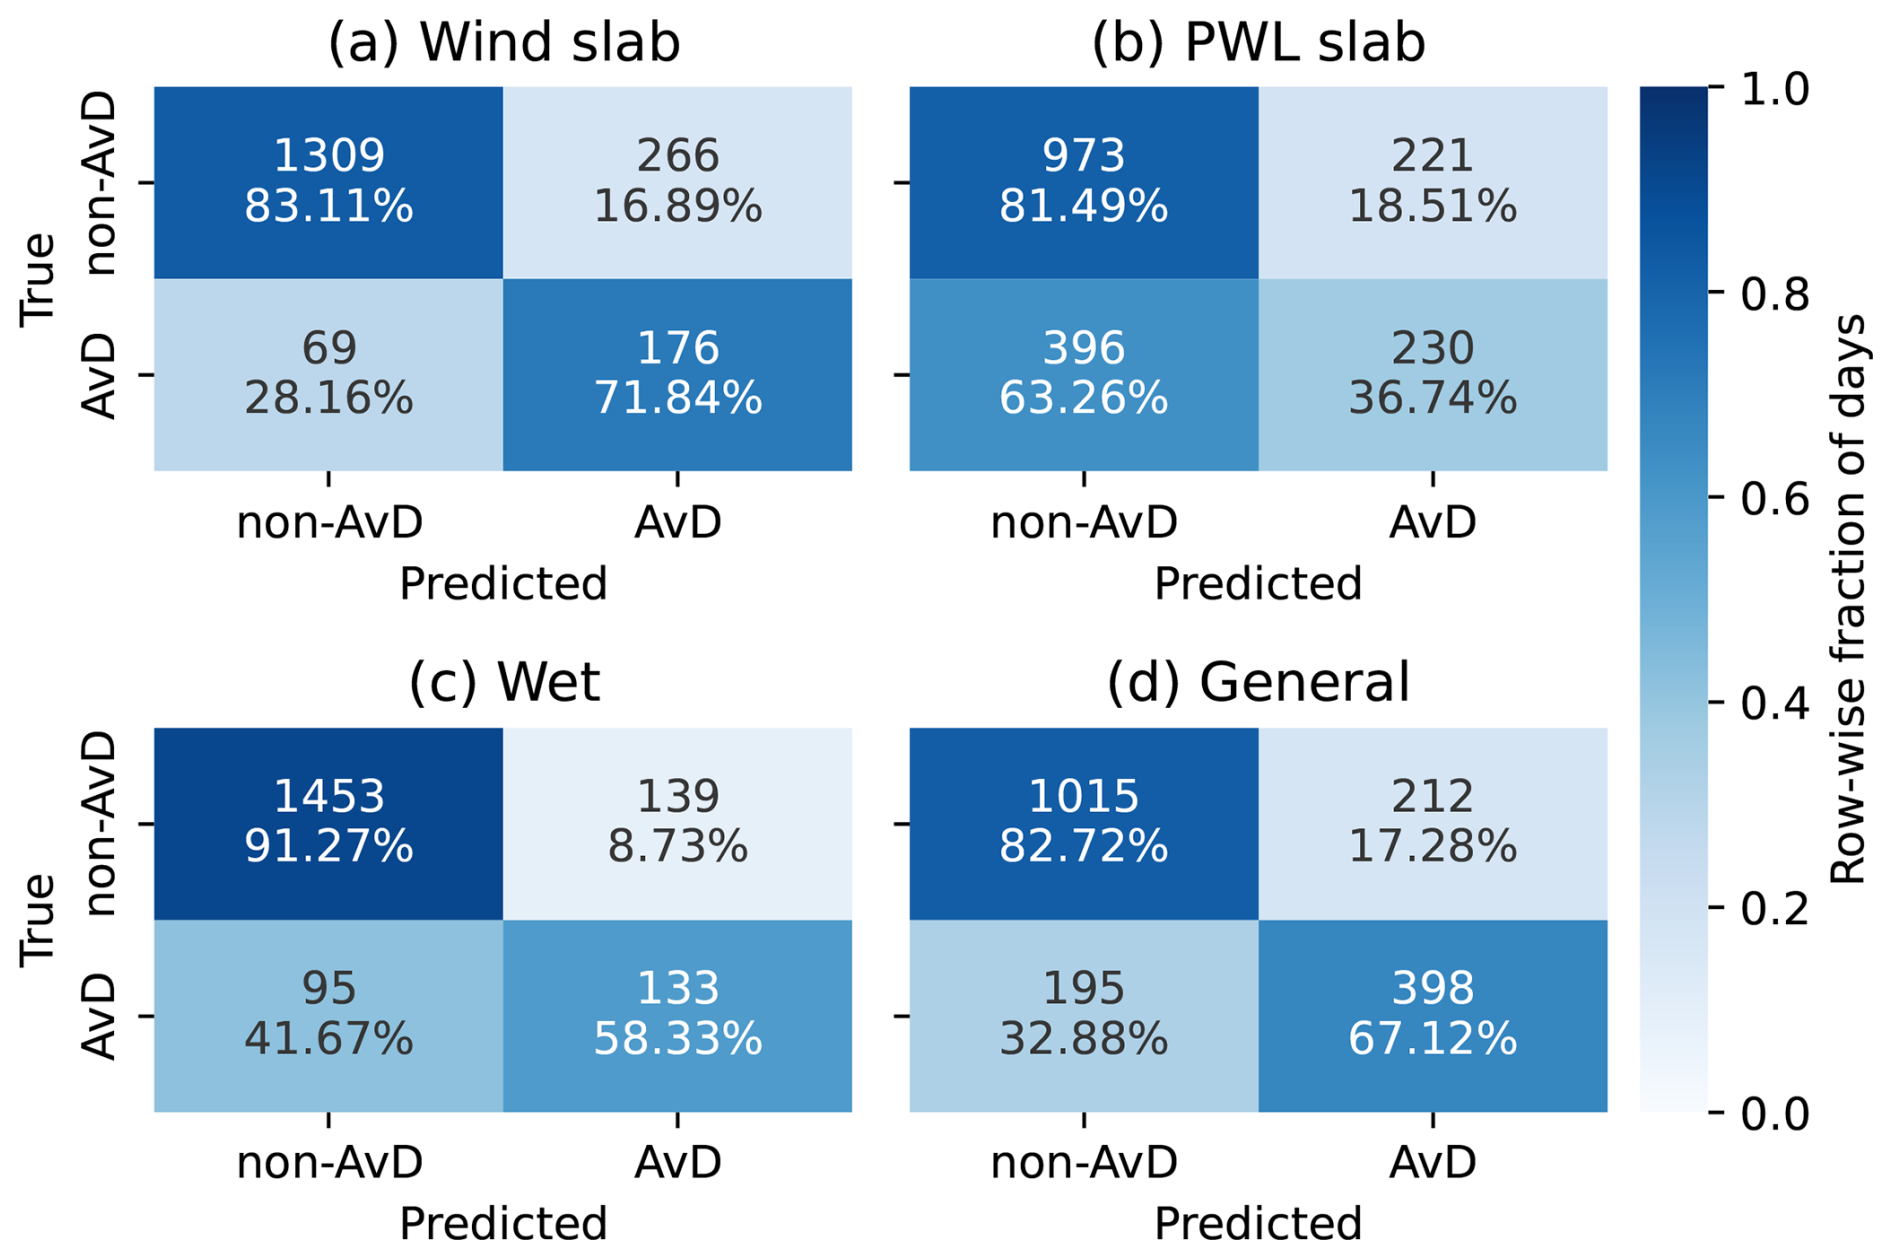
Figure 4Confusion matrices for the random forest models trained for the different avalanche problems: (a) wind slab, (b) PWL slab, (c) wet snow, as well as (d) the general avalanche problem. The abbreviations AvD and non-AvD mean avalanche day and non-avalanche day, respectively. The colour and percentages indicate the row-wise fraction of the number of days.
Figure 5 shows the feature importances of the 15 most important predictive features for each of the APs. The numbers of included features in the RF models after the optimisation procedure are presented in Table E1 in Appendix E. In general, the different APs have different most important features, although the wind slab and the general problem exhibit similarities. For the wind slab, the most important parameters are related to new snow (s7_n, s3_n), snow-drift (wdrift3_3_x), and wind speed (wmax3_x). However, some SNOWPACK-derived parameters are also important, such as the 1–3 d change of the Sn38 stability index (Sn38_100_d1...3). For the PWL slab, the change over time of the SNOWPACK-derived structural stability index (SSI_100_d1...3) is most important, while for the wet-snow AP, the maximum temperature (tmax_x) has the highest importance. As mentioned above, the general AP is similar to the wind slab AP in terms of most important features with new snow and wind-related features being most important. However, the SNOWPACK-derived stability indices appear less important for the general problem and instead the 7 d maximum temperature (t7_x) and the 7 d averaged net short-wave radiation (nsw7_x) play a role as well as the change of the liquid water content (lwc_i_d2).
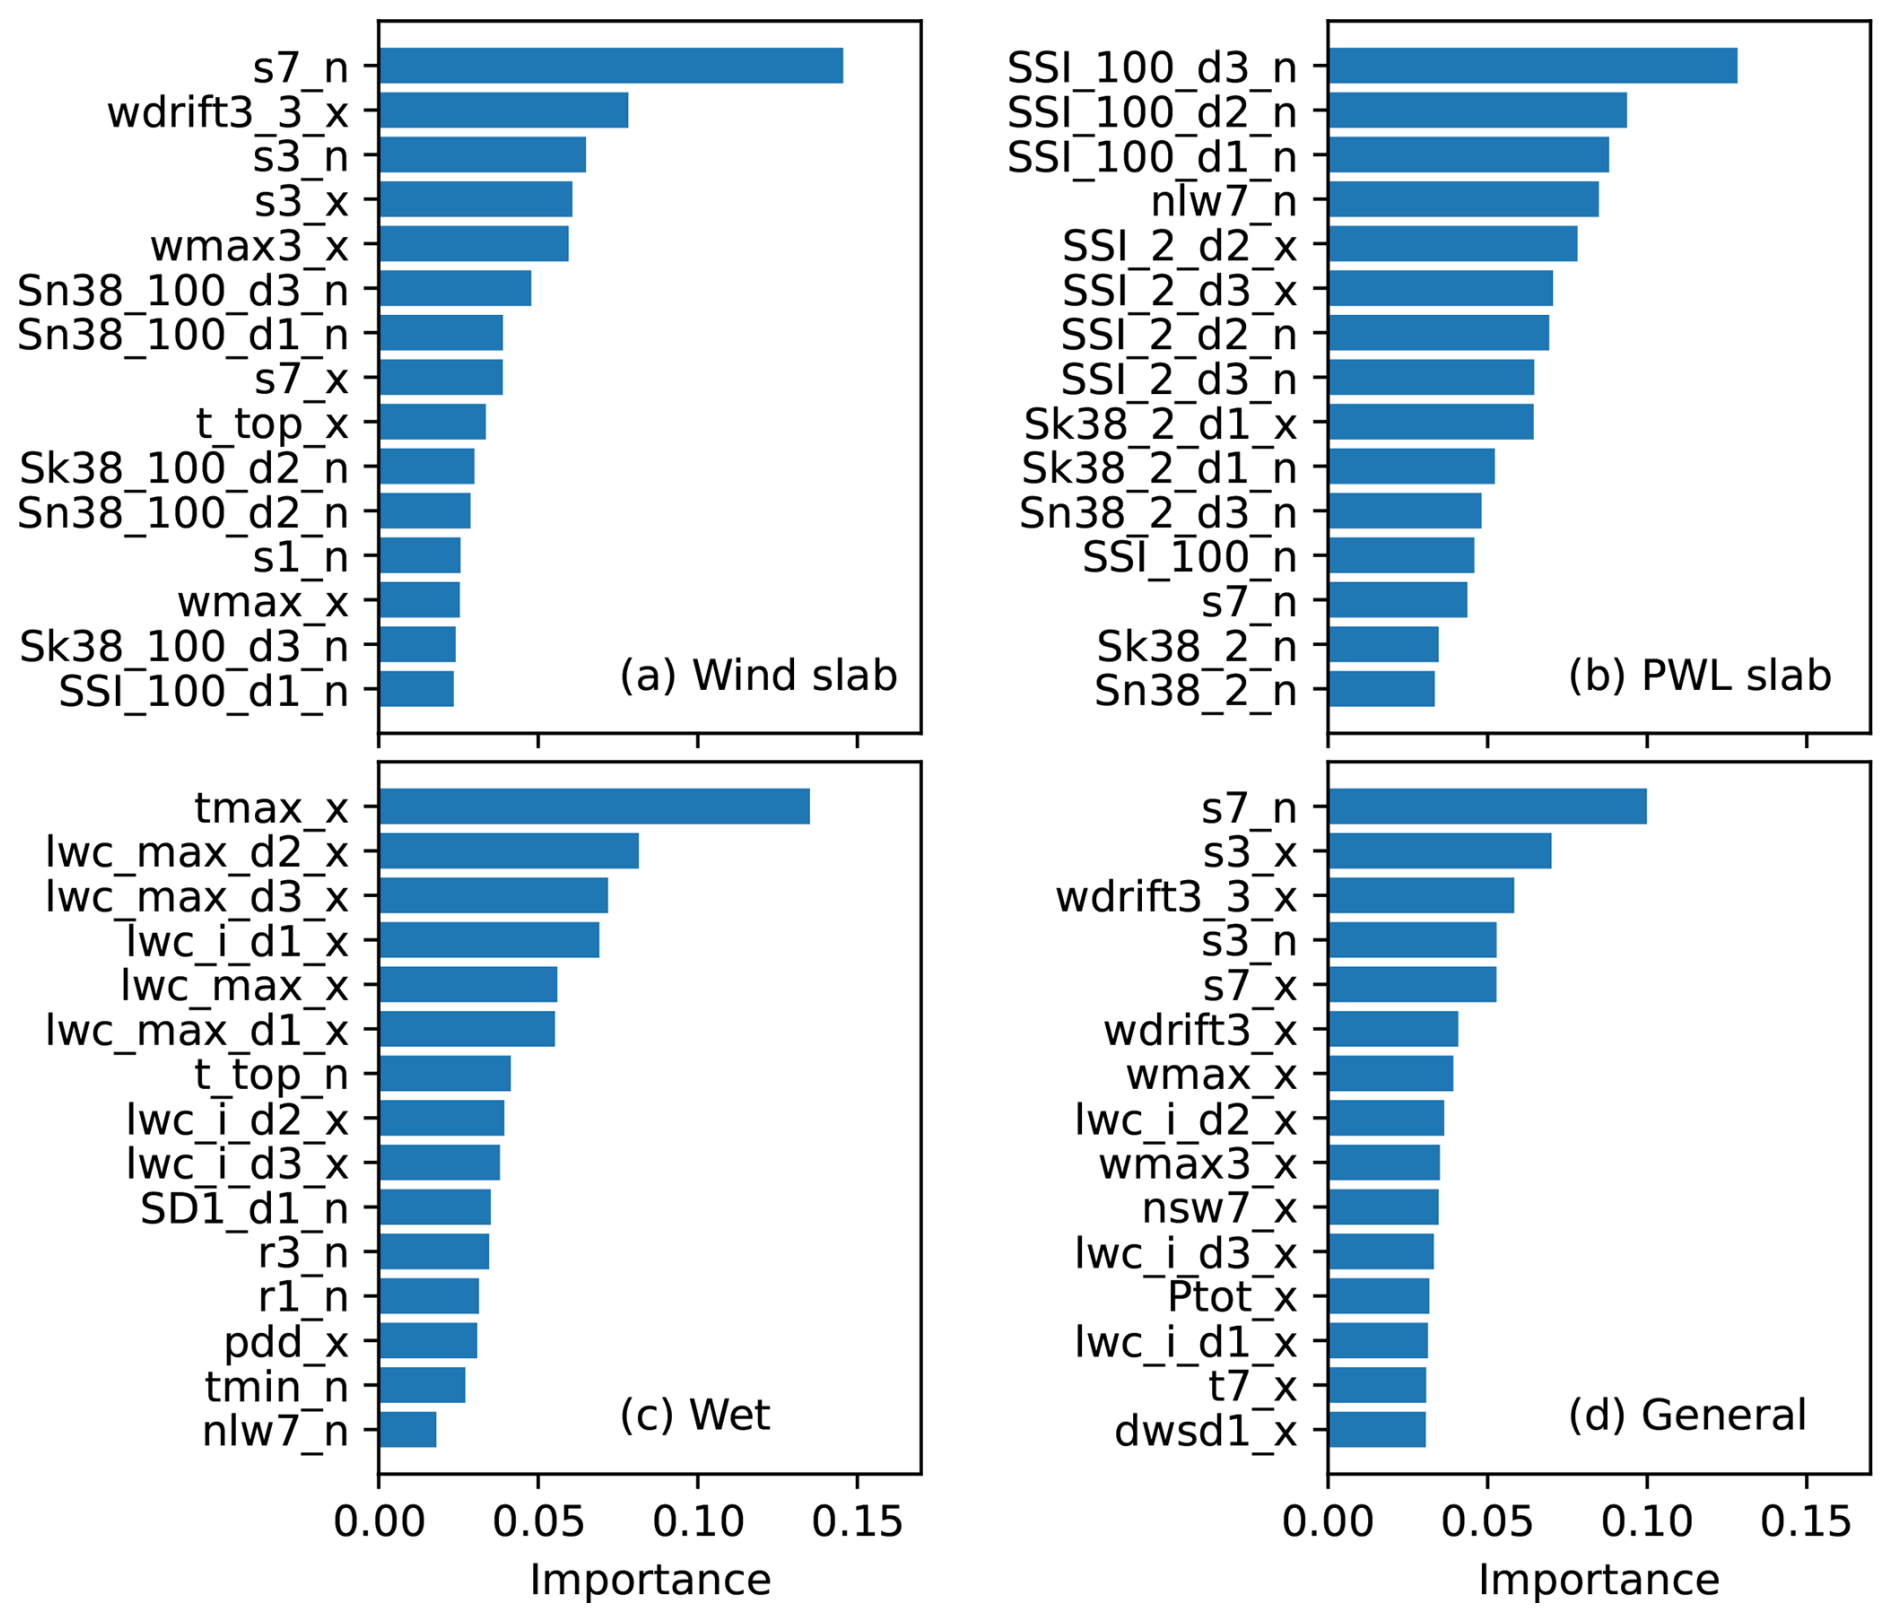
Figure 5The fifteen most important features and their feature importances for the random forest models for the different avalanche problems: (a) wind slab, (b) PWL slab, (c) wet, as well as (d) the general avalanche danger. See Tables C1 and C2 in Appendix C for descriptions of the predictive features.
5.1 Past changes – NORA3
Like Eiselt and Graversen (2025) we perform a hindcast of the ADF for the NORA3 period from 1970–2024. The main differences to Eiselt and Graversen (2025) are (1) that here the predictive features include the SNOWPACK output and (2) that the predicted avalanche danger is differentiated into individual avalanche problems. The annual and 7 years rolling mean hindcasts for the wind slab, PWL slab, and wet-snow problems, as well as the general ADF for the warning region Lyngen during winter (December–February) are shown in Fig. 6 (Fig. S8 shows the general ADF in Lyngen for winter, spring, and the full season, comprising December–February, March–May, and December–May, respectively).
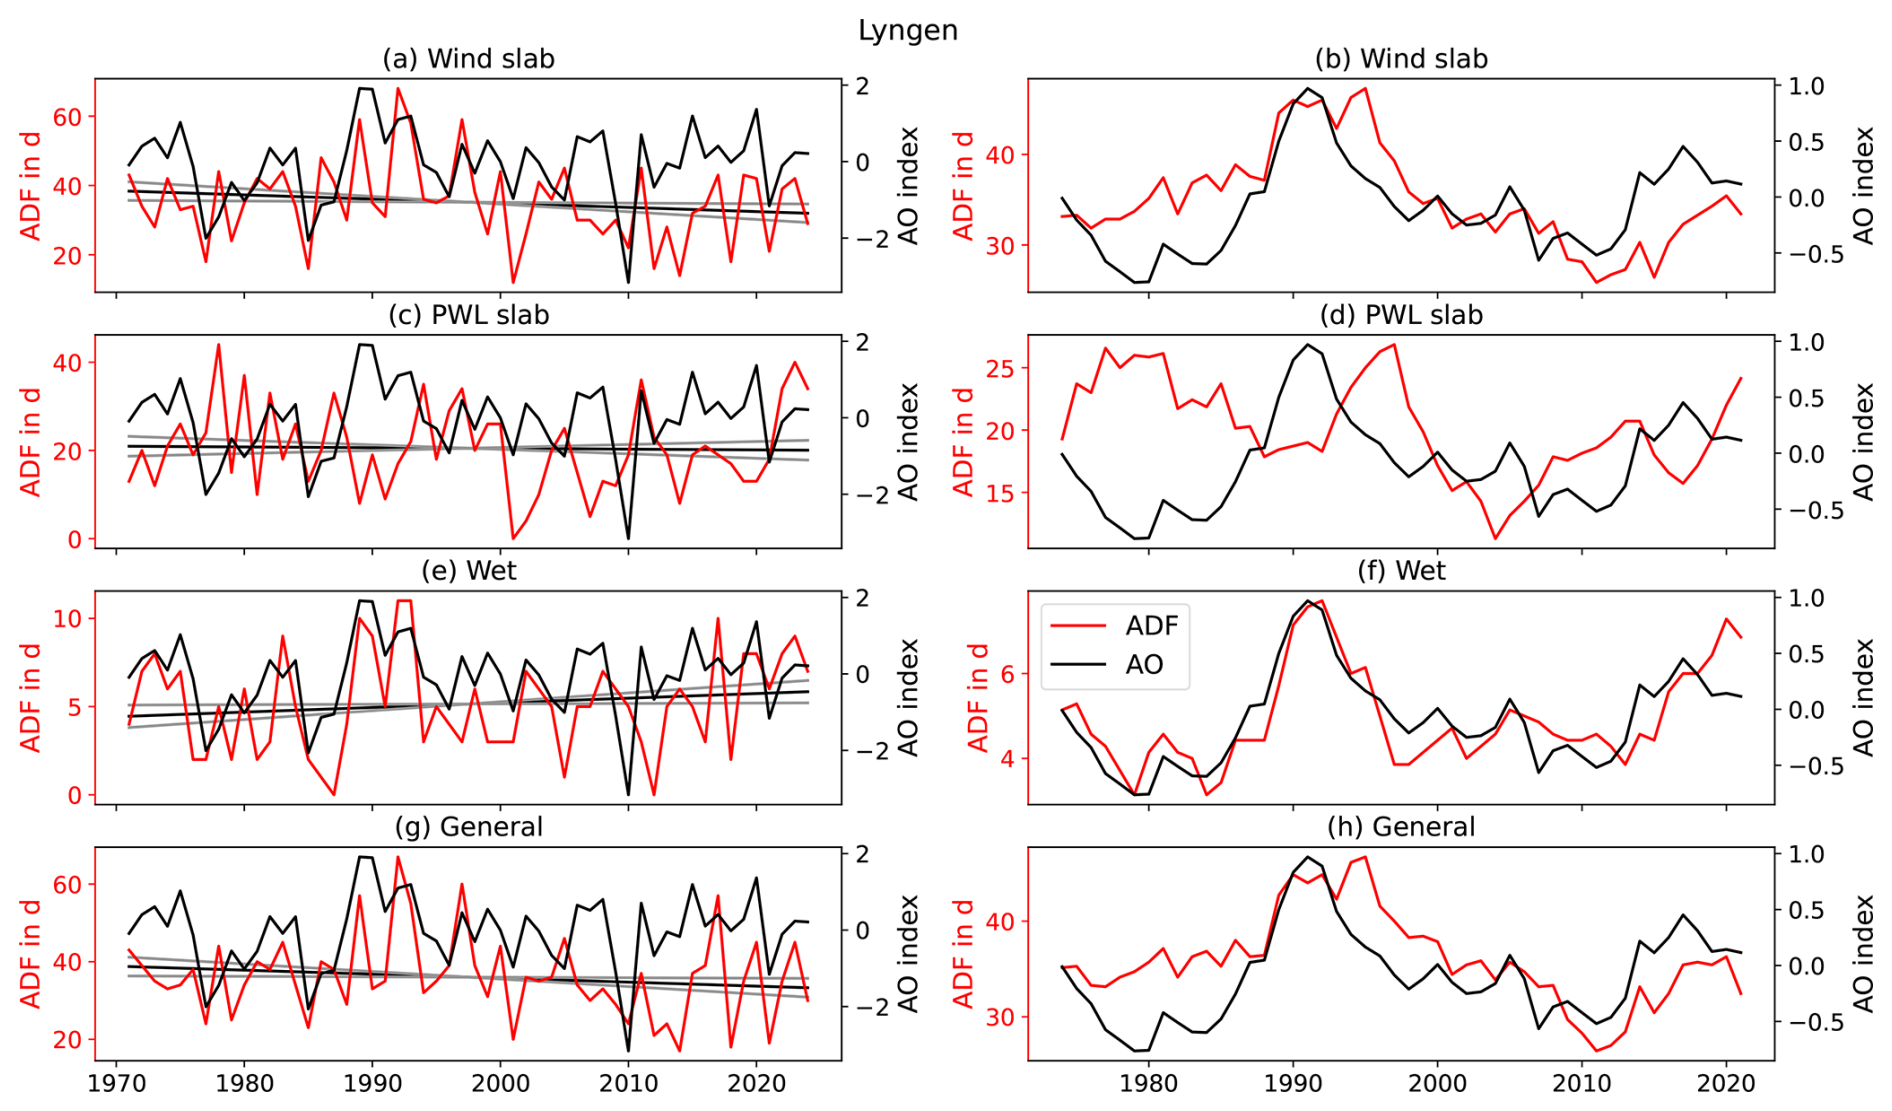
Figure 6Winter (December–February) avalanche-day frequency (ADF; red) and Arctic Oscillation (AO) index (black) from 1970–2024 based on NORA3 data for (a, b) wind slab, (c, d) PWL slab, (e, f) wet, and (g, h) general avalanche problem for (left panels) annual and (right panels) 7 years rolling means in the warning region Lyngen. The straight black and gray lines indicate the linear trends and their uncertainties. Note the different y axis scales for the different avalanche problems. For the corresponding correlation coefficients of AO and ADF see Fig. 8 and Table S2 in the Supplement.
5.1.1 Linear trends
We first consider linear trends of the ADF over the whole NORA3 period (1970–2024). The values of the trend slopes are depicted in Fig. 7 (see also the straight lines in Fig. 6 for Lyngen) and the regression coefficients (Pearson R) are shown in Table S1.
In general, few significant linear trends are observed. However, trends in winter (December–February) for the most part are negative, while in spring (March–May) they are positive, resulting in marginal trends throughout the full avalanche season (December–May). This is consistent across warning regions and APs (except for the wet problem, where trends tend to be generally positive).
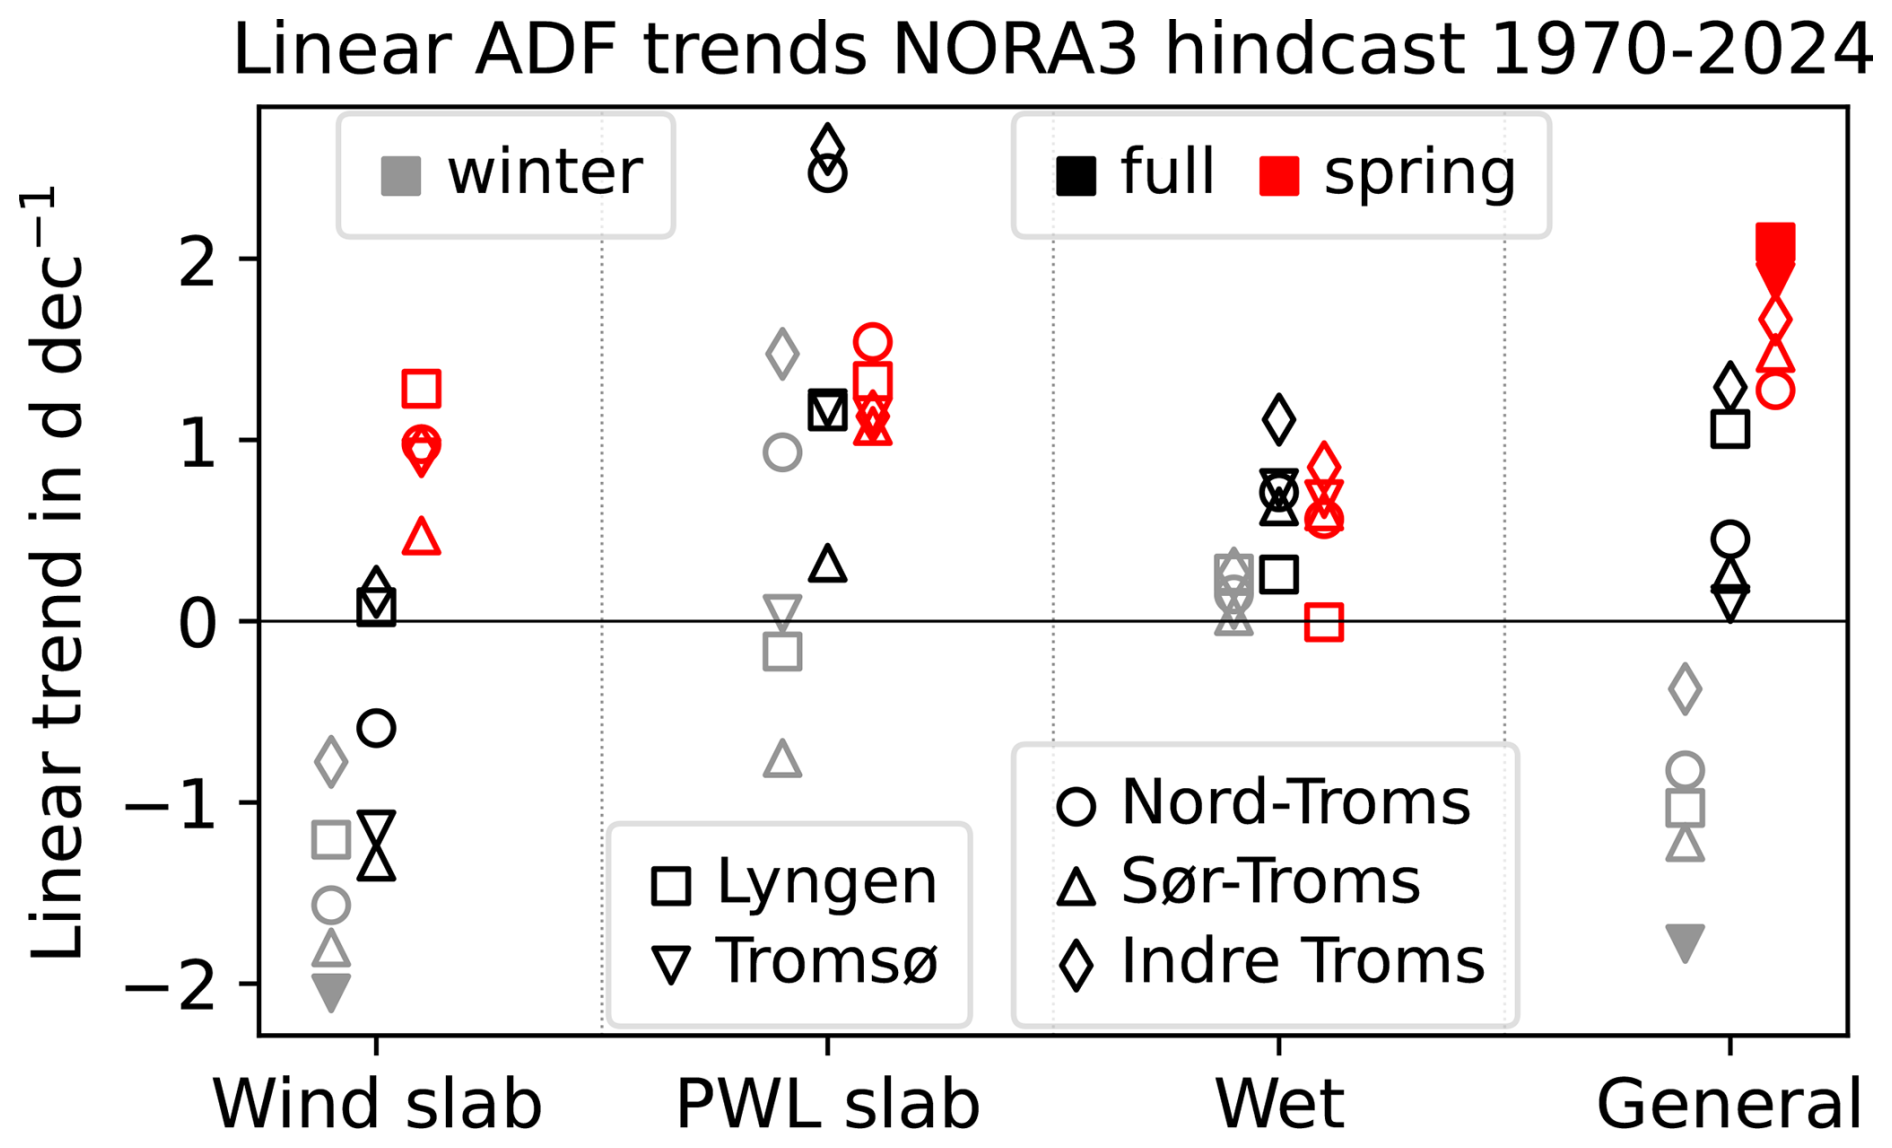
Figure 7Linear trends in the full season (December–May), winter (December–February), and spring (March–May) avalanche-day frequency (ADF) from 1970–2024 based on NORA3 data for all avalanche problems and regions. Filled markers indicate statistical significance at p<0.05.
5.1.2 ADF–AO linkage
We expand the correlation analysis of Eiselt and Graversen (2025) of the general ADF and the Arctic Oscillation (AO) index by considering the individual APs. Figure 8 shows the correlation coefficients of the AO index with the ADF for all regions, seasons, and APs, both for the annual and 7 years rolling mean values (see also Table S2). We note that the 7 years rolling mean aggregation introduces a strong autocorrelation and, hence, we do not show the statistical significance for the ADF–AO correlations in this case. We caution against over-interpreting these correlations, but include them as an instructive illustration of the ADF–AO linkage.
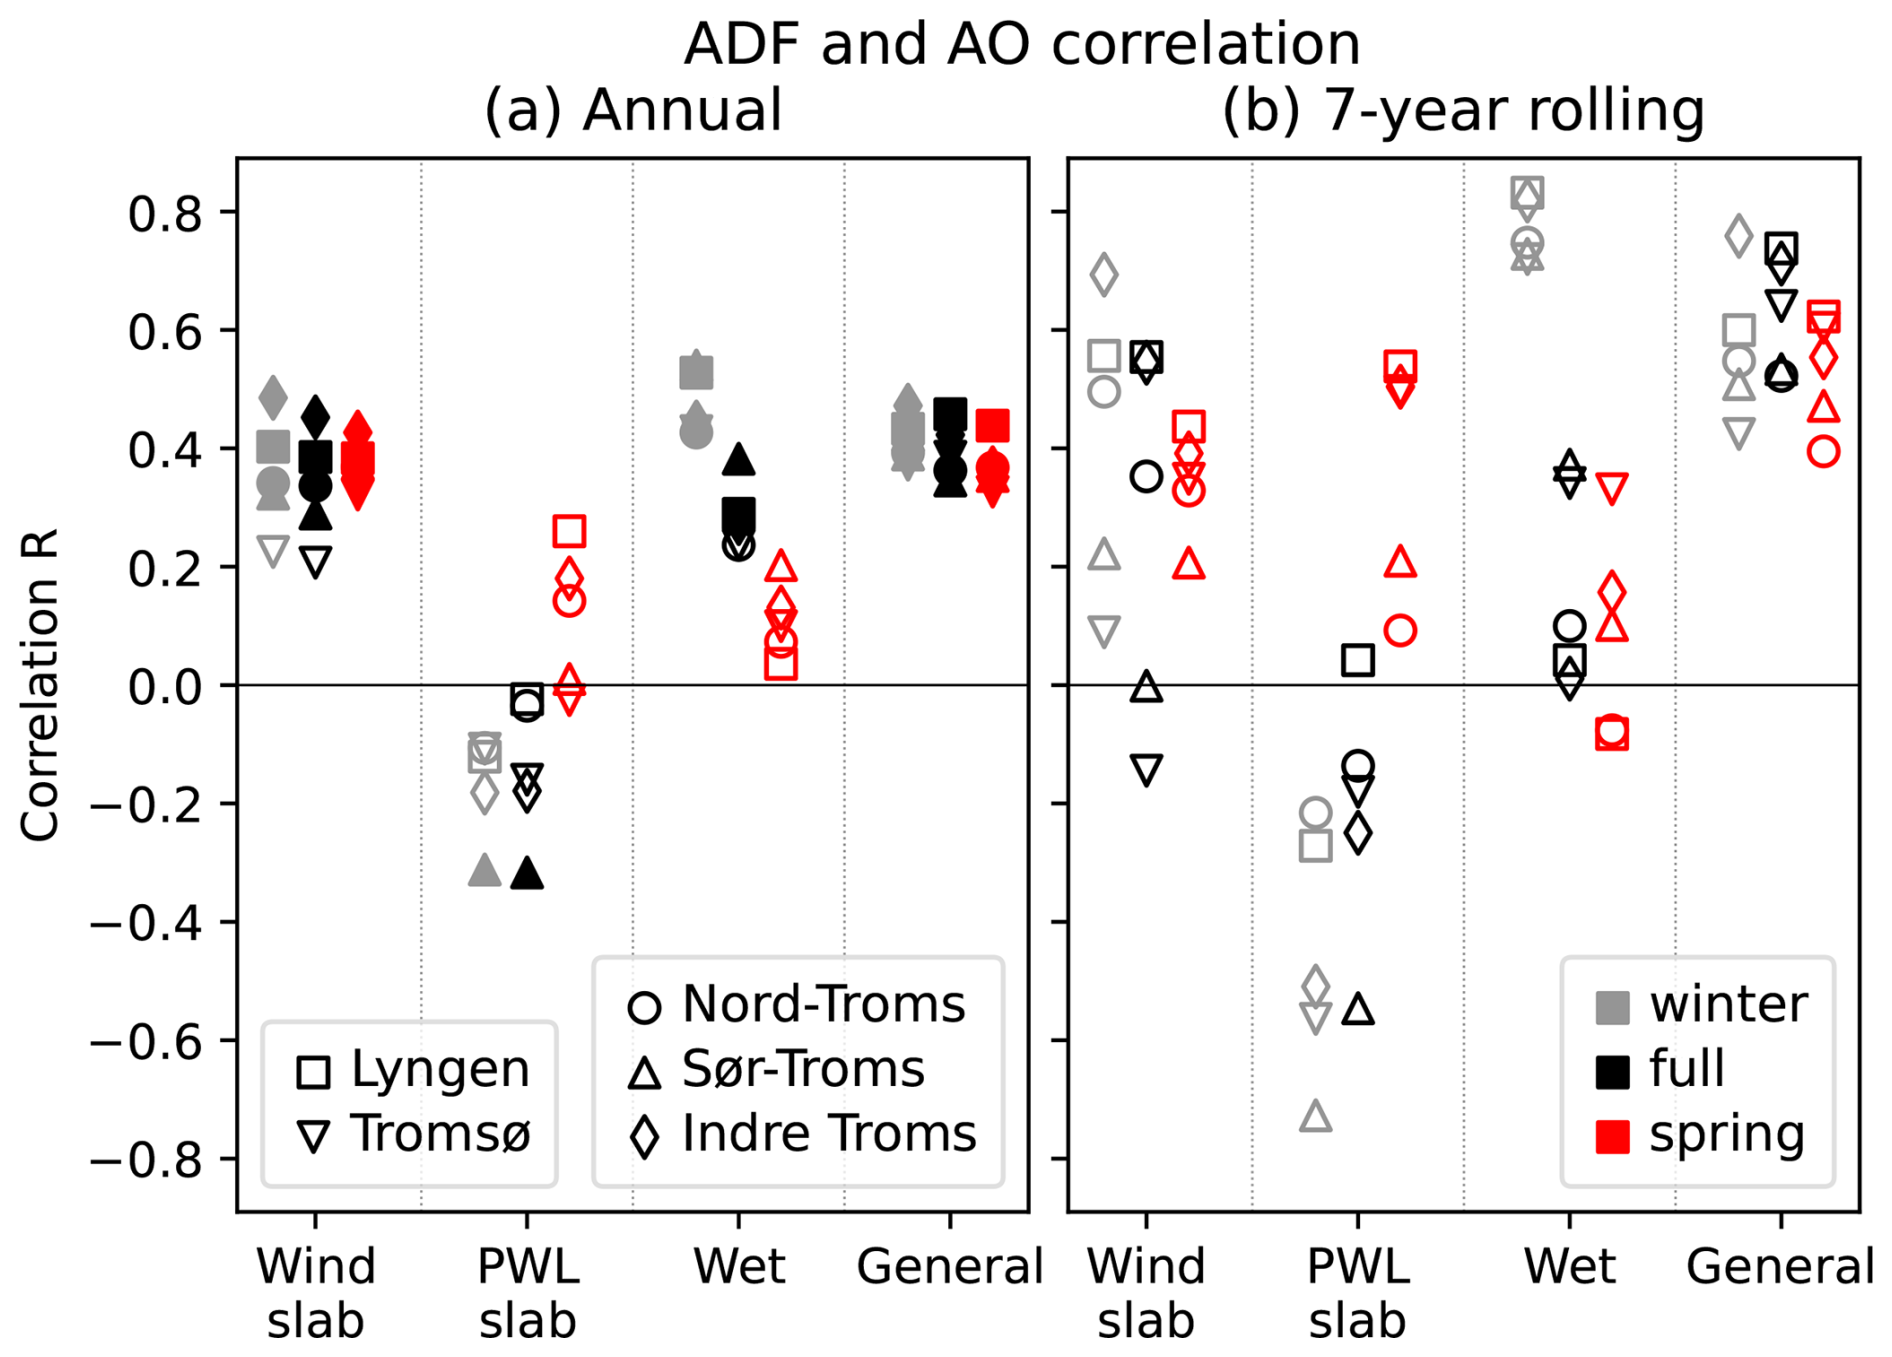
Figure 8Correlation coefficients (Pearson R) between (a) annual and (b) 7 years rolling mean avalanche-day frequency (ADF) and Arctic Oscillation (AO) index for all seasons, regions, and avalanche problems. Filled markers in (a) indicate statistical significance at p<0.05. The values are also shown in Table S2.
The main result is that there is a significant linkage between the AO and the ADF during winter (December–February) for all APs, except the PWL slab (Fig. 8). The results for the individual seasons and APs are presented below.
It is clear from Fig. 8 that the most consistent correlations across regions and seasons are found for the general ADF. Consistent with Eiselt and Graversen (2025), correlations are stronger for the 7 years rolling means (0.42–0.76) than for the annual values (0.37–0.47), but they also vary more than for the annual values across regions, and correlations tend to be slightly stronger in winter than in spring. The correlations of the AO index and the wind slab ADF are similar to the general ADF, but slightly weaker and more variable across regions and seasons. The weakest correlations are found for the PWL slab ADF for the annual values which exhibit statistically non-significant correlations often close to zero. In contrast, for the 7 years rolling means, some strong negative correlations are found in the winter and the full season. However, these vary strongly across regions (), and in spring correlations are in fact mostly positive. The strongest correlations of the AO index and the ADF are observed for the wet-snow AP in winter, both for the annual (0.43–0.54) and 7 years rolling means (0.72–0.82). However, in spring, the wet-snow ADF correlates only weakly with the AO index. We note that the wet-snow ADF with values of about 5 d is considerably smaller than the ADF of the other problems (20–40 d). As an example, the ADF values for all APs are shown for Lyngen in Fig. 6 for winter together with the winter AO index.
5.2 Future changes – NorCP
To investigate potential future changes of the APs, we consider the NorCP downscalings based on the EC-Earth climate model for the historical as well as RCP4.5 and RCP8.5 scenarios (Fig. 9). We find that results based on the NorCP downscaling of the GFDL-CM3 RCP8.5 scenario are generally similar to the corresponding EC-Earth-based simulations, as can be seen in Fig. S9. The significance of the changes of the ADF between historical, mid-century, and late century is tested with a Monte-Carlo simulation. The procedure is described in Appendix B. The numerical changes and their statistical significance are shown in Figs. S10–S13.
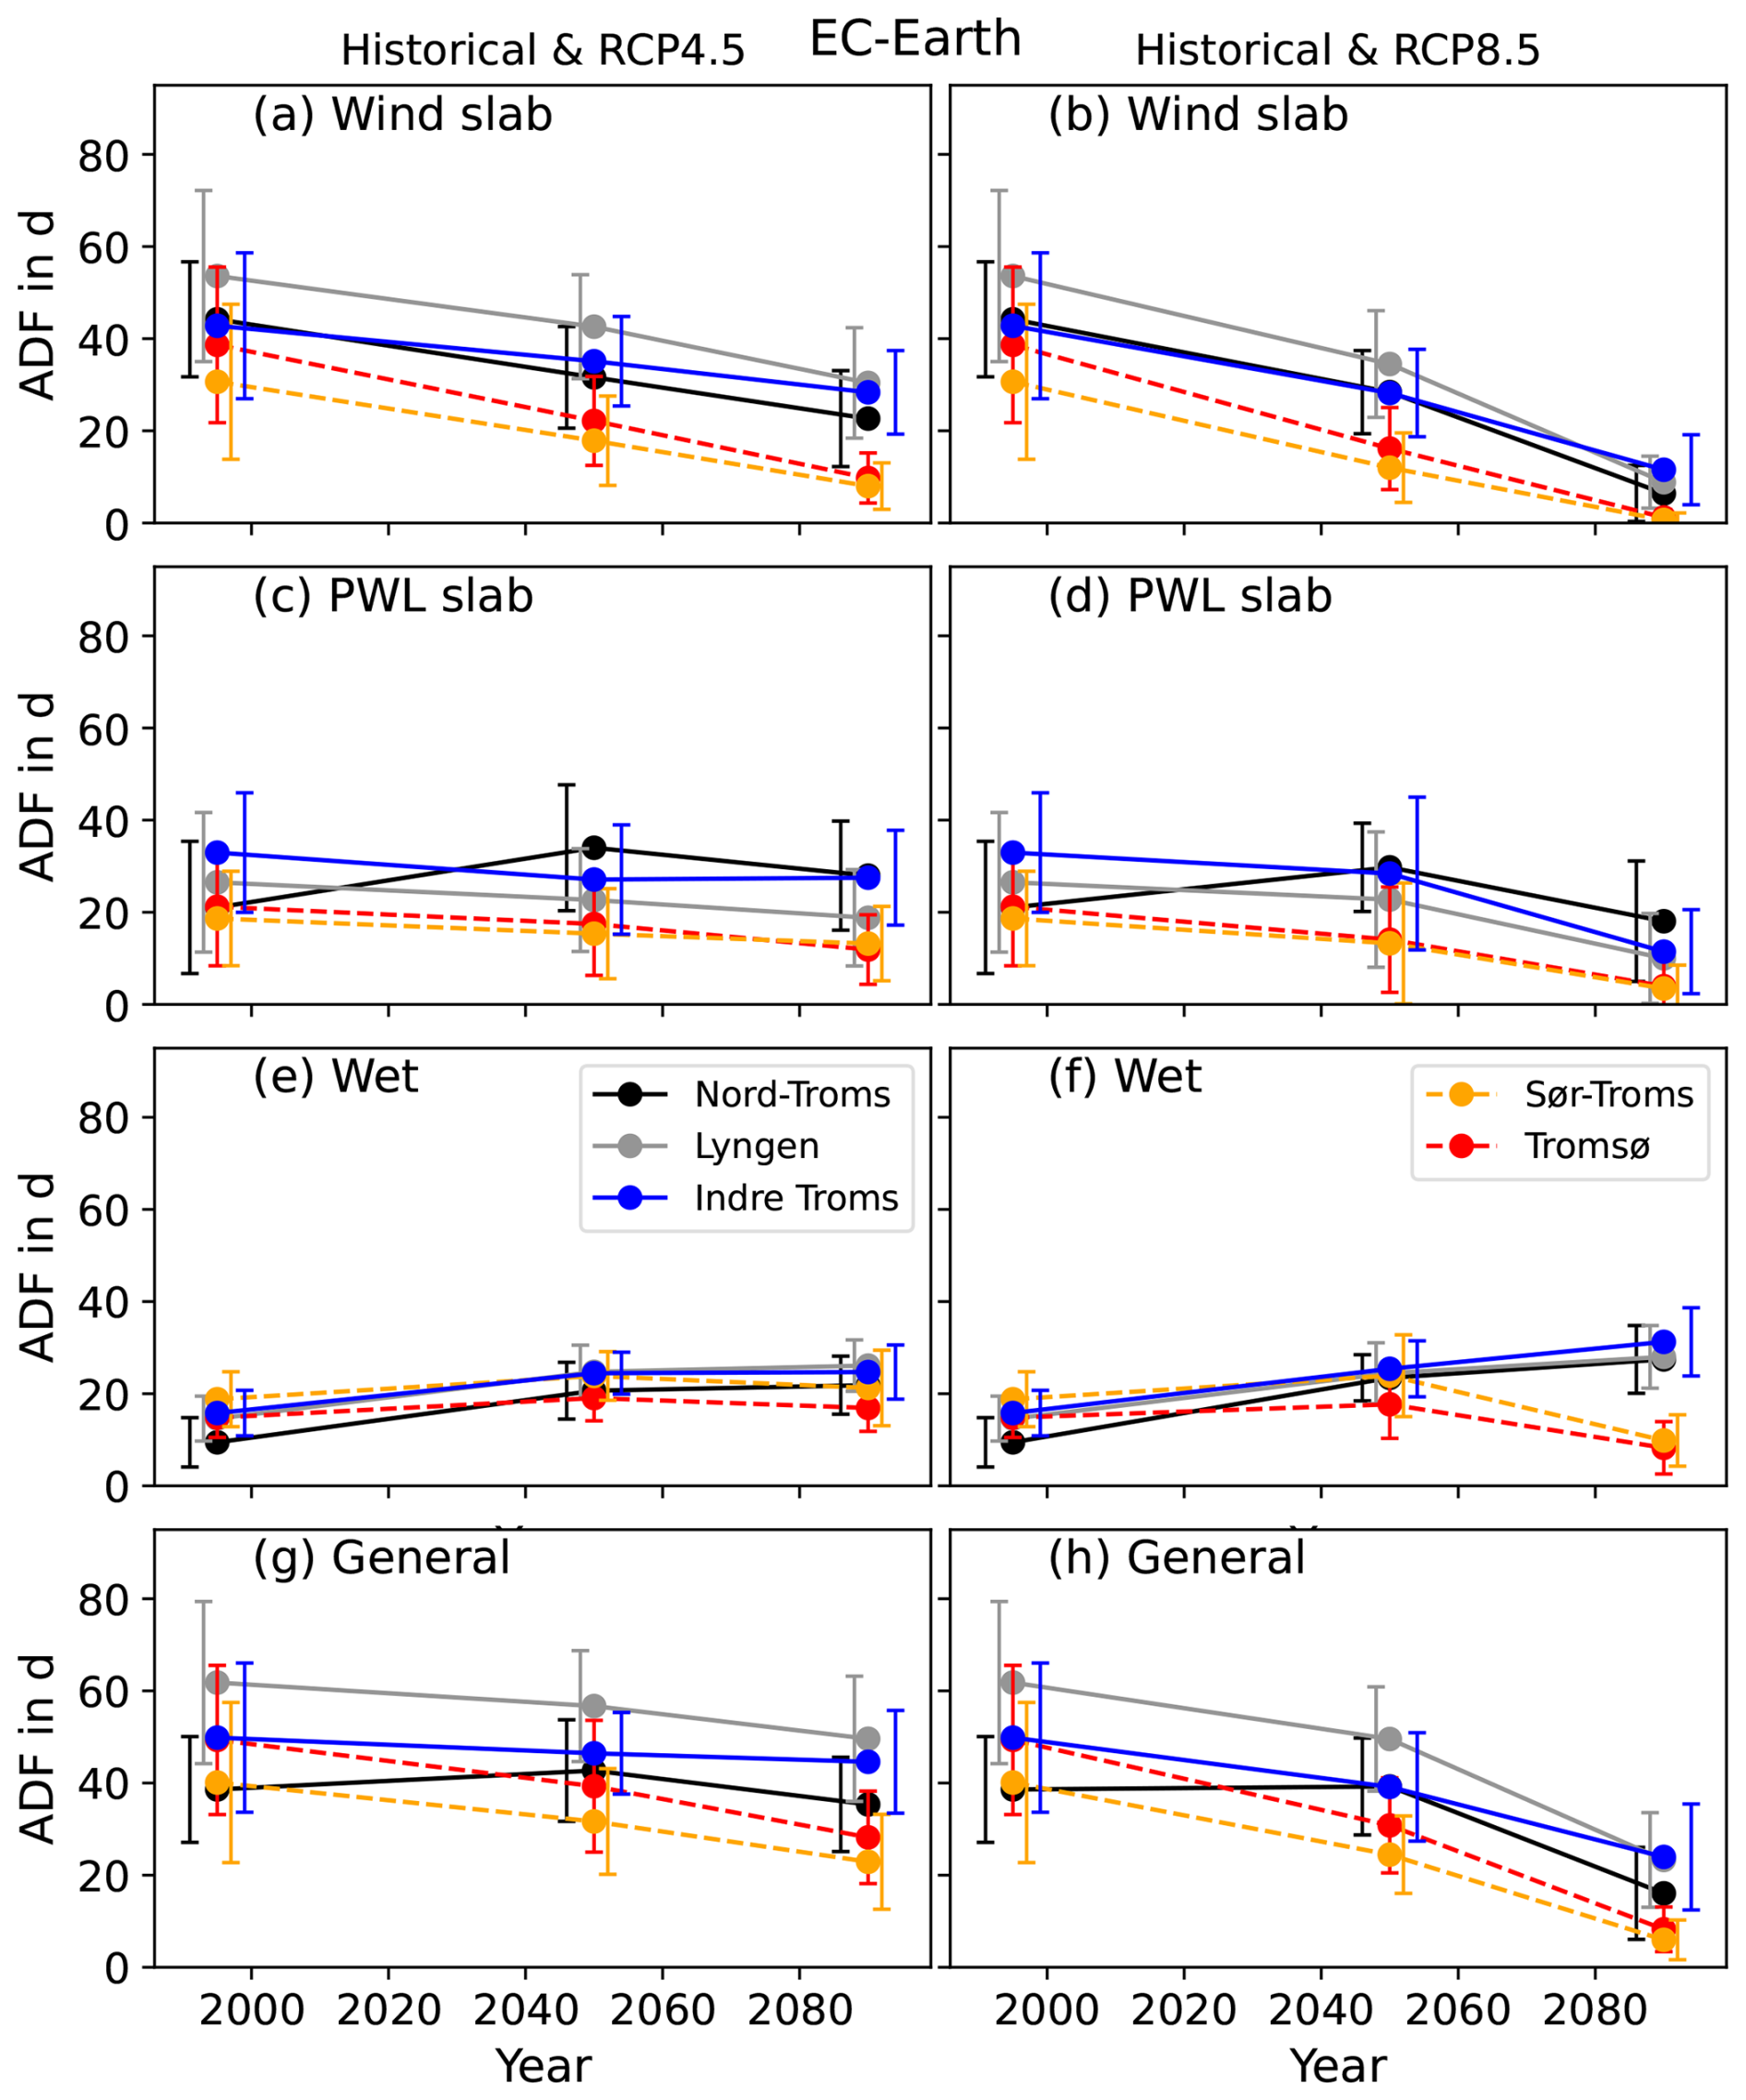
Figure 9Full-season avalanche-day frequency (ADF) averaged separately for the three 20 years NorCP periods 1985–2005 (historical), 2040–2060 (mid-century), and 2080–2100 (late century) for (a, b) wind slab, (c, d) PWL slab, (e, f) wet, and (g, h) general avalanche problem. The different colours represent the different warning regions. The low-elevation regions are depicted with dashed lines, the high-elevation regions with solid lines. The errorbars indicate the standard deviations of the individual 20 years periods. The errorbars are slightly horizontally shifted for better readability. The left panels show the historical and RCP4.5 and the right panels the historical and RCP8.5 simulations with EC-Earth. For the historical and RCP8.5 simulations with GFDL-CM3 see Fig. S9. Figures S10–S13 show the numerical changes between periods and indicate the significance of the changes.
The main result is that the ADF in northern Norway declines over the 21st century for all APs, except for the wet-snow AP, which in fact exhibits an increase for the high-elevation regions (Nord-Troms, Lyngen, Indre Troms). We present the results in more detail below, focusing first on RCP4.5, followed by RCP8.5.
The wind slab ADF in RCP4.5 declines monotonically in all regions. The changes are similar across the regions and statistically significant in most cases (p<0.05). The ADF development of the PWL slab AP is less clear. A slight decline in the early period can be observed, with a further decline in the late period, implying a statistically significant decline of the PWL slab ADF from the historical to the late-century period (except for Nord-Troms). The wet-snow problem differs from all other APs in that there is a general increase in ADF. During the early period, the increase is statistically significant and consistent across all regions. In the late period, the low-elevation regions (Tromsø, Sør-Troms) exhibit a slight decline. Throughout the whole century, the high-elevation regions (Nord-Troms, Lyngen, Indre Troms) show a significant increase in wet-snow ADF, while in the low-elevation regions (Tromsø, Sør-Troms) there is no significant change. For the general AP all regions (except Nord-Troms) show a statistically significant decline throughout the century.
In RCP8.5 the wind slab ADF changes are generally similar to RCP4.5 although the decline is more severe and tends to accelerate in the late century. Almost all changes (throughout the century and in the individual early and late periods for all regions) are statistically significant. Notably, in the low-elevation regions of Tromsø and Sør-Troms the late-century ADF is close to zero, while in the other three (high-elevation) regions the ADF, although low, is different from zero. The changes in the PWL slab ADF in RCP8.5 during the early period appear similar to RCP4.5, meaning a small, often non-significant decline (except for Nord-Troms). However, in the late period the decline accelerates in all regions and becomes statistically significant. Again, as for the wind slab AP, in the late century the low-elevation regions PWL slab ADF is almost zero, while the other regions retain non-zero ADF. The RCP8.5 wet-snow ADF shows a rather dichotomous behaviour between low- and high-elevation regions: After a significant increase that is similar across regions in the early period, the increase continues in the high-elevation regions, while in the low-elevation regions, a decline sets in. Notably, in the high-elevation regions this leads to the wet-snow problem being the dominant AP in the late century, while historically and in the mid-century, the wind slab and the PWL slab were more dominant. Conversely, in the low-elevation regions, the wet-snow ADF declines to a level in the late century that is statistically significantly smaller than the historical level. Finally, the general ADF in RCP8.5 again declines significantly throughout the century, with an acceleration in the late period in all regions.
6.1 Model skill and feature importances
As shown in Sect. 4, the model performance varies considerably between the different APs, especially with respect to the prediction of AvDs, while for non-AvDs the performance is good in all cases. A potential reason for this is the much higher frequency of non-AvDs compared to AvDs (Fig. 4), i.e. an apparently high model skill can be achieved by simply defaulting to non-AvD. However, for the PWL slab 34 % of days are AvDs as compared to only 13 % for the wind slab and wet-snow APs although the model performance for the latter problems is considerably better than for the former. This indicates that the prediction of the PWL slab AP is fundamentally more complicated than for the other APs. Notably, while the wind slab AP mostly depends on the current weather conditions, the PWL slab additionally depends on the conditions earlier in the season (e.g., Marienthal et al., 2015). The earlier weather conditions are included in our predictive features in so far as they impact the SNOWPACK simulations. However, this information is rather uncertain due to its heavy model-based character, the strong approximations in the generation of the SNOWPACK input data, and the large-scale spatial aggregation performed in the preparation of the predictive features (see Sect. 2.4 and 2.5). Thus, it appears plausible that in our setup the wind slab is more predictable than the PWL slab. The wet-snow AP is to a large degree determined by the maximum temperature, implying a stronger predictability compared to the PWL slab. The weaker performance of the wet-snow AP prediction compared to the wind slab may reflect the lack of understanding of the mechanics of wet-snow avalanches as noted by Mitterer et al. (2013). The survey among forecasters conducted by Techel and Pielmeier (2009) emphasises that the timing of wet-snow avalanches is a major difficulty, likely contributing to less accuracy when forecasting the wet-snow AP. However, interestingly, regarding the distribution of AvDs and non-AvDs, the RF model for the wet-snow AP outperforms that for the wind slab AP, with the latter strongly overpredicting AvDs. In contrast, the PWL slab AvDs are underpredicted. This appears to indicate insufficiencies in the balancing of the input data for which we use the SMOTE methodology (Sect. 3.2). We have tested other methods such as SVMSMOTE and ADASYN (Fernandéz et al., 2018) as well as using different class weights, but this led to no improvement of the results.
That the most important features of the wind slab and general APs are mostly related to wind, new snow, and snow depth is consistent with earlier work covering Norway (Bakkehøi, 1987; Kronholm et al., 2006; Jaedicke et al., 2008; Eiselt and Graversen, 2025) and other regions (Davis et al., 1999; Gauthier et al., 2017; Pérez-Guillén et al., 2022; Hao et al., 2023) and is extensively discussed in these studies. The 1–3 d changes of the natural and skier stability indices (Sk38 and Sn38, respectively) also appear important for the wind slab, although in earlier work these changes are more typically associated with PWL slab avalanches (e.g. Zeidler and Jamieson, 2004). However, note that here these features relate only to shallow weak layers (Sk38_100, Sn38_100), potentially indicating more immediate avalanche release. Conversely, for the PWL slab AP, the stability indices at deeper weak layers (SSI_2, Sk38_2 etc.) are also important (Fig. 5b). This consistency indicates that despite the above-mentioned high uncertainty of the SNOWPACK-derived features, these still are of some value in predicting avalanche danger (see also Schirmer et al., 2009). While we here find the most important features for the PWL slab AP to be related to SNOWPACK-derived stability indices (consistent with Zeidler and Jamieson, 2004), other studies have emphasised the importance of meteorological parameters, which may act as trigger for avalanche release on a PWL. For example, Marienthal et al. (2015) and Conlan and Jamieson (2016) noted the impact of air temperature and its changes over several days for PWL slab hazard. Furthermore, earlier work pointed to the importance of snow loading (Marienthal et al., 2015; Conlan and Jamieson, 2016), which may be incorporated here by the 7 d new snow parameter (Fig. 5b). Finally, Conlan and Jamieson (2016) showed the relevance of solar warming for the PWL slab hazard. However, while Conlan and Jamieson (2016) emphasised that in addition to the spring the solar radiation is also important in the winter months, this cannot be the case here, since polar-night conditions prevail for most of the northern Norwegian winter. Thus, there is no short-wave radiation during the winter months potentially explaining its exclusion as a predictive feature here.
Regarding the wet-snow problem our results appear consistent with earlier work showing the importance of air temperature and liquid water content (LWC) of the snow (Mitterer and Schweizer, 2013; Hendrick et al., 2023). Specifically, similar to Hendrick et al. (2023) for the LWC features and the snow depth, mostly the temporal 1–3 d changes are important. In addition, the 1–3 d changes of the LWC index (lwc_i) introduced by Mitterer and Schweizer (2013) appear among the most important features of the wet-snow AP, supporting the applicability of this index.
6.2 Past changes – linear trends and correlation with the Arctic Oscillation
6.2.1 Linear trends
The lack of significant long-term (1970–2024) trends of the ADF found in Sect. 5.1.1 is consistent with the findings of Eiselt and Graversen (2025), and also with Saloranta et al. (2024) who found only few significant trends in their analysis of avalanche indicators in Norway for the period 1961–2020. Dyrrdal et al. (2020) investigated trends in climate indices connected with avalanche activity for Troms in northern Norway over the period 1958–2017 for October through April. Their results were also somewhat mixed, with variables related to snow (e.g. maximum snow amount) exhibiting both positive and negative trends across Troms, while winter rain events consistently increased. This appears consistent with our results as the wet-snow and general ADFs exhibit weak positive trends from 1970–2024 (December–May; Fig. 7). However, it must be mentioned again that these trends are non-significant and our study appears in line with the statement from the review of Eckert et al. (2024) that “trends in the the number or frequency of avalanches are often elusive” due to avalanche cycles and large decadal variability. In northern Norway, the avalanche activity appears to be influenced by regional climate modes (Eiselt and Graversen, 2025), which we turn to in the next section.
6.2.2 ADF–AO linkage
The linkage between the general ADF and the Arctic Oscillation (AO) was explored and extensively discussed by Eiselt and Graversen (2025). Several earlier studies also indicated a likely influence of the AO-related North Atlantic Oscillation (NAO) on northern Norwegian avalanche activity through its impact on the meteorological conditions (e.g. Uvo, 2003; Dyrrdal et al., 2020), although the explicit correlation analysis of the AO/NAO with ADF in Norway had not previously been conducted (for other countries such as, e.g., Iceland see Keylock, 2003). Eiselt and Graversen (2025) found especially the 3 d sum of new snow as well as the 3 d averaged wind speed in northern Norway to be correlated with the AO index. As these parameters in their combination constituting snow drift (wdrift3_3) were most important in determining the ADF, this explained the causal linkage of the ADF with the AO. Here we also investigate the linkage of the predictive features with the AO and find similar strong correlations of the accumulated new snow and wind speed with the AO index (Fig. 10). However, because of the aggregation of the predictive features across the different elevation levels as maxima (“_x” features) and minima (“_n” features; see Sect. 2.5), which is different from Eiselt and Graversen (2025), there is additional complexity to our results. Indeed, we find that the elevation-minimum new-snow features (s3_n, s7_n) are only weakly correlated with the AO index, while the correlation with the elevation-maximum new-snow features (s3_x, s7_x) is strong (Fig. 10). Thus, it appears that the AO partly determines the maximum snow fall and depth across elevations in northern Norway but has little effect on the minimum. Eiselt and Graversen (2025) focused mostly on the winter months December through February, for which the linkage was found to be clearest, although there are also significant correlations of the AO index with the general and wind slab ADFs in the spring months March through May (Fig. 8). However, here we point out that the character of the correlation in spring is different from that in the winter. The conspicuous peak of the general ADF visible both in the winter (for Lyngen see Fig. 6) and the full season is absent in the spring (see for Lyngen Fig. S8). Instead, subsequent to little change from 1970–2005, a continuous increase in the ADF is apparent, concurrent with an increase in the AO index resulting in the significant correlations seen in Fig. 8. The most important feature of both the general and the wind slab ADF (s7_n) exhibits a corresponding rise at the same time (not shown), likely explaining the ADF development. Given the weak correspondence with the AO index in the 1990s it is questionable if the increase of the spring ADF is caused by the AO. Instead, a potential driver of the rise in general and wind slab ADF in spring may be constituted by the generally increased precipitation due to Arctic warming (see also Dyrrdal et al., 2020).
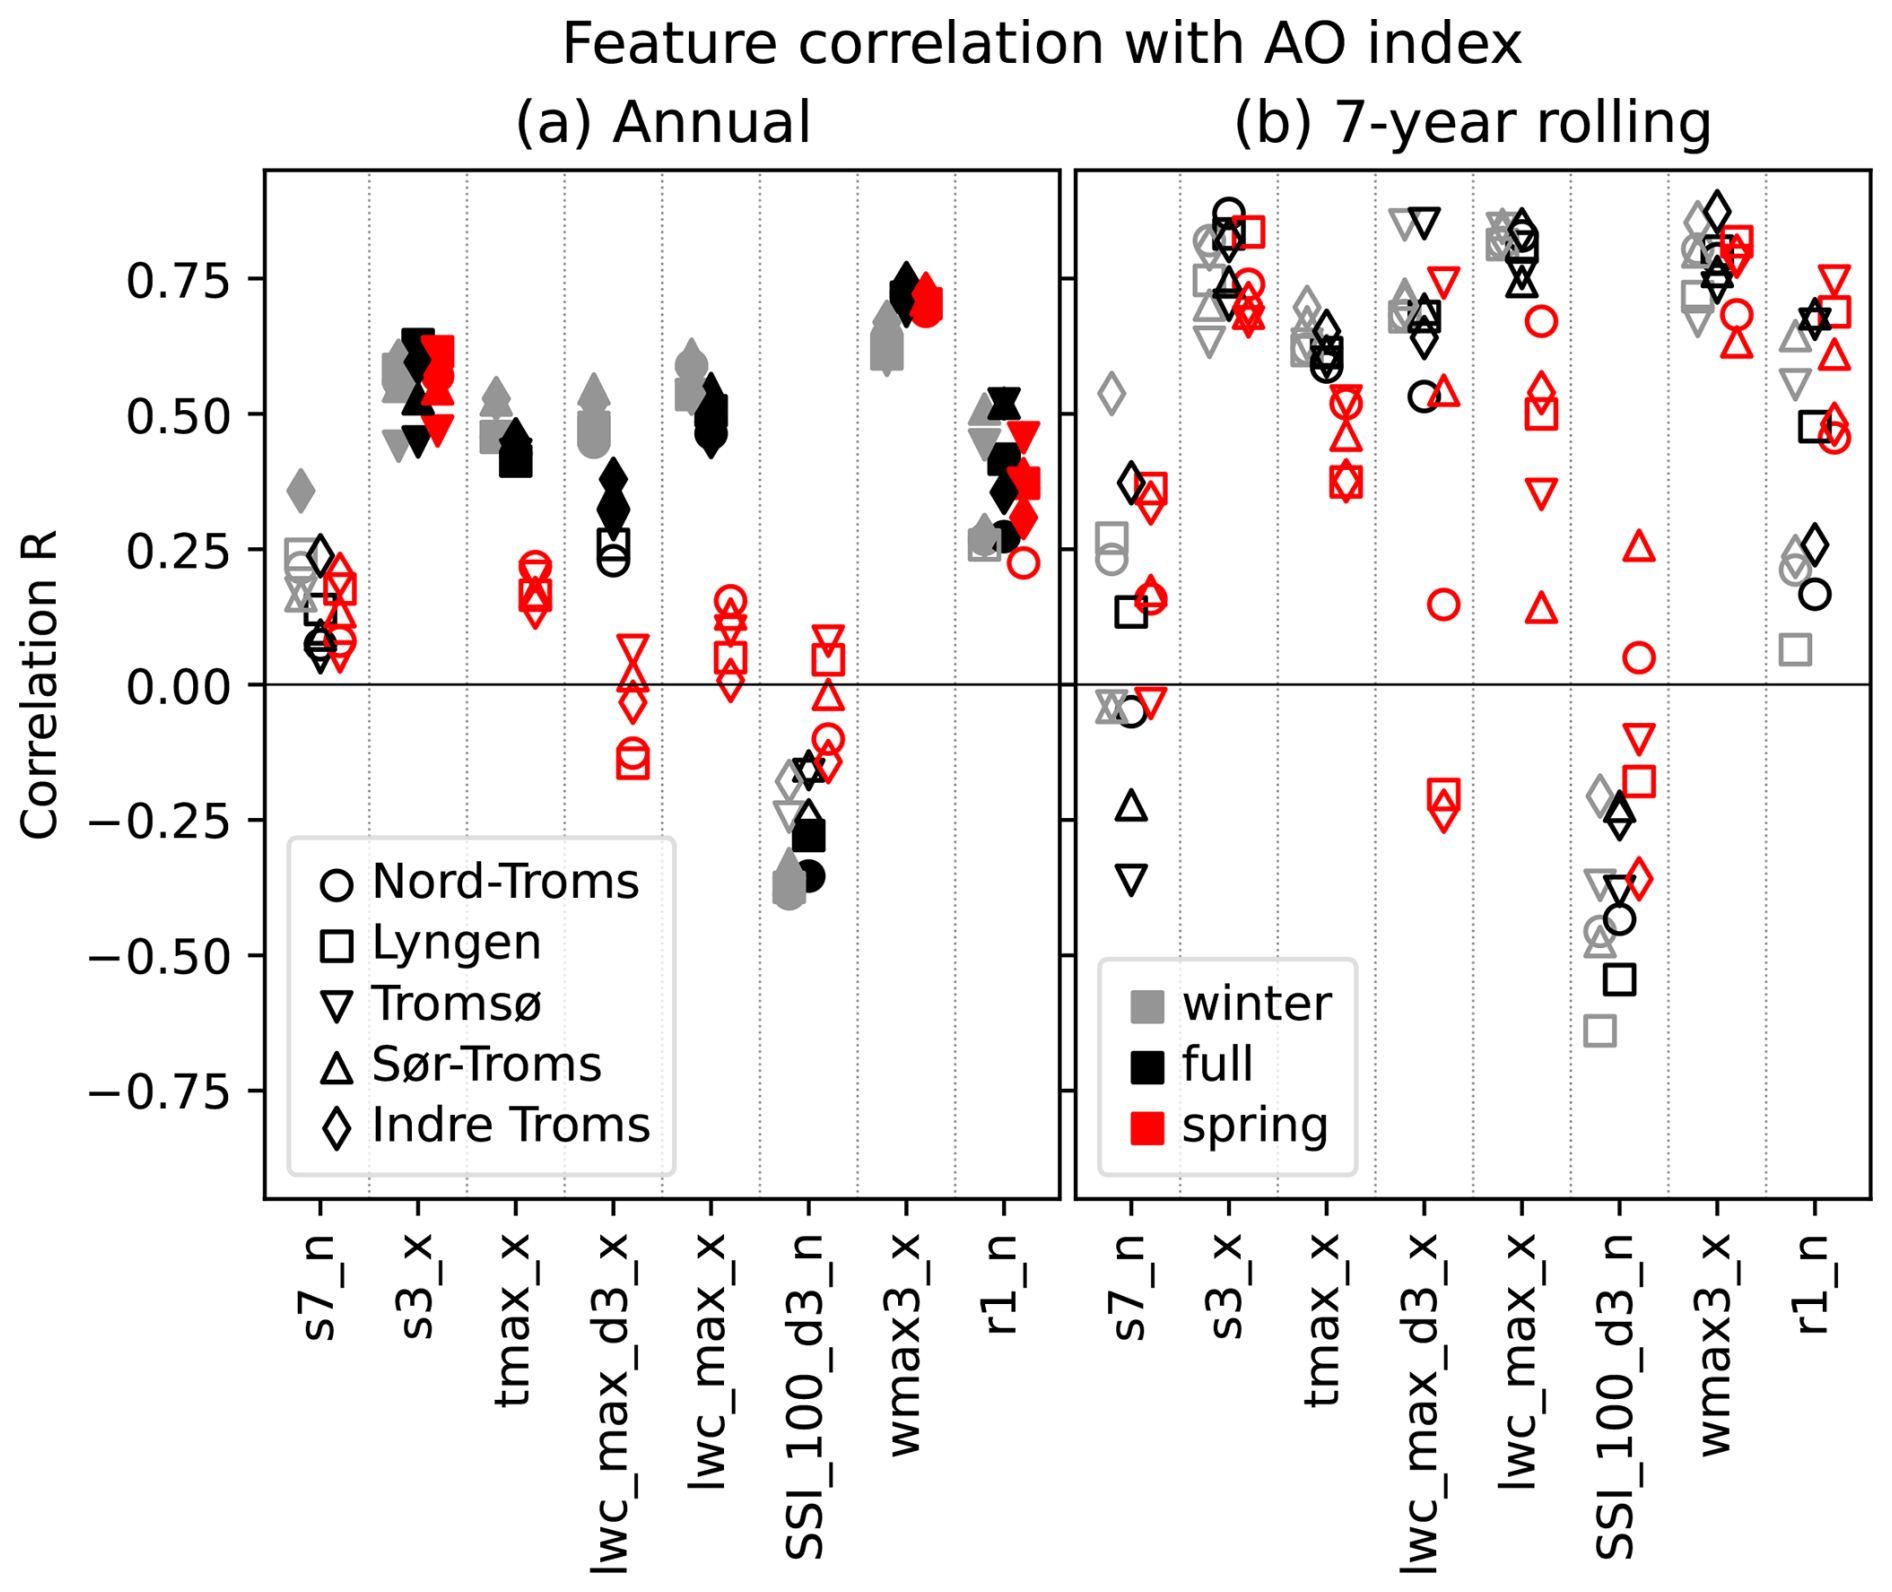
Figure 10Correlation (Pearson R) of (a) annual and (b) 7 years rolling mean NORA3- and SNOWPACK-derived predictive features with the Arctic Oscillation (AO) index for all regions in winter (gray), spring (red), and full season (black). Filled markers in (a) indicate significant correlations at p<0.05. For the feature definitions see Sect. 2.5 and Tables C1 and C2 in Appendix C.
Expanding the discussion to the other APs, we find that the strong correlations of the wet-snow ADF with the AO index in winter (December–February) are also well explained by the impact of the AO on the most important meteorological features for this AP. Both tmax_x and the features related to the LWC (e.g. lwc_max_d3_x and lwc_max_x) are strongly correlated with the AO index in winter (Fig. 10). Conversely, correlations of the wet-snow ADF with the AO index in spring (March–May) are much lower, especially for the annual values. This is well in line with the most important feature (tmax_x) which shows only a small peak in the 1990s, and after 2005 remains constant or even slightly declines, while the spring AO index concurrently increases (Fig. S14). Spring temperatures thus appear little influenced by the AO explaining its small impact on the spring wet-snow ADF. The low correlations of the full-season (December–May) wet-snow ADF with the AO index are more difficult to understand since most of the important features (e.g. tmax_x and lwc_max_d3_x) are correlated well with the AO index (Fig. 10). One explanation may be that for several other important features (especially SD_d1_n), the correlations with the AO index are considerably worse for the full season than winter (not shown).
Finally, a potential linkage of the PWL slab ADF with the AO appears unclear, especially since there are large differences between the correlations based on the annual and 7 years rolling-mean values. For the annual values, the correlation of the PWL slab ADF with the AO index is mostly close to zero, which is consistent with the correlation between the AO index and the most important features (see SSI_100_d3_n in Fig. 10). For the 7 years rolling mean values, the often strong negative correlations of winter and full-season PWL slab ADF with the AO index also appear in line with the correlations between the AO index and SSI_100_d3_n. We are unable to provide an explanation for the differences between the annual and the 7 years rolling mean values. However, three points may be noted regarding the potential linkage of the AO with the PWL slab AP: (1) The positive correlation of the AO index with temperature may imply thaw events that stabilise the snowpack, leading to fewer PWLs. (2) The generally negative correlation of the PWL slab ADF with the AO index may result from the concurrent higher wind slab and wet-snow ADF, reflecting the fact that fewer weak layers persist for a long time as avalanches readily release due to frequent new snow and wind-drift loading. (3) The performance of the RF model in terms of predicting PWL slab ADF is low (Fig. 4), calling into question the robustness of the results regarding this AP (see also Sect. 6.4).
6.3 Future changes – dependence on avalanche problem and elevation
To explain the changes of the ADF in the future climate scenarios we investigate projected changes of the most important predictive features.
The wet-snow problem stands out among the APs as the only one mostly increasing over the 21st century, dependent on the warning region. This appears well in line with the important features (Fig. 5), i.e. the maximum temperature (tmax_x; see Fig. 11e and f) and several LWC-derived features (lwc_max_d3_x, lwc_max_x; see Figs. 11g, h and S15e, f, respectively) which increase as well. The dependence on the warning region is likely explained by the changes in snow depth across different elevation levels: In the low-elevation regions (Tromsø and Sør-Troms), little snow remains in the late century (see also Dyrrdal et al., 2020) leading to a general decline in all the APs, including the wet-snow problem, while in the other regions, there is still enough snow to cause considerable avalanche danger. We note that when not including the snow depth as a predictive feature in our RF model, a similar increase in wet-snow ADF is predicted in all warning regions, even in the RCP8.5 late-century simulation. This is likely due to the temperature being the most important feature, determining a continuous increase in wet-snow ADF. However, this becomes unphysical if no snow remains. Thus, it is important to include snow depth or snow-depth-related parameters as predictive features in ML models, even if they do not appear among the most important (see also Lazar and Williams, 2008, and Appendix A).
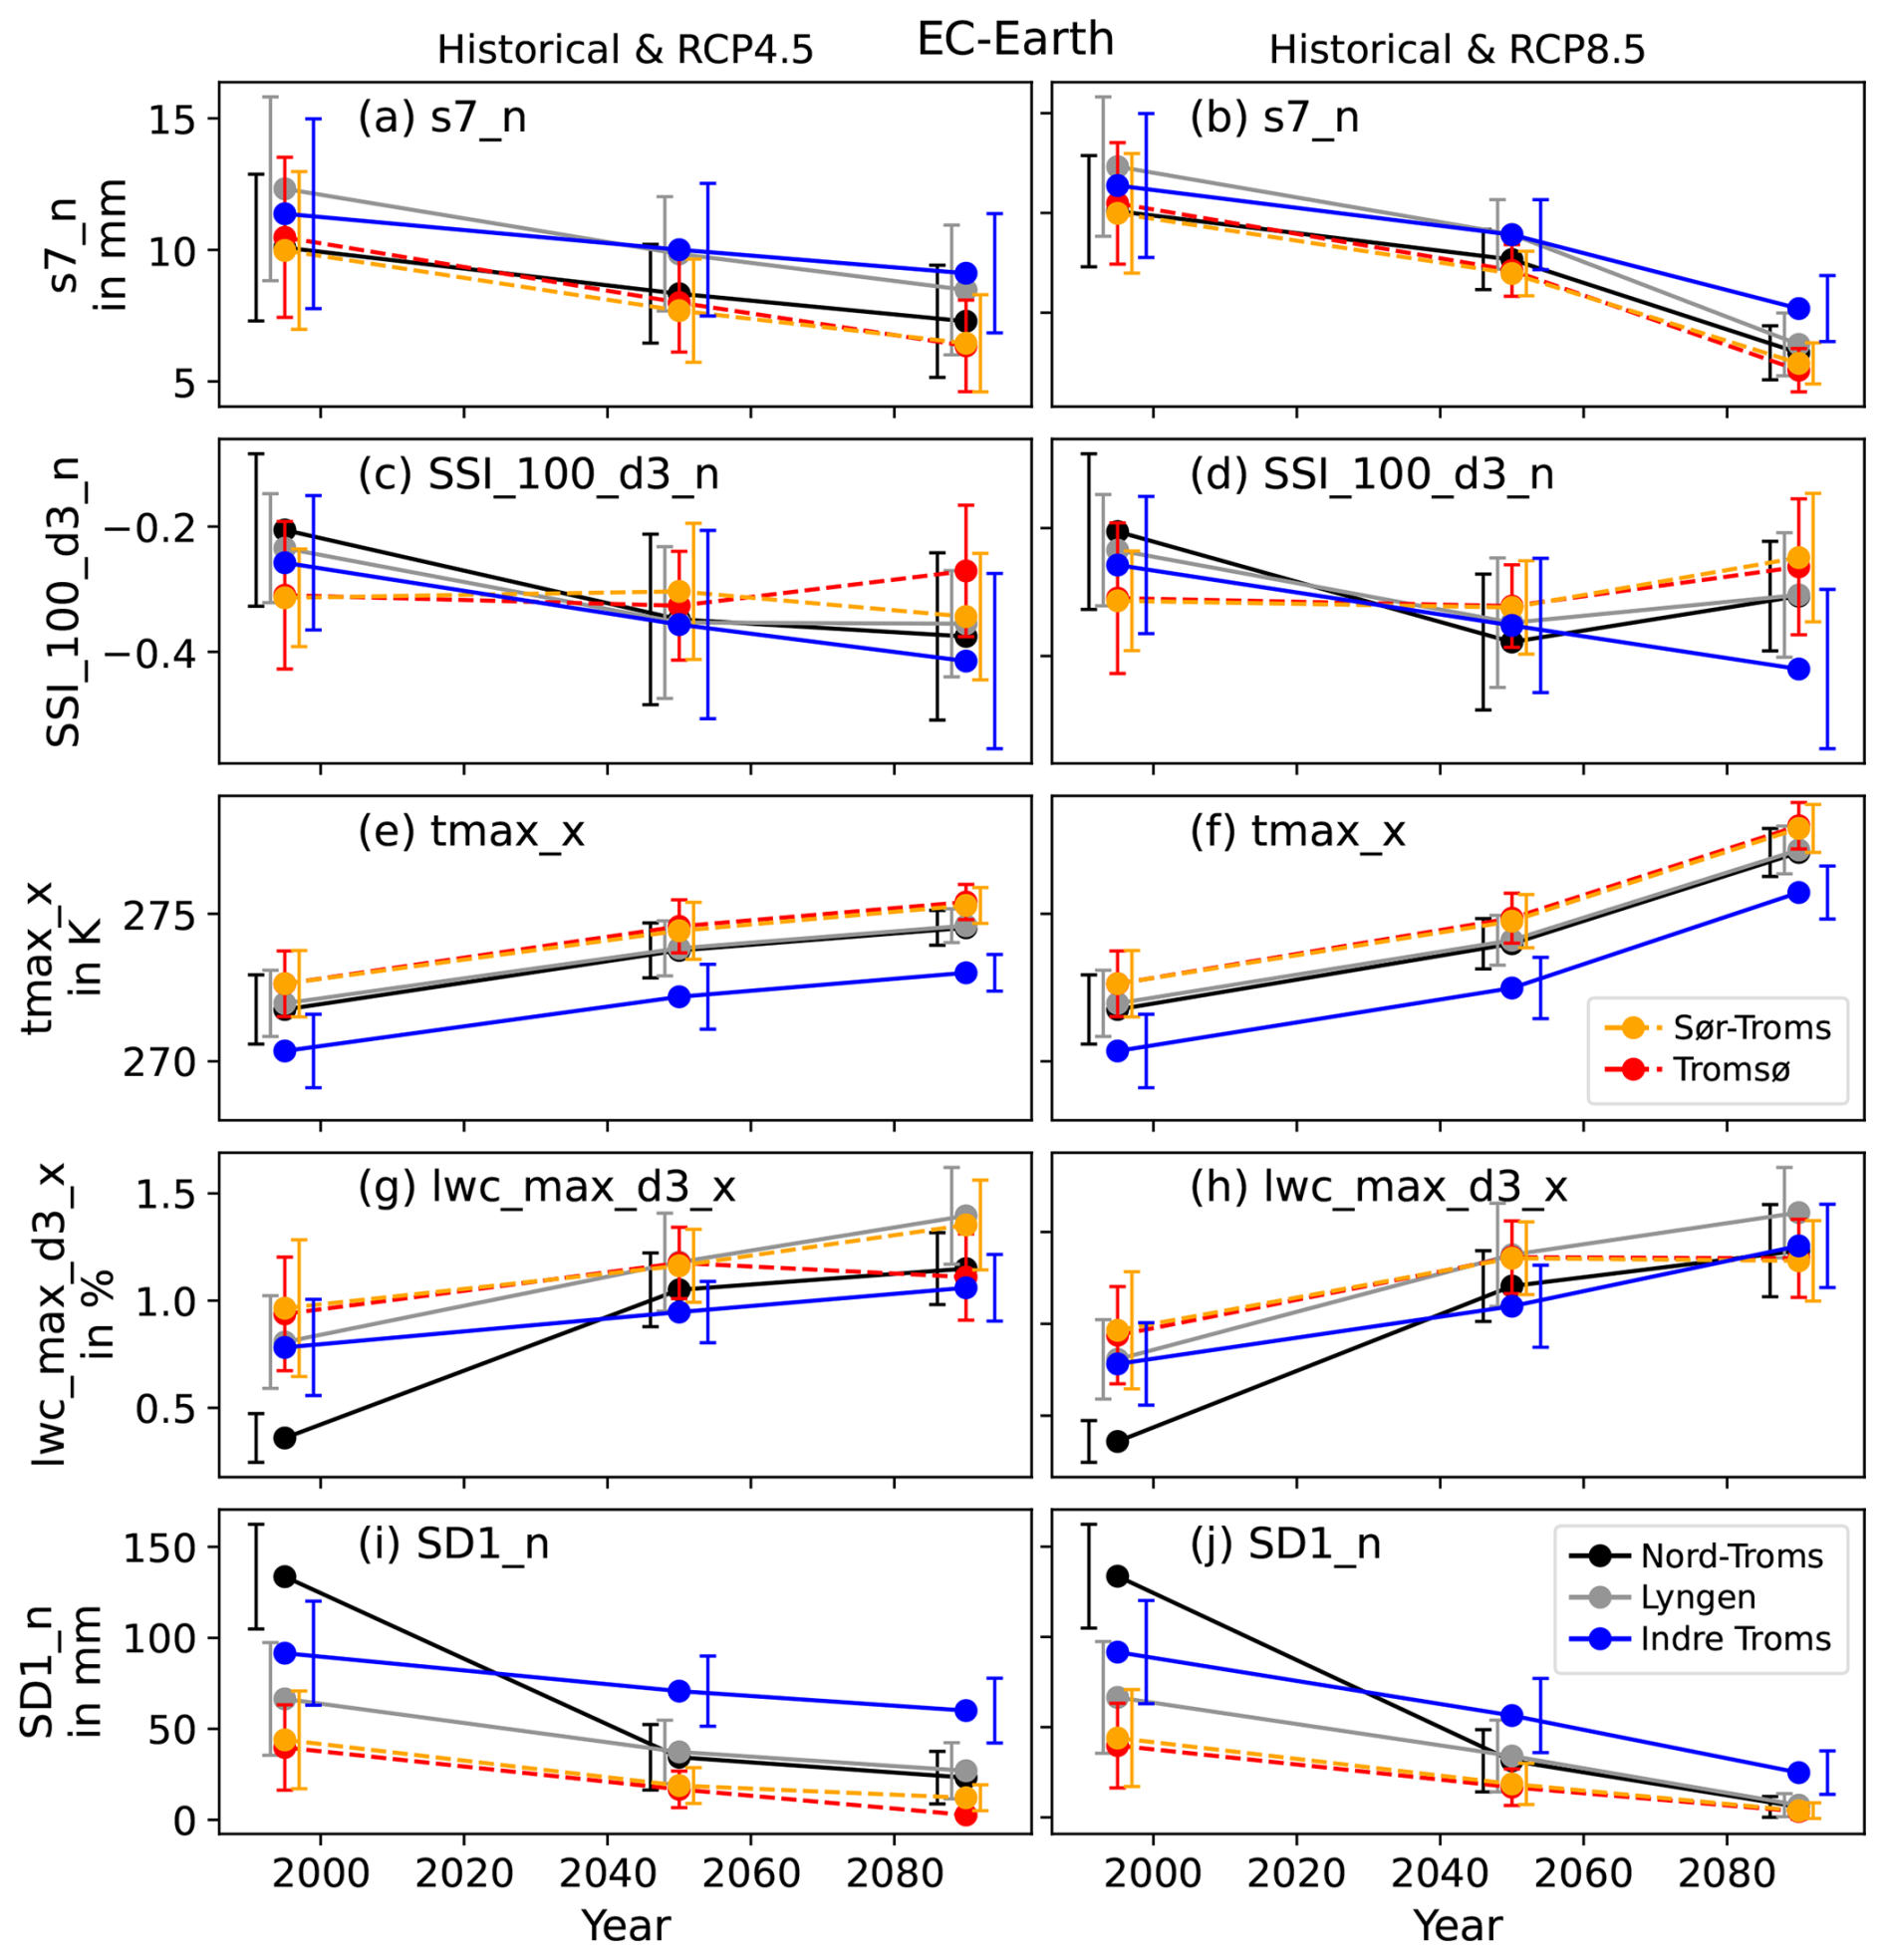
Figure 11NorCP- and SNOWPACK-derived predictive features for the EC-Earth RCP4.5 (left panels) and RCP8.5 (right panels) simulations. Shown are the averages (dots) of the three 20 years periods 1985–2005 (historical), 2040–2060 (mid-century), and 2080–2100 (late century). The errorbars indicate the standard deviation over the 20 years periods. The errorbars are slightly horizontally shifted for better readability. The different colours represent the different individual warning regions. For the feature definitions see Sect. 2.5 and Tables C1 and C2 in Appendix C.
Turning to the other APs, the consistent decline of the wind slab and general ADF throughout the 21st century results partly from a significant decline of the snow fall (s7_n; see Fig. 11a and b) as well as of other important parameters related to snow depth, wind speed, and snow drift (see Fig. S15). This is in agreement with earlier work from Dyrrdal et al. (2020) who investigated RCP8.5 future projections of climate indices related to avalanches in Troms. They found a decline in most of the indices related to snow fall and wind (maximum snow fall, snow drift), especially towards the end of the century and indicated that a decline of dry-snow avalanches may set in before 2040, even in the higher and colder regions within Troms, consistent with the results presented here.
The decreasing PWL slab ADF especially over the late 21st century concurs with the changes in the stability indices and their derivative features. The 3 d change of the SSI becomes smaller in the late century (Fig. 11c and d), while the SSI itself increases (Fig. S15a and b), implying more stable snowpack conditions. The decline of the PWL slab ADF is consistent with a recent study for the Swiss Alps by Mayer et al. (2024). They conducted a more detailed analysis of the SNOWPACK profiles and found a decline of persistent grain types, which tend to form in cold conditions, decreasing the likelihood of PWL formation. They further pointed to the influence of higher temperatures being responsible for weaker temperature gradients through the snowpack, leading to fewer weak layers being formed. We note that although temperature-related features are not included in the prediction of the PWL slab AP (Fig. 5b), the temperature effect may be represented in the SNOWPACK-derived stability indices (SSI, Sn38, Sk38) which are the most important features in determining the PWL slab ADF. Consistent with our and Mayer et al. (2024)'s findings, Katsuyama et al. (2023) in their +4 °C climate change experiments also found a reduction in the number of PWLs in northern Japan which they interpreted as resulting from the snowpack stabilising quicker due to the higher temperatures (see also Lehning et al., 2002b).
Our results regarding the general decline of avalanche danger and also the shift of the AP away from the PWL slab and wind slab towards the wet-snow problem appear to be consistent with the earlier work considering the Troms county by Kuya et al. (2024) and Dyrrdal et al. (2020). The latter analysis of snow-avalanche-related climate indices argued for a higher frequency of wet-snow avalanches and slushflows in the future due to increasing snow melt and winter rain. However, the Troms climate fact sheet (Hisdal et al., 2017, later updated by Hisdal et al., 2021) pointed out that in the long run the frequency even of wet-snow avalanches and slushflows will decline as less snow is available. Here we find that while wet-snow avalanche danger indeed will likely decline at low elevation, at higher elevation it remains considerable even at the end of the century. A similar conclusion emerged from Kuya et al. (2024)'s analysis of snow, sleet, and rain projections in Norway, indicating that in Troms at low elevation the amounts of snow will decline, while little to no decline was found at high elevation. However, they noted that despite the small changes of snow amount, the water content of the snow will increase, supporting our results of increased wet avalanche danger at higher elevation.
An elevation dependence of future avalanche development was also indicated in studies in other regions. Castebrunet et al. (2014) in their investigation of projections of future avalanche activity in the French Alps reported that in the northern French Alps avalanche activity declines during the 21st century, while in the southern Alps it increases, especially during winter (15 December–15 March). They explained the discrepancy with the difference in altitude, the northern French Alps being generally lower than the southern French Alps, consistent with our findings. However, they caution that the findings on these smaller scales remain uncertain. Notably, they also reported a 20 %–30 % decrease of avalanche activity in general across the French Alps, qualitatively in agreement with the results presented here. Another similar finding is that there is relatively little difference between the climate scenarios by mid-century, while differences become more marked by the late century. As observed by Castebrunet et al. (2014), this implies that climate policies may have an impact on late-century avalanche danger (also compare Lazar and Williams, 2008). However, it appears that for the mid-century the impact would be marginal. The shift of the dominant AP from dry to wet was also found recently for the Swiss Alps by Mayer et al. (2024). Similar to the present study and Castebrunet et al. (2014), they reported a general decline of December through May avalanche activity (by 10 %–60 %), resulting mainly from less frequent dry-snow avalanches which are only partly compensated by more frequent wet-snow avalanches. An elevation dependence is also clear from Mayer et al. (2024), as stations below 2300 m a.s.l. exhibited decreasing wet-snow avalanche activity, while above 2300 m wet-snow avalanches became more frequent during the 21st century. We note that with a maximum elevation of about 1800 m, Troms has generally much lower altitude than the French (Castebrunet et al., 2014, separate into low, medium, and height at 1800, 2400, and 3000 m, respectively) and the Swiss Alps (Mayer et al., 2024, divide high and low at 2300 m). This likely explains the similarities between the projected future changes in avalanche activity in Troms and the Alps, despite the large latitudinal difference (Troms being at about 70° N versus the Alps at about 45° N).
6.4 Limitations
Several limitations of our study should be pointed out. A fundamental concern is the data basis which consists of downscaled climate data at a spatial resolution of 3 km. While the downscalings have been shown to improve the representation of regional and local meteorological conditions compared to the lower-resolution reanalyses and climate models (Haakenstad et al., 2021; Haakenstad and Breivik, 2022; Lind et al., 2020), a 3 km resolution still implies a “smoothing” of meteorological conditions. This is especially true for extreme events which are important for avalanche release. However, we note that our binary classification of the avalanche danger into AvD and non-AvD in itself implies a sort of smoothing. Days with DLs 4 and 5 which are most likely associated with extreme events are combined with days with DL 3 which more often occurs under non-extreme conditions. We thus expect the effect of the 3 km resolution to be relatively small. Biases in the reanalysis and model data, especially relating to wind and precipitation (see Haakenstad et al., 2021; Haakenstad and Breivik, 2022; Lind et al., 2020), may also impact the prediction of the APs. However, in this study we only consider changes and not absolute values, and we investigate these changes only within the same datasets (i.e., we do not inter-compare NORA3 and NorCP). Nonetheless, a comparison of the NORA3 and NorCP historical (1985–2005) ADF confirms their similarity (see Fig. S16). Hence, we believe the influence of these biases on our conclusions to be minimal.
A further concern is the large extent of the warning regions in the Norwegian avalanche bulletin (Eiselt and Graversen, 2025). Since meteorological conditions may be different throughout the individual regions, this complicates the linkage with the regional DL and likely decreases the ML model accuracy. It also requires a severe spatial aggregation of the meteorological and snow data, likely obscuring information that would be important for a more spatially refined avalanche-danger prediction. To investigate the impact of the strong spatial aggregation on the prediction accuracy we have tested several different ways of performing spatial aggregation or selection of grid cells. We have generated the predictors for ten specifically wind- and snow-exposed grid cells per avalanche region (SNOWPACK was run for these grid cells specifically as well), but this did not improve the performance of the ML models. Moreover, we have tested taking the maxima/minima of the features for each individual elevation band (resulting in a much larger number of features), but the impact on the model performance was again minimal.
The meteorological input data for the SNOWPACK model are also strongly spatially aggregated and it is questionable if representative snowpack profiles may be obtained on this basis. As a further sensitivity test, we additionally performed the SNOWPACK simulations for the four main aspects at 38° steepness (the most frequent avalanche slope according to McClung and Schaerer, 2006), but the inclusion of these data did not improve the performance of the ML models. The result that the SNOWPACK-derived parameters are found among the most important features, especially for the PWL slab, is encouraging in this regard, but the fact that the RF model performance does not increase compared to Eiselt and Graversen (2025) raises doubts about the current quality of information gain from SNOWPACK. A further concern is that the input data sets for SNOWPACK derived from NORA3 and NorCP consist of different variables. This may lead to inconsistencies, but, as mentioned above, we believe our approach of comparing prediction results only within datasets minimises this problem.
Another issue is that the version of SNOWPACK used here has not been validated for the Arctic conditions prevailing in northern Norway. Using an earlier version of SNOWPACK, Domine et al. (2019) found that SNOWPACK does not simulate density and thermal conductivity profiles of an Arctic location (Bylot Island) correctly. However, we note that despite the similar latitude of Bylot Island (73° N), the climatic conditions there are considerably different from those in the Troms county, especially in terms of temperature. According to Domine et al. (2019) the annual average temperature on Bylot Island is −14.5 °C, while the values given by Hisdal et al. (2021) for several locations in Troms range from 1−4 °C. Thus, it is likely that the issues found by Domine et al. (2019) do not apply as strongly in Troms. Indeed, the problems pointed out for a SNOWPACK simulation on Kvaløya in Troms county by van Herwijnen et al. (2024) did not relate to strong temperature gradients but rather to the input data stemming from a numerical weather prediction model. However, an issue with SNOWPACK in the Norwegian context is an inadequate representation of the impact of wind (Bert Kruyt, personal communication, 2025; see also https://avacollabra.org/wind_in_snowpack/, last access: 5 January 2026). In the course of the operational implementation of SNOWPACK for Norway (Herla et al., 2024), NVE has developed a new wind parametrisation that has recently been published (https://gitlabext.wsl.ch/snow-models/snowpack/-/tree/NVE/snowpack?ref_type=heads; last access: 17 November 2025) and may be used in future research.
Associated with the issues concerning the input data is the uncertainty of the ML model predictions. As pointed out in Sect. 4, the accuracy in predicting AvDs tends to be moderate and is especially low for the PWL slab AP. Furthermore, for the wind slab AP, AvDs are significantly overpredicted, while the opposite is true for the PWL slab AP. Only for the wet-snow and general APs the RF model reproduces the true distribution of AvDs and non-AvDs. Since these issues may impact the robustness of our hindcast and future projection results, we perform a further sensitivity analysis. We train three additional RF models, always excluding a different pair of years (winters ending in 2018/2022, 2019/2024, 2020/2022) as test data. Comparing their predictions for the NORA3 historical and the NorCP future projection data with the predictions from the main RF model presented in the current study (excluded years 2021/2023; see Sect. 3.1) we find that the results are similar and lead to the same conclusions. Generally, while the predicted absolute ADF values differ between the RF models, the changes over time are consistent, raising our confidence in the robustness of our conclusions. We present the sensitivity analysis in more detail in Sect. S2 and show the annual ADF values and linear trends for the general AP, the 7 years rolling means and ADF–AO correlation coefficients of the wind slab AP, and the EC-Earth future projections of the wet-snow AP in Figs. S3–S5, respectively.
A further limitation of our study is that compared to some other studies focusing on future climate projections, based on several ensemble runs of the future climate simulations (Katsuyama et al., 2023; Mayer et al., 2024), we are restricted to the two single-ensemble runs available via NorCP. Thus, our study likely does not comprise a representative sample of possible future conditions and development of snow avalanche hazard in northern Norway. We note that more high-resolution (1 km) climate data are available for Norway from the Norwegian Meteorological Institute (Norwegian Meteorological Institute, 2025a; Wong et al., 2016) in the form of statistical downscalings of the EURO-CORDEX dynamical downscalings for Europe (Jacob et al., 2014). These data are unsuitable for our work because they lack wind information and their resolution is daily. Nonetheless, we have attempted to train RF models to generate ADF projections based on these data. The results (Figs. S17–S19) generally support our conclusions based on the NorCP data (for a brief discussion see Appendix A). A new version of the statistical downscaling data based on the EURO-CORDEX simulations including wind data was released in October 2025 (Anita Verpe Dyrrdal, personal communication, 2025; see also , 2025). Employing temporal downscaling techniques, as done by, e.g. Mayer et al. (2024), may enable the utilisation of SNOWPACK also for these data and make available a large and more robust set of future climate projections for the purposes of avalanche danger prediction in Norway.
As a final, more general concern we point to the notorious uncertainty of regional future climate projections, especially with respect to wind and precipitation which are strongly controlled by dynamics (Shepherd, 2014). In northern Europe, the Atlantic Meridional Overturning Circulation (AMOC) is an important phenomenon influencing the regional climate (e.g. Jackson et al., 2015; van Westen et al., 2024). The AMOC is projected to decline in most future GCM simulations conducted for CMIP, although the magnitude of the decline varies widely between GCMs (Weijer et al., 2020; Eiselt and Graversen, 2023; Madan et al., 2024). However, few future scenarios take a full AMOC collapse into account, while recent work increasingly points to this possibility (Liu et al., 2017; Ditlevsen and Ditlevsen, 2023; Dijkstra and van Westen, 2026). A collapse of the AMOC would likely have severe consequences for northern European climatic conditions, such as a strong regional cooling (e.g. Jackson et al., 2015; van Westen et al., 2024), implying considerable impacts on the snow-avalanche hazard. However, different conclusions specifically for the northern Norwegian context may be drawn from recent research by Årthun et al. (2023) who found that the Nordic Seas overturning circulation in fact strengthens in future climate simulations, thus diverging from the development at lower latitudes and acting as a stabilising factor for the AMOC. Hence, they caution that the changes in North Atlantic overturning “should not be extrapolated to the Nordic Seas and Arctic Ocean.”
This study investigates past and future changes of avalanche danger in northern Norway based on a machine-learning methodology. The danger levels, published in the daily Norwegian avalanche bulletin, for the general avalanche problem as well as the three avalanche problems (APs) wind slab, PWL slab, and wet snow are aggregated from a five-level scale to a binary scale of avalanche days (AvDs) and non-avalanche days (non-AvDs), and the avalanche-day frequency (ADF) is interpreted as a metric to gauge avalanche activity. Random forest (RF) models are optimised and trained to predict the AvDs based on predictive features derived from downscaled reanalysis data (NORA3) as well as downscaled future climate projection data (NorCP). In addition, the SNOWPACK model is utilised to simulate the snow cover. For the historical period (1970–2024) only marginal linear trends are found, concurring with earlier work covering northern Norway (Eiselt and Graversen, 2025). However, this finding is uncertain, in line with previous findings stating that historical trends in avalanche activity remain unclear (Eckert et al., 2024). Considerable decadal variability of avalanche danger is encountered, and following the earlier work by Eiselt and Graversen (2025), a linkage is established between the Arctic Oscillation (AO) and the avalanche danger in northern Norway. However, this linkage depends on the AP, and while the general AP as well as the wind slab and wet-snow avalanches appear partly linked with the AO, this is not the case for the PWL slab. The connection of the AO with the ADF is traced to the most important predictive features used in the RF models. Many of the meteorological parameters that determine the general, the wind slab, and the wet-snow AP are significantly correlated with the AO index. In contrast, the SNOWPACK-derived stability indices are less well correlated, hereby providing a possible explanation of the observed weaker linkage of the AO and the PWL slab. For the 21st century, based on the future climate projections, the RF models predict significant changes in avalanche danger, which are, however, dependent on the emission scenario, the elevation, and the AP. For the general, the PWL slab, and the wind slab AP, the ADF is found to decline throughout the 21st century. This is the case for both studied emission scenarios, but the changes are more severe in RCP8.5 than in RCP4.5. The wet-snow ADF exhibits a more nuanced development which is more dependent on elevation than the other APs. The wet-snow ADF increases until mid-century but this increase continues towards the late century only in the regions at higher elevation, while it reverses to a decline in the regions at lower elevation. Hence, our study appears to concur with the developing consensus expressed in Eckert et al. (2024) that in lower regions, avalanche frequency will likely generally decline but in higher regions it will increase due to wet-snow avalanche danger.
Reliable climate change information for natural hazards is important for planning and decision making, especially in Arctic Norway with its low population density and communities depending on supply lines that can easily become cut off (e.g. roads without alternative routes; see Jacobsen et al., 2016; Hovelsrud et al., 2018). The present study builds on and expands Eiselt and Graversen (2025) to provide information on climate change development of snow-avalanche hazard in northern Norway, similar to previous work for other regions (e.g. Castebrunet et al., 2014; Katsuyama et al., 2023; Mayer et al., 2024). The finding that avalanche danger is generally projected to decline is encouraging, but it is important to take into account the projected change of avalanche characteristics – the shift from dry to wet avalanches. For instance, as suggested by Mayer et al. (2024), mitigation and hazard-mapping procedures should not assume stationary conditions and be revised more frequently (e.g. every 10 years). More generally, to accommodate the uncertain and complex nature of socio-environmental challenges in a changing climate including changing natural hazards, dynamic planning approaches should be developed to ensure society resilience. Natural hazard projections as conducted in this study are an important part of such approaches, and work is currently under way applying the so-called “adaptation pathways” methodology (Haasnoot et al., 2013; Buurman and Babovic, 2016; Werners et al., 2021) in northern Norway with a focus on avalanche hazard to provide an adaptation strategy adequate for the changing Arctic climate.
In addition to the NorCP data, high-resolution (1 km) future projection climate data are available for Norway from the Norwegian Meteorological Institute (Norwegian Meteorological Institute, 2025a; Wong et al., 2016). These are statistical downscalings of the EURO-CORDEX dynamical downscalings for Europe (Jacob et al., 2014). However, no wind information is provided and the temporal resolution is daily, preventing the utilisation of these data as input for SNOWPACK. Moreover, a robust partitioning of the precipitation into snow and rain also appears infeasible. Despite these shortcomings we have trained RF models using only the predictive features available from the EURO-CORDEX-based data (i.e. only temperature- and precipitation-related features; note that the partition into snow and rain is thus to some degree taken into account internally by the RF model). This apporach in fact results in a similar predictive performance compared to the RF models presented in Sect. 4 (not shown). We note that this further questions the usefulness of the SNOWPACK-derived predictive features, at least as they are included here. The future projections of the ADF based on the data derived from EURO-CORDEX for three climate models are shown in Figs. S17–S19. They concur insofar with the NorCP-derived results (Figs. 9 and S9) as all avalanche problems except the wet snow exhibit a decline in ADF which is stronger in RCP4.5 than in RCP8.5. However, when it comes to the wet-snow problem, the EURO-CORDEX-derived results show a strong monotonic increase throughout the 21st century. As noted in Sect. 6.3, this illustrates the importance of including predictive features related to the snow depth in the ML model. The wet-snow problem based on the EURO-CORDEX-derived data is mostly predicted by temperature variables and since snow-depth-related variables are missing this implies a constant rise in the ADF concurrent with the projected temperature rise. Hence, this presents an argument for the usefulness of the SNOWPACK simulation data as they ensure that the ML prediction results are physically reasonable, even if they do not appear to improve the ML model performance as gauged by standard metrics for the historical period.
The significance of the difference between the avalanche-day frequency (ADF) predicted for the different periods within a given future climate scenario (Figs. 9 and S9–13) is tested with a Monte-Carlo simulation which is described in the following: Let A and B be two periods (all periods comprise 20 avalanche seasons, i.e., 20 ADF values). The “observed” statistic is calculated as the mean ADF of climate period A minus the mean ADF of period B. Then periods A and B are combined and their ADF values are randomly permuted. The permuted values are subsequently divided again into two periods (Atest and Btest) and the difference between their mean values is calculated. If this mean difference between Atest and Btest is larger than the mean difference between A and B a counter is incremented. This procedure is repeated for a given number of permutations (here 100 000). Finally, the p value is calculated by dividing the counter by the number of permutations, giving the fraction of instances in which a random shuffling of the data produced a larger difference than the real difference of periods A and B, i.e., the observed statistic.
Tables C1 and C2 list and give descriptions of all the predictive features considered in this study.
Table C1Potential predictors constructed from NORA3 meteorological data. The “nowcast day” refers to the day of publication of the avalanche danger nowcast (see Sect. 2.1 for details). See Sect. 2.5 for more details on the parameter definition.
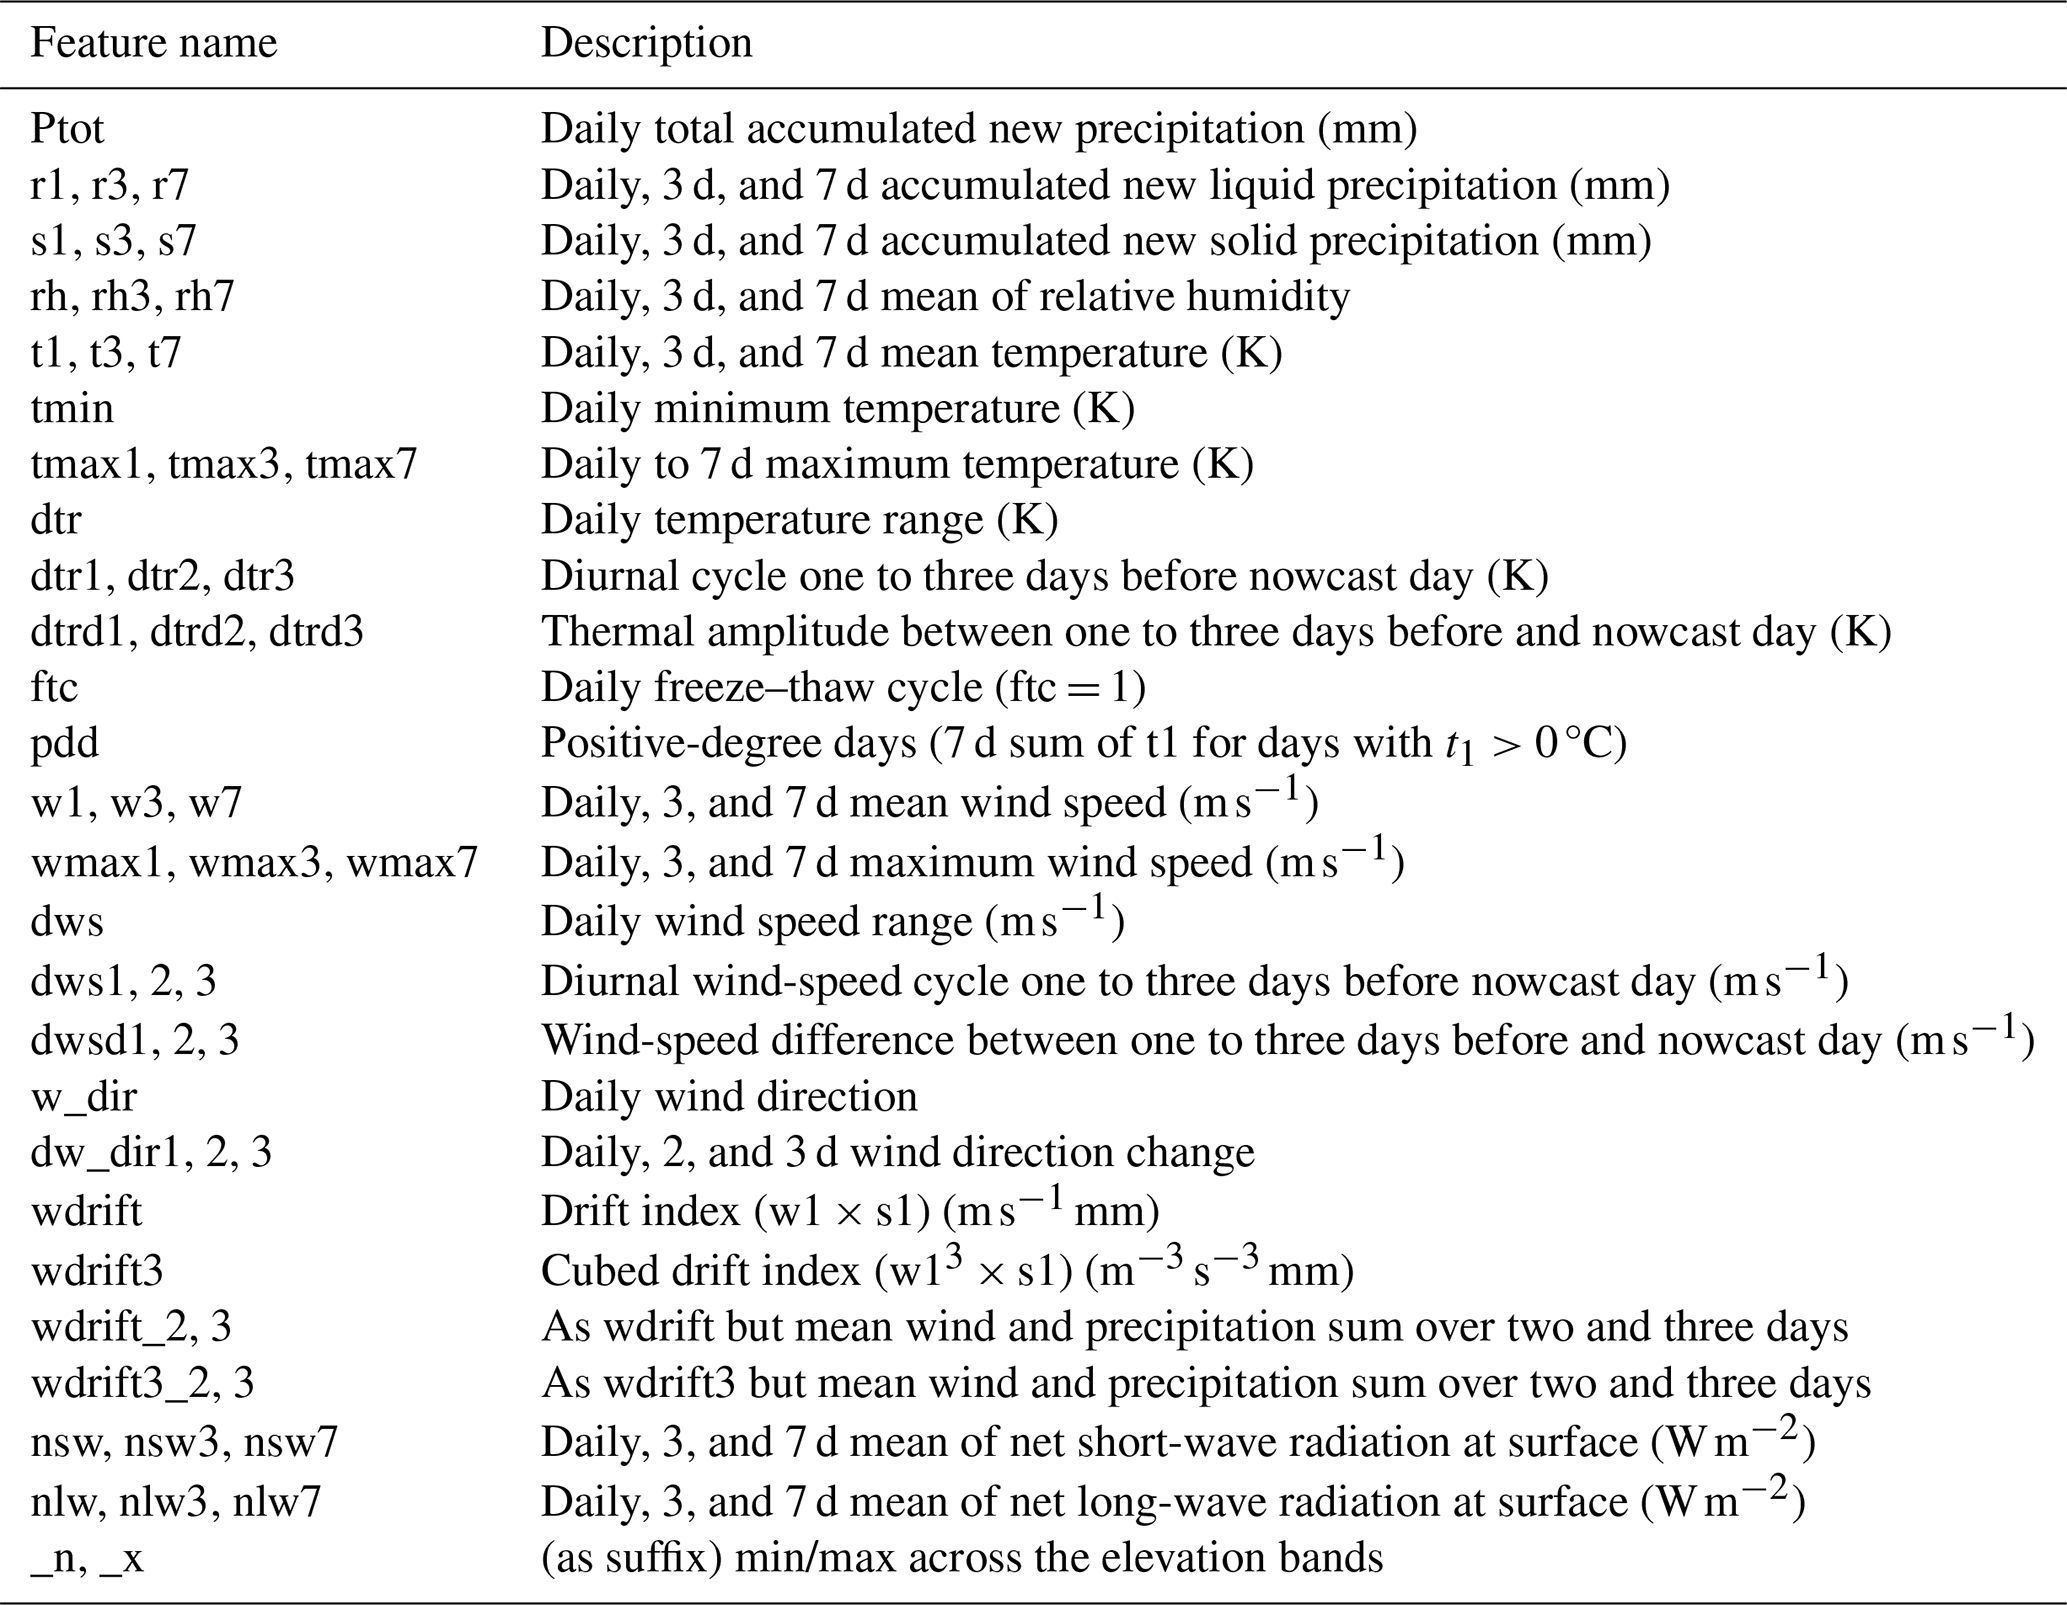
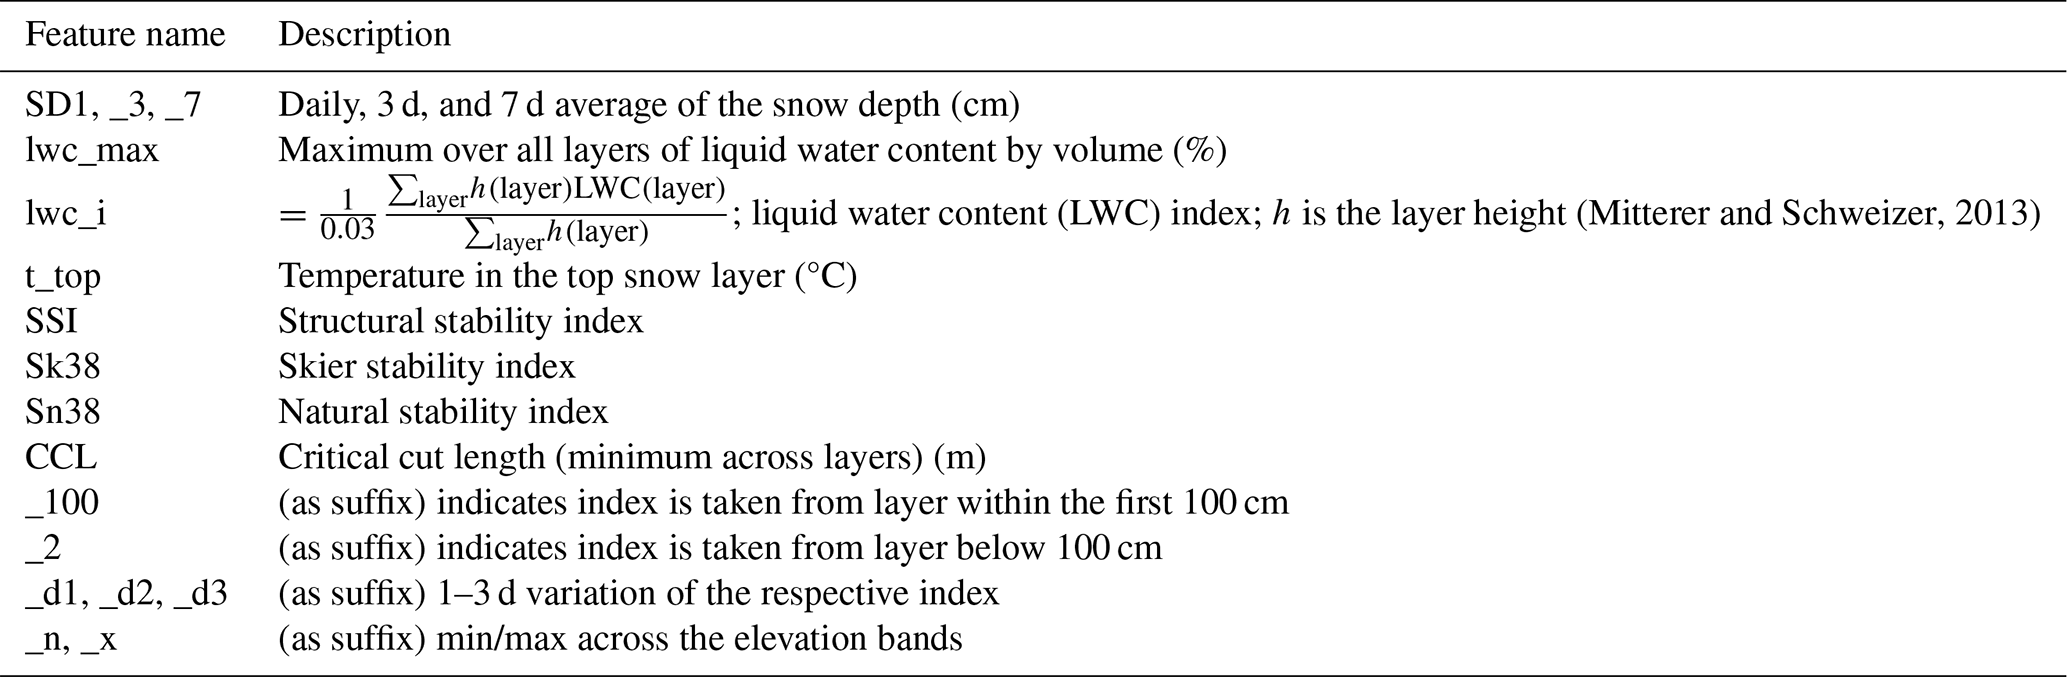
Here we briefly present the metrics that are employed to gauge model performance using hits (a), false alarms (b), misses (c), and correct non-events (d), which are used to calculate the following performance metrics:
representing the fraction of hits among the positive forecasts (i.e., hits and false alarms),
representing the fraction of hits among the positive observations (i.e., hits and misses), as well as
being the harmonic mean of precision and recall. A macro score represents the unweighted mean of the score over all classes, thus treating all classes equally (e.g., Sokolova and Lapalme, 2009). Further scores employed are
and, finally,
Table E1 lists the hyperparameters found to optimise the performance of the random forest models during the grid-search procedures for the individual avalanche problems. Additionally, it provides the number of included predictive features.
Table E1The sets of hyperparameters used in the random forest models. The row “Maximum number of features” refers to the number of features considered at each split in the decision trees. “log2” indicates the binary logarithm of the number of all included predictive features. The last row indicates the number of included predictive features per avalanche problem. See Sect. 3.3 for the optimisation procedure employed to determine the hyperparemter set and the number of features.
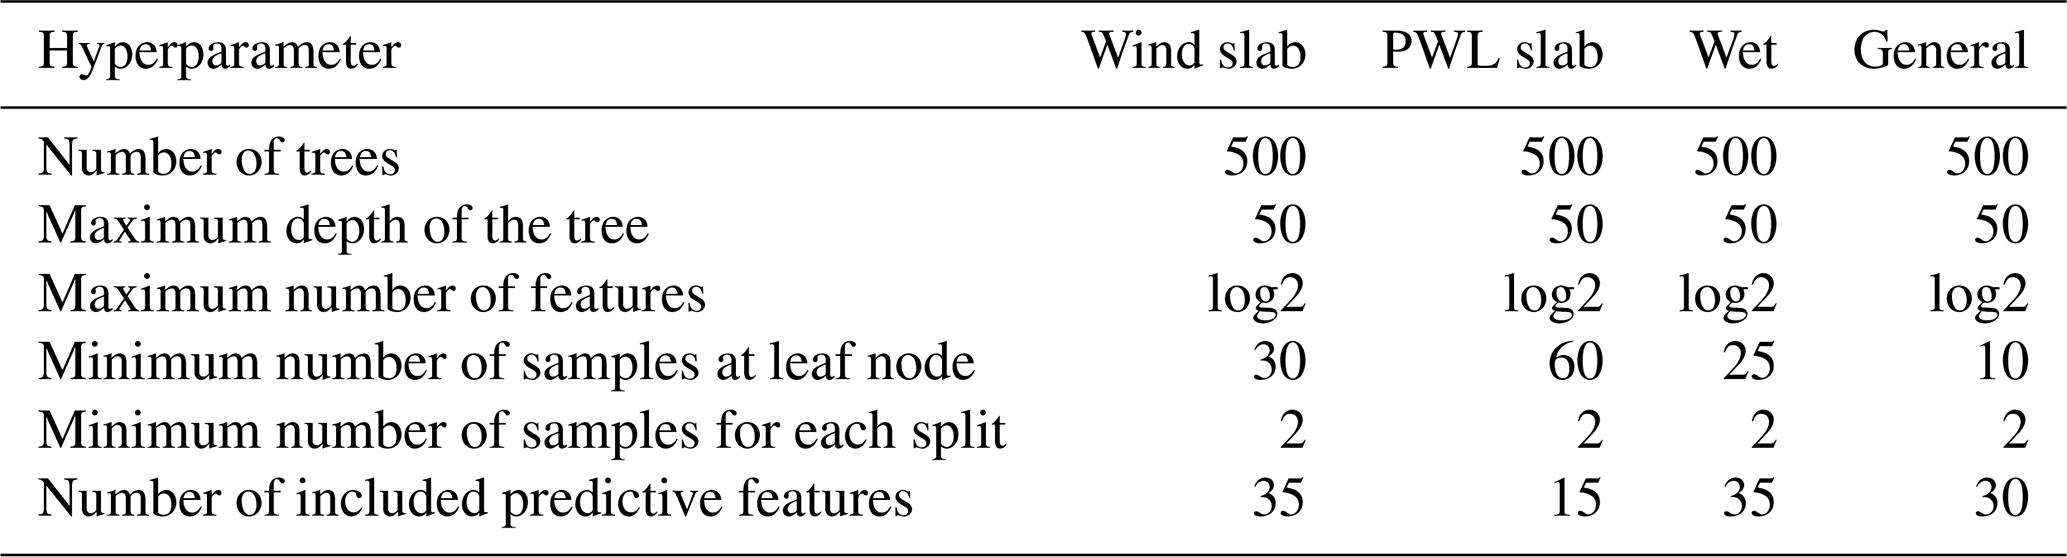
The programming language Python was used to perform the data analysis and generate the figures. The random forest model was generated using the Python library scikit-learn (Pedregosa et al., 2011). The maps were produced with the library Cartopy (Met Office, 2010–2024). The code for downloading and preprocessing the data, as well as generating the machine-learning models and the figures is published on Zenodo (https://doi.org/10.5281/zenodo.19185871, Eiselt, 2026a), as are the optimised and trained machine-learning models and the predictive features (https://doi.org/10.5281/zenodo.19185230, Eiselt, 2026b). The raw NORA3 data are publicly available at https://thredds.met.no/thredds/catalog/nora3_subset_atmos/atm_hourly/catalog.html (last access: 23 March 2026) and the ERA5 we used to train the linear model to derive surface temperature is available at https://cds.climate.copernicus.eu/datasets/reanalysis-era5-single-levels?tab=download (last access: 23 March 2026). The NorCP data are available on request (see https://sites.google.com/met.no/downscaling/data, last access: 23 March 2026).
The supplement related to this article is available online at https://doi.org/10.5194/tc-20-1867-2026-supplement.
KUE and RGG conceived and designed the study. Material preparation, data collection and analysis were performed by KUE. The first draft of the manuscript was written by KUE with comments and revisions from RGG. The manuscript was revised by KUE with contributions and comments from RGG.
The contact author has declared that neither of the authors has any competing interests.
Publisher's note: Copernicus Publications remains neutral with regard to jurisdictional claims made in the text, published maps, institutional affiliations, or any other geographical representation in this paper. The authors bear the ultimate responsibility for providing appropriate place names. Views expressed in the text are those of the authors and do not necessarily reflect the views of the publisher.
The authors are grateful to the editor, Nora Helbig, to Francis Meloche, and three anonymous reviewers for helpful comments, suggestions, and references, leading to strong improvements of our manuscript. The research is conducted under the IMPETUS project (http://www.climate-impetus.eu, last access: 20 August 2025). This work uses data from the NorCP project, which is a Nordic collaboration involving climate modeling groups from the Danish Meteorological Institute (DMI), Finnish Meteorological Institute (FMI), Norwegian Meteorological Institute (MET Norway) and the Swedish Meteorological and Hydrological Institute (SMHI) (Wang et al., 2024). We are grateful to Oskar Landgren for his help in acquiring the NorCP data. The authors thank Debmita Bandyopadhyay, Konstantinos Christakos, Eirik Mikal Samuelsen, and Christopher D'Amboise for valuable suggestions. Finally, we thank Stefania Munaretto for bringing the relevance of the AMOC for this topic to our attention.
This research has been supported by the EU Horizon 2020 (grant no. 101037084).
This paper was edited by Nora Helbig and reviewed by four anonymous referees.
Årthun, M., Asbjørnsen, H., Chafik, L., Johnson, H. L., and Våge, K.: Future strengthening of the Nordic Seas overturning circulation, Nat. Commun., 14, 2065, https://doi.org/10.1038/s41467-023-37846-6, 2023. a
Bakkehøi, S.: Snow avalanche prediction using a probabilistic method, in: Avalanche Formation, Movement and Effects, edited by Salm, B. and Gubler, H., Proceedings and Reports, vol. 162, 549–555, International Association of Hydrological Sciences, https://iahs.info/uploads/dms/6852.549-555-162-Bakkeh%C3%B8i.pdf (last access: 23 September 2025), 1987. a
Ballesteros-Cánovas, J. A., Trappmann, D., Madrigal-González, J., Eckert, N., and Stoffel, M.: Climate warming enhances snow avalanche risk in the western Himalayas, P. Natl. Acad. Sci. USA, 115, 3410–3415, https://doi.org/10.1073/pnas.1716913115, 2018. a
Bartelt, P. and Lehning, M.: A physical SNOWPACK model for the Swiss avalanche warning Part I: Numerical model, Cold Reg. Sci. Technol., 35, 123–145, https://doi.org/10.1016/S0165-232X(02)00074-5, 2002. a, b, c
Belušić, D., de Vries, H., Dobler, A., Landgren, O., Lind, P., Lindstedt, D., Pedersen, R. A., Sánchez-Perrino, J. C., Toivonen, E., van Ulft, B., Wang, F., Andrae, U., Batrak, Y., Kjellström, E., Lenderink, G., Nikulin, G., Pietikäinen, J.-P., Rodríguez-Camino, E., Samuelsson, P., van Meijgaard, E., and Wu, M.: HCLIM38: a flexible regional climate model applicable for different climate zones from coarse to convection-permitting scales, Geosci. Model Dev., 13, 1311–1333, https://doi.org/10.5194/gmd-13-1311-2020, 2020. a
Bengtsson, L., Andrae, U., Aspelien, T., Batrak, Y., Calvo, J., de Rooy, W., Gleeson, E., Hansen-Sass, B., Homleid, M., Hortal, M., Ivarsson, K.-I., Lenderink, G., Niemelä, S., Nielsen, K. P., Onvlee, J., Rontu, L., Samuelsson, P., Muñoz, D. S., Subias, A., Tijm, S., Toll, V., Yang, X., and Køltzow, M. Ø.: The HARMONIE-AROME Model Configuration in the ALADIN-HIRLAM NWP System, Mon. Weather Rev., 146, 1919–1935, https://doi.org/10.1175/MWR-D-16-0417.1, 2017. a
Breiman, L.: Random forests, Mach. Learn., 45, 5–32, https://doi.org/10.1023/A:1010933404324, 2001. a, b
Breiman, L., Friedman, J., Stone, C. J., and Olshen, R. A.: Classification and regression trees, Wadsworth International Group, Belmont, CA, https://doi.org/10.1201/9781315139470, 1984. a
Buurman, J. and Babovic, V.: Adaptation Pathways and Real Options Analysis: An approach to deep uncertainty in climate change adaptation policies, Policy Soc., 35, 137–150, https://doi.org/10.1016/j.polsoc.2016.05.002, 2016. a
Castebrunet, H., Eckert, N., Giraud, G., Durand, Y., and Morin, S.: Projected changes of snow conditions and avalanche activity in a warming climate: the French Alps over the 2020–2050 and 2070–2100 periods, The Cryosphere, 8, 1673–1697, https://doi.org/10.5194/tc-8-1673-2014, 2014. a, b, c, d, e, f, g, h
CH2018: CH2018 – Climate Scenarios for Switzerland, Tech. rep., MeteoSwiss, Eidgenössische Technische Hochschule Zürich (ETH), University of Bern (Unibe), National Centre for Climate Services (NSSC) and Swiss Academy of Science (scnat), ISBN 978-3-9525031-4-0, 2018. a
Chawla, N. V., Bowyer, K. W., Hall, L. O., and Kegelmeyer, W.-P.: SMOTE: Synthetic Minority Over-sampling Technique, J. Artif. Intell. Res., 16, 321–357, https://doi.org/10.1613/jair.953, 2002. a
Conlan, M. and Jamieson, B.: Naturally triggered persistent deep slab avalanches in western Canada Part I: avalanche characteristics and weather trends from weather stations, J. Glaciol., 62, 243–255, https://doi.org/10.1017/jog.2016.1, 2016. a, b, c, d, e
Davis, R. E., Elder, K., Howlett, D., and Bouzaglou, E.: Relating storm and weather factors to dry slab avalanche activity in Alta, Utah, and Mammoth Mountain, California, using classification and regression trees, Cold Reg. Sci. Technol., 30, 79–89, https://doi.org/10.1016/S0165-232X(99)00032-4, 1999. a
Dee, D. P., Uppala, S. M., Simmons, A. J., Berrisford, P., Poli, P., Kobayashi, S., Andrae, U., Balmaseda, M. A., Balsamo, G., Bauer, P., Bechtold, P., Beljaars, A. C. M., van de Berg, L., Bidlot, J., Bormann, N., Delsol, C., Dragani, R., Fuentes, M., Geer, A. J., Haimberger, L., Healy, S. B., Hersbach, H., Hólm, E. V., Isaksen, L., Kållberg, P., Köhler, M., Matricardi, M., McNally, A. P., Monge-Sanz, B. M., Morcrette, J.-J., Park, B.-K., Peubey, C., de Rosnay, P., Tavolato, C., Thépaut, J.-N., and Vitart, F.: The ERA-Interim reanalysis: configuration and performance of the data assimilation system, Q. J. Roy. Meteor. Soc., 137, 553–597, https://doi.org/10.1002/qj.828, 2011. a
Dijkstra, H. A. and van Westen, R. M.: The Probability of an AMOC Collapse Onset in the Twenty-First Century, Annu. Rev. Mar. Sci., 18, 23–46, https://doi.org/10.1146/annurev-marine-040324-024822, 2026. a
Ditlevsen, P. and Ditlevsen, S.: Warning of a forthcoming collapse of the Atlantic meridional overturning circulation, Nat. Commun., 14, 4254, https://doi.org/10.1038/s41467-023-39810-w, 2023. a
Dkengne Sielenou, P., Viallon-Galinier, L., Hagenmuller, P., Naveau, P., Morin, S., Dumont, M., Verfaillie, D., and Eckert, N.: Combining random forests and class-balancing to discriminate between three classes of avalanche activity in the French Alps, Cold Reg. Sci. Technol., 187, 103276, https://doi.org/10.1016/j.coldregions.2021.103276, 2021. a
Domine, F., Picard, G., Morin, S., Barrere, M., Madore, J.-B., and Langlois, A.: Major issues in simulating some Arcitc snowpack properties using current detailed snow physics models: Consequences for the thermal regime and water budget of permafrost, J. Adv. Model. Earth Sy., 11, 34–44, https://doi.org/10.1029/2018MS001445, 2019. a, b, c
Donner, L. J., Wyman, B. L., Hemler, R. S., Horowitz, L. W., Ming, Y., Zhao, M., Golaz, J.-C., Ginoux, P., Lin, S.-J., Schwarzkopf, M. D., Austin, J., Alaka, G., Cooke, W. F., Delworth, T. L., Freidenreich, S. M., Gordon, C. T., Griffies, S. M., Held, I. M., Hurlin, W. J., Klein, S. A., Knutson, T. R., Langenhorst, A. R., Lee, H.-C., Lin, Y., Magi, B. I., Malyshev, S. L., Milly, P. C. D., Naik, V., Nath, M. J., Pincus, R., Ploshay, J. J., Ramaswamy, V., Seman, C. J., Shevliakova, E., Sirutis, J. J., Stern, W. F., Stouffer, R. J., Wilson, R. J., Winton, M., Wittenberg, A. T., and Zeng, F.: The Dynamical Core, Physical Parameterizations, and Basic Simulation Characteristics of the Atmospheric Component AM3 of the GFDL Global Coupled Model CM3, J. Climate, 24, 3484–3519, https://doi.org/10.1175/2011JCLI3955.1, 2011. a
Durand, Y., Giraud, G., Brun, E., Mérindol, L., and Martin, E.: A computer-based system simulating snowpack structures as a tool for regional avalanche forecasting, J. Glaciol., 45, 469–484, https://doi.org/10.3189/S0022143000001337, 1999. a
Durand, Y., Laternser, M., Giraud, G., Etchevers, P., Lesaffre, B., and Mérindol, L.: Reanlysis of 44 yr of climate in the French Alps (1958–2002): methodology, model validation, climatology, and trends for air temperature and precipitation, J. Appl. Meteorol. Clim., 48, 429–449, https://doi.org/10.1175/2008JAMC1808.1, 2009. a
Dyrrdal, A. V., Isaksen, K., Jacobsen, J. K. S., and Nilsen, I. B.: Present and future changes in winter climate indices relevant for access disruptions in Troms, northern Norway, Nat. Hazards Earth Syst. Sci., 20, 1847–1865, https://doi.org/10.5194/nhess-20-1847-2020, 2020. a, b, c, d, e, f, g
Dyrrdal, A. V., Hygen, H. O., Nilsen, I. B., Mayer, S., Hanssen-Bauer, I., Dobler, A., Wong, W. K., Huang, S., Tunheim, K., Garvin, K., Lutz, J., and Tajet, H. T. T.: New national projections and climate assessment report for Norway, EMS Annual Meeting 2025, Ljubljana, Slovenia, 7–12 September 2025, EMS2025-347, https://doi.org/10.5194/ems2025-347, 2025. a
EAWS: Avalanche Danger Scale, https://www.avalanches.org/standards/avalanche-danger-scale/ (last access: 23 September 2025), 2025a. a
EAWS: Avalanche Problems, https://www.avalanches.org/standards/avalanche-problems/ (last access: 23 September 2025), 2025b. a
Eckert, N., Ketlock, C., Castebrunet, H., Lavigne, A., and Naaim, M.: Temporal trend in avalanche activity in the French Alps and subregions: from occurrences and runout altitudes to unsteady return periods, J. Glaciol., 59, 93–114, https://doi.org/10.3189/2013JoG12J091, 2013. a
Eckert, N., Corona, C., Giacona, F., Gaume, J., Mayer, S., van Herwijnen, A., Hagemuller, P., and Stoffel, M.: Climate change impacts on snow avalanche activity and related risks, Nat. Rev. Earth Environ., 5, 369–389, https://doi.org/10.1038/s43017-024-00540-2, 2024. a, b, c, d, e, f
Eiselt, K.-U.: Avalanche Danger Prediction Python Library (v1.0.1), Zenodo [code], https://doi.org/10.5281/zenodo.19185871, 2026a. a, b
Eiselt, K.-U.: Data and models for the article “Past and future changes in avalanche problems in northern Norway estimated with machine-learning models”, Zenodo [data set], https://doi.org/10.5281/zenodo.19185230, 2026b. a
Eiselt, K.-U. and Graversen, R. G.: On the control of Northern Hemispheric feedbacks by AMOC: Evidence from CMIP and slab-ocean modeling, J. Climate, 36, 6777–6795, https://doi.org/10.1175/JCLI-D-22-0884.1, 2023. a
Eiselt, K.-U. and Graversen, R. G.: Predicting avalanche danger in northern Norway using statistical models, The Cryosphere, 19, 1849–1871, https://doi.org/10.5194/tc-19-1849-2025, 2025. a, b, c, d, e, f, g, h, i, j, k, l, m, n, o, p, q, r, s, t, u, v, w, x, y, z, aa, ab, ac, ad, ae, af, ag, ah, ai, aj, ak
Engeset, R. V.: National Avalanche Warning Service for Norway – established 2013, International Snow Science Workshop Grenoble – Chamonix Mont-Blanc, France, 7–11 October 2013, 301–310, http://arc.lib.montana.edu/snow-science/item/1853 (last access: 23 September 2025), 2013. a, b
Engeset, R. V., Ekker, R., Humstad, T., and Landrø, M.: Varsom: Regobs – A common real-time picture of the hazard situation shared by mobile information technology, Proceedings, International Snow Science Workshop, Innsbruck, Austria, 7–12 October 2018, 1573–1577, http://arc.lib.montana.edu/snow-science/item/2822 (last access: 23 September 2025), 2018a. a, b
Engeset, R. V., Pfuhl, G., Landrø, M., Mannberg, A., and Hetland, A.: Communicating public avalanche warnings – what works?, Nat. Hazards Earth Syst. Sci., 18, 2537–2559, https://doi.org/10.5194/nhess-18-2537-2018, 2018b. a
Eyring, V., Bony, S., Meehl, G. A., Senior, C. A., Stevens, B., Stouffer, R. J., and Taylor, K. E.: Overview of the Coupled Model Intercomparison Project Phase 6 (CMIP6) experimental design and organization, Geosci. Model Dev., 9, 1937–1958, https://doi.org/10.5194/gmd-9-1937-2016, 2016. a
Fernandéz, A., García, S., Herrera, F., and Chawla, N. V.: SMOTE for learning from imbalanced data: Progress and challenges, marking the 15 year anniversary, J. Artif. Intell. Res., 61, 863–905, https://doi.org/10.1613/jair.1.11192, 2018. a, b
Fischer, A., Strassmann, K., Croci-Maspoli, M., Hama, A., Knutti, R., Kotlarski, S., Schär, C., Schnadt Poberaj, C., Ban, N., Bavay, M., Beyerle, U., Bresch, D., Brönnimann, S., Burlando, P., Casanueva, A., Fatichi, S., Feigenwinter, I., Fischer, E., Hirschi, M., Liniger, M., Marty, C., Medhaug, I., Peleg, N., Pickl, M., Raible, C., Rajczak, J., Rössler, O., Scherrer, S., Schwierz, C., Seneviratne, S., Skelton, M., Sørland, S., Spirig, C., Tschurr, F., Zeder, J., and Zubler, E.: Climate Scenarios for Switzerland CH2018 – Approach and Implications, Climate Services, 26, 100288, https://doi.org/10.1016/j.cliser.2022.100288, 2022. a
Föhn, P. M. B.: The stability index and various triggering mechanisms, in: Avalanche Formation, Movement and Effects, edited by Salm, B. and Gubler, H., Proceedings and Reports, vol. 162, 195–214, International Association of Hydrological Sciences, https://iahs.info/uploads/dms/6822.195-214-162-Fo%CC%88hn.pdf (last access: 23 September 2025), 1987. a, b
Førland, E. J., Alfnes, E., Amundsen, H., Asvall, R. P., Benestad, R., Debernard, J., Engen-Skaugen, T., Hanssen-Bauer, I., Harstveit, K., Haugen, J. E., Hovelsrud, G. K., Isaksen, K., Jaedicke, C., Kronholm, K., Kvambekk, Å. S., LaCasce, J., Roald, L. A., Sletten, K., and Stalsberg, K.: Climate change and natural disasters in Norway. An assessment of possible future changes, met.no report 06/2007 KLIMA, Norwegian Meteorological Institute, https://www.met.no/publikasjoner/met-report/met-report-2007/_/attachment/download/77d60ab8-b4ed-4120-8e9b-2bb808942dc0:48a4b0efbabbfa94f9a2a8ec5c3edc71efb0686c/MET-report-06-2007.pdf (last access: 23 September 2025), 2007. a, b
Gauthier, F., Germain, D., and Hétu, B.: Logistic models as a forecasting tool for snow avalanches in a cold maritime climate: northern Gaspésie, Québec, Canada, Nat. Hazards, 89, 201–232, https://doi.org/10.1007/s11069-017-2959-3, 2017. a
Gądek, B., R. J. Kaczka, Z. R., Rojan, E., Casteller, A., and Bebi, P.: Snow avalanche activity in Żleb Żandarmerii in a time of climate change (Tatra Mts., Poland), Catena, 158, 201–212, https://doi.org/10.1016/j.catena.2017.07.005, 2017. a
Graversen, R. G., Mauritsen, T., M. Tjernström, E. K., and Svensson, G.: Vertical structure of recent Arctic warming, Nature, 451, 53–56, https://doi.org/10.1038/nature06502, 2008. a
Griffies, S. M., Winton, M., Donner, L. J., Horowitz, L. W., Downes, S. M., Farneti, R., Gnanadesikan, A., Hurlin, W. J., Lee, H.-C., Liang, Z., Palter, J. B., Samuels, B. L., Wittenberg, A. T., Wyman, B. L., Yin, J., and Zadeh, N.: The GFDL CM3 Coupled Climate Model: Characteristics of the Ocean and Sea Ice Simulations, J. Climate, 24, 3520–3544, https://doi.org/10.1175/2011JCLI3964.1, 2011. a
Haakenstad, H. and Breivik, Ø.: NORA3. Part II: Precipitation and temperature statistics in complex terrain modeled with a nonhydrostatic model, J. Appl. Meteorol. Clim., 61, 1549–1572, https://doi.org/10.1175/JAMC-D-22-0005.1, 2022. a, b, c, d
Haakenstad, H., Breivik, Ø., Furevik, B. R., Reistad, M., Bohlinger, P., and Aarnes, O. J.: NORA3: A nonhydrostatic high-resolution hindcast of the North Sea, the Norwegian Sea, and Barents Sea, J. Appl. Meteorol. Clim., 60, 1443–1464, https://doi.org/10.1175/JAMC-D-21-0029.1, 2021. a, b, c, d
Haasnoot, M., Kwakkel, J. H., Walker, W. E., and ter Maat, J.: Dynamic adaptive policy pathways: A method for crafting robust decisions for a deeply uncertain world, Global Environ. Chang., 23, 485–498, https://doi.org/10.1016/j.gloenvcha.2012.12.006, 2013. a
Hao, J., Zhang, X., Li, P. C. L., Zhang, G., and Li, C.: Impacts of climate change on snow avalanche activity along a transportation corridor in the Tianshan Mountains, Int. J. Disast. Risk Sc., 14, 510–522, https://doi.org/10.1007/s13753-023-00475-0, 2023. a, b, c
Hausfather, Z. and Peters, G. P.: Emissions – the “business as usual” story is misleading, Nature, 577, 618–620, https://doi.org/10.1038/d41586-020-00177-3, 2020a. a
Hausfather, Z. and Peters, G. P.: RCP8.5 is a problematic scenario for near-term emissions, P. Natl. Acad. Sci. USA, 117, 27791–27792, https://doi.org/10.1073/pnas.2017124117, 2020b. a
Hazeleger, W., Severijns, C., Semmler, T., Ştefǎnescu, S., Yang, S., Wang, X., Wyser, K., Dutra, E., Baldasano, J. M., Bintanja, R., Bougeault, P., Caballero, R., Ekman, A. M. L., Christensen, J. H., van den Hurk, B., Jimenez, P., Jones, C., Kållberg, P., Koenigk, T., McGrath, R., Miranda, P., van Noije, T., Palmer, T., Parodi, J. A., Schmith, T., Selten, F., Storelvmo, T., Sterl, A., Tapamo, H., Vancoppenolle, M., Viterbo, P., and Willén, U.: EC-Earth, B. Am. Meteorol. Soc., 91, 1357–1364, https://doi.org/10.1175/2010BAMS2877.1, 2010. a
Hazeleger, W., Wang, X., Severijns, C., Ştefǎnescu, S., Bintanja, R., Sterl, A., Wyser, K., Semmler, T., Yang, S., van den Hurk, B., van Noije, T., van der Linden, E., and van der Wiel, K.: EC-Earth V2.2: description and validation of a new seamless earth system prediction model, Clim. Dynam., 39, 2611–2629, https://doi.org/10.1007/s00382-011-1228-5, 2012. a
Hendrick, M., Techel, F., Volpi, M., Olevski, T., Pérez-Guillén, C., van Herwijnen, A., and Schweizer, J.: Automated prediction of wet-snow avalanche activity in the Swiss Alps, J. Glaciol., 69, 1365–1378, https://doi.org/10.1017/jog.2023.24, 2023. a, b, c, d, e, f, g
Herla, F., Widforss, A., Binder, M., Müller, K., Horton, S., Reisecker, M., and Mitterer, C.: Establishing an operational weather & snowpack model chain in Norway to support avalanche forecasting, International Snow Science Workshop Proceedings 2024, Tromsø, Norway, 23–29 September 2024, 168–175, http://arc.lib.montana.edu/snow-science/item/3129 (last access: 23 September 2025), 2024. a
Hersbach, H., Bell, B., Berrisford, P., Hirahara, S., Horányi, A., Muñoz-Sabater, J., Nicolas, J., Peubey, C., Radu, R., Schepers, D., Simmons, A., Soci, C., Abdalla, S., Abellan, X., Balsamo, G., Bechtold, P., Biavati, G., Bidlot, J., Bonavita, M., Chiara, G. D., Dahlgren, P., Dee, D., Diamantakis, M., Dragani, R., Flemming, J., Forbes, R., Fuentes, M., Geer, A., Haimberger, L., Healy, S., Hogan, R. J., Hólm, E., Janisková, M., Keeley, S., Laloyaux, P., Lopez, P., Lupu, C., Radnoti, G., de Rosnay, P., Rozum, I., Vamborg, F., Villaume, S., and Thépaut, J.-N.: The ERA5 global reanalysis, Q. J. Roy. Meteor. Soc., 146, 1999–2049, https://doi.org/10.1002/qj.3803, 2020. a
Hisdal, H., Vikhamar-Schuler, D., Førland, E. J., and Nilsen, I. B.: Klimaprofiler for fylker. Et kunnskapsrunnlag for klimatilpasning, NCCS report 3/2017, Norsk klimaservicesenter (KSS), https://www.met.no/kss/_/attachment/download/ca5f4425-e692-406f-aa26-d0745f618da9:4ac43e586f97d63ad5aa635b901e95b24eba2517/bok-klimaprofiler-norge-endelig-lavopploselig.pdf (last access: 23 September 2025), 2017. a
Hisdal, H., Vikhamar-Schuler, D., Førland, E. J., and Nilsen, I. B.: Klimaprofiler for fylker. Et kunnskapsrunnlag for klimatilpasning, NCCS report 2/2021, Norsk klimaservicesenter (KSS), https://www.met.no/kss/_/attachment/download/2645b2f6-4958-4a22-9a51-f806c8d91076:8b40a210005a14e62f07a8904089342e2a34f4f9/NCCS_report_2-2021_nettversjon.pdf (last access: 23 September 2025), 2021. a, b
Hock, R., Rasul, G., Adler, C., Cáceres, B., Gruber, S., Hirabayashi, Y., Jackson, M., Kääb, A., Kang, S., Kutuzov, S., Milner, A., Molau, U., Morin, S., Orlove, B., and Steltzer, H.: High Mountain Areas, in: High Mountain Areas, edited by Pörtner, H.-O., Roberts, D. C., Masson-Delmotte, V., Zhai, P., Tignor, M., Poloczanska, E., Mintenbeck, K., Alegría, A., Nicolai, M., Okem, A., Petzold, J., Rama, B., and Weyer, N. M., Cambridge University Press, Cambridge, UK and New York, NY, USA, 131–202, https://doi.org/10.1017/9781009157964.004, 2019. a
Hovelsrud, G. K., Karlsson, M., and Olsen, J.: Prepared and flexible: Local adaptation strategies for avalanche risk, Cogent Social Sciences, 4, 1460899, https://doi.org/10.1080/23311886.2018.1460899, 2018. a
IPCC: Special Report on Emission Scenarios, Cambridge University Press, Cambridge, UK, ISBN 978-0521800811, 2000. a, b
IPCC: Climate Change 2021 – The Physical Science Basis: Working Group I Contribution to the Sixth Assessment Report of the Intergovernmental Panel on Climate Change, Cambridge: Cambridge University Press, https://doi.org/10.1017/9781009157896, 2023. a, b
Jackson, L. C., Kahana, R., Graham, T., Ringer, M. A., Woollings, T., Mecking, J., and Wood, R. A.: Global and European climate impacts of a slowdown of the AMOC in a high resolution GCM, Clim. Dynam., 45, 3299–3316, https://doi.org/10.1007/s00382-015-2540-2, 2015. a, b
Jacob, D., Petersen, J., Eggert, B., Alias, A., Christensen, O. B., Bouwer, L. M., Braun, A., Colette, A., Déqué, M., Georgievski, G., Georgopoulou, E., Gobiet, A., Menut, L., Nikulin, G., Haensler, A., Hempelmann, N., Jones, C., Keuler, K., Kovats, S., Kröner, N., Kotlarski, S., Kriegsmann, A., Martin, E., van Meijgaard, E., Moseley, C., Pfeifer, S., Preuschmann, S., Radermacher, C., Radtke, K., Rechid, D., Rounsevell, M., Samuelsson, P., Somot, S., Soussana, J.-F., Teichmann, C., Valentini, R., Vautard, R., Weber, B., and Yiou, P.: EURO-CORDEX: new high-resolution climate change projections for European impact research, Reg. Environ. Change, 14, 563–578, https://doi.org/10.1007/s10113-013-0499-2, 2014. a, b, c
Jacobsen, J. K. S., Leiren, M. D., and Saarinen, J.: Natural hazard experiences and adaptations: A study of winter climate-induced road closures in Norway, Norsk Geografisk Tidsskrift – Norwegian Journal of Geograpy, 70, 292–305, https://doi.org/10.1080/00291951.2016.1238847, 2016. a
Jaedicke, C., Solheim, A., Blikra, L. H., Stalsberg, K., Sorteberg, A., Aaheim, A., Kronholm, K., Vikhamar-Schuler, D., Isaksen, K., Sletten, K., Kristensen, K., Barstad, I., Melchiorre, C., Høydal, Ø. A., and Mestl, H.: Spatial and temporal variations of Norwegian geohazards in a changing climate, the GeoExtreme Project, Nat. Hazards Earth Syst. Sci., 8, 893–904, https://doi.org/10.5194/nhess-8-893-2008, 2008. a
Jaedicke, C., Bakkehøi, S., Sandersen, F., Brattlien, K., and Solheim, A.: Regional avalanche warning in Norway, a new concept for a large country, The International Snow Science Workshop, Davos 2009, Proceedings, 371–374, https://arc.lib.montana.edu/snow-science/item/262 (last access: 23 September 2025), 2009. a, b
Jamieson, J. and Johnston, C. D.: Refinements to the stability index for skier-triggered dry-slab avalanches, Ann. Glaciol., 26, 296–302, https://doi.org/10.3189/1998AoG26-1-296-302, 1998. a, b
Johnsen, E. R.: Modern forms of communication avalanche danger – A Norwegian case, International Snow Science Workshop Grenoble – Chamonix Mont-Blanc, France, 7–11 October 2013, 423–427, http://arc.lib.montana.edu/snow-science/item/1829 (last access: 23 September 2025), 2013. a
Katsuyama, Y., Katsushima, T., and Takeuchi, Y.: Large-ensemble climate simulations to assess changes in snow stability over northern Japan, J. Glaciol., 69, 577–590, https://doi.org/10.1017/jog.2022.85, 2023. a, b, c, d, e
Keylock, C. J.: The North Atlantic Oscillation and snow avalanching in Iceland, Geophys. Res. Lett., 30, 58, https://doi.org/10.1029/2002GL016272, 2003. a
Kronholm, K., Vikhamar-Schuler, D., Jaedicke, C., Isaksen, K., Sorteberg, A., and Kristensen, K.: Forecasting snow avalanche days from meteorological data using classification trees; Grasdalen, western Norway, Proceedings, International Snow Science Workshop, Telluride, Colorado, 1–6 October 2006, 786–795, https://arc.lib.montana.edu/snow-science/item/1016 (last access: 23 September 2025), 2006. a
Kuya, E. K., Hanssen-Bauer, I., Mayer, S., and Heiberg, H.: Projected changes of rain, sleet, and snowfall in Norway, Norsk Geografisk Tidsskrift–Norwegian Journal of Geography, 78, 73–87, https://doi.org/10.1080/00291951.2024.2360409, 2024. a, b
Lazar, B. and Williams, M.: Climate change in western ski areas: Potential changes in the timing of wet avalanches and snow quality for the Aspen ski area in the years 2030 and 2100, Cold Reg. Sci. Technol., 51, 219–228, https://doi.org/10.1016/j.coldregions.2007.03.015, 2008. a, b, c, d, e
Lehning, M., Bartelt, P., Brown, B., Fierz, C., and Satyawali, P.: A physical SNOWPACK model for the Swiss avalanche warning: Part II. Snow microstructure, Cold Reg. Sci. Technol., 35, 147–167, https://doi.org/10.1016/S0165-232X(02)00073-3, 2002a. a, b
Lehning, M., Bartelt, P., Brown, B., and Fierz, C.: A physical SNOWPACK model for the Swiss avalanche warning: Part III. Meteorological forcing, thin layer formation and evaluation, Cold Reg. Sci. Technol., 35, 169–184, https://doi.org/10.1016/S0165-232X(02)00072-1, 2002b. a, b, c
Lind, P., Belušić, D., Christensen, O. B., Dobler, A., Kjellström, E., Landgren, O., Lindstedt, D., Matte, D., Pedersen, R. A., Toivonen, E., and Wang, F.: Benefits and added value of convection-permitting climate modeling over Fenno-Scandinavia, Clim. Dynam., 55, 1893–1912, https://doi.org/10.1007/s00382-020-05359-3, 2020. a, b, c, d, e, f
Lind, P., Belušić, D., Médus, E., Dobler, A., Pedersen, R. A., Wang, F., Matte, D., Kjellström, E., Landgren, O., Lindstedt, D., Christensen, O. B., and Christensen, J. H.: Climate change information over Fenno-Scandinavia produced with a convection-permitting climate model, Clim. Dynam., 61, 519–541, https://doi.org/10.1007/s00382-022-06589-3, 2023. a, b, c, d
Liu, W., Xie, S.-P., Liu, Z., and Zhu, J.: Overlooked possibility of a collapsed Atlantic Meridional Overturning Circulation in warming climate, Sci. Adv., 3, e1601666, https://doi.org/10.1126/sciadv.1601666, 2017. a
Madan, G., Gjermundsen, A., Iversen, S. C., and LaCasce, J. H.: The weakening AMOC under extreme climate change, Clim. Dynam., 62, 1291–1309, https://doi.org/10.1007/s00382-023-06957-7, 2024. a
Manabe, S. and Stouffer, R. J.: Sensitivity of a global climate model to an increase of CO2 concentration in the atmosphere, J. Geophys. Res., 85, 5529–5554, https://doi.org/10.1029/JC085iC10p05529, 1980. a
Marienthal, A., Hendrikx, J., Birkeland, K., and Irvine, K. M.: Meteorological variables to aid forecasting deep slab avalanaches on persistent weak layers, Cold Reg. Sci. Technol., 120, 227–236, https://doi.org/10.1016/j.coldregions.2015.08.007, 2015. a, b, c
Martin, E., Giraud, G., Lejeune, Y., and Boudart, G.: Impact of a climate change on avalanche hazard, Ann. Glaciol., 32, 163–167, https://doi.org/10.3189/172756401781819292, 2001. a
Mayer, S., Hendrick, M., Michel, A., Richter, B., Schweizer, J., and van Herwijnen, A.: Projected impact of climate warming on avalanche activity at two sites in the Swiss Alps, International Snow Science Workshop Proceedings 2023, Bend, Oregon, 8–13 October 2023, 572–576, http://arc.lib.montana.edu/snow-science/item/2935 (last access: 23 September 2025), 2023a. a
Mayer, S., Techel, F., Schweizer, J., and van Herwijnen, A.: Prediction of natural dry-snow avalanche activity using physics-based snowpack simulations, Nat. Hazards Earth Syst. Sci., 23, 3445–3465, https://doi.org/10.5194/nhess-23-3445-2023, 2023b. a, b
Mayer, S., Hendrick, M., Michel, A., Richter, B., Schweizer, J., Wernli, H., and van Herwijnen, A.: Impact of climate change on snow avalanche activity in the Swiss Alps, The Cryosphere, 18, 5495–5517, https://doi.org/10.5194/tc-18-5495-2024, 2024. a, b, c, d, e, f, g, h, i, j, k
McClung, D. and Schaerer, P.: The Avalanche Handbook, Mountanieers Books, Seattle, WA, 3rd edn., ISBN 978-0898868092, 2006. a
Meehl, G. A., Covey, C., Delworth, T., Latif, M., McAvaney, B., Mitchell, J. F. V., Stouffer, R. J., and Taylor, K. E.: The WRPC CMIP3 multimodel dataset: A new era in climate change research, B. Am. Meteorol. Soc., 88, 1383–1394, https://doi.org/10.1175/BAMS-88-9-1383, 2007. a
Met Office: Cartopy: a cartographic python library with a Matplotlib interface, Exeter, Devon, https://scitools.org.uk/cartopy (last access: 23 September 2025), 2010–2024. a
Mitterer, C. and Schweizer, J.: Analysis of the snow-atmosphere energy balance during wet-snow instabilities and implications for avalanche prediction, The Cryosphere, 7, 205–216, https://doi.org/10.5194/tc-7-205-2013, 2013. a, b, c, d
Mitterer, C., Techel, F., Fierz, C., and Schweizer, J.: An operational supporting tool for assessing wet-snow avalanche danger, International Snow Science Workshop Grenoble – Chamonix Mont-Blanc, France, 7–11 October 2013, 334–338, http://arc.lib.montana.edu/snow-science/item/1860 (last access: 23 September 2025), 2013. a
Monti, F., Cagnati, A., Valt, M., and Schweizer, J.: A new method for visualizing snow stability profiles, Cold Reg. Sci. Technol., 78, 64–72, https://doi.org/10.1016/j.coldregions.2012.02.005, 2012. a
Monti, F., Schweizer, J., and Fierz, C.: Hardness estimation and weak layer detection in simulated snow stratigraphy, Cold Reg. Sci. Technol., 103, 72–90, https://doi.org/10.1016/j.coldregions.2014.03.009, 2014. a
Monti, F., Gaume, J., van Herwijnen, A., and Schweizer, J.: Snow instability evaluation: calculating the skier-induced stress in a multi-layered snowpack, Nat. Hazards Earth Syst. Sci., 16, 775–788, https://doi.org/10.5194/nhess-16-775-2016, 2016. a, b
Morin, S., Horton, S., Techel, F., Bavay, M., Coléou, C., Fierz, C., Gobiet, A., Hagenmuller, P., Lafaysse, M., Ližar, M., and Mitterer, C.: Application of physical snowpack models in support of operational avalanche hazard forecasting: A status report on current implementations and prospects for the future, Cold Reg. Sci. Technol., 170, 102910, https://doi.org/10.1016/j.coldregions.2019.102910, 2020. a
Moss, R. H., Edmonds, J. A., Hibbard, K. A., Manning, M. R., Rose, S. K., van Vuuren, D. P., Carter, T. R., Emori, S., Kainuma, M., Kram, T., Meehl, G. A., Mitchell, J. F. B., Nakicenovic, N., Riahi, K., Smith, S. J., Stouffer, R. J., Thomson, A. M., Weyant, J. P., and Wilbanks, T. J.: The next generation of scenarios for climate change research and assessment, Nature, 463, 747–756, https://doi.org/10.1038/nature08823, 2010. a, b, c
Müller, K., Kosberg, S., Landrø, M., and Engeset, R. V.: Report from the first operational winter of the Norwegian Avalanche Centre, International Snow Science Workshop Grenoble – Chamonix Mont-Blanc, France, 7–11 October 2013, 311–315, http://arc.lib.montana.edu/snow-science/item/1854 (last access: 23 September 2025), 2013. a
Müller, K., Mitterer, C., Engeset, R., Ekker, R., and Kosberg, S.: Combining the conceptual model of avalanche hazard with the Bavarian matrix, International Snow Science Workshop 2016 Proceedings, Breckenridge, CO, USA, 3–7 October 2016, 472–479, http://arc.lib.montana.edu/snow-science/item/2309 (last access: 23 September 2025), 2016a. a, b
Müller, K., Stucki, T., Mitterer, C., Nairz, P., Konetschny, H., Feistl, T., Berbenni, C. C. F., and Chiambretti, I.: Towards and improved European auxiliary matrix for assessing avalanche danger levels, International Snow Science Workshop 2016 Proceedings, Breckenridge, CO, USA, 3–7 October 2016, 1229–1231, http://arc.lib.montana.edu/snow-science/item/2445 (last access: 2 December 2025), 2016b. a
Müller, K., Techel, F., Mitterer, C., Feistl, T., Sofia, S., Roux, N., Palmgren, P., Bellido, G. M., and Bertranda, L.: The EAWS Matrix, a look-up table for regional avalanche danger level assessment, and its underlying concept, International Snow Science Workshop Proceedings 2023, Bend, Oregon, 8–13 October 2023, 540–546, http://arc.lib.montana.edu/snow-science/item/2930 (last access: 23 September 2025), 2023. a, b
Norwegian Meteorological Institute: Catalog, https://thredds.met.no/thredds/catalog/KSS/Klima_i_Norge/utgave2015/catalog.html (last access: 23 September 2025), 2025a. a, b
Norwegian Meteorological Institute: Catalog, https://thredds.met.no/thredds/projects/nora3_subsets.html (last access: 23 September 2025), 2025b. a
Norwegian Meteorological Institute: Catalog, https://thredds.met.no/thredds/catalog/KSS/Klima_i_Norge/utgave2025/catalog.html (last access: 23 September 2025), 2025c. a
Pedregosa, F., Varoquaux, G., Gramfort, A., Michel, V., Thirion, B., Grisel, O., Blondel, M., Prettenhofer, P., Weiss, R., Dubourg, V., Vanderplas, J., Passos, A., Cournapeau, D., Brucher, M., Perrot, M., and Duchesnay, E.: Scikit-learn: Machine Learning in Python, J. Mach. Learn. Res., 12, 2825–2830, http://jmlr.org/papers/v12/pedregosa11a.html (last access: 23 September 2025), 2011. a
Peitzsch, E. H., Pederson, G. T., Birkeland, K. W., Hendrikx, J., and Fagre, D. B.: Climate drivers of large magnitude snow avalanche years in the U. S. northern Rocky Mountains, Sci. Rep., 11, 10032, https://doi.org/10.1038/s41598-021-89547-z, 2021. a
Pérez-Guillén, C., Techel, F., Hendrick, M., Volpi, M., van Herwijnen, A., Olevski, T., Obozinski, G., Pérez-Cruz, F., and Schweizer, J.: Data-driven automated predictions of the avalanche danger level for dry-snow conditions in Switzerland, Nat. Hazards Earth Syst. Sci., 22, 2031–2056, https://doi.org/10.5194/nhess-22-2031-2022, 2022. a, b, c, d, e, f, g
Pérez-Guillén, C., Simeon, A., Techel, F., Volpi, M., Sovilla, B., and van Herwijnen, A.: Integrating automated avalanche detections for validating and explaining avalanche forecast models, International Snow Science Workshop Proceedings 2024, Tromsø, Norway, 23–29 September 2024, 52–57, http://arc.lib.montana.edu/snow-science/item/3111 (last access: 23 September 2025), 2024. a
Riahi, K., van Vuuren, D. P., Kriegler, E., Edmonds, J., O’Neill, B. C., Fujimori, S., Bauer, N., Calvin, K., Dellink, R., Fricko, O., Lutz, W., Popp, A., Cuaresma, J. C., KC, S., Leimbach, M., Jiang, L., Kram, T., Rao, S., Emmerling, J., Ebi, K., Hasegawa, T., Havlik, P., Humpenöder, F., Da Silva, L. A., Smith, S., Stehfest, E., Bosetti, V., Eom, J., Gernaat, D., Masui, T., Rogelj, J., Strefler, J., Drouet, L., Krey, V., Luderer, G., Harmsen, M., Takahashi, K., Baumstark, L., Doelman, J. C., Kainuma, M., Klimont, Z., Marangoni, G., Lotze-Campen, H., Obersteiner, M., Tabeau, A., and Tavoni, M.: The Shared Socioeconomic Pathways and their energy, land use, and greenhouse gas emissions implications: An overview, Global Environ. Chang., 42, 153–168, https://doi.org/10.1016/j.gloenvcha.2016.05.009, 2017. a
Saloranta, T., Müller, K., and Wickström, S.: Trends in hydrometeorological avalanche indicators in Norway and Svalbard in 1961–2020, International Snow Science Workshop Proceedings 2024, Tromsø, Norway, 23–29 September 2024, 643–647, http://arc.lib.montana.edu/snow-science/item/3203 (last access: 23 September 2025), 2024. a
Saloranta, T. M.: Simulating snow maps for Norway: description and statistical evaluation of the seNorge snow model, The Cryosphere, 6, 1323–1337, https://doi.org/10.5194/tc-6-1323-2012, 2012. a
Saloranta, T. M.: Simulating more accurate snow maps for Norway with MCMC parameter estimation method, The Cryosphere Discuss., 8, 1973–2003, https://doi.org/10.5194/tcd-8-1973-2014, 2014. a
Saloranta, T. M.: Operational snow mapping with simplified data assimilation using the seNorge snow model, J. Hydrol., 538, 314–325, https://doi.org/10.1016/j.jhydrol.2016.03.061, 2016. a
Schirmer, M., Lehning, M., and Schweizer, J.: Statistical forecasting of regional avalanche danger using simulated snow-cover data, J. Glaciol., 55, 761–768, https://doi.org/10.3189/002214309790152429, 2009. a
Schulzweida, U.: CDO User Guide, Zenodo, https://doi.org/10.5281/zenodo.10020800, 2023. a
Schwalm, C. R., Glendon, S., and Duffy, P. B.: Reply to Husfather and Peters: RCP8.5 is neither problematic nor misleading, P. Natl. Acad. Sci. USA, 117, 27793–27794, https://doi.org/10.1073/pnas.2018008117, 2020. a
Schweizer, J., Bellaire, S., Fierz, C., Lehning, M., and Pielmeier, C.: Evaluating and improving the stability predictions of the snow cover model SNOWPACK, Cold Reg. Sci. Technol., 46, 52–59, https://doi.org/10.1016/j.coldregions.2006.05.007, 2006. a
Serreze, M. C., Barrett, A. P., Stroeve, J. C., Kindig, D. N., and Holland, M. M.: The emergence of surface-based Arctic amplification, The Cryosphere, 3, 11–19, https://doi.org/10.5194/tc-3-11-2009, 2009. a
Shepherd, T. G.: Atmospheric circulation as a source of uncertainty in climate change projections, Nat. Geosci., 7, 703–708, https://doi.org/10.1038/NGEO2253, 2014. a
Sinickas, A., Jamieson, B., and Maes, M. A.: Snow avalanches in western Canada: investigating change in occurrence rates and implications for risk assessment and mitigation, Struct. Infrastruct. E., 12, 490–498, https://doi.org/10.1080/15732479.2015.1020495, 2016. a
Sokolova, M. and Lapalme, G.: A systematic analysis of performance measures for classification tasks, Inform. Proc. Manage., 45, 427–437, https://doi.org/10.1016/j.ipm.2009.03.002, 2009. a
Statham, G., Haegeli, P., Greene, E., Birkeland, K., Israelson, C., Tremper, B., Stethem, C., McMahon, B., White, B., and Kelly, J.: A conceptual model of avalanche hazard, Nat. Hazard, 90, 663–691, https://doi.org/10.1007/s11069-017-3070-5, 2018. a
Taylor, K. E., Stouffer, R. J., and Meehl, G. A.: An overview of CMIP5 and the experiment design, B. Am. Meteorol. Soc., 93, 485–498, https://doi.org/10.1175/BAMS-D-11-00094.1, 2012. a
Techel, F. and Pielmeier, C.: Wet snow diurnal evolution and stability assessment, The International Snow Science Workshop, Davos 2009, Proceedings, 27 September–2 October 2009, 256–261, http://arc.lib.montana.edu/snow-science/item/238 (last access: 23 September 2025), 2009. a
Techel, F., Helfenstein, A., Mayer, S., Pérez-Guillén, C., Purves, R., Ruesch, M., Schmudlach, G., Soland, K., and Winkler, K.: Human vs. machine – Comparing model predictions and human forecasts of avalanche danger and snow stability in the Swiss Alps, International Snow Science Workshop Proceedings 2024, Tromsø, Norway, 23–29 September 2024, 31–38, http://arc.lib.montana.edu/snow-science/item/3108 (last access: 23 September 2025), 2024. a
Teich, M., Marty, C., Gollut, C., Gret-Regâmey, A., and Bebi, R.: Snow and weather conditions associated with avalanche releases on forests: Rare situations with decreasing trends during the last 41 years, Cold Reg. Sci. Technol., 83–84, 77–88, https://doi.org/10.1016/j.coldregions.2012.06.007, 2012. a
Uvo, C. B.: Analysis and regionalization of northern European winter precipitation based on its relationship with the North Atlantic oscillation, Int. J. Climatol., 23, 1185–1194, https://doi.org/10.1002/joc.930, 2003. a
van Herwijnen, A., Muccioli, M., Wever, N., Saiet, E., Mayer, S., and Pugno, N.: Is Arctic snow different from alpine snow? Delving into the complexities of snow cover properties and snow instability, International Snow Science Workshop Proceedings 2024, Tromsø, Norway, 23–29 September, 401–408, http://arc.lib.montana.edu/snow-science/item/3165 (last access: 23 September 2025), 2024. a
van Vuuren, D. P., Edmonds, J., Kainuma, M., Riahi, K., Thomson, A., Hibbard, K., Hurtt, G. C., Kram, T., Krey, V., Lamarque, J.-F., Masui, T., Meinshausen, M., Nakicenovic, N., Smith, S. J., and Rose, S. K.: The Representative Concentration Pathways: An overview, Climatic Change, 109, 5–31, https://doi.org/10.1007/s10584-011-0148-z, 2011. a, b
van Westen, R. M., Kilphuis, M., and Dijkstra, H.: Physics-based early warning signal shows that AMOC is on tipping course, Sci. Adv., 10, eadk1189, https://doi.org/10.1126/sciadv.adk1189, 2024. a, b
Varsom: Avalanche warnings, https://www.varsom.no/en/avalanches/avalanche-warnings/ (last access: 23 September 2025), 2025. a
Varsom: About The Norwegian Avalanche Warning Service, https://www.varsom.no/en/avalanches/avalanche-warnings/about-the-norwegian-avalanche-warning-service/ (last access: 23 September 2025), 2025a. a
Varsom: Avalanche problems, https://www.varsom.no/en/avalanches/about-avalanches/avalanche-problems/ (last access: 23 September 2025), 2025b. a
Wang, F., Landgren, O., Laakso, A., Christensen, O. B., Dobler, A., and Lind, P.: User policy for NorCP data, https://doi.org/10.5281/zenodo.13827561, 2024. a
Weijer, W., Cheng, W., Garuba, O. A., Hu, A., and Nadiga, B. T.: CMIP6 models predict significant 21st century decline of the Atlantic Meridional Overturning Circulation, Geophys. Res. Lett., 47, e2019GL086075, https://doi.org/10.1029/2019GL086075, 2020. a
Werners, S. E., Wise, R. M., Butler, J. R., Totin, E., and Vincent, K.: Adaptation pathways: A review of approaches and a learning framework, Environ. Sci. Policy, 116, 266–275, https://doi.org/10.1016/j.envsci.2020.11.003, 2021. a
Winkler, R. L. and Murphy, A. H.: On seeking the best performance measure or a best forecasting method, Int. J. Forecasting, 8, 104–107, https://doi.org/10.1016/0169-2070(92)90014-Z, 1992. a
Wong, W. K., Haddeland, I., Lawrence, D., and Beldring, S.: Gridded 1 × 1 km Climate and Hydrological Projections for Norway, NVE Report 59-2016, Norwegian Water Resources and Energy Directorate, https://nve.brage.unit.no/nve-xmlui/handle/11250/2500569 (last access: 23 September 2025), 2016. a, b
Zeidler, A. and Jamieson, B.: A nearest-neighbour model for forecasting skier-triggered dry-slab avalanches on persistent weak layers in the Colombia Mountains, Canada, Ann. Glaciol., 38, 166–172, https://doi.org/10.3189/172756404781815194, 2004. a, b, c, d
- Abstract
- Introduction
- Data
- Methods
- Model performance and feature importances
- Results
- Discussion
- Summary and conclusions
- Appendix A: Future projections from EURO-CORDEX
- Appendix B: Monte-Carlo significance test
- Appendix C: Predictive feature tables
- Appendix D: Model evaluation metrics
- Appendix E: Random forest hyperparameter set
- Code and data availability
- Author contributions
- Competing interests
- Disclaimer
- Acknowledgements
- Financial support
- Review statement
- References
- Supplement