the Creative Commons Attribution 4.0 License.
the Creative Commons Attribution 4.0 License.
 | 25 Feb 2026
CMIP6 climate model spread outweighs glacier model spread in 21st-century drought buffering projections
Finn Wimberly
Sloan Coats
Jonathan Mackay
Erik Holmgren
Drought risk is changing as the hydrological cycle responds to anthropogenic climate change. Projections of future drought risk used to inform water management would ideally be conducted at local scale, but local-scale projections demand local data and computational resources that are often not available. As an alternative, global-scale projections of glacier runoff and the hydrological cycle can provide important insights for the local scale, particularly when interpreted carefully. Here, we use an ensemble of 11 latest-generation (CMIP6) climate models to force three different global glacier models, and we examine changes in glacial drought buffering for 75 major river basins in the early, mid-, and late 21st century. Glacial drought buffering results are broadly consistent across glacier models. By contrast, we find that the spread in glacial drought buffering among different climate models is large and likely under-sampled compared with the full archive of suitable CMIP6 simulations (123 simulations from 28 models for the SSP2-4.5 scenario). This work highlights that, for downstream hydrological studies: (1) no one global glacier model is more suitable than another, and (2) analysing a representative ensemble of climate models is imperative. Our findings illustrate that differences in glacier model outputs that appear consequential to glaciologists may be less consequential for downstream impact metrics.
- Article
(5725 KB) - Full-text XML
- BibTeX
- EndNote


Ongoing anthropogenic climate change has severe consequences for the global water cycle and hydrological hazards (Douville et al., 2021; Caretta et al., 2022). For example, projections from global climate models show robust increases in the severity and frequency of several drought metrics in the coming decades (Cook et al., 2020). Global impact models (Prudhomme et al., 2014) and global hydrological models (Wanders et al., 2015) support similar conclusions. Those projections do not account for changes in parts of the water cycle that are not simulated by those models; for example, glaciers provide substantial runoff to mountain regions, and that cannot be simulated directly in CMIP6-class climate models (Decharme et al., 2019; Lawrence et al., 2019; Ultee et al., 2022a, and discussion therein). Although global hydrological models show promise for projecting catchment-scale hydrologic change (Kumar et al., 2022), they include at best a simplistic representation of glacier dynamics (Wiersma et al., 2022; Hanus et al., 2024). The regional importance of glacier runoff, and the nonlinear response of glaciers to climate change, demands large-scale glacier-dynamic projections of the impacts of glacier runoff entering major hydrologic systems.
Droughts manifest in response to local environmental conditions that are connected to regional-to-global scale climate. In mountain regions where glacier runoff is significant, projections of drought would ideally come from local-scale hydrological models coupled with glacier evolution models, both driven by regional-to-global scale climate variability and change. There has been progress in coupling glacier evolution models with hydrological models for local- to regional-scale analyses, generally by driving a hydrological model with pre-generated glacier runoff for a short, contemporary period (Naz et al., 2014; Mackay et al., 2018, 2019; Wiersma et al., 2022; Pesci et al., 2023; Hanus et al., 2024). However, it is not yet feasible to produce multidecadal projections of glacio-hydrological dynamic evolution for all glacier-dependent basins. Coupled hydrological models are computationally expensive and rely on tens of parameters that are poorly constrained by observations (van Tiel et al., 2020b; Somers and McKenzie, 2020; Hanus et al., 2024). Moreover, the computational, analytical, and observational resources necessary to develop these analyses are not equitably distributed, and often unavailable in the places that most need it (Stein et al., 2024). In the many basins where fine-scale coupled glacio-hydrological simulations are not yet possible, we can analyse the drought buffering role of glaciers – excluding interactions with snowpack or groundwater – from the combined output of global climate models and glacier models.
Standardized drought indices permit efficient large-scale drought analysis. Given a time series of some hydrological quantity of interest, such as local water balance, a standardized index compares variations against those of a reference period to identify periods that would be experienced as unusually dry. A wide range of drought indices that focus on different types of drought and components of the hydrological system has been developed (World Meteorological Organization and Global Water Partnership, 2016). For future projections, standardized indices facilitate comparison of drought conditions based on output from climate models with otherwise incompatible hydrology schemes. The Standardized Precipitation-Evapotranspiration Index (“SPEI”; Vicente-Serrano et al., 2009), which accounts for the effect of changing temperature on atmospheric moisture demand, is commonly used for large-scale analyses of drought under climate change scenarios (Cook et al., 2014; Ault, 2020). Ultee et al. (2022a) modified the SPEI to quantify glacial drought buffering by accounting for a time-varying flux of glacier runoff.
Most glacierized river basins contain tens, hundreds, or thousands of individual glaciers, many of which lack in situ ice thickness or runoff observations (Salzmann et al., 2014). Projecting future runoff for such basins requires a model that can efficiently simulate multiple glaciers, at multi-decadal time scales, using only remote sensing or large-scale reanalysis data as inputs. Several such models, known as global glacier evolution models (hereafter “glacier models”), are now available (Huss and Hock, 2015; Maussion et al., 2019; Hock et al., 2019; Rounce et al., 2020). Regional-to global-scale simulations from these models predict dramatic loss of present-day glacier mass during the 21st century, with an initial increase and subsequent decrease in annual glacier runoff (Huss and Hock, 2018; Immerzeel et al., 2020; Wimberly et al., 2025; Schuster et al., 2025). In some basins, the phase of increasing glacial runoff has already passed, with no further increase projected in the 21st century.
Previous projections with one glacier model forced by previous-generation (CMIP5) climate model simulations found that glacial drought buffering on the SPEI continued through the end of the 21st century in almost all major river basins worldwide (Ultee et al., 2022a). The availability of updated projections from state-of-the-art climate models (“CMIP6”, Eyring et al., 2016) and large apparent discrepancies in runoff projections from different glacier models (Wimberly et al., 2025) motivate an evaluation of the sensitivity of glacial drought buffering projections to these changes. Here, we expand the glacial drought buffering analysis of Ultee et al. (2022a) to include three different glacier models, forced by a common ensemble of simulations from 11 CMIP6 climate models, for 75 glacierized river basins worldwide.
2.1 Study areas
Our analysis focuses on the world's 75 large river basins (basin area Abasin≥3000 km2) that have considerable glacier cover (glacier cover Ag≥30 km2), consistent with Wimberly et al. (2025) and Holmgren (2022). We chose these thresholds to identify basins where climate model output (typically not finer than 0.25° resolution, or about 28 km at the equator) would be suitable for a large-scale drought study, and where there was enough glacier ice to produce non-negligible runoff at basin scale. The basins span North and South America, Europe, Asia, and New Zealand, and are home to more than one third of the world's population (Huss and Hock, 2018). We do not consider any river basins in Greenland or Antarctica. Glacier area fraction () ranges from in the Irrawaddy basin to in the Copper basin, with a median of . That is, the rivers in our analysis are fed in part by glacier runoff, but glaciers are only a small part of their catchment area. While we have not selected for hydrological characteristics other than glacier cover, the basins included are climatologically diverse: they range from tropical to subpolar; they sit on both windward and leeward sides of large mountain ranges; some are monsoon-affected; some are strongly affected by El Niño-Southern Oscillation variability; some are arid; some are high-altitude endorheic basins, and some flow through vast lowlands before reaching their outlet. The basin outlines are shown in global map view in Fig. 1, and in regional maps with basin names in Figs. A1–A5.
We analyse model spread in drought buffering and its forcing variables for each basin. The basins appear as markers with whiskers in Fig. 2, plotted according to their glacier area fraction. In Fig. 3, each panel shows a single basin with its name, organized by region (labelled at the right side of the figure). Figures 4–5 present global climate model ensemble range and mean, with the basins in the same order and labelled by region. Figures D1 and D2 show time series of the forcing variables for each basin, with the same organization as Fig. 3. We summarize aggregate results below; where we use specific basins as examples, we indicate the basin name, region, and its (row, column) location on the figure when applicable.
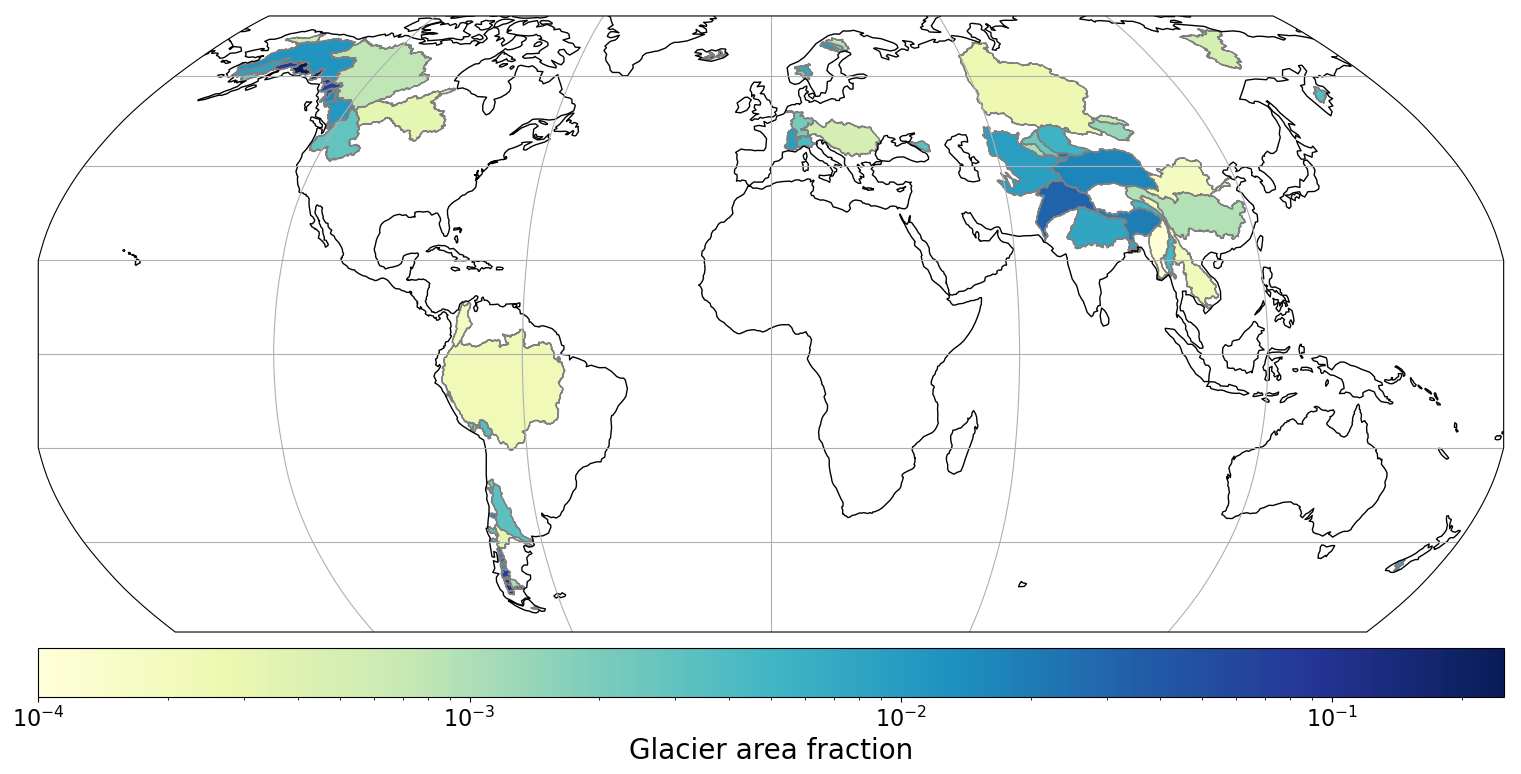
Figure 1Map of river basins included in this analysis: 75 large river basins, each ≥ 3000 km2 in area, with glacier cover ≥ 30 km2 in the Randolph Glacier Inventory v6 (RGI Consortium, 2017). Basin outlines are from the Global Runoff Data Centre (Global Runoff Data Centre, 2020), here colored according to their initial glacier area fraction . See Appendix A for regional maps with basin names.
2.2 Global glacier runoff projections
We analyse a set of projections generated by three glacier models: the Global Glacier Evolution Model (“GloGEM”; Huss and Hock, 2015, 2018), the Python Glacier Evolution model (“PyGEM”; Rounce et al., 2020), and the Open Global Glacier Model (“OGGM”; Maussion et al., 2019, 2023). Among the models participating in recent glacier model intercomparisons (Supplementary Table S2 of Zekollari et al., 2025), OGGM, PyGEM, and GloGEM are the only ones simulating all glacier regions on a per-glacier basis and providing runoff output.
The runoff projections are forced by a common set of a single continuous historical (2000–2014) and Shared Socioeconomic Pathway (SSP) 2–4.5 (2015–2100) simulations from 11 CMIP6 global climate models (hereafter GCMs). The forcing ensemble is consistent with standard, publicly archived glacier projections (Compagno et al., 2022; Rounce et al., 2023; Schuster et al., 2023b; Zekollari et al., 2024; Wimberly et al., 2025). The SSP2–4.5 scenario results in mid-range warming through the 21st century. For simplicity, we evaluate only one climate scenario here; the dependence of glacial runoff and drought buffering on climate scenario is quantified in several other studies (Huss and Hock, 2018; Ultee et al., 2022a; Aguayo et al., 2024; Wimberly et al., 2025; Schuster et al., 2025).
The three glacier models all use similar methods (described in Huss and Hock, 2015) to bias correct the GCM data. For the GCM grid point closest to the glacier, the method calculates an additive (for temperature) and multiplicative (for precipitation) monthly bias between the GCM data and a reanalysis product. The interannual variability of the GCM temperature series is further adjusted to be consistent with the reanalysis data. A local precipitation factor is calibrated in each glacier model's mass balance module to produce per-glacier mass change consistent with satellite observations over the period 2000–2020. All models are calibrated using the same observed mass change dataset of Hugonnet et al. (2021).
The three glacier models provide glacier-by-glacier projections of glacier volume and fixed-gauge water runoff, with monthly resolution, for the period 2000-2100. The runoff projections include all sources of runoff – ice melt, snow melt, and liquid precipitation – within initially glacierized areas. Glacier model differences, especially in calibration of the precipitation factor, can lead to significant discrepancies in simulated runoff. We outline key details of each model's implementation in Table B1. Wimberly et al. (2025) provides a more complete analysis of the factors affecting glacier runoff output in these simulations.
2.3 Drought buffering
Changes in glacier runoff do not translate directly to changes in downstream water supply. Among the many fates possible after leaving the glacial environment, runoff may flow rapidly along surface channels, seep slowly through subsurface pathways, or be lost to evapotranspiration, altering the timing and quantity of water availability. For that reason we use a metric of downstream water supply that accounts for catchment hydrological processes, including potential changes with future climate change: the Standardized Precipitation-Evapotranspiration Index (“SPEI”; Vicente-Serrano et al., 2009).
We compute two versions of the SPEI following the methods described in Ultee et al. (2022a). We do not analyse either version of SPEI in isolation; our work is not intended to produce a projection of actual drought frequency or severity. Rather, we analyse “drought buffering” as the difference between SPEI with no dynamic glacier runoff (SPEIN) and SPEI that accounts for glacier runoff (SPEIG). We are most interested in how the buffering effect may change over time.
The “no glaciers” SPEIN uses only GCM output without accounting for glacier runoff. For each month between 1900–2100, we compute a water balance , where P is precipitation and PET is potential evapotranspiration. The PET computation uses a Penman-Monteith method – a function of surface temperature, surface pressure, specific humidity at the surface, and surface net radiation – modified to allow time-varying stomatal conductance in response to CO2 forcing (following Yang et al., 2019). We integrate the D series over a 3-month scale, such that the integrated value at each time step is the sum of that month and the two previous ones, which focuses our analysis on streamflow drought (e.g. López-Moreno et al., 2013; Ultee et al., 2022a, Appendix B). We then standardize all D values against those in a climatological reference period (1900–1979), using a nonparametric rank standardization such that unusually high D values are assigned to SPEI values ≥ 1 and unusually low values to SPEI without assuming an underlying distribution shape (Farahmand and AghaKouchak, 2015). We maintained the same climatological reference period chosen in our earlier glacial drought buffering study to facilitate comparison (Ultee et al., 2022a).
The “with glaciers” SPEIG is analogous, but replaces the moisture source term P in the water balance with an area-weighted sum of precipitation over ice-free areas and glacial runoff (including ice melt, snow melt, and liquid precipitation) over initially glacierized areas:
where is the modified moisture source, Abasin is total basin area, Ag is initially glacierized area of the basin, and R is glacial runoff from all glaciers that drain into the basin. The variables Ag and R come from the glacier models. The climatological reference period does not include glacier runoff, which makes an absolute comparison between SPEIG and SPEIN less meaningful; for that reason, we focus on changes in buffering over time.
Following standard operational practice (e.g. Danandeh Mehr and Vaheddoost, 2020), we identify a “drought” as any period of continuously negative SPEI during which the SPEI reaches a threshold value of −1 or lower for at least one month. The “severity” of a given drought is the cumulative sum of SPEI during that period. For each of the river basins studied here, we report the average severity of all droughts within a given time period.
We analyse SPEI data for the 21st century, 2000–2100, in three 21-year periods. The “Early century” is 2000–2020, “Mid-century” 2040–2060, and “Late century” 2080–2100. The glacial drought buffering in the “Early century” is considered a baseline for each basin, by which we assess future changes in buffering. For example, if the difference in severity between SPEIN and SPEIG is positive during the Early century and becomes more positive in the Late century, then buffering is projected to increase.
2.4 Model spread
The sources of uncertainty in our projections of glacial drought buffering include structural uncertainty among GCMs, structural uncertainty among glacier models, parameter uncertainty in glacier models, uncertain future climate scenarios, and internal climate variability. The impacts of these uncertainties vary regionally and are most effectively quantified at regional scale (e.g. Aguayo et al., 2024). For this global analysis, we focus on comparing the spread in glacial buffering of drought severity, and changes in that buffering over time, across GCMs and across glacier models. This comparison will not fully quantify the known sources of uncertainty, but it can inform glaciologists and practitioners as to the relative dependence of large-scale drought buffering estimates on choice of glacier model.
We calculate drought buffering statistics for each glacier model-GCM pair. We then analyse the results for individual glacier models, showing the spread from the GCM forcing ensemble for that glacier model (whiskers in Figs. 2b and 3). The “GCM spread” is the difference between the ensemble members (N=11) predicting highest buffering versus lowest buffering for a given glacier model, basin, and period. The “glacier model spread” is the difference between the glacier models (N=3) predicting highest versus lowest multi-GCM mean buffering for a given basin and period. We report the ratio of GCM spread to glacier model spread in Fig. 3.
As noted in Wimberly et al. (2025), the available glacier runoff data represents the entire population of glacier models available for global runoff simulations, but only a small sample of the GCM forcing realizations from the CMIP6 archive. One of the GCMs included in the Wimberly et al. (2025) ensemble lacks the secondary output variables necessary for calculating SPEI which means it cannot be included in our analysis. To contextualize the inter-GCM spread not sampled in the current archive of glacier runoff simulations, we compare the precipitation and temperature from our standard forcing ensemble against a larger ensemble of all CMIP6 simulations that include the variables and scenarios necessary for our analysis (Figs. 4–5 and D1–D2 below; CMIP6 ensemble from Eyring et al., 2016). This wider ensemble (123 simulations from 28 distinct GCMs, Table C2) includes spread from both structural uncertainty and internal variability, which we do not attempt to separate.
Glacial drought buffering as measured in SPEI is projected to continue through the 21st century. This result is robust to differences in GCM forcing, choice of glacier model, and choice of baseline periods, all of which differ between our study and Ultee et al. (2022a). However, we find that GCM spread – arising from natural climate variability as well as differences in climate model construction – has not been well sampled in current glacier projections.
3.1 Magnitude of glacial drought buffering correlates with glacier area fraction
Glacial drought buffering is strongest in moderately glacierized basins. The strength of buffering, expressed in terms of reduced drought severity, increases as glacier area fraction increases, with a decrease for the most heavily glacierized basins (Fig. 2a). This result is consistent with glacial drought buffering computed for a single glacier model by Ultee et al. (2022a). It also aligns with theoretical understanding of the “glacier compensation effect” on streamflow, in which interannual streamflow variability is minimized when the contributions from precipitation and from melt counterbalance, i.e. with moderate rather than total glacier cover (Chen and Ohmura, 1990; van Tiel et al., 2020a).
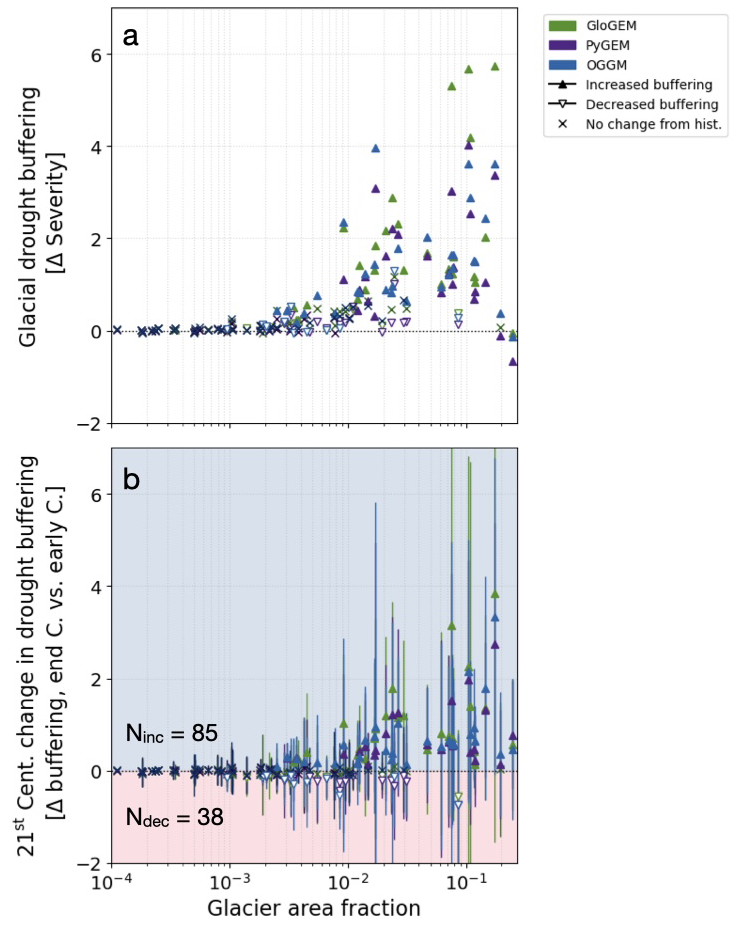
Figure 2(a) Late century (2080–2100) glacial buffering of drought severity, and (b) change in buffering between the Early (2000–2020) and Late century, for three glacier models (colors) and 75 basins (markers). Glacial buffering of drought severity is the difference in severity between SPEIN and SPEIG over the period (see Sect. 2.3). Both panels show results for the ensemble of 11 GCMs, forcing each glacier model studied here: PyGEM in purple, GloGEM in green, and OGGM in blue. Upward filled carets indicate buffering increased from the baseline; downward open carets indicate buffering decreased; X markers indicate that the change in buffering is within ± 0.1 SPEI. Panel (a) shows only the ensemble mean, for readability. Panel (b) shows the ensemble mean change in buffering, with full 11 GCM spread in whiskers. Annotations on panel (b) give the number of basin-glacier model pairs with increased (Ninc) or decreased (Ndec) buffering; the total number of basin-glacier model pairs is .
3.2 Change in glacial drought buffering over time consistent among glacier models
Glacial buffering of drought severity generally persists or increases through the Late 21st century. About 45 % (102 cases) of all glacier model-basin pairs (3 glacier models × 75 basins) show no change in GCM ensemble mean buffering between the Early and Late century, and a further 38 % show increased buffering (85 cases; Fig. 2b). The more heavily glacierized basins tend to show larger increases in GCM ensemble mean buffering, though with more inter-GCM spread.
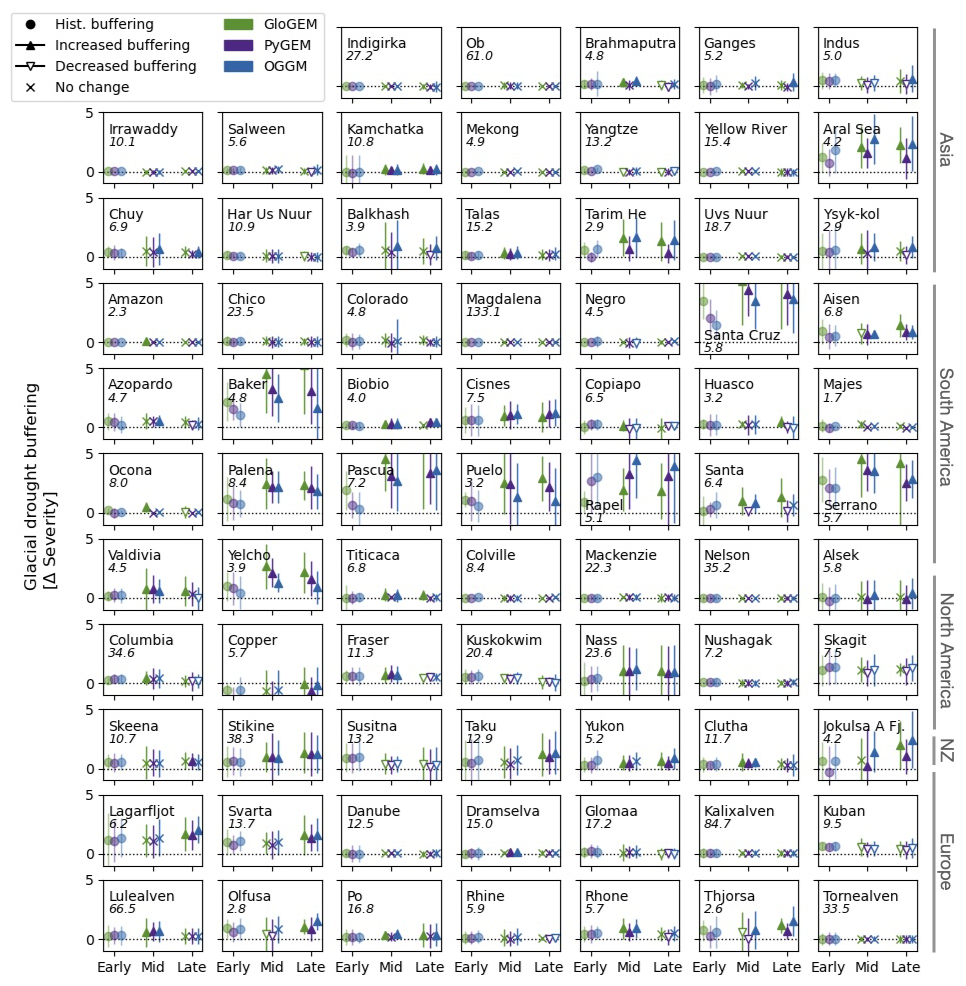
Figure 321st-century glacial drought buffering, expressed as difference in drought severity, for three periods: Early (2000–2020), Mid (2040–2060), and Late century (2080–2100). Glacial buffering of drought severity is the difference in severity between SPEIN and SPEIG over the period (see Sect. 2.3). Colors indicate results per glacier model; markers indicate if the GCM ensemble mean buffering increases (upward filled triangles), decreases (downward open triangles), or remains unchanged (x) relative to the historical baseline (circles in Early century). Whiskers give inter-GCM spread. Italic text gives ratio of inter-GCM to inter-glacier-model spread at Late century.
Although there are differences among glacier models in the magnitude of projected changes – buffering of drought severity shown on the vertical axes in Figs. 2–3 – the pattern over time for a given basin is similar across glacier models. For example, buffering in the Aral Sea basin (Asia; row 2, column 7 of Fig. 3) is positive in the Early century, increases in the Mid century, and remains high through the Late century for GloGEM (green markers), PyGEM (purple markers), and OGGM (blue markers). In other basins, such as the Indigirka (Asia; row 1, column 3), buffering is weak but does not decrease through the Late century, irrespective of choice of glacier model. There are a handful of basins where buffering does decrease later in the century for all three glacier models, e.g., the Kuban (Europe; row 10, column 7). Among the 225 cases shown (75 basins × 3 time periods) there are only 7 for which glacier models disagree on the sign of change. In all cases, GCM ensemble mean buffering for each glacier model falls within the inter-GCM spread of the other two glacier models. We therefore conclude that the qualitative patterns of glacial drought buffering are robust to choice of glacier model.
3.3 Inter-GCM spread in glacial drought buffering is substantial and under-sampled
Although ensemble mean glacial drought buffering is consistent across glacier models, there is considerable inter-GCM spread (whiskers in Figs. 2–3). Inter-GCM spread always exceeds inter-glacier-model spread. For example, comparing Late-century buffering, inter-GCM spread exceeds inter-glacier-model spread by factors ranging from 1.7 (Majes basin, South America; row 5, column 7 of Fig. 3) to 133 (Magdalena basin, South America; row 4, column 4). In most basins (55 of 75), inter-GCM spread is at least five times the spread across glacier models. This is true not only in basins with strong buffering such as the Rapel (South America; row 6, column 5), but also moderate buffering cases such as the Indus (Asia; row 1, column 7) and Fraser (North America; row 8, column 3), and weak buffering cases such as the Danube (Europe; row 10, column 3). Ensemble members tend to agree in sign with the GCM ensemble mean change, but there are several cases in which one or more GCMs projects a change over time of opposite sign to the GCM ensemble mean. Those cases are legible in Fig. 2b, where some GCM ensemble members show decreasing buffering (whiskers ending at negative y-axis values) despite a positive GCM ensemble mean change (markers with positive y-axis values).
The 11-member GCM ensemble we analyse here, and which has been used as the standard forcing for glacier models, under-samples uncertainty in the CMIP6 archive. If the glacier-forcing ensemble were representative of the larger CMIP6 archive (Eyring et al., 2016), we would expect the precipitation and temperature series of the 11 members to be well dispersed among those of a larger ensemble. We would also expect the mean values of the smaller ensemble to be close to the mean values of the larger ensemble for most basins. Instead, in comparison to the larger, 123-member CMIP6 ensemble, 21st-century precipitation and temperature projections from the glacier-forcing ensemble sample a smaller range and their means are biased low (Figs. 4–5, D1–D2). For example, the glacier forcing ensemble members sample a much more limited range of precipitation change than the CMIP6 ensemble members (Fig. 4a). The mean change at Late century has a consistently larger amplitude in the CMIP6 ensemble than in the glacier forcing ensemble for both precipitation (Fig. 4b) and temperature (Fig. 5b). Without generating glacier runoff projections for a more complete sampling of the CMIP6 archive – a computational demand beyond what has been attempted by the glacier modelling community thus far – the uncertainty from GCMs in projections of future glacial runoff and drought buffering remains poorly quantified. Understanding the sources of GCM ensemble spread, and how it differs regionally, for both the standard glacier-forcing ensemble and the CMIP6 archive, merits attention in more detailed studies.
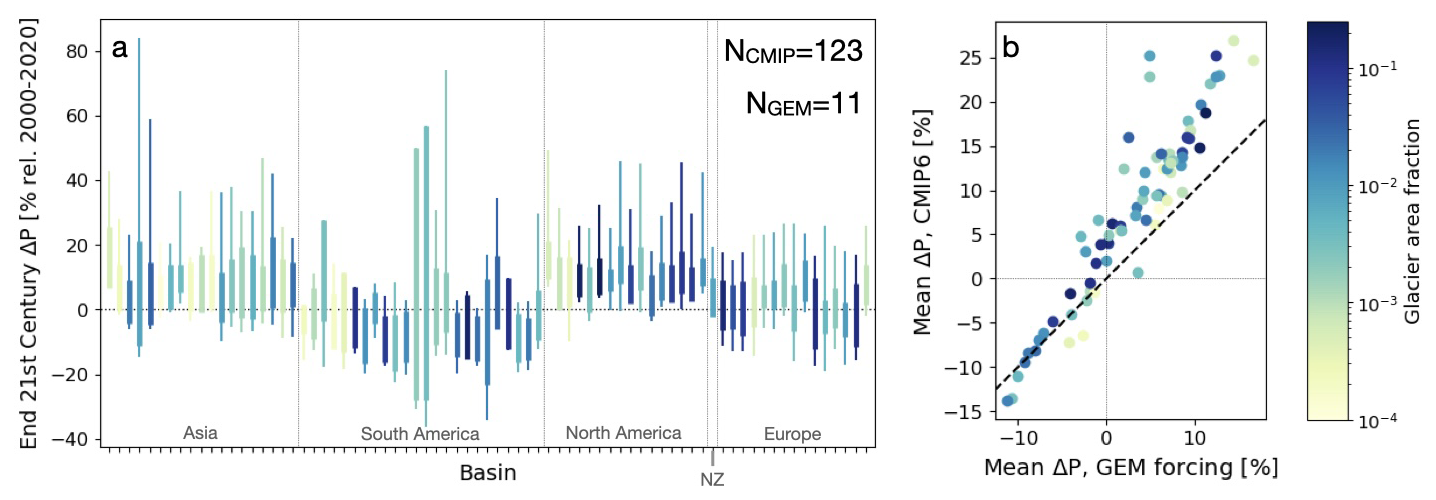
Figure 4Panel (a): Spread in Late-century (2080–2100) percent change in total basin precipitation for (bars) the 11 members of the glacier model forcing ensemble and (whiskers) the 123 members of the CMIP6 archive with data sufficient for SPEI. Panel (b): Ensemble means of the same variable, with the glacier model forcing ensemble mean on the x-axis and the CMIP6 ensemble mean on the y-axis; dashed black line shows 1:1 correspondence. Results are colored by basin glacier area fraction and shown in the same basin order as other figures; time series for each basin are shown in Fig. D1.
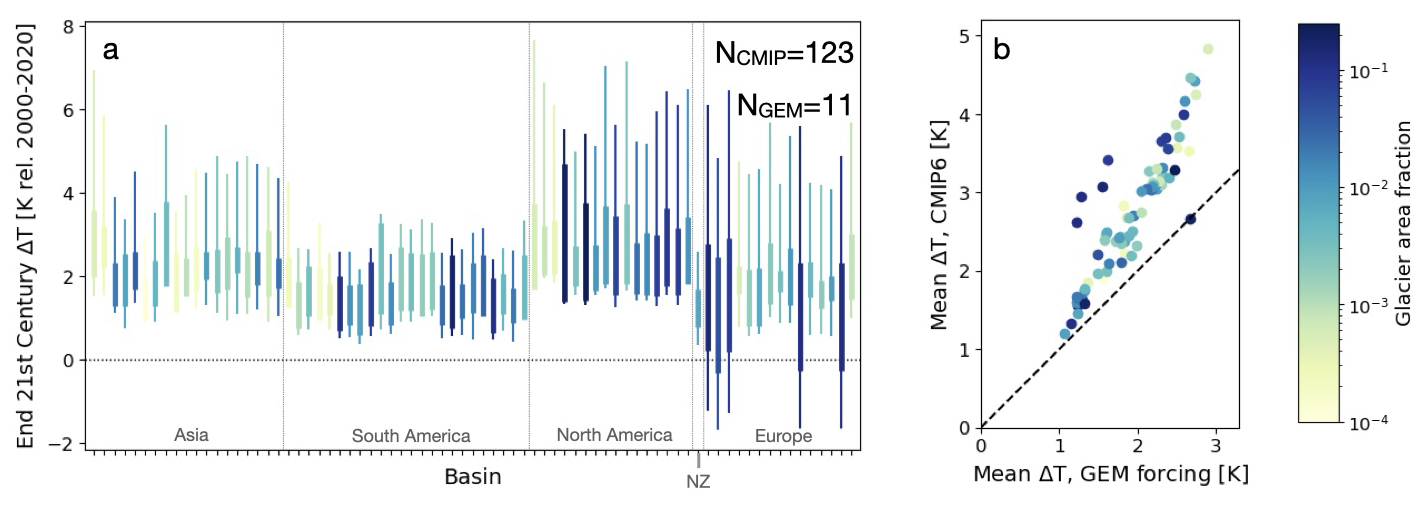
Figure 5Panel (a): Spread in Late-century (2080–2100) basin-averaged temperature anomaly for (bars) the 11 members of the glacier model forcing ensemble and (whiskers) the 123 members of the CMIP6 archive with data sufficient for SPEI. Panel (b): Ensemble means of the same variable, with the glacier model forcing ensemble mean on the x-axis and the CMIP6 ensemble mean on the y-axis; dashed black line shows 1:1 correspondence. Results are colored by basin glacier area fraction and shown in the same basin order as other figures; time series for each basin are shown in Fig. D2.
Our results demonstrate conclusively that inter-GCM spread outweighs inter-glacier-model spread in glacial drought buffering projections from a standard set of glacier model simulations. More generally, although we have not fully sampled the relevant sources of uncertainty, our findings suggest that uncertainty in climate forcing from GCMs is more important than uncertainty in glacier model physics for hydrological projections in glacierized river basins.
Glacier models use different approaches to simulate glacier processes, so we should expect some resulting differences in their runoff outputs. For example, differences in the approach to calibration, climate-forcing downscaling, and initialization can produce large differences in simulated glacier mass and runoff (Marzeion et al., 2020; Schuster et al., 2023a; Aguayo et al., 2024; Wimberly et al., 2025). This is in fact desirable, allowing the glacier modelling community to sample structural uncertainty – because our models are always an imperfect simplification of the physical world, and we want to capture the range of possibilities – so we should not strive to find one “best-performing” glacier model for every application. Indeed, any evaluation of “performance” depends on context and the intended use case (O'Loughlin, 2024). Our objective here is rather to provide interpretive guidance for use cases where model uncertainty is important but may not be directly quantified.
4.1 Drought buffering robustness across global glacier models
The magnitude of glacial drought buffering correlates with basin glacier coverage in all three glacier models (Fig. 2). This result agrees with the theoretical expectation that streamflow variability is minimized for basins with moderate glacier cover (Chen and Ohmura, 1990; Fleming and Clarke, 2005; van Tiel et al., 2020a). It is reassuring that glacier models reproduce the theoretical expectation regardless of differences in process parametrizations. The temporal trends in glacial drought buffering also do not depend on the choice of glacier model (Fig. 3). Despite differences among glacier models in terms of absolute runoff projections (i.e. physical units), the projected annual and seasonal runoff expressed as percent changes are generally similar (Wimberly et al., 2025). The rank standardization used to compute a nonparametric SPEI (Farahmand and AghaKouchak, 2015; Ultee et al., 2022a) will likely translate similar percent changes in runoff to similar SPEI changes, other inputs being equal. Our results demonstrate explicitly that large absolute differences in runoff (up to a factor of three; see Wimberly et al., 2025) among glacier models may be relatively unimportant for downstream drought metrics. These findings imply that any of the three glacier models chosen would be appropriate for regional-scale drought analysis. In a regional-scale drought study conducted with limited computational resources, it may not be necessary to sample an ensemble of different glacier models.
Consistency of glacial drought buffering on SPEI does not necessarily imply that other hydrological metrics will be similar across glacier models. In part, the simulated drought buffering is a result of glacier models scaling up precipitation over the glacier domain, which corrects GCM underestimation of the water balance at high elevation (Ultee et al., 2022a). Each glacier model applies different precipitation corrections (Table B1), and that leads to corresponding differences in absolute runoff. Different choices of baseline climate dataset and calibration scheme also affect simulated runoff from each model (Schuster et al., 2023a; Aguayo et al., 2024). Thus, hydrological studies that require absolute glacier runoff should either sample multiple glacier models or seek observational constraints on runoff to adjust a single glacier model.
4.2 Interpretation of large and under-sampled climate model uncertainty
Inter-GCM spread emerges as a larger source of uncertainty than inter-glacier-model spread in this analysis. The ensemble of GCM simulations in our results was chosen to be consistent with previous glacier modelling efforts (Compagno et al., 2022; Rounce et al., 2023; Schuster et al., 2023b; Zekollari et al., 2024; Wimberly et al., 2025), which selected ensemble members agnostically, and it is not representative of the full CMIP6 ensemble spread in the 75 river basins we study. We do not attempt to separate GCM structural uncertainty from internal variability, and it is likely that the 11-member ensemble of climate forcing undersamples both. For instance, internal climate variability may be large in basins affected by modes of climate variability such as the El Niño-Southern Oscillation. Internal climate variability is best sampled by analysing many model realizations of the same time period (Deser et al., 2020); our glacier model forcing ensemble uses only one realization per GCM, while the full CMIP6 ensemble includes multiple realizations from several models (Table C2). Furthermore, choosing 11 out of over 25 available CMIP6 GCMs is unlikely to fully quantify structural uncertainty. The under-sampling of both structural uncertainty and internal climate variability is apparent in the limited spread of precipitation and temperature projections from the glacier-forcing ensemble compared with a 123-member CMIP6 ensemble (Figs. 4–5 and D1–D2). Finally, our drought buffering analysis includes only a single climate scenario. Thus, although our previous analyses indicate that scenario uncertainty may be comparable in magnitude to other GCM uncertainties (Ultee et al., 2022a; Wimberly et al., 2025), we have not quantified it here. Fully quantifying the uncertainty from internal variability, scenario uncertainty, and structural uncertainty at the scale of the river basins of interest should be a high priority for future studies.
Accounting for climate variability and model spread is of particular importance for glacier modelling because glaciers are long-term integrators of variability in the climate. Short-term variations in temperature and precipitation can produce large, longer-term variation in glacier extent (Oerlemans, 2000; Roe and O'Neal, 2009; Goosse et al., 2018). When variability is ignored, as in glacier simulations forced by ensemble-mean climate fields, the resulting estimates of glacier volume change are biased (Vlug, 2021; Vlug et al., 2021; Robel et al., 2024). Bias and missing variability in glacier volume are consequential for annual runoff, because they determine how much water is stored as glacier ice from year to year. We expect that glacier model simulations sampling a more representative ensemble of climate model forcing, that more fully accounts for climate variability, could differ not only in glacier runoff variability but also in mean state compared with simulations forced by a limited ensemble. The selection of representative climate forcing for hydrological modelling is an area of active research (Snyder et al., 2024; Adhikari et al., 2024). Moreover, regions differ in which modes of climate variability most affect their hydroclimate. We expect that ensemble selection done at the regional scale (e.g. Rivera and Arnould, 2020; Huong et al., 2023; Azad and Ahmadi, 2024) will be more effective than a single global ensemble in detailed simulations of glacio-hydrological change.
A noted challenge of the CMIP6 ensemble is that some ensemble members respond too strongly to greenhouse gas forcing, producing warming inconsistent with observational constraints. This enhanced warming is a result of changes in certain model processes since the CMIP5 generation (Zelinka et al., 2020), and the Intergovernmental Panel on Climate Change Sixth Assessment Report (AR6) has addressed it by analysing weighted ensemble means rather than simple ensemble mean change over time. Hausfather et al. (2022) suggest that regional impact studies select climate forcing ensembles that are consistent with AR6, for example by choosing models with equilibrium climate sensitivity within the “likely” range. We have used the climate sensitivities of each CMIP6 model as assessed by Zelinka (2022) to present such ensembles in Figs. C1–C2. Our main conclusion, namely that inter-GCM spread is large and under-sampled in the glacier model ensemble compared with the broader CMIP6 ensemble, is upheld in those results as well. However, excluding models with climate sensitivity outside the AR6 “likely” range removes more than 60 % of the sample. We suggest that those interested in likely hydrological futures explore the other recommendations of Hausfather et al. (2022) such as analysing global warming levels (temperature outcomes) rather than scenarios. That will require additional data processing when using archived model output (see e.g. Zekollari et al., 2025), but it supports broader sampling from the CMIP6 archive.
4.3 Implications and limitations for downstream hydrological applications
Aside from GCM and glacier model-related uncertainty, the definition of “drought” is also a consequential source of uncertainty in future projections (Satoh et al., 2021; Caretta et al., 2022). We have assessed glacial drought buffering using only one of the many drought indices in operational use (World Meteorological Organization and Global Water Partnership, 2016). Other drought indices are less straightforward to modify for glacial runoff input, do not account for important climate change signals, or have limited data available to assess in future projections. The SPEI, like other drought indices, is a statistical metric that does not account for physical processes other than those explicit in its input data (Scheff et al., 2022). Most notably for the mountain basins we describe here, SPEI does not explicitly account for changing snowpack, interactions with groundwater stores, or human interventions in regional water flow (Van Loon et al., 2016). Because our fixed-gauge glacial runoff includes snowmelt over previously glacierized areas (Sect. 2.2), our analysis of “glacial” drought buffering may overstate the hydrological role of glaciers and mask the importance of seasonal snow in a changing climate. Our results are therefore not to be interpreted as a definitive projection of future drought or glacial drought buffering. Based on the statistical construction of standardized indices, and our previous analysis showing correlation between SPEI and the Standardized Runoff Index (Ultee et al., 2022a), we believe that inter-model spread and change over time of glacial drought buffering will be robust to choice of drought index. However, regional studies should consider what drought metric(s) best represent hydrological changes in their study area.
Methodological choices in the computation of a given drought metric affect drought projections as well. For example, analysts computing SPEI choose a climatological reference period (here 1900–1979), an integration period for the water balance (here 3 months), a standardization method (here nonparametric rank standardization), and a potential evapotranspiration equation (here a modified Penman-Monteith method). These choices have minimal effect on our analysis of glacial drought buffering and its change over time, because we compare our SPEI projections to historical baselines with the same methodological choices (Sect. 2.3, above, and Ultee et al., 2022a). We therefore chose methods consistent with established practice (Cook et al., 2014; Farahmand and AghaKouchak, 2015; Yang et al., 2019; Ault, 2020) and chose not to further quantify uncertainty in those choices. Regional analyses of future drought may still benefit from sensitivity studies of the user choices in their metric of choice.
Although the three glacier models we analyse are nearly interchangeable in terms of quantifying drought buffering, there are inter-glacier model differences that may make one more suitable than another for specific regional hydrology projections. For example, PyGEM is the only one that includes explicit treatment of debris cover on glaciers, which significantly impacts ice dynamics in regions such as High Mountain Asia (Rounce et al., 2020). Further, even a single glacier model may produce a large spread in certain runoff metrics – comparable to inter-GCM spread – when subjected to different choices of historical climate dataset and initial glacier geometry (Aguayo et al., 2024). Downstream users must therefore carefully define their requirements, and consult the glacier model description literature, to ensure an appropriate choice of glacier model and initialization datasets.
Our analysis of glacial drought buffering quantifies only two of many sources of uncertainty in glacio-hydrological projections. The relative importance of different sources of uncertainty depends on the intended use case. Consider two hypothetical uses of glacier projection information: Agricultural planners may be most interested in the expected seasonal shift in runoff peak for glacierized basins, while hydropower planning may require projections of interannual runoff variability. The former depends more strongly on climate scenario, while the latter depends more strongly on the reference climate used to initialize a glacier model (Aguayo et al., 2024). Our results do not provide direct information sufficient for either use case. New ensemble simulations that sample glacier runoff from multiple glacier models, calibrated to common observations, forced by a broad ensemble of GCMs that captures relevant modes of climate variability, assessed at a range of global warming levels, could provide more comprehensive uncertainty quantification that would support a range of applications. In the meantime, we encourage practitioners to (1) carefully define their variables of interest, (2) review available literature on the largest sources of uncertainty specific to those variables, (3) design simulations to sample those sources of uncertainty if possible, and (4) apply regional observational constraints on simulated runoff where available.
We have used all suitable global glacier models, forced by an ensemble of state-of-the-art global climate models, to quantify glacial drought buffering on the Standardized Precipitation-Evapotranspiration Index. Glacial drought buffering correlates with basin glacier coverage, and buffering generally increases or remains steady through the late 21st century. The consistency of this result with Ultee et al. (2022a) indicates that it is robust to choice of glacier model, choice of CMIP5 or CMIP6 forcing, and choice of baseline period. Our results should reassure glacier modellers that large inter-glacier-model differences in some output variables do not hinder their utility for downstream impact studies. By contrast, the spread resulting from the climate model forcing is greater than that from different glacier models, even though we have not fully sampled the sources of climate model uncertainty. Future downstream hydrological studies that wish to use glacier model output can justify using only one of the available glacier models, if well chosen for their regional context and normalized to observed runoff. However, it is imperative that downstream hydrological studies and the next generation of global glacier model projections select and analyse a representative ensemble of climate model simulations for climate forcing.
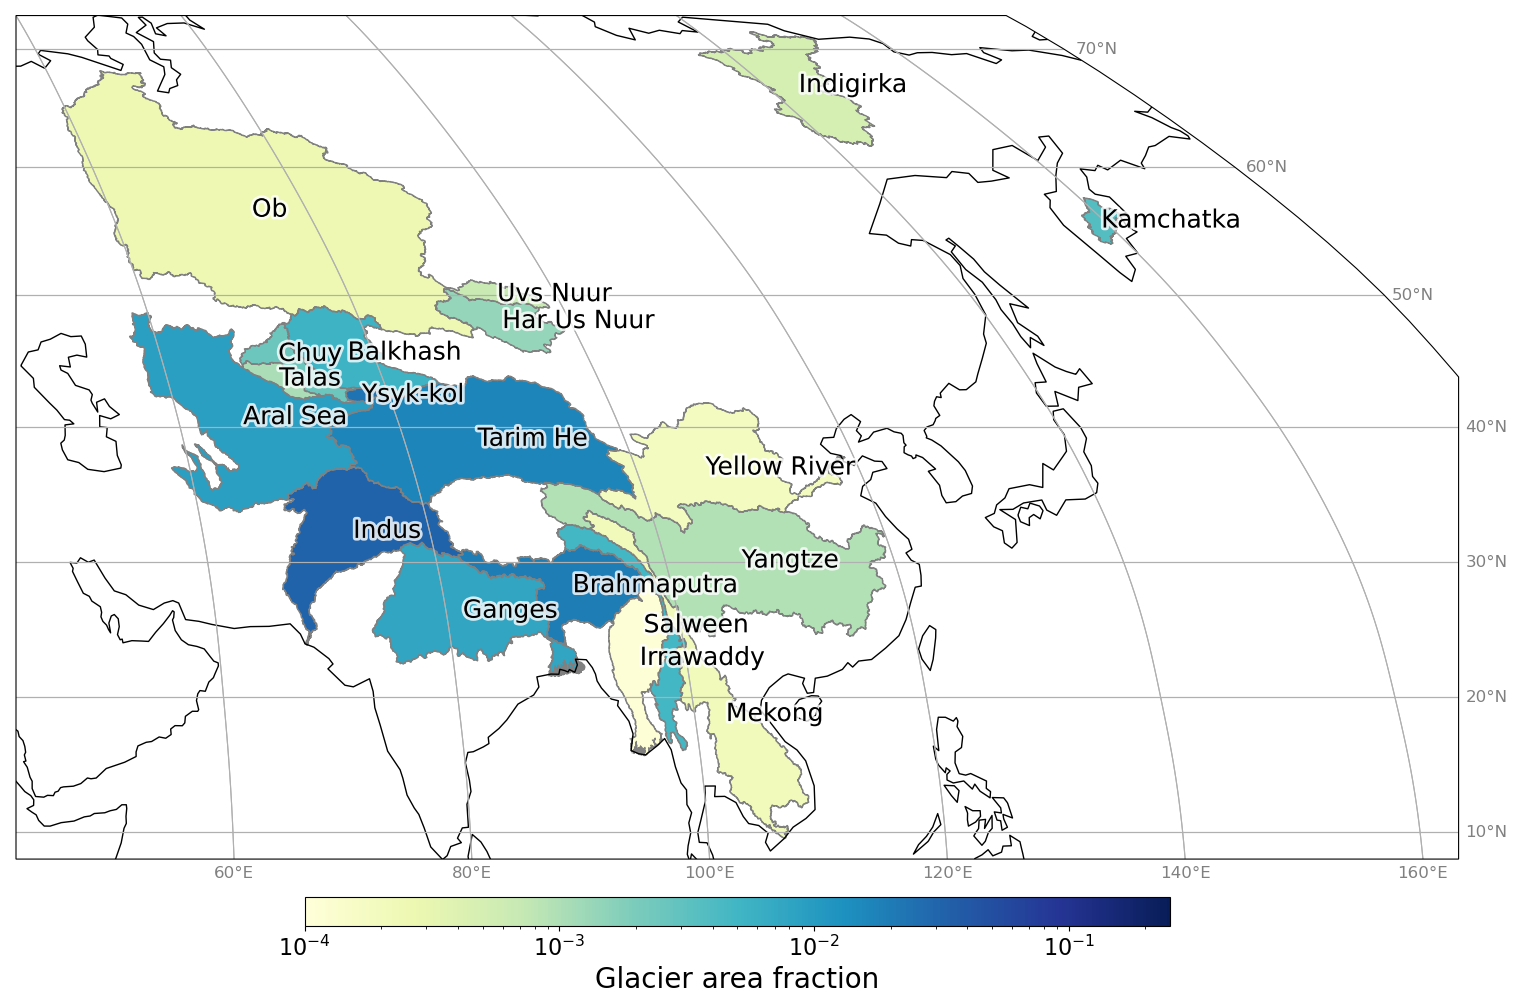
Figure A1River basins of Asia included in this study, colored by the glacier area fraction .
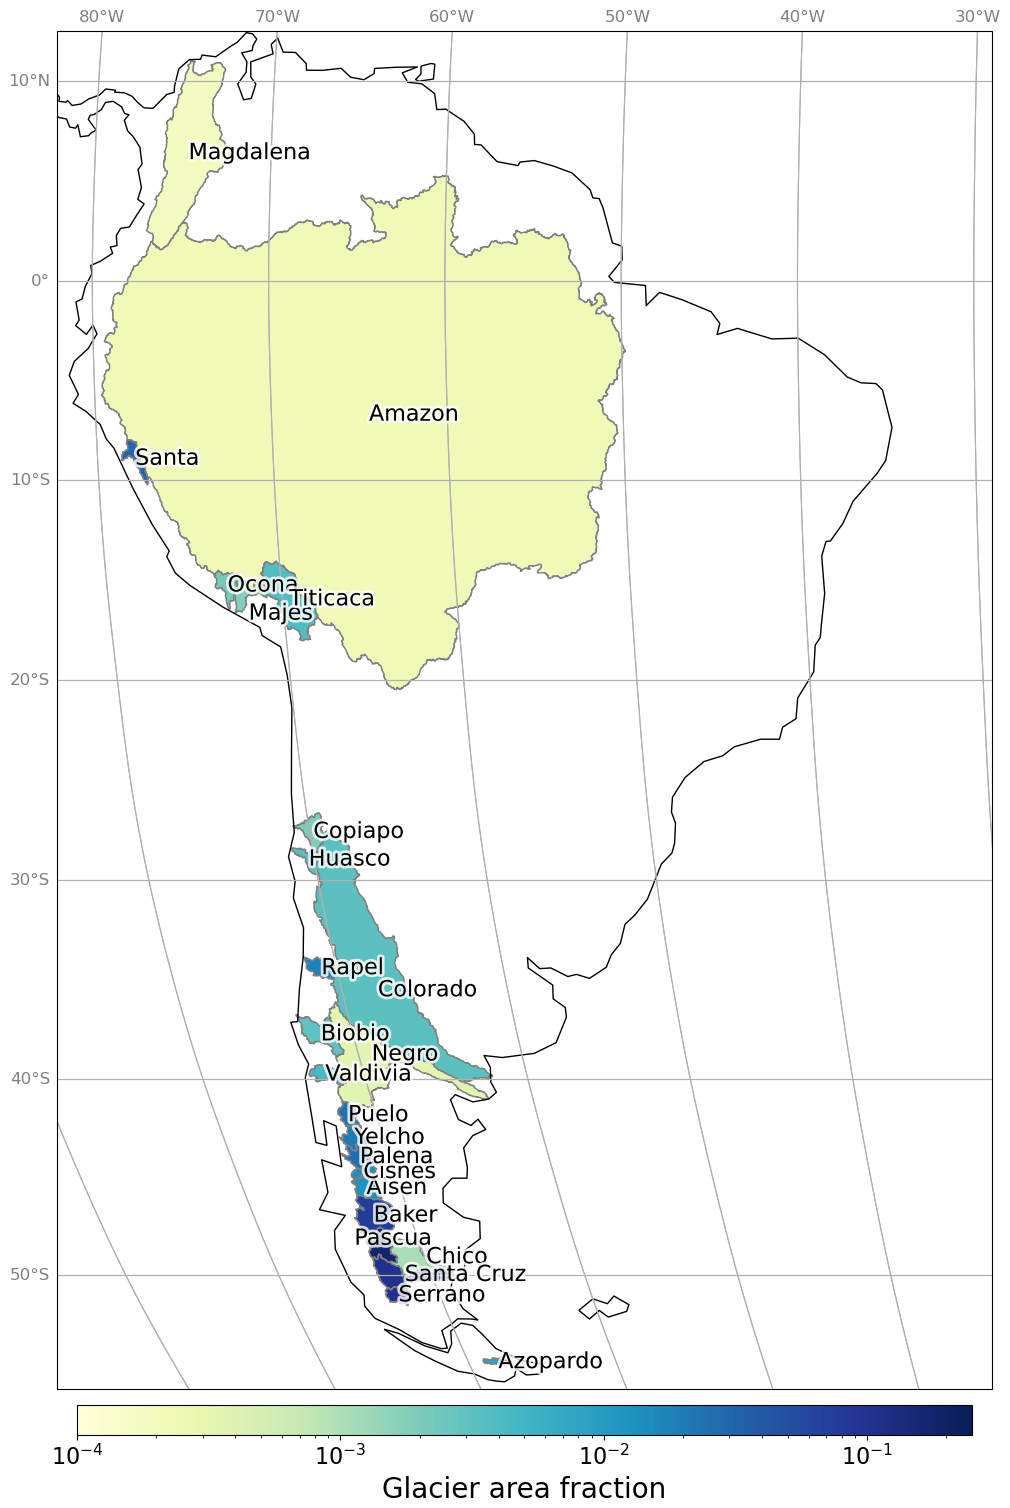
Figure A2River basins of South America included in this study, colored by the glacier area fraction .
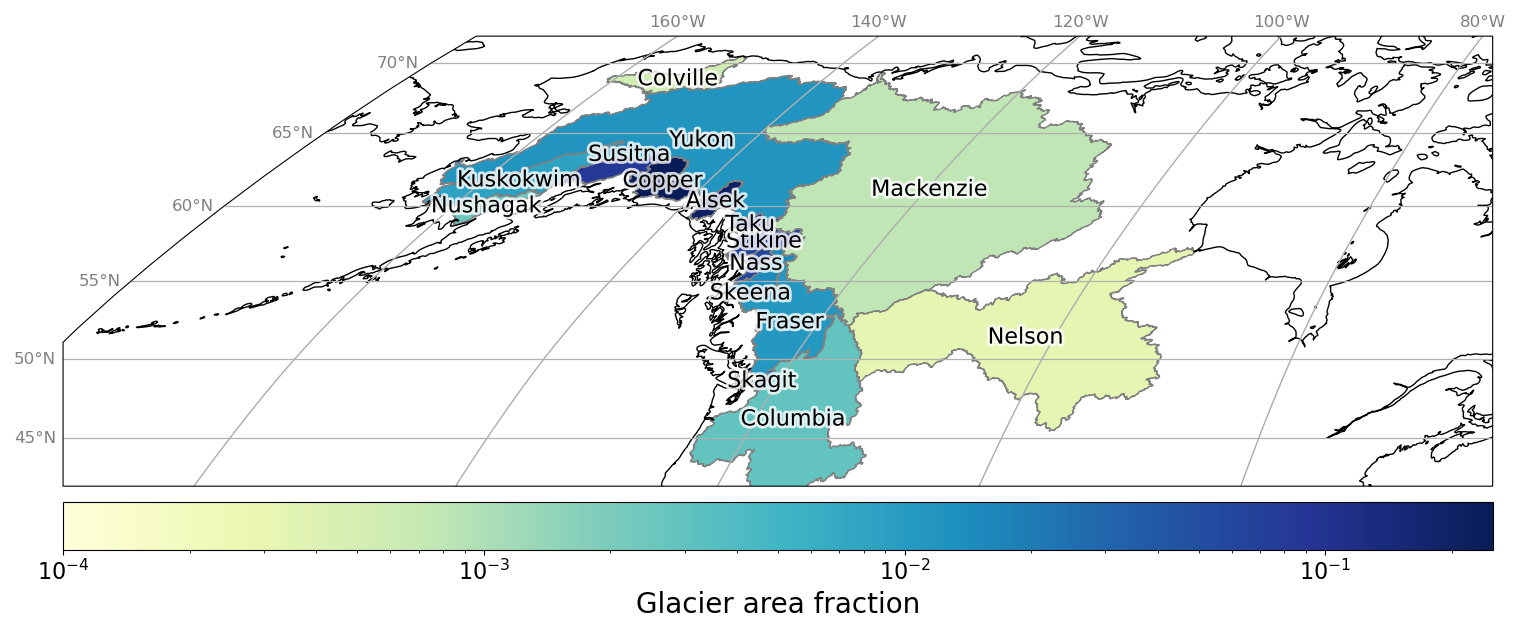
Figure A3River basins of North America included in this study, colored by the glacier area fraction .
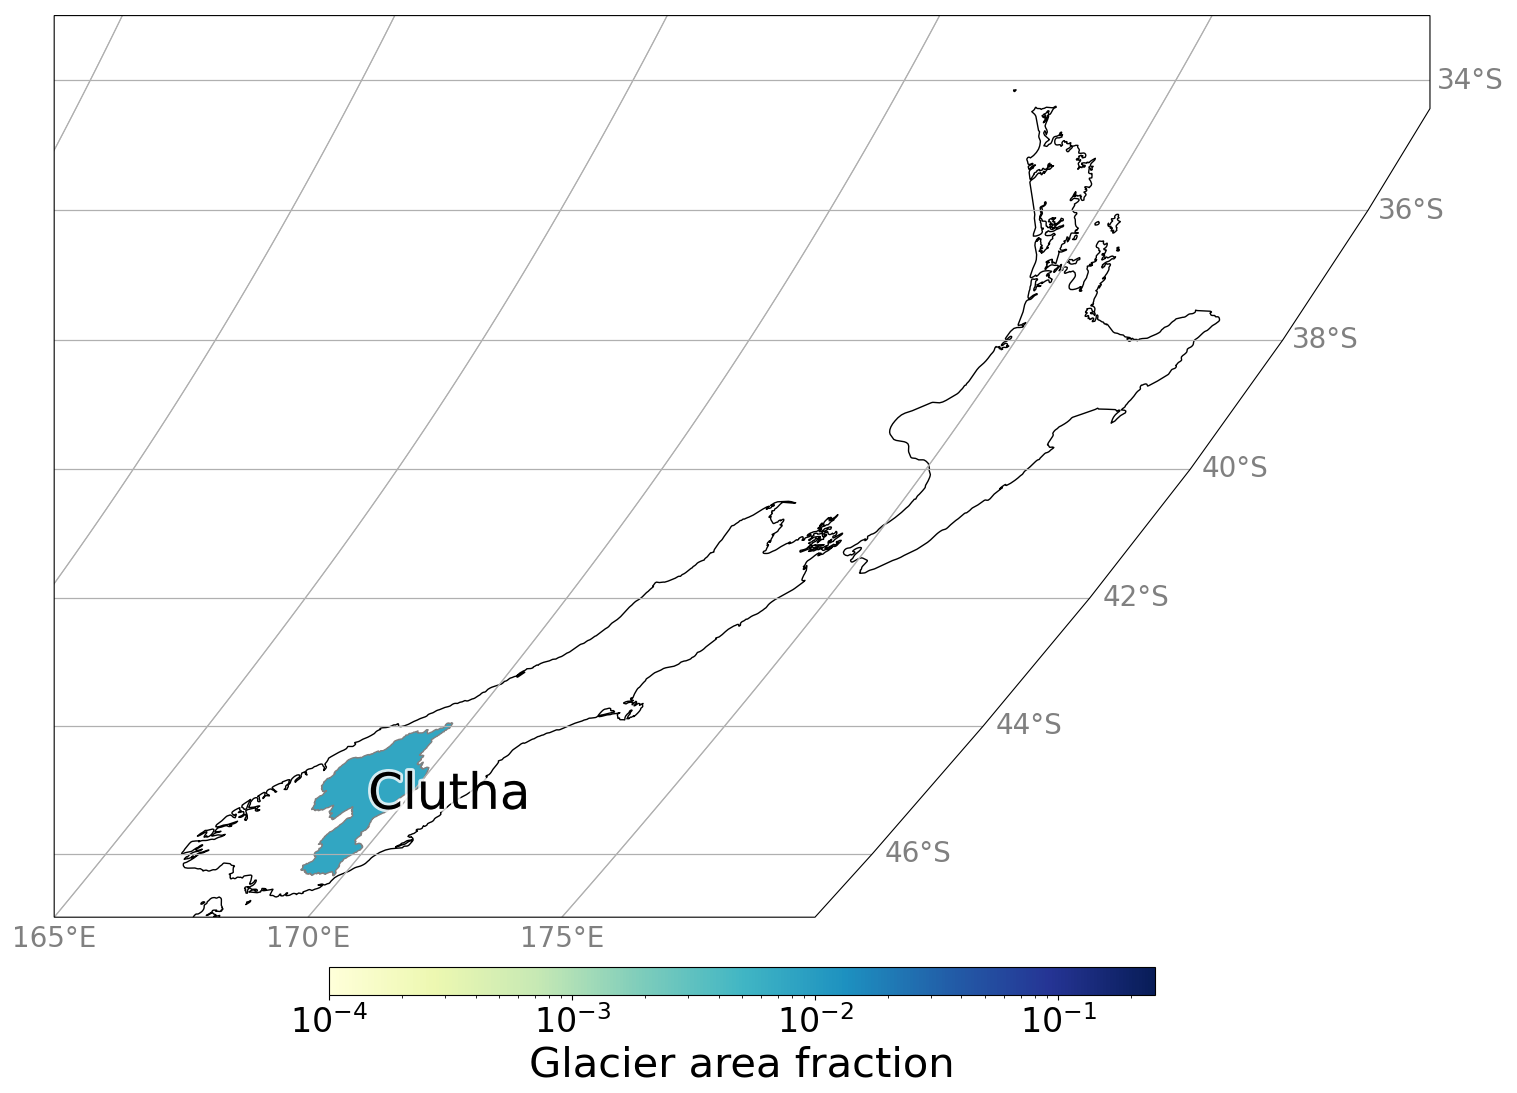
Figure A4The single New Zealand river basin included in this study, colored by the glacier area fraction .
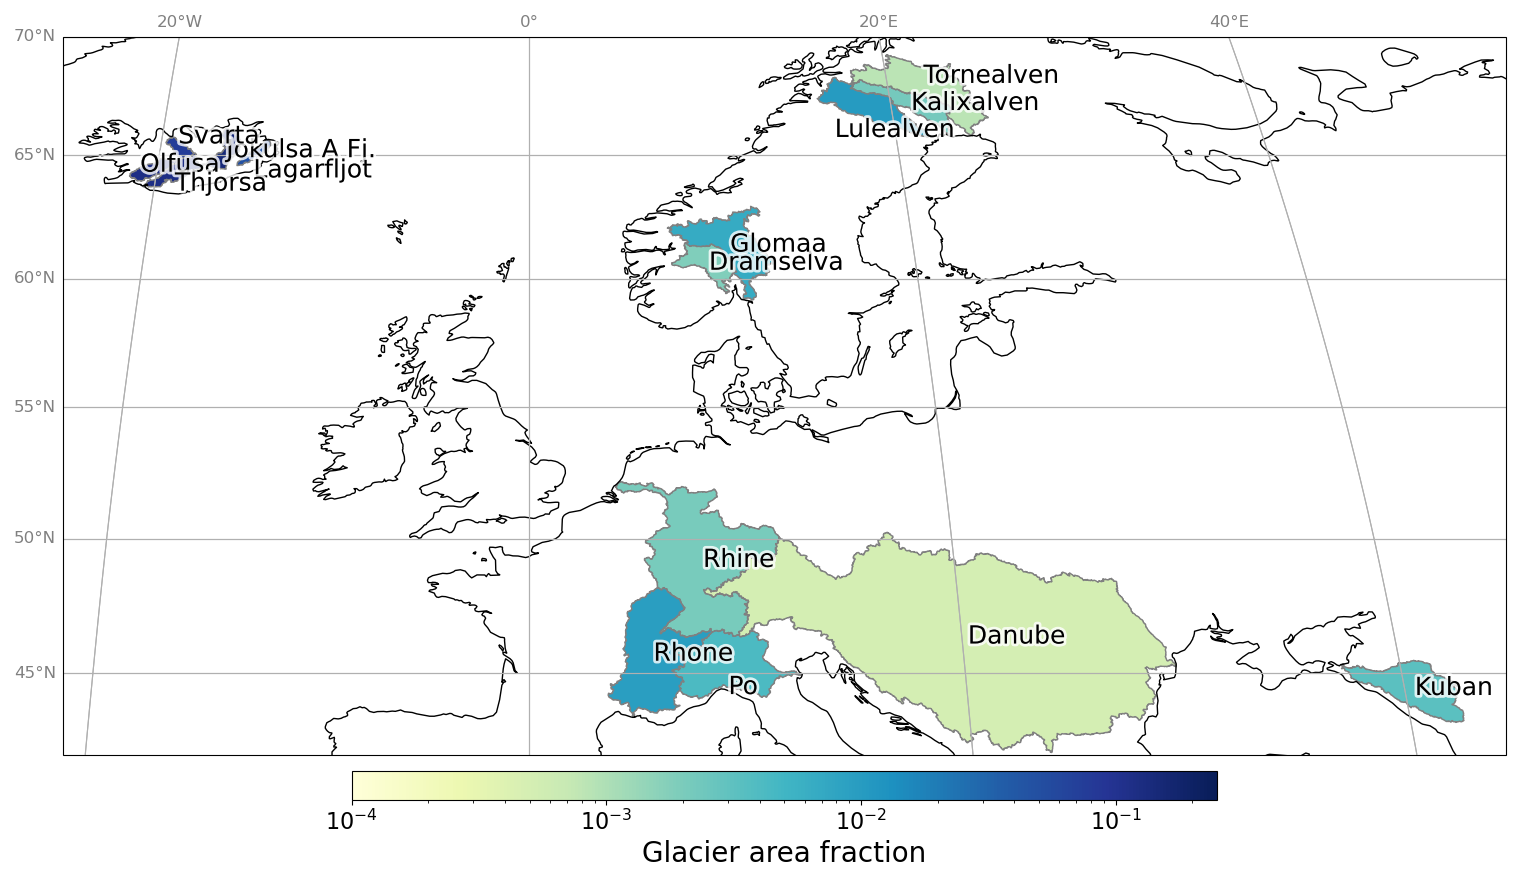
Figure A5River basins of Europe included in this study, colored by the glacier area fraction .
Table B1Summary of key features of the three glacier models used in our analysis. For more detail on glacier modelling techniques, we refer readers to Zekollari et al. (2022). For analysis of the runoff output of these three models, we refer readers to Wimberly et al. (2025).
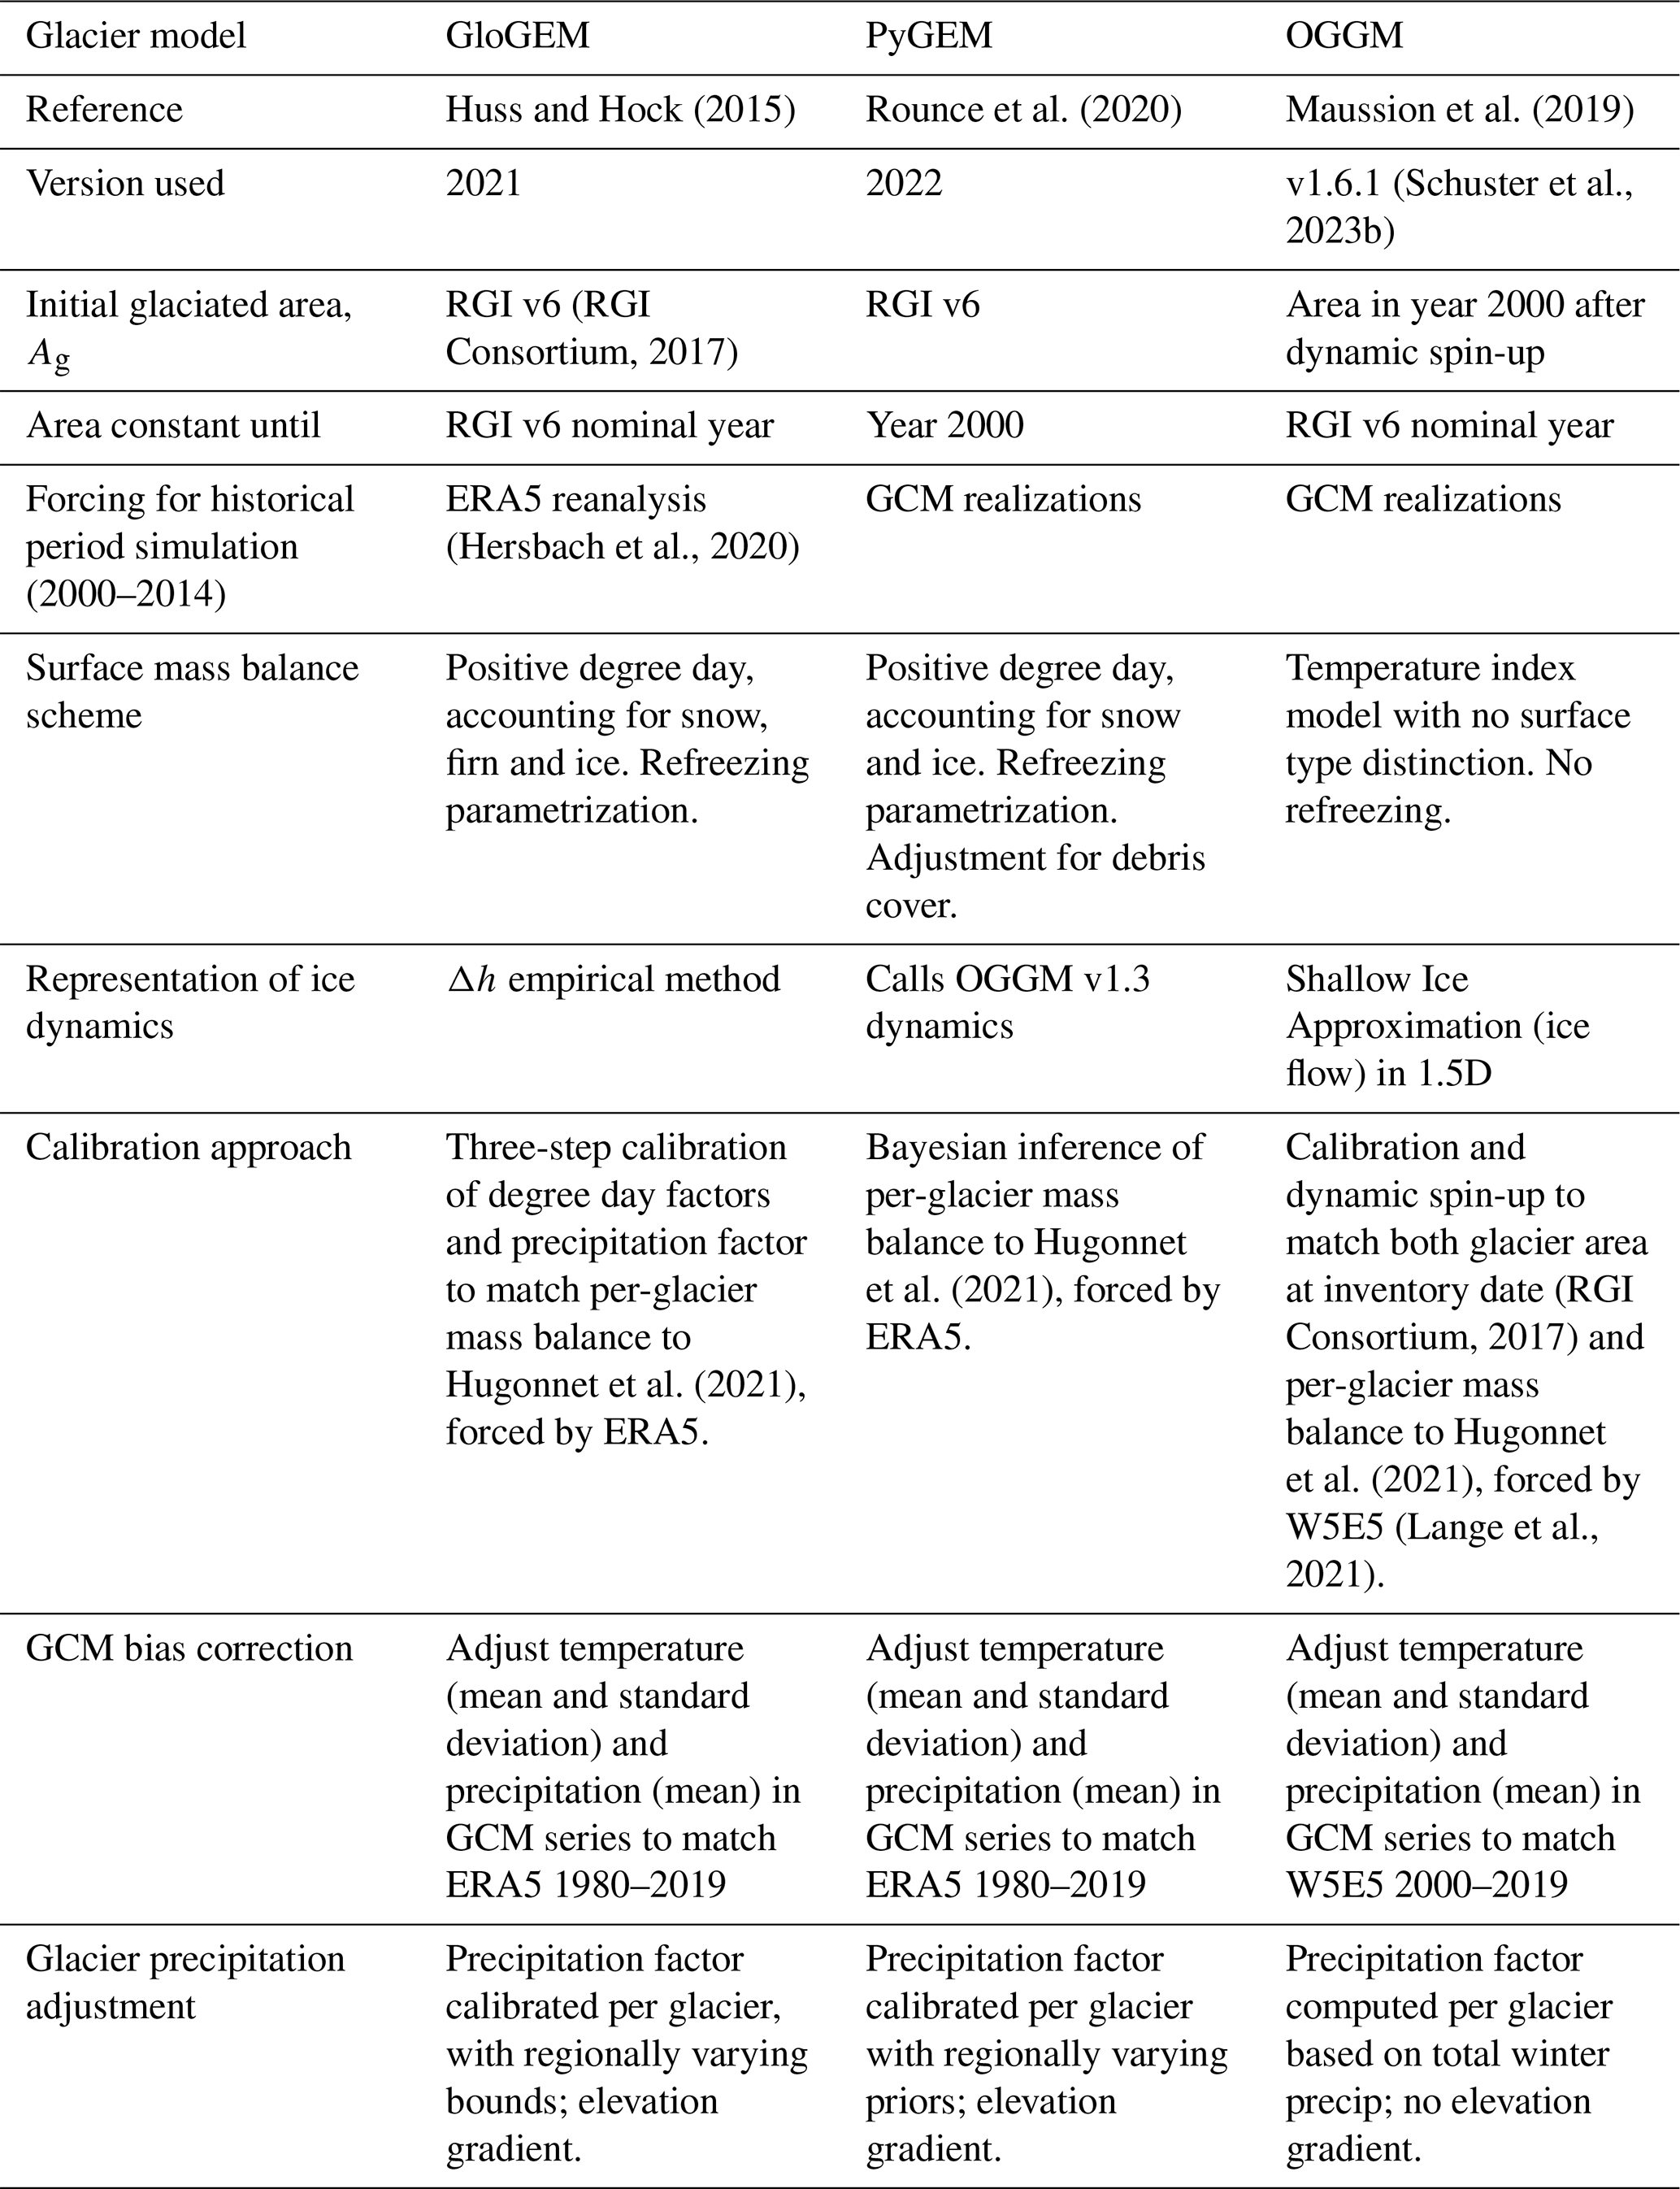
Table C1GCMs used in glacier model forcing ensemble (all r1i1p1f1 realization).
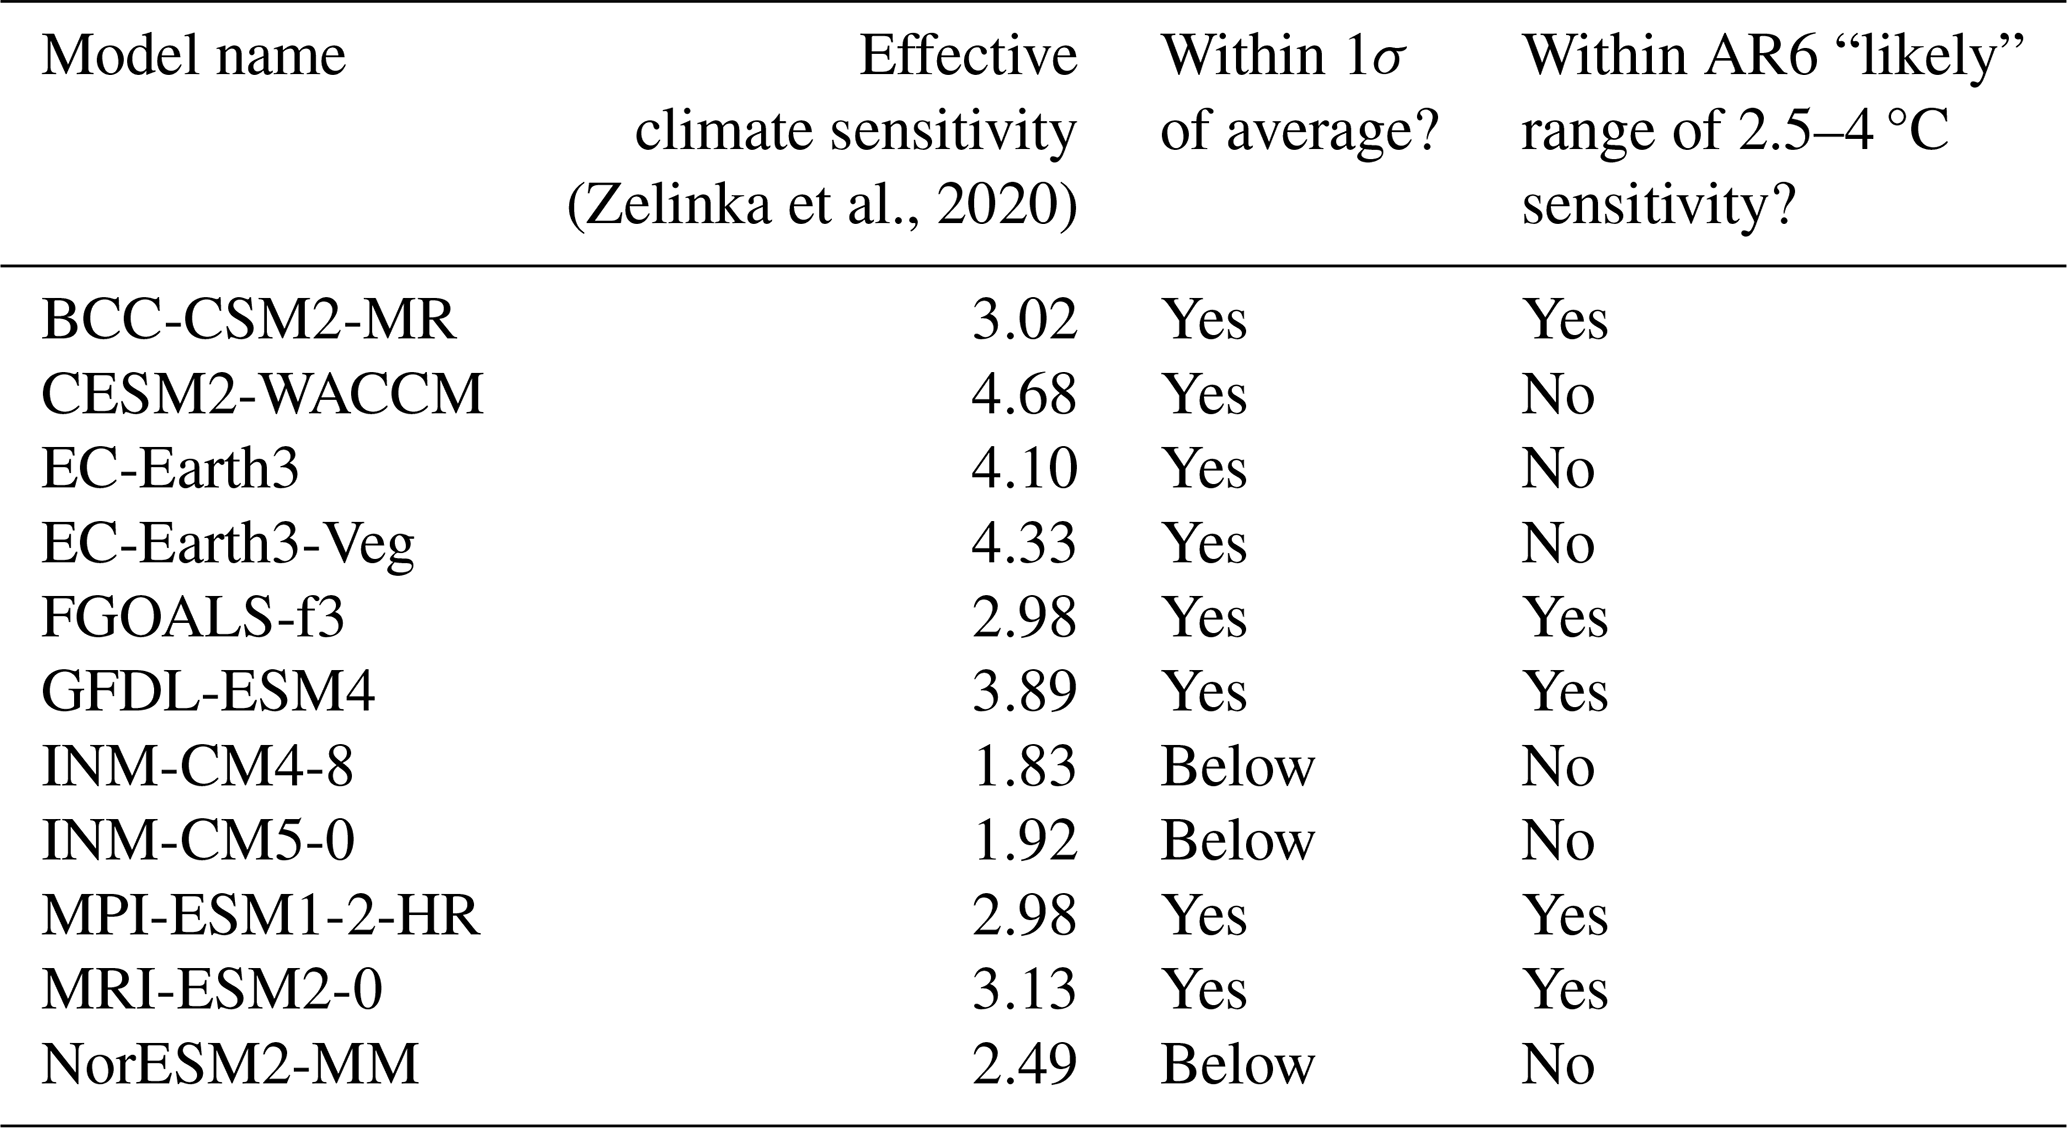
Table C2GCMs in CMIP6 archive suitable for glacial drought buffering analysis (Sect. 2.4). Effective climate sensitivity assessed for “flagship” model variant (usually r1i1p1f1 realization) by Zelinka et al. (2020) and updated in Zelinka (2022). Models not assessed by Zelinka show “–” in the climate sensitivity column. The last column indicates whether the assessed climate sensitivity for the flagship variant falls within the IPCC AR6 “likely” range, suggested by Hausfather et al. (2022) as a criterion for filtering CMIP6 simulations.
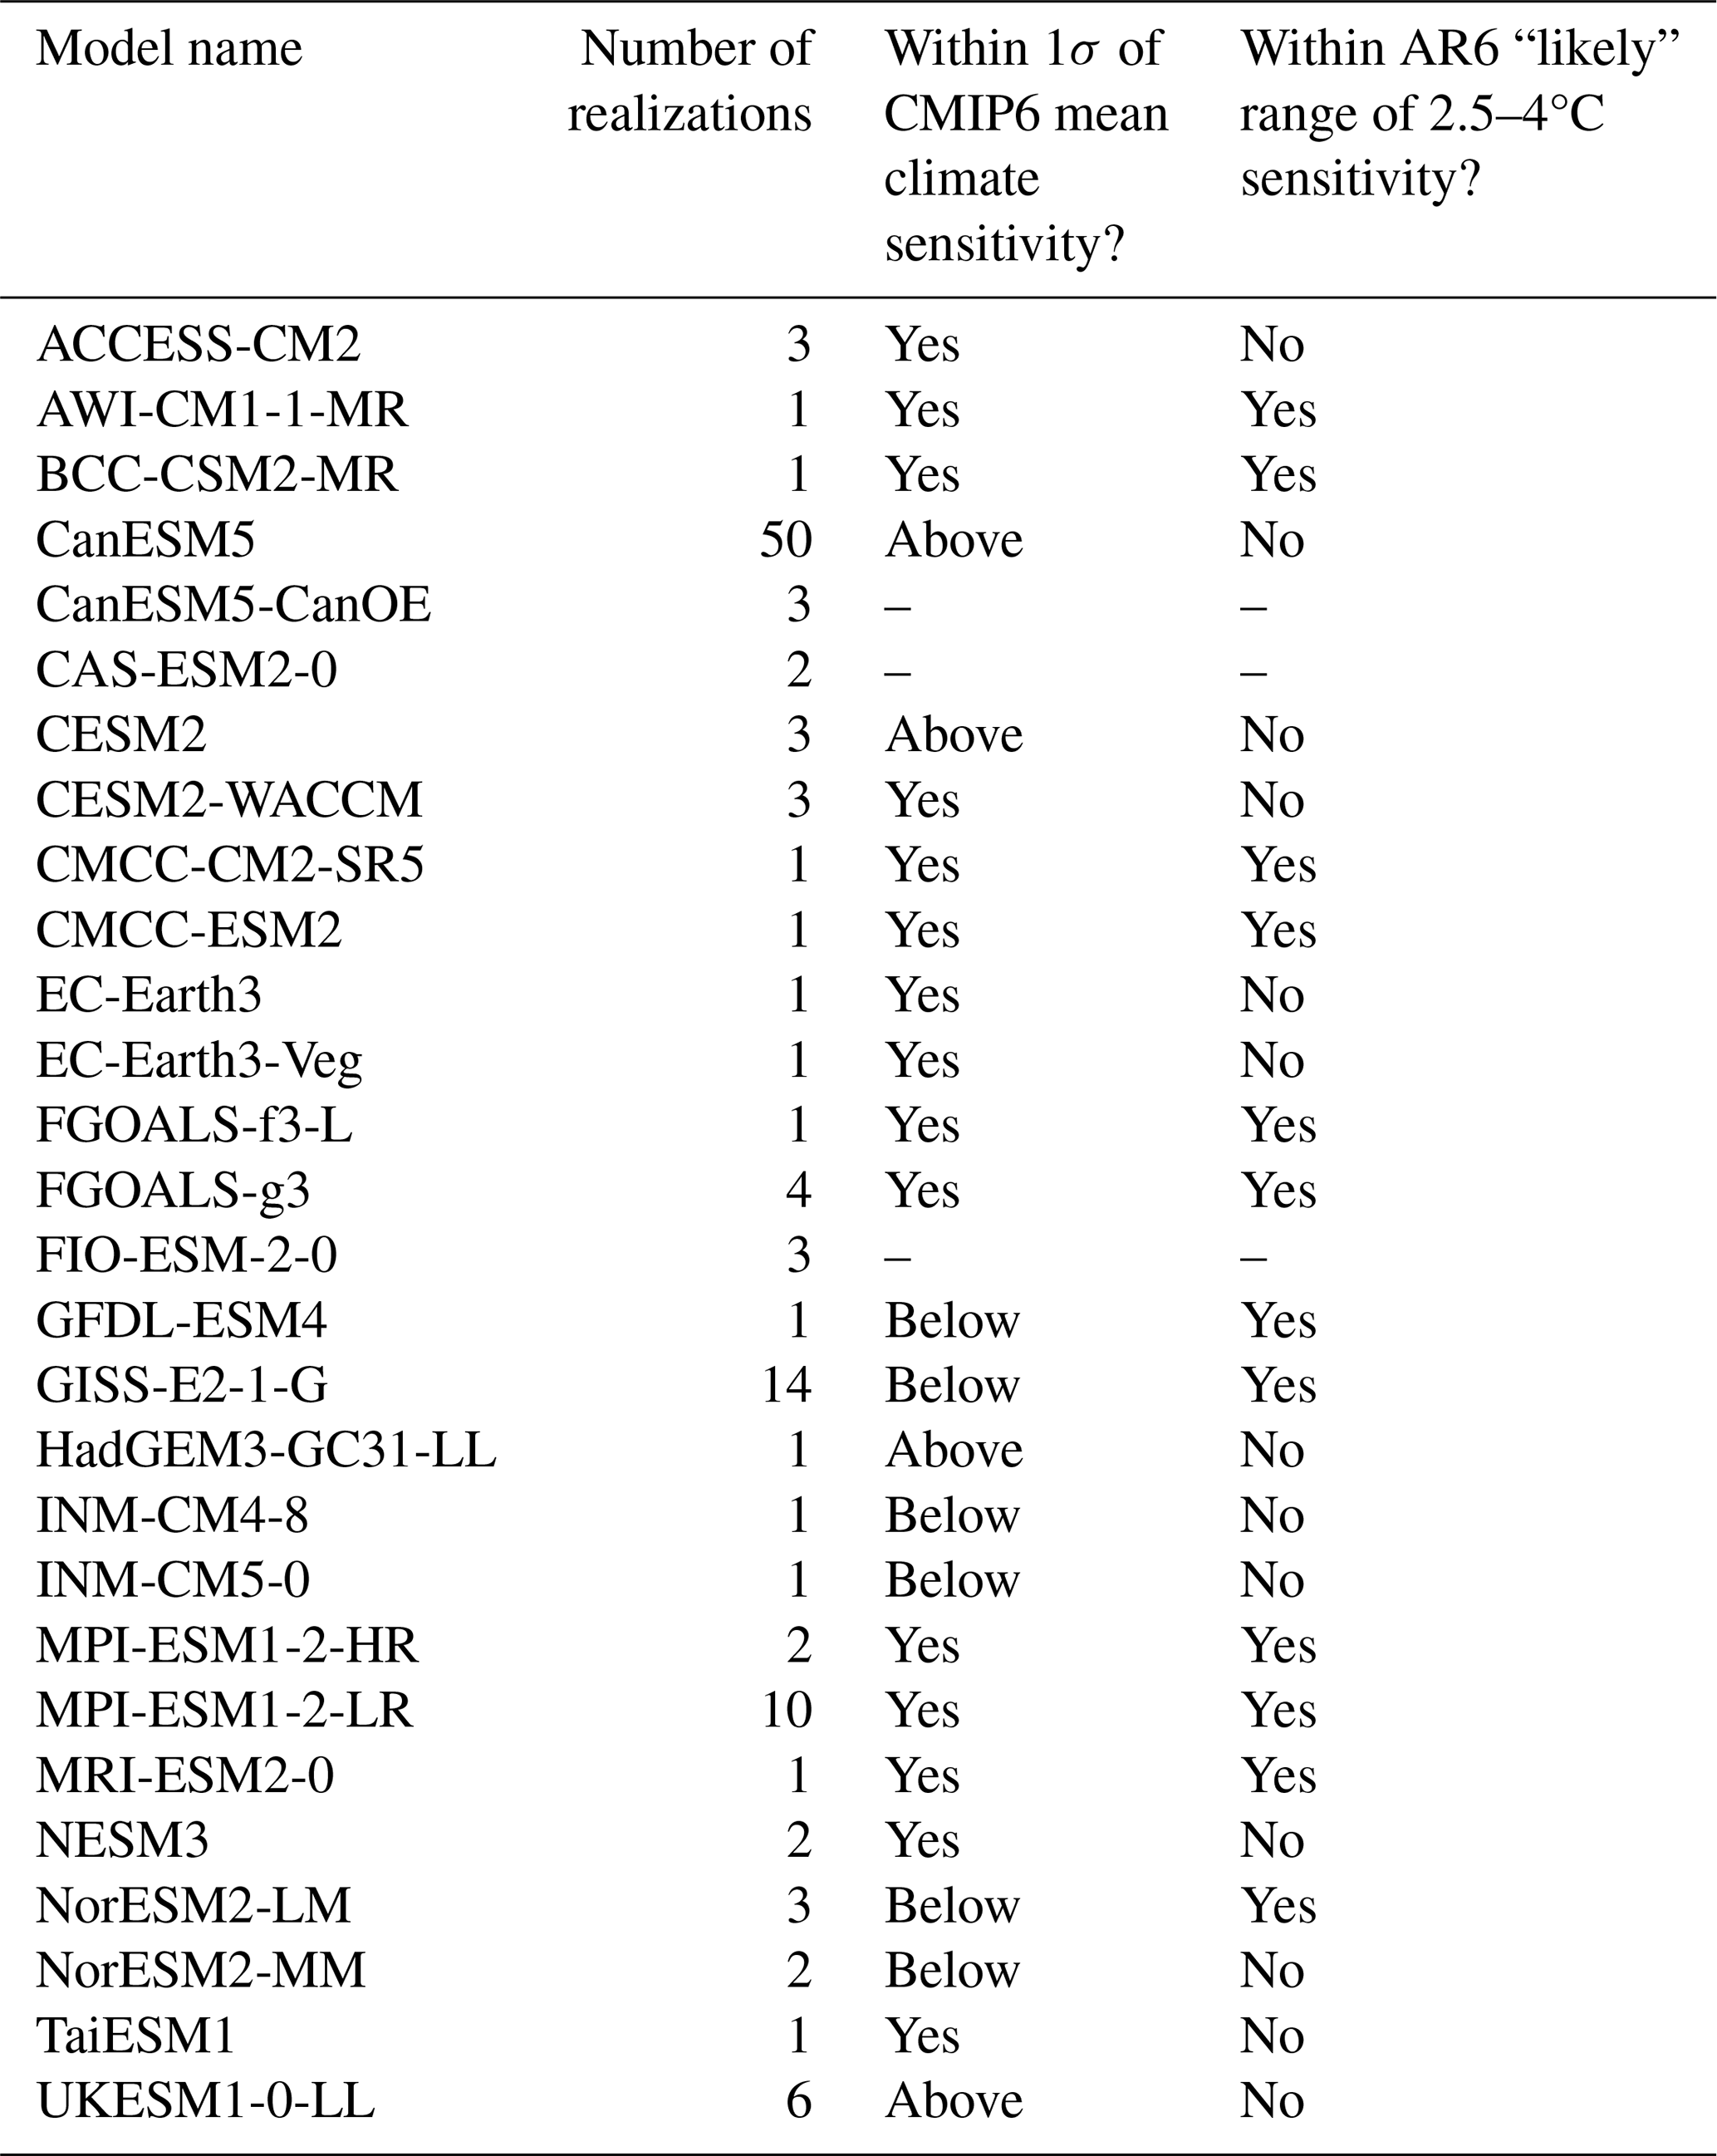
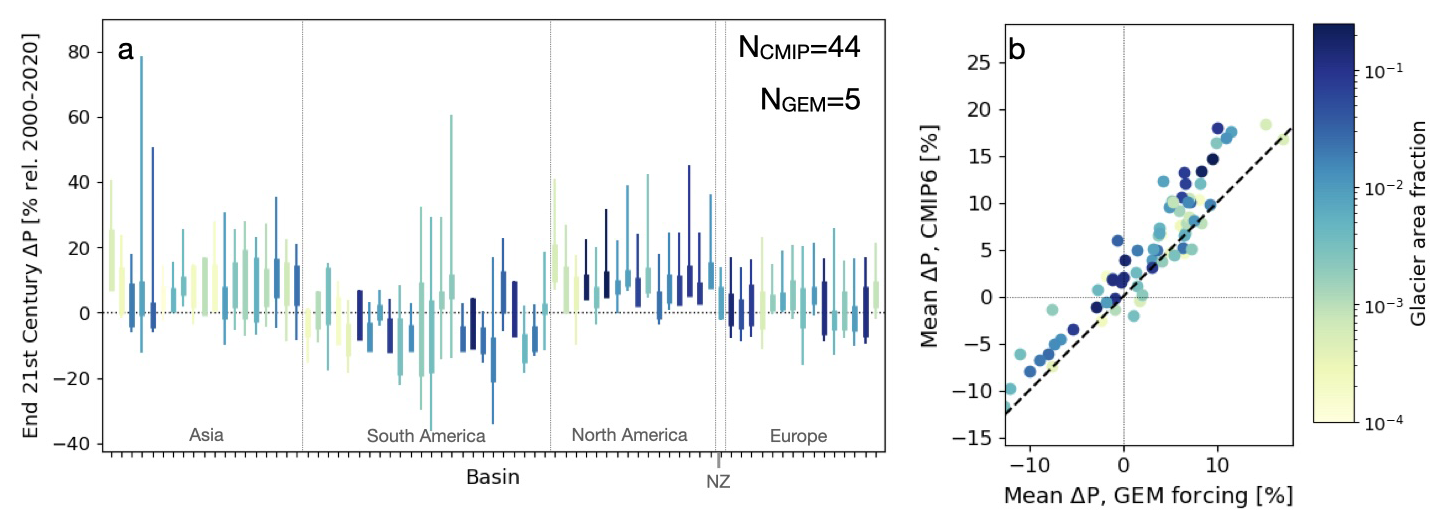
Figure C1Comparable to main text Fig. 4, but limited to models with assessed climate sensitivity within the “likely” range (Table C2). Panel (a): Spread in Late-century (2080–2100) basin-averaged precipitation anomaly for (bars) the 5 members of the glacier model forcing ensemble and (whiskers) the 44 members of the CMIP6 archive with data sufficient for SPEI. Panel (b): Ensemble means of the same variable, with the glacier model forcing ensemble mean on the x-axis and the CMIP6 ensemble mean on the y-axis; dashed black line shows 1:1 correspondence. Results are colored by basin glacier area fraction and shown in the same basin order as other figures.

Figure C2Comparable to main text Fig. 5, but limited to models with assessed climate sensitivity within the “likely” range (Table C2). Panel (a): Spread in Late-century (2080–2100) basin-averaged temperature anomaly for (bars) the 5 members of the glacier model forcing ensemble and (whiskers) the 44 members of the CMIP6 archive with data sufficient for SPEI. Panel (b): Ensemble means of the same variable, with the glacier model forcing ensemble mean on the x-axis and the CMIP6 ensemble mean on the y-axis; dashed black line shows 1:1 correspondence. Results are colored by basin glacier area fraction and shown in the same basin order as other figures.
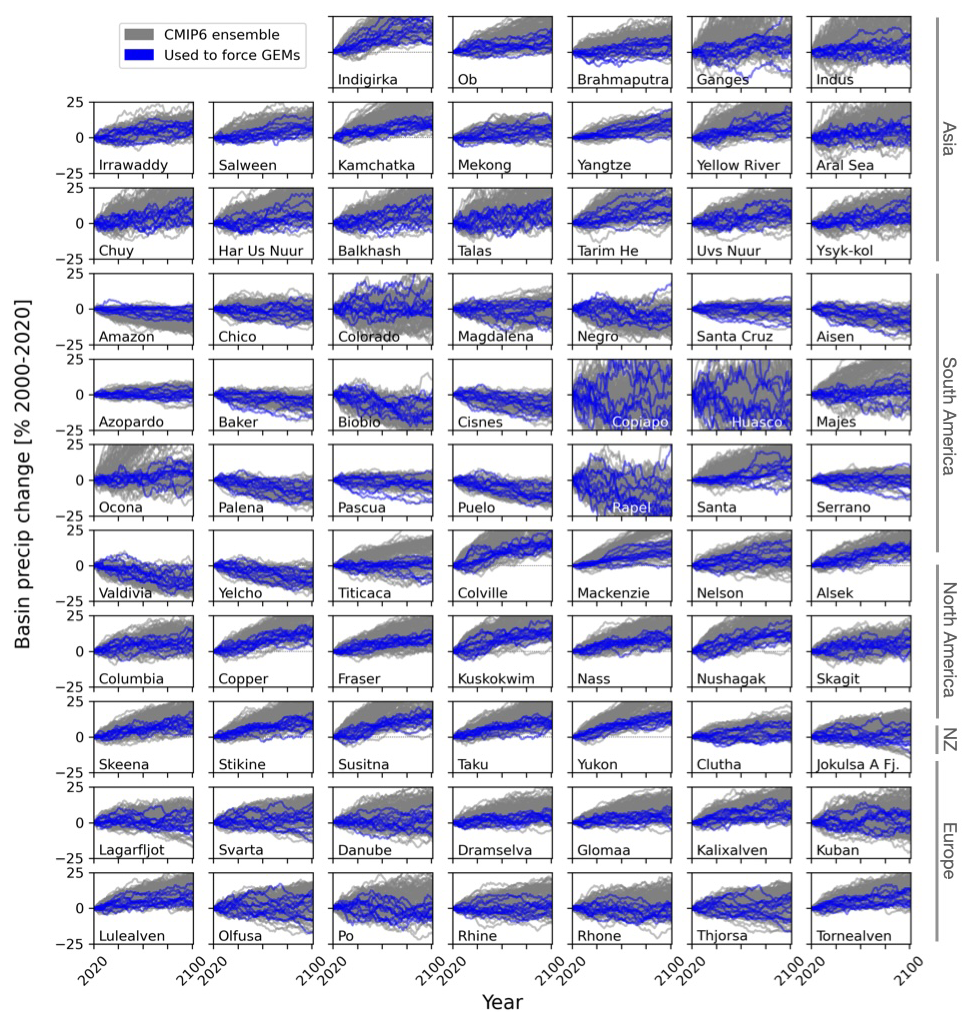
Figure D1Change in precipitation over the 21st century, forced by SSP2-4.5, for an ensemble of 123 CMIP6 simulations (grey lines) compared with the 11-member ensemble used to force the glacier models (blue lines). Changes are expressed as percent change with respect to a 2000–2020 baseline.
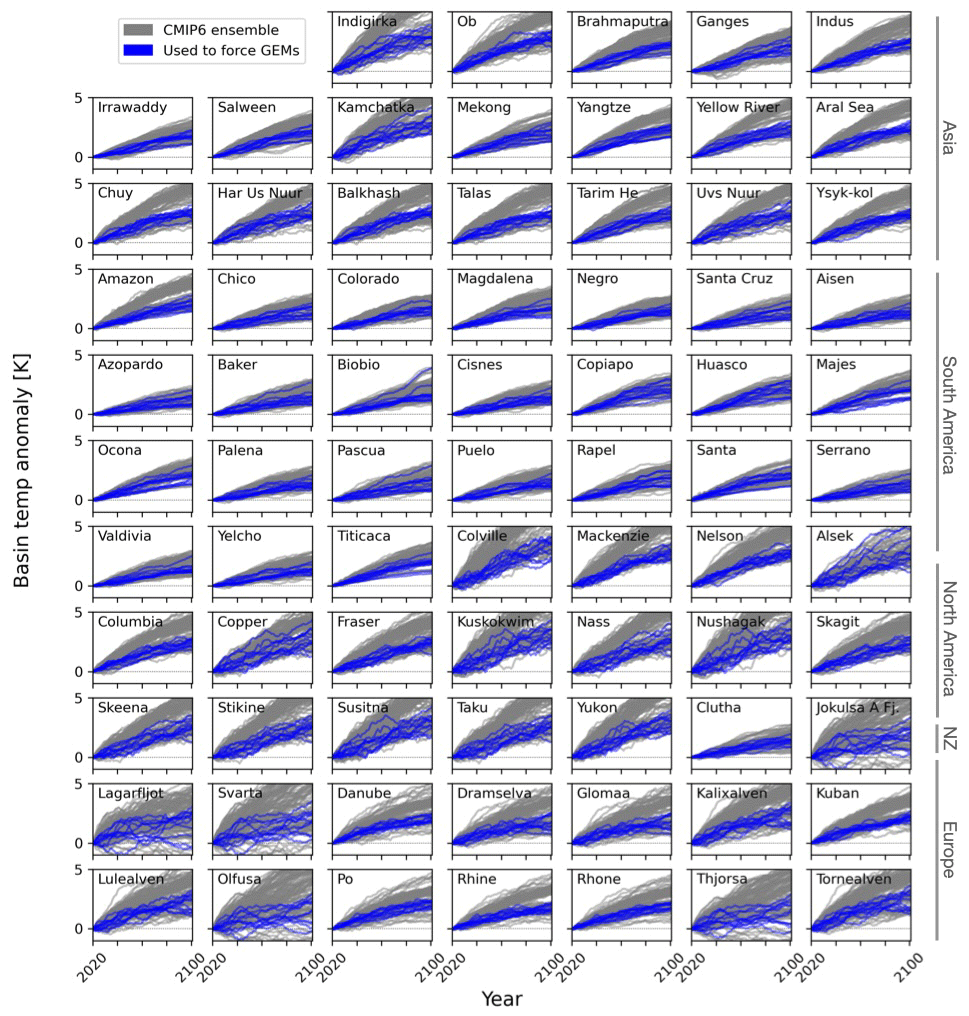
Figure D2Change in temperature over the 21st century, forced by SSP2-4.5, for an ensemble of 123 CMIP6 simulations (grey lines) compared with the 11-member ensemble used to force the glacier models (blue lines). Changes are temperature anomaly (K) from a 2000–2020 baseline.
The glacier model runoff aggregated to basin scale is archived as Wimberly (2024). The OGGM standard runoff projections are a variant of Schuster et al. (2023b). The PyGEM runoff projections are archived as Rounce et al. (2022). The code for our analysis is available on GitHub and archived on Zenodo (https://doi.org/10.5281/zenodo.6510185, Ultee et al., 2022b).
LU conceived of the study. SC and JM consulted on methodology. FW and EH conducted related analyses that informed the methods. FW aggregated and processed all glacier model data. SC aggregated global climate model data and computed SPEI values. LU and FW made figures. LU drafted the manuscript, and all authors edited and approved its final form.
The contact author has declared that none of the authors has any competing interests.
Publisher's note: Copernicus Publications remains neutral with regard to jurisdictional claims made in the text, published maps, institutional affiliations, or any other geographical representation in this paper. The authors bear the ultimate responsibility for providing appropriate place names. Views expressed in the text are those of the authors and do not necessarily reflect the views of the publisher.
The authors thank the developer teams of the glacier models GloGEM, PyGEM, and OGGM for their efforts in providing runoff outputs and discussing interpretation. Lilian Schuster completed and archived the public OGGM simulations studied here. Brandon Tober completed the PyGEM simulations. Matthias Huss completed the GloGEM simulations.
This research has been supported by the Natural Environment Research Council (grant no. NE/W004895/1).
This paper was edited by Brice Noël and reviewed by two anonymous referees.
Adhikari, R. K., Yilmaz, A. G., Mainali, B., and Dyson, P.: Performance evaluation of CMIP6 models for application to hydrological modelling studies – A case study of Australia, Science of The Total Environment, 945, 174 015, https://doi.org/10.1016/j.scitotenv.2024.174015, 2024. a
Aguayo, R., Maussion, F., Schuster, L., Schaefer, M., Caro, A., Schmitt, P., Mackay, J., Ultee, L., Leon-Muñoz, J., and Aguayo, M.: Unravelling the sources of uncertainty in glacier runoff projections in the Patagonian Andes (40–56° S), The Cryosphere, 18, 5383–5406, https://doi.org/10.5194/tc-18-5383-2024, 2024. a, b, c, d, e, f
Ault, T. R.: On the essentials of drought in a changing climate, Science, 368, 256–260, https://doi.org/10.1126/science.aaz5492, 2020. a, b
Azad, N. and Ahmadi, A.: Assessment of CMIP6 models and multi-model averaging for temperature and precipitation over Iran, Scientific Reports, 14, 24165, https://doi.org/10.1038/s41598-024-74789-4, 2024. a
Caretta, M. A., Mukherji, A., Arfanuzzaman, M., Betts, R. A., Gelfan, A., Hirabayashi, Y., Lissner, T. K., Liu, J., Gunn, E. L., Morgan, R., Mwanga, S., and Supratid, S.: Water, in: Climate Change 2022: Impacts, Adaptation and Vulnerability. Contribution of Working Group II to the Sixth Assessment Report of the Intergovernmental Panel on Climate Change, edited by: Pörtner, H.-O., Roberts, D., Tignor, M., Poloczanska, E., Mintenbeck, K., Alegría, A., Craig, M., Langsdorf, S., Löschke, S., Möller, V., Okem, A., and Rama, B., 551–712, Cambridge University Press, Cambridge, UK and New York, NY, USA, https://doi.org/10.1017/9781009325844.006, 2022. a, b
Chen, J. and Ohmura, A.: On the influence of Alpine glaciers on runoff, IAHS Publication, 193, 117–125, 1990. a, b
Compagno, L., Huss, M., Miles, E. S., McCarthy, M. J., Zekollari, H., Dehecq, A., Pellicciotti, F., and Farinotti, D.: Modelling supraglacial debris-cover evolution from the single-glacier to the regional scale: an application to High Mountain Asia, The Cryosphere, 16, 1697–1718, https://doi.org/10.5194/tc-16-1697-2022, 2022. a, b
Cook, B. I., Smerdon, J. E., Seager, R., and Coats, S.: Global warming and 21st century drying, Climate Dynamics, 43, 2607–2627, https://doi.org/10.1007/s00382-014-2075-y, 2014. a, b
Cook, B. I., Mankin, J. S., Marvel, K., Williams, A. P., Smerdon, J. E., and Anchukaitis, K. J.: Twenty-first century drought projections in the CMIP6 forcing scenarios, Earth's Future, e2019EF001461, https://doi.org/10.1029/2019EF001461, 2020. a
Danandeh Mehr, A. and Vaheddoost, B.: Identification of the trends associated with the SPI and SPEI indices across Ankara, Turkey, Theoretical and Applied Climatology, 139, 1531–1542, https://doi.org/10.1007/s00704-019-03071-9, 2020. a
Decharme, B., Delire, C., Minvielle, M., Colin, J., Vergnes, J.-P., Alias, A., Saint-Martin, D., Séférian, R., Sénési, S., and Voldoire, A.: Recent changes in the ISBA-CTRIP land surface system for use in the CNRM-CM6 climate model and in global off-line hydrological applications, Journal of Advances in Modeling Earth Systems, 11, 1207–1252, https://doi.org/10.1029/2018MS001545, 2019. a
Deser, C., Lehner, F., Rodgers, K. B., Ault, T., Delworth, T. L., DiNezio, P. N., Fiore, A., Frankignoul, C., Fyfe, J. C., Horton, D. E., Kay, J. E., Knutti, R., Lovenduski, N. S., Marotzke, J., McKinnon, K. A., Minobe, S., Randerson, J., Screen, J. A., Simpson, I. R., and Ting, M.: Insights from Earth system model initial-condition large ensembles and future prospects, Nature Climate Change, 10, 277–286, https://doi.org/10.1038/s41558-020-0731-2, 2020. a
Douville, H., Raghavan, K., Renwick, J., Allan, R. P., Arias, P. A., Barlow, M., Cerezo-Mota, R., Cherchi, A., Gan, T. Y., Gergis, J., Jiang, D., Khan, A., Mba, W. P., Rosenfeld, D., Tierney, J., and Zolina, O.: Water cycle changes, in: Climate Change 2021: The Physical Science Basis, Contribution of Working Group I to the Sixth Assessment Report of the Intergovernmental Panel on Climate Change, edited by: Masson-Delmotte, V. P., Zhai, P., Pirani, A., Connors, S. L., Péan, C., Berger, S., Caud, N., Chen, Y., Goldfarb, L., Gomis, M. I., Huang, M., Leitzell, K., Lonno, E., Matthews, J. B. R., Maycock, T. K., Waterfield, T., Yelekçi, O., Yu, R., and Zhou, B., 1055–1210, Cambridge University Press, Cambridge, UK, https://doi.org/10.1017/9781009157896.010, 2021. a
Eyring, V., Bony, S., Meehl, G. A., Senior, C. A., Stevens, B., Stouffer, R. J., and Taylor, K. E.: Overview of the Coupled Model Intercomparison Project Phase 6 (CMIP6) experimental design and organization, Geoscientific Model Development, 9, 1937–1958, https://doi.org/10.5194/gmd-9-1937-2016, 2016. a, b, c
Farahmand, A. and AghaKouchak, A.: A generalized framework for deriving nonparametric standardized drought indicators, Advances in Water Resources, 76, 140–145, https://doi.org/10.1016/j.advwatres.2014.11.012, 2015. a, b, c
Fleming, S. W. and Clarke, G. K.: Attenuation of High-Frequency Interannual Streamflow Variability by Watershed Glacial Cover, Journal of Hydraulic Engineering, 131, 615–618, https://doi.org/10.1061/(ASCE)0733-9429(2005)131:7(615), 2005. a
Global Runoff Data Centre: GRDC Major River Basins, https://grdc.bafg.de/products/basin_layers/major_rivers/ (last access: 23 February 2026), 2020. a
Goosse, H., Barriat, P.-Y., Dalaiden, Q., Klein, F., Marzeion, B., Maussion, F., Pelucchi, P., and Vlug, A.: Testing the consistency between changes in simulated climate and Alpine glacier length over the past millennium, Climate of the Past, 14, 1119–1133, https://doi.org/10.5194/cp-14-1119-2018, 2018. a
Hanus, S., Schuster, L., Burek, P., Maussion, F., Wada, Y., and Viviroli, D.: Coupling a large-scale glacier and hydrological model (OGGM v1.5.3 and CWatM V1.08) – towards an improved representation of mountain water resources in global assessments, Geoscientific Model Development, 17, 5123–5144, https://doi.org/10.5194/gmd-17-5123-2024, 2024. a, b, c
Hausfather, Z., Marvel, K., Schmidt, G. A., Nielsen-Gammon, J., and Zelinka, M.: Climate simulations: recognize the “hot model” problem, Nature, 605, 26–29, https://doi.org/10.1038/d41586-022-01192-2, 2022. a, b, c
Hersbach, H., Bell, B., Berrisford, P., Hirahara, S., Horányi, A., Muñoz-Sabater, J., Nicolas, J., Peubey, C., Radu, R., Schepers, D., Simmons, A., Soci, C., Abdalla, S., Abellan, X., Balsamo, G., Bechtold, P., Biavati, G., Bidlot, J., Bonavita, M., De Chiara, G., Dahlgren, P., Dee, D., Diamantakis, M., Dragani, R., Flemming, J., Forbes, R., Fuentes, M., Geer, A., Haimberger, L., Healy, S., Hogan, R. J., Hólm, E., Janisková, M., Keeley, S., Laloyaux, P., Lopez, P., Lupu, C., Radnoti, G., de Rosnay, P., Rozum, I., Vamborg, F., Villaume, S., and Thépaut, J.-N.: The ERA5 global reanalysis, Quarterly Journal of the Royal Meteorological Society, 146, 1999–2049, https://doi.org/10.1002/qj.3803, 2020. a
Hock, R., Bliss, A., Marzeion, B., Giesen, R. H., Hirabayashi, Y., Huss, M., Radić, V., and Slangen, A. B.: GlacierMIP – A model intercomparison of global-scale glacier mass-balance models and projections, Journal of Glaciology, 65, 453–467, https://doi.org/10.1017/jog.2019.22, 2019. a
Holmgren, E.: 21st century glacier runoff and how it buffers drought in 75 21st centry glacier runoff and how it buffers drought in 75 large-scale basins, Master's thesis, University of Innsbruck, urn:nbn:at:at-ubi:1-107739, 2022. a
Hugonnet, R., McNabb, R., Berthier, E., Menounos, B., Nuth, C., Girod, L., Farinotti, D., Huss, M., Dussaillant, I., Brun, F., and Kääb, A.: Accelerated global glacier mass loss in the early twenty-first century, Nature, 592, 726–731, https://doi.org/10.1038/s41586-021-03436-z, 2021. a, b, c, d
Huong, N. T., Kim, Y.-T., and Kwon, H.-H.: Evaluation and selection of CMIP6 GCMs for long-term hydrological projections based on spatial performance assessment metrics across South Korea, Journal of Water and Climate Change, 14, 2663–2679, https://doi.org/10.2166/wcc.2023.021, 2023. a
Huss, M. and Hock, R.: A new model for global glacier change and sea-level rise, Frontiers in Earth Science, 3, https://doi.org/10.3389/feart.2015.00054, 2015. a, b, c, d
Huss, M. and Hock, R.: Global-scale hydrological response to future glacier mass loss, Nature Climate Change, 8, 135–140, https://doi.org/10.1038/s41558-017-0049-x, 2018. a, b, c, d
Immerzeel, W. W., Lutz, A. F., Andrade, M., Bahl, A., Biemans, H., Bolch, T., Hyde, S., Brumby, S., Davies, B. J., Elmore, A. C., Emmer, A., Feng, M., Fernández, A., Haritashya, U., Kargel, J. S., Koppes, M., Kraaijenbrink, P. D. A., Kulkarni, A. V., Mayewski, P. A., Nepal, S., Pacheco, P., Painter, T. H., Pellicciotti, F., Rajaram, H., Rupper, S., Sinisalo, A., Shrestha, A. B., Viviroli, D., Wada, Y., Xiao, C., Yao, T., and Baillie, J. E. M.: Importance and vulnerability of the world's water towers, Nature, 577, 364–369, https://doi.org/10.1038/s41586-019-1822-y, 2020. a
Kumar, A., Gosling, S. N., Johnson, M. F., Jones, M. D., Zaherpour, J., Kumar, R., Leng, G., Schmied, H. M., Kupzig, J., Breuer, L., Hanasaki, N., Tang, Q., Ostberg, S., Stacke, T., Pokhrel, Y., Wada, Y., and Masaki, Y.: Multi-model evaluation of catchment- and global-scale hydrological model simulations of drought characteristics across eight large river catchments, Advances in Water Resources, 165, 104212, https://doi.org/10.1016/j.advwatres.2022.104212, 2022. a
Lange, S., Menz, C., Gleixner, S., Cucchi, M., Weedon, G. P., Amici, A., Bellouin, N., Müller Schmied, H., Hersbach, H., Buontempo, C., and Cagnazzo, C.: WFDE5 over land merged with ERA5 over the ocean (W5E5 v2.0), ISIMIP Repository, https://doi.org/10.48364/ISIMIP.342217, 2021. a
Lawrence, D. M., Fisher, R. A., Koven, C. D., Oleson, K. W., Swenson, S. C., Bonan, G., Collier, N., Ghimire, B., van Kampenhout, L., Kennedy, D., Kluzek, E., Lawrence, P. J., Li, F., Li, H., Lombardozzi, D., Riley, W. J., Sacks, W. J., Shi, M., Vertenstein, M., Wieder, W. R., Xu, C., Ali, A. A., Badger, A. M., Bisht, G., van den Broeke, M., Brunke, M. A., Burns, S. P., Buzan, J., Clark, M., Craig, A., Dahlin, K., Drewniak, B., Fisher, J. B., Flanner, M., Fox, A. M., Gentine, P., Hoffman, F., Keppel-Aleks, G., Knox, R., Kumar, S., Lenaerts, J., Leung, L. R., Lipscomb, W. H., Lu, Y., Pandey, A., Pelletier, J. D., Perket, J., Randerson, J. T., Ricciuto, D. M., Sanderson, B. M., Slater, A., Subin, Z. M., Tang, J., Thomas, R. Q., Val Martin, M., and Zeng, X.: The Community Land Model Version 5: Description of New Features, Benchmarking, and Impact of Forcing Uncertainty, Journal of Advances in Modeling Earth Systems, 11, 4245–4287, https://doi.org/10.1029/2018MS001583, 2019. a
López-Moreno, J., Vicente-Serrano, S., Zabalza, J., Beguería, S., Lorenzo-Lacruz, J., Azorin-Molina, C., and Morán-Tejeda, E.: Hydrological response to climate variability at different time scales: A study in the Ebro basin, Journal of Hydrology, 477, 175–188, https://doi.org/10.1016/j.jhydrol.2012.11.028, 2013. a
Mackay, J. D., Barrand, N. E., Hannah, D. M., Krause, S., Jackson, C. R., Everest, J., and Aðalgeirsdóttir, G.: Glacio-hydrological melt and run-off modelling: application of a limits of acceptability framework for model comparison and selection, The Cryosphere, 12, 2175–2210, https://doi.org/10.5194/tc-12-2175-2018, 2018. a
Mackay, J. D., Barrand, N. E., Hannah, D. M., Krause, S., Jackson, C. R., Everest, J., Aðalgeirsdóttir, G., and Black, A. R.: Future evolution and uncertainty of river flow regime change in a deglaciating river basin, Hydrology and Earth System Sciences, 23, 1833–1865, https://doi.org/10.5194/hess-23-1833-2019, 2019. a
Marzeion, B., Hock, R., Anderson, B., Bliss, A., Champollion, N., Fujita, K., Huss, M., Immerzeel, W., Kraaijenbrink, P., Malles, J.-H., Maussion, F., Radić, V., Rounce, D. R., Sakai, A., Shannon, S., van de Wal, R., and Zekollari, H.: Partitioning the Uncertainty of Ensemble Projections of Global Glacier Mass Change, Earth's Future, e2019EF001470, https://doi.org/10.1029/2019EF001470, 2020. a
Maussion, F., Butenko, A., Champollion, N., Dusch, M., Eis, J., Fourteau, K., Gregor, P., Jarosch, A. H., Landmann, J., Oesterle, F., Recinos, B., Rothenpieler, T., Vlug, A., Wild, C. T., and Marzeion, B.: The Open Global Glacier Model (OGGM) v1.1, Geoscientific Model Development, 12, 909–931, https://doi.org/10.5194/gmd-12-909-2019, 2019. a, b, c
Maussion, F., Rothenpieler, T., Dusch, M., Schmitt, P., Vlug, A., Schuster, L., Champollion, N., Li, F., Marzeion, B., Oberrauch, M., Eis, J., Fischer, A., Landmann, J., Jarosch, A., luzpaz, Hanus, S., Rounce, D., Castellani, M., Bartholomew, S. L., Minallah, S., bowenbelongstonature, Merrill, C., Otto, D., Loibl, D., Rosa, G., Ultee, L., Thompson, S., Anton, U. B., and Gregor, P.: OGGM/oggm: v1.6.1, Zenodo, https://doi.org/10.5281/zenodo.8287580, 2023. a
Naz, B. S., Frans, C. D., Clarke, G. K. C., Burns, P., and Lettenmaier, D. P.: Modeling the effect of glacier recession on streamflow response using a coupled glacio-hydrological model, Hydrology and Earth System Sciences, 18, 787–802, https://doi.org/10.5194/hess-18-787-2014, 2014. a
Oerlemans, J.: Holocene glacier fluctuations: is the current rate of retreat exceptional?, Annals of Glaciology, 31, 39–44, https://doi.org/10.3189/172756400781820246, 2000. a
O'Loughlin, R.: Why we need lower-performance climate models, Climatic Change, 177, https://doi.org/10.1007/s10584-023-03661-7, 2024. a
Pesci, M. H., Schulte Overberg, P., Bosshard, T., and Förster, K.: From global glacier modeling to catchment hydrology: bridging the gap with the WaSiM-OGGM coupling scheme, Frontiers in Water, 5, https://doi.org/10.3389/frwa.2023.1296344, 2023. a
Prudhomme, C., Giuntoli, I., Robinson, E. L., Clark, D. B., Arnell, N. W., Dankers, R., Fekete, B. M., Franssen, W., Gerten, D., Gosling, S. N., Hagemann, S., Hannah, D. M., Kim, H., Masaki, Y., Satoh, Y., Stacke, T., Wada, Y., and Wisser, D.: Hydrological droughts in the 21st century, hotspots and uncertainties from a global multimodel ensemble experiment, Proceedings of the National Academy of Sciences, 111, 3262–3267, https://doi.org/10.1073/pnas.1222473110, 2014. a
RGI Consortium: Randolph Glacier Inventory – A Dataset of Global Glacier Outlines. (NSIDC-0770, Version 6), Boulder, Colorado USA, National Snow and Ice Data [data set], https://doi.org/10.7265/4m1f-gd79, 2017. a, b, c
Rivera, J. A. and Arnould, G.: Evaluation of the ability of CMIP6 models to simulate precipitation over Southwestern South America: Climatic features and long-term trends (1901–2014), Atmospheric Research, 241, 104953, https://doi.org/10.1016/j.atmosres.2020.104953, 2020. a
Robel, A. A., Verjans, V., and Ambelorun, A. A.: Biases in ice sheet models from missing noise-induced drift, The Cryosphere, 18, 2613–2623, https://doi.org/10.5194/tc-18-2613-2024, 2024. a
Roe, G. H. and O'Neal, M. A.: The response of glaciers to intrinsic climate variability: observations and models of late-Holocene variations in the Pacific Northwest, Journal of Glaciology, 55, 839–854, https://doi.org/10.3189/002214309790152438, 2009. a
Rounce, D. R., Hock, R., and Shean, D. E.: Glacier Mass Change in High Mountain Asia Through 2100 Using the Open-Source Python Glacier Evolution Model (PyGEM), Frontiers in Earth Science, 7, 331, https://doi.org/10.3389/feart.2019.00331, 2020. a, b, c, d
Rounce, D. R., Hock, R., and Maussion, F.: Global PyGEM-OGGM Glacier Projections with RCP and SSP Scenarios, Version 1, https://doi.org/10.5067/P8BN9VO9N5C7, 2022. a
Rounce, D. R., Hock, R., Maussion, F., Hugonnet, R., Kochtitzky, W., Huss, M., Berthier, E., Brinkerhoff, D., Compagno, L., Copland, L., Farinotti, D., Menounos, B., and McNabb, R. W.: Global glacier change in the 21st century: Every increase in temperature matters, Science, 379, 78–83, https://doi.org/10.1126/science.abo1324, 2023. a, b
Salzmann, N., Huggel, C., Rohrer, M., and Stoffel, M.: Data and knowledge gaps in glacier, snow and related runoff research – A climate change adaptation perspective, Journal of Hydrology, 518, 225–234, https://doi.org/10.1016/j.jhydrol.2014.05.058, 2014. a
Satoh, Y., Shiogama, H., Hanasaki, N., Pokhrel, Y., Boulange, J. E. S., Burek, P., Gosling, S. N., Grillakis, M., Koutroulis, A., Schmied, H. M., Thiery, W., and Yokohata, T.: A quantitative evaluation of the issue of drought definition: a source of disagreement in future drought assessments, Environmental Research Letters, 16, 104001, https://doi.org/10.1088/1748-9326/ac2348, 2021. a
Scheff, J., Coats, S., and Laguë, M. M.: Why do the Global Warming Responses of Land-Surface Models and Climatic Dryness Metrics Disagree?, Earth's Future, 10, e2022EF002814, https://doi.org/10.1029/2022EF002814, 2022. a
Schuster, L., Rounce, D. R., and Maussion, F.: Glacier projections sensitivity to temperature-index model choices and calibration strategies, Annals of Glaciology, 1–16, https://doi.org/10.1017/aog.2023.57, 2023a. a, b
Schuster, L., Schmitt, P., Vlug, A., and Maussion, F.: OGGM/oggm-standard-projections-csv-files: v1.0 (v1.0), Zenodo, https://doi.org/10.5281/zenodo.8286065, 2023b. a, b, c, d
Schuster, L., Maussion, F., Rounce, D. R., Ultee, L., Schmitt, P., Lacroix, F., Frölicher, T. L., and Schleussner, C.-F.: Irreversible glacier change and trough water for centuries after overshooting 1.5 °C, Nature Climate Change, 15, 634–641, https://doi.org/10.1038/s41558-025-02318-w, 2025. a, b
Snyder, A., Prime, N., Tebaldi, C., and Dorheim, K.: Uncertainty-informed selection of CMIP6 Earth system model subsets for use in multisectoral and impact models, Earth System Dynamics, 15, 1301–1318, https://doi.org/10.5194/esd-15-1301-2024, 2024. a
Somers, L. D. and McKenzie, J. M.: A review of groundwater in high mountain environments, WIREs Water, 7, e1475, https://doi.org/10.1002/wat2.1475, 2020. a
Stein, L., Mukkavilli, S. K., Pfitzmann, B. M., Staar, P. W. J., Ozturk, U., Berrospi, C., Brunschwiler, T., and Wagener, T.: Wealth Over Woe: Global Biases in Hydro-Hazard Research, Earth's Future, 12, e2024EF004590, https://doi.org/10.1029/2024EF004590, 2024. a
Ultee, L., Coats, S., and Mackay, J.: Glacial runoff buffers droughts through the 21st century, Earth System Dynamics, 13, 935–959, https://doi.org/10.5194/esd-13-935-2022, 2022a. a, b, c, d, e, f, g, h, i, j, k, l, m, n, o, p
Ultee, L., Coats, S., and Mackay, J.: ehultee/glacial-SPEI: Publication releast (v1.1.0), Zenodo [code], https://doi.org/10.5281/zenodo.6510185, 2022b. a
Van Loon, A. F., Stahl, K., Di Baldassarre, G., Clark, J., Rangecroft, S., Wanders, N., Gleeson, T., Van Dijk, A. I. J. M., Tallaksen, L. M., Hannaford, J., Uijlenhoet, R., Teuling, A. J., Hannah, D. M., Sheffield, J., Svoboda, M., Verbeiren, B., Wagener, T., and Van Lanen, H. A. J.: Drought in a human-modified world: reframing drought definitions, understanding, and analysis approaches, Hydrology and Earth System Sciences, 20, 3631–3650, https://doi.org/10.5194/hess-20-3631-2016, 2016. a
van Tiel, M., Kohn, I., Van Loon, A. F., and Stahl, K.: The compensating effect of glaciers: Characterizing the relation between interannual streamflow variability and glacier cover, Hydrological Processes, 34, 553–568, https://doi.org/10.1002/hyp.13603, 2020a. a, b
van Tiel, M., Stahl, K., Freudiger, D., and Seibert, J.: Glacio-hydrological model calibration and evaluation, WIREs Water, 7, e1483, https://doi.org/10.1002/wat2.1483, 2020b. a
Vicente-Serrano, S. M., Beguería, S., and López-Moreno, J. I.: A Multiscalar Drought Index Sensitive to Global Warming: The Standardized Precipitation Evapotranspiration Index, Journal of Climate, 23, 1696–1718, https://doi.org/10.1175/2009JCLI2909.1, 2009. a, b
Vlug, A.: The influence of climate variability on the mass balance of Canadian Arctic land-terminating glaciers, in simulations of the last millennium, Ph.D. thesis, Universität Bremen, https://doi.org/10.26092/elib/1501, 2021. a
Vlug, A., Schuster, L., and Maussion, F.: Impact models and averages of forcing data: A recommendation, OGGM Blog, https://oggm.org/2021/08/05/mean-forcing/ (last access: 20 February 2026), 2021. a
Wanders, N., Wada, Y., and Van Lanen, H. A. J.: Global hydrological droughts in the 21st century under a changing hydrological regime, Earth System Dynamics, 6, 1–15, https://doi.org/10.5194/esd-6-1-2015, 2015. a
Wiersma, P., Aerts, J., Zekollari, H., Hrachowitz, M., Drost, N., Huss, M., Sutanudjaja, E. H., and Hut, R.: Coupling a global glacier model to a global hydrological model prevents underestimation of glacier runoff, Hydrology and Earth System Sciences, 26, 5971–5986, https://doi.org/10.5194/hess-26-5971-2022, 2022. a, b
Wimberly, F.: Processed Runoff Files, Data Dryad, 2024. a
Wimberly, F., Ultee, L., Schuster, L., Huss, M., Rounce, D. R., Maussion, F., Coats, S., Mackay, J., and Holmgren, E.: Inter-model differences in 21st century glacier runoff for the world's major river basins, The Cryosphere, 19, 1491–1511, https://doi.org/10.5194/tc-19-1491-2025, 2025. a, b, c, d, e, f, g, h, i, j, k, l, m, n
World Meteorological Organization and Global Water Partnership: Handbook of Drought Indicators and Indices, Tech. rep., Integrated Drought Management Programme (IDMP), Geneva, Switzerland, ISBN 978-92-63-11173-9, 978-91-87823-24-4, 2016. a, b
Yang, Y., Roderick, M. L., Zhang, S., McVicar, T. R., and Donohue, R. J.: Hydrologic implications of vegetation response to elevated CO2 in climate projections, Nature Climate Change, 9, 44, https://doi.org/10.1038/s41558-018-0361-0, 2019. a, b
Zekollari, H., Huss, M., Farinotti, D., and Lhermitte, S.: Ice-Dynamical Glacier Evolution Modeling – A Review, Reviews of Geophysics, 60, e2021RG000754, https://doi.org/10.1029/2021RG000754, 2022. a
Zekollari, H., Huss, M., Schuster, L., Maussion, F., Rounce, D. R., Aguayo, R., Champollion, N., Compagno, L., Hugonnet, R., Marzeion, B., Mojtabavi, S., and Farinotti, D.: Twenty-first century global glacier evolution under CMIP6 scenarios and the role of glacier-specific observations, The Cryosphere, 18, 5045–5066, https://doi.org/10.5194/tc-18-5045-2024, 2024. a, b
Zekollari, H., Schuster, L., Maussion, F., Hock, R., Marzeion, B., Rounce, D. R., Compagno, L., Fujita, K., Huss, M., James, M., Kraaijenbrink, P. D. A., Lipscomb, W. H., Minallah, S., Oberrauch, M., Van Tricht, L., Champollion, N., Edwards, T., Farinotti, D., Immerzeel, W., Leguy, G., and Sakai, A.: Glacier preservation doubled by limiting warming to 1.5 °C versus 2.7 °C, Science, 388, 979–983, https://doi.org/10.1126/science.adu4675, 2025. a, b
Zelinka, M.: “CMIP56_forcing_feedback”, Zenodo, https://doi.org/10.5281/zenodo.6647291, 2022. a, b
Zelinka, M. D., Myers, T. A., McCoy, D. T., Po-Chedley, S., Caldwell, P. M., Ceppi, P., Klein, S. A., and Taylor, K. E.: Causes of Higher Climate Sensitivity in CMIP6 Models, Geophysical Research Letters, 47, e2019GL085782, https://doi.org/10.1029/2019GL085782, 2020. a, b
- Abstract
- Introduction
- Methods
- Results
- Discussion
- Conclusions
- Appendix A: Regional maps
- Appendix B: Glacier models included
- Appendix C: Global climate model ensembles and climate sensitivity
- Appendix D: Per-basin comparison with CMIP6 archive
- Code and data availability
- Author contributions
- Competing interests
- Disclaimer
- Acknowledgements
- Financial support
- Review statement
- References