the Creative Commons Attribution 4.0 License.
the Creative Commons Attribution 4.0 License.
 | 11 Feb 2026
Water vapour isotope anomalies during an atmospheric river event at Dome C, East Antarctica
Niels Dutrievoz
Cécile Agosta
Cécile Davrinche
Amaëlle Landais
Sebastien Nguyen
Étienne Vignon
Inès Ollivier
Christophe Leroy-Dos Santos
Elise Fourré
Mathieu Casado
Jonathan Wille
Vincent Favier
Bénédicte Minster
Frédéric Prié
From 19 to 23 December 2018, an atmospheric river sourced in the Atlantic hit the French–Italian Concordia station, located at Dome C, East Antarctic Plateau, 3233 m above sea level (a.s.l.). It induced a significant surface warming (+18 °C in 3 d), combined with high specific humidity (3-fold increase in 3 d) and a strong isotopic anomaly in water vapour (+17 ‰ for δ18O). The isotopic composition of water vapour monitored during the event may be explained by the isotopic signature of long-range water transport, and by local moisture uptake during the event. In this study, we used continuous meteorological and isotopic water vapour observations, together with the atmospheric general circulation model LMDZ6iso, to describe this event and quantify the influence of each of these processes. The presence of mixed-phase clouds during the event induced a significant increase in downward long wave radiation, leading to high surface temperature and resulting in high turbulent mixing in the boundary layer. Although surface fluxes are underestimated in LMDZ6iso, near-surface temperature and specific humidity are well represented. The surface vapour δ18O is accurately simulated during the event, despite an overestimated amplitude in the diurnal cycle outside of the event. Using the LMDZ6iso simulation, we perform a surface water vapour mass budget by decomposing total specific humidity into contributions from individual processes. Our analysis demonstrates that surface sublimation, which becomes significantly stronger during the event compared to typical diurnal cycles, emerges as the dominant driver of the vapour δ18O signal at the peak of the event, accounting for approximately 70 % of the total contribution. The second largest contribution comes from moisture input via large-scale advection associated with the atmospheric river, accounting for approximately 30 % of the total. Consequently, our results reveal that the isotopic signal monitored in water vapour during this atmospheric river event reflects both long-range moisture advection and interactions between the boundary layer and the snowpack. Only specific meteorological conditions driven by a pronounced moisture intrusion can explain these strong interactions. Given the marked imprint of air–snow exchanges on the vapour isotopic signal, improving the representation of local processes in climate models could substantially improve the simulation of the isotopic signal over Antarctica and provide valuable insight into moisture uptake processes.
- Article
(9874 KB) - Full-text XML
-
Supplement
(13282 KB) - BibTeX
- EndNote


Water isotopes are largely used as a proxy of past climate variations, in particular at Dome C, East Antarctica, where the longest continuous climatic record has been obtained from water isotope measurements in a 3200 m long ice core (EPICA community members, 2004; Landais et al., 2021). Interpreting water isotopic signal in ice cores is however complex due to the impact of the atmospheric water cycle before snowfall and of post-deposition processes. Studying variations of δ18O in atmospheric vapour, precipitations and surface snow is thus critical to understand how large-scale moisture intrusion and local processes interact, to finally produce the signal recorded in ice cores. This is why, since 2011, measurements of the isotopic composition of surface snow and precipitation have been carried out at this location (Touzeau et al., 2016; Stenni et al., 2016; Casado et al., 2021; Dreossi et al., 2024; Ollivier et al., 2025b). This motivation also led to the installation of an analyser of water vapour isotopic composition at Dome C for the summer seasons, first in 2014 (Casado et al., 2016), and for all summers since December 2018 (Leroy-Dos Santos et al., 2021; Ollivier et al., 2025a). The measurement of water vapour isotopic composition is a challenge in such low humidity environment because of the strong influence of mixing ratio on δ18O values (Leroy-Dos Santos et al., 2021).
Between 19 and 23 December 2018, a +17.6 °C temperature anomaly was observed at the Automatic Weather Station (AWS) of French–Italian Concordia station (123.4° E, 75.1° S, 3233 m above sea level (a.s.l.)), located at Dome C, on the East Antarctic Plateau (Fig. 1), relative to the December 2018 clear-sky daily cycle averages. On 21 December 2018, the temperature reached −14.7 °C, the second highest value recorded since the installation of the Concordia AWS in 2005 (Grigioni et al., 2022). During this event, humidity levels increased by a factor of three and water vapour δ18O increased by 17 ‰ in 3 d. The primary cause of these anomalous values was the intrusion of warm and moist air from lower latitudes in the form of an atmospheric river (AR), a narrow long band of enhanced water vapour fluxes originating from the sub-tropics and mid-latitudes (Zhu and Newell, 1998; Nash et al., 2018). This AR was detected using the polar-specific detection algorithm described in Wille et al. (2021), and characterized using 10 d back-trajectory analyses performed every 3 h at 1000 m above ground level (a.g.l.) at Dome C with the FLEXPART Lagrangian Particle Dispersion Model (Pisso et al., 2019; Leroy-Dos Santos et al., 2020; Wille et al., 2022; Gorodetskaya et al., 2023). The event was first identified over Coats Land, west of Dronning Maud Land, on 17 December 2018, before progressing towards the South Pole and Dome C (Fig. 1).
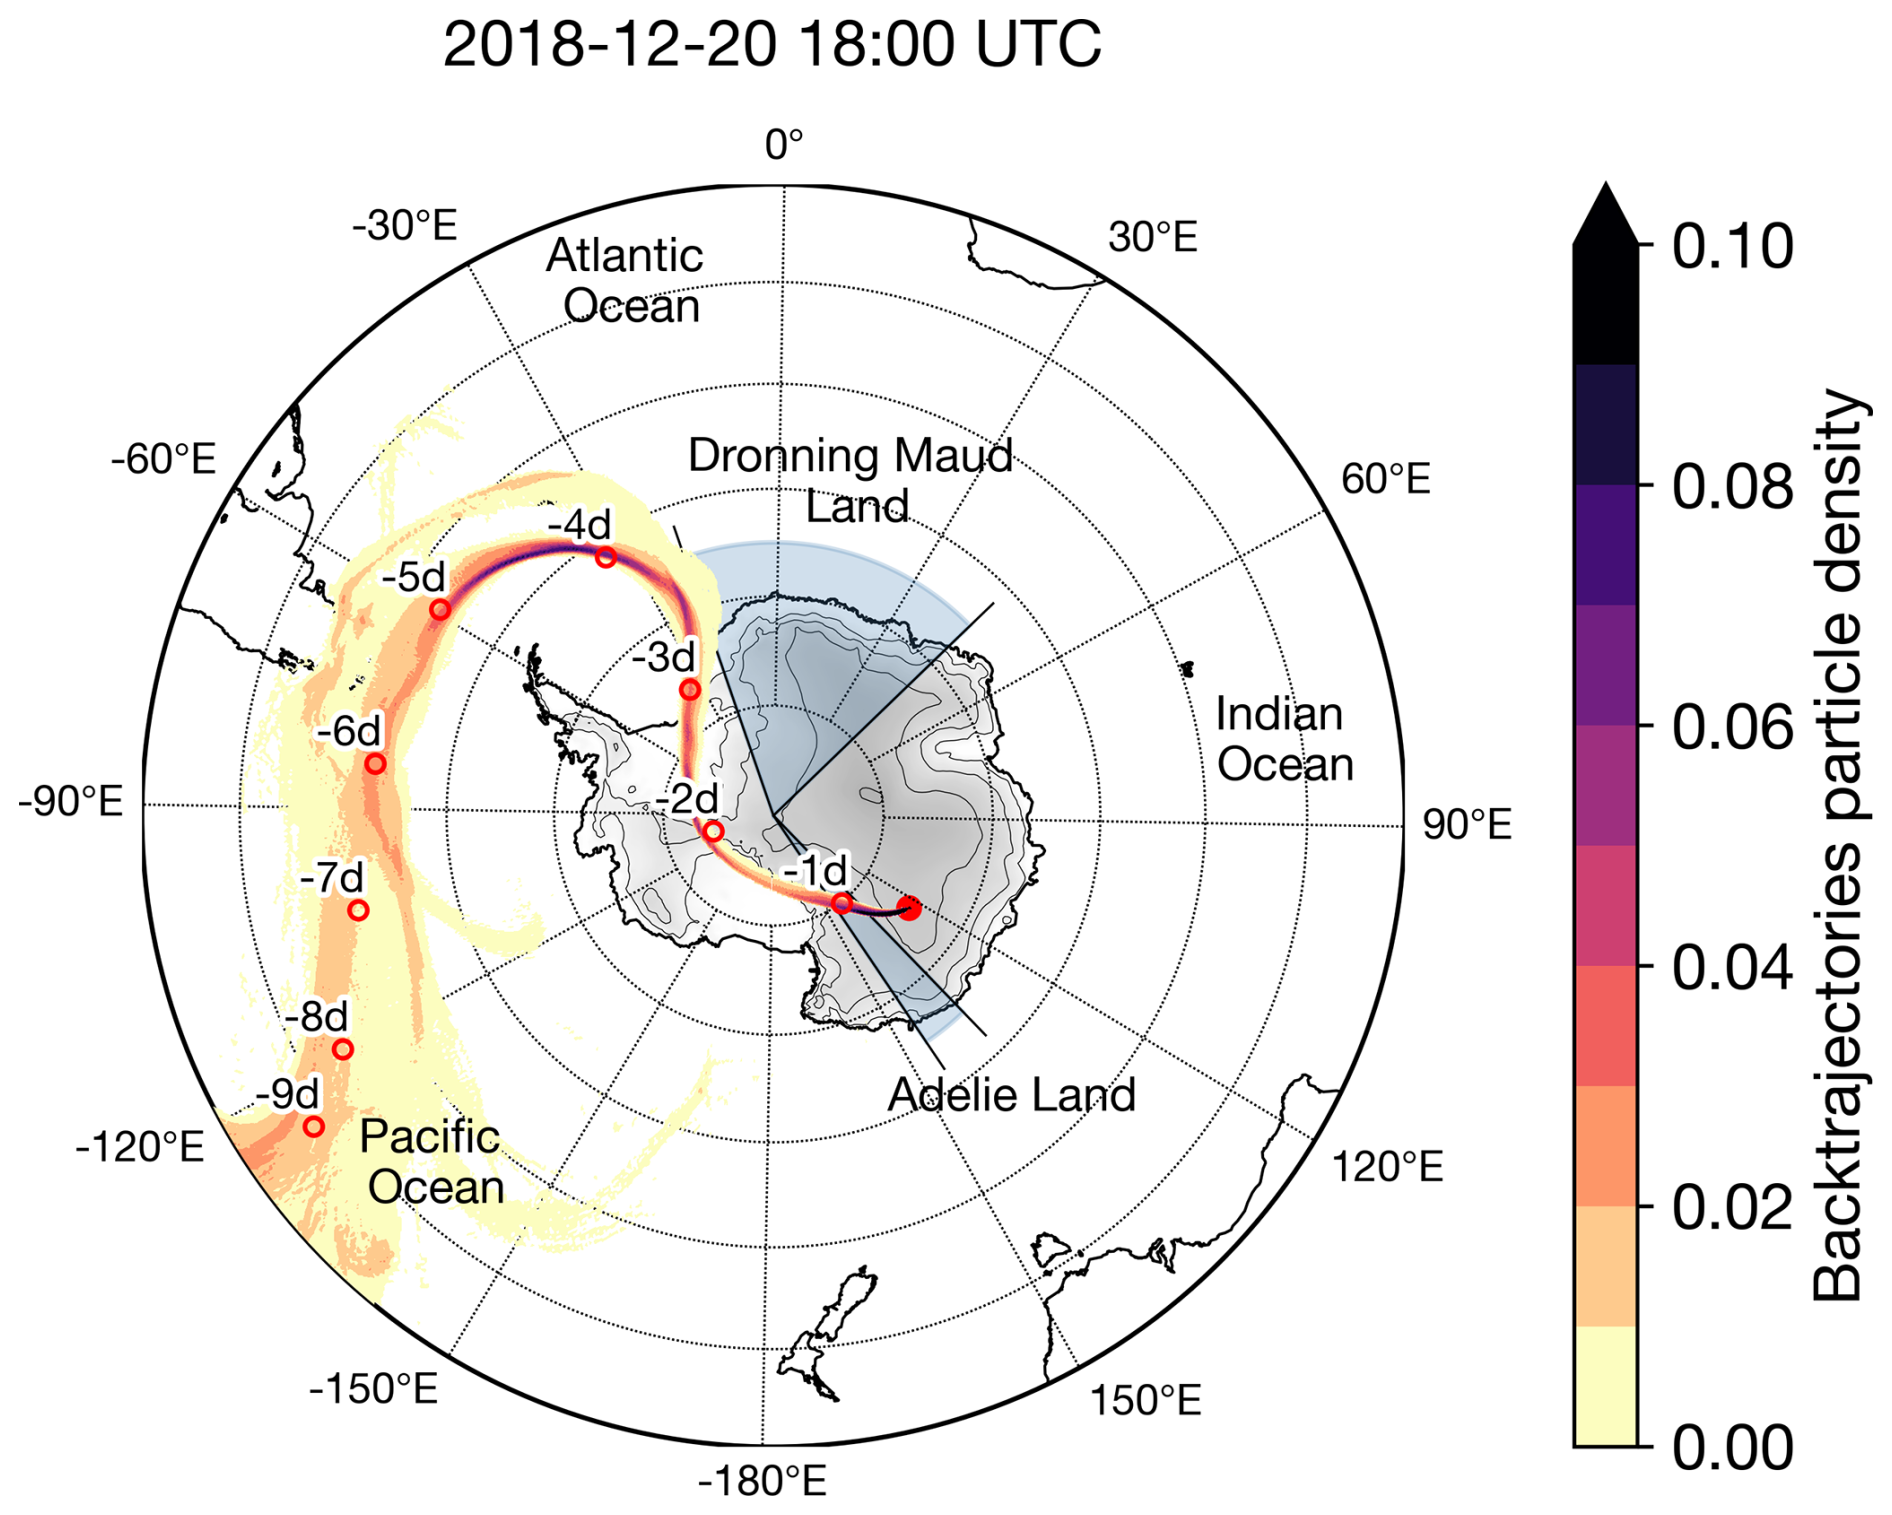
Figure 1FLEXPART 10 d backtrajectory analysis showing particles total footprint, i.e. the density partition of particles released from Concordia station (red dot, 123.4° E, 75.1° S, 3233 m a.s.l.) 20 December 2018 18:00 at a 1000 m a.g.l.. The French–Italian Concordia station is located at Dome C on the East Antarctic Plateau. The red circles and the “−xd” labels indicate the mean position of the particles during the xth day preceding 20 December 2018. The light blue pie charts correspond to the Dronning Maud Land and Adelie Land regions. Units represent the density of particles in the atmospheric column launched from Concordia standardized by the total number of particles.
ARs are known to have a major impact on the Antarctic surface climate, as they induce surface warming, either through enhanced sensible heat fluxes associated with warm air advection, or via the presence of mixed phase clouds with high supercooled liquid water and ice water content that increase downward longwave radiation towards the surface (Wille et al., 2019). In addition to triggering intense surface warming, AR also enable anomalously high inland moisture advection, making them a major contributor to extreme precipitation events over the desert polar plateau (Gorodetskaya et al., 2014; Turner et al., 2019; Wille et al., 2021; Adusumilli et al., 2021). The event of December 2018 recorded at Concordia station is in line with those characteristics, as Ricaud et al. (2020) highlighted the presence of a supercooled liquid cloud at 1500 m above Dome C and of precipitating ice crystals and/or blowing snow 20 December 2018. The impact of atmospheric rivers on water vapour isotopic anomalies has been studied for a specific event recorded in Greenland in July 2012 (Bonne et al., 2015), during which the large-scale transport of an air mass from Ivittuut to the NEEM drilling site caused a strong positive anomaly in temperature, specific humidity, and δD. However, large-scale transport only accounts for about half of the observed changes in water vapour isotopic composition. At Concordia Station, a +28 ‰ anomaly in water vapour δ18O was observed during the AR event of 15–19 March 2022, which originated from the Indian Ocean sector (Wille et al., 2024b). While large-scale dynamics appear to be a major driver of surface anomalies in specific humidity and δ18O, this study aims to better understand how local boundary-layer processes shape the surface signal during large-scale events.
In this study, we focus on the Dome C AR event of December 2018, with the aim of disentangling the impact of large-scale advection and boundary layer processes on the surface air vapour isotopic signal. In Sect. 2, we present our observational dataset, modelling tools and methodology. In Sect. 3, we describe in detail the December 2018 event, from large scale analysis to local observations at Dome C, and evaluate the LMDZ6iso model during this event. In Sect. 4, we study the influence of large-scale advection and boundary layer processes on the isotopic signal recorded in the water vapour and surface snow. Finally, we discuss our results in Sect. 5.
2.1 Observations
2.1.1 Surface meteorology, longwave and shortwave radiative fluxes at the surface, radiosondes, and column-integrated atmospheric water
To place the event in a broader climatological context, we use hourly temperature and specific humidity from the Concordia AWS, provided by the IPEV/PNRA Project “Routine Meteorological Observation at Station Concordia” since 2005 (Grigioni et al., 2022). However, the AWS measurements are subject to two known limitations: (i) a warm daytime bias during summer under calm wind conditions, due to the lack of sensor ventilation (Genthon et al., 2011); and (ii) a dry bias at night, as standard thermohygrometers are unable to measure supersaturated conditions (Genthon et al., 2017). We remind the reader that, throughout this manuscript, the term night refers to an austral summer night, during which the sun remains above the horizon. For the detailed analysis of the event, we rely on measurements from the 45 m meteorological tower, located about 800 m upwind of the main station buildings, where the known AWS biases have been addressed through the CALVA instrumentation: temperature sensors are mechanically ventilated (Genthon et al., 2011), and updated thermohygrometers are specifically designed to detect supersaturation, even under extreme winter conditions (Genthon et al., 2017; Vignon et al., 2022). This dataset includes temperature, relative humidity, specific humidity, and wind speed measured approximately 3 m above the surface (Genthon et al., 2021a, b, 2022). Relative humidity is computed following the protocol described in Vignon et al. (2022) and Ollivier et al. (2025b). In addition, we use surface water vapour fluxes estimated by Ollivier et al. (2025b), based on the bulk method and derived from the same 3 m meteorological tower measurements, combined with snow surface temperature observations. For the bulk method, the stability functions from Holtslag and De Bruin (1988) are used for stable atmospheric conditions and from Högström (1996) for unstable atmospheric conditions. The roughness lengths for heat and moisture are assumed to be equal to the roughness length for momentum. Further details on the estimation of the surface water vapour flux can be found in Ollivier et al. (2025b). We also use upward and downward shortwave and longwave surface radiation from the Baseline Surface Radiation Network (BSRN) installed at Concordia Station (Lupi et al., 2021; Bai et al., 2022). Finally, we use available radiosondes, launched twice a day from Concordia Station throughout December 2018 (Grigioni et al., 2019). The soundings provide vertical profiles of temperature, relative humidity with respect to liquid water, and wind speed. Relative humidity is recalculated with respect to ice.
2.1.2 Isotopic composition of water vapour and surface snow
An infrared cavity ring-down spectrometer (Picarro L2130-i) was used to continuously measure the isotopic composition of water vapour, pumped from 1 m above the snow surface (Casado et al., 2016), and these data are available in Leroy-Dos Santos et al. (2021). This instrument was installed in 2018 at Concordia station, together with a home-made device to generate water vapour of known isotopic composition at low humidity to calibrate the analyser (Leroy-Dos Santos et al., 2021). Surface snow samples (0–1 cm) were collected every 2–4 h during the day in the clean area, approximately 800 m upwind of the main station buildings. The detailed sampling protocol and site description are provided in Ollivier et al. (2025b).
2.2 Models
2.2.1 Atmospheric river detection
The December 2018 AR was identified using an AR detection algorithm specifically designed for polar regions (Wille et al., 2019, 2021). In previous studies, this detection algorithm has been used to assess AR impacts such as surface melt, ice-shelf instability, and snowfall accumulation, and to characterise their synoptic properties (Wille et al., 2022; Pohl et al., 2021; Wille et al., 2024a, b; Gorodetskaya et al., 2023). Essentially, the AR detection algorithm used in this study searches for either integrated water vapour (IWV) or the meridional component of the integrated vapour transport (vIVT) between 37.5 and 85° S for values above the 98th percentile of all monthly climatological values defined from 1980–2021, using 3-hourly fields from ERA5 reanalysis vertically integrated on all levels. If this value forms a continuous segment that extends at least 20° in the meridional direction, then the segment is labelled as an AR. The December 2018 AR event was identified based on the patterns of IWV and vIVT. For more details on this algorithm, see the Methods in Wille et al. (2021).
2.2.2 The isotope-enabled general circulation model LMDZ6iso
We use the atmospheric general circulation model (AGCM) LMDZ6, described in Hourdin et al. (2020), using the version 20231022.trunk with the NPv6.3 physical package (Hourdin et al., 2023). This configuration is closely aligned with the atmospheric setup of IPSL-CM6A (Boucher et al., 2020), developed for phase 6 of the Coupled Model Intercomparison Project (CMIP6) (Eyring et al., 2016). The surface layer scheme and the turbulent diffusion parameterisation in LMDZ6 have been adapted to reproduce the structure and variability of the boundary layer at Dome C (Vignon et al., 2017b, 2018), including the summertime diurnal cycle and the two distinct stable regimes-weakly stable and very stable-that dominate during winter. We use LMDZ6's standard horizontal Low Resolution (LR) longitude-latitude grid (144 × 142), which corresponds to a 2.0° resolution in longitude and 1.67° in latitude. The vertical grid comprises 79 levels, with the lowest atmospheric level approximately 7 m a.g.l. at Dome C. Our simulation is nudged towards 6-hourly 3D fields of temperature and wind of the ERA5 reanalysis (Hersbach et al., 2020) using a relaxation time scale of 12 h. Nudging is excluded below the sigma-pressure level equivalent to 850 hPa a.s.l. (around 1000 m a.g.l. over the ice sheet), allowing the physics and dynamics of the model to operate freely within the boundary layer. Surface ocean boundary conditions are derived from ERA5 reanalysis monthly mean sea surface temperature and sea-ice concentration fields. A summary of the simulation evaluation is provided in Sect. 2.2.4.
2.2.3 Isotopic processes
The isotopic processes in LMDZ6iso, the isotope-enabled version of LMDZ6, are described in Risi et al. (2010), and a summary is provided here. In this study, we focus on the isotopes HO, HO, and HDO in water vapour, and use the standard δ notation to express the relative abundance of heavy stable water isotopes compared to the light isotope:
where δ (expressed in ‰) refers to either δ18O or δD. Here, Rsample is the ratio of heavy to light water molecules in the sample (e.g., HO HO or HDO HO), and RVSMOW is the equivalent ratio in the Vienna Standard Mean Ocean Water (VSMOW), used as reference. For moisture transport, LMDZ6 uses the Van Leer advection scheme (Van Leer, 1977; Risi et al., 2010). Under first-order fractionation behaviour, variations in δD are approximately eight times those in δ18O (Craig, 1961). Deviations from this relationship are quantified using the deuterium excess (d-excess):
The d-excess is particularly sensitive to kinetic fractionation processes (Dansgaard, 1964), and thus serves as a useful tracer of evaporation conditions at the moisture source (Gat et al., 2011), as well as non-equilibrium processes such as ice condensation under supersaturated conditions or evaporation of precipitating droplets (Jouzel and Merlivat, 1984). Equilibrium fractionation coefficients between water vapour and liquid or ice are derived from Merlivat and Nief (1967) and Majoube (1971). Kinetic fractionation effects are parametrized for sea surface evaporation following Merlivat and Jouzel (1979) and for ice condensation and supersaturation based on Jouzel and Merlivat (1984), where the kinetic fractionation coefficient αcin is defined as:
where Si is the supersaturation during ice condensation (relative humidity with respect to ice, dimensionless), αeq is the equilibrium fractionation coefficient, and D and Diso are the diffusivities of most abundant water and the isotope respectively (in m2 s−1). In LMDZ6iso, supersaturation used for isotope processes calculation is parametrized as a simple linear function of temperature for freezing conditions and is used exclusively to compute the fractionation coefficient:
where λ is a tuning parameter ranging from 0 K−1 (no supersaturation with respect to ice) to 0.006 K−1 (high supersaturation with respect to ice), T is the air temperature (K), and Tfreeze is the freezing temperature (273.15 K). To reduce the bias in surface snow δ18O and d-excess, we performed our simulation using a value of λ = 0.004 K−1, as described in Dutrievoz et al. (2025b).
In the model, the isotopic composition of surface snow is modelled using a snow bucket representing the average isotopic composition of snowfall since the start of the simulation. The isotopic signature of surface snow can only be modified by fractionation during surface vapour condensation, as sublimation is assumed to occur without fractionation, consistent with common isotope-enabled AGCM assumptions (e.g., Hoffmann et al., 1998). Recent studies have nevertheless shown that sublimation and vapour exchange can significantly influence the isotopic composition of surface snow, but it is not yet taken into account in LMDZ6iso (Casado et al., 2021; Hughes et al., 2021; Harris Stuart et al., 2023; Dietrich et al., 2023).
2.2.4 Simulation evaluation
The LMDZ6iso simulation used in this study is similar to the one described and evaluated in Dutrievoz et al. (2025b), but with a ERA5 nudging relaxation time scale of 12 h instead of 3 h, which does not significantly affect the results over Antarctica. A summary of the simulation evaluation is provided here. Over Antarctica for the period 1979–2024, LMDZ6iso captures well the spatial distribution of mean surface temperature with a mean cold bias of 1.4 K. Simulated snow accumulation exhibits a mean bias of +12.2 kg m−2 yr−1, representing 8.7 % of the mean observed accumulation, independently of the altitude. When ran with an intermediate supersaturation parameter (λ = 0.004 K−1), the model accurately reproduces the spatial distribution of the mean annual surface snow δ18O across the continent with no bias when considering the entire ice sheet. However, a positive bias is observed inland, where measured δ18O values are lower than −45 ‰, with a bias of +2.6 ‰ at Dome C, while a negative bias appears in coastal regions, where δ18O exceeds −40 ‰. Regarding surface snow d-excess, LMDZ6iso systematically overestimates d-excess compared to observations (+6.6 ‰ at Concordia), except at the ice sheet margins, with a maximum positive bias of 11.9 ‰ inland. At Concordia, LMDZ6iso accurately simulates temperature and specific humidity during clear-sky diurnal cycles in December 2018, despite a slight positive bias (1.5 K and 0.04 g kg−1, respectively). The mean water vapour δ18O over the same period is −66.9 ‰ in the observations and −62.2 ‰ in LMDZ6iso. However, the modelled amplitude of vapour δ18O is more than twice as large as observed (4.3 ‰ observed vs. 11.5 ‰ modelled). This discrepancy likely reflects an overly strong enrichment during the day and/or an excessive depletion at night.
2.3 Water vapour isotopic budget using tendencies
2.3.1 Computation of isotopic tendencies
To investigate the processes governing the atmospheric water budget and the isotopic composition of water vapour at the surface, we use the LMDZ6iso water vapour tendencies. These tendencies represent the rate of change of each water vapour isotope (in kg kg−1 s−1) due to specific processes driving the water cycle: large-scale advection, cloud and precipitation condensation and sublimation, shallow convection, deep convection (negligible in Antarctica), and vertical turbulent diffusion (which encompasses surface sublimation and condensation).
The total atmospheric water vapour budget and vapour isotopic budget are computed as the sum of contributions from all processes:
where is the change in time of atmospheric specific humidity (in kg kg−1 s−1) and is the change in time of the δ of atmospheric vapour (in ‰ s−1).
The rate of change of δ in atmospheric vapour attributable to each process, (in ‰ s−1), is calculated as follows:
where q represents the atmospheric specific humidity before the process (in kg kg−1), δ is the atmospheric vapour δ18O before the process (in ‰), is the specific humidity tendency associated to the process (in kg kg−1 s−1), and δprocess is the isotopic composition of this specific humidity tendency at each time step (in ‰). A detailed derivation of this equation is provided in Dutrievoz et al. (2025b), Appendix A.
2.3.2 Quantification of the origin of water and δ18O in the near-surface atmospheric layer and in the mixed layer
We now aim to identify the origin of the atmospheric water sources. The associated methodology is illustrated in Fig. 2. This study focuses on the analysis of δ18O, but a similar analysis using δD would yield equivalent results. Based on the tendencies, we intend to decompose the total specific humidity into a sum of contributions from different processes. We define an initial vapour bucket composed of the humidity present in the atmosphere, qinit and , at the initial time step t0. Then at the next time step t + Δt, positive contributions ( > 0 or > 0, Eq. 9) are added to their respective buckets q|process, which quantify the amount of water originating from each source process (e.g., surface sublimation, cloud or precipitation sublimation, or water advected by the atmospheric dynamics). It leads to intermediate quantities , the sum of which is larger than q(t+Δt) (Eq. 10). Negative contributions (either < 0 or < 0) correspond to mass sinks for all vapour buckets (e.g., surface condensation, cloud condensation, water advected by the atmospheric dynamics or shallow convection), so the sum of negative tendencies is subtracted proportionally to each bucket (as illustrated by the rescaling in Fig. 2), resulting in the sum of buckets being equal to the specific humidity q(t+Δt) (Eq. 11). By applying this scheme iteratively at each time step, the initial bucket is progressively depleted-typically within a few days-and replaced by a sum of buckets corresponding to processes with positive contributions to the specific humidity. In other words, when a process adds water to the atmosphere, the origin of the water can be traced back based on the nature of the contributing process. In contrast, when water is removed from the atmosphere, it originates from the mixed vapour from different origins; therefore, the loss is distributed proportionally among all existing buckets. We chose to first sum the positive contributions and then subtract the negative contributions at each time step. This order of operations is not symmetric: applying the negative tendencies first and then adding the positive ones leads to similar but slightly different results. In the following, , and :
where corresponds to the positive contributions of each process to the total and isotopic specific humidity at time step t (in kg kg−1 s−1), refers to the specific humidity from the previous time step incremented by the sum of all positive contributions between t and t+Δt (in kg kg−1) and q(t+Δt) is the specific humidity at time t+Δt (in kg kg−1).

Figure 2Schematic representation of the methodology used to determine the origin of atmospheric water sources. Depending on whether their contribution is positive or negative, the processes are classified either as sources ( > 0), shown with solid colours, or as sinks ( < 0), shown with hatched colours. Each bucket is supplied by a specific water source and is represented by a distinct colour: the initial bucket, consisting of the water already present in the atmosphere, is shown in grey; the orange bucket corresponds to water originating from surface sublimation; the blue bucket represents water transported by advection; and the purple bucket accounts for water from cloud and precipitation sublimation. In this example, shallow convection, represented in red, does not correspond to a bucket, as it only removes water from the atmosphere. Paler colours indicate newly added water contributions.
Using Eq. (11) for total water and their equivalents for qiso, we compute the global δ and its anomaly relative to the clear-sky mean diurnal cycle value, as a function of the isotopic contributions associated with each process:
where δ is the isotopic composition of atmospheric vapour (in ‰), δ|process is the isotopic composition of atmospheric vapour associated to each process at each time step (in ‰) and δmean is the isotopic clear-sky mean diurnal cycle value (in ‰). The derivation of Eqs. (13) and (14) are detailed in Appendix A.
We also performed a water budget analysis within the mixed layer to ensure consistency with the surface signal. The mixed layer is defined as the surface atmospheric layer (7 m a.g.l. in the model) and the layers mixed by shallow convection. During the night, in the absence of convection and under weak turbulent conditions, a decoupling occurs between the surface and the rest of the atmosphere. During the day, shallow convection mixes the air between the surface and approximately 400–500 m a.g.l. The growth of the mixed layer mixes the air from above into the mixed layer, introducing a new process which we refer to as entrainment. The entrainment term, illustrated in Fig. S1 in the Supplement, includes water originating from various atmospheric processes. Therefore, this additional process must be considered when performing a water and isotope budget in a mixed layer with a varying altitude.
3.1 Large scale conditions during the event
Although Dome C is geographically closer to the Indian sector of the Southern Ocean – and most events affecting the station generally originate from this sector (Sodemann and Stohl, 2009; Genthon et al., 2016; Schlosser et al., 2017) – analysis of the synoptic-scale atmospheric circulation associated with this event indicates a much more distant moisture source, originating from the Atlantic sector, as shown in Fig. 1. The AR detection algorithm, presented in Sect. 2.2.1, depicts an initial landfall over western Dronning Maud Land on 17 December, with the AR progressing across the Antarctic Plateau. The moisture intrusion reaches Dome C on 19 December, but is not classified as an AR since the AR detection algorithm domain only extends until 85° S and cannot track moisture transport that passes over the South Pole moving from south to north (Fig. 3). These warm air masses, characterised by high integrated water vapour over Dome C, contain large amounts of cloud ice and liquid water, which contribute to surface warming through enhanced sensible heat fluxes and increased downward longwave radiation (Ricaud et al., 2024a). After 22 December, the moisture quantities decreases on the Antarctic Plateau, but temperatures remain elevated around Dome C due to residual moisture in the region. MODIS satellite imagery confirms this timeline, showing the initial inland cloud penetration on 18 December (Fig. 3b) and then traversing the Antarctic Plateau towards Dome C by the 21th (Fig. 3d).
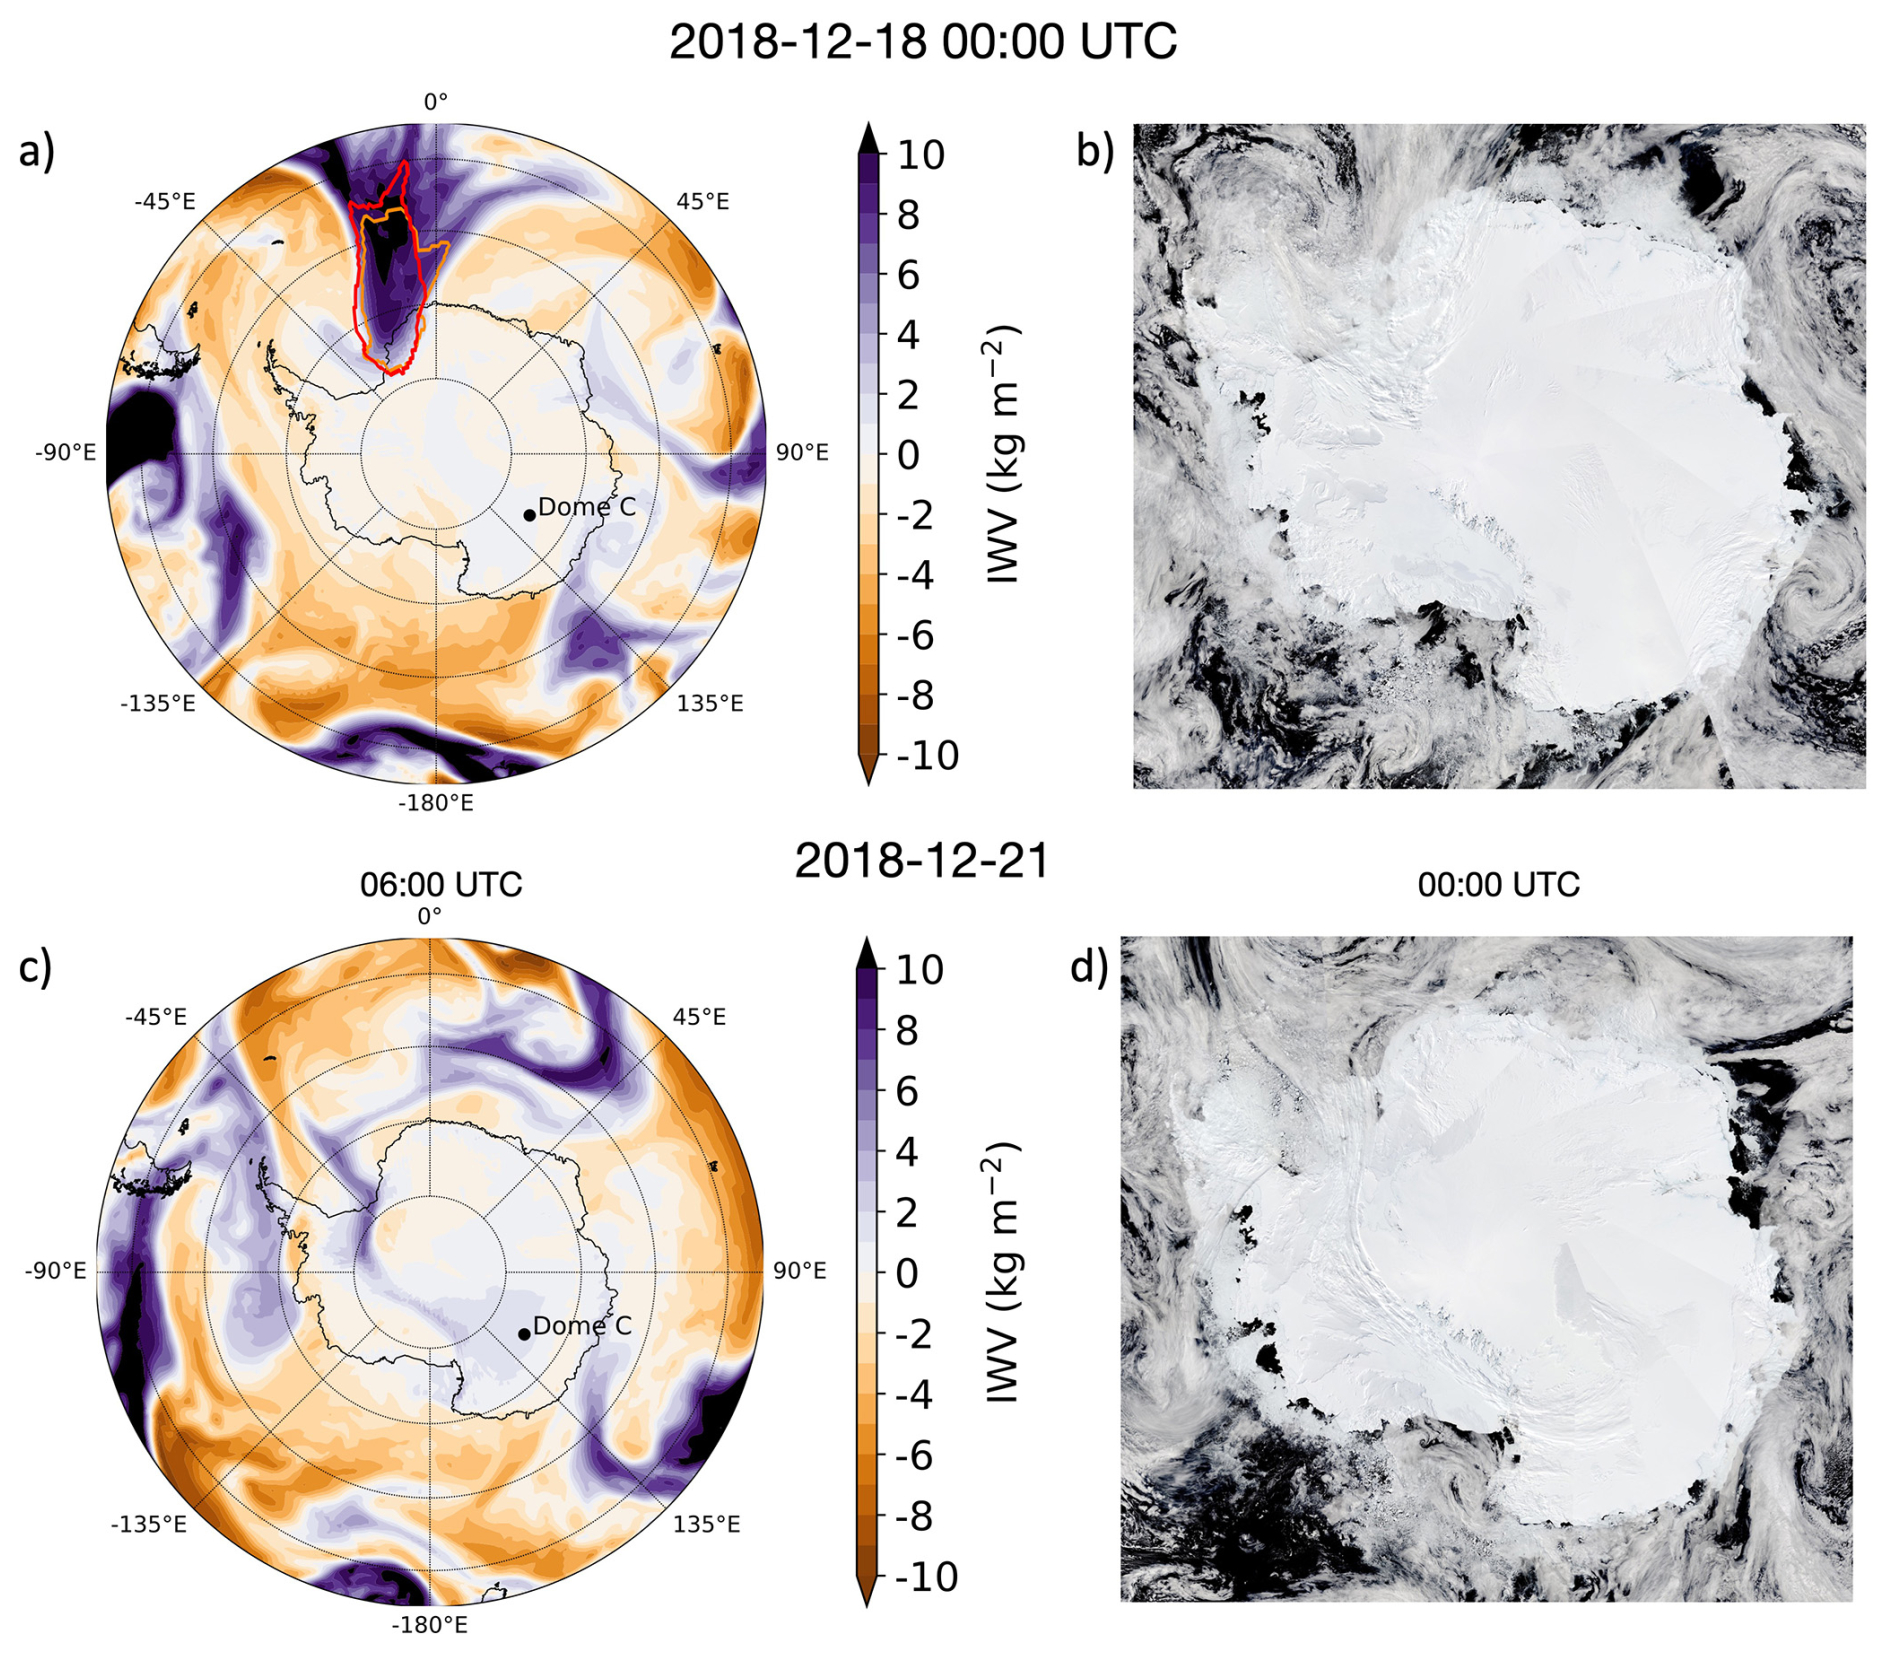
Figure 3Atmospheric river on (a, b) 18 December 2018 at 00:00 UTC, before the AR crossed the Antarctic Plateau, (c) 21 December 2018 at 06:00 UTC and (d) 21 December 2018 at 00:00 UTC, after the AR had reached Dome C. (a, c) Shape of the detected AR, with anomalies in integrated water vapour transport (IWV) relative to the December climatology (1980–2021) shown in shading. Red and orange contours correspond to ARs detected using the vIVT and IWV based detection methods, respectively. (b, d) MODIS satellite imagery illustrating the progression of the AR across the Antarctic Plateau. Satellite images were obtained from the NASA MODIS instrument via the NASA Worldview application (https://worldview.earthdata.nasa.gov, last access: 2 February 2026)).
This seemingly unusual path of moisture transport over the Antarctic Plateau and the South Pole results from a pronounced atmospheric ridge that extends across the entire continent. The ridge directs the moisture flow towards the coastline during the initial AR landfall on the 18th and then expands across the Antarctic Plateau, reaching the other side of the continent (Fig. S2a). The latent heat release associated with the poleward moisture transport likely contributes to the development of the ridge over the Antarctic continent as evidenced by the prolonged period of positive potential vorticity anomalies around the Weddell Sea extending back to 17 December (Figs. S2 and S3). In addition to the mid-level 500 hPa geopotential height anomalies encompassing most of the Antarctic Plateau, anomalies are also present in the stratosphere at 10 hPa (Fig. S2b). These height anomalies in the stratosphere, observed for most of December and extending downward to the surface during the AR event (Fig. S4a), may indicate a potential weakening of the Southern polar vortex, as persistent lower-level positive temperature anomalies exceeding 5 °C are observed across the continent for most of December, peaking during the major moisture intrusion event from 17 to 22 December (Fig. S4b).
Now that we have characterized the AR, we examine the spatial anomalies in temperature, specific humidity, relative humidity, δ18O, and d-excess during the event (12:00 UTC on 20 December 2018), relative to the December average (1980–2021) at the sigma-pressure level corresponding to 850 hPa geopotential height in LMDZ, equivalent to an altitude of approximately 1500 m a.s.l. and about 1000 m above the Antarctic Plateau (Fig. S5). The AR pathway exhibits a pronounced temperature anomaly exceeding +10 °C, extending from the oceanic boundary near Dronning Maud Land (Fig. 1) to the edge of the Antarctic Plateau near Adélie Land (Fig. 4a). The AR is also associated with a significant positive anomaly in specific humidity, although spatially more confined compared to the temperature anomaly (Fig. 4b). East of the AR, over Dronning Maud Land and within the 5 °C anomaly contour, the region shows a strong negative anomaly in relative humidity (up to −60 %), with completely dry air in some locations (below 10 %, Figs. 4c and S6c). In the same region, the AR is characterised by a strong negative δ18O anomaly of −20 ‰ reaching −80 ‰ (Figs. 4d, S6d), and the d-excess displays a strong positive anomaly of +40 ‰, with absolute values reaching up to +80 ‰ (Fig. 4e, S6e). The AR is associated with a positive δ18O anomaly of approximately +10 ‰, spatially distributed over the same region as the specific humidity anomaly (Fig. 4b, d).
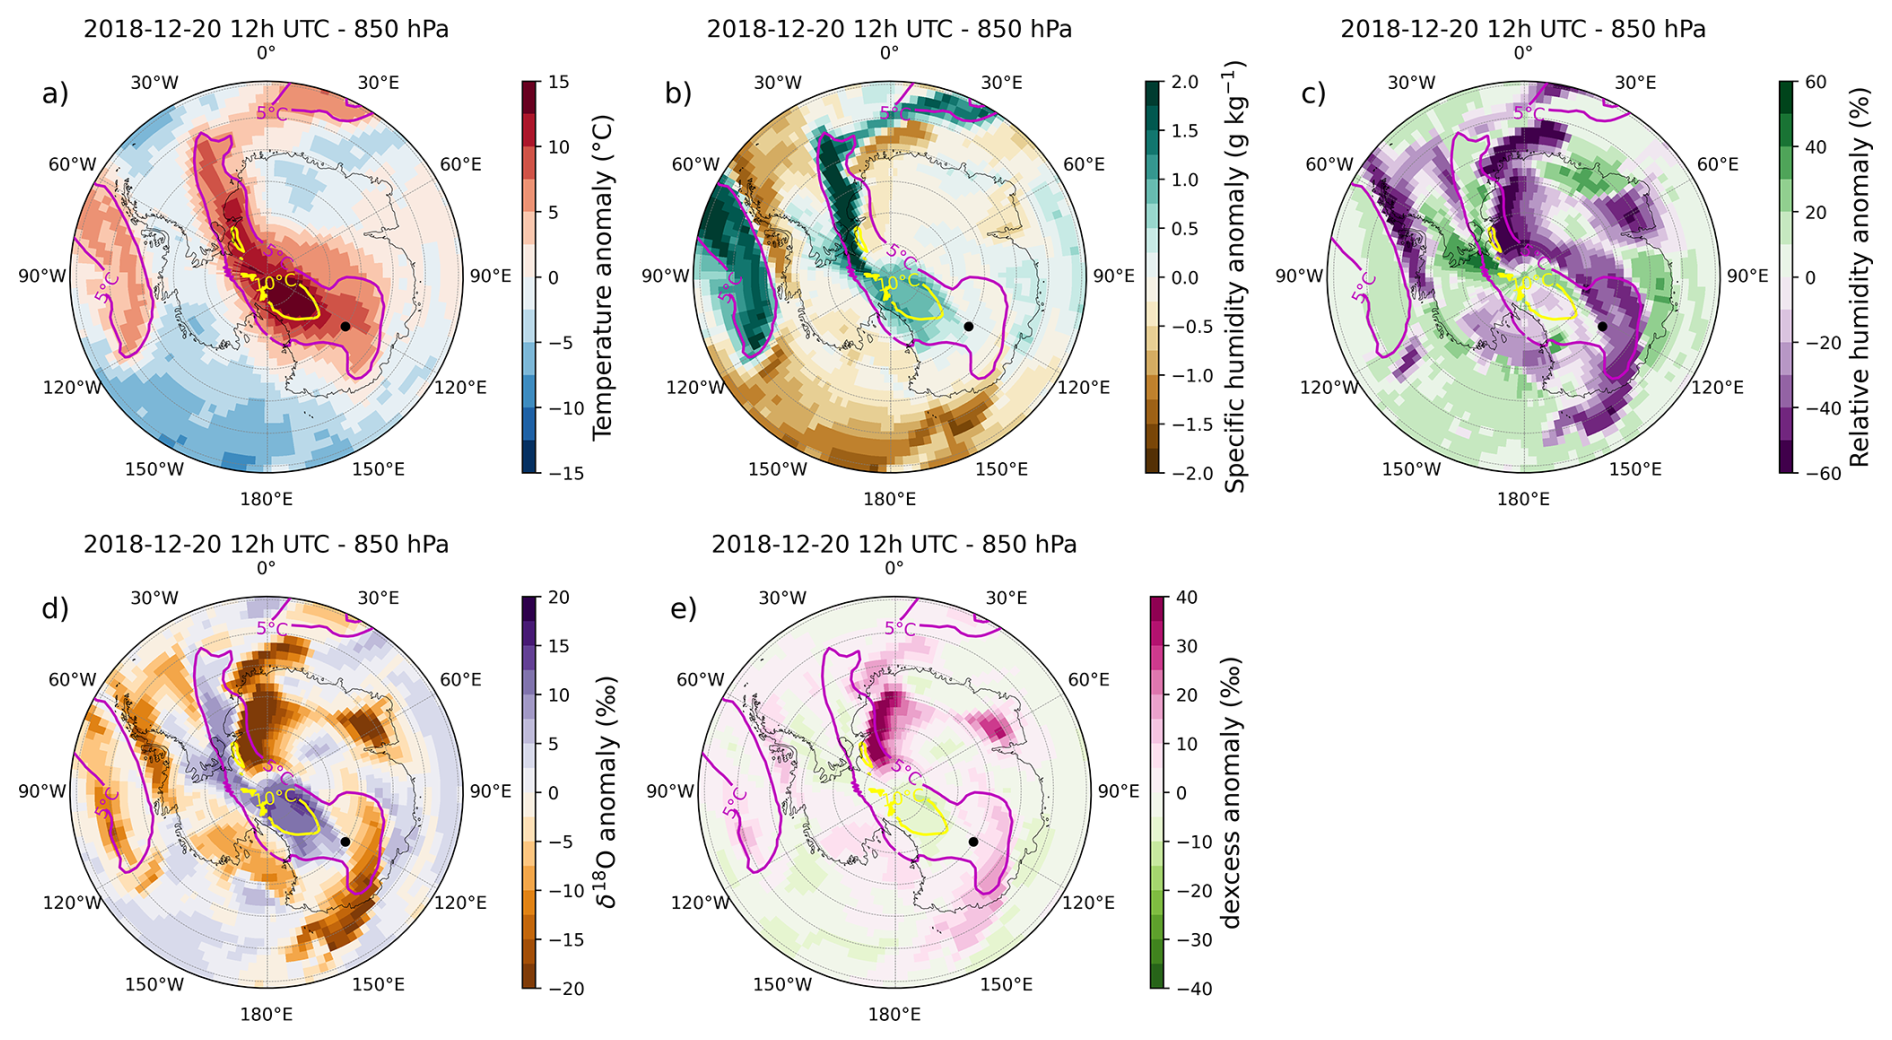
Figure 4LMDZ6iso anomalies at the model level equivalent to 850 hPa a.s.l. of (a) temperature (°C), (b) specific humidity (g kg−1), (c) relative humidity (%), (d) δ18O (‰), and (e) d-excess (‰), calculated on 20 December 2018 at 12:00 UTC relative to the December average (1980–2021). The purple contour represents the 5 °C anomaly boundary, while the yellow contour indicates the 10 °C anomaly boundary. The black dot indicates Concordia station. The altitude above the surface corresponding to the LMDZ6iso model level equivalent to 850 hPa is shown in Fig. S5 (around 1000 m a.g.l. over the ice sheet).
3.2 Anomalies monitored at the surface
The AR event at Dome C is identified from the 45 m meteorological tower observations (Sect. 2.1.1) as a period of anomalously high temperature and specific humidity relative to the mean December diurnal cycle, beginning with an increase on 19 December and ending with a return to near-average values on 23 December.
Over the 13-year AWS record period (2006–2018), the December 2018 event is characterized by the second highest maximum temperature (−14.7 °C) and the absolute record for specific humidity (1.54 g kg−1) throughout the 1-hourly summer (December–January) measurements (Fig. 5). Consequently, this event stands out for its exceptionally high temperature and specific humidity compared to the previous 13 summers.
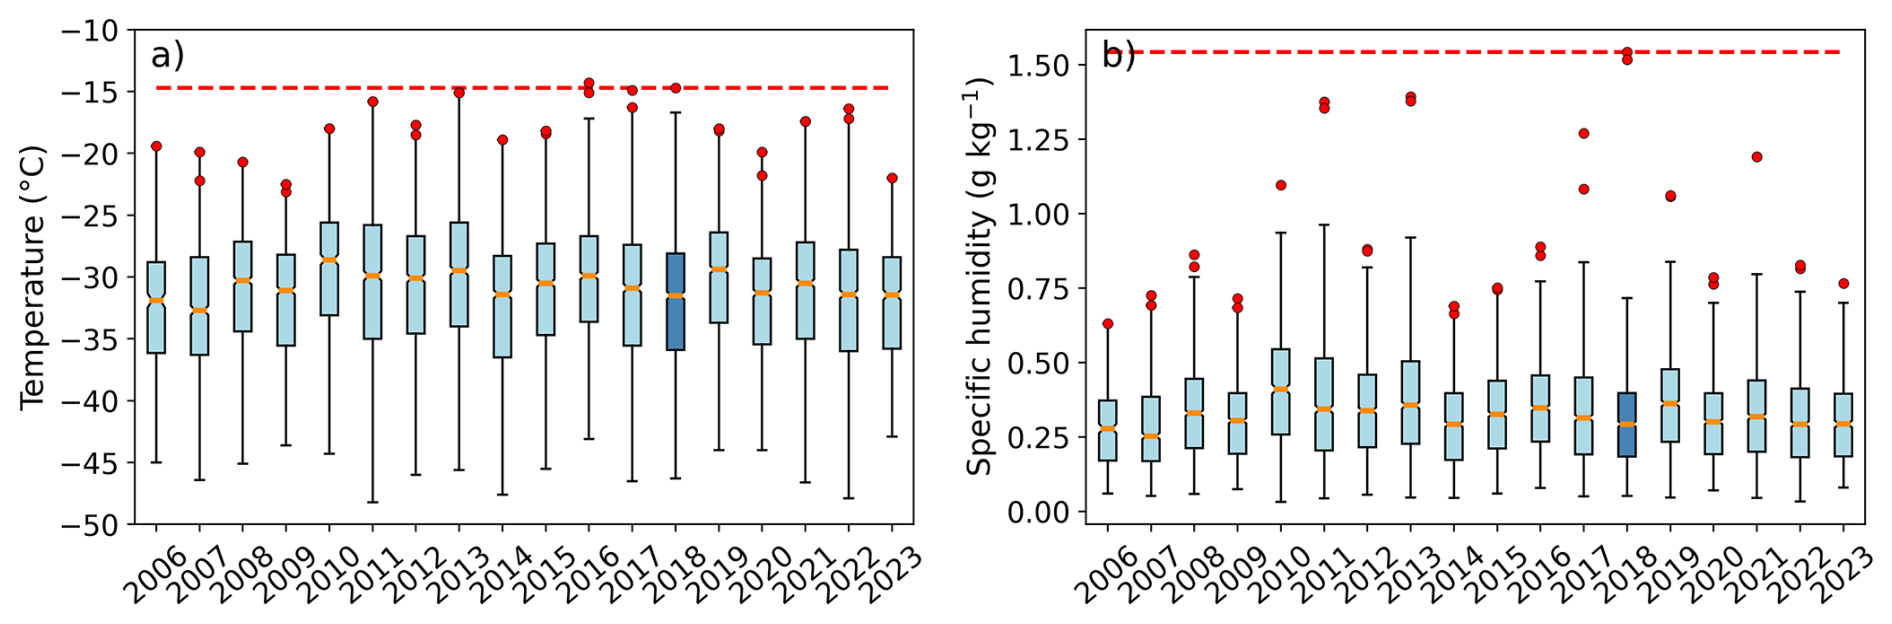
Figure 5Hourly temperatures (a) and specific humidity (b) recorded at Dome C during summers (December–January) from December 2006 to January 2024 from the AWS. The year of interest, 2018 (December 2018–January 2019), is coloured in dark blue. Each box is delimited by the 0.25 and 0.75 percentiles and the orange bar represents the median. Black bars indicate the values inside 1.5 times the inter-quartile range. Red circles indicate values outside the 0.999 percentiles. The dotted red line indicate the value reached during the December 2018 AR.
The water vapour flux from the surface to the lower atmosphere in December 2018 is estimated using meteorological measurements at Dome C and the bulk method described in Sect. 2.1.1. The roughness length for momentum (z0) used in the reference calculation is set to 1 mm, corresponding to the value in LMDZ. Sensitivity tests were also performed using two alternative values, 0.01 and 6.3 mm, as estimated in Vignon et al. (2017a). The resulting water vapour flux is found to be highly sensitive to the choice of z0, with larger values of z0 leading to increased fluxes (Fig. S7). The water vapour flux is characterised by pronounced daytime surface sublimation, while nocturnal conditions are associated with condensation. During the event, the model underestimates the first sublimation peak (21 December) by 74 % (0.046 kg m−2 h−1 observed, 0.012 kg m−2 h−1 modelled), and the second peak (22 December) by 44 % (0.048 kg m−2 h−1 observed, 0.027 kg m−2 h−1 modelled). On the night of 21 December, the model simulates night-time condensation that is nearly two times stronger than observed (−0.006 kg m−2 h−1 observed, −0.011 kg m−2 h−1 modelled).
To assess the intensity of the observed anomaly and evaluate the performance of the LMDZ6iso model, we focus on analysing surface meteorological data recorded by the 45 m meteorological tower (presented in Sect. 2.1.1) and δ18O in the vapour recorded by the Picarro instrument (detailed in Sect. 2.1.2). We compare the AR event (19–23 December) to the mean diurnal cycle calculated throughout the month of December 2018, excluding the event. The entire period is shown in Fig. S8.
On 21 December 2018 at 07:00 UTC, the temperature and humidity measurements are −14.6 °C and 1.45 g kg−1 respectively (Fig. 6), in line with records of the AWS station. It exceeds the December 2018 clear sky daily cycle averages by 17.9 °C and 1.16 g kg−1, respectively (Fig. 6a, d). The event is characterized by two pronounced peaks in incoming longwave radiation (Fig. 6b) associated with the presence of mixed phase clouds with high supercooled liquid water and ice water content (Ricaud et al., 2024b). Additionally, the AR event is marked by a nocturnal saturation of relative humidity with no episodes of supersaturation except on 23 December, alongside a doubling of wind speed (Fig. 6c, e). The water vapour δ18O exhibits a pronounced enrichment of 17.2 ‰ relative to the clear-sky diurnal cycle average for December 2018, with a maximum value of −49.6 ‰ recorded on 22 December at 01:00 UTC, reaching values comparable to those observed in surface snow (Fig. 6f). During the event, despite significant spatial variability (more the 8 ‰), surface snow exhibits a mean δ18O value of −53.6 ‰, and becomes enriched by 2.3 ‰ after the event, reaching −51.3 ‰ (Fig. 6f).
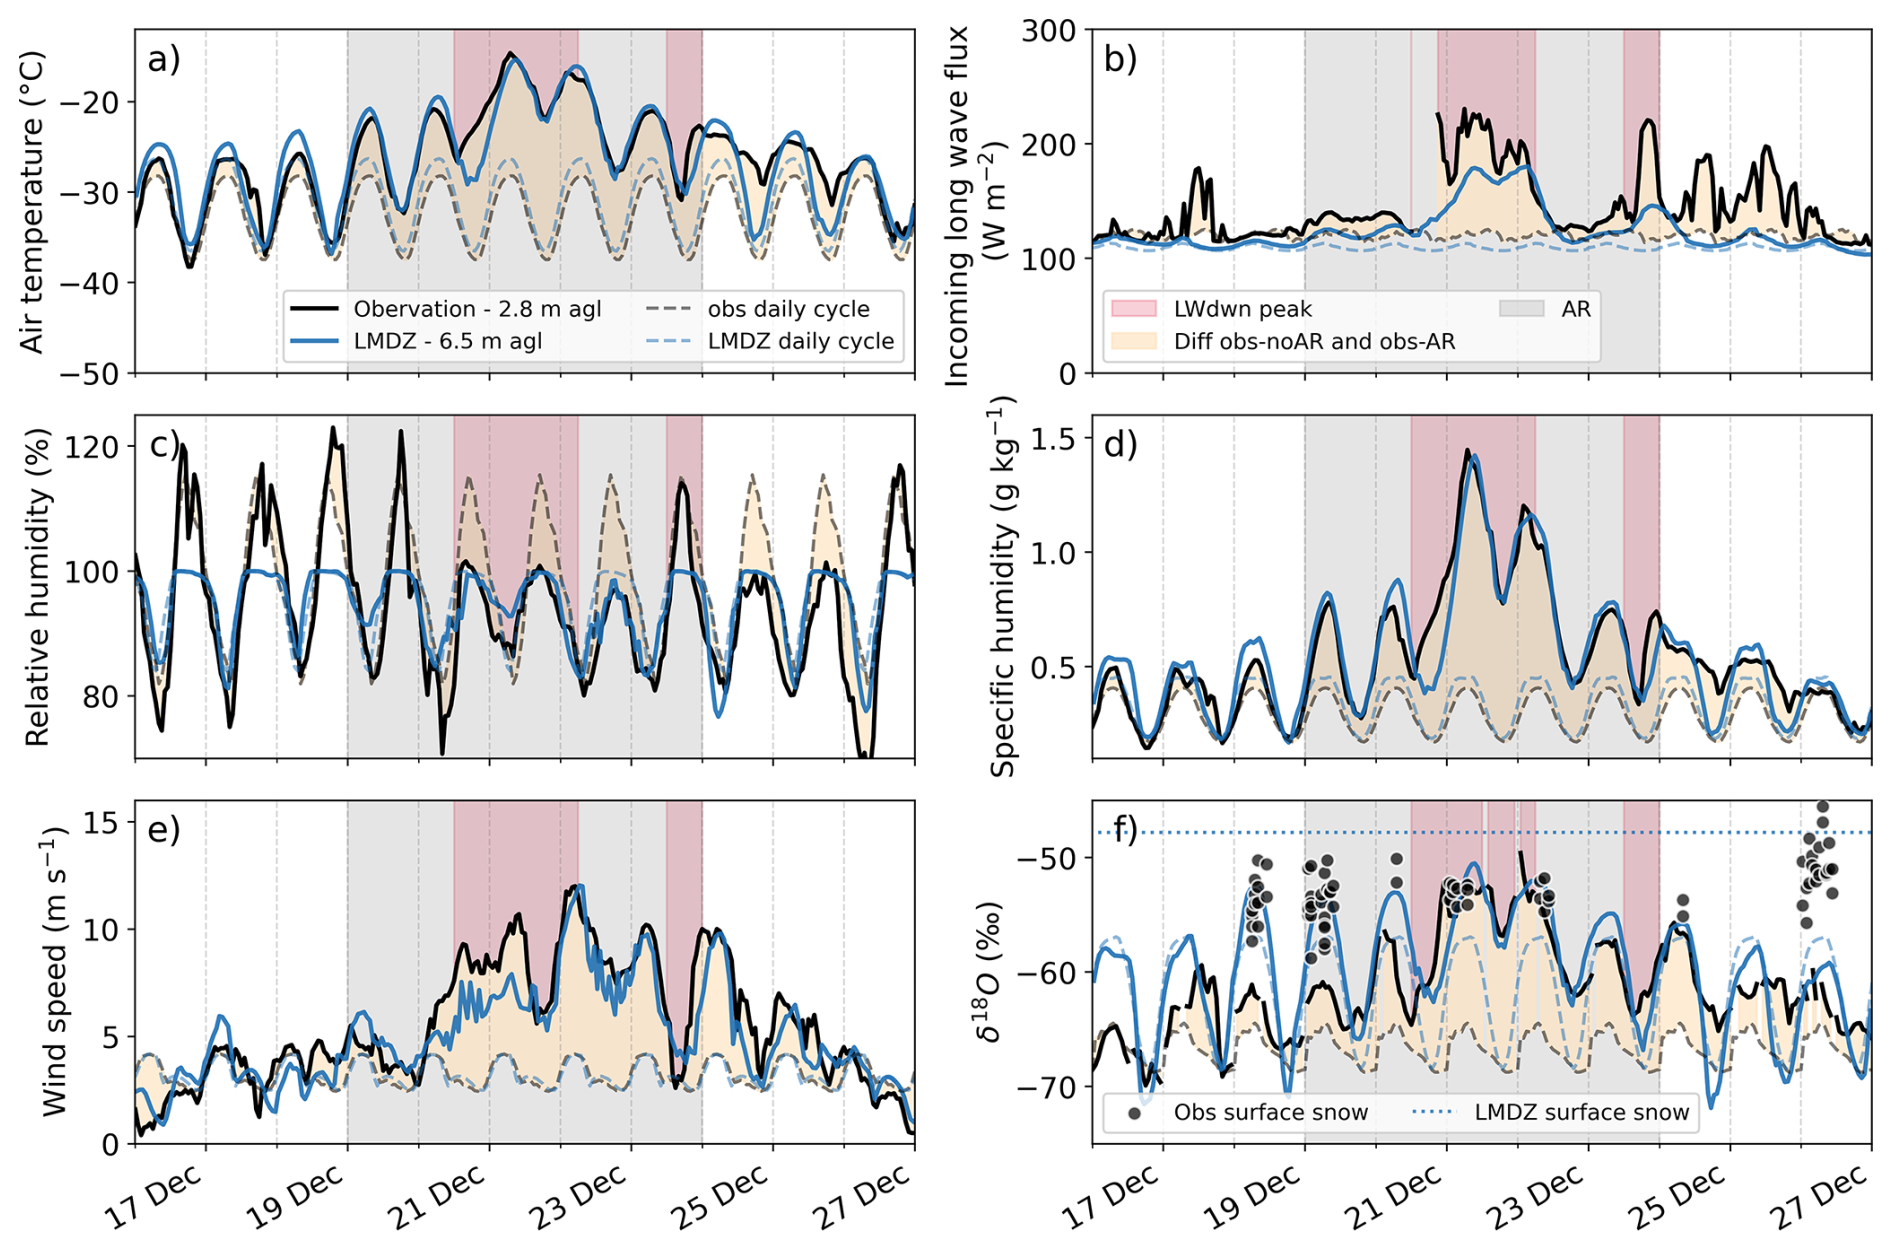
Figure 6Evolution of (a) air temperature (°C) from the first level of the Concordia meteorological tower (2.8 m a.g.l.), (b) incoming longwave flux from the Baseline Surface Radiation Network, (c) relative humidity with respect to ice (%), (d) specific humidity (g kg−1), (e) wind speed (m s−1) from the first level of the Concordia meteorological tower (3.0 m a.g.l.) and (f) δ18O (‰ from the Concordia Picarro instrument (1.0 m a.g.l.). In panel (f), observed surface snow is shown as black dots, while modelled surface snow is represented by a dotted line. The grey rectangle indicates the period of the AR. The blue line represents the model output (first level: 6.7 m a.g.l.), while the black line corresponds to the observations. The grey and blue dashed lines represent the mean diurnal cycle calculated over the entire month of December 2018, excluding the event (19–23 December), for observations and the model, respectively. The orange shading indicates the difference between the mean clear-sky diurnal cycle and the observations during the event, while the red shading highlights the peaks in downward longwave radiation.
During the event, the model captures the two main peaks in downward longwave radiation, albeit with underestimated peak intensities (22 % lower for the first maximum peak and 34 % for the second maximum peak) (Fig. 6b). Outside the event, the model reproduces the diurnal temperature cycle with an amplitude 11 % larger than observed (9.3 °C observed, 10.2 °C modelled), associated with a mean warm bias of 1.6 °C, and simulates the specific humidity cycle with an amplitude 14 % higher than observed (0.24 g kg−1 observed, 0.27 g kg−1 modelled), with a mean moist bias of 0.05 g kg−1. During the event, the maximum temperature bias is −0.8 °C, while the maximum specific humidity bias is −0.01 g kg−1 (1 % lower than observed) (Fig. 6a, d). Outside the event, the model fails to reproduce the nocturnal period of supersaturation. However, during the event, when no supersaturation is observed, the model accurately reproduces the diurnal cycle of relative humidity (Fig. 6c). The LMDZ6iso model also captures variations in wind speed during the event, with a slight mean bias of 0.8 m s−1 (11 % lower than observed) (Fig. 6e). While the model overestimates the amplitude of the diurnal cycle of vapour δ18O by more than a factor of two (4.3 ‰ observed, 11.5 ‰ modelled), as detailed in Dutrievoz et al. (2025b) and Ollivier et al. (2025a), it successfully captures vapour δ18O during the event's peak, with a positive bias of 1.8 ‰ (Fig. 6f). The modelled surface snow δ18O remains constant at a value of −48 ‰, which is 5 ‰ higher than observed during the event (Fig. 6f).
3.3 Vertical atmospheric profile during the event
We examine the vertical structure of the atmosphere during the AR event and during the unperturbed period outside the event (1–18 and 24–31 December 2018). We recall that the LMDZ6iso model is nudged to ERA5 reanalysis for temperature and wind above the boundary layer, and it reproduces these fields consistently with the reanalysis (not shown). In December 2018, outside of the event, the mean temperature increases from −31.5 °C at the surface to −30.1 °C at 89 m a.g.l., before decreasing to −38.1 °C at 2032 m a.g.l. (Fig. 7a). During the AR (21 December 2018 at 11:00 UTC), the temperature is 12.3 °C higher than under non-AR conditions within the first 2000 m a.g.l. Outside the AR period, specific humidity averages 0.3 g kg−1 throughout the atmospheric column up to 2000 m a.g.l., whereas during the event it is on average more than three times higher and decreases progressively from 1.3 g kg−1 at the surface to 0.7 g kg−1 at 1964 m a.g.l. (Fig. 7b). Relative humidity with respect to ice is close to saturation both before and during the event (Fig. 7c). Wind speed outside the AR period averages 3.1 m s−1 throughout the atmospheric column up to 2000 m a.g.l. During the AR, the wind speed increases sharply from 6.7 m s−1 at the surface to 25.9 m s−1 at 1582 m a.g.l. (Fig. 7d). The model accurately captures variations in temperature, specific humidity, and wind speed both during and outside the AR event, but it underestimates relative humidity over the lowest 2000 m a.g.l. by 9 % during the event and by 16 % outside the event. Vertical profiles above 2000 m a.g.l. are shown in the Supplement (Fig. S9).
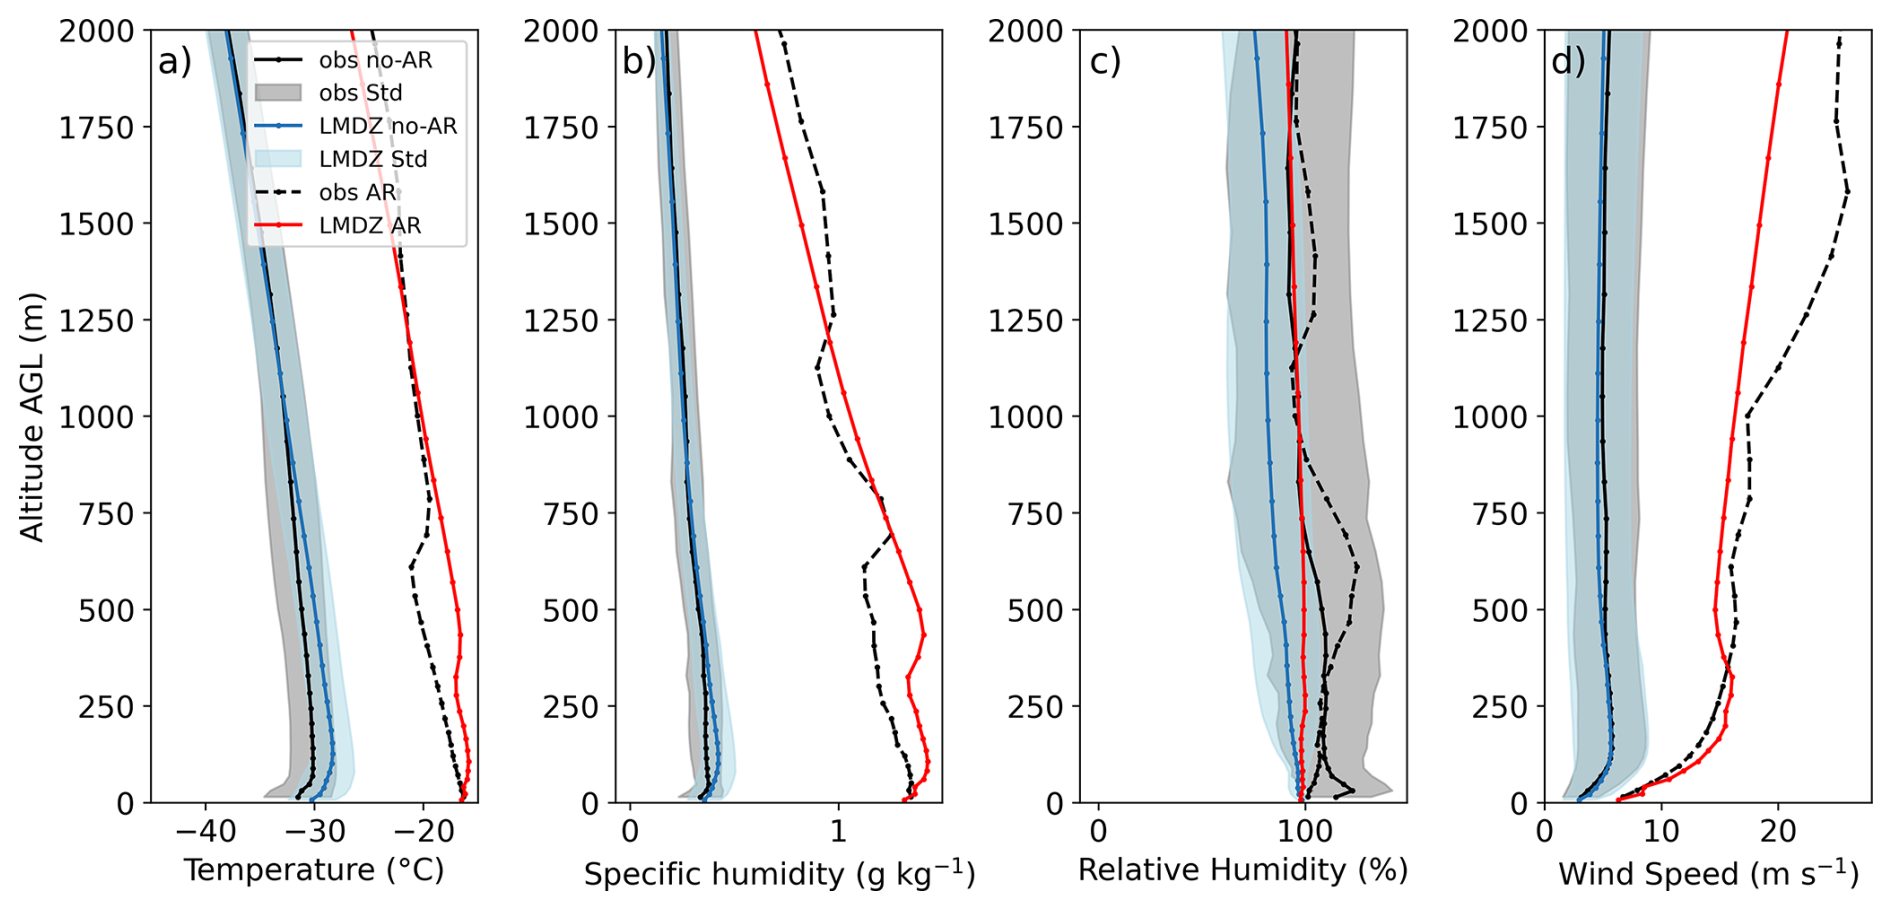
Figure 7Vertical profiles of (a) temperature (°C), (b) specific humidity (g kg−1), (c) relative humidity with respect to ice (%) and (d) wind speed (m s−1) from the surface to 2000 m a.g.l., based on average radiosonde measurements at the Concordia station during December 2018 excluding the event (19–23 December) (twice per day, black solid lines) and during the AR event (21 December 2018 at 11:00 UTC, black dashed lines). Corresponding LMDZ6iso model output at the nearest grid point for the same times are shown in blue lines (December averages) and red lines (AR event). The standard deviation is shown in gray for observations and in blue for LMDZ6iso for 52 radiosondes during December 2018 outside the AR event.
We now use the model to obtain a more detailed understanding of the sources of isotopic variability measured at the surface during the AR event. In the model, variations in specific humidity and water isotopes are governed by the four processes outlined in Sect. 2.3: surfaces fluxes, cloud condensation and precipitation sublimation, shallow convection and advection. Our goal is to identify the contributions of these processes to the observed surface variations in specific humidity and δ18O between 19 and 23 December 2018. At Concordia, the diurnal cycle is characterised by maximum solar insolation at 03:00 UTC and minimum insolation at 15:00 UTC (local time at Concordia is UTC+8). The warm temperature anomaly characteristic of the AR event at the surface extends up to 2000 m a.g.l. throughout the study period (Fig. 7a). This anomaly overlays the diurnal cycle, which is marked by nocturnal surface cooling (Fig. 8a). For specific humidity, a positive anomaly associated with the AR is observed from 20–21 December within the first 1000 m a.g.l., with a peak intensity on 21 December (Fig. 8b). Relative humidity exhibits a sharp decrease to approximately 20 % from 18 December, evident above 200 m a.g.l. This is followed by a period of saturation starting on 20 December and lasting until early 22 December, before transitioning back to a drier phase (relative humidity lower than 20 %) on 22 and 23 December, above 300 m a.g.l. (Fig. 8c).
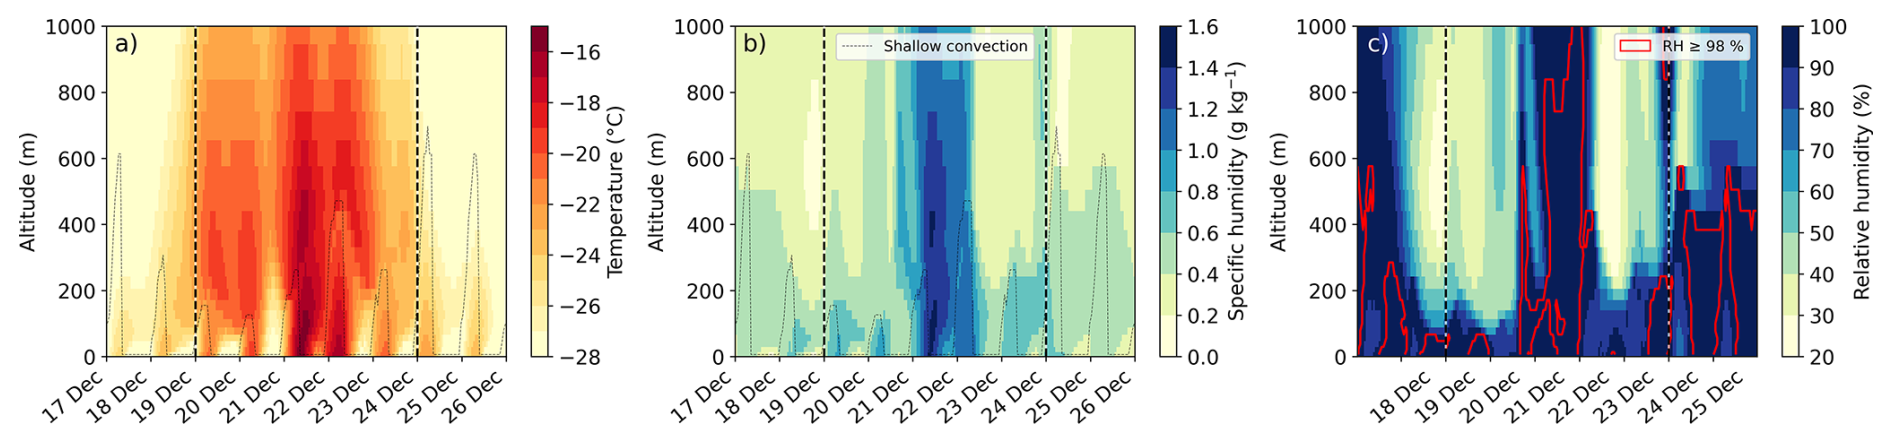
Figure 8Modelled vertical profiles of (a) temperature (°C), (b) specific humidity (g kg−1), and (c) relative humidity with respect to ice (%) at Concordia. The red outline indicates regions where the relative humidity is higher than 98 %. The dotted lines indicate the height of the mixed layer during shallow convection. The dashed vertical lines delineate the boundaries of the atmospheric river. All times are given in UTC.
Based on the model's water vapour tendencies, daytime surface sublimation and the turbulent transport of moisture in the first 200 m a.g.l., extending up to 400 m a.g.l. on 21 and 22 December, result in an enrichment of atmospheric vapour in δ18O (Fig. 9a, b). During nighttime, the temperature decreases, leading to saturation and condensation near the surface, which causes a reduction in δ18O in surface vapour. The analysis of specific humidity and δ18O tendencies in the surface layer (0–6.7 m a.g.l.) confirms the strong influence of surface sublimation and turbulence on the surface signal, both during the typical diurnal cycle and the AR event (Fig. 10). Shallow convection mixes this humidity within the mixed layer (from the surface to 200–400 m a.g.l.) during the day, transporting surface moisture upward. This process decreases δ18O at the surface while enriching vapour at higher altitudes (Figs. 9c, d and 10). Cloud condensation leads to a depletion of both moisture and δ18O around 400 m during the peak of the event, as well as during the post-event diurnal cycle (Fig. 9e, f). In contrast, the sublimation of clouds and precipitation enriches the air in both moisture and δ18O bellow the cloud, around 200 m a.g.l. Finally, advection transports large-scale moisture enriched in δ18O to the surface starting on 21 December, followed by a decrease in both moisture and δ18O on 22 December (Figs. 9g, h and 10).

Figure 9Decomposition of the rate of change in time of the different processes controlling specific humidity (a, c, e, g: in g kg−1 h−1) and vapour δ18O (b, d, f, h: in ‰ h−1) as a function of time at Concordia station. Panels (a) and (b) correspond to surface sublimation and turbulent mixing, panels (c) and (d) to shallow convection, panels (e) and (f) to cloud condensation and precipitation sublimation and panels (g) and (h) to advection. It should be noted that the sign of changes is relative to water vapour so the surface sublimation is positive (increase in water vapour) and the cloud condensation is negative (decrease in water vapour). The dotted lines indicate the height of the mixed layer during shallow convection. The dashed vertical lines delineate the boundaries of the atmospheric river. All times are given in UTC.
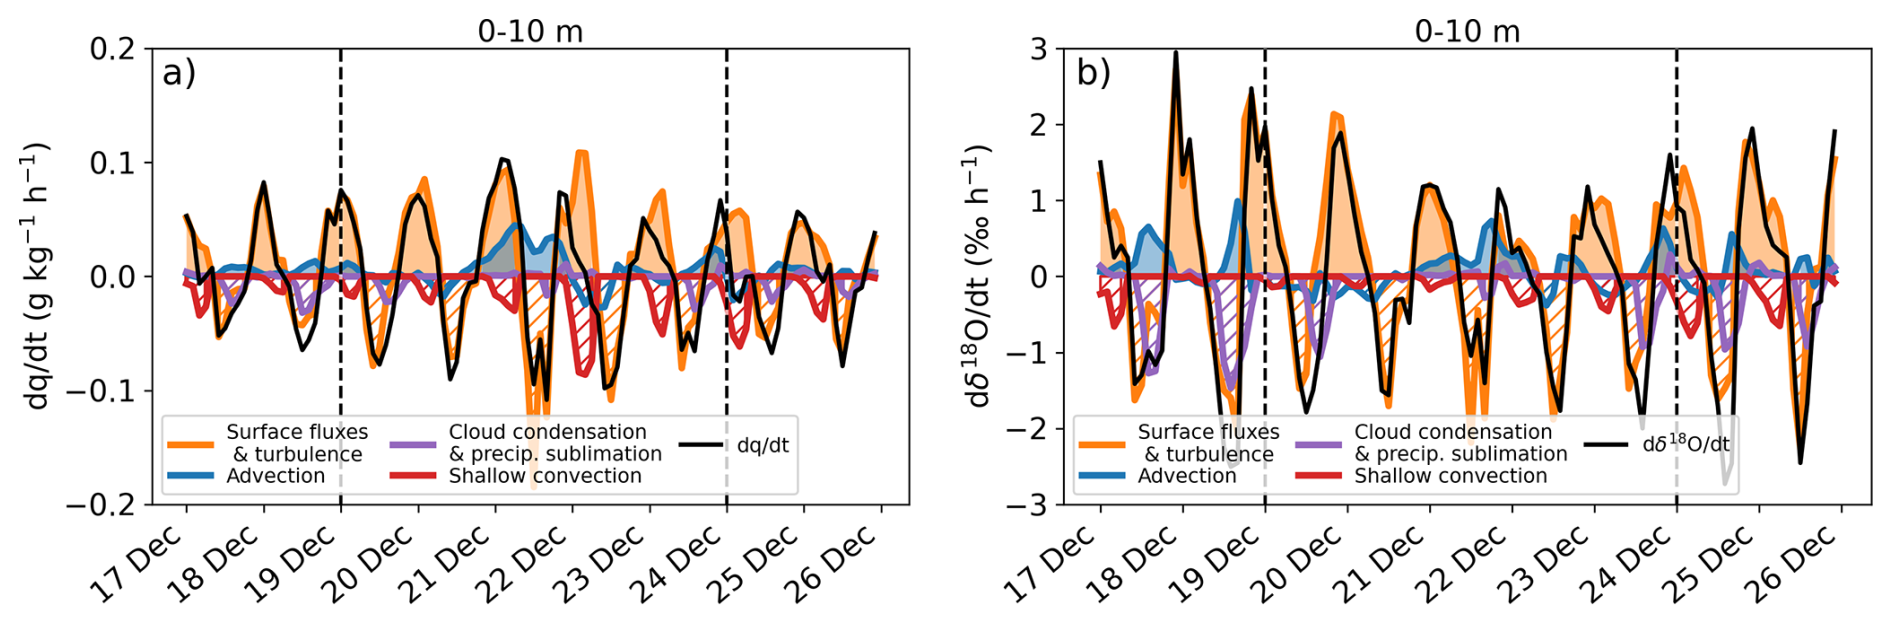
Figure 10Rate of temporal change in the surface atmospheric layer due to the different processes contributing to the (a) specific humidity tendency (g kg−1 h−1) and (b) vapour δ18O tendency (‰ h−1) at Concordia station. The black line represents the signal obtained from the first level model output. The individual contributions to the rate of change of humidity and δ18O are shown in colour: orange for vertical turbulent diffusion and surface fluxes, blue for advection, purple for cloud condensation and precipitation sublimation and red for shallow convection. Processes with positive contributions are shown in solid colours, whereas processes with negative contributions are shown using hatched shading. It should be noted that the sign of changes is relative to water vapour so the surface sublimation is positive (increase in water vapour) and the cloud condensation is negative (decrease in water vapour). The dashed vertical lines delineate the boundaries of the atmospheric river.
We now aim to quantify the relative contributions from large-scale processes (advection) and local processes (surface and atmospheric sublimation) to the specific humidity and δ18O signals during the AR. For this, we track the sources of atmospheric vapour through processes with positive tendencies. We consider that atmospheric vapour is the mixing of 3 buckets corresponding to 3 different sources: surface sublimation, large-scale advection, and cloud and precipitation sublimation (Fig. 11a, b), following the approach described in Sect. 2.3. As shallow convection always transports water from the surface towards the upper layers (shallow convection tendencies always negative in the surface atmospheric layer, Fig. 10), it does not contribute to the surface specific humidity as a water source. At the peak of the event, the large-scale advection accounts for 30 % of the moisture amount (0.44 g kg−1), while surface sublimation accounts for 69 % (1.01 g kg−1). Cloud and precipitation sublimation plays a minor role, contributing for 1 % of the surface vapour (0.02 g kg−1). To facilitate the interpretation of the total isotopic signal, we analysed the δ18O anomaly relative to the mean vapour δ18O during the clear-sky diurnal cycles (−62 ‰). The total δ18O anomaly (Fig. 11d) is computed as the weighted sum of each process’s δ18O anomaly value (Fig. 11c), scaled by its moisture contribution (Fig. 11b), according to Eqs. (13) and (14). The δ18O associated with surface sublimation exhibits a pronounced diurnal cycle, closely matching the total δ18O, with a maximum of −51 ‰ at the peak of the event (Fig. 11c). The δ18O related to large-scale advection and cloud and precipitation sublimation shows a significant depletion on 20 December (−94 ‰ and −85 ‰, respectively), followed by a sharp increase, reaching maximum values of −51 ‰ and −40 ‰, respectively, at the event's peak. During the peak of the event, surface sublimation is the primary contributor of surface vapour increase in δ18O, enriching the mean surface vapour by 7.8 ‰ compared to the mean clear-sky diurnal cycle, which accounts for 68 % of the total increase. Large-scale advection contributes for an additional 3.4 ‰, corresponding to 30 % of the increase. Finally, cloud and precipitation sublimation slightly enriches the vapour by 0.2 ‰, contributing to 2 % of the overall increase. The complete period corresponding to Fig. 11a and d is presented in Fig. S10.
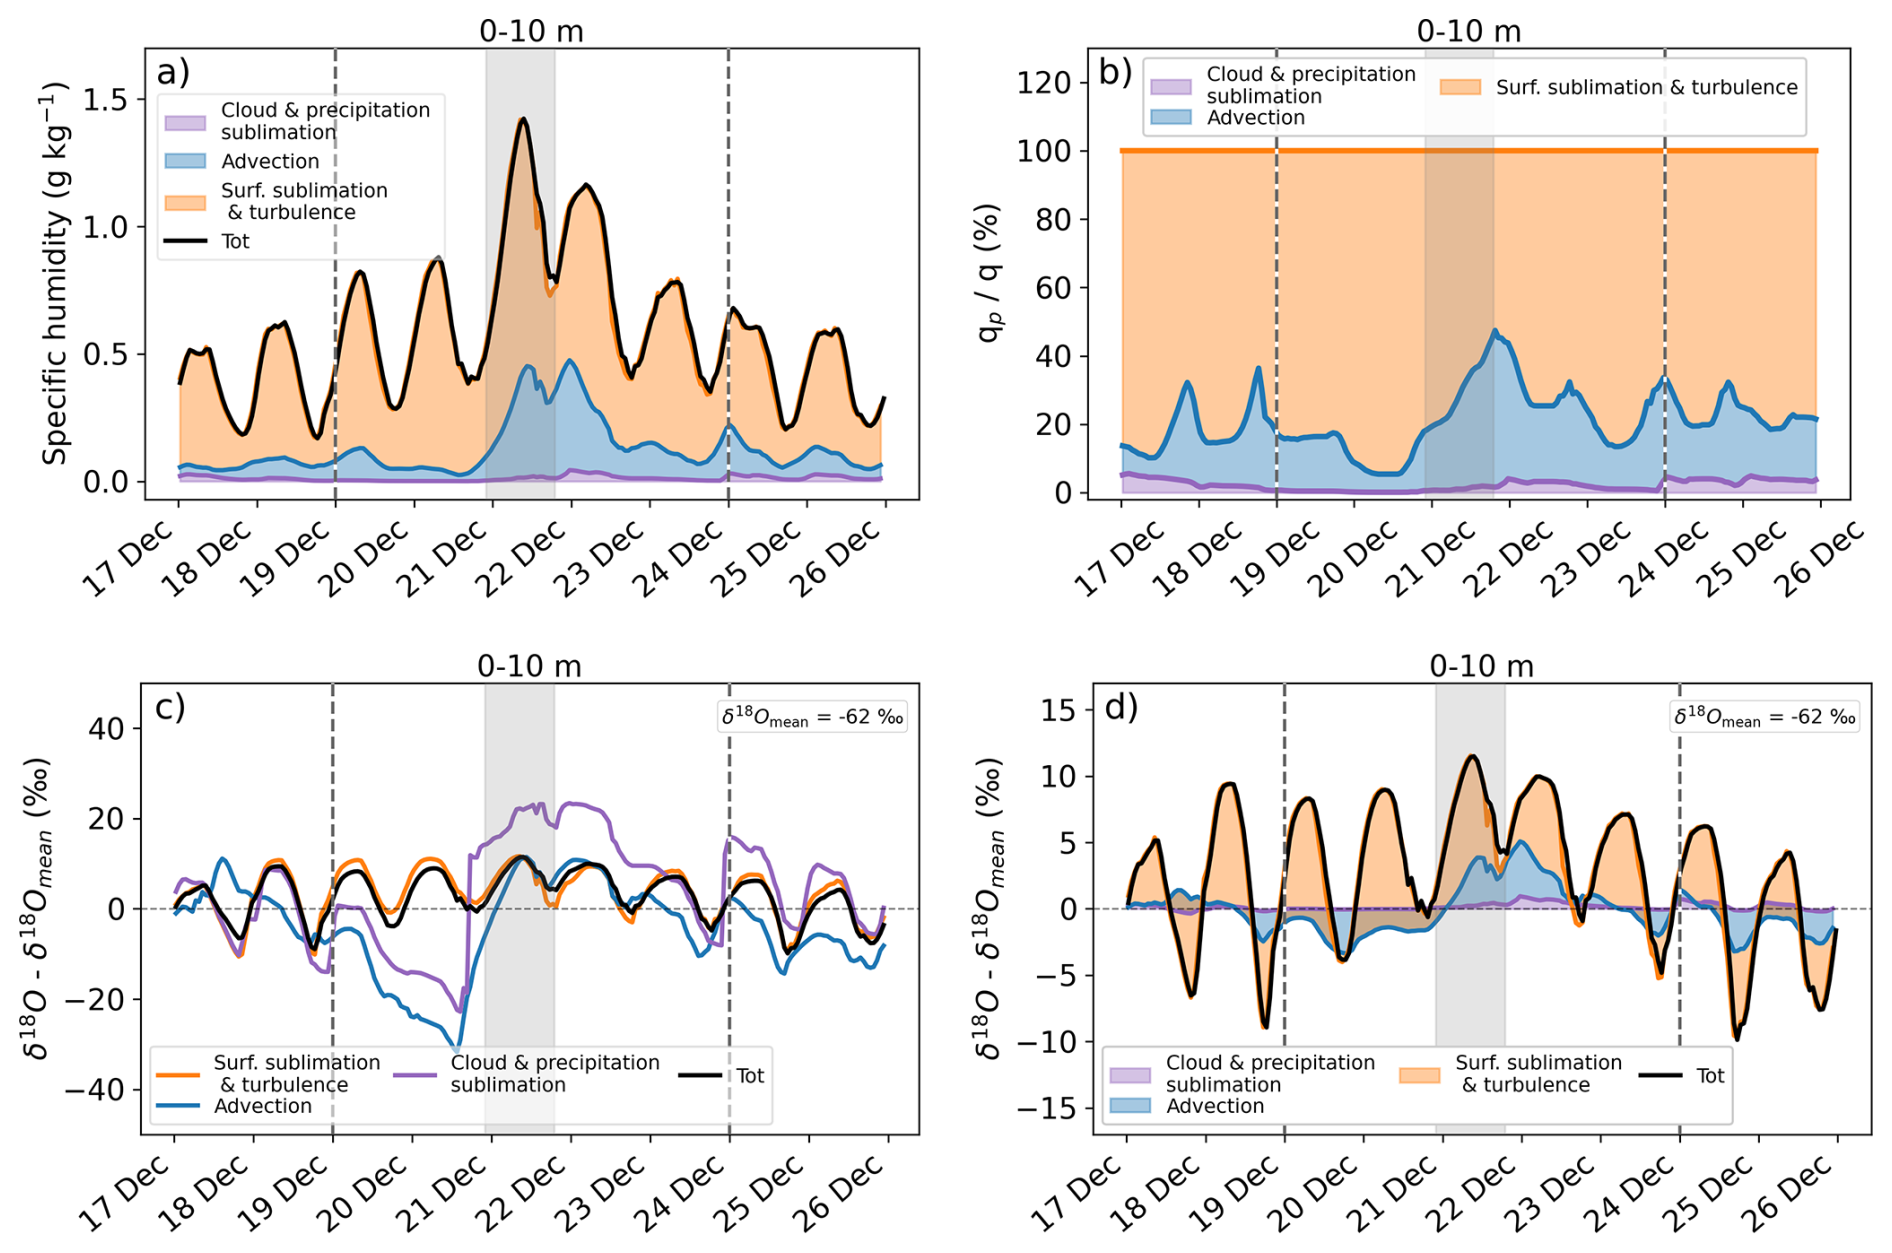
Figure 11(a) Temporal evolution of the positive contributions of different processes to the surface specific humidity (6.7 m a.g.l.) and (b) their respective percentages. (c) Evolution of the δ18O anomaly relative to the mean clear-sky diurnal cycle value (δ18Omean = −62 ‰), associated with different processes. (d) Positive contributions of different processes to the surface δ18O anomaly relative to this mean diurnal value. The black line represents the signal obtained from total specific humidity and δ18O. Individual contributions to specific humidity and δ18O are shown in colour: orange for surface sublimation and vertical turbulent diffusion, blue for advection, and purple for cloud and precipitation sublimation. Vertical dashed lines mark the AR period (19–23 December), while the shaded area highlights the peak of the event, reached on 21 December at 09:30 UTC.
The December 2018 AR event observed at Concordia, which originated from the Atlantic sector and crossed the Antarctic continent, illustrates the interaction between local processes and large-scale mechanisms that control the isotopic signature of surface water vapour. This is the first atmospheric river event observed at Dome C with available isotopic vapour observations, and the only one recorded over the 2009–2019 period originating from the Atlantic sector (Petteni et al., 2025). The processes governing the surface vapour δ18O signal are presented in Fig. 12 for clear-sky conditions (left) and for the AR event (right). Under clear-sky conditions, the diurnal cycle of δ18O is primarily controlled by the surface sublimation and condensation cycle. During the day, surface snow sublimation enriches surface vapour, which is mixed within the boundary layer by shallow convection. At night, cooling of the air leads to condensation both in the atmosphere and at the surface, resulting in a depletion in the vapour δ18O. Additionally, the strong atmospheric stratification at night leads to a decoupling between surface and higher-altitude atmospheric layers. At the peak of the AR event, surface sublimation is identified as the primary source of both specific humidity and vapour δ18O, accounting for approximately 70 % of the total contribution. The second major contribution comes from large-scale moisture advection associated with the AR, accounting for approximately 30 %. These results emphasize that the observed isotopic signal cannot be attributed solely to large-scale atmospheric transport but requires a detailed consideration of local boundary layer processes. Thus, this study deepens our understanding of the local and synoptic processes that shape the vapour isotopic signal in polar regions. We note, however, that in the model there is currently no isotopic fractionation during surface sublimation. While numerous field studies have demonstrated that the sublimation flux is fractionating (Steen-Larsen et al., 2013; Casado et al., 2016; Madsen et al., 2019), the introduction of a fractionation scheme in the model could reduce the contribution of sublimation. Nevertheless, the analysis of the total water budget suggests that surface sublimation makes a substantial contribution to the observed specific humidity anomaly.
To extend our surface analysis, we also performed a water and isotope budget analysis across the entire mixed layer (Fig. S11). Integrating processes over a variable mixed layer height introduces a contribution from the entrainment with upper layers, as explained in Sect. 2.3.2. Applying the same process attribution as for the surface, we find that 49 % of the specific humidity content at the AR peak is attributed to surface sublimation and turbulence, while 38 % is due to advection and 13 % to entrainment (Fig. S12a, b). Since the entrainment term represents a combination of water originating from surface sublimation and advection, we observe that at least half of the mixed layer vapour content comes from surface sublimation, aligning with the surface-level analysis. For δ18O, the mixed layer analysis indicates that 48 % of the contributions originate from advection, 39 % from surface sublimation, and 13 % from entrainment compared to the mean clear-sky diurnal cycles (−62 ‰) (Fig. S12d). By attributing all entrained water to advection, we obtain a contribution to total vapour of 61 % by advection and 39 % by sublimation, which we consider to be the upper bound for the contribution of advection to the mixed layer isotopic signal.
Finally, we perform a process-based analysis for positive and negative tendencies to estimate not only the sources of vapour, but also the processes driving the variability of specific humidity and δ18O during the event. To this end, we compared the unperturbed diurnal cycle prior to the AR event (1–17 December), during which we computed the mean cumulative temporal change in specific humidity associated with each process (Eq. 5; Fig. S13a) and in δ18O associated with each process (Eqs. 6 and 7; Fig. S13c). We then examined the anomaly during the AR event (19–24 December) relative to this reference diurnal-cycle period, for both specific humidity and δ18O (Fig. S13b, d). For specific humidity, the first 3 d of the event are characterized by a progressive increase in surface sublimation, to which advection contributes from the third day onward, explaining the main humidity peak on 21 December (Fig. S13b). During the night on 21 December, the surface condensation is partly compensated by increased advection. On 22 December, the combination of surface sublimation and advection explains the second peak in specific humidity. Throughout the event, shallow convection and cloud condensation act to reduce the amount of water in the near-surface atmosphere. For δ18O, we find a slight positive anomaly in surface sublimation during the first 2 d of the event compared with the typical diurnal cycle, followed by a negative surface-flux anomaly from the fourth day onwards. The negative contributions to δ18O from condensation and shallow convection are weaker than during unperturbed diurnal cycles. In addition, advection decreases the vapour δ18O in the model during the peak of the event. Because the amplitude of vapour δ18O during surface sublimation and condensation cycles is overestimated under unperturbed conditions, as shown here and previously discussed in Dutrievoz et al. (2025b) and Ollivier et al. (2025a), the interpretation of isotopic anomalies during the event remains limited, underscoring the need to correct this bias in the LMDZ6iso model (Fig. S13d).

Figure 12Summary of the processes controlling the modelled isotopic composition of surface vapour at Concordia during classical diurnal cycle (left) and during the AR (right). The processes of surface fluxes and turbulent mixing are shown in orange, cloud condensation and precipitation sublimation is shown in purple, shallow convection is shown in red and advection is in blue.
This study demonstrates that the LMDZ6iso model performs well in representing surface meteorological variables during the AR event. With regard to vapour isotopes, the model accurately captures the maximum vapour δ18O during the event, however the overestimated amplitude of vapour δ18O outside the event, discussed above, raises doubts as to whether this agreement reflects the correct physical processes. This overestimated amplitude may result either from excessive daytime enrichment during sublimation and/or from excessive nighttime depletion during condensation. The analysis of humidity and isotopic tendencies using the LMDZ6iso model proves particularly effective in disentangling and quantifying the contributions of processes influencing the simulated isotopic signal. This methodology offers a promising perspective for better understanding the interactions between local mechanisms and large-scale processes within the surface boundary layer, as well as for more effectively interpreting the isotopic signature of atmospheric rivers in water vapour.
To this end, a first step is to improve the representation of isotopic processes in climate models. Recent studies have demonstrated that isotopic fractionation occurs during sublimation (Madsen et al., 2019; Wahl et al., 2021; Hughes et al., 2021), challenging the assumption of non-fractionating fluxes. Given that local sublimation fluxes dominate over large-scale advection in contributing to surface vapour isotopic variations, incorporating isotopic fractionation during sublimation, as in Wahl et al. (2022) and Dietrich et al. (2023), is a promising perspective to improve the simulation of water vapour isotopes over Antarctica, as it is expected to reduce the amplitude of isotopic diurnal cycle variations by decreasing vapour enrichment during sublimation. Consequently, this could lower the isotopic contribution of surface sublimation during the AR. Additionally, improving the representation of snow in the LMDZ6iso model could further advance the accuracy of vapour isotopic composition simulations. Currently, the model averages snowfall from the start of the simulation into a single snow bucket, yielding a long-term mean isotopic value that obscures variability associated with recent events. Consequently, fresh precipitation, which directly influences the isotopic composition of vapour through sublimation, is not adequately represented. To address this limitation, future developments will aim at implementing a more detailed snow bucket scheme capable of capturing the isotopic impact of recent precipitation on surface water vapour.
In parallel, a more detailed investigation of snowfall and surface snow evolution during AR events is also needed. Surface snow is expected to reflect both the isotopically enriched snowfall associated with ARs and wind-blown snow, as wind speed exceeded 10 m s−1 during this specific event. At such intensities, drifting snow can be lifted several hundred metres above the surface (Palm et al., 2011), where it may readily sublimate, potentially changing the isotopic composition of atmospheric water vapour (Wahl et al., 2024). Consequently, the sublimation of airborne snowflakes may exhibit a distinct isotopic signature than that of sublimation flux from the surface. As this process is not currently represented in LMDZ6iso, understanding its contribution to the surface isotopic signal would be a valuable next step.
To assess whether our analysis is representative of the interactions between large-scale and local processes, it would be valuable to analyse additional AR events, both at Concordia and other locations, to determine whether the contributions of local and large-scale processes vary depending on the event and location. In terms of detection algorithms, this trans-Antarctic AR highlights the need for an AR detection framework that is not restricted to 85° S. Future developments in polar AR detection will hopefully address this limitation. In our study, the AR crosses the Antarctic Plateau for 3 d, from its arrival in western Dronning Maud Land on 17 December to its passage over Concordia on 19 December. During this period, the AR moves through an extremely dry atmosphere, where its passage induces a strong temperature anomaly, leading to significant surface sublimation. This process may have progressively modified the isotopic composition of the AR. As a result, the AR could gradually reach an isotopic composition similar to that of surface snow, thereby weakening the contribution of advection to the observed δ18O anomaly at the surface in Concordia. To test this further, similar studies should be conducted on other AR events with different moisture origins and at stations located at varying distances from the coast. The March 2022 atmospheric river would be an excellent case study, as a +28 ‰ anomaly in water vapour δ18O was measured at Concordia (Wille et al., 2024b), with the moisture originating from the Indian Ocean. This would help determine whether the isotopic composition of an AR equilibrates with that of surface snow as it travels across the Antarctic Plateau. Moreover, an isotopic analysis of these events using a Lagrangian approach, combined with a process-based decomposition similar to that of Dütsch et al. (2018), would provide a complementary perspective on the processes involved during the transport of atmospheric rivers.
Finally, it would be valuable to gain a more detailed understanding of the isotopic composition of water vapour throughout the vertical structure of the atmosphere. In this study, we have highlighted the strong contribution of surface sublimation to the isotopic anomaly at the surface and within the boundary layer. However, evaluating our model at higher altitudes remains crucial. For example, using observational data, it would be necessary to evaluate daytime shallow convection, as this process mixes the boundary layer and transports moisture from the surface to higher altitudes. Recently, Rozmiarek et al. (2025) used fixed-wing uncrewed aircraft to obtain isotopic observations (δ18O and δD) up to 1500 m a.g.l. over the northeastern Greenland Ice Sheet during summer 2022. This innovative approach revealed an “inverted-C” vertical structure for δ18O and δD under cloudy conditions and a “C-shaped” structure for d-excess between the surface and 1500 m altitude. This pattern reflects the dual influence of local-scale processes, such as surface sublimation and large-scale advection. Reproducing this methodology under clear-sky conditions and during AR events in Antarctica and Greenland would provide a valuable extension to our surface and mixed layer analysis. Furthermore, isotopic measurements at higher altitudes would help better constrain the microphysics of mixed-phase clouds, which are frequently observed over the Antarctic Plateau (Ricaud et al., 2020, 2024b).
To compute the isotopic delta as a function of the isotopic delta associated with each process, we use the definition of δ = . In the LMDZ6iso model, water variables are defined by the specific humidity of total water q (in kg kg−1) and the specific humidity of each water isotopes qiso (in kg kg−1). The specific humidity of total water and of each water isotope can be decomposed as the sum of the contributions from each process:
where q|process and qiso|process represent the total specific humidity and the isotopic specific humidity respectively, associated with each process (in kg kg−1), computed as the time integral of the isotopic tendencies:
Using these variables, the isotopic ratio R in mol mol−1 can be computed as follows:
where Miso is the molar mass of the water isotope (in kg mol−1), and M16 is the molar mass of HO (in kg mol−1). In this equation, we approximated the specific humidity of HO, q16, by the specific humidity of total water q.
Using this framework, the δ of water vapour becomes:
From Eqs. (A2) and (A10), we compute the global δ anomaly relative to the mean diurnal cycle value, expressed as a function of the isotopic contributions associated with each process (Eq. 14):
The LMDZ6iso model outputs generated for this study are available at https://doi.org/10.5281/zenodo.15481580 (Dutrievoz et al., 2025a). Radiosonde data are provided in Grigioni et al. (2019, https://doi.org/10.1594/PANGAEA.899638), AWS data in Grigioni et al. (2022, https://doi.org/10.12910/DATASET2022-002), and water vapour isotopic measurements in Leroy-Dos Santos et al. (2021). The meteorological tower data from the 45 m mast are part of the CALVA project and can be accessed at https://web.lmd.jussieu.fr/~cgenthon/SiteCALVA/CalvaData.html (last access: 2 February 2026). The database containing the atmospheric river (AR) detection catalogues is available on Zenodo at https://doi.org/10.5281/zenodo.15830634 (Wille, 2025).
The python scripts written to generate the analyses and figures for this study are available at https://doi.org/10.5281/zenodo.15481977 (Dutrievoz and Agosta, 2025).
The study was designed by ND, CA and AL. Analyses were performed by ND, CA, CD, and JW. The LMDZ6iso simulations were carried out by ND, CA and SN. Water isotopes data collection and analysis were performed by AL, MB, FP, and EF. All authors contributed to reviewing and improving the manuscript.
The contact author has declared that none of the authors has any competing interests.
Publisher's note: Copernicus Publications remains neutral with regard to jurisdictional claims made in the text, published maps, institutional affiliations, or any other geographical representation in this paper. The authors bear the ultimate responsibility for providing appropriate place names. Views expressed in the text are those of the authors and do not necessarily reflect the views of the publisher.
Jonathan Wille acknowledges support from the Agence Nationale de la Recherche project ANR-20-CE01-0013 (ARCA). Inès Ollivier acknowledges support from the EU H2020 research and innovation programme under the Marie Skłodowska-Curie grant agreement 955750 (DEEPICE). This work is part of the AWACA project that has received funding from the European Research Council (ERC) under the European Union's Horizon 2020 research and innovation program (grant agreement no. 951596). Data and information were obtained from IPEV/PNRA Project “Routin Meteorological Observation at Station Concordia” – http://www.climantartide.it (last access: 2 February 2026) The water vapour isotopic data presented in this study has been collected within the frame of the French Polar Institute (IPEV) project NIVO 1110. We acknowledge using data from the project CALVA 1013 and GLACIOCLIM observatories supported by the French Polar Institute (IPEV) and the Observatoire des Sciences de l'Univers de Grenoble (OSUG) (https://web.lmd.jussieu.fr/~cgenthon/SiteCALVA/CalvaData.html, https://glacioclim.osug.fr/, last access: 15 December 2025). The HAMSTRAD programme (910) has been funded by the Institut National des Sciences de l’Univers (INSU)/Centre National de la Recherche Scientifique (CNRS), the Institut polaire français Paul-Emile Victor (IPEV), Météo-France and the Centre National d’Etudes Spatiales (CNES). We acknowledge Antoine Berchet for his help for performing back-trajectory analyses with the FLEXPART model. The LMDZ6iso simulations were performed with computing HPC and storage resources by GENCI at IDRIS and TGCC thanks to the grant 2025-AD010114000R2 on the supercomputers Jean Zay's CSL partition and Joliot Curie's ROME partition. We also indicate we used artificial intelligence (AI) tools to improve the English syntax in some sections of the manuscript, as well as to provide comments and suggestions for optimizing portions of the code.
This research has been supported by the European Research Council, EU H2020 (grant no. 951596) and the Agence Nationale de la Recherche (grant no. ANR-20-CE01-0013).
This paper was edited by T. J. Fudge and reviewed by Michelle Maclennan and one anonymous referee.
Adusumilli, S., Fish, M., Fricker, H. A., and Medley, B.: Atmospheric River Precipitation Contributed to Rapid Increases in Surface Height of the West Antarctic Ice Sheet in 2019, Geophys. Res. Lett., 48, https://doi.org/10.1029/2020GL091076, 2021. a
Bai, J., Zong, X., Lanconelli, C., Lupi, A., Driemel, A., Vitale, V., Li, K., and Song, T.: Long-Term Variations of Global Solar Radiation and Its Potential Effects at Dome C (Antarctica), Int. J. Env. Res. Pub. He., 19, 3084, https://doi.org/10.3390/ijerph19053084, 2022. a
Bonne, J.-L., Steen-Larsen, H. C., Risi, C., Werner, M., Sodemann, H., Lacour, J.-L., Fettweis, X., Cesana, G., Delmotte, M., Cattani, O., Vallelonga, P., Kjaer, H. A., Clerbaux, C., Sveinbjörnsdóttir, A. E., and Masson-Delmotte, V.: The summer 2012 Greenland heat wave: In situ and remote sensing observations of water vapor isotopic composition during an atmospheric river event, J. Geophys. Res.-Atmos., 120, 2970–2989, https://doi.org/10.1002/2014JD022602, 2015. a
Boucher, O., Servonnat, J., Albright, A. L., Aumont, O., Balkanski, Y., Bastrikov, V., Bekki, S., Bonnet, R., Bony, S., Bopp, L., Braconnot, P., Brockmann, P., Cadule, P., Caubel, A., Cheruy, F., Codron, F., Cozic, A., Cugnet, D., D'Andrea, F., Davini, P., De Lavergne, C., Denvil, S., Deshayes, J., Devilliers, M., Ducharne, A., Dufresne, J., Dupont, E., Éthé, C., Fairhead, L., Falletti, L., Flavoni, S., Foujols, M., Gardoll, S., Gastineau, G., Ghattas, J., Grandpeix, J., Guenet, B., Guez, E., L., Guilyardi, E., Guimberteau, M., Hauglustaine, D., Hourdin, F., Idelkadi, A., Joussaume, S., Kageyama, M., Khodri, M., Krinner, G., Lebas, N., Levavasseur, G., Lévy, C., Li, L., Lott, F., Lurton, T., Luyssaert, S., Madec, G., Madeleine, J., Maignan, F., Marchand, M., Marti, O., Mellul, L., Meurdesoif, Y., Mignot, J., Musat, I., Ottlé, C., Peylin, P., Planton, Y., Polcher, J., Rio, C., Rochetin, N., Rousset, C., Sepulchre, P., Sima, A., Swingedouw, D., Thiéblemont, R., Traore, A. K., Vancoppenolle, M., Vial, J., Vialard, J., Viovy, N., and Vuichard, N.: Presentation and Evaluation of the IPSL‐CM6A‐LR Climate Model, J. Adv. Model. Earth Sy., 12, e2019MS002010, https://doi.org/10.1029/2019MS002010, 2020. a
Casado, M., Landais, A., Masson-Delmotte, V., Genthon, C., Kerstel, E., Kassi, S., Arnaud, L., Picard, G., Prie, F., Cattani, O., Steen-Larsen, H.-C., Vignon, E., and Cermak, P.: Continuous measurements of isotopic composition of water vapour on the East Antarctic Plateau, Atmos. Chem. Phys., 16, 8521–8538, https://doi.org/10.5194/acp-16-8521-2016, 2016. a, b, c
Casado, M., Landais, A., Picard, G., Arnaud, L., Dreossi, G., Stenni, B., and Prié, F.: Water Isotopic Signature of Surface Snow Metamorphism in Antarctica, Geophys. Res. Lett., 48, https://doi.org/10.1029/2021GL093382, 2021. a, b
Craig, H.: Isotopic Variations in Meteoric Waters, Science, 133, 1702–1703, https://doi.org/10.1126/science.133.3465.1702, 1961. a
Dansgaard, W.: Stable isotopes in precipitation, Tellus A, 16, 436, https://doi.org/10.3402/tellusa.v16i4.8993, 1964. a
Dietrich, L. J., Steen-Larsen, H. C., Wahl, S., Jones, T. R., Town, M. S., and Werner, M.: Snow-Atmosphere Humidity Exchange at the Ice Sheet Surface Alters Annual Mean Climate Signals in Ice Core Records, Geophys. Res. Lett., 50, e2023GL104249, https://doi.org/10.1029/2023GL104249, 2023. a, b
Dreossi, G., Masiol, M., Stenni, B., Zannoni, D., Scarchilli, C., Ciardini, V., Casado, M., Landais, A., Werner, M., Cauquoin, A., Casasanta, G., Del Guasta, M., Posocco, V., and Barbante, C.: A decade (2008–2017) of water stable isotope composition of precipitation at Concordia Station, East Antarctica, The Cryosphere, 18, 3911–3931, https://doi.org/10.5194/tc-18-3911-2024, 2024. a
Dutrievoz, N. and Agosta, C.: Scripts - Water vapour isotope anomalies during an atmospheric river event at Dome C, East Antarctica, Zenodo [code], https://doi.org/10.5281/zenodo.15481977, 2025. a
Dutrievoz, N., Agosta, C., and Nguyen, S.: LMDZiso output - Water vapour isotope anomalies during an atmospheric river event at Dome C, East Antarctica, Zenodo [data set], https://doi.org/10.5281/zenodo.15481580, 2025a. a
Dutrievoz, N., Agosta, C., Risi, C., Vignon, É., Nguyen, S., Landais, A., Fourré, E., Leroy-Dos Santos, C., Casado, M., Masson-Delmotte, V., Jouzel, J., Dubos, T.,A Ollivier, I., Stenni, B., Dreossi, G., Masiol, M., Minster, B., and Prié, F.: Antarctic water stable isotopes in the global atmospheric model LMDZ6: From climatology to boundary layer processes, J. Geophys. Res.-Atmos., 130, e2024JD042073, https://doi.org/10.1029/2024JD042073, 2025b. a, b, c, d, e
Dütsch, M., Pfahl, S., Meyer, M., and Wernli, H.: Lagrangian process attribution of isotopic variations in near-surface water vapour in a 30-year regional climate simulation over Europe, Atmos. Chem. Phys., 18, 1653–1669, https://doi.org/10.5194/acp-18-1653-2018, 2018. a
EPICA community members: Eight glacial cycles from an Antarctic ice core, Nature, 429, 623–628, 2004. a
Eyring, V., Bony, S., Meehl, G. A., Senior, C. A., Stevens, B., Stouffer, R. J., and Taylor, K. E.: Overview of the Coupled Model Intercomparison Project Phase 6 (CMIP6) experimental design and organization, Geosci. Model Dev., 9, 1937–1958, https://doi.org/10.5194/gmd-9-1937-2016, 2016. a
Gat, J., Klein, B., Kushnir, Y., Roether, W., Wernli, H., Yam, R., and Shemesh, A.: Isotope composition of air moisture over the Mediterranean Sea: an index of the air–sea interaction pattern, Tellus B, 55, 953–965, 2011. a
Genthon, C., Six, D., Favier, V., Lazzara, M., and Keller, L.: Atmospheric temperature measurement biases on the Antarctic plateau, J. Atmos. Ocean. Tech., 28, 1598–1605, 2011. a, b
Genthon, C., Six, D., Scarchilli, C., Ciardini, V., and Frezzotti, M.: Meteorological and snow accumulation gradients across Dome C, East Antarctic plateau, Int. J. Climatol., 36, 455–466, 2016. a
Genthon, C., Piard, L., Vignon, E., Madeleine, J.-B., Casado, M., and Gallée, H.: Atmospheric moisture supersaturation in the near-surface atmosphere at Dome C, Antarctic Plateau, Atmos. Chem. Phys., 17, 691–704, https://doi.org/10.5194/acp-17-691-2017, 2017. a, b
Genthon, C., Veron, D. E., Vignon, E., Madeleine, J.-B., and Piard, L.: Water vapor in cold and clean atmosphere: a 3-year data set in the boundary layer of Dome C, East Antarctic Plateau, Earth Syst. Sci. Data, 14, 1571–1580, https://doi.org/10.5194/essd-14-1571-2022, 2022. a
Genthon, C., Veron, D., Vignon, E., Madeleine, J.-B., and Piard, L.: Water vapor observation in the lower atmospheric boundary layer at Dome C, East Antarctic plateau, p. 3 datasets, PANGAEA [data set], https://doi.org/10.1594/PANGAEA.939425, 2021a. a
Genthon, C., Veron, D., Vignon, E., Six, D., Dufresne, J. L., Madeleine, J.-B., Sultan, E., and Forget, F.: Ten years of shielded ventilated atmospheric temperature observation on a 45-m tower at Dome C, East Antarctic plateau, PANGAEA [data set], https://doi.org/10.1594/PANGAEA.932512, 2021b. a
Gorodetskaya, I. V., Tsukernik, M., Claes, K., Ralph, M. F., Neff, W. D., and Van Lipzig, N. P. M.: The role of atmospheric rivers in anomalous snow accumulation in East Antarctica, Geophys. Res. Lett., 41, 6199–6206, https://doi.org/10.1002/2014GL060881, 2014. a
Gorodetskaya, I. V., Durán-Alarcón, C., González-Herrero, S., Clem, K. R., Zou, X., Rowe, P., Rodriguez Imazio, P., Campos, D., Leroy-Dos Santos, C., Dutrievoz, N., Wille, J. D., Chyhareva, A., Favier, V., Blanchet, J., Pohl, B., Cordero, R. R., Park, S.-J., Colwell, S., Lazzara, M. A., Carrasco, J., Gulisano, A. M., Krakovska, S., Ralph, F. M., Dethinne, T., and Picard, G.: Record-high Antarctic Peninsula temperatures and surface melt in February 2022: a compound event with an intense atmospheric river, npj Climate and Atmospheric Science, 6, 202, https://doi.org/10.1038/s41612-023-00529-6, 2023. a, b
Grigioni, P., Antonelli, A., Camporeale, G., Ciardini, V., De Silvestri, L., Dolci, S., Iaccarino, A., Proposito, M., and Scarchilli, C.: YOPP-SH Radiosonde measurements from Concordia Station, Antarctica, 2018-12, PANGAEA [data set], https://doi.org/10.1594/PANGAEA.899638, 2019. a, b
Grigioni, P., Camporeale, G., Ciardini, V., De Silvestri, L., Iaccarino, A., Proposito, M., and Scarchilli, C.: Dati meteorologici della Stazione meteorologica CONCORDIA presso la Base CONCORDIA STATION (DomeC), ENEA [data set], https://doi.org/10.12910/DATASET2022-002, 2022. a, b, c
Harris Stuart, R., Faber, A.-K., Wahl, S., Hörhold, M., Kipfstuhl, S., Vasskog, K., Behrens, M., Zuhr, A. M., and Steen-Larsen, H. C.: Exploring the role of snow metamorphism on the isotopic composition of the surface snow at EastGRIP, The Cryosphere, 17, 1185–1204, https://doi.org/10.5194/tc-17-1185-2023, 2023. a
Hersbach, H., Bell, B., Berrisford, P., Hirahara, S., Horányi, A., Muñoz‐Sabater, J., Nicolas, J., Peubey, C., Radu, R., Schepers, D., Simmons, A., Soci, C., Abdalla, S., Abellan, X., Balsamo, G., Bechtold, P., Biavati, G., Bidlot, J., Bonavita, M., De Chiara, G., Dahlgren, P., Dee, D., Diamantakis, M., Dragani, R., Flemming, J., Forbes, R., Fuentes, M., Geer, A., Haimberger, L., Healy, S., Hogan, R. J., Hólm, E., Janisková, M., Keeley, S., Laloyaux, P., Lopez, P., Lupu, C., Radnoti, G., De Rosnay, P., Rozum, I., Vamborg, F., Villaume, S., and Thépaut, J.: The ERA5 global reanalysis, Q. J. Roy. Meteor. Soc., 146, 1999–2049, https://doi.org/10.1002/qj.3803, 2020. a
Hoffmann, G., Werner, M., and Heimann, M.: Water isotope module of the ECHAM atmospheric general circulation model: A study on timescales from days to several years, J. Geophys. Res.-Atmos., 103, 16871–16896, https://doi.org/10.1029/98JD00423, 1998. a
Holtslag, A. A. M. and De Bruin, H. A. R.: Applied Modeling of the Nighttime Surface Energy Balance over Land, J. Appl. Meteorol., 27, 689–704, https://doi.org/10.1175/1520-0450(1988)027<0689:AMOTNS>2.0.CO;2, 1988. a
Hourdin, F., Rio, C., Grandpeix, J., Madeleine, J., Cheruy, F., Rochetin, N., Jam, A., Musat, I., Idelkadi, A., Fairhead, L., Foujols, M., Mellul, L., Traore, A., Dufresne, J., Boucher, O., Lefebvre, M., Millour, E., Vignon, E., Jouhaud, J., Diallo, F. B., Lott, F., Gastineau, G., Caubel, A., Meurdesoif, Y., and Ghattas, J.: LMDZ6A: The Atmospheric Component of the IPSL Climate Model With Improved and Better Tuned Physics, J. Adv. Model. Earth Sy., 12, e2019MS001892, https://doi.org/10.1029/2019MS001892, 2020. a
Hourdin, F., Ferster, B., Deshayes, J., Mignot, J., Musat, I., and Williamson, D.: Toward machine-assisted tuning avoiding the underestimation of uncertainty in climate change projections, Science Advances, 9, eadf2758, https://doi.org/10.1126/sciadv.adf2758, 2023. a
Hughes, A. G., Wahl, S., Jones, T. R., Zuhr, A., Hörhold, M., White, J. W. C., and Steen-Larsen, H. C.: The role of sublimation as a driver of climate signals in the water isotope content of surface snow: laboratory and field experimental results, The Cryosphere, 15, 4949–4974, https://doi.org/10.5194/tc-15-4949-2021, 2021. a, b
Högström, U.: Review of some basic characteristics of the atmospheric surface layer, Bound.-Lay. Meteorol., 78, 215–246, 1996. a
Jouzel, J. and Merlivat, L.: Deuterium and oxygen 18 in precipitation: Modeling of the isotopic effects during snow formation, J. Geophys. Res.-Atmos., 89, 11749–11757, https://doi.org/10.1029/JD089iD07p11749, 1984. a, b
Landais, A., Stenni, B., Masson-Delmotte, V., Jouzel, J., Cauquoin, A., Fourré, E., Minster, B., Selmo, E., Extier, T., Werner, M., Vimeux, F., Uemura, R., Crotti, I., and Grisart, A.: Interglacial Antarctic–Southern Ocean climate decoupling due to moisture source area shifts, Nat. Geosci., 14, 918–923, 2021. a
Leroy-Dos Santos, C., Masson-Delmotte, V., Casado, M., Fourré, E., Steen-Larsen, H., Maturilli, M., Orsi, A., Berchet, A., Cattani, O., Minster, B., Gherardi, J., and Landais, A.: A 4.5 year-long record of Svalbard water vapor isotopic composition documents winter air mass origin, J. Geophys. Res.-Atmos., 125, e2020JD032681, https://doi.org/10.1029/2020JD032681, 2020. a
Leroy-Dos Santos, C., Casado, M., Prié, F., Jossoud, O., Kerstel, E., Farradèche, M., Kassi, S., Fourré, E., and Landais, A.: A dedicated robust instrument for water vapor generation at low humidity for use with a laser water isotope analyzer in cold and dry polar regions, Atmos. Meas. Tech., 14, 2907–2918, https://doi.org/10.5194/amt-14-2907-2021, 2021. a, b, c, d, e
Lupi, A., Lanconelli, C., and Vitale, V.: Basic and other measurements of radiation at Concordia station (2006-01 et seq), p. 181 datasets, PANGAEA [data set], https://doi.org/10.1594/PANGAEA.935421, 2021. a
Madsen, M. V., Steen-Larsen, H. C., Hörhold, M., Box, J., Berben, S. M. P., Capron, E., Faber, A.-K., Hubbard, A., Jensen, M. F., Jones, T., Kipfstuhl, S., Koldtoft, I., Pillar, H. R., Vaughn, B. H.,Vladimirova, D., and Dahl-Jensen, D.: Evidence of isotopic fractionation during vapor exchange between the atmosphere and the snow surface in Greenland, J. Geophys. Res.-Atmos., 124, 2932–2945, 2019. a, b
Majoube, M.: Fractionnement en oxygène 18 et en deutérium entre l’eau et sa vapeur, J. Chim. Phys., 68, 1423–1436, https://doi.org/10.1051/jcp/1971681423, 1971. a
Merlivat, L. and Jouzel, J.: Global climatic interpretation of the deuterium‐oxygen 18 relationship for precipitation, J. Geophys. Res.-Oceans, 84, 5029–5033, https://doi.org/10.1029/JC084iC08p05029, 1979. a
Merlivat, L. and Nief, G.: Fractionnement isotopique lors des changements d'état solide-vapeur et liquide-vapeur de l'eau à des températures inférieures à 0 °C, Tellus, 19, 122–127, https://doi.org/10.3402/tellusa.v19i1.9756, 1967. a
Nash, D., Waliser, D., Guan, B., Ye, H., and Ralph, F. M.: The Role of Atmospheric Rivers in Extratropical and Polar Hydroclimate, J. Geophys. Res.-Atmos., 123, 6804–6821, https://doi.org/10.1029/2017JD028130, 2018. a
Ollivier, I., Lauwers, T., Dutrievoz, N., Agosta, C., Casado, M., Fourré, E., Genthon, C., Jossoud, O., Prié, F., Steen-Larsen, H. C., and Landais, A.: Time series of the summertime atmospheric water vapour isotopic composition at Concordia station, East Antarctica, Earth Syst. Sci. Data, 17, 5655–5674, https://doi.org/10.5194/essd-17-5655-2025, 2025a. a, b, c
Ollivier, I., Steen-Larsen, H. C., Stenni, B., Arnaud, L., Casado, M., Cauquoin, A., Dreossi, G., Genthon, C., Minster, B., Picard, G., Werner, M., and Landais, A.: Surface processes and drivers of the snow water stable isotopic composition at Dome C, East Antarctica – a multi-dataset and modelling analysis, The Cryosphere, 19, 173–200, https://doi.org/10.5194/tc-19-173-2025, 2025b. a, b, c, d, e
Palm, S. P., Yang, Y., Spinhirne, J. D., and Marshak, A.: Satellite remote sensing of blowing snow properties over Antarctica, J. Geophys. Res.-Atmos., 116, D16123, https://doi.org/10.1029/2011JD015828, 2011. a
Petteni, A., Casado, M., Leroy-Dos Santos, C., Landais, A., Dutrievoz, N., Agosta, C., Akers, P. D., Savarino, J., Spolaor, A., Frezzotti, M., and Stenni, B.: Air Mass Origin Effects on Antarctic Snow Isotopic Composition: An Observation and Modelling Study, EGUsphere [preprint], https://doi.org/10.5194/egusphere-2025-3188, 2025. a
Pisso, I., Sollum, E., Grythe, H., Kristiansen, N. I., Cassiani, M., Eckhardt, S., Arnold, D., Morton, D., Thompson, R. L., Groot Zwaaftink, C. D., Evangeliou, N., Sodemann, H., Haimberger, L., Henne, S., Brunner, D., Burkhart, J. F., Fouilloux, A., Brioude, J., Philipp, A., Seibert, P., and Stohl, A.: The Lagrangian particle dispersion model FLEXPART version 10.4, Geosci. Model Dev., 12, 4955–4997, https://doi.org/10.5194/gmd-12-4955-2019, 2019. a
Pohl, B., Favier, V., Wille, J., Udy, D. G., Vance, T. R., Pergaud, J., Dutrievoz, N., Blanchet, J., Kittel, C., Amory, C., Krinner, G., and Codron, F.: Relationship Between Weather Regimes and Atmospheric Rivers in East Antarctica, J. Geophys. Res.-Atmos., 126, https://doi.org/10.1029/2021JD035294, 2021. a
Ricaud, P., Del Guasta, M., Bazile, E., Azouz, N., Lupi, A., Durand, P., Attié, J.-L., Veron, D., Guidard, V., and Grigioni, P.: Supercooled liquid water cloud observed, analysed, and modelled at the top of the planetary boundary layer above Dome C, Antarctica, Atmos. Chem. Phys., 20, 4167–4191, https://doi.org/10.5194/acp-20-4167-2020, 2020. a, b
Ricaud, P., Del Guasta, M., Lupi, A., Roehrig, R., Bazile, E., Durand, P., Attié, J.-L., Nicosia, A., and Grigioni, P.: Supercooled liquid water clouds observed over Dome C, Antarctica: temperature sensitivity and cloud radiative forcing, Atmos. Chem. Phys., 24, 613–630, https://doi.org/10.5194/acp-24-613-2024, 2024a. a
Ricaud, P., Durand, P., Grigioni, P., Del Guasta, M., Camporeale, G., Roy, A., Attié, J.-L., and Bognar, J.: In situ observations of supercooled liquid water clouds over Dome C, Antarctica, by balloon-borne sondes, Atmos. Meas. Tech., 17, 5071–5089, https://doi.org/10.5194/amt-17-5071-2024, 2024b. a, b
Risi, C., Bony, S., Vimeux, F., and Jouzel, J.: Water‐stable isotopes in the LMDZ4 general circulation model: Model evaluation for present‐day and past climates and applications to climatic interpretations of tropical isotopic records, J. Geophys. Res.-Atmos., 115, D12118, https://doi.org/10.1029/2009JD013255, 2010. a, b
Rozmiarek, K. S., Dietrich, L. J., Vaughn, B. H., Town, M. S., Markle, B. R., Morris, V., Steen-Larsen, H. C., Fettweis, X., Brashear, C. A., Bennett, H., and Jones, T. R.: Atmosphere to surface profiles of water-vapor isotopes and meteorological conditions over the northeast Greenland ice sheet, J. Geophys. Res.-Atmos., 130, e2024JD042719, https://doi.org/10.1029/2024JD042719, 2025. a
Schlosser, E., Dittmann, A., Stenni, B., Powers, J. G., Manning, K. W., Masson-Delmotte, V., Valt, M., Cagnati, A., Grigioni, P., and Scarchilli, C.: The influence of the synoptic regime on stable water isotopes in precipitation at Dome C, East Antarctica, The Cryosphere, 11, 2345–2361, https://doi.org/10.5194/tc-11-2345-2017, 2017. a
Sodemann, H. and Stohl, A.: Asymmetries in the moisture origin of Antarctic precipitation, Geophys. Res. Lett., 36, L22803, https://doi.org/10.1029/2009GL040242, 2009. a
Steen-Larsen, H. C., Johnsen, S. J., Masson-Delmotte, V., Stenni, B., Risi, C., Sodemann, H., Balslev-Clausen, D., Blunier, T., Dahl-Jensen, D., Ellehøj, M. D., Falourd, S., Grindsted, A., Gkinis, V., Jouzel, J., Popp, T., Sheldon, S., Simonsen, S. B., Sjolte, J., Steffensen, J. P., Sperlich, P., Sveinbjörnsdóttir, A. E., Vinther, B. M., and White, J. W. C.: Continuous monitoring of summer surface water vapor isotopic composition above the Greenland Ice Sheet, Atmos. Chem. Phys., 13, 4815–4828, https://doi.org/10.5194/acp-13-4815-2013, 2013. a
Stenni, B., Scarchilli, C., Masson-Delmotte, V., Schlosser, E., Ciardini, V., Dreossi, G., Grigioni, P., Bonazza, M., Cagnati, A., Karlicek, D., Risi, C., Udisti, R., and Valt, M.: Three-year monitoring of stable isotopes of precipitation at Concordia Station, East Antarctica, The Cryosphere, 10, 2415–2428, https://doi.org/10.5194/tc-10-2415-2016, 2016. a
Touzeau, A., Landais, A., Stenni, B., Uemura, R., Fukui, K., Fujita, S., Guilbaud, S., Ekaykin, A., Casado, M., Barkan, E., Luz, B., Magand, O., Teste, G., Le Meur, E., Baroni, M., Savarino, J., Bourgeois, I., and Risi, C.: Acquisition of isotopic composition for surface snow in East Antarctica and the links to climatic parameters, The Cryosphere, 10, 837–852, https://doi.org/10.5194/tc-10-837-2016, 2016. a
Turner, J., Phillips, T., Thamban, M., Rahaman, W., Marshall, G. J., Wille, J. D., Favier, V., Winton, V. H. L., Thomas, E., Wang, Z., Broeke, M., Hosking, J. S., and Lachlan‐Cope, T.: The Dominant Role of Extreme Precipitation Events in Antarctic Snowfall Variability, Geophys. Res. Lett., 46, 3502–3511, https://doi.org/10.1029/2018GL081517, 2019. a
Van Leer, B.: Towards the ultimate conservative difference scheme. IV. A new approach to numerical convection, J. Computat. Phys., 23, 276–299, https://doi.org/10.1016/0021-9991(77)90095-X, 1977. a
Vignon, E., Genthon, C., Barral, H., Amory, C., Picard, G., Gallée, H., Casasanta, G., and Argentini, S.: Momentum-and heat-flux parametrization at Dome C, Antarctica: A sensitivity study, Bound.-Lay. Meteorol., 162, 341–367, 2017a. a
Vignon, E., Hourdin, F., Genthon, C., Gallée, H., Bazile, E., Lefebvre, M.-P., Madeleine, J.-B., and Van de Wiel, B. J.: Antarctic boundary layer parametrization in a general circulation model: 1-D simulations facing summer observations at Dome C, J. Geophys. Res.-Atmos., 122, 6818–6843, 2017b. a
Vignon, E., Hourdin, F., Genthon, C., Van de Wiel, B. J., Gallee, H., Madeleine, J.-B., and Beaumet, J.: Modeling the dynamics of the atmospheric boundary layer over the Antarctic Plateau with a general circulation model, J. Adv. Model. Earth Sy., 10, 98–125, 2018. a
Vignon, É., Raillard, L., Genthon, C., Del Guasta, M., Heymsfield, A. J., Madeleine, J.-B., and Berne, A.: Ice fog observed at cirrus temperatures at Dome C, Antarctic Plateau, Atmos. Chem. Phys., 22, 12857–12872, https://doi.org/10.5194/acp-22-12857-2022, 2022. a, b
Wahl, S., Steen-Larsen, H. C., Reuder, J., and Hörhold, M.: Quantifying the stable water isotopologue exchange between the snow surface and lower atmosphere by direct flux measurements, J. Geophys. Res.-Atmos., 126, e2020JD034400, https://doi.org/10.1029/2020JD034400, 2021. a
Wahl, S., Steen-Larsen, H. C., Hughes, A. G., Dietrich, L. J., Zuhr, A., Behrens, M., Faber, A.-K., and Hörhold, M.: Atmosphere-snow exchange explains surface snow isotope variability, Geophys. Res. Lett., 49, e2022GL099529, https://doi.org/10.1029/2022GL099529, 2022. a
Wahl, S., Walter, B., Aemisegger, F., Bianchi, L., and Lehning, M.: Identifying airborne snow metamorphism with stable water isotopes, The Cryosphere, 18, 4493–4515, https://doi.org/10.5194/tc-18-4493-2024, 2024. a
Wille, J.: Polar specific atmospheric river detection algorithm catalogs, Version v1, Zenodo [data set], https://doi.org/10.5281/zenodo.15830634, 2025. a
Wille, J. D., Favier, V., Dufour, A., Gorodetskaya, I. V., Turner, J., Agosta, C., and Codron, F.: West Antarctic surface melt triggered by atmospheric rivers, Nat. Geosci., 12, 911–916, https://doi.org/10.1038/s41561-019-0460-1, 2019. a, b
Wille, J. D., Favier, V., Gorodetskaya, I. V., Agosta, C., Kittel, C., Beeman, J. C., Jourdain, N. C., Lenaerts, J. T. M., and Codron, F.: Antarctic Atmospheric River Climatology and Precipitation Impacts, J. Geophys. Res.-Atmos., 126, https://doi.org/10.1029/2020JD033788, 2021. a, b, c, d
Wille, J. D., Favier, V., Jourdain, N. C., Kittel, C., Turton, J. V., Agosta, C., Gorodetskaya, I. V., Picard, G., Codron, F., Santos, C. L.-D., Amory, C., Fettweis, X., Blanchet, J., Jomelli, V., and Berchet, A.: Intense atmospheric rivers can weaken ice shelf stability at the Antarctic Peninsula, Communications Earth & Environment, 3, 90, https://doi.org/10.1038/s43247-022-00422-9, 2022. a, b
Wille, J. D., Alexander, S. P., Amory, C., Baiman, R., Barthélemy, L., Bergstrom, D. M., Berne, A., Binder, H., Blanchet, J., Bozkurt, D., Bracegirdle, T. J., Casado, M., Choi, T., Clem, K. R., Codron, F., Datta, R., Di Battista, S., Favier, V., Francis, D., Fraser, A. D., Fourré, E., Garreaud, R. D., Genthon, C., Gorodetskaya, I. V., González-Herrero, S., Heinrich, V. J., Hubert, G., Joos, H., Kim, S.-J., King, J. C., Kittel, C., Landais, A., Lazzara, M., Leonard, G. H., Lieser, J. L., Maclennan, M., Mikolajczyk, D., Neff, P., Ollivier, I., Picard, G., Pohl, B., Ralph, F. M., Rowe, P., Schlosser, E., Shields, C. A., Smith, I. J., Sprenger, M., Trusel, L., Udy, D., Vance, T., Vignon, É., Walker, C., Wever, N., and Zou, X.: The extraordinary March 2022 East Antarctica “heat” wave. Part I: Observations and meteorological drivers, J. Climate, 37, 757–778, https://doi.org/10.1175/JCLI-D-23-0175.1, 2024a. a
Wille, J. D., Alexander, S. P., Amory, C., Baiman, R., Barthélemy, L., Bergstrom, D. M., Berne, A., Binder, H., Blanchet, J., Bozkurt, D., Bracegirdle, T. J., Casado, M., Choi, T., Clem, K. R., Codron, F., Datta, R., Di Battista, S., Favier, V., Francis, D., Fraser, A. D., Fourré, E., Garreaud, R. D., Genthon, C., Gorodetskaya, I. V., González-Herrero, S., Heinrich, V. J., Hubert, G., Joos, H., Kim, S.-J., King, J. C., Kittel, C., Landais, A., Lazzara, M., Leonard, G. H., Lieser, J. L., Maclennan, M., Mikolajczyk, D., Neff, P., Ollivier, I., Picard, G., Pohl, B., Ralph, F. M., Rowe, P., Schlosser, E., Shields, C. A., Smith, I. J., Sprenger, M., Trusel, L., Udy, D., Vance, T., Vignon, É., Walker, C., Wever, N., and Zou, X.: The extraordinary March 2022 East Antarctica “heat” wave. Part II: Impacts on the Antarctic ice sheet, J. Climate, 37, 779–799, https://doi.org/10.1175/JCLI-D-23-0176.1, 2024b. a, b, c
Zhu, Y. and Newell, R. E.: A Proposed Algorithm for Moisture Fluxes from Atmospheric Rivers, Mon. Weather Rev., 126, 725–735, https://doi.org/10.1175/1520-0493(1998)126<0725:APAFMF>2.0.CO;2, 1998. a
- Abstract
- Introduction
- Materials and methods
- Description of the event and model evaluation
- Attribution of the isotopes anomalies at the surface
- Discussion and conclusion
- Appendix A: Computation of the isotopic delta for different process
- Code and data availability
- Author contributions
- Competing interests
- Disclaimer
- Acknowledgements
- Financial support
- Review statement
- References
- Supplement