the Creative Commons Attribution 4.0 License.
the Creative Commons Attribution 4.0 License.
 | 03 Dec 2025
Brief communication: Annual variability of the atmospheric circulation at large spatial scale reconstructed from a data assimilation framework cannot explain local East Antarctic ice rises' surface mass balance records
Marie G. P. Cavitte
Hugues Goosse
Quentin Dalaiden
Nicolas Ghilain
Ice cores are influenced by local processes that alter surface mass balance (SMB) records. To evaluate whether atmospheric circulation on large spatial scales explains the differing SMB trends at eight East Antarctic ice rises, we assimilated ice core SMB records within a high-resolution downscaled atmospheric model, while incorporating radar-derived SMB constraints to quantify local observation errors. The reconstruction captures the diverse variability from SMB records but may over-fit by introducing unrealistic wind spatial heterogeneity. While local errors are quantified, they might not cover all uncertainties. Moreover, small-scale wind circulation, unresolved in the reconstruction, could significantly affect local ice core SMB signals.
- Article
(3966 KB) - Full-text XML
-
Supplement
(886 KB) - BibTeX
- EndNote


Surface mass balance (SMB), which is the net accumulation or removal of snowfall at the surface, over Antarctica is well understood while the actual absolute amounts are not well constrained, yet it is a very important term for net global sea level rise (Lenaerts et al., 2019). The East Antarctic Ice Sheet, with its high elevation and very cold temperatures has a strong potential to mitigate sea level, with a calculated 0.77 mm of global sea level mitigated over the twentieth century (Medley and Thomas, 2019). However, characterized by high snowfall rates along the coast and low over the plateau, with strong katabatic winds, the East Antarctic Ice Sheet shows strong spatial variability of SMB (Hirsch et al., 2023). Regional climate models with a high spatial resolution (∼ 25 km2), such as the polar-oriented Regional Atmospheric Climate Model version 2.3 (RACMO2.3p) (Van Wessem et al., 2018), struggle to capture the mean SMB state in the ice sheet interior, while they have a reasonably good fit with coastal mean SMB (e.g. Agosta et al., 2019). However, they lack in spatial variability along the coastline, mostly due to their limited grid resolution, as shown in Kausch et al. (2020) for the Dronning Maud Land coast.
To reconstruct SMB beyond direct instrumental measurements, which only cover the last decade or two (Wang et al., 2021), ice cores are the main in-situ observations (Lenaerts et al., 2019). Ice cores provide historical records with a high temporal resolution, which strongly depends on the accumulation rate, generally annual in the first hundreds of meters of the ice sheet. However, ice cores are point measurements with a surface footprint of a few cm2. These records are therefore influenced by local processes that can lead to different SMB values compared to nearby locations, mainly because of wind erosion and redistribution (Casado et al., 2020). Cavitte et al. (2022) have shown that, in the case of East Antarctic ice rises, this can lead to a systematic underestimation of the SMB over a larger region, but the temporal variability of the SMB is generally well captured.
Data assimilation (DA) allows to optimally combine model simulations and observations to reconstruct past climate variations. DA thus offers the possibility to reconstruct spatial fields from noisy data with sparse spatial coverage and is well adapted to reconstruct SMB from ice core records (Dalaiden et al., 2021). However, DA requires an estimation of the error for any assimilated record. In a DA framework, the observation error dictates the confidence in the climate data in reconstructing variables by dictating the weight of each record in the final reconstruction. The observation error is a combination of two errors: the measurement error – quantified from the published data sets – and the representativeness error – which quantifies what size area an observation is representative of. The representativeness error is difficult to quantify and is traditionally estimated based on prior knowledge or comparing observations with the nearest grid cell (i.e., centroid) from the prior (e.g. Dalaiden et al., 2021; Valler et al., 2020). An innovation in this study is to account for the representativeness error using ice-penetrating radar. With data points every few meters in a radar survey, ice-penetrating radar provides the opportunity to build detailed spatial maps of SMB (e.g. Kausch et al., 2020). By comparing radar-derived SMB and co-located ice cores' measured SMB, we are able to quantify the error of representativeness of the ice core records (Cavitte et al., 2023). This representativeness error can then be directly included in the DA framework that incorporates the local ice core SMB records.
Here, we apply the representativeness error derived from radar data to improve the reconstruction of SMB of the Dronning Maud Land (DML) region over the past 25 years based on the assimilation of eight ice core SMB series by taking advantage of the compilation provided in Cavitte et al. (2023). These eight ice core SMB records are in close proximity (∼ 100–300 km between ice rises, Fig. 1) of each other, and have an annual resolution with differing trends.
Our goal is to understand whether the contrasted measured SMB records can be explained by atmospheric circulation changes at large spatial scales. We use historical snowfall and wind simulations as our initial state of the climate. The model prior (first guess field) consists of a 10-member ensemble of SMB, 10 m winds (zonal and meridional surface winds) simulations downscaled from the Community Earth System Model version 2 (CESM2, Danabasoglu et al., 2020) down to the RACMO2.3p 5.5 km grid (Lenaerts et al., 2017), using a statistical method described in Ghilain et al. (2022). The downscaled SMB and 10 m winds are therefore consistent and provide us with information at the adequate temporal and spatial scales to understand the different time evolution of the local ice rises' SMB over the historical period. Our approach allows us to understand the local SMB records better as we have a quantified estimate of the records' uncertainties and a framework to test the role of those uncertainties compared to a potential contribution of regional atmospheric dynamics in the difference between the records. After assimilation of the SMB records, the reconstructed winds are associated with the variability of the snowfall field through the assimilation process. The main goal of this study is therefore to test whether using a data assimilation framework with SMB constraints from East Antarctic ice cores, with added information from radar data (for estimating the observation error), can help to get a better reconstruction of SMB. Note that the ice cores used in this study cover the recent instrumental period in order to test the methodology and evaluate if it could be applied to longer ice core records.
The observed differences in the signal displayed by the various ice cores could be due either to local processes and non-climatic signal noise (e.g. stratigraphic noise, Dallmayr et al., 2025) that are uncorrelated between the different locations or to regional atmospheric circulation variability inducing contrasted spatial patterns in snow accumulation. We investigate those two potential origins in the data assimilation framework. The estimate of the uncertainty (observation error within the DA framework) based on radar measurements will give more weight in the reconstruction to the records that display a stronger climate signal (i.e., less noisy) and we will check if this helps to obtain a reconstruction which is consistent with all the records accounting for their uncertainty. The impact of the regional atmospheric circulation will be tested using the downscaled estimates of winds. We note that model results unconstrained by data may not follow well the SMB derived from ice cores, maybe because they have some biases in simulating the regional atmospheric dynamics or the link between large-scale and regional atmospheric circulation. We assume in our investigation that the physics of the model is adequate to represent the regional processes and the data constraint imposed by the assimilation of ice core records will ensure a better agreement between observed and reconstructed variability.
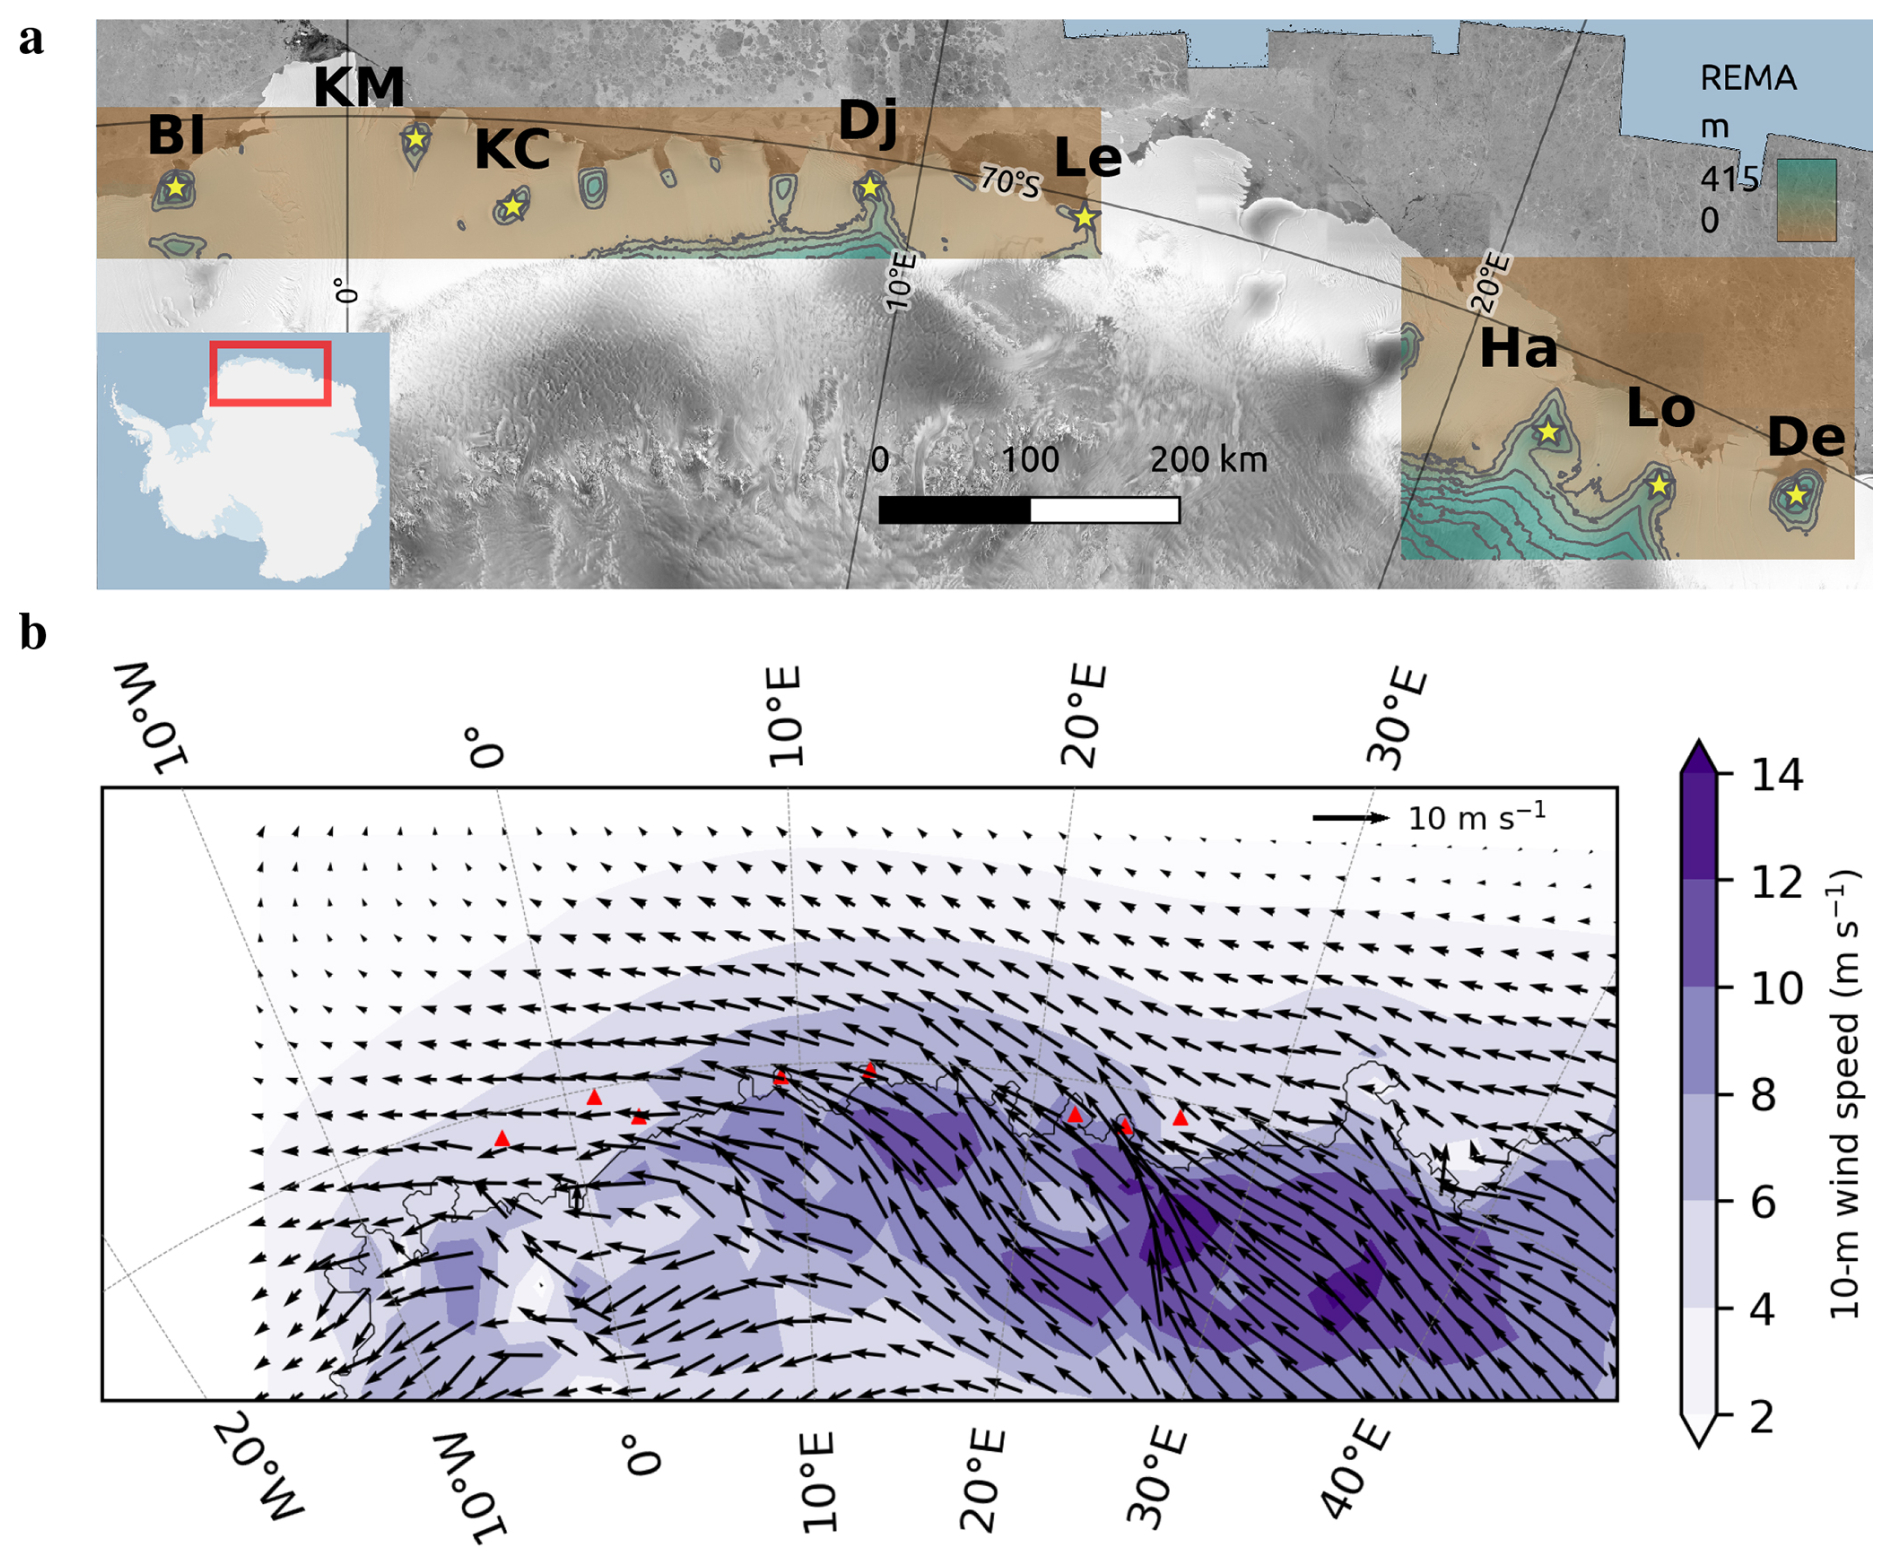
Figure 1(a) Location of the eight ice cores along the Dronning Maud Land coast. Site initials: BI is Blåskimen Island, KM is Kupol Moskovskij, KC is Kupol Ciolkovskogo, Dj is Djupranen, Le is Leningradkollen, Ha is Hammarryggen, Lo is Lokkeryggen and De is Derwael. Background is the Radarsat-1 Antarctic Mapping Project (RAMP) RADARSAT mosaic (Jezek et al., 2013) with superimposed the Reference Elevation Model of Antarctica (REMA) v2 elevation for each site (units are meters and referenced to the WGS84 ellipsoid) with 100 m elevation contour lines shown in gray. This figure was prepared with Quantarctica (Matsuoka et al., 2021). (b) RACMO2.3p (Lenaerts et al., 2017) mean 10 m winds over Dronning Maud Land for 1987–2011. Red triangles locate the ice core sites.
2.1 Data assimilation
The DA method implemented is identical to that described in a previous study (e.g. Dalaiden et al., 2021). We use an offline approach and build the prior distribution, i.e. the initial state of the climate given by the model prior, from existing climate model simulations (Steiger et al., 2017). The model simulations we choose are statistically downscaled snowfall simulations for the period 1850–2014 (Ghilain et al., 2022) (more info on the downscaling process is provided in Sect. 2.3).
Data assimilation methods require two main inputs, an initial guess of the state and the observations used to update this initial guest. The initial guess is commonly drawn from an ensemble of model simulations. The DA method applied in this study uses a particle filter (Dubinkina et al., 2011). In the case of a particle filter, each model simulation is called a particle, and the ensemble of all particles is referred to as the prior. In this study, the prior is built from the ten downscaled simulations spanning the 1850–2014 period from Ghilain et al. (2022). In the assimilation process, we do not only use the model year corresponding to the year we want to reconstruct. Because firstly, ten simulations are too small to correctly estimate the range of potential states at a particular time. And secondly, because of the large internal variability of the system, there is no reason that observations in one particular year are more similar to model states for the same year than 10 years before or ten years later for instance. Therefore, as in previous studies (e.g. Dalaiden et al., 2023), the size of the prior is augmented by selecting all the annual averages of the initial 10-member ensemble, under the assumption that the temporal predictability for the target variables we want to reconstruct is lower than one year. This is a reasonable assumption for the temperature and winds over our region of interest, and such a method has been shown to be highly skilful for reconstructing the hydroclimate (e.g. Steiger et al., 2017). Taking into account all the years (1850–2014) of our model simulations and the 10 members of the ensemble, we therefore start with 1650 particles. As the observations are annually resolved, we apply an annual DA time step. The prior remains constant throughout the data assimilation process. Therefore, the temporal variability in the reconstruction arises solely from the assimilated observations. During reconstruction, the prior is directly compared with annual observations since the ice cores provide a direct measurement of SMB. Particle weights are assigned based on the agreement between model results and observations at the nearest grid cell, with particles presenting the highest likelihood (i.e having a closer match with observations) receiving higher weights (see Dubinkina et al., 2011, for more details and the exact formulas). The mean reconstruction is determined by the weighted mean of the particles, while the range of the weighted ensemble provides a measure of reconstruction uncertainty. The observation error is taken into account during the data assimilation process, in particular during the data-model comparison when computing the weight of each particle based on the likelihood. Our observation error is the root-mean-square combination of the instrumental error and the representativeness error (Supplement Table S1). The instrumental error is calculated from the measurement error propagated by the best-fit depth–density profile calculated to obtain the SMB records. We select the representativeness error estimated from the difference between a point measurement at the ice core location and the mean radar-based estimate over a circle with a radius of 3 km (as quantified in Cavitte et al., 2023), which is a close match to the model prior with a spatial resolution of 5.5×5.5 km. We also augment this observation error by 10 %–50% to test the impact of potential uncertainty of this estimate of the error on the reconstruction obtained (see Discussion).
2.2 SMB observations
We assimilate the ice core SMB records as anomalies (SMB record minus the temporal mean SMB over 1987–2011). We use the published ice core SMB data for each of the eight ice rise core sites as described in Cavitte et al. (2023). Further information on the ice core datasets is provided in Table 1 and Supplement Table S1. All eight SMB records have an annual resolution.
Dey et al. (2023)Dey et al. (2023)Vega et al. (2016)Vega et al. (2016)Vega et al. (2016)Cavitte et al. (2022)Philippe et al. (2016)Cavitte et al. (2022)Wauthy et al. (2024)Cavitte et al. (2022)Wauthy et al. (2024)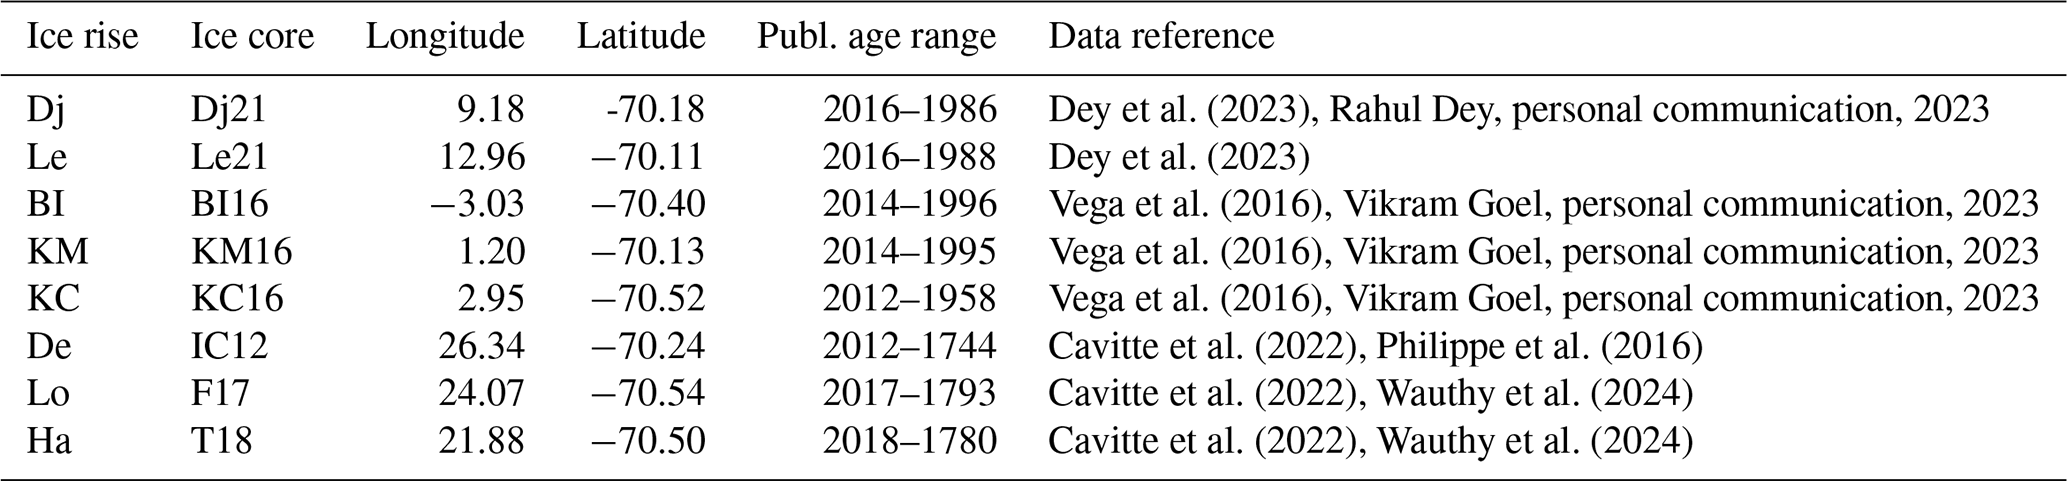
2.3 Downscaled model ensemble
The model ensemble is obtained through a statistical downscaling method which consists of associating snowfall simulations from RACMO2.3p at the 5.5 km spatial resolution over Dronning Maud Land (Lenaerts et al., 2017) with specific weather patterns from a coarser spatial resolution global climate model (ERA5, 0.25° in latitude-longitude), at a daily timescale. The basis of the statistical downscaling is to evaluate the relationship between a high quality but shorter time frame reanalysis dataset (here, ERA5, Hersbach et al., 2020) and a regionally optimized regional climate model simulation with a higher spatial resolution (here, RACMO2.3p) to create an association database (Ghilain et al., 2022). The database associates the ten main variability modes of four atmospheric fields providing information on circulation patterns at large spatial scales (surface pressure, geopotential height at 500 hPa, relative humidity at 700 hPa and precipitation) with the daily snowfall from RACMO2.3p. This database can be searched for analogs for periods not covered by RACMO2.3p or ERA5. The method is applied to the ensemble members of the CESM2 Earth System Model (Danabasoglu et al., 2020) which has a lower spatial resolution but longer time frame to downscale the CESM2 results to the spatial scale of RACMO2.3p. This downscaled product has an improved spatio-temporal distribution of snowfall compared to global climate models, such as the CESM2 simulations on which it is based, and thus can provide information on atmospheric circulation patterns at large spatial scales associated with local snowfall changes (Ghilain et al., 2022). In assimilating ice core SMB records with this downscaled snowfall dataset, we make the assumption that SMB and snowfall are similar. In the framework of our methodology, this is a reasonable assumption for our region as the total annual melt in this region is limited (and when occurring, it mainly freezes within the firn) and therefore SMB is dominated by the snowfall and can be represented by it.
Because we would like to reconstruct the atmospheric circulation at large spatial scales linked to our reconstruction of SMB variability, which was not reconstructed in Ghilain et al. (2021), we apply the same method as used for snowfall to the wind components (zonal and meridional near-surface winds) of the CESM2 ensemble to obtain a 5.5 km resolved wind simulation ensemble. For this, we use the time series of the 40 principal components obtained in the SMB downscaling as well as the principal components time series from ERA5 (Ghilain et al., 2021).
One of the advantages of data assimilation methods is the use of the co-variance among all the modelled variables to not only update the variable that is assimilated (i.e., snowfall) but also all the other modelled variables, in particular the ones presenting a strong relationship with the assimilated variable. As such, the downscaled 10 m winds are updated concomitantly with the SMB field through the assimilation process. When assimilating the ice core data, a set of temporal weights for all particles are obtained to update the initial modelled state to match the assimilated observations. More specifically, during the data assimilation process, the largest weights are associated with the particles presenting the closest match with observations. Originally, all the weights are set to unity (all of the members of the prior have the same weight). The data assimilation process therefore aims at updating the weight to match the assimilated observations. These resulting weights are then applied to the modelled downscaled SMB fields to then calculate an optimal reconstructed SMB field that fits the observations while taking into account uncertainties from both modelling and observations. Since the modelled downscaled 10 m winds are physically consistent with the modelled downscaled SMB ensemble, the same set of weights can be applied to all the simulated variables. This is particularly valuable for the variables having a strong relationship with the assimilated variables.
Assimilating the eight ice core SMB records with the observation error quantified using the co-located radar datasets, we see that the reconstruction is able to reasonably fit the assimilated observations (Fig. 2a) with significant correlations (p value ≤ 0.05) between the reconstructed time series and the observed ice core time series for seven out of the eight ice core sites. The correlation values vary between 0.55 and 0.98 for all ice cores, except at KM which has a non-significant correlation of 0.28. The RMSE values between the observations and reconstruction remain below 10 cm w.e. yr−1 for six sites and up to 12 cm w.e. yr−1 for the other two. We also plot the RACMO2.3p SMB record extracted at the grid cell closest to the ice core sites showing that the reconstruction and the RACMO2.3p time series are statistically distinct, the correlation of the reconstruction with RACMO2.3p being insignificant for the majority of the ice core sites and the RMSE higher than 10 cm w.e. yr−1 for most sites. However, note that the initial correlation of the ice core time series with the extracted RACMO2.3p time series is also weak. If we now examine the temporal correlation of the RACMO2.3p SMB simulation with the obtained reconstruction spatially (Fig. 2b), we observe a positive and significant correlation (p-value ≤ 0.05) for the eastern section of the DML coast, comprising the three easternmost ice rises assimilated (Ha, Lo and De), same for the westernmost section, including the three western ice rises (BI, KM and KC) and a negative weaker correlation for the central section, although the ice core records show a strong positive correlation locally with RACMO2.3p. These SMB results show a good reconstruction from a technical standpoint, although all ice cores have differing SMB trends.
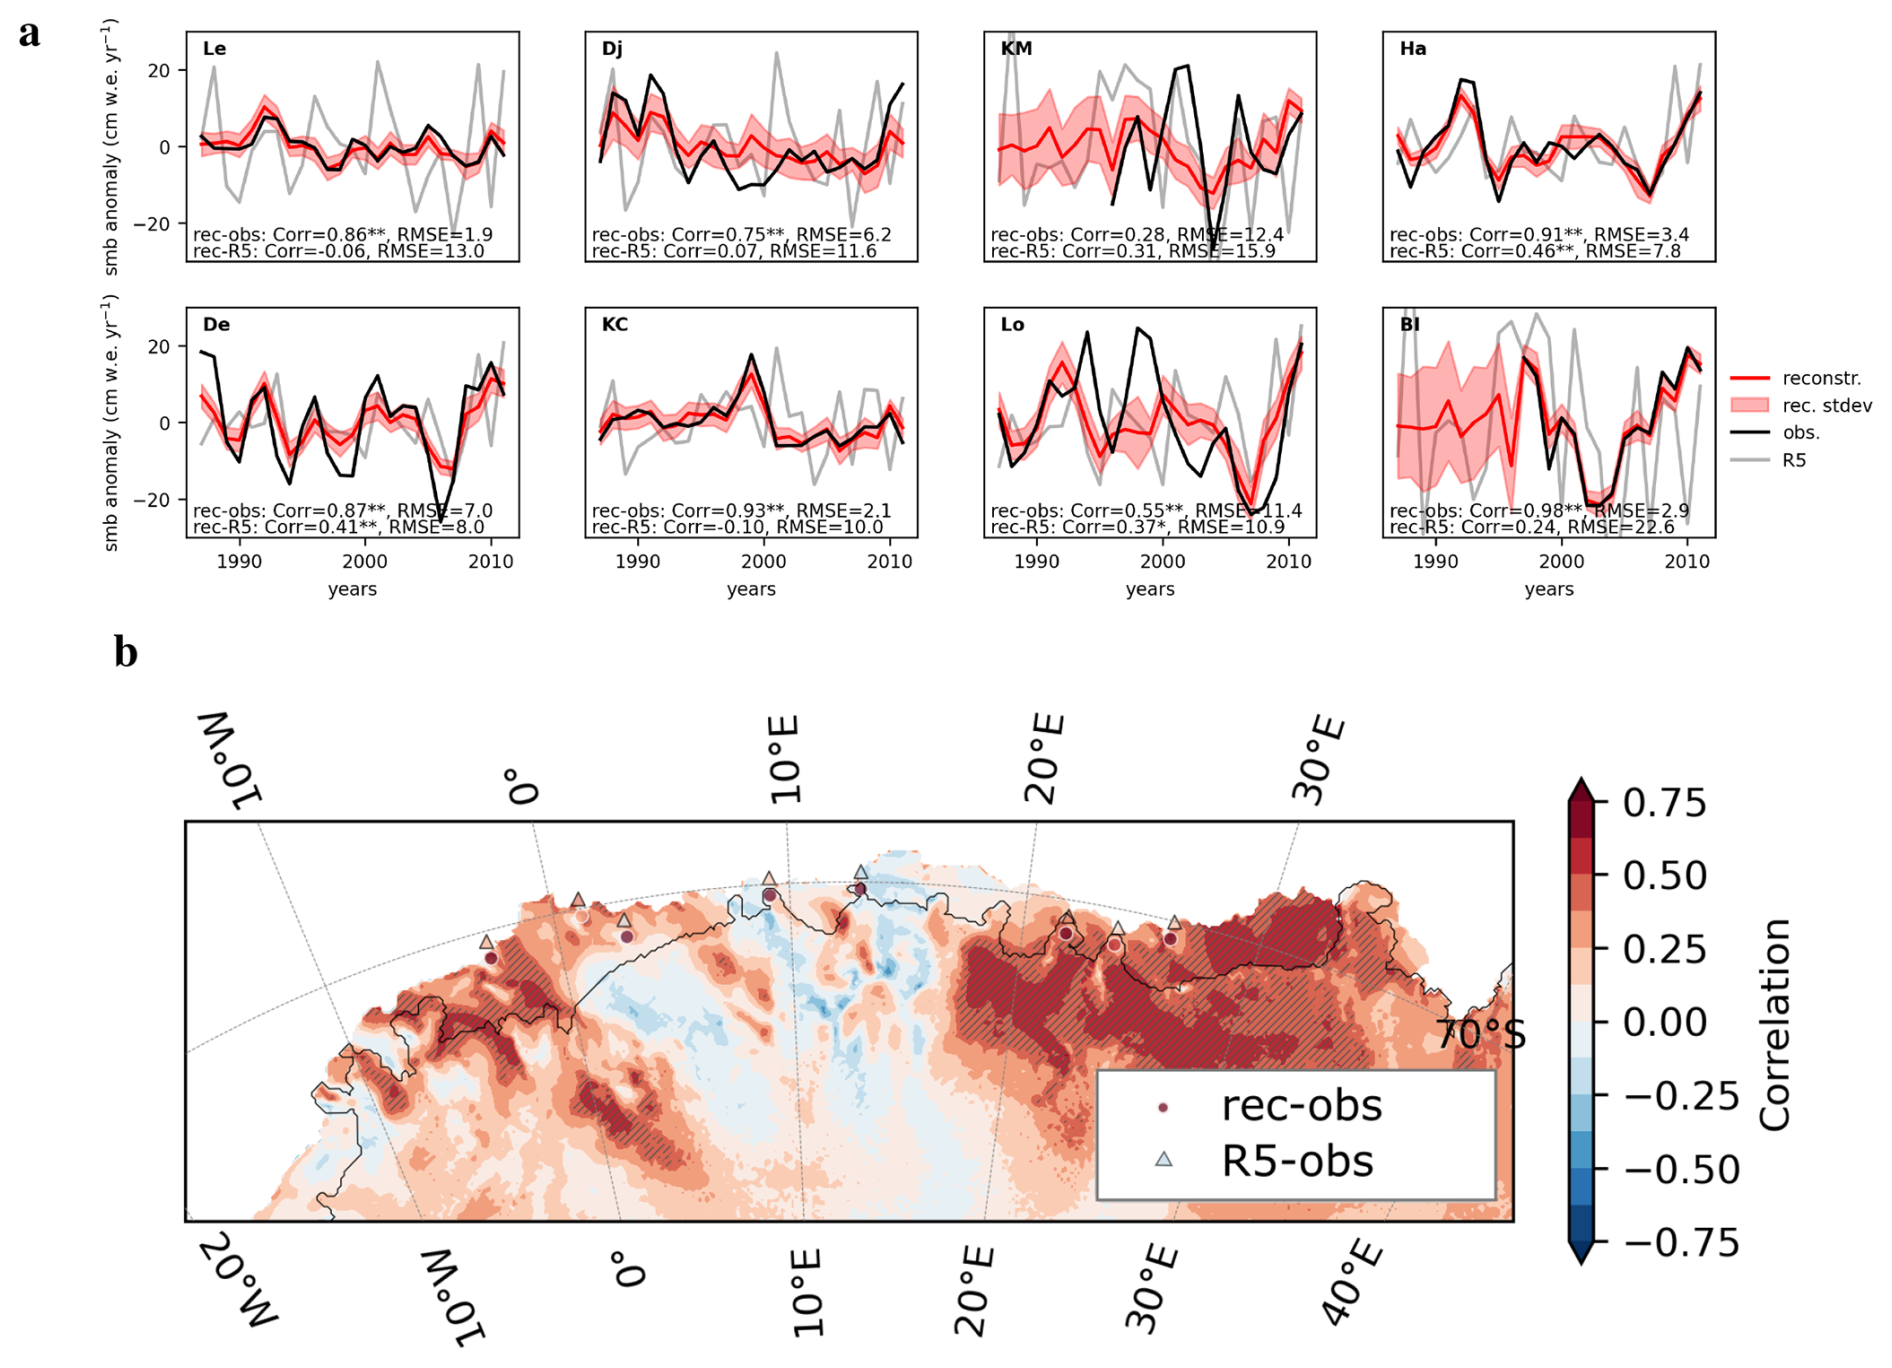
Figure 2(a) SMB time series of the ice core records (black) versus ice-core based reconstruction (red) with reconstruction uncertainty in light red. Gray lines show the RACMO2.3p time series extracted at the ice core sites for comparison. Correlation and RMSE (in cm w.e. yr−1) values are provided for each ice rise site, between the reconstruction (“rec”) and the observations (“obs”), as well as the reconstruction and RACMO2.3p (labeled as “R5”). Correlations with a p-value ≤ 0.05 are double starred while a p-value of ≤ 0.1 starred. (b) Spatial map of the temporal correlation between RACMO2.3p SMB (labeled as “R5”) and the SMB reconstruction. Hatchings highlight areas with a p-value ≤ 0.1; circles locate the ice core sites and are colored according to the value of the correlation between the ice core SMB and the reconstructed SMB locally; triangles are colored according to the value of the correlation between the observations and RACMO2.3p SMB locally (the triangles are offset vertically for ease of reading).
To understand how realistic our reconstruction of SMB variability is from a physical standpoint, we look at the associated atmospheric circulation at large spatial scales that is reconstructed concomitantly using the 10 m above-ground winds (Fig. 3c–d). We analyse how the wind circulation has changed over the recent decade (2002–2011) with respect to the earliest decade reconstructed (1987–1996). The goal is to determine if the temporal variability of the winds can explain the temporal variability in the ice core's SMB record, i.e. to understand why the SMB trends in the ice cores present different trends despite their relative proximity. While ERA5 is constrained by observations at large scale and should provide a reasonable estimate of the larger-scale circulation, the regional circulation is more uncertain and no direct observations are available to measure the skill of our reconstruction of the winds. Nevertheless, the reconstruction should not look too strongly constrained by conflicting regional records (inducing for instance very strong local patterns) or be in strong disagreement at large-scale with ERA5. This comparison is a test of the validity of the method used to reconstruct the winds, which will determine whether it can be applied over longer time intervals, for which fewer direct measurements are available. We also contrast it to resulting SMB difference between those two periods (Fig. 3a–b).
RACMO2.3p produces strong spatial contrasts in SMB (Fig. 3b) and the same spatial patterns are observed in the reconstruction but with lower amplitudes (Fig. 3a). To obtain the best possible fit with the eight different SMB records which are located within hundreds of kilometers of each other, we notice that the atmospheric circulation at large spatial scale is significantly modified (Fig. 3c) when comparing to RACMO2.3p (Fig. 3d), which we expect is relatively accurate at this spatial scale and decadal timescale (Agosta et al., 2019). Figure 3 shows the difference in wind strength between the 2002–2011 and the 1987–1996 10-year intervals of the reconstruction. The reduction in decadal wind strength blowing from east to west along the DML coast observed in RACMO2.3p is also observed in the reconstruction, particularly over western DML, but the difference is weaker from one decade to the next in the reconstruction. In eastern DML, the RACMO2.3p-observed increase in wind strength is not observed in the reconstruction. Furthermore, the ensemble reconstruction shows a stronger component of meridional flow over the ice rises, and over the DML coastline as a whole, than RACMO2.3p. The reconstruction is forced to create a lot of wind heterogeneity over the ice rises along the coastline to match the different local ice rises' signal at a small spatial scale, but the spatial wind pattern obtained is different from RACMO2.3p. We highlight that the number of particles retained by the filter can be quite low (about 7 % on average). Retaining too few particles implies that the reconstruction may be based on too few samples and the estimate may become less accurate (filter degeneracy). However, 7 % of the 1650 particles available in the prior still corresponds to 115 particles on average, which provides a reasonable size for computing statistics for our reconstruction. We have also applied an observation error augmented by 10 %–50 % to test the impact of a potential underestimation of the observation error, but this results in a worse match between the observations and the reconstruction, a wind circulation mostly unchanged and does not significantly increase the number of particles kept within the DA framework (number of particles kept increases to 15 % on average for an increase of 50 % in the observation error).
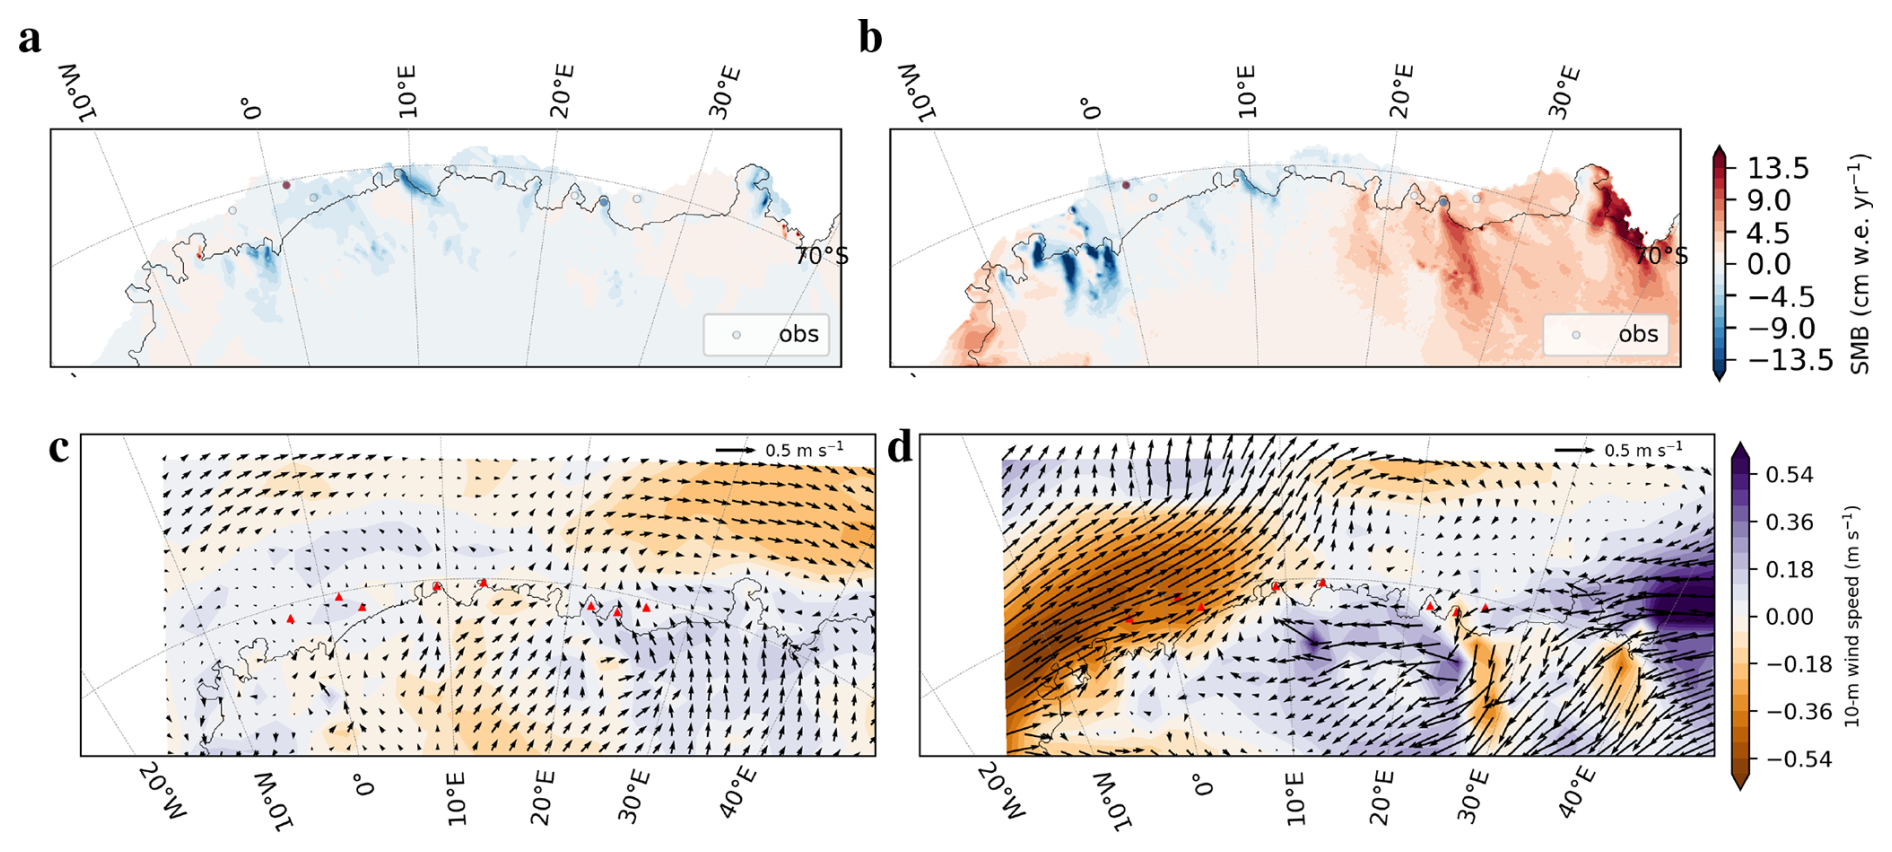
Figure 3Difference in (a–b) SMB and (c–d) wind circulation, average over 2002–2011 minus average over 1987–1996 10-year intervals reconstruction. Left column shows the results for the reconstruction (a, c), right column shows the results for RACMO2.3p (b, d). Circles in panels (a) and (b) show the difference in SMB for the ice core data; red triangles in panels (c) and (d) locate the ice core sites. Note that the region shown in panels (a)–(b) is limited to the ice sheet and ice shelves as opposed to (c)–(d) which show the full domain including the offshore region.
Assimilation of the ice core annual SMB records with a 5.5 km snowfall model ensemble can reconstruct the SMB field needed to reproduce the different ice core SMB time series with an observation error constrained from co-located radar measurements. We confirm that for records where the calculated error is smaller, i.e. we have more trust in the SMB record, the accuracy of the reconstruction in reconstructing the measured SMB record is higher. However, the reconstructed wind anomalies resemble an over-fitting to observations in which changes in the synoptic circulation are trying to compensate for errors not well accounted for in our methodology, or processes at a smaller scale than the one resolved by RACMO2.3p.
Many other factors could be invoked to explain the contrasting ice core SMB records of the Dronning Maud Land coast. Ice rises are generally small (tens of kilometers in width), yet with a strong topographic gradient (hundreds of meters in height above sea level). The De ice rise for example is a thick dome-shaped ice rise entirely located within the Roi Baudouin Ice Shelf and reaches a maximum height of 429 m above sea level, with a maximum ice thickness of 550 m for a 31 km width east-west and 40 km north-south (Cavitte et al., 2022). Because of their topography, ice rises are influenced by various local scale effects which act at a smaller scale than the RACMO2.3p grid size. Kausch et al. (2020) have shown that ice rises' SMB records are strongly affected by wind-driven redistribution of snow at the ice crest. In addition, we note the wide range of shapes of the ice rises, with some connected to the main land, and others entirely surrounded by ice shelves. Interactions of the synoptic circulation coming from the Southern Ocean with the katabatic winds from the ice sheet interior could affect snow redistribution. The contrasting ice rise geometries combined with the local wind influence could significantly modify a SMB signal locally. These local effects will therefore modify the SMB time series recorded by the ice cores during or after snowfall events. In addition, ice flow dynamics within the ice rises could have changed the position of the ice crest maximum over time, however this should not have a large impact on a few decades. Another potential reason for the disagreement between the reconstruction and observed/modeled atmospheric circulation is that we use a downscaled model ensemble based on snowfall associations in which we assimilate ice core SMB records. So if surface snow redistribution plays a large role in the individual ice cores' SMB records, this is not captured in the model ensemble. However, RACMO2.3p SMB does not reproduce well the small-scale process such as those linked with wind redistribution (Agosta et al., 2019) and therefore a downscaled SMB model ensemble would not have significantly changed the results in this case. We repeated the DA using the radar-derived SMB directly (which retains the ice core's temporal variability, as shown in Cavitte et al., 2023) with its associated observation errors and the same model prior, which we compare to the assimilation of the ice core SMB in the Supplement (Supplement Sect. S2). The SMB and wind spatial patterns obtained are distinctly different from the ice core-based reconstruction's and from the patterns observed in RACMO2.3p. This radar-based reconstruction is technically sound with the hypotheses chosen but the results are not robust, over-fitting of the radar data inputs is observed once again. The reconstruction obtained is sensitive to the assimilated data.
Münch et al. (2017) show that an ice core is not necessarily representative of a very wide surface area. A combination of both sub-annual and local spatial processes might be at work to explain the different SMB records observed on the ice rises. A solution could be to average several ice cores. However, this is difficult to do with the limited number of ice cores available. Another option would be to assimilate the ice core records at a lower temporal resolution to increase the signal-to-noise in the records. The reconstruction is particularly difficult due to the complexity of the region, with very contrasted topography and therefore potentially strong wind interactions with the relief. Perhaps attempting a similar reconstruction but applied to a region with smoother topographic relief could improve the skill of the reconstruction. We note that the ice core SMB records used here are uncorrected for vertical strain rates. But as we only examine the top 50 m of the ice column, we can reasonably assume that this has a minimal impact on the SMB reconstructed over the corresponding time period. We also note that although RACMO2.3p captures well large-scale atmospheric circulation, being constrained by ERA-Interim reanalysis (Lenaerts et al., 2017), this model has large errors in SMB locally, especially in topographically complex areas such as the DML coastline (Kausch et al., 2020; Cavitte et al., 2020).
By combining a high resolution downscaled atmospheric circulation model ensemble and well constrained ice core SMB records with quantified observation errors using co-located radar observations through a DA framework, we are able to reconstruct well the annual ice core SMB records measured at eight ice rises along the DML coast. However, although the DA experiments work from a technical standpoint, the atmospheric circulation at large spatial scales reconstructed patterns do not agree with the regional climate model RACMO2.3p for the region. We conclude that annual circulation changes at large spatial scales-only cannot explain the observed local records of SMB. A combination of local effects at a smaller spatial scale than 5.5 km and precipitation events at the sub-annual timescale might be able to explain the contrasting ice core records. Ice cores' temporal resolution strongly depends on accumulation, generally annual in the first few hundred meters of the ice sheet. Therefore, we need to rely on other types of SMB records such as automatic weather stations to have information on these shorter timescales. The issue in that case is that such records are currently not long enough to retrieve meaningful SMB trends to reconstruct circulation patterns beyond the reanalysis era. Although the radar-derived SMB provide local constraints on the error of representativeness of the SMB records, they potentially still underestimate the full uncertainties of the records. On the other hand, as regional climate models improve in grid resolution with increasing computer power and the emergence of Machine Learning and Artificial Intelligence emulators, very high resolution regional climate or snow models might soon provide appropriate simulations to examine the contribution of local wind circulation in local SMB measurements.
Radar-derived SMB can be found at https://doi.org/10.14428/DVN/J34MQO (Cavitte, 2023). RACMO2.3p simulations are available by request to J. M. (Melchior) van Wessem. Downscaled annual snowfall, the PCs and the EOFs used for the downscaling are available at https://doi.org/10.5281/zenodo.4287517 (Ghilain et al., 2021); downscaled annual wind simulations are available at https://doi.org/10.5281/zenodo.17366618 (Ghilain and Cavitte, 2025).
The supplement related to this article is available online at https://doi.org/10.5194/tc-19-6483-2025-supplement.
MGPC led the data analysis, assimilation, wind-downscaling and writing. HG provided rich discussions in planning the experiments. QD provided the data assimilation framework and support for running the experiments. NG provided the downscaling expertise. All co-authors contributed to the discussions on this work. MGPC prepared the paper with contributions from all co-authors.
The contact author has declared that none of the authors has any competing interests.
Publisher’s note: Copernicus Publications remains neutral with regard to jurisdictional claims made in the text, published maps, institutional affiliations, or any other geographical representation in this paper. While Copernicus Publications makes every effort to include appropriate place names, the final responsibility lies with the authors. Views expressed in the text are those of the authors and do not necessarily reflect the views of the publisher.
We would like to thank all those involved in data collection, ice core and radar data processing under the Mass2Ant and MADICE projects upon which this study relies. Marie Cavitte and Quentin Dalaiden were postdoctoral researchers of the FRS-FNRS (Belgium) for the duration of the study. Hugues Goosse is a research director within the FRS-FNRS. Nicolas Ghilain is funded by the Belgian Science Policy through the Fed-tWin program. Computational resources were provided by the supercomputing facilities of the Université catholique de Louvain (CISM/UCL) and the Consortium des Équipements de Calcul Intensif en Fédération Wallonie Bruxelles (CÉCI), funded by Fond de la Recherche Scientifique de Belgique (F.R.S.-FNRS) under convention 2.5020.11 and by the Walloon Region. Finally, we would like to thank the Editor Reinhard Drews for his encouragement and the Reviewers for their constructive reviews and helpful comments which made this paper much stronger.
This research has been supported by the Fonds De La Recherche Scientifique – FNRS, the Belgian Research Action through Interdisciplinary Networks (BRAIN.be) from the Belgian Science Policy Office in the framework of the “East Antarctic surface mass balance in the Anthropocene: observations and multiscale modelling (Mass2Ant)” project (contract no. BR/165/A2/Mass2Ant), the India-Norway MADICE project from the Ministry of Earth Sciences, India (Grant No. MoES/Indo-Nor/PS-3/2015). QD also received support from European Union’s Horizon 2020 research and innovation programme under the Marie Skłodowska-Curie grant agreement 101149188.
This paper was edited by Reinhard Drews and reviewed by two anonymous referees.
Agosta, C., Amory, C., Kittel, C., Orsi, A., Favier, V., Gallée, H., van den Broeke, M. R., Lenaerts, J. T. M., van Wessem, J. M., van de Berg, W. J., and Fettweis, X.: Estimation of the Antarctic surface mass balance using the regional climate model MAR (1979–2015) and identification of dominant processes, The Cryosphere, 13, 281–296, https://doi.org/10.5194/tc-13-281-2019, 2019. a, b, c
Casado, M., Münch, T., and Laepple, T.: Climatic information archived in ice cores: impact of intermittency and diffusion on the recorded isotopic signal in Antarctica, Clim. Past, 16, 1581–1598, https://doi.org/10.5194/cp-16-1581-2020, 2020. a
Cavitte, M.: Gridded surface mass balance derived from shallow radar stratigraphy over eight ice rises along the Dronning Maud Land coast and one site in the Dome Fuji region, Antarctica, Open Data @ UCLouvain [data set], https://doi.org/10.14428/DVN/J34MQO, 2023. a
Cavitte, M. G., Goosse, H., Wauthy, S., Kausch, T., Tison, J.-L., Van Liefferinge, B., Pattyn, F., Lenaerts, J. T., and Claeys, P.: From ice core to ground-penetrating radar: representativeness of SMB at three ice rises along the Princess Ragnhild Coast, East Antarctica, Journal of Glaciology, 68, 1221–1233, https://doi.org/10.1017/jog.2022.39, 2022. a, b, c, d, e
Cavitte, M. G. P., Dalaiden, Q., Goosse, H., Lenaerts, J. T. M., and Thomas, E. R.: Reconciling the surface temperature–surface mass balance relationship in models and ice cores in Antarctica over the last 2 centuries, The Cryosphere, 14, 4083–4102, https://doi.org/10.5194/tc-14-4083-2020, 2020. a
Cavitte, M. G. P., Goosse, H., Matsuoka, K., Wauthy, S., Goel, V., Dey, R., Pratap, B., Van Liefferinge, B., Meloth, T., and Tison, J.-L.: Investigating the spatial representativeness of East Antarctic ice cores: a comparison of ice core and radar-derived surface mass balance over coastal ice rises and Dome Fuji, The Cryosphere, 17, 4779–4795, https://doi.org/10.5194/tc-17-4779-2023, 2023. a, b, c, d, e
Dalaiden, Q., Goosse, H., Rezsohazy, J., and Thomas, E. R.: Reconstructing atmospheric circulation and sea-ice extent in the West Antarctic over the past 200 years using data assimilation, Climate Dynamics, 3479–3503, https://doi.org/10.1007/s00382-021-05879-6, 2021. a, b, c
Dalaiden, Q., Rezsöhazy, J., Goosse, H., Thomas, E. R., Vladimirova, D. O., and Tetzner, D.: An Unprecedented Sea Ice Retreat in the Weddell Sea Driving an Overall Decrease of the Antarctic Sea-Ice Extent Over the 20th Century, Geophysical Research Letters, 50, e2023GL104666, https://doi.org/10.1029/2023GL104666, e 2023. a
Dallmayr, R., Laepple, T., Freitag, J., Behrens, M., Lisovski, S., Jansen, D., Wilhelms, F., and Hörhold, M.: Topographic Effect Creates Non-climatic Variations in Ice-Core Based Temperature Records of the Last Millennium in Dronning Maud Land, Antarctica, Geophysical Research Letters, 52, e2025GL115124, https://doi.org/10.1029/2025GL115124, 2025. a
Danabasoglu, G., Lamarque, J.-F., Bacmeister, J., Bailey, D. A., DuVivier, A. K., Edwards, J., Emmons, L. K., Fasullo, J., Garcia, R., Gettelman, A., Hannay, C., Holland, M. M., Large, W. G., Lauritzen, P. H., Lawrence, D. M., Lenaerts, J. T. M., Lindsay, K., Lipscomb, W. H., Mills, M. J., Neale, R., Oleson, K. W., Otto-Bliesner, B., Phillips, A. S., Sacks, W., Tilmes, S., van Kampenhout, L., Vertenstein, M., Bertini, A., Dennis, J., Deser, C., Fischer, C., Fox-Kemper, B., Kay, J. E., Kinnison, D., Kushner, P. J., Larson, V. E., Long, M. C., Mickelson, S., Moore, J. K., Nienhouse, E., Polvani, L., Rasch, P. J., and Strand, W. G.: The Community Earth System Model Version 2 (CESM2), Journal of Advances in Modeling Earth Systems, 12, e2019MS001916, https://doi.org/10.1029/2019MS001916, 2020. a, b
Dey, R., Thamban, M., Laluraj, C. M., Mahalinganathan, K., Redkar, B. L., Kumar, S., and Matsuoka, K.: Application of visual stratigraphy from line-scan images to constrain chronology and melt features of a firn core from coastal Antarctica, Journal of Glaciology, 69, 179–190, https://doi.org/10.1017/jog.2022.59, 2023. a, b
Dubinkina, S., Goosse, H., Sallaz-Damaz, Y., Crespin, E., and Crucifix, M.: Testing a particle filter to reconstruct climate changes over the past centures, International Journal of Bifurcation and Chaos, 21, 3611–3618, https://doi.org/10.1142/S0218127411030763, 2011. a, b
Ghilain, N. and Cavitte, M.: MASS2ANT Surface (10 meters height) wind field Dataset (Downscaling CESM2 @5.5km over Dronning Maud Land, Antarctica, 1850–2014), Zenodo [data set], https://doi.org/10.5281/zenodo.17366618, 2025. a
Ghilain, N., Vannitsem, S., Dalaiden, Q., Goosse, H., and De Cruz, L.: MASS2ANT Snowfall Dataset (Downscaling @5.5km over Dronning Maud Land, Antarctica, 1850–2014), Zenodo [data set], https://doi.org/10.5281/zenodo.4287517, 2021. a, b, c
Ghilain, N., Vannitsem, S., Dalaiden, Q., Goosse, H., De Cruz, L., and Wei, W.: Large ensemble of downscaled historical daily snowfall from an earth system model to 5.5 km resolution over Dronning Maud Land, Antarctica, Earth Syst. Sci. Data, 14, 1901–1916, https://doi.org/10.5194/essd-14-1901-2022, 2022. a, b, c, d
Hersbach, H., Bell, B., Berrisford, P., Hirahara, S., Horányi, A., Muñoz-Sabater, J., Nicolas, J., Peubey, C., Radu, R., Schepers, D., Simmons, A., Soci, C., Abdalla, S., Abellan, X., Balsamo, G., Bechtold, P., Biavati, G., Bidlot, J., Bonavita, M., De Chiara, G., Dahlgren, P., Dee, D., Diamantakis, M., Dragani, R., Flemming, J., Forbes, R., Fuentes, M., Geer, A., Haimberger, L., Healy, S., Hogan, R. J., Hólm, E., Janisková, M., Keeley, S., Laloyaux, P., Lopez, P., Lupu, C., Radnoti, G., de Rosnay, P., Rozum, I., Vamborg, F., Villaume, S., and Thépaut, J.-N.: The ERA5 global reanalysis, Quarterly Journal of the Royal Meteorological Society, 146, 1999–2049, https://doi.org/10.1002/qj.3803, 2020. a
Hirsch, N., Zuhr, A., Münch, T., Hörhold, M., Freitag, J., Dallmayr, R., and Laepple, T.: Stratigraphic noise and its potential drivers across the plateau of Dronning Maud Land, East Antarctica, The Cryosphere, 17, 4207–4221, https://doi.org/10.5194/tc-17-4207-2023, 2023. a
Jezek, K. C., Curlander, J. C., Carsey, F., Wales, C., and Barry, R. G.: RAMP AMM-1 SAR Image Mosaic of Antarctica [data set], https://nsidc.org/data/nsidc-0103/versions/2 (last access: 2024), 2013. a
Kausch, T., Lhermitte, S., Lenaerts, J. T. M., Wever, N., Inoue, M., Pattyn, F., Sun, S., Wauthy, S., Tison, J.-L., and van de Berg, W. J.: Impact of coastal East Antarctic ice rises on surface mass balance: insights from observations and modeling, The Cryosphere, 14, 3367–3380, https://doi.org/10.5194/tc-14-3367-2020, 2020. a, b, c, d
Lenaerts, J., Lhermitte, S., Drews, R., Ligtenberg, S., Berger, S., Helm, V., Smeets, C., Van den Broeke, M., Van De Berg, W. J., Van Meijgaard, E., Eijkelboom, M., Eisen, O., and Pattyn, F.: Meltwater produced by wind–albedo interaction stored in an East Antarctic ice shelf, Nat. Clim. Chang., 7, 58, https://doi.org/10.1038/nclimate3180, 2017. a, b, c, d
Lenaerts, J. T. M., Medley, B., van den Broeke, M. R., and Wouters, B.: Observing and Modeling Ice Sheet Surface Mass Balance, Reviews of Geophysics, 57, 376–420, https://doi.org/10.1029/2018RG000622, 2019. a, b
Medley, B. and Thomas, E.: Increased snowfall over the Antarctic Ice Sheet mitigated twentieth-century sea-level rise, Nature Climate Change, 9, 34, https://doi.org/10.1038/s41558-018-0356-x, 2019. a
Münch, T., Kipfstuhl, S., Freitag, J., Meyer, H., and Laepple, T.: Constraints on post-depositional isotope modifications in East Antarctic firn from analysing temporal changes of isotope profiles, The Cryosphere, 11, 2175–2188, https://doi.org/10.5194/tc-11-2175-2017, 2017. a
Philippe, M., Tison, J.-L., Fjøsne, K., Hubbard, B., Kjær, H. A., Lenaerts, J. T. M., Drews, R., Sheldon, S. G., De Bondt, K., Claeys, P., and Pattyn, F.: Ice core evidence for a 20th century increase in surface mass balance in coastal Dronning Maud Land, East Antarctica, The Cryosphere, 10, 2501–2516, https://doi.org/10.5194/tc-10-2501-2016, 2016. a
Steiger, N. J., Steig, E. J., Dee, S. G., Roe, G. H., and Hakim, G. J.: Climate reconstruction using data assimilation of water isotope ratios from ice cores, Journal of Geophysical Research: Atmospheres, 122, 1545–1568, 2017. a, b
Valler, V., Brugnara, Y., Franke, J., and Brönnimann, S.: Assimilating monthly precipitation data in a paleoclimate data assimilation framework, Clim. Past, 16, 1309–1323, https://doi.org/10.5194/cp-16-1309-2020, 2020. a
van Wessem, J. M., van de Berg, W. J., Noël, B. P. Y., van Meijgaard, E., Amory, C., Birnbaum, G., Jakobs, C. L., Krüger, K., Lenaerts, J. T. M., Lhermitte, S., Ligtenberg, S. R. M., Medley, B., Reijmer, C. H., van Tricht, K., Trusel, L. D., van Ulft, L. H., Wouters, B., Wuite, J., and van den Broeke, M. R.: Modelling the climate and surface mass balance of polar ice sheets using RACMO2 – Part 2: Antarctica (1979–2016), The Cryosphere, 12, 1479–1498, https://doi.org/10.5194/tc-12-1479-2018, 2018. a
Vega, C. P., Schlosser, E., Divine, D. V., Kohler, J., Martma, T., Eichler, A., Schwikowski, M., and Isaksson, E.: Surface mass balance and water stable isotopes derived from firn cores on three ice rises, Fimbul Ice Shelf, Antarctica, The Cryosphere, 10, 2763–2777, https://doi.org/10.5194/tc-10-2763-2016, 2016. a, b, c
Wang, Y., Ding, M., Reijmer, C. H., Smeets, P. C. J. P., Hou, S., and Xiao, C.: The AntSMB dataset: a comprehensive compilation of surface mass balance field observations over the Antarctic Ice Sheet, Earth Syst. Sci. Data, 13, 3057–3074, https://doi.org/10.5194/essd-13-3057-2021, 2021. a
Wauthy, S., Tison, J.-L., Inoue, M., El Amri, S., Sun, S., Fripiat, F., Claeys, P., and Pattyn, F.: Spatial and temporal variability of environmental proxies from the top 120 m of two ice cores in Dronning Maud Land (East Antarctica), Earth Syst. Sci. Data, 16, 35–58, https://doi.org/10.5194/essd-16-35-2024, 2024. a, b