the Creative Commons Attribution 4.0 License.
the Creative Commons Attribution 4.0 License.
 | 24 Oct 2025
Rapid regional assessment of rock glacier activity based on DInSAR wrapped-phase signal
Federico Agliardi
Chiara Crippa
Daniele Codara
Federico Franzosi
Alpine periglacial landforms like rock glaciers and protalus ramparts are key indicators of the state of permafrost. They are characterized by complex deformation mechanisms and temporal trends, possibly evolving towards destabilization. A quantitative assessment of their activity is thus fundamental in climatological and geohazard perspectives. Spaceborne interferometric synthetic-aperture radar (InSAR) techniques provide powerful tools to document the surface deformations of periglacial features, yet their application to the rapid screening of rock glacier activity over wide areas is still limited.
We propose a semi-automated methodology that combines wrapped-phase deformation signals obtained from differential interferometric synthetic-aperture radar (DInSAR), available information on permafrost extent, geomorphological data, and multivariate statistics to characterize the activity of 514 periglacial landforms over 1000 km2 in Upper Valtellina (Central Alps, Italy). We process Sentinel-1 A and B SAR images with increasing temporal baselines (12 to 120 d) to generate 124 interferograms in ascending and descending geometries. We analyse the statistical distribution of the wrapped interferometric phase to assess the state of activity of each periglacial landform through an objective activity index. This is combined with regional-scale information on the likelihood of permafrost occurrence to classify periglacial landforms based on their activity on different temporal scales. We obtain four activity classes, validated by comparison to geomorphological evidence and related to environmental variables through multivariate statistics. Our results demonstrate the potential of wrapped DInSAR products, routinely generated over large areas and unaffected by unwrapping errors, to support a regional-scale screening of periglacial landform activity and the identification of candidates for site-specific studies.
- Article
(24722 KB) - Full-text XML
-
Supplement
(717 KB) - BibTeX
- EndNote


Ongoing climate change strongly impacts the alpine cryosphere, with major implications for mountain landscapes, hydrology, the availability of water resources, infrastructure stability and durability, and geohazards (Haeberli, 2013; Beniston et al., 2018; Kääb et al., 2021). Permafrost degradation caused by climate warming changes the rheology and stability of ice-bearing soils, affecting alpine slope dynamics, sediment transport, and possible destabilization (Springman et al., 2012; Scapozza et al., 2014; Marcer et al., 2019; Cicoira et al., 2021). Moreover, rising ground temperature and the subsequent ice loss can reduce the water storage potential of rock glaciers (Jones et al., 2018a, b), increase subsurface water triggering fast shallow-slope instabilities, and contribute to slope-scale natural hazards (Stoffel and Huggel, 2012; Bodin et al., 2016; Kummert et al., 2017). In this context, the study of periglacial landforms like rock glaciers and protalus ramparts is of key importance as their distribution and activity are critical indicators of the past and present conditions of mountain permafrost, and changes in their dynamics provide proxies of climate change trends (Haeberli and Beniston, 1998; Berger et al., 2004; Kellerer-Pirklbauer and Kaufmann, 2012; Cicoira et al., 2021; Beniston et al., 2017).
Rock glaciers and protalus ramparts are bodies of frozen debris and ice that move under gravity load in permafrost areas (Barsch, 1996), typically associated with permafrost bodies 10 to 100 m thick (Vonder Mühll and Haeberli, 1990; Humlum, 1997). Their development requires favourable combinations of climatic and topographic conditions and precipitation regimes and the supply of debris with a suitable grain size (e.g. Kääb and Weber, 2004). These landforms are more resilient to climate warming than glaciers thanks to a surface debris cover that insulates an ice-rich core (Jones et al., 2019; Buchelt et al., 2023).
Rock glaciers are characterized by elongated shapes and steep fronts and, depending on the occurrence or lack of internal ice, are classified as intact or relict (Barsch, 1996). Intact rock glaciers normally have a swollen appearance, with well-developed lobes of coarse debris, steep creeping fronts, and transverse ridges and furrows, resulting from compression and extension associated with different flow velocities and internal deformation patterns. Relict rock glaciers, which have lost their frozen core entirely, tend to have flatter surface morphology, with vegetated relic structures testifying to past movements (Barsch, 1996; Scotti et al., 2013; RGIK, 2023a).
Protalus ramparts are ridges or debris ramps whose origin is still debated but is usually related to the deformation of permafrost-bearing debris at the base of steep talus slopes below rocky cliffs in alpine environments (Shakesby, 2004; Hedding, 2011; Scapozza et al., 2011; Scotti et al., 2013).
The surface movement of rock glaciers and protalus ramparts is spatially heterogeneous and reflects the internal processes of permafrost creep and shearing within a distinct shear horizon, typically situated at depth in the permafrost core (Haeberli, 1985; Springman et al., 2012; Cicoira et al., 2021; RGIK, 2023a; Hu et al., 2025). The typical rates of movement of rock glaciers and protalus ramparts usually range between a few centimetres and several decimetres per year, exhibit seasonal variations (Delaloye and Staub, 2016; Wirz et al., 2016; Kenner et al., 2017), and can reach some metres per year in the case of ice-rich landforms on steep slopes (Haeberli, 1985; Haeberli et al., 2006). Thus, a complete characterization of the state of the activity of periglacial landforms requires a quantitative analysis that is conducted over different temporal scales and is able to reflect the contributions of the different deformation mechanisms.
A proper in situ assessment of the structure, mechanisms, and state of the activity of creeping periglacial features relies on field mapping, geophysical surveys, boreholes, and ground-based displacement measurements (Krainer et al., 2015; Fey and Krainer, 2020; Bearzot et al., 2022; Bertone et al., 2023). Nevertheless, as site accessibility, geomorphological and dynamic complexity, and budget constraints limit the possibility to systematically characterize hundreds of thousands of inventoried landforms, regional assessments based on detailed field studies remain limited.
Regional inventories, based on geomorphological criteria, traditionally included activity attributes of mapped landforms that rely on their surface evidence (Barsch, 1996; Scotti et al., 2013) and lacked a quantitative assessment of associated spatial–temporal kinematic patterns. To fill this gap, remote sensing techniques, including spaceborne interferometric synthetic-aperture radar (InSAR) and offset tracking applied to optical images, have been used to retrieve displacement fields and time series for mapped periglacial features (Strozzi et al., 2020; Kääb et al., 2021; Zhang et al., 2021; Bertone et al., 2022; Buchelt et al., 2023). At the site-specific scale, the integrated use of interferometric and offset tracking techniques allows for the following of rock glacier activity across multiple temporal scales, from cm yr−1 to m yr−1, and up to destabilization (e.g. Cicoira et al., 2021). On the regional scale, the International Permafrost Association (IPA) RGIK Action Group (Strozzi et al., 2020; Bertone et al., 2022; RGIK, 2023a) has proposed detailed guidelines to improve rock glacier inventories in mountain regions, including a kinematic attribute based on multi-annual velocity ranges derived by differential interferometric synthetic-aperture radar (DInSAR) and local-scale monitoring data. All of these approaches greatly improved the state of the art, allowing us to effectively capture the displacement rates and styles of the activity of periglacial features. However, they rely on the manual analysis of multiple DInSAR interferograms and satellite optical images (Kääb et al., 2021; Rouyet et al., 2021; Zhang et al., 2021; Jones et al., 2023; RGIK, 2023a) or the analysis of rock glacier velocity (RGV) as derived from displacement time series available for selected reference landforms (RGIK, 2023b, c; Hu et al., 2025). Thus, they are time consuming or difficult to apply systematically to regional inventory datasets that include hundreds or thousands of phenomena, especially if the analysis needs to be updated regularly (e.g. Pellet et al., 2023; Kellerer-Pirklbauer et al., 2024).
We propose a novel, semi-automated methodology that combines Sentinel-1 DInSAR wrapped-phase deformation signals, available information on permafrost extent, geomorphological data, and multivariate statistics to perform a regional-scale screening of the state of the activity of periglacial landforms over wide areas. We test our methodology on 514 rock glaciers and protalus ramparts, retrieved from a published inventory (Scotti et al., 2013) over 1000 km2 in Upper Valtellina (Central Alps, Italy), to demonstrate the potential of wrapped DInSAR products, unaffected by unwrapping errors, for a fast regional assessment of periglacial landform activity.
2.1 Periglacial landform inventory
The study area includes the upper alpine sector of Valtellina (∼ 1000 km2) in the region of Lombardia (northern Italy). From a geological point of view, the area is characterized by the outcrop of metamorphic, metasedimentary, and sedimentary rocks, belonging to the Variscan crystalline basement of the former Adria passive margin and the related Permo-Mesozoic sedimentary successions, stacked in the Austroalpine structural units during the Cretaceous period (Froitzheim et al., 1994).
The area is characterized by an elevation range of between 700 and 3850 m a.s.l.; high local relief; and a relatively steep topography (mean slope value of 30–35°) strongly imprinted by glaciations over the Quaternary, including the Last Glacial Maximum and later pulses (Ivy-Ochs et al., 2008; Bini et al., 2009), and until recent times. Although rapidly shrinking, glaciers still survive at the highest elevations (Fig. 1a), covering about 3 % of the study area (data from Smiraglia and Diolaiuti, 2016).
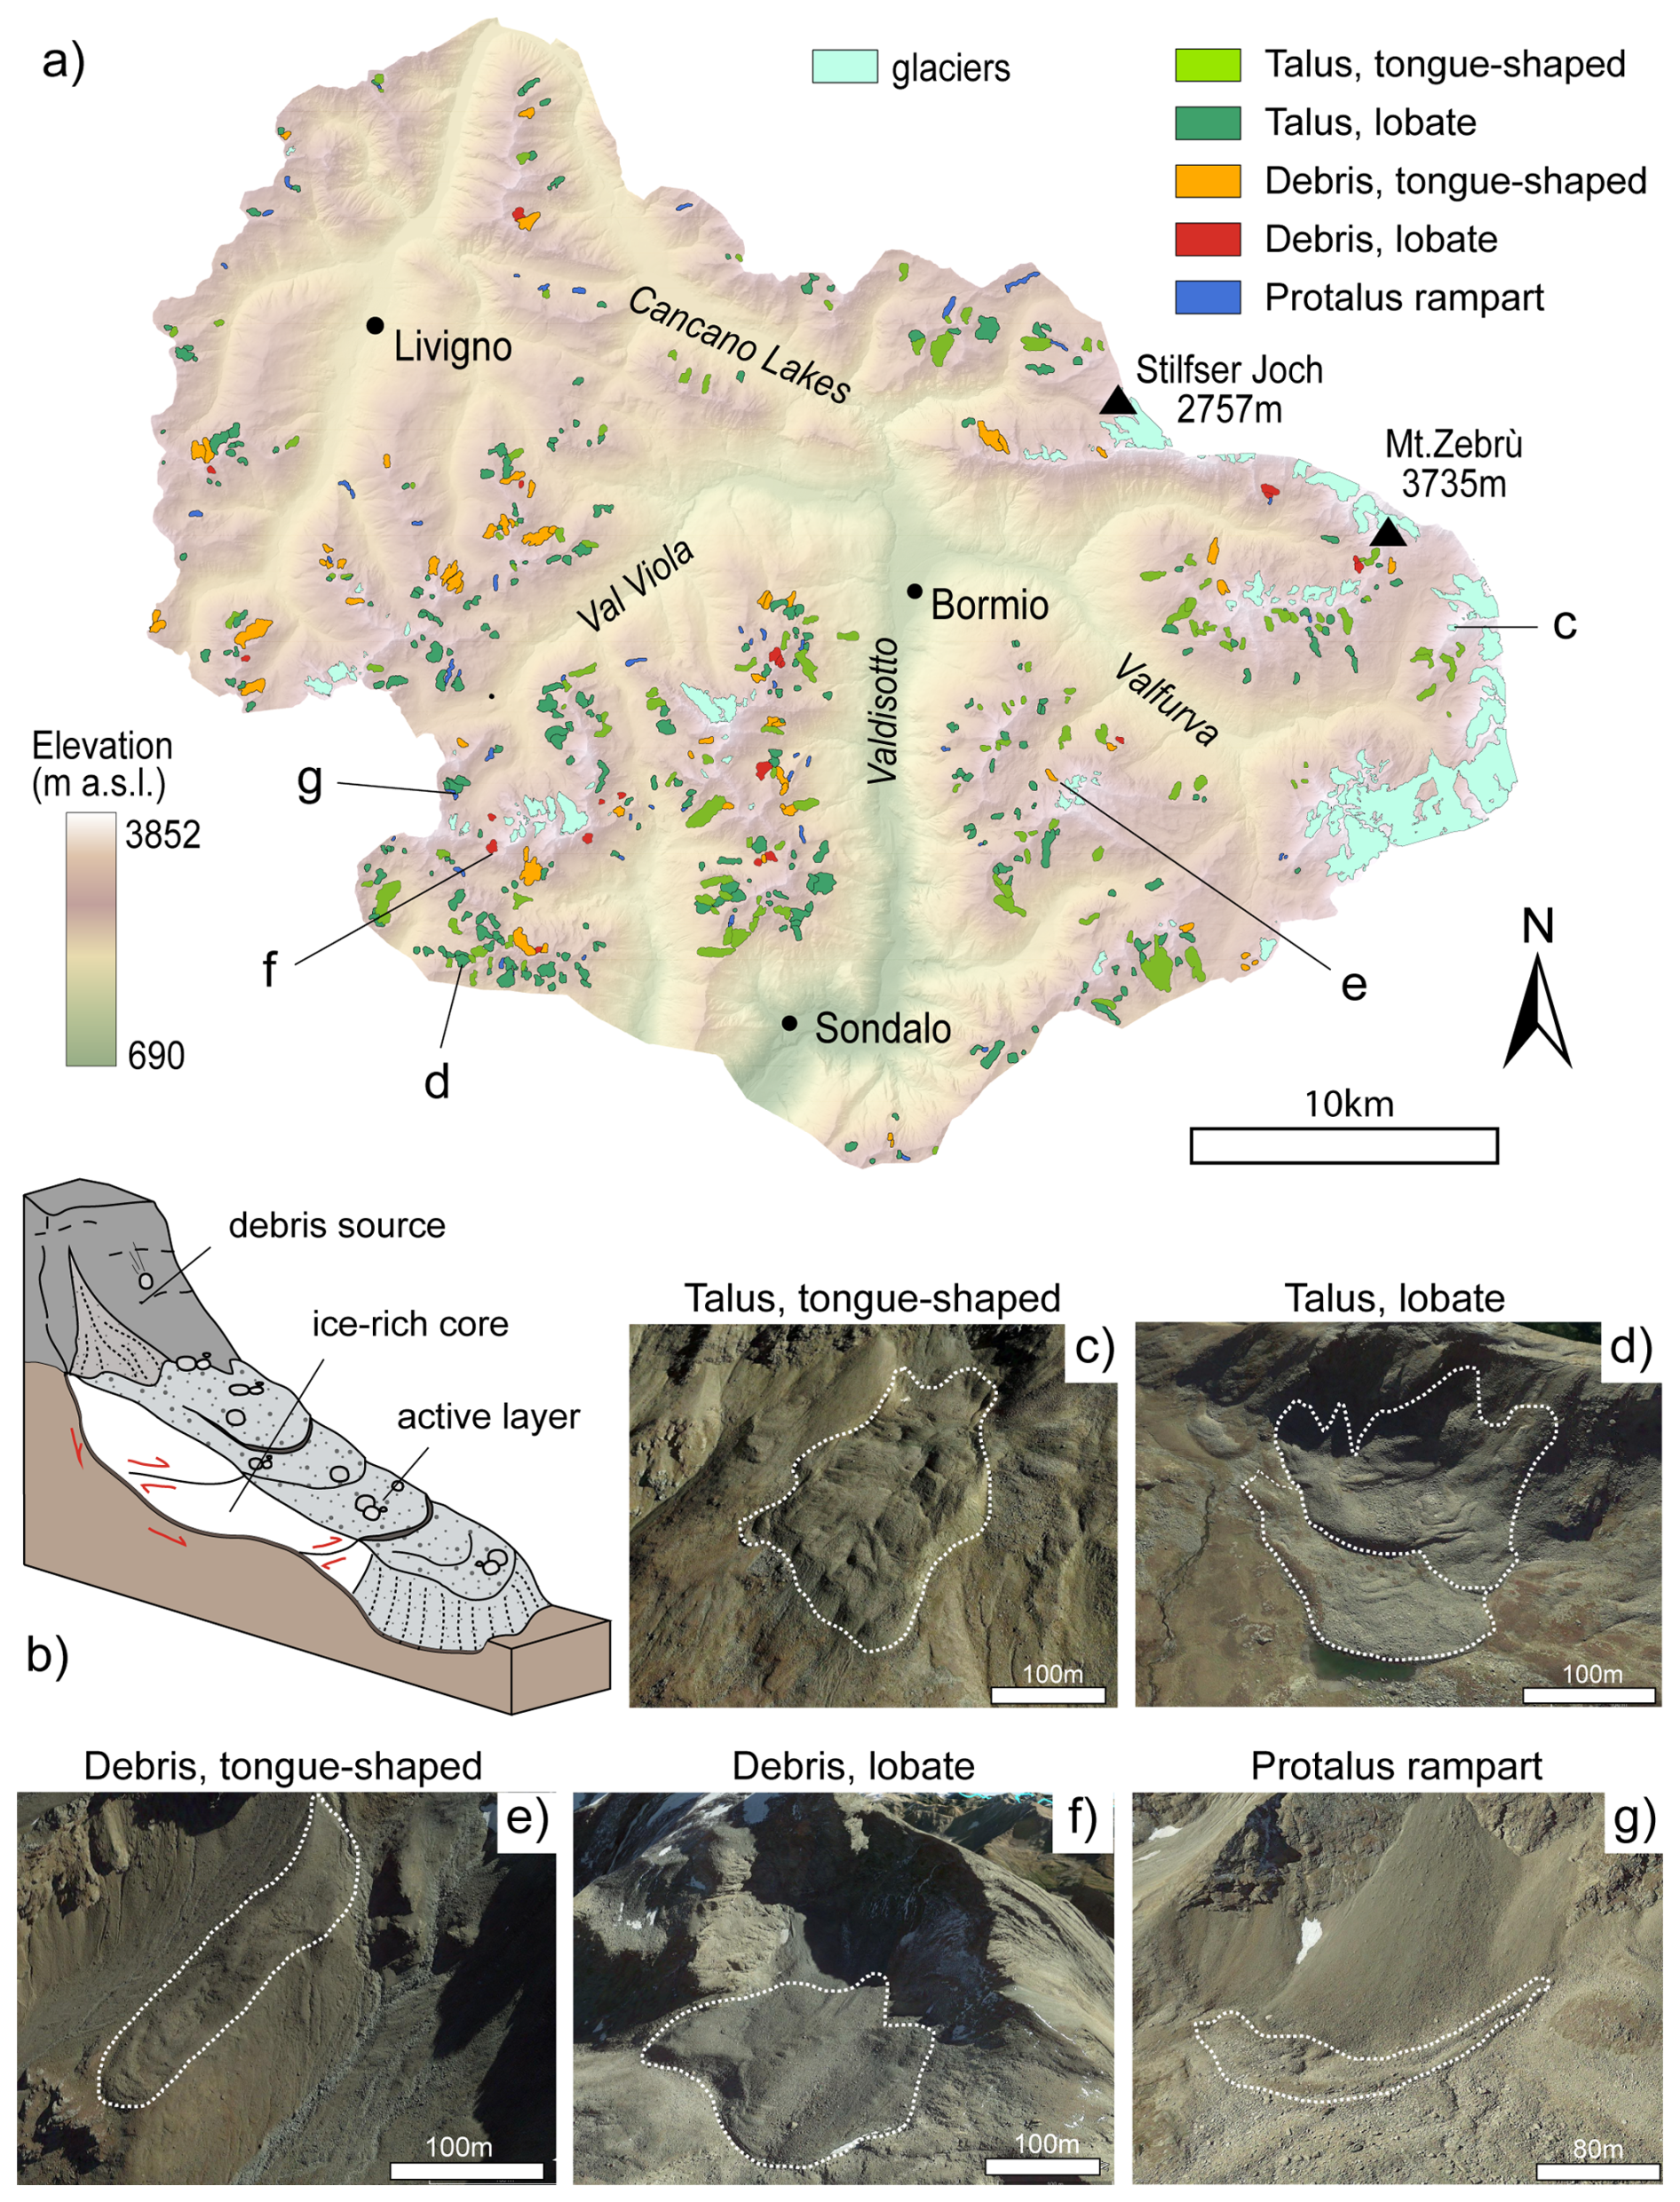
Figure 1Distribution and geomorphological classification of periglacial features mapped in the study area (after Scotti et al., 2013). (a) Inventory map (polygons). (b) Simplified sketch of an intact rock glacier. (c–g) Examples of mapped periglacial features, with locations shown in (a). Imagery: © Google Earth 2021.
The climate has a continental character, with average annual precipitation lower than 1000 mm and seasonal maxima in July–August and October–November (Scotti et al., 2013; Ceriani and Carelli, 2000; Casale and Bocchiola, 2022). The mean air temperature strongly depends on altitude but is generally lowest in January (mean air temperature: −10 to 0 °C) and highest in July (mean air temperature between 7 to 15 °C) over the entire area (Casale and Bocchiola, 2022).
Using aerial optical imagery, a 5 m digital elevation model (DEM), and field surveys, Scotti et al. (2013) compiled a geomorphological rock glacier inventory for the entirety of Lombardia. Within our study area, the inventory includes 514 protalus ramparts and rock glaciers, with the latter being classified according to both genetic and morphological attributes (Fig. 1 and Figs. S1–S3 in the Supplement). The genetic attribute indicates the origin of the material supplied to the landform: talus rock glaciers are fed by ice-free slope debris that originated from adjacent rock walls (including rockfall and rockslide deposits), while debris rock glaciers mainly rework glacial deposits (Barsch, 1996). The morphological attribute classifies rock glaciers, according to their plan shape and geometry, as lobate (length width < 1) or tongue-shaped (length width > 1; Barsch, 1996; Nyenhuis et al., 2005).
Scotti et al. (2013) also assigned to each mapped periglacial landform an attribute of “activity” (Fig. 2a; Table 1), essentially related to the geomorphological evidence of the expected inner presence or lack of ground ice. Intact rock glaciers are characterized by steep creeping fronts and side slopes and furrow-and-ridge morphologies usually associated with ice occurrence (Fig. 2b, c). Intact landforms may be “active” (i.e. moving) or “inactive”, i.e. in an advanced stage of permafrost degradation or lacking material supply and showing little to no movement (Barsch, 1996; Scotti et al., 2013). Here, we adopt the recent proposal of RGIK (2020, 2023a) to replace the term “inactive” with “transitional” since landforms with these geomorphological characteristics can still move at rates lower than 10 cm yr−1 (Lambiel et al., 2023). On the other hand, “relict” landforms show a subdued topography, collapsed structures, and growing vegetation (Fig. 2d), testifying to the complete disappearance of permafrost (Scotti et al., 2013).
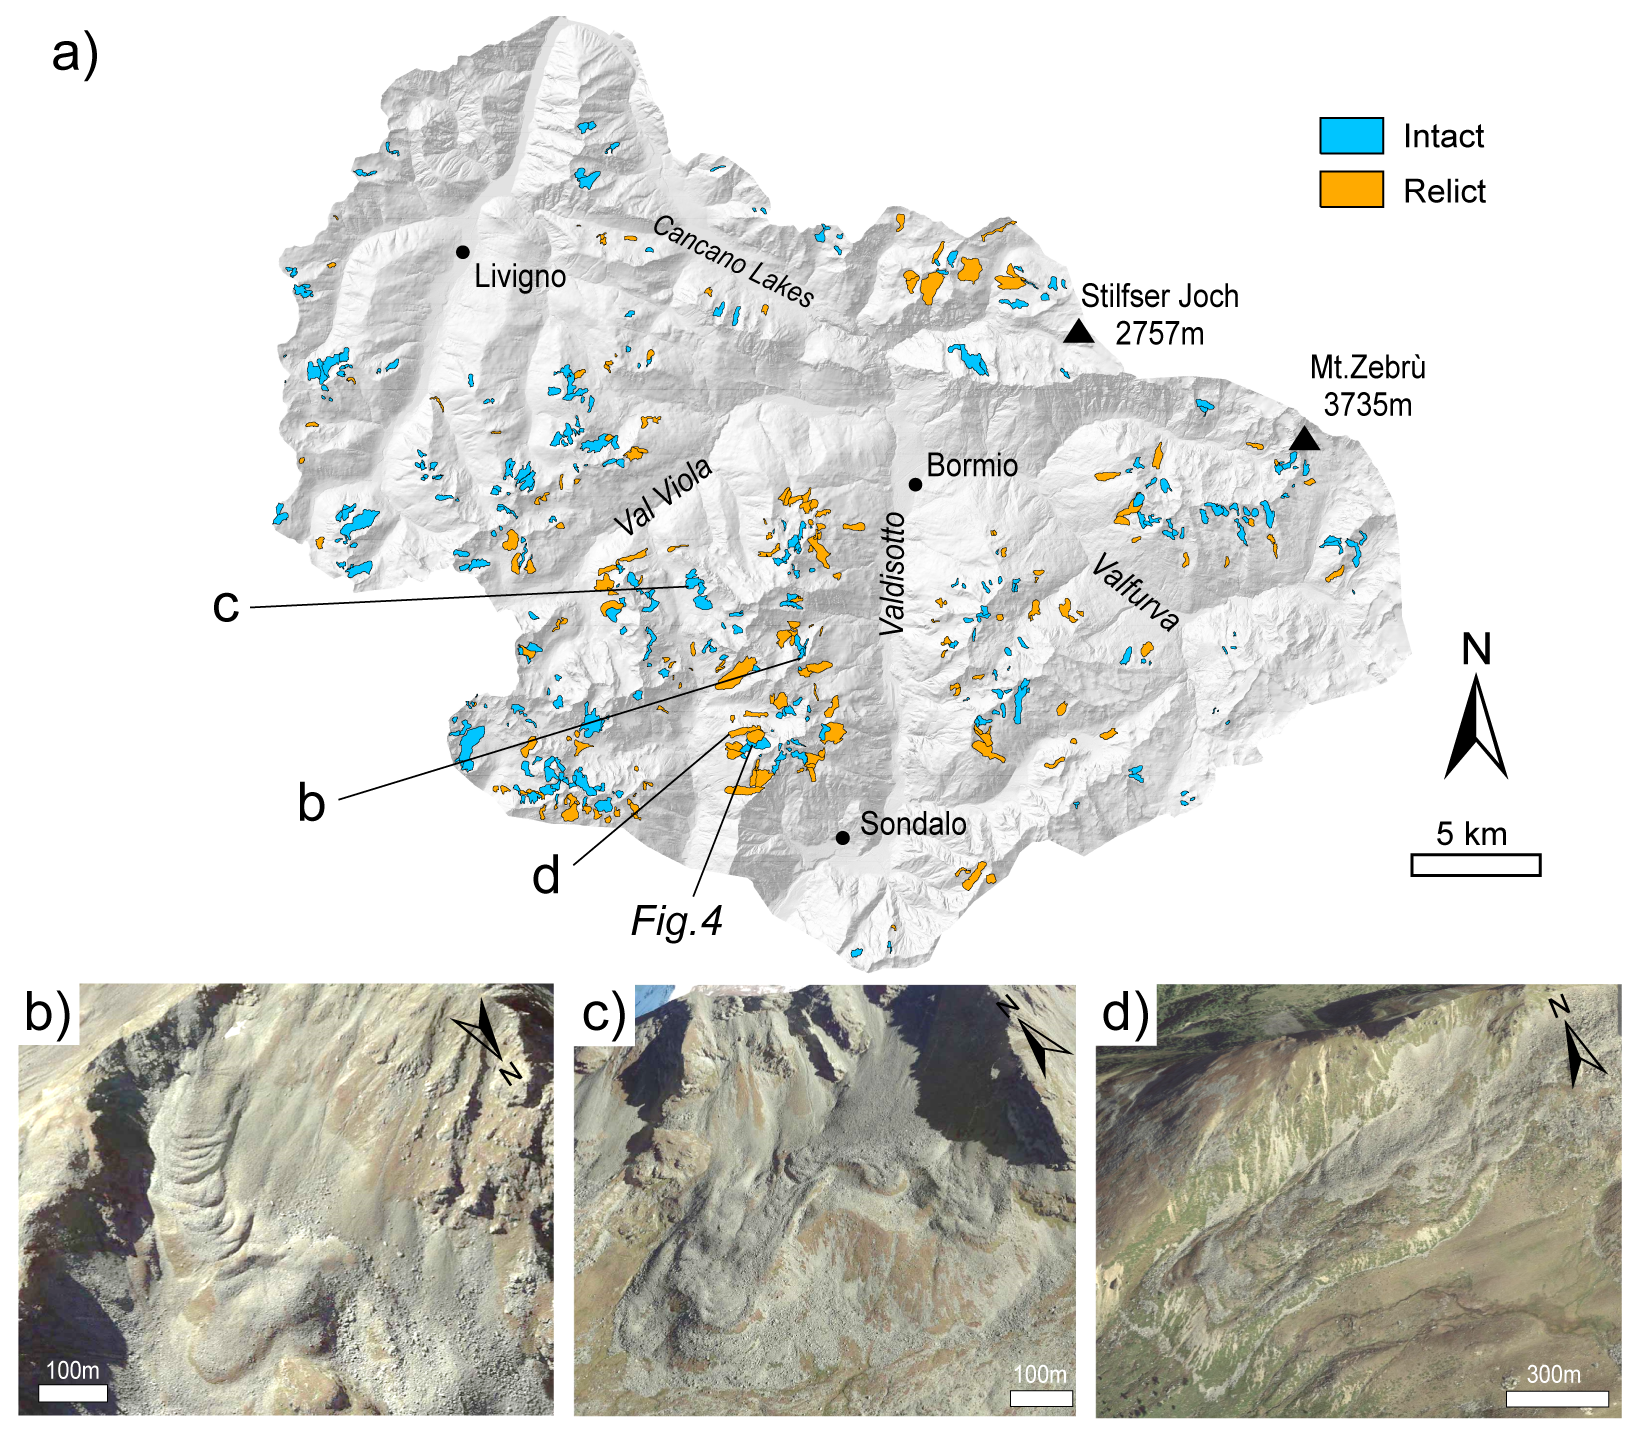
Figure 2Geomorphological classification of periglacial landform activity. (a) Distribution of activity classes according to Scotti et al. (2013). (b, c) Intact landforms. (d) Relict landforms. Landform locations are shown in (a). Imagery: © Google Earth 2021.
Table 1Inventory of periglacial landforms – subset of Scotti et al. (2013).
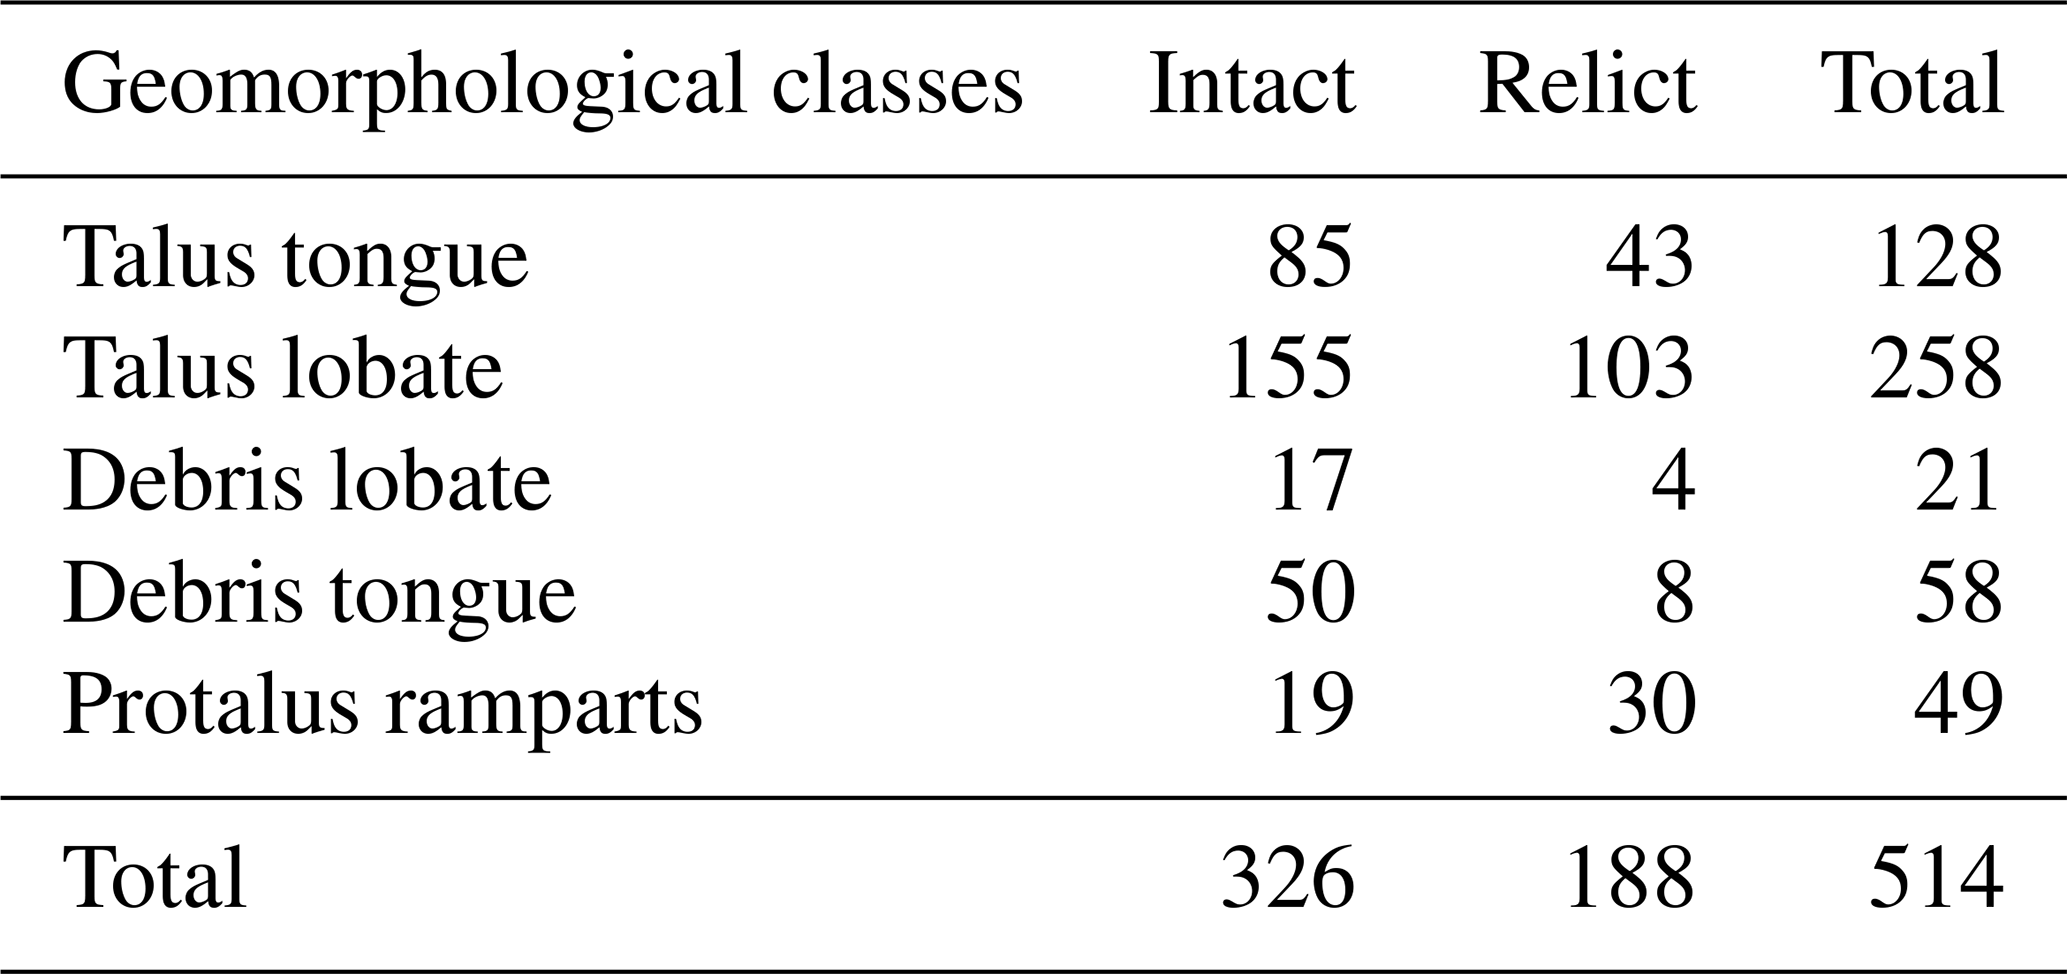
The resulting classification includes five classes of landforms (Table 1), distributed over the entire study area at altitudes between 2000 and 3500 m a.s.l. Relict features tend to be found at altitudes in the range of 2350–2550 m (Fig. S1) and are characterized by variable slope values depending on the considered class but are most frequently in the range of 16–25° (interquartile (IQ) range for the talus-lobate class; Fig. S2). Active landforms mostly occur between 2600 and 2800 m a.s.l. (Fig. S1) and are associated with slightly steeper slope values (20–28°, IQ range for talus-lobate features; Fig. S2). Mapped landforms are characterized by a variable topographic aspect (Fig. S3), with debris rock glaciers mainly facing to the north and talus-related landforms showing a more variable aspect related to the local cliff topography. Although it has not been updated since 2013, the inventory provides a robust reference to identify the location and general characteristics of periglacial landforms in the area.
2.2 Permafrost extent
We accounted for the likely extent of permafrost in the study area using the Alpine Permafrost Index Map (APIM; Boeckli et al., 2012). The APIM is the result of a statistical model accounting for a set of permafrost occurrence predictors, including mean annual air temperature, potential incoming solar radiation, and mean annual total precipitation (Boeckli et al., 2012).
Using an RGB colour code, the map portrays the likelihood of permafrost occurrence with respect to the local conditions (Fig. 3a, b). Since permafrost conditions may have changed since product publication, to obtain a conservative estimate of likely permafrost extent (i.e. considering only the API class “permafrost in nearly all conditions”), we recoded the map based on the red (R) band values of the APIM RGB colour code (range: 0–255) and then filtered the areas with R values below a specified threshold. We used a threshold of R=240, tuned to optimize the relative frequency of intact and relict features mapped by Scotti et al. (2013) in the resulting areas of modelled presence or lack of permafrost (Fig. 3c).
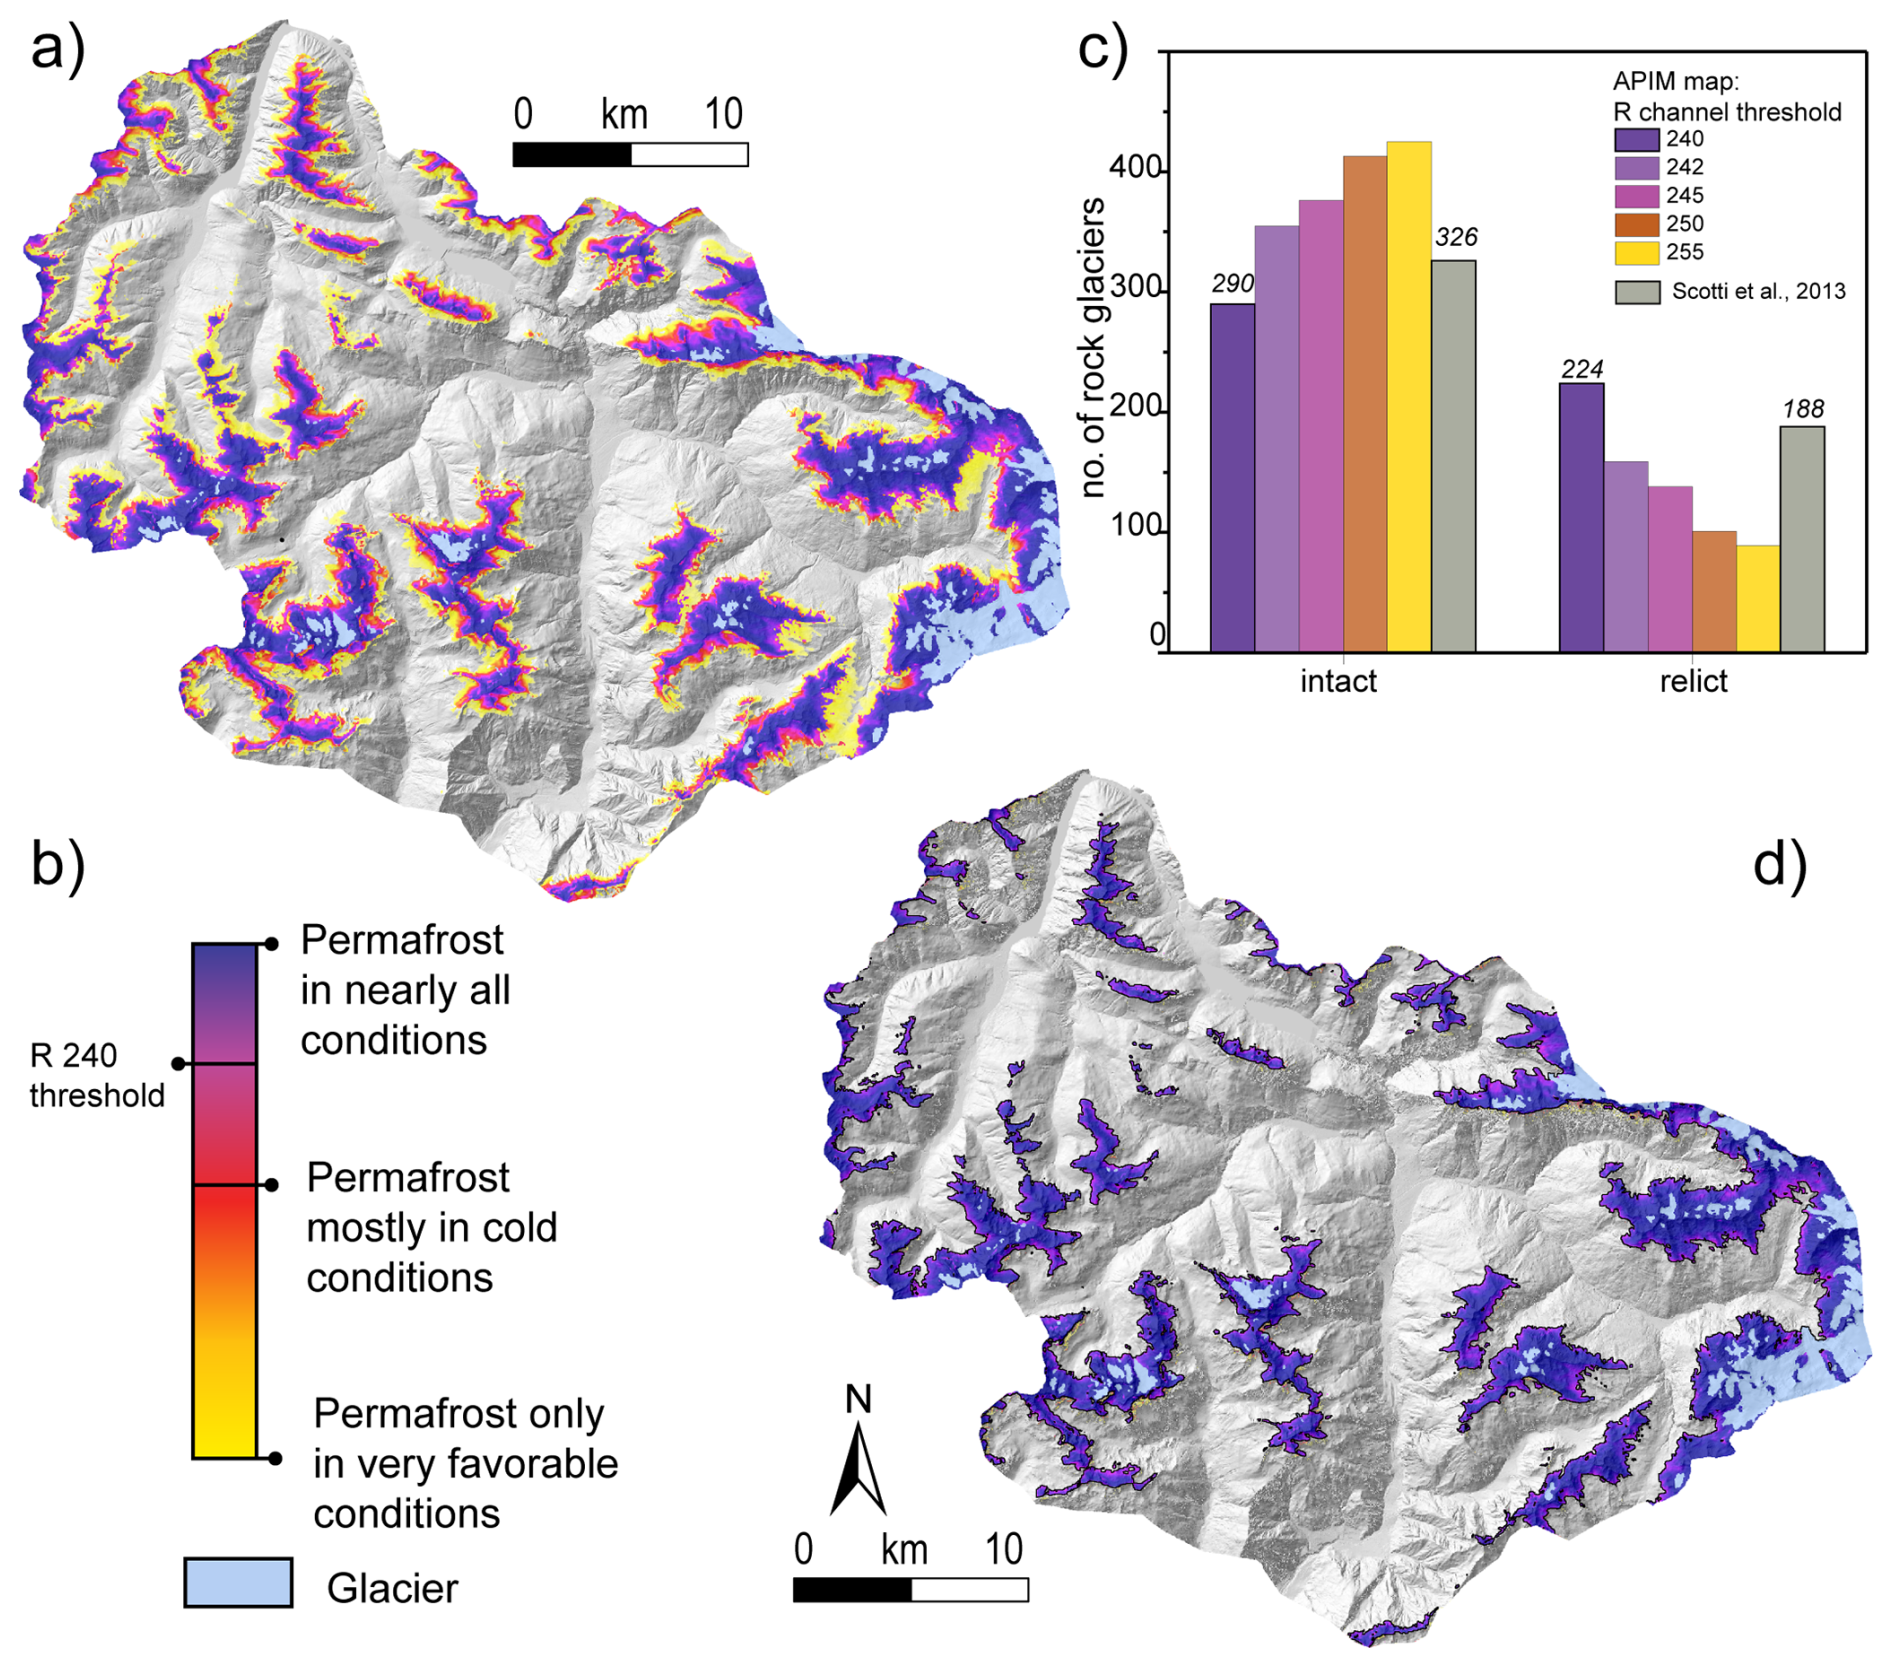
Figure 3Likely extent of permafrost in the study area. (a) Original Alpine Permafrost Index Map (APIM; Boeckli et al., 2012). (b) Likelihood classes of permafrost occurrence based on the APIM RGB colour code. (c) Frequency of periglacial landforms with or without permafrost as a function of different threshold values of the R (red channel) value compared with the intact and relict classes of Scotti et al. (2013). (d) Permafrost extent considering an R threshold of 240.
2.3 Surface deformations: DInSAR
We retrieved 194 Sentinel-1 A and B single-look complex (SLC) radar images (C band; wavelength: 5.56 cm), acquired in TOPS interferometric wide swath (IW) mode between June 2017 and October 2020 in both ascending and descending geometries (Tables S1 and S2 in the Supplement). DInSAR processing was carried out using the ESA SNAP (Sentinel Application Platform) software v.8, using the Shuttle Radar Topography Mission (SRTM) 1Sec HGT DEM for co-registration, topographic phase removal, and terrain correction.
For each mapped feature, we selected the best acquisition geometry depending on the C index by Notti et al. (2014), which is a function of topographic (slope and aspect) and satellite orbit parameters (incidence line-of-sight (LOS) angle Θ and orbital azimuth angle δ). The C index (Fig. S4) provides a measure of the fraction of movement that can be recorded by a SAR sensor, allowing for the selection of the most appropriate SAR acquisition geometry to be used for each periglacial feature.
We processed 100 radar images in ascending geometry and 94 in the descending one, covering the summer–autumn periods (June to October) of the considered years, in agreement with the guidelines of the IPA Action Group (RGIK, 2023a).
Since periglacial features can move at different rates, their deformation signal can be masked by noise or lost by phase aliasing when they move too fast (Lambiel et al., 2023). Therefore, to explore diverse timescales of rock glacier deformation (Cicoira et al., 2021), we first generated interferograms with temporal baselines (Bt) of 6, 12, 18, 24, and 90 d, as well as of 120 and/or 140 d (“seasonal” interferograms) for the year 2017 (see Tables S2 and S3).
This preliminary investigation, in agreement with other published studies (Strozzi et al., 2020; Brencher et al., 2021; RGIK, 2023a), allowed for the selection of temporal baselines of 12, 24, 90, and 120 or 140 d (i.e. interferograms covering the maximum observation window in the snow-free period from June to October). Interferograms covering 12–24 d show high coherence (mean values of >0.4 within the features of interest) and provide signals representing short-term deformation patterns of mapped periglacial features. On the other hand, 120 or 140 d interferograms provide information on the overall seasonal deformations.
Then, we generated 233 interferograms from images in ascending geometry and 274 from descending ones, using different temporal baselines (Bt's). We manually inspected all products and discarded those affected by significant decorrelation, atmospheric phase screening (APS), and snow cover disturbances. After this step, the number of usable products greatly decreased. For subsequent analyses, we exploited 124 interferograms (45 ascending and 79 descending), i.e. 25 % of the full set of interferograms, pointing out the limitations of DInSAR caused by the alpine environment and climatic conditions. To improve the signal-to-noise ratio, all of the interferograms were multi-looked by factors of 4 in the range and 1 in the azimuth direction and were filtered using a Goldstein filter (Goldstein and Werner, 1998).
Despite careful image selection and processing, Sentinel-1 interferograms rarely display clear fringe patterns on the features of interest. Their unwrapping and conversion to displacements (Costantini, 1998) are usually unfeasible or excessively uncertain due to abrupt phase jumps, disconnected coherent patches, etc. Therefore, we did not apply the unwrapping procedure over the area of interest (AOI) but focused on the wrapped-phase information. Without unwrapping, a precise estimate of displacement rates is elusive. However, for a given temporal baseline (Bt) and radar wavelength (λ), velocity ranges can be estimated assuming that displacement between two acquisitions is lower than (to avoid phase ambiguity) or (to avoid both phase and direction ambiguities; Colesanti and Wasowski, 2006; Manconi, 2021).
2.4 Analysis of DInSAR wrapped-phase signals
We prepared a semi-automatic procedure to analyse phase value distributions to infer the state of activity of each mapped periglacial feature. The procedure includes four steps (Fig. 4): (a) identification of stable reference “rims” around each periglacial feature (Fig. 4a); (b) correction of DInSAR wrapped-phase values within each feature with reference to its stable reference area (Fig. 4b); (c) stacking of the corrected wrapped interferograms generated with the same temporal baseline (Bt) and median stacked-phase computation, allowing for the mitigation of atmospheric disturbances (Fig. 4c); and (d) analysis of the distribution of median stacked-phase values inside each rock glacier and stable area and calculation of an activity index (Fig. 4d).
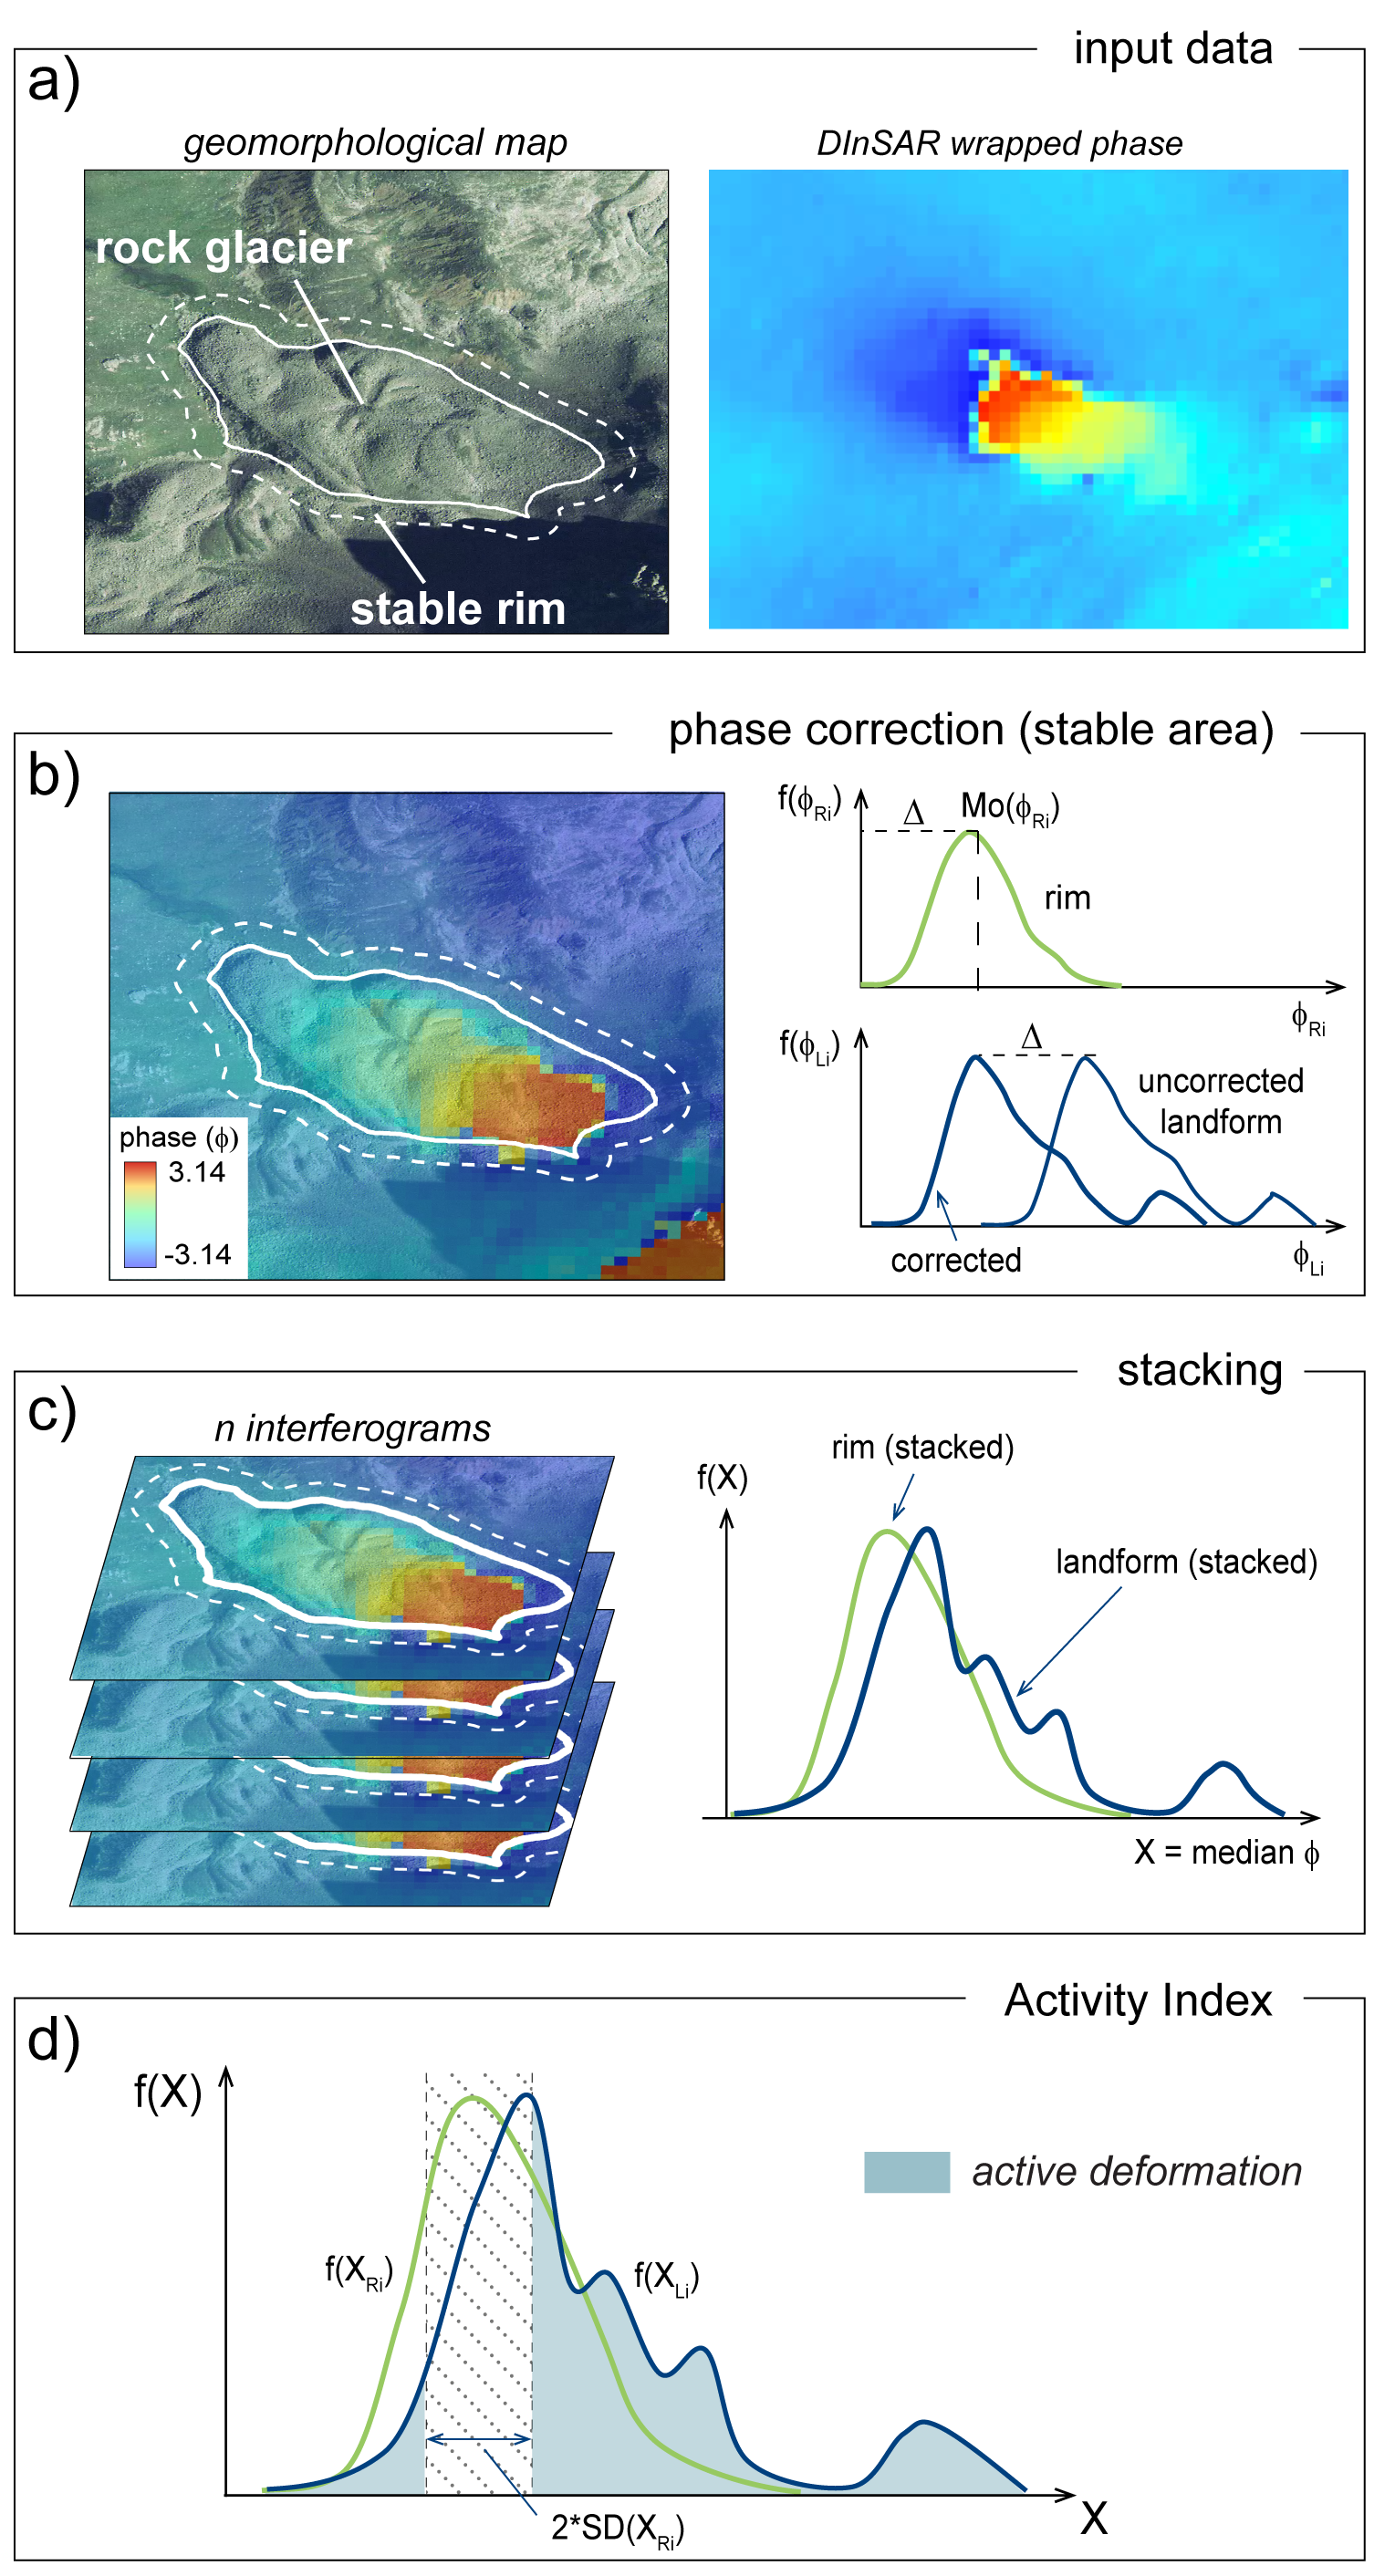
Figure 4Activity index analysis workflow. (a) Polygons of rock glaciers and their stable rims and related DInSAR wrapped-phase signals computed at a given temporal baseline (Bt). (b) Landform phase correction with respect to the modal phase value of the corresponding stable rim. (c) Stacking (median phase values) of all interferograms generated at the same temporal baseline. (d) Calculation of the activity index (see the main text for an explanation). The location of the example rock glacier is outlined in Fig. 2a. Imagery: © Google Earth 2021.
Based on the mapping criteria used by Scotti et al. (2013), we assumed that movements related to periglacial processes are confined within polygon boundaries, while surrounding areas, lacking evidence of permafrost deformation, are considered to be stable. We generated 30 m wide buffers around each mapped landform to identify “stable rims” with no deformation signals. In the case of adjacent forms or multiple rock glaciers merging into one body, the rims were cut to avoid overlapping among different features. The narrow buffer width allowed us to avoid including excessive areas of proximal talus slopes or rock walls, which would introduce noise or artefacts into the phase value. The width of stable rims can be calibrated for site-specific needs.
To allow a consistent comparison among different interferograms, we corrected the DInSAR wrapped-phase values (ΦLi) inside each landform (Li) with respect to their stable rims (Fig. 4a) by subtracting the modal value of wrapped-phase difference within the stable rim, Mo(ΦRi), from each phase value within the landform (Fig. 4b). Brencher et al. (2021) used a similar approach, considering local stable reference points near ridges and bedrock outcrops. However, they performed manual selections, hindering an automated analysis at the regional scale (i.e. for hundreds of periglacial landforms).
After this correction, all interferograms generated with the same temporal baseline (Bt) and acquisition geometry (ascending or descending) were stacked to compute the median wrapped-phase value of each pixel within each periglacial feature, XLi (Fig. 4c). Then, the distributions of the median stacked phase inside the landforms, f(XLi). were compared to the ones inside the corresponding stable rims, f(XRi) (Fig. 4d). We assume that values of f(XLi) falling outside ±1 sample standard deviation of f(XRi) correspond to active deformation, and, for each landform i, we define the activity index (AI) as follows (Eq. 1):
where
-
XLi is the median stacked wrapped phase within the periglacial landform i,
-
XRi is the median stacked wrapped phase within the stable rim surrounding the landform i,
-
f(XLi) is the probability density distribution of XLi, and
-
SD(XRi) is the sample standard deviation of XRi.
2.5 Land surface temperature (LST)
The inner part of intact rock glaciers hosts ground ice, which is insulated by the surficial debris cover. The active layer of rock glaciers plays a key role in regulating heat exchange with permafrost, influencing land surface temperature (LST), which is cooler during warm months in active rock glaciers with respect to transitional or relict ones (Alcott, 2020). Thus, LST derived from remote sensing products is considered to be a useful indicator of the occurrence and state of permafrost (Hachem et al., 2012; Luo et al., 2019; Bartsch et al., 2023; Gök et al., 2024), supporting the validation of the activity assessment of periglacial landforms. With this perspective, we computed the LST of the areas of interest using Landsat 8 images (Table 2).
Table 2Dataset used to compute LST in GEE. A cloud filter was added to exclude images with a cloud cover over 20 %.
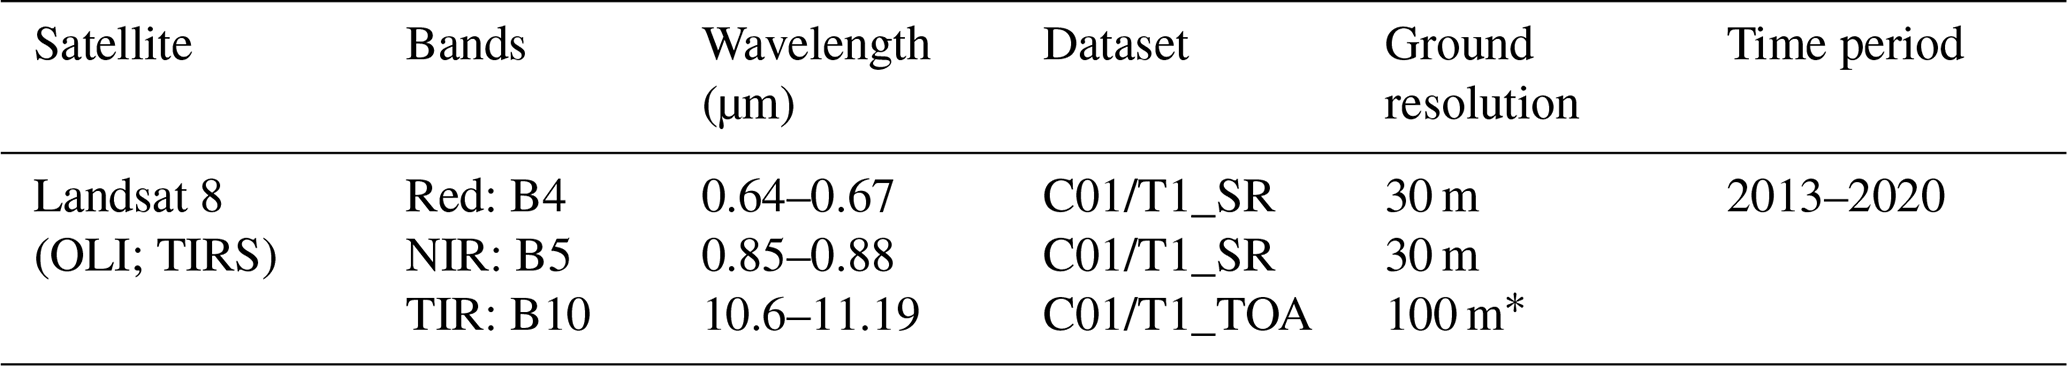
* Gridded to 30 m.
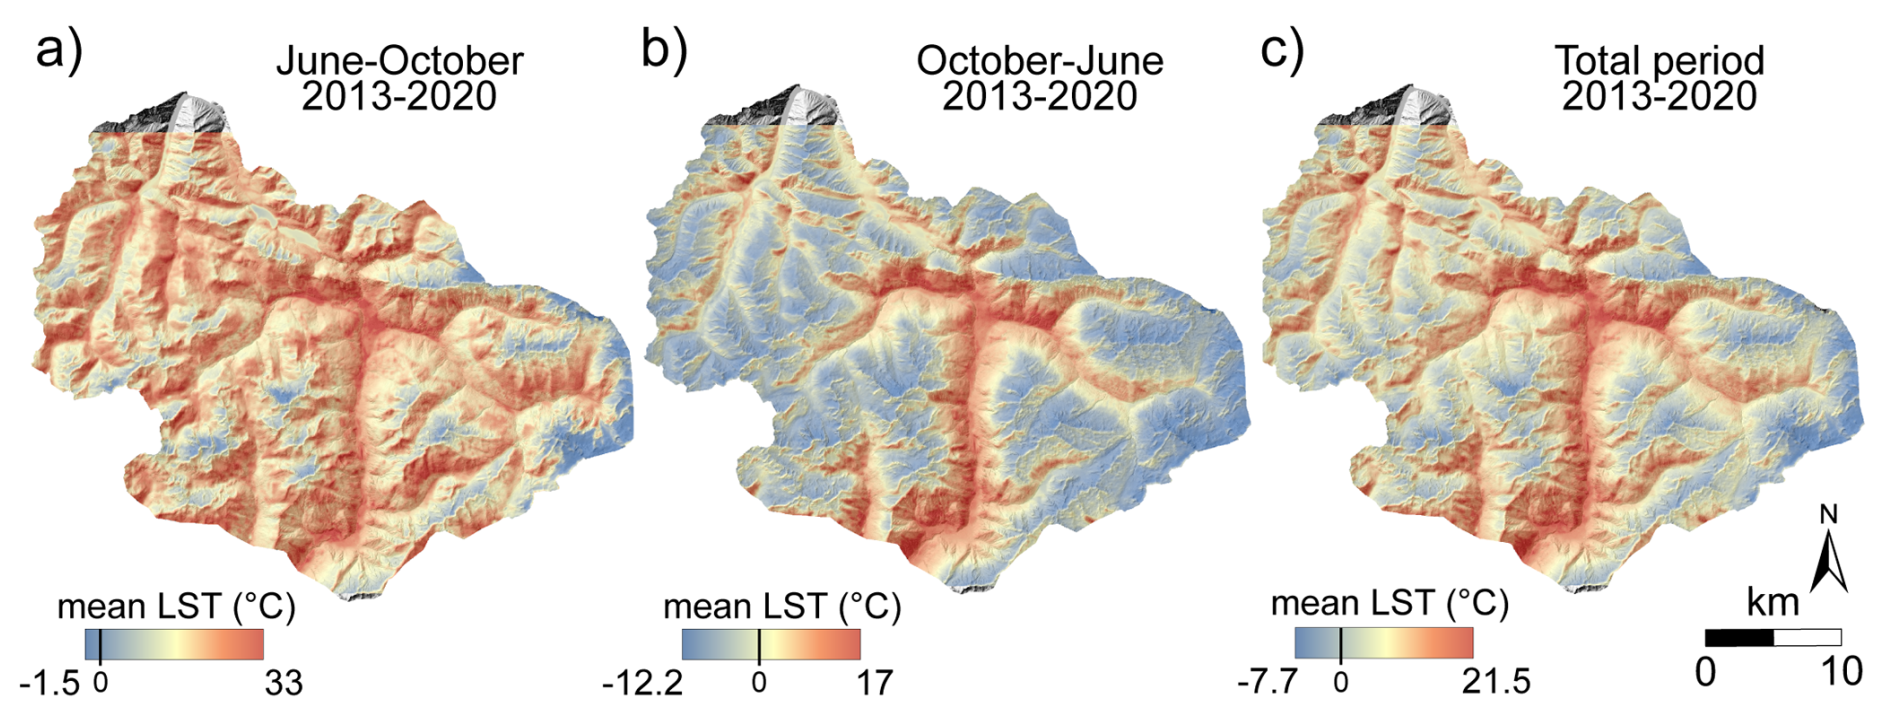
Figure 5LST computed over the period 2013–2020 for the study area. (a) Mean LST for summer months (June–October). Negative values commonly indicate glaciers and snowfields. (b) Mean LST for winter periods (October–June). (c) Overall mean LST (no seasonal distinction).
Analyses were carried out on the Google Earth Engine™ (GEE) platform using the code proposed by Ermida et al. (2020) to process thermal infrared (TIR) band signals provided by Landsat 8 over the period of 2013 to 2020.
Mapped periglacial features are distributed across a wide range of altitudes, and several (especially those classified as relict) are covered by shrubs. As a consequence, we quantified LST using an algorithm that is able to correct land emissivity for the surface vegetation contribution using the NDVI (normalized difference vegetation index; Malakar et al., 2018; Parastatidis et al., 2017; Ermida et al., 2020). We also used a filter to exclude all images with cloud coverage exceeding 20 % of the scene.
We retrieved 53 images from GEE and processed them in MATLAB™ to extract temperature statistics for selected time intervals. We computed a mean LST map for summer (June–October) and winter periods (October–June) (Fig. 5a, b), as well as an overall total mean LST (Fig. 5c) for the 53 images, with no seasonal distinction. However, retrieving meaningful information for winter periods remains challenging because of the extent of snow cover in the study area.
2.6 Principal component analysis
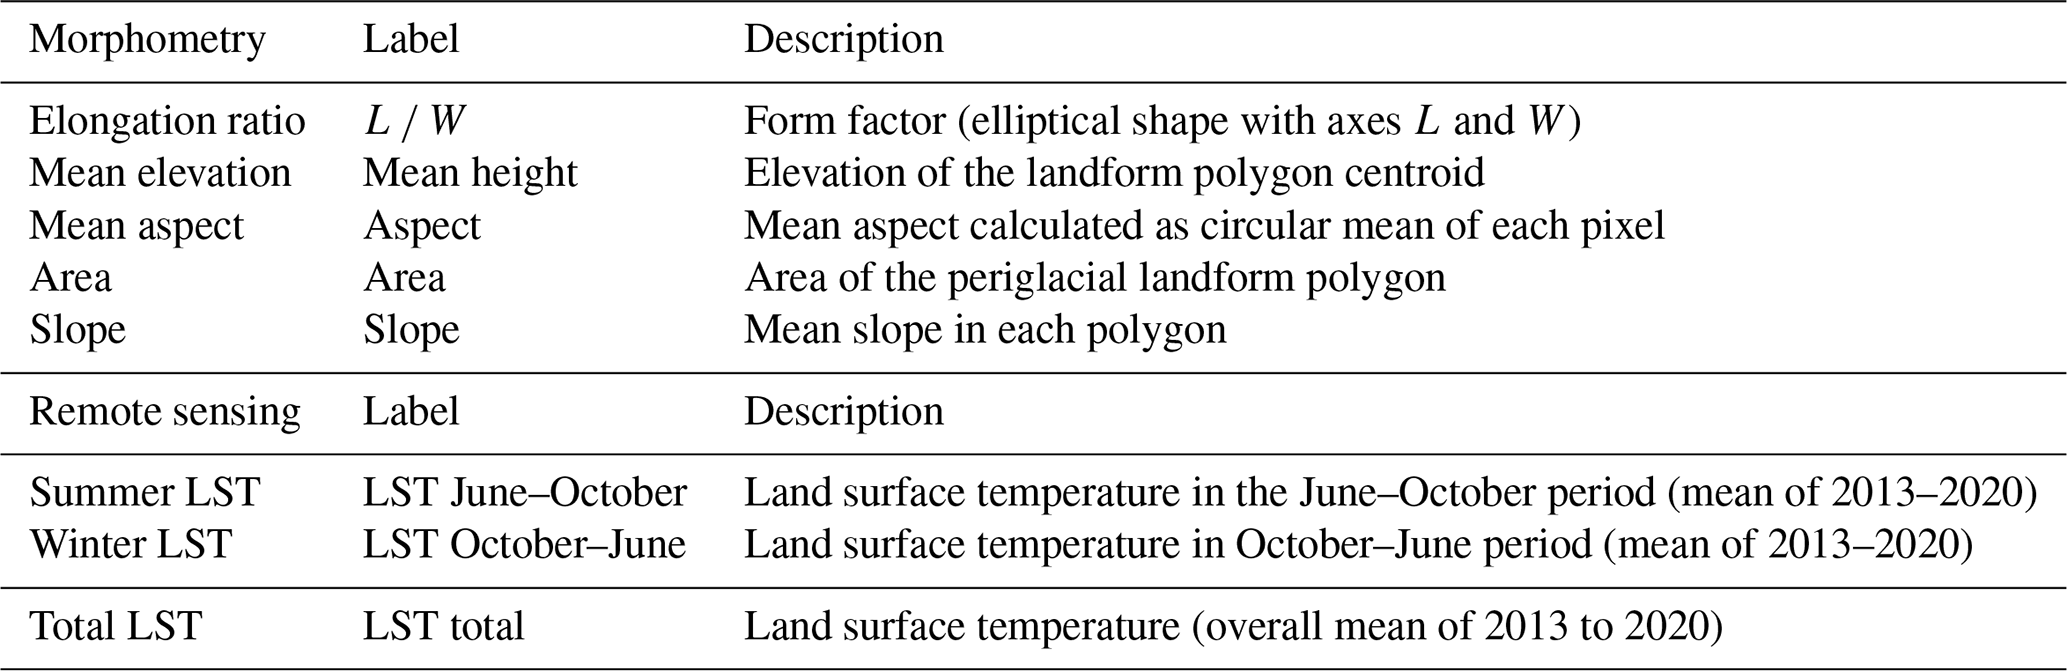
Rock glacier dynamics and activity depend on a combination of morphoclimatic factors related to latitude, elevation, slope, aspect, and the amount of sediment supply from contributing sources. We used principal component analysis (PCA, Hotelling, 1933) to explore the relationships between some variables typically associated with alpine rock glacier activity (Table 3) and the activity of periglacial landforms assessed at different temporal scales through our methodology in order to support its validation. PCA allows us to explore and interpret a set of data by reducing the dimensionality of variables, i.e. by finding new variables that are linearly related to the original ones, maximize their variance, and are uncorrelated with each other (Ballabio, 2015). In our analysis, the number of principal components (PCs) was determined according to their eigenvalue, representing the amount of variance explained by a given principal component. We considered all the PCs with an eigenvalue of >1, a value indicating that the PC accounts for more variance than accounted for by one of the input variables.
Table 3Input parameters of the multivariate statistical analysis.
3.1 Periglacial landform activity
The wide-area application of our methodology allowed us to compute an activity index based on the kinematic information contained in raw interferometric products (i.e. DInSAR wrapped-phase maps), generated for different reference timescales (e.g. temporal baseline, Bt). Our activity index (Eq. 1) is easily represented in maps (Fig. 6a) and provides a non-dimensional description of landform activity, depending on both landform displacement rates and the extent of moving areas.
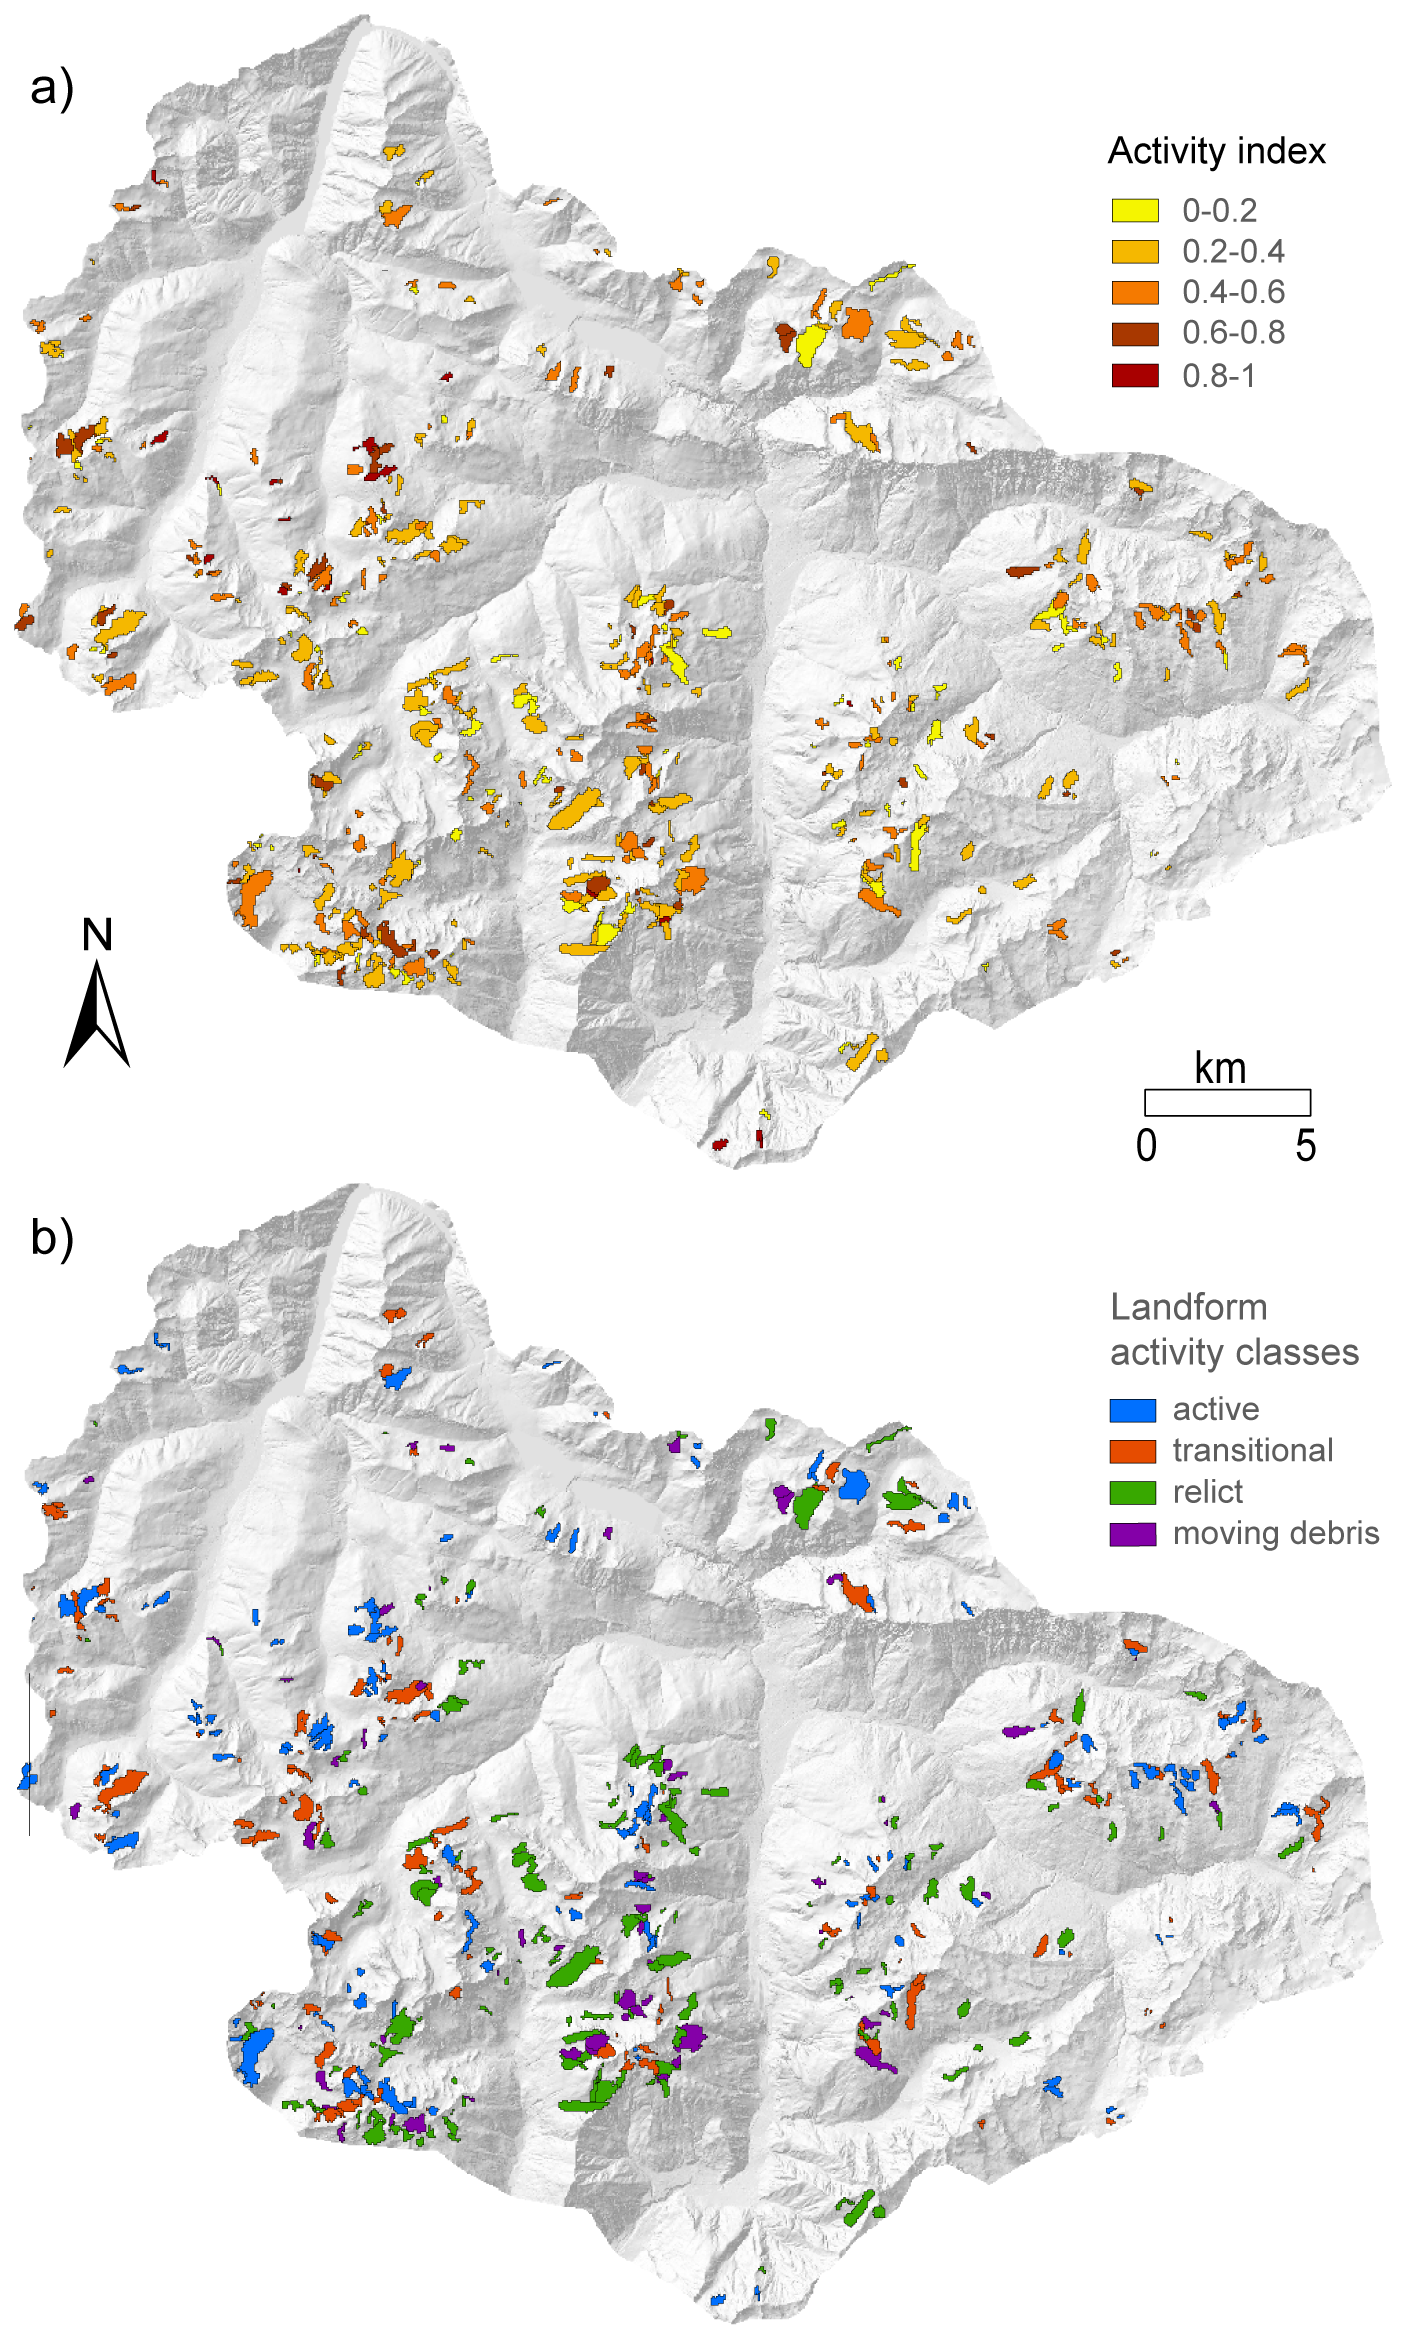
Figure 6Maps of activity index and landform activity classes for a temporal baseline of 24 d. (a) Polygons classified according to the computed values of the activity index (0–1). (b) Reclassified map obtained considering an AI threshold of 0.4 and the presence of permafrost.
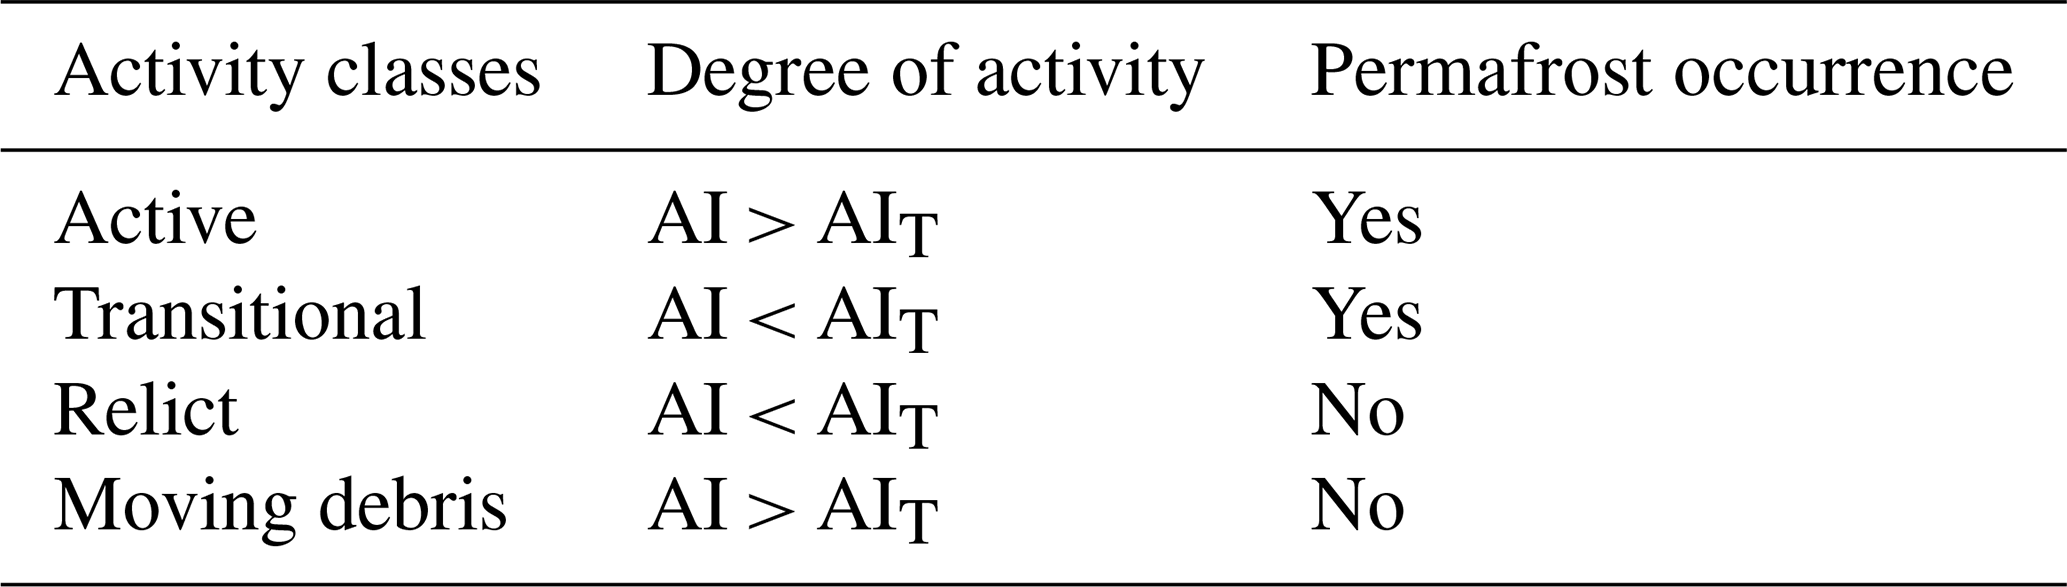
Nevertheless, the activity of individual periglacial features in geomorphological inventories is commonly assessed in a classified form, requiring problem-specific classification criteria and thresholds. Here, we combined two criteria, namely a threshold value (AIT) of the activity index and the occurrence of permafrost, to reclassify the datasets into four landform activity classes (Table 4; Fig. 6b). Three of them (active, transitional, relict) correspond to the activity classes usually adopted in rock glacier inventories (RGIK 2020, 2023a), while the “moving debris” was introduced here to account for landforms that show significant displacements without being associated with permafrost occurrence.
Table 4Activity classes resulting from the DInSAR analysis according to unique combinations of degree of activity and permafrost occurrence. AIT denotes activity index threshold.
The final classification (Fig. 6a, b, Table 4) is sensitive to the selected value of the threshold AIT and to the temporal baseline (Bt) of the reference interferograms. Such sensitivity is displayed in the form of curves (Fig. 7) showing the absolute number of landforms in each class of activity as a function of AIT. The curves related to active and transitional landforms (Fig. 7a, b) are symmetrical due to their intrinsic definition (i.e. presence of permafrost, complementary ranges of AI). The sensitivity of the classification to AIT (i.e. curve steepness) is higher for values lower than 0.6 and depends strongly on Bt (i.e. 90 d, seasonal). This is observed in different classification results for different temporal baselines, in agreement with the different commonly observed timescales of landform activity. The maximum separation between curves obtained with different temporal baselines is observed for AIT values in the range of 0.35–0.5. On the other hand, the curves related to the relict and moving-debris classes (Fig. 7c, d), characterized by the absence of permafrost, are almost completely insensitive to Bt. The final classification shown in Fig. 6b corresponds to a value of AIT of 0.4, which allows for the maximization of the difference between classifications obtained for different temporal baselines and, thus, classes of displacement rate.
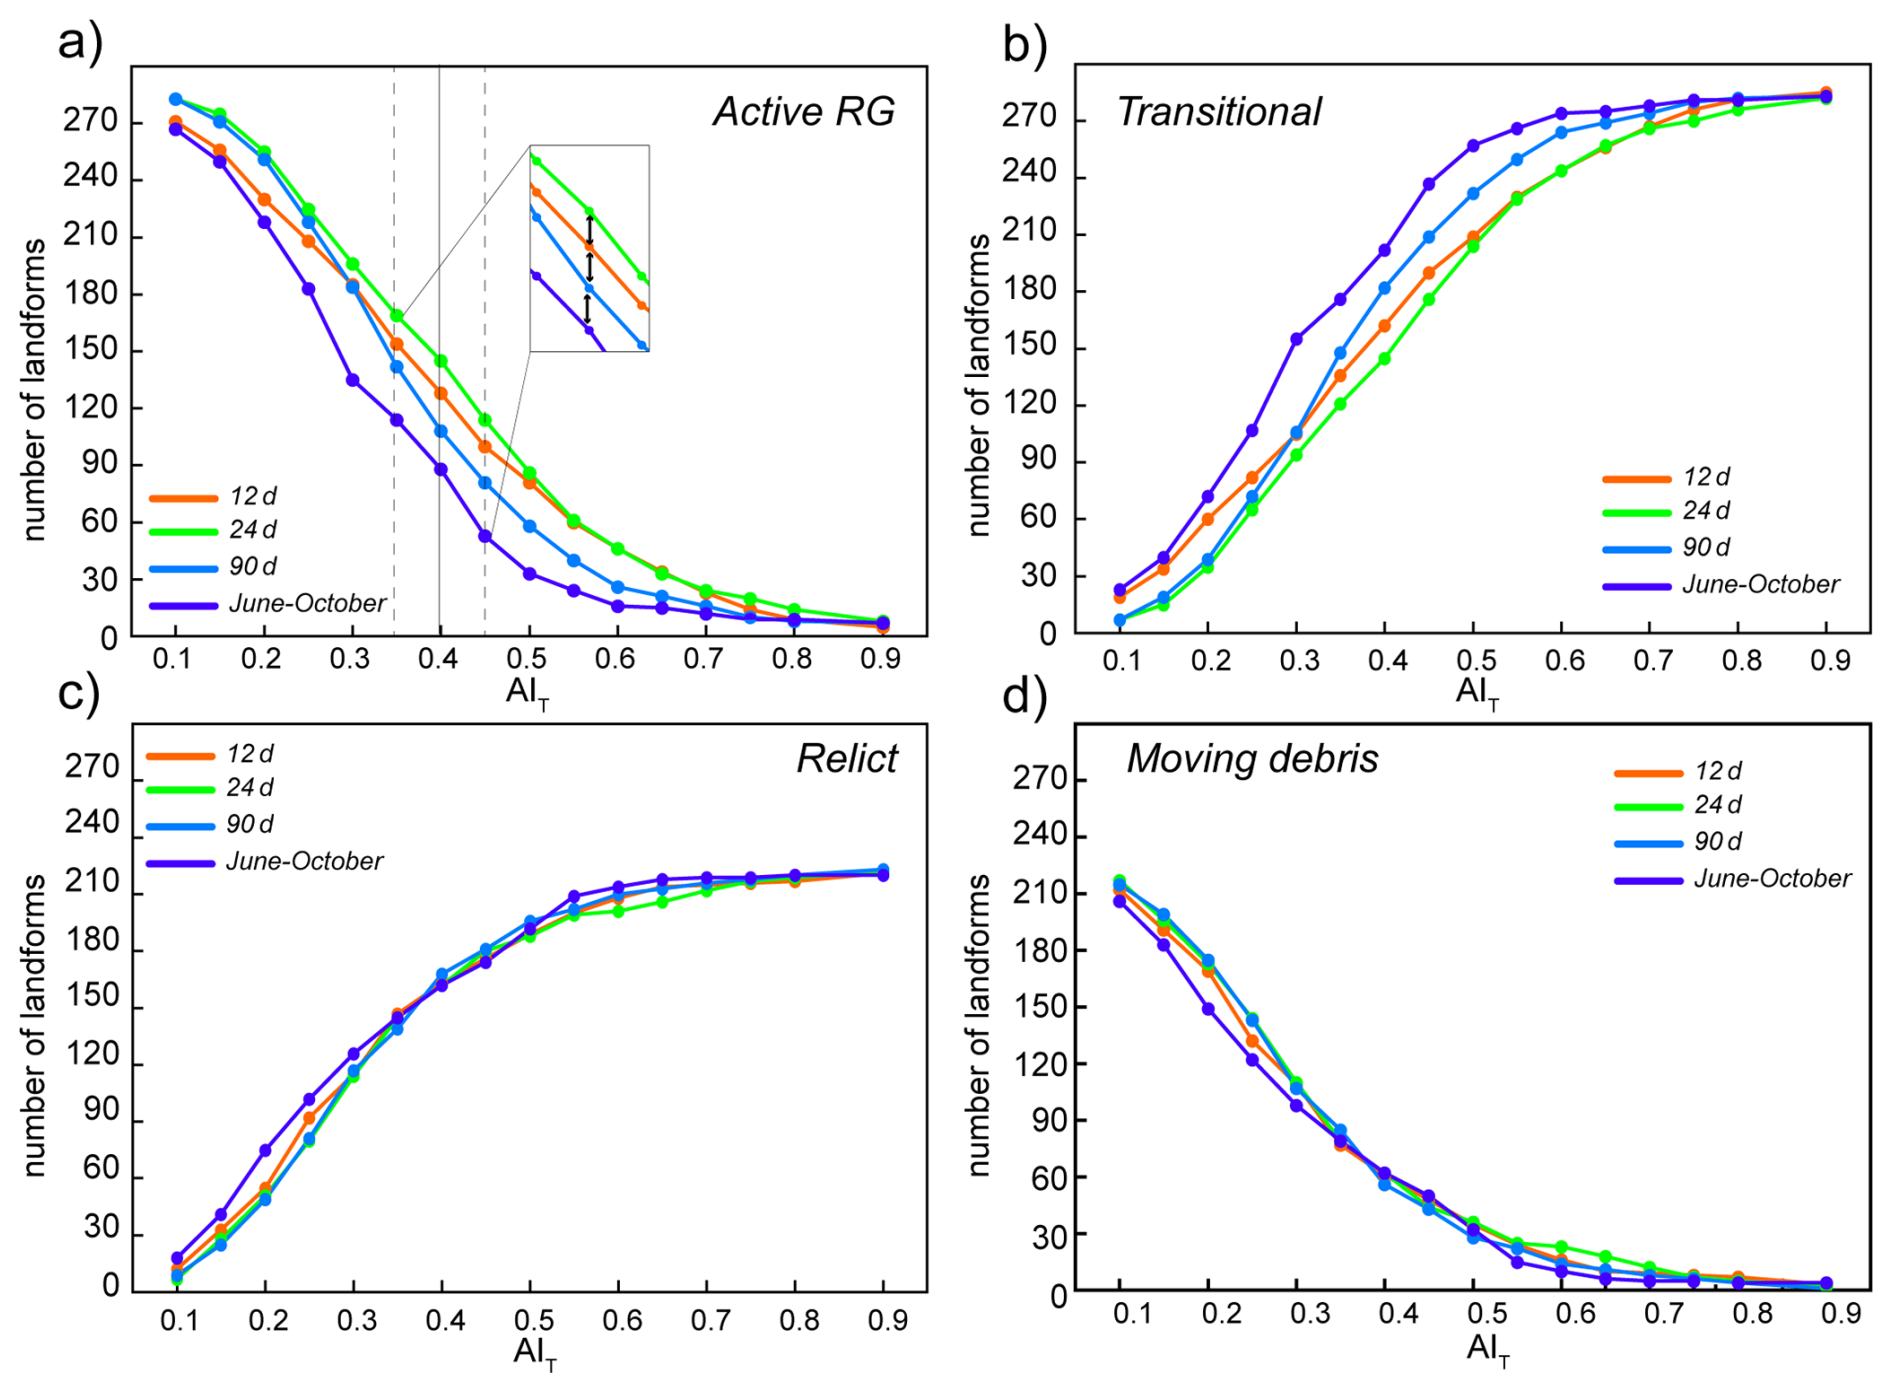
Figure 7Dependence of the abundance of periglacial features in different activity classes on the threshold value of the activity index (AIT) and the temporal baseline (Bt). (a) The numbers of active and (b) transitional features are complementary and strongly dependent on Bt, especially for AIT values in the range of 0.35–0.5. (c) The numbers of relict features and (d) moving-debris features are almost independent of each other and of the temporal baseline (Bt).
The strong sensitivity of the number of landforms classified as intact (i.e. active and transitional) to Bt suggests that their activity is related to underlying deformation mechanisms occurring at different rates and, thus, is better captured over a few days or longer periods, requiring local-scale studies to be clarified.
3.2 Styles of activity and comparison with geomorphological data
The number of periglacial landforms assigned to each activity class by our methodology is reported in Table 5. The population of landforms classified as active and transitional varies depending on the considered temporal baselines. The 24 d temporal baseline corresponds to the maximum relative number of active features, while the number of transitional features increases with longer baselines, more suitable to capturing slow movements.
Table 5Number of rock glaciers belonging to each activity class and relative maximum detectable velocity.
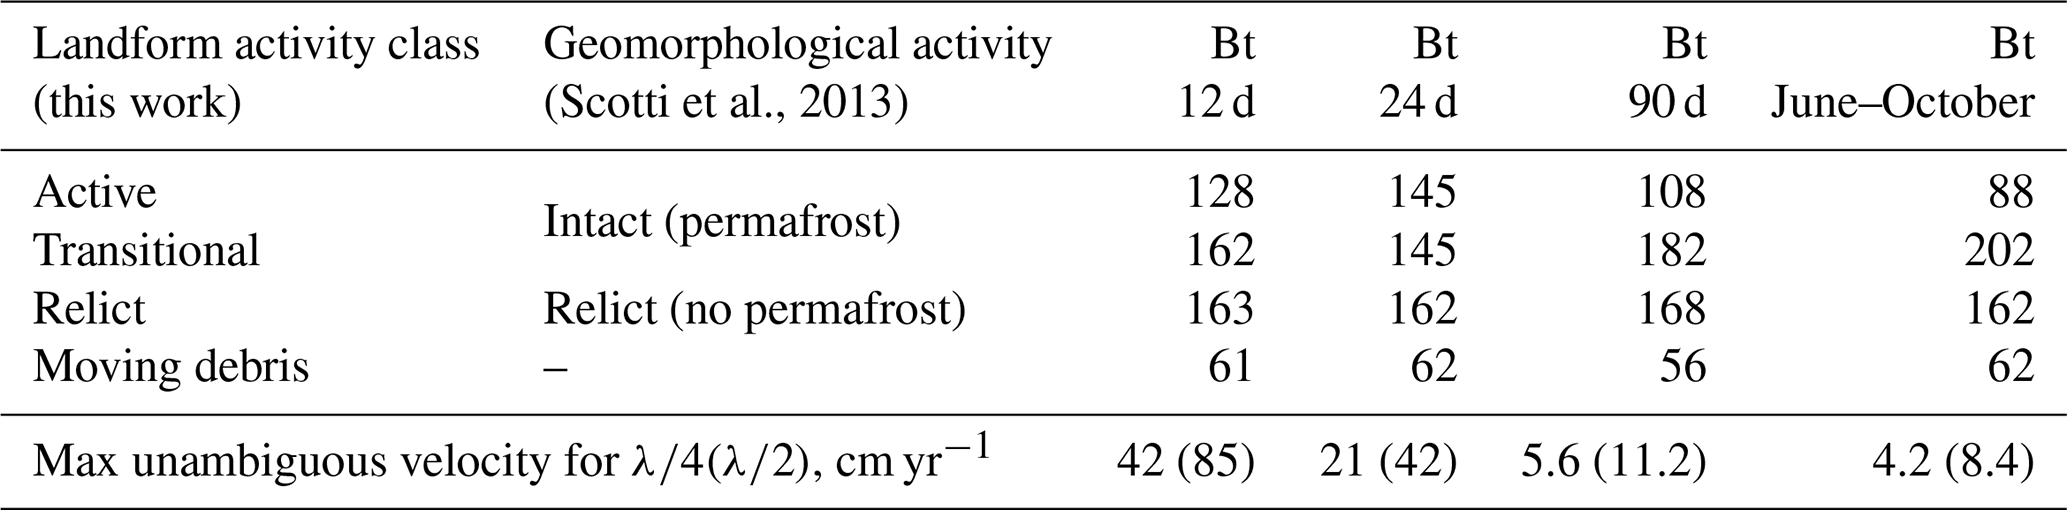
Although our activity classification is not explicitly related to quantified displacement rates, these can be bracketed considering the corresponding temporal baselines, as suggested by several authors (Colesanti and Wasowski, 2006; Manconi, 2021; RGIK, 2023a). Velocities reported in Table 5 correspond to the maximum unambiguous velocities that can be inferred for each Bt considering C-band SAR measurements with respect to ambiguity thresholds of and .
Deeper insights into the styles of activity of active landforms come from the examination of the number of temporal baselines at which features are classified as active (Fig. 8). Landforms active at one specific Bt can be inferred to move at an average velocity falling within narrow ranges, with maximum values captured by DInSAR depending on the considered Bt (Table 5). Periglacial features active at 12 or 24 d are characterized by typically observed displacement rates of dm yr−1 (Haeberli et al., 2006), whose DInSAR signal is lost over longer temporal baselines due to decorrelation effects. Features active only at long temporal baselines may testify to slow or seasonal movements.
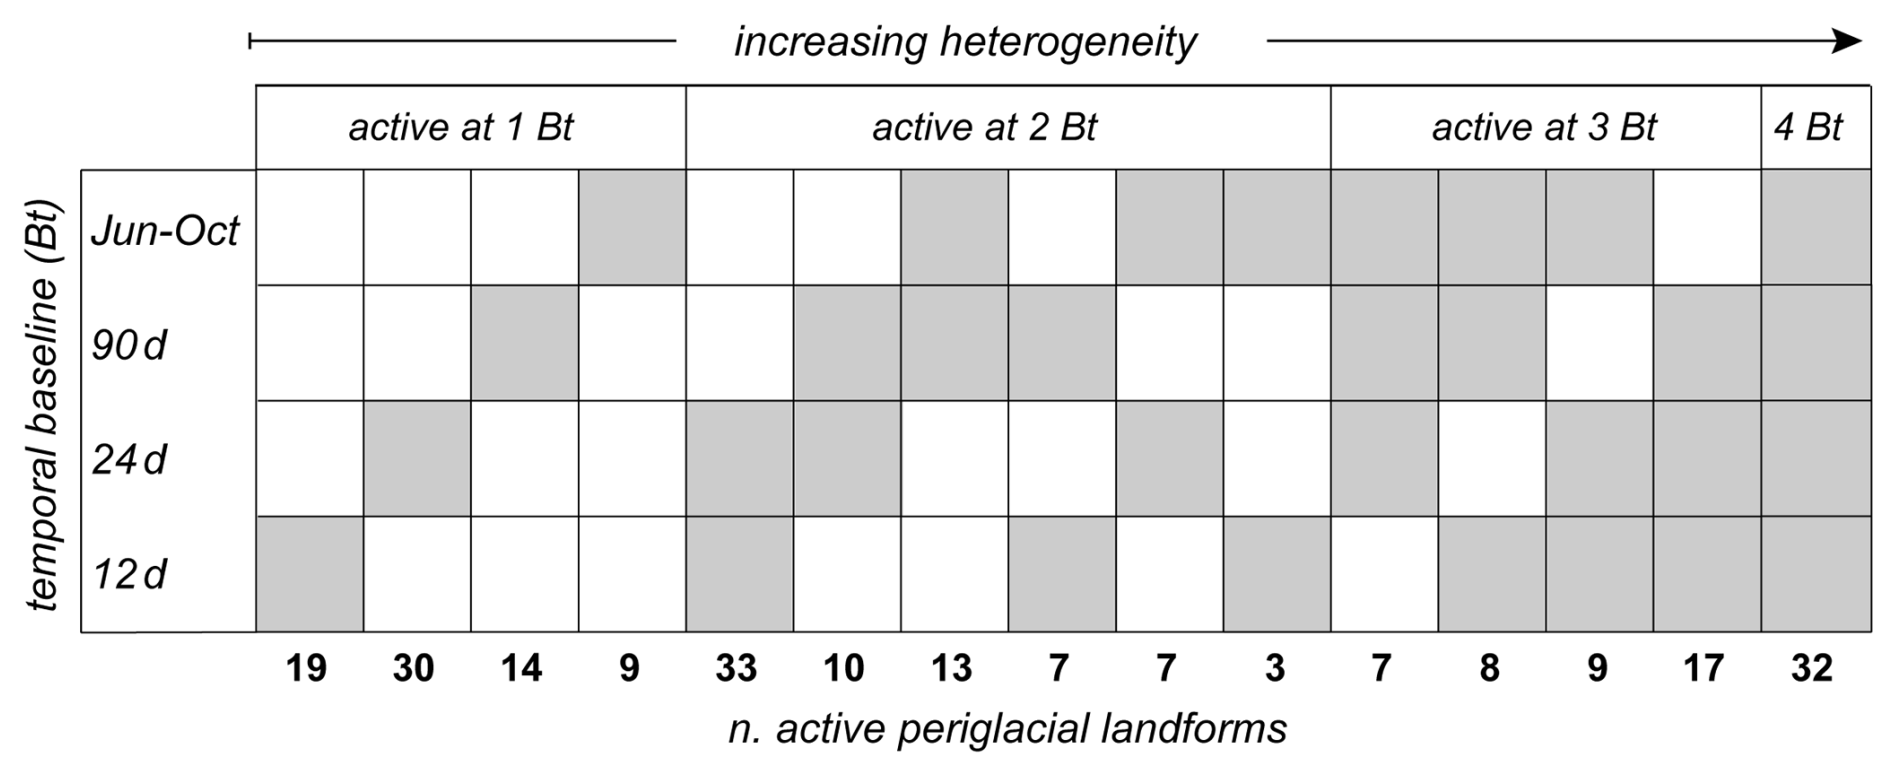
Figure 8Periglacial landforms active on different temporal baselines (classification with AIT: 0.4; see the main text for an explanation). From left to right, landforms are active on an increasing number of temporal baselines, indicated by grey boxes, suggesting increasing spatial and/or temporal complexity.
At the same time, activity detected over an increasing number of different temporal baselines (e.g. 12 d and June–October; Fig. 8) points to landforms undergoing seasonally variable displacement rates or possible complex movements of different rock glacier units (RGIK, 2023a), not explicitly considered here. According to this interpretation, landforms active over three or all if the considered temporal baselines are characterized by the maximum spatial–temporal heterogeneity. Although a precise assessment of the nature of this heterogeneity cannot be achieved by our regional analysis, our results provide useful hints for the selection of individual cases that deserve targeted, site-specific investigations.
The number of features classified as moving debris is almost constant over different temporal baselines (Table 5), supporting the hypothesis of an activity not directly related to permafrost (likely not present in this class; Table 4) but associated with slope instability with variable displacement rates controlled by local conditions.
We compared our classification results at Bt = 24 d (i.e. the temporal baseline that maximizes the active class) with the geomorphological activity classification of Scotti et al. (2013; Table 1). The latter only includes two classes of landforms, namely intact and relict, according to the inferred permafrost occurrence. For the sake of comparison, we once again grouped our active and transitional classes under the term intact (Table 5). The comparison outlines that the two classifications are consistent for 458 cases out of 514. A total of 89 % of the features classified as intact by Scotti et al. (2013) have been confirmed by our classification, while the remaining are now classified as moving debris based on the lack of permafrost from the API map. On the other hand, 11 % of features previously classified by Scotti et al. (2013) as relict have now been recognized as moving debris with the contribution of InSAR and permafrost information.
Landforms classified as active by both approaches usually display sharp morphological evidence with well-developed longitudinal and transversal ridges and furrows, steep frontal slopes, lack of vegetation, and fresh debris cover (Fig. 9a). The activity is reflected in clear DInSAR signals which, depending on the analysed Bt, can be characterized by smooth changes with (partly) fringed patterns (Fig. 9b) or decorrelated signals with a noisy pattern (Bertone et al., 2022). In contrast, relict rock glaciers do not display any swollen convex appearance or active morpho-structures but are less steep and frequently vegetated with shrubs and longitudinal scree accumulation, testifying to the presence of relict furrows (Fig. 9c). For these cases, the DInSAR signal is homogenous and similar to the surrounding slope (no movement; Fig. 9d).
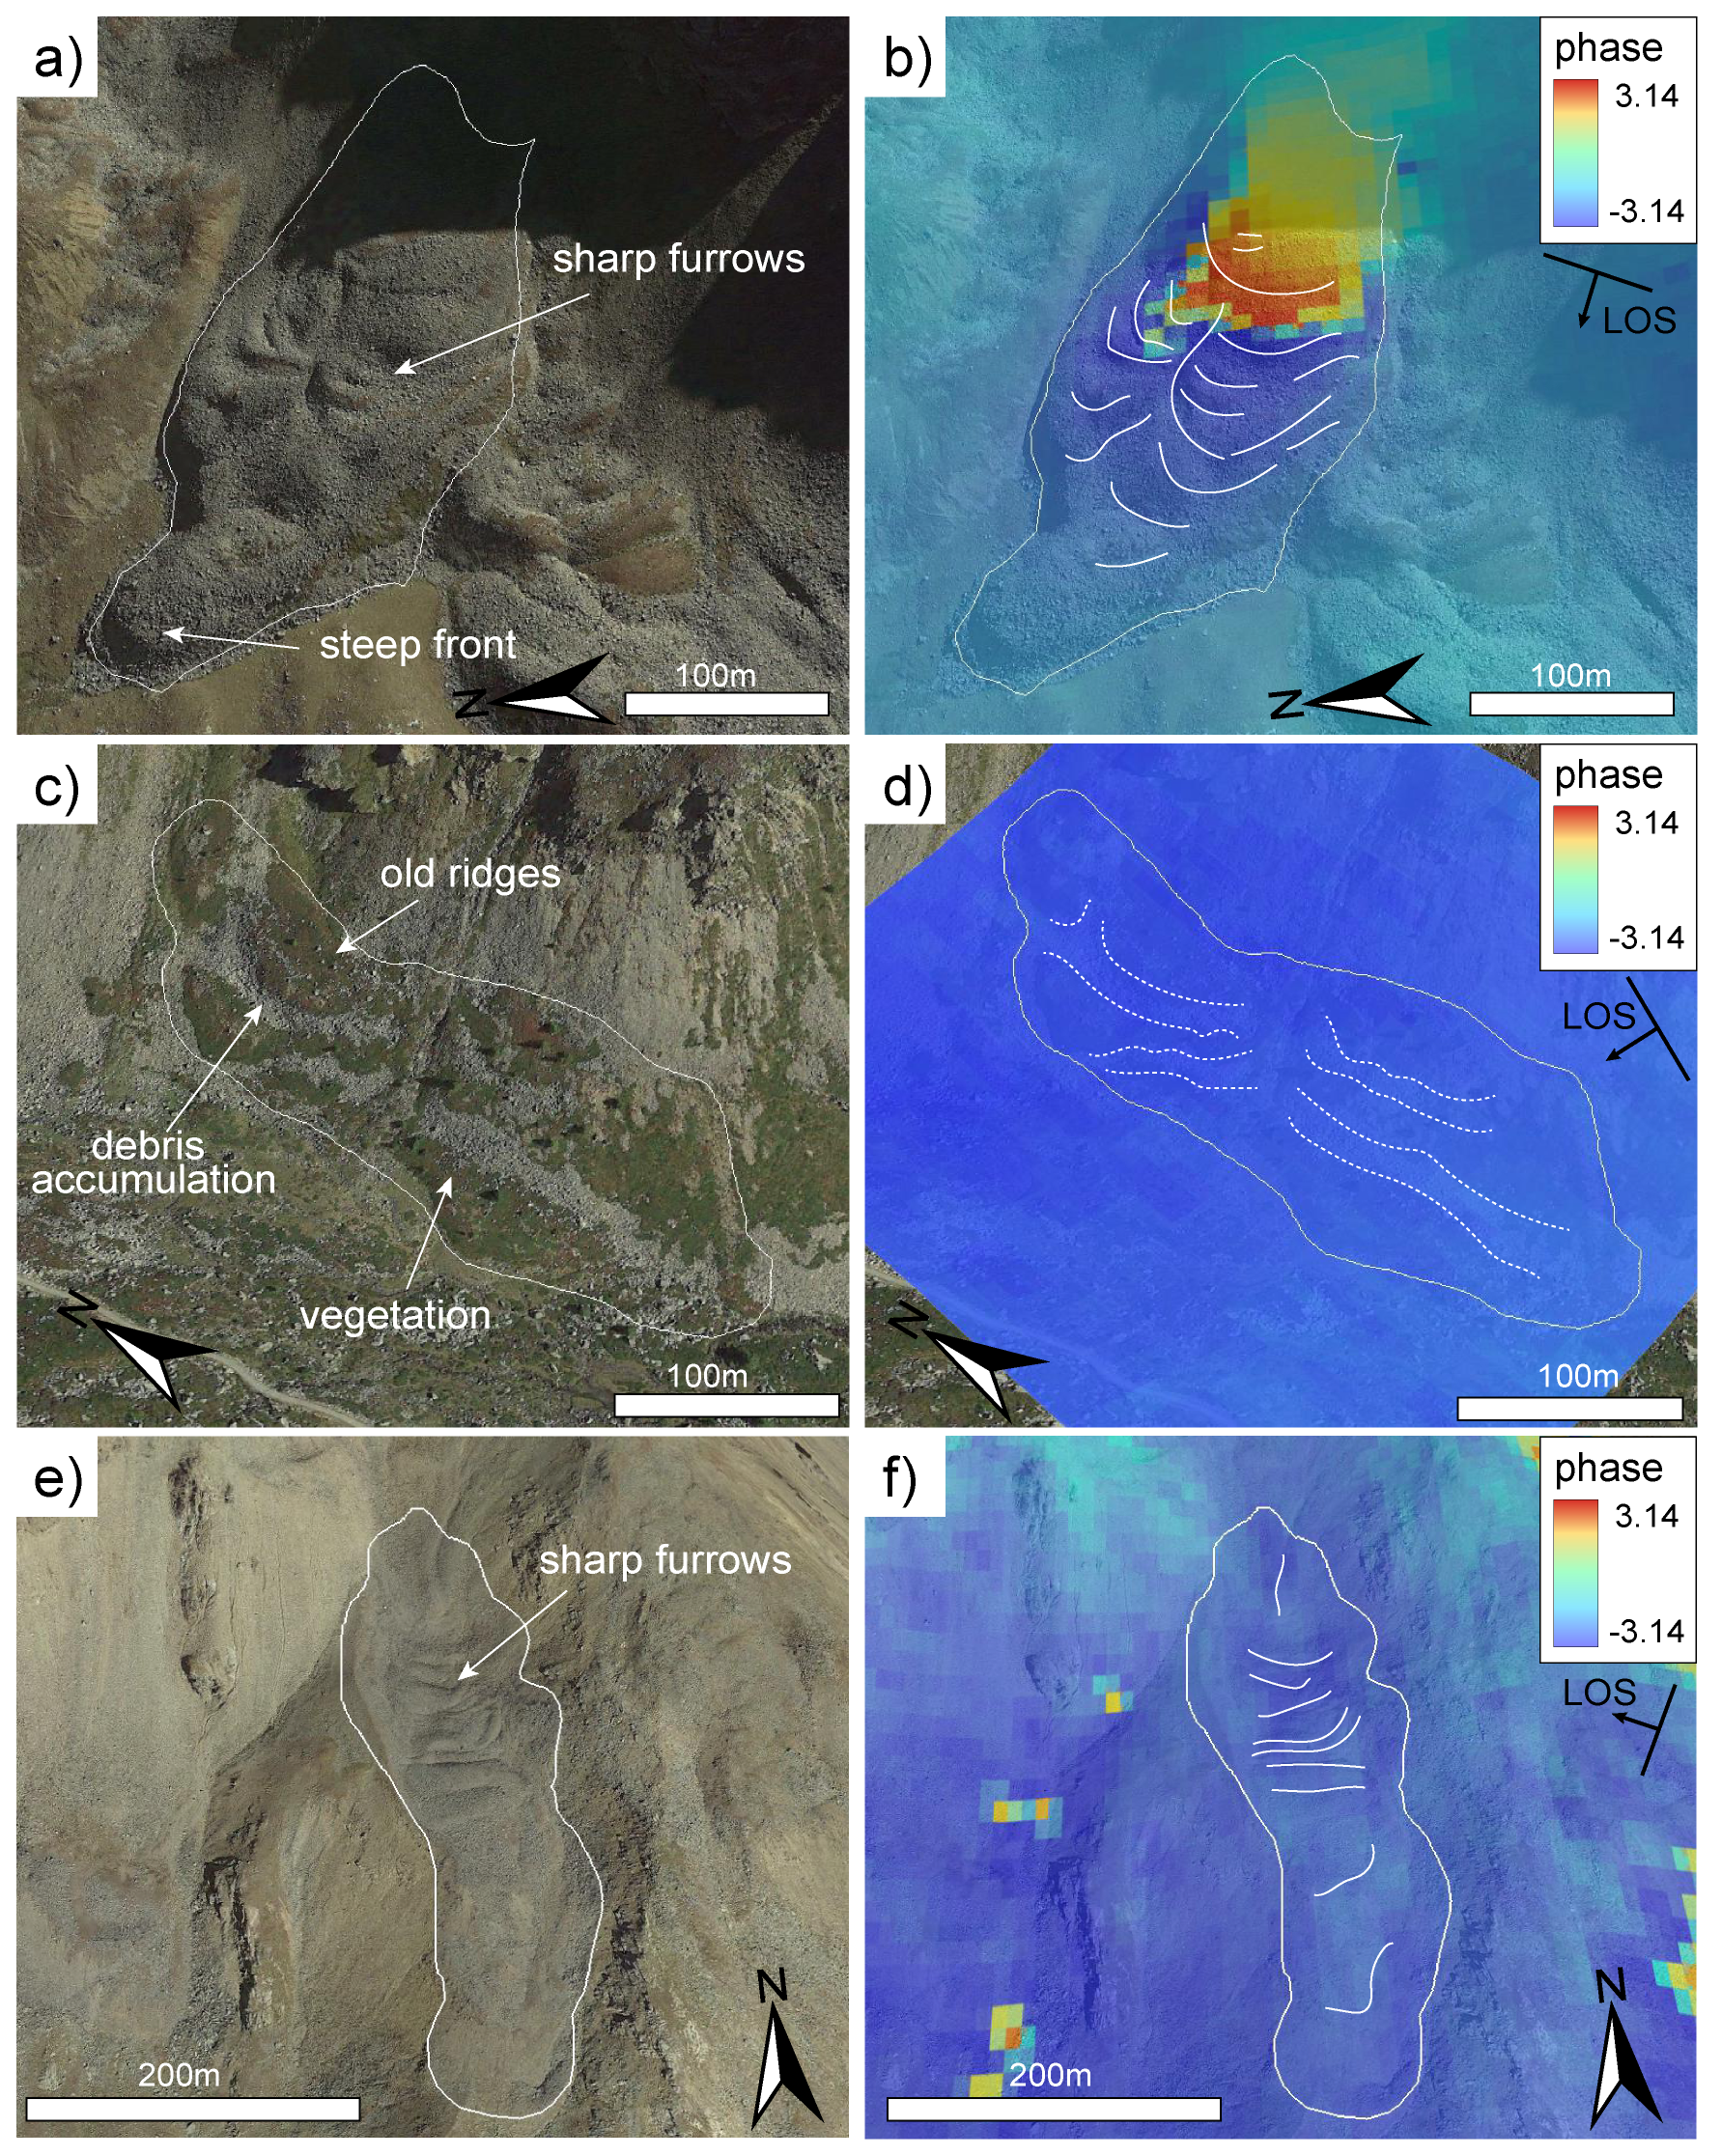
Figure 9Comparison between geomorphological and DInSAR-based activity assessment. (a) Active rock glacier (Bt = 24 d, AI = 0.87), with sharp furrows, ridges, and steep fronts, associated with clear fringe patterns, testifying to the activity of the upper part of the rock glacier (b). (c) Relict rock glacier (Bt = 120 d, AI = 0.19) characterized by abandoned, subdued, and vegetated morphological evidence, mirrored in (d) by the absence of a DInSAR signal. (e) Active rock glacier with sharp furrows and lobes, to which the SAR sensor is blind (C index = 0.2), resulting in (f) a strong underestimation of the activity of its movement (Bt = 24 d, AI = 0.23). Portrayed DInSAR signals are from individual interferograms (not stacked) without APS corrections. Imagery: © Google Earth 2021.
However, the transition from intact to relict based on DInSAR activity information can be related to an unfavourable slope orientation to the satellite, with possible activity of N- or S-directed movements not captured by DInSAR, despite the clear geomorphological evidence of permafrost presence (Fig. 9e, f).
3.3 Distribution and controls of periglacial landform activity
Our results highlight the possibility of discriminating between periglacial landforms active at different rates, over different temporal baselines, and with different complexity. In addition, we analysed their distribution with respect to morphometric and land surface temperature (LST) variables to explore possible relations with the environmental factors that control their dynamics and further validate our classification methodology.
Periglacial landforms falling in different activity classes exhibit different distributions with respect to topographic aspect and slope (example for Bt = 24 d in Fig. 10). Active landforms cluster along N-facing slopes, the most favourable to permafrost occurrence, although they are found also in E- and W-facing slopes when other factors (e.g. elevation, local relief, and debris supply) are suitable. Transitional landforms, still hosting permafrost but not showing significant movements, also tend to be N-facing but show a more scattered occurrence in an aspect range between N240 and N120. On the other hand, relict features are spread over broader aspect ranges (N70–N270) on S-facing slopes abandoned by permafrost. Finally, the distribution of moving-debris landforms does not show a clear correlation with aspect, and it is observed over a broad range of slope inclination. This supports the interpretation that this class of active movements is not related to permafrost conditions but rather to other slope instability factors.
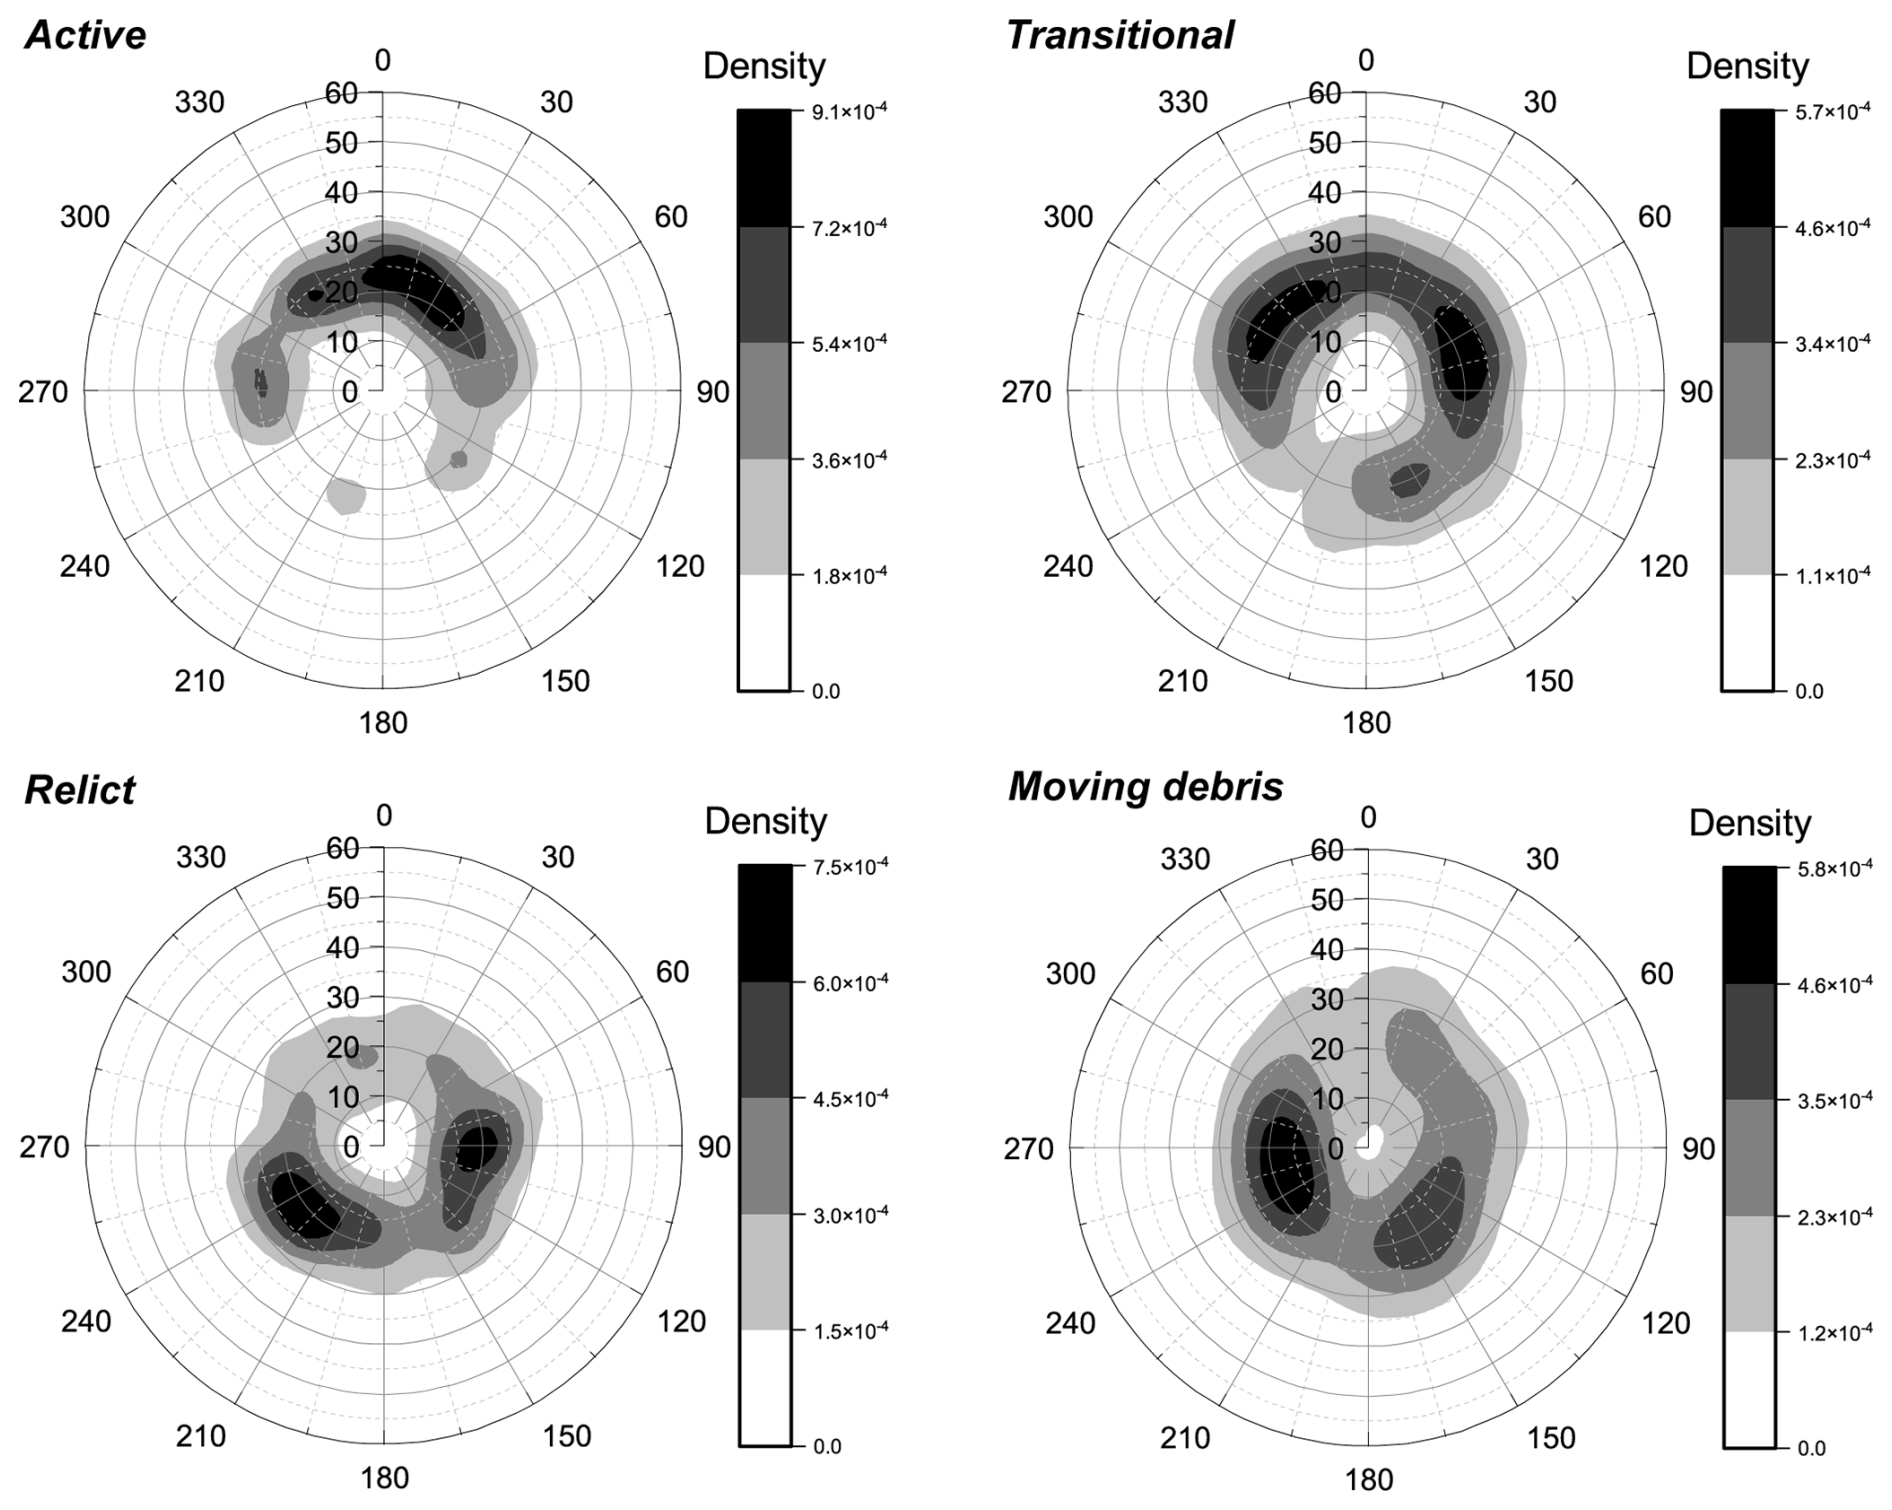
Figure 10Stereographic (polar) diagrams showing the distribution of the average topographic aspect (i.e. azimuth) and slope (i.e. dip) computed for each mapped periglacial feature, falling in different activity classes according to our methodology (Bt = 24 d). The relative abundance of periglacial features is expressed in terms of point density.
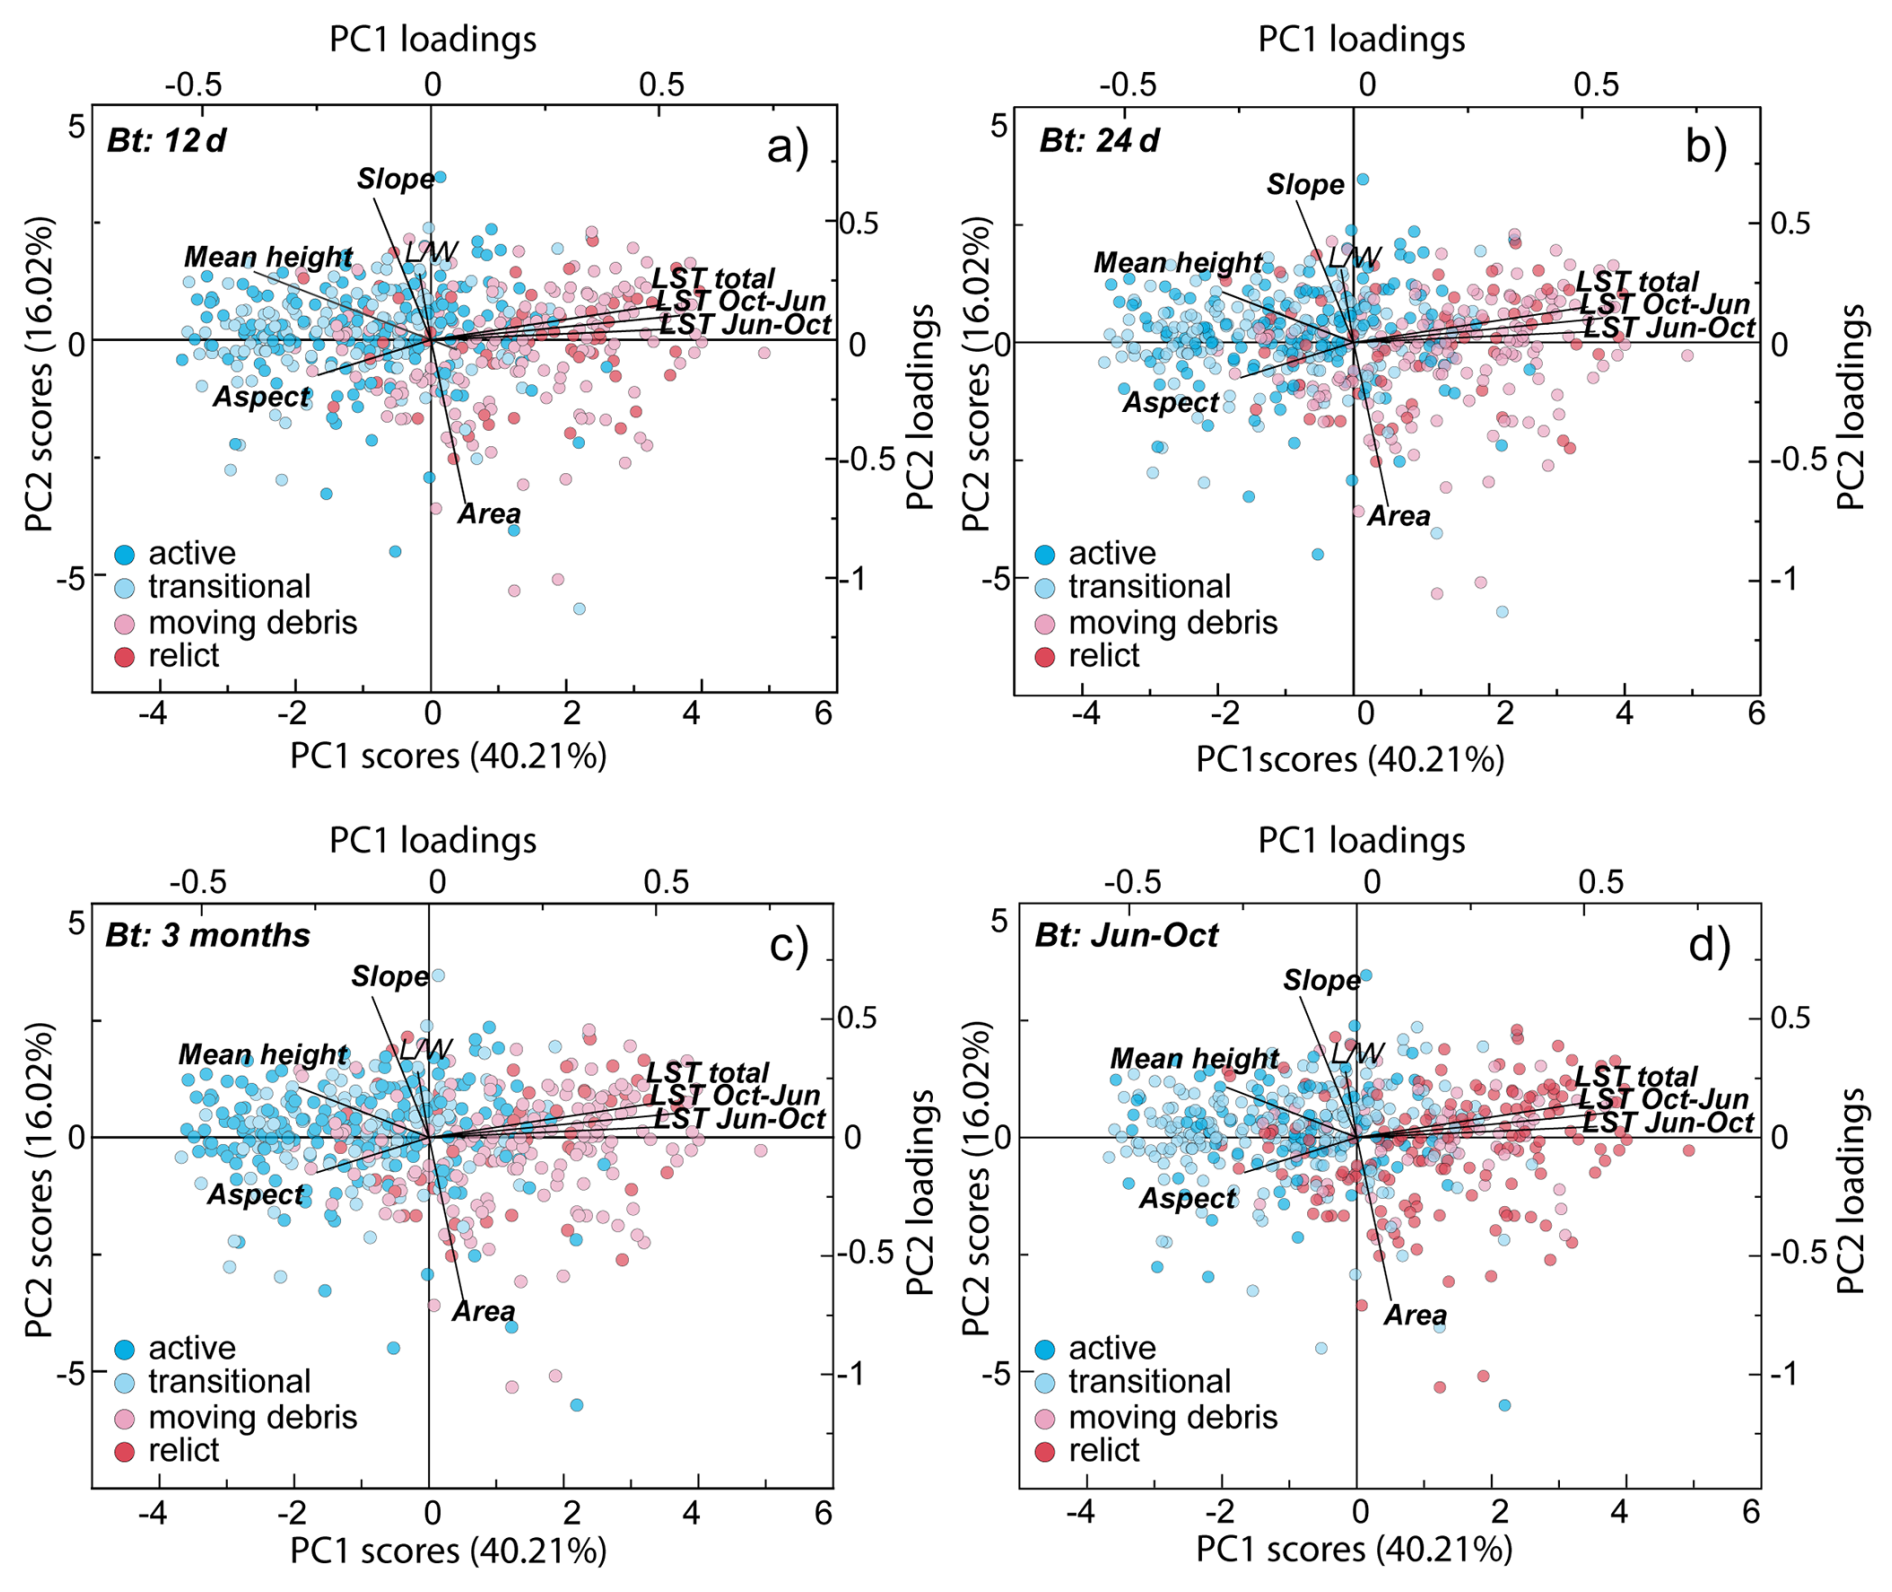
Figure 11PCA biplots. The graphs portray the distribution of rock glacier activity classes with respect to the considered morphometric and LST values at (a) 12 d Bt, (b) 24 d Bt, (c) 3-month Bt, and (d) seasonal Bt. The biplots show an association between activity and LST, with active features clearly trending towards lower temperatures.
Principal component analysis (Fig. 11) allowed for further exploration of possible relationships between landform activity as classified by our methodology and other variables typically associated with alpine rock glacier activity, namely surface area, mean elevation (i.e. the elevation of the landform polygon centroid), and the length-to-width ratio () which describes the elongation of each feature. We also considered the mean land surface temperature (LST) computed for each polygon from Landsat 8 images for the summer months (June–October), in the winter periods (October–June), and over the total analysed period (2013–2020).
We selected the first two principal components (PCs), accounting for 57 % of the entire multivariate space, and represented the cases according to their activity class attribution in the four considered temporal baselines (Fig. 11).
The first principal component (PC1), accounting for about 40 % of the variance, is mainly associated with the LST, with increasing temperature corresponding to less active landforms and a temperature difference of about 5 °C compared to relict landforms, as seen on the right-hand side of the biplots in Fig. 11. This supports the role of permafrost in the activity of the features classified as active rock glaciers and protalus ramparts, while moving-debris features show a more scattered distribution, again supporting the fact that the activity of these features is not dependent on permafrost. Activity trends are also associated with mean elevation and aspect, with active and transitional landforms being associated with higher elevations, and seem to be less dependent on slope and landform, aligning the second principal component (PC2), accounting for only 16 % of the variance. The described patterns were consistent across the different temporal baselines considered in the study.
These results help in outlining the typical conditions associated with each landform class, in agreement with previous findings (Alcott, 2020; Harris and Pedersen, 1998; Vonder Mühll et al., 2003), and support the robustness of our classification and its ability to recognize active features possibly not driven by permafrost-related processes.
Over the last 2 decades, there has been growing interest in studying the activity of periglacial landforms (especially rock glaciers) as important proxies of the state of mountain permafrost, with important implications for climate change, water availability, and geohazards in alpine environments (Deline et al., 2015; Marcer et al., 2021; Amschwand et al., 2025).
These studies rely on the regional-scale assessment of the activity of large rock glacier populations over wide areas based on remotely sensed data, especially InSAR products. Despite the important recent improvements in the state of art (Rouyet et al., 2021; Bertone et al., 2022; RGIK, 2023a), the regional-scale screening of periglacial landform activity remains a challenging and time-consuming task, still hooked to the manual analysis of DInSAR interferograms or displacement time series.
In this study, we proposed and tested, using a dataset of 514 periglacial features (Scotti et al., 2013), a novel semi-automated and replicable methodology that is able to classify periglacial features into four classes of activity. Our methodology is based on the integration of two key factors: an estimation of landform activity based on the distribution of DInSAR wrapped-phase difference across multiple temporal baselines and the likelihood of permafrost occurrence as portrayed by the APIM model (Boeckli et al., 2012). These factors are combined into a scalar activity index, which is eventually classified using a threshold value that maximizes the differences between temporal baselines.
Our methodology is conceived to exploit the potential of InSAR data, routinely generated over large areas, to provide a screening assessment of periglacial landform activity, support a quick periodic update to some activity attributes of rock glacier inventories, and identify candidate cases for site-specific studies.
Due to the regional scale of the study and the harsh environmental conditions of alpine settings (i.e. steep mountainous terrains, atmospheric artefacts, snow cover effects), we focused on assessing landform activity without resorting to unwrapping (RGIK, 2023a). In fact, identifying a stable area close enough to each periglacial feature, which can grant a reliable reference point for unwrapping algorithms, is usually very difficult in regional-scale analyses. Since unwrapped displacements are always relative to a stable point, the selection of a unique point for the entire study area would cause the propagation of unacceptable uncertainty, amplified by topographic conditions, moving away from this point. Furthermore, alpine mass movements like rock glaciers usually display noisy DInSAR signals with poorly expressed interferometric fringes, for example, due to displacement gradients between surrounding pixels higher than half of the radar wavelength (Bertone et al., 2022), hampering the application of minimum-cost unwrapping algorithms (Costantini, 1998).
Our classification approach has advantages and limitations and must be regarded to be a complement and not an alternative to previously proposed approaches (e.g. RGIK, 2023a). Our workflow is semi-automated and allows for a rapid classification of mapped populations of periglacial landforms over wide areas (514 spread over 1000 km2 in our case study), while existing approaches rely on a manual attribution of the kinematic attribute (e.g. Barboux et al., 2014; Bertone et al., 2022). Differently from the semi-automated methodologies proposed by Rouyet et al. (2021) and Bertone et al. (2022), our stacking approach exploits Sentinel-1 interferograms at the highest possible multi-looked resolution (about 15 m) and relies on the automated analysis of frequency distributions of stacked median wrapped phases that are computed for each mapped landform and not pixel-wise.
Differently from activity assessment approaches based on multi-temporal interferometric methods (Zhang et al., 2021; Buchelt et al., 2023), our approach exploits the spatially distributed information contained in wrapped interferograms, avoids the uncertainties related to unwrapping, and better captures the timescales of process occurrence by working on specific temporal baselines. Moreover, our methodology relies on stacking, allowing us to mitigate the effects of atmospheric phase-screening effects, which are difficult to correct for in high-mountain alpine environments. On the other hand, the semi-automated character of our method may suffer from local errors, which, in any case, are checked during the validation stage.
Obviously, our methodology suffers from the intrinsic limitations of satellite InSAR, including a limited ability to detect movements on unfavourably oriented slopes (Fig. S4). As the direction of rock glacier movement departs from the LOS direction, we expect that, for a given displacement, fringe patterns dilate and flatten until they become impossible to distinguish from noise. Nonetheless, this occurs gradually, and, for each periglacial feature, we quantify the fraction of movement that can be recorded by the sensor as a function of topographic and satellite orbit parameters (Notti et al., 2014; Fig. S4). In these conditions, as already proposed for regional-scale landslide applications (Crippa et al., 2021), we prefer to avoid applying a precise threshold to SAR sensitivity but provide a full dataset that can be filtered later. We believe that this approach makes the results of our activity assessment more robust in relation to the different sources of uncertainty and facilitates a quantitative evaluation of the impact of SAR visibility.
The definition of our activity index is based on the frequency distribution of wrapped-phase difference values emerging from background levels recorded in the adjacent stable rims. Thus, it combines information on both the extent of active areas within the mapped landforms and their unambiguous displacement rates. In this respect, the definition of transitional features using our methodology appears to be consistent with the original kinematics-based definition (RGIK, 2020, 2023a; Lambiel et al., 2023), with low displacement rates resulting in activity index values below the detection threshold in permafrost-bearing landforms.
As a result of the proposed classification scheme, we also recognize a category of landforms characterized by significant deformation signals without being associated with likely permafrost occurrence (i.e. our moving-debris class). Our methodology is unable to infer the physical processes underlying these specific activity characteristics. However, we observe that moving-debris landforms are active independently of the considered temporal baseline (Fig. 7), and their distribution is uncorrelated with the topographic variables commonly associated with active rock glaciers (Figs. 10 and 11). In this sense, we propose that the moving-debris category, accounting for 12 % of the dataset at Bt = 24 d in our case study, includes features submitted to site-specific examination when the analysis is intended to support the update of rock glacier inventories.
An activity assessment methodology accounting for the information provided by InSAR over a wide range of temporal baselines (12 to 120 d) is key to gain preliminary insights into the complex spatial and temporal dynamics of periglacial landforms. These can be either strongly heterogeneous due to interplaying deformation mechanisms (e.g. active-layer movement, permafrost creep, internal shearing) or overlapping processes that require site-specific geomorphological investigation, monitoring, and modelling studies (Springman et al., 2012; Cicoira et al., 2021). Our regional-scale results allow us to highlight different styles of activity. Temporal baselines of 12 and 24 d capture the activity of rock glaciers and protalus ramparts characterized by typically observed displacement rates of dm yr−1 (Haeberli et al., 2006) and up to 85 cm yr−1, with the 24 d Bt corresponding to the maximum number of features classified as active (Table 5). Landforms characterized by homogeneous slow movements (max. 11 cm yr−1) are captured with longer temporal baselines (90 to 120 d). On the other hand, the activity of a large subset of the inventory is captured in interferograms generated with different temporal baselines (12 and 120 d; Fig. 8), suggesting that they may exhibit more complex spatial patterns or temporal trends. Our methodology is not conceived to provide insights into the physical processes underlying observed styles of activity (e.g. temperature effects, hydrological forcing, destabilization) but supports the identification of case studies for site-specific investigations.
Morphometric and multivariate statistical analysis results support the robustness of our classification approach and the effectiveness of including an indicator of permafrost distribution (i.e. an API map) directly in the activity classification procedure. The clustering of permafrost-bearing (active and transitional) and permafrost-lacking landforms (relict and moving debris) into distinct groups is influenced by aspect, elevation, and land surface temperature in a way that is consistent with the control of permafrost occurrence. Additional factors like precipitation, snow cover depth, and duration could enhance the characterization of features falling into different activity classes, but this is beyond the scope of this work.
Finally, and from a more general perspective, our results prove that significant information about the activity of alpine mass movement can be automatically extracted from DInSAR wrapped-phase signals, avoiding the uncertainties introduced by unwrapping procedures and atmospheric correction models. This can bring about interesting perspectives with regard to the development of fast and automated mass movement detection tools based on increasingly powerful artificial-intelligence techniques.
Using DInSAR wrapped-phase difference and permafrost occurrence data, we provided a rapid, semi-automatic, and replicable regional screening methodology, allowing us to classify the activity of rock glaciers and protalus ramparts across multiple temporal baselines. This classification yielded four distinct categories, namely active, transitional, relict, and moving-debris classes, that are consistent with the most recent rock glacier inventorying criteria but also objectively and rapidly assessed and enabled the identification of landforms exhibiting different velocity ranges and degrees of heterogeneity.
The possibility of obtaining a rapid classification of large populations of periglacial landforms over large areas while being respectful of field geomorphological evidence and kinematic and environmental constraints provides a useful tool to (a) exploit routinely generated wrapped DInSAR products to perform (and regularly update) a fast screening of periglacial landform activity over wide areas and (b) identify candidate case studies for local-scale studies, depending on estimated activity and complexity or heterogeneity.
We used published or freely available data. We used the published geomorphological inventory of Scotti et al. (2013, https://doi.org/10.1016/j.geomorph.2012.12.028; GIS data courtesy of the authors). For DInSAR processing, we used Sentinel-1 data downloaded from the ASF Vertex portal and processed them using the ESA SNAP Sentinel-1 toolbox v.8 (The European Space Agency). The complete list of used SAR images and generated interferograms is provided in the Supplement with public access. For permafrost data, we used the freely available Alpine Permafrost Index Map (Boeckli et al., 2012, https://doi.org/10.5194/tc-6-125-2012). For LST, we used free Landsat 8 data acquired through the Google Earth Engine tool by Ermida et al. (2020).
The supplement related to this article is available online at https://doi.org/10.5194/tc-19-5003-2025-supplement.
FA and CC conceived the research and designed the methodology. CC and DC prepared the geomorphological, permafrost, and LST data for analysis and performed DInSAR processing. FA, CC, and FF prepared the wrapped-phase analysis workflow. FA and CC analysed and validated the results. FA and CC wrote the paper. FA managed the project.
The contact author has declared that none of the authors has any competing interests.
Publisher's note: Copernicus Publications remains neutral with regard to jurisdictional claims made in the text, published maps, institutional affiliations, or any other geographical representation in this paper. While Copernicus Publications makes every effort to include appropriate place names, the final responsibility lies with the authors. Views expressed in the text are those of the authors and do not necessarily reflect the views of the publisher.
The authors thank Dr. Andrea Manconi, Dr. Alessandro Mondini, and Dr. Fabio Bovenga for the fruitful discussions on the theoretical aspects of InSAR and stacking applications to the periglacial environments.
The research was funded by the European Union – Next Generation EU, Mission 4, Component 2, CUP H53D23001660006 (PRIN22 Project “MIRAGE: Mass movement Investigation and prediction through geomorphology, Remote sensing and Artificial intelligence”) and was partially supported by the Italian Ministry of University and Research (MUR) project “Dipartimenti di Eccellenza 2023–2027, Department of Earth and Environmental Sciences, University of Milano-Bicocca”.
This paper was edited by Christian Hauck and reviewed by two anonymous referees.
Alcott, A.: Classification of Rock Glaciers in Southern Colorado Based on Ice Content Using Radar Interferometry and Thermal Remote Sensing, Doctoral dissertation, University of Missouri-Columbia, ProQuest Dissertations & Theses, 2020. 27993233, 2020.
Amschwand, D., Tschan, S., Scherler, M., Hoelzle, M., Krummenacher, B., Haberkorn, A., Kienholz, C., Aschwanden, L., and Gubler, H.: Seasonal ice storage changes and meltwater generation at Murtèl rock glacier (Engadine, eastern Swiss Alps): estimates from measurements and energy budgets in the coarse blocky active layer, Hydrol. Earth Syst. Sci., 29, 2219–2253, https://doi.org/10.5194/hess-29-2219-2025, 2025.
Ballabio, D.: A MATLAB toolbox for Principal Component Analysis and unsupervised exploration of data structure, Chemom. Intell. Lab. Syst., 149, 1–9, https://doi.org/10.1016/j.chemolab.2015.10.003, 2015.
Barsch, D.: Rockglaciers, Series, Springer Series in Physical Environment, ISBN 978-3-642-80095-5, 1996.
Bartsch, A., Strozzi, T., and Nitze, I.: Permafrost monitoring from space, Surveys in Geophysics, 44, 1579–1613, 2023.
Barboux, C., Delaloye, R., and Lambiel, C.: Inventorying slope movements in an Alpine environment using DInSAR, Earth Surf. Proc. Landforms, 39, 2087–2099, https://doi.org/10.1002/esp.3603, 2014.
Bearzot, F., Garzonio, R., Di Mauro, B., Colombo, R., Cremonese, E., Crosta, G. B., Delaloye, R., Hauck, C., Morra Di Cella, U., Pogliotti, P., Frattini, P., and Rossini, M.: Kinematics of an Alpine rock glacier from multi-temporal UAV surveys and GNSS data, Geomorphology, 402, https://doi.org/10.1016/j.geomorph.2022.108116, 2022.
Beniston, M., Haeberli, W., Hoelzle, M., and Taylor, A.: On the potential use of glacier and permafrost observations for verification of climate models, Annals of Glaciology, 25, 400–406, https://doi.org/10.3189/S026030550001435X, 2017.
Beniston, M., Farinotti, D., Stoffel, M., Andreassen, L. M., Coppola, E., Eckert, N., Fantini, A., Giacona, F., Hauck, C., Huss, M., Huwald, H., Lehning, M., López-Moreno, J.-I., Magnusson, J., Marty, C., Morán-Tejéda, E., Morin, S., Naaim, M., Provenzale, A., Rabatel, A., Six, D., Stötter, J., Strasser, U., Terzago, S., and Vincent, C.: The European mountain cryosphere: a review of its current state, trends, and future challenges, The Cryosphere, 12, 759–794, https://doi.org/10.5194/tc-12-759-2018, 2018.
Berger, J., Krainer, K., and Mostler, W.: Dynamics of an active rock glacier (Ötztal Alps, Austria), Quaternary Res., 62, 233–242, https://doi.org/10.1016/j.yqres.2004.07.002, 2004.
Bertone, A., Barboux, C., Bodin, X., Bolch, T., Brardinoni, F., Caduff, R., Christiansen, H. H., Darrow, M. M., Delaloye, R., Etzelmüller, B., Humlum, O., Lambiel, C., Lilleøren, K. S., Mair, V., Pellegrinon, G., Rouyet, L., Ruiz, L., and Strozzi, T.: Incorporating InSAR kinematics into rock glacier inventories: insights from 11 regions worldwide, The Cryosphere, 16, 2769–2792, https://doi.org/10.5194/tc-16-2769-2022, 2022.
Bertone, A., Seppi, R., Callegari, M., Cuozzo, G., Dematteis, N., Krainer, K., Carlo Marin, Notarnicola, C., and Zucca, F.: Unprecedented observation of hourly rock glacier velocity with ground-based SAR. Geophys. Res. Lett., 50, e2023GL102796, https://doi.org/10.1029/2023GL102796, 2023.
Bini, A., Buoncristiani, J. F., Couterrand, S., Ellwanger, D., Felber, M., Florineth, D., Graf, H. R., Keller, O., Kelly, M., Schlüchter, C., and Schöneich, P.: Die Schweiz während des letzteiszeitlichen Maximums (LGM), Karte 1 : 500 000, Bundesamt für Landesgeologie [Map], https://www.swisstopo.admin.ch/de/geokarten-500-pixel (last access: 21 October 2025), 2009.
Bodin, X., Krysiecky, J. M., Schoeneich, P., Le Roux, O., Lorier, L., Echelard, T., Peyron, M., and Walpersdorf, A.: The 2006 collapse of the Bérard rock glacier (Southern French Alps), Permafr. Periglac. Process., 28, 209–223, https://doi.org/10.1002/ppp.1887, 2016.
Boeckli, L., Brenning, A., Gruber, S., and Noetzli, J.: A statistical approach to modelling permafrost distribution in the European Alps or similar mountain ranges, The Cryosphere, 6, 125–140, https://doi.org/10.5194/tc-6-125-2012, 2012.
Brencher, G., Handwerger, A. L., and Munroe, J. S.: InSAR-based characterization of rock glacier movement in the Uinta Mountains, Utah, USA, The Cryosphere, 15, 4823–4844, https://doi.org/10.5194/tc-15-4823-2021, 2021.
Buchelt, S., Blöthe, J. H., Kuenzer, C., Schmitt, A., Ullmann, T., Philipp, M., and Kneisel, C.: Deciphering Small-Scale Seasonal Surface Dynamics of Rock Glaciers in the Central European Alps Using DInSAR Time Series, Rem. Sens., 15, 2982, https://doi.org/10.3390/rs15122982, 2023.
Casale, F. and Bocchiola, D.: Climate Change Effects upon Pasture in the Alps: The Case of Valtellina Valley, Italy, Climate, 10, 173, https://doi.org/10.3390/cli10110173, 2022.
Ceriani, M. and Carelli, M.: Carta delle precipitazioni medie, minime e massime annue del territorio alpino lombardo (registrate nel periodo 1891–1990), Scala 1 : 250.000. Regione Lombardia, Direzione Generale Territorio ed Urbanistica, U.O. Difesa del Suolo, Struttura Rischi Idrogeologici e Sismici, https://doi.org/10.3189/S026030550001435X, 2000.
Cicoira, A., Marcer, M., Gärtner-Roer, I., Bodin, X., Arenson, L. U., and Vieli, A.: A general theory of rock glacier creep based on in-situ and remote sensing observations, Permafr. Periglac. Process., 32, 139-153, doi.org/10.1002/ppp.2090, 2021.
Colesanti, C. and Wasowski, J.: Investigating landslides with space-borne Synthetic Aperture Radar (SAR) interferometry, Eng. Geol., 88, 173–199, https://doi.org/10.1016/j.enggeo.2006.09.013, 2006.
Costantini, M.: A novel phase unwrapping method based on network programming, IEEE Trans. Geosci. Rem. Sens., 36, 813–821, https://doi.org/10.1109/36.673674, 1998.
Crippa, C., Valbuzzi, E., Frattini, P., Crosta, G. B., Spreafico, M. C., and Agliardi, F.: Semi-automated regional classification of the style of activity of slow rock-slope deformations using PS InSAR and SqueeSAR velocity data, Landslides, 18, 2445–2463, 2021.
Delaloye, R. and Staub, B.: Seasonal variations of rock glacier creep: Time series observations from the Western Swiss Alps, in: Proceedings of the International Conference on Book of Abstracts, 20–24 June 2016, Potsdam, Germany, https://doi.org/10.2312/GFZ.LIS.2016.001, 2016.
Deline, P., Gruber, S., Delaloye, R., Fischer, L., Geertsema, M., Giardino, M., Hasler, A., Kirkbride, M., Krautblatter, M., Magnin, F., McColl, S., Ravanel, L., and Schoeneich, P.: Ice loss and slope stability in high-mountain regions. In Snow and ice-related hazards, risks, and disasters, 521–561, Academic Press, https://doi.org/10.1016/B978-0-12-394849-6.00015-9, 2015.
Ermida, S. L., Soares, P., Mantas, V., Göttsche, F. M., and Trigo, I. F.: Google earth engine open-source code for land surface temperature estimation from the Landsat series, Rem. Sens., 12, 1471, https://doi.org/10.3390/rs12091471, 2020.
Fey, C. and Krainer, K.: Analyses of UAV and GNSS based flow velocity variations of the rock glacier Lazaun (Ötztal Alps, South Tyrol, Italy), Geomorphology, 365, 107261, https://doi.org/10.1016/j.geomorph.2020.107261, 2020.
Froitzheim, N., Schmid, S., and Conti, P.: Repeated change from crustal shortening to orogen-parallel extension in the Austroalpine units of Graubunden, Eclogae Geol. Helv., 87, 559–612, 1994.
Gök, D. T., Scherler, D., and Wulf, H.: Land surface temperature trends derived from Landsat imagery in the Swiss Alps, The Cryosphere, 18, 5259–5276, https://doi.org/10.5194/tc-18-5259-2024, 2024.
Goldstein, R. M. and Werner, C. L.: Radar interferogram filtering for geophysical applications, Geophys. Res. Lett., 25, 4035–4038, 1998.
Hachem, S., Duguay, C. R., and Allard, M.: Comparison of MODIS-derived land surface temperatures with ground surface and air temperature measurements in continuous permafrost terrain, The Cryosphere, 6, 51–69, https://doi.org/10.5194/tc-6-51-2012, 2012.
Haeberli, W.: Creep of mountain permafrost: internal structure and flow of alpine rock glaciers, Mitteilungen der Versuchsanstalt fur Wasserbau, Hydrologie und Glaziologie an der Eidgenossischen Technischen Hochschule Zurich, 77, ISSN 0374-0056, 1985.
Haeberli, W.: Mountain permafrost – research frontiers and a special long-term challenge, Cold Regions Sci. Tech., 96, 71–76, 2013.
Haeberli, W. and Beniston, M.: Climate change and its impacts on glaciers and permafrost in the Alps, Ambio, 27, 258–265, 1998.
Haeberli, W., Hallet, B., Arenson, L., Elconin, R., Humlum, O., Kääb, A., Kaufmann, V., Ladanyi, B., Matsuoka, N., Springman, S., and Vonder Mühll, D.: Permafrost creep and rock glacier dynamics, Permafr. Periglac. Process., 17, 189–214, https://doi.org/10.1002/ppp.561, 2006.
Harris, S. A. and Pedersen, D. E.: Thermal regimes beneath coarse blocky materials, Permafr. Periglac. Process., 9, 107–120, 1998.
Hedding, D. W.: Pronival rampart and protalus rampart: a review of terminology, J. Glac., 57, 1179–1180, https://doi.org/10.3189/002214311798843241, 2011.
Hotelling, H.: Analysis of a complex of statistical variables into principal components, J. Educ. Psych., 24, 417, https://doi.org/10.1037/h0071325, 1933.
Hu, Y., Arenson, L. U., Barboux, C., Bodin, X., Cicoira, A., Delaloye, R., Gärtner-Roer, I., Kääb, A., Kellerer-Pirklbauer, A., Lambiel, C., Liu, L., Pellet, C., Rouyet, L., Schoeneich, P., Seier, G., and Strozzi, T.: Rock Glacier Velocity: An Essential Climate Variable Quantity for Permafrost, Rev. Geophys., 63, https://doi.org/10.1029/2024rg000847, 2025.
Humlum, O.: Active layer thermal regime at three rock glaciers in Greenland, Permafr. Periglac. Process., 8, 383–408, 1997.
Ivy-Ochs, S., Kerschner, H., Reuther, A., Preusser, F., Heine, K., Maisch, M., Kubik, P. W., and Schlüchter, C.: Chronology of the last glacial cycle in the European Alps, J. Quat. Sci., 23, 559–573, 2008.
Jones, D. B., Harrison, S., Anderson, K., and Betts, R. A.: Mountain rock glaciers contain globally significant water stores, Scientific Reports, 8, 2834, https://doi.org/10.1038/s41598-018-21244-w, 2018a.
Jones, D. B., Harrison, S., Anderson, K., Selley, H. L., Wood, J. L., and Betts, R. A.: The distribution and hydrological significance of rock glaciers in the Nepalese Himalaya, Global and Planetary Change, 160, 123–142, https://doi.org/10.1016/j.gloplacha.2017.11.005, 2018b.
Jones, D. B., Harrison, S., and Anderson, K.: Mountain glacier-to-rock glacier transition, Glob. Planet. Change, 181, 102999, https://doi.org/10.1016/j.gloplacha.2019.102999, 2019.
Jones, N., Strozzi, T., Rabatel, A., Ducasse, E., and Mouginot, J.: Surface instability mapping in alpine paraglacial environments using Sentinel-1 DInSAR techniques, IEEE Journal of Selected Topics in Applied Earth Observations and Remote Sensing, https://doi.org/10.1109/JSTARS.2023.3287285, 2023.
Kääb, A., and Weber, M.: Development of transverse ridges on rock glaciers: field measurements and laboratory experiments, Permafrost and Periglacial Processes, 15, 379–391, https://doi.org/10.1002/ppp.506, 2004.
Kääb, A., Strozzi, T., Bolch, T., Caduff, R., Trefall, H., Stoffel, M., and Kokarev, A.: Inventory and changes of rock glacier creep speeds in Ile Alatau and Kungöy Ala-Too, northern Tien Shan, since the 1950s, The Cryosphere, 15, 927–949, https://doi.org/10.5194/tc-15-927-2021, 2021.
Kellerer-Pirklbauer, A. and Kaufmann, V.: About the relationship between rock glacier velocity and climate parameters in central austria, Austrian Journal of Earth Sciences, 105.2, 94–112, 2012.
Kellerer-Pirklbauer, A., Bodin, X., Delaloye, R., Lambiel, C., Gartner-Roer, I., Bonnefoy-Demongeot, M., Carturan, L., Damm, B., Eulenstein, J., Fischer, A., Hartl, L., Ikeda, A., Kaufmann, V., Krainer, K., Matsuoka, N., Morra Di Cella, U., Noetzli, J., Seppi, R., Scapozza, C., Schoeneich, P., Stocker-Waldhube, M., Thibert, E., and Zumiani, M.: Acceleration and interannual variability of creep rates in mountain permafrost landforms (rock glacier velocities) in the European Alps in 1995–2022, Environ. Res. Lett., 19, 034022, https://doi.org/10.1088/1748-9326/ad25a4, 2024.
Kenner, R., Phillips, M., Beutel, J., Hiller, M., Limpach, P., Pointner, E., and Volken, M.: Factors Controlling Velocity Variations at Short-Term, Seasonal and Multiyear Time Scales, Ritigraben Rock Glacier, Western Swiss Alps, Permafrost Periglac. Proc., 684, 675–684, https://doi.org/10.1002/ppp.1953, 2017.
Krainer, K., Bressan, D., Dietre, B., Haas, J. N., Hajdas, I., Lang, K., Mair, V., Nickus, U., Reidl, D., Thies, H., and Tonidandel, D.: A 10,300-year-old permafrost core from the active rock glacier Lazaun, southern Ötztal Alps (South Tyrol, northern Italy), Quaternary Research, 83, 324–335, https://doi.org/10.1016/j.yqres.2014.12.005, 2015.
Kummert, M., Dealloying, R., and Braillard, L.: Erosion and sediment transfer processes at the front of rapidly moving rock glaciers: Systematic observations with automatic cameras in the western Swiss Alps, Permafr. Periglac. Proc., 29, 21–33, https://doi.org/10.1002/ppp.1960, 2017.
Lambiel, C., Strozzi, T., Paillex, N., Vivero, S., and Jones, N.: Inventory and kinematics of active and transitional rock glaciers in the Southern Alps of New Zealand from Sentinel-1 InSAR. Arctic, Antarctic, and Alpine Research, 55, 2183999, https://doi.org/10.1080/15230430.2023.2183999, 2023.
Luo, D., Jin, H., and Bense, V. F.: Ground surface temperature and the detection of permafrost in the rugged topography on NE Qinghai-Tibet Plateau, Geoderma, 333, 57–68, 2019.
Malakar, N. K., Hulley, G. C., Hook, S. J., Laraby, K., Cook, M., and Schott, J. R.: An operational land surface temperature product for Landsat thermal data: Methodology and validation, IEEE Trans. Geosci. Rem. Sens., 56, 5717–5735, https://doi.org/10.1109/TGRS.2018.2824828, 2018.
Manconi, A.: How phase aliasing limits systematic space-borne DInSAR monitoring and failure forecast of alpine landslides, Eng. Geol., 287, 106094, https://doi.org/10.1016/j.enggeo.2021.106094, 2021.
Marcer, M., Serrano, C., Brenning, A., Bodin, X., Goetz, J., and Schoeneich, P.: Evaluating the destabilization susceptibility of active rock glaciers in the French Alps, The Cryosphere, 13, 141–155, https://doi.org/10.5194/tc-13-141-2019, 2019.
Marcer, M., Cicoira, A., Cusicanqui, D., Bodin, X., Echelard, T., Obregon, R., and Schoeneich, P.: Rock glaciers throughout the French Alps accelerated and destabilised since 1990 as air temperatures increased, Comm. Earth Env., 2, 81, https://doi.org/10.1038/s43247-021-00150-6, 2021.
Nyenhuis, M., Hoelzle, M., and Dikau, R.: Rock glacier mapping and permafrost distribution modelling in the Turtmanntal, Valais, Switzerland, Zeitschrift für Geomorphologie, N. F., 49, 275–292, 2005.
Notti, D., Herrera, G., Bianchini, S., Meisina, C., García-Davalillo, J. C., and Zucca, F.: A methodology for improving landslide PSI data analysis, Int. J. Rem. Sens., 35, 2186–2214, https://doi.org/10.1080/01431161.2014.889864, 2014.
Parastatidis, D., Mitraka, Z., Chrysoulakis, N., and Abrams, M.: Online global land surface temperature estimation from Landsat, Rem. Sens., 9, 1208, https://doi.org/10.3390/rs9121208, 2017.
Pellet, C., Bodin, X., Cusicanqui, D., Delaloye, R., Kääb, A., Kaufmann, V. Noetzli, J., Thibert, E., Vivero, S., and Kellerer-Pirklbauer, A.: Rock Glacier Velocity, Bull. Amer. Meteor. Soc., 104, 41–42, https://doi.org/10.1175/2023BAMSStateoftheClimate.1, 2023.
RGIK: Rock glacier inventory using InSAR (kinematic approach), Practical Guidelines (version 3.0.2), IPA Action Group Rock glacier inventories and kinematics, https://bigweb.unifr.ch/Science/Geosciences/Geomorphology/Pub/Website/CCI/Guidelines/RGI_ka_InSAR-based_Guidelines_v.3.0.2.pdf (last access: 20 May 2024), 2020.
RGIK: Guidelines for inventorying rock glaciers: baseline and practical concepts (version 1.0), IPA Action Group Rock glacier inventories and kinematics, 25 pp., https://doi.org/10.51363/unifr.srr.2023.002, 2023a.
RGIK: Rock Glacier Velocity as an associated parameter of ECV Permafrost: Baseline concepts (Version 3.2), IPA Action Group Rock glacier inventories and kinematics, 12 pp., 2023b.
RGIK: Rock Glacier Velocity as associated product of ECV Permafrost: practical concepts (version 1.2), IPA Action Group Rock glacier inventories and kinematics, 17 pp., 2023c.
Rouyet, L., Lilleøren, K. S., Böhme,M., Vick, L.M., Delaloye, R., Etzelmüller, B., Lauknes, T. R., Larsen, Y., and Blikra, L. H.: Regional morpho-kinematic inventory of slope movements in northern Norway, Frontiers in Earth Science, 9, 681088, https://doi.org/10.3389/feart.2021.681088, 2021.
Scapozza, C., Lambiel, C., Baron, L., Marescot, L., and Reynard, E.: Internal structure and permafrost distribution in two alpine periglacial talus slopes, Valais, Swiss Alps, Geomorphology, 132, 208–221, https://doi.org/10.1016/j.geomorph.2011.05.010, 2011.
Scapozza, C., Lambiel, C., Bozzini, C., Mari, S., and Conedera, M.: Assessing the rock glacier kinematics on three different timescales: a case study from the southern Swiss Alps, Earth Surf. Proc. Land., 39, 2056–2069, https://doi.org/10.1002/esp.3599, 2014.
Scotti, R., Brardinoni, F., Alberti, S., Frattini, P., and Crosta, G. B.: A regional inventory of rock glaciers and protalus ramparts in the central Italian Alps, Geomorphology, 186, 136–149, https://doi.org/10.1016/j.geomorph.2012.12.028, 2013.
Shakesby, R. A.: Protalus ramparts, in: Encyclopedia of Geomorphology, edited by: Goudie, A., Vol. 1. Routledge, London, 813–814, 2004.
Smiraglia, C., and Diolaiuti, G. A.: LO STATO ATTUALE DEI GHIACCIAI ITALIANI E LA LORO RECENTE EVOLUZIONE: RISULTATI DI UN NUOVO INVENTARIO, Istituto Lombardo-Accademia di Scienze e Lettere-Rendiconti di Scienze, 2016.
Springman, S. M., Arenson, L. U., Yamamoto, Y., Maurer, H., Kos, A., Buchli, T., and Derungs, G.: Multidisciplinary investigations on three rock glaciers in the swiss alps: legacies and future perspectives, Geografiska Annaler: Series A, Physical Geography, 94, 215–243, https://doi.org/10.1111/j.1468-0459.2012.00464.x, 2012.
Stoffel, M. and Huggel, C.: Effects of climate change on mass movements in mountain environments, Progress in physical geography: Earth and Environment, 36, 421–439, https://doi.org/10.1177/0309133312441010, 2012.
Strozzi, T., Caduff, R., Jones, N., Barboux, C., Delaloye, R., Bodin, X., Kääb, A., Mätzler, E., and Schrott, L.: Monitoring rock glacier kinematics with satellite synthetic aperture radar, Rem. Sens., 12, 559, https://doi.org/10.3390/rs12030559, 2020.
Vonder Mühll, D. and Haeberli, W.: Thermal Characteristics of the Permafrost within an Active Rock Glacier (Murtèl/Corvatsch, Grisons, Swiss Alps), J. Glac., 36, 151–158, https://doi.org/10.3189/S0022143000009382, 1990.
Vonder Mühll, D., Arenson, L. U., and Springman, S. M.: Temperature conditions in two Alpine rock glaciers. Proceedings of the International Conference on Permafrost, Zürich, Switzerland, 21–25, http://hdl.handle.net/20.500.11850/54148 (last access: 21 October 2025), 2003.
Wirz, V., Gruber, S., Purves, R. S., Beutel, J., Gärtner-Roer, I., Gubler, S., and Vieli, A.: Short-term velocity variations at three rock glaciers and their relationship with meteorological conditions, Earth Surf. Dynam., 4, 103–123, https://doi.org/10.5194/esurf-4-103-2016, 2016.
Zhang, X., Feng, M., Zhang, H., Wang, C., Tang, Y., Xu, J., Yan, D., and Wang, C.: Detecting rock glacier displacement in the central Himalayas using multi-temporal InSAR, Rem. Sens., 13, 4738, https://doi.org/10.3390/rs13234738, 2021.