the Creative Commons Attribution 4.0 License.
the Creative Commons Attribution 4.0 License.
 | 23 Oct 2025
Thermokarst lakes disturb the permafrost structure and stimulate through-talik formation in the Qinghai–Tibet Plateau, China: a hydrogeophysical investigation
Wei Wang
Fujun Niu
Zeyong Gao
Wenkang Huang
Huake Cao
Thermokarst lakes are widely distributed in the Qinghai–Tibet Plateau (QTP) and continuously disturb the permafrost structure. Investigating the permafrost and sublake talik structures is crucial to assessing and predicting the fate of the ecosystem and engineering under climate warming. Until recently, measurements of the permafrost distribution are often limited to seasonally frozen soil or permafrost at a few borehole locations, and the detection of deep permafrost and sublake taliks in the QTP has rarely been attempted on larger scales. Here, a synergistic application of electrical resistivity tomography and borehole temperature measurement was used to investigate the permafrost and sublake talik structures in a thermokarst lake region of the QTP. The results showed that the maximum lower limit depths of the permafrost and active layer were determined to be 84–100 and 0.9–4.0 m, respectively. Sub- and supra-permafrost water continuously erode the base and top plate of the permafrost, thereby reducing its thickness and disturbing its structure. Moreover, thermokarst lakes (unofficially named lakes BLH–A, B, and C) thaw the surrounding permafrost and form three through-taliks below them. These findings can help understand the interaction between thermokarst lakes and permafrost and optimize cryohydrogeologic models that can predict the evolution of permafrost and thermokarst lakes in similar cold regions.
- Article
(3679 KB) - Full-text XML
-
Supplement
(595 KB) - BibTeX
- EndNote


Permafrost is ground (soil or rock and included ice and organic material) that remains at or below 0 °C for at least 2 consecutive years (Gao and Coon, 2022; Shur et al., 2011) and covers approximately a quarter of the land surface in the Northern Hemisphere (Liu et al., 2021; Obu, 2021). The Qinghai–Tibet Plateau (QTP), which has the largest body of permafrost at high elevations and low latitudes (Zhou et al., 2022a; Sun et al., 2023), is crucial for maintaining the global climate and ecological environment (Yao et al., 2012; Liu et al., 2023a). However, climate warming caused rapid thawing of permafrost in this region, which is expected to continue throughout the 21st century (Zhang et al., 2022, 2023a). Thermokarst lakes have become a common natural landscape, widely distributed in permafrost regions (Li et al., 2021a). The surface area and number of thermokarst lakes caused by factors such as permafrost degradation, precipitation, and temperature in the QTP have been increasing (Luo et al., 2022). Thermokarst lakes are believed to serve as heat sources that thaw the surrounding permafrost (Peng et al., 2021). Where thermokarst lakes are present, through-taliks may exist and provide flow pathways that accelerate permafrost degradation (Ke et al., 2023b), lead to the loss of supra-permafrost water resources (Yoshikawa and Hinzman, 2003), change the hydrological cycle (Li et al., 2021a), affect groundwater quality (Bouchard et al., 2011), and reconfigure the geomorphological landscape (Veremeeva et al., 2021). Additionally, thermokarst lakes have a strong thermal effect on adjacent infrastructure, thus affecting their stability and inducing serious engineering diseases (Guo et al., 2016; Wen et al., 2018; Liu et al., 2023b). As such, investigating the distribution of permafrost and sublake taliks is valuable for understanding and predicting the fate of the ecosystem, hydrological environment, and engineering projects in the QTP under climate warming.
The thermal state and thickness of permafrost are typically determined from core drilling (Noetzli et al., 2021), ground temperature measurement (GTM) (Uhlemann et al., 2023), and modeling (Li et al., 2014). Wu et al. (2010) showed that the permafrost thickness in the QTP ranged from 10 to 312 m, whereas the maximum thicknesses obtained from borehole measurements and geothermal gradient estimation were 128 m (Tanggula Mountains) and 312 m (Fenghuo Mountains), respectively. The permafrost thicknesses in alpine, hilly, and plain or river valleys are >200, 60–130, and <60 m (Cheng et al., 2019), respectively. Lin et al. (2016) revealed the thermal state and extinction process of the permafrost within 50 m below a thermokarst lake using nearly 10 years of ground temperature monitoring data. Core drilling and GTM for detecting permafrost and taliks are valuable but labor-intensive and point-scale (You et al., 2017), making it difficult to estimate the spatial distribution (larger than the point scale) of permafrost. Additionally, although it is easy to monitor shallow permafrost, it is difficult to accurately detect permafrost structures with a large thickness because of the limitation of the drilling depth (Uhlemann et al., 2023). Numerical models play an important role in revealing the spatiotemporal evolution of permafrost and thermokarst lakes at large scales (Wellman et al., 2013; Li et al., 2014, 2021a). However, these models are based on some simplified assumptions (e.g., lake geometries are regular and constant, precipitation and evaporation are ignored, saturation models, etc.) and formation structure (permafrost and sublake taliks) that cannot be supported by actual measurements, which implies a trade-off between model complexity and simulation accuracy (Lamontagne-Halle et al., 2020). To detect larger-scale (larger than borehole locations) and more accurate permafrost and sublake taliks structures for cryohydrogeologic modeling, convenient and dense spatial measurement technologies are required.
Geophysical prospecting methods (GPMs) are noninvasive techniques for obtaining subsurface physical information, and they can help overcome the above limitations and improve our understanding of multiscale subsurface structures (Binley et al., 2015). Electrical resistivity tomography (ERT) (Briggs et al., 2017; Hornum et al., 2021), transient electromagnetic (TEM) (Creighton et al., 2018), ground penetrating radar (GPR) (Terry et al., 2020), and nuclear magnetic resonance (NMR) (Keating et al., 2018) can be used for detecting permafrost and taliks; these techniques are respectively based on the differences in the electrical resistivity (ER), dielectric permittivity, and electromagnetic excitation of the protons in hydrogen atoms between frozen and thawed sediments. GPMs are often used in combination to determine the permafrost distribution and improve the accuracy of the results. For example, the distribution of permafrost and taliks has been determined by combining GPR and ERT methods (Sjöberg et al., 2015; You et al., 2017). Rangel et al. (2021) observed taliks below a drained lake basin in the western Arctic Coastal Plain of Alaska using a combination of TEM, NMR, and thermal modeling methods. Yoshikawa et al. (2006) combined six different GPMs (GPR, ERT, TEM, very-low-frequency electromagnetic method, seismic refraction, and helicopter-borne electromagnetic method) to reveal the characteristics of permafrost and taliks in Alaska and the capabilities of these methods were compared. Furthermore, core drilling is often combined with GPMs to help interpret geophysical information (Hilbich et al., 2008; Gao et al., 2019). Despite the contributions made by GPMs toward understanding the permafrost in the QTP, the structure of deep permafrost and sublake taliks remains unclear. Filling this gap can help understand and predict the evolution of the permafrost and the ecological–hydrological environment in the QTP.
Given the widely distributed thermokarst lakes and the paucity of information about permafrost degradation under their influence, we aim to answer the following questions: (1) What is the characteristic of permafrost structure (spatial distribution and thickness)? (2) How do thermokarst lakes affect the permafrost distribution? To answer these questions, we combined ERT and GTM methods to obtain the characteristics of sublake taliks and permafrost structures in the Qinghai–Tibet engineering corridor. ERT measurements were used to map the permafrost distribution, whereas GTM helped record the thermal state of the sublake taliks and was used to verify the ERT results. To the best of our knowledge, this is the first study in which ERT and GTM are successfully employed to obtain information on deep permafrost and sublake taliks in the QTP. Overall, the results of this study enrich our understanding of the permafrost and sublake taliks and can provide basic information, such as permafrost thickness and distribution and the morphology of through-taliks, for predicting the development of thermokarst lakes and permafrost and in the maintenance of infrastructure.
2.1 Study area
The study area is located in the Beiluhe basin in the central QTP, where permafrost and thermokarst lakes are widely distributed (Fig. 1). Important projects, such as the Qinghai–Tibet Railway and Qinghai–Tibet Highway, pass through this basin, making it an important engineering monitoring base (Ke et al., 2022a). The study area has a sub-frigid plateau semi-arid climate, with mean annual precipitation, evaporation, and temperature of 369.8 mm, 1317 mm, and −3.4 °C (Yin et al., 2017), respectively. Rainfall, snow, and hail, accounting for over 80 % of the total annual precipitation, mainly occur from June to September. Continuous permafrost with a thickness range of ∼50–120 m was formed in cold environments, and the active layer with a thickness range of ∼1.6–3.4 m was formed through the periodic freeze–thaw cycle on the ground surface (Ke et al., 2023a). This study was conducted around lakes BLH–A, B, and C (unofficial name) (Fig. 1c). The maximum depth of these lakes is generally 2 m. The areas and maximum lake surface widths of the lakes BLH–A, B, and C are ∼1.2, 0.7, and 0.8 ha and ∼150, 120, and 135 m, respectively. Lakes BLH–A, B, and C are freshwater lakes with pH and total dissolved solids of 8.22–9.71 and 208–952 mg L−1, respectively. Freshwater lakes may have a stronger impact on the surrounding permafrost than saline or brackish lakes in the QTP (Wang et al., 2018; Zhang et al., 2023b), and the saline water may play an important role in holding the bottom of the lake at a low temperature to preserve the permafrost. 210Pb and 137Cs dating showed that the deposition rates of sediment below lake BLH-A were 0.0056 and 0.0603 cm s−1, suggesting that lake BLH-A may formed 800 years ago (Lin et al., 2010). The lakes and the active layer in this region typically start to thaw in mid-May and freeze in mid-October. Precipitation, supra-permafrost water, and meltwater together help maintain the lake level, which is discharged mainly through evaporation and surface runoff.
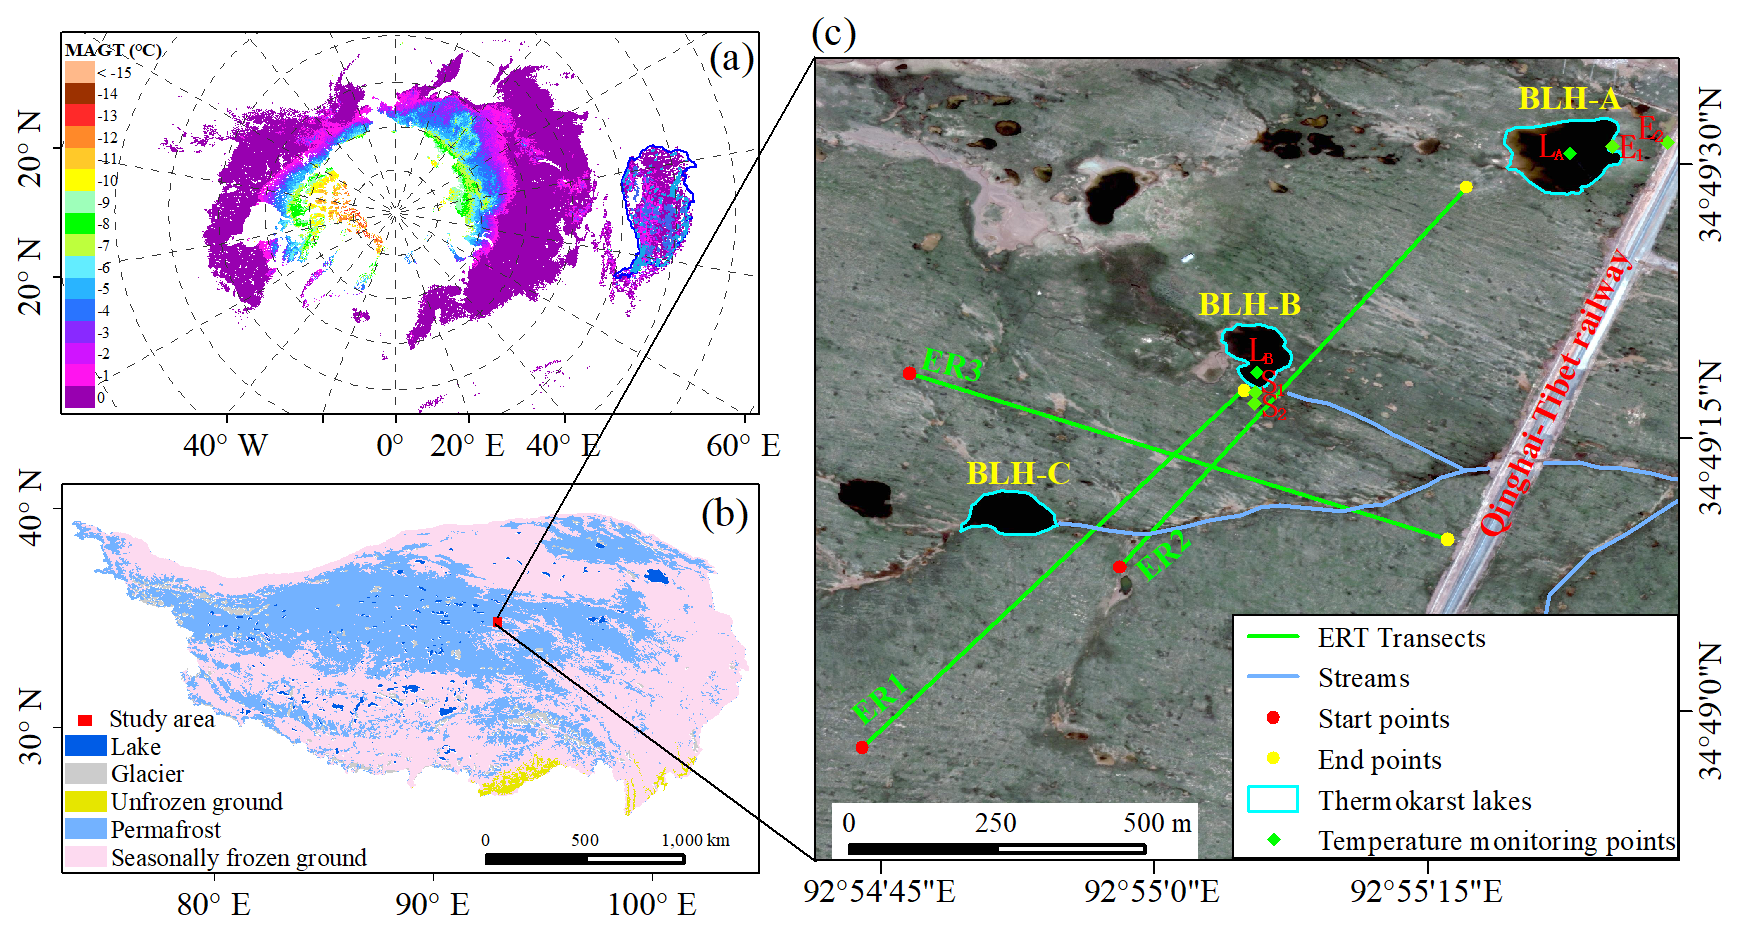
Figure 1Map showing the mean annual ground temperature (MAGT) of permafrost regions in the Northern Hemisphere (a) (Ran et al., 2021), permafrost and seasonally frozen ground (permafrost-free below the active layer) distributions of the QTP (b) (Zhao, 2019), and locations of ERT measurement transects, thermokarst lakes, ground temperature monitoring point (c).
2.2 Hydrogeological characteristics
The study area is located in the topographically flat area of the Beiluhe Basin, which is surrounded by high mountains except for its eastern part. Surface runoff from precipitation, meltwater, and lake water all flow into the Beiluhe River in the form of streams. The main landforms are alpine meadows and alpine wetland meadows, and thermokarst lakes are also common natural landforms (Gao et al., 2021). The stratigraphy of the study area is not very undulating, and the strata are the Quaternary Holocene alluvial diluvial layer and Neogene lacustrine sedimentary layer from top to bottom (Li et al., 2020). The Quaternary Holocene alluvial–diluvial layer comprises silt and fine sand layers with a total thickness range of 0.5–3.5 m, and its underlying brown-red clay layer has a thickness range of 1.0–6.0 m. The Neogene lacustrine sedimentary layer is mainly composed of strongly weathered mudstone, which is the dominant lithology of the study area (Fig. 2). Based on the borehole information collected from the Northwest Institute of Eco-Environmental and Resources, CAS, the formation lithology from top to bottom are sand (∼12 % water content), silty clay (20 %–30 % water content), sand (thick-bedded subsurface ice) with a high ice content (HIC) (more than 50 %), and mudstone with a low ice content (LIC) (∼17 %).
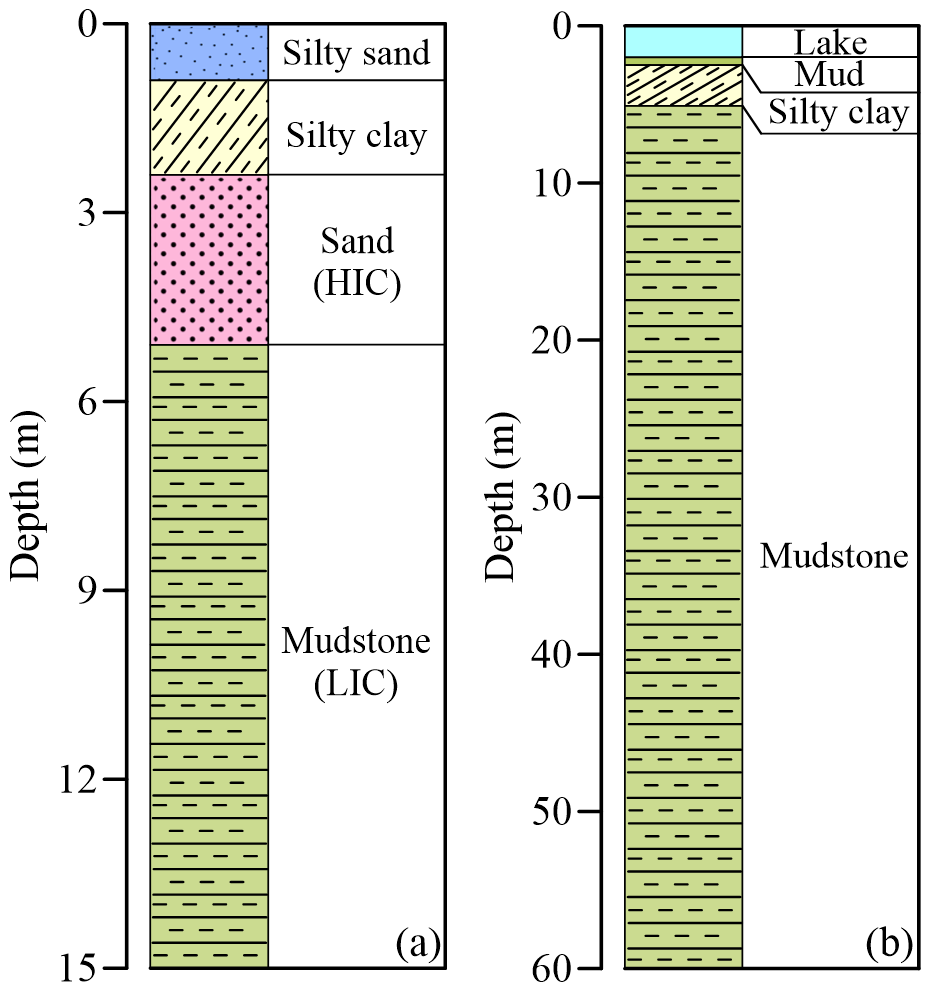
Figure 2Stratigraphic information obtained by core drilling in the shore (a) and center (b) of lake BLH–A.
2.3 Processes for talik and permafrost detection
Figure 3b shows the workflow for talik and permafrost detection. A field survey plan was first developed, and the measuring lines were determined based on the distribution of the thermokarst lake and the basic understanding of permafrost thickness in the study area. Subsequently, borehole data were collected, and the hydrogeological characteristics were analyzed to determine the GPM. Thereafter, the ERT (Fig. 3a) method was used to carry out field detection work, and professional software (RES2DINV) was used to process and interpret the field data. The distribution characteristics of the permafrost and talik were defined based on the interpretation results. Finally, the thermal state of the thermokarst lakes and the surrounding permafrost was analyzed using the ground temperature monitoring data, and the geophysical survey results were supplemented.
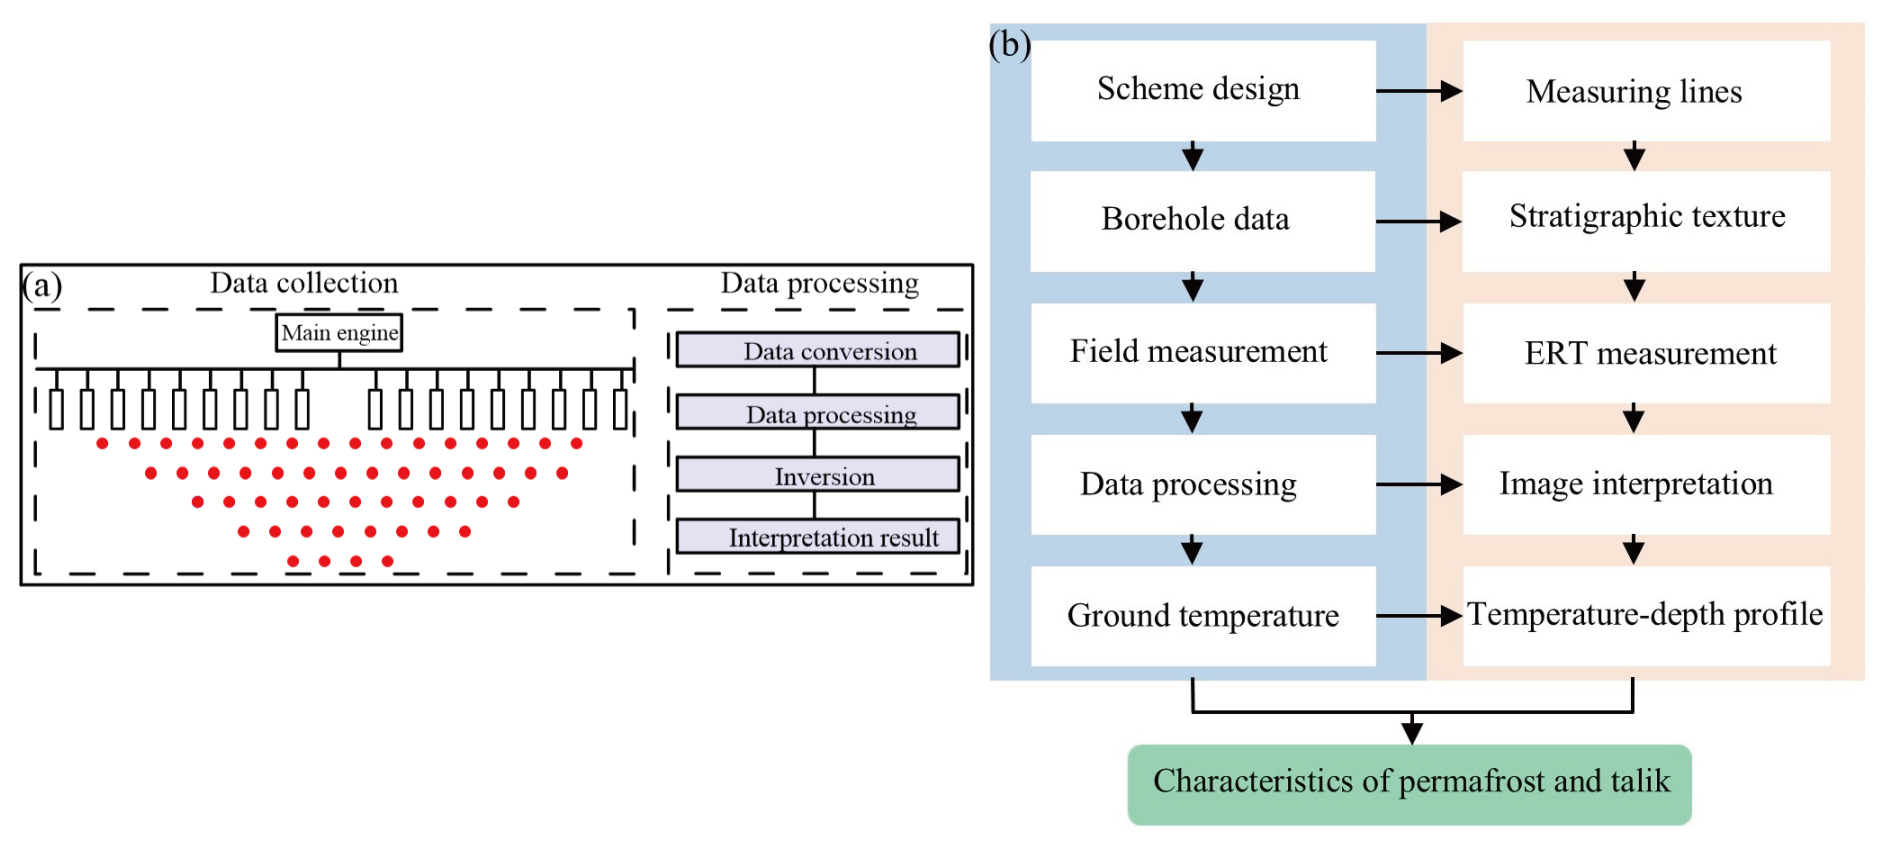
Figure 3Schematic and data interpretation process diagram of the ERT (a) and the framework for permafrost detection (b).
2.4 ERT surveys and interpretations
The ERT method, which is based on the electrical differences between geological bodies (rock and soil), can be used to obtain the distribution of the measured resistance by artificially establishing an underground stable current field (Gao et al., 2019). In this method, current is emitted to the subsurface through electrodes, and the measured resistance is calculated from the potential difference between the electrodes (Zhou and Che, 2021) (Fig. 3a). The distribution of measured resistance is obtained by multiple automatic measurements between different electrodes; it is then used to invert the distribution of the ER and infer the geological elements. For permafrost regions, the ER variations can be attributed to changes in the unfrozen water content, assuming that other conditions (lithology, pore space, and electrode coupling) are constant (Hilbich et al., 2008). Since the ER of unfrozen water is significantly lower than that of frozen water (Tang et al., 2018), the ER variation in permafrost regions is indicative of the change in the water (ice) content of the formation. Thus, the permafrost distribution can be inferred from these changes.
Field measurements were conducted in August 2022 in the Beiluhe basin in the central QTP. In this study, the LFGMD-4 ERT instrument (manufactured by LingFeng Technology Inc., China) (http://www.cqlfgeo.com, last access: 13 May 2023) was used to perform the ER measurements in five transects (numbered ER1 to ER5, referring to Figs. 1 and 4). To analyze the interaction between the permafrost and thermokarst lake, the ER1 and ER2 transects (Fig. 1) were measured. To reveal the distribution of the shallow permafrost, the length and electrode spacing of ER1 were adjusted, and ER4 and 5 transects were obtained (Fig. 4c and d). The directions of ER4 and 5 were the same as that of ER1 and close to the end of ER1. To obtain the largely intact permafrost, the ER3 transect was measured far away from the thermokarst lake. The fixed electrode spacings and measuring line lengths for ER1, ER2, ER3, ER4, and ER5 were 10, 10, 10, 5, and 2 m and 790, 790, 790, 195, and 118 m (Table S1), respectively. The elevations of the electrode were also recorded for terrain correction. The industry-standard RES2DINV (Geotomo Software, 2011) was employed for the ERT inversion. For the inverse modeling, the smoothness-constrained least-squares method was applied (Loke and Barker, 1996).
2.5 Ground temperature monitoring for determining permafrost state
To reveal the thermal state of the thermokarst lake and the surrounding permafrost, the Northwest Institute of Eco-Environment and Resources, CAS, monitored the ground temperature at and around the bottom of the lakes BLH–A and B in 2006 and 2018, respectively. For lake BLH–A, monitoring sites were located at the center of the lake (LA), and 3.9 (E1) and 63.5 m (E2) from the lakeshore (Fig. 1c); the maximum monitoring depths were 58, 15, and 15 m (Table S2) (Lin et al., 2010), respectively. The ground temperatures were automatically monitored using thermistor chains (produced by Northwest Institute of Eco-Environment and Resources, CAS), with errors of less than 0.05 °C, and two data loggers (DT500, DataTaker., AUS) at 3 h intervals. For lake BLH–B, monitoring sites were set at the center of the lake (LB), and 5 (S1) and 30 m (S2) from the lakeshore (Fig. 1c), with maximum measured depths of 47.5, 5, and 5 m (Gao et al., 2021), respectively. The ground temperatures were automatically monitored using thermistor chains and a data logger (CR3000, Campbell Scientific Inc., USA) at 4 h intervals. However, only the temperature data of lake BLH–A from 9 January 2006 to 5 May 2016 and of lake BLH–B from 2 September 2018 to 26 October 2019 were collected.
Ground temperature monitoring is the most effective method to determine the state of permafrost. However, the depth of the borehole often cannot reach the lower limit of permafrost and the thickness of permafrost cannot be accurately determined due to constraints, such as limited budget, inconvenient transportation, harsh environment, and construction difficulty. Therefore, Eq. (1) was used to estimate the lower limit of permafrost (Zhao and Sheng, 2015).
Where H0 is the depth of the lower limit of permafrost; Tcp is the ground temperature at the selected depth (generally exceeds the annual variation depth); g and h are the ground temperature gradient and selected depth, respectively.
3.1 ERT geophysical imaging
The ER1 transect commences in the meadows located away from lake BLH–B, traversing a stream in the south of lake BLH–C before passing through a degraded meadow, and finally reaching the shore of lake BLH–B (Fig. 4a). This transect was designed to investigate the impact of lakes, streams, and degraded meadows on the permafrost. All the inversion iterations for ER1, 4, and 5 were less than 5, and the root-mean-square errors were less than 5.0 %. As shown in Fig. S1, the calculated and measured apparent resistivities were close, which met the basic inversion requirements. Generally, the maximum detection depth is to of the transect length (790 m). To ensure a balance between the sensitivity coverage range and numerical stability during the inversion process, the maximum detection depth determined by RES2DINV based on the electrode configuration and the maximum spacing used during data acquisition is 141 m. The ER of ER1 ranged from 0.7 to 7361 Ωm with characteristics of high and low values for the shallow and deep layers, respectively (Fig. 4b). Generally, the variation in ER was used to infer the interface between the permafrost and unfrozen zones. For example, a rapid decline in ER occurs when transitioning from permafrost to an unfrozen aquifer. The ER (at a distance of 356.0 m) decreased sharply from 7361 (at a depth of 18.0 m) to 25 Ωm (at a depth of 51.0 m) and decreased moderately to 10 Ωm (at a depth of 62.0 m), and then varied from 10.0 to 6.5 Ωm from a depth of 62.0 to 141.0 m (Fig. 4b). Similar ER changes can be found at other positions (e.g., at distances of 278, 525, 673 m, etc.); however, the interfaces were at different depths. Therefore, the formation along ER1 could be divided into unfrozen aquifers, an uncertain transitory interface between frozen and unfrozen sediments (Gao et al., 2019), and permafrost with limits of 10 and 25 Ωm based on the ER distribution. The maximum depth of the permafrost was located under meadows away from the lakes and streams at a depth of 84 m. Seven discontinuous high-ER zones existed within a depth of less than 40 m, which may be a frozen aquifuge with a very low water content. Although lake BLH-C was approximately 45 m from ER1, the lateral and vertical thermal erosion from the lake and stream thawed the deep (similar to that shown in Fig. 4f) and shallow permafrost, respectively. Therefore, it can be inferred that a through-talik had formed below lake BLH-C based on the ERT measurements of ER1 (Fig. 4b) and GTM in lakes BLH-A and BLH-B (Fig. 5a and b). The sub-permafrost water carrying heat preferentially flowed to zones with higher porosity and permeability, and continuously eroded the permafrost base, causing the permafrost base around the lake to lift significantly. The thermal convection process dominated the permafrost degradation, and its influence on the horizontal was limited; thus, the permafrost-free area increased with increasing depth. The permafrost closer to the lakes BLH–C and BLH–B thawed more sharply, suggesting that these lakes contributed to permafrost degradation. Under the influence of lake BLH–B, permafrost thickness between lakes BLH–B and BLH–C was approximately 35 m. Notably, the sub-permafrost aquifer was cut off by a band of permafrost with a low ice content or by a formation with a low water content at the right of lake BLH–C. Overall, the through-talik changed the groundwater cycle, which dramatically disturbed the permafrost structure.
ER4 and 5 transects depicted more detailed hydrogeologic information than ER1 within depths of 35 and 19 m (Fig. 4c and d), respectively. The ER of ER4 ranged from 9 to 1183 Ωm with characteristics of high values in the middle layer and low values in the shallow and deep layers (Fig. 4c). The maximum permafrost thickness along ER4 was inferred to be 30 m, which was close to the result along ER1. The thawed active layer increased the water content and decreased the ER of the shallow layer. The maximum upper limit depth of the permafrost was inferred to be 4.0 m. The heat from lake BLH–B and sub-permafrost water thawed the deep permafrost and reduced the ER. ER5 described the ER (ranging from 30 to 1568 Ωm) of the active layer (Fig. 4d), and the active layer thickness (ALT) was inferred to be in the range of 0.9–4.0 m. The ALT increased from the starting point to the ending point, which may have been affected by the topography-controlled flow of supra-permafrost water.
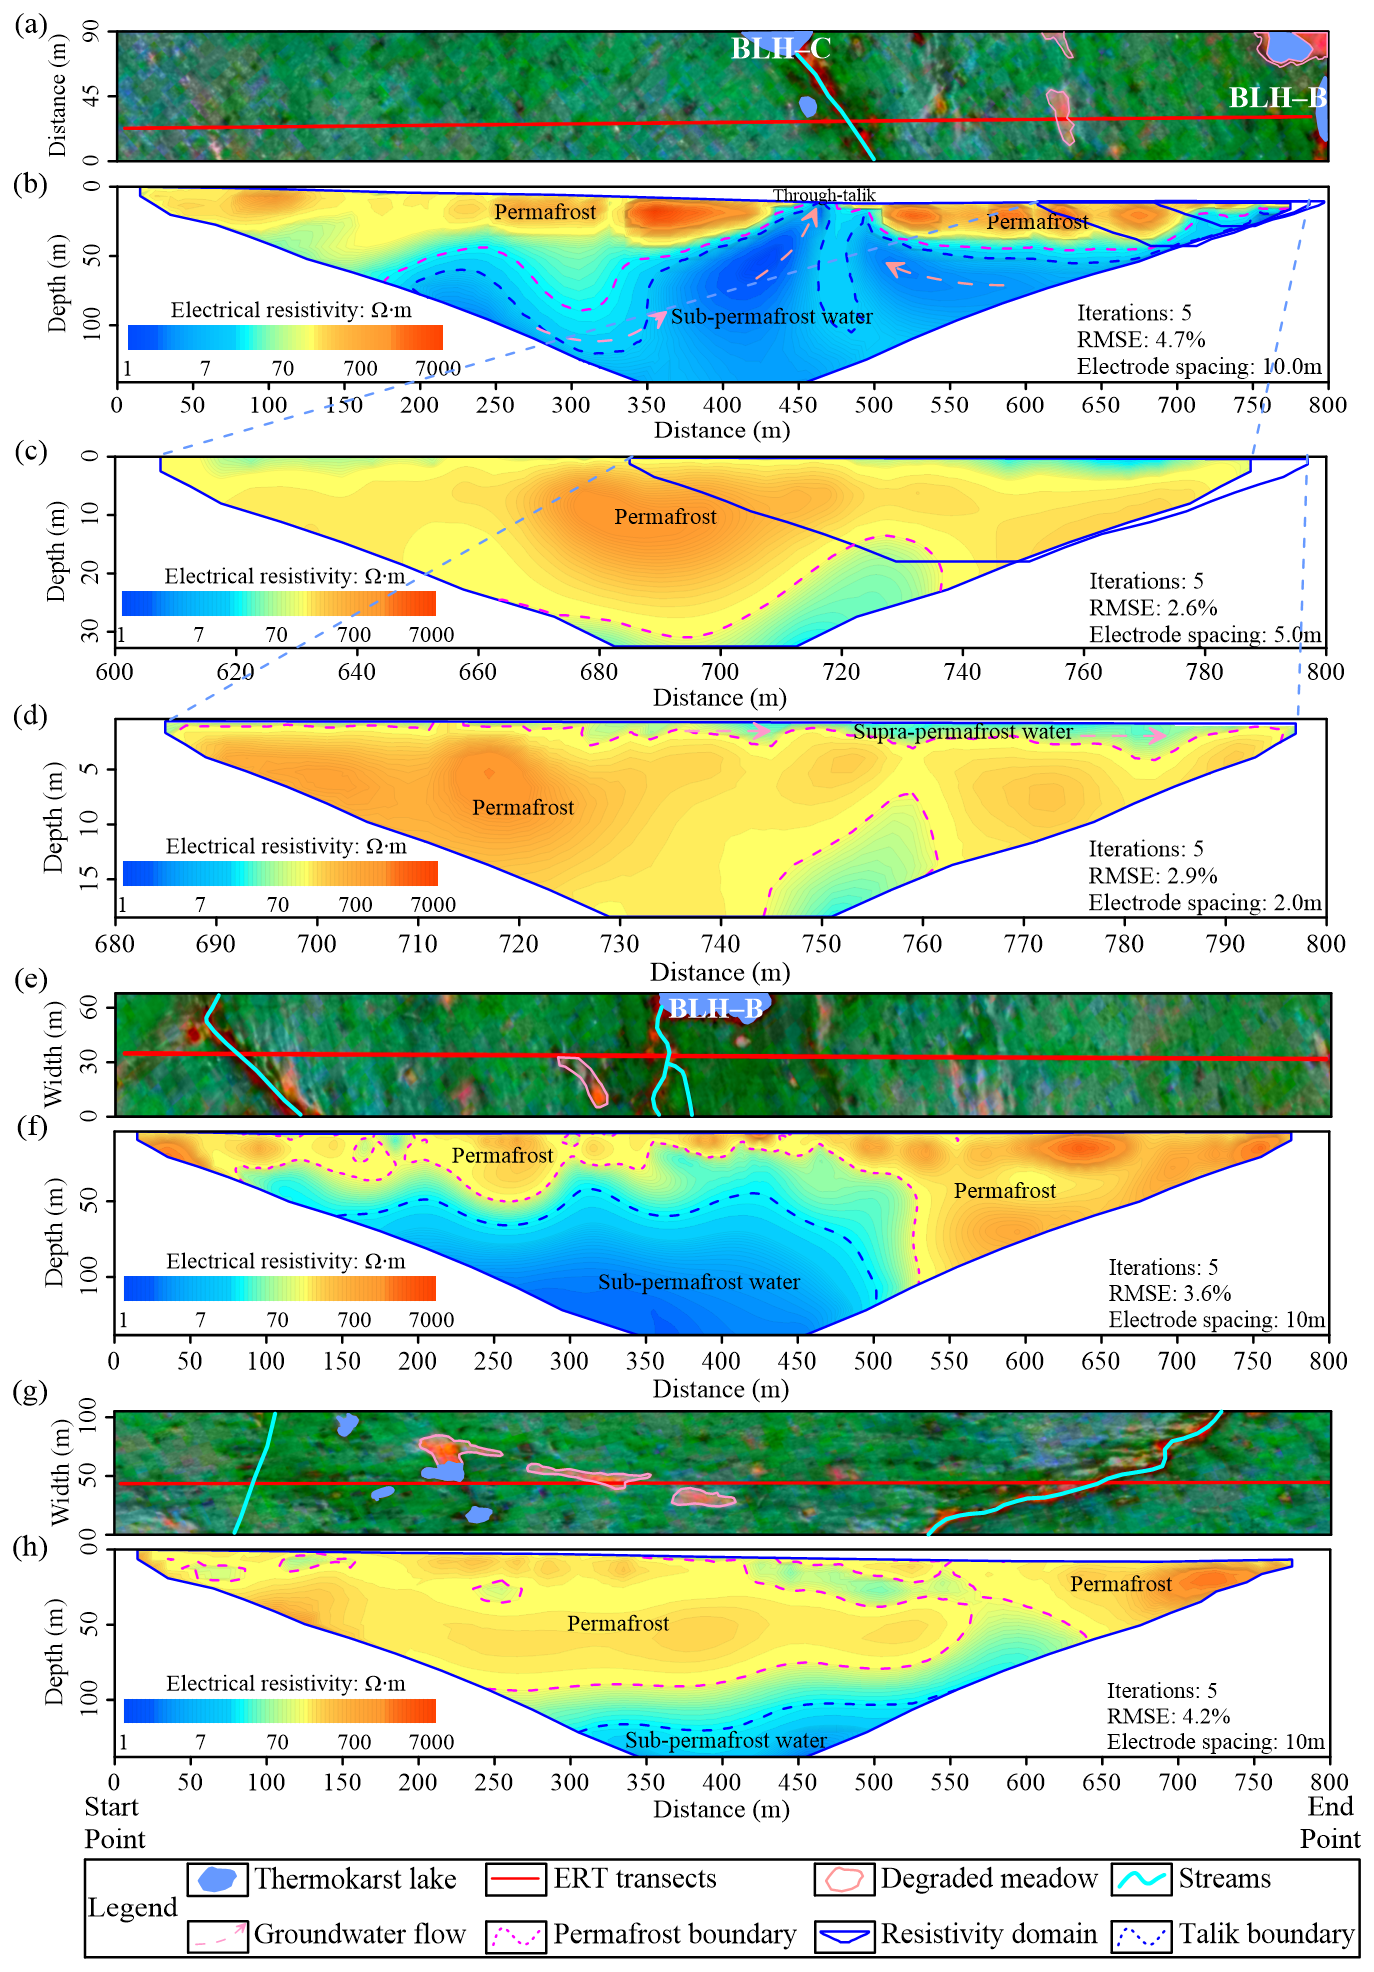
Figure 4Land cover along ER1 (a), ER2 (e), and ER3 (g) transects and inversion results of ER1 (b), ER4 (c), ER5 (d), ER2 (f), and ER3 (h). The ER domain (continuous blue line) is the boundary of the ER inversion results.
ER2 and 3 transects were employed to reveal the effects of lake BLH–B on permafrost (Fig. 4e and f) and the less disturbed permafrost located far away from the lakes (Fig. 4g and h), respectively. Based on the distribution of the ER, the maximum permafrost thickness along the ER2 transect was 100 m, located on the right side of lake BLH–B (Fig. 4f). This was due to the existence of a watershed between lakes BLH–A and B, where groundwater discharged to the two lakes separately, thus having a lesser impact on the permafrost. However, permafrost on the left side of lake BLH–B was less than 50 m thick and incomplete, which was close to the result revealed by ER1 and may have been affected by lakes, degraded meadows, groundwater, and streams. The ER of the deep layer (below 40 m) in the south of lake BLH–B was very low, suggesting that the deep permafrost was thawed by lake BLH–B. Permafrost in the southern part of lake BLH–B maintained a thickness range of 10–20 m, suggesting the preferential erosion of the permafrost base due to the lateral heat conduction and convection of the lake. For the ER3 transect, the maximum lower limit of the permafrost was inferred to be 93 m (Fig. 4h), which was close to those obtained from ER1 and 2. A sub-permafrost water aquifer was estimated to be present below a depth of 120 m and was relatively evenly distributed. A relatively low ER zone (in the distance range of 340–550 m) existed in the shallow layer, which may be the thawed permafrost affected by streams and degraded meadows. Notably, some low-ER zones existed in the interior of the permafrost (e.g., in the distance ranges of 34–85, 108–157, and 236–267 m), which may be attributed to lithology or measurement errors. Nevertheless, the ERT method could capture the permafrost and talik structures that were disturbed by the thermokarst lakes, groundwater, and streams.
3.2 Ground temperature below and around thermokarst lakes
Ground temperature from the thawed active layer to the ice-free zone below the permafrost base first decreased and then increased (Li et al., 2014), because the temperatures of the thawed active layer and ice-free zone (>0 °C) were greater than that of the permafrost (<0 °C). The ground temperatures below the bottom of lakes BLH–A and B were above 0 °C (Fig. 5a and b), indicating that the permafrost completely thawed within this depth. Moreover, the temperature below the lake BLH–B decreased first and then increased (Fig. 5b), suggesting the complete disappearance of the permafrost and the formation of a through-talik. Unlike lake BLH–B, the temperature below lake BLH–A continued to decrease with increasing depth (Fig. 5a), implying the possible existence of permafrost or a permafrost-free zone below the borehole bottom. To determine whether there was a through-talik below lake BLH–A, the thawing depth (depths of 0 °C) below lake BLH–A was estimated by using the geothermal gradient. The results showed the thawing depth was 73.38–87.21 m (Table S3). With the depth increased, the geothermal gradient decreased. Therefore, the thawing depth may be greater than 87.21 m. The lower limit depth of the permafrost estimated by the borehole temperature was 85 m (Lin et al., 2010). Similarly, a previous study also found that temperature observation data could well record the process of permafrost from its presence to its complete disappearance (Lin et al., 2016), suggesting that a through-talik had also formed below lake BLH–A (formed 800 years ago, determined by the 210Pb and 137Cs).
The mean annual air temperature (MAAT) at Beiluhe (BLH) (2002–2021), Wudaoliang (WDL) (1957–2021) (80 km from BLH), and Tuotuohe (TTH) (1957–2021) (45 km from BLH) meteorological stations continued to rise at rates of 0.040, 0.031, and 0.035 °C a−1, increasing by 0.70, 2.47, and 2.73 °C (Fig. 5g), respectively, which witnessed climate warming. Under the influence of climate warming, the temperature of the lake and the ground surface increased, causing the ground temperature to rise gradually (Fig. 5a, c, and e). From 2006 to 2016, the ground temperature contours continuously moved to greater depths (Fig. 5a, c, and e), indicating that permafrost around the lake gradually thawed. A comparison between Fig. 5c and e shows that the variation in ground temperature was more evident and intense because E1 was closer to lake BLH–A and experienced a stronger thermal erosion. From 2008 to 2016, the upper limit of the permafrost moved to a greater depth (Fig. 5c, e, and h), indicating an increase in the ALT. However, from 2006 to 2008, the MAAT at BLH decreased by 1.02 °C (WDL and TTH decreased by 1.36 and 1.27 °C, respectively) and the ALT decreased by 2.55 m (E1) and 2.0 m (E2), respectively, indicating that a brief cooling climate decreased the ALT. From 2006 to 2016, the maximum ALT (MALT) (defined by the 0 °C isotherm) values at E1 and E2 were in the ranges of 2.45–5.11 and 2.89–4.89 m, respectively. The MALT values at S1 and S2 were 2.45 and 2.76 m (Fig. 5d and f), respectively, from September 2018 to September 2019.
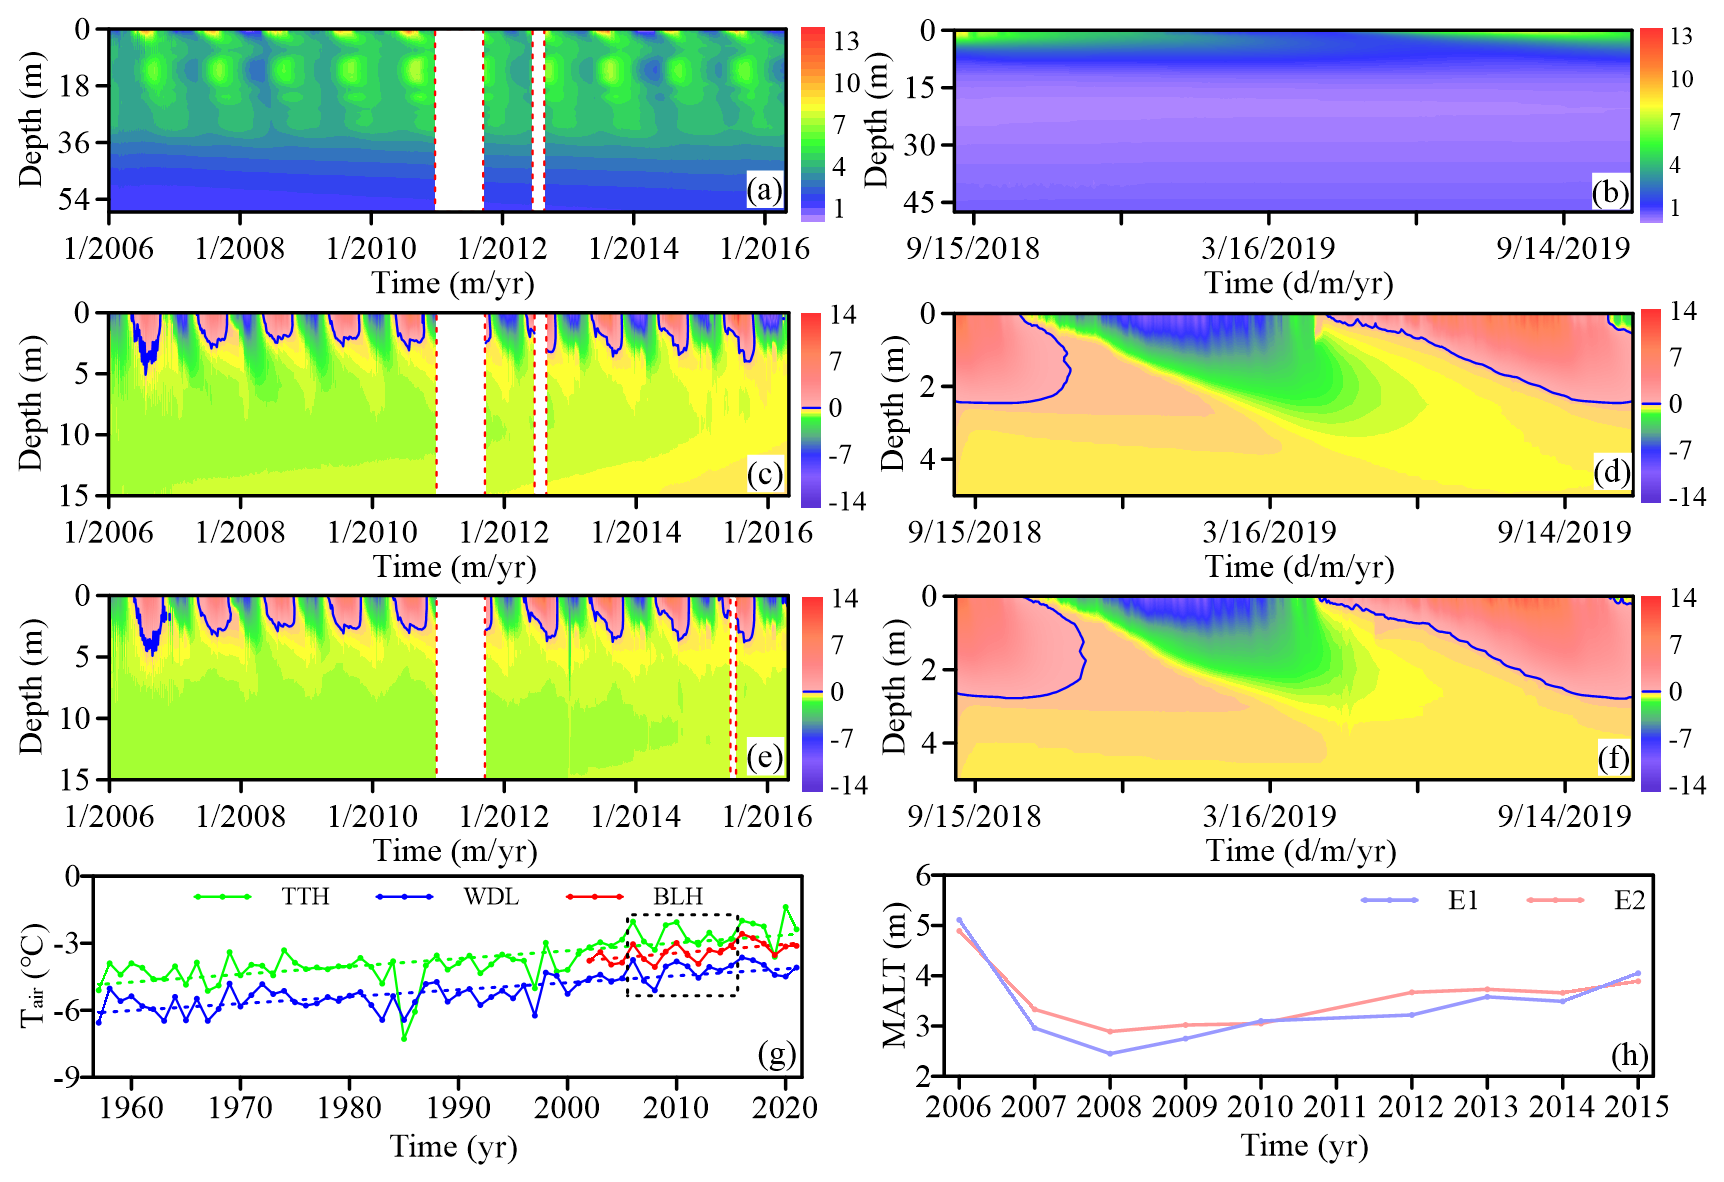
Figure 5Contour maps of the ground temperature in borehole LA (a), E1 (c), E2 (e), LB (b), S1 (d), and S2 (f), respectively; (g) air temperature in BLH (built in 2002), WDL, and TTH meteorological stations; (h) variation in MALT at E1 and E2, respectively; the areas marked by the red dashed lines (a, c, e), black dashed line (g) and blue line (c–f) represent missing data, air temperature during 2006–2015, and temperatures equal to 0 °C, respectively.
4.1 Comparison and unification of detection results
The maximum lower limit depth of the permafrost for ER3 was 93 m (Fig. 4h), which was close to those for ER1 (84 m) and ER2 (100 m). The ERT method exhibited a high resolution and accuracy for shallow layers (Li et al., 2021b), and its results were consistent with the influence of thermokarst lakes, streams, and groundwater on the permafrost. Therefore, the maximum lower limit depth of the permafrost (less disturbed) was in the range of 84–100 m. Based on the ER of ER1 (Fig. 4b) and GTM in lakes BLH-A and BLH-B (Fig. 5a and b), it can be inferred that a through-talik had formed below lake BLH-C. The temperature monitoring results of lake BLH–A indicated the formation of a through-talik below lake BLH–A (Fig. 5a) (Lin et al., 2017). Similarly, the ground temperatures (LB) and the results of ER2 jointly revealed the complete degradation of the permafrost below lake BLH–B, forming a through-talik (Figs. 4f and 5b). The ALT inferred from the ERT was in the range of 0.9–4.0 m (the average level was 2.45 m), which was close to the result of the borehole temperature (S1 and S2 in September 2019 were 2.45 and 2.76 m, respectively) (Xu et al., 2023). Overall, the hydrogeophysical investigations clarified the permafrost structure and the effect of thermokarst lakes and groundwater on permafrost.
4.2 Hydrogeophysical investigation of thermokarst lake–permafrost systems
In this study, ERT and GTM were combined to determine the permafrost and talik structures. Previous hydrogeophysical investigations of the QTP were typically performed in areas with a small permafrost thickness (e.g., in high plains, basins, and valleys in relatively lower altitude areas) or seasonally frozen soil. Permafrost bases were found at depths of less than 55 m (You et al., 2016; Gao et al., 2019; Yang et al., 2019; Zhou et al., 2022b), whereas in alpine and hilly regions, permafrost bases were typically found at depths greater than 60 m (the maximum value reached 130 m) (Cheng et al., 2019; Gao et al., 2019). Our study was conducted in the Beiluhe basin, which lies in the hinterland of the QTP, and we found that the maximum permafrost depth was in the range of 84–100 m. Furthermore, previous modeling (Li et al., 2021a; Ke et al., 2023b) and geothermal gradient analyses (Lin et al., 2010) conducted in our study area showed the existence of permafrost bases at depths of 91 and 85 m, respectively. Gao et al. (2021) found that the unfrozen water content within a depth of 80 m (maximum detection depth) of the lakeshore was low (less than 6 %), indicating a wide distribution of thick ice-rich permafrost. As discussed above, the results of the lower limit of the permafrost (permafrost thickness) in this study area are consistent with our findings. Further, previous modeling studies showed that thermokarst lakes accelerate permafrost degradation, alter groundwater circulation (Wellman et al., 2013; Li et al., 2014, 2021a), and stimulate the formation of sublake taliks (Creighton et al., 2018; Rangel et al., 2021). Similarly, our study confirmed that the thermokarst lakes continued to transfer heat to the surrounding permafrost, causing the permafrost to thaw and form through-taliks (Li et al., 2021a; Ke et al., 2022b).
The formation of through-taliks may cause ecological environmental problems, such as the loss of water resources, water quality deterioration, and vegetation degradation (Niu et al., 2018). Under the backdrop of global warming, the rapid talik expansion and accelerated permafrost degradation exacerbate these environmental problems (Ding et al., 2019). Our study fills the gap in the investigation of sublake taliks in the QTP and also confirms that thermokarst lakes thaw the surrounding permafrost and form through-taliks (Li et al., 2021a; Ke et al., 2022b). The application of GPMs in cryo-hydrogeology can help detect permafrost structures and taliks (Creighton et al., 2018; Rangel et al., 2021). The synergistic application of the ERT and GTM proved to be an effective and valuable approach for explaining the permafrost and sublake talik structures. The findings of hydrogeophysical investigations on permafrost thickness and the distribution of permafrost and sublake taliks can better guide models in exploring the variation in the symbiotic system of thermokarst lakes and permafrost given their widespread distribution in the Northern Hemisphere.
4.3 The effect of the thermokarst lake on permafrost structure
In regions without thermokarst lakes, permafrost dynamics are mainly controlled by air temperature, precipitation, and groundwater flow, which primarily influence the active layer; thus, the permafrost structure remains relatively stable (Fig. 4h) (Wu et al., 2022). However, the temperatures of thermokarst lakes are generally higher than those of the surrounding permafrost, thereby accelerating permafrost degradation (in 't Zandt et al., 2020). In the initial stage of thermokarst lake development, permafrost impedes groundwater flow, and heat transfer is dominated by thermal conduction (McKenzie et al., 2007). Under these conditions, thawing mainly occurs vertically, concentrated beneath the lake bottom and within limited areas around the lake (Fig. 4b) (Niu et al., 2018). As thawing progresses and permafrost below the lake bottom disappears, a through-talik forms, which restores groundwater flow pathways. Groundwater carrying heat preferentially migrates through highly permeable zones, resulting in progressive thawing at the base of the permafrost (Fig. 4b and f) (Li et al., 2021a). Our investigation revealed substantial thawing at the permafrost base near the lake, indicating that groundwater plays a critical role in the thawing process, which highlights the significance of thermal convection in permafrost degradation and confirms previous numerical simulation results (Rowland et al., 2011; Zipper et al., 2018). In particular, the permafrost in the lakeshore was disturbed by the groundwater and thermokarst lakes, causing the lakeshore to collapse (Niu et al., 2018), thus accelerating lake expansion. Furthermore, in regions with a thermokarst lake group, permafrost between adjacent lakes exhibited pronounced degradation, with a remarkable thinning of its thickness after through-talik formation (Fig. 4b, c, and d) (Ke et al., 2023b). In summary, thermokarst lakes disturb permafrost structure through two primary mechanisms: (1) direct thermal erosion caused by relatively warm lake water, and (2) alterations in groundwater circulation that enhance subsurface thaw (the main mechanism). These processes emphasize the combined influence of thermokarst lakes and groundwater on permafrost dynamics in permafrost regions. These findings enhance our understanding of the interaction mechanisms between thermokarst lakes and permafrost, and contribute to research on the evolution of thermokarst lakes and their associated ecological and environmental impacts in cold regions.
The findings of this study need to be seen in light of two major limitations. One is regarding the field investigation. Studies during the cold season and long-term investigations were not performed. Considering that the interaction between thermokarst lake and permafrost is long-term and complex, long-term monitoring will be significant to understanding the process of permafrost degradation and talik development. Moreover, only measured 5 ERT transects, which may be insufficient for the complex lake–permafrost systems such as the one studied. Additionally, no new drilling work or temperature measurements were conducted because of the difficulty and high cost of deep drilling. Another limitation concerns the ERT method. Defining a consistent ER threshold to delineate permafrost boundaries remains challenging, as ER is controlled by factors such as ice or water content and rock type. These limitations that need to be overcome increase the error and uncertainty in the results. Nevertheless, our results revealed the permafrost structure and talik morphologies and the effect of thermokarst lake on permafrost. In the future, more transects and borehole data can be considered for a comprehensive and long-term measurement of the permafrost and taliks. The development of more applicable calculated methods and convenient-to-use instruments with high precision, high resolution, and strong applicability can be another research direction.
It is widely accepted that thermokarst lakes disturb the permafrost. However, in situ detection of the permafrost structure (particularly thick permafrost) and sublake taliks in thermokarst lake regions has been limited. Therefore, in this study, the ERT and GTM were combined to interpret the permafrost structure and talik morphologies and analyze the effect of thermokarst lakes on permafrost. The ERT method determines the maximum lower limit depth of the permafrost to be in the range of 84–100 m, and the ALT was inferred to be in the range of 0.9–4.0 m. The results demonstrated that the permafrost below lakes BLH–A, B, and C had completely thawed and formed through-taliks. Furthermore, the permafrost degradation near the thermokarst lakes was more serious, confirming the contribution of thermokarst lakes to permafrost degradation. Sub- and supra-permafrost water continuously erode the base and top plate of the permafrost, thereby reducing its thickness and disturbing its structure. The results highlighted the contribution of thermal convection processes to permafrost degradation. The combination of ERT and GTM is a useful method for detecting permafrost and sublake talik in cold regions. Our findings can provide necessary constraints (such as permafrost and sublake talik distributions and permafrost thickness) for cryohydrogeologic models of the thermokarst lake–permafrost system to predict permafrost degradation and talik development under the backdrop of future climate warming.
| QTP | Qinghai-Tibet Plateau |
| GTM | ground temperature measurement |
| LIC | low ice content |
| GPM | geophysical prospecting method |
| ERT | electrical resistivity tomography |
| TEM | transient electromagnetic |
| GPR | ground penetrating radar |
| NMR | nuclear magnetic resonance |
| ER | electrical resistivity |
| MAGT | mean annual ground temperature |
| HIC | high ice content |
| ALT | active layer thickness |
| MALT | maximum active layer thickness |
| MAAT | mean annual air temperature |
| BLH | Beiluhe |
| WDL | Wudaoliang |
| TTH | Tuotuohe |
| R2 | coefficient of determination |
ERT data used in this study are available at https://doi.org/10.5281/zenodo.17164658 (Ke and Wang, 2025). The air temperature data are sourced from the National Tibetan Plateau Data Center (https://data.tpdc.ac.cn/, last access: 10 October 2023).
The supplement related to this article is available online at https://doi.org/10.5194/tc-19-4989-2025-supplement.
XK: Conceptualization, Methodology, Software, Investigation, Writing-original draft. WW: Supervision, Resources, Methodology, Review & Editing. FN: Resources, Methodology. ZG: Resources, Methodology. WH: Data curation & Interpretation. HC: Data curation & Interpretation.
The contact author has declared that none of the authors has any competing interests.
Publisher's note: Copernicus Publications remains neutral with regard to jurisdictional claims made in the text, published maps, institutional affiliations, or any other geographical representation in this paper. While Copernicus Publications makes every effort to include appropriate place names, the final responsibility lies with the authors. Views expressed in the text are those of the authors and do not necessarily reflect the views of the publisher.
This article is part of the special issue “Emerging geophysical methods for permafrost investigations: recent advances in permafrost detecting, characterizing, and monitoring”. It is not associated with a conference.
We are grateful to Beiluhe Observation and Research Station on Frozen Soil Engineering and Environment in Qinghai–Tibet Plateau for providing the experimental sites and relevant support. We thank senior engineer Wentao Liu from the College of Geological Engineering and Geomatics at Chang'an University for guidance regarding the geophysical prospecting method. Additionally, we are grateful to all the reviewers and editors who participated in the review as well as to MJEditor (http://www.mjeditor.com, last access: 5 February 2025) for its linguistic assistance during the preparation of this manuscript.
This research was funded by the Postdoctoral Fellowship Program of CPSF (grant no. GZC20252062), the Fundamental Research Funds for the Central Universities, CHD, Key Laboratory of Eco-hydrology and Water Security in Arid and Semi-arid Regions of Ministry of Water Resources, Chang'an University Open Fund Funding (grant no. 300102295504), the National Natural Science Foundation of China (grant no. 41730640), and the Talent Support Program of Hongliu Youqing in Lanzhou University of Technology.
This paper was edited by Sebastian Uhlemann and reviewed by three anonymous referees.
Binley, A., Hubbard, S. S., Huisman, J. A., Revil, A., Robinson, D. A., Singha, K., and Slater, L. D.: The emergence of hydrogeophysics for improved understanding of subsurface processes over multiple scales, Water Resour. Res., 51, 3837–3866, https://doi.org/10.1002/2015wr017016, 2015.
Bouchard, F., Francus, P., Pienitz, R., and Laurion, I.: Sedimentology and geochemistry of thermokarst ponds in discontinuous permafrost, subarctic Quebec, Canada, J. Geophys. Res.-Biogeo., 116, https://doi.org/10.1029/2011jg001883, 2011.
Briggs, M. A., Campbell, S., Nolan, J., Walvoord, M. A., Ntarlagiannis, D., Day-Lewis, F. D., and Lane, J. W.: Surface geophysical methods for characterising frozen ground in transitional permafrost landscapes, Permafr. Periglac. Process., 28, 52–65, https://doi.org/10.1002/ppp.1893, 2017.
Cheng, G. D., Zhao, L., Li, R., Wu, X. D., Sheng, Y., Hu, G. J., Zou, D. F., Jin, H. J., Li, X., and Wu, Q. B.: Characteristic, changes and impacts of permafrost on Qinghai-Tibet Plateau, Chin. Sci. Bull. Chin., 64, 2783–2795, https://doi.org/10.1360/tb-2019-0191, 2019.
Creighton, A. L., Parsekian, A. D., Angelopoulos, M., Jones, B. M., Bondurant, A., Engram, M., Lenz, J., Overduin, P. P., Grosse, G., Babcock, E., and Arp, C. D.: Transient electromagnetic surveys for the determination of talik depth and geometry beneath thermokarst lakes, J. Geophys. Res.-Solid Earth, 123, 9310–9323, https://doi.org/10.1029/2018jb016121, 2018.
Ding, Y. J., Zhang, S. Q., Zhao, L., Li, Z. Q., and Kang, S. C.: Global warming weakening the inherent stability of glaciers and permafrost, Sci. Bull., 64, 245–253, https://doi.org/10.1016/j.scib.2018.12.028, 2019.
Gao, B. and Coon, E. T.: Evaluating simplifications of subsurface process representations for field-scale permafrost hydrology models, The Cryosphere, 16, 4141–4162, https://doi.org/10.5194/tc-16-4141-2022, 2022.
Gao, S. H., Jin, H. J., Bense, V. F., Wang, X. B., and Chai, X. J.: Application of electrical resistivity tomography for delineating permafrost hydrogeology in the headwater area of Yellow River on Qinghai-Tibet Plateau, SW, Hydrogeol. J., 27, 1725–1737, https://doi.org/10.1007/s10040-019-01942-z, 2019.
Gao, Z. Y., Niu, F. J., Wang, Y. B., Lin, Z. J., and Wang, W.: Suprapermafrost groundwater flow and exchange around a thermokarst lake on the Qinghai-Tibet Plateau, China, J. Hydrol., 593, 125882, https://doi.org/10.1016/j.jhydrol.2020.125882, 2021.
Guo, L., Yu, Q. H., You, Y. H., Wang, X. B., Yuan, C., and Li, X. N.: Evaluation on the influences of lakes on the thermal regimes of nearby tower foundations along the Qinghai-Tibet Power Transmission Line, Appl. Therm. Eng., 102, 829–840, https://doi.org/10.1016/j.applthermaleng.2016.03.135, 2016.
Hilbich, C., Hauck, C., Hoelzle, M., Scherler, M., Schudel, L., Vdlksch, I., Miihll, D. V., and Mausbacher, R.: Monitoring mountain permafrost evolution using electrical resistivity tomography: A 7-year study of seasonal, annual, and long-term variations at Schilthorn, Swiss Alps, J. Geophys. Res.-Earth Surf., 113, https://doi.org/10.1029/2007jf000799, 2008.
Hornum, M. T., Betlem, P., and Hodson, A.: Groundwater flow through continuous permafrost along geological boundary revealed by electrical resistivity tomography, Geophys. Res. Lett., 48, e2021GL092757, https://doi.org/10.1029/2021gl092757, 2021.
in 't Zandt, M. H., Liebner, S., and Welte, C. U.: Roles of Thermokarst Lakes in a Warming World, Trends in Microbiology, 28, 769–779, https://doi.org/10.1016/j.tim.2020.04.002, 2020.
Ke, X. and Wang, W.: ERT data, Zenodo [data set], https://doi.org/10.5281/zenodo.17164658, 2025.
Ke, X. M., Li, Y. J., Wang, W., Niu, F. J., and Gao, Z. Y.: Hydrogeochemical characteristics and processes of thermokarst lake and groundwater during the melting of the active layer in a permafrost region of the Qinghai-Tibet Plateau, China, Sci. Total Environ., 851, 158183, https://doi.org/10.1016/j.scitotenv.2022.158183, 2022a.
Ke, X. M., Ou, A. F., Wang, W., Niu, F. J., and Gao, Z. Y.: Interaction of thermokarst lake and permafrost in Qinghai-Tibet Plateau, Adv. Water Sci., 33, 542–552, https://doi.org/10.14042/j.cnki.32.1309.2022.04.003, 2022b.
Ke, X. M., Liu, P., Wang, W., Li, J. L., Niu, F. J., Gao, Z. Y., and Kong, D. T.: Spatial variability of the vertical saturated hydraulic conductivity of sediments around typical thermokarst lakes, Geoderma, 429, 116230, https://doi.org/10.1016/j.geoderma.2022.116230, 2023a.
Ke, X. M., Wang, W., Huang, W. F., Niu, F. J., and Gao, Z. Y.: Thermokarst lakes group accelerates permafrost degradation in the Qinghai–Tibet Plateau, China: A modeling study, J. Hydrol., 625, 130072, https://doi.org/10.1016/j.jhydrol.2023.130072, 2023b.
Keating, K., Binley, A., Bense, V., Van Dam, R. L., and Christiansen, H. H.: Combined geophysical measurements provide evidence for unfrozen water in permafrost in the Adventdalen valley in Svalbard, Geophys. Res. Lett., 45, 7606–7614, https://doi.org/10.1029/2017gl076508, 2018.
Lamontagne-Halle, P., McKenzie, J. M., Kurylyk, B. L., Molson, J., and Lyon, L. N.: Guidelines for cold-regions groundwater numerical modelling, WIREs Water, 7, e1467, https://doi.org/10.1002/wat2.1467, 2020.
Li, J. L., Wang, W., Wang, D. H., Li, J. Q., and Dong, J.: Hydrochemical and stable isotope characteristics of lake water and groundwater in the Beiluhe Basin, Qinghai-Tibet Plateau, Water, 12, 2269, https://doi.org/10.3390/w12082269, 2020.
Li, J. L., Wang, W., Ke, X. M., Li, J. H., Yu, Y. T., Gao, Z. Y., and Niu, F. J.: Impacts of groundwater flow on the evolution of a thermokarst lake in the permafrost-dominated region on the Qinghai-Tibet plateau, Hydrol. Proces., 35, e14443, https://doi.org/10.1002/hyp.14443, 2021a.
Li, M., Zeng, Y., Lubczynski, M. W., Roy, J., Yu, L., Qian, H., Li, Z., Chen, J., Han, L., Zheng, H., Veldkamp, T., Schoorl, J. M., Hendricks Franssen, H.-J., Hou, K., Zhang, Q., Xu, P., Li, F., Lu, K., Li, Y., and Su, Z.: A first investigation of hydrogeology and hydrogeophysics of the Maqu catchment in the Yellow River source region, Earth Syst. Sci. Data, 13, 4727–4757, https://doi.org/10.5194/essd-13-4727-2021, 2021b.
Li, S. Y., Zhan, H. B., Lai, Y. M., Sun, Z. Z., and Pei, W. S.: The coupled moisture-heat process of permafrost around a thermokarst pond in Qinghai-Tibet Plateau under global warming, J. Geophys. Res.-Earth Surface, 119, 836–853, https://doi.org/10.1002/2013jf002930, 2014.
Lin, Z. J., Niu, F. J., Ge, J. J., Wang, P., and Dong, Y. H.: Variation characteristics of the thawing lake in permafrost regions of the Tibetan Plateau and their influence on the thermal state of permafrost, J. Glaciol. Geocryol., 32, 341–350, 2010.
Lin, Z. J., Luo, J., and Niu, F. J.: Development of a thermokarst lake and its thermal effects on permafrost over nearly 10 yr in the Beiluhe Basin, Qinghai-Tibet Plateau, Geosphere, 12, 632–643, https://doi.org/10.1130/ges01194.1, 2016.
Lin, Z. J., Niu, F. J., Fang, J. H., Luo, J., and Yin, G. A.: Interannual variations in the hydrothermal regime around a thermokarst lake in Beiluhe, Qinghai-Tibet Plateau, Geomorphology, 276, 16–26, https://doi.org/10.1016/j.geomorph.2016.09.035, 2017.
Liu, G. M., Wu, T. H., Hu, G. J., Wu, X. D., and Li, W. P.: Permafrost existence is closely associated with soil organic matter preservation: Evidence from relationships among environmental factors and soil carbon in a permafrost boundary area, CATENA, 196, 104894, https://doi.org/10.1016/j.catena.2020.104894, 2021.
Liu, H. M., Cheng, Y., Liu, Z. F., Li, Q. R., Zhang, H. Y., and Wei, W.: Conflict or coordination? The spatiotemporal relationship between humans and nature on the Qinghai-Tibet plateau, Earths Future, 11, e2022EF003452, https://doi.org/10.1029/2022ef003452, 2023a.
Liu, Z. Y., Wang, S. W., Jiang, Z. Y., Dong, Y. H., Chen, J. B., and Cui, F. Q.: Study on the coupling thermal effect of thermokarst lake and high sunny slope on permafrost embankment, Transp. Geotech., 41, 101024, https://doi.org/10.1016/j.trgeo.2023.101024, 2023b.
Loke, M. H. and Barker, R. D.: Practical techniques for 3D resistivity surveys and data inversion, Geophys. Prospect., 44, 499–523, https://doi.org/10.1111/j.1365-2478.1996.tb00162.x, 1996.
Luo, J., Niu, F. J., Lin, Z. J., Liu, M. H., Yin, G. A., and Gao, Z. Y.: Abrupt increase in thermokarst lakes on the central Tibetan Plateau over the last 50 years, CATENA, 217, 106497, https://doi.org/10.1016/j.catena.2022.106497, 2022.
McKenzie, J. M., Voss, C. I., and Siegel, D. I.: Groundwater flow with energy transport and water–ice phase change: Numerical simulations, benchmarks, and application to freezing in peat bogs, Adv. Water Resour., 30, 966–983, https://doi.org/10.1016/j.advwatres.2006.08.008, 2007.
Niu, F. J., Wang, W., Lin, Z. J., and Luo, J.: Study on environmental and hydrological effects of thermokarst lakes in permafrost regions of the Qinghai-Tibet Plateau, Adv. Earth Sci., 33, 335–342, https://doi.org/10.11867/j.issn.1001-8166.2018.04.0335, 2018.
Noetzli, J., Arenson, L. U., Bast, A., Beutel, J., Delaloye, R., Farinotti, D., Gruber, S., Gubler, H., Haeberli, W., Hasler, A., Hauck, C., Hiller, M., Hoelzle, M., Lambiel, C., Pellet, C., Springman, S. M., Vonder Muehll, D., and Phillips, M.: Best practice for measuring permafrost temperature in boreholes based on the experience in the Swiss Alps, Front. Earth Sci., 9, 607875, https://doi.org/10.3389/feart.2021.607875, 2021.
Obu, J.: How much of the earth's surface is underlain by permafrost?, J. Geophys. Res.-Earth Surf., 126, e2021JF006123, https://doi.org/10.1029/2021jf006123, 2021.
Peng, E. X., Sheng, Y., Hu, X. Y., Wu, J. C., and Cao, W.: Thermal effect of thermokarst lake on the permafrost under embankment, Adv. Clim. Chang. Res., 12, 76–82, https://doi.org/10.1016/j.accre.2020.10.002, 2021.
Ran, Y., Li, X., Cheng, G., Che, J., Aalto, J., Karjalainen, O., Hjort, J., Luoto, M., Jin, H., Obu, J., Hori, M., Yu, Q., and Chang, X.: High-resolution datasets of permafrost thermal state and hydrothermal zonation in the Northern Hemisphere, National Tibetan Plateau/Third Pole Environment Data Center [data set], https://doi.org/10.11888/Geocry.tpdc.271190, 2021.
Rangel, R. C., Parsekian, A. D., Farquharson, L. M., Jones, B. M., Ohara, N., Creighton, A. L., Gaglioti, B. V., Kanevskiy, M., Breen, A. L., Bergstedt, H., Romanovsky, V. E., and Hinkel, K. M.: Geophysical observations of taliks below drained lake basins on the Arctic Coastal Plain of Alaska, J. Geophys. Res.-Solid Earth, 126, e2020JB020889, https://doi.org/10.1029/2020jb020889, 2021.
Rowland, J. C., Travis, B. J., and Wilson, C. J.: The role of advective heat transport in talik development beneath lakes and ponds in discontinuous permafrost, Geophys. Res. Lett., 38, https://doi.org/10.1029/2011gl048497, 2011.
Shur, Y., Jorgenson, M. T., and Kanevskiy, M. Z.: Permafrost, in: Encyclopedia of Snow, Ice and Glaciers, edited by: Singh, V. P., Singh, P., and Haritashya, U. K., Springer Netherlands, Dordrecht, 2011.
Sjöberg, Y., Marklund, P., Pettersson, R., and Lyon, S. W.: Geophysical mapping of palsa peatland permafrost, The Cryosphere, 9, 465–478, https://doi.org/10.5194/tc-9-465-2015, 2015.
Sun, W., Cao, B., Hao, J., Wang, S., Clow, G. D., Sun, Y., Fan, C., Zhao, W., Peng, X., Yao, Y., and Zhang, T.: Two-dimensional simulation of island permafrost degradation in Northeastern Tibetan Plateau, Geoderma, 430, 116330, https://doi.org/10.1016/j.geoderma.2023.116330, 2023.
Tang, L. Y., Wang, K., Jin, L., Yang, G. S., Jia, H. L., and Taoum, A.: A resistivity model for testing unfrozen water content of frozen soil, Cold Reg. Sci. Technol., 153, 55–63, https://doi.org/10.1016/j.coldregions.2018.05.003, 2018.
Terry, N., Grunewald, E., Briggs, M., Gooseff, M., Huryn, A. D., Kass, M. A., Tape, K. D., Hendrickson, P., and Lane, J. W.: Seasonal subsurface thaw dynamics of an aufeis feature inferred from geophysical methods, J. Geophys. Res.-Earth Surf., 125, e2019JF005345, https://doi.org/10.1029/2019jf005345, 2020.
Uhlemann, S., Shirley, I., Wielandt, S., Ulrich, C., Wang, C., Fiolleau, S., Peterson, J., Lamb, J., Thaler, E., Rowland, J., Hubbard, S. S., and Dafflon, B.: Estimating permafrost distribution using co-located temperature and electrical resistivity measurements, Geophys. Res. Lett., 50, e2023GL103987, https://doi.org/10.1029/2023gl103987, 2023.
Veremeeva, A., Nitze, I., Gunther, F., Grosse, G., and Rivkina, E.: Geomorphological and climatic drivers of thermokarst lake area increase trend (1999–2018) in the Kolyma Lowland Yedoma region, North-Eastern Siberia, Remote Sens., 13, 178, https://doi.org/10.3390/rs13020178, 2021.
Wang, W. H., Wu, T. H., Zhao, L., Li, R., Xie, C. W., Qiao, Y. P., Zhang, H. W., Zhu, X. F., Yang, S. H., Qin, Y. H., and Hao, J. M.: Hydrochemical characteristics of ground ice in permafrost regions of the Qinghai-Tibet Plateau, Sci. Total Environ., 626, 366–376, https://doi.org/10.1016/j.scitotenv.2018.01.097, 2018.
Wellman, T. P., Voss, C. I., and Walvoord, M. A.: Impacts of climate, lake size, and supra- and sub-permafrost groundwater flow on lake-talik evolution, Yukon Flats, Alaska (USA), Hydrogeol. J., 21, 281–298, https://doi.org/10.1007/s10040-012-0941-4, 2013.
Wen, Z., Zhelezniak, M., Wang, D. Y., Ma, W., Wu, Q. B., Yang, Z., Zhirkov, A., and Gao, Q.: Thermal interaction between a thermokarst lake and a nearby embankment in permafrost regions, Cold Reg. Sci. Technol., 155, 214–224, https://doi.org/10.1016/j.coldregions.2018.08.010, 2018.
Wu, Q. B., Zhang, T. J., and Liu, Y. Z.: Permafrost temperatures and thickness on the Qinghai-Tibet Plateau, Glob. Planet. Change, 72, 32–38, https://doi.org/10.1016/j.gloplacha.2010.03.001, 2010.
Wu, T., Xie, C., Zhu, X., Chen, J., Wang, W., Li, R., Wen, A., Wang, D., Lou, P., Shang, C., La, Y., Wei, X., Ma, X., Qiao, Y., Wu, X., Pang, Q., and Hu, G.: Permafrost, active layer, and meteorological data (2010–2020) at the Mahan Mountain relict permafrost site of northeastern Qinghai–Tibet Plateau, Earth Syst. Sci. Data, 14, 1257–1269, https://doi.org/10.5194/essd-14-1257-2022, 2022.
Xu, Z. D., Jiang, L. M., Guo, R., Huang, R. G., Zhou, Z. W., Niu, F. J., and Jiao, Z. P.: Interaction of permafrost degradation and thermokarst lakes in the Qinghai-Tibet Plateau. Geomorphology, 425, https://doi.org/10.1016/j.geomorph.2023.108582, 2023.
Yang, G. Q., Xie, C. W., Wang, W., Du, E., Liu, W. H., Zhang, Y. X., and Ni, J.: Study on TEM sounding permafrost with shallow bedrock, J. Glaciol. Geocryol., 41, 1067–1077, https://doi.org/10.7522/j.issn.1000-0240.2019.0328, 2019.
Yao, T. D., Thompson, L. G., Mosbrugger, V., Zhang, F., Ma, Y. M., Luo, T. X., Xu, B. Q., Yang, X. X., Joswiak, D. R., Wang, W. C., Joswiak, M. E., Devkota, L. P., Tayal, S., Jilani, R., and Fayziev, R.: Third Pole Environment (TPE), Environ. Dev., 3, 52–64, https://doi.org/10.1016/j.envdev.2012.04.002, 2012.
Yin, G. A., Niu, F. J., Lin, Z. J., Luo, J., and Liu, M. H.: Effects of local factors and climate on permafrost conditions and distribution in Beiluhe basin, Qinghai-Tibet Plateau, China, Sci. Total Environ., 581, 472–485, https://doi.org/10.1016/j.scitotenv.2016.12.155, 2017.
Yoshikawa, K. and Hinzman, L. D.: Shrinking thermokarst ponds and groundwater dynamics in discontinuous permafrost near Council, Alaska, Permafr. Periglac. Process., 14, 151–160, https://doi.org/10.1002/ppp.451, 2003.
Yoshikawa, K., Leuschen, C., Ikeda, A., Harada, K., Gogineni, P., Hoekstra, P., Hinzman, L., Sawada, Y., and Matsuoka, N.: Comparison of geophysical investigations for detection of massive ground ice (pingo ice), J. Geophys. Res.-Planets, 111, https://doi.org/10.1029/2005JE002573, 2006.
You, Y. H., Yang, M. B., Yu, Q. H., Wang, X. B., Li, X. N., and Yue, Y. Y.: Investigation of an icing near a tower foundation along the Qinghai-Tibet Power Transmission Line, Cold Reg. Sci. Technol., 121, 250–257, https://doi.org/10.1016/j.coldregions.2015.05.005, 2016.
You, Y. H., Yu, Q. H., Pan, X. C., Wang, X. B., and Guo, L.: Geophysical imaging of permafrost and talik configuration beneath a thermokarst lake, Permafr. Periglac. Process., 28, 470–476, https://doi.org/10.1002/ppp.1938, 2017.
Zhang, G. F., Nan, Z. T., Hu, N., Yin, Z. Y., Zhao, L., Cheng, G. D., and Mu, C. C.: Qinghai-Tibet Plateau Permafrost at Risk in the Late 21st Century, Earths Future, 10, https://doi.org/10.1029/2022ef002652, 2022.
Zhang, G. F., Mu, C. C., Nan, Z. T., Wu, X. D., Cheng, G. D.: Elevation dependency of future degradation of permafrost over the Qinghai-Tibet Plateau, Environ. Res. Lett., 18, https://doi.org/10.1088/1748-9326/ace0d1, 2023a.
Zhang, Y. X., Zhao, L., Xie, C. W., Wu, T. H., Wu, X. D., Yang, G. Q., Yang, S. H., Wang, W., Pang, Q. Q., Liu, G. Y., Zou, D. F., Hu, G. J., Wang, C., and Liu, S. B.: Permafrost characteristics and potential influencing factors in the lake regions of Hoh Xil, Qinghai-Tibet Plateau, Geoderma, 437, 116572, https://doi.org/10.1016/j.geoderma.2023.116572, 2023b.
Zhao, L.: A new map of permafrost distribution on the Tibetan Plateau (2017), National Tibetan Plateau/Third Pole Environment Data Center [data set], https://doi.org/10.11888/Geocry.tpdc.270468, 2019.
Zhao, L. and Sheng, Y. (Eds.): Permafrost Survey Manual, Science Press, Beijing, ISBN 9787030456113, 2015 (in Chinese).
Zhou, F. J., Yao, M. M., Fan, X. W., Yin, G. A., Meng, X. L., and Lin, Z. J.: Evidence of warming from long-term records of climate and permafrost in the hinterland of the Qinghai-Tibet plateau, Front. Environ. Sci., 10, 836085, https://doi.org/10.3389/fenvs.2022.836085, 2022a.
Zhou, H. X. and Che, A. L.: Geomaterial segmentation method using multidimensional frequency analysis based on electrical resistivity tomography, Eng. Geol., 284, 105925, https://doi.org/10.1016/j.enggeo.2020.105925, 2021.
Zhou, H. Y., Liu, G. Y., Yang, B., Zou, D. F., Zhao, L., Du, E. J., Tan, C. H., Chen, W., Yang, C. L., Wen, L., Duoji, W., Zhang, X. X., Xiao, Y., Hu, G. J., Li, Z. B., Xie, C. W., Wang, L. X., and Liu, S. B.: Characteristics of permafrost in Tuotuo River source area of upper Yangtze Rive, J. Glaciol. Geocryol., 44, 69–82, https://doi.org/10.7522/j.issn.1000-0240.2022.0020, 2022b.
Zipper, S. C., Lamontagne-Halle, P., McKenzie, J. M., and Rocha, A. V.: Groundwater controls on postfire permafrost thaw: Water and energy balance effects, J. Geophys. Res.-Earth Surf., 123, 2677–2694, https://doi.org/10.1029/2018jf004611, 2018.