the Creative Commons Attribution 4.0 License.
the Creative Commons Attribution 4.0 License.
 | 23 Oct 2025
Similarities between sea ice area variations and satellite-derived terrestrial biosphere and cryosphere parameters across the Arctic
Rodrigue Tanguy
Helena Bergstedt
Clemens von Baeckmann
Hans Tømmervik
Marc Macias-Fauria
Juha Lemmetyinen
Kimmo Rautiainen
Chiara Gruber
Bruce C. Forbes
Satellite time series availability for the Arctic Ocean and adjacent land areas allows cross-comparisons for cryosphere vs. vegetation parameters. Previous studies focused on correlation analyses between vegetation indices (time-integrated normalized difference vegetation index (TI-NDVI) and maximum normalized difference vegetation index (MaxNDVI)) of tundra regions and sea ice extent for selected months. We have refined these analyses through the consideration of distinct sea ice basins and all months and through an extension to south of the treeline, and we have included cryosphere essential climate variables such as snow water equivalent (SWE; March as proxy for annual maximum) and mean annual ground temperature (MAGT) in permafrost areas. The focus was on 2000–2019, reflecting data availability. As a first step, we derived trends. Changes across all the different parameters could be specifically determined for eastern Siberia. Then, time series were de-trended and correlations determined. Linkages between sea ice area (SIA) and normalized difference vegetation index (NDVI) across tundra regions were confirmed, where lower sea ice extent coincides with higher NDVI. The regional extension beyond the treeline revealed linkages for northern European Russia and partially over northern Scandinavia. Differences compared to previous studies ending in 2008 were found for the Kara Sea region and adjacent land area, indicating recent changes. In the case of MAGT, high significant correlations were found for more distant sea ice basins than for the NDVI derivatives, indicating influences of large-scale atmospheric circulation patterns. Negative and positive significant correlations were found for March SWE depending on the SIA month and region. Also, months other than September (sea ice extent minimum) were found to have high correlations vs. land-based variables, with distinct differences across sea ice basins. The fraction of data points with significant correlations north of 60° N was higher for SWE and MAGT than for the NDVI derivatives. Fractions for SWE were higher for Eurasia than northern America. Autumn (incl. October and November) and mid-winter (incl. February, March) were most relevant for both investigated cryosphere-related parameters, MAGT and SWE. Although similar patterns could be found for TI-NDVI and MaxNDVI, a higher proportion of significant correlations was observed for TI-NDVI. The datasets provide a baseline for future studies on common drivers of essential climate parameters and causative effects across the Arctic.
- Article
(30957 KB) - Full-text XML
- BibTeX
- EndNote


Climate change across the Arctic specifically affects the cryosphere, including sea ice, ice caps and glaciers, snow, and permafrost (IPCC, 2019). Feedback mechanisms and associated tipping systems of the global climate have been identified (Lenton et al., 2008; Armstrong McKay et al., 2022), and the potential of remote sensing for their monitoring has been discussed (Lenton et al., 2024). Recent sea ice extent and ice sheet mass balance decline can be well observed through the use of satellites (Spreen et al., 2008; Druckenmiller et al., 2021). Permafrost monitoring from space is limited but can be achieved through the use of land surface temperature (LST) in permafrost models (Westermann et al., 2017). Similarities in trends and variations have so far been identified between permafrost and ice sheets (Sasgen et al., 2024) and between permafrost and sea ice extent (Bartsch et al., 2023b, 2024). Sea ice variations have also been linked to vegetation patterns across the Arctic (e.g., Bhatt et al., 2010; Buchwal et al., 2020). Variations in the cryosphere and biosphere on land are crucial for terrestrial ecosystems, including biodiversity (e.g., Rixen et al., 2022).
Spatially and temporally consistent information going back in time is needed in order to reliably identify trends and patterns. Satellite records are limited to the last 40–50 years. Many records are much shorter, starting around 2000 or later. Data gaps and variable sampling intervals are additional challenges. Many Arctic climate change studies therefore rely on the use of reanalyzed data (e.g., Rantanen et al., 2022; Park et al., 2013). Trends and linkages in related parameters observable from satellites have nevertheless been studied but are usually described for single parameters/pairs or restricted to the current tundra extent and with varying analysis periods. Valuable information for understanding climate change patterns across the Arctic could be derived from satellite data despite its shortcomings, but capabilities have not been fully exploited to date.
1.1 Trends based on satellite records
Trend analyses for the terrestrial Arctic based on multiple satellite-derived parameters have so far been described by Comiso and Hall (2014) and AMAP (2017) (Table A1). Comiso and Hall (2014) focused on cryosphere-related parameters and applied a consistent time frame for the comparison. Vegetation parameters were not included in this case. AMAP (2017) was based on a literature review, and time frames therefore varied from parameter to parameter. The only common parameter discussed in the two studies was snow extent (Table A1). An update of trends was published by AMAP (2021), also considering sea ice extent but changing to a fusion of different sources in the case of snow parameters (modeling and satellite). Both studies included records starting in the early 1980s but extended to different years between 2010 and 2015. The southern limit of the analysis varied by up to 4° latitude.
A range of studies focused on Arctic trend analyses of single parameters (Tables 1 and 2). Records from the Advanced Very High Resolution Radiometer (AVHRR; shortwave and thermal infrared) and Scanning Multichannel Microwave Radiometer/Special Sensor Microwave Imager (SSMR/SSMI; passive microwave) are crucial for analyses of changes back into the 1980s. Such comparably long records provide information related to the cryosphere (snow, albedo, sea ice, land surface temperature, freeze/thaw state) and vegetation (through the normalized difference vegetation index – NDVI) records. Capabilities improved from 1999 onward, starting with the Moderate Resolution Imaging Spectroradiometer (MODIS; shortwave and thermal infrared). Land surface temperature (LST) from MODIS was used, for example, for permafrost modeling (CryoGRID; Westermann et al., 2017; Obu et al., 2019). Permafrost ground temperature estimated using various satellite records is available through the European Space Agency (ESA) Climate Change Initiative (CCI) covering the years 1997 to 2021. Specifically, mean annual ground temperature at 2 m depth (MAGT−2 m) can be used as a proxy for permafrost conditions, e.g., for the retrieval of permafrost extent (Obu et al., 2021a). Trends at 2 m depth indicate that permafrost in Arctic coastal regions, specifically Siberia, is warming faster than in other regions (Miner et al., 2022) (Table 1). Seasonal thaw depth (active layer thickness) is a further indicator for permafrost change. Western Siberia has been identified as a hotspot of change, with increases in both growing season length (Smith et al., 2004) and thaw depth (Brouillette, 2021). A statistically significant trend in increasing snow water equivalent (SWE) has also been reported over this region (Pulliainen et al., 2020), in contrast to decreasing trends over many other Eurasian regions and North America. SWE has also increased over northern Fennoscandia according to both satellite and in situ records (Bjerke et al., 2025). The surface temperature increase from 1981–2012 was higher over the ocean than over land (Comiso and Hall, 2014). Different patterns over land can be observed between winter and summer over the last 40 years (Dupuis et al., 2024). Warming can be observed, for example, over mainland North America in winter and over the Taymyr region (northern Eurasia) in summer. Both areas also show strong increases in the maximum normalized difference vegetation index (MaxNDVI) as derived from AVHRR (Frost et al., 2025).
Miner et al. (2022)Brouillette (2021)Smith et al. (2004)Pulliainen et al. (2020)Comiso and Hall (2014)AMAP (2017)Pulliainen et al. (2020)Takala et al. (2009)Anttila et al. (2018)Comiso and Hall (2014)Stroeve and Notz (2018)Comiso and Hall (2014)Comiso and Hall (2014)Dupuis et al. (2024)Comiso and Hall (2014)Table 1Past studies on Arctic trends with focus on observables from satellite data (excluding ice sheets) – part I.
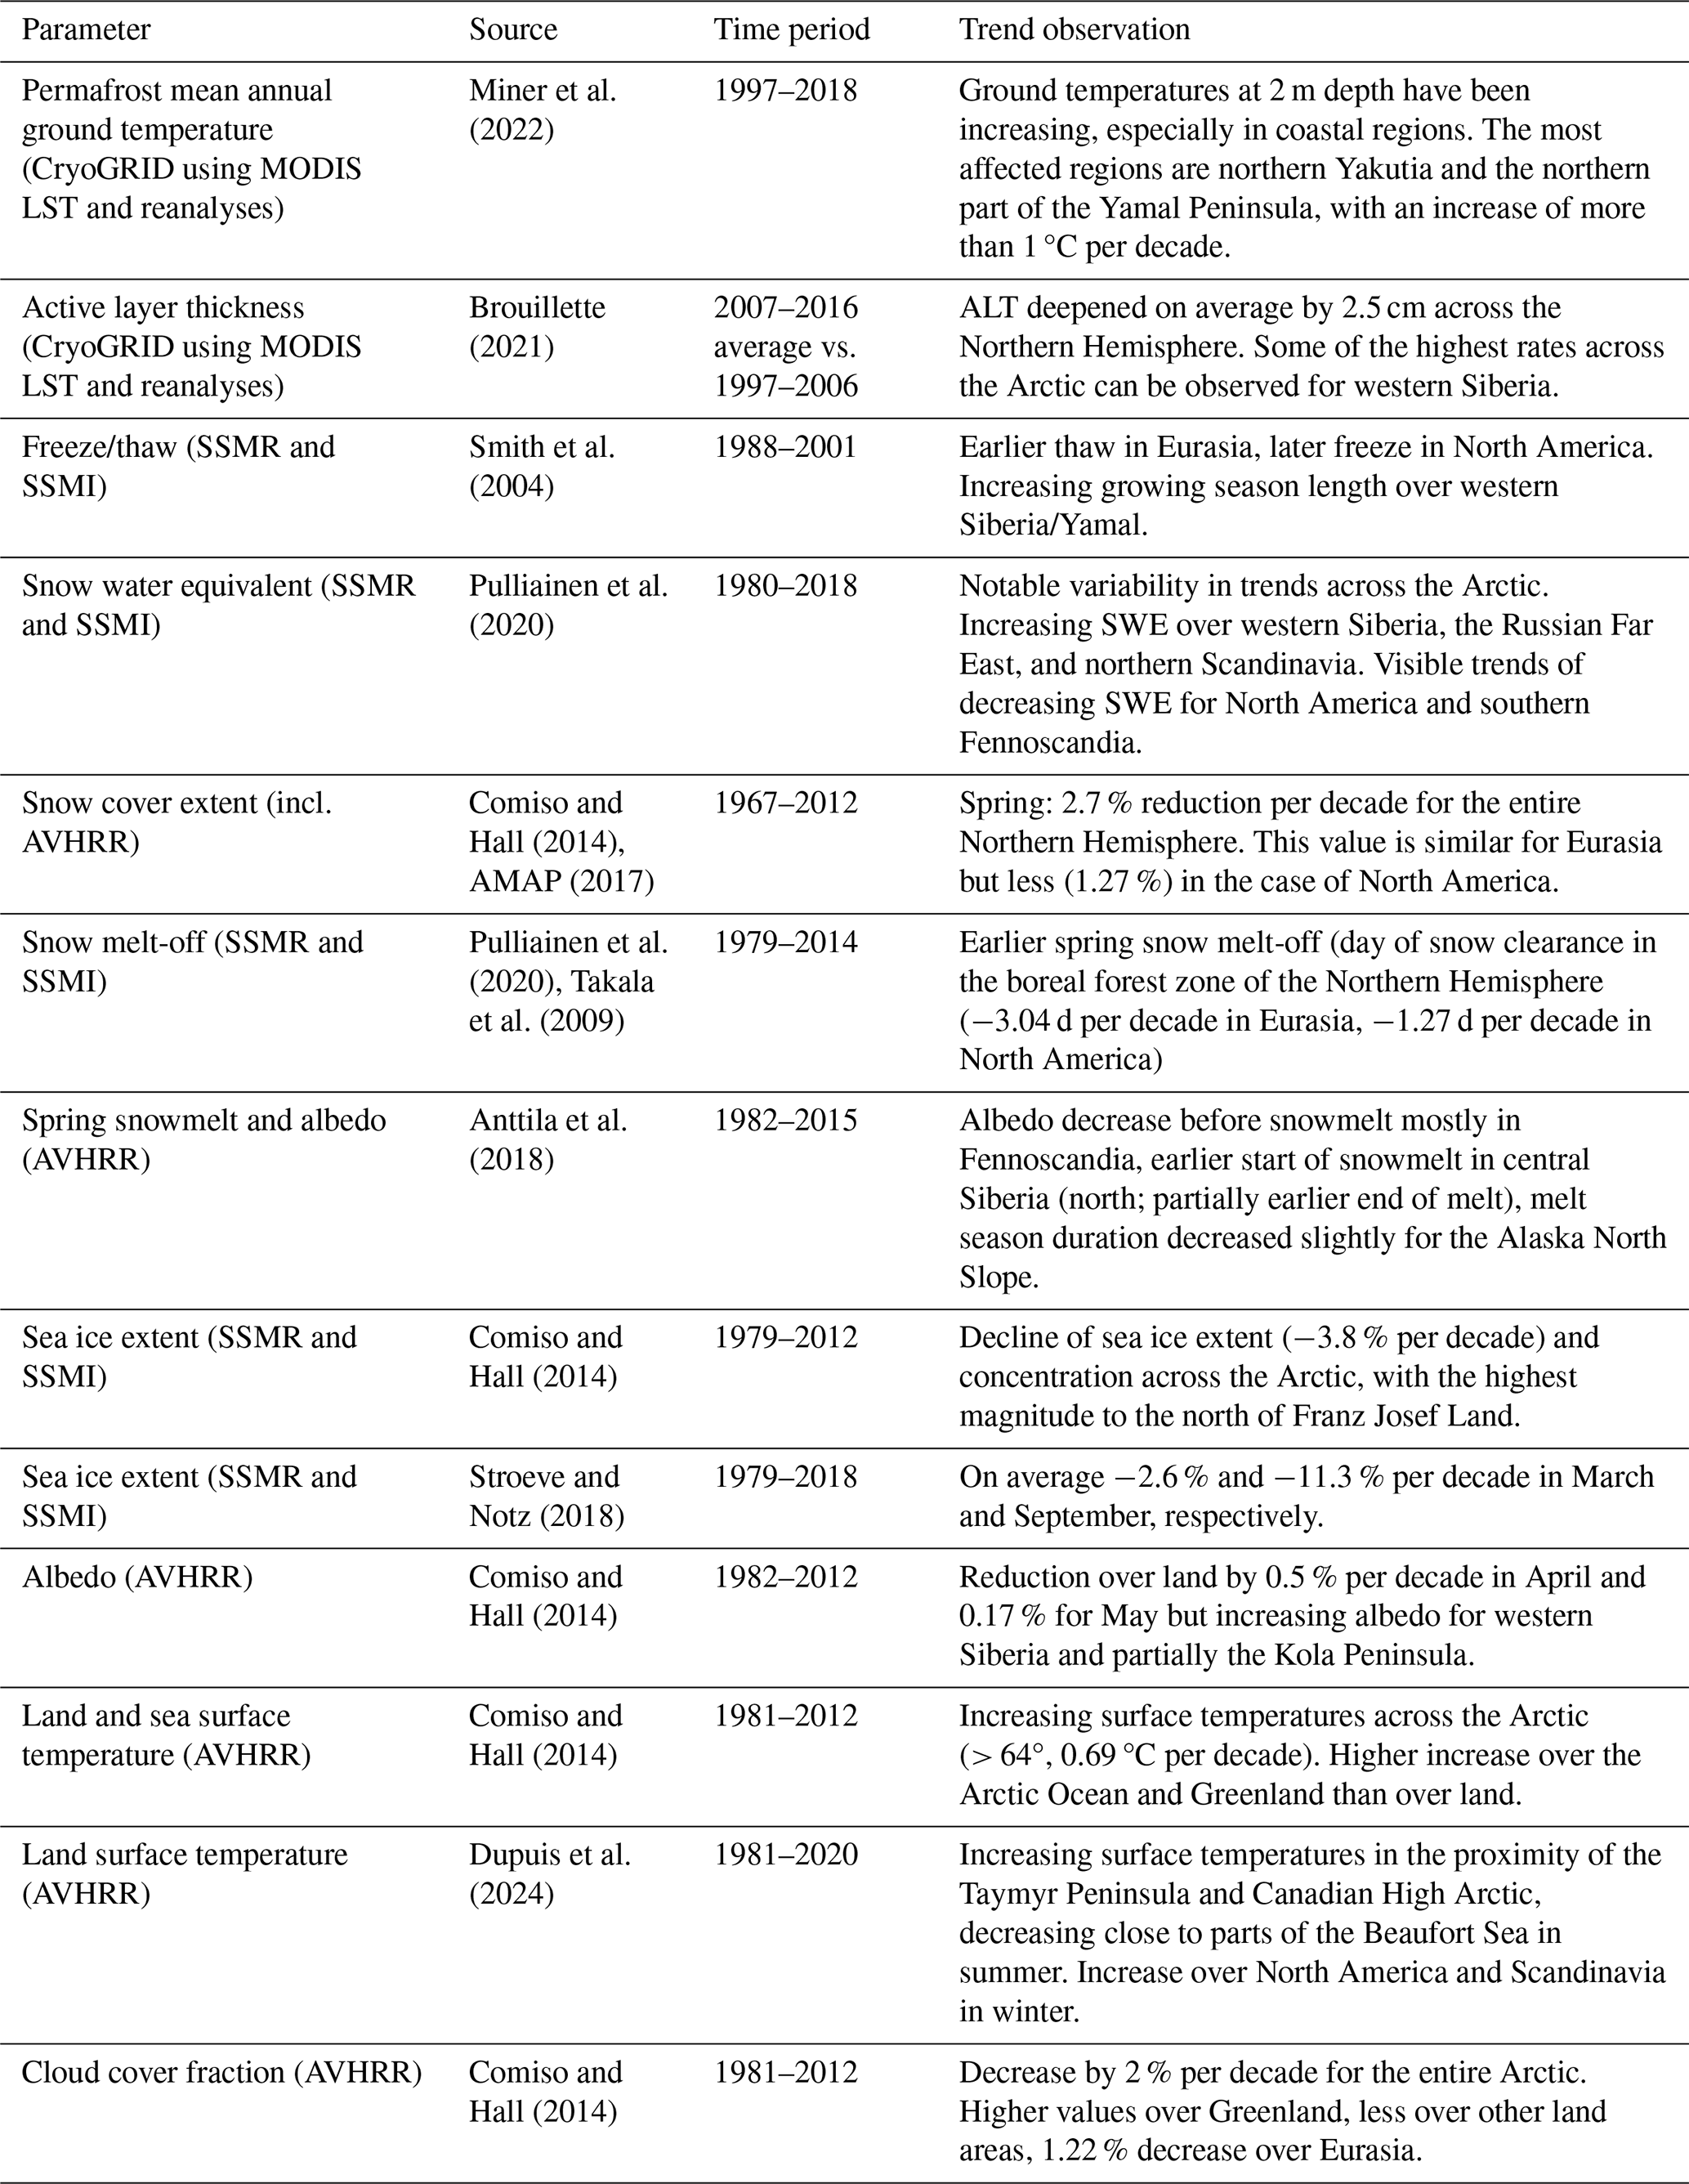
Table 2Past studies on trends with focus on observables from satellite data – part II: Arctic tundra MaxNDVI and TI-NDVI.
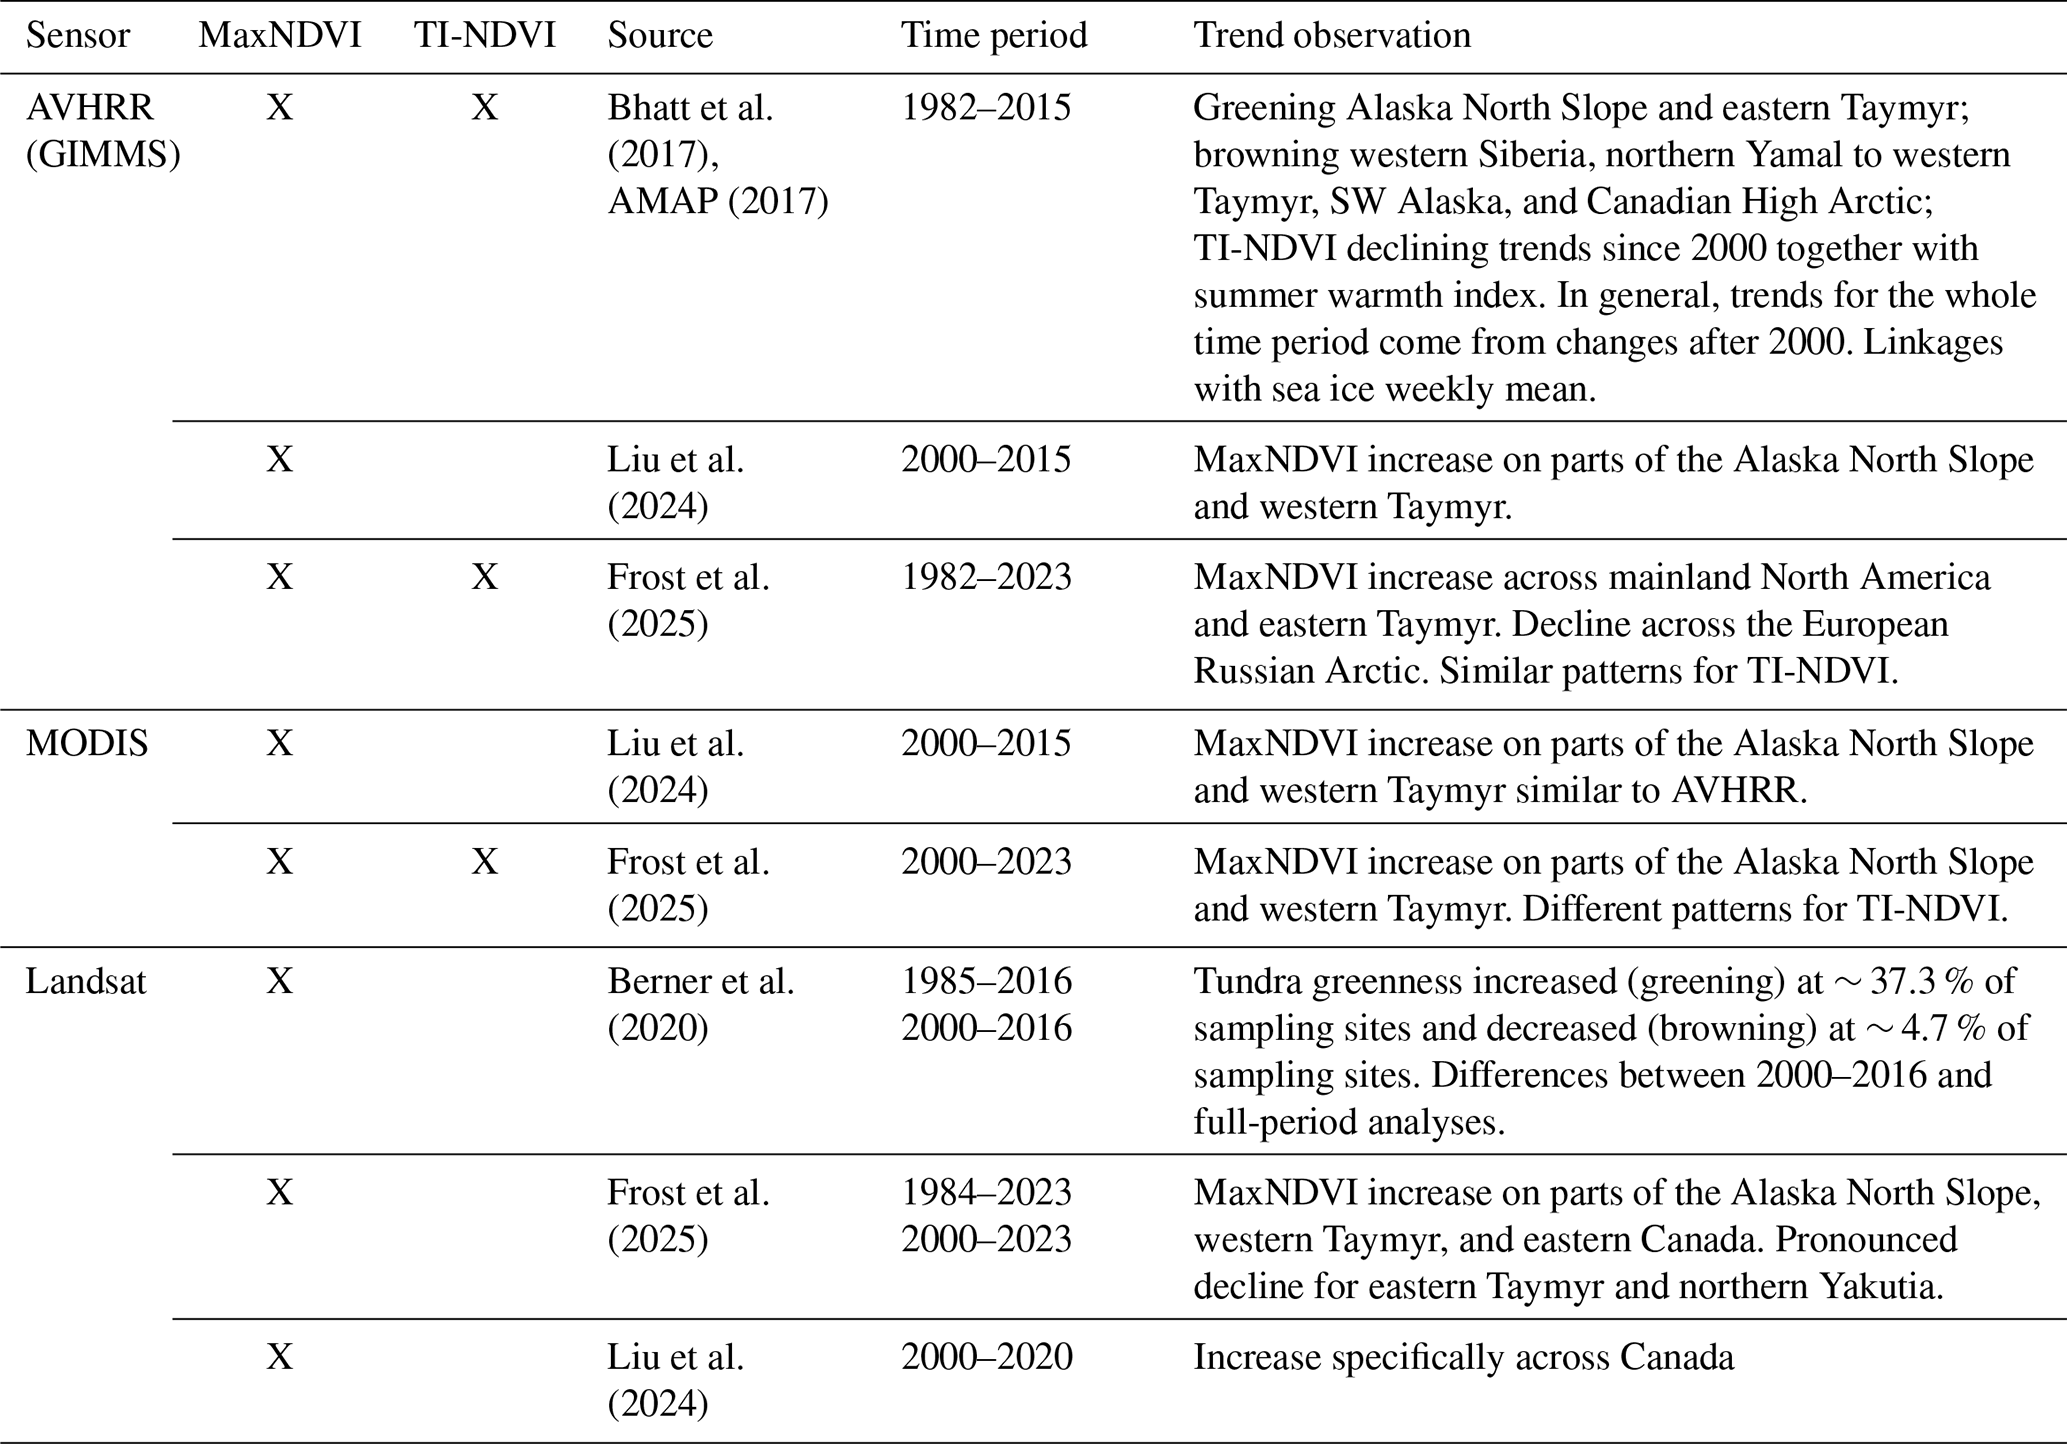
Vegetation indices indicate changes across the entire Arctic tundra (Bhatt et al., 2017), with more pronounced patterns after 2000. Vegetation analyses rely specifically on NDVI retrievals from the Global Inventory Modeling and Mapping Studies (GIMMS) record, which is based on AVHRR (different versions, 8 × 8 km) (Pinzon and Tucker, 2014) (Table 2). NDVI-related trend analyses across the Arctic usually target the identification of greening or browning as a result of climate change (Bhatt et al., 2017; Frost et al., 2025). Greening is usually interpreted as increasing vegetation height, biomass, cover, and abundance (Myers-Smith et al., 2020). Most studies therefore focused on specific NDVI statistics rather than phenology. The main target parameters are MaxNDVI and the time-integrated normalized difference vegetation index (TI-NDVI). MaxNDVI is the maximum annual NDVI, and TI-NDVI is the sum of summer bi-weekly NDVI. MaxNDVI represents the annual maximum NDVI value observed during the period of peak phytomass during the growing season, typically in late July and early August for the Arctic (Frost et al., 2025) and somewhat earlier for the Boreal region below 60° N. TI-NDVI includes phenological variations throughout the growing season; therefore, it represents gross primary production better than MaxNDVI (Tucker and Sellers, 1986). NDVImax and TI-NDVI may exhibit different correlations with climatic parameters such as temperature (Yan et al., 2022). Spatial patterns between MaxNDVI and TI-NDVI trends differ across the Arctic (Frost et al., 2025). MaxNDVI trend patterns captured by MODIS (500 m) are more pronounced than the higher-spatial-resolution observations based on Landsat (30 m; Frost et al., 2025). An alternative to TI-NDVI is the growing season summed NDVI (GSSNDVI). It is based on daily NDVI values, so it is of limited applicability due to frequent cloud cover, but it is a good proxy for gross primary production across the Arctic (Park et al., 2016). Phenology indicators based on AVHRR NDVI indicate an increasing length in growing season in many parts of the Arctic (Park et al., 2016).
1.2 Linkages with sea ice variations
1.2.1 Vegetation
Previous regional NDVI studies indicated the importance of sea ice in basin-specific analyses (e.g., Bhatt et al., 2010; Macias-Fauria et al., 2012, 2017; Table 3). Sea ice basin-specific TI-NDVI (AVHRR) trend relationship analyses covering the entire Arctic were initially carried out for a 50–100 km buffer (for land area north of the tree line, as defined through the Circumpolar Arctic Vegetation Map – CAVM; Walker et al., 2002, Raynolds et al., 2019) covering the years 1982 to 2008 (Bhatt et al., 2010) (Table 3). The timing of the 50 % mean sea ice concentration in spring was used for these analyses. Significant correlations were found for eastern Siberia (Bering, Chukchi, Laptev, eastern Kara seas) and the Canadian Archipelago. Further analyses were made for de-trended MaxNDVI (Bhatt et al., 2013) and for a longer time period (to 2019; Bhatt et al., 2021) separating Eurasia and northern America. Initially, a 100 km ocean zone with a focus on open-water data was compared to tundra over adjacent land area by sea ice basin including data until 2008 (20 basins; Bhatt et al., 2013). This was extended to 2019, also including the summer average open-water extent but with separation between North America and Eurasia only (within the tundra CAVM boundary; Bhatt et al., 2021). Statistically significant correlations were only found for North America, compared to TI-NDVI, which was relevant for both regions. This applied to the time period 1982–2019 and to the original 1982–2008 records. Li et al. (2023) demonstrate issues with orbital drift in GIMMS/AVHRR records. Trends derived from GIMMS were also shown to differ from MODIS (Frost et al., 2025).
Bhatt et al. (2010)Comiso and Nishio (2008)Bhatt et al. (2013)Comiso and Nishio (2008)Bhatt et al. (2021)Comiso and Nishio (2008)Dutrieux et al. (2012)Yu et al. (2021)Macias-Fauria et al. (2012)Macias-Fauria et al. (2017)Karlsen et al. (2024)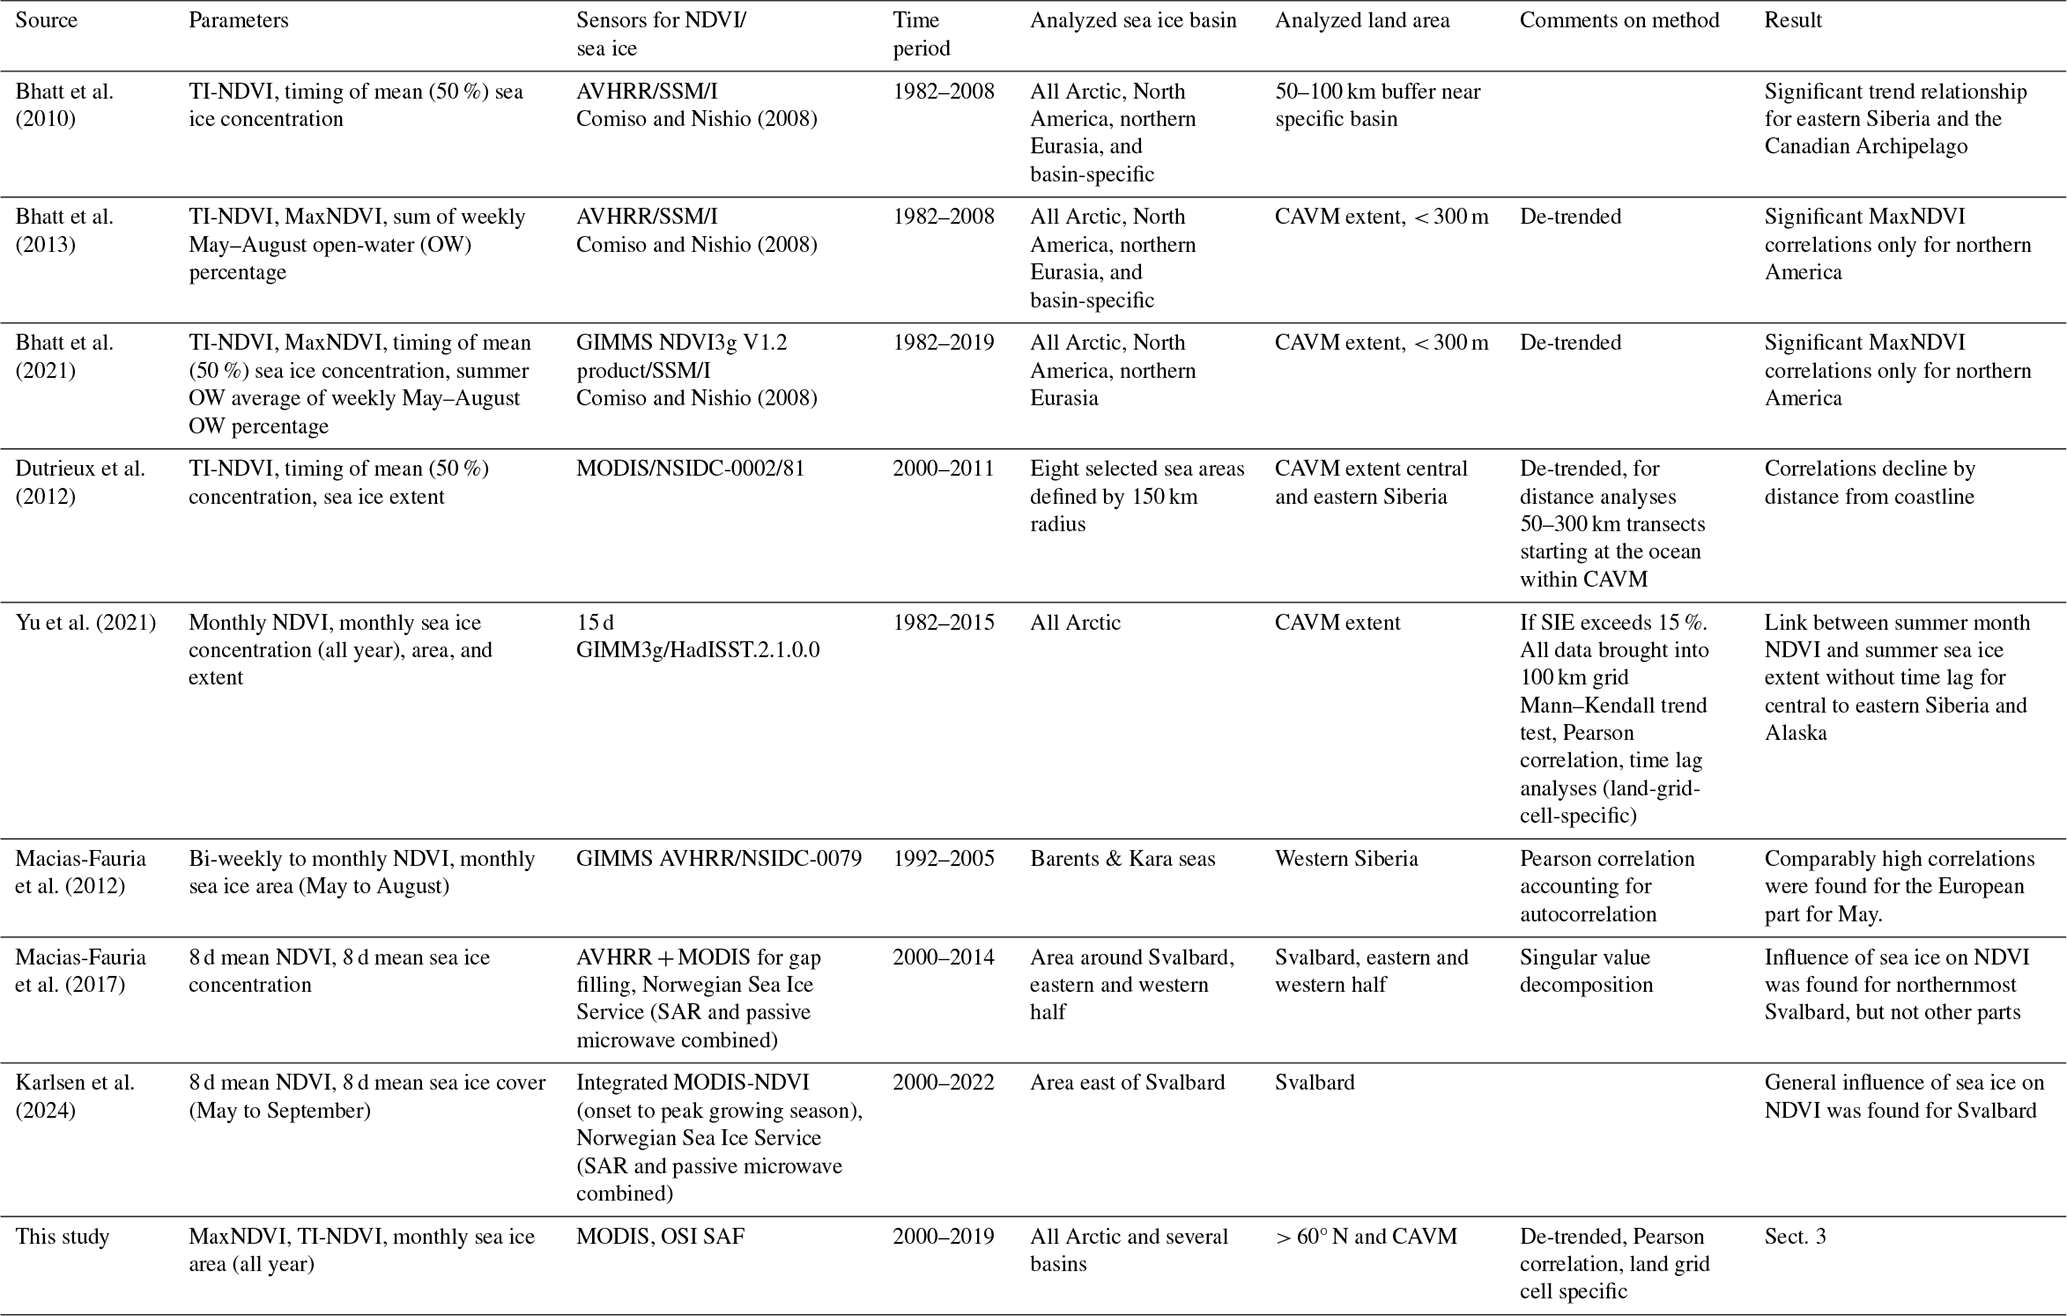
Dutrieux et al. (2012) focused on central and eastern Siberia using MODIS data for the first time (2000–2011). Correlations of TI-NDVI with sea ice cover decline with distance from the coast. Highest correlations were found for mid-June sea ice concentrations. Yu et al. (2021) investigated monthly sea ice data and identified a link between the NDVI of summer months with summer sea ice extent without time lag for central to eastern Siberia and Alaska (within the CAVM extent). Late-spring (May–early June) sea ice was also compared to NDVI for western Siberia in Macias-Fauria et al. (2012). Comparably high correlations were found for the European part for May.
Kerby and Post (2013) focused on Kangerlussuaq (western Greenland) and the relationship of sea ice (January to May) with the summer warmth index, which was linked in previous studies to NDVI in other regions (Bhatt et al., 2021). The highest correlation was found for the Davis Strait/Baffin Bay regional sea ice extent in June. An influence of adjacent sea ice variations on NDVI was also found for northernmost and eastern Svalbard (Macias-Fauria et al., 2017; Karlsen et al., 2024).
1.2.2 Permafrost
The lower the Northern Hemisphere (NH) minimum sea ice extent, the higher the NH mean annual ground temperature in permafrost soils (Bartsch et al., 2023b). The relationship of permafrost (MAGT at 2 m depth) and NH sea ice trends was initially investigated for September conditions (minimum extent; meereisportal.de; Spreen et al., 2008; grant no. REKLIM-2013-04). The overall trend for the Northern Hemisphere MAGT at 2 m depth (referring to the area of permafrost extent maximum within the observation period, 1997–2019) follows sea ice decline for September (R2= 0.75). A change of on average 1 °C at 2 m depth coincides with a September sea ice decline of about 2.5 million km2. This analysis was extended to cover all months, and de-trending was applied (Bartsch et al., 2024). The correlation of MAGT−2 m with monthly NH sea ice extent was shown to be comparably high from August to October (R2> 0.8) in all cases, but regional differences (on land) have been identified across the Arctic. The correlation was highest for northern central Siberia. This differs from areas with highest trends for ground temperature, as shown in Miner et al. (2022). The latter are located more eastwards. Basin-specific analyses of sea ice have not been reported to date.
1.2.3 Snow
The impact of sea ice conditions on snow parameters has been investigated on the basis of modeling, specifically for SWE. The sea ice records used usually represented September as the month of minimum extent, and analyses considered averages for the entire Arctic (Park et al., 2013). Low sea ice cover was found to be linked to anomalously high snow depth (as determined by the land surface model CHANGE) in northeastern Siberia for 1979 to 2006 due to increase in precipitation (Park et al., 2013). In contrast, a decline in snow depth was found for North America. A similar pattern was found through satellite observations by Pulliainen et al. (2020) for this region.
Gastineau et al. (2023) found declining trends in snow mass across eight different models for 1979–2014, with high deviations in absolute values among the models. The sea ice correlation analyses were thus limited to the parameter snow extent. The focus was on the months from November to March for both snow extent and sea ice. No robust influence of sea ice concentration variability on snow cover extent was found, which was attributed to the lack of ocean–sea ice coupling in the models (Gastineau et al., 2023).
A linkage between lake ice growth across Alaska and September sea ice concentration in the adjacent ocean (Beaufort and Chukchi seas) was found for records from 1991–2008 (Alexeev et al., 2016). It was suggested that sea ice conditions impact snowfall on land based on an investigation of SWE obtained from regional climate model simulations driven by reanalysis data. Low sea ice cover was found to lead to higher precipitation/SWE and thinner lake ice due to the insulation effect of snow. On a pan-Arctic scale, neither a splitting into basins nor the consideration of other months than September sea ice extent has been analyzed so far based on satellite-derived snow records.
1.3 Objectives
Linkages of observables across the North Pole have recently been documented for selected cryosphere parameters only. In this study, we present a pan-Arctic analysis and discussion of similarities between sea ice variation and observed terrestrial biosphere and cryosphere parameters. This is needed to advance our understanding of processes conditioning climate change impacts across the Arctic but is lacking to date. Previous circumpolar analyses of NDVI focused on sea ice comparisons within the adjacent basins only. Also, analyses were confined to tundra regions. They were defined through the boundaries of the CAVM, which excludes, among other regions, northern Scandinavia and northwestern Russia. While there are limitations for records based on satellite data, spatially and temporally consistent observations are available for the cryosphere and for vegetation parameters from 2000 onward, due to the availability of MODIS and denser coverage by Landsat (see, e.g., Tables 2 and 3). In order to address these gaps, we analyzed time series of both TI-NDVI and MaxNDVI, permafrost mean annual ground temperature, and snow water equivalent, considering multiple sea basins for the identification of potential regional linkages (confined to the area north of 60° N). The results of the statistical analyses were combined into an open-access dataset of Arctic Sea Ice and Land Parameter Correlations (ASILaC) to facilitate further analyses.
2.1 Dataset and analysis extent
Sea ice area (SIA) records were obtained from the EUMETSAT Ocean and Sea Ice Satellite Application Facility (OSI SAF) sea ice index (version 2.1 (2020), OSI-420, 25 km; OSI SAF and EUMETSAT SAF On Ocean And Sea Ice, 2020). SIA represents the sum of the total cover area of a given pixel multiplied by the ice concentration in that pixel. The extents of the sea ice basins were used as defined through the data provider (OSI SAF). This includes eight basins covering most of the Arctic except the Canadian Archipelago (retrieval impeded due to limited extent of water surface between islands) (Fig. 1).
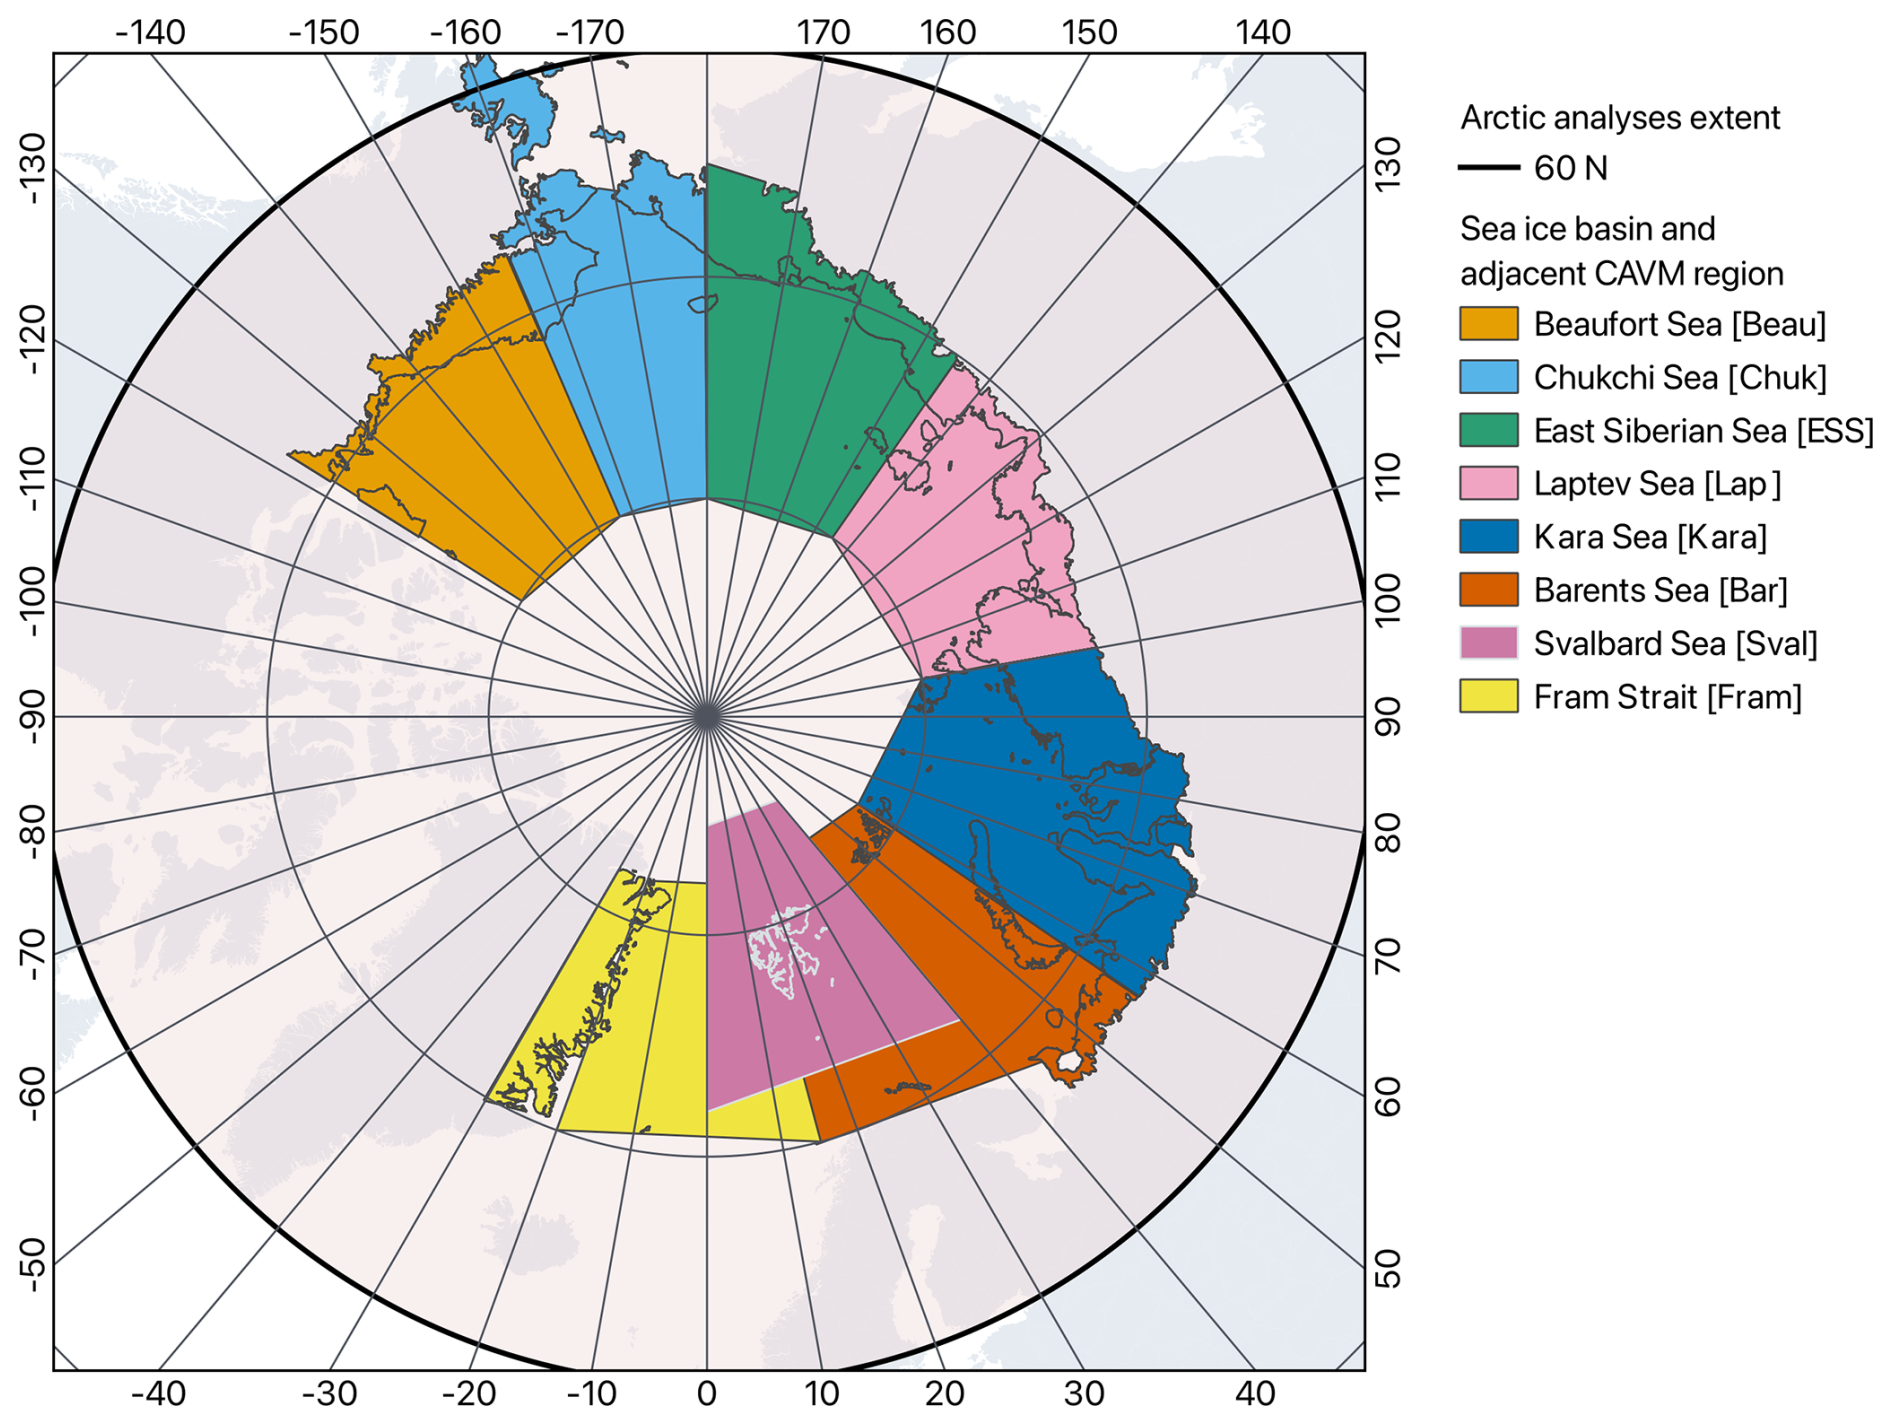
Figure 1Ocean basins considered for sea ice area correlation analyses as defined by the OSI SAF Sea Ice Index v2.1 (OSI SAF and EUMETSAT SAF On Ocean And Sea Ice, 2020), adjacent land area confined by the southern Circumpolar Arctic Vegetation Map (CAVM; Walker et al., 2002) boundary (treeline), and full analysis extent north of 60° N.
Vegetation, permafrost, and snow records were considered for the sea ice correlation analyses (Table 4). The analysis period is harmonized across the available datasets. The overlap period is defined as 2000–2018/2019, which allows the usage of MODIS for both vegetation records and permafrost time series. The analyses of vegetation parameters included MaxNDVI and TI-NDVI, following previous studies (Tables 1 and 2). MODIS NDVI data were extracted from Tømmervik (2025). The NDVI records are available at 250 m nominal resolution. The following datasets were processed: Moderate Resolution Imaging Spectroradiometer (MODIS), 2000–2019, using the 16 d NDVI product from the Terra (MOD13A1, v. 6.1) with a spatial resolution of 500 m. Pixels with a summary quality assurance value ≥3 (indicating cloudy and compromised observations) were removed. Time-integrated NDVI (TI-NDVI) is the sum of maximum NDVI values within set compositing periods during May–September. It has been calculated for datasets with daily temporal resolution. We followed the procedure of Frost et al. (2025). No filtering processes or other amendments have been applied to the datasets.
Tømmervik (2025)Obu et al. (2021b)Pulliainen et al. (2020)Luojus et al. (2021)Table 4Datasets considered for correlation analyses covering the entire Arctic.
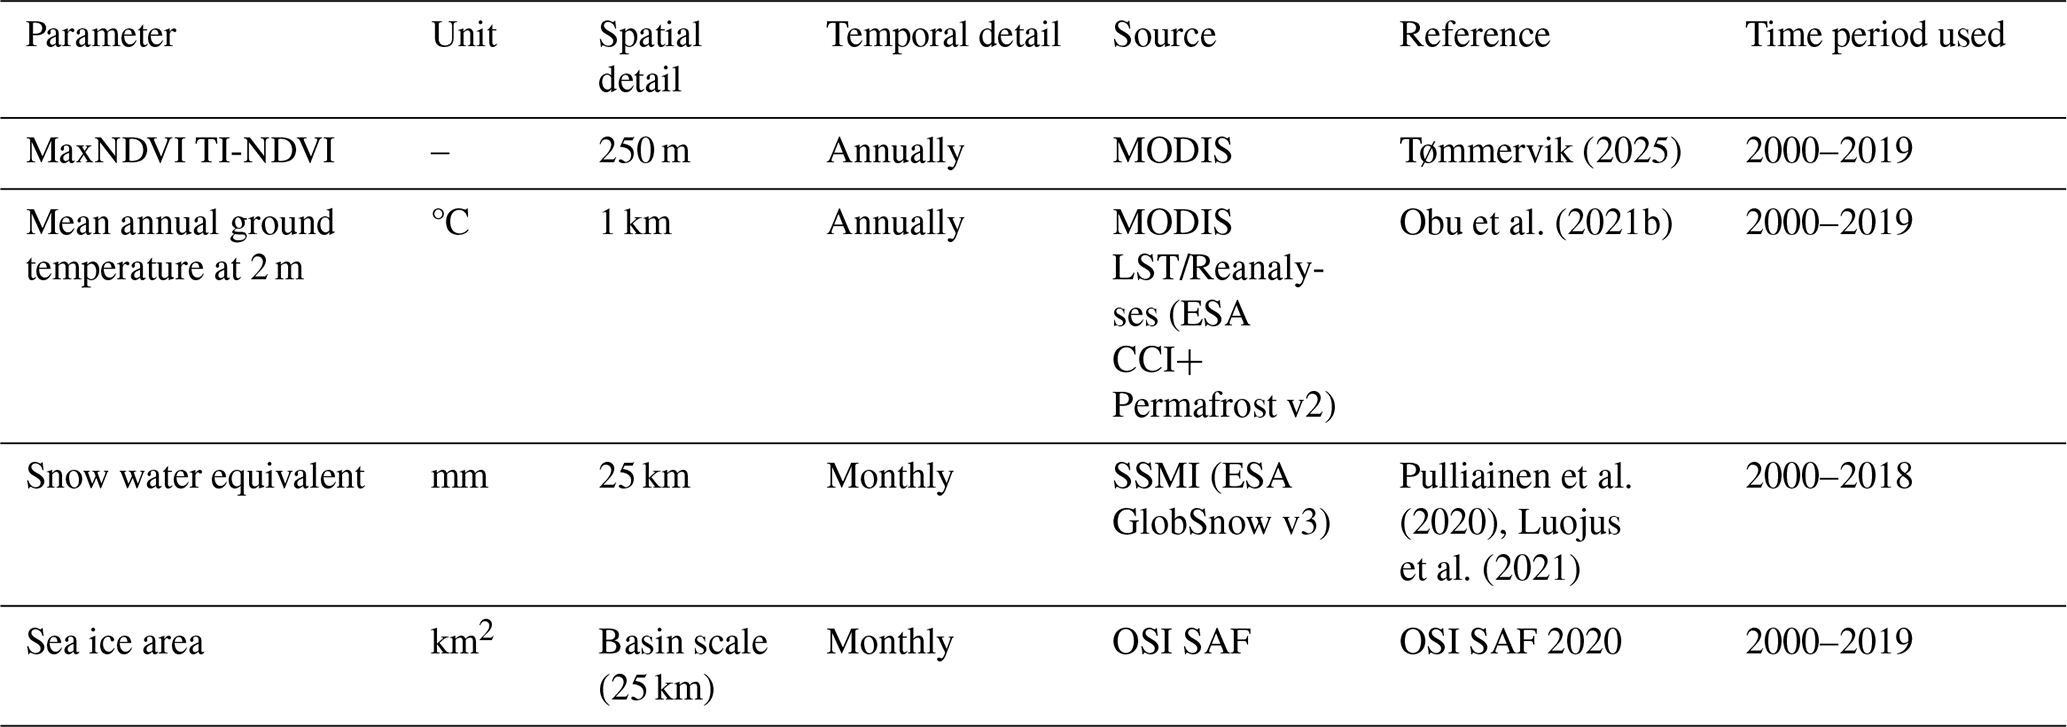
Ground temperature is available from the ESA CCI Permafrost project (v2; Obu et al., 2021b). It is derived from a thermal model driven and constrained by satellite data (MODIS LST). The transient modeling approach allows the quantification of temperature change over time at certain depths. Average annual ground temperatures are provided for specific depths (surface and 1, 2, 5, 10 m) and at 1 km gridding. This dataset covers the Northern Hemisphere (north of 30°) for the period 2003–2021 based on MODIS land surface temperature merged with downscaled ERA5 reanalysis near-surface air temperature data in the case of cloud cover. Although active layer thickness is also available, this variable was not considered, since uncertainties are higher than for ground temperature (Heim et al., 2021). Records representing 2 m depth have been used, as it is also recommended that they be used for permafrost extent estimation (Obu et al., 2021a), and initial tests have shown variation from year to year despite attenuation (Bartsch et al., 2023b).
SWE is available from the ESA GlobSnow v3.0 climate data record (Takala et al., 2009; Luojus et al., 2021; Pulliainen et al., 2020). The data are provided in a fixed equal-area grid (EASE grid) of 625 km2, nominally at 25 km by 25 km spatial resolution. Islands and areas with notable topography, such as mountain ranges, were masked, along with the comparably ice-free but narrow margin of Greenland. The dataset is derived from passive microwave observations (SSMI). For consistency with the annual representations of vegetation and permafrost, the average SWE in March was selected for this study and interpreted to represent maximum SWE conditions following Pulliainen et al. (2020).
To facilitate the discussion, datasets for the number of frozen days (obtained from the MEAsUREs dataset and based on passive microwave; Kim et al., 2017, 2021), aggregated Landsat MaxNDVI trends (Mekonnen et al., 2021), and MaxNDVI available from the GIMMS/AVHRR dataset (Pinzon and Tucker, 2014; Vermote and NOAA CDR Program, 2019) were investigated. The general analysis extent for the land parameters was set to be north of 60° N. Subsets for tundra only, based on the CAVM, were created for comparability with previous studies (see Table 3). The eastern and western boundaries of these subsets are extensions of the eight sea ice basins towards the south.
2.2 Trend and correlation analyses
The main workflow comprised trend retrieval, de-trending, correlation analyses, and post-processing for the creation of the dataset of Arctic Sea Ice and Land Parameter Correlations (ASILaC) (Fig. 2).
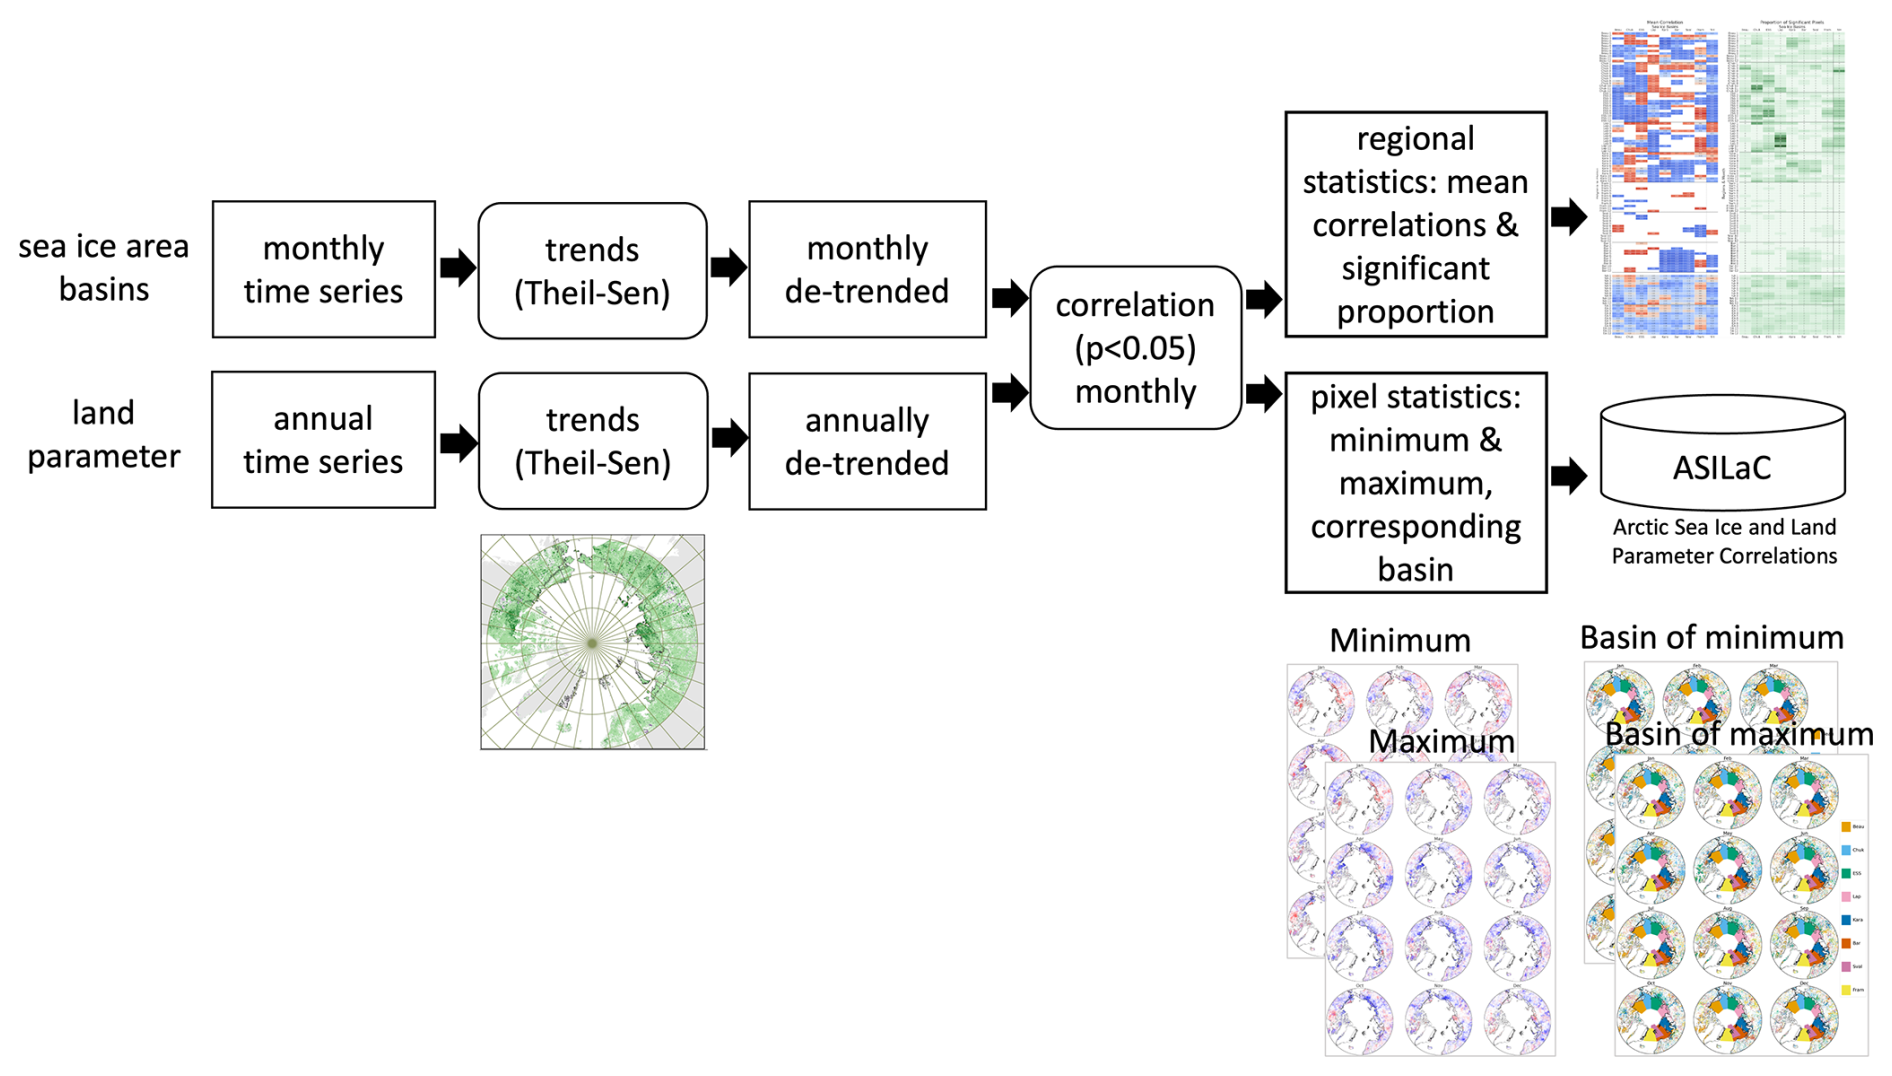
Figure 2Workflow overview. Figure examples represent TI-NDVI. Trends and regional statistics are presented in Results. Maps of all data are included in the dataset of Arctic Sea Ice and Land Parameter Correlations (ASILaC; Bartsch et al. (2025c)) and in the Appendix.
Dedicated pre-processing was only required for the extraction of frozen days, which served as an auxiliary dataset. We used data from the MEAsUREs dataset, which includes both AM and PM orbits. A pixel was considered frozen only if retrievals from both overpasses (AM and PM) estimated a frozen state. Trend analysis was applied to the cumulative number of frozen days from 1 March to 31 July. This period characterizes spring thaw in the Northern Hemisphere (e.g., Mortin et al., 2012). A change in the number of frozen days in this period represents a change in spring timing.
Firstly, trends were derived for all land parameters as listed in Table 4 and for > 60° N. Consistent masking (land/sea, lakes, glaciers) was applied to all datasets. Trends were derived using Theil–Sen analyses. In the case of MaxNDVI, trends were also determined based on records from AVHRR/GIMMS.
In a second step, de-trending was applied. The Pearson correlations of sea ice area with the land parameters were determined for the entire NH area north of 60° N and sub-basins. Monthly SIA was compared to mean annual ground temperature (MAGT−2 m), TI-NDVI, MaxNDVI, and SWE (March, representing annual maximum). In the case of SWE, January–March SIA represents the same year, and April–December SIA represents the previous year. In all other cases, January to December of the same year was used. For all further analyses, only significant correlations were considered (p<0.05).
Results of the correlation analysis include gridded datasets of pixel-wise correlations with each sea ice basin area. Masking was applied with respect to significant correlation on a per-pixel basis. The pixel-specific minimum and maximum correlation values, including the corresponding month and sea ice basin, were determined and included into ASILaC. Results were summarized for the CAVM sub-regions, North America, and northern Eurasia. This included average correlations and the proportion of pixels with significant correlations for each region.
3.1 Trends
SWE both increased and decreased across the Arctic during the analysis period, 2000–2019 (Fig. 3). On average, it did, however, increase north of 60° N (Table A2). Permafrost ground temperature and NDVI indices also mostly increased. Large changes were observed for NE Siberia across these parameters, except TI-NDVI. Parts of western Siberia and northeastern Siberia that experienced increasing snow amount also showed higher positive trends of MaxNDVI. Smaller patches of both decreasing and increasing NDVI-based variables were found south of the treeline, likely reflecting vegetation response to fires, for example.
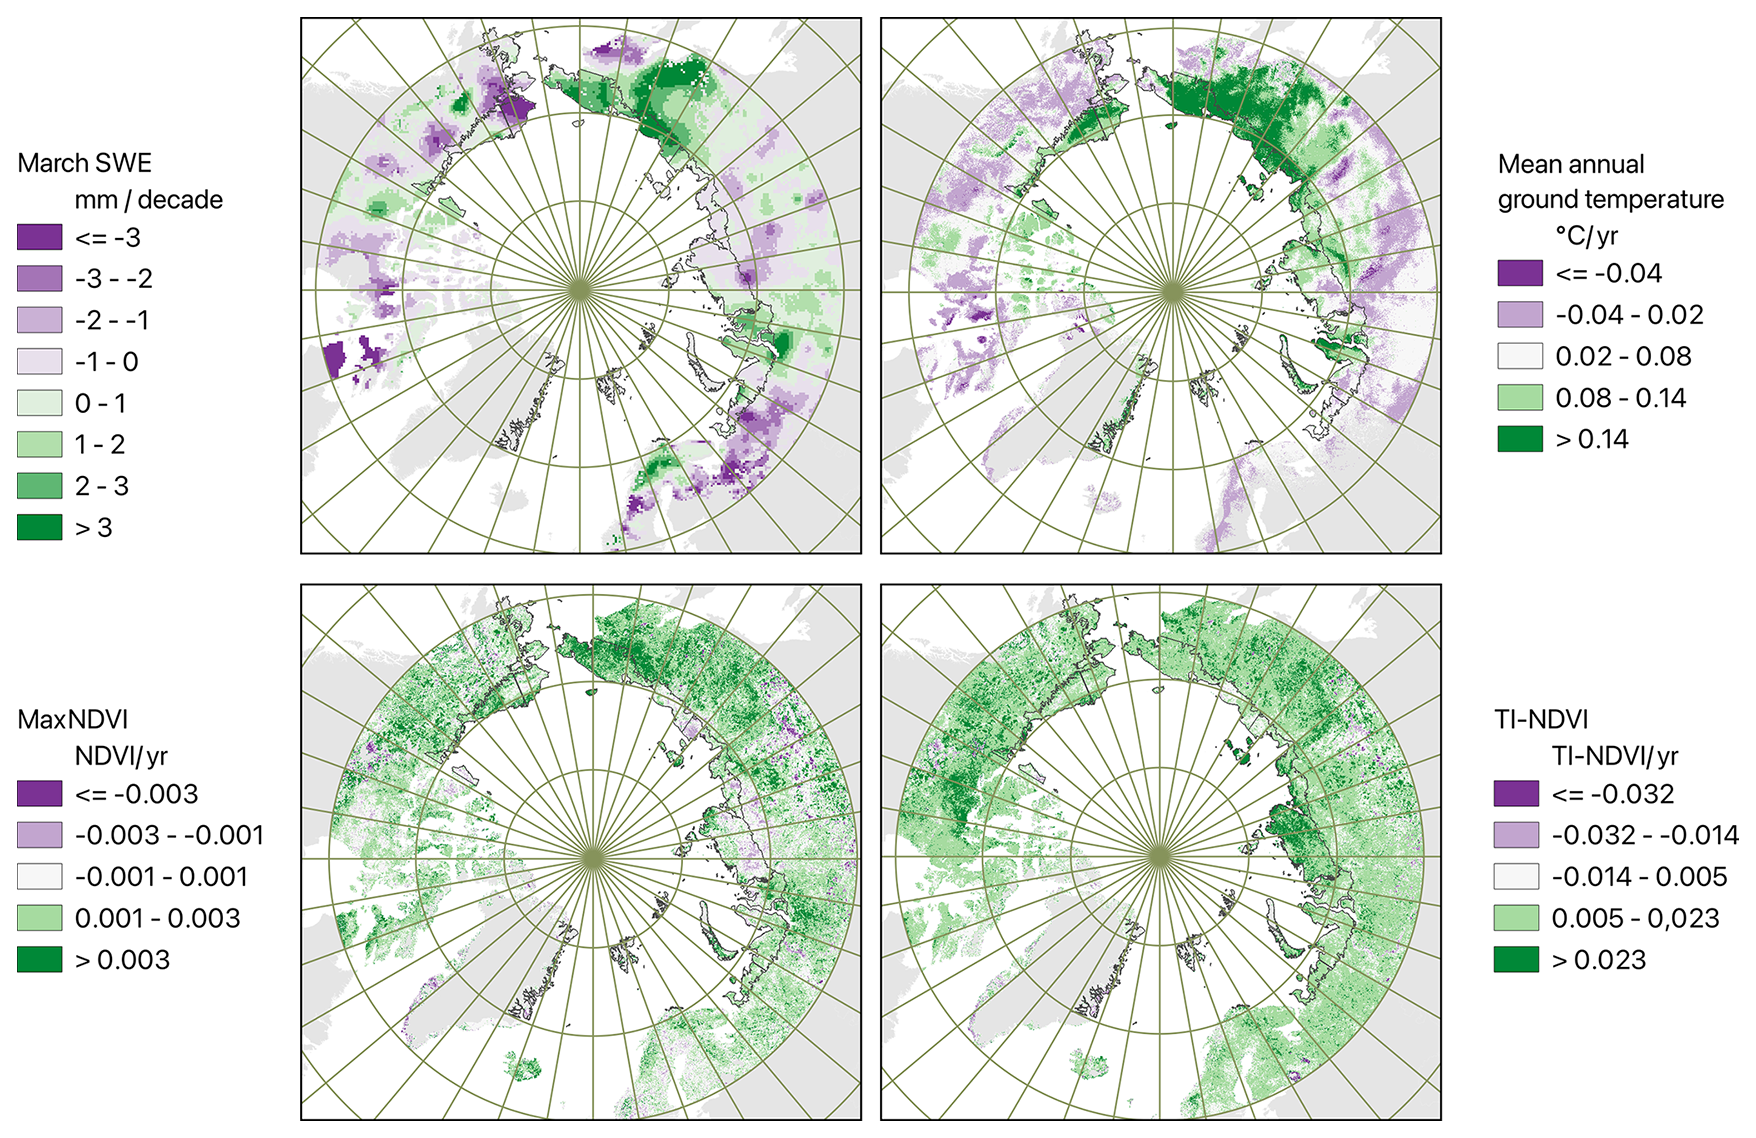
Figure 3Trends for snow water equivalent (SWE), mean annual ground temperature, MaxNDVI, and TI-NDVI (2000–2018; for data sources, see Table 4). Black outlines represent CAVM extent (source: Walker et al., 2002).
3.2 Correlations
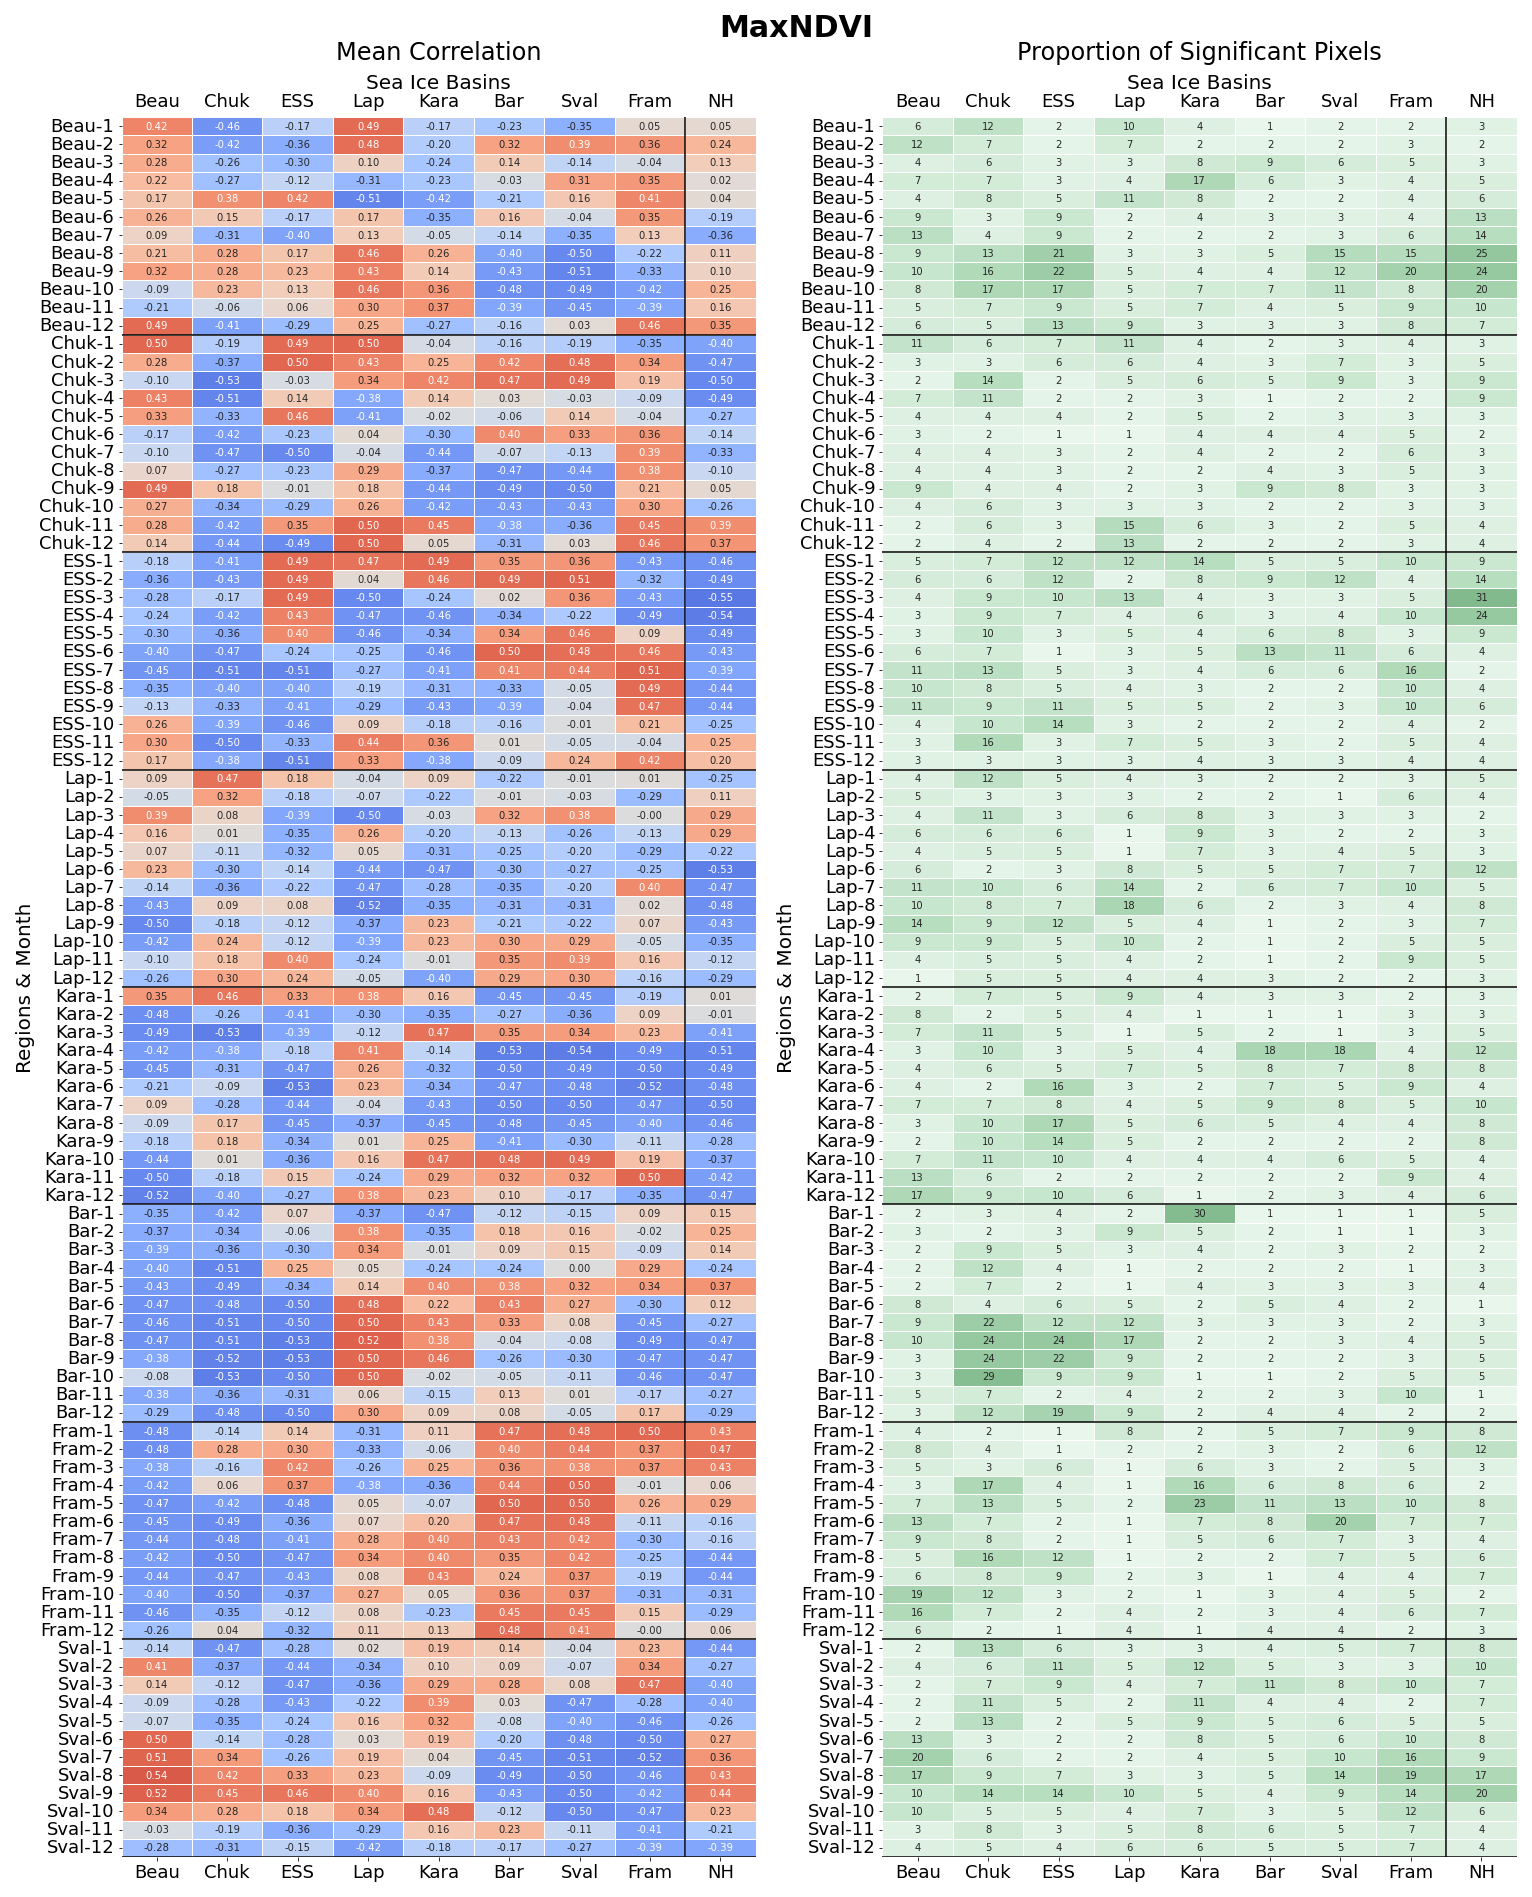
The proportion of area with significant correlation ranged from zero to 95 % (Figs. 4, 5, 6, 7). Values were higher for SWE and MAGT than for vegetation parameters and lowest for MaxNDVI. This applied to the tundra (CAVM) regions and to larger-area analyses (Fig. 8). While, in most cases, values were below 10 % within the CAVM regions, in some cases, much larger values were obtained. The Svalbard non-glaciated area reached proportions of more than 90 % significant correlations in the case of MAGT for January SIA conditions in the Svalbard sea and for January and February SIA conditions in the Barents Sea. A total of 64 % was obtained for March SWE in the case of the Beaufort Sea region linked to Fram Strait SIA in October. Considering the full Northern Hemisphere SIA, February was most important for SWE in the Laptev Sea coastal region (61 %). Proportions for TI-NDVI exceeded 50 % for the linkage of the Barents Sea and Laptev Sea with their adjacent area in August. The lowest values were observed for MaxNDVI, with a maximum of 30 % in the case of the Barents CAVM area and January SIA in the Kara Sea.
North of 60° N, proportions were higher for northern America than for Eurasia in the case of TI-NDVI, MaxNDVI, and MAGT. This pattern is reversed for SWE. This largely also applied when confining the analyses to tundra regions, except for MAGT. The significant fractions were comparably low for the region adjacent to the Beaufort Sea ice basin (which includes the Alaska North Slope).
Proportions for MAGT were the highest among the investigated parameters, exceeding 90 % for Svalbard (for the sea ice area of the Svalbard Sea in January and for the sea ice area of the Barents Sea in January and February) and 80 % for the Laptev Sea coastal region when considering the entire NH sea ice record (August). Results for the Fram Strait and Svalbard adjacent land areas were unavailable for SWE due to the masking of ice sheets and coarse spatial resolution for the records used.
3.2.1 Sea ice and permafrost
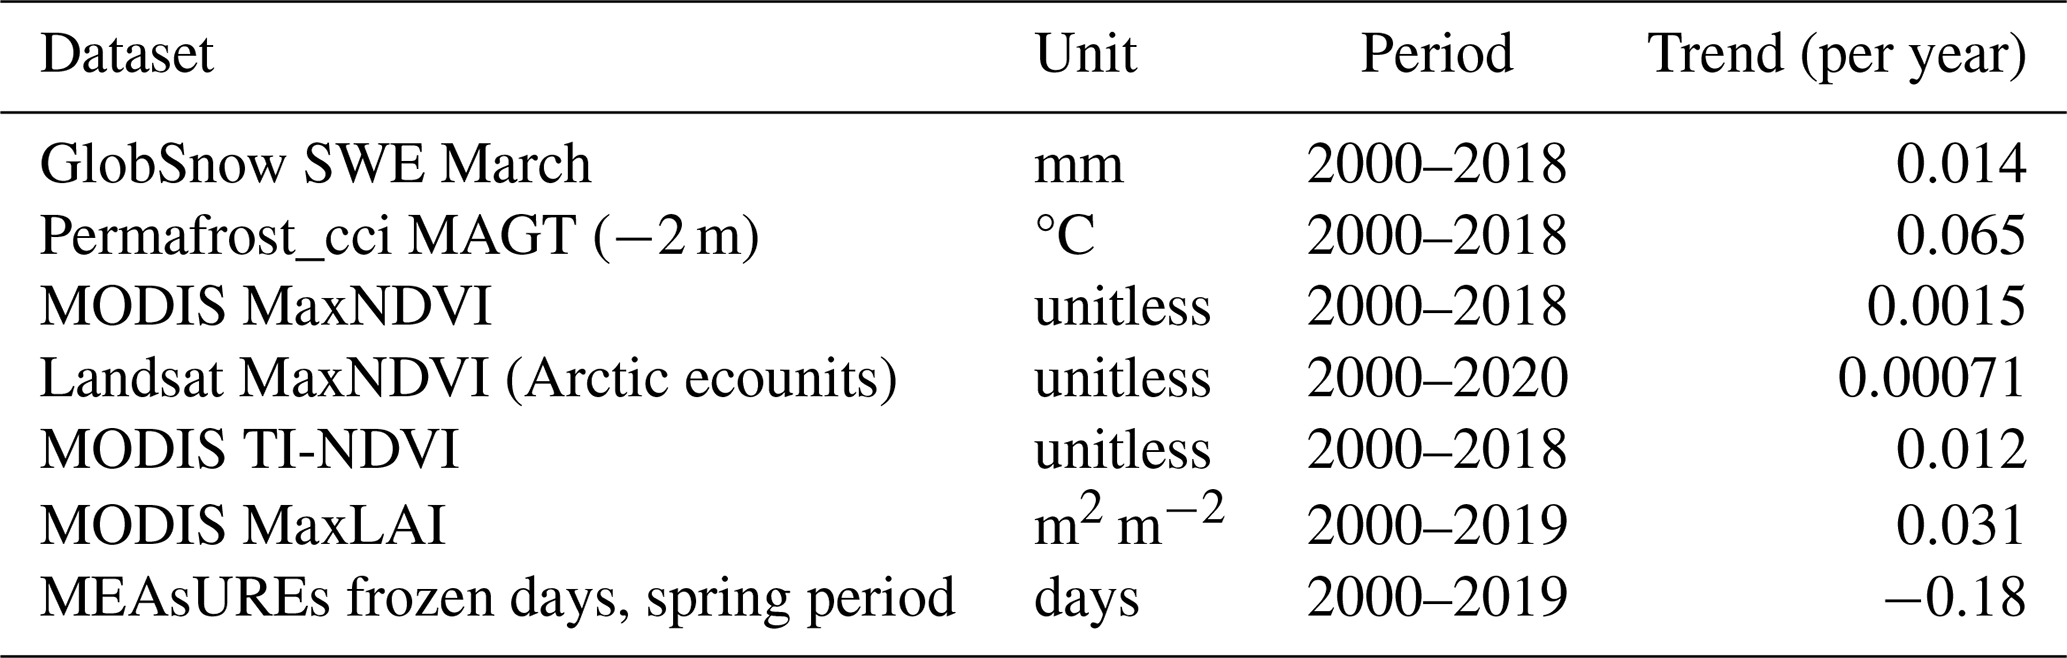
The relationship between sea ice extent and MAGT differed among the investigated regions, months, and Arctic Ocean basins. In general, the correlations were negative; that is, as sea ice area declines, ground temperatures increase (Figs. 4, A3). Northern central Siberia (Yamal Peninsula to Lena Delta and Kara Sea to Laptev Sea) and the Canadian Archipelago had the strongest relationship with sea ice in July to October. Not only for summer but also for most cold-season months, SIA was relevant for eastern Siberia (October to May, except December), specifically for Svalbard and NE Greenland (December to May).
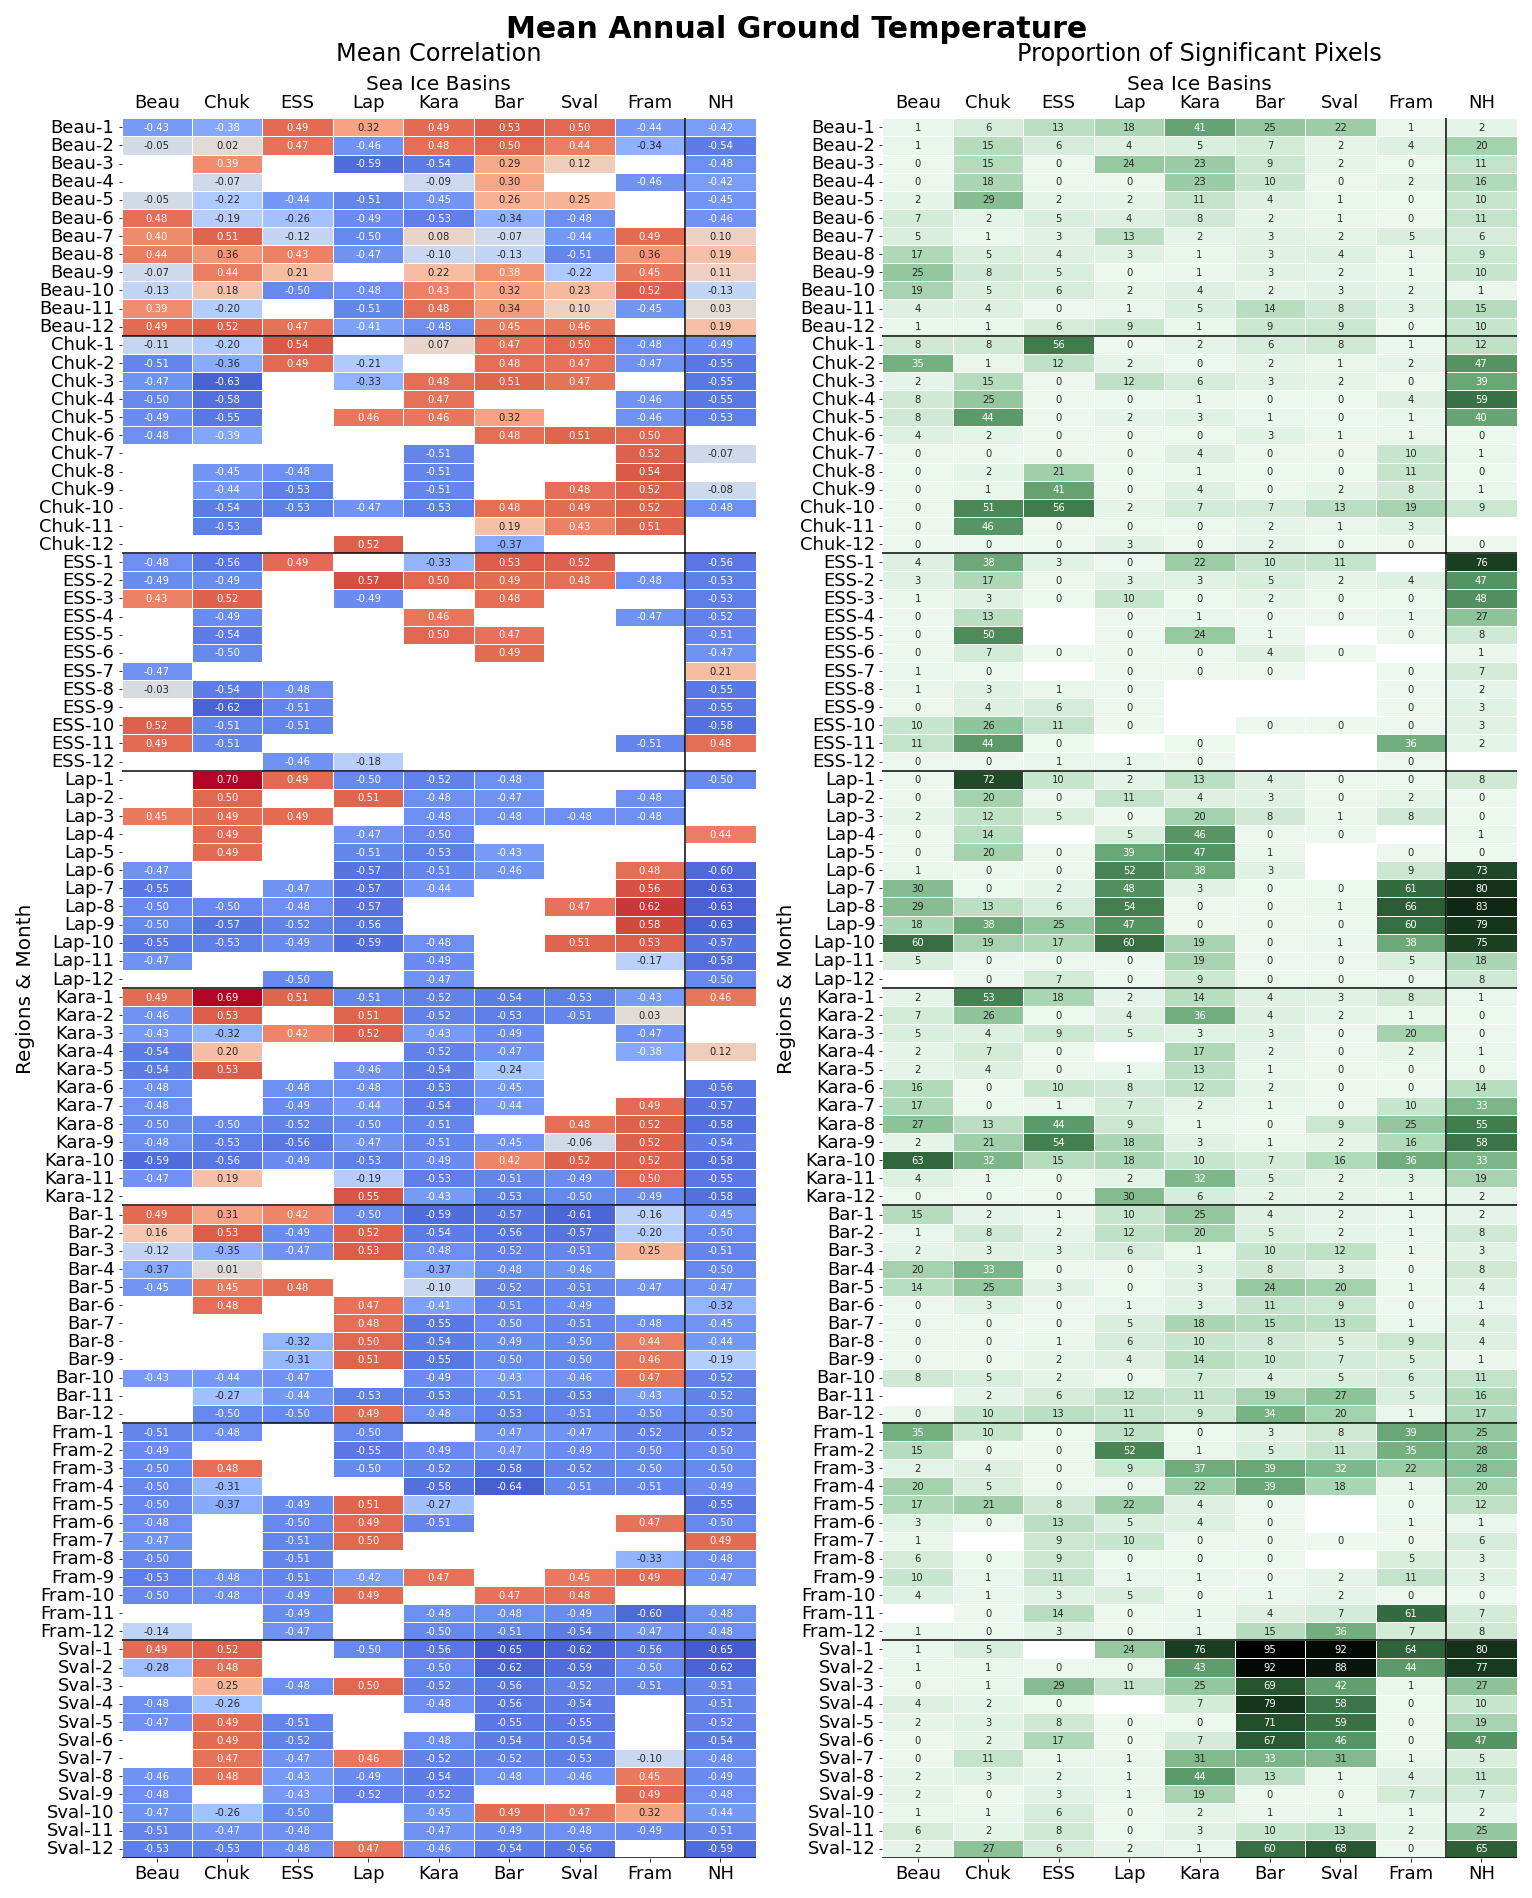
The fractions of land areas with significant correlations were in many cases lowest for December and highest for May to October. MAGT variations for most of western Siberia and northwestern Russia were linked to sea ice patterns of the relatively close Fram Strait in August to September and sea ice patterns of the Kara Sea in October and November (Fig. A4). Average correlations for tundra were around −0.5 (Fig. 4). The Chukchi Sea ice showed strong statistical links to changes in adjacent land areas and eastern Siberia in several months, specifically in transition periods. Negative correlations occur in early winter, with > 50 % of pixels having significant values. The Chukchi Sea CAVM region MAGT is relatively highly negatively correlated with cold-season SIA of the Chukchi Sea in addition to the eastern Siberian SIA in autumn.
Significant correlations with more distant basins were found in many cases. Chukchi Sea and Beaufort Sea ice variations were inversely correlated MAGT (< −0.5 on average, 63 % significant) in parts of western Siberia (Kara) for October. Central Siberian MAGT correlated with the East Siberian Sea (ESS) ice in August to October and with the Beaufort SIA for January to June (Fig. A4). Variations were also similar for the Canadian Archipelago MAGT and the Kara SIA from March to June in addition to the Beaufort SIA in September and October. Northern Fennoscandia showed partial similarities with Barents and Kara SIA from January to September. The western parts partially correlated with East Siberian Sea, Chukchi Sea, and Beaufort Sea ice variations in October to December. The MAGT of the Laptev Sea tundra regions co-varies with sea ice along its coast from May to October. In addition, summer–autumn SIA of the Beaufort Sea is significantly negatively correlated across the Laptev Sea tundra. The entire Northern Hemisphere SIA from spring to autumn most negatively correlated with the Laptev Sea CAVM region, with up to 80 % significant pixels, which is the highest value of all analyzed parameters. Higher values are only reached in the case of the linkage between the Svalbard and Barents SIA with the Svalbard unglaciated area.
Regionally, positive correlations were also observed. The Chukchi Sea January and February sea ice area was, for example, positively correlated with MAGT along the Kara Sea tundra region (0.53 to 0.69; 26 %–53 % proportion of significant values). Positive correlations were also found regarding the August and September Fram Strait sea ice extent. August to October SIA for the Beaufort Sea to Laptev Sea regions were negatively correlated with MAGT of the Kara Sea region. Positive significant correlations can be found for summer–autumn SIA conditions in the Fram Strait across all CAVM regions except the East Siberian Sea.
3.2.2 Sea ice versus MaxNDVI and TI-NDVI
Both negative and positive correlations between MaxNDVI and SIA were found (Figs. 5,A5). However, the highest significant fractions are negative, with more greening in cases of low sea ice extent. The same applies to TI-NDVI (Figs. 6, A7, A8). Distinct high positive correlations were found for the Chukchi Sea ice area across several regions (Figs. A9, A10). The results of the two indices show partially similar spatial patterns. Significant trends can be observed for far eastern Siberia in both cases. In April to May, central to eastern Siberian values increased, specifically related to sea ice variations in the Chukchi region for MaxNDVI and related to Beaufort SIA for TI-NDVI. This region has also been identified as relevant for TI-NDVI across the adjacent land area by Bhatt et al. (2010). July–December SIA variations in the Beaufort, Chukchi, and East Siberian seas showed similarities with both MaxNDVI and TI-NDVI across the European Russian Arctic and western Siberia. The highest proportion of significant pixels and the strongest negative correlations with TI-NDVI were obtained for the summer sea ice area of the Laptev and East Siberian seas and the adjacent land area (57 % and 47 % respectively). The Chukchi Sea tundra area TI-NDVI variations coincided with lower sea ice extent in the Chukchi Sea region. Higher proportions of significant pixels (14 %–18 %) and low average correlation values for MaxNDVI also occurred for the summer Laptev Sea ice area and adjacent land area. The highest proportions were, however, found for the Barents land area and Chukchi SIA.
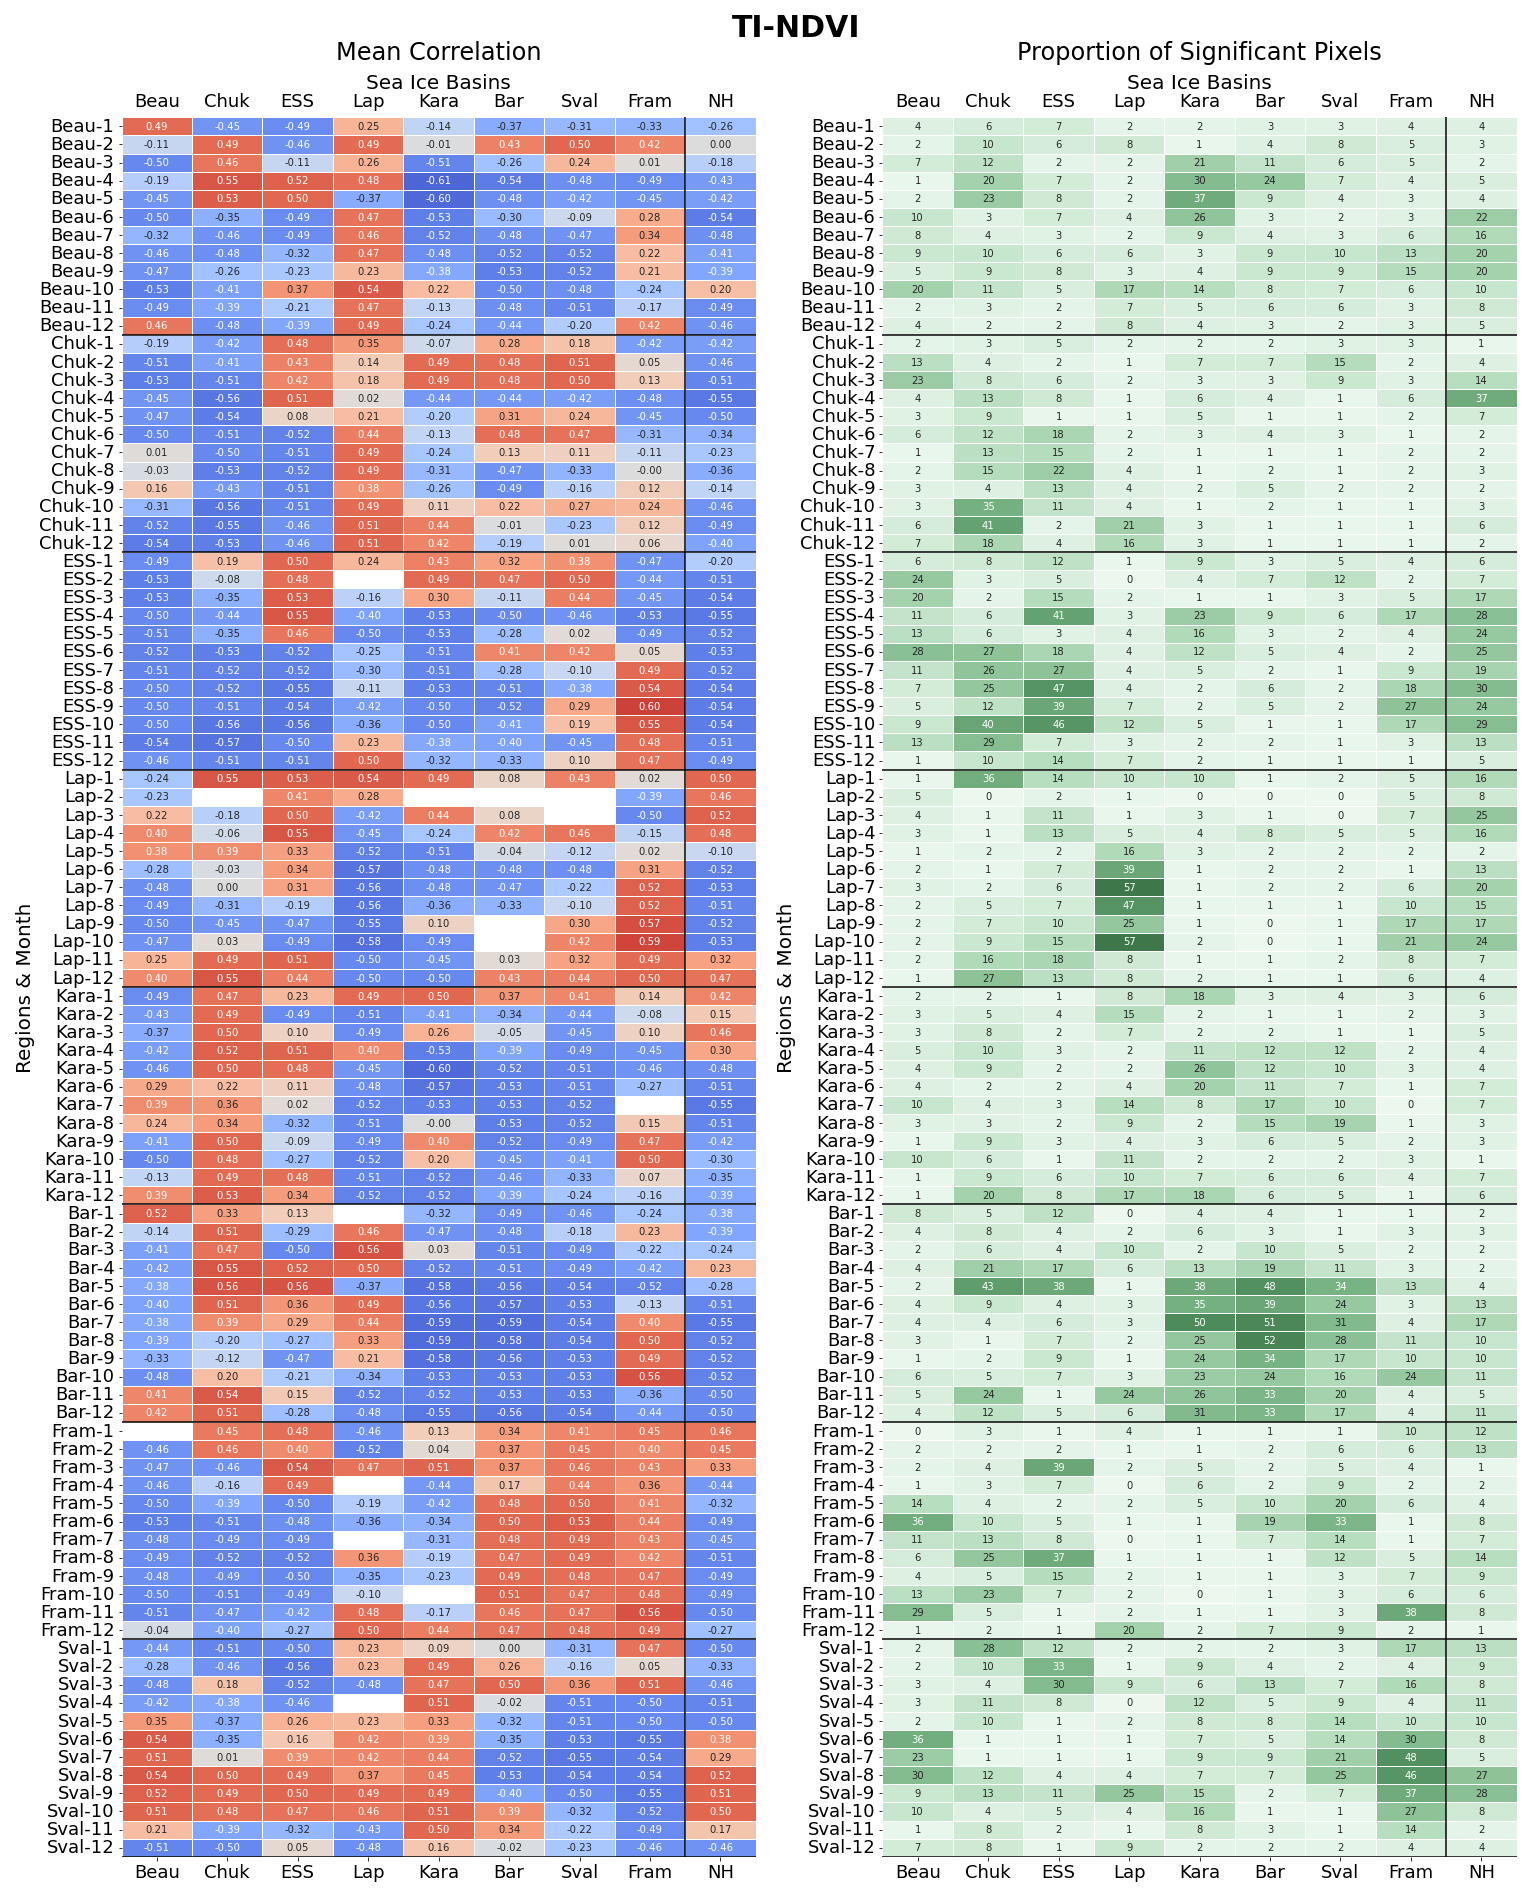
Positive correlations (high/low sea ice area–high/low TI-NDVI) were found for eastern Taymyr for November to January (Fig. A7; sea ice in the East Siberian Sea to Beaufort Sea regions; January preceding the TI-NDVI value and November and December after).
The importance of sea ice regions for vegetation can switch from basin to basin throughout the year. For example, the Kara Sea tundra region MaxNDVI correlated with ESS SIA in summer and with Barents and Svalbard SIA in April. The strong sea ice link of eastern to far eastern Siberia was also reflected in TI-NDVI correlation values (< −0.5). In the case of these highest values, the Beaufort SIA was relevant from January to June. This pattern switched to the Chukchi Sea and to East Siberian Sea from July to November.
Linkages for TI-NDVI could be also identified south of the CAVM boundary, specifically over Russia and Scandinavia (Figs. A8, A10). The June Fram Strait SIA correlated along the Norwegian coast. The Laptev Sea ice extent in July and August was linked to TI-NDVI in central Siberia.
3.2.3 Sea ice and SWE
March SWE and SIA correlations were partially negative and partially positive (Figs. 7, A11, A13, A12, A14). Nevertheless, minimum and maximum values derived from samples of the same pairing (land sub-region and sea ice basin) had mostly the same direction. Exceptions were SW Alaska for July (preceding year; lowest value for the Beaufort Sea and highest for Fram Strait Sea), Yamal for April (preceding year; lowest for ESS and highest for Kara Sea), and SE Taymyr for February (lowest for Fram Strait and highest for ESS).
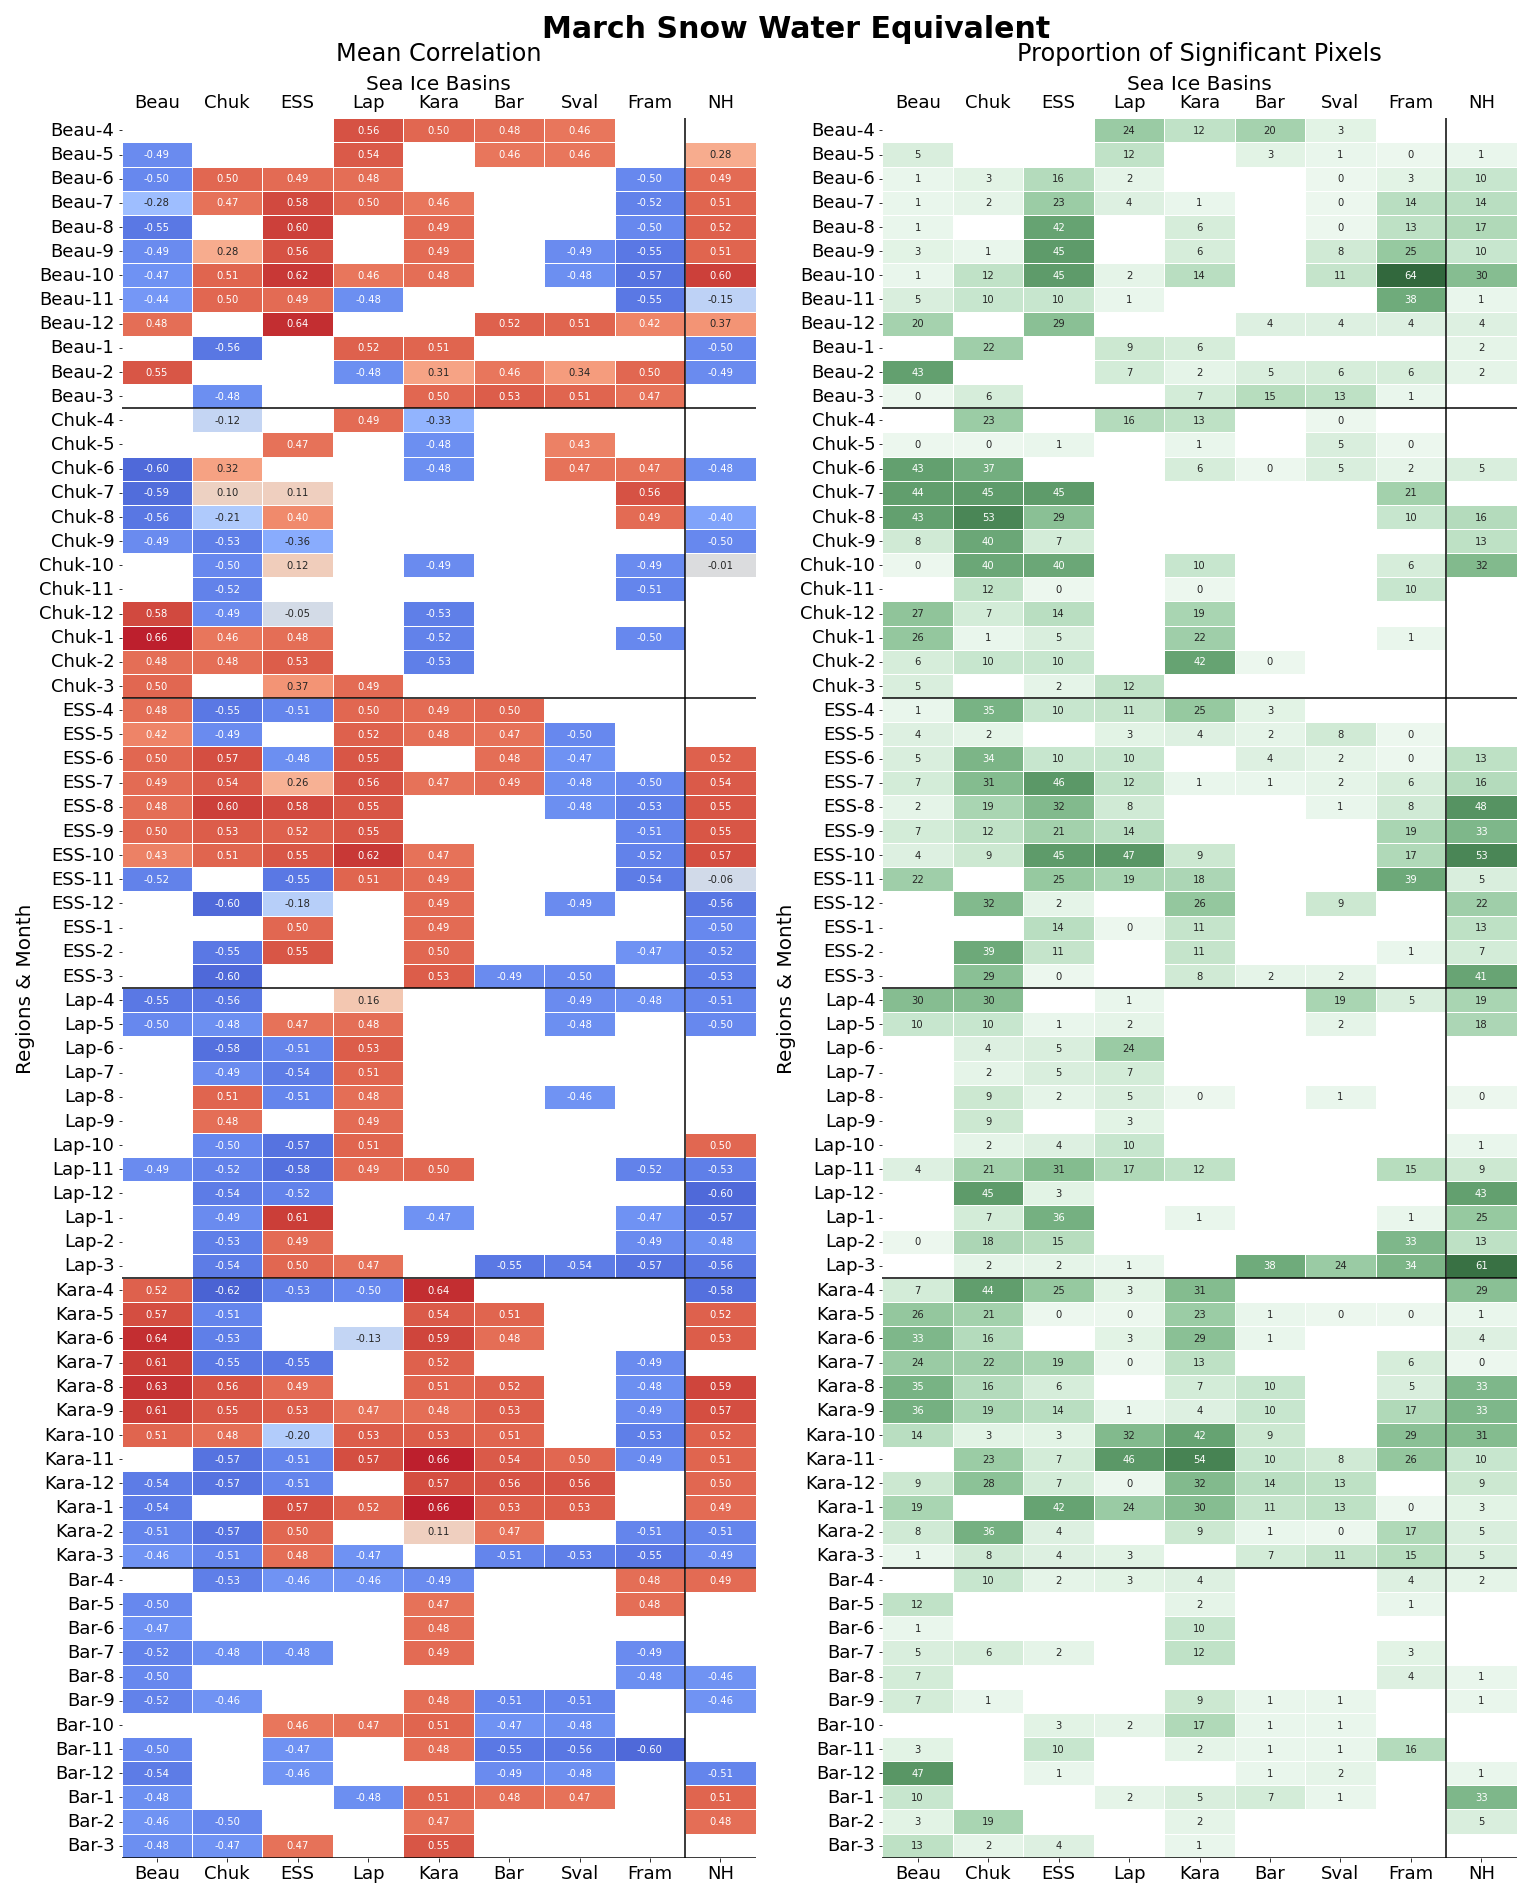
Lower-than-average sea ice conditions in February linked to higher SWE in March across many parts of Siberia and SW Alaska (Fig. A11). Negative correlation values are found for Chukchi Sea and Fram Strait SIA conditions across most CAVM regions. For March, Fram Strait linkages were most dominant (Fig. A12). Parts of Alaska exhibited a significant negative correlation with October and November Fram Strait SIA and a positive correlation for December to February Beaufort SIA. December–March SIA in the Chukchi Sea correlated negatively with SWE in eastern Siberia. Beaufort and Chukchi SIA correlated negatively with parts of central Siberia for almost all months, except March. Positive correlations for parts of western to central Siberia were found for the Kara SIA for October, November, and January. Thus, over this region, larger sea ice extent in autumn linked to higher SWE in March.
SIA in the Chukchi, East Siberian, and Kara seas and in the Fram Strait, along with the NH average SIA, showed the highest proportions of significant correlations with SWE in tundra areas (Fig. 7). The NH average SIA across the cold season correlated significantly with SWE specifically in East Siberian Sea, Laptev coast, and Kara Sea regions (Figs. A12 and A14). Barents and Svalbard SIA had comparably fewer significant correlations with March SWE (Fig. 7). The land area adjacent to the Chukchi Sea had high SWE when SIA in the Chukchi and Beaufort Sea was low in the previous summer/autumn. The Kara Sea tundra regions had higher March SWE when the NH and Fram Strait average SIA was low in January/February and when the Fram Strait SIA was low in autumn (but also high SWE with high SIA in the Kara Sea and Beaufort Sea region and with high NH average SIA in early winter).
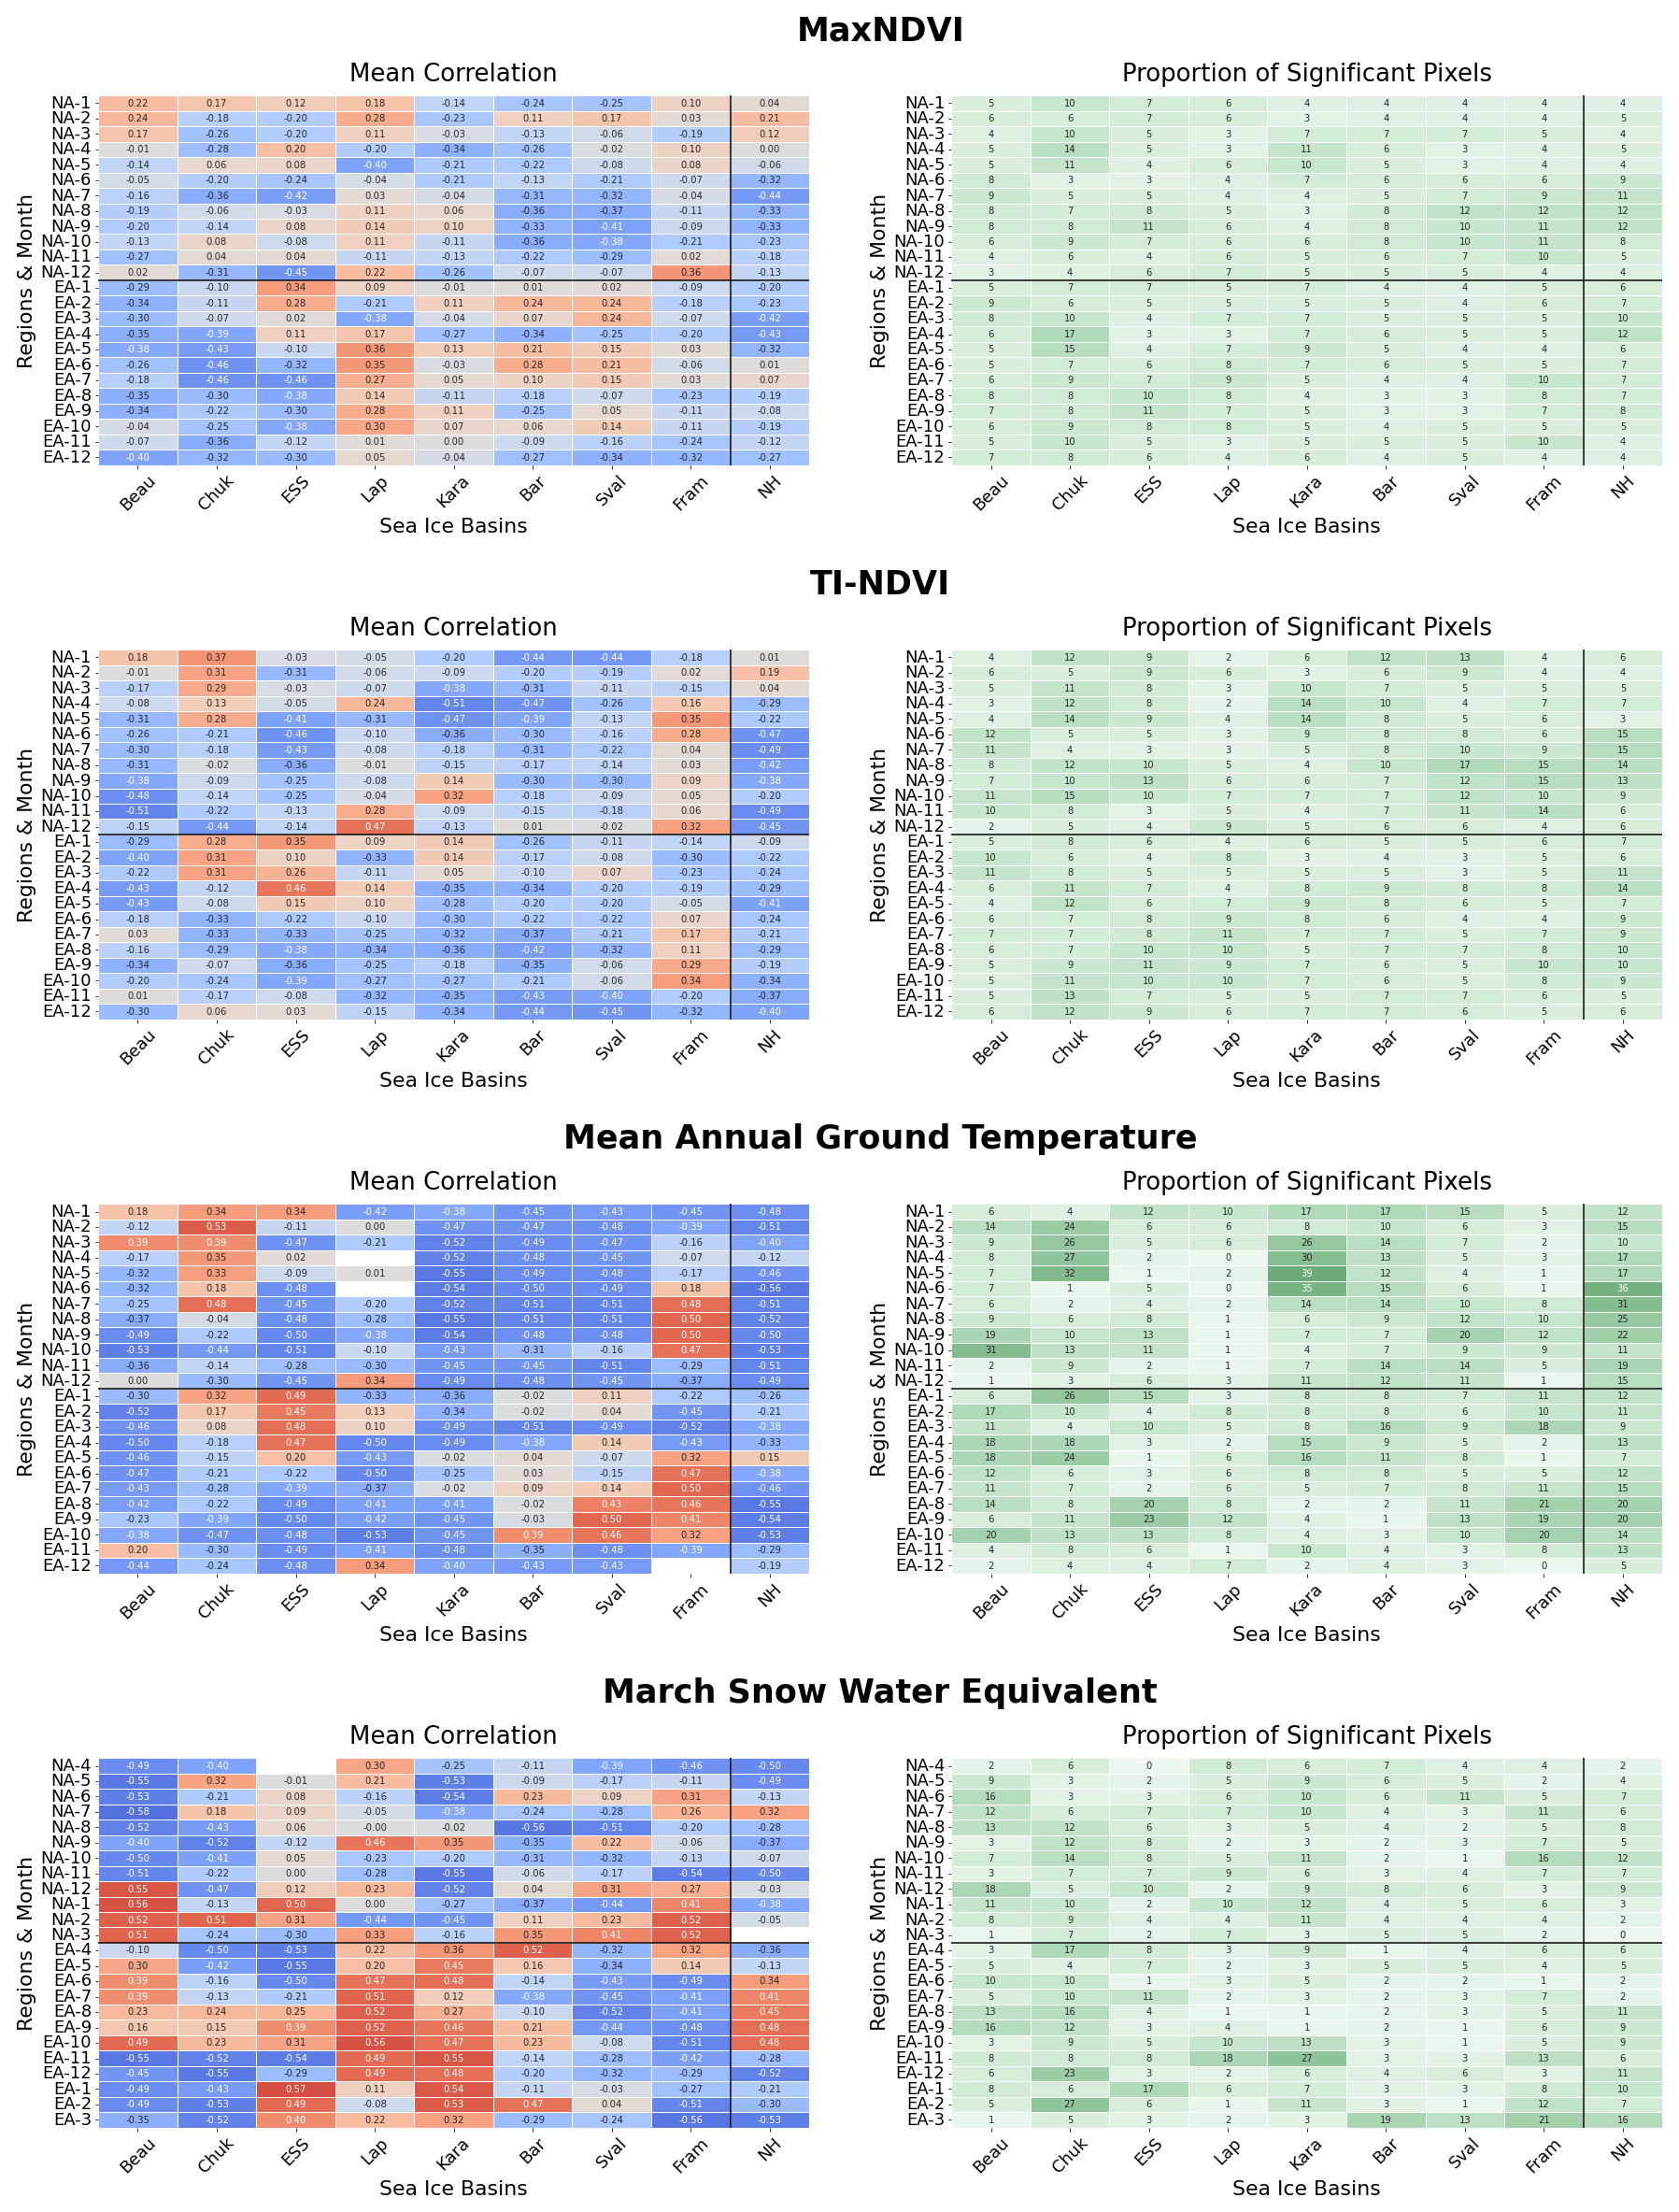
Figure 8Significant correlations (95 %) and proportion of significant pixels for sea ice area (by basin; see Fig. 1 for abbreviations) versus mean annual ground temperature, MaxNDVI, TI-NDVI, and snow water equivalent within North America (NA) and Eurasia (EA) north of 60° N. In the case of SWE, months 4–12 represent the preceding year. See Table 4 for data sources.
4.1 Trends
Li et al. (2023) demonstrated issues with orbital drift in AVHRR/GIMMS. Our results and those of Frost et al. (2025) confirm differences in the MaxNDVI trend results compared to MODIS and Landsat. Trend patterns of MODIS and Landsat do, however, largely agree (Fig. A1), confirming the utility of the MODIS dataset chosen for our study.
Bhatt et al. (2017) reported a declining trend in TI-NDVI and browning for Yamal based on AHVRR/GIMMS. This is also reported for western Siberia, including parts of Yamal, for 1982–2019 by Druckenmiller et al. (2021). MODIS- and Landsat-based trend analyses starting in 2000, however, show increasing values (Fig. A1). The regions with the strongest positive TI-NDVI trends for 2000–2019 (Fig. 3) were the Taymir Peninsula and parts of northern mainland Canada. These regions coincide with areas of increased solar absorption trends (1998–2015; potentially due to earlier snowmelt timing), as identified previously with reanalysis data (Letterly et al., 2018), and with regions that have decreasing trends in frozen days during springtime (2000–2019, Fig. A1).
The SWE trend investigation by Pulliainen et al. (2020) focused on March for 1980–2018. The study also found statistically significant trends in increasing snow water equivalent (SWE) over regions in both western Siberia and the Russian Far East. In contrast, Pulliainen et al. (2020) reported decreasing trends in SWE over North America, notably over regions surrounding Hudson Bay and areas adjacent to the Beaufort Sea. The latter also agrees with our results based on the years 2000–2018.
4.2 Correlations
4.2.1 Vegetation parameters
Both spring and summer sea ice extent were found to play a role for NDVI derivatives but with differing spatial patterns. While summer sea ice conditions showed low negative correlations specifically with tundra regions across all Arctic coasts, this was less pronounced for winter sea ice.
The regions identified as areas with strong positive trends in TI-NDVI (Fig. 3) show distinct sea ice correlation patterns compared to other areas. Correlations are positive for several months in autumn and early winter, meaning that higher sea ice extents coincide with higher TI-NDVI in the preceding summer. In northern Canada, the highest correlations were found vs. the Kara Sea ice extent, and, in Taymyr, these were found for the Chukchi Sea (Figs. A9 and A10). Comparably high positive TI-NDVI correlations (with 15 %–21 % significant values) also occurred for November and December for the Laptev SIA and the Chukchi Sea tundra region. So far, only preceding and temporally coincident sea ice conditions with the vegetation growing season have been discussed in the literature. Our results indicate that patterns which drive processes reflected in NDVI may regionally relate to colder-than-average conditions towards autumn, leading to earlier sea ice formation. Further analysis is needed for clarification.
The use of predefined sea ice basin extents in our study resulted in broader investigated areas than in Bhatt et al. (2013) and also in the exclusion of some regions. The latter specifically applies to the Canadian Arctic Archipelago, Baffin Bay, and the Davis Strait, for which Bhatt et al. (2013) found comparably high correlations of open-water extent with TI-NDVI on adjacent land area. The boundaries of the other sea ice basins, however, mostly agree with those used by Bhatt et al. (2013), but sub-basins for the Barents, Kara, and Chukchi seas were merged in our analysis. The significant correlations for the East Siberian Sea and Chukchi Sea identified in Bhatt et al. (2013) agree with results from our study. Similar correlations were found in our study for the Laptev Sea summer months and adjacent land area (appr. 0.3 R2; 0.31 in Bhatt et al., 2013). Different results were obtained for the Kara Sea. R2 values higher than 0.3 were identified for MODIS-derived TI-NDVI (2000–2019) compared to 0.06/0.07 based on the AVHRR TI-NDVI (1982–2008) reported in Bhatt et al. (2013). This might be due to the different observation period, indicating recent changes in this region, or to issues with the AVHRR dataset (Li et al., 2023).
In our study, MaxNDVI more strongly reflects sea ice changes than previously reported (Bhatt et al., 2021). Bhatt et al. (2021) obtained −0.07 and −0.33 for the CAVM zones of northern Eurasia and North America. Negative correlations were stronger (mostly < −0.4) in our results, which are based on MODIS instead of AVHRR/GIMMS. Our analysis cannot confirm the stronger negative correlations for MaxNDVI over North America as compared to Siberia identified in Bhatt et al. (2021), as Bhatt et al. (2021) used 50 % sea ice concentration timing (which can represent differing months), and this study compiled correlations for specific months.
TI-NDVI correlations for May and June sea ice extent across northwestern Russia were more negative than for MaxNDVI, with the strongest link being with the adjacent Kara Sea. This early-summer pattern agrees with monthly NDVI regional analyses for this region in Macias-Fauria et al. (2012), who identified May as a month of importance for the period 1992–2005. In our results, April appears more relevant for the more recent analysis period (2000–2019). This might relate to continuous decline in sea ice extent across all months. However, the proportion of significant correlations was only 18 % (Fig. 5). The partial linkage of NDVI on Svalbard with the surrounding SIA found by Macias-Fauria et al. (2017) and Karlsen et al. (2024) was confirmed in our analysis. The months selected by Karlsen et al. (2024) for sea ice area averaging (May to September) showed the highest proportion of significant values (up to 25 %) in the case of Svalbard SIA, but our results show that more distant basins also have significant correlations with Svalbard NDVI (Fig. 6). These include the neighboring Fram Strait (negative correlation, up to 48 % significant) and the Beaufort Sea area (positive correlation, up to 36 % significant) in the case of TI-NDVI. The negative correlations of Svalbard NDVI-based variables with the Fram Strait sea ice extent also agree with Macias-Fauria et al. (2012), who attributed them to the dynamics of the North Atlantic Oscillation driving warm air advection and sea ice decline in the wider region.
Bhatt et al. (2013, 2021) suggested that the linkage between sea ice and NDVI indices becomes weaker with the advancement of sea ice decline. The patterns identified with data covering 2000–2019 are, however, similar to results for a longer period based on AVHRR. Similarly, Karlsen et al. (2024) reported a recent rapid increase in Svalbard tundra productivity, evidenced as the integrated MODIS-NDVI from the phenologically based onset (O) to the peak (P) of the growing season (OP NDVI). This trend was strongly related to the recent increase in growing season temperature and in agreement with the last decade's transition from perennial sea ice to absent sea ice around the eastern part of the Svalbard archipelago. Further on, rapid expansion of tundra on Svalbard linked to sea ice decline was noted by Ingrosso et al. (2025). Significant negative correlations were also found in our study for Svalbard (Figs. 5 and 6).
The specific TI-NDVI correlation spatial patterns identified by Dutrieux et al. (2012) for the Taymyr to eastern Siberian regions (decline in correlations with distance to coast, up to 300 km, in June) can be partially confirmed. However, this pattern cannot be observed for other months, specifically for the following ones (after June), which show higher correlations with sea ice area in this region (Fig. 6).
The selected vegetation parameters have been investigated without attribution to certain land cover types. Parmentier et al. (2015) found a negative correlation of sea ice (within 2000 km distance) with modeled methane emissions from wetlands across the Arctic specifically for September and October. A combination of the correlation analyses with land cover may thus provide additional insights. Furthermore, common satellite-derived vegetation parameters, such as leaf area index (LAI) or phenology indicators (e.g., Park et al., 2016), may also provide additional insight into regional patterns. However, MaxLAI index trends show similar patterns to MaxNDVI trends, exemplifying the general linkage of LAI with NDVI (Figs. 3 and A1), and were thus not considered in the present study. An alternative parameter available from passive microwave satellite records is vegetation optical depth (VOD). Observed patterns have been shown to be relevant for recent changes in parts of the Canadian Arctic and northeastern Siberia (Watts et al., 2025). Phenology may also be represented through proxies such as snow extent or freeze–thaw datasets. The representation of the transition periods in satellite-derived freeze–thaw records is, however, challenging (Bartsch et al., 2025b).
4.2.2 Cryosphere parameters
Sea ice key regions were identified for March SWE (Fig. 9). Specifically, the Fram Strait and Chukchi Sea variations are reflected in SWE across the Arctic, including western Siberia.
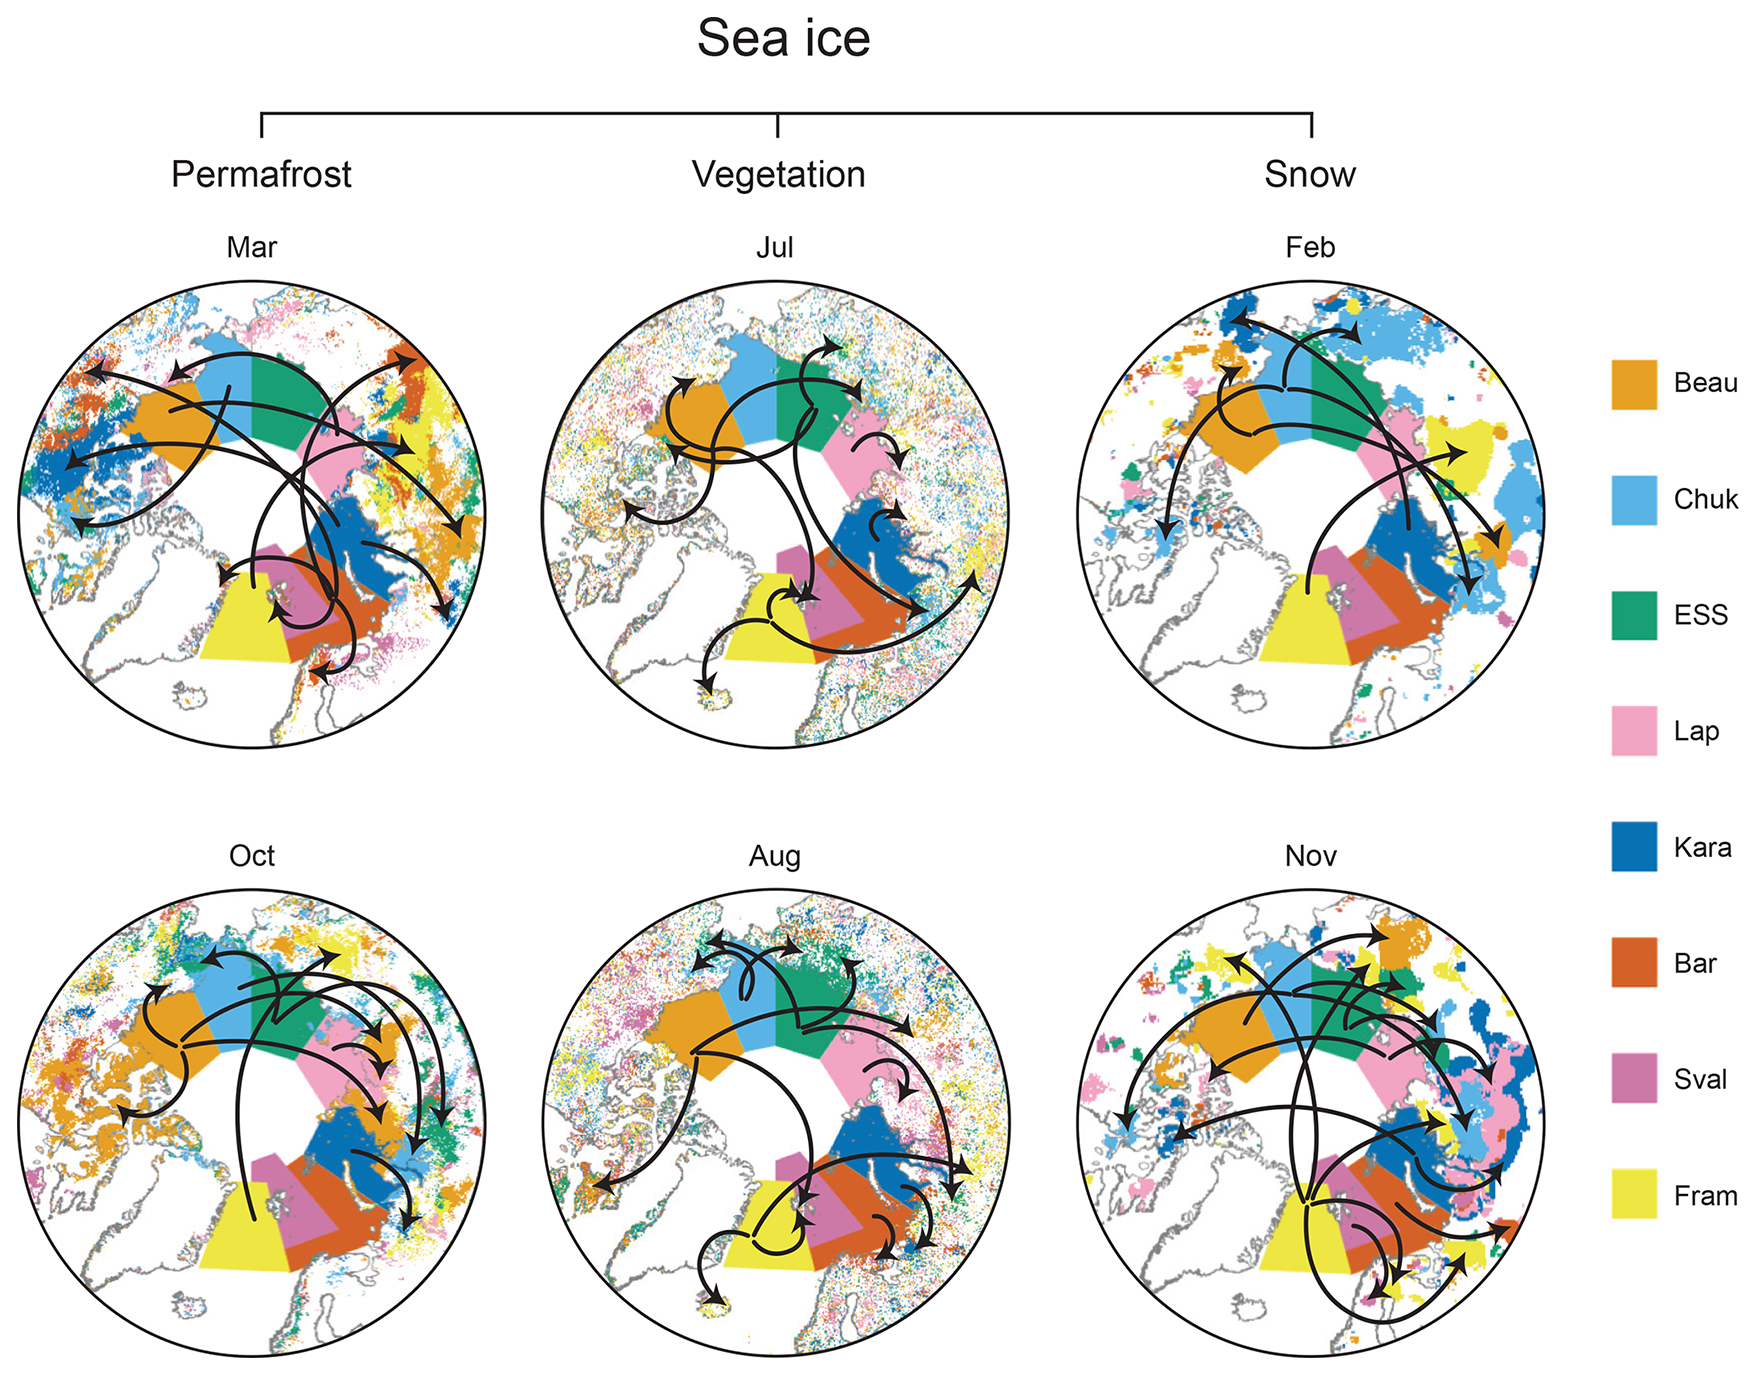
Figure 9Areas with significant correlations for selected months and annotations (arrows) highlighting linkages. Permafrost: mean annual ground temperature at 2 m depth; Vegetation top: MaxNDVI (maximum normalized difference vegetation index); Vegetation bottom: TI-NDVI (time-integrated normalized difference vegetation index); Snow: March SWE (snow water equivalent).
The importance of sea ice for northern Eurasian snow conditions reported by Park et al. (2013) based on modeled snow depth for 1979–2006 can be confirmed for our analysis period 2000–2019. However, de-trending leads to insignificant results for eastern Siberia. The importance of the Chukchi Sea ice conditions for SWE across Alaska reported by Alexeev et al. (2016) for 1991–2008 were also confirmed by our results. Significant correlations were found for the Chukchi, East Siberian, and Laptev seas, which supports the link between Chukchi Sea ice and SWE variations in the Siberian Far East suggested by Pulliainen et al. (2020). Pulliainen et al. (2020) noted drastic snowfall events as a result of loss of sea ice in the adjoining Chukchi Sea during the last 2 years of the study period.
High negative correlations of March SWE with SIA in regions such as northern Fennoscandia and Svalbard may have implications for wildlife and reindeer herding (Bokhorst et al., 2009; Vikhamar-Schuler et al., 2016). The increasing fragmentation of reindeer habitat in Svalbard (and possibly other areas around the circumpolar area), due to loss of sea ice (SIA) as dispersal corridors (Peeters et al., 2020), will likely reduce the overall “effective” area of suitable habitats (Pedersen et al., 2023). However, increased greening might compensate for this (Karlsen et al., 2024). SWE phenology and structure changes may also potentially affect wildlife (Bartsch et al., 2023a). The analyses of additional months and further related observables might therefore be of added value. Forbes et al. (2016) suggested a linkage of sea ice conditions with rain-on-snow events for the land area adjacent to the Kara Sea, which impact wildlife, vegetation, and ground temperatures. So far, reliable rain-on-snow detection based on satellite data has been limited to mid-winter, and the number of documented large-scale events is rather low (Bartsch et al., 2023a). Linkages could thus not yet been proven based on satellite records.
Significant negative correlations with comparably distant sea ice basins, in addition to adjacent ones, were found for MAGT (Fig. 9). Such long-distance linkages across the Arctic were also found for ice sheets and permafrost (active layer thickness; Sasgen et al., 2024). A high similarity with Arctic impact indices (from reanalysis data) was found for central Siberian active layer thickness and for the mass balance of the northern part of the Greenland ice sheet. Central Siberia MAGT also showed significant negative correlations with the Fram Strait SIA from January to March in our study (Fig. A4). However, for permafrost, the Beaufort and East Siberian seas appear to be the key regions. Sea ice in these basins showed significant correlations with land area, specifically in autumn (Fig. 9). This included regions in Siberia. In the case of the Beaufort SIA, results also indicate a strong linkage with MAGT across the Canadian High Arctic for autumn. This could not be found for winter conditions (e.g., March; Fig. 9). Correlations for MAGT were stronger than for vegetation parameters and had the highest significant fraction among all parameters despite the chosen depth of 2 m.
4.2.3 Similarities and causalities
Significant month-specific correlations with de-trended SIA time series were found across the year for all investigated land parameters. For both TI-NDVI and MaxNDVI, significant correlations were also observed outside of the CAVM region, across the taiga biome, both in Eurasia (including Scandinavian mountain ranges) and northern America. Parmentier et al. (2015) showed that linkages might exist even further south than for the extent of this study and also for SIA across Hudson Bay and the Canadian Archipelago. These sea ice basins are not included in the OSI SAF records used but would be needed for more in-depth analyses of this region. While mostly negative correlations (low SIA – increased greenness, more snowfall, etc.) are discussed in the literature, positive correlations were also found for MAGT and vegetation indices for some summer months, specifically for the Fram Strait sea ice basin. This region is an area of sea ice export (Spreen et al., 2020; Anonymous, 2025) where increases have been documented for spring and summer during recent decades (Smedsrud et al., 2017).
Regions with significant correlations with sea ice are to some extent similar for ground temperature and NDVI (e.g., Figs. A3 and A5). Specifically, results for eastern Siberia show significant correlations for these parameters but differences in related sea ice basins. In the case of ground temperatures, we identified linkages with more distant basins than compared to NDVI, where the adjacent basins show the highest correlations across the Arctic (Fig. 9). The latter applies specifically to the summer months July and August. In general, the timing of significant correlation and related sea ice basins varied strongly across regions and parameters, indicating a range of potential causal linkages. This agrees with previous studies on selected regions and/or other parameters that have identified specific, differing relevant time periods and suggested potential causal linkages. This included early-summer SIA and vegetation (e.g., Macias-Fauria et al., 2012, as well as Macias-Fauria et al., 2017) and sea ice and simulated autumn methane emissions from wetland areas (Parmentier et al., 2015), both with negative correlations. In the case of the Laptev Sea region, correlations of vegetation and temperature parameters with adjacent sea ice basin conditions might be linked through atmospheric large-scale circulation during springtime and land–sea–air transport in summer (Rehder et al., 2020). For the second case, causality was found for increases in temperature and moisture over land (which accompany low SIA) in both directions (Rehder et al., 2020). Vegetation-change-driven sea ice decline (albedo change caused surface heating imbalances, leading to sea level pressure anomalies) has also been suggested based on Earth system modeling (Zhang et al., 2020). Synchronous variations in different observables over larger distances, across the Arctic Ocean, have previously been identified and suggested to relate to atmospheric circulation patterns (for glacier mass balance in northern Greenland and permafrost active layer thickness in central Siberia; Sasgen et al., 2024), specifically features of the North Atlantic Oscillation and the Greenland Blocking Index.
The ASILaC dataset provides information on both previously regionally documented and additional potential linkages, close and distant, and thus a baseline for future studies on common drivers of essential climate variables and dependencies across the Arctic. The consideration of Arctic change indices as applied by Sasgen et al. (2024) for glacier mass balance and permafrost active layer thickness may support such analyses.
Significant correlations of sea ice with satellite-based terrestrial variables across the Arctic are reported in this study. The importance of certain sea ice basins and timing differed between permafrost ground temperature, vegetation indices, and snow water equivalent. Autumn (incl. October and November) and mid-winter (incl. February, March) were most relevant for both investigated cryosphere-related parameters of permafrost temperature and March snow water equivalent (used here as a proxy for maximum).
NDVI analyses confirm previous studies for the CAVM/tundra zone. However, added value is provided through the inclusion of areas outside the tundra region. Areas with significant correlations extend into the boreal forest biome specifically across Siberia. A further aspect was added through consideration of succeeding SIA conditions. For example, summers with high MaxNDVI along the Laptev Sea are followed by high sea ice concentration in the Chukchi Sea.
SWE analyses confirm previous modeling results. Chukchi Sea ice affects March SWE in adjacent land areas. The Fram Strait SIA also has specific regional linkages (adjacent tundra region of the Kara Sea). Previous studies were, however, confined to September sea ice extent. Our results show that cold-season SIA is of relevance across several areas. March SWE correlates highest with January–March SIA.
Sea ice and MAGT have so far only been investigated for the entire Northern Hemisphere. The MAGT variation analyses for separate regions revealed differences. For the CAVM zone, significant correlations are reported for the Kara and Laptev seas, with respect to sea ice basins located eastwards and across the Arctic Ocean. Strongest linkages between sea ice and MAGT were found for Svalbard and the Laptev Sea regions but with distinct timing. Winter SIA in the proximity correlated strongly with the Svalbard unglaciated areas, whereas summer SIA correlated with the Laptev Sea coast.
In the case of ground temperatures, high significant correlations against SIA were found for more distant basins than for NDVI, where the adjacent sea ice basins are more relevant. March SWE for both distant and adjacent land area showed significant results. The linkages of the cryosphere parameters with comparably distant sea ice basins indicate an influence of larger atmospheric circulation patterns throughout the year. This differs for vegetation parameters which are rather influenced by land–sea–air transport in summer, potentially both ways. Although similarities were found between TI-NDVI and MaxNDVI, more significant correlations were observed for TI-NDVI. Both TI-NDVI and MaxNDVI are integrative parameters over the growing season. The inclusion of phenology-related indicators could provide additional information on vegetation-related aspects. Potential linkages might be missed due to the lack of representation of the Hudson Bay and Canadian Archipelago SIA. The current dataset nevertheless provides a baseline for extended analyses of drivers and dependencies, also including reanalysis data.
A1 Trends
Comiso and Hall (2014)AMAP (2017)Table A1Satellite records used in selected published trend discussions for the Arctic.
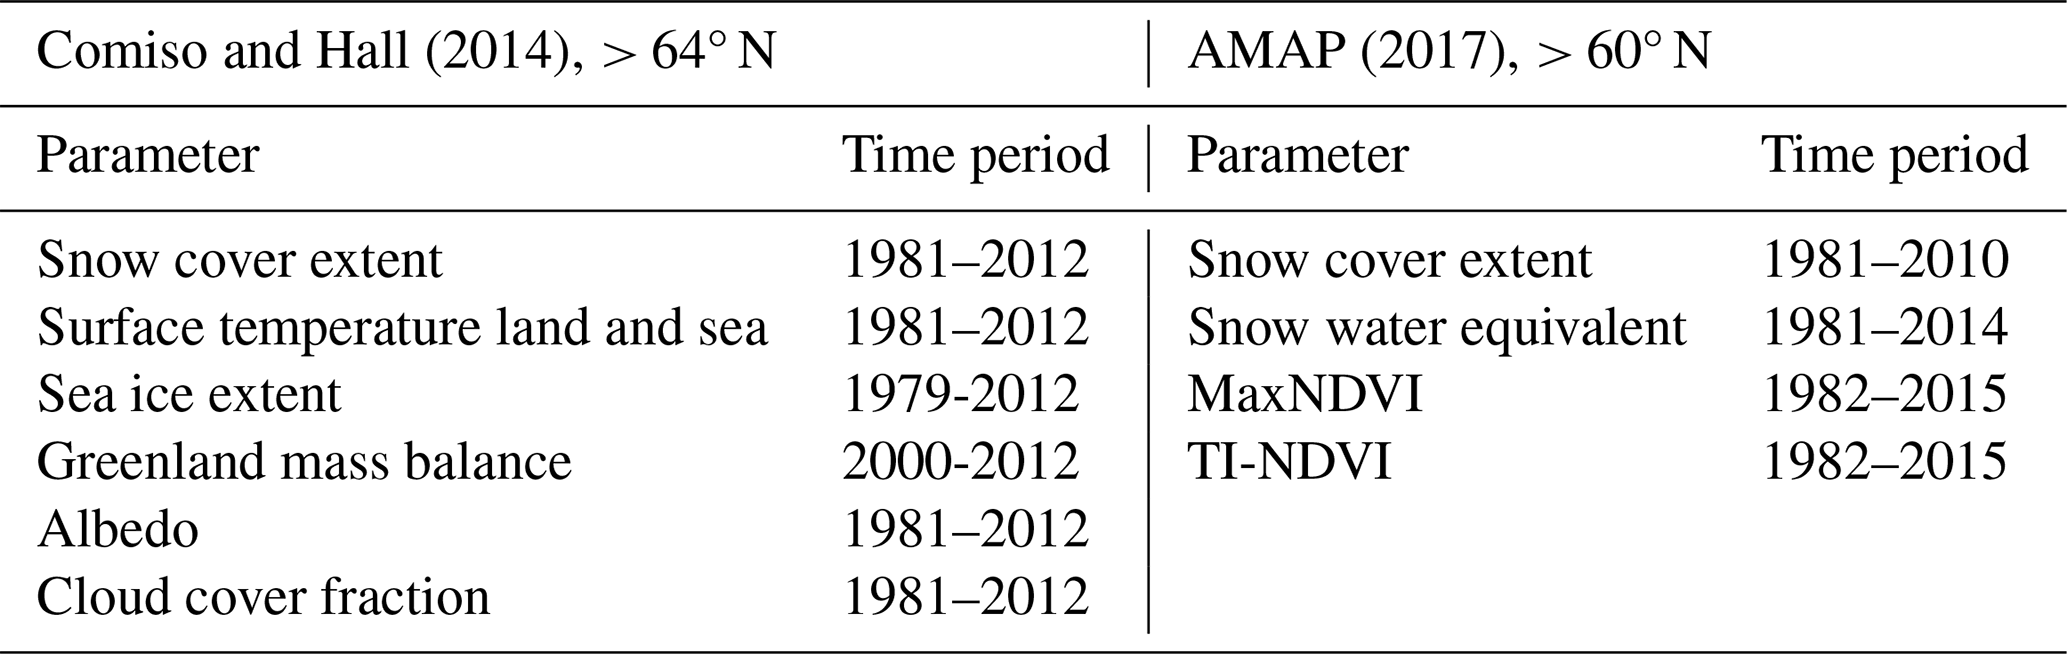
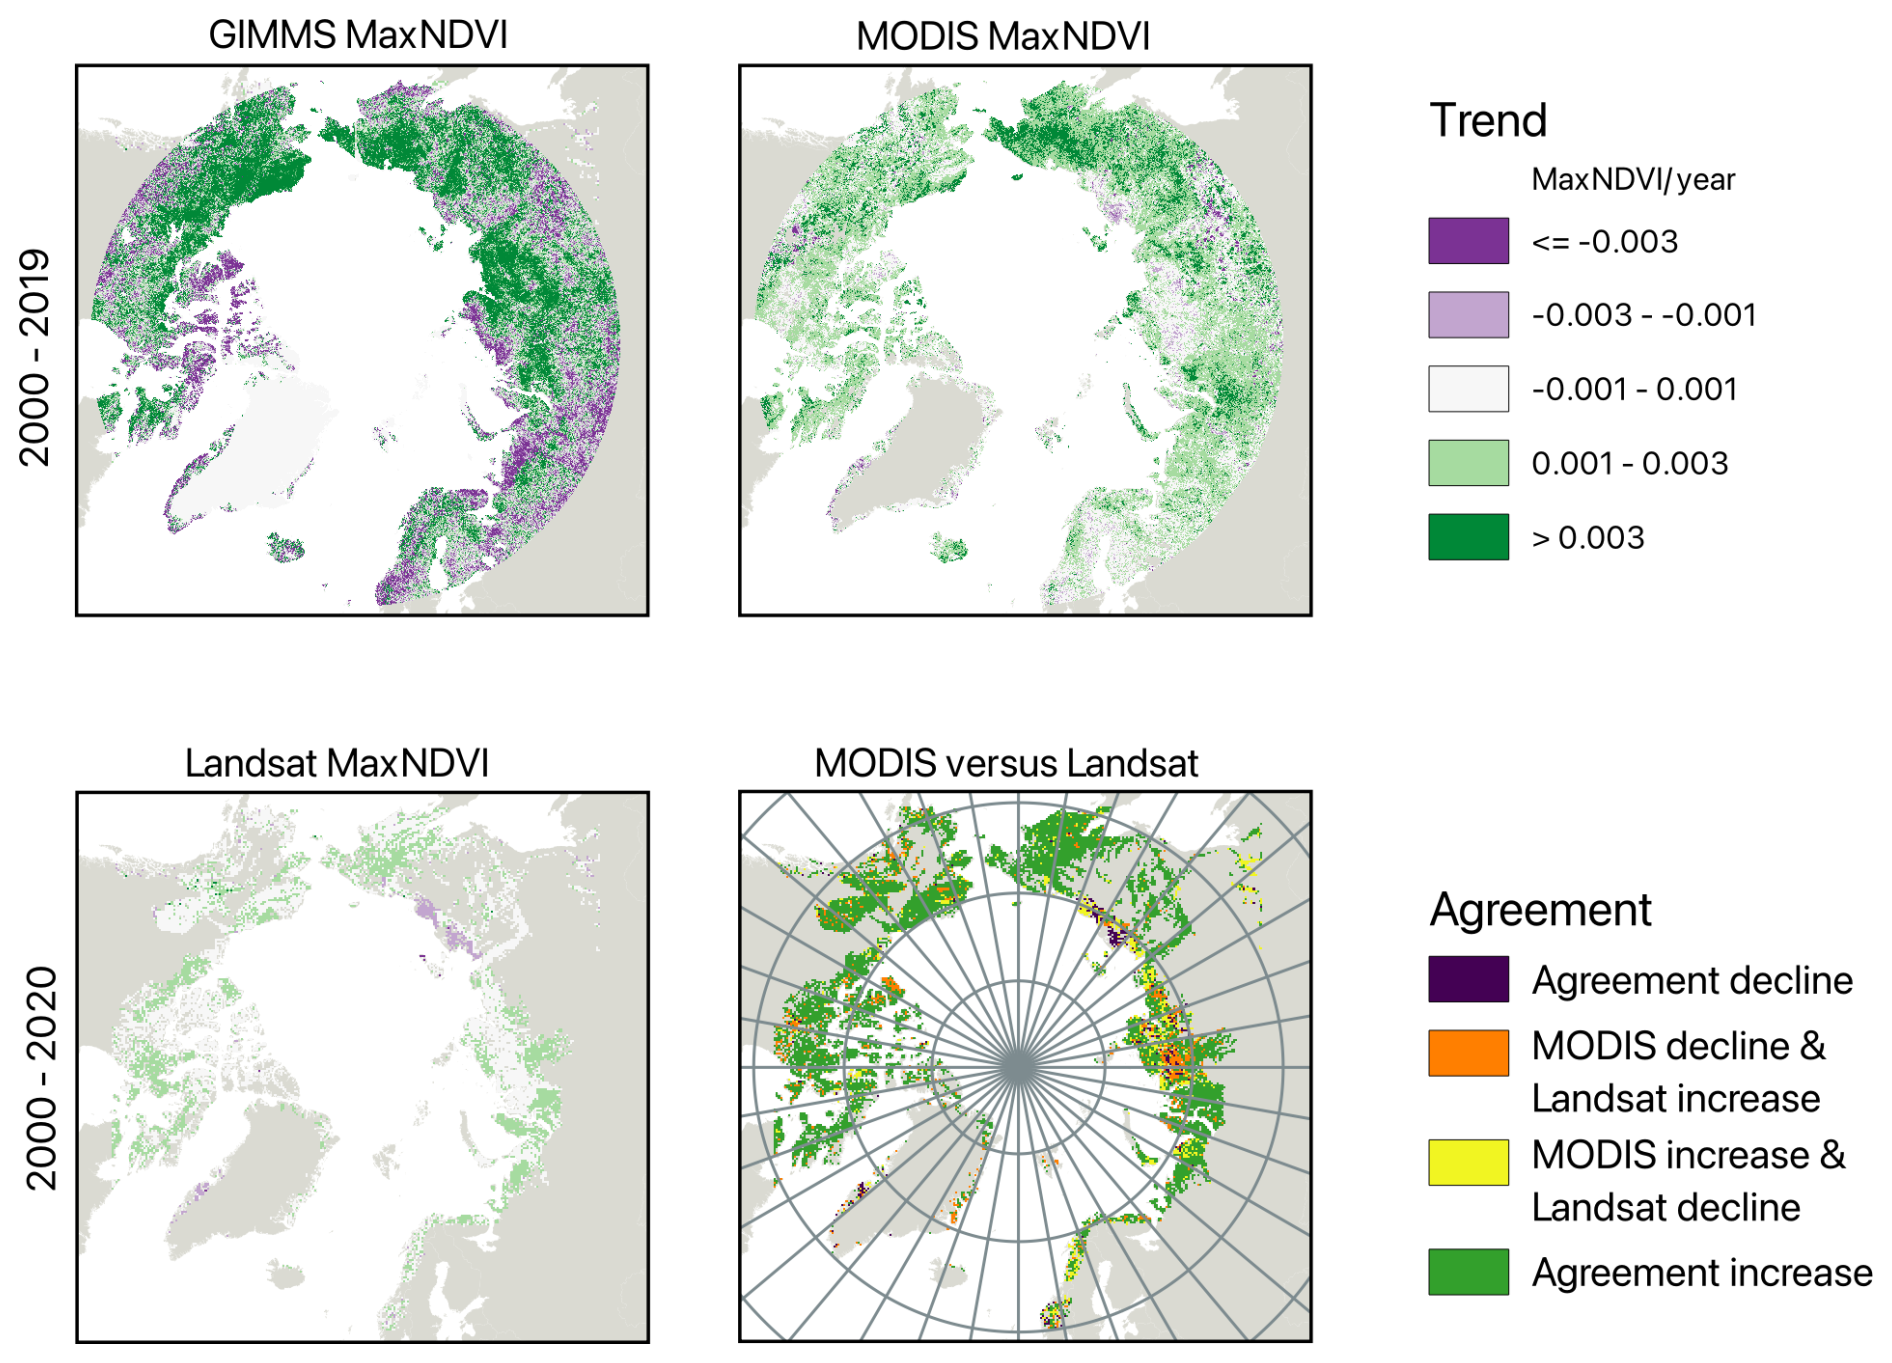
Figure A1MaxNDVI trends for selected datasets: AVHRR (GIMMS)-, Landsat (Mekonnen et al., 2021)-, and MODIS-derived MaxNDVI trends for 2000–2019/2020.
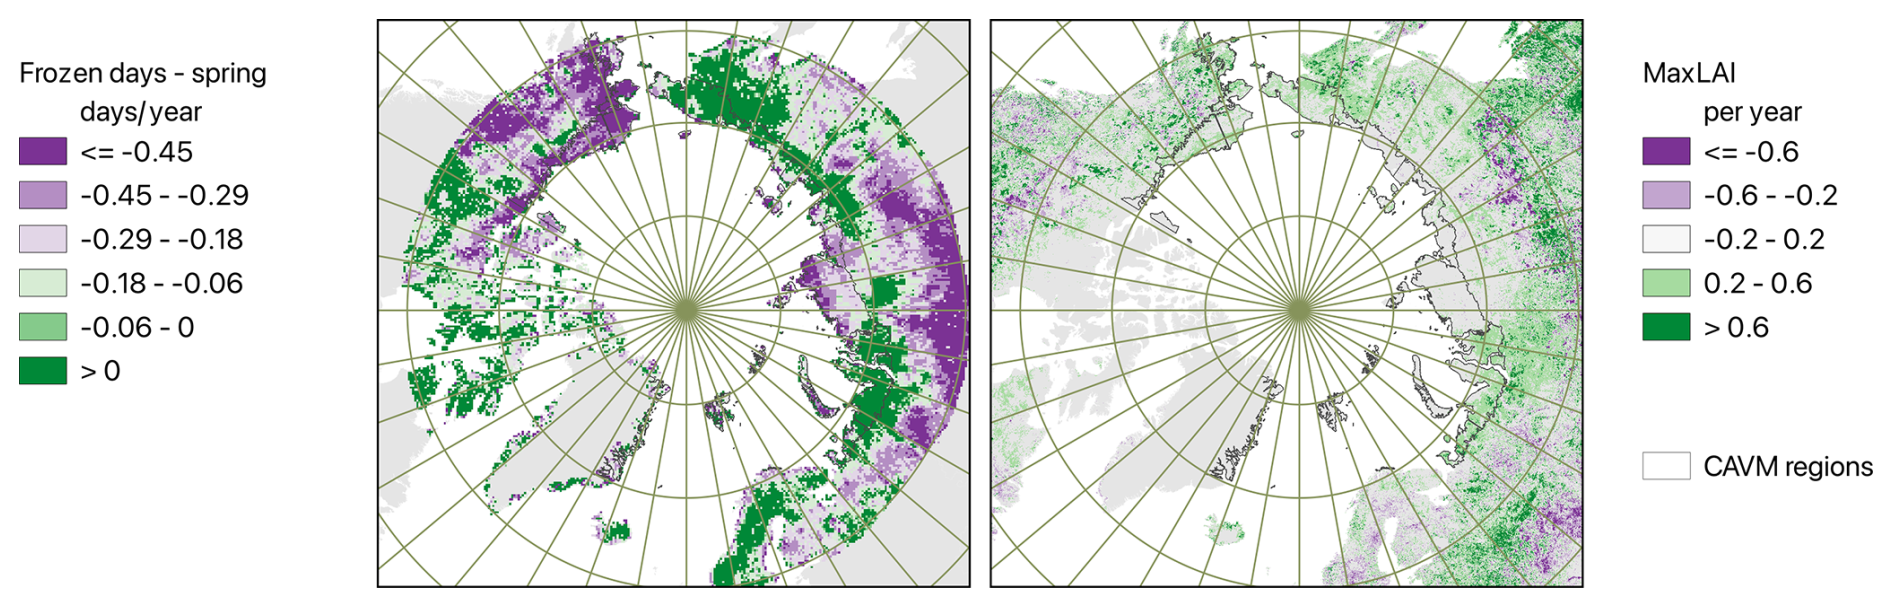
Figure A2Trends in thawing period length derived from MEAsUREs (Kim et al., 2021) and maximum leaf area index based on MODIS (Tømmervik, 2025), 2000–2019.
Table A2Averaged trends for north of 60° N for all analysis records. For specifications, see Table 4.
A2 Correlations
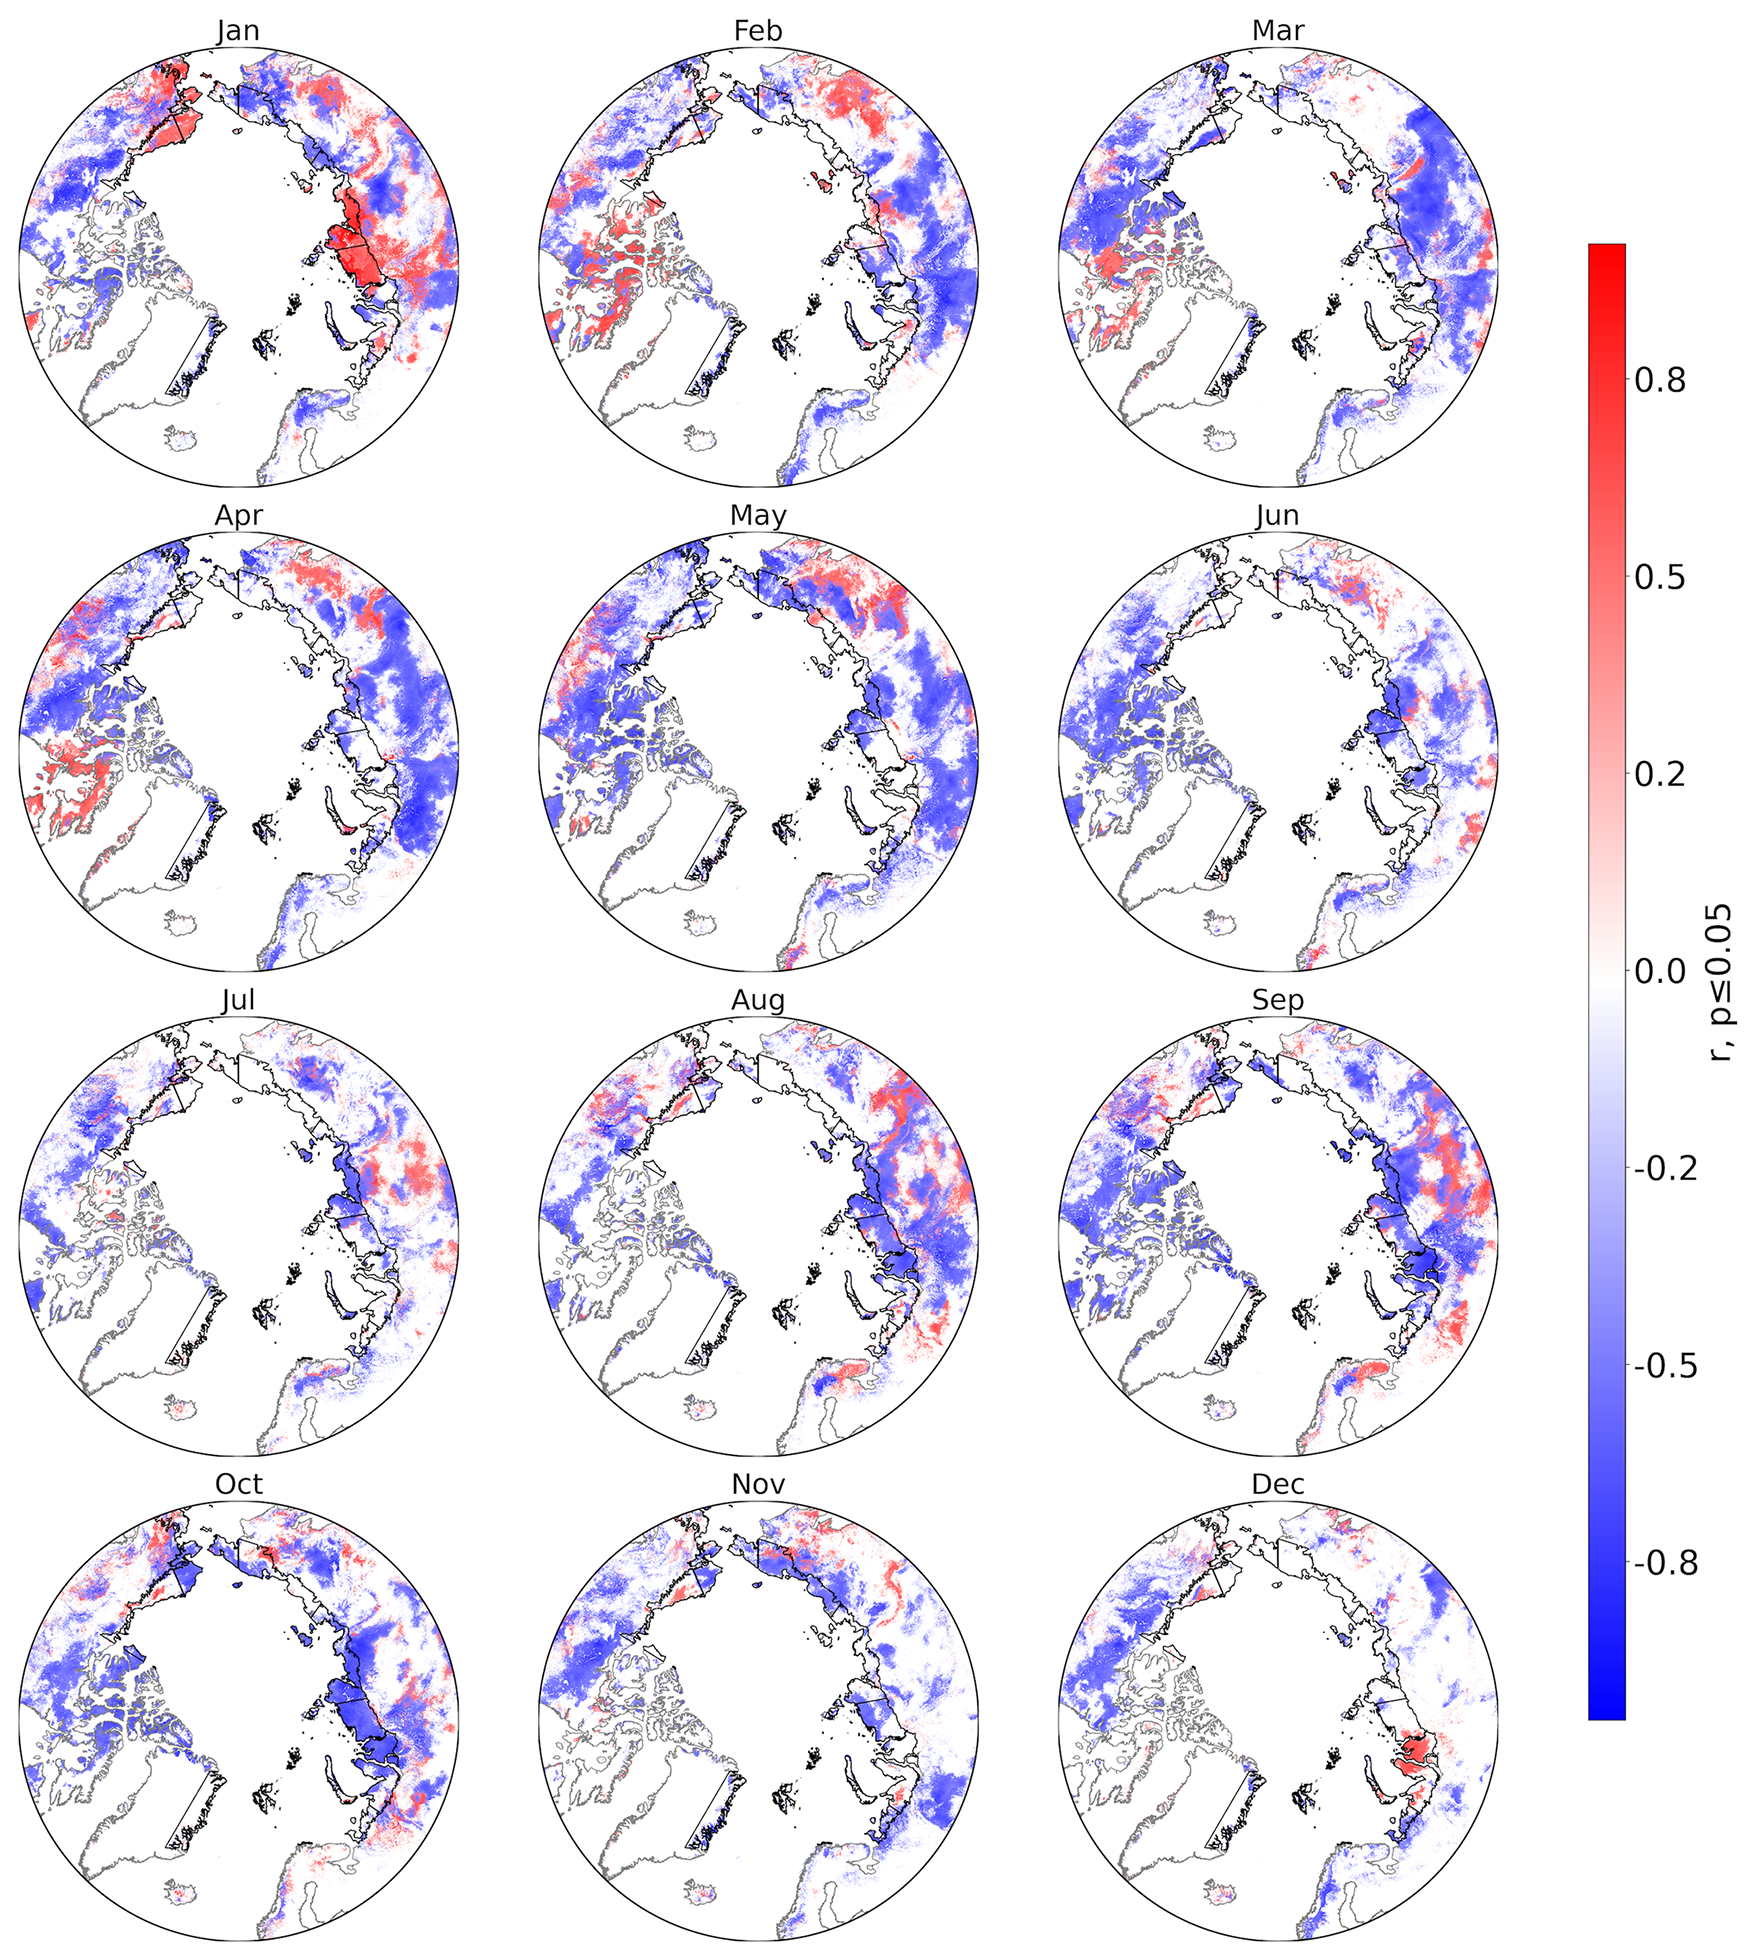
Figure A3Minimum correlation of mean annual ground temperature at 2 m depth (Obu et al., 2021b) and monthly basin-specific sea ice area (OSI SAF and EUMETSAT SAF On Ocean And Sea Ice, 2020), 2000–2019.
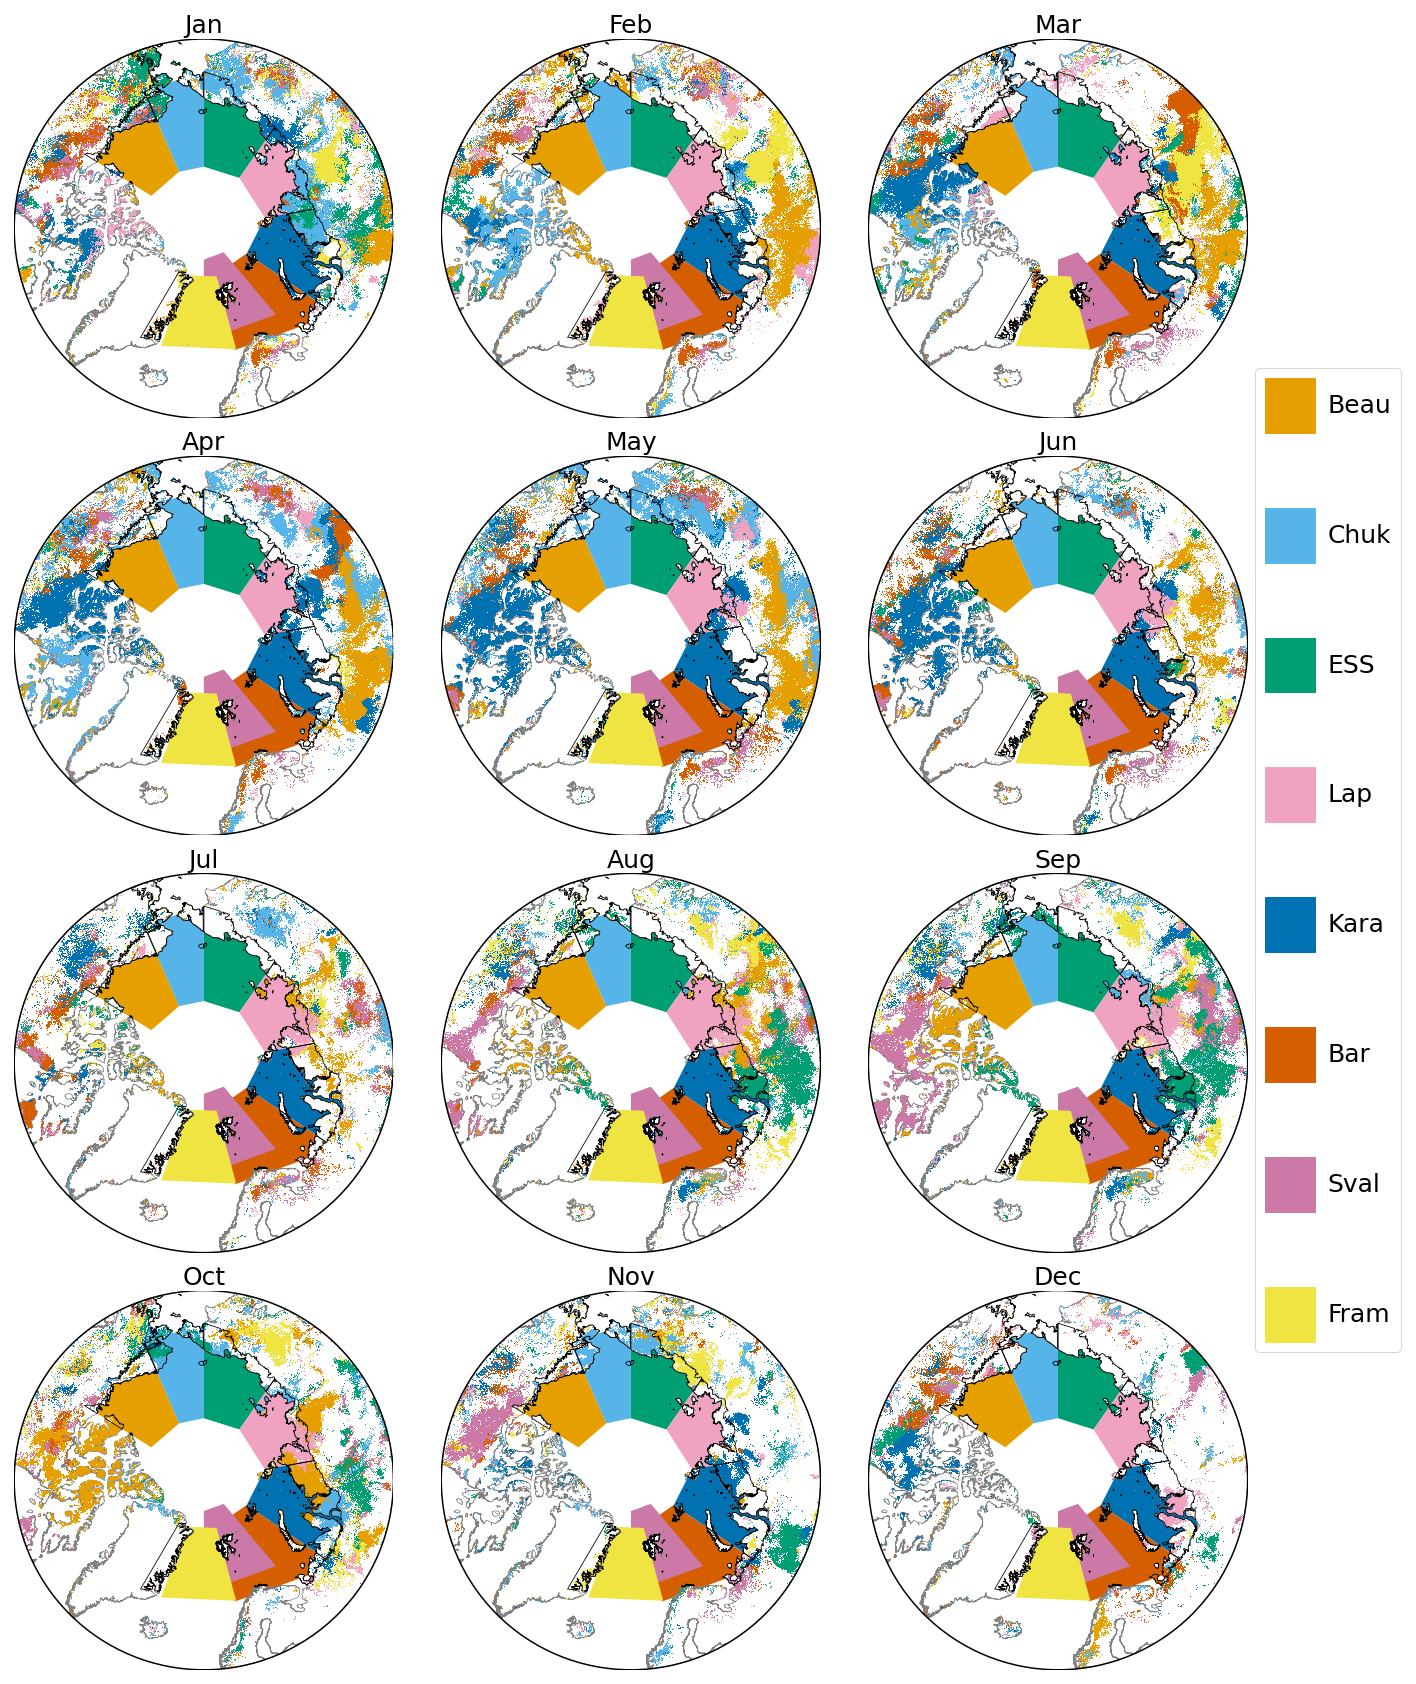
Figure A4Area with significant minimum correlation of mean annual ground temperature at 2 m depth (Obu et al., 2021b) with sea ice area and associated basin (OSI SAF and EUMETSAT SAF On Ocean And Sea Ice, 2020), 2000–2019. For actual basin extent and legend, see Fig. 1.
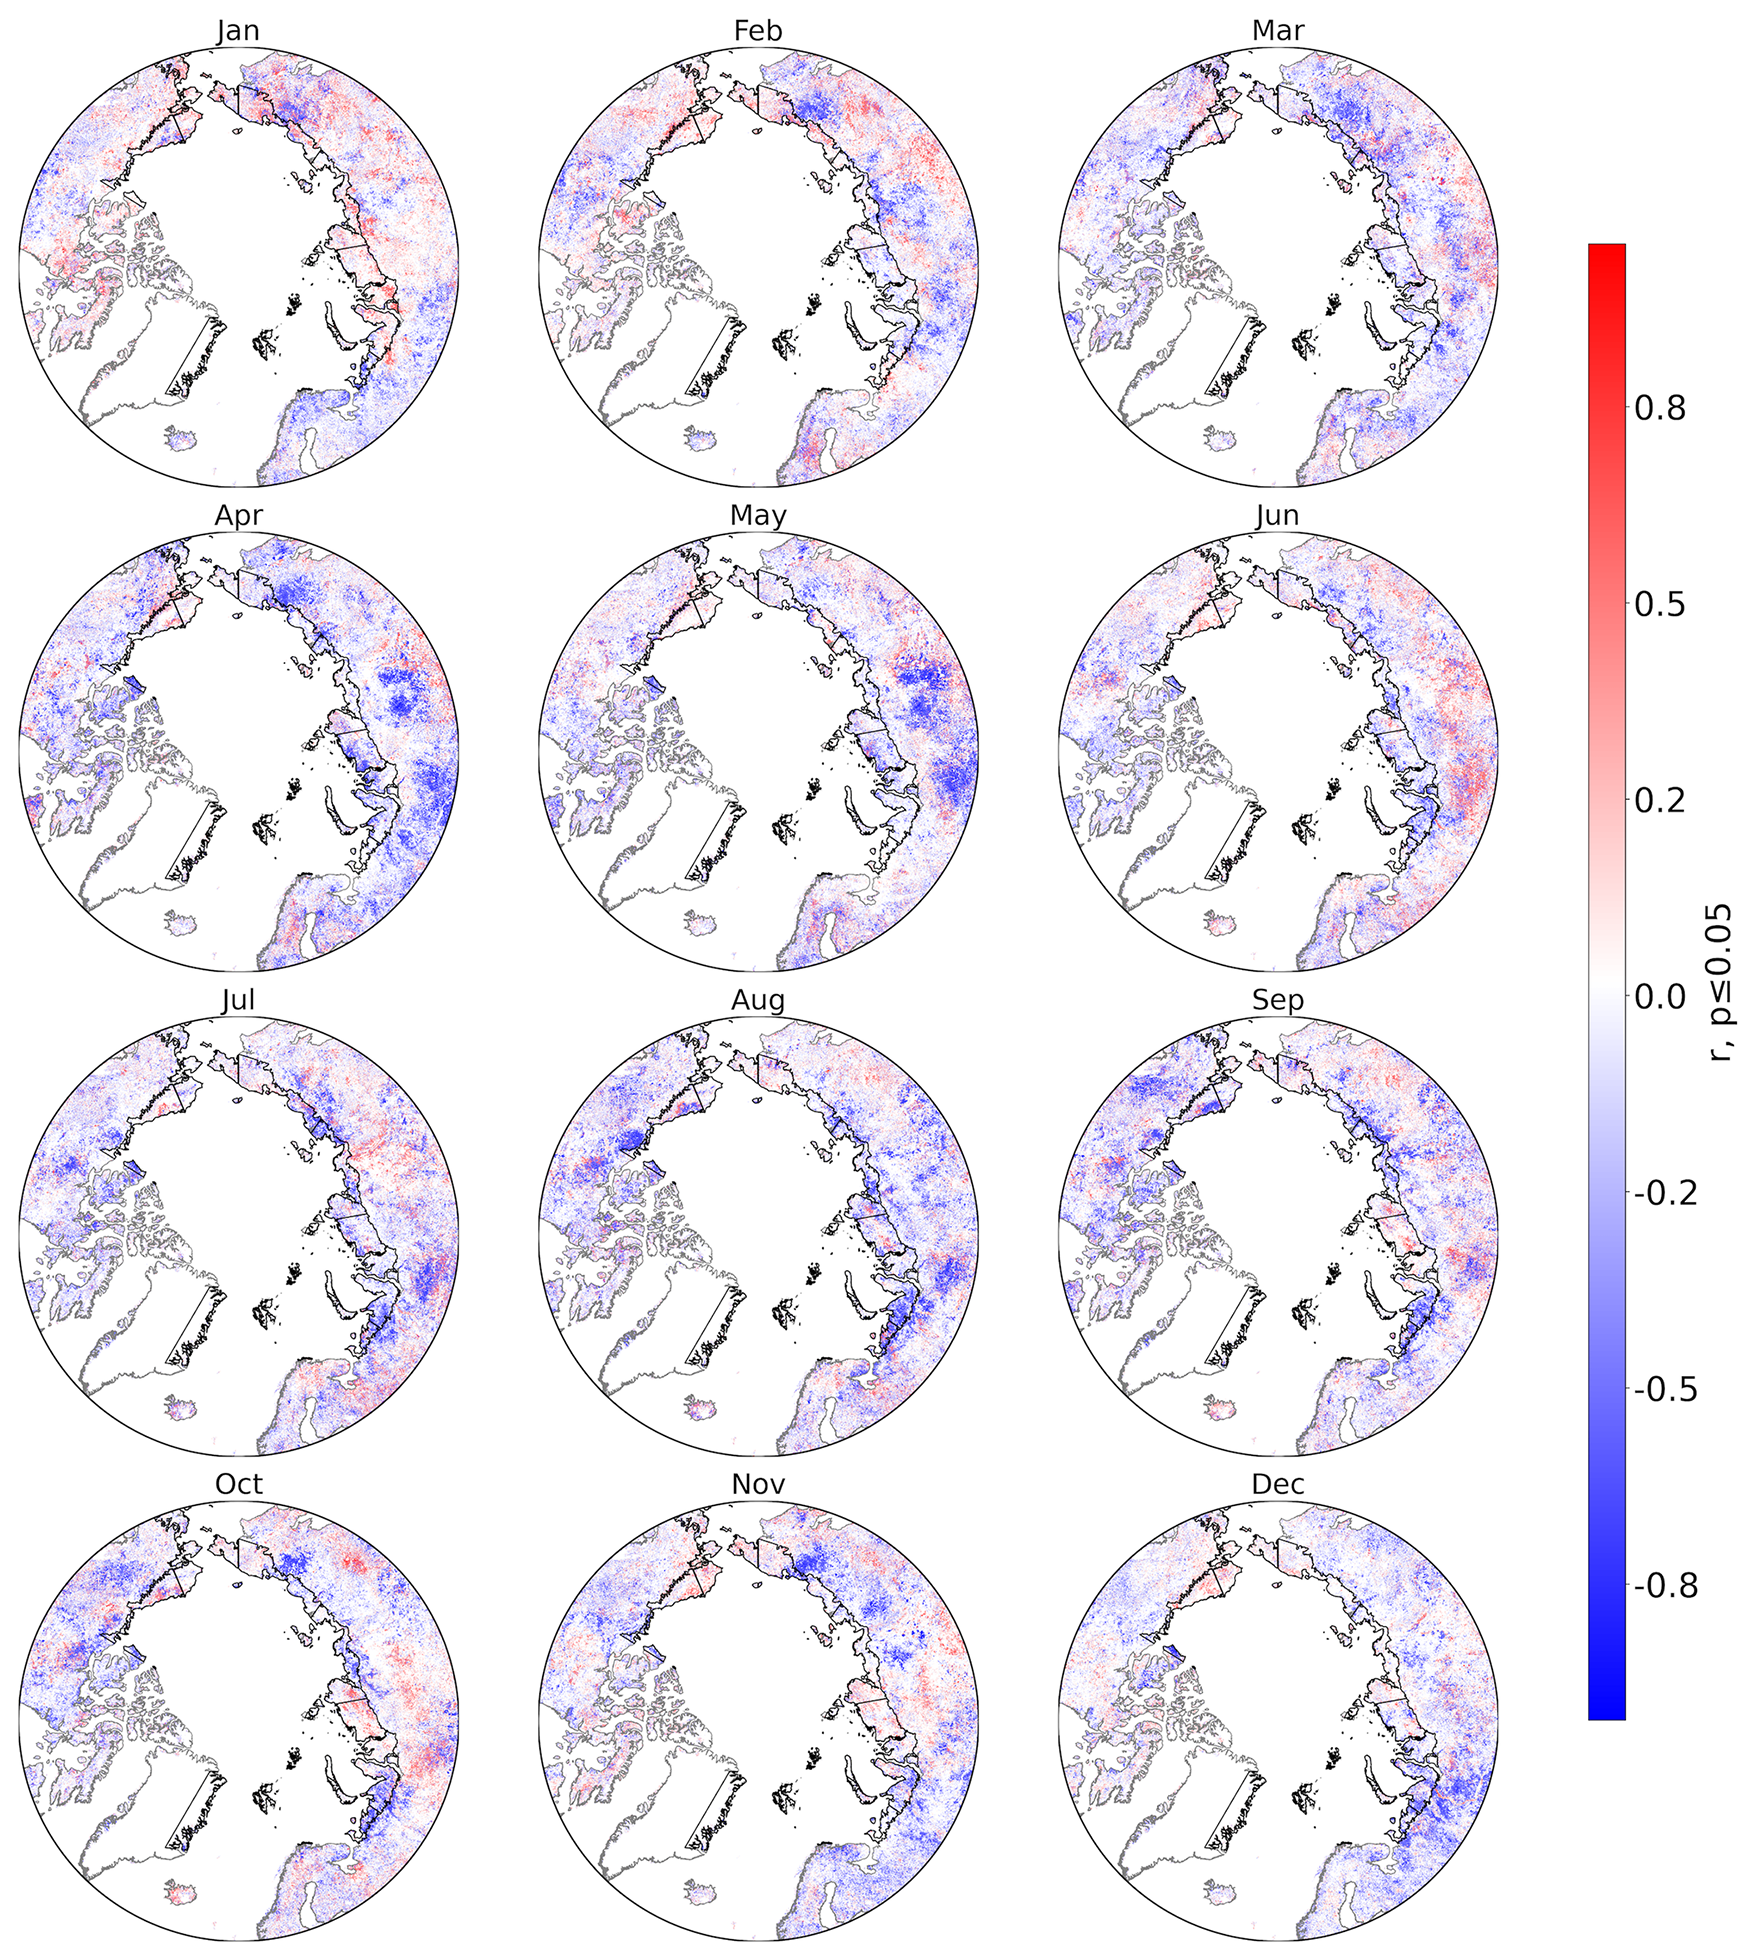
Figure A5Minimum correlation of maximum NDVI (MODIS) and monthly basin-specific sea ice area (OSI SAF and EUMETSAT SAF On Ocean And Sea Ice, 2020), 2000–2019.
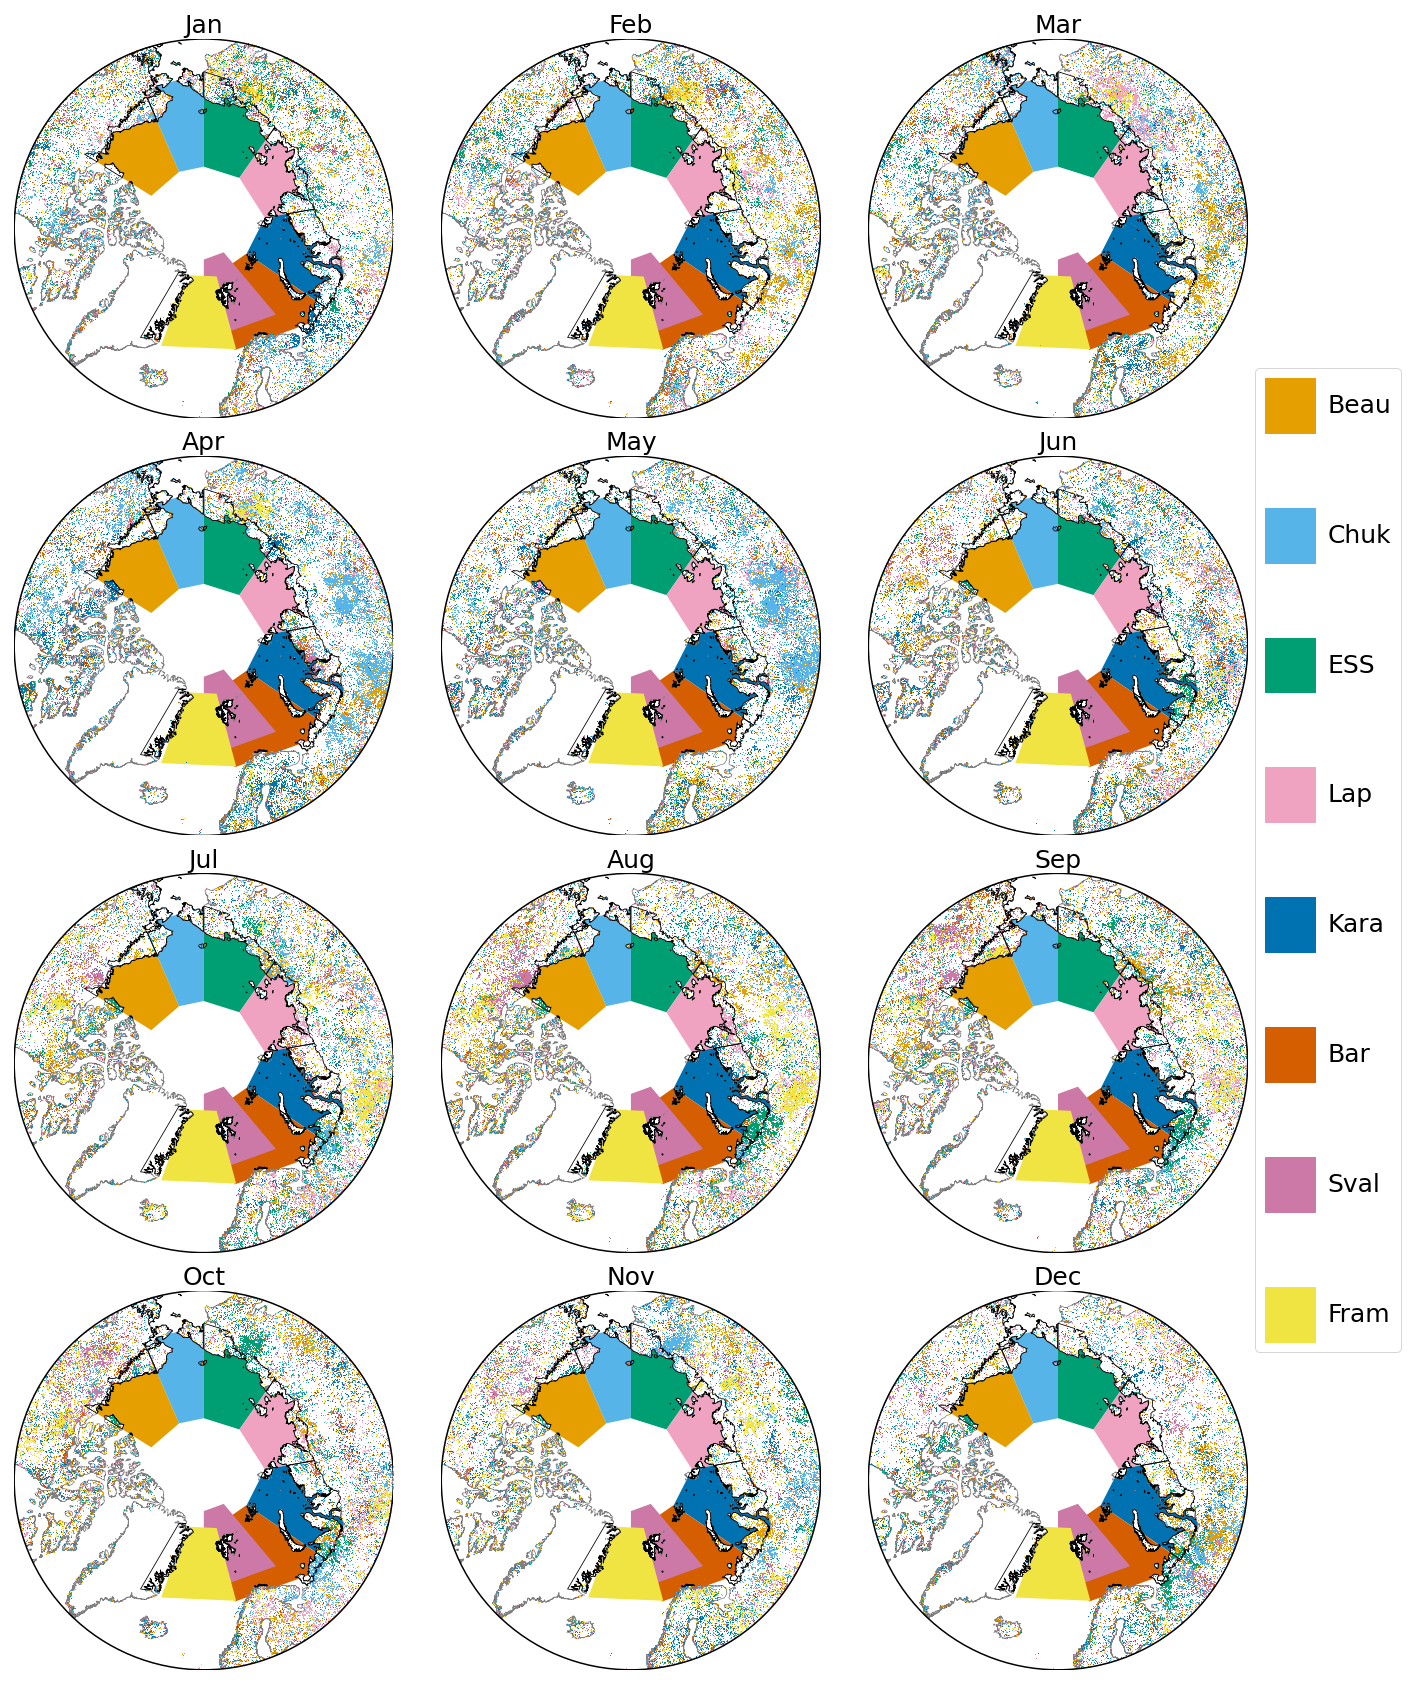
Figure A6Area with significant minimum correlation of maximum NDVI (MODIS) with sea ice area and associated basin (OSI SAF and EUMETSAT SAF On Ocean And Sea Ice, 2020), 2000–2019. For actual basin extent and legend, see Fig. 1.
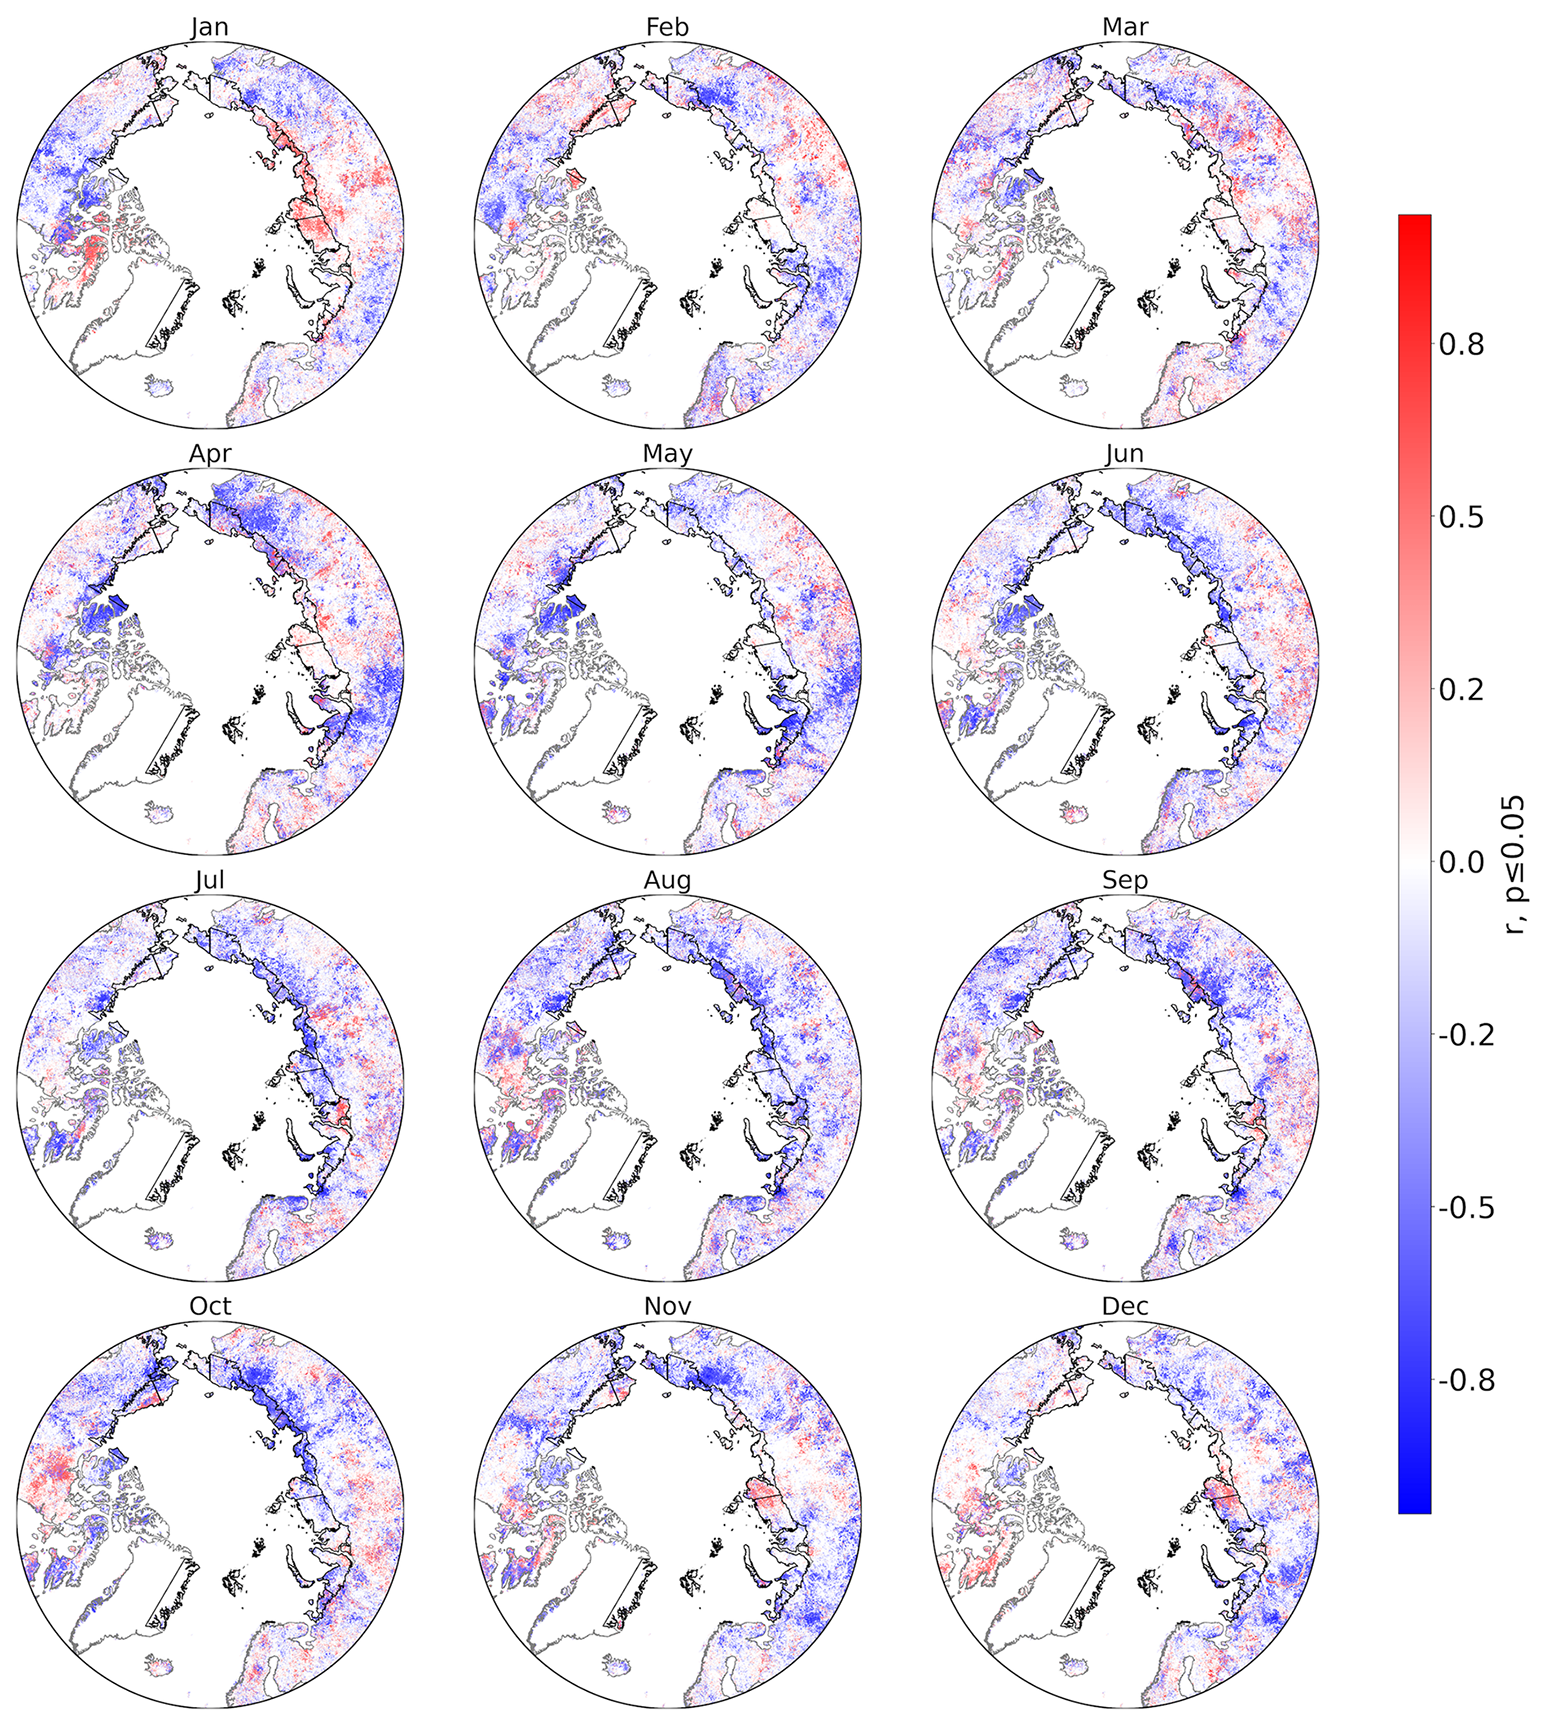
Figure A7Minimum correlation of TI-NDVI (MODIS) and monthly basin-specific sea ice area (OSI SAF and EUMETSAT SAF On Ocean And Sea Ice, 2020), 2000–2019.
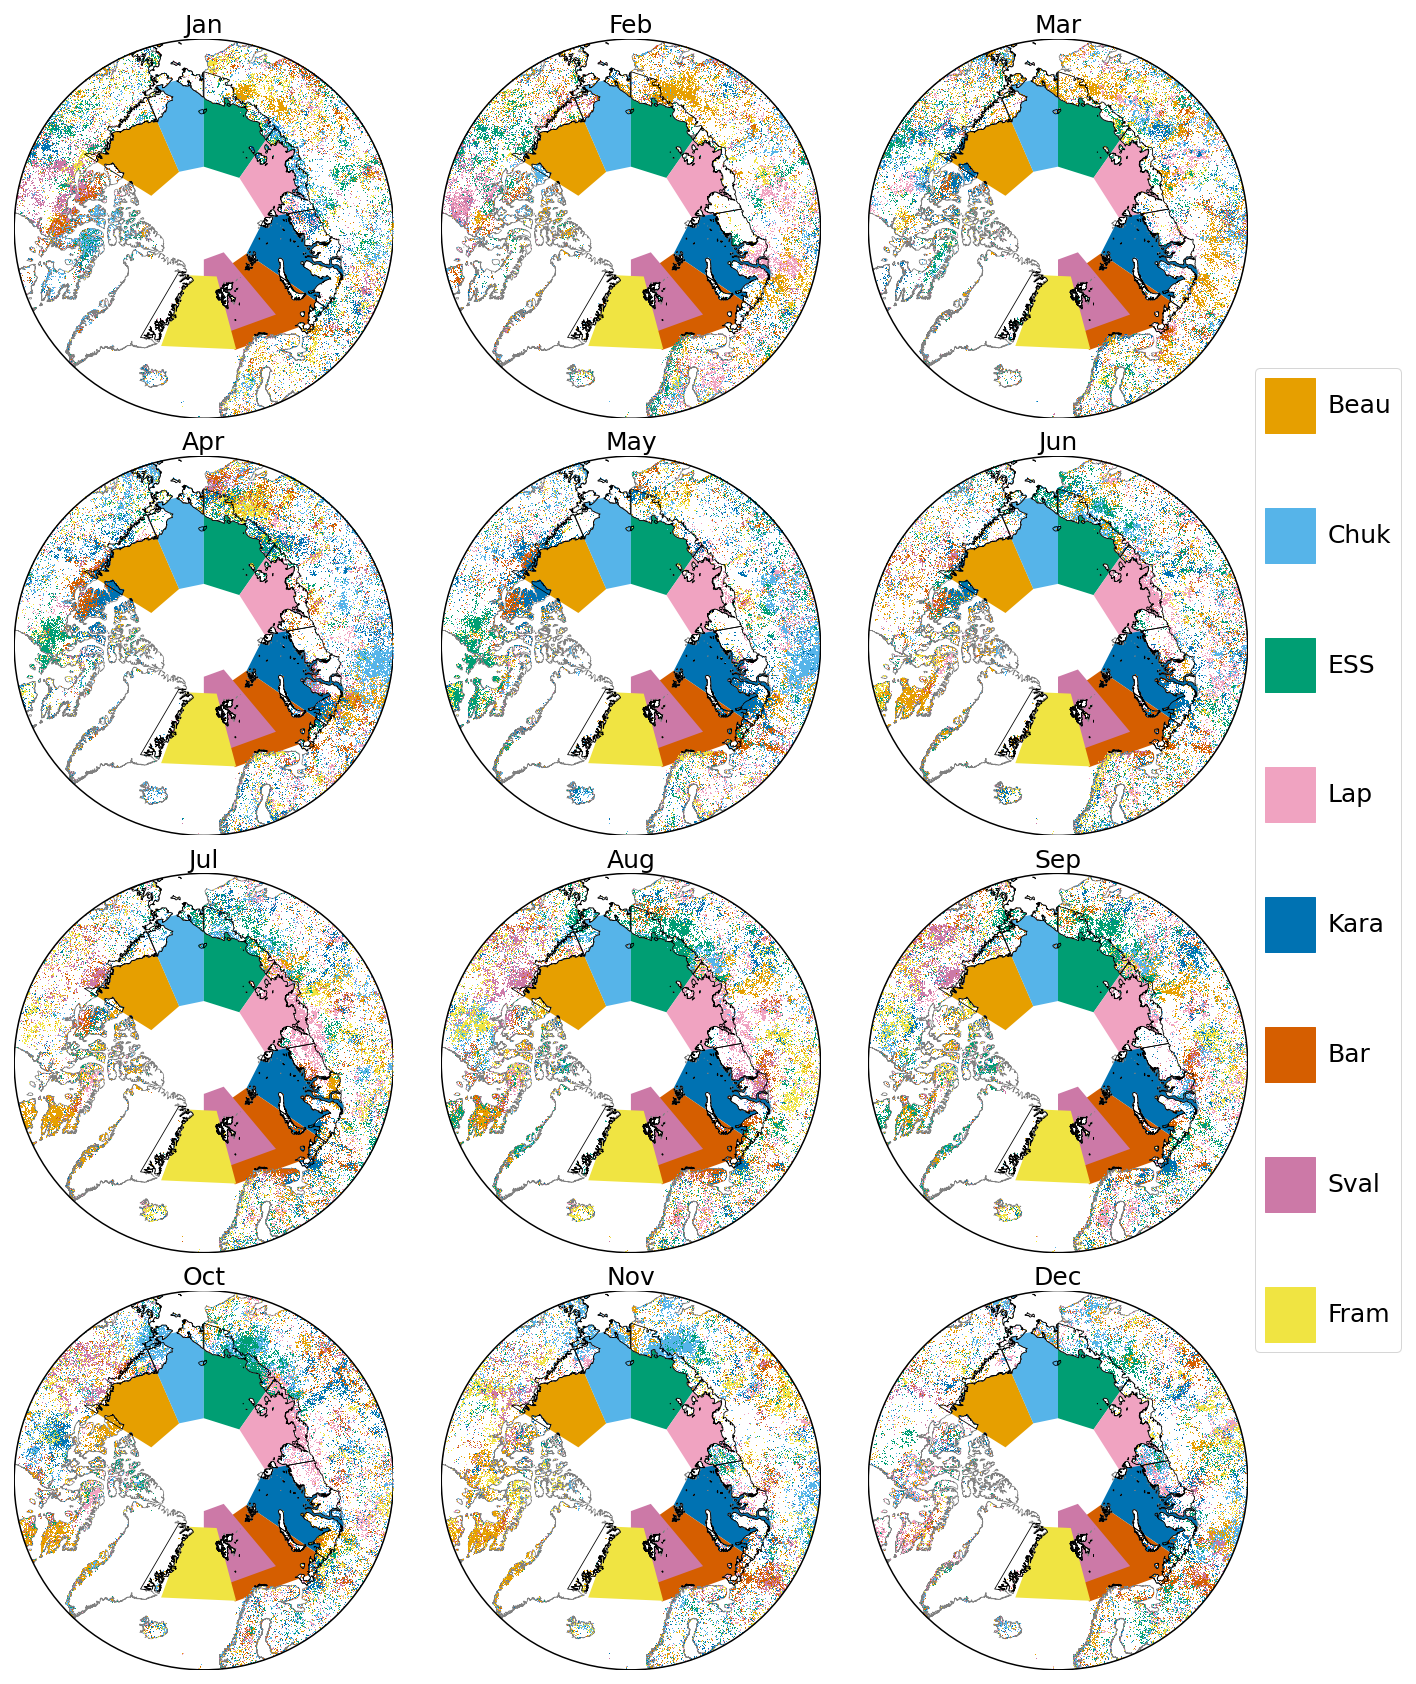
Figure A8Area with significant minimum correlation of TI-NDVI (MODIS) with sea ice area and associated basin (source: ESA CCI sea ice), 2000–2019. For actual basin extent and legend, see Fig. 1.
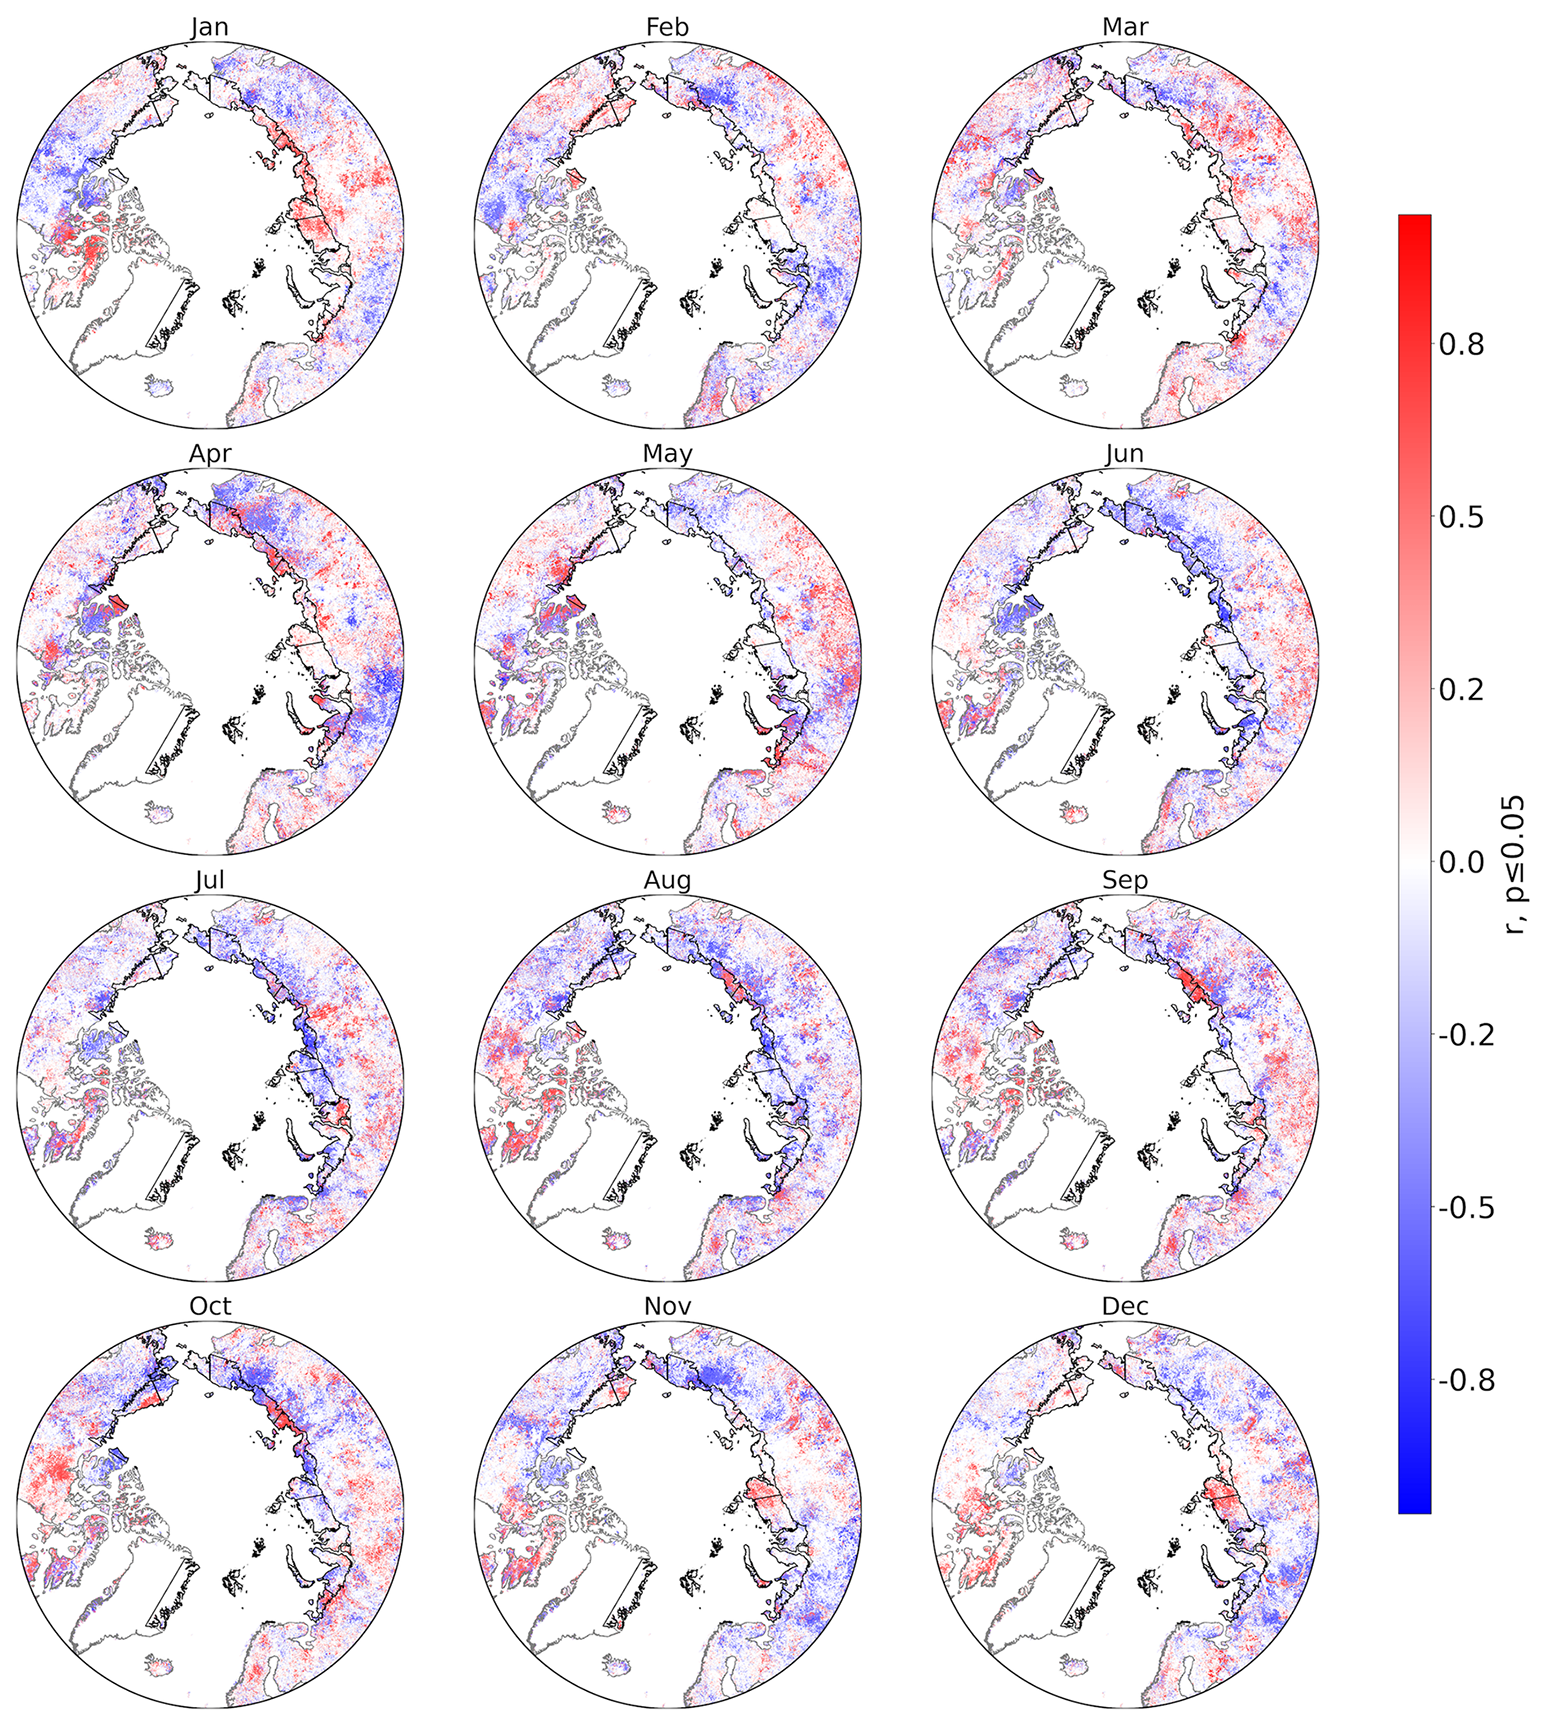
Figure A9Maximum correlation of TI-NDVI (MODIS) and monthly basin-specific sea ice area (OSI SAF and EUMETSAT SAF On Ocean And Sea Ice, 2020), 2000–2019.
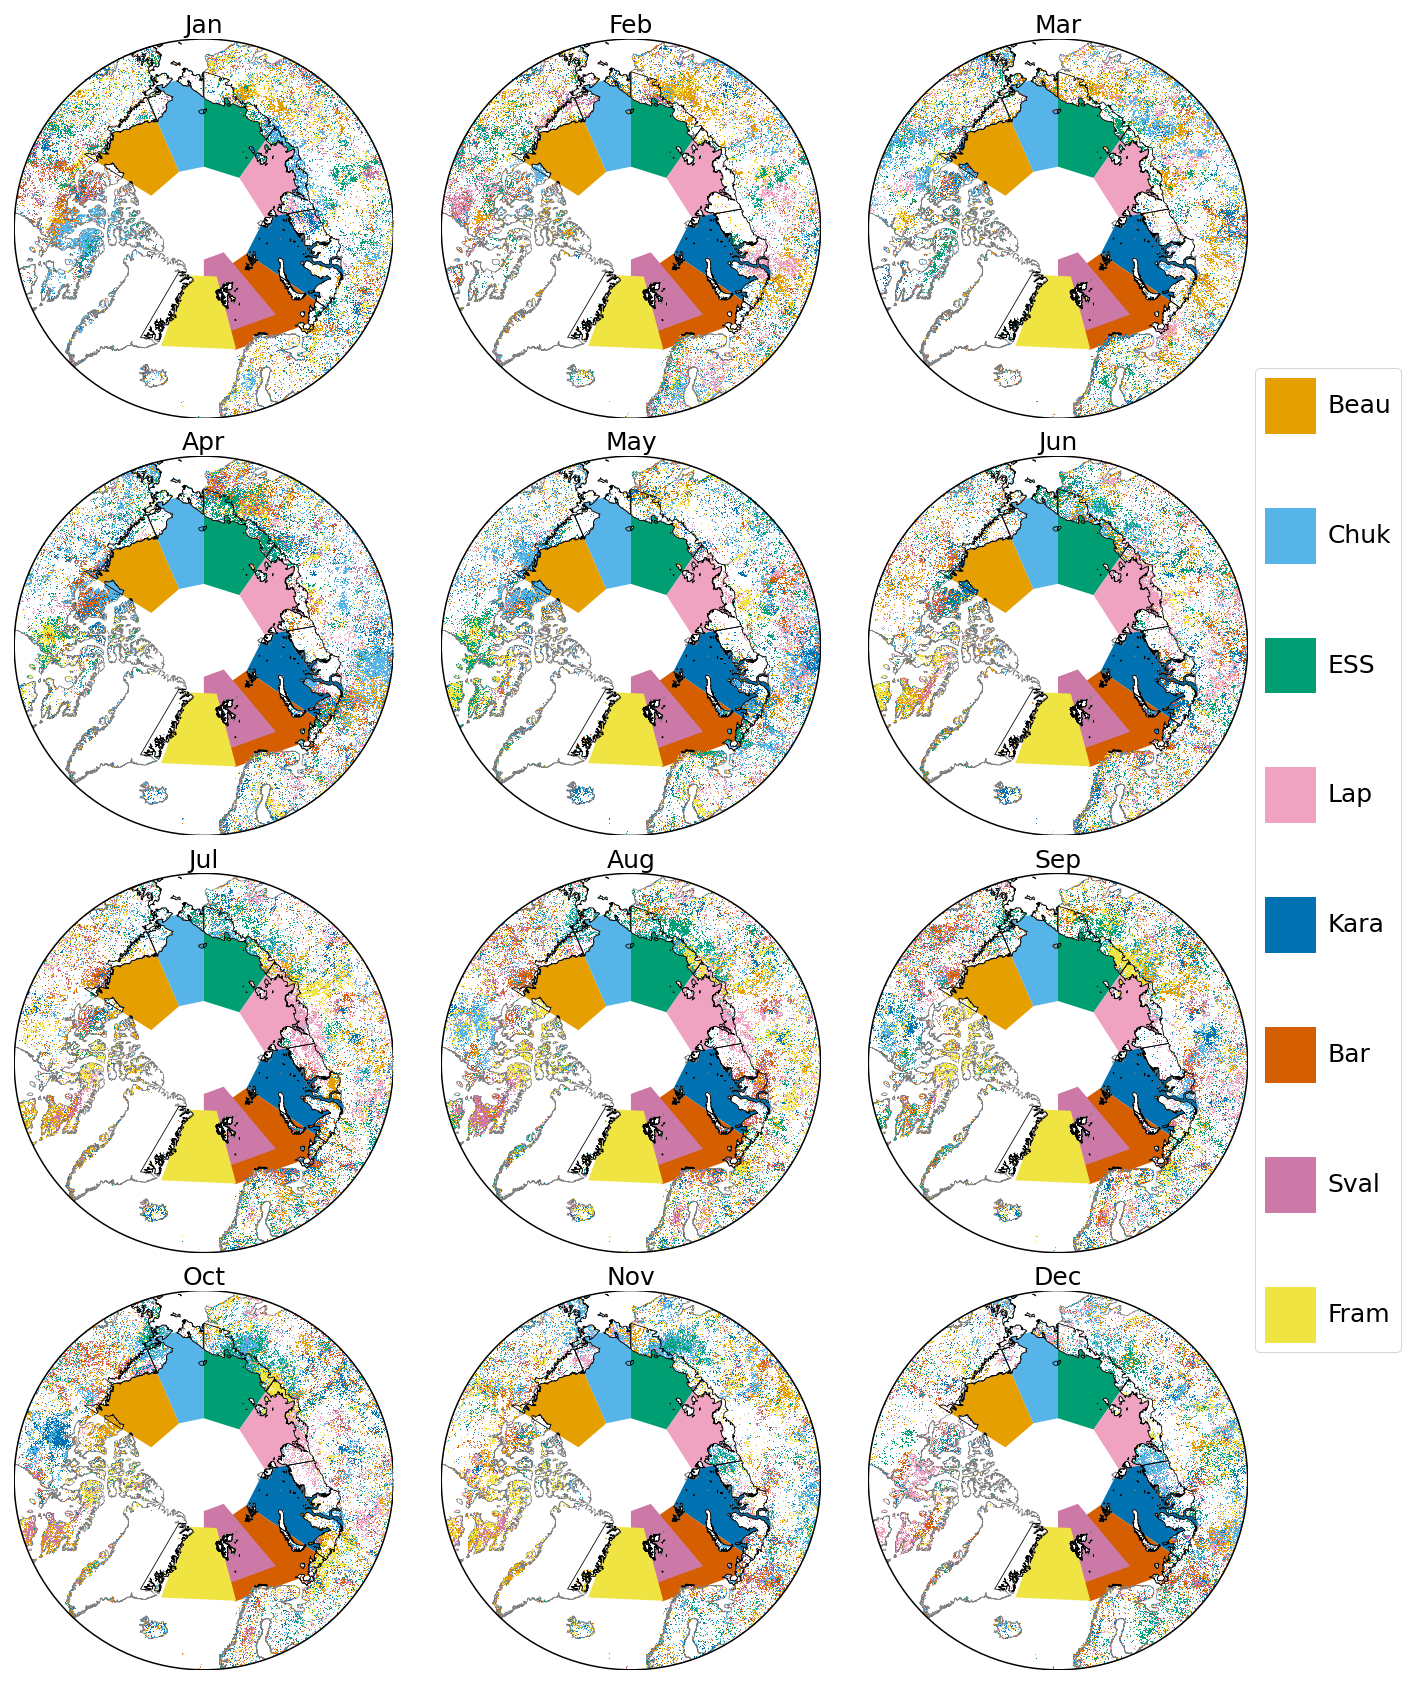
Figure A10Area with significant maximum correlation of TI-NDVI (MODIS) with sea ice area and associated basin (OSI SAF and EUMETSAT SAF On Ocean And Sea Ice, 2020), 2000–2019. For actual basin extent and legend, see Fig. 1.
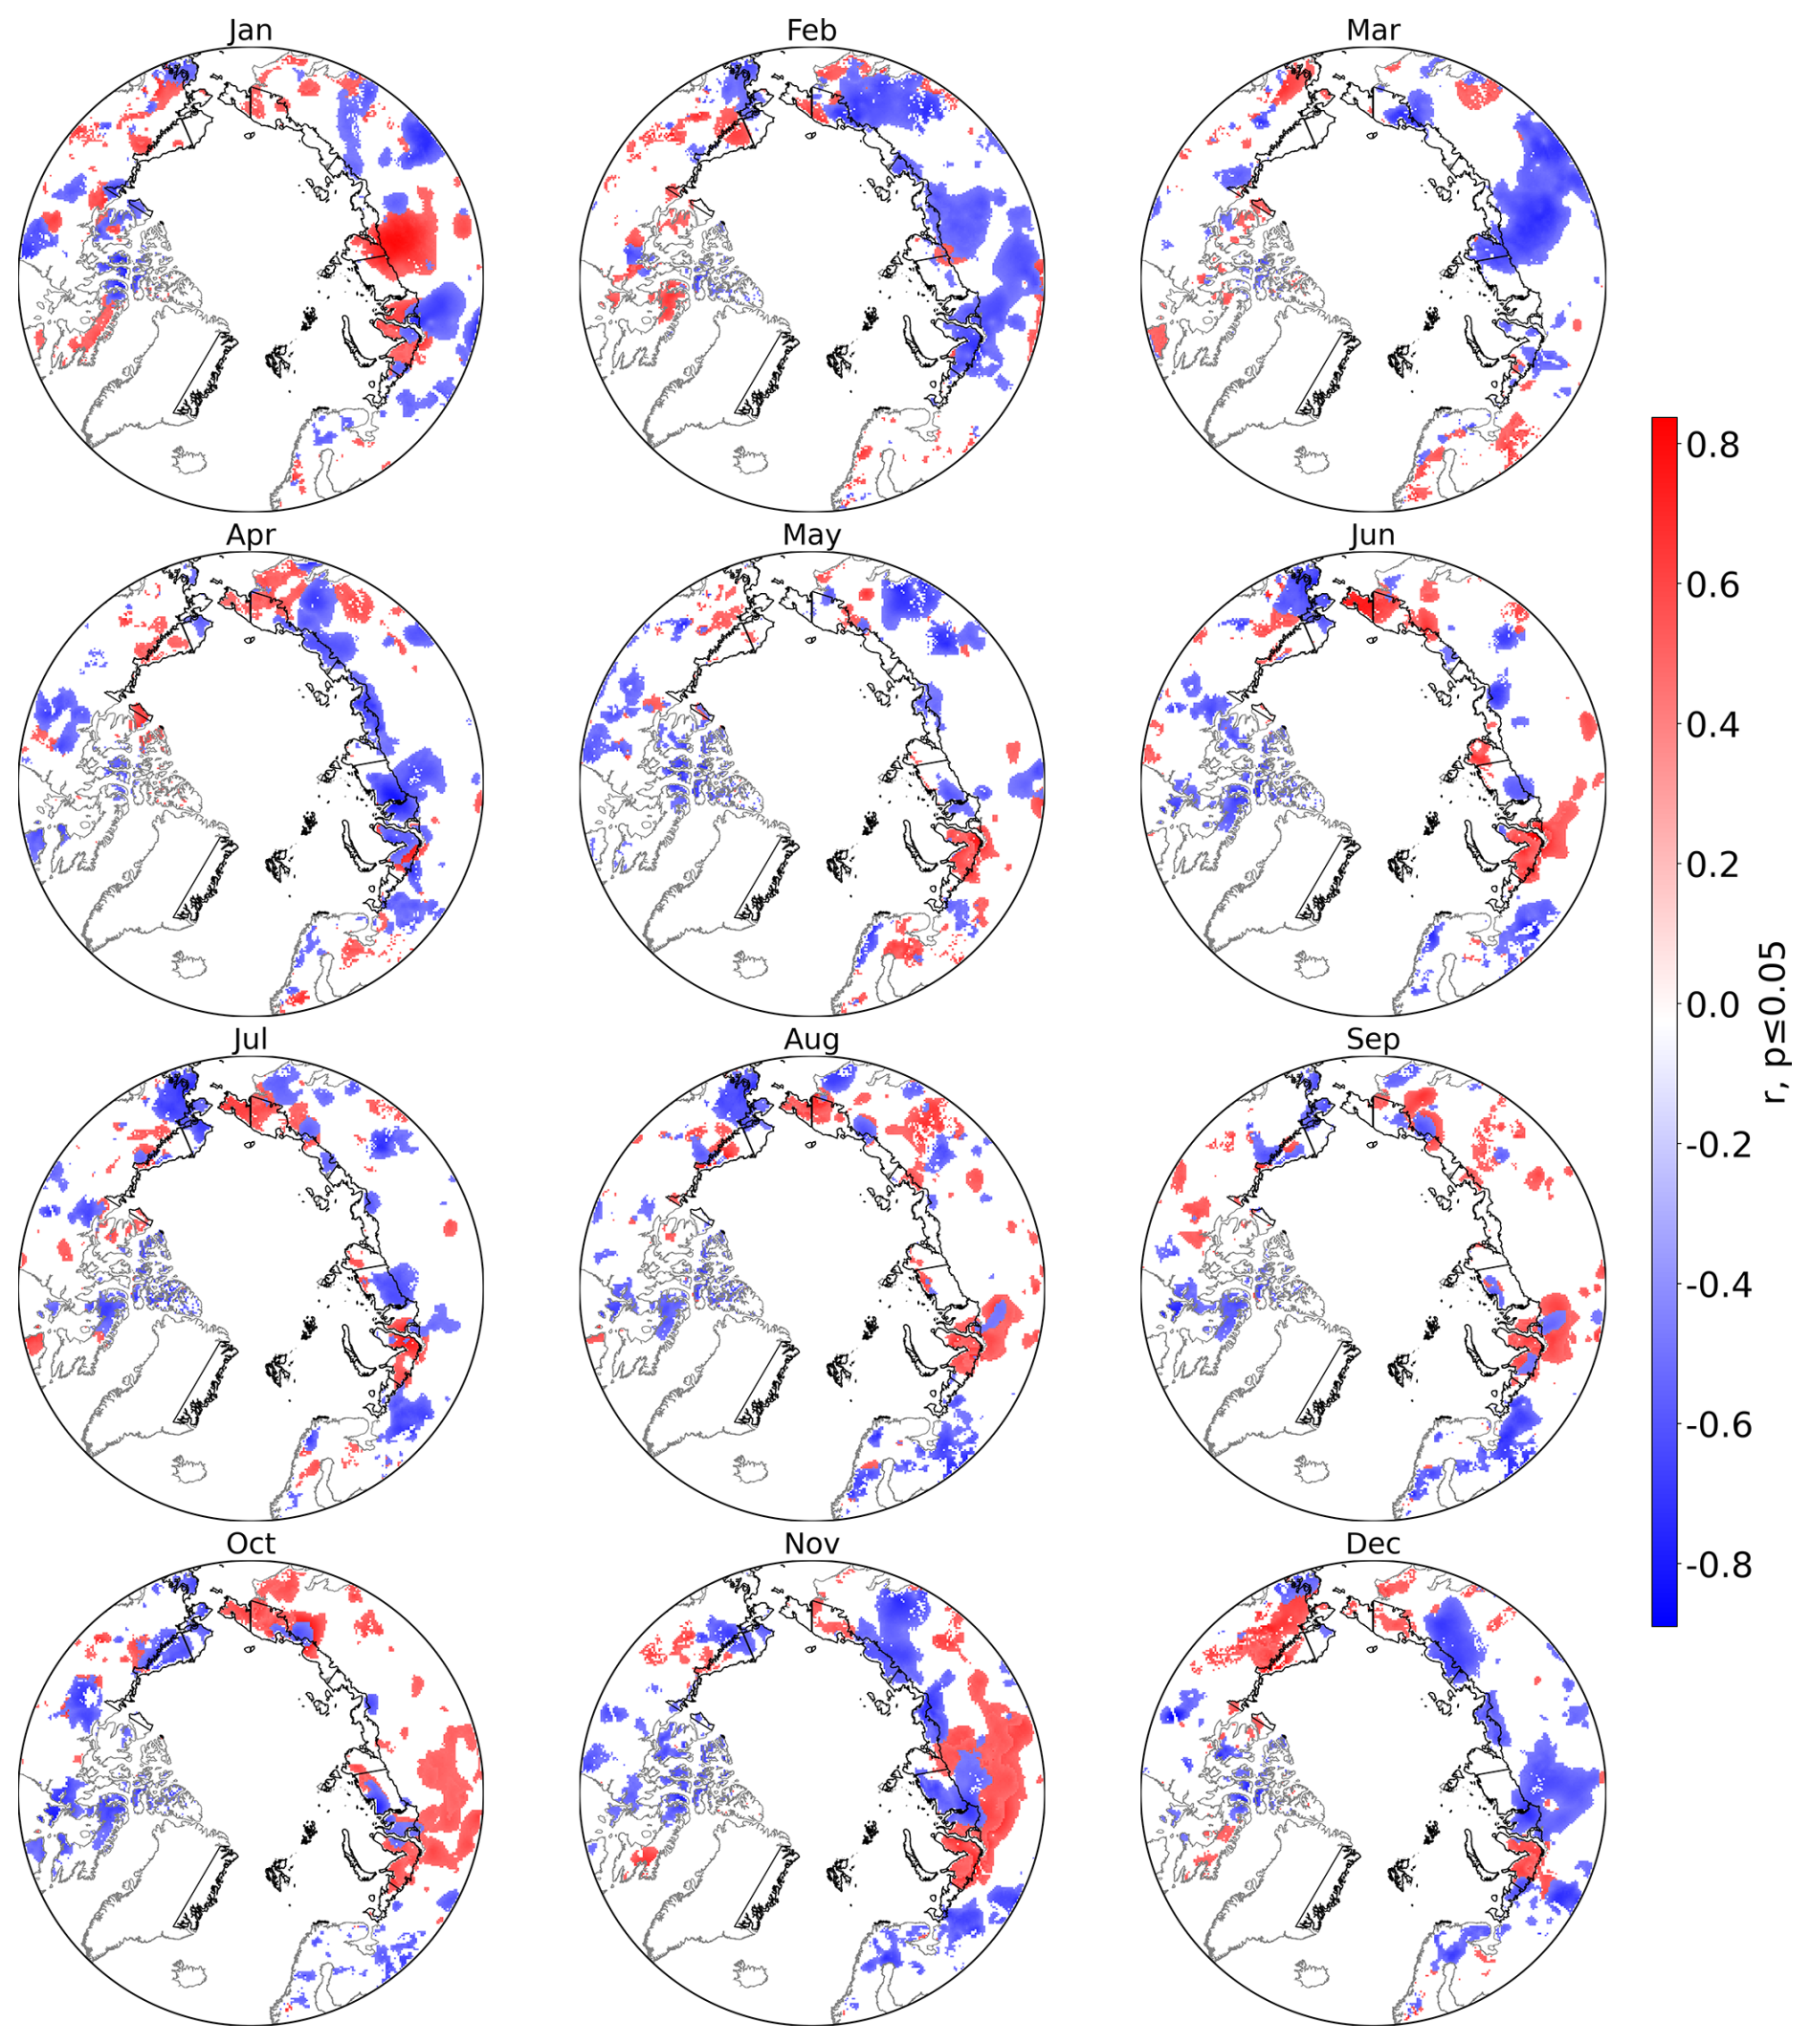
Figure A11Minimum correlation of SWE (March) and monthly basin-specific sea ice area (OSI SAF and EUMETSAT SAF On Ocean And Sea Ice, 2020), 2000–2019.
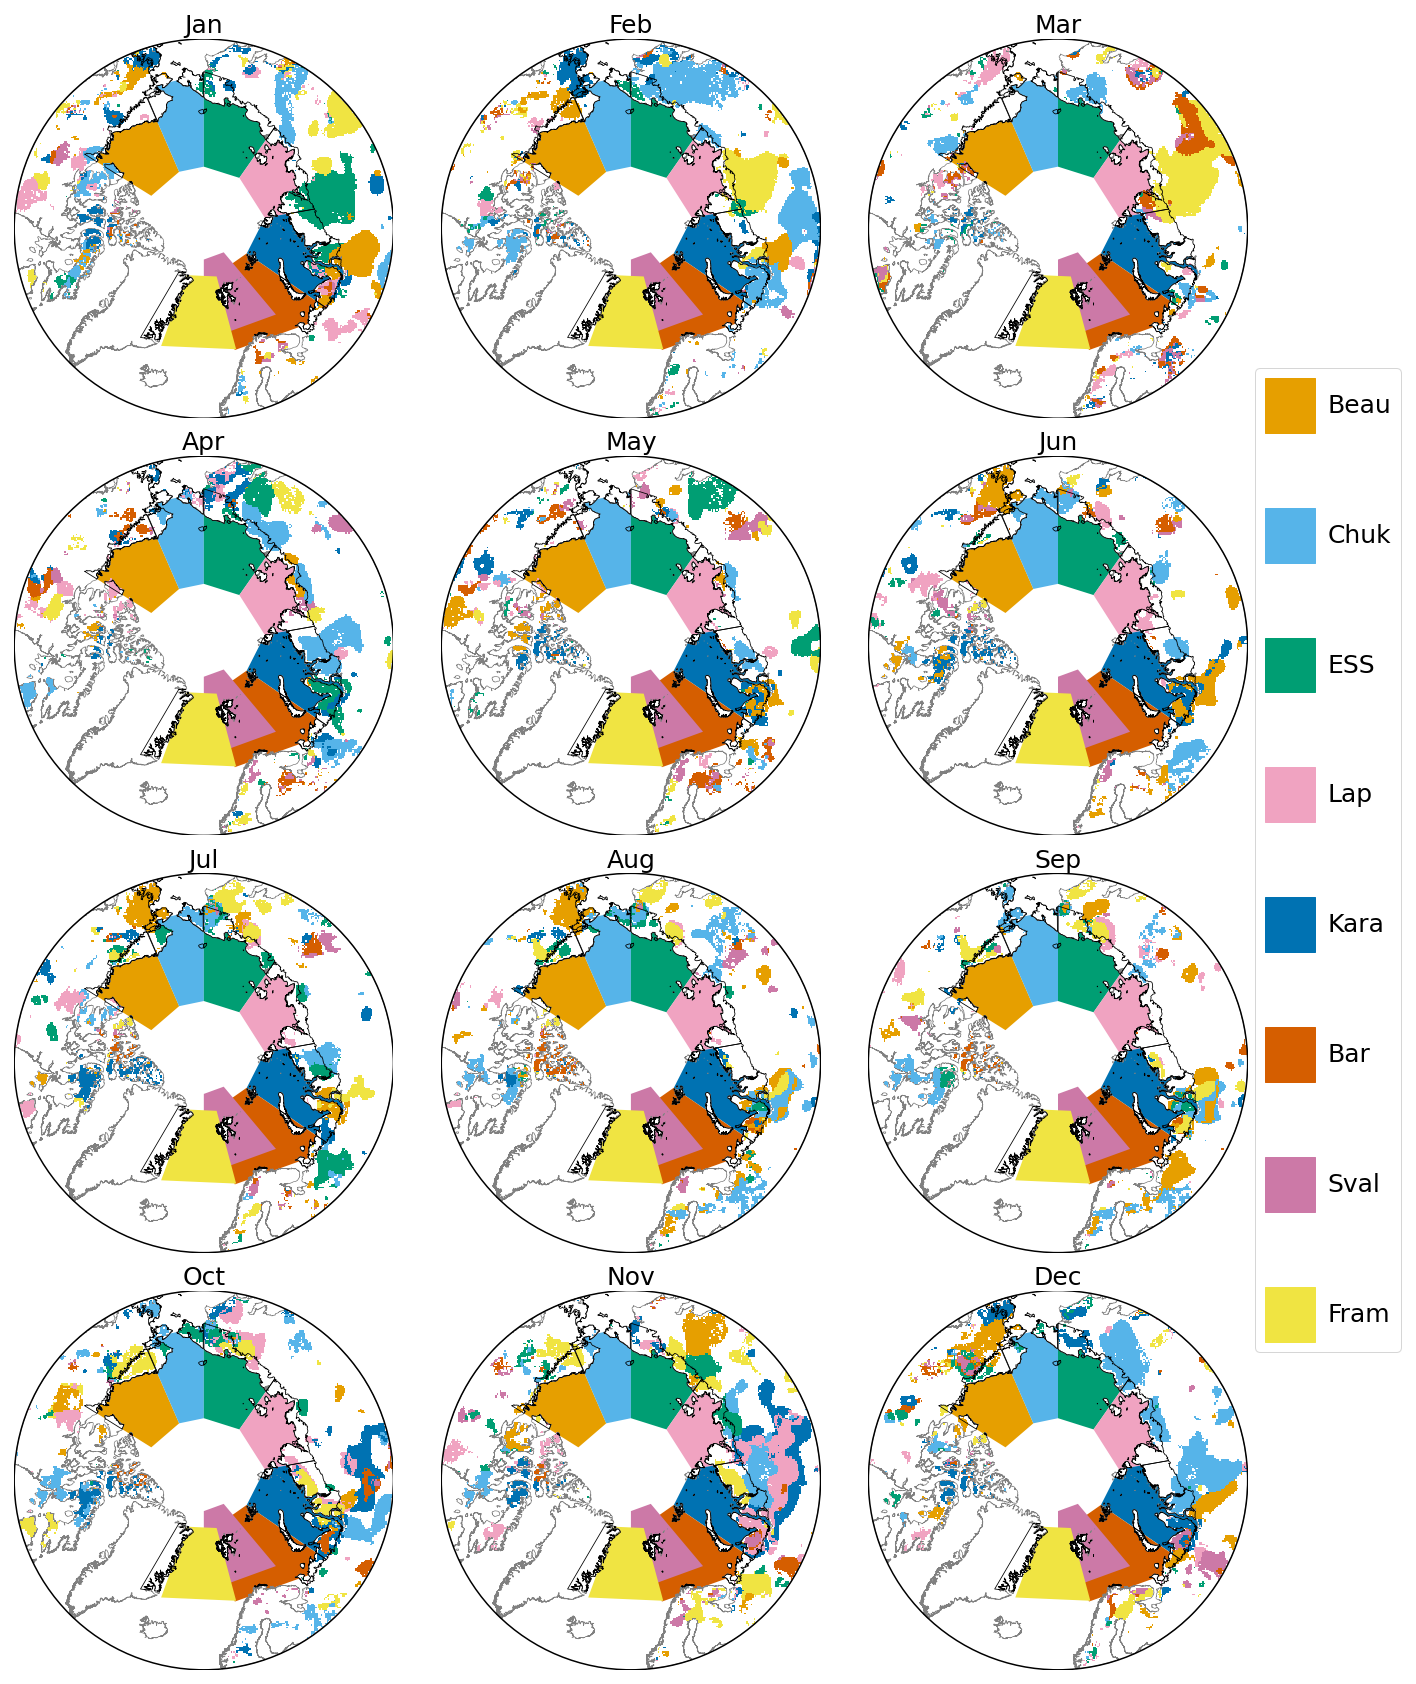
Figure A12Area with significant minimum correlation of SWE (March) with sea ice area and associated basin (source: ESA CCI sea ice), 2000–2019. For actual basin extent and legend, see Fig. 1.
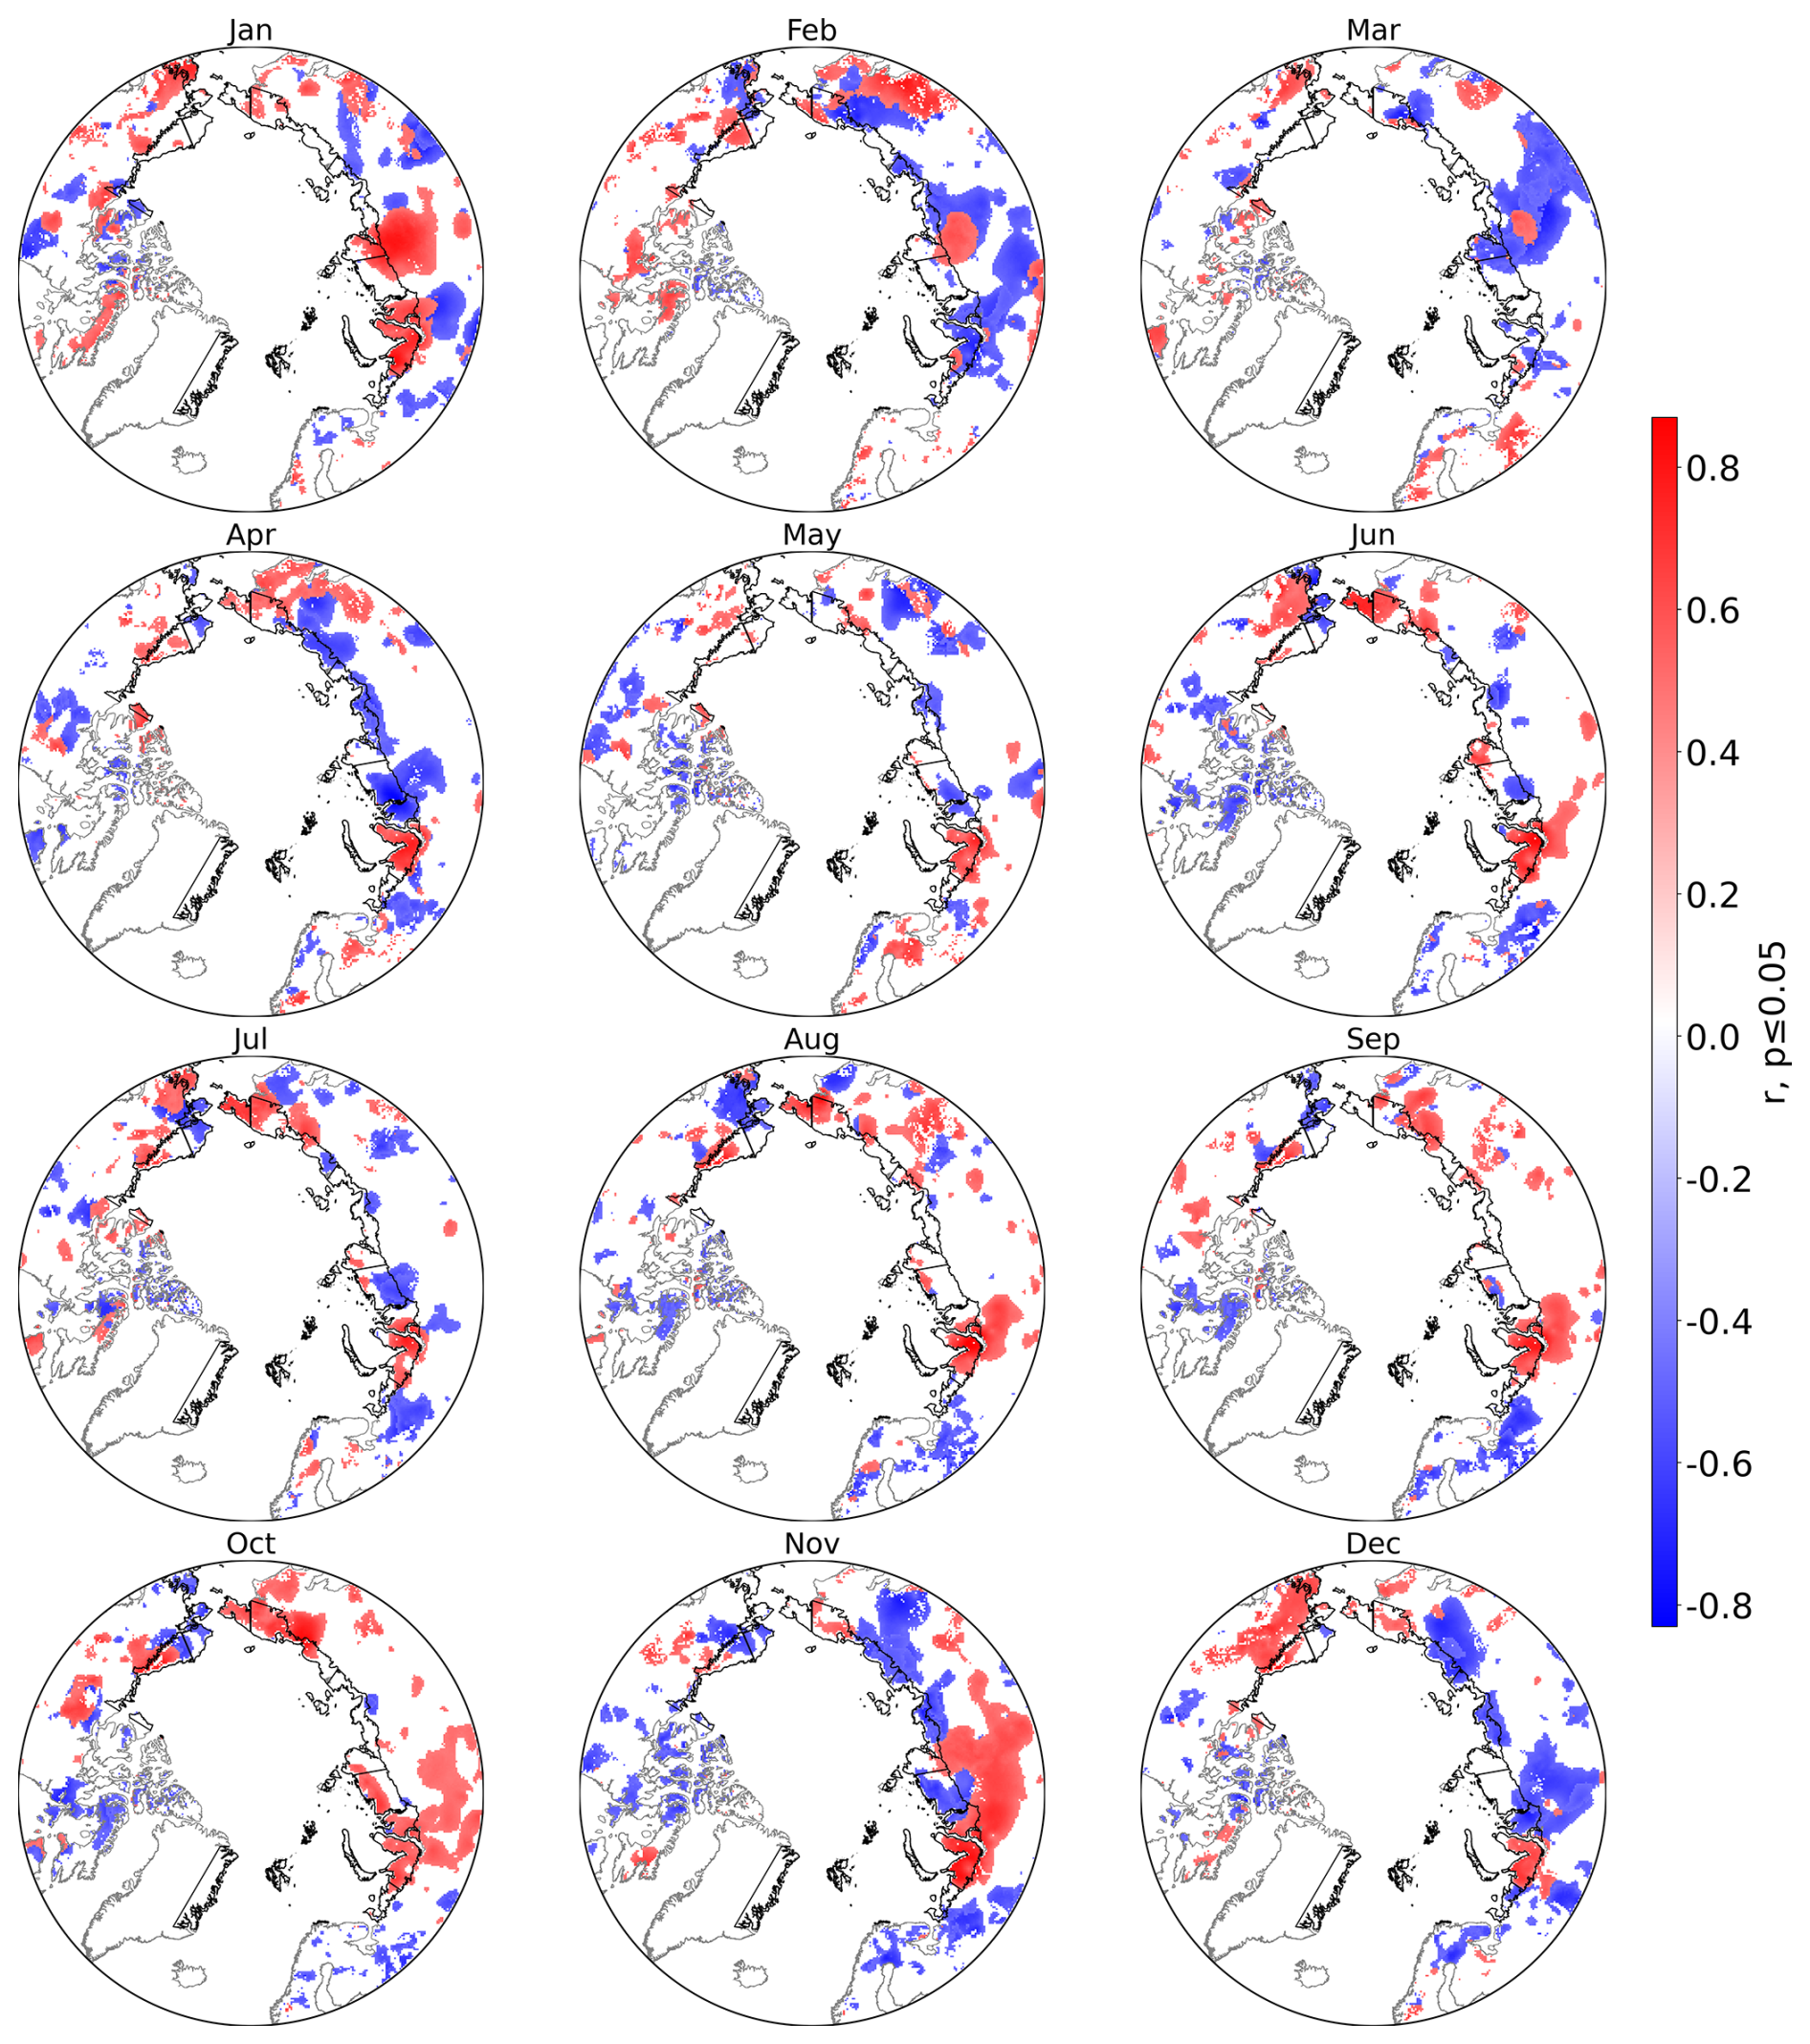
Figure A13Maximum correlation of SWE (March) and monthly basin-specific sea ice area (OSI SAF and EUMETSAT SAF On Ocean And Sea Ice, 2020), 2000–2019.
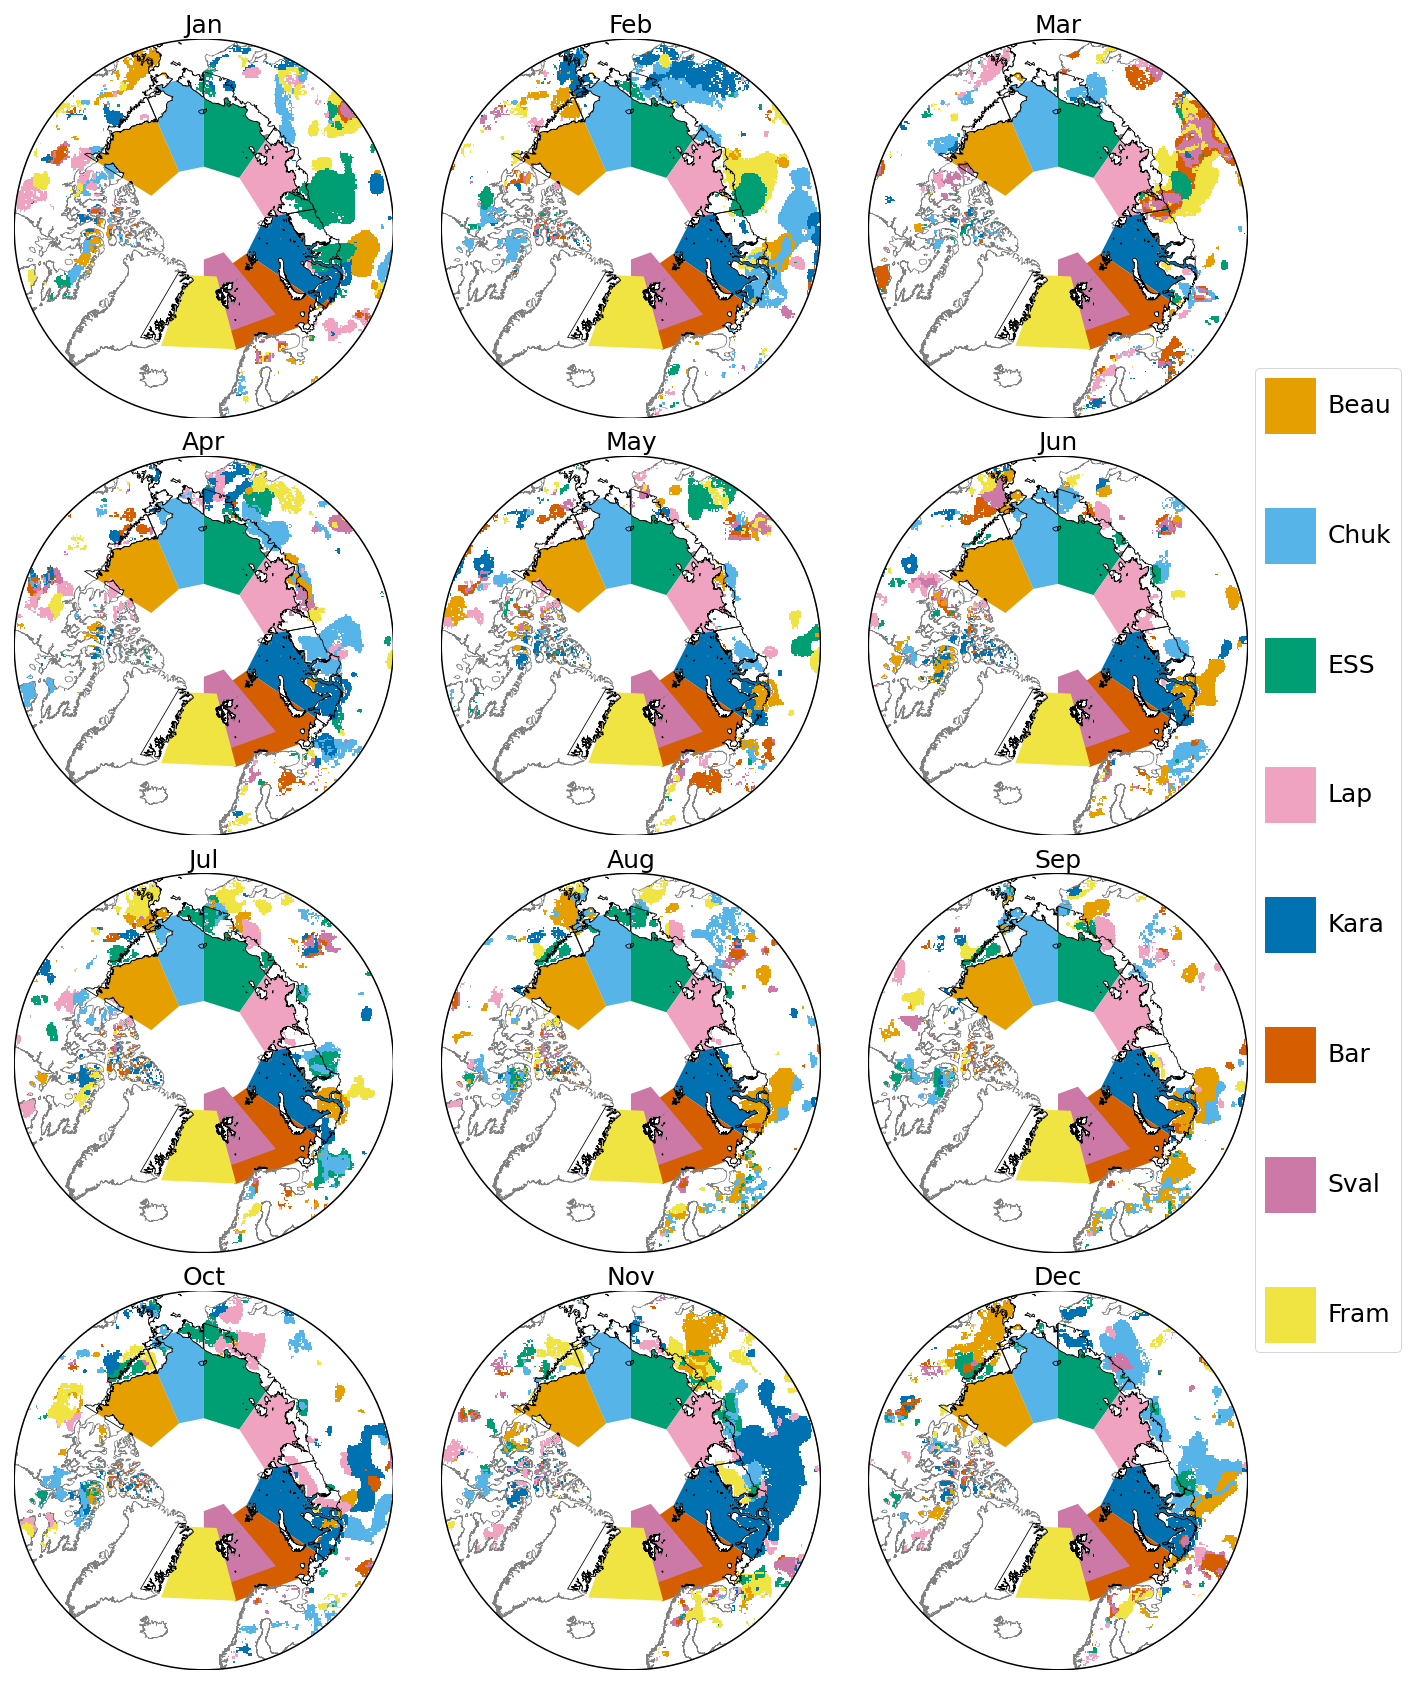
Figure A14Area with significant maximum correlation of SWE (March) with sea ice area and associated basin (OSI SAF and EUMETSAT SAF On Ocean And Sea Ice, 2020), 2000–2019. For actual basin extent and legend, see Fig. 1.
All input data are freely available, and sources are specified in Table 4. The derived trend and correlation datasets are available on Zenodo: https://doi.org/10.5281/zenodo.14975145 (Bartsch et al., 2025a) and https://doi.org/10.5281/zenodo.14975004 (Bartsch et al., 2025c). All processing was performed using freely available software (e.g., GeoPandas, Rasterio, Rasterstats).
AB developed the concept for the study, compiled the results, and wrote the first draft of the article. RT, HB, KR, JL, CvB, and HT processed the satellite data. MMF, HT, JL, BCF, and CG contributed to the writing of the article.
The contact author has declared that none of the authors has any competing interests.
Publisher’s note: Copernicus Publications remains neutral with regard to jurisdictional claims made in the text, published maps, institutional affiliations, or any other geographical representation in this paper. While Copernicus Publications makes every effort to include appropriate place names, the final responsibility lies with the authors. Views expressed in the text are those of the authors and do not necessarily reflect the views of the publisher.
This research has been supported by EU Horizon 2020 (grant no. 869471, CHARTER); the European Space Agency (grant nos. 4000123681/18/I-NB and 4000124098/18/I-NB, CCI+ Permafrost and CCI+ Snow respectively); the European Research Council, EU H2020 European Research Council (grant no. 951288, Q-Arctic); and the Research Council of Finland (grant no. 364034, Academy Research Fellowship EMonSoil).
This paper was edited by Alexandre Langlois and reviewed by two anonymous referees.
Alexeev, V. A., Arp, C. D., Jones, B. M., and Cai, L.: Arctic sea ice decline contributes to thinning lake ice trend in northern Alaska, Environmental Research Letters, 11, 074022, https://doi.org/10.1088/1748-9326/11/7/074022, 2016. a, b
AMAP: Snow, Water, Ice and Permafrost in the Arctic (SWIPA) 2017. Arctic Monitoring and Assessment Programme (AMAP), Oslo, Norway, Tech. rep., Arctic Monitoring and Assessment Programme (AMAP), Oslo, xiv + 269 pp., https://www.amap.no/documents/doc/snow-water-ice-and-permafrost-in-the-arctic-swipa-2017/1610 (last access: 2 January 2022), 2017. a, b, c, d, e
AMAP: AMAP Arctic Climate Change Update 2021: Key Trends and Impacts. Arctic Monitoring and Assessment Programme (AMAP), Tromsø, Norway, Tech. rep., Arctic Monitoring and Assessment Programme (AMAP), Tromsø, viii + 148 pp., https://www.amap.no/documents/doc/amap-arctic-climate-change-update-2021-key-trends-and-impacts/3594 (last access: 2 January 2025), 2021. a
Anonymous: Referee Comment 1, Comment on egusphere-2025-1358, https://doi.org/10.5194/egusphere-2025-1358-rc1, 2025. a
Anttila, K., Manninen, T., Jääskeläinen, E., Riihelä, A., and Lahtinen, P.: The Role of Climate and Land Use in the Changes in Surface Albedo Prior to Snow Melt and the Timing of Melt Season of Seasonal Snow in Northern Land Areas of 40–80° N during 1982–2015, Remote Sensing, 10, 1619, https://doi.org/10.3390/rs10101619, 2018. a
Armstrong McKay, D. I., Staal, A., Abrams, J. F., Winkelmann, R., Sakschewski, B., Loriani, S., Fetzer, I., Cornell, S. E., Rockström, J., and Lenton, T. M.: Exceeding 1.5 °C global warming could trigger multiple climate tipping points, Science, 377, https://doi.org/10.1126/science.abn7950, 2022. a
Bartsch, A., Bergstedt, H., Pointner, G., Muri, X., Rautiainen, K., Leppänen, L., Joly, K., Sokolov, A., Orekhov, P., Ehrich, D., and Soininen, E. M.: Towards long-term records of rain-on-snow events across the Arctic from satellite data, The Cryosphere, 17, 889–915, https://doi.org/10.5194/tc-17-889-2023, 2023a. a, b
Bartsch, A., Strozzi, T., and Nitze, I.: Permafrost Monitoring from Space, Surveys in Geophysics, https://doi.org/10.1007/s10712-023-09770-3, 2023b. a, b, c
Bartsch, A., Tanguy, R., Bergstedt, H., Muri, X., and von Baeckmann, C.: Similarities in Northern Hemisphere Permafrost Ground Temperature and Sea Ice Extent Change from 1997 to 2019, in: IGARSS 2024 – 2024 IEEE International Geoscience and Remote Sensing Symposium, IEEE, 134–137, https://doi.org/10.1109/igarss53475.2024.10642186, 2024. a, b
Bartsch, A., Bergstedt, H., Tømmervik, H., Lemmetyinen, J., and Rautiainen, K.: Selected Arctic Land Parameter Trends: Ground Temperature, Snow Water Equivalent, NDVI, LAI and Freeze Thaw Duration, Zenodo [data set], https://doi.org/10.5281/zenodo.14975145, 2025a. a
Bartsch, A., Muri, X., Hetzenecker, M., Rautiainen, K., Bergstedt, H., Wuite, J., Nagler, T., and Nicolsky, D.: Benchmarking passive-microwave-satellite-derived freeze–thaw datasets, The Cryosphere, 19, 459–483, https://doi.org/10.5194/tc-19-459-2025, 2025b. a
Bartsch, A., Tanguy, R., Tømmervik, H., Lemmetyinen, J., Bergstedt, H., and von Baeckmann, C.: Arctic Sea Ice and Land Parameter Correlations (ASILaC), Zenodo [data set], https://doi.org/10.5281/zenodo.14975004, 2025c. a, b
Berner, L. T., Massey, R., Jantz, P., Forbes, B. C., Macias-Fauria, M., Myers-Smith, I., Kumpula, T., Gauthier, G., Andreu-Hayles, L., Gaglioti, B. V., Burns, P., Zetterberg, P., D’Arrigo, R., and Goetz, S. J.: Summer warming explains widespread but not uniform greening in the Arctic tundra biome, Nature Communications, 11, https://doi.org/10.1038/s41467-020-18479-5, 2020. a
Bhatt, U., Walker, D., Raynolds, M., Bieniek, P., Epstein, H., Comiso, J., Pinzon, J., Tucker, C., and Polyakov, I.: Recent Declines in Warming and Vegetation Greening Trends over Pan-Arctic Tundra, Remote Sensing, 5, 4229–4254, https://doi.org/10.3390/rs5094229, 2013. a, b, c, d, e, f, g, h, i, j
Bhatt, U. S., Walker, D. A., Raynolds, M. K., Comiso, J. C., Epstein, H. E., Jia, G., Gens, R., Pinzon, J. E., Tucker, C. J., Tweedie, C. E., and Webber, P. J.: Circumpolar Arctic Tundra Vegetation Change Is Linked to Sea Ice Decline, Earth Interactions, 14, 1–20, https://doi.org/10.1175/2010EI315.1, 2010. a, b, c, d, e
Bhatt, U. S., Walker, D. A., Raynolds, M. K., Bieniek, P. A., Epstein, H. E., Comiso, J. C., Pinzon, J. E., Tucker, C. J., Steele, M., Ermold, W., and Zhang, J.: Changing seasonality of panarctic tundra vegetation in relationship to climatic variables, Environmental Research Letters, 12, 055003, https://doi.org/10.1088/1748-9326/aa6b0b, 2017. a, b, c, d
Bhatt, U. S., Walker, D. A., Raynolds, M. K., Walsh, J. E., Bieniek, P. A., Cai, L., Comiso, J. C., Epstein, H. E., Frost, G. V., Gersten, R., Hendricks, A. S., Pinzon, J. E., Stock, L., and Tucker, C. J.: Climate drivers of Arctic tundra variability and change using an indicators framework, Environmental Research Letters, 16, 055019, https://doi.org/10.1088/1748-9326/abe676, 2021. a, b, c, d, e, f, g, h, i
Bjerke, J. W., López-Blanco, E., Tømmervik, H., Striberny, A., Davids, C., Ólafsdóttir, R., Karlsen, S. R., Sandström, P., Turunen, M., Rikkonen, T., Arneberg, M. K., Siikavuopio, S., Zinglersen, K., Lynge-Pedersen, K., Sandström, S., and Rautio, P.: Nordic boreo-arctic lands under rapid climatic change: A review of recent and future trends and extreme events, Earth-Science Reviews, 261, 105012, https://doi.org/10.1016/j.earscirev.2024.105012, 2025. a
Bokhorst, S. F., Bjerke, J. W., Tømmervik, H., Callaghan, T. V., and Phoenix, G. K.: Winter warming events damage sub‐Arctic vegetation: consistent evidence from an experimental manipulation and a natural event, Journal of Ecology, 97, 1408–1415, https://doi.org/10.1111/j.1365-2745.2009.01554.x, 2009. a
Brouillette, M.: How microbes in permafrost could trigger a massive carbon bomb, Nature, 591, 360–362, https://doi.org/10.1038/d41586-021-00659-y, 2021. a, b
Buchwal, A., Sullivan, P. F., Macias-Fauria, M., Post, E., Myers-Smith, I. H., Stroeve, J. C., Blok, D., Tape, K. D., Forbes, B. C., Ropars, P., Lévesque, E., Elberling, B., Angers-Blondin, S., Boyle, J. S., Boudreau, S., Boulanger-Lapointe, N., Gamm, C., Hallinger, M., Rachlewicz, G., Young, A., Zetterberg, P., and Welker, J. M.: Divergence of Arctic shrub growth associated with sea ice decline, Proceedings of the National Academy of Sciences, 117, 33334–33344, https://doi.org/10.1073/pnas.2013311117, 2020. a
Comiso, J. C. and Hall, D. K.: Climate trends in the Arctic as observed from space, WIREs Climate Change, 5, 389–409, https://doi.org/10.1002/wcc.277, 2014. a, b, c, d, e, f, g, h, i
Comiso, J. C. and Nishio, F.: Trends in the sea ice cover using enhanced and compatible AMSR‐E, SSM/I, and SMMR data, Journal of Geophysical Research: Oceans, 113, https://doi.org/10.1029/2007jc004257, 2008. a, b, c
Druckenmiller, M. L., Moon, T. A., Thoman, R. L., Ballinger, T. J., Berner, L. T., Bernhard, G. H., Bhatt, U. S., Bjerke, J. W., Box, J. E., Brown, R., Cappelen, J., Christiansen, H. H., Decharme, B., Derksen, C., Divine, D., Drozdov, D. S., Elias Chereque, A., Epstein, H. E., Farquharson, L. M., Farrell, S. L., Fausto, R. S., Fettweis, X., Fioletov, V. E., Forbes, B. C., Frost, G. V., Gargulinski, E., Gerland, S., Goetz, S. J., Grabinski, Z., Grooß, J.-U., Haas, C., Hanna, E., Hanssen-Bauer, I., Hendricks, S., Holmes, R. M., Ialongo, I., Isaksen, K., Jain, P., Johnsen, B., Kaleschke, L., Kholodov, A. L., Kim, S.-J., Korsgaard, N. J., Labe, Z., Lakkala, K., Lara, M. J., Loomis, B., Luojus, K., Macander, M. J., Malkova, G. V., Mankoff, K. D., Manney, G. L., McClelland, J. W., Meier, W. N., Mote, T., Mudryk, L., Müller, R., Nyland, K. E., Overland, J. E., Park, T., Pavlova, O., Perovich, D., Petty, A., Phoenix, G. K., Raynolds, M. K., Reijmer, C. H., Richter-Menge, J., Ricker, R., Romanovsky, V. E., Scott, L., Shapiro, H., Shiklomanov, A. I., Shiklomanov, N. I., Smeets, C. J. P. P., Smith, S. L., Soja, A., Spencer, R. G. M., Starkweather, S., Streletskiy, D. A., Suslova, A., Svendby, T., Tank, S. E., Tedesco, M., Tian-Kunze, X., Timmermans, M.-L., Tømmervik, H., Tretiakov, M., Tschudi, M., Vakhutinsky, S., van As, D., van de Wal, R. S. W., Veraverbeke, S., Walker, D. A., Walsh, J. E., Wang, M., Webster, M., Winton, O., Wood, K., York, A., and Ziel, R.: The Arctic, Bulletin of the American Meteorological Society, 102, S263–S316, https://doi.org/10.1175/bams-d-21-0086.1, 2021. a, b
Dupuis, S., Göttsche, F.-M., and Wunderle, S.: Temporal stability of a new 40-year daily AVHRR land surface temperature dataset for the pan-Arctic region, The Cryosphere, 18, 6027–6059, https://doi.org/10.5194/tc-18-6027-2024, 2024. a, b
Dutrieux, L. P., Bartholomeus, H., Herold, M., and Verbesselt, J.: Relationships between declining summer sea ice, increasing temperatures and changing vegetation in the Siberian Arctic tundra from MODIS time series (2000–11), Environmental Research Letters, 7, 044028, https://doi.org/10.1088/1748-9326/7/4/044028, 2012. a, b, c
Forbes, B. C., Kumpula, T., Meschtyb, N., Laptander, R., Macias-Fauria, M., Zetterberg, P., Verdonen, M., Skarin, A., Kim, K.-Y., Boisvert, L. N., Stroeve, J. C., and Bartsch, A.: Sea ice, rain-on-snow and tundra reindeer nomadism in Arctic Russia, Biology Letters, https://doi.org/10.1098/rsbl.2016.0466, 2016. a
Frost, G. V., Bhatt, U. S., Macander, M. J., Berner, L. T., Walker, D. A., Raynolds, M. K., Magnusson, R. I., Bartsch, A., Bjerke, J. W., Epstein, H. E., Forbes, B. C., Goetz, S. J., Hoy, E. E., Karlsen, S. R., Kumpula, T., Lantz, T. C., Lara, M. J., López-Blanco, E., Montesano, P. M., Neigh, C. S. R., Nitze, I., Orndahl, K. M., Park, T., Phoenix, G. K., Rocha, A. V., Rogers, B. M., Schaepman-Strub, G., Tømmervik, H., Verdonen, M., Veremeeva, A., Virkkala, A.-M., and Waigl, C. F.: The changing face of the Arctic: four decades of greening and implications for tundra ecosystems, Frontiers in Environmental Science, 13, 2025, https://doi.org/10.3389/fenvs.2025.1525574, 2025. a, b, c, d, e, f, g, h, i, j, k
Gastineau, G., Frankignoul, C., Gao, Y., Liang, Y.-C., Kwon, Y.-O., Cherchi, A., Ghosh, R., Manzini, E., Matei, D., Mecking, J., Suo, L., Tian, T., Yang, S., and Zhang, Y.: Forcing and impact of the Northern Hemisphere continental snow cover in 1979–2014, The Cryosphere, 17, 2157–2184, https://doi.org/10.5194/tc-17-2157-2023, 2023. a, b
Heim, B., Lisovski, S., Wieczorek, M., Pellet, C., Delaloye, R., Bartsch, A., Jakober, D., Pointner, G., and Strozzi, T.: ESA CCI+ Product Validation and Intercomparison Report, v3.0, Tech. rep., https://climate.esa.int/documents/1520/CCI_PERMA_PVIR_v3.0_20210930.pdf (last access: 2 January 2025), 2021. a
Ingrosso, G., Ceccarelli, C., Giglio, F., Giordano, P., Hefter, J., Langone, L., Miserocchi, S., Mollenhauer, G., Nogarotto, A., Sabino, M., and Tesi, T.: Greening of Svalbard in the twentieth century driven by sea ice loss and glaciers retreat, Communications Earth & Environment, 6, https://doi.org/10.1038/s43247-025-01994-y, 2025. a
IPCC: IPCC Special Report on the Ocean and Cryosphere in a Changing Climate, https://www.ipcc.ch/srocc/ (last access: 2 January 2025), 2019. a
Karlsen, S. R., Elvebakk, A., Stendardi, L., Høgda, K. A., and Macias-Fauria, M.: Greening of Svalbard, Science of The Total Environment, 945, 174130, https://doi.org/10.1016/j.scitotenv.2024.174130, 2024. a, b, c, d, e, f
Kerby, J. T. and Post, E.: Advancing plant phenology and reduced herbivore production in a terrestrial system associated with sea ice decline, Nature Communications, 4, https://doi.org/10.1038/ncomms3514, 2013. a
Kim, Y., Kimball, J. S., Glassy, J., and Du, J.: An extended global Earth system data record on daily landscape freeze–thaw status determined from satellite passive microwave remote sensing, Earth Syst. Sci. Data, 9, 133–147, https://doi.org/10.5194/essd-9-133-2017, 2017. a
Kim, Y., Kimball, J., Du, J., and Glassy, J.: MEaSUREs Global Record of Daily Landscape Freeze/Thaw Status, Version 5, National Snow and Ice Data Center [data set], https://doi.org/10.5067/LJ6SLXNJB2CQ, 2021. a, b
Lenton, T. M., Held, H., Kriegler, E., Hall, J. W., Lucht, W., Rahmstorf, S., and Schellnhuber, H. J.: Tipping elements in the Earth’s climate system, Proceedings of the National Academy of Sciences, 105, 1786–1793, https://doi.org/10.1073/pnas.0705414105, 2008. a
Lenton, T. M., Abrams, J. F., Bartsch, A., Bathiany, S., Boulton, C. A., Buxton, J. E., Conversi, A., Cunliffe, A. M., Hebden, S., Lavergne, T., Poulter, B., Shepherd, A., Smith, T., Swingedouw, D., Winkelmann, R., and Boers, N.: Remotely sensing potential climate change tipping points across scales, Nature Communications, 15, https://doi.org/10.1038/s41467-023-44609-w, 2024. a
Letterly, A., Key, J., and Liu, Y.: Arctic climate: changes in sea ice extent outweigh changes in snow cover, The Cryosphere, 12, 3373–3382, https://doi.org/10.5194/tc-12-3373-2018, 2018. a
Li, M., Cao, S., Zhu, Z., Wang, Z., Myneni, R. B., and Piao, S.: Spatiotemporally consistent global dataset of the GIMMS Normalized Difference Vegetation Index (PKU GIMMS NDVI) from 1982 to 2022, Earth Syst. Sci. Data, 15, 4181–4203, https://doi.org/10.5194/essd-15-4181-2023, 2023. a, b, c
Liu, C., Huang, H., Liu, C., Wang, X., and Wang, S.: Comparative evaluation of vegetation greenness trends over circumpolar Arctic tundra using multi-sensors satellite datasets, International Journal of Digital Earth, 17, https://doi.org/10.1080/17538947.2024.2328823, 2024. a, b, c
Luojus, K., Pulliainen, J., Takala, M., Lemmetyinen, J., Mortimer, C., Derksen, C., Mudryk, L., Moisander, M., Hiltunen, M., Smolander, T., Ikonen, J., Cohen, J., Salminen, M., Norberg, J., Veijola, K., and Venäläinen, P.: GlobSnow v3.0 Northern Hemisphere snow water equivalent dataset, Scientific Data, 8, https://doi.org/10.1038/s41597-021-00939-2, 2021. a, b
Macias-Fauria, M., Forbes, B. C., Zetterberg, P., and Kumpula, T.: Eurasian Arctic greening reveals teleconnections and the potential for structurally novel ecosystems, Nature Climate Change, 2, 613–618, https://doi.org/10.1038/nclimate1558, 2012. a, b, c, d, e, f
Macias-Fauria, M., Karlsen, S. R., and Forbes, B. C.: Disentangling the coupling between sea ice and tundra productivity in Svalbard, Scientific Reports, 7, https://doi.org/10.1038/s41598-017-06218-8, 2017. a, b, c, d, e
Mekonnen, Z. A., Riley, W. J., Berner, L. T., Bouskill, N. J., Torn, M. S., Iwahana, G., Breen, A. L., Myers-Smith, I. H., Criado, M. G., Liu, Y., Euskirchen, E. S., Goetz, S. J., Mack, M. C., and Grant, R. F.: Arctic tundra shrubification: a review of mechanisms and impacts on ecosystem carbon balance, Environmental Research Letters, 16, 053001, https://doi.org/10.1088/1748-9326/abf28b, 2021. a, b
Miner, K. R., Turetsky, M. R., Malina, E., Bartsch, A., Tamminen, J., McGuire, A. D., Fix, A., Sweeney, C., Elder, C. D., and Miller, C. E.: Permafrost carbon emissions in a changing Arctic, Nature Reviews Earth & Environment, 3, 55–67, https://doi.org/10.1038/s43017-021-00230-3, 2022. a, b, c
Mortin, J., Schrøder, T. M., Walløe Hansen, A., Holt, B., and McDonald, K. C.: Mapping of seasonal freeze‐thaw transitions across the pan‐Arctic land and sea ice domains with satellite radar, Journal of Geophysical Research: Oceans, 117, https://doi.org/10.1029/2012jc008001, 2012. a
Myers-Smith, I. H., Kerby, J. T., Phoenix, G. K., Bjerke, J. W., Epstein, H. E., Assmann, J. J., John, C., Andreu-Hayles, L., Angers-Blondin, S., Beck, P. S. A., Berner, L. T., Bhatt, U. S., Bjorkman, A. D., Blok, D., Bryn, A., Christiansen, C. T., Cornelissen, J. H. C., Cunliffe, A. M., Elmendorf, S. C., Forbes, B. C., Goetz, S. J., Hollister, R. D., de Jong, R., Loranty, M. M., Macias-Fauria, M., Maseyk, K., Normand, S., Olofsson, J., Parker, T. C., Parmentier, F.-J. W., Post, E., Schaepman-Strub, G., Stordal, F., Sullivan, P. F., Thomas, H. J. D., Tømmervik, H., Treharne, R., Tweedie, C. E., Walker, D. A., Wilmking, M., and Wipf, S.: Complexity revealed in the greening of the Arctic, Nature Climate Change, 10, 106–117, https://doi.org/10.1038/s41558-019-0688-1, 2020. a
Obu, J., Westermann, S., Bartsch, A., Berdnikov, N., Christiansen, H. H., Dashtseren, A., Delaloye, R., Elberling, B., Etzelmüller, B., Kholodov, A., Khomutov, A., Kääb, A., Leibman, M. O., Lewkowicz, A. G., Panda, S. K., Romanovsky, V., Way, R. G., Westergaard-Nielsen, A., Wu, T., Yamkhin, J., and Zou, D.: Northern Hemisphere permafrost map based on TTOP modelling for 2000–2016 at 1 km2 scale, Earth-Science Reviews, 193, 299–316, https://doi.org/10.1016/j.earscirev.2019.04.023, 2019. a
Obu, J., Westermann, S., Barboux, C., Bartsch, A., Delaloye, R., Grosse, G., Heim, B., Hugelius, G., Irrgang, A., Kääb, A. M., Kroisleitner, C., Matthes, H., Nitze, I., Pellet, C., Seifert, F. M., Strozzi, T., Wegmüller, U., Wieczorek, M., and Wiesmann, A.: ESA Permafrost Climate Change Initiative (Permafrost_cci): Permafrost extent for the Northern Hemisphere, v3.0, CEDA [data set], https://doi.org/10.5285/6e2091cb0c8b4106921b63cd5357c97c, 2021a. a, b
Obu, J., Westermann, S., Barboux, C., Bartsch, A., Delaloye, R., Grosse, G., Heim, B., Hugelius, G., Irrgang, A., Kääb, A. M., Kroisleitner, C., Matthes, H., Nitze, I., Pellet, C., Seifert, F. M., Strozzi, T., Wegmüller, U., Wieczorek, M., and Wiesmann, A.: ESA Permafrost Climate Change Initiative (Permafrost_cci): Permafrost ground temperature for the Northern Hemisphere, v3.0, CEDA [data set], https://doi.org/10.5285/b25d4a6174de4ac78000d034f500a268, 2021b. a, b, c, d
OSI SAF and EUMETSAT SAF On Ocean And Sea Ice: Sea Ice Index – Multimission, EUMETSAT [data set], https://doi.org/10.15770/EUM_SAF_OSI_0022, 2020. a, b, c, d, e, f, g, h, i, j, k, l
Park, H., Walsh, J. E., Kim, Y., Nakai, T., and Ohata, T.: The role of declining Arctic sea ice in recent decreasing terrestrial Arctic snow depths, Polar Science, 7, 174–187, https://doi.org/10.1016/j.polar.2012.10.002, 2013. a, b, c, d
Park, T., Ganguly, S., Tømmervik, H., Euskirchen, E. S., Høgda, K.-A., Karlsen, S. R., Brovkin, V., Nemani, R. R., and Myneni, R. B.: Changes in growing season duration and productivity of northern vegetation inferred from long-term remote sensing data, Environmental Research Letters, 11, 084001, https://doi.org/10.1088/1748-9326/11/8/084001, 2016. a, b, c
Parmentier, F. W., Zhang, W., Mi, Y., Zhu, X., van Huissteden, J., Hayes, D. J., Zhuang, Q., Christensen, T. R., and McGuire, A. D.: Rising methane emissions from northern wetlands associated with sea ice decline, Geophysical Research Letters, 42, 7214–7222, https://doi.org/10.1002/2015gl065013, 2015. a, b, c
Pedersen, A., Soininen, E., Hansen, B., Le Moullec, M., Loe, L., Paulsen, I., Eischeid, I., Karlsen, S., Ropstad, E., Stien, A., Tarroux, A., Tommervik, H., and Ravolainen, V.: High seasonal overlap in habitat suitability in a non-migratory High Arctic ungulate, Global Ecology and Conservation, 45, e02528, https://doi.org/10.1016/j.gecco.2023.e02528, 2023. a
Peeters, B., Le Moullec, M., Raeymaekers, J. A. M., Marquez, J. F., Røed, K. H., Pedersen, A. O., Veiberg, V., Loe, L. E., and Hansen, B. B.: Sea ice loss increases genetic isolation in a high Arctic ungulate metapopulation, Global Change Biology, 26, 2028–2041, https://doi.org/10.1111/gcb.14965, 2020. a
Pinzon, J. and Tucker, C.: A Non-Stationary 1981–2012 AVHRR NDVI3g Time Series, Remote Sensing, 6, 6929–6960, https://doi.org/10.3390/rs6086929, 2014. a, b
Pulliainen, J., Luojus, K., Derksen, C., Mudryk, L., Lemmetyinen, J., Salminen, M., Ikonen, J., Takala, M., Cohen, J., Smolander, T., and Norberg, J.: Patterns and trends of Northern Hemisphere snow mass from 1980 to 2018, Nature, 581, 294–298, https://doi.org/10.1038/s41586-020-2258-0, 2020. a, b, c, d, e, f, g, h, i, j, k
Rantanen, M., Karpechko, A. Y., Lipponen, A., Nordling, K., Hyvärinen, O., Ruosteenoja, K., Vihma, T., and Laaksonen, A.: The Arctic has warmed nearly four times faster than the globe since 1979, Communications Earth & Environment, 3, https://doi.org/10.1038/s43247-022-00498-3, 2022. a
Raynolds, M. K., Walker, D. A., Balser, A., Bay, C., Campbell, M., Cherosov, M. M., Daniëls, F. J., Eidesen, P. B., Ermokhina, K. A., Frost, G. V., Jedrzejek, B., Jorgenson, M. T., Kennedy, B. E., Kholod, S. S., Lavrinenko, I. A., Lavrinenko, O. V., Magnússon, B., Matveyeva, N. V., Metúsalemsson, S., Nilsen, L., Olthof, I., Pospelov, I. N., Pospelova, E. B., Pouliot, D., Razzhivin, V., Schaepman-Strub, G., Šibík, J., Telyatnikov, M. Y., and Troeva, E.: A raster version of the Circumpolar Arctic Vegetation Map (CAVM), Remote Sensing of Environment, 232, 111297, https://doi.org/10.1016/j.rse.2019.111297, 2019. a
Rehder, Z., Niederdrenk, A. L., Kaleschke, L., and Kutzbach, L.: Analyzing links between simulated Laptev Sea sea ice and atmospheric conditions over adjoining landmasses using causal-effect networks, The Cryosphere, 14, 4201–4215, https://doi.org/10.5194/tc-14-4201-2020, 2020. a, b
Rixen, C., Høye, T. T., Macek, P., Aerts, R., Alatalo, J. M., Anderson, J. T., Arnold, P. A., Barrio, I. C., Bjerke, J. W., Björkman, M. P., Blok, D., Blume-Werry, G., Boike, J., Bokhorst, S., Carbognani, M., Christiansen, C. T., Convey, P., Cooper, E. J., Cornelissen, J. H. C., Coulson, S. J., Dorrepaal, E., Elberling, B., Elmendorf, S. C., Elphinstone, C., Forte, T. G., Frei, E. R., Geange, S. R., Gehrmann, F., Gibson, C., Grogan, P., Halbritter, A. H., Harte, J., Henry, G. H., Inouye, D. W., Irwin, R. E., Jespersen, G., Jónsdóttir, I. S., Jung, J. Y., Klinges, D. H., Kudo, G., Lämsä, J., Lee, H., Lembrechts, J. J., Lett, S., Lynn, J. S., Mann, H. M., Mastepanov, M., Morse, J., Myers-Smith, I. H., Olofsson, J., Paavola, R., Petraglia, A., Phoenix, G. K., Semenchuk, P., Siewert, M. B., Slatyer, R., Spasojevic, M. J., Suding, K., Sullivan, P., Thompson, K. L., Väisänen, M., Vandvik, V., Venn, S., Walz, J., Way, R., Welker, J. M., Wipf, S., and Zong, S.: Winters are changing: snow effects on Arctic and alpine tundra ecosystems, Arctic Science, 8, 572–608, https://doi.org/10.1139/as-2020-0058, 2022. a
Sasgen, I., Steinhoefel, G., Kasprzyk, C., Matthes, H., Westermann, S., Boike, J., and Grosse, G.: Atmosphere circulation patterns synchronize pan-Arctic glacier melt and permafrost thaw, Communications Earth & Environment, 5, 375, https://doi.org/10.1038/s43247-024-01548-8, 2024. a, b, c, d
Smedsrud, L. H., Halvorsen, M. H., Stroeve, J. C., Zhang, R., and Kloster, K.: Fram Strait sea ice export variability and September Arctic sea ice extent over the last 80 years, The Cryosphere, 11, 65–79, https://doi.org/10.5194/tc-11-65-2017, 2017. a
Smith, N. V., Saatchi, S. S., and Randerson, J. T.: Trends in high northern latitude soil freeze and thaw cycles from 1988 to 2002, Journal of Geophysical Research: Atmospheres, 109, https://doi.org/10.1029/2003JD004472, 2004. a, b
Spreen, G., Kaleschke, L., and Heygster, G.: Sea ice remote sensing using AMSR-E 89-GHz channels, Journal of Geophysical Research, 113, https://doi.org/10.1029/2005jc003384, 2008. a, b
Spreen, G., de Steur, L., Divine, D., Gerland, S., Hansen, E., and Kwok, R.: Arctic Sea Ice Volume Export Through Fram Strait From 1992 to 2014, Journal of Geophysical Research: Oceans, 125, https://doi.org/10.1029/2019jc016039, 2020. a
Stroeve, J. and Notz, D.: Changing state of Arctic sea ice across all seasons, Environmental Research Letters, 13, 103001, https://doi.org/10.1088/1748-9326/aade56, 2018. a
Takala, M., Pulliainen, J., Metsamaki, S., and Koskinen, J.: Detection of Snowmelt Using Spaceborne Microwave Radiometer Data in Eurasia From 1979 to 2007, IEEE Transactions on Geoscience and Remote Sensing, 47, 2996–3007, https://doi.org/10.1109/TGRS.2009.2018442, 2009. a, b
Tucker, C. J. and Sellers, P. J.: Satellite remote sensing of primary production, International Journal of Remote Sensing, 7, 1395–1416, https://doi.org/10.1080/01431168608948944, 1986. a
Tømmervik, H.: GLOBAL MODIS NDVI/LAI and NOAA AVHRR GIMMS NDVI datasets, Zenodo [data set], https://doi.org/10.5281/ZENODO.14644910, 2025. a, b, c
Vermote, E. and NOAA CDR Program: NOAA Climate Data Record (CDR) of AVHRR Normalized Difference Vegetation Index (NDVI), Version 5, NOAA [data set], https://doi.org/10.7289/V5ZG6QH9, 2019. a
Vikhamar-Schuler, D., Isaksen, K., Haugen, J. E., Tømmervik, H., Luks, B., Schuler, T. V., and Bjerke, J. W.: Changes in Winter Warming Events in the Nordic Arctic Region, Journal of Climate, 29, 6223–6244, https://doi.org/10.1175/jcli-d-15-0763.1, 2016. a
Walker, D., Gould, W., Maier, H., and Raynolds, M.: The Circumpolar Arctic Vegetation Map: AVHRR-derived base maps, environmental controls, and integrated mapping procedures, International Journal of Remote Sensing, 23, 4551–4570, 2002. a, b, c
Watts, J. D., Potter, S., Rogers, B. M., Virkkala, A., Fiske, G., Arndt, K. A., Burrell, A., Butler, K., Gerlt, B., Grayson, J., Shestakova, T. A., Du, J., Kim, Y., Parmentier, F. W., and Natali, S. M.: Regional Hotspots of Change in Northern High Latitudes Informed by Observations From Space, Geophysical Research Letters, 52, https://doi.org/10.1029/2023GL108081, 2025. a
Westermann, S., Peter, M., Langer, M., Schwamborn, G., Schirrmeister, L., Etzelmüller, B., and Boike, J.: Transient modeling of the ground thermal conditions using satellite data in the Lena River delta, Siberia, The Cryosphere, 11, 1441–1463, https://doi.org/10.5194/tc-11-1441-2017, 2017. a, b
Yan, J., Zhang, G., Ling, H., and Han, F.: Comparison of time-integrated NDVI and annual maximum NDVI for assessing grassland dynamics, Ecological Indicators, 136, 108611, https://doi.org/10.1016/j.ecolind.2022.108611, 2022. a
Yu, L., Leng, G., and Python, A.: Varying response of vegetation to sea ice dynamics over the Arctic, Science of The Total Environment, 799, 149378, https://doi.org/10.1016/j.scitotenv.2021.149378, 2021. a, b
Zhang, W., Döscher, R., Koenigk, T., Miller, P., Jansson, C., Samuelsson, P., Wu, M., and Smith, B.: The Interplay of Recent Vegetation and Sea Ice Dynamics – Results From a Regional Earth System Model Over the Arctic, Geophysical Research Letters, 47, https://doi.org/10.1029/2019gl085982, 2020. a