the Creative Commons Attribution 4.0 License.
the Creative Commons Attribution 4.0 License.
 | 22 Oct 2025
How to reduce sampling errors in spaceborne cloud radar-based snowfall estimates
Filippo Emilio Scarsi
Alessandro Battaglia
Maximilian Maahn
Stef Lhermitte
Snowfall is an important climate change indicator affecting surface albedo, glaciers, sea ice, freshwater storage, cloud lifetime, and ecosystems. Precise snowfall measurements at high latitudes are particularly important for the estimation of the mass balance of ice sheets; however, the snowfall is difficult to quantify with in situ measurements in those locations. In this context, spaceborne radar and radiometer atmospheric missions can help in the assessment of snowfall at high latitudes.
The decommissioned NASA CloudSat mission provided invaluable information about global snowfall climatology from 2006 to 2023. The CloudSat-based estimates of global snowfall are considered the reference for global snowfall estimates, but these data suffer from poor sampling and the inability to see shallow or retrieve heavy precipitation, which limits their use, for example, as input to surface mass balance models of the major ice sheets. WIVERN (WInd VElocity Radar Nephoscope), one of the ESA Earth Explorer 11 selected missions, is equipped with a conical scanning 94 GHz Doppler radar and a passive 94 GHz radiometer, with the main objective of measuring global in-cloud horizontal winds, but also quantifying cloud ice water content and precipitation rate. Its conically scanning system, with a 42° incidence angle, is expected to reduce the radar blind zone near the surface (especially over the ocean) and allows the mission to have a swath width of 800 km and 70 times more sampled points than a fixed-looking instrument. The proposed radar measurements tackle the current uncertainties in snowfall estimates, highly improving the sampling frequency and accuracy of snowfall measurements.
The uncertainty in snowfall measurements arises from various factors, including the diurnal cycle, uncertainty in the Z–S relationship, and the sampling error. This study quantifies each of these contributors individually and demonstrates the improved sampling capabilities of the WIVERN conically scanning geometry for some specific regions (Antarctica, Greenland) by computing the sampling error at different spatial and temporal scales via simulations of WIVERN vs. CloudSat orbits and scanning geometry, based on the snowfall rates produced by ERA5 reanalysis.
Results show that a WIVERN-like conically scanning system significantly reduces the uncertainty in polar snowfall estimates if compared to a CloudSat-like near-nadir fixed viewing geometry. While CloudSat generates acceptable errors at the annual zonal scales, WIVERN can produce estimates within the climatological variability for latitude–longitude domain larger than 0.5° × 0.5° already at the monthly timescale, making it a valuable product for regional climate model evaluation and as an input to surface mass balance models of the major ice sheets and glaciers.
- Article
(11608 KB) - Full-text XML
- BibTeX
- EndNote


In polar regions and mid-latitudes, most precipitation is formed through the ice phase as snowfall (Mülmenstädt et al., 2015). For high latitudes and mountainous regions, it is the dominating form of precipitation on the ground (Field and Heymsfield, 2015). Therefore, snowfall not only removes moisture form the atmosphere but also plays a crucial, interlinking role in the climate system. In the cryosphere, snowfall is the only mass source term for glaciers and ice sheets and is thus crucial for their mass balance (Souverijns et al., 2018a). On sea ice, snow forms an insulating layer between sea ice and the atmosphere, impacting sea ice lifetime (Perovich et al., 2017). On land, snow modifies the surface albedo, which is relevant for the ice–albedo feedback (Hall, 2004). Furthermore, snow cover impacts ecology (Slatyer et al., 2022), traffic safety (Strong et al., 2010), recreation (Steiger et al., 2019), and freshwater storage, which is also relevant for hydropower generation (Wasti et al., 2022). In a warming climate, precipitation amounts and extreme events, including heavy snowfall, are expected to increase (Quante et al., 2021), but the estimates of the exact magnitudes are affected by large uncertainties (Lopez-Cantu et al., 2020). This is because the exact pathways through which ice particles, liquid water, cloud dynamics, and aerosol particles are interacting during snow formation are not well understood (Morrison et al., 2012; Griesche et al., 2021).
Better observations of the fingerprints of snowfall formation processes at sufficient spatio-temporal resolution are needed to advance our understanding of ice- and mixed-phase clouds and precipitation formation processes (Morrison et al., 2020). Traditionally, snowfall is measured with in situ gauges, but high spatial variability (Scipión et al., 2013), poor coverage (Kidd et al., 2017), and wind-related undercatch (Yang et al., 1999) pose significant challenges.
The deficits of in situ snowfall observations require the use of remote sensing techniques. Because ground-based remote sensing with weather radar is available only in densely populated areas, and few sites are equipped with radars in the polar regions (e.g. Matrosov et al., 2008; Souverijns et al., 2018b; Li et al., 2021; Schoger et al., 2021; Matrosov et al., 2022; Tridon et al., 2022; Alexander et al., 2023), spaceborne remote sensing techniques are the prime method to observe snowfall globally. Passive microwave sensors such as the AMSU (Advanced Microwave Sounding Unit) offer good spatial coverage due to their kilometre-scale imaging capabilities, but passive microwave signals are also impacted by surface properties (Chen and Staelin, 2003; Skofronick-Jackson et al., 2004; Skofronick-Jackson and Johnson, 2011) and the presence of supercooled liquid water (Wang et al., 2013; Battaglia and Panegrossi, 2020; Panegrossi et al., 2022), which are difficult to separate from atmospheric scattering contributions by frozen hydrometeors.
Due to their unique profiling capabilities, radar can provide profile properties of hydrometeors and separate scattering by hydrometeors from the surface. Even though the conversion into snowfall rates is associated with uncertainties related to indirect observation, spaceborne radars on low-orbit satellites such as CloudSat (Stephens et al., 2002) and EarthCARE (Wehr et al., 2023) provide the best way to observe snowfall globally (Milani and Kidd, 2023). CloudSat snowfall measurements have been successfully evaluated with ground-based in situ (Hiley et al., 2011) and ground-based radar networks (Smalley et al., 2014; Mroz et al., 2021). The data have been used to produce snowfall climatologies (Liu, 2008; Palerme et al., 2014; Stephens et al., 2018; Bennartz et al., 2019; Kulie et al., 2020), which are most relevant in regions with sparse in situ observations such as Antarctica or Greenland. Further, CloudSat data were used to study seasonal cycles (Kulie and Milani, 2018), evaluate climate models (Palerme et al., 2017), and study the surface mass balance of ice sheets (Boening et al., 2012; Milani et al., 2018). However, the combination of CloudSat's revisit time of 16 d combined with the 1 km footprint of the observations leads to a sparse spatial sampling, causing noise in snowfall climatologies even when averaging over 10 years (Kulie et al., 2020). Further, it was found that CloudSat's snowfall retrieval has biases for snowfall rates exceeding 1.0 mm h−1 (Cao et al., 2014). Due to surface clutter contamination, CloudSat cannot observe snowfall in the blind zone, which is up to 1200 m thick and can lead to an underestimation of snowfall rate for shallow events but also to an overestimation of snowfall rate due to sublimation (Maahn et al., 2014).
In this study, we show the potential of the ESA Earth Explorer 11 selected mission WIVERN (WInd VElocity Radar Nephoscope; http://www.wivern.polito.it (last access: 15 June 2024); Illingworth et al., 2018; Battaglia et al., 2018, 2022; ESA, 2025; Rizik et al., 2023; Tridon et al., 2023) to monitor global snowfall. Different to CloudSat and EarthCARE, WIVERN's cloud radar will not measure at nadir but will scan conically at a 38° off-nadir angle (for measuring horizontal in-cloud wind) and also features a 94 GHz passive channel. WIVERN will be characterized by a smaller blind zone over ice-free ocean (Coppola et al., 2025) and has the potential for improved snowfall retrievals due to the availability of a passive channel (Battaglia and Panegrossi, 2020). However, over land and sea ice, WIVERN's blind zone is anticipated to be larger than that of CloudSat, potentially limiting its capability to observe shallow-snowfall precipitation events. This work focusses on how the conical scanning, with 70 times better coverage than for a nadir-pointing instrument such as CloudSat or EarthCARE, improves snowfall estimates. The analysis is based on three main assumptions.
-
Blind zone effect. The impact of the blind zone is related to the snowfall regime. With shallow snowfall being the most common, a significant number of snowfall events occur below CloudSat’s blind zone (Shates et al., 2025). While WIVERN's surface snowfall retrieval performance would improve over ice-free oceans compared to CloudSat due to reduced blind zone effects, it would decrease over land and sea ice. The blind zone effect is not accounted for in the current snowfall estimate analysis. However, the resulting impact on estimates is examined in Sect. 4. Coppola et al. (2025) provides a detailed discussion on the hydrometeor detection near the Earth's surface in WIVERN and CloudSat measurements.
-
Z–S relationship assumption. The Z–S relationship is assumed to be unbiased. In practice, the Z–S is typically application dependent.
-
Attenuation is neglected, and its contribution is expected to reduce the SNR (signal-to-noise ratio) at very high snowfall rates. Also, it is expected to be larger for WIVERN due to its slanted observation geometry.
WIVERN and the methodology are introduced in Sect. 2, results are presented in Sect. 3, the ground clutter impact on surface snow precipitation is discussed in Sect. 4, and concluding remarks are given in Sect. 5.
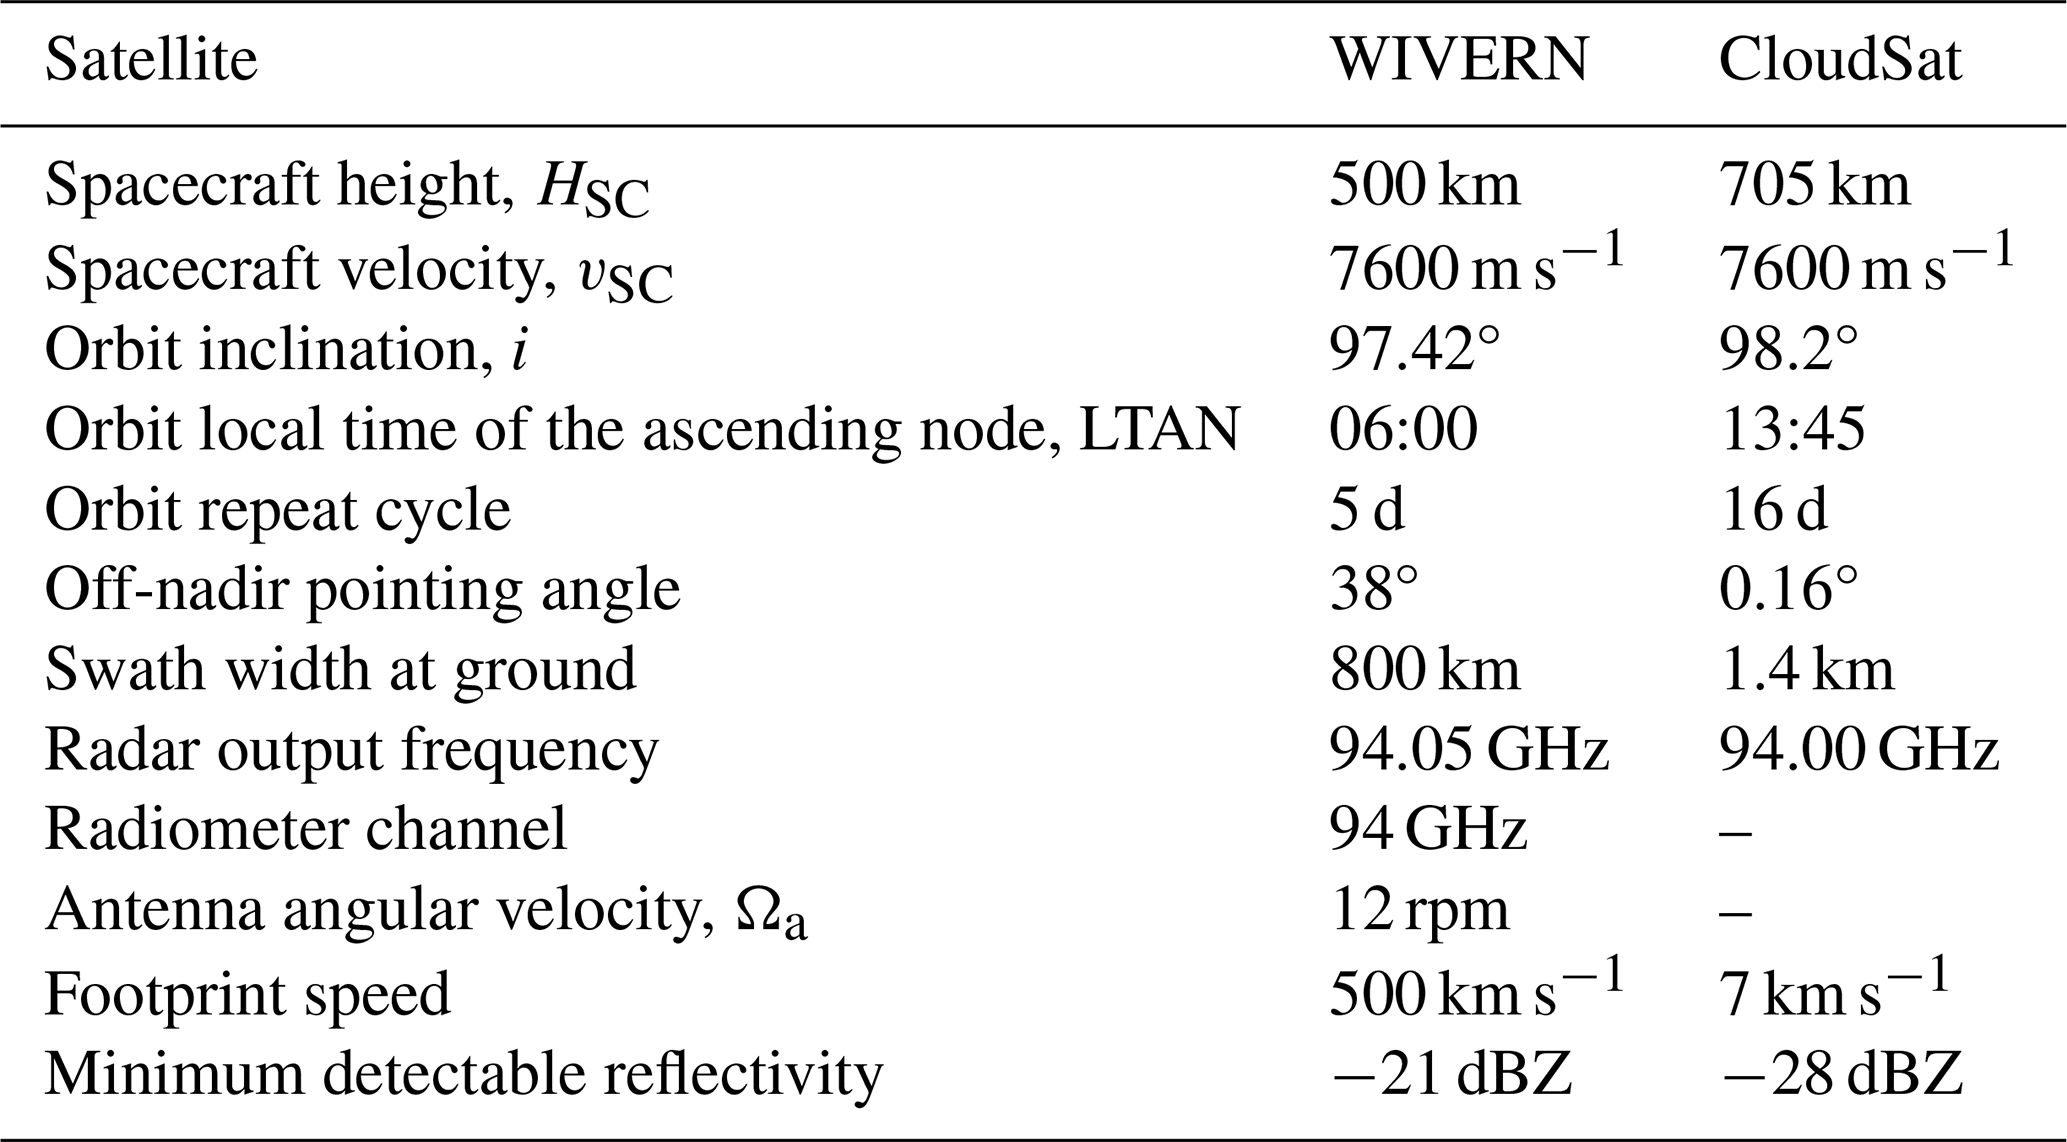
Table 1WIVERN and CloudSat (Stephens et al., 2002) orbit and radar specifics. The shown configuration of WIVERN is the one currently under Phase A study for the ESA Earth Explorer 11 programme.
The basis for this work is the ERA5 hourly surface snowfall (water equivalent) reanalysis product (Hersbach et al., 2023a), as it is considered to have realistic spatio-temporal snow fields (Kouki et al., 2023). The ERA5 snowfall dataset that was used in the analysis has a spatial resolution of 0.25° × 0.25° and covers a total time span of 20 years from 2001 to 2020. We use it as a benchmark to compare the accumulated snowfall retrieved by WIVERN-like and CLOUDSAT-like radar instruments, both simulated with the same ERA5 dataset. The sampling of the radar footprints was computed based on the viewing geometry (see Table 1) and the satellite orbits, which have been propagated in the period of interest according to the orbital parameters reported in Table 1. Then, for each time stamp of the selected ERA5 dataset, a mask that indicates whether any given 0.25° × 0.25° grid point of the geolocated snowfall dataset is sampled by the instrument is generated according to the radar footprints' positions on the ground. With a conically scanning radar, several passes over the same grid point may occur within minutes, but we count several passes within 1 h as one.
The mask was applied to the ERA5 snowfall dataset to produce two datasets, with the snowfall simulated as observed by the CloudSat and WIVERN instruments using the following procedure. The hourly ERA5 snowfall, S, is converted to the equivalent radar reflectivity factor ze according to a mean climatological relationship as proposed by Hiley et al. (2011) through
with ze in mm6 m−3. Typically, reflectivity is used in logarithmic units, with dBZ converted according to . The reflectivity below the nominal radar sensitivity (−21 and −28 dBZ for WIVERN and CloudSat, respectively) is set to 0 mm6 m−3, as below these thresholds, no snow precipitation is expected to be detected. The Ze values are converted to snowfall rate by introducing random noise associated with the uncertainty in the Ze–S relationship. For this, Z, in dBZ, is assumed to be normally distributed. Consequently, S is sampled from a log-normal distribution, whose mean value corresponds to the ERA5 value and whose standard deviations are computed as half the difference, , where S1σ and S−1σ are assumed equal to
-
;
-
,
which are the inverse formulas of ze=61.2 S1.1 and ze=7.6 S1.3, respectively, proposed by Hiley et al. (2011) as lower and upper boundaries for the uncertainty in the Ze–S relationship. This represents a worst-case estimate of the uncertainty caused by the Ze–S relationship, as we assume it varies randomly from grid box to grid box, whereas in reality it may be spatially correlated. Here, we neglect errors related to the fact that S is not observed at the surface, but at a higher altitude due to the surface clutter (1200 m for CloudSat; Maahn et al., 2014). Also note that, typically, Z–S relationships cannot be unbiased for every regime, application, and context. For instance, Hiley's distributions are derived for specific regimes (e.g. no riming). Therefore, outside those regimes (e.g. in the presence of riming, supercooled particles, or other particle shapes), other sources of uncertainty might exist.
Figure 1 shows an example case of geolocated ERA5 snowfall rate (2 January 2020, 18:00 UTC) in comparison to the corresponding simulated WIVERN and CloudSat retrievals. Despite its sparse sampling within its 800 km swath, the WIVERN footprint samples all 0.25° grid points within the swath, with an obvious benefit compared with the CloudSat nadir observations.
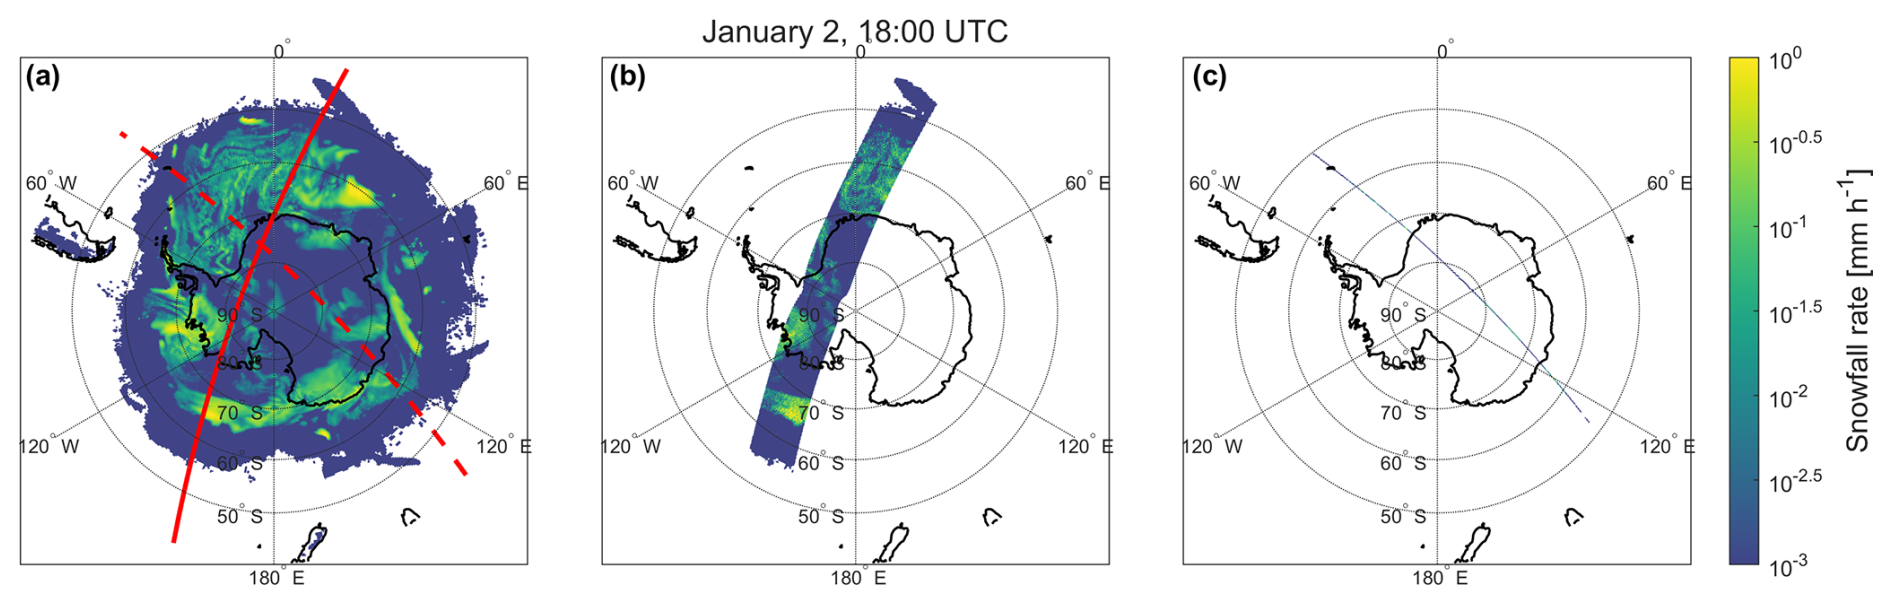
Figure 1Example of a geolocated WIVERN and CloudSat snowfall rate retrieval obtained at a given hour. Panel (a) shows the geolocated ERA5 accumulated snowfall rate on 2 January 2020 at 18:00 UTC, with the satellites' ground track of WIVERN and CloudSat outlined with the solid and dashed red lines, respectively. Panels (b) and (c) depict what would be the corresponding snowfall rate retrieval of WIVERN and CloudSat, respectively. Uncertainty due to application of the Ze–S relationship has been included.
Finally, the snowfall retrieved in each 0.25° × 0.25° grid box is aggregated at different timescales (e.g. a month, a year). The results can then be further aggregated over coarser spatial domains.
The simulated snowfall retrievals from the satellites are compared with the ERA5 reference dataset to assess the reliability of the WIVERN (SWIV) and CloudSat (SCS) data for estimating snowfall accumulation at different spatial and temporal scales.
For each investigated spatial and temporal resolution, time series data are accumulated for a total of 20 years. From the three time series of SERA5, SWIV, and SCS, the bias (), the root mean square error (), and their normalized counterparts (, ) are estimated with
The differences between the simulated fields and the ERA5 reference are mainly driven by three factors: the radar sensitivity leading to the omission of low-reflectivity events, the uncertainties in the Ze–S relationship, and the instrument sampling (i.e. the fact that at any location S is sampled intermittently according to the revisit time). The latter contribution can be further decomposed into the contribution associated with the diurnal cycle of the orbit (i.e. the fact that at any given location the satellite passes only at certain times of the day) and into the sparseness of the measurements on different days.
To study the impact of potential blind zone effects, which are neglected in the following when using ERA5 surface snowfall, we also use height-resolved ERA5 snow water content in Sect. 4.
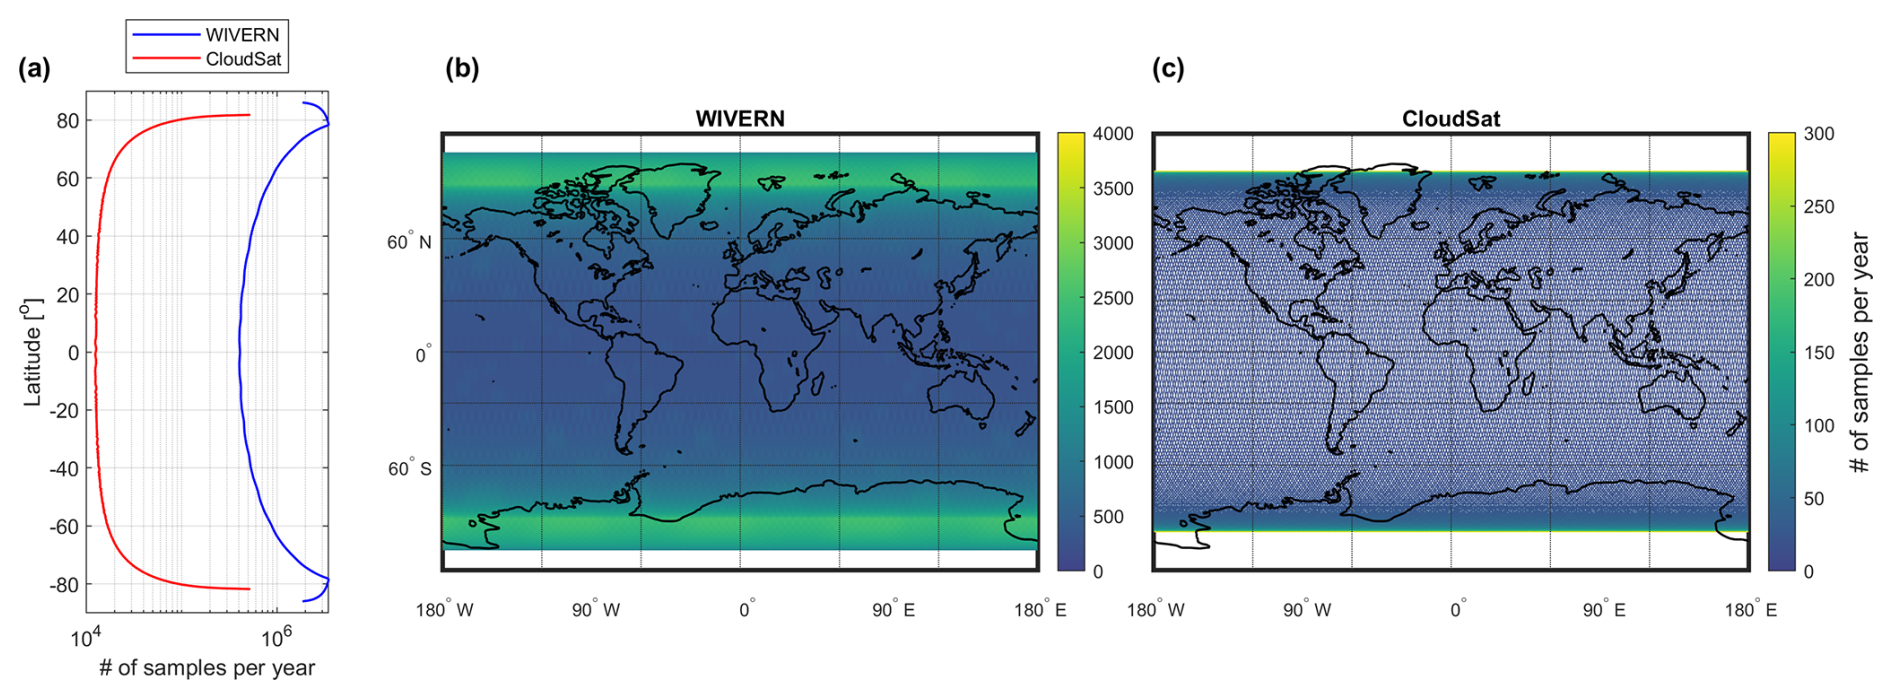
Figure 2Number of annual samples collected by WIVERN (b) and CloudSat (c) per 0.25° × 0.25° grid box. Note the different colour scales for the two panels. Zonal overpasses averaged over 0.25° wide latitude bands are shown in panel (a).
The number of annual samples collected by WIVERN and CloudSat shown in Fig. 2 clearly demonstrates the advantage of the WIVERN sampling, with an average of 6.696×10⁸ total number of samples per year compared to 1.45×10⁷ for CloudSat. While WIVERN produces global coverage with a resolution of 0.25° for absolute latitudes below 86°, CloudSat has gaps (white spots in the right panel of Fig. 2) due to its periodic orbit and its viewing geometry. The WIVERN reduction in the blind region near the poles up to 86° latitudes means a coverage of 95 % of the Antarctic continent, which is a significant improvement in comparison to CloudSat's coverage of only 75 % of the continent. And, unlike CloudSat, WIVERN can cover Greenland and the Southern Ocean completely.
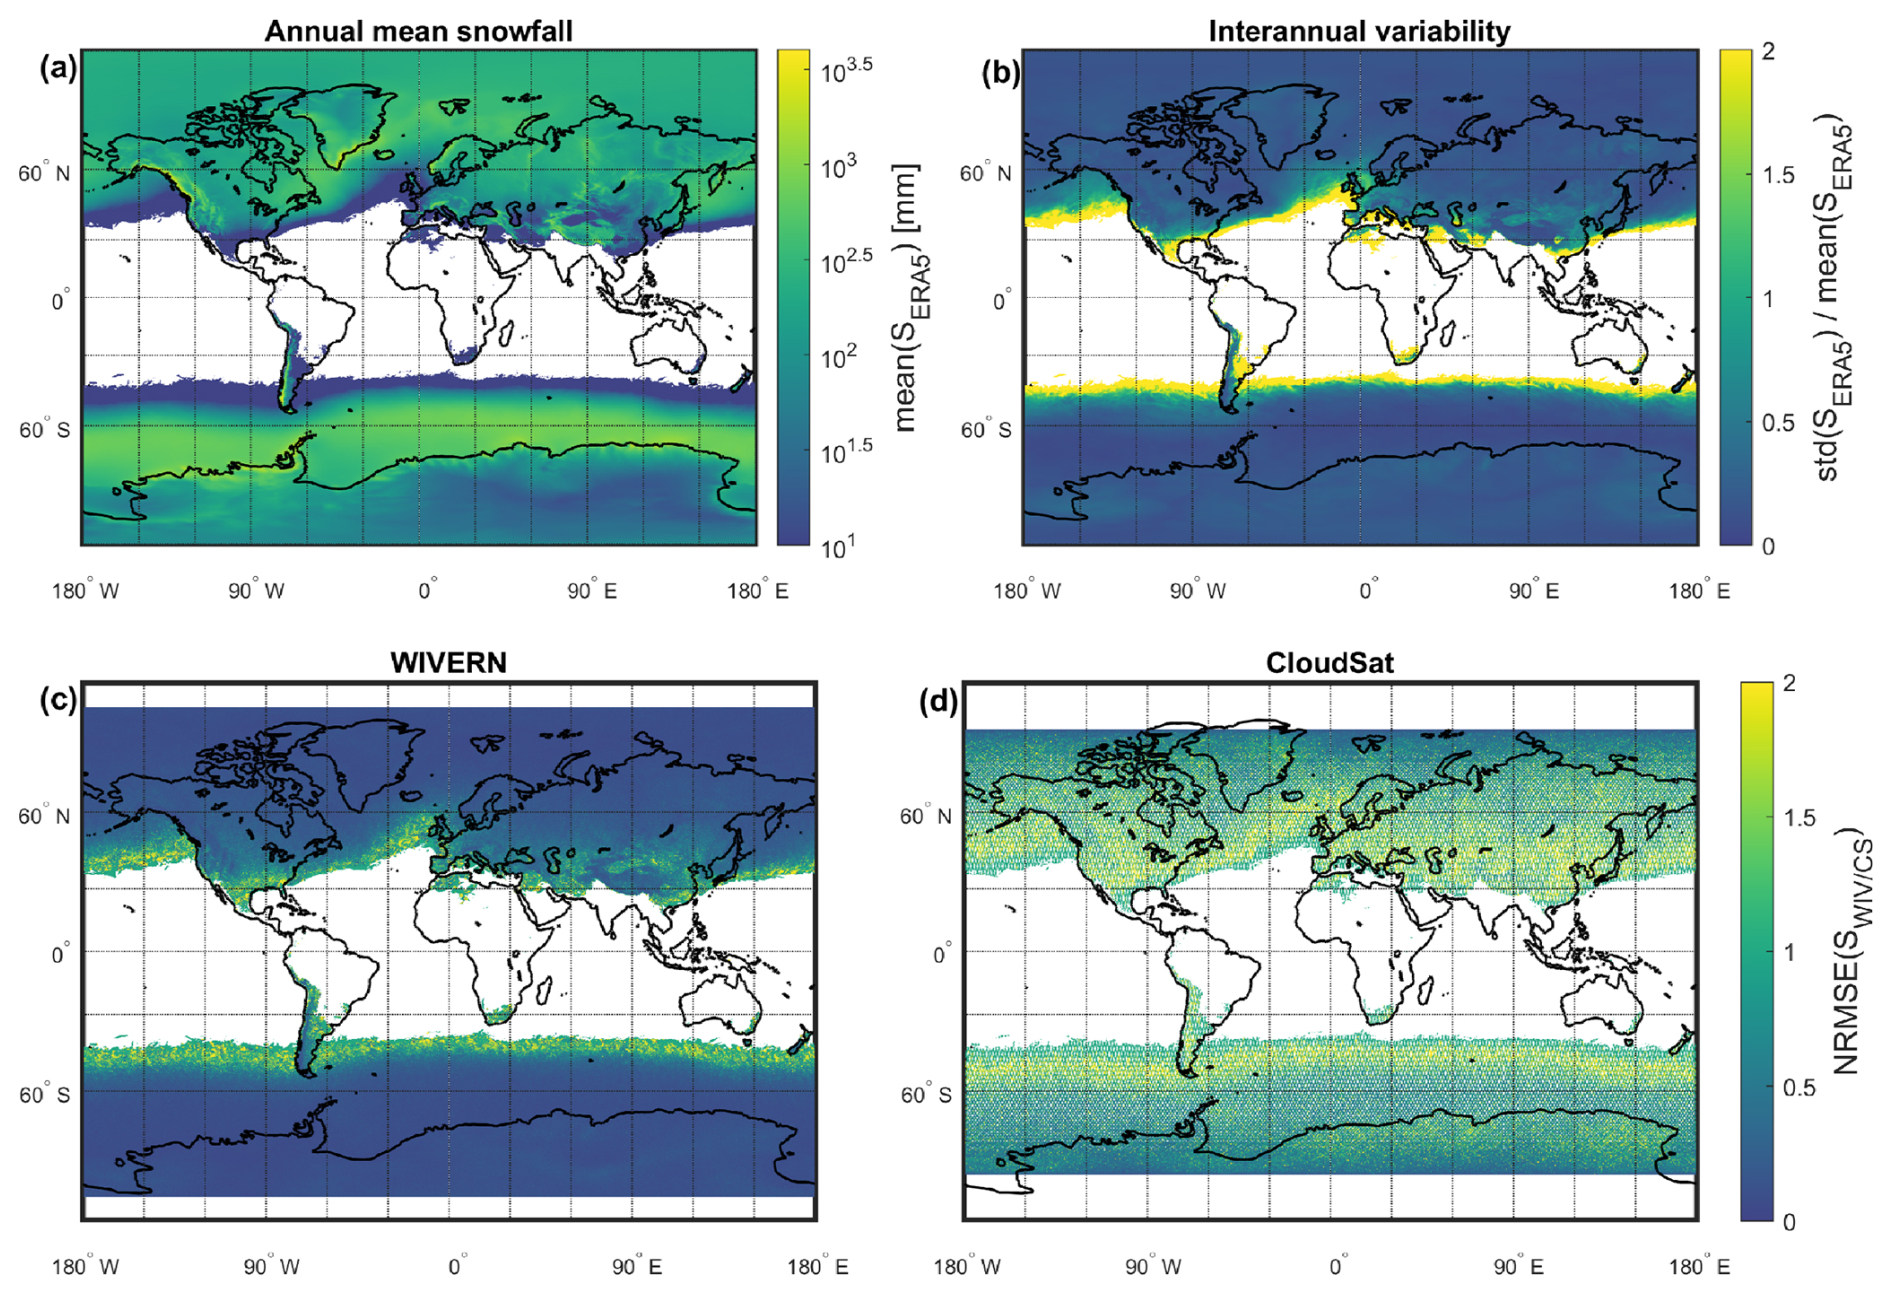
Figure 3Panel (a) shows the mean annual accumulated snowfall according to ERA5 from 2001 to 2020. Panel (b) shows the normalized standard deviation, hence the inter-annual variability in the snowfall. The corresponding normalized root mean square error in the 1-year accumulated snowfall sampled by WIVERN and CloudSat is also shown in panels (c) and (d), respectively.
We set the estimated CloudSat and WIVERN errors in perspective to the mean snowfall rate. Figure 3 shows the mean annual accumulated snowfall according to the ERA5 dataset in panel (a) and the normalized inter-annual variability in such snowfall in panel (b). The figure also depicts the NRMSE of the WIVERN (panel c) and CloudSat (panel d) annual accumulations. For WIVERN, the NRMSE is lower than 0.5 for most regions, with higher values in regions where the snowfall is rare so that the number of samples is low (i.e. in lower latitudes). The NRMSE tends to decrease when moving toward the poles due to the improved sampling (Fig. 2) and less intermittent snowfall observations. For CloudSat, the NRMSE is above 0.5 almost everywhere, rising to much higher values in regions where the snowfall is very rare due to the strong intermittency of the phenomenon and the poor sampling. The NRMSE constantly decreases as the satellite approaches the polar regions due to the higher number of samples collected by the satellite and the high sensitivity of the CloudSat CPR (Cloud Profiling Radar). Furthermore, the nadir-looking viewing geometry of CloudSat CPR, together with the repetition of the satellite's ground track, generates gaps in the sampling of increased size as they get closer to the Equator (see panel d in Fig. 3 or panel c in Fig. 2).
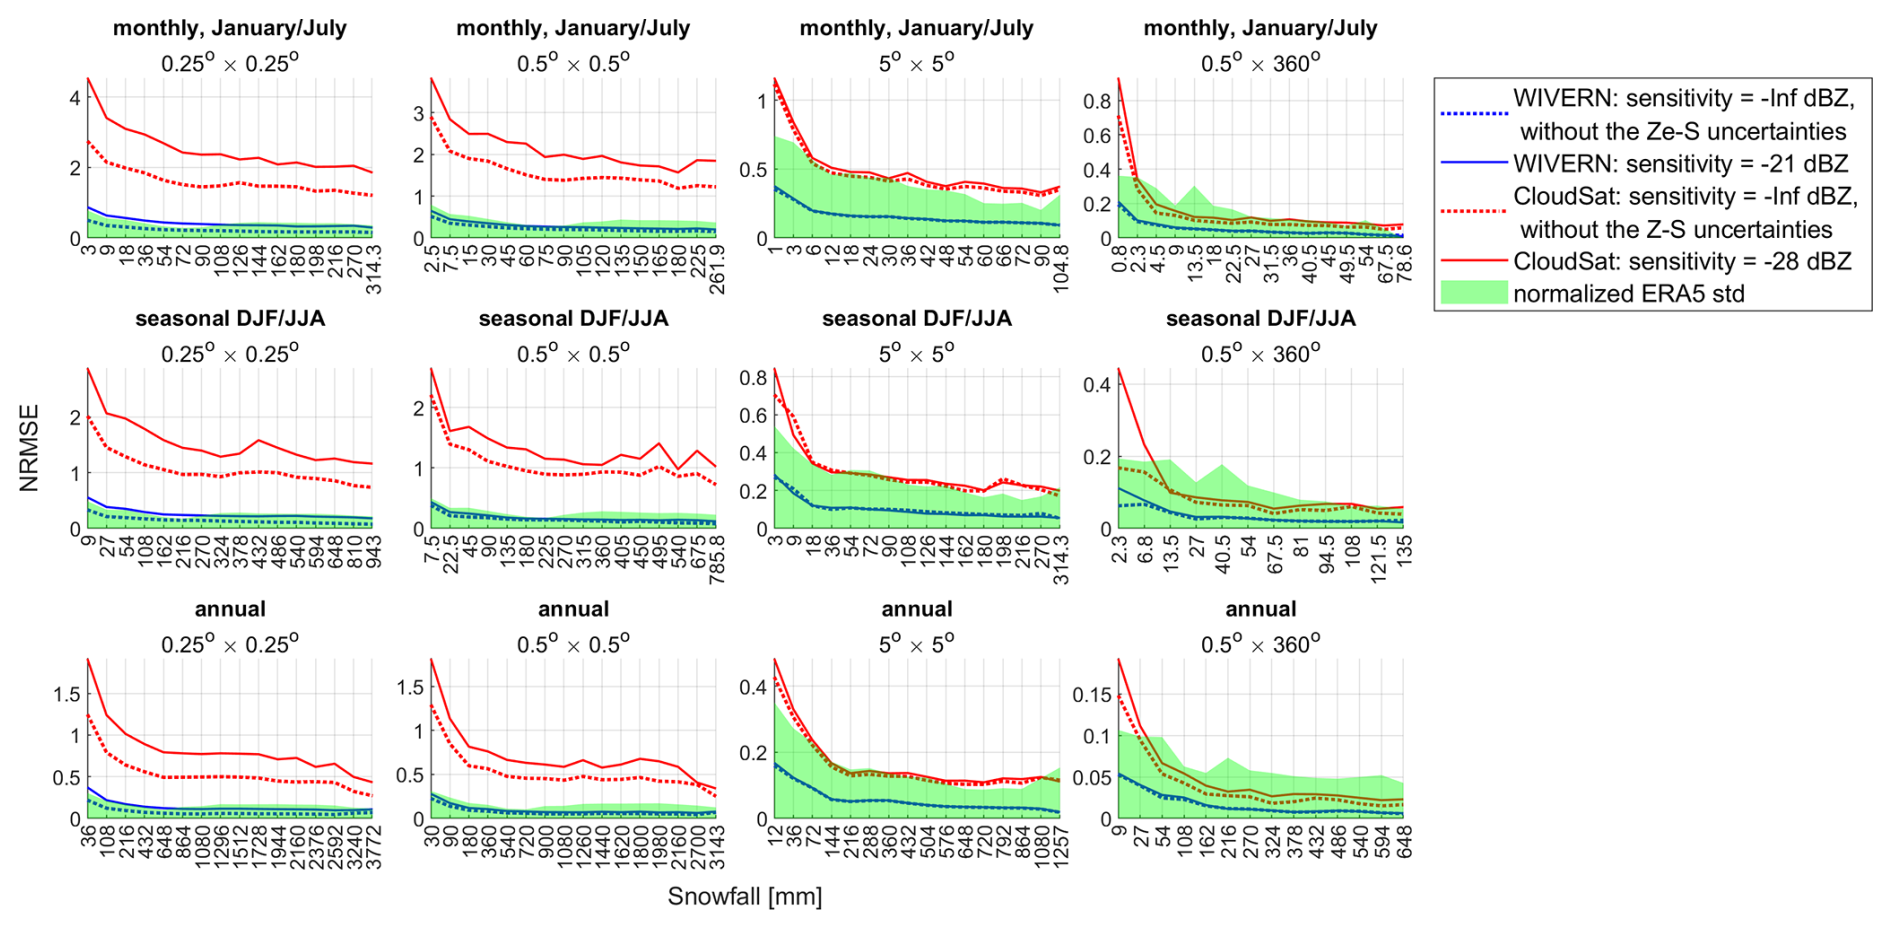
Figure 4NRMSE for WIVERN (blue lines) and CloudSat (red lines) as a function of different snowfall accumulation classes and for different lat×long grid box sizes and the zonal mean. The classes indicate the accumulated snowfall in the specified period, averaged in the specified spatial resolution domain. The NRMSE considering only the sampling contribution (dashed lines) and all sources of error (solid lines) is shown with different line styles. The monthly, seasonal, and annual timescales are shown in the top, middle, and bottom row, respectively. The snowfall classes are defined as snowfall intervals; e.g. for the annual timescale, the first bin corresponds to snowfall accumulations between 36 and 108 mm and the last bin to values ≥3772 mm. Results for the monthly (seasonal) case are shown when considering data of January (DJF) in the Northern Hemisphere and July (JJA) in the Southern Hemisphere. In order to provide useful benchmarks, WIVERN (or CloudSat) NRMSE must be lower than the normalized climatological variability in ERA5 snowfall (defined as the normalized standard deviation), which is indicated by the shaded green area. The solid black line indicates the number of occurrences in the analysed ERA5 dataset for the specific class (with the y-axis scale drawn on the right side).
3.1 Errors in snowfall accumulation at different spatial and temporal scales
In order to answer the question of how the error varies when the temporal scale of accumulation is changed, the analysis was conducted examining the estimated annual, seasonal, and monthly accumulated snowfall. Similarly, for spatial scales, global snowfall was aggregated into grids with lat × long box sizes of 0.25° × 0.25°, 0.5° × 0.5°, 1° × 1°, 5.0° × 5.0°, and 10.0° × 10.0°. Zonal averages with a latitude resolution of 0.5° have been studied to observe the zonal mean behaviour of the error as well.
Across the entire 20-year dataset, and for each temporal and spatial scale, grid points are grouped into classes based on the snowfall accumulation at the given timescale, averaged within a size pixel of the given spatial scale. For each class, the ERA5 mean snowfall, its standard deviation, and the normalized root mean square error (NRMSE) of WIVERN and CloudSat snowfall (relative to ERA5) are computed. Additionally, the climatological variability – defined as the class standard deviation normalized by the class mean – is also used to benchmark results.
Figure 4 illustrates the NRMSE of WIVERN (blue lines) and CloudSat (red lines) as a function of snowfall accumulation for different temporal and spatial scales. The NRMSE is presented both with and without applying a sensitivity threshold and Z–S uncertainties. Trends indicate that uncertainty decreases as snowfall accumulation increases. This is because regions with low snowfall accumulations typically experience infrequent snowfall events, which are more likely to be missed, especially by CloudSat due to its coarser sampling resolution.
Averaging over larger spatial domains (left vs. right figure columns) and longer temporal scales (upper vs. lower figure rows) reduces the NRMSE. Furthermore, Z–S uncertainties diminish when averaging over broader spatial domains, leading to a rapid convergence of the total NRMSE toward the NRMSE value expected only from sampling errors.
These trends behave according to the central limit theorem: the probability density function (PDF) being sampled by the two instruments is the ERA5 hourly snowfall product for each pixel. Each sampling process results in RMSE convergence following the relationship , where n represents the number of samples collected by the instrument (n1 for WIVERN and n2 for CloudSat, with n1>n2). As the temporal and spatial scales increase, n grows, and the RMSE converges. WIVERN experiences faster convergence than CloudSat due to its larger number of collected samples.
At the annual, seasonal, and monthly scales, the CloudSat NRMSE for zonal snow is lower than the climatological variability (with exceptions at very low snowfall rates). However, when looking at CloudSat 5° × 5°, the error exceeds the variability and is comparable to the WIVERN error at a much finer scale (0.25° × 0.25°).
If the climatological variability is used as a threshold for acceptable measurement uncertainty, then CloudSat annual accumulations can only be used at the annual zonal domains. Conversely, WIVERN produces errors lower than the natural variability at domains of at least 0.5° × 0.5°. WIVERN 0.25° × 0.25° can still be useful but only for annual, seasonal, and monthly accumulations larger than 864, 270, and 108 mm, respectively.
As highlighted by Roberts et al. (2018), it is important to have precipitation datasets with spatial resolution better than 100 km poleward of 50°; the WIVERN mission could significantly contribute to such a goal by providing snowfall rates at spatial scales better than 0.5°.
3.1.1 Impact of sampling error
The sampling error associated with the intermittent sampling of the snowfall (Fig. 4) is typically the dominant source of error; it decreases if the number of samples increases, e.g. when coarsening the spatial and/or the temporal scale and/or if the snowfall becomes less intermittent (e.g. typically for higher accumulations). As the WIVERN sampling is much better than that of CloudSat, its sampling error is always lower than that of CloudSat (by at least a factor of 2).
WIVERN and CloudSat orbits are both sun-synchronous, with a mean local time of the ascending node (MLTAN) of 06:00 and 13:45 local time, respectively. This means that for any given point on the Earth's surface, the spacecraft will always pass over that point at the same local time. The local time of the observation is the same as the local time of the satellite overpass. This is also true for WIVERN; however, the large swath width means that the same point can be observed at different local times, especially at high latitudes (e.g. at 80° S latitude there are on average 6.4 samples per day; see Fig. 2). Sampling a given site at only a few specific times of the day introduces an error in the snowfall accumulation due to the snowfall diurnal cycle (Watters et al., 2021; Milani and Wood, 2021), which is considered to be part of the sampling error. Since for WIVERN measurements at latitudes above 60° N and 60° S, the maximum revisit time (worst-case scenario) is always less than 1 d (Battaglia et al., 2022), WIVERN sampling errors are only induced by the diurnal cycle effect. However, this is not the case for CloudSat CPR sampling, which is characterized by an orbit repetition time of 16 d.
WIVERN's sampling errors are always smaller than the climatological variability at any spatial and temporal scale. Conversely, averaging over domains larger than 5° × 5° is required at all timescales to reduce CloudSat sampling errors below the threshold dictated by the natural variability, with the sampling errors in the zonal snowfall being comparable with the WIVERN sampling errors for domains 0.25° × 0.25° in size.
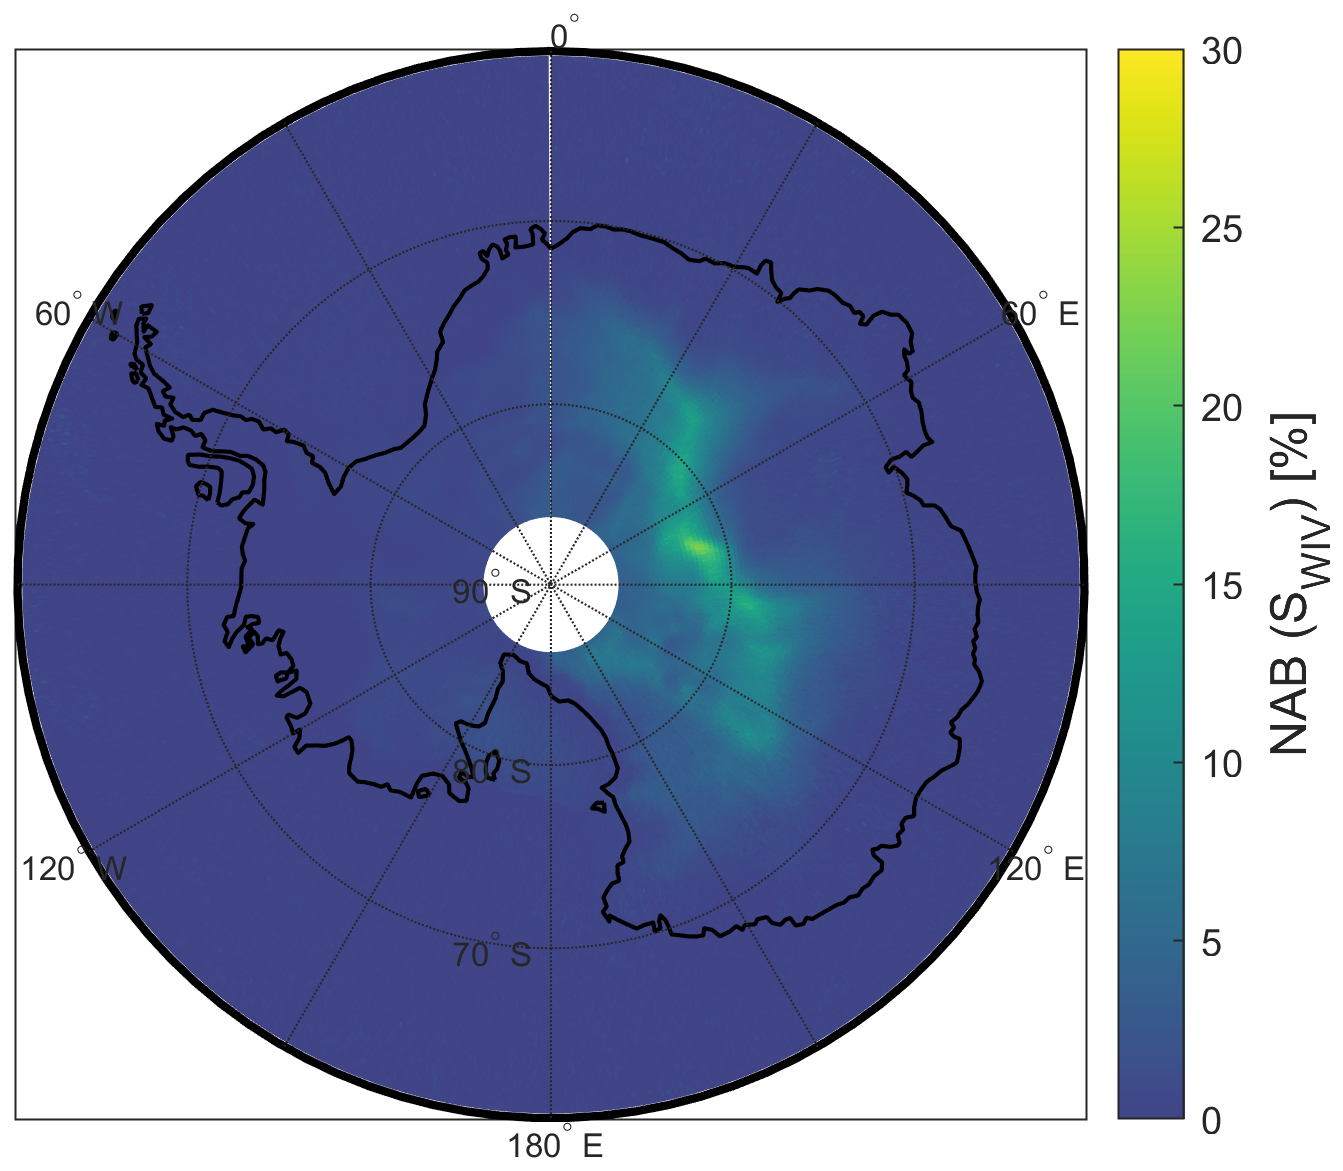
Figure 5Normalized absolute bias between SWIV computed with sensitivity = −21 dBZ and SWIV computed without the error induced by the sensitivity, normalized by the latter.
3.1.2 Impact of the radar sensitivity
The effect of the sensitivity emerges at locations where the snowfall rates generate reflectivities below the sensitivity of the radar. When adopting the Ze–S relationship of Eq. (1), the minimum detectable snowfall rate is and mm s−1 for WIVERN and CloudSat, respectively. Due to WIVERN's worse sensitivity, this effect is more pronounced than for CloudSat and is only really significant for specific regions where snow rates below the detection threshold contribute significantly to the total accumulation. In particular, the error in the WIVERN accumulated snowfall in the region of the Antarctic desert between 0° and 150° E is strongly affected by this source of error, as can be seen in Figs. 3 and 5. Other regions such as central Greenland and western China are affected as well. However, globally, or when looking at the snowfall zonal behaviour depicted in Fig. 6 or at points clustered based on similar snowfall values, as outlined in Fig. 4, this effect appears to be negligible.
3.1.3 Impact of uncertainties in the Ze–S relationship
Snowfall retrievals, especially those based on a single frequency, are limited by various uncertainties such as the characterization of the snowflake size distribution and the modelling of the backscattering properties of the ice crystals (Hiley et al., 2011; Kneifel et al., 2020; Tridon et al., 2019). At large snowfall rates, non-Rayleigh effects at the 94 GHz band cause further problems in the estimation of the snowfall rate. Uncertainties associated with the retrieval of S from Ze are considered in this study, as described in Sect. 2, but it is important to note that the estimate of the Ze–S is assumed to be unbiased.
Figure 4 shows the contributions of the sampling error, the Ze–S uncertainty, and the sensitivity to the total error. As the latter contribution is negligible, the difference between the sampling error and the total error highlights the importance of the Ze–S uncertainties in the snowfall retrieval. For both WIVERN and CloudSat, the total NRMSE almost doubles compared to when considering only the effect of sampling at finer spatial scales, such as for the grid box size of 0.25° × 0.25°. Instead, when averaging the snowfall in larger areas, e.g. increasing the size of the grid boxes, the impact of the Ze–S is strongly mitigated, as expected from the assumption of the Ze–S estimate being unbiased. For WIVERN, thanks to the high number of collected samples, the contribution of the Ze–S uncertainty becomes negligible starting from a 1.0° × 1.0° spatial scale (not shown).
3.2 Errors in zonal snowfall: from annual to monthly scales
For global precipitation studies, zonal precipitation estimates are of particular interest for the observation of the Earth's climate, the detection of climate change, and the evaluation and constraint of historical and future climate simulations (Hagemann et al., 2006; Hegerl et al., 2015; Egli et al., 2022).
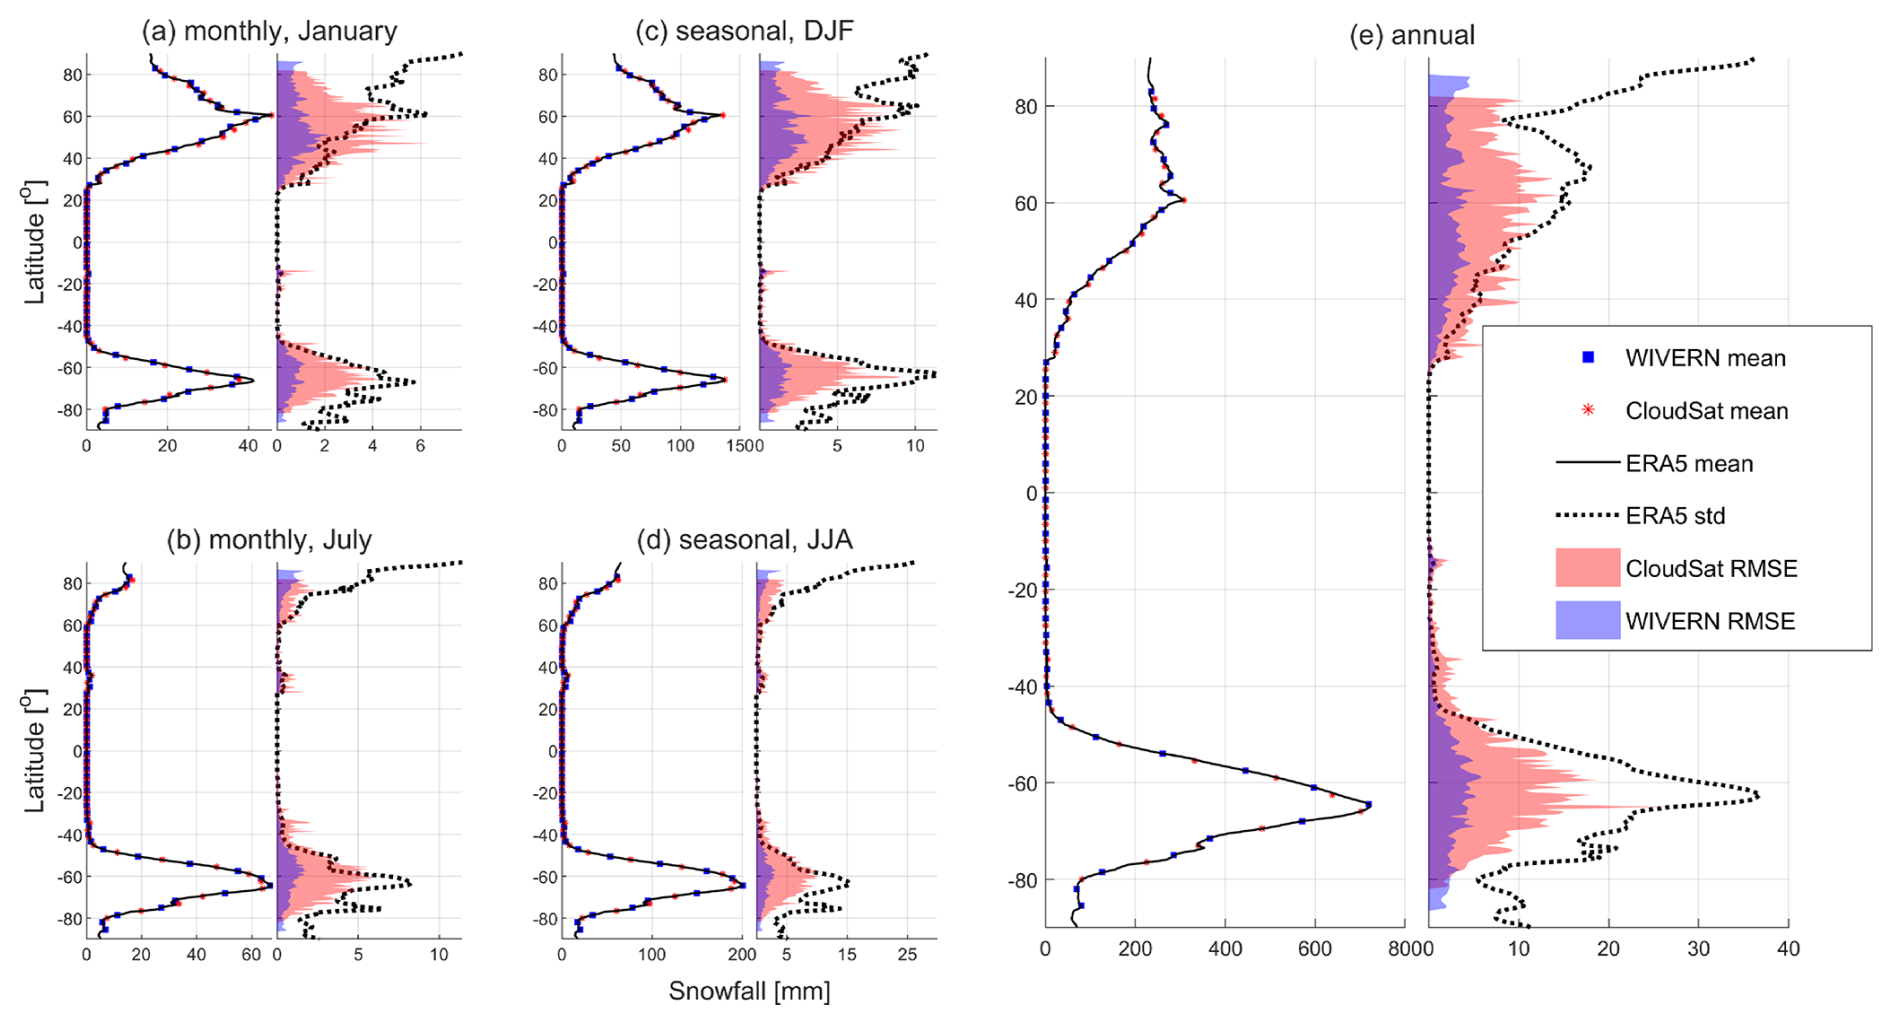
Figure 6The figure shows the zonal mean snowfall at the monthly (January in panel a and July in panel b), seasonal (DJF in panel c and JJA in panel d), and annual (in panel e) timescales. The ERA5, WIVERN, and CloudSat mean values are depicted with a solid black line, blue markers, and red markers, respectively. The inter-annual variability in the zonal mean (i.e. ERA5 standard deviation) is shown by the dashed black line. The shaded areas outline the RMSE of WIVERN and CloudSat.
The zonal mean snowfall, where the latitude resolution is 0.5°, is shown in Fig. 6. WIVERN and CloudSat can capture the zonal climatological mean of the reference at the monthly, seasonal, and annual timescales, with the second being a bit more noisy than the first. CloudSat RMSE is within the standard deviation of ERA5 only for annual means. At the monthly and seasonal scales, CloudSat exceeds the standard deviation of ERA5 in the Northern Hemisphere during the warm season between 60–65 and 25–40° N and during the cold season between 25–60° N and 25–60° S. CloudSat exceeds the inter-annual climatological variability only at latitudes between 25–45° N and 25–45° S. Instead, WIVERN RMSE remains within the climatological variability at the three timescales.
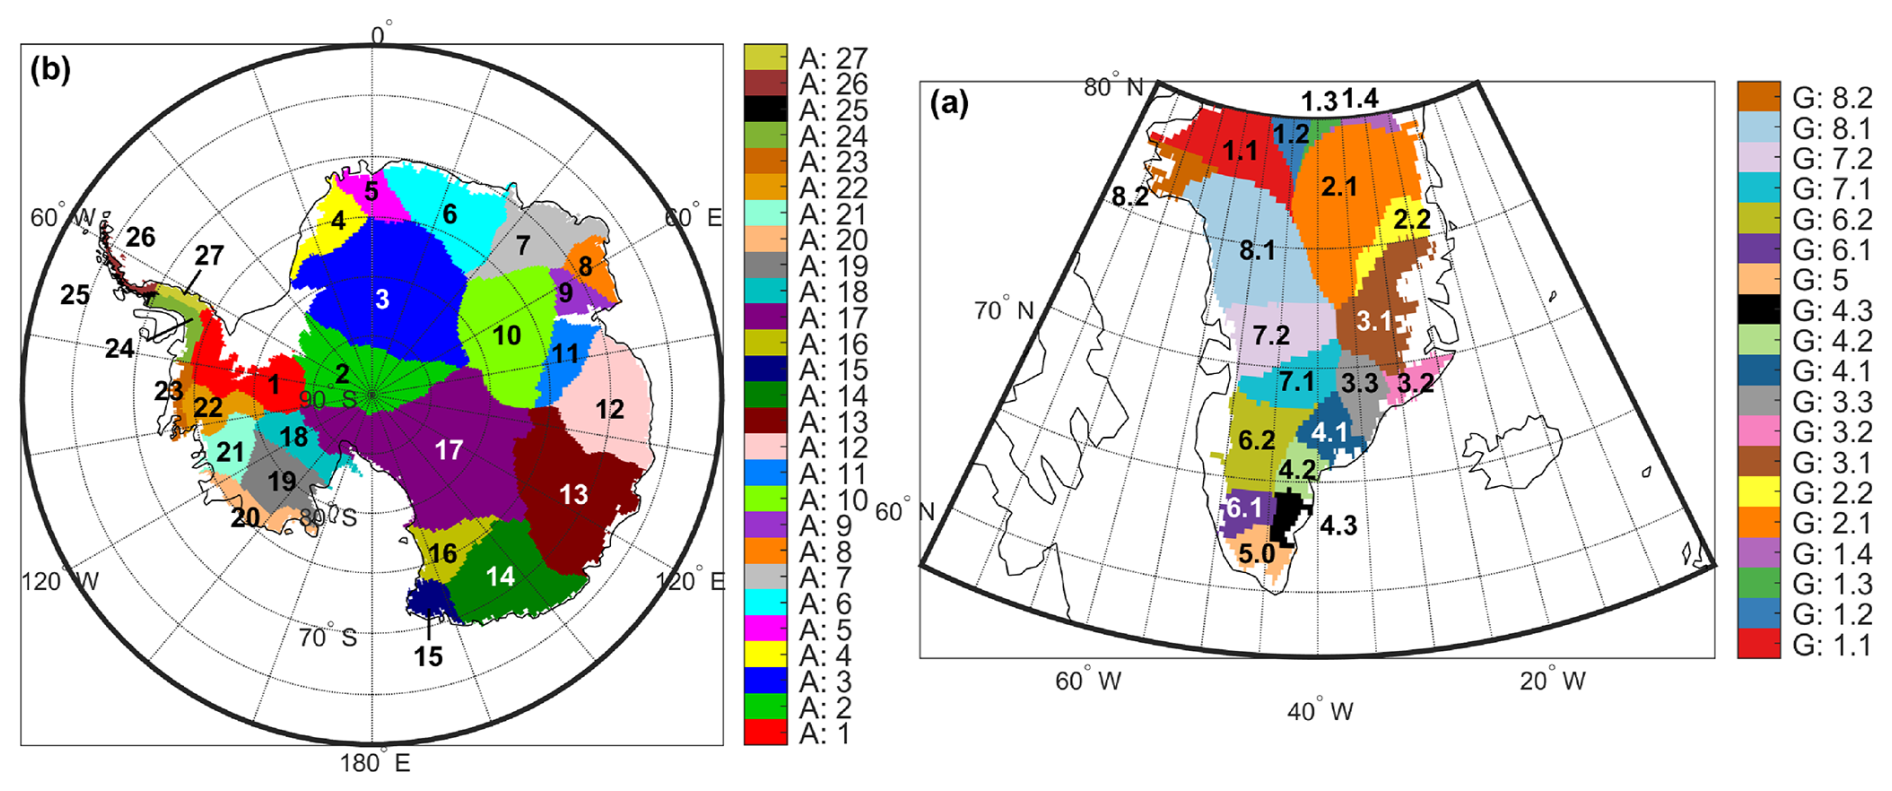
Figure 7Division of Greenland and Antarctica into sub-regions based on the basins, according to Zwally et al. (2012).
3.3 Regional estimation of accumulated snowfall
Estimation of snowfall in polar regions is of primary importance for quantifying the ice sheet mass balance and monitoring potential ice loss. Typically, estimates at annual and greater scales are useful to understand the ice sheet response to multi-year climate modes (e.g. El Niño), ice flow changes due to long-term melting or thickening, the impact of ice sheet melting on the sea level rise, and the inter-annual variability in the ice sheet mass balance. On the other hand, estimates at daily to seasonal timescales are useful to understand the seasonal variability, the grounding line migrations, and short-term oceanic or atmospheric forcing. Therefore, an analysis to quantify the regional effects of CloudSat and WIVERN sampling has been carried out in regions of Antarctica and Greenland defined by their drainage systems in Zwally et al. (2012). In Zwally et al. (2012), each basin is assigned an ID number, and the subdivision is shown in Fig. 7. Antarctic regions of particular interests are the following:
-
the Amundsen Sea sector, which consists of basins ranging from 20 to 22 and is characterized by the strongest ice mass loss on the continent, as described in Yang et al. (2023);
-
the Antarctic Peninsula, which consists of basins ranging from 24 to 27 and has experienced a rapid warming in recent years.
Such regions are also characterized by large snowfall accumulations.
For Greenland, when considering the loss of ice sheet mass, the conditions are less variable over the area (Mouginot et al., 2019), and the regions of interest correspond to the basins 3.3, 4.1, 4.2, 4.3, and 5.0, which are the ones affected by the highest snowfall precipitation (see Fig. 3).
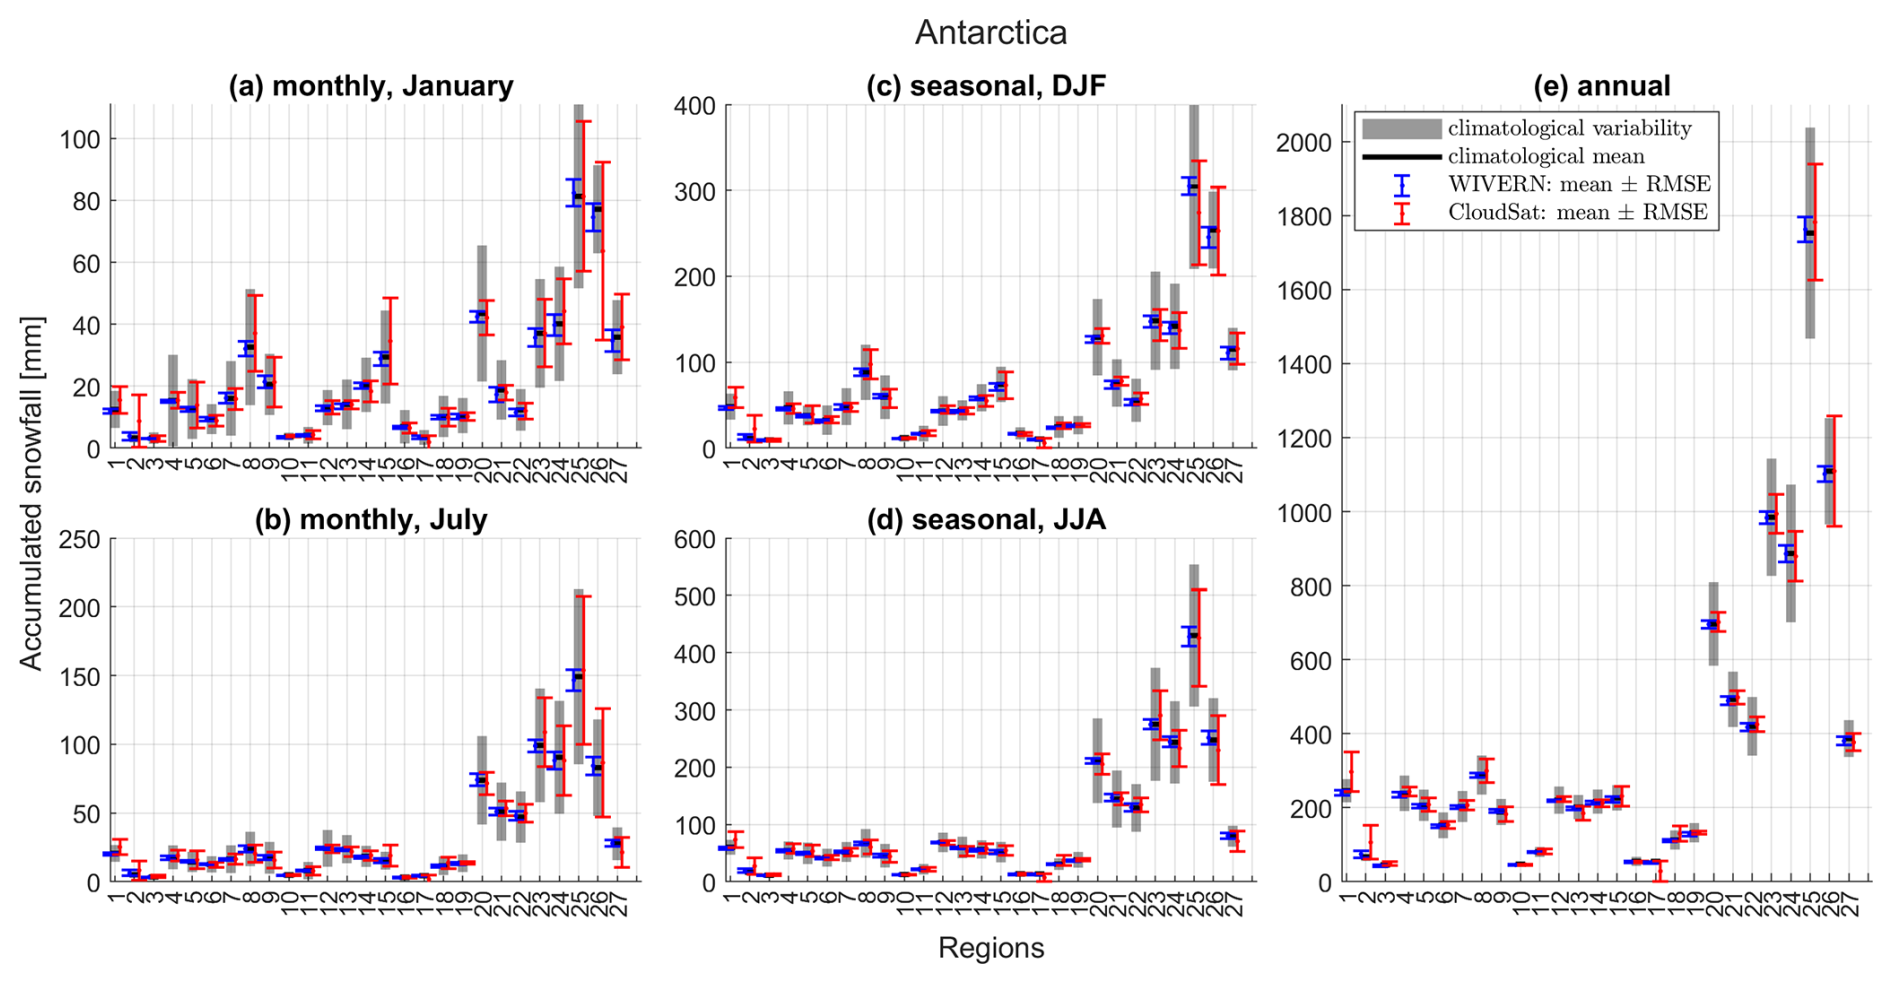
Figure 8For each of the Antarctic regions (x axis), the ERA5 mean snowfall accumulation (black line) and the climatological variability (shaded grey area) are shown. The mean accumulated snowfall ± RMSE sampled by WIVERN and CloudSat is shown with blue and red error bars, respectively. The result is shown for the monthly (a, b), seasonal (c, d), and annual (e) timescales. Results at the first two timescales are shown for January, July, DJF, and JJA to highlight the different behaviour between the two seasons.
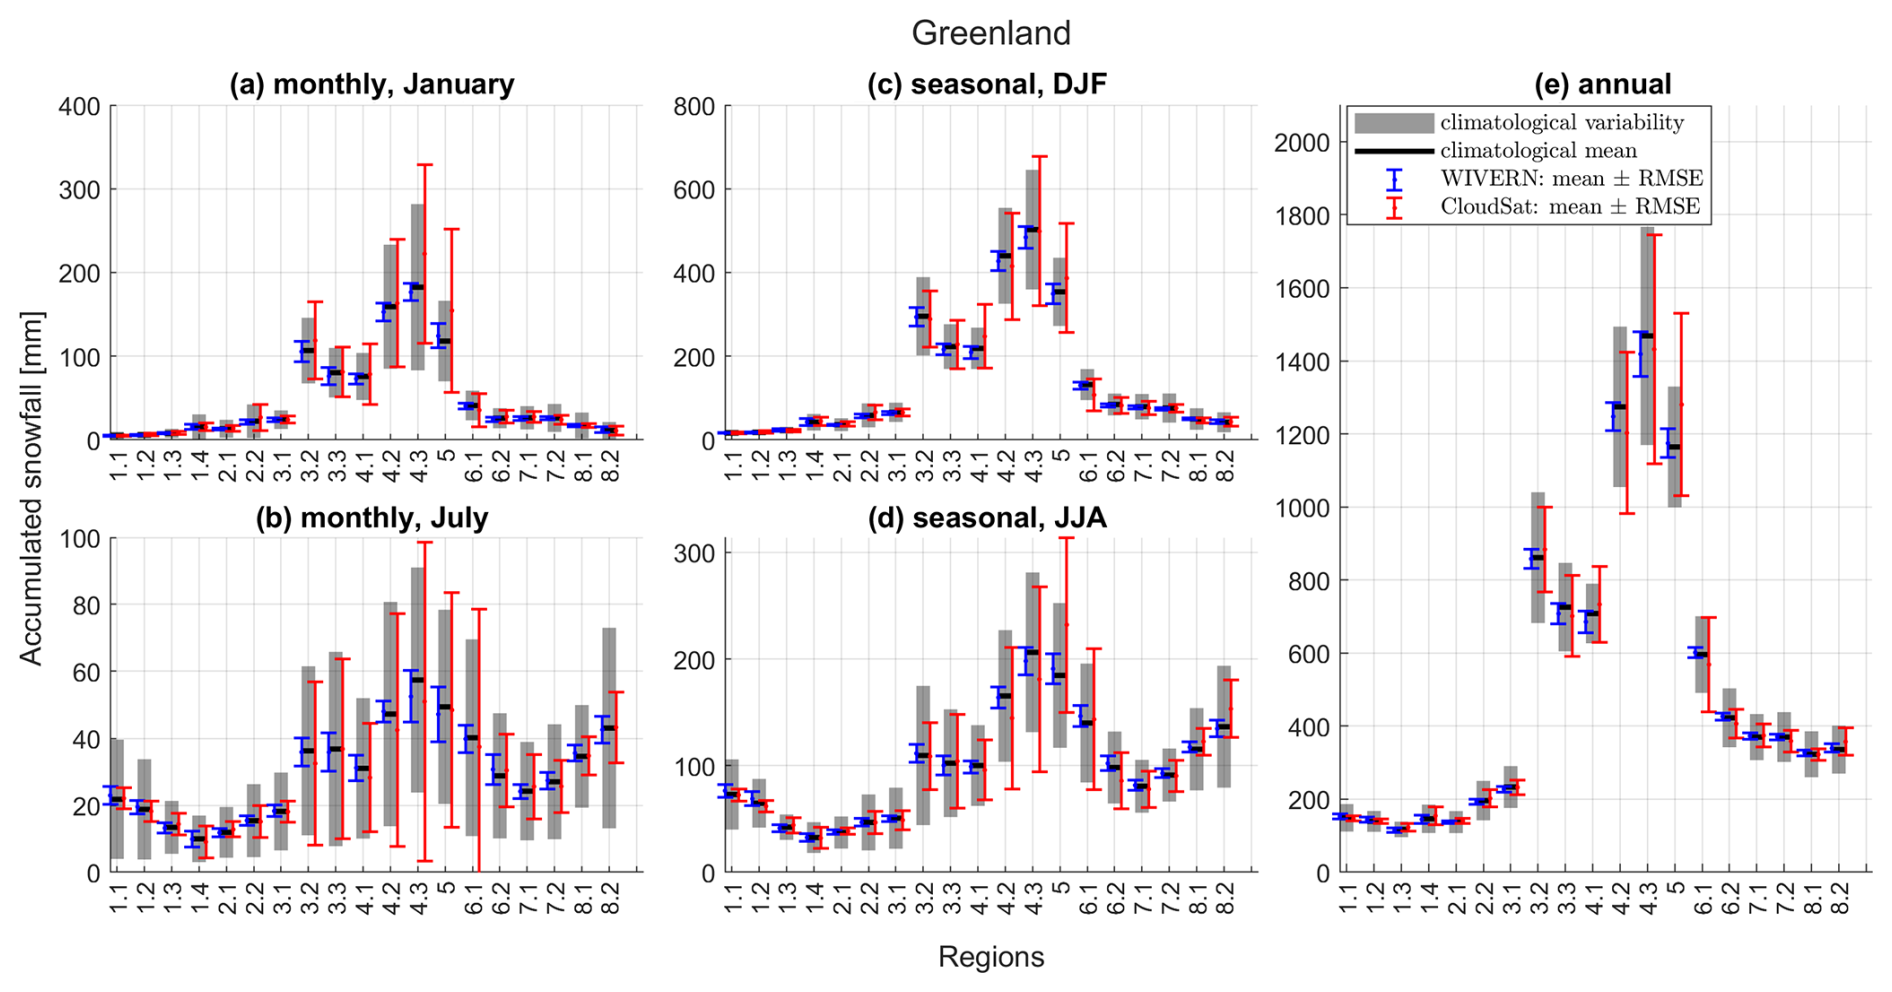
Figure 9For each of the Greenland regions (x axis), the ERA5 mean snowfall accumulation (black line) and the climatological variability (shaded grey area) are shown. The mean accumulated snowfall ± RMSE sampled by WIVERN and CloudSat is shown with blue and red error bars, respectively. The result is shown for the monthly (a, b), seasonal (c, d), and annual (e) timescales. Results at the first two timescales are shown for January, July, DJF, and JJA to highlight the different behaviour between the two seasons.
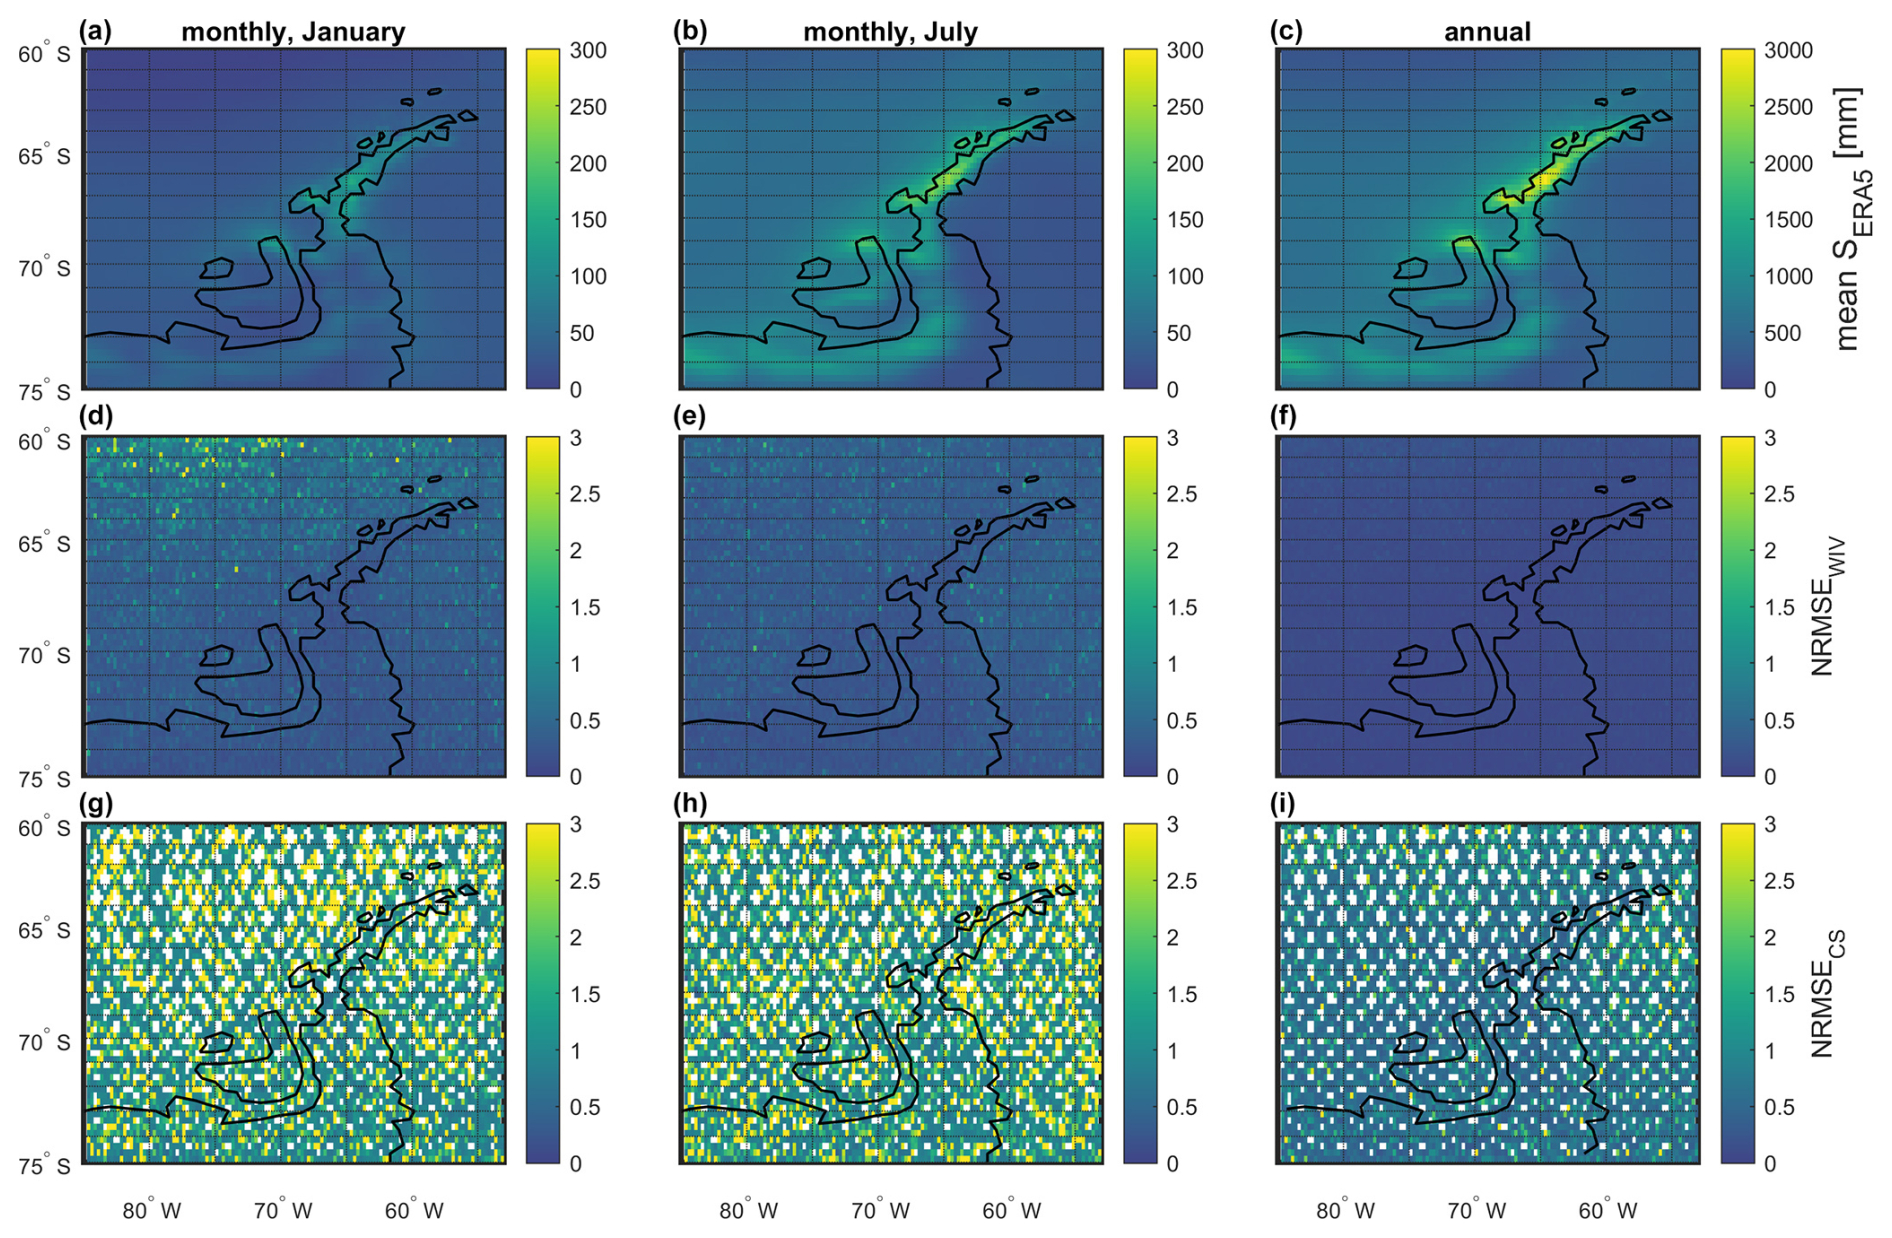
Figure 10Panels (a)–(c) show the mean monthly and annual snowfall on the Antarctic Peninsula according to ERA5 on a lat–long grid with box sizes of 0.25° × 0.25°. Panels (d)–(f) and (g)–(i) show the corresponding NRMSE of WIVERN and CloudSat, respectively.
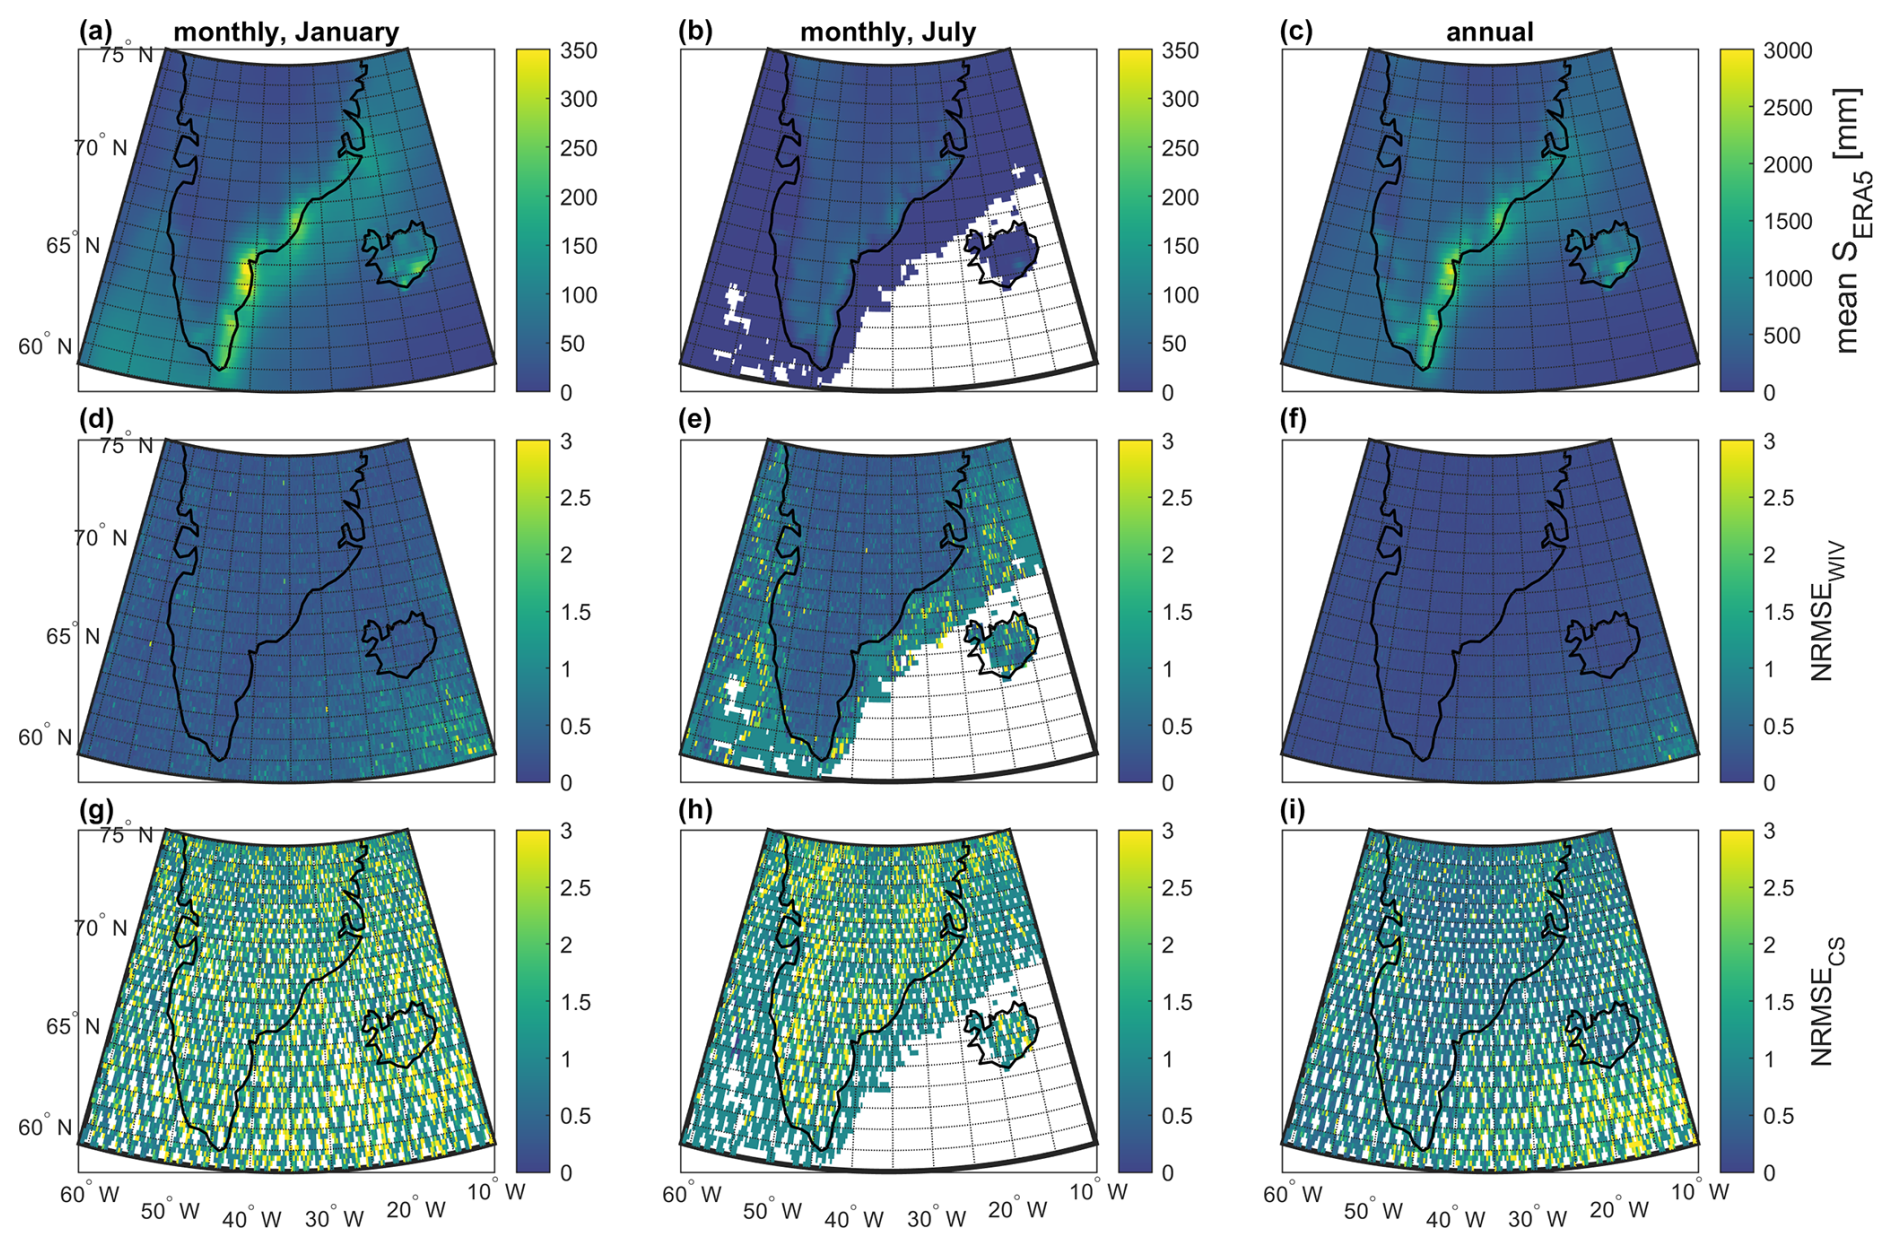
Figure 11Panels (a)–(c) show the mean monthly and annual snowfall on Greenland and Iceland according to ERA5 on a lat–long grid with box sizes of 0.25° × 0.25°. Panels (d)–(f) and (g)–(i) show the corresponding NRMSE of WIVERN and CloudSat, respectively. Note that, in July, the snowfall on the points above the ocean is very low and is characterized by very weak or very rare snowfall events, which cause the NRMSE to be ∼ 1 for WIVERN and CloudSat.
In order to provide useful measurements for estimating the total snowfall accumulation in a certain region, the RMSE must be significantly lower than the climatological variability in the region. As shown in Fig. 8, when trying to estimate the total snowfall in the regions of Antarctica, WIVERN can provide very useful benchmarks at all timescales, as their RMSE is low compared to the climatological variability in the regions, with the WIVERN's RMSE being systematically lower than the RMSE of CloudSat. Also, CloudSat's RMSE falls above the variability in regions 1, 2, 17, and 26 at seasonal and annual timescales and 1, 2, 17, 26, and 27 at monthly scales. Their estimates are thus both precise and accurate enough to provide useful insights for short- and long-term frequency effects on the ice sheets, with some exceptions for CloudSat.
In the regions of Greenland, as shown in Fig. 9, CloudSat's sampling results in a very large RMSE, strongly exceeding ERA5 variability in some regions: 3,3, 4.1, 4.2, 4.3, 5.0, and 6.1 at all timescales and 3.2, 3,3, 4.1, 4.2, 4.3, 5.0, and 6.1 at the monthly scale. Instead, WIVERN can tackle short frequency effects affecting all the regions.
Overall, WIVERN produces a significantly lower RMSE than CloudSat (lower by at least a factor of 2), indicating that WIVERN might provide more robust estimates of regional snowfall variability.
Biases in the mean snowfall are introduced by the sampling, indicating an overestimation or underestimation of the snowfall, and are larger in Greenland than in Antarctica. Overall, WIVERN produces smaller biases than CloudSat, with some exceptions (e.g. region G:4.3 at the annual scale) related to the sensitivity. The number of samples collected by both satellites is higher in Antarctica than in Greenland (see Fig. 2), causing the RMSE and the bias to be larger in the latter.
WIVERN better captures the local variability within each region; e.g. the snowfall hotspots in the Antarctica Peninsula and along the south-eastern coast of Greenland are captured by WIVERN at the monthly to seasonal timescale, but not by CloudSat, as shown in Figs. 10 and 11 for the Antarctic Peninsula and Greenland, respectively.
For spaceborne radar observations, precipitation at the surface may be biased by ground clutter, with some very shallow events completely missed. Given the strong reduction in the normalized surface backscatter cross-section over the ocean at oblique angles of incidence (Battaglia et al., 2017; Wolde et al., 2019), WIVERN is expected to reduce the blind layer over ocean surfaces compared to nadir-looking radars (Meneghini and Kozu, 1990; Coppola et al., 2025). For sea ice and land surfaces, the importance of the clutter increases. The ERA5 vertically resolved snow water content profiles (Hersbach et al., 2023b) can be used in synergy with the CloudSat and WIVERN ground clutter height retrieved in Coppola et al. (2025) to determine the impact of the clutter on snowfall estimates. The ground clutter height, defined as the height of the SCR (signal-to-clutter ratio) equal to 5 dB, depends on the surface type and the hydrometeor effective reflectivity at the surface, . Therefore, this analysis is conducted for three different types of surfaces where snowfall is likely to occur, i.e. ice-free ocean, sea ice, and land assuming, the attenuation caused by snowfall precipitation is negligible. WIVERN ground clutter height is lower over ice-free ocean and higher over land and sea ice than the clutter height of CloudSat (Coppola et al., 2025). Over land and sea ice, σ0 at the WIVERN incidence angle is assumed to be 5 dB lower than the one measured at nadir for CloudSat.
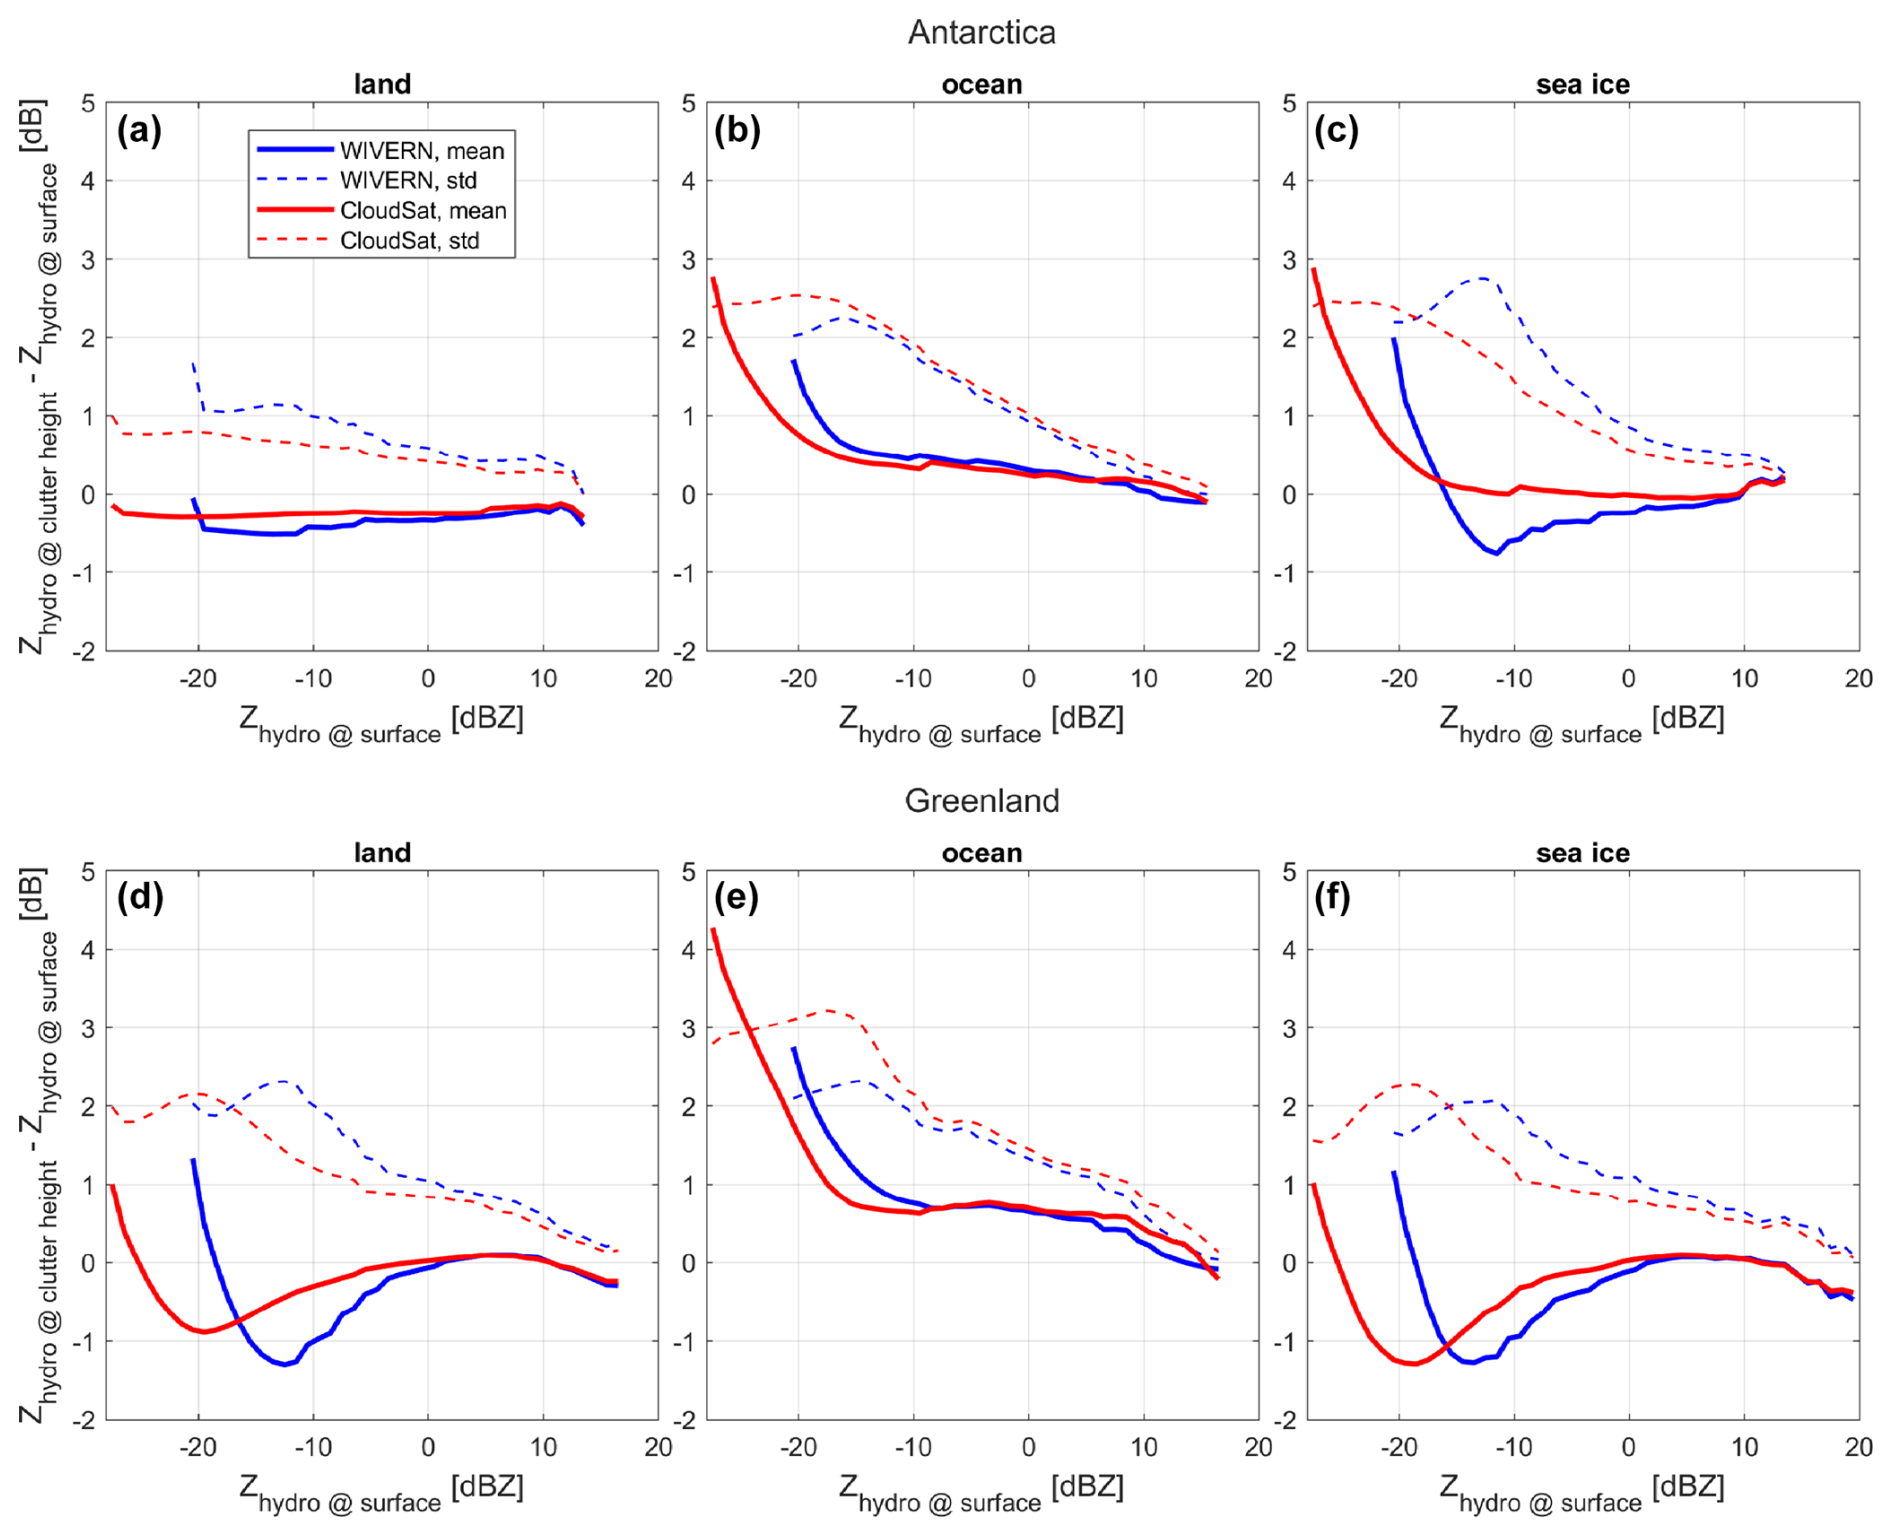
Figure 12Mean (solid lines) and standard deviation (dashed lines) values of as a function of for WIVERN (blue) and CloudSat (red) for two different regions (a–c: Antarctica; d–f: Greenland) and three different surface types (a, d: land; b, e: ice-free ocean; c, f: sea ice).
The following procedure is implemented for each of the types of surfaces of interest:
-
Radar reflectivity profiles are computed from the snow water content (SWC) profiles given by ERA5 using the reflectivity–ice water content (Z–IWC) relationship for the 94 GHz in Liu and Illingworth (2000).
-
The ERA5 sea ice edge product (Aaboe et al., 2023) has been used to determine if a given profile is located over land, sea ice, or ice-free ocean.
-
For each snow Z profile, the ground clutter height (of WIVERN and CloudSat) is retrieved based on the reflectivity at the surface, , as the median value of the histogram of the ground clutter height for that given shown in Coppola et al. (2025).
-
Z at the ground clutter height, , is then retrieved, and statistics on the histogram are computed.
The mean and standard deviation of are shown in Fig. 12. The variability in is very small for both WIVERN and CloudSat, with WIVERN showing slightly better standard deviation results than CloudSat over ice-free oceans, while the opposite occurs over land and sea ice. CloudSat exhibits slightly lower biases compared to WIVERN, including ice-free ocean regions, despite WIVERN’s ability to observe closer to the surface. This could be attributed to compensating effects of sublimation and shallow precipitation, which cancel out at 1200 m better than at 600 m (see also Maahn et al., 2014).
This analysis has some limitations: the resolution of the ERA5 data is 0.25° in latitude and longitude and may be too coarse to capture the vertical variability in the snow profiles. Also, the vertical resolution near the surface is only ∼190 m. Together with known problems of ERA5 to represent the atmospheric boundary layer (Sinclair et al., 2022), this could limit the validity of this analysis. To our knowledge, however, there is no alternative data product available that can characterize the vertical profile of cloud properties reliably all the way to the surface.
Spaceborne cloud radars are essential tools for observing snowfall globally (Stephens et al., 2018; Battaglia et al., 2020). Snowfall measurements are relevant for providing estimates of the snowfall accumulation and thus for a wide range of applications: from regional water cycle budgets to quantification of the mass balance changes in the ice sheet, the ice shelves, and the glaciers. However, the reliability of such products can be severely compromised by the intermittent and sparse sampling of snowfall carried out by the radar, with the number of samples collected in a given region in a given a time frame depending on the satellite orbit and on the radar scan geometry. For example, the WIVERN conically scanning radar (currently in Phase A of ESA's Earth Explorer programme) collects an order of magnitude more samples than a CloudSat- or EarthCARE-like fixed near-nadir radar, which also has gaps in coverage due to the narrow swath.
In this paper, the ERA5 hourly snowfall dataset has is used as a reference to simulate 20 years of snowfall accumulation, as would have been sampled by a 94 GHz radar with WIVERN and CloudSat sampling geometry. Such accumulations are compared with the reference to assess the spatial and temporal scales at which these sensors become useful tools for estimating seasonal and/or regional accumulated snowfall. The error introduced by the two radars can be decomposed into the sampling error directly related to the intermittent sampling of the phenomenon, the error due to the uncertainty in the Ze–S relationship (assumed to be unbiased), and the error introduced by the minimum detectability threshold of the radar. Each contribution to the error has also been analysed separately. To provide useful measurements, the error should be lower than the climatological variability, which is set to be the threshold of acceptable errors. The results show the following.
-
For WIVERN and CloudSat, the sampling error is the main cause of uncertainty. It decreases as the temporal and spatial scale increase, with the error in WIVERN always being at least twice as small as the error in CloudSat (Fig. 4).
-
The radar sensitivity error is higher for WIVERN than for CloudSat (−21 vs. −28 dBZ), but the error is generally negligible, except for WIVERN in the regions where the snowfall rates are very low and snowfall events occur very frequently in time (e.g. in the centre of Antarctica; Fig. 5). As it is only relevant with respect to marginal snowy areas, its effect is globally insignificant for snowfall accumulation.
-
The error due to the Ze–S uncertainty is strongly mitigated when averaging spatially and temporally, as expected from the assumption of it being unbiased. For WIVERN, the large number of samples collected makes the error negligible starting from the 1.0° × 1.0° spatial scale, with excellent results already at the monthly scale.
Overall, total errors produced by WIVERN are below the ERA5 climatological variability at the 0.5° × 0.5° spatial scale already at the monthly scale. Conversely, CloudSat needs to be averaged at annual zonal scales to produce reliable estimates (Fig. 4).
-
In the context of assessing total accumulation in various regions of Antarctica and Greenland (Figs. 8 and 9), WIVERN can provide reliable estimates already at the monthly scale. Instead, CloudSat offers less precise estimates, with RMSE exceeding the variability in some of the regions. Furthermore, when examining the local variability within these regions, CloudSat estimates are highly imprecise (Figs. 10 and 11).
-
Based on ERA5 reanalysis profiles, the surface blind zone generates a small bias in the reflectivity lower than 2 dB for dBZ (i.e. for snowfall that is important for mass accumulation) (Fig. 12). CloudSat has slightly lower biases than WIVERN over land, sea ice, and ice-free ocean surfaces. The standard deviation is also lower, except over ocean.
In conclusion, CloudSat is suitable for estimating snowfall accumulation over large areas and longer timescales (e.g. annual zonal), but its poor sampling capabilities limit the possibility of deriving annual or monthly precipitation over domains smaller than zonal scales. The recently launched EarthCARE radar will face very similar sampling issues. On the other hand, a conically scanning wide-swath radar, such as the one proposed by the WIVERN team, could represent a unique observing system due to its improved sampling capabilities, contributing to the snowfall accumulation estimates over domains smaller than 0.5° × 0.5° already at the monthly timescale.
Finally, the WIVERN radar will have a low noise-equivalent delta temperature radiometer mode and will provide (noisy) estimates of polarimetric variables such as differential reflectivity and differential phase shifts (Battaglia et al., 2025). This could further improve the estimation of snowfall rates, e.g. by identifying the presence of rimed snow and supercooled droplets (Maherndl et al., 2025).
The code is available on request.
The data are available at https://doi.org/10.24381/cds.adbb2d47 (Hersbach et al., 2023a) and at https://doi.org/10.24381/cds.bd0915c6 (Hersbach et al., 2023b).
FES carried out most of the analysis and wrote the text. AB and MM defined the project, wrote parts of the text, and reviewed the work. SL reviewed the work.
At least one of the (co-)authors is a member of the editorial board of The Cryosphere. The peer-review process was guided by an independent editor, and the authors also have no other competing interests to declare.
Analysis was carried out using Copernicus Climate Change Service information 2024. Neither the European Commission nor the ECMWF is responsible for any use that may be made of the Copernicus information or data it contains.
Publisher's note: Copernicus Publications remains neutral with regard to jurisdictional claims made in the text, published maps, institutional affiliations, or any other geographical representation in this paper. While Copernicus Publications makes every effort to include appropriate place names, the final responsibility lies with the authors.
This work was supported in part by the European Space Agency under the activity WInd VElocity Radar Nephoscope (WIVERN) Phase A Science and Requirements Consolidation Study, ESA contract number 4000144120/24/NL/IB/ab. Filippo Emilio Scarsi's work was conducted during and with the support of the Italian national inter-university PhD course in sustainable development and climate change (http://www.phd-sdc.it, last access: 15 May 2024). Maximilian Maahn was supported by the German Research Foundation (DFG, Deutsche Forschungsgemeinschaft) Transregional Collaborative Research Center SFB/TRR 172 (project ID 268020496). This research used the Mafalda cluster at Politecnico di Torino.
This research has been supported by the European Space Agency (grant no. 4000144120/24/NL/IB/ab) and by German Research Foundation (DFG, Deutsche Forschungsgemeinschaft) Transregional Collaborative Research Center SFB/TRR 172 (grant no. 268020496).
This paper was edited by Carrie Vuyovich and reviewed by three anonymous referees.
Aaboe, S., Down, E., Sørensen, A., Lavergne, T., and Eastwood, S.: Sea-ice type climate data record 1978-present, v3.0. Copernicus Climate Change Service (C3S) Climate Data Store (CDS) [data set], https://doi.org/10.24381/cds.29c46d83 (last access: 12 April 2025), 2023. a
Alexander, S. P., Protat, A., Berne, A., and Ackermann, L.: Radar-Derived Snowfall Microphysical Properties at Davis, Antarctica, J. Geophys. Res.-Atmos., 128, e2022JD038389, https://doi.org/10.1029/2022JD038389, 2023. a
Battaglia, A. and Panegrossi, G.: What Can We Learn from the CloudSat Radiometric Mode Observations of Snowfall over the Ice-Free Ocean?, Radio Sci., 12, 3285, https://doi.org/10.3390/rs12203285, 2020. a, b
Battaglia, A., Wolde, M., D'Adderio, L. P., Nguyen, C., Fois, F., Illingworth, A., and Midthassel, R.: Characterization of Surface Radar Cross Sections at W-Band at Moderate Incidence Angles, IEEE T. Geosci. Remote, 55, 3846–3859, 10.1109/TGRS.2017.2682423, 2017. a
Battaglia, A., Dhillon, R., and Illingworth, A.: Doppler W-band polarization diversity space-borne radar simulator for wind studies, Atmos. Meas. Tech., 11, 5965–5979, https://doi.org/10.5194/amt-11-5965-2018, 2018. a
Battaglia, A., Kollias, P., Dhillon, R., Roy, R., Tanelli, S., Lamer, K., Grecu, M., Lebsock, M., Watters, D., Mroz, K., Heymsfield, G., Li, L., and Furukawa, K.: Spaceborne Cloud and Precipitation Radars: Status, Challenges, and Ways Forward, Rev. Geophys., 58, e2019RG000686, https://doi.org/10.1029/2019RG000686, 2020. a
Battaglia, A., Martire, P., Caubet, E., Phalippou, L., Stesina, F., Kollias, P., and Illingworth, A.: Observation error analysis for the WInd VElocity Radar Nephoscope W-band Doppler conically scanning spaceborne radar via end-to-end simulations, Atmos. Meas. Tech., 15, 3011–3030, https://doi.org/10.5194/amt-15-3011-2022, 2022. a, b
Battaglia, A., Rizik, A., Sikaneta, I., and Tridon, F.: I and Qs Simulation and Processing Envisaged for Spaceborne Polarization Diversity Doppler Radars, IEEE T. Geosci. Remote, 63, 1–14, https://doi.org/10.1109/TGRS.2025.3529672, 2025. a
Bennartz, R., Fell, F., Pettersen, C., Shupe, M. D., and Schuettemeyer, D.: Spatial and temporal variability of snowfall over Greenland from CloudSat observations, Atmos. Chem. Phys., 19, 8101–8121, https://doi.org/10.5194/acp-19-8101-2019, 2019. a
Boening, C., Lebsock, M., Landerer, F., and Stephens, G.: Snowfall-driven mass change on the East Antarctic ice sheet, Geophys. Res. Lett., 39, https://doi.org/10.1029/2012GL053316, 2012. a
Cao, Q., Hong, Y., Chen, S., Gourley, J., Zhang, J., and Kirstetter, P.-E.: Snowfall Detectability of NASA's CloudSat: The First Cross-Investigation of Its 2C-Snow-Profile Product and National Multi-Sensor Mosaic QPE (NMQ) Snowfall Data, Progress In Electromagnetics Research, 148, 55–61, https://doi.org/10.2528/PIER14030405, 2014. a
Chen, F. and Staelin, D.: AIRS/AMSU/HSB precipitation estimates, IEEE T. Geosci. Remote, 41, 410–417, https://doi.org/10.1109/TGRS.2002.808322, 2003. a
Coppola, M., Battaglia, A., Tridon, F., and Kollias, P.: Improved hydrometeor detection near the Earth’s surface by a conically scanning spaceborne W-band radar, EGUsphere [preprint], https://doi.org/10.5194/egusphere-2025-416, 2025. a, b, c, d, e, f
Egli, M., Sippel, S., Pendergrass, A. G., de Vries, I., and Knutti, R.: Reconstruction of Zonal Precipitation From Sparse Historical Observations Using Climate Model Information and Statistical Learning, Geophys. Res. Lett., 49, e2022GL099826, https://doi.org/10.1029/2022GL099826, 2022. a
Report for Mission Selection: Earth Explorer 11 Candidate Mission WIVERN, European Space Agency, Noordwijk, The Netherlands, ESA-EOPSM-WIVE-RP-4798, 234 pp., https://esamultimedia.esa.int/docs/EarthObservation/ESA_EE11_Report_for_Selection_WIVERN_v1.0.pdf (last access: 15 August 2025), 2025. a
Field, P. R. and Heymsfield, A. J.: Importance of snow to global precipitation, Geophys. Res. Lett., 42, 9512–9520, https://doi.org/10.1002/2015GL065497, 2015. a
Griesche, H. J., Ohneiser, K., Seifert, P., Radenz, M., Engelmann, R., and Ansmann, A.: Contrasting ice formation in Arctic clouds: surface-coupled vs. surface-decoupled clouds, Atmos. Chem. Phys., 21, 10357–10374, https://doi.org/10.5194/acp-21-10357-2021, 2021. a
Hagemann, S., Arpe, K., and Roeckner, E.: Evaluation of the Hydrological Cycle in the ECHAM5 Model, J. Climate, 19, 3810–3827, https://doi.org/10.1175/JCLI3831.1, 2006. a
Hall, A.: The Role of Surface Albedo Feedback in Climate, J. Climate, 17, 1550–1568, https://doi.org/10.1175/1520-0442(2004)017<1550:TROSAF>2.0.CO;2, 2004. a
Hegerl, G. C., Black, E., Allan, R. P., Ingram, W. J., Polson, D., Trenberth, K. E., Chadwick, R. S., Arkin, P. A., Sarojini, B. B., Becker, A., Dai, A., Durack, P. J., Easterling, D., Fowler, H. J., Kendon, E. J., Huffman, G. J., Liu, C., Marsh, R., New, M., Osborn, T. J., Skliris, N., Stott, P. A., Vidale, P.-L., Wijffels, S. E., Wilcox, L. J., Willett, K. M., and Zhang, X.: Challenges in Quantifying Changes in the Global Water Cycle, B. Am. Meteorol. Soc., 96, 1097–1115, https://doi.org/10.1175/BAMS-D-13-00212.1, 2015. a
Hersbach, H., Bell, B., Berrisford, P., Biavati, G., Horányi, A., Muñoz Sabater, J., Nicolas, J., Peubey, C., Radu, R., Rozum, I., Schepers, D., Simmons, A., Soci, C., Dee, D., and Thépaut, J.-N.: ERA5 hourly data on single levels from 1940 to present, Copernicus Climate Change Service (C3S) Climate Data Store (CDS) [data set], https://doi.org/10.24381/cds.adbb2d47, 2023a. a, b
Hersbach, H., Bell, B., Berrisford, P., Biavati, G., Horányi, A., Muñoz Sabater, J., Nicolas, J., Peubey, C., Radu, R., Rozum, I., Schepers, D., Simmons, A., Soci, C., Dee, D., and Thépaut, J.-N.: ERA5 hourly data on pressure levels from 1940 to present, Copernicus Climate Change Service (C3S) Climate Data Store (CDS) [data set], https://doi.org/10.24381/cds.bd0915c6, 2023b. a, b
Hiley, M. J., Kulie, M. S., and Bennartz, R.: Uncertainty Analysis for CloudSat Snowfall Retrievals, J. Appl. Meteorol. Climatol., 50, 399–418, https://doi.org/10.1175/2010JAMC2505.1, 2011. a, b, c, d
Illingworth, A. J., Battaglia, A., Bradford, J., Forsythe, M., Joe, P., Kollias, P., Lean, K., Lori, M., Mahfouf, J.-F., Melo, S., Midthassel, R., Munro, Y., Nicol, J., Potthast, R., Rennie, M., Stein, T. H. M., Tanelli, S., Tridon, F., Walden, C. J., and Wolde, M.: WIVERN: A New Satellite Concept to Provide Global In-Cloud Winds, Precipitation, and Cloud Properties, B. Am. Meteorol. Soc., 99, 1669–1687, https://doi.org/10.1175/BAMS-D-16-0047.1, 2018. a
Kidd, C., Becker, A., Huffman, G. J., Muller, C. L., Joe, P., Skofronick-Jackson, G., and Kirschbaum, D. B.: So, How Much of the Earth’s Surface Is Covered by Rain Gauges?, B. Am. Meteorol. Soc., 98, 69–78, https://doi.org/10.1175/BAMS-D-14-00283.1, 2017. a
Kneifel, S., Leinonen, J., Tyynela, J., Ori, D., and Battaglia, A.: Satellite precipitation measurement, vol. 1 of Adv.Global Change Res., chap. Scattering of Hydrometeors, Springer, ISBN 978-3-030-24567-2, 2020. a
Kouki, K., Luojus, K., and Riihelä, A.: Evaluation of snow cover properties in ERA5 and ERA5-Land with several satellite-based datasets in the Northern Hemisphere in spring 1982–2018, The Cryosphere, 17, 5007–5026, https://doi.org/10.5194/tc-17-5007-2023, 2023. a
Kulie, M. S. and Milani, L.: Seasonal variability of shallow cumuliform snowfall: A CloudSat perspective, Q. J. Roy. Meteor. Soc., 144, 329–343, https://doi.org/10.1002/qj.3222, 2018. a
Kulie, M. S., Milani, L., Wood, N. B., and L'Ecuyer, T. S.: Global Snowfall Detection and Measurement, pp. 699–716, Springer International Publishing, Cham, ISBN 978-3-030-35798-6, https://doi.org/10.1007/978-3-030-35798-6_12, 2020. a, b
Li, H., Möhler, O., Petäjä, T., and Moisseev, D.: Two-year statistics of columnar-ice production in stratiform clouds over Hyytiälä, Finland: environmental conditions and the relevance to secondary ice production, Atmos. Chem. Phys., 21, 14671–14686, https://doi.org/10.5194/acp-21-14671-2021, 2021. a
Liu, C.-L. and Illingworth, A. J.: Toward More Accurate Retrievals of Ice Water Content from Radar Measurements of Clouds, J. Appl. Meteorol., 39, 1130–1146, https://doi.org/10.1175/1520-0450(2000)039<1130:TMAROI>2.0.CO;2, 2000. a
Liu, G.: Deriving snow cloud characteristics from CloudSat observations, J. Geophys. Res.-Atmos., 113, https://doi.org/10.1029/2007JD009766, 2008. a
Lopez-Cantu, T., Prein, A. F., and Samaras, C.: Uncertainties in Future U.S. Extreme Precipitation From Downscaled Climate Projections, Geophys. Res. Lett., 47, e2019GL086797, https://doi.org/10.1029/2019GL086797, 2020. a
Maahn, M., Burgard, C., Crewell, S., Gorodetskaya, I. V., Kneifel, S., Lhermitte, S., Van Tricht, K., and van Lipzig, N. P. M.: How does the spaceborne radar blind zone affect derived surface snowfall statistics in polar regions?, J. Geophys. Res.-Atmos., 119, 13604–13620, https://doi.org/10.1002/2014JD022079, 2014. a, b, c
Maherndl, N., Battaglia, A., Kötsche, A., and Maahn, M.: Riming-dependent snowfall rate and ice water content retrievals for W-band cloud radar, Atmos. Meas. Tech., 18, 3287–3304, https://doi.org/10.5194/amt-18-3287-2025, 2025. a
Matrosov, S., Shupe, M., and Djalalova, I.: Snowfall Retrievals Using Millimeter-Wavelength Cloud Radars, J. Appl. Meteorol. Climatol., 47, 769–777, https://doi.org/10.1175/2007JAMC1768.1, 2008. a
Matrosov, S. Y., Shupe, M. D., and Uttal, T.: High temporal resolution estimates of Arctic snowfall rates emphasizing gauge and radar-based retrievals from the MOSAiC expedition, Elementa: Science of the Anthropocene, 10, 00101, https://doi.org/10.1525/elementa.2021.00101, 2022. a
Meneghini, R. and Kozu, T.: Spaceborne weather radar, Artech House, ISBN 978-0890063828, 1990. a
Milani, L. and Kidd, C.: The State of Precipitation Measurements at Mid-to-High Latitudes, Atmosphere, 14, https://doi.org/10.3390/atmos14111677, 2023. a
Milani, L. and Wood, N. B.: Biases in CloudSat Falling Snow Estimates Resulting from Daylight-Only Operations, Remote Sens., 13, 1677, https://doi.org/10.3390/rs13112041, 2021. a
Milani, L., Kulie, M. S., Casella, D., Dietrich, S., L’Ecuyer, T. S., Panegrossi, G., Porcù, F., Sanò, P., and Wood, N. B.: CloudSat snowfall estimates over Antarctica and the Southern Ocean: An assessment of independent retrieval methodologies and multi-year snowfall analysis, Atmos. Res., 213, 121–135, https://doi.org/10.1016/j.atmosres.2018.05.015, 2018. a
Morrison, H., de Boer, G., Feingold, G., Harrington, J., Shupe, M. D., and Sulia, K.: Resilience of persistent Arctic mixed-phase clouds, Nature Geoscience, 5, 11–17, https://doi.org/10.1038/ngeo1332, 2012. a
Morrison, H., van Lier-Walqui, M., Fridlind, A. M., Grabowski, W. W., Harrington, J. Y., Hoose, C., Korolev, A., Kumjian, M. R., Milbrandt, J. A., Pawlowska, H., Posselt, D. J., Prat, O. P., Reimel, K. J., Shima, S.-I., van Diedenhoven, B., and Xue, L.: Confronting the Challenge of Modeling Cloud and Precipitation Microphysics, J. Adv. Model. Earth Sy., 12, e2019MS001689, https://doi.org/10.1029/2019MS001689, 2020. a
Mouginot, J., Rignot, E., Bjørk, A. A., van den Broeke, M., Millan, R., Morlighem, M., Noël, B., Scheuchl, B., and Wood, M.: Forty-six years of Greenland Ice Sheet mass balance from 1972 to 2018, P. Natl. Acad. Sci. USA, 116, 9239–9244, https://doi.org/10.1073/pnas.1904242116, 2019. a
Mroz, K., Montopoli, M., Battaglia, A., Panegrossi, G., Kirstetter, P., and Baldini, L.: Cross Validation of Active and Passive Microwave Snowfall Products over the Continental United States, J. Hydrometeorol., 22, 1297–1315, https://doi.org/10.1175/JHM-D-20-0222.1, 2021. a
Mülmenstädt, J., Sourdeval, O., Delanoë, J., and Quaas, J.: Frequency of occurrence of rain from liquid-, mixed-, and ice-phase clouds derived from A-Train satellite retrievals, Geophys. Res. Lett., 42, 6502–6509, https://doi.org/10.1002/2015GL064604, 2015. a
Palerme, C., Kay, J. E., Genthon, C., L'Ecuyer, T., Wood, N. B., and Claud, C.: How much snow falls on the Antarctic ice sheet?, The Cryosphere, 8, 1577–1587, https://doi.org/10.5194/tc-8-1577-2014, 2014. a
Palerme, C., Genthon, C., Claud, C., Kay, J. E., Wood, N. B., and L’Ecuyer, T.: Evaluation of current and projected Antarctic precipitation in CMIP5 models, Clim. Dynam., 48, 225–239, https://doi.org/10.1007/s00382-016-3071-1, 2017. a
Panegrossi, G., Casella, D., Sanò, P., Camplani, A., and Battaglia, A.: Chapter 12 – Recent advances and challenges in satellite-based snowfall detection and estimation, in: Precipitation Science, edited by: Michaelides, S., 333–376, Elsevier, ISBN 978-0-12-822973-6, https://doi.org/10.1016/B978-0-12-822973-6.00015-9, 2022. a
Perovich, D., Polashenski, C., Arntsen, A., and Stwertka, C.: Anatomy of a late spring snowfall on sea ice, Geophys. Res. Lett., 44, 2802–2809, https://doi.org/10.1002/2016GL071470, 2017. a
Quante, L., Willner, S. N., Middelanis, R., and Levermann, A.: Regions of intensification of extreme snowfall under future warming, Sci. Rep., 11, 16621, https://doi.org/10.1038/s41598-021-95979-4, 2021. a
Rizik, A., Battaglia, A., Tridon, F., Scarsi, F. E., Kötsche, A., Kalesse-Los, H., Maahn, M., and Illingworth, A.: Impact of Crosstalk on Reflectivity and Doppler Measurements for the WIVERN Polarization Diversity Doppler Radar, IEEE T. Geosci. Remote, 61, 1–14, https://doi.org/10.1109/TGRS.2023.3320287, 2023. a
Roberts, M. J., Vidale, P. L., Senior, C., Hewitt, H. T., Bates, C., Berthou, S., Chang, P., Christensen, H. M., Danilov, S., Demory, M.-E., Griffies, S. M., Haarsma, R., Jung, T., Martin, G., Minobe, S., Ringler, T., Satoh, M., Schiemann, R., Scoccimarro, E., Stephens, G., and Wehner, M. F.: The Benefits of Global High Resolution for Climate Simulation: Process Understanding and the Enabling of Stakeholder Decisions at the Regional Scale, B. Am. Meteorol. Soc., 99, 2341–2359, https://doi.org/10.1175/BAMS-D-15-00320.1, 2018. a
Schoger, S. Y., Moisseev, D., von Lerber, A., Crewell, S., and Ebell, K.: Snowfall-Rate Retrieval for K- and W-Band Radar Measurements Designed in Hyytiälä, Finland, and Tested at Ny-Ålesund, Svalbard, Norway, J. Appl. Meteorol. Climatol., 60, 273–289, https://doi.org/10.1175/JAMC-D-20-0095.1, 2021. a
Scipión, D. E., Mott, R., Lehning, M., Schneebeli, M., and Berne, A.: Seasonal small-scale spatial variability in alpine snowfall and snow accumulation, Water Resour. Res., 49, 1446–1457, https://doi.org/10.1002/wrcr.20135, 2013. a
Shates, J. A., Pettersen, C., L’Ecuyer, T. S., and Kulie, M. S.: KAZR-CloudSat Analysis of Snowing Profiles at the North Slope of Alaska: Implications of the Satellite Radar Blind Zone, J. Geophys. Res.-Atmos., 130, e2024JD042700, https://doi.org/10.1029/2024JD042700, 2025. a
Sinclair, V. A., Ritvanen, J., Urbancic, G., Erner, I., Batrak, Y., Moisseev, D., and Kurppa, M.: Boundary-layer height and surface stability at Hyytiälä, Finland, in ERA5 and observations, Atmos. Meas. Tech., 15, 3075–3103, https://doi.org/10.5194/amt-15-3075-2022, 2022. a
Skofronick-Jackson, G. and Johnson, B. T.: Surface and atmospheric contributions to passive microwave brightness temperatures for falling snow events, J. Geophys. Res.-Atmos., 116, https://doi.org/10.1029/2010JD014438, 2011. a
Skofronick-Jackson, G., Kim, M.-J., Weinman, J., and Chang, D.-E.: A physical model to determine snowfall over land by microwave radiometry, IEEE T. Geosci. Remote, 42, 1047–1058, https://doi.org/10.1109/TGRS.2004.825585, 2004. a
Slatyer, R. A., Umbers, K. D. L., and Arnold, P. A.: Ecological responses to variation in seasonal snow cover, Conservation Biology, 36, e13727, https://doi.org/10.1111/cobi.13727, 2022. a
Smalley, M., L'Ecuyer, T., Lebsock, M., and Haynes, J.: A Comparison of Precipitation Occurrence from the NCEP Stage IV QPE Product and the CloudSat Cloud Profiling Radar, J. Hydrometeorol., 15, 444–458, https://doi.org/10.1175/JHM-D-13-048.1, 2014. a
Souverijns, N., Gossart, A., Gorodetskaya, I. V., Lhermitte, S., Mangold, A., Laffineur, Q., Delcloo, A., and van Lipzig, N. P. M.: How does the ice sheet surface mass balance relate to snowfall? Insights from a ground-based precipitation radar in East Antarctica, The Cryosphere, 12, 1987–2003, https://doi.org/10.5194/tc-12-1987-2018, 2018a. a
Souverijns, N., Gossart, A., Lhermitte, S., Gorodetskaya, I. V., Grazioli, J., Berne, A., Duran-Alarcon, C., Boudevillain, B., Genthon, C., Scarchilli, C., and van Lipzig, N. P. M.: Evaluation of the CloudSat surface snowfall product over Antarctica using ground-based precipitation radars, The Cryosphere, 12, 3775–3789, https://doi.org/10.5194/tc-12-3775-2018, 2018b. a
Steiger, R., Scott, D., Abegg, B., Pons, M., and Aall, C.: A critical review of climate change risk for ski tourism, Current Issues in Tourism, 22, 1343–1379, https://doi.org/10.1080/13683500.2017.1410110, 2019. a
Stephens, G., Winker, D., Pelon, J., Trepte, C., Vane, D., Yuhas, C., LÉcuyer, T., and Lebsock, M.: CloudSat and CALIPSO within the A-Train: Ten Years of Actively Observing the Earth System, B. Am. Meteorol. Soc., 99, 569–581, https://doi.org/10.1175/BAMS-D-16-0324.1, 2018. a, b
Stephens, G. L., Vane, D. G., Boain, R. J., Mace, G. G., Sassen, K., Wang, Z., Illingworth, A. J., O'Connor, E. J., Rossow, W. B., Durden, S. L., Miller, S. D., Austin, R. T., Benedetti, A., Mitrescu, C., and Team, C. S.: The CloudSat mission and the A-Train: A new dimension of space-based observations of clouds and precipitation, B. Am. Meteorol. Soc., 83, 1771–1790, https://doi.org/10.1175/BAMS-83-12-1771, 2002. a, b
Strong, C. K., Ye, Z., and Shi, X.: Safety Effects of Winter Weather: The State of Knowledge and Remaining Challenges, Transport Reviews, 30, 677–699, https://doi.org/10.1080/01441640903414470, 2010. a
Tridon, F., Battaglia, A., Chase, R. J., Turk, F. J., Leinonen, J., Kneifel, S., Mroz, K., Finlon, J., Bansemer, A., Tanelli, S., Heymsfield, A. J., and Nesbitt, S. W.: The Microphysics of Stratiform Precipitation During OLYMPEX: Compatibility Between Triple-Frequency Radar and Airborne In Situ Observations, J. Geophys. Res.-Atmos., 124, 8764–8792, https://doi.org/10.1029/2018JD029858, 2019. a
Tridon, F., Silber, I., Battaglia, A., Kneifel, S., Fridlind, A., Kalogeras, P., and Dhillon, R.: Highly supercooled riming and unusual triple-frequency radar signatures over McMurdo Station, Antarctica, Atmos. Chem. Phys., 22, 12467–12491, https://doi.org/10.5194/acp-22-12467-2022, 2022. a
Tridon, F., Battaglia, A., Rizik, A., Scarsi, F. E., and Illingworth, A.: Filling the Gap of Wind Observations Inside Tropical Cyclones, Earth Space Sci., 10, e2023EA003099, https://doi.org/10.1029/2023EA003099, 2023. a
Wang, Y., Liu, G., Seo, E.-K., and Fu, Y.: Liquid water in snowing clouds: Implications for satellite remote sensing of snowfall, Atmos. Res., 131, 60–72, https://doi.org/10.1016/j.atmosres.2012.06.008, 2013. a
Wasti, A., Ray, P., Wi, S., Folch, C., Ubierna, M., and Karki, P.: Climate change and the hydropower sector: A global review, WIREs Climate Change, 13, e757, https://doi.org/10.1002/wcc.757, 2022. a
Watters, D., Battaglia, A., and Allan, R. P.: The Diurnal Cycle of Precipitation according to Multiple Decades of Global Satellite Observations, Three CMIP6 Models, and the ECMWF Reanalysis, J. Climate, 34, 5063–5080, https://doi.org/10.1175/JCLI-D-20-0966.1, 2021. a
Wehr, T., Kubota, T., Tzeremes, G., Wallace, K., Nakatsuka, H., Ohno, Y., Koopman, R., Rusli, S., Kikuchi, M., Eisinger, M., Tanaka, T., Taga, M., Deghaye, P., Tomita, E., and Bernaerts, D.: The EarthCARE mission – science and system overview, Atmos. Meas. Tech., 16, 3581–3608, https://doi.org/10.5194/amt-16-3581-2023, 2023. a
Wolde, M., Battaglia, A., Nguyen, C., Pazmany, A. L., and Illingworth, A.: Implementation of polarization diversity pulse-pair technique using airborne W-band radar, Atmos. Meas. Tech., 12, 253–269, https://doi.org/10.5194/amt-12-253-2019, 2019. a
Yang, D., Elomaa, E., Tuominen, A., Aaltonen, A., Goodison, B., Gunther, T., Golubev, V., Sevruk, B., Madsen, H., and Milkovic, J.: Wind-induced Precipitation Undercatch of the Hellmann Gauges, Hydrol. Res., 30, 57–80, https://doi.org/10.2166/nh.1999.0004, 1999. a
Yang, T., Liang, Q., Zheng, L., Li, T., Chen, Z., Hui, F., and Cheng, X.: Mass Balance of the Antarctic Ice Sheet in the Early 21st Century, Remote Sens., 15, 1677, https://doi.org/10.3390/rs15061677, 2023. a
Zwally, H., Giovinetto, M., Beckley, M., and Saba, J.: Antarctic and Greenland Drainage Systems, https://earth.gsfc.nasa.gov/cryo/data/polar-altimetry/antarctic-and-greenland-drainage-systems (last access: 15 May 2024), 2012. a, b, c
- Abstract
- Introduction
- Methodology
- Results
- Influence of the ground clutter on the detection of the surface snowfall precipitation
- Summary and conclusions
- Code availability
- Data availability
- Author contributions
- Competing interests
- Disclaimer
- Acknowledgements
- Financial support
- Review statement
- References