the Creative Commons Attribution 4.0 License.
the Creative Commons Attribution 4.0 License.
 | 25 Jun 2025
Mechanisms and impacts of anomalous high-salinity shelf water formation in the Ross Sea
Xiaoqiao Wang
Chuan Xie
Xi Zhao
Chuning Wang
Heng Hu
Yuanjie Chen
High-salinity shelf water (HSSW) acts as a precursor to the Antarctic Bottom Water and plays a critical role in regulating the global ocean circulation system. This study employs a high-resolution coupled ocean–sea ice–ice shelf model to analyze the interannual variation in HSSW formation in the Ross Sea, which is one of the major production sites of HSSW. We are particularly focused on anomalously high HSSW production during the winter of 2007. The results indicate that, in this winter, there were frequent passages of synoptic-scale cyclones that were centered near the front of the Ross Ice Shelf. The western flanks of these cyclones significantly enhanced offshore winds over the western Ross Ice Shelf Polynya, a major origin site of HSSW in the Ross Sea, leading to a sharp increase in ice production within this polynya. The HSSW formation resulting from brine rejection during ice freezing reached the highest volume of 16 000 km3 in 2007. However, the salinity and density of the Ross Sea during this period exhibited unexpectedly low values. This inconsistency was due to a rapid increase in ice shelf melting over the Amundsen Sea and Ross Sea during 2006–2007, with annual cumulative melt rates reaching a peak in recent decades. Meanwhile, the resulting large amount of meltwater was transported westward into the Ross Sea by notably strong slope and coastal currents in 2007, leading to large fluxes of freshwater flux into the Ross Sea. The interaction between enhanced HSSW formation driven by ice production and the large influx of meltwater highlights the complex dynamics that shape hydrographic variability in the Ross Sea.
- Article
(10705 KB) - Full-text XML
- BibTeX
- EndNote


High-salinity shelf water (HSSW), a precursor to the Antarctic Bottom Water (AABW), is predominantly formed in Antarctic coastal polynyas, which are regions of persistent open water bordered by sea ice along the coastline. These polynyas are largely driven by katabatic and synoptic offshore winds (Bromwich et al., 1998; Massom et al., 1998; Morales Maqueda et al., 2004; Weber et al., 2016; Wenta and Cassano, 2020), which enhance air–sea heat exchange, expand polynya size, and increase sea ice production (SIP) as wind speed rises. During the freezing seasons, the continuous sea ice formation and associated brine rejection in coastal polynyas lead to the formation of HSSW. When HSSW mixes with other water masses, such as the ice shelf meltwater and relatively warmer Circumpolar Deep Water (CDW), the resulting water mass can cross the continental slope and sink to the deep ocean, ultimately forming AABW (Comiso and Gordon, 1998; Ohshima et al., 2013; Whitworth et al., 2013). As the lower limb of the global overturning circulation, AABW plays a crucial role in regulating the oceanic heat storage capacity and the pathways of carbon sequestration in the Southern Ocean and the world ocean (Arrigo et al., 2008; Gruber et al., 2019; Murakami et al., 2020; Li et al., 2023).
The Ross Sea (Fig. 1a) is a primary region for the formation of AABW (Gordon et al., 2009), with a production accounting for approximately 20 %–40 % of the total (Meredith, 2013; Solodoch et al., 2022). AABW in the Ross Sea primarily originates from two typical coastal polynyas: the Terra Nova Bay Polynya (TNBP) in the western Ross Sea and the Ross Ice Shelf Polynya (RISP) (Fig. 1b); the latter has the highest ice production among all Antarctic coastal polynyas (Tamura et al., 2016) and is the focused region of this study. The western side of RISP serves as the primary site for HSSW formation, while the eastern side, significantly influenced by the fresh ice shelf meltwater, is less favorable for the formation of high-salinity HSSW (Smith et al., 2012; Yan et al., 2023). Previous studies revealed the formation and characteristics of HSSW and AABW in the Ross Sea on synoptic to interannual time scales as well as long-term trends, demonstrating the roles of atmospheric circulations, sea ice production, and freshwater input. At the synoptic scale, strong wind events driven by cyclones or katabatic winds play a critical role in shaping the polynya dynamics and extent. Numerous studies have identified strong correlations between wind speed and sea ice concentration/production in the polynyas (Bromwich et al., 1998; Dale et al., 2017; Cheng et al., 2019; Ding et al., 2020; Wenta and Cassano, 2020); the variability of sea ice production further influences ocean convection, the HSSW formation (Thompson et al., 2020; Wang et al., 2021), and its subsequent transport (Wang et al., 2023b). On the seasonal scale, based on mooring datasets and numerical simulations, significant HSSW production starts in July and lasts until October (Mathiot et al., 2012; Rusciano et al., 2013; Yan et al., 2023). For the long-term trend, observations show a dramatic decline in the HSSW salinity over recent decades, attributed to increased transport of meltwater from the Amundsen Sea to the Ross Sea (Jacobs et al., 2022), though this trend has been found to be reversed in recent years (Castagno et al., 2019; Silvano et al., 2020; Guo et al., 2021). Up until now, anomalous HSSW production events, which can make significant contributions to the HSSW volume and subsequently the AABW production, have not been fully explored. In this study, by examining the distinct variations in HSSW formation from 2003 to 2019, we aim to elucidate the underlying physical processes driving anomalously high HSSW production in the austral winter of 2007. A high-resolution coupled ocean–sea ice–ice shelf model covering the Ross Sea and the Amundsen Sea, which effectively simulates the observed temporal variability of HSSW, is employed to perform such investigations. Salinity and density fields in the Ross Sea are also analyzed, the variations of which suggest the combined effects of HSSW production and freshwater input. The manuscript is organized as follows: Sect. 2 describes the numerical model, observational data, model validation, and analysis methods. Section 3 presents results on the atmospheric drivers of SIP and their influence on HSSW formation, as well as the impacts of meltwater transport from the Amundsen Sea. Section 4 discusses the relationships between large-scale atmospheric modes and HSSW variability. Section 5 provides the conclusions.
2.1 Model data description
This study utilizes a high-resolution Ross–Amundsen Sea ocean–sea ice–ice shelf model (RAISE, Zhang et al., 2025) developed based on the Regional Ocean Modeling System (ROMS v3.6), a primitive-equation, free-surface, terrain-following coordinate model (Shchepetkin and McWilliams, 2009). ROMS is coupled with a dynamic sea ice model (Budgell, 2005) employing elastic-viscous-plastic (EVP) rheology (Hunke and Dukowicz, 1997; Hunke, 2001), which includes two-layer ice thermodynamics with snow as an insulating layer following Mellor and Kantha (1989) and Häkkinen and Mellor (1992). This configuration effectively simulates sea ice characteristics in polar regions around the Antarctic, including the Ross Sea (Stern et al., 2013; Dinniman et al., 2011, 2015). The ice shelves are modeled as static, without mass variation or iceberg calving, and a three-equation parameterization scheme is employed to represent the thermodynamic and mechanical effects of the ice shelf–seawater interactions (Holland and Jenkins, 1999; Dinniman et al., 2011).
The model domain spans approximately 85.6 to 64.2° S and 143.0° E to 89.9° W (Fig. 1a), including the Ross Sea and Amundsen Sea, along with the floating ice shelves. The horizontal resolution varies from 2–4 km along the continental shelf to 3–6 km in the open ocean, permitting mesoscale eddies on the continental shelf and slope, but is not fully eddy-resolving (Hallberg, 2013; Stewart and Thompson, 2015; St-Laurent et al., 2013). The model employs 32 terrain-following vertical levels, with significantly higher resolution in the near-surface and bottom layers than those in the intermediate layers. The bathymetry and ice shelf topography are derived from MEaSUREs BedMachine Antarctica, version 2 (Morlighem et al., 2020). ROMS calculates the momentum, heat, and freshwater (imposed as a salt flux) fluxes in the open ocean using the COARE version 3.0 bulk flux formulas (Fairall et al., 2003). The vertical momentum and mixing are calculated using the K profile parameterization scheme (Large et al., 1994). The initial temperature and salinity conditions derive from a 10 km circum-Antarctic ocean–sea ice–ice shelf model (Dinniman et al., 2015). Boundary conditions for temperature, salinity, sea surface height, and depth-averaged velocities are sourced from the Met Office Global Seasonal Forecasting System version 5 (GloSea5) (Maclachlan et al., 2015), while sea ice concentration data are incorporated from multiple satellite products, including the Advanced Microwave Scanning Radiometer-Earth Observing System (AMSR-E), Special Sensor Microwave Imager/Sounder (SMMI/S), and Advanced Microwave Scanning Radiometer 2 (AMSR-2), based on their availability during different time periods. Tidal forcing, based on TPXO-9, includes 15 major tidal constituents (Egbert and Erofeeva, 2002) and is applied at the open boundaries through sea surface height and barotropic currents. Atmospheric forcing fields utilized in this model are obtained from the ERA5 reanalysis product, including 3-hourly surface wind and air temperature, along with daily sea level pressure, precipitation, humidity, and cloud cover (Hersbach et al., 2020), produced by the European Centre for Medium-Range Weather Forecasts (ECMWF). The model simulation spans from 2003 to 2019 after a 5 year spin-up simulation, and the model results are output as 5 d-average fields.
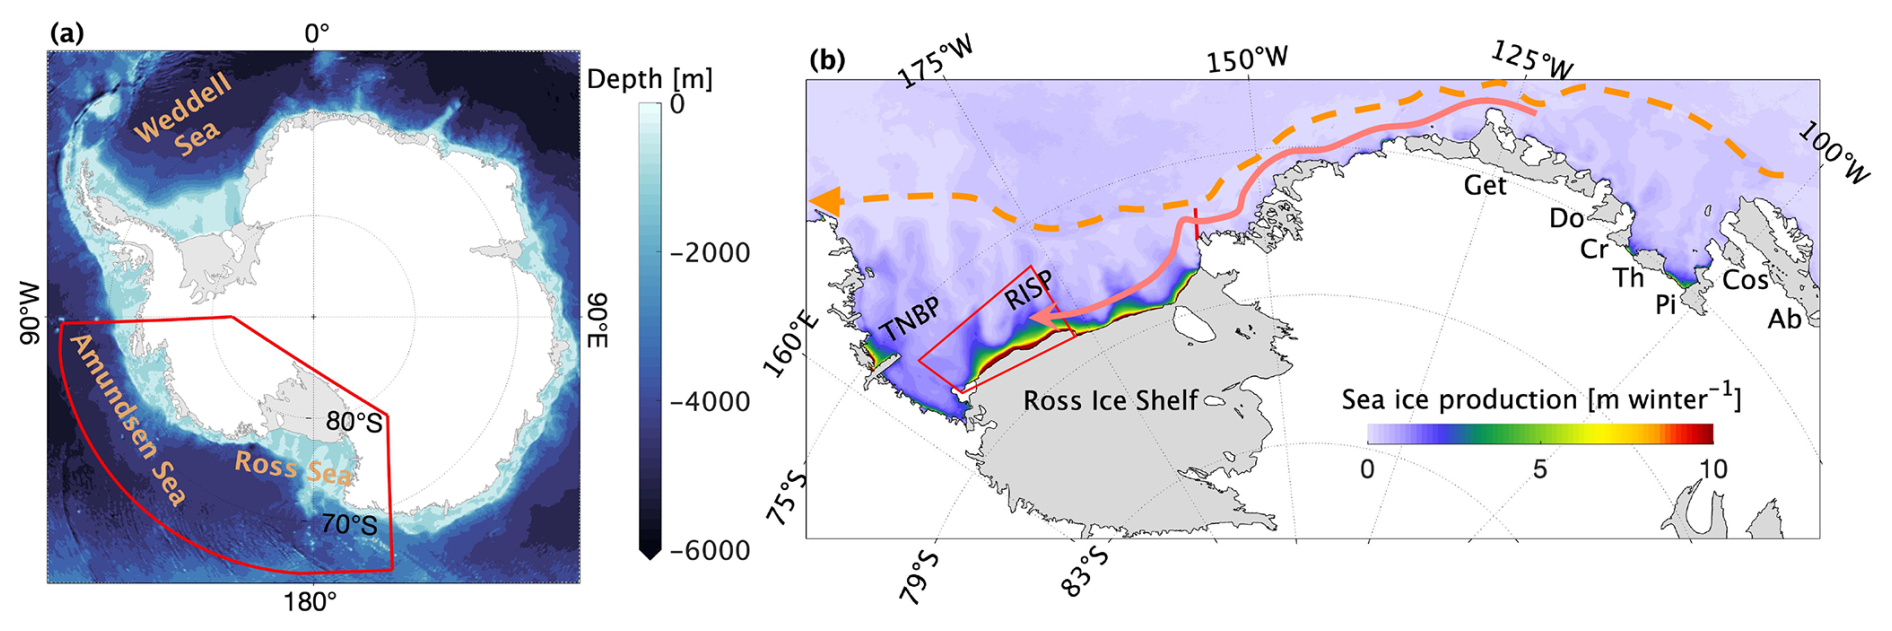
Figure 1Geographic maps of (a) the Southern Ocean south of 60° S and (b) the Ross Sea and Amundsen Sea. Areas in white show continental surfaces, and areas in light gray indicate ice shelves. The color scale indicates accumulated sea ice production over the austral winter (June–August), averaged from 2003–2019 based on the model simulations. In panel (a), the model domain is shown by the red polygon. In panel (b), the dashed orange line indicates the Antarctic slope current, the solid pink line indicates the coastal current, and the red line between the Ross Sea and the Amundsen Sea indicates the selected transect used to calculate the freshwater transport. RISP represents the Ross Ice Shelf Polynya and TNBP indicates the Terra Nova Bay Polynya. The red box in panel (b) indicates the western RISP. The labeled local ice shelves are: Abbot Ice Shelf (Ab), Cosgrove Ice Shelf (Cos), Pine Island Ice Shelf (Pi), Thwaites Ice Shelf (Th), Crosson Ice Shelf (Cr), Dotson Ice Shelf (Do), and Getz Ice Shelf (Get).
2.2 Model validation
A comprehensive validation of the RAISE model is presented by Zhang et al. (2025), demonstrating its capacity to effectively capture the temporal and spatial variability of SIP in polynyas and the hydrographic properties of HSSW in the Ross Sea. With regard to sea ice area (SIA), a comparison with the AMSR-E/AMSR2 datasets indicates that the simulated temporal variability of SIA is highly correlated with that of the observed dataset (R=0.91, P<0.001), though SIA is typically underestimated in the model. The model effectively captures the interannual variations of accumulative SIP in the Ross Sea polynyas, with correlations between the modeled and satellite-retrieved SIP reaching 0.62 for the Terra Nova Bay Polynya (Zhang et al., 2025) and 0.64 for the western RISP (i.e., the major HSSW formation site over the entire RISP, Fig. 2) at the 95 % confidence level. The satellite-retrieved SIP dataset is available from the Institute of Low Temperature Science at Hokkaido University (https://www2.lowtem.hokudai.ac.jp/wwwod/polar-seaflux/, last access: 11 November 2024).
The performance of the RAISE model in simulating the hydrographic properties and water masses in the Ross Sea was evaluated using temperature–salinity (T–S) diagrams and vertical transect patterns from the World Ocean Database (WOD) and the Marine Mammals Exploring the Oceans Pole to Pole (MEOP) seal-tag CTD observations (Zhang et al., 2025). The model accurately reproduces the key water masses present in the region, including the HSSW, CDW, and ice shelf meltwater. Furthermore, the model exhibits a high degree of accuracy in reproducing the temporal variability of HSSW density and salinity over the Ross Sea. A comparison of the model output with mooring data from the Italian MORSea and U.S. CALM projects revealed significant correlations between the variations of modeled and observed HSSW density in the Terra Nova Bay Polynya and on the western Ross Sea slope. More details of the model validation are given in Zhang et al. (2025). Meanwhile, the simulated ice shelf melt rates for the Amundsen Sea and Ross Sea show good agreement with observation-based estimates (Xie et al., 2024).
2.3 Methods
The extent of the RISP was defined as the area where the multiyear-average annual cumulative SIP exceeds zero near the Ross Ice Shelf region based on model simulations, as shown in Fig. 1b. This study focuses exclusively on the western portion of the RISP (west of 183° E), where previous studies have shown that HSSW formation is dominant (Orsi and Wiederwohl, 2009; Wang et al., 2023b) due to the influence of meltwater from the Amundsen Sea ice shelves and the Ross Ice Shelf in the eastern region. The HSSW is defined as the water mass with neutral density (γn) > 28.27 kg m−3, practical salinity (S) >34.62 and potential temperature (θ) °C (Orsi and Wiederwohl, 2009; Castagno et al., 2019). The area for calculating the HSSW volume extends to the base of the Ross Ice Shelf, as Assmann et al. (2003) and Budillon et al. (2003) demonstrated the existence of a southerly flow on the western side of the Ross Sea, transporting HSSW to the base of the ice shelf. This flow can advect more than 10 % of HSSW to the southern part of Ross Ice Shelf and intensify continuously over winter (Jendersie et al., 2018).
Cyclone tracking was conducted using the University of Melbourne Automatic Cyclone Tracking Scheme (Murray and Simmonds, 1991), which is based on the ERA5 reanalysis product from 2003 to 2019. The optimal parameters for this scheme, including the horizontal air pressure field smoothing parameter, the radius for calculating Laplacian pressure, and the maximum topographic height employed for cyclone detection, were derived from the values established by Uotila et al. (2009). The identified cyclones were characterized by a number of properties, including their locations, lifetimes, mean radii, and additional characteristics. Cyclones were selected based on specific criteria: a lifetime exceeding 12 h and a distance greater than 1000 km between the first and last detected locations. Such criteria can exclude certain detected but unrealistic cyclones (Uotila et al., 2011). The region south of 42° S was divided into 720 sectors, each encompassing 4° in latitude and 6° in longitude. The number of cyclone tracks per sector was calculated for the period from 2003 to 2019, following the definitions proposed by Uotila et al. (2013). Although cyclone tracking and track density calculations were performed across the entire region south of 42° S, subsequent analyses primarily focused on the Ross Sea and its adjacent areas to provide a more detailed characterization of cyclone activity in this region. This emphasis was motivated by the pronounced influence of cyclone center locations on the local wind field, particularly in modulating offshore winds that contribute to polynya formation. Cyclone distributions beyond this region were not shown, as their impact on the nearshore wind field is relatively limited due to their spatial scale. Recent studies suggest that while higher spatial resolutions of input atmospheric data may capture more small-scale cyclones and increase total track numbers, the spatial distribution of cyclogenesis and activity regions remains consistent across resolutions (Zhong et al., 2023). Therefore, the statistical results of cyclones in this study are robust to changes in data resolution.
The transport of meltwater discharged from ice shelves is quantified by calculating the specific freshwater transport across a designated meridional transect at the boundary between the Ross and Amundsen Seas (Fig. 1b). Following Li et al. (2021), the advective freshwater transport across the boundaries is calculated as follows:
where u represents the horizontal velocity vector (u, v), and Ffw is the freshwater content. Ffw is derived from Brown and Irish (1993) as follows:
with S as the salinity and Sref set to 34.9 psu as a reference, which is the maximum salinity observed in the Ross Sea. This approach quantifies the freshwater input by combining spatially integrated velocity and salinity contrasts, offering insights into the transport dynamics of meltwater across defined oceanic boundaries.
3.1 Sea ice production and the related atmospheric drivers
Sea ice production in the coastal polynya is the determinate factor for HSSW formation. From 2003 to 2019, modeled cumulative ice production over the RISP during austral winter exhibited a pronounced peak in 2007 (Fig. 2). Satellite-derived ice production data from 2003 to 2013 also show the maximum value in 2007. However, the model tends to overestimate SIP, compared with observations; this may be attributed to several factors. The satellite-derived SIP dataset does not account for active frazil ice formation in Antarctic coastal polynyas, potentially leading to underestimation of SIP in frazil-dominated regions (Nakata et al., 2021). Moreover, satellite retrievals do not incorporate oceanic heat fluxes, while observations from Terra Nova Bay indicate that lower subsurface temperatures could enhance SIP if vertical oceanic heat fluxes were considered in retrieval algorithms (Thompson et al., 2020). Additionally, model limitations in representing sea ice thermodynamic and dynamic processes may contribute to overestimation of sea ice thickness in polynya regions, further affecting SIP estimates (Zhang et al., 2025).
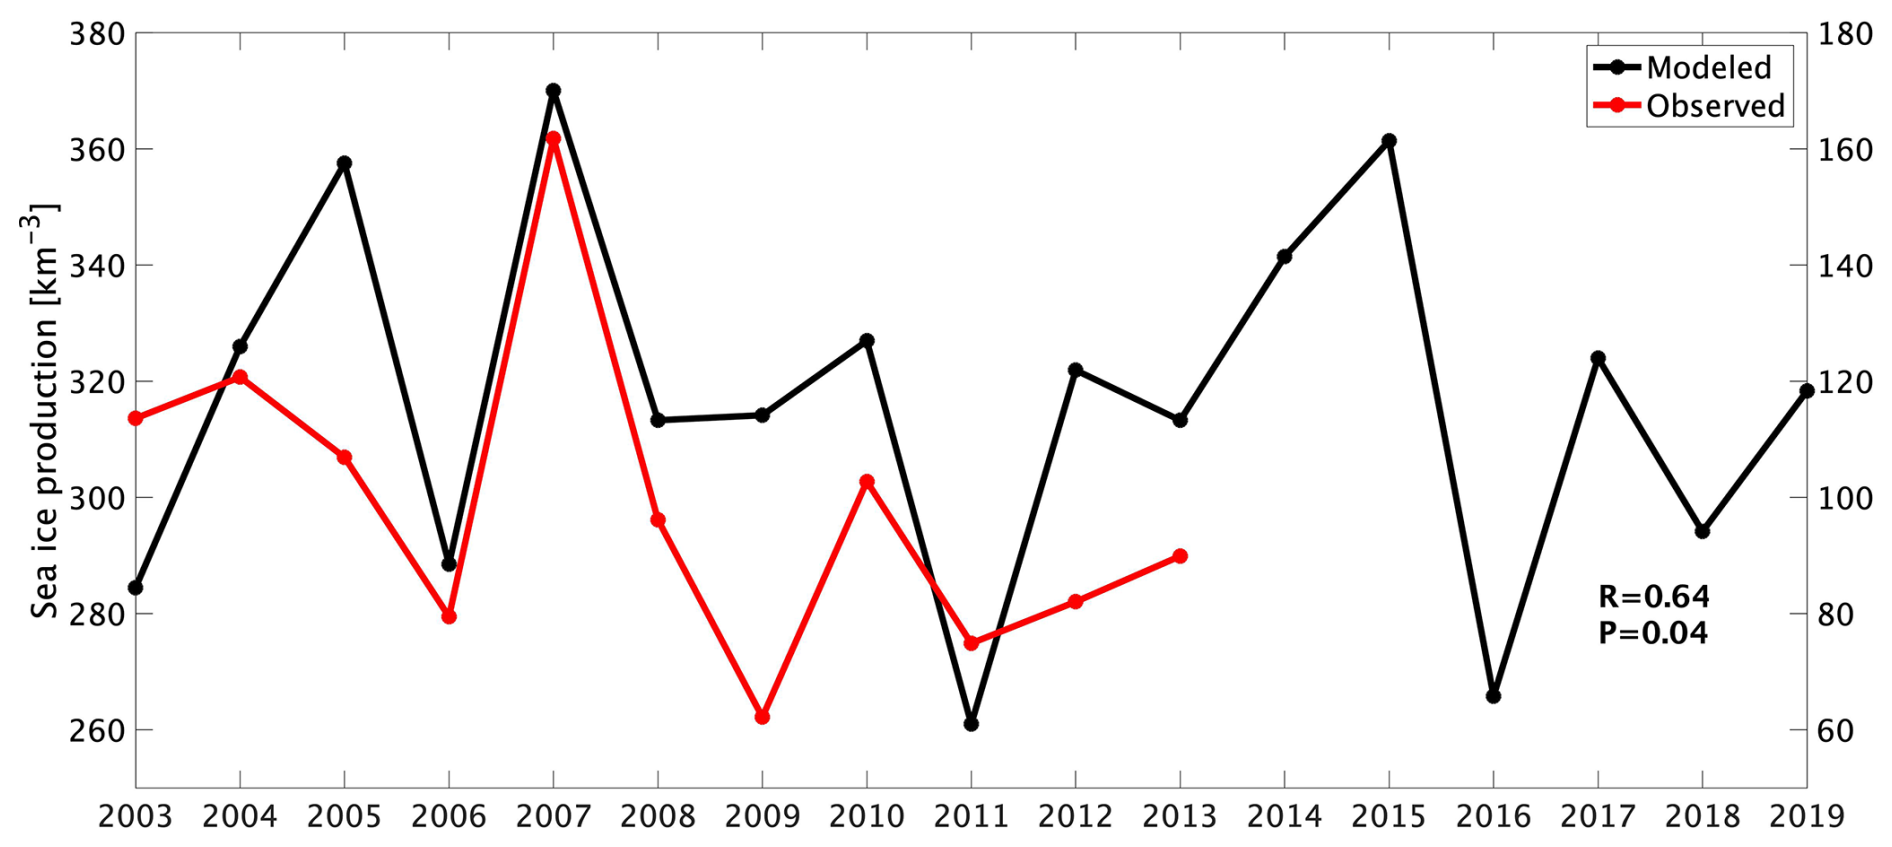
Figure 2Time series of observed (red line; 2003–2013) and modeled (black line; 2003–2019) polynya-averaged sea ice production (SIP) during austral winter (June–August) for the western Ross Ice Shelf Polynya indicated by the red box in Fig. 1b (left y axis: modeled SIP, right y axis: observed SIP). The correlation coefficient between the observed and modeled SIP is 0.64 (P=0.04).
To better understand the drivers behind the exceptionally high ice production in 2007, statistical analysis of cyclones over the Ross Sea and surrounding regions was performed using the cyclone tracking scheme. The spatial distribution of winter cyclone track density (Fig. 3) reveals that most cyclone centers are concentrated north and east of the Ross Sea, with relatively few or no cyclones observed over the Ross Ice Shelf, particularly between 79 and 84° S. However, in several years, such as 2005, 2007, 2017, and 2019, a relatively high frequency of cyclones was recorded over the Ross Ice Shelf (Fig. 3c, e, o, q). Among these years, 2007 stands out as the year with the highest cumulative cyclone track density, reaching approximately 18 (Fig. 3e).
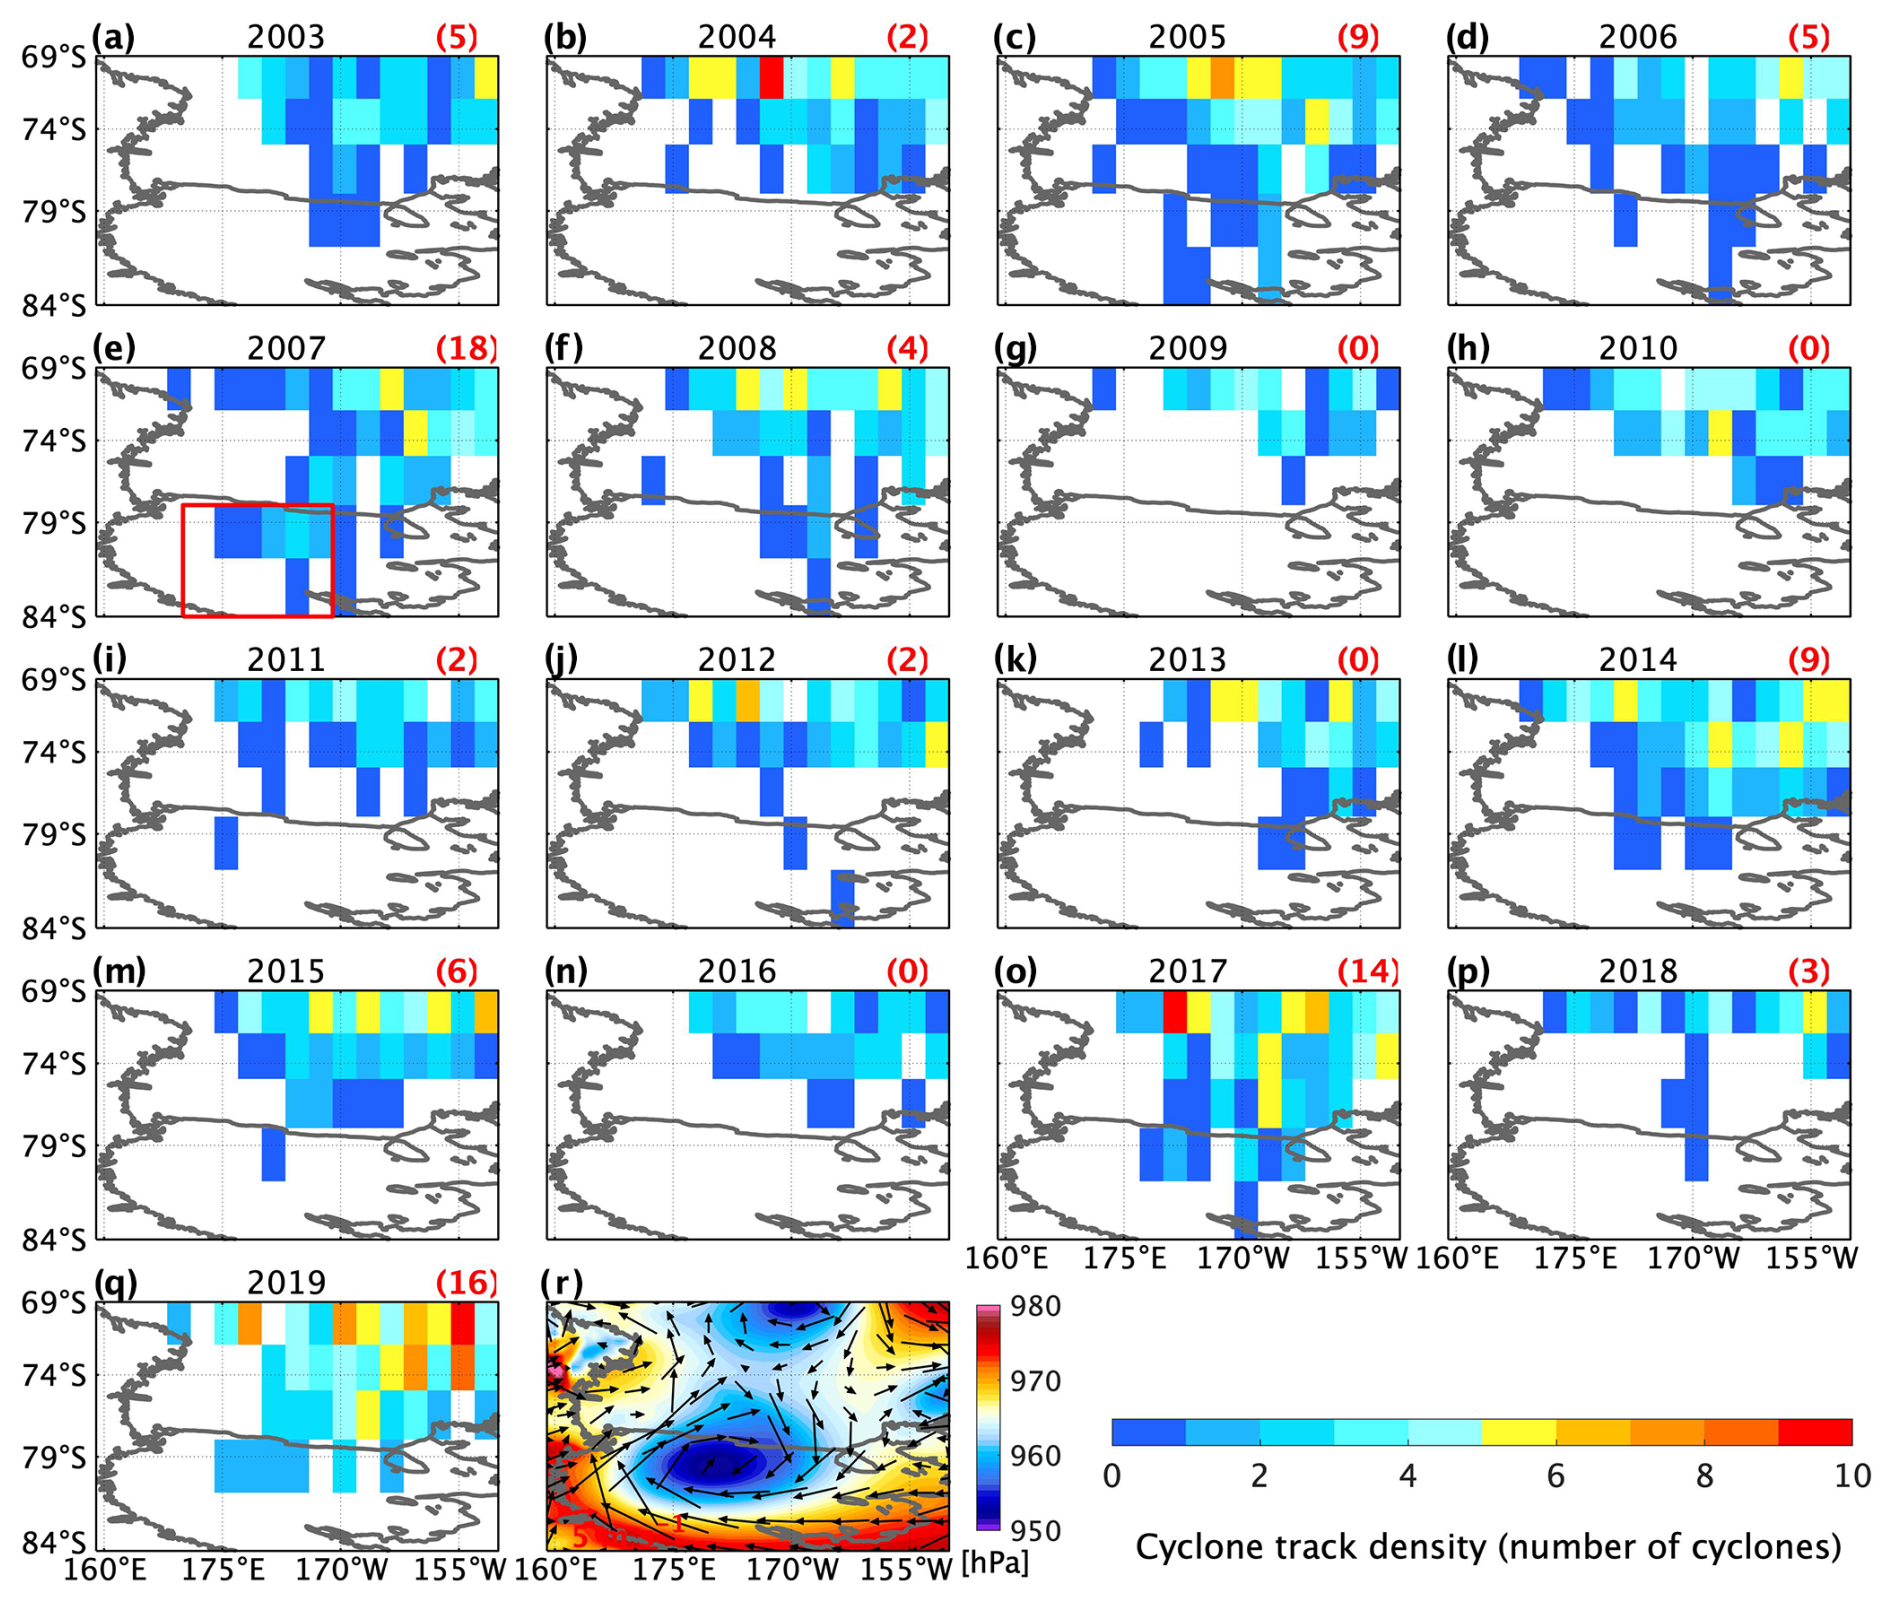
Figure 3(a–q) Austral winter track densities (the number of tracks per section) of cyclones in the Ross Sea from 2003–2019. The red box on the Ross Ice Shelf in (e) represents the spatial extent over which the accumulated track density is calculated, and the numbers in the upper right corners indicate the density value calculated based on this box. (r) Spatial distributions of sea level pressure (colored shading) and 10 m wind vectors (black arrow) for a typical cyclone occurring on 14 August 2007.
The frequent passage of cyclones centered near and over the Ross Ice Shelf significantly impacts the local wind field. The western branches of these cyclones enhance offshore winds over the western RISP (Fig. 3r), resulting in intensified meridional wind speeds (Fig. 4). In 2007, the aggregation of cyclones in this region (Fig. 3e) led to pronounced increases in offshore winds (Fig. 4e). The spatial distribution of meridional wind speed for multiple years further highlights that, in 2007, offshore winds over the western RISP were the strongest, reaching approximately 9 m s−1 (Fig. 4e). Additionally, the area with offshore wind speeds exceeding 5 m s−1 extended farther eastward than other years, reaching approximately 175° W (Fig. 4e). Figure 4r highlights that the spatially averaged meridional wind speed on the western side of the Ross Sea (red box shown in Fig. 4e) in 2007 was approximately 6.5 m s−1, the highest among the analyzed years. Other years with elevated cyclone track densities, such as 2005, 2017, and 2019 (Fig. 3c, o, q), also exhibited relatively strong offshore winds (Fig. 4c, o, q), with average wind nearing 6 m s−1 (Fig. 4r). Meanwhile, for the year 2015, although cyclone track densities were not higher near the front of the Ross Ice Shelf (Fig. 3m), a significantly stronger offshore wind speed was observed over the western Ross Sea (Fig. 4m and r). This intensification of offshore winds may also be associated with local katabatic winds near the ice shelf front (Mathiot et al., 2010). In the winter of 2007, these strengthened offshore winds contributed to the record-high SIP in the RISP (Fig. 2). Similarly, the relatively strong offshore wind speeds in 2005, 2015, 2017, and 2019 also contributed to notable increases in SIP in these years (Fig. 2).
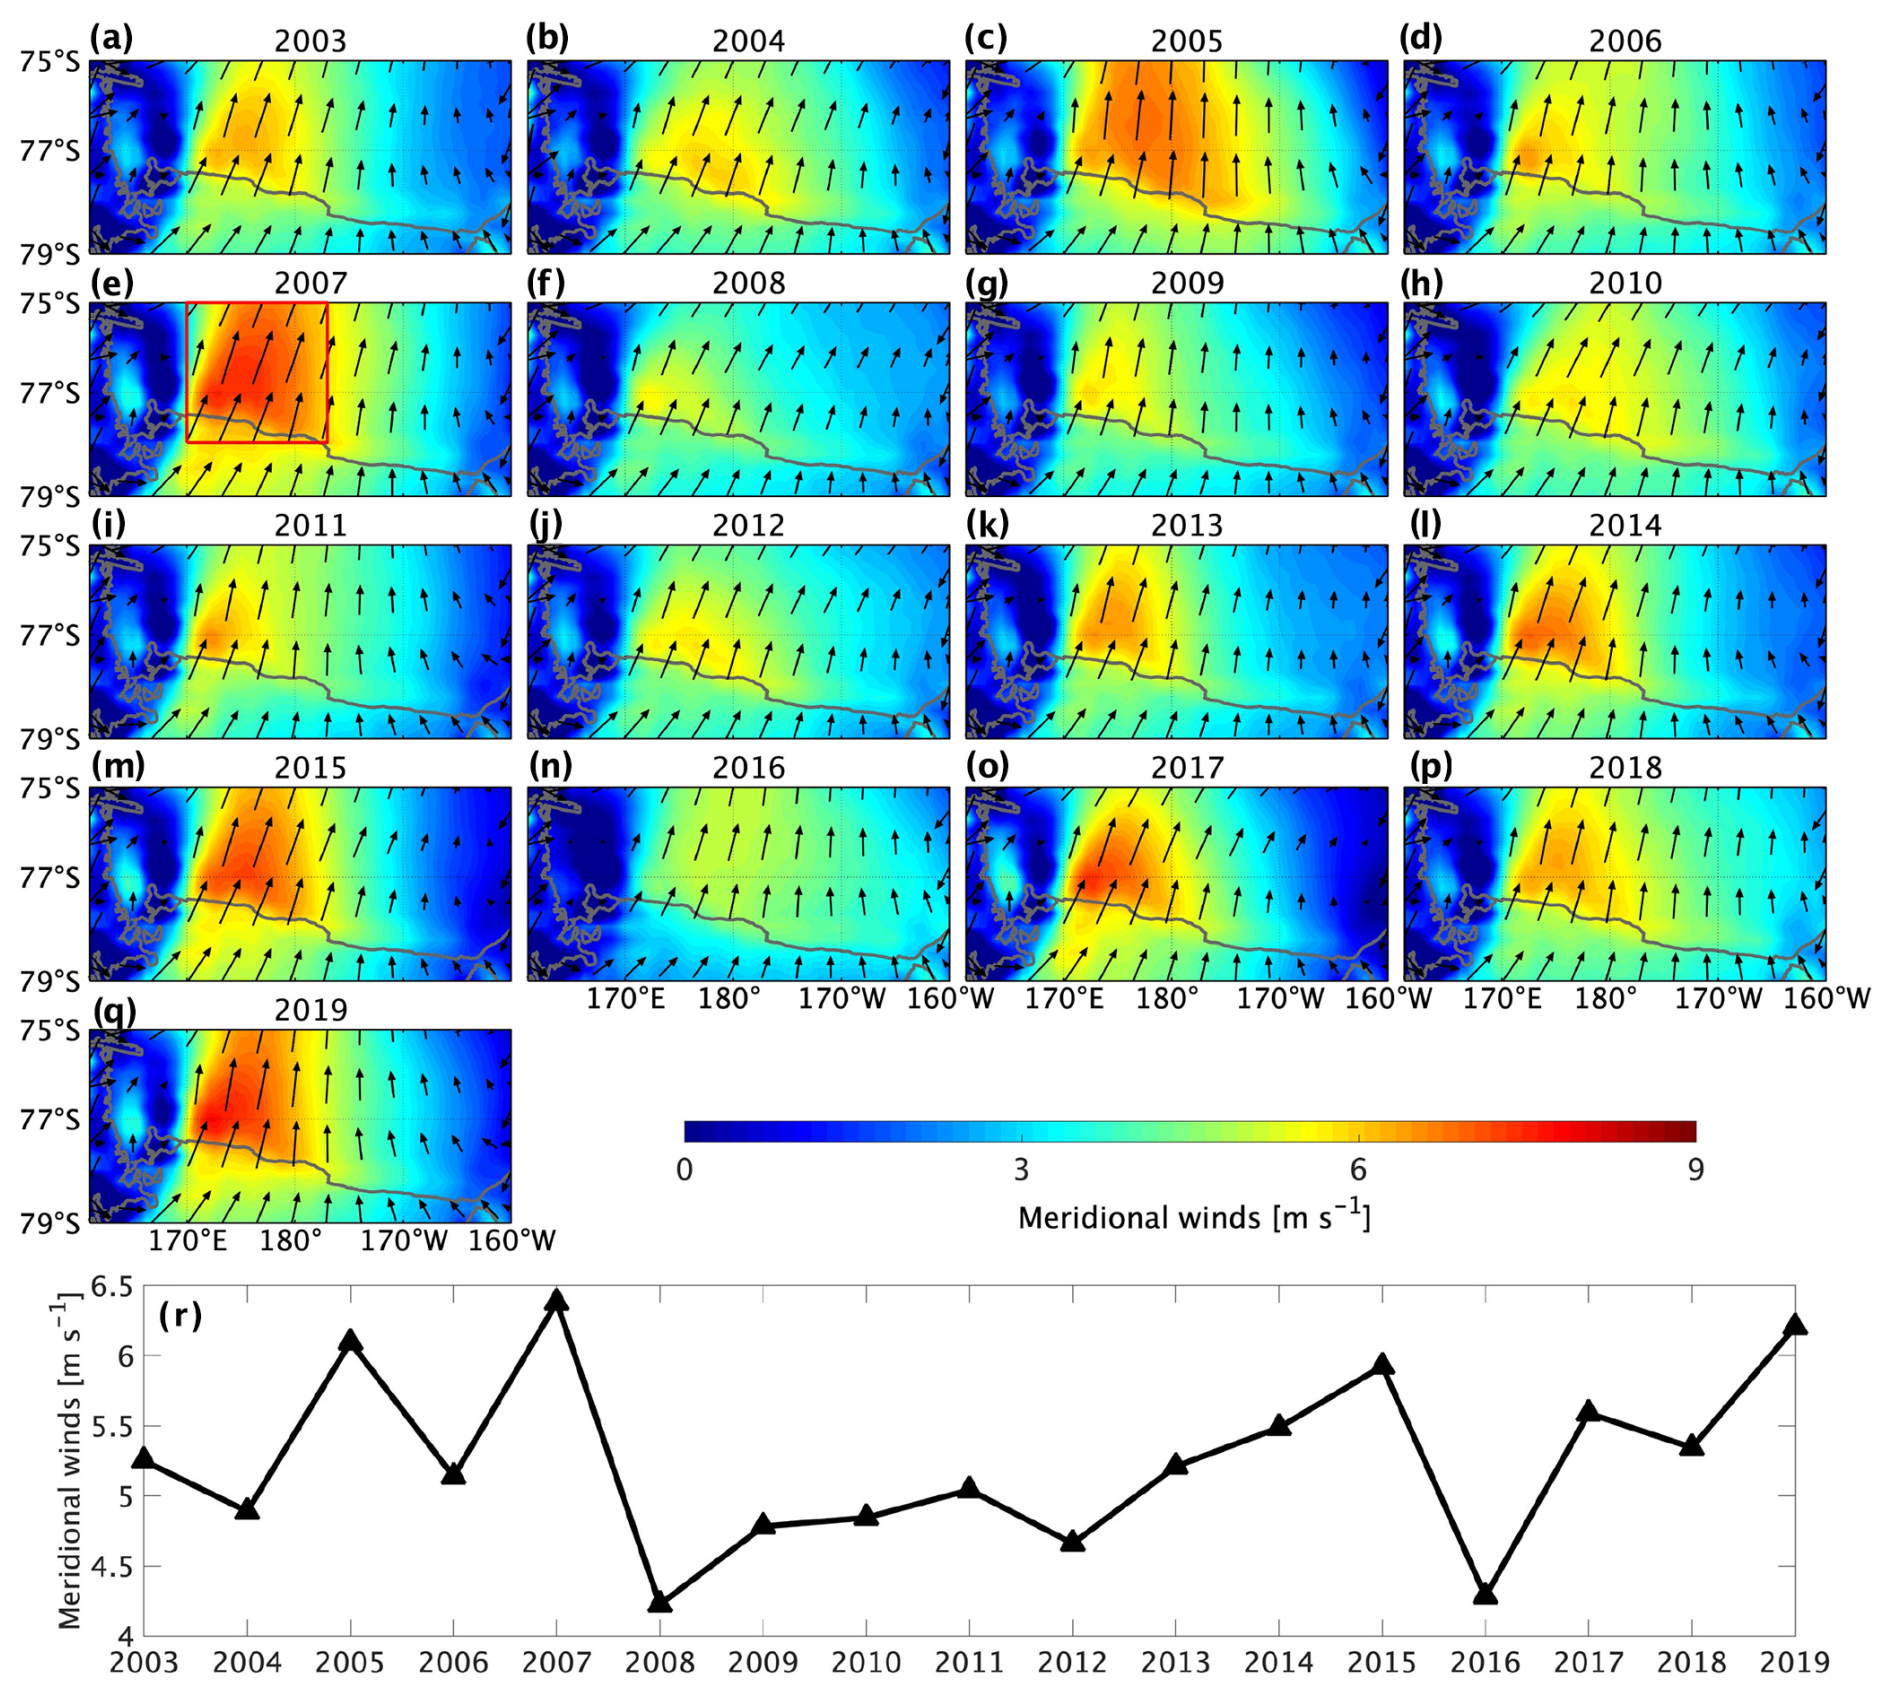
Figure 4(a–q) Spatial distributions of winter-averaged 10 m meridional wind speed (colored shading) and 10 m wind vectors (black arrows) in the Ross Sea from 2003–2019. (r) Time series of spatially averaged meridional wind speed over the western Ross Sea (red box in panel e).
3.2 Hydrographic properties and HSSW formation
The brine rejection process associated with sea ice formation in polynya regions directly affects the salinity of the surrounding area. To understand the influence of SIP on the hydrographic characteristics of the Ross Sea, the spatial distribution of winter-averaged salinity from 2003 to 2019 was analyzed first (Fig. 5). Typically, regions of high SIP, such as the RISP, are expected to exhibit higher salinity levels due to enhanced brine rejection. However, contrary to the expectations, salinity values in the western Ross Sea in 2007 were not high, ranging between 34.5 and 34.7 (Fig. 5e). These salinity levels were lower than those recorded in other years with moderate SIP, such as 2005, 2017, and 2019, where salinity reached 34.8–34.9 (Fig. 5c, o, q). Although Castagno et al. (2019) reported a slight salinity increase in 2007, their data are based on austral summer observations and include an interpolated estimate for that year due to a lack of direct CTD measurements. Similarly, hydrographic properties representing water masses, such as potential density and neutral density, also showed lower values in 2007 (not shown). These findings indicate that the hydrographic characteristics in 2007 do not align with the anticipated impacts of the highest SIP occurring in this year, suggesting the presence of other factors influencing the salinity and density in the Ross Sea. These processes will be discussed in Sect. 3.3.
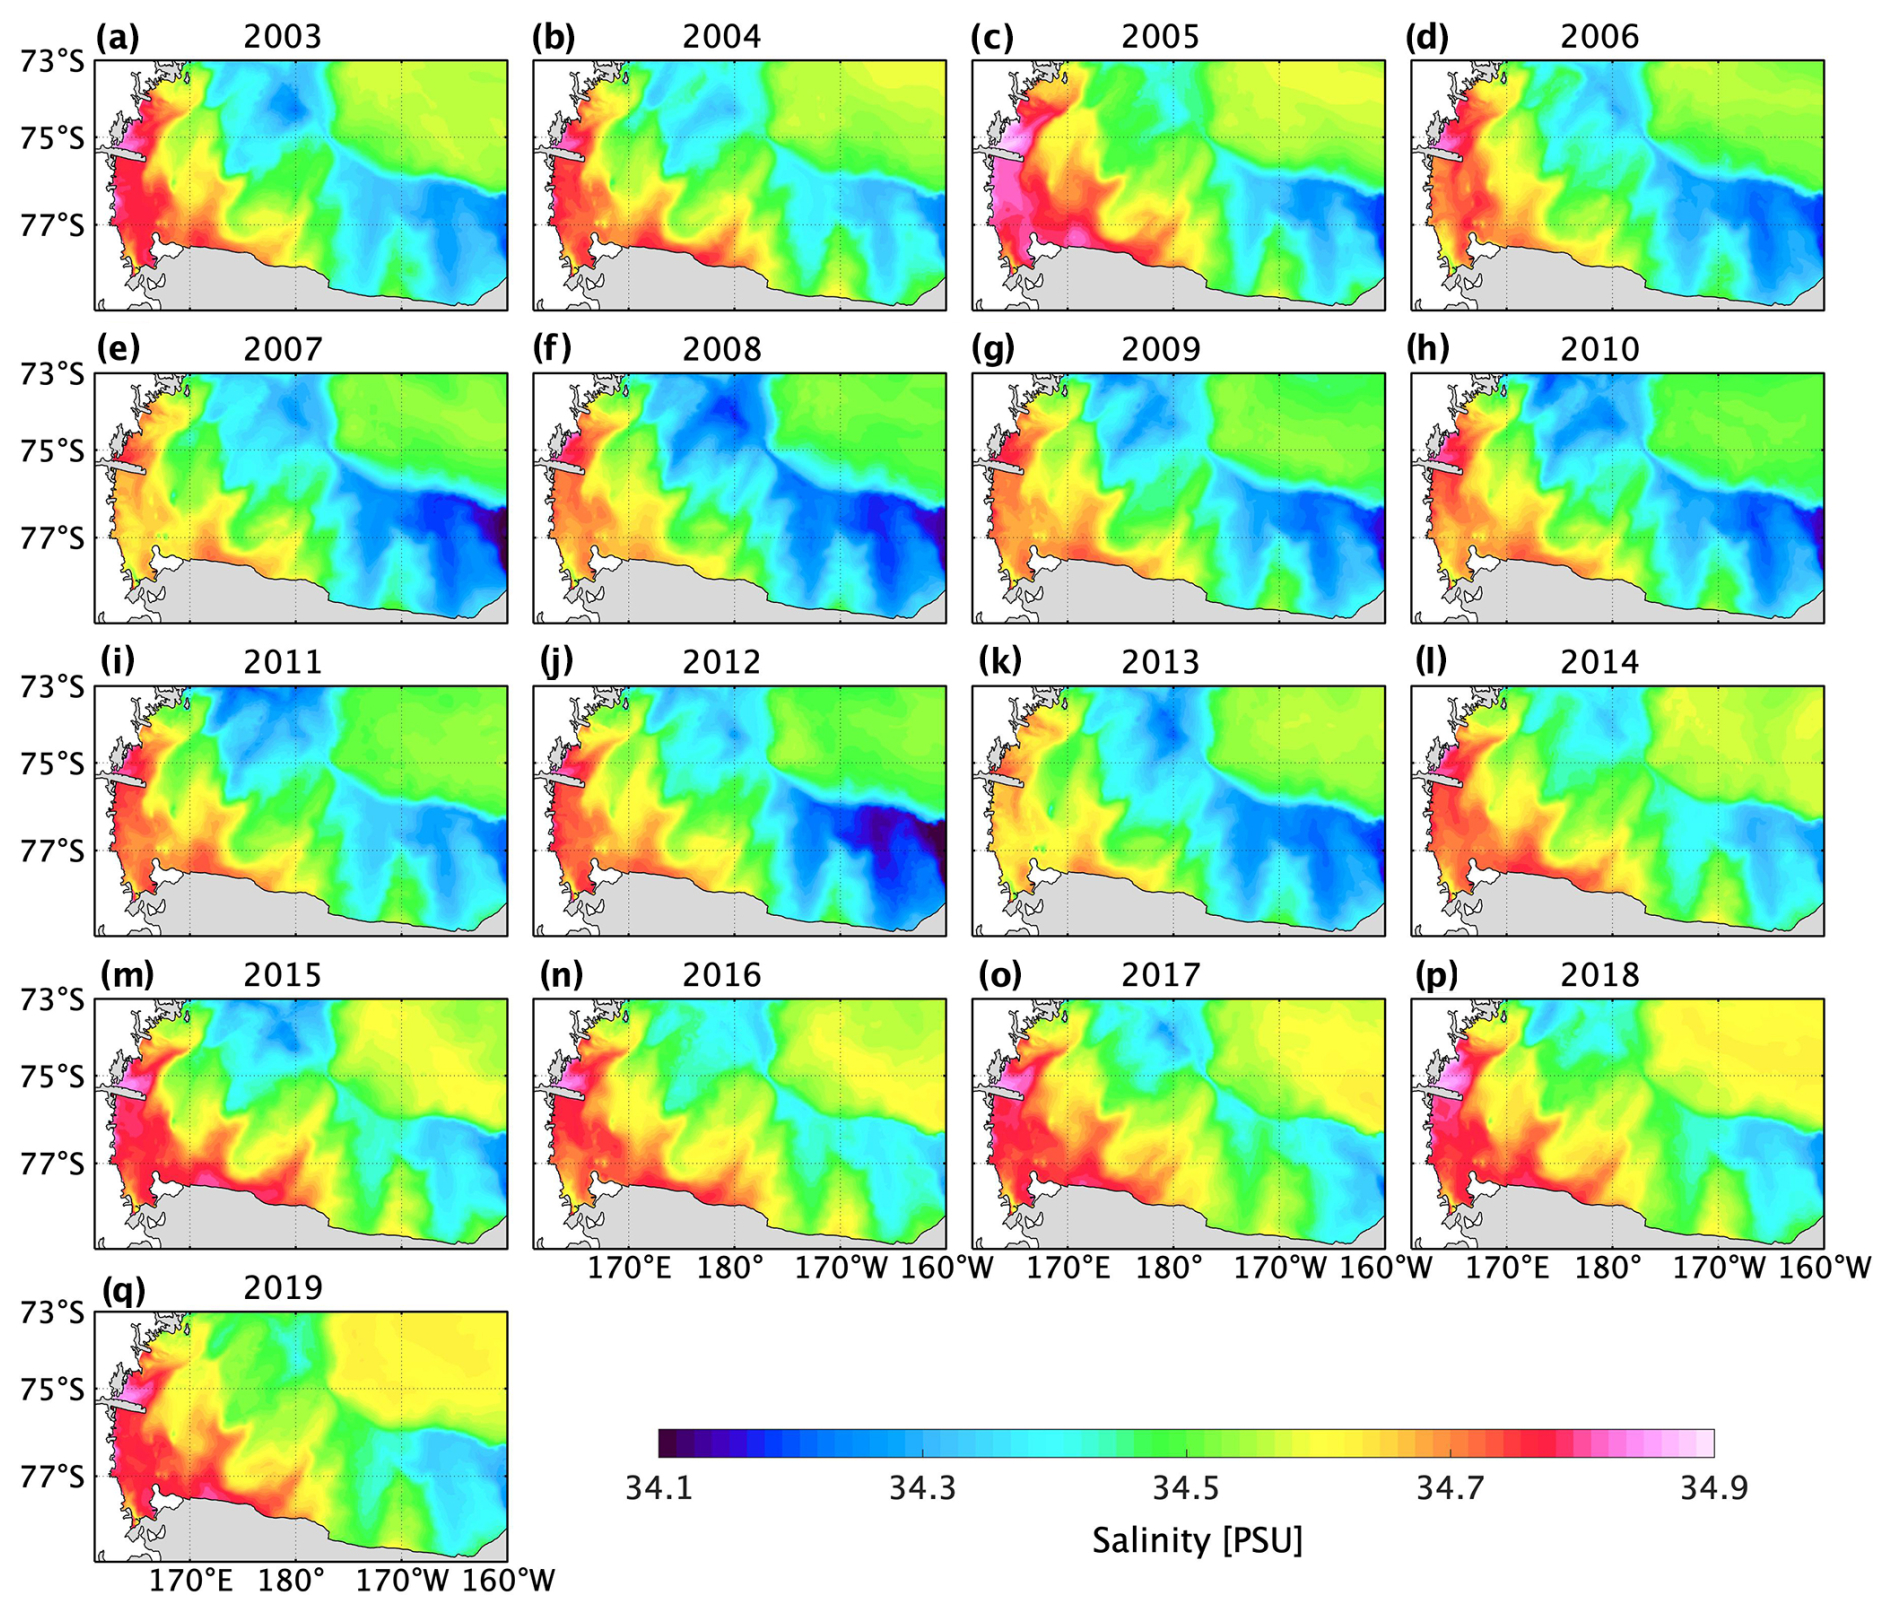
Figure 5(a–q) Spatial distributions of depth-averaged winter salinity in the Ross Sea from 2003–2019.
Salinity is not a precise indicator for quantifying the volume of HSSW formed, therefore the following analysis is instead focused on changes in HSSW volume itself, which can better represent the net production of HSSW. The HSSW volume change in the Ross Sea between July and October from 2003 to 2019 is shown in Fig. 6. Emphasis is placed on the July–October period, as this interval is characterized by the most pronounced salinity increases and HSSW formation (Rusciano et al., 2013; Yan et al., 2023; Zhang et al., 2024). HSSW is characterized by neutral density (γn) >28.27 kg m−3, practical salinity (S) >34.62, and potential temperature (θ) ° C (Orsi and Wiederwohl, 2009; Castagno et al., 2019). As mentioned in Sect. 2.3, the calculation included the region beneath the ice shelf, as indicated by the dashed box in Fig. 6a, where a southward flow on the western side of the Ross Sea can facilitate the transport of newly formed HSSW (Assmann et al., 2003; Budillon et al., 2003; Jendersie et al., 2018). The results revealed that the largest increase in the HSSW volume occurred in the winter of 2007, reaching approximately 16 000 km3 (Fig. 6b). This substantial increase is consistent with the exceptionally high SIP observed in 2007 over RISP (Fig. 2), indicating that significant HSSW formation was triggered by the enhanced brine rejection resulting from ice production in that year. Additionally, the SIP over the TNBP and the corresponding HSSW production in its surrounding region during 2007 were examined. The results revealed that the SIP and HSSW volume increase in 2007 were moderate in this area over 2003 to 2019 (not shown), suggesting that the greatest HSSW volume increase in 2007 in the Ross Sea was primarily driven by the significantly enhanced ice production over RISP. The second-highest increase in HSSW volume was recorded in 2019, and can also be attributed to the relatively strong meridional winds (Fig. 4q) that drove enhanced ice production and HSSW formation. In conclusion, while 2007 experienced the highest SIP and HSSW production, the expected increase in salinity and density was not observed, suggesting complex interactions between SIP and hydrographic properties in the Ross Sea. In the following section, the processes affecting the relationship between the production of sea ice and HSSW and salinity in the Ross Sea in 2007 will be analyzed.
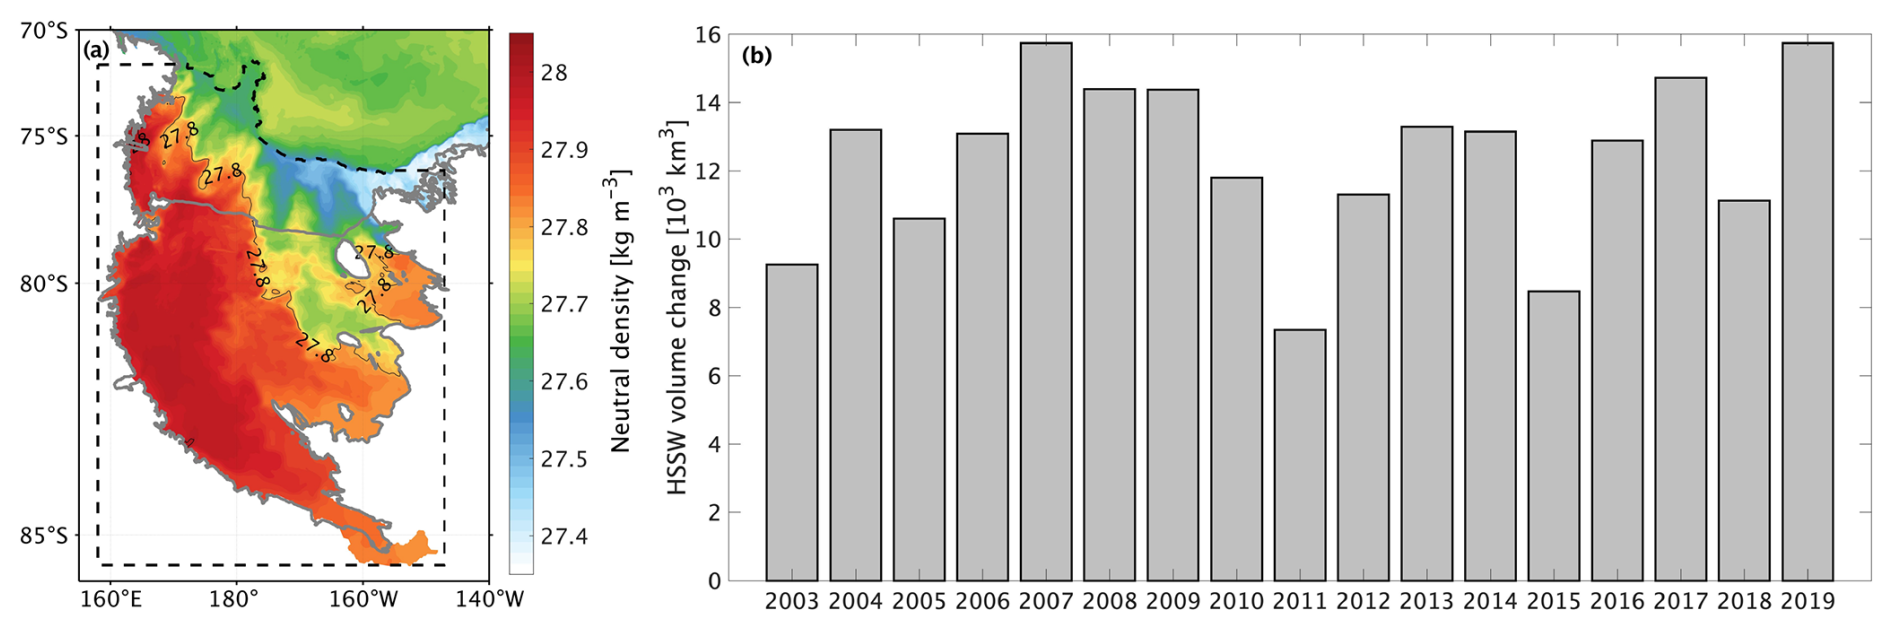
Figure 6(a) Spatial distribution of depth-averaged neutral density (colored shading) in the Ross Sea and Ross Ice Shelf cavity. The solid gray line indicates the neutral density contour of 27.8 kg m−3. The dashed black line indicates the extent of HSSW calculated for HSSW volume; (b) Time series of HSSW volume change between July and October from 2003 to 2019.
3.3 Ice shelf meltwater fluxes
In addition to HSSW, the hydrographic characteristics of the Ross Sea are influenced by other water masses with different properties, such as CDW from the open ocean and freshwater input resulting from the ice shelf melting. CDW is characterized by relatively high salinity and temperature (Yabuki et al., 2006; Liu et al., 2017; Morrison et al., 2020; Chen et al., 2023). The strength of CDW intrusion in 2007 did not show significant anomalies compared with other years (not shown), suggesting that while CDW may exert some influence, it is not the dominant factor. Furthermore, previous studies have suggested that changes in the transport of CDW onto the continental shelf contribute less to the trends and variability of shelf water salinity in the Ross Sea (Castagno et al., 2017). This implies that ice shelf meltwater is the most direct contributor to the anomalously low salinity signal observed in 2007. In this study, meltwater is defined as a water mass with salinity lower than 34.54, as determined by using numerical dyes to track its distribution and then calculating the mean wintertime salinity over multiple years. Therefore, the winter-averaged ice shelf meltwater volume in the Ross Sea was calculated, identifying a peak in 2007, with a volume of approximately 53 000 km3 (Fig. 7a). This fact indicates that the anomalously low salinity signal in 2007 (Fig. 5e) was associated with an increase in ice shelf meltwater during that year. The ice shelf meltwater in the Ross Sea primarily originates from two sources: meltwater from the Amundsen Sea ice shelves and the Ross Ice Shelf itself, with the former mainly transported to the Ross Sea by the Antarctic slope and coastal currents (Dinniman et al., 2016; Kusahara and Hasumi, 2013, 2014; Nakayama et al., 2014, 2020; Xie et al., 2024). The annual cumulative melt rates of both the Ross and Amundsen Sea ice shelves were quantified (Fig. 7b), and it was found that the total ice shelf melting intensified, beginning in 2006, and remained elevated throughout 2007 (blue bars in Fig. 7b). This considerable increase in meltwater resulted in a large release of fresh ice shelf meltwater, with the cumulative melt rate in 2007 reaching the highest value observed in recent decades (blue bars in Fig. 7b). Furthermore, a comparison of the melt rates of the Ross Ice Shelf and the Amundsen Sea ice shelves indicates that the magnitude of melting of the latter is significantly greater than that of the former (Fig. 7b), as is consistent with the findings of previous studies (Rignot et al., 2013). These results indicate that the anomalously low salinity observed in the western Ross Sea in 2007 is associated with an increased influx of meltwater, driven by enhanced melting of ice shelves in the Amundsen Sea.
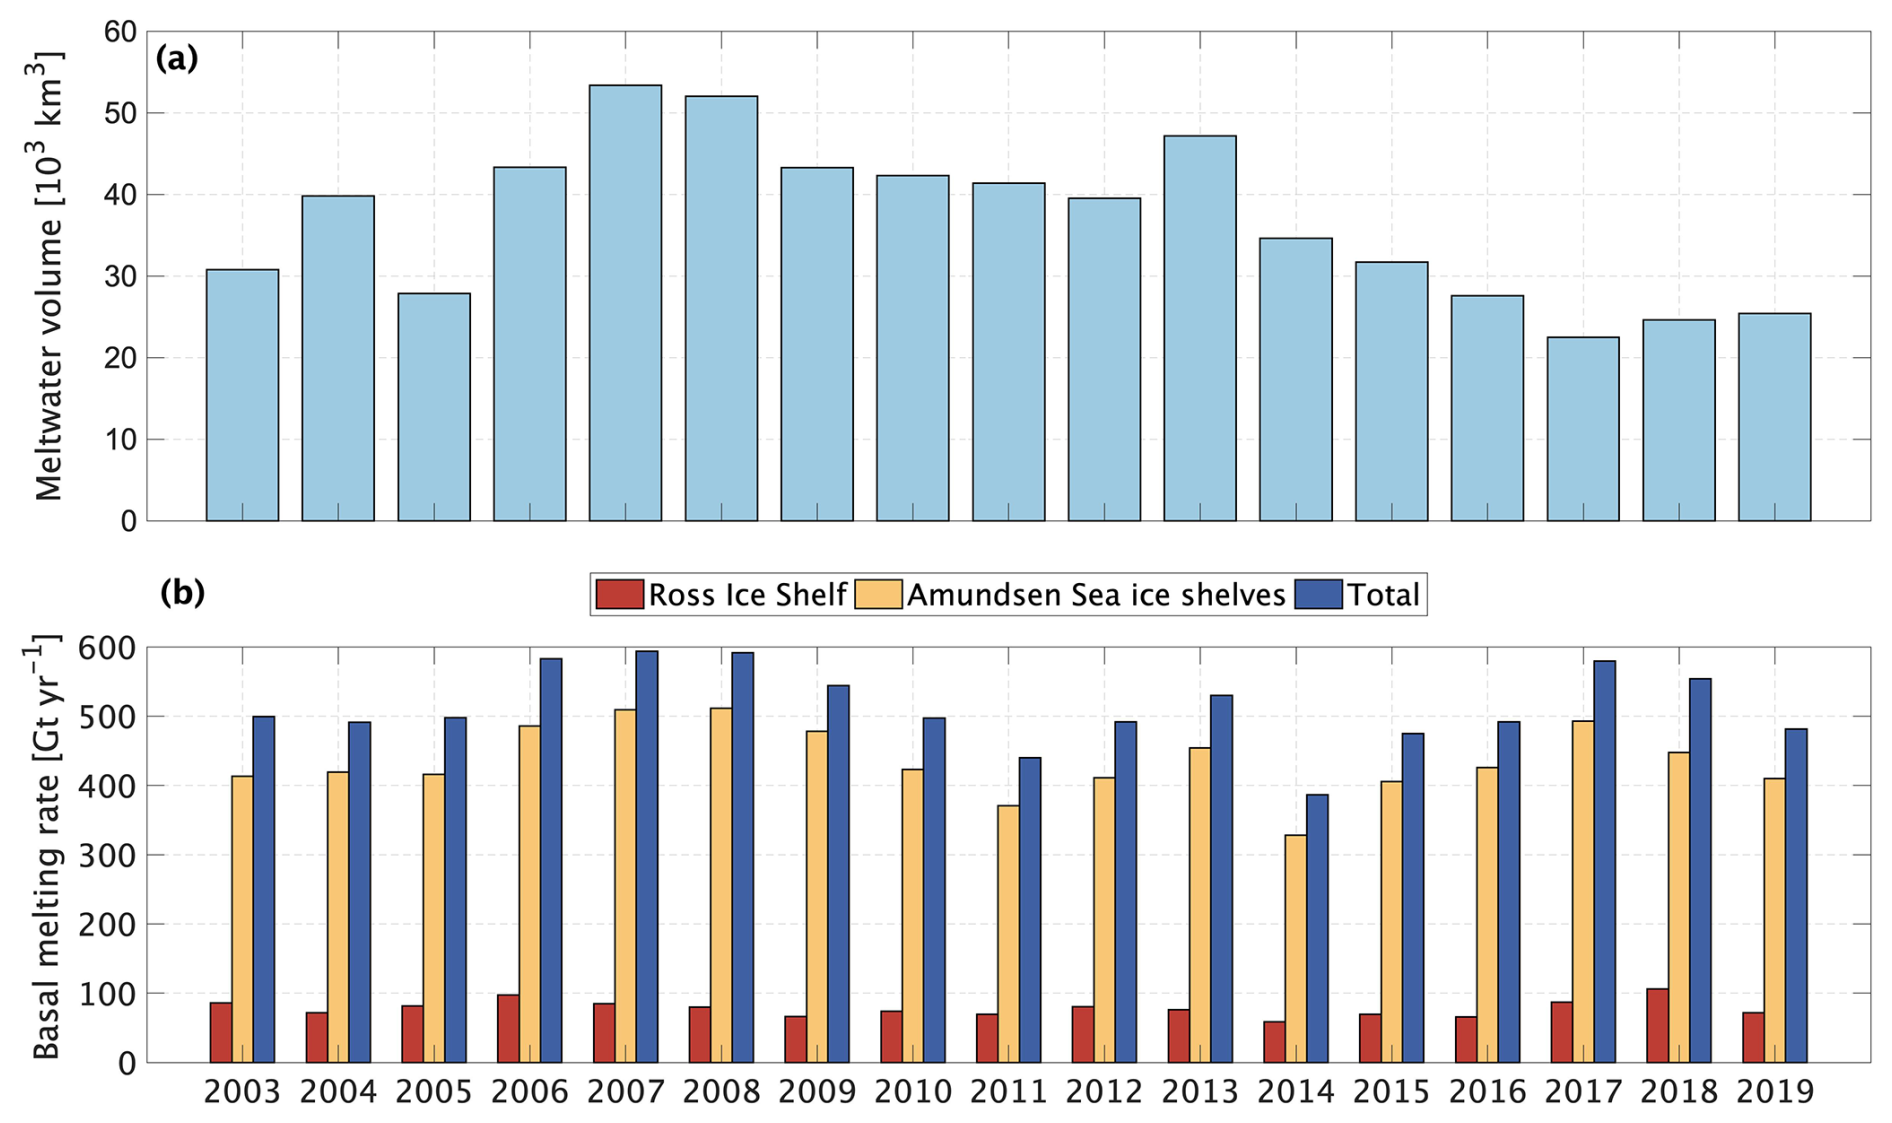
Figure 7Time series of (a) winter-averaged ice shelf meltwater volume in the Ross Sea and (b) annual cumulative basal melting rate of the Ross Ice Shelf, the Amundsen Sea ice shelves, and their combined total from 2003 to 2019.
To further demonstrate the impact of Amundsen Sea ice shelf meltwater on the hydrographic properties of the Ross Sea, a meridional transect along the boundary between the Ross Sea and the Amundsen Sea was selected (red line in Fig. 1b). The seasonal mean freshwater fluxes across this transect for all four seasons (austral summer, autumn, winter, and spring) from 2003 to 2019 were calculated (Fig. 8). The time series of seasonal mean freshwater flux during winter (June–August, red line in Fig. 8) demonstrates that the absolute value of freshwater flux peaked in 2007, reaching approximately −0.058 Sv. This indicates a substantial westward transport of ice shelf meltwater from the Amundsen Sea into the Ross Sea, consistent with the peak ice shelf melt rate observed in 2007 (Fig. 7b). In addition, it is found that the meltwater volume during winter was also highest in 2007, confirming the fact that a significant amount of meltwater accumulated during this year (Fig. 7a). A similarly strong westward freshwater flux was observed during autumn 2007 (March–May, black line in Fig. 8). The summer (December to February) freshwater flux shows the second most negative value in 2007, which was −0.038 Sv (yellow line in Fig. 8), indicating a notable westward transport of meltwater into the Ross Sea in late 2006 and early 2007. Spring (September–November) freshwater flux further shows that a significant westward transport was already present during spring 2006 (blue line in Fig. 8), while in winter 2006 the transport was weak. Furthermore, the correlation analysis between freshwater flux anomalies in autumn (MAM) and summer (DJF) and winter-averaged salinity yielded correlation coefficients of R=0.66 (P=0.004) and R=0.54 (P=0.03), respectively (not shown). These results suggest that the strong westward ice shelf meltwater flux might have begun in late 2006 and continued to intensify into the autumn and winter of 2007. The anomalously low salinity values observed in the western Ross Sea in winter 2007 (Fig. 5e) suggest that the time required for meltwater to be transported from the western Amundsen Sea to the western Ross Sea and significantly impact the local hydrographic properties is approximately 9–12 months. This transport of ice shelf meltwater played a key role in influencing the hydrographic conditions of the western Ross Sea, particularly contributing to the unusually low salinity observed in winter 2007 (Fig. 5e). This emphasizes the importance of understanding how the timing and persistence of ice shelf meltwater fluxes affect the downstream hydrographic properties in the Ross Sea.
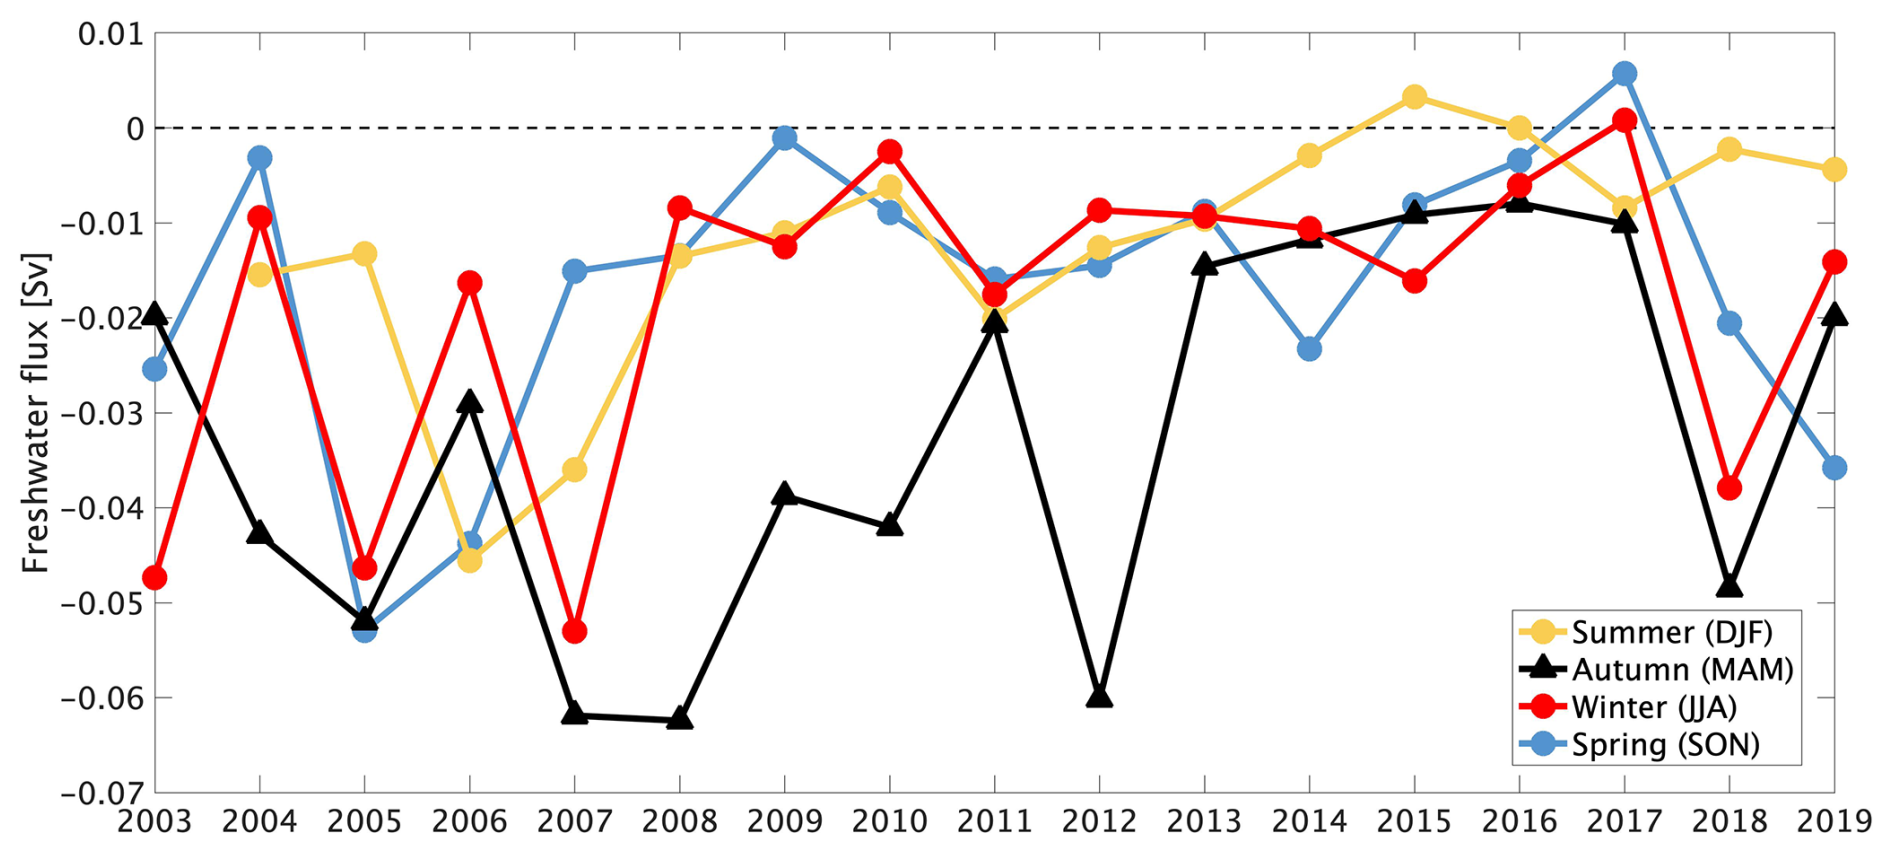
Figure 8Time series of seasonal mean freshwater flux across the defined transect (indicated by the red line in Fig. 1b) from 2003 to 2019 for austral summer (DJF, yellow line), autumn (MAM, black line), winter (JJA, red line), and spring (SON, blue line). Negative values represent westward transport of freshwater from the Amundsen Sea into the Ross Sea.
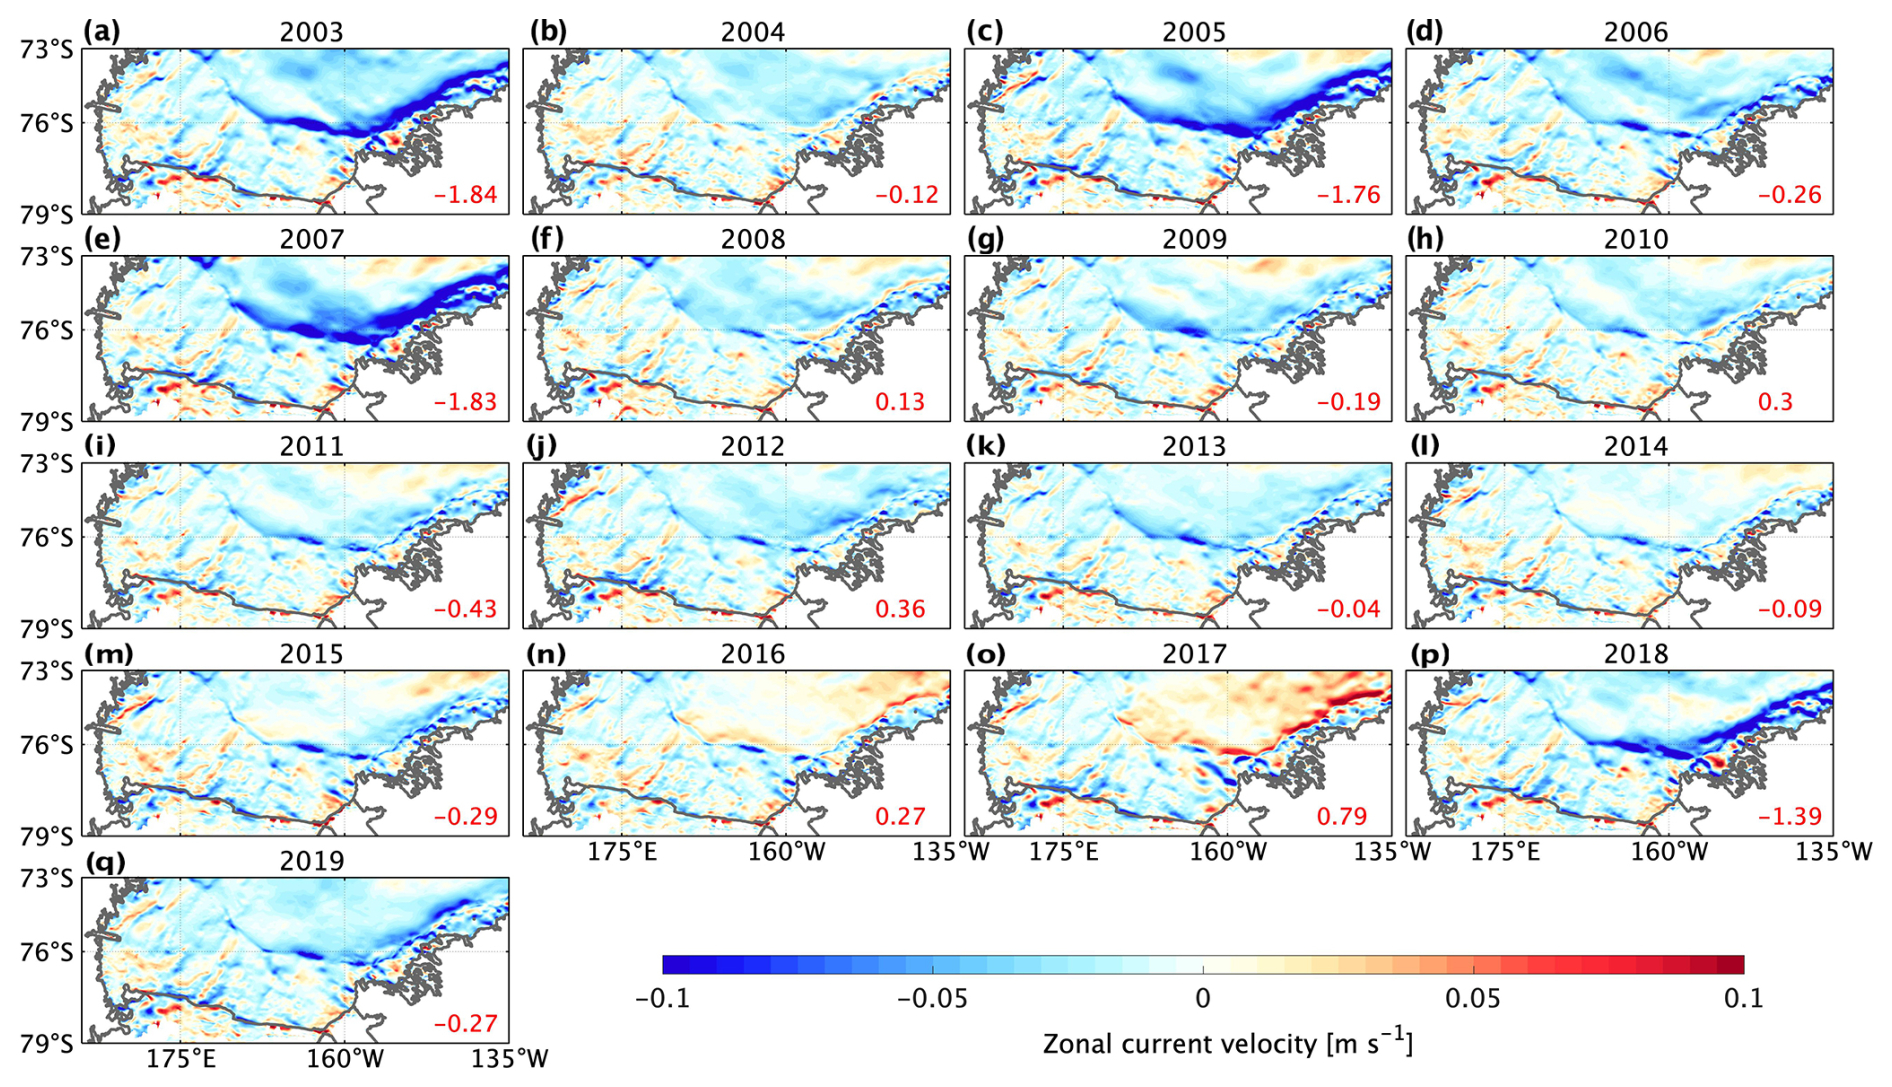
Figure 9(a–q) Spatial distributions of winter-averaged zonal current velocities in the Ross Sea and Amundsen Sea from 2003 to 2019, averaged over the upper 300 m, where the majority of meltwater is located. The red numbers in the lower right corners indicate the volume transport of westward coastal and slope current across the defined transect (shown by the red line in Fig. 1b) and the positive values denote eastward currents.
As described by Eq. (1) in Sect. 2, freshwater flux is influenced not only by the amount of ice shelf meltwater but also by the magnitude of current velocity. To further investigate the cause of the extreme freshwater flux observed in winter 2007 (Fig. 8), we analyzed the spatial distribution of the winter-averaged zonal current velocity in the upper 300 m in the Ross Sea and Amundsen Sea (Fig. 9). The results show that both the Antarctic slope current and the coastal current reached their strongest intensities in 2007 (Fig. 9e), notably in the narrow continental shelf area between the Amundsen and Ross Seas where their locations are challenging to distinguish (Heywood et al., 1985, 2004). In particular, the volume transport of the coastal/slope current across the defined transect reached 1.83 Sv in 2007 (Fig. 9e), indicating a substantial intensification of westward transport during this period. Meanwhile, the westward coastal current along the front of the Ross Ice Shelf remains notably pronounced in 2007, although the signal is not entirely continuous (Fig. 9e), and the westward flow in the Ross Sea region is even more prominent at the surface (not shown). Furthermore, the freshwater flux across the transect exhibited a remarkably strong correlation (R=0.98, P<0.0001) with the zonal current velocity along the transect (not shown). This analysis suggests that the strong freshwater flux from the Amundsen Sea to the Ross Sea in 2007 was a combined result of the highest ice shelf melt rate and the strongest zonal flow velocity (Fig. 9e), resulting in anomalously low salinity in the Ross Sea in that year. Further examination of Fig. 9 indicates that relatively strong current velocities also occurred in 2003 and 2005 (Fig. 9a and c), and Fig. 8 shows correspondingly high freshwater fluxes in austral winter for these years. However, Fig. 7b reveals that the ice shelf melt rates during 2003 and 2005 were not particularly elevated. This suggests that, in these years, the strong zonal current velocities likely played a dominant role in driving the westward freshwater flux, emphasizing the significant influence of current dynamics on freshwater transport. The intensified westward flow is likely driven by background wind anomalies rather than cyclone activity, as evidenced by the coastal easterly wind anomaly in 2007 and the absence of significant cyclone density maxima in the western Amundsen Sea (not shown). This anomaly likely enhanced onshore Ekman transport, deepened the pycnocline near the coast, and strengthened the westward coastal flow (Kim et al., 2016; Dotto et al., 2018). It may also be influenced by other factors, such as sea ice cover, mesoscale eddy activity over the continental slope, and tidal flow variations across the continental shelf break (Stewart et al., 2019).
The variability and trends in the formation of HSSW and the hydrographic characteristics in the Ross Sea are influenced by large-scale climate modes or systems, including the Southern Annular Mode (SAM) and the Amundsen Sea Low (ASL) (Silvano et al., 2020; Zhang et al., 2024). They can modulate local wind fields over the Ross Sea and Amundsen Sea, thereby affecting sea ice production in polynyas and the transport of freshwater from the Amundsen Sea to the Ross Sea. These processes ultimately affect the formation of HSSW, the hydrographic characteristics of the Ross Sea, and, subsequently, the stability of the meridional overturning circulation.
Projections from multiple Coupled Model Intercomparison Project Phase 5 (CMIP5) models under the RCP8.5 scenario indicate that SAM is likely to continue shifting toward its positive phase by the end of this century (Zheng et al., 2013); this can strengthen the westerly jet and shift its core poleward, leading to a weakening of polar easterlies (Sen Gupta and England, 2006; Zhang et al., 2018). This weakening suppresses the westward transport of freshwater and sea ice from the Amundsen Sea, driven by the Antarctic coastal current (Kim et al., 2016; Dotto et al., 2018; Silvano et al., 2020). Simultaneously, the weakening of polar easterlies can enhance offshore winds in the TNBP region and reduce surface air temperature over the RISP, increasing sea ice production and promoting greater HSSW/AABW production (Zhang et al., 2024). The processes mentioned above can interact synergistically to enhance the HSSW formation in the future. In addition, previous research indicates that the positive phase of SAM is associated with a significant increase of cyclones near the Antarctic coast (Uotila et al., 2013; Grieger et al., 2018). Enhanced cyclonic activities will strengthen offshore winds over the western RISP, enlarging the polynya and promoting SIP (Wenta and Cassano, 2020; Wang et al., 2023b). This further facilitates the HSSW formation and increases salinity in the Ross Sea. Therefore, by affecting both sea ice production in the Ross Sea polynyas and the freshwater transport from the Amundsen Sea, the future change of SAM is expected to drive a long-term increase in HSSW production and salinity in the Ross Sea.
Future projections based on CMIP5 and CMIP6 models indicate that, under high-emission scenarios, the ASL will be deepened and shift poleward in different seasons (Hosking et al., 2016; Gao et al., 2021). A deepened and southeastward-located ASL may enhance offshore winds over the RISP, resulting in an increase in polynya extent (Wang et al., 2022b) and ice production rate, ultimately promoting subsequent HSSW production. Meanwhile, the deepening of the ASL and its associated southwestward extension of low pressure may drive eastward coastal current anomalies, reducing meltwater transport from the Amundsen Sea into the Ross Sea and further facilitating HSSW formation (Guo et al., 2021). Variations in ASL intensity itself can also influence local wind patterns, thereby affecting sea ice import and subsequent sea ice formation (Silvano et al., 2020; Wang et al., 2023a). For instance, a weakened ASL could generate anticyclonic anomalies in the Amundsen Sea and coastal westerly anomalies, suppressing sea ice import and thereby increasing local ice production in the Ross Sea (Silvano et al., 2020). Conversely, a deepened ASL might enhance southerly winds, accelerating sea ice export to the open ocean (Wang et al., 2023a) and subsequently enhancing ice production. These contrasting mechanisms highlight the complex influence of ASL intensity and positional shifts on HSSW formation and salinity variability, underscoring the need for case-specific analyses that account for diverse ASL configurations. Moreover, accurate projections of future HSSW and AABW formation trends require a comprehensive assessment of the combined effects of the SAM, ASL, and local wind field interactions. Understanding these complex interactions is crucial for reducing uncertainties in predicting Antarctic shelf processes under future climate change scenarios.
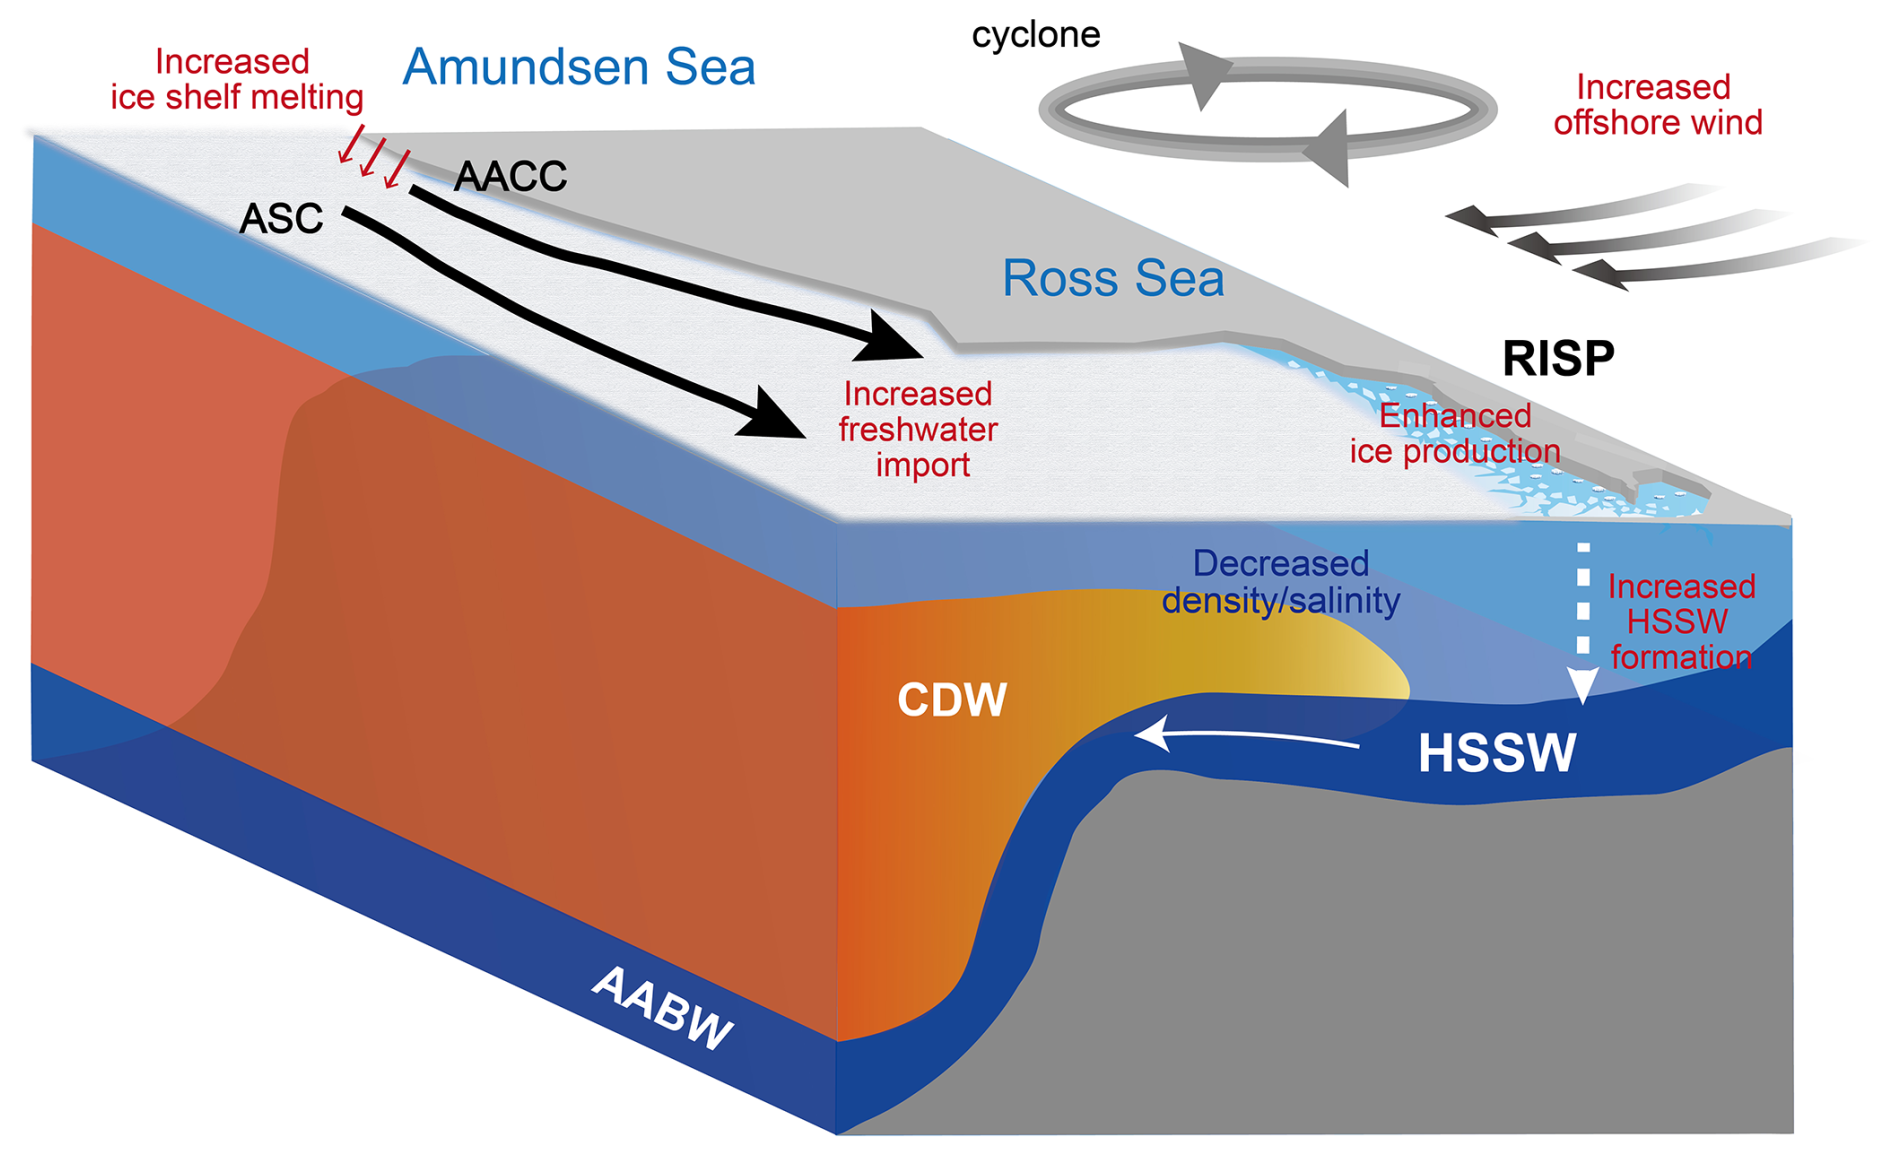
Figure 10Schematic illustrating the atmospheric drivers of high-salinity shelf water (HSSW) production in the Ross Sea and the combined effects of HSSW production and freshwater transport from the Amundsen Sea on the Ross Sea hydrographic fields. RISP represents the Ross Ice Shelf Polynya. CDW denotes the Circumpolar Deep Water and AABW indicates the Antarctic Bottom Water. AACC represents the Antarctic coastal current and ASC refers to the Antarctic slope current.
Beyond the influence of large-scale climate modes on Ross Sea HSSW/AABW formation and hydrographic characteristics, the long-term trends in Antarctic sea ice extent may also play a critical role in shaping regional water mass transformation. Recent studies highlight that Antarctic sea ice has undergone an unprecedented decline since 2016, reaching record-low winter extents in 2023 (Wang et al., 2022a; Liu et al., 2023; Purich and Doddridge, 2023; Josey et al., 2024). These dramatic changes in sea ice can substantially alter surface heat loss and thus water mass formation and cyclone systems. Josey et al. (2024) found that regions experiencing the most severe sea ice retreat provide an important new source of turbulent ocean heat loss to the atmosphere during winter. The increased oceanic heat loss enhances the formation of a denser class of Antarctic Surface Water (ASW), driven by surface buoyancy fluxes. Although this modified ASW originates away from the primary dense water formation sites on the continental shelf, its mixing with CDW may substantially alter CDW properties, thereby influencing the characteristics and production of AABW. The increased oceanic heat loss may also intensify cyclone activity, which in turn affects the local sea ice production and water mass transformation by modifying wind fields. Additionally, the severity of sea ice decline contributes to ongoing ocean warming (Naughten et al., 2023; Prend et al., 2024), enhancing ice shelf melting, and increasing freshwater input into the ocean. This freshwater flux can further impact AABW formation and alter regional hydrographic properties. Overall, large-scale sea ice trends exert a regulatory influence on small-scale hydrological processes and AABW formation by shaping oceanic stratification, circulation, and surface heat exchange.
This study examines the mechanisms and impacts of HSSW formation in the Ross Sea, focusing on the anomalous event in 2007. Increased cyclonic activities over the Ross Ice Shelf in 2007 enhanced offshore winds over the west of the Ross Ice Shelf Polynya, leading to record-high sea ice production and HSSW formation. However, salinity and density in the Ross Sea exhibited anomalously low values in that year. The inconsistency between HSSW formation and salinity field was primarily driven by a significant influx of ice shelf meltwater from the Amundsen Sea, contributed by both large ice shelf melting rate and strong westward slope and coastal currents (Fig. 10). Analysis of seasonal freshwater fluxes revealed that the strong westward transport of meltwater began in spring 2006, persisted through the summer between 2006 and 2007, and intensified into the autumn and winter of 2007. The time required for ice shelf meltwater to travel from the western Amundsen Sea to the western Ross Sea and significantly alter local hydrographic properties is approximately 9–12 months when the Antarctic slope and coastal currents are relatively stronger. The peak freshwater flux during winter 2007, driven by increased ice shelf melting rates and strong zonal current velocities, could play the most critical role in the unusually low salinity in the Ross Sea in winter 2007. These findings highlight the role of synoptic atmospheric events on the accumulative HSSW formation in winter, which can potentially make significant contributions to AABW production in the open ocean. The impacts on AABW are not analyzed in this work but warrant further investigation in the future. The results also highlight the complex interplay between sea ice production, meltwater fluxes, and ocean currents in shaping regional hydrographic characteristics in the Ross Sea, as well as the importance of understanding the timing and persistence of freshwater fluxes and their downstream impacts on hydrographic properties in the Ross Sea.
The model data that support the findings of this study are available at https://zenodo.org/records/15694437 (Wang, 2025). More details about other observed and reanalysis data are presented in Sect. 2.
ZZ and XW formulated the original ideas presented in this manuscript. XW conducted the model results analysis. XW and ZZ wrote the original manuscript draft. CX, XZ, CW, HH, and YC participated in the result interpretation, manuscript preparation, and improvement. CX and HH conducted the 5 d-average model simulations. CX, HH, CW, and YC contributed to the model development. All authors contributed to the article and approved the submitted version.
The contact author has declared that none of the authors has any competing interests.
Publisher's note: Copernicus Publications remains neutral with regard to jurisdictional claims made in the text, published maps, institutional affiliations, or any other geographical representation in this paper. While Copernicus Publications makes every effort to include appropriate place names, the final responsibility lies with the authors.
We thank the three anonymous reviewers for their efforts in reviewing and improving this paper. The authors appreciate the support of the Shanghai Frontiers Science Center of Polar Science (SCOPS) and the Shanghai Key Laboratory of Polar Life and Environment Sciences.
This research has been supported by the National Natural Science Foundation of China (grant nos. 42406259, 42476271, 41941008, and 42476257), the Shanghai Pilot Program for Basic Research of Shanghai Jiao Tong University (grant no. 21TQ1400201), the Impact and Response of Antarctic Seas to Climate Change (grant no. IRASCC 1-02-01B), the Shenlan Program funded by Shanghai Jiao Tong University (grant no. SL2020MS021), and the Science Foundation for Youths of Hunan Province (Category C) (grant no. 025JJ60240).
This paper was edited by Bin Cheng and reviewed by three anonymous referees.
Arrigo, K. R., van Dijken, G., and Long, M.: Coastal Southern Ocean: A strong anthropogenic CO2 sink, Geophys. Res. Lett., 35, L21602, https://doi.org/10.1029/2008GL035624, 2008.
Assmann, K., Hellmer, H. H., and Beckmann, A.: Seasonal variation in circulation and water mass distribution on the Ross Sea continental shelf, Antarct. Sci., 15, 3–11, https://doi.org/10.1017/S0954102003001007, 2003.
Bromwich, D. H., Liu, Z., Rogers, A. N., and Van Woert, M. L.: Winter atmospheric forcing of the Ross Sea Polynya, in: Ocean, Ice and Atmosphere: Interactions at the Antarctic Continental Margin, edited by: Jacobs, S. S. and Weiss, R. F., AGU, Washington, DC, 75, 101–133, https://doi.org/10.1029/AR075p0101, 1998.
Budgell, W. P.: Numerical simulation of ice-ocean variability in the Barents Sea region, Ocean Dynam., 55, 370–387, https://doi.org/10.1007/s10236-005-0008-3, 2005.
Budillon, G., Pacciaroni, M., Cozzi, S., Rivaro, P., Catalano, G., Ianni, C., and Cantoni, C.: An optimum multiparameter mixing analysis of the shelf waters in the Ross Sea, Antarct. Sci., 15, 105–118, https://doi.org/10.1017/S095410200300110X, 2003.
Brown, W. S. and Irish, J. D.: The annual variation of water mass structure in the Gulf of Maine: 1986–1987, J. Mar. Res., 51, 53–107, https://doi.org/10.1357/0022240933223828, 1993.
Castagno, P., Falco, P., Dinniman, M. S., Spezie, G., and Budillon, G.: Temporal variability of the Circumpolar Deep Water inflow onto the Ross Sea continental shelf, J. Mar. Syst., 166, 37–49, https://doi.org/10.1016/j.jmarsys.2016.07.007, 2017.
Castagno, P., Capozzi, V., DiTullio, G. R., Falco, P., Fusco, G., Rintoul, S. R., Spezie, G., and Budillon, G.: Rebound of shelf water salinity in the Ross Sea, Nat. Commun., 10, 5441, https://doi.org/10.1038/s41467-019-13083-8, 2019.
Chen, Y., Zhang, Z., Wang, X., Liu, X., and Zhou, M.: Interannual variations of heat budget in the lower layer of the eastern Ross Sea shelf and the forcing mechanisms in the Southern Ocean State Estimate, Int. J. Climatol., 43, 5055–5076, https://doi.org/10.1002/joc.8132, 2023.
Cheng, Z., Pang, X., Zhao, X., and Stein, A.: Heat flux sources analysis to the Ross Ice Shelf Polynya ice production time series and the impact of wind forcing, Remote Sens., 11, 188, https://doi.org/10.3390/rs11020188, 2019.
Comiso, J. C. and Gordon, A. L.: Interannual variability in summer sea ice minimum, coastal polynyas, and bottom water formation in the Weddell Sea, in: Antarctic Sea Ice: Physical Processes, Interactions, and Variability, edited by: Jeffries, M., AGU, Washington, DC, 74, 293–315, https://doi.org/10.1029/AR074p029, 1998.
Dale, E. R., McDonald, A. J., Coggins, J. H. J., and Rack, W.: Atmospheric forcing of sea ice anomalies in the Ross Sea polynya region, The Cryosphere, 11, 267–280, https://doi.org/10.5194/tc-11-267-2017, 2017.
Ding, Y., Cheng, X., Li, X., Shokr, M., Yuan, J., Yang, Q., and Hui, F.: Specific relationship between the surface air temperature and the area of the Terra Nova Bay Polynya, Antarctica, Adv. Atmos. Sci., 37, 532–544, https://doi.org/10.1007/s00376-020-9146-2, 2020.
Dinniman, M. S., Klinck, J. M., and Smith, W. O.: A model study of Circumpolar Deep Water on the West Antarctic Peninsula and Ross Sea continental shelves, Deep-Sea Res. Pt. II, 58, 1508–1523, https://doi.org/10.1016/j.dsr2.2010.11.013, 2011.
Dinniman, M. S., Klinck, J. M., Bai, L. S., Bromwich, D. H., Hines, K. M., and Holland, D. M.: The effect of atmospheric forcing resolution on delivery of ocean heat to the Antarctic floating ice shelves, J. Climate, 28, 6067–6085, https://doi.org/10.1175/JCLI-D-14-00374.1, 2015.
Dinniman, M. S., Asay-Davis, X. S., Galton-Fenzi, B. K., Holland, P. R., Jenkins, A., and Timmermann, R.: Modeling ice shelf/ocean interaction in Antarctica: A review, Oceanography, 29, 144–153, https://doi.org/10.5670/oceanog.2016.106, 2016.
Dotto, T. S., Garabato, A. N., Bacon, S., Tsamados, M., Holland, P. R., Hooley, J., Frajka-Williams, E., Ridout, A., and Meredith, M. P.: Variability of the Ross Gyre, Southern Ocean: Drivers and Responses Revealed by Satellite Altimetry, Geophys. Res. Lett., 45, 6195–6204, https://doi.org/10.1029/2018GL078607, 2018.
Egbert, G. D. and Erofeeva, S. Y.: Efficient inverse modeling of barotropic ocean tides, J. Atmos. Ocean. Tech., 19, 183–204, https://doi.org/10.1175/1520-0426(2002)019<0183:EIMOBO>2.0.CO;2, 2002.
Fairall, C. W., Bradley, E. F., Hare, J. E., Grachev, A. A., and Edson, J. B.: Bulk Parameterization of Air–Sea Fluxes: Updates and Verification for the COARE Algorithm, J. Climate, 16, 571–591, https://doi.org/10.1175/1520-0442(2003)016<0571:BPOASF>2.0.CO;2, 2003.
Gao, M., Kim, S. J., Yang, J., Liu, J., Jiang, T., Su, B., Wang, Y., and Huang, J.: Historical fidelity and future change of Amundsen Sea Low under 1.5 °C–4 °C global warming in CMIP6, Atmos. Res., 255, 105533, https://doi.org/10.1016/j.atmosres.2021.105533, 2021.
Gordon, A. L., Orsi, A. H., Muench, R., Huber, B. A., Zambianchi, E., and Visbeck, M.: Western Ross Sea continental slope gravity currents, Deep-Sea Res. Pt. II, 56, 796–817, https://doi.org/10.1016/j.dsr2.2008.10.015, 2009.
Grieger, J., Leckebusch, G. C., Raible, C. C., Rudeva, I., and Simmonds, I.: Subantarctic cyclones identified by 14 tracking methods, and their role for moisture transports into the continent, Tellus A, 70, 1–18, https://doi.org/10.1080/16000870.2018.1454808, 2018.
Gruber, N., Landschützer, P., and Lovenduski, N. S.: The variable Southern Ocean carbon sink, Annu. Rev. Mar. Sci., 11, 1–28, https://doi.org/10.1146/annurev-marine-121916-063407, 2019.
Guo, G., Gao, L., and Shi, J.: Modulation of dense shelf water salinity variability in the western Ross Sea associated with the Amundsen Sea Low, Environ. Res. Lett., 16, 014004, https://doi.org/10.1088/1748-9326/abc995, 2021.
Häkkinen, S. and Mellor, G. L.: Modeling the seasonal variability of a coupled Arctic ice-ocean system, J. Geophys. Res., 97, 20285–20304, https://doi.org/10.1029/92JC02037, 1992.
Hallberg, R.: Using a resolution function to regulate parameterizations of oceanic mesoscale eddy effects, Ocean Modell., 72, 92–103, https://doi.org/10.1016/j.ocemod.2013.08.007, 2013.
Hersbach, H., Bell, B., Berrisford, P., Hirahara, S., Horányi, A., Muñoz‐Sabater, J., Nicolas, J., Peubey, C., Radu, R., Schepers, D., Simmons, A., Soci, C., Abdalla, S., Abellan, X., Balsamo, G., Bechtold, P., Biavati, G., Bidlot, J., Bonavita, M., De Chiara, G., Dahlgren, P., Dee, D., Diamantakis, M., Dragani, R., Flemming, J., Forbes, R., Fuentes, M., Geer, A., Haimberger, L., Healy, S., Hogan, R. J., Hólm, E., Janisková, M., Keeley, S., Laloyaux, P., Lopez, P., Lupu, C., Radnoti, G., De Rosnay, P., Rozum, I., Vamborg, F., Villaume, S., and Thépaut, J.: The ERA5 global reanalysis, Q. J. R. Meteor. Soc., 146, 1999–2049, https://doi.org/10.1002/qj.3803, 2020.
Heywood, K. J., Locarnini, R. A., Frew, R. D., Dennis, P. F., and King, B. A.: Transport and water masses of the Antarctic slope front system in the eastern Weddell Sea, in: Ocean, Ice, and Atmosphere: Interactions at the Antarctic Continental Margin, AGU Antarctic Research Series, edited by: Jacobs, S. S. and Weiss, R. F., 75, 203–220, https://doi.org/10.1029/AR075p0203, 1985.
Heywood, K. J., Naveira Garabato, A. C., Stevens, D. P., and Muench, R. D.: On the fate of the Antarctic slope front and the origin of the Weddell front, J. Geophys. Res.-Oceans, 109, 2003JC002053, https://doi.org/10.1029/2003JC002053, 2004.
Holland, D. M. and Jenkins, A.: Modeling Thermodynamic Ice–Ocean Interactions at the Base of an Ice Shelf, J. Phys. Oceanogr., 29, 1787–1800, https://doi.org/10.1175/1520-0485(1999)029<1787:MTIOIA>2.0.CO;2, 1999.
Hosking, J. S., Orr, A., Bracegirdle, T. J., and Turner, J.: Future circulation changes off West Antarctica: Sensitivity of the Amundsen Sea Low to projected anthropogenic forcing, Geophys. Res. Lett., 43, 367–376, https://doi.org/10.1002/2015GL067143, 2016.
Hunke, E. C.: Viscous-Plastic Sea Ice Dynamics with the EVP Model: Linearization Issues, J. Comput. Phys., 170, 18–38, https://doi.org/10.1006/jcph.2001.6710, 2001.
Hunke, E. C. and Dukowicz, J. K.: An Elastic–Viscous–Plastic Model for Sea Ice Dynamics, J. Phys. Oceanogr., 27, 1849–1867, https://doi.org/10.1175/1520-0485(1997)027<1849:AEVPMF>2.0.CO;2, 1997.
Jacobs, S., Giulivi, C., and Dutrieux, P.: Persistent Ross Sea freshening from imbalance West Antarctic ice shelf melting, J. Geophys. Res.-Oceans, 127, e2021JC017808, https://doi.org/10.1029/2021JC017808, 2022.
Jendersie, S., Williams, M. J. M., Langhorne, P. J., and Robertson, R.: The Density-Driven Winter Intensification of the Ross Sea Circulation, J. Geophys. Res.-Oceans, 123, 7702–7724, https://doi.org/10.1029/2018JC013965, 2018.
Josey, S. A., Meijers, A. J. S., Blaker, A. T., Grist, J. P., Mecking, J., and Ayres, H. C.: Record-low Antarctic sea ice in 2023 increased ocean heat loss and storms, Nat., 636, 635–639, https://doi.org/10.1038/s41586-024-08368-y, 2024.
Kim, C. S., Kim, T. W., Cho, K. H., Ha, H. K., Lee, S. H., Kim, H. C., and Lee, J. H.: Variability of the Antarctic Coastal Current in the Amundsen Sea, Estuar. Coast. Shelf Sci., 181, 123–133, https://doi.org/10.1016/j.ecss.2016.08.004, 2016.
Kusahara, K. and Hasumi, H.: Modeling Antarctic ice shelf responses to future climate changes and impacts on the ocean, J. Geophys. Res.-Oceans, 118, 2454–2475, https://doi.org/10.1002/jgrc.20166, 2013.
Kusahara, K. and Hasumi, H.: Pathways of basal meltwater from Antarctic ice shelves: A model study, J. Geophys. Res.-Oceans, 119, 5690–5704, https://doi.org/10.1002/2014jc009915, 2014.
Large, W. G., McWilliams, J. C., and Doney, S. C.: Oceanic vertical mixing: A review and a model with nonlocal boundary layer parameterization, Rev. Geophys., 32, 363–403, https://doi.org/10.1029/94RG01872, 1994.
Li, Q., England, M. H., Hogg, A. M., Rintoul, S. R., and Morrison, A. K.: Abyssal ocean overturning slowdown and warming driven by Antarctic meltwater, Nature, 615, 841–847, https://doi.org/10.1038/s41586-023-05762-w, 2023.
Li, X., Cai, W., Meehl, G., Chen, D., Yuan, X., Raphael, M., Holland, D., Ding, Q., Fogt, R., Markle, B., Wang, G., Bromwich, D., Turner, J., Xie, S.-P., Steig, E., Gille, S., Xiao, C., Wu, B., Lazzara, M., and Song, C.: Tropical teleconnection impacts on Antarctic climate changes, Nat. Rev. Earth Environ., 2, 680–698, https://doi.org/10.1038/s43017-021-00204-5, 2021.
Liu, C., Wang, Z., Cheng, C., Xia, R., Li, B., and Xie, Z.: Modeling modified Circumpolar Deep Water intrusions onto the Prydz Bay continental shelf, East Antarctica, J. Geophys. Res.-Oceans, 122, 5198–5217, https://doi.org/10.1002/2016JC012336, 2017.
Liu, J., Zhu, Z., and Chen, D.: Lowest Antarctic Sea Ice Record Broken for the Second Year in a Row, Ocean-Land-Atmos. Res., 2, 0007, https://doi.org/10.34133/olar.0007, 2023.
MacLachlan, C., Arribas, A., Peterson, K. A., Maidens, A., Fereday, D., Scaife, A. A., Gordon, M., Vellinga, M., Williams, A., Comer, R. E., Camp, J., Xavier, P., and Madec, G.: Global Seasonal forecast system version 5 (GloSea5): A high-resolution seasonal forecast system, Q. J. Roy. Meteor. Soc., 141, 1072–1084, https://doi.org/10.1002/qj.2396, 2015.
Massom, R. A., Harris, P. T., Michael, K. J., and Potter, M. J.: The distribution and formative processes of latent-heat polynyas in East Antarctica, Ann. Glaciol., 27, 420–426, https://doi.org/10.3189/1998AoG27-1-420-426, 1998.
Mathiot, P., Barnier, B., Gallée, H., Molines, J. M., Sommer, J. L., Juza, M., and Penduff, T.: Introducing katabatic winds in global ERA40 fields to simulate their impacts on the Southern Ocean and sea-ice, Ocean Modell., 35, 146–160, https://doi.org/10.1016/j.ocemod.2010.07.001, 2010.
Mathiot, P., Jourdain, N. C., Barnier, B., Gallée, H., Molines, J. M., Le Sommer, J., and Penduff, T.: Sensitivity of coastal polynyas and high-salinity shelf water production in the Ross Sea, Antarctica, to the atmospheric forcing, Ocean Dynam., 62, 701–723, https://doi.org/10.1007/s10236-012-0531-y, 2012.
Mellor, G. L. and Kantha, L.: An ice-ocean coupled model, J. Geophys. Res.-Oceans, 94, 10937–10954, https://doi.org/10.1029/JC094iC08p10937, 1989.
Meredith, M. P.: Replenishing the abyss, Nat. Geosci., 6, 166–167, https://doi.org/10.1038/ngeo1727, 2013.
Morales Maqueda, M. A., Willmott, A. J., and Biggs, N. R. T.: Polynya dynamics: A review of observations and modeling, Rev. Geophys., 42, RG1004, https://doi.org/10.1029/2002RG000116, 2004.
Morlighem, M., Rignot, E., Binder, T., Blankenship, D., Drews, R., Eagles, G., Eisen, O., Ferraccioli, F., Forsberg, R., Fretwell, P., Goel, V., Greenbaum, J. S., Gudmundsson, H., Guo, J., Helm, V., Hofstede, C., Howat, I., Humbert, A., Jokat, W., Karlsson, N. B., Lee, W. S., Matsuoka, K., Millan, R., Mouginot, J., Paden, J., Pattyn, F., Roberts, J., Rosier, S., Ruppel, A., Seroussi, H., Smith, E. C., Steinhage, D., Sun, B., Broeke, M. R. V. D., Ommen, T. D. V., Wessem, M. V., and Young, D. A.: Deep glacial troughs and stabilizing ridges unveiled beneath the margins of the Antarctic ice sheet, Nat. Geosci., 13, 132–137, https://doi.org/10.1038/s41561-019-0510-8, 2020.
Morrison, A. K., Hogg, A. M., England, M. H., and Spence, P.: Warm Circumpolar Deep Water transport toward Antarctica driven by local dense water export in canyons, Sci. Adv., 6, eaav2516, https://doi.org/10.1126/sciadv.aav2516, 2020.
Murakami, K., Nomura, D., Hashida, G., Nakaoka, S., Kitade, Y., Hirano, D., Hirawake, T., and Oshima, K. I.: Strong biological carbon uptake and carbonate chemistry associated with dense shelf water outflows in the Cape Darnley polynya, East Antarctica, Mar. Chem., 225, 103842, https://doi.org/10.1016/j.marchem.2020.103842, 2020.
Murray, R. J. and Simmonds, I.: A numerical scheme for tracking cyclone centres from digital data. Part I: development and operation of the scheme, Aust. Meteorol. Mag., 39, 155–166, 1991.
Nakata, K., Ohshima, K. I., and Nihashi, S.: Mapping of Active Frazil for Antarctic Coastal Polynyas, With an Estimation of Sea-Ice Production, Geophys. Res. Lett., 48, e2020GL091353, https://doi.org/10.1029/2020GL091353, 2021.
Nakayama, Y., Timmermann, R., Rodehacke, C. B., Schröder, M., and Hellmer, H. H.: Modeling the spreading of glacial meltwater from the Amundsen and Bellingshausen Seas, Geophys. Res. Lett., 41, 7942–7949, https://doi.org/10.1002/2014GL061600, 2014.
Nakayama, Y., Timmermann, R., and Hellmer, H. H.: Impact of West Antarctic ice shelf melting on Southern Ocean hydrography, The Cryosphere, 14, 2205–2216, https://doi.org/10.5194/tc-14-2205-2020, 2020.
Naughten, K. A., Holland, P. R., and De Rydt, J.: Unavoidable future increase in west Antarctic ice-shelf melting over the twenty-first century, Nat. Clim. Chang., 13, 1222–1228, https://doi.org/10.1038/s41558-023-01818-x, 2023.
Ohshima, K. I., Fukamachi, Y., Williams, G. D., Nihashi, S., Roquet, F., Kitade, Y., Tamura, T., Hirano, D., Herraiz-Borreguero, L., Field, I., Hindell, M., Aoki, S., and Wakatsuchi, M.: Antarctic bottom water production by intense sea-ice formation in the Cape Darnley polynya, Nat. Geosci., 6, 235–240, https://doi.org/10.1038/ngeo1738, 2013.
Orsi, A. H. and Wiederwohl, C. L.: A recount of Ross Sea water, Deep-Sea Res. Pt. II, 56, 778–795, https://doi.org/10.1016/j.dsr2.2008.10.033, 2009.
Prend, C. J., MacGilchrist, G. A., Manucharyan, G. E., Pang, R. Q., Moorman, R., Thompson, A. F., Griffies, S. M., Mazloff, M. R., Talley, L. D., and Gille, S. T.: Ross gyre variability modulates oceanic heat supply toward the west Antarctic continental shelf, Commun. Earth Environ., 5, 47, https://doi.org/10.1038/s43247-024-01207-y, 2024.
Purich, A. and Doddridge, E. W.: Record low Antarctic sea ice coverage indicates a new sea ice state, Commun. Earth Environ., 4, 314, https://doi.org/10.1038/s43247-023-00961-9, 2023.
Rignot, E., Jacobs, S., Mouginot, J., and Scheuchl, B.: Ice-shelf melting around Antarctica, Science, 341, 266–270, https://doi.org/10.1126/science.1235798, 2013.
Rusciano, E., Budillon, G., Fusco, G., and Spezie, G.: Evidence of atmosphere-sea ice-ocean coupling in the Terra Nova Bay Polynya (Ross Sea–Antarctica), Cont. Shelf Res., 61–62, 112–124, https://doi.org/10.1016/j.csr.2013.04.002, 2013.
Sen Gupta, A. and England, M. H.: Coupled ocean–atmosphere–ice response to variations in the Southern Annular Mode, J. Climate, 19, 4457–4486, https://doi.org/10.1175/JCLI3843.1, 2006.
Shchepetkin, A. F. and McWilliams, J. C.: Correction and commentary for “Ocean forecasting in terrain-following coordinates: Formulation and skill assessment of the regional ocean modeling system” by Haidvogel et al., J. Comput. Phys., 228, 8985–9000, https://doi.org/10.1016/j.jcp.2009.09.002, 2009.
Silvano, A., Foppert, A., Rintoul, S. R., Holland, P. R., Tamura, T., Kimura, N., Castagno, P., Falco, P., Budillon, G., Haumann, F. A., Naveira Garabato, A. C., and Macdonald, A. M.: Recent recovery of Antarctic Bottom Water formation in the Ross Sea driven by climate anomalies, Nat. Geosci., 13, 780–786, https://doi.org/10.1038/s41561-020-00655-3, 2020.
Smith, W., Sedwick, P., Arrigo, K., Ainley, D., and Orsi, A.: The Ross Sea in a sea of change, Oceanography, 25, 90–103, https://doi.org/10.5670/oceanog.2012.80, 2012.
Solodoch, A., Stewart, A. L., Hogg, A. M., Morrison, A. K., Kiss, A. E., Thompson, A. F., Purkey, S. G., and Cimoli, L.: How does Antarctic Bottom Water cross the Southern Ocean?, Geophys. Res. Lett., 49, e2021GL097211, https://doi.org/10.1029/2021GL097211, 2022.
Stern, A. A., Dinniman, M. S., Zagorodnov, V., Tyler, S. W., and Holland, D. M.: Intrusion of warm surface water beneath the McMurdo Ice Shelf, Antarctica, J. Geophys. Res.-Oceans, 118, 7036–7048, https://doi.org/10.1002/2013JC008842, 2013.
Stewart, A. L. and Thompson, A. F.: Eddy-mediated transport of warm Circumpolar Deep Water across the Antarctic Shelf Break, Geophys. Res. Lett., 42, 432–440, https://doi.org/10.1002/2014GL062281, 2015.
Stewart, A. L., Klocker, A., and Menemenlis, D.: Acceleration and Overturning of the Antarctic Slope Current by Winds, Eddies, and Tides, J. Phys. Oceanogr., 49, 2043–2074, https://doi.org/10.1175/JPO-D-18-0221.1, 2019.
St-Laurent, P., Klinck, J. M., and Dinniman, M. S.: On the role of coastal troughs in the circulation of warm Circumpolar Deep Water on Antarctic shelves, J. Phys. Oceanogr., 43, 51–64, https://doi.org/10.1175/JPO-D-11-0237.1, 2013.
Tamura, T., Ohshima, K. I., Fraser, A. D., and Williams, G. D.: Sea ice production variability in Antarctic coastal polynyas, J. Geophys. Res.-Oceans, 121, 2967–2979, https://doi.org/10.1002/2015JC011537, 2016.
Thompson, L., Smith, M., Thomson, J., Stammerjohn, S., Ackley, S., and Loose, B.: Frazil ice growth and production during katabatic wind events in the Ross Sea, Antarctica, The Cryosphere, 14, 3329–3347, https://doi.org/10.5194/tc-14-3329-2020, 2020.
Uotila, P., Pezza, A. B., Cassano, J. J., Keay, K., and Lynch, A. H.: A comparison of low-pressure system statistics derived from a high-resolution NWP output and three reanalysis products over the Southern Ocean, J. Geophys. Res., 114, D17115, https://doi.org/10.1029/2008JD011583, 2009.
Uotila, P., Vihma, T., Pezza, A. B., Simmonds, I., Keay, K., and Lynch, A. H.: Relationships between Antarctic cyclones and surface conditions as derived from high-resolution numerical weather prediction data, J. Geophys. Res., 116, D07109, https://doi.org/10.1029/2010JD015358, 2011.
Uotila, P., Vihma, T., and Tsukernik, M.: Close interactions between the Antarctic cyclone budget and large-scale atmospheric circulation, Geophys. Res. Lett., 40, 3237–3241, https://doi.org/10.1002/grl.50556, 2013.
Wang, J., Luo, H., Yang, Q., Liu, J., Yu, L., Shi, Q., and Han, B.: An Unprecedented Record Low Antarctic Sea-ice Extent during Austral Summer 2022, Adv. Atmos. Sci., 39, 1591–1597, https://doi.org/10.1007/s00376-022-2087-1, 2022a.
Wang, S., Liu, J., Cheng, X., Yang, D., Kerzenmacher, T., Li, X., Hu, Y., and Braesicke, P.: Contribution of the deepened Amundsen sea low to the record low Antarctic sea ice extent in February 2022, Environ. Res. Lett., 18, 054002, https://doi.org/10.1088/1748-9326/acc9d6, 2023a.
Wang, T., Wei, H., and Xiao, J.: Dynamic linkage between the interannual variability of the spring Ross Ice Shelf Polynya and the atmospheric circulation anomalies, Clim Dynam., 58, 831–840, https://doi.org/10.1007/s00382-021-05936-0, 2022b.
Wang, X.: Mechanisms and impacts of anomalous high-salinity shelf water formation in the Ross Sea, Zenodo [data set], https://zenodo.org/records/15694437, 2025.
Wang, X., Zhang, Z., Wang, X., Vihma, T., Zhou, M., Yu, L., Uotila, P., and Sein, D. V.: Impacts of strong wind events on sea ice and water mass properties in Antarctic coastal polynyas, Clim. Dynam., 57, 3505–3528, https://doi.org/10.1007/s00382-021-05878-7, 2021.
Wang, X., Zhang, Z., Dinniman, M. S., Uotila, P., Li, X., and Zhou, M.: The response of sea ice and high-salinity shelf water in the Ross Ice Shelf Polynya to cyclonic atmosphere circulations, The Cryosphere, 17, 1107–1126, https://doi.org/10.5194/tc-17-1107-2023, 2023b.
Weber, N. J., Lazzara, M. A., Keller, L. M., and Cassano, J. J.: The extreme wind events in the Ross Island Region of Antarctica, Weather Forecast., 31, 985–1000, https://doi.org/10.1175/WAF-D-15-0125.1, 2016.
Wenta, M. and Cassano, J. J.: The atmospheric boundary layer and surface conditions during katabatic wind events over the Terra Nova Bay Polynya, Remote Sens., 12, 4160, https://doi.org/10.3390/rs12244160, 2020.
Whitworth III, T., Orsi, A. H., Kim, S. J., Nowlin, W. D., and Locarnini, R. A.: Water masses and mixing near the Antarctic slope front, in: Ocean, Ice, and Atmosphere: Interactions at the Antarctic Continental Margin, edited by: Jacobs, S. S. and Weiss, R. F., AGU, Washington, DC, 75, 1–27, https://doi.org/10.1029/AR075p0001, 2013.
Xie, C., Zhang, Z., Chen, Y., Wang, C., and Zhou, M.: The response of Ross Sea shelf water properties to enhanced Amundsen Sea ice shelf melting, J. Geophys. Res.-Oceans, 129, e2024JC020919, https://doi.org/10.1029/2024JC020919, 2024.
Yabuki, T., Suga, T., Hanawa, K., Matsuoka, K., Kiwada, H., and Watanabe, T.: Possible source of the Antarctic Bottom Water in the Prydz Bay region, J. Oceanogr., 62, 649–655, https://doi.org/10.1007/s10872-006-0083-1, 2006.
Yan, L., Wang, Z., Liu, C., Wu, Y., Qin, Q., Sun, C., Qian, J., and Zhang, L.: The salinity budget of the Ross Sea continental shelf, Antarctica, J. Geophys. Res.-Oceans, 128, e2022JC018979, https://doi.org/10.1029/2022JC018979, 2023.
Zhang, Z., Uotila, P., Stössel, A., Vihma, T., Liu, H., and Zhong, Y.: Seasonal Southern Hemisphere multi-variable reflection of the Southern Annular Mode in atmosphere and ocean reanalyses, Clim. Dynam., 50, 1451–1470, https://doi.org/10.1007/s00382-017-3698-6, 2018.
Zhang, Z., Xie, C., Castagno, P., England, M. H., Wang, X., Dinniman, M. S., Silvano, A., Wang, C., Zhou, L., Li, X., Zhou, M., and Budillon, G.: Evidence for large-scale climate forcing of dense shelf water variability in the Ross Sea, Nat. Commun., 15, 8190, https://doi.org/10.1038/s41467-024-52524-x, 2024.
Zhang, Z., Xie, C., Wang, C., Chen, Y., Hu, H., and Wang, X.: The Ross Sea and Amundsen Sea Ice–Sea Model (RAISE v1.0): a high-resolution ocean–sea ice–ice shelf coupling model for simulating the Dense Shelf Water and Antarctic Bottom Water in the Ross Sea, Antarctica, Geosci. Model Dev., 18, 1375–1393, https://doi.org/10.5194/gmd-18-1375-2025, 2025.
Zheng, F., Li, J., Clark, R. T., and Nnamchi, H. C.: Simulation and projection of the Southern Hemisphere Annular Mode in CMIP5 models, J. Climate, 26, 9860–9879, https://doi.org/10.1175/JCLI-D-13-00204.1, 2013.
Zhong, R., Yang, Q., Hodges, K., Wu, R., and Chen, D.: Impact of Data Resolution on Tracking Southern Ocean Cyclones, Mon. Weather Rev., 151, 3–22, https://doi.org/10.1175/MWR-D-22-0121.1, 2023.