the Creative Commons Attribution 4.0 License.
the Creative Commons Attribution 4.0 License.
Future permafrost degradation under climate change in a headwater catchment of central Siberia: quantitative assessment with a mechanistic modelling approach
Thibault Xavier
Laurent Orgogozo
Anatoly S. Prokushkin
Esteban Alonso-González
Simon Gascoin
Oleg S. Pokrovsky
Permafrost thawing as a result of climate change has major consequences locally and globally, both for the biosphere and for human activities. The quantification of its extent and dynamics under different climate scenarios is needed to design local adaptation and mitigation measures and to better understand permafrost climate feedbacks. To this end, numerical simulation can be used to explore the response of soil thermal and hydrological regimes to changes in climatic conditions. Mechanistic approaches minimise modelling assumptions by relying on the numerical resolution of continuum mechanics equations, but they involve significant computational effort. In this work, the permaFoam solver is used, along with high-performance computing resources, to assess the impact of four climate scenarios of the Coupled Model Intercomparison Project Phase 6 (CMIP6) on permafrost dynamics within a pristine, forest-dominated watershed in the continuous-permafrost zone. Using these century-timescale simulations, changes in the soil temperature, soil moisture, active layer thickness, and water fluxes are quantified, assuming no change in the vegetation cover. The most severe scenario (SSP5-8.5) suggests a dramatic increase in both the active layer thickness and annual evapotranspiration, with the maximum values on the watershed increasing by, respectively, +65 % and +35 % by 2100 compared to current conditions. For the active layer thickness, a variable that integrates both the thermal and hydrological states of the near-surface permafrost, this projected increase would correspond to a ∼350 km southward shift in current climatic conditions. Moreover, in this scenario, the thermal equilibrium of near-surface permafrost with the new climatic conditions would not be reached in 2100, suggesting a further thawing of permafrost even in the case in which climate change is halted.
- Article
(2978 KB) - Full-text XML
-
Supplement
(966 KB) - BibTeX
- EndNote
Permafrost is mostly situated in regions that are experiencing especially intense climate change, resulting in widespread warming and thawing, with the shrinking of its lateral extent and the thickening of the soil active layer (Biskaborn et al., 2019; Hu et al., 2022; C. Li et al., 2022; G. Li et al., 2022). Permafrost thawing induces sizable changes in the environment (Walvoord and Kurylyk, 2016; Nitze et al., 2018; Makarieva et al., 2019; Jin et al., 2022; Wright et al., 2022) and in human activities (Shiklomanov et al., 2017; Streletskiy et al., 2019, 2023; Hjort et al., 2018, 2022) in the Arctic and the sub-Arctic. For instance, a permafrost-thaw-related decrease in the soil moisture leads to an increase in boreal fire frequency (Kurylyk, 2019; Kim et al., 2020), while soil mechanical instabilities induced by permafrost thawing threaten human settlements (Ramage et al., 2021) and infrastructure (Bartsch et al., 2021). Moreover, permafrost thaw may exert significant controls on the biogeochemical cycles of carbon and related metals (Sonke et al., 2018; Karlsson et al., 2021; Walvoord and Striegl, 2021) and on climate dynamics (Miner et al., 2022; Park and Kug, 2022; de Vrese et al., 2023), with potentially major feedbacks on climate warming. Thus, anticipating the evolution of permafrost cover and dynamics is of primary importance for understanding and mitigating the climate-change-induced impacts at high latitudes. For this, robust and accurate numerical simulations are required (Schneider von Deimling et al., 2021; Hu et al., 2023).
Boreal forest is one of the largest biomes on Earth (Gauthier et al., 2015), and 80 % of its area is located in permafrost regions, thereby covering 55 % of the total global permafrost area (Stuenzi et al., 2021). Due to the complexity of the biophysical processes involved, quantifying the evolution of permafrost dynamics in boreal forests under climate change requires mechanistic, high-resolution modelling approaches (Orgogozo et al., 2019). However, the large extent of the considered areas makes the use of such approaches impracticable at global, continental, or regional scales. As a consequence, the mechanistic modelling of permafrost dynamics has to focus on processes at the watershed scale in headwater catchments with long-term environmental monitoring, following a general trend in the Arctic sciences (Speetjens et al., 2023; Vonk et al., 2023). In Arctic environments, the vegetation strongly controls the surface energy budget (Fedorov et al., 2019; Oehri et al., 2022), interacts with climate dynamics (Park et al., 2020; Kirdyanov et al., 2024), and drives water fluxes (Orgogozo et al., 2019). As such, vegetation should be taken into account when simulating the impact of climate warming on permafrost in boreal-forest areas (Loranty et al., 2018, Kirdyanov et al., 2020; Holloway et al., 2020).
The quantitative mechanistic modelling of permafrost dynamics under climate change at the headwater catchment scale requires large computational resources because fine spatio-temporal discretisation is needed due to the strong non-linearities and couplings of various physical processes (Kurylyk and Watanabe, 2013). This is especially important for century-long simulation periods (O'Neill et al., 2016) and simulation domains with surfaces of up to tens of square kilometres (e.g. Arndal and Topp-Jørgensen, 2020). For this, high-performance-computing techniques are needed (Orgogozo et al., 2023).
In this study, we focus on a permafrost-dominated, forested watershed of central Siberia that was subjected to long-term environmental monitoring, the Kulingdakan watershed (e.g. Prokushkin et al., 2007; Mashukov et al., 2021). The objective is to assess the future state of the permafrost and the ground thermal regime in this continuous-permafrost, boreal-forest environment under different climate change scenarios at the century timescale. The permafrost status of this catchment under current climatic conditions has already been investigated (Orgogozo et al., 2019). Here, we simulate, using a mechanistic modelling approach, the permafrost dynamics at the catchment scale until 2100 under various scenarios of climate change. The vegetation controls on permafrost dynamics are partly included in the mechanistic modelling framework by considering evapotranspiration fluxes (Orgogozo et al., 2019) and are partly handled empirically by accounting for the insulating effect of ground-floor vegetation (Blok et al., 2011; Cazaurang et al., 2023). However, because no changes in vegetation are explicitly considered, we assume constant biomass and primary production and therefore investigate only the physical part of the response of permafrost to climate change. We use the permaFoam high-performance-computing cryo-hydrogeological simulator (Orgogozo et al., 2023) with a national-level supercomputing infrastructure, the Joliot-Curie supercomputer of the Très Grand Centre de Calcul (TGCC) of the French Alternative Energies and Atomic Energy Commission (CEA). The simulated permafrost-thawing features in Kulingdakan are discussed and compared for different CMIP6 (Coupled Model Intercomparison Project Phase 6) scenarios, including the following:
-
the soil thermal regime (soil temperature and active layer thickness evolution, equivalent southward shift under current climatic conditions)
-
the soil hydrology (evapotranspiration fluxes and soil moisture evolution)
-
the spatial variability of climate-warming impacts at the scale of the watershed under study
-
the state and evolution of the thermal imbalance of the permafrost (e.g. Ji et al., 2022; Nitzbon et al., 2023) in the considered region.
2.1 Study site: Kulingdakan, a forested catchment in continuous-permafrost area
The Kulingdakan catchment is located in the Krasnoyarsk region (64.31° N, 100.28° E), within a continuous-permafrost zone belonging to the boreal-forest biome (northern taïga; see Fig. 1a). This pristine catchment has been monitored for the study of boreal processes over the past 2 decades. The vegetation is dominated by larch (Larix gmelinii), dwarf shrubs, mosses, and lichens. The catchment covers an area of 41 km2 and has an elevation ranging from 132 to 630 m (Prokushkin et al., 2004). The climate is cold and continental, with an average annual mean temperature of −8 °C and an annual total precipitation of 400 mm (annual mean measured between 1999 and 2014 at the Tura meteorological station, 5 km south of the Kulingdakan catchment, altitude of 168 m). The stream, which flows from east to west, divides the 41 km2 catchment area into two approximately rectangular slopes of equal area, the north aspect slope (NAS) and the south aspect slope (SAS). As shown by a previous numerical study of this site using permaFoam under current climatic conditions, the hydrological budget in this watershed is largely dominated by evapotranspiration fluxes (Orgogozo et al., 2019). Two horizons constitute the soil in the first few metres: an organic horizon (litter and peat) and a mineral horizon (mainly rocky and/or gravely loam).
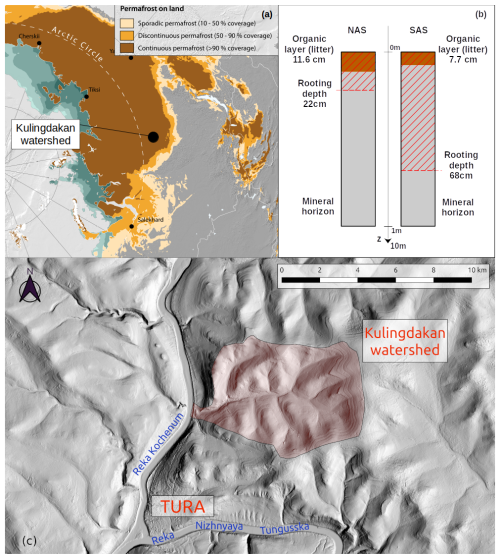
Figure 1(a) Location of Kulingdakan watershed (map from GRID-Arendal, Nunataryuk). (b) Representation of soil column structure for north aspect slope (NAS) and south aspect slope (SAS) of the Kulingdakan watershed. (c) Digital elevation model (DEM) of Kulingdakan watershed, extracted from ArcticDEM (Porter et al., 2023).
Due to the difference in solar radiation induced by their aspects, primary production and evapotranspiration are more intensive in the SAS than in the NAS. Thus, the two slopes show significant differences in the larch tree size and larch stand density, as well as in the rooting depth, organic horizon, and moss layer thickness and active layer dynamics. The thickness of the organic horizon is 11.6 cm on the NAS and 7.7 cm on the SAS (Gentsch, 2011), while the moss layer thickness is 13 cm on the NAS and 6.4 cm on the SAS (Prokushkin et al., 2007). The rooting depth is 10 cm into the mineral horizon for the NAS and 60 cm into the mineral horizon for the SAS (Viers et al., 2013), and this difference has been shown to be of great importance for the dynamics of the active layer (Orgogozo et al., 2019). The observed maximum active layer thickness is 1.22 m in the SAS and 0.58 m in the NAS (Gentsch, 2011). These pedological and physiological contrasts between the two aspects of the watershed slope, summarised in Fig. 1b, are explicitly considered when performing permafrost simulations (see Sect. S2 “Calculation set-up and details” in the Supplement).
Previous modelling studies in the Kulingdakan catchment on water flux repartitioning, the soil temperature at different depths, and the active layer thickness (Orgogozo et al., 2019, 2023) demonstrated that the use of the permaFoam solver, together with boundary conditions (water fluxes and soil surface temperature) provided by field measurements, made it possible to obtain numerical simulation results in agreement with in situ observations under current climatic conditions.
2.2 The permaFoam cryo-hydrogeological simulator
The numerical tool used in this study is permaFoam (Orgogozo et al., 2019, 2023), the permafrost modelling solver developed in the framework of OpenFOAM, the open-source, high-performance-computing toolbox for computational fluid dynamics (Weller et al., 1998, https://openfoam.org, last access: 10 December 2024, https://www.openfoam.com, last access: 10 December 2024). This solver is designed to simulate 3D, transient coupled heat and water transfers in a variably saturated soil with evapotranspiration and the freezing–thawing of the pore water. The two main equations solved by permaFoam are the Richards equation (Eq. 1), which governs the flow of water, and an energy balance equation (Eq. 2) that governs the heat transfer; both are defined at the Darcy scale of the considered porous medium (soil).
The two primary variables in Eqs. (1) and (2) are the generalised water pressure head h (m) and the soil temperature T (K), respectively. In the Richards equation (Eq. 1), z is the vertical coordinate (m) (oriented upward); KH is the hydraulic conductivity of the variably saturated, variably frozen porous medium (m s−1); CH is the capillary capacity (also called the specific moisture capacity) of the unsaturated porous medium (m−1); and QAET (s−1) is a source term representing the water uptake by vegetation through the evapotranspiration process (computed using the Hamon formula; see Hamon, 1963; Frolking, 1997). From the pressure head field h, the Darcy velocity V (m s−1) is derived according to Eq. (3):
In the energy balance equation (Eq. 2), the considered transfer processes are conduction through the entire porous medium, convection by pore water flow, and latent heat exchanges when phase change occurs. In this heat transfer equation, KT,eq () is the apparent thermal conductivity of the porous medium, θice (–) is the volumetric ice content, L (J m−3) is the latent heat of the fusion of ice, CT,eq () is the equivalent heat capacity of the porous medium, and CT,liquid () is the equivalent heat capacity of liquid water. In permaFoam, these two coupled equations are solved in 3D using the finite-volume method, with sequential operator splitting for handling the couplings, Picard loops for dealing with the non-linearities, and a backward time scheme for temporal discretisation. A detailed description of the solver can be found in Orgogozo et al. (2023).
The numerical resolution of these coupled and highly non-linear equations, including stiff fronts generated by freeze–thaw processes, at the spatial and temporal scales required for studying climate change impacts on boreal watersheds requires both a robust algorithm and the efficient use of high-performance-computing means. This is the reason that permaFoam is developed within the OpenFOAM framework, which allows the use of up-to-date and efficient numerical methods for solving partial differential equations on last-generation supercomputing facilities. Thanks to its implementation in OpenFOAM, the permaFoam solver has demonstrated excellent parallel performances on various supercomputer architectures for dedicated test cases (Orgogozo et al., 2023) in terms of both the large numerical domains (up to 1 billion mesh points on the CALMIP Olympe supercomputer) and the number of cores (16 000 on the GENCI Irene ROME supercomputer).
2.3 Modelling domain
According to preliminary numerical experiments (data not shown), for modelling Kulingdakan watershed permafrost, the use of a dual 2D simplified representation (Orgogozo et al., 2019) makes it possible to simulate properly the thermal and hydrological fluxes in the soils. As such, full 3D simulations, which are far more costly from a computational perspective than 2D simulations (Orgogozo et al., 2023), are not needed. Additionally, the use of 2D simulations allows for the consideration of lateral transfers (Sjöberg et al., 2016; Lamontagne-Hallé et al., 2018; Hamm and Frampton, 2021; Jan, 2022). Thus, in this work, we used 2D numerical domains, with climatic forcing as the top boundary conditions (see Sect. 2.4) and geothermal heat flux and nil water flux as the bottom boundary conditions. The initial conditions were obtained through 10 years of spin-up under current climatic conditions. These current climatic conditions were represented by a synthetic year of climate forcing corresponding to the multi-annual means of the 1999–2014 observations (see Sect. S1 in the Supplement: Estimating soil surface temperature from external conditions, including Fig. S1 in the Supplement). The starting conditions of this spin-up were extracted from the results of the previous calculations (Orgogozo et al., 2019). The convergence criterion for the spin-up was the active layer thickness interannual difference (annual variability of less than 0.2 %). The spatial discretisation of the domain is done using a mesh of 5.2×10⁷ cells according to a convergence study presented in Sect. S2: Calculation set-up and details.
The numerical simulations provide the full 2D fields of physical quantities describing the heat and water flow within both the SAS and NAS (two 2.5 km wide and 10 m thick slopes), including both the frozen and active layers in each slope. These included the soil temperature, pressure head, liquid water content, and ice content for each time step that was saved (user defined; here, every 6 months). In addition, the temperature, water content, ice content, and evapotranspiration sink term are monitored at an hourly frequency throughout two vertical profiles located at the mid-slope of the SAS and NAS numerical domains using 61 virtual point probes distributed over the 10 m of the numerical domain thickness. Finally, the infiltration and exfiltration water fluxes through the total soil surface are also saved from the standard output at every time step. Further details of the modelling set up are presented in Sect. S2: Calculation set-up and details.
2.4 Soil surface conditions under climate change derived from CMIP6 scenarios
In order to apply climate forcings that are representative of possible future trajectories, we consider climate scenarios produced as a part of the Coupled Model Intercomparison Project Phase 6 (CMIP6) organised by the Intergovernmental Panel on Climate Change (IPCC) (Eyring et al., 2016); in particular, we consider the so-called tier-1 key scenarios (O'Neill et al., 2016). These scenarios have been highlighted because of their relevance to scientific questions, the range of possible futures they cover, and their continuity with previous Representative Concentration Pathways (RCP) scenarios (van Vuuren et al., 2011) published during CMIP5. We considered four CMIP6 scenarios, from the sustainable pathway with the least forcing (coldest) to the pathway with the most forcing (hottest): SSP1-2.6, SSP2-4.5, SSP3-7.0, and SSP5-8.5. Among these scenarios, SSP2-4.5 is the one that is used most often in permafrost studies (e.g. Karjalainen et al., 2019; Ramage et al., 2021; Hjort et al., 2022). For each of these scenarios, an ensemble of models has been run on different regions of the globe. The climate model output data were accessed via the IPCC Working Group I (IPCC-WGI) Interactive Atlas (Iturbide et al., 2022), February 2023 version, which provides the median (P50) of the ensemble of models for a selected output variable, region, and scenario. We used the projections of the air temperature and precipitation changes for the eastern Siberian region, averaged at each yearly time step. To obtain the local scenarios of climate change for the air temperature and precipitation (Fig. 2), these yearly averaged projections of air temperature and/or precipitation changes between 2015 and 2100 have been summed with daily air temperature and/or precipitation variations along the synthetic year of climate forcing corresponding to the multi-annual means of the 1999–2014 observations in Tura, which are representative of current climatic conditions (see Sect. S1: Estimating soil surface temperature from external conditions, Fig. S1). This provided the projections of the daily air temperature and/or precipitation from 2015 to 2100 for the Tura area. The yearly averages of these daily projections are presented in Fig. 2.
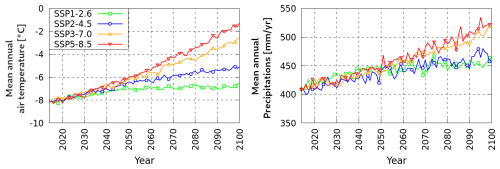
Figure 2Projections of air temperature and precipitation in Kulingdakan based on CMIP6 projections based on the eastern Siberia area.
The projections show an increase in air temperature over the century at a rate between +1.9 °C per 100 years (SSP1-2.6) and +7.8 °C per 100 years (SSP5-8.5); these rates were obtained by re-scaling the averaged increase rates from 2014 to 2100 to the centennial timescale. For every scenario, this local increase rate is higher than the global one (global increase rates, according to Fan et al., 2020, are as follows: SSP1-2.6 – +1.18 °C per 100 years, SSP2-4.5 – +3.22 °C per 100 years, SSP3-7.0 – +5.50 °C per 100 years, and SSP5-8.5 – +7.20 °C per 100 years). The annual precipitation could also change significantly, with a relative increase by 2100 of +12 % (SSP1-2.6) to +29 % (SSP5-8.5) compared to the current value.
In order to translate these climate projections, which describe atmospheric conditions, into suitable soil surface boundary conditions for cryo-hydrogeological simulations (water fluxes and temperature at the soil surface, beneath snow and moss layers), a dedicated empirical procedure has been developed. The goal is to set up a methodology for deriving the soil surface temperature from the air temperature on the slopes of the Kulingdakan watershed based on the available observation data. Indeed, the soil temperature and air temperature may be significantly different in such a boreal-forest environment due to the effects of the understorey (Zellweger et al., 2019; Haesen et al., 2021), the moss cover insulation (Blok et al., 2011; Cazaurang et al., 2023), and the winter snowpack (Jan and Painter, 2020; Khani et al., 2023) and its interactions with vegetation (Dominé et al., 2022). This empirical, site-specific procedure is detailed in Sect. S1: Estimating soil surface temperature from external conditions, and it makes it possible to build up slope-wise soil temperature estimates on the basis of the air temperature and snow conditions. For water fluxes, the simplest approximation has been adopted, assuming that the water flux at the top of the soil is equal to the rain flux. For the soil surface temperature estimate, we first used a modified temperature index approach (Braithwaite and Olesen, 1989; Hock, 2003) for estimating the snow water equivalent, and then we used multiple regression to derive below-moss soil surface temperature from the air temperature, precipitation, and snow water equivalent. We chose a temperature index approach to simulate the snow water equivalent on the soil surface because climate projections only provide the air temperature and precipitation, whereas a more advanced energy balance snowpack model requires additional information on wind, radiation, and air humidity. To calibrate this temperature index model, we first reconstruct the snow water equivalent for the period of 1999–2014 from the observed snow depth with the Multiple Snow Data Assimilation System (MuSA) toolbox (Alonso-González et al., 2022) forced with ERA5 data (Hersbach et al., 2020), fusing available snow depth observations with an ensemble of simulations generated by the energy and mass balance model called the Flexible Snow Model (Essery, 2015). Then, we calibrated a multiple regression method to derive the soil surface temperature as a function of the air temperature and precipitation while taking into account the insulating effect of moss and snow layers. Calibrations were performed with air temperature and precipitation data measurements, the MuSA-derived snow water equivalent between 1999 and 2014, and the topsoil (i.e. below moss) temperature measured in situ between 2003 and 2005. With this procedure, for each slope, an empirical transfer function that provides soil temperature estimates derived from the air temperature and precipitation was obtained. Finally, these transfer functions were used to produce scenarios of the daily soil surface temperature under climate change for the two slopes of the catchment. This information is used to build the soil surface boundary conditions of the hydrogeological simulations. It must be emphasised that our empirical approach was based on parametrical fitting on observation data for estimating the transfer function between atmospheric forcing and the soil surface temperature. As a result, no vegetation changes due to climate change could be considered in this transfer function. Therefore, we focus on the purely physical response of the catchment permafrost to climate change while considering the vegetation impacts on permafrost dynamics under constant vegetation cover. Coupling vegetation dynamics with the cryo-hydrogeological model would allow one to assess the impact of the climate-warming-induced changes of the vegetation cover on permafrost conditions. However, this is beyond the scope of the present study and will be the focus of future work.
From post-processing the computed 2D fields of physical quantities describing the heat and water flow within both the SAS and NAS (two 2.5 km wide, 10 m thick slopes), including both the frozen and active layers in each slope, a large wealth of data characterising the considered virtual permafrost dynamics is obtained (Sect. S3 in the Supplement: Changes in the main variables according to the four climate projections), and, below, only the key features of the centennial evolution under climate change are presented.
3.1 Soil surface temperature projections
The results of the temperature index approach used for modelling the snow cover of the Kulingdakan watershed are presented in Fig. 3. The snow water equivalent (SWE) model shows a good agreement with the MuSA reconstructions (Fig. 3a); hence, this model was used to estimate the SWE under future climate projections (Fig. 3b).
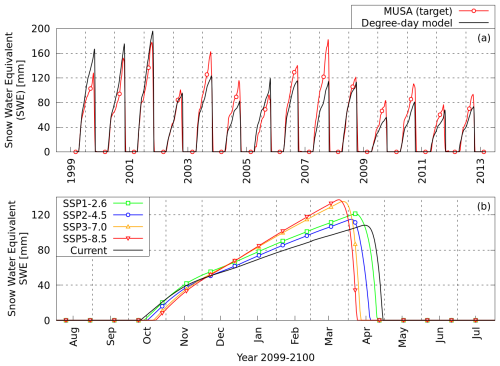
Figure 3(a) Present snow model comparison with MuSA output and (b) projection at the end of the century.
For each slope, the output data of the snow cover model were used as input data for the multiple regression of the soil surface temperature, along with the air temperature data and precipitation data. These empirical transfer functions were in good agreement with the observations, as shown in Fig. 4.
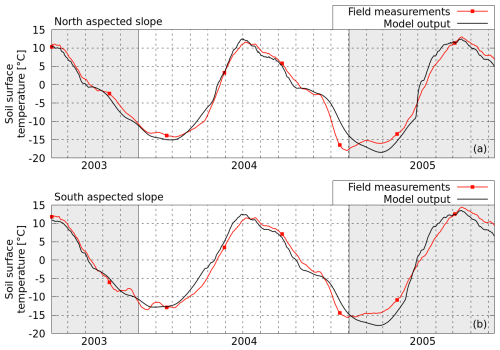
Figure 4Measurements and empirical transfer function estimates for soil surface temperature under present climatic conditions in the (a) NAS and (b) SAS.
The L1 norm of the differences between the field measurements and model output is 1.42 °C in the NAS and 1.56 °C in the SAS. The L2 norms of these differences are 0.07 °C for both the SAS and NAS. A more detailed discussion of the behaviour of these empirical transfer functions may be found in Sect. S1: Estimating soil surface temperature from external conditions.
Finally, for each slope, soil temperature projections are obtained for the four considered CMIP6 climate scenarios by applying the developed modelling chain with the projections for air temperature and precipitation as input data.
The four projections based on the different Shared Socioeconomic Pathways (SSPs) lead to an increase in the ground surface temperature from +1.4 °C (SSP1-2.6) to +5.2 °C (SSP5-8.5) between 2014 and 2100 (Fig. 5a and b). These rates of increase, roughly equivalent, by extrapolation, to +1.7 °C per 100 years (SSP1-2.6) and +5.9 °C per 100 years (SSP-8.5), are lower than the projected increases in air temperature (+1.9 °C per 100 years for SSP1-2.6 and +7.8 °C per 100 years for SSP5-8.5) due to the insulating effect of the snow cover and the vegetation layer and also due to the thermal inertia of the soil column below the surface. One can note that, for the SSP3-7.0 and SSP5-8.5 scenarios, the mean annual soil surface temperature becomes positive around 2080.
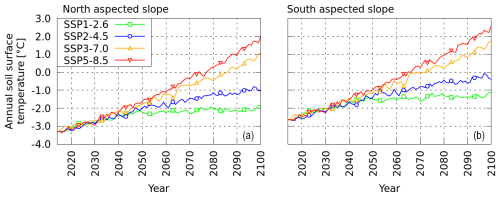
Figure 5Soil surface temperature projections over the century based on SSP scenarios obtained using the transfer function described in Sect. S1: Estimating soil surface temperature from external conditions. Transfer function model estimation for soil surface temperature under present conditions for (a) the NAS and (b) the SAS of the Kulingdakan watershed.
3.2 Trends in soil temperatures
The soil temperature at different depths is one of the key variables for characterising permafrost dynamics. The multi-annual trends induced by the climate warming of the mean annual soil temperature between 2014 and 2100 at four depths (10 cm, 1 m, 5 m, and 10 m below the surface) are illustrated in Fig. 6.
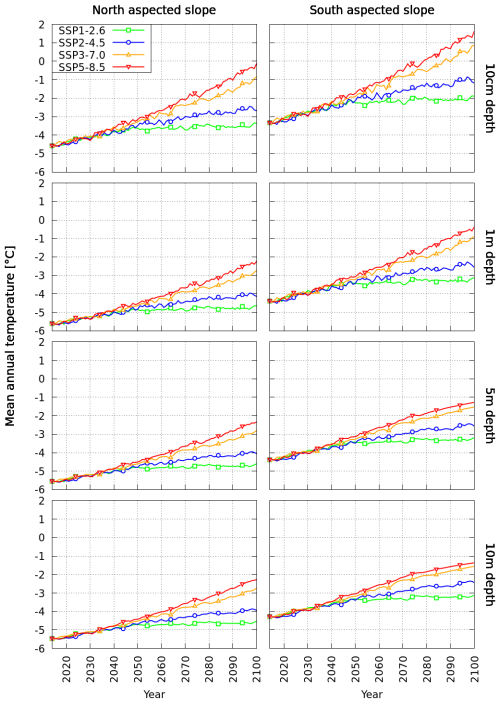
Figure 6Mean annual temperature evolution at 10 cm, 1 m, 5 m, and 10 m under the surface for each scenario and slope considered.
On both slopes, the soil temperature experiences a significant increase down to 10 m depth for all climate-warming scenarios considered. For the two high-forcing pathway (hottest) scenarios, the annual mean soil temperature even becomes positive close to the surface (10 cm depth) in the SAS, with this happening by 2080 for SSP5-8.5 and by 2090 for SSP3-7.0. Meanwhile, for the medium scenario, SSP2-4.5, and for the low-forcing sustainable pathway (coldest) scenario, SSP1-2.6, the mean annual soil temperature stays negative everywhere until 2100. The warming is more intensive in the SAS than in the NAS, and, as expected, the amplitude of soil warming decreases with depth. In the SAS, at 10 cm depth, the temperature rise between current conditions and the year 2100 is 1.4 °C for the SSP1-2.6 scenario and 5.0 °C for the SSP5-8.5 scenario, while, at 5 m depth, the temperature rises are 1.2 and 3.1 °C, respectively. In the NAS, at 10 cm depth, the temperature rise between current conditions and the year 2100 is 1.2 °C for the SSP1-2.6 scenario and 4.4 °C for the SSP5-8.5 scenario, while, at 5 m depth, the temperature rises are 1.0 and 3.2 °C, respectively. It should be noted that, for both slopes, the vertical gradient of the temperature in 2100 is higher in scenario SSP5-8.5 than in scenario SSP1-2.6. This indicates a stronger thermal non-equilibrium under more intense warming. For instance, the difference in temperature in 2100 between 10 cm depth and 5 m depth is 3.0 °C in the SAS and 2.2 °C in the NAS for scenario SSP5-8.5, while it is 1.3 °C in the SAS and 1.2 °C in the NAS for the SSP1-2.6 scenario. In order to provide insight into the thermal-equilibrium state of the soil columns in each slope in 2100, additional simulations have been performed by applying the projected climatic conditions of the end of the century (averaged over 2096–2100) for 30 more years. For each scenario, the vertical soil temperature profiles for 2100 and for the numerical experiments with 30 more years of 2096–2100 climatic conditions are plotted in Fig. 7.
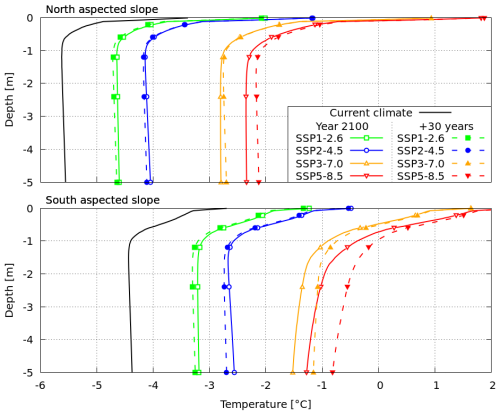
Figure 7Annual mean temperature profiles in 2100 and after 30 years of additional cycling of the average climatic forcing between 2096 and 2100.
Considering the soil temperature profiles in 2100, two regions may be distinguished: the first metre, with steep positive vertical gradients (the soil surface is warmer than the bottom of the active layer), and a deeper region, with smoother vertical thermal gradients that are either slightly negative (SSP1-2.6 and SSP2-4.5 in the NAS and SAS), almost nil (SSP3-7.0 and SSP5-8.5 in the NAS), or positive (SSP3-7.0 and SSP5-8.5 in the SAS). When comparing these profiles with those obtained with 30 additional years of modelling under constant 2096–2100 climatic conditions, we observe important differences in both slopes for scenario SSP5-8.5 and also for scenario SSP3-7.0 and scenario SSP2-4.5 in the SAS.
3.3 Active layer thickness evolution
Numerical simulations provide access to the soil temperature at various depths. From the soil temperature profile, the maximum depth with a positive temperature may be computed at each time step. The maximum thawed depth obtained over a year defines the active layer thickness (ALT) of this year. The active layer thickness has been computed for each scenario and each year and is plotted for both the NAS and SAS in Fig. 8.
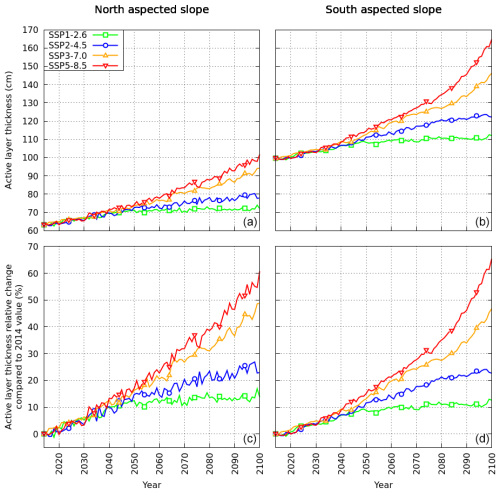
Figure 8Active layer thickness temporal evolution on the NAS (a, c) and on the SAS (b, d) of the Kulingdakan watershed, obtained from permaFoam simulations under different SSP scenarios. (a, b) Active layer thickness value. (c, d) Relative change compared to 2014 value (63 cm for the NAS and 100 cm for the SAS).
For both slopes, an increase in the active layer thickness is observed between 2014 and 2100 in every scenario, with a more important thickening in the SAS than in the NAS. SSP1-2.6 leads to an increase of +12.5 cm / +13 % for the SAS and of +8.8 cm / +14 % for the NAS, while SSP5-8.5 leads to a more dramatic increase of +65.1 cm / +65 % for the SAS and of +38.5 cm / +61 % for the NAS. In the first half of the century, the behaviour of the active layer thickness does not differ significantly between scenarios, with a thickening rate in the ALT of about +3.6 mm yr−1 (±23 %) in the SAS and of +2.8 mm yr−1 (±18 %) in the NAS. However, in the second half of the century (2050–2100), different scenarios lead to very different active layer thickness evolution dynamics. For SSP1-2.6, the thickening rate is rather small, with a rate of +0.60 mm yr−1 for the SAS and of +0.32 mm yr−1 for the NAS, while, for the SSP5-8.5 scenario, the thickening rate rises to +9.1 mm yr−1 for the SAS and to +5.1 mm yr−1 for the NAS. By the end of the simulated period, these thickening rates show no diminishing trend in the SAS, suggesting that the dynamic thermal equilibrium is not reached in the active layer. To illustrate this, Fig. 9 shows the active layer thickness evolution for 30 years of additional simulations while keeping the climatic conditions of the end of the century (2096–2100) for each scenario.
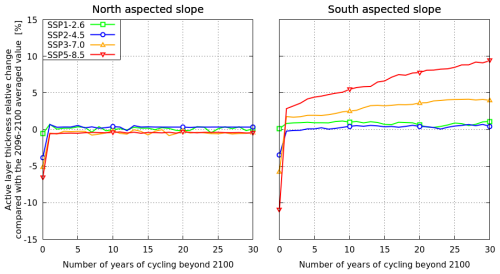
Figure 9Relative change in active layer thickness compared with the average value for 2096–2100 over 30 years of spin-up for a synthetic year obtained by averaging climatic conditions between 2096 and 2100.
Overall, the active layer is not far from thermal equilibrium on both slopes for the low-forcing sustainable pathway (SSP1-2.6) and the medium pathway (SSP2-4.5) climatic scenarios. However, when considering the high-forcing pathway scenario, SSP5-8.5, an important thermal-inertia effect appears in the SAS, with an additional active layer thickness increase of +10.4 % over these 30 years compared to the 2096–2100 value, i.e. an increase of +17 cm. This additional change in the active layer thickness brings the resulting change compared to the 2014 value to +77 cm (+77 %) for the SSP5-8.5 scenario for the SAS. The abrupt change observed at the end of the first year of cycling is a direct observation of the abrupt change in climatic forcing (from 2100 forcings to 2096–2100 averaged conditions). Interannual variability is included in CMIP6 scenarios, as can be seen in Fig. 2 for both the air temperature and precipitation. For the NAS, the active layer is back to equilibrium in a year, which is a sign of a short response time. For the SAS, and particularly for the steepest scenarios, this effect is added to a longer response time change, as discussed previously.
3.4 Trends in soil moisture
The soil moisture content experienced less important changes than the thermal regime under the considered climate change scenario. To illustrate the soil moisture evolution near the surface, the total water, liquid water, and ice volumetric contents have been averaged over the first 2 m of the soil for each slope, and their 2014–2100 evolutions have been plotted in Fig. 10 for the four climatic scenarios. Note that the 2 m surface soil layer thickness considered for this quantification encompasses the entire area with water content evolution under the climate change scenarios. Regardless of the scenario, there is no significant evolution of the total water content in the first 2 m of soil in the NAS, and the only noticeable change is the increase in the proportion of liquid water (+17 % in SSP1-2.6, +28 % in SSP2-4.5, +62 % in SSP3-7.0, and +78 % in SSP5-8.5), suggesting an increase in the amount of liquid water available for vegetation. In the SAS, however, the first 2 m of the soil exhibited a slight but detectable diminishing of the total water content by 2100 (−5 % in SSP1-2.6 and SSP2-4.5, −10 % in SSP3-7.0 and SSP5-8.5). On the other hand, the proportion of liquid water over ice increases (+9 % in SSP1-2.6, +20 % in SSP2-4.5, +50 % in SSP3-7.0, and +72 % in SSP5-8.5). Therefore, on the SAS, climate warming may result in an increase in the amount of liquid water available for vegetation. This finding is important for heat and water transfers in the soil, given the strong couplings and non-linearities between these transfers. For instance, decreasing the total water content induces a decrease in the soil thermal inertia, while decreasing the share of ice versus liquid water induces a decrease in the apparent thermal conductivity. This can also impact the vegetation dynamics since vegetation takes up only liquid soil water for transpiration. It should be emphasised that the presented partitioning between liquid water and ice is based on the mean annual quantities. This provides a smaller proportion of liquid water compared to that at the end of the active season (second half of September), when the active layer is at its maximum thickness (see Sect. S4 in the Supplement).
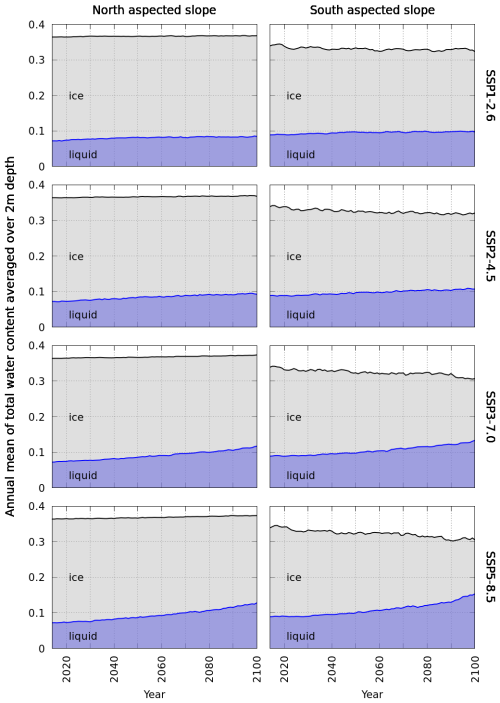
Figure 10Annual mean of total water content (m3 of water per m3 of soil) partitioned into liquid (blue) and ice (grey) water content averaged over 2 m depth in different climate projections.
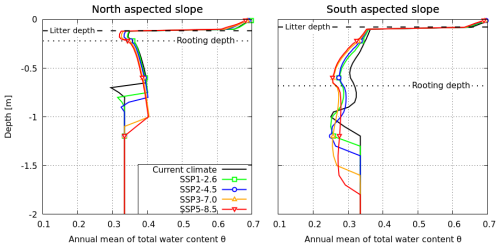
In order to investigate the local variation of the moisture content in the rooting zone and in the active layer of each slope, the vertical profiles of the mean annual total water content have been plotted in Fig. 11 for current climatic conditions and for the year 2100 under the SSP1-2.6, SSP2-4.5, SSP3-7.0, and SSP5-8.5 scenarios. The processes driving the evolution of vertical moisture profiles are complex; they involve coupled and non-linear heat and water transfers, as well as changing evapotranspiration fluxes. The main changes in the vertical moisture profiles can be described as follows. The water profiles do not change significantly in the highly porous organic horizon for both slopes. In the active layer within the mineral horizon, the behaviours of the SAS and the NAS show a greater contrast. In most of the root layers of both slopes, upward vertical moisture gradients, and, thus, downward water movements, occur. This is likely to be the signature of an infiltration-dominated flow regime. On the contrary, below the root layer, there are downward vertical moisture gradients and, thus, according to the generalised Darcy's law, upward water movements. This could be explained by the root water uptake occurring above in the root layer, uptake that would create a capillarity-dominated zone where waters are attracted from the depth toward the root layer. The SAS and the NAS differ strongly in terms of root layer thickness: 10 cm in the mineral horizon in the NAS and 60 cm in the mineral horizon in the SAS. The shapes of the profiles of vertical water fluxes differ strongly between the two slopes, along with their responses to climate change. In the NAS, the only evolution with climate change is a thickening of the zone with a downward vertical moisture gradient (i.e. an upward water flux) alongside the thickening of the active layer, with no significant changes in the gradient itself. Meanwhile, in the SAS, along with the thickening of the zone with water movements (i.e. moisture gradients) that comes with active layer thickening, significant changes in the upward moisture gradients are expected to occur: the hotter the scenario, the steeper the gradients and, thus, the stronger the downward water fluxes.
3.5 Water fluxes
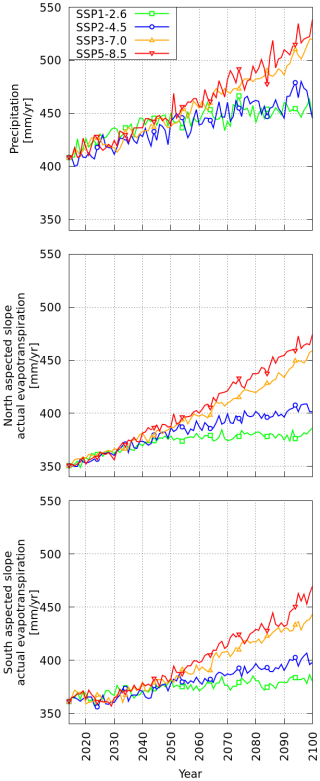
The water fluxes also change significantly with climate change on both slopes for every scenario. Evapotranspiration is the most important component of the hydrological budget in Kulingdakan. Focusing on this dominant component, Fig. 12 presents the centennial evolution of evapotranspiration on both slopes and of precipitation for the four climate change scenarios. A significant increase in evapotranspiration is simulated in all cases, with an increase between +19 mm / +5 % (SSP1-2.6) and +108 mm / +30 % (SSP5-8.5) in the SAS and between +35 mm / +10 % and +123 mm / +35 % in the NAS. The increase in the evapotranspiration fluxes in Kulingdakan is correlated to the increase in precipitation, with similar rates for both slopes.
Similarly to previous simulations of mean annual temperature, soil surface temperature, and active layer thickness, the evolution is globally similar among scenarios until 2050, with significant divergences appearing only between 2050 and 2100.
The numerical results obtained by the mechanistic modelling of heat and water transfer within the permafrost and active layers of Kulingdakan document the physical response to be expected within this catchment under climate change, with soil warming (Fig. 6) and active layer thickening (Fig. 8) in all climate scenarios. An important spatial variability in terms of this thermal response is identified in relation to the aspect of the slopes, which stems from a sizable contrast in the vegetation cover, hydrologic and thermal states, and active layer dynamics, as currently observed between the two slopes of the catchment (Prokushkin et al., 2007). Indeed, since the NAS is wetter, its thermal inertia is more important due to the larger amount of latent heat that must be provided in order to thaw and warm its soils compared to the drier soils of the SAS. This difference in moisture content is largely due to differences in the tree cover biomass and physiology. In particular, the deeper root layer in the SAS compared to in the NAS induces more intensive evapotranspiration under both current (Orgogozo et al., 2019) and future climate conditions. Note that this contrast between the two slopes tends to diminish with climate warming (Fig. 12). Liquid water availability for root water uptake is better in SAS than in NAS under the current climate, as well as in the studied scenarios of climate change (Sect. S4: A view of seasonal change of liquid water available for vegetation uptake). Meanwhile, the SAS is drier than the NAS in terms of total water content in current climate, and this contrast in dryness will increase with climate warming (Fig. 10). The pattern of water fluxes within the active layer, with an upward flux to the thinner, close-to-the-surface root layer in the NAS and a downward flux toward the bottom of the thicker root layer in the SAS, is also preserved under climate change, with an intensification of the fluxes in the SAS under the high-forcing pathway scenarios (Fig. 11). According to Fig. 11, the changes in vertical water fluxes will be stronger in the SAS than in the NAS, likely due to the pronounced drying of the active layer of the SAS, while the total water content in the NAS does not change much (Fig. 10). The drying of the root layer in the SAS may then lead to a steeper downward moisture gradient and, thus, to a more important infiltration flux within this layer. Furthermore, the thicker moss layer in the NAS is likely to alleviate the effect of changes in the climatic conditions on soil more efficiently compared to that in the SAS. Because our modelling takes into account the root water uptake mechanistically (Orgogozo et al., 2023) and the low vegetation-insulating effect empirically (Sect. S1: Estimating soil surface temperature from external conditions), the warming of the soil and the thickening of the active layer under climate change are significantly more pronounced in the SAS than in the NAS. This spatial variability in the permafrost dynamics of forest environments, persistent in all climate change scenarios, reflects the prominent role of micro-climatic conditions in the responses to climate change that has been demonstrated recently in the literature (Zellweger et al., 2020). It must be emphasised that all the numerical results of this study have been obtained considering the vegetation in its present state. The strong local variabilities in the vegetation cover depending on the permafrost conditions in the Kulingdakan catchment (Orgogozo et al., 2019) and, from a broader perspective, in the Arctic (Oehri et al., 2022) are consistent with the tight connections between the evolution of vegetation under climate change (e.g. Vitasse et al., 2009, 2011; Rew et al., 2020) and the permafrost pattern, which has not been explicitly considered in this study. At the centennial timescale, changes in the tree growth rate, the forest fire frequency, or the nature of the vegetation cover may exert important impacts on permafrost conditions (Cable et al., 2016; Fedorov et al., 2019; Rew et al., 2020; Li et al., 2021; Heijmans et al., 2022). Meanwhile, without belittling these complex interactions between vegetation and permafrost dynamics, this study shows that important impacts of climate change on the permafrost dynamics of the forested continuous-permafrost area are to be expected, even with the steady state of the vegetation. We noted that the more intense the climate change is, the more pronounced these thermal responses are. For instance, under the SSP5-8.5 scenario, a maximum evolution of the active layer thickness is +65 cm / +65 % for the SAS and +39 cm / +61 % for the NAS, while, under the SSP2-4.5 scenario, an increase of +23 cm / +23 % for the SAS and an increase of +15 cm / +23 % for the NAS are anticipated. Using empirical transfer functions to approximate the soil surface temperature from atmospheric conditions under climate change poses the problem of extrapolation, for instance, under extreme hot-weather conditions that may occur in the future, which are unprecedented in the training period of 1999–2014. However, performing the mechanistic modelling of the surface energy balance in extreme weather conditions in permafrost contexts was beyond the scope of this work. Additionally, it must be noted that, for now, in permaFoam, evapotranspiration is assumed to be solely constituted by transpiration, while the evaporation within the soil is neglected (Orgogozo et al., 2019). This assumption is made in the context of the study of boreal-forest areas, in which transpiration largely dominates over evaporation in the hydrological budget (e.g. Park et al., 2021). Meanwhile, evaporation may dominate in tundra environments (Clark et al., 2023) and is likely to increase in the future in forested environments. Since soil evaporation adds another coupling between heat and water transfers through exchanges of latent heat, it could directly affect the soil temperature evolution. These points should constitute a scope of future modelling works.
To produce a broader geographical context of the active layer thickening projections simulated at the scale of a small catchment, a comparison of centennial evolutions under climate change with large geographical coverage is performed using a substituting-space-for-time approach (Fig. 13).
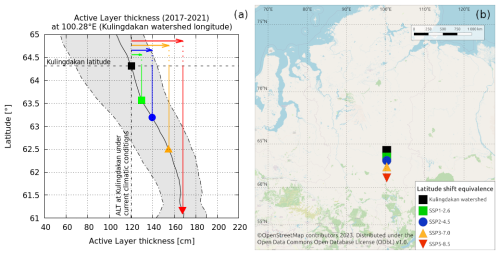
Figure 13(a) Equivalence between simulated active layer thickening by 2096–2100 under climate change (SAS and NAS average) and southward latitudinal shift in current climatic conditions (2017–2021). The latitudinal trend (black line – average over a 1° lat. × 1° long. polygon) and envelope (in grey – min. and max. over years within the same polygon) are extracted from the Permafrost CCI (Westermann et al., 2024). (b) Representation of the latitudinal southward shift equivalent to each climate scenario's active layer thickening on the regional map.
The simulated thickening of the active layer, averaged over both slopes of Kulingdakan, is depicted as southward latitudinal shifts along the meridian passing by Kulingdakan, i.e. with a north–south translation along 100.28° E (Fig. 13). The latitudinal evolution of the active layer thickness along the current meridian is computed based on the permafrost_CCI dataset (Westermann et al., 2024) by averaging the value of the multi-annual mean of the active layer thickness for the 2017–2021 period over a polygon of 1° of latitude by 1° of longitude centred on the considered meridian and browsing the latitude between 67 and 57° N. The 1° × 1° polygon was considered to be big enough to smooth the small-scale non-homogeneities (at the kilometre scale) and small enough to capture the latitudinal effect, including biome transitions (∼ hundreds of kilometres, e.g. Anisimov et al., 2015). In Fig. 13a, the black line describes the multi-annual (1997–2019) temporal average of the spatial average of the active layer thickness over a 1° × 1° polygon centred on a moving latitude; the grey-shaded area represents the minimum and maximum obtained for this spatial average during the considered period. It can be seen that, in the high-forcing pathway scenario, SSP5-8.5, the active layer thickening would correspond to a 349 km southward shift, while, in the medium scenario, SSP2-4.5, it would correspond to a 124 km southward shift.
Under a permanently changing climatic context, an important question is that regarding the state of thermal equilibrium versus non-equilibrium of the permafrost (Obu et al., 2019): is the climate-change-induced warming slow enough that permafrost may be considered at every time close to the thermal equilibrium with climatic conditions? Or, on the contrary, do the transient effects dominate the thermal dynamics of permafrost under climate change? The simulation results of this work provide information for characterising the degree of thermal equilibrium of the continuous permafrost in a forested study site under various scenarios of climate change. First of all, we emphasise that, since the bottom thermal boundary condition in our modelling is the geothermal heat flux (Duchkov et al., 1997), the assumption of overall thermal equilibrium at depth (<10 m) in the hundreds of metres of the thick permafrost of the Putorana Plateau (Pokrovsky et al., 2005) is implicitly made. Meanwhile, the temperature profiles shown in Fig. 7 demonstrate that, under this assumption, the thermal-equilibrium state of the first 10 m of soil in 2100 depends on both the climate change scenario and the slope aspect. In the NAS, the thermal equilibrium of the first 10 m of soil is achieved by 2100 in every climate scenario, with only a slight shift between the 2100 and (2100+30) conditions in the SSP5-8.5 scenario. Additionally, with sub-zero vertical thermal gradients in each scenario, only small heat exchanges between the surface and the deep layer may occur. On the contrary, by 2100 in the SAS, strong thermal non-equilibrium is encountered in the two high-forcing pathway scenarios, SSP3-7.0 and SSP5-8.5 (Figs. 7 and 8). Under these scenarios, sizable evolutions of temperature profiles are expected between 2100 and 2100+30. Moreover, for these two scenarios, the vertical thermal gradients between 1 and 10 m depth are clearly positive (considering an upward vertical axis), which implies an ongoing heat flux from the surface to the depths. In this case, the permafrost is warming below 10 m at a rate that we implicitly assume to be small enough that it does not modify the total amount of heat stored within this deep permafrost. As such, in scenarios SSP3-7.0 and SSP5-8.5, the climate change clearly induces the transient warming of the permafrost below 10 m depth in the SAS of the Kulingdakan watershed. One could note slightly decreasing trends in the soil temperature under scenarios SSP1-2.6 and SSP2-4.5. This is due to interannual variabilities in both the precipitation and the air temperature in CMIP6 projections (Fig. 2). Therefore, the year 2100 may offer different conditions from those observed in the 2096–2100 average, which is repeated over 30 cycles to assess the equilibrium state of the permafrost,. For example, in SSP2-4.5, the last decade experiences an important annual precipitation peak, up to 475 mm yr−1, centred around 2095, before a decreasing trend in the second part of the decade, ending up with a precipitation of 410 mm yr−1 being projected in 2100. This results, for the year 2100, in a decrease in the snow-cover-insulating effect in winter and, thus, a lowering of the soil surface temperature (Fig. 5) compared to the conditions encountered in the previous decade.
Overall, the results of the present study may be used to improve our understanding of the climate-warming-related changes in the wide areas of boreal forest on continuous permafrost, with implications for continental surfaces (Revich et al., 2022), ecosystems (Wang and Liu, 2022), and element cycles (Schuur et al., 2022) and related global consequences and feedbacks. Mechanistic modelling, although it is computationally costly, is capable of providing quantitative information for these research fields. This approach should be applied in other environmentally monitored boreal watersheds in order to numerically characterise the physical response of permafrost to climate change under various environmental contexts, for instance, in northern Sweden (Auda et al., 2023) and western Siberia (Cazaurang et al., 2023).
The four main conclusions that could be drawn from this numerical study are the following:
-
All climate change scenarios trigger significant soil warming (+1.8 °C in the SAS and +1.5 °C in the NAS under the SSP2-4.5 scenario at 1 m depth according to the presented simulations) and an increase in the active layer thickness (+23 cm / +23 % in the SAS and +15 cm / +23 % in the NAS under the SSP2-4.5 scenario) for both slopes of the Kulingdakan watershed. The projected increase in the active layer thickness under the SSP2-4.5 scenario would be equivalent to a ∼120 km southward shift under current climatic conditions and a ∼350 km southward shift under the SSP5-8.5 scenario.
-
For all climate change scenarios, the combination of soil warming and an increase in precipitation leads to an important increase in evapotranspiration for both slopes (+37 mm / +10 % in the SAS and +51 mm / +14 % in the NAS under the SSP2-4.5 scenario). Meanwhile, the mean annual soil moisture decreases only slightly in the NAS (−2.3 % under the SSP2-4.5 scenario, averaged over the 22 cm of rooting depth), but the decrease is more pronounced in the SAS (−6.0 % under the SSP2-4.5 scenario, averaged over the 68 cm of rooting depth).
-
The important spatial variability observed in the Kulingdakan watershed illustrates the key role of meso-climatic conditions and small-scale geomorphological contrasts in the permafrost response to climate warming.
-
Under the two high-forcing pathway scenarios of climate change, namely SSP3-7.0 and SSP5-8.5, the near-surface permafrost of the SAS of the Kulingdakan watershed is in a non-equilibrium thermal state in 2100, and further investigation is needed to assess whether or not the permafrost below 10 m depth will be close to thermal equilibrium in this region. This indicates the need to develop non-equilibrium modelling approaches for regional and global permafrost modelling under climate change.
The approach developed in this study can be applied to other high-latitude permafrost-affected catchments, provided that the necessary information on the current thermal and hydrological parameters of the soil, as well as on vegetation coverage, is available.
All raw data and simulation cases are accessible via the data portal: https://doi.org/10.6096/1026 (Orgogozo and Xavier, 2024).
The supplement related to this article is available online at: https://doi.org/10.5194/tc-18-5865-2024-supplement.
TX and LO were responsible for the design, implementation, and visualisation of the permaFoam simulations. EAG, SG, and TX designed and carried out the surface simulations. ASP provided observation data. OSP reviewed the paper. LO prepared the paper with contributions from all the co-authors.
The contact author has declared that none of the authors has any competing interests.
Publisher's note: Copernicus Publications remains neutral with regard to jurisdictional claims made in the text, published maps, institutional affiliations, or any other geographical representation in this paper. While Copernicus Publications makes every effort to include appropriate place names, the final responsibility lies with the authors.
This work has been funded by the French National Research Agency ANR (grant no. ANR-19 CE46-0003-01) and benefited from access to the supercomputers of CALMIP (project no. p12166) and GENCI (project no. A0140410794, TGCC). This work was supported by a French government grant managed by the Agence Nationale de la Recherche under the “Investissements d'avenir” programme (reference no. ANR-21-ESRE-0051). Oleg S. Pokrovsky is grateful for the partial support from the TSU Development Programme PRIORITY – 2030 and the project PEACE of PEPR FairCarboN (grant no. ANR-22-PEXF-0011). Anatoly S. Prokushkin is supported by State Assignment no. 0287-2021-0008. Esteban Alonso-González is supported by the European Space Agency through the Climate Change Initiative postdoctoral grant.
This research has been supported by the French National Research Agency ANR (grant nos. ANR-19 CE46-0003-0 and ANR-21-ESRE-0051), the TSU Development Programme PRIORITY – 2030 and the project PEACE of PEPR FairCarboN (grant no. ANR-22-PEXF-0011), State Assignment no. 0287-2021-0008, and the European Space Agency (through the Climate Change Initiative postdoctoral grant).
This paper was edited by Philipp de Vrese and reviewed by two anonymous referees.
Alonso-González, E., Aalstad, K., Baba, M. W., Revuelto, J., López-Moreno, J. I., Fiddes, J., Essery, R., and Gascoin, S.: The Multiple Snow Data Assimilation System (MuSA v1.0), Geosci. Model Dev., 15, 9127–9155, https://doi.org/10.5194/gmd-15-9127-2022, 2022.
Anisimov, O. A., Zhiltcova, Y. L., and Razzhivin, V. Y.: Predictive modeling of plant productivity in the Russian Arctic using satellite data, Izv. Atmos. Ocean. Phy.+, 51, 1051–1059, https://doi.org/10.1134/S0001433815090042, 2015.
Arndal, M. F. and Topp-Jørgensen, E. (Eds.): INTERACT Station Catalogue – 2020, DCE – Danish Centre for Environment and Energy, Aarhus University, Denmark, 190 pp., ISBN 978-87-93129-15-3, https://www.eu-interact.org (last access: 11 April 2024), 2020.
Auda, Y., Lundin, E. J., Gustafsson, J., Pokrovsky, O. S., Cazaurang, S., and Orgogozo, L.: A new land cover map of two watersheds under long-term environmental monitoring in the Swedish Arctic using Sentinel-2 data, Water, 15, 3311, https://doi.org/10.3390/w15183311, 2023.
Bartsch, A., Pointner, G., Nitze, I., Efimova, A., Jakober, D., Ley, S., Högström, E., Grosse, G., and Schweitzer, P.: Expanding infrastructure and growing anthropogenic impacts along Arctic coasts, Environ. Res. Lett., 16, 115013, https://doi.org/10.1088/1748-9326/ac3176, 2021.
Biskaborn, B. K., Smith, S. L., Noetzli, J., Matthes, H., Vieira, G., Streletskiy, D. A., Schoeneich, P., Romanovsky, V. E., Lewkowicz, A. G., Abramov, A., Allard, M., Boike, J., Cable, W. L., Christiansen, H. H., Delaloye R., Diekmann, B., Drozdov, D., Etzelmüller, B., Grosse, G., Guglielmin M., Ingeman-Nielsen, T., Isaksen, K., Ishikawa, M., Johansson, M., Johannson, H., Joo, A., Kaverin, D., Kholodov, A., Konstantinov, P., Kröger, T., Lambiel, C., Lanckman, J.-P., Luo, D., Malkova, G., Meiklejohn, I., Moskalenko, N., Oliva, M., Phillips, M., Ramos, M., Sannel, A. B. K., Sergeev, D., Seybold, C., Skryabin, P., Vasiliev, A., Wu, Q., Yoshikawa, K., Zheleznyak, M., and Lantuit, H.: Permafrost is warming at a global scale, Nat. Commun., 10, 264, https://doi.org/10.1038/s41467-018-08240-4, 2019.
Blok, D., Heijmans, M. M. P. D., Schaepman-Strub, G., Van Ruijven, F., Parmentier, F. J. W., and Maximov, T. C.: The cooling capacity of mosses: Controls on water and energy fluxes in a Siberian tundra site, Ecosystems, 14, 1055–1065, https://doi.org/10.1007/s10021-011-9463-5, 2011.
Braithwaite, R. J. and Olesen, O. B.: Calculation of glacier ablation from air temperature, West Greenland, in: Glacier Fluctuations and Climatic Change, edited by: Oerlemans, J., Kluwer Academic Publishers, 219–233, https://research.manchester.ac.uk/en/publications/calculation-of-glacier-ablation-from-air-temperature-west-greenla (last access: 10 December 2024), 1989.
Cable, W. L., Romanovsky, V. E., and Jorgenson, M. T.: Scaling-up permafrost thermal measurements in western Alaska using an ecotype approach, The Cryosphere, 10, 2517–2532, https://doi.org/10.5194/tc-10-2517-2016, 2016.
Cazaurang, S., Marcoux, M., Pokrovsky, O. S., Loiko, S. V., Lim, A. G., Audry, S., Shirokova, L. S., and Orgogozo, L.: Numerical assessment of morphological and hydraulic properties of moss, lichen and peat from a permafrost peatland, Hydrol. Earth Syst. Sci., 27, 431–451, https://doi.org/10.5194/hess-27-431-2023, 2023.
Clark, J. A., Tape, K. D., and Young-Robertson, J. M.: Quantifying evapotranspiration from dominant Arctic vegetation types using lysimeters, Ecohydrology, 16, e2484, https://doi.org/10.1002/eco.2484, 2023.
de Vrese, P., Georgievski, G., Gonzalez Rouco, J. F., Notz, D., Stacke, T., Steinert, N. J., Wilkenskjeld, S., and Brovkin, V.: Representation of soil hydrology in permafrost regions may explain large part of inter-model spread in simulated Arctic and subarctic climate, The Cryosphere, 17, 2095–2118, https://doi.org/10.5194/tc-17-2095-2023, 2023.
Dominé, F., Fourteau, K., Picard, G., Lackner, G., Sarrazin, D., and Poirier, M.: Permafrost cooled in winter by thermal bridging through snow-covered shrub branches, Nat. Geosci., 15, 554–560, https://doi.org/10.1038/s41561-022-00979-2, 2022.
Duchkov, A. D., Sokolova, L. S., Balobaev, V. T., Devyatkin, V. N., Kononov, V. I., and Lysak, S. V.: Heat flow and geothermal field in Siberia, Geol. Geofiz., 38, 1716–1729, 1997.
Essery, R.: A factorial snowpack model (FSM 1.0), Geosci. Model Dev., 8, 3867–3876, https://doi.org/10.5194/gmd-8-3867-2015, 2015.
Eyring, V., Bony, S., Meehl, G. A., Senior, C. A., Stevens, B., Stouffer, R. J., and Taylor, K. E.: Overview of the Coupled Model Intercomparison Project Phase 6 (CMIP6) experimental design and organization, Geosci. Model Dev., 9, 1937–1958, https://doi.org/10.5194/gmd-9-1937-2016, 2016.
Fan, X., Duan, Q., Shen, C., Wu, Y., and Xing, C.: Global surface air temperatures in CMIP6: Historical performance and future changes, Environ. Res. Lett., 15, 104056, https://doi.org/10.1088/1748-9326/abb051, 2020.
Fedorov, A. N., Konstantinov, P. Y., Vasilyev, N. F., and Shestakova, A. A.: The influence of boreal forest dynamics on the current state of permafrost in Central Yakutia, Polar Sci., 22, 100483, https://doi.org/10.1016/j.polar.2019.100483, 2019.
Frolking, S.: Sensitivity of spruce/moss boreal forest net ecosystem productivity to seasonal anomalies in weather, J. Geophys. Res., 102, 29053–29064, https://doi.org/10.1029/96JD03707, 1997.
Gauthier, S., Bernier, P., Kuuluvainen, T., Shvidenko, A. Z., and Schepaschenko, D. G.: Boreal forest health and global change, Science, 349, 819–822, https://doi.org/10.1126/science.aaa9092, 2015.
Gentsch, N.: Permafrost Soils in Central Siberia: Landscape Controls on Soil Organic Carbon Storage in a Light Taiga Biome, Akademische Verlagsgemeinschaft München, Munich, Germany, ISBN 978-3-86924-015-2, 2011.
Haesen, S., Lembrechts, J. J., De Frenne, P., Lenoir, J., Aalto, J., Ashcroft, M. B., Kopecký, M., Luoto, M., Maclean, I., Nijs, I., Niittynen, P., van den Hoogen, J., Arriga, N., Brůna, J., Buchmann, N., Čiliak, M., Collalti, A., De Lombaerde, E., Descombes, P., Gharun, M., Goded, I., Govaert, S., Greiser, C., Grelle, A., Gruening, C., Hederová, L., Hylander, K., Kreyling, J., Kruijt, B., Macek, M., Máliš, F., Man, M., Manca, G., Matula, R., Meeussen, C., Merinero, S., Minerbi, S., Montagnani, L., Muffler, L., Ogaya, R., Penuelas, J., Plichta, R., Portillo-Estrada, M., Schmeddes, J., Shekhar, A., Spicher, F., Ujházyová, M., Vangansbeke, P., Weigel, R., Wild, J., Zellweger, F., and Van Meerbeek, K.: ForestTemp – Sub-canopy microclimate temperatures of European forests, Global Change Biol., 27, 6307–6319, https://doi.org/10.1111/gcb.15892, 2021.
Hamm, A. and Frampton, A.: Impact of lateral groundwater flow on hydrothermal conditions of the active layer in a high-Arctic hillslope setting, The Cryosphere, 15, 4853–4871, https://doi.org/10.5194/tc-15-4853-2021, 2021.
Hamon, W. R.: Computation of direct runoff amounts from storm rainfall, International Association of Scientific Hydrological Sciences Publication, 63, 52–62, 1963.
Heijmans, M. M. P. D., Magnússon, R. Í. Lara, M. J., Frost, G. V., Myers-Smith, I. H., Van Huissteden, J., Jorgenson, M. T., Fedorov, A. N., Epstein, H. E., Lawrence, D. M., and Limpens, J.: Tundra vegetation change and impacts on permafrost, Nat. Rev. Earth Environ., 3, 68–84, https://doi.org/10.1038/s43017-021-00233-0, 2022.
Hersbach, H., Bell, B., Berrisford, P., Hirahara, S., Horányi, A., Muñoz-Sabater, J., Nicolas, J., Peubey, C., Radu, R., Schepers, D., Simmons, A., Soci, C., Abdalla, S., Abellan, X., Balsamo, G., Bechtold, P., Biavati, G., Bidlot, J., Bonavita, M., De Chiara, G., Dahlgren, P., Dee, D., Diamantakis, M., Dragani, R., Flemming, J., Forbes, R., Fuentes, M., Geer, A., Haimberger, L., Healy, S., Hogan, R. J., Hólm, E., Janisková, M., Keeley, S., Laloyaux, P., Lopez, P., Lupu, C., Radnoti, G., de Rosnay, P., Rozum, I., Vamborg, F., Villaume, S., and Thépaut, J.-N.: The ERA5 global reanalysis, Q. J. Roy. Meteor. Soc., 146, 1999–2049, https://doi.org/10.1002/qj.3803, 2020.
Hjort, J., Karjalainen, O., Aalto, J., Westermann, S., Romanovky, V. E., Nelson, F. E., Etzelmüller, B., and Luoto, M.: Degrading permafrost puts Arctic infrastructure at risk by mid-century, Nat. Commun., 9, 5147, https://doi.org/10.1038/s41467-018-07557-4, 2018.
Hjort, J., Streletskiy, D., Doré, G., Wu, Q., Bjella, K., and Luoto, M.: Impacts of permafrost degradation on infrastructure, Nat. Rev. Earth Environ., 3, 24–38, https://doi.org/10.1038/s43017-021-00247-8, 2022.
Hock, R.: Temperature index melt modelling in mountain areas, J. Hydrol., 282, 104–115, https://doi.org/10.1016/S0022-1694(03)00257-9, 2003.
Holloway, J. E., Lewkowicz, A. G., Douglas, T. A., Li, X., Turetsky, M. R., Baltzer, J. L., and Huijun, J.: Impact of wildfire on permafrost landscapes: A review of recent advances and future prospects, Permafrost Periglac., 31, 371–382, https://doi.org/10.1002/ppp.2048, 2020.
Hu, G., Zhao, L., Wu, T., Wu, X., Park, H., Li, R., Zhu, X., Ni, J., Zou, D., Hao, J., and Li, W.: Continued warming of the permafrost regions over the Northern Hemisphere under future climate change, Earths Future, 10, e2022EF002835, https://doi.org/10.1029/2022EF002835, 2022.
Hu, G., Zhao, L., Li, R., Park, H., Wu, X., Su, Y., Guggenberger, G., Wu, T., Zou, D., Zhu, X., Zhang, W., Wu, Y., and Hao, J.: Water and heat coupling processes and its simulation in frozen soils: Current status and future research directions, CATENA, 222, 106844, https://doi.org/10.1016/j.catena.2022.106844, 2023.
Iturbide, M., Fernández, J., Gutiérrez, J. M., Bedia, J., Cimadevilla, E., Díez-Sierra, J., Manzanas, R., Casanueva, A., Baño-Medina, J., Milovac, J., Herrera, S., Cofiño, A. S., San Martín, D., García-Díez, M., Hauser, M., Huard, D., and Yelekci, Ö.: Repository supporting the implementation of FAIR principles in the IPCC-WG1 Atlas, Zenodo, https://doi.org/10.5281/zenodo.3691645, 2022.
Jan, A.: Modeling the role of lateral surface flow in low-relief polygonal tundra, Permafrost Periglac., 33, 214–225, https://doi.org/10.1002/ppp.2145, 2022.
Jan, A. and Painter, S. L.: Permafrost thermal conditions are sensitive to shifts in snow timing, Environ. Res. Lett., 15, 084026, https://doi.org/10.1088/1748-9326/ab8ec4, 2020.
Ji, H., Nan, Z., Hu, J., Zhao, Y., and Zhang, Y.: On the spin-up strategy for spatial modeling of permafrost dynamics: A case study on the Qinghai-Tibet Plateau, J. Adv. Model. Earth Sy., 14, e2021MS002750, https://doi.org/10.1029/2021MS002750, 2022.
Jin, H., Huang, Y., Bense, V. F., Ma, Q., Marchenko, S. S., Shepelev, V. V., Hu, Y., Liang, S., Spektor, V. V., Jin, X., Li, X., and Li, X.: Permafrost degradation and its hydrogeological impacts, Water, 14, 372, https://doi.org/10.3390/w14030372, 2022.
Karjalainen, O., Aalto, J., Luoto, M., Westermann, S., Romanovsky, V. E., Nelson, F. E., Etzelmüller B., and Hjort J.: Circumpolar permafrost maps and geohazard indices for near-future infrastructure risk assessments, Sci. Data, 6, 190037, https://doi.org/10.1038/sdata.2019.37, 2019.
Karlsson, J., Serikova, S., Vorobyev, S. N., Rocher-Ros, G., Denfeld, B., and Pokrovsky, O. S.: Carbon emission from Western Siberian inland waters, Nat. Commun., 12, 825, https://doi.org/10.1038/s41467-021-21054-1, 2021.
Khani, H. M., Kinnard, C., Gascoin, S., and Lévesque, E.: Fine-scale environment control on ground surface temperature and thaw depth in a High Arctic tundra landscape, Permafrost Periglac., 34, 467–480, https://doi.org/10.1002/ppp.2203, 2023.
Kim, J.-S., Kug, J. S., Jeong, S. J., Park, H., and Schaepman-Strub, G.: Extensive fires in southeastern Siberian permafrost linked to preceding Arctic Oscillation, Sci. Adv., 6, eaax3308, https://doi.org/10.1126/sciadv.aax3308, 2020.
Kirdyanov, A. V., Saurer, M., Siegwolf, R., Knorre, A. A., Prokushkin, A. S., Churakova (Sidorova), O. V., Fonti, M. V., and Büntgen, U.: Long-term ecological consequences of forest fires in the continuous permafrost zone of Siberia, Environ. Res. Lett., 15, 034061, https://doi.org/10.1088/1748-9326/ab7469, 2020.
Kirdyanov, A. V., Saurer, M., Arzac, A., Knorre, A. A., Prokushkin, A. S., Churakova (Sidorova), O. V., Arosio, T., Bebchuk, T., Siegwolf, R., and Büntgen, U.: Thawing permafrost can mitigate warming-induced drought stress in boreal forest trees, Sci. Total Environ., 912, 168858, https://doi.org/10.1016/j.scitotenv.2023.168858, 2024.
Kurylyk, B. L.: Engineering challenges of warming, Nat. Clim. Change, 9, 807–808, https://doi.org/10.1038/s41558-019-0612-8, 2019.
Kurylyk, B. L. and Watanabe, K.: The mathematical representation of freezing and thawing processes in variably-saturated, non-deformable soils, Adv. Water Resour., 60, 160–177, https://doi.org/10.1016/j.advwatres.2013.07.016, 2013.
Lamontagne-Hallé, P., McKenzie, J. M., Kurylyk, B. L., and Zipper, S. C.: Changing groundwater discharge dynamics in permafrost regions, Environ. Res. Lett., 13, 084017, https://doi.org/10.1088/1748-9326/aad404, 2018.
Li, C., Wei, Y., Liu, Y., Li, L., Peng, L., Chen, J., Liu L., Dou, T., and Wu, X.: Active layer thickness in the Northern Hemisphere: Changes from 2000 to 2018 and future simulations, J. Geophys. Res.-Atmos., 127, e2022JD036785, https://doi.org/10.1029/2022JD036785, 2022.
Li, G., Zhang, M., Pei, W., Melnikov, A., Khristoforov, I., Li, R., and Yu, F.: Changes in permafrost extent and active layer thickness in the Northern Hemisphere from 1969 to 2018, Sci. Total Environ., 804, 150182, https://doi.org/10.1016/j.scitotenv.2021.150182, 2022.
Li, X.-Y., Jin, H.-J., Wang, H.-W., Marchenko, S. S., Shan, W., Luo, D.-L., He, R.-X., Spektor, V., Huang, Y.-D., Li, X.-Y., and Jia, N.: Influences of forest fires on the permafrost environment: A review, Advances in Climate Change Research, 12, 48–65, https://doi.org/10.1016/j.accre.2021.01.001, 2021.
Loranty, M. M., Abbott, B. W., Blok, D., Douglas, T. A., Epstein, H. E., Forbes, B. C., Jones, B. M., Kholodov, A. L., Kropp, H., Malhotra, A., Mamet, S. D., Myers-Smith, I. H., Natali, S. M., O'Donnell, J. A., Phoenix, G. K., Rocha, A. V., Sonnentag, O., Tape, K. D., and Walker, D. A.: Reviews and syntheses: Changing ecosystem influences on soil thermal regimes in northern high-latitude permafrost regions, Biogeosciences, 15, 5287–5313, https://doi.org/10.5194/bg-15-5287-2018, 2018.
Makarieva, O., Nesterova, N., Post, D. A., Sherstyukov, A., and Lebedeva, L.: Warming temperatures are impacting the hydrometeorological regime of Russian rivers in the zone of continuous permafrost, The Cryosphere, 13, 1635–1659, https://doi.org/10.5194/tc-13-1635-2019, 2019.
Mashukov, D. A., Benkova, A. V., Benkova, V. E., Shashkin, A., and Prokushkin, A.: Radial growth and anatomic structure of the trunk wood of healthy and stag-headed larch trees on permafrost, Contemp. Probl. Ecol., 14, 767–774, https://doi.org/10.1134/S1995425521070143, 2021.
Miner, K. R., Turetsky, M. R., Malina, E., Bartsch, A., Tamminen, J., McGuire, D., Fix, A., Sweeney, C., Elder, C. D., and Miller, C. E.: Permafrost carbon emissions in a changing Arctic, Nat. Rev. Earth Environ., 3, 55–67, https://doi.org/10.1038/s43017-021-00230-3, 2022.
Nitzbon, J., Krinner, G., Schneider von Deimling, T., Werner, M., and Langer, M.: First quantification of the permafrost heat sink in the Earth's climate system, Geophys. Res. Lett., 50, e2022GL102053, https://doi.org/10.1029/2022GL102053, 2023.
Nitze, I., Grosse, G., Jones, B. M., Romanovsky V. E., and Boike, J.: Remote sensing quantifies widespread abundance of permafrost region disturbances across the Arctic and Subarctic, Nat. Commun., 9, 5423, https://doi.org/10.1038/s41467-018-07663-3, 2018.
Obu, J., Westermann, S., Bartsch, A., Berdnikov, N., Christiansen, H. H., Dashtseren, A., Delaloye, R., Elberling, B., Etzelmüller, B., Kholodov, A., Khomutov, A., Kääb, A., Leibman, M. O., Lewkowicz, A. G., Panda, S. K., Romanovsky, V., Way, R. G., Westergaard-Nielsen, A., Wu, T., Yamkhin, J., and Zou, D.: Northern Hemisphere permafrost map based on TTOP modelling for 2000–2016 at 1 km2 scale, Earth-Sci. Rev., 193, 299–316, https://doi.org/10.1016/j.earscirev.2019.04.023, 2019.
Oehri, J., Schaepman-Strub, G., Kim, J. S., Grysko, R., Kropp, H., Grünberg, I., Zemlianskii, V., Sonnentag, O., Euskirchen, E. S., Chacko, M. R., Muscari, G., Blanken, P. D., Dean, J. F., di Sarra, A., Harding, R. J., Sobota, I., Kutzbach, L., Plekhanova, E., Riihelä, A., Boike, J., Miller, N. B., Beringer, J., Lopez-Blanco, E., Stoy, P. C., Sullivan, R. C., Kejna, M., Parmentier, F. J. W., Gamon, J. A., Mastepanov, M., Wille, C., Jackowicz-Korczynski, M., Karger, D. N., Quinton, W. L., Putkonen, J., van As, D., Christensen, T. R., Hakuba, M. Z., Stone, R. S., Metzger, S., Vandecrux, B., Frost, G. V., Wild, M., Hansen, B., Melonie, D., Domine, F., Te Beest, M., Sachs, T., Kalhori, A., Rocha, A. V., Williamson, S. N., Morris, S., Atchley, A. L., Essery, R., Runkle, B. R. K., Holl, D., Riihimaki, L. D., Iwata, H., Schuur, E. A. G., Cox, C. J., Grachev, A. A., McFadden, J. P., Fausto, R. S., Göckede, M., Ueyama, M., Pirk, N., de Boer, G., Bret-Harte, M. S., Leppäranta, M., Steffen, K., Friborg, T., Ohmura, A., Edgar, C. W., Olofsson, J., and Chambers, S. D.: Vegetation type is an important predictor of the arctic summer land surface energy budget, Nat. Commun., 13, 6379, https://doi.org/10.1038/s41467-022-34049-3, 2022.
O'Neill, B. C., Tebaldi, C., van Vuuren, D. P., Eyring, V., Friedlingstein, P., Hurtt, G., Knutti, R., Kriegler, E., Lamarque, J.-F., Lowe, J., Meehl, G. A., Moss, R., Riahi, K., and Sanderson, B. M.: The Scenario Model Intercomparison Project (ScenarioMIP) for CMIP6, Geosci. Model Dev., 9, 3461–3482, https://doi.org/10.5194/gmd-9-3461-2016, 2016.
Orgogozo, L. and Xavier, T.: Permafrost mechanistical simulation with the permaFoam solver in the Kulingdakan watershed (Central Siberia) based on CMIP6 scenarios (2014–2100), Theia [data set], https://doi.org/10.6096/1026, 2024.
Orgogozo, L., Prokushkin, A. S., Pokrovsky, O. S., Grenier, C., Quintard, M., Viers, J., and Audry, S.: Water and energy transfer modeling in a permafrost-dominated, forested catchment of Central Siberia: The key role of rooting depth, Permafrost Periglac., 30, 75–89, https://doi.org/10.1002/ppp.1995, 2019.
Orgogozo, L., Xavier, T., Oulbani, H., and Grenier, C.: Permafrost modelling with OpenFOAM®: New advancements of the permaFoam solver, Comput. Phys. Commun., 282, 108541, https://doi.org/10.1016/j.cpc.2022.108541, 2023.
Park, H., Tanoue, M., Sugimoto, A., Ichiyanagi, K., Iwahana, G., and Hiyama, T.: Quantitative separation of precipitation and permafrost waters used for evapotranspiration in a boreal forest: A numerical study using tracer model, J. Geophys. Res.-Biogeo., 126, e2021JG006645, https://doi.org/10.1029/2021JG006645, 2021.
Park, S. W. and Kug, J. S.: A decline in atmospheric CO2 levels under negative emissions may enhance carbon retention in the terrestrial biosphere, Commun. Earth Environ., 3, 289, https://doi.org/10.1038/s43247-022-00621-4, 2022.
Park, S. W., Kim, J. S., and Kug, J. S.: The intensification of Arctic warming as a result of CO2 physiological forcing, Nat. Commun., 11, 2098, https://doi.org/10.1038/s41467-020-15924-3, 2020.
Pokrovsky, O. S., Schott, J. S., Kudryavtzev, D. I., and Dupré, B.: Basalt weathering in Central Siberia under permafrost conditions, Geochim. Cosmochim. Ac., 69, 5659–5680, 2005.
Porter, C., Howat, I., Noh, M.-J., Husby, E., Khuvis, S., Danish, E., Tomko, K., Gardiner, J., Negrete, A., Yadav, B., Klassen, J., Kelleher, C., Cloutier, M., Bakker, J., Enos, J., Arnold, G., Bauer, G., and Morin, P.: ArcticDEM – Mosaics, Version 4.1, Harvard Dataverse, V1, https://doi.org/10.7910/DVN/3VDC4W, 2023.
Prokushkin, A., Kajimoto, T., Prokushkin, S., McDowell, W., Abaimov, A. P., and Matsuura, Y.: Climatic factors influencing fluxes of dissolved organic carbon from the forest floor in a continuous-permafrost Siberian watershed, Can. J. Forest Res., 35, 2130–2140, https://doi.org/10.1139/x05-150, 2004.
Prokushkin, A. S., Gleixner, G., McDowell, W. H., Ruehlow, S., and Schulze, E.-D.: Source- and substrate-specific export of dissolved organic matter from permafrost-dominated forested watershed in central Siberia, Global Biogeochem. Cy., 21, GB4003, https://doi.org/10.1029/2007GB002938, 2007.
Ramage, J., Jungsberg, L., Wang, S., Westermann, S., Lantuit, H., and Heleniak, T.: Population living on permafrost in the Arctic, Popul. Environ., 43, 22–38, https://doi.org/10.1007/s11111-020-00370-6, 2021.
Revich, B. A., Eliseev, D. O., and Shaposhnikov, D. A.: Risks for public health and social infrastructure in Russian Arctic under climate change and permafrost degradation, Atmosphere-Basel, 13, 532, https://doi.org/10.3390/atmos13040532, 2022.
Rew, L. J., McDougall, K. L., Alexander, J. M., Daehler, C. C., Essl, F., Haider, S., Kueffer, C., Lenoir, J., Milbau, A., Nuñez, M. A., Pauchard, A., and Rabitsch, W.: Moving up and over: Redistribution of plants in alpine, Arctic, and Antarctic ecosystems under global change, Arct. Antarct. Alp. Res., 52, 651–665, https://doi.org/10.1080/15230430.2020.1845919, 2020.
Schneider von Deimling, T., Lee, H., Ingeman-Nielsen, T., Westermann, S., Romanovsky, V., Lamoureux, S., Walker, D. A., Chadburn, S., Trochim, E., Cai, L., Nitzbon, J., Jacobi, S., and Langer, M.: Consequences of permafrost degradation for Arctic infrastructure – bridging the model gap between regional and engineering scales, The Cryosphere, 15, 2451–2471, https://doi.org/10.5194/tc-15-2451-2021, 2021.
Schuur, E. A. G., Abbott, B. W., Commane, R., Ernakovich, J., Euskirchen, E., Hugelius, G., Grosse, G., Jones, M., Koven, C., Leshyk, V., Lawrence, D., Loranty, M. M., Mauritz, M., Olefeldt, D., Natali, S., Rodenhizer, H., Salmon, V., Schädel, C., Strauss, J., Treat, C., and Turetsky, M.: Permafrost and climate change: Carbon cycle feedbacks from the warming Arctic, Annu. Rev. Env. Resour., 47, 343–371, 2022.
Shiklomanov, N. I., Streletskiy, D. A., Swales, T. B., and Kokorev, V. A.: Climate change and stability of urban infrastructure in Russian permafrost regions: Prognostic assessment based on GCM climate projections, Geogr. Rev., 107, 125–142, https://doi.org/10.1111/gere.12214, 2017.
Sjöberg, Y., Coon, E., Sannel, A. B. K., Pannetier, R., Harp, D., Frampton, A., Painter, S. L., and Lyon, S. W.: Thermal effects of groundwater flow through subarctic fens: A case study based on field observations and numerical modeling, Water Resour. Res., 52, 1591–1606, https://doi.org/10.1002/2015WR017571, 2016.
Sonke, J. E., Teisserenc, R., Heimbürger-Boavida, L.-E., Petrova, M. V., Marusczak, N., Le Dantec, T., Chupakov, A. V., Li, C., Thackray, C. P., Sunderland, E. M., Tananaev, N., and Pokrovsky, O. S.: Eurasian river spring flood observations support net Arctic Ocean mercury export to the atmosphere and Atlantic Ocean, P. Natl. Acad. Sci. USA, 115, E11586–E11594, https://doi.org/10.1073/pnas.1811957115, 2018.
Speetjens, N. J., Hugelius, G., Gumbricht, T., Lantuit, H., Berghuijs, W. R., Pika, P. A., Poste, A., and Vonk, J. E.: The pan-Arctic catchment database (ARCADE), Earth Syst. Sci. Data, 15, 541–554, https://doi.org/10.5194/essd-15-541-2023, 2023.
Streletskiy, D. A., Suter, L. J., Shiklomanov, N. I., Porfiriev, B. N., and Eliseev, D. O.: Assessment of climate change impacts on buildings, structures and infrastructure in the Russian regions on permafrost, Environ. Res. Lett., 14, 025003, https://doi.org/10.1088/1748-9326/aaf5e6, 2019.
Streletskiy, D. A., Clemens, S., Lanckman, J.-P., and Shiklomanov, N. I.: The costs of Arctic infrastructure damages due to permafrost degradation, Environ. Res. Lett., 18, 015006, https://doi.org/10.1088/1748-9326/acab18, 2023.
Stuenzi, S. M., Boike, J., Gädeke, A., Herzschuh, U., Kruse, S., Pestryakova, L. A., Westermann, S., and Langer, M.: Sensitivity of ecosystem-protected permafrost under changing boreal forest structures, Environ. Res. Lett., 16, 084045, https://doi.org/10.1088/1748-9326/ac153d, 2021.
van Vuuren, D. P., Edmonds, J., Thomson, A., Riahi, K., Kainuma, M., Matsui, T., Hurtt, G. C., Lamarque, J.-F., Meinshausen, M., Smith, S., Granier, C., Rose, S. K., and Hibbard, K. A.: The representative concentration pathways: An overview, Climatic Change, 109, 5–31, https://doi.org/10.1007/s10584-011-0148-z, 2011.
Viers, J., Prokushkin, A. S., Pokrovsky, O. S., Auda, Y., Kirdyanov, A. V., Beaulieu, E., Zouiten, C., Oliva, P., and Dupré, B.: Seasonal and spatial variability of elemental concentrations in boreal forest larch foliage of Central Siberia on continuous permafrost, Biogeochemistry, 113, 435–449, https://doi.org/10.1007/s10533-012-9770-8, 2013.
Vitasse, Y., Porté, A. J., Kremer, A., Michalet, R., and Delzon, S.: Responses of canopy duration to temperature changes in four temperate tree species: Relative contributions of spring and autumn leaf phenology, Oecologia, 161, 187–198, https://doi.org/10.1007/s00442-009-1363-4, 2009.
Vitasse, Y., François, C., Delpierre, N., Dufrêne, E., Kremer, A., Chuine, I., and Delzon S.: Assessing the effects of climate change on the phenology of European temperate trees, Agr. Forest Meteorol., 151, 969–980, https://doi.org/10.1016/j.agrformet.2011.03.003, 2011.
Vonk, J. E., Speetjens, N. J., and Poste, A. E.: Small watersheds may play a disproportionate role in arctic land-ocean fluxes, Nat. Commun., 14, 3442, https://doi.org/10.1038/s41467-023-39209-7, 2023.
Walvoord, M. A. and Kurylyk, B. L.: Hydrologic impacts of thawing permafrost – A review, Vadose Zone J., 15, 1–20, https://doi.org/10.2136/vzj2016.01.0010, 2016.
Walvoord, M. A. and Striegl, R. G.: Complex vulnerabilities of the water and aquatic carbon cycles to permafrost thaw, Front. Clim., 3, 730402, https://doi.org/10.3389/fclim.2021.730402, 2021.
Wang, J. and Liu, D.: Vegetation green-up date is more sensitive to permafrost degradation than climate change in spring across the northern permafrost region, Global Change Biol., 28, 1569–1582, https://doi.org/10.1111/gcb.16011, 2022.
Weller, H. G., Tabor, G., Jasak, H., and Fureby, C.: A tensorial approach to computational continuum mechanics using object orientated techniques, Comput. Phys., 12, 620–631, https://doi.org/10.1063/1.168744, 1998.
Westermann, S., Barboux, C., Bartsch, A., Delaloye, R., Grosse, G., Heim, B., Hugelius, G., Irrgang, A., Kääb, A. M., Matthes, H., Nitze, I., Pellet, C., Seifert, F. M., Strozzi, T., Wegmüller, U., Wieczorek, M., and Wiesmann, A.: ESA Permafrost Climate Change Initiative (Permafrost_cci): Permafrost active layer thickness for the Northern Hemisphere, v4.0, NERC EDS Centre for Environmental Data Analysis, https://doi.org/10.5285/d34330ce3f604e368c06d76de1987ce5,, 24 April 2024.
Wright, S. N., Thompson, L. M., Olefeldt, D., Connon, R. F., Carpino, O. A., Beel, C. R., and Quinton, W. L.: Thaw-induced impacts on land and water in discontinuous permafrost: A review of the Taiga Plains and Taiga Shield, northwestern Canada, Earth-Sci. Rev., 232, 104104, https://doi.org/10.1016/j.earscirev.2022.104104, 2022.
Zellweger, F., Coomes, D., Lenoir, J., Depauw, L., Maes, S. L., Wulf, M., Kirby, K. J., Brunet, J., Kopecky, M., Malis, F., Schmidt, W., Heinrichs, S., den Ouden, J., Jaroszewicz, B., Buyse, G., Spicher, F., Verheyen, K., and De Frenne, P.: Seasonal drivers of understorey temperature buffering in temperate deciduous forests across Europe, Global Ecol. Biogeogr., 28, 1774–1786, https://doi.org/10.1111/geb.12991, 2019.
Zellweger, F., De Frenne, P., Lenoir, J., Vangansbeke, P., Verheyen, K., Bernhardt-Römermann, M., Baeten, L., Hédl, R., Berki, I., Brunet, J., Van Calster, H., Chudomelova, M., Decocq, G., Dirnböck, T., Durak, T., Heinken, T., Jaroszewicz, B., Kopecky M., Malis, F., Macek, M., Malicki, M., Naaf, T., Nagel, A. T., Ortmann-Ajlai, A., Petrik, P., Pielech, R., Reczynska, K., Schmidt, W., Standovar, T., Swierkosz, K., Teleki, B., Vild, O., Wulf, M., and Coomes, D.: Forest microclimate dynamics drive plant responses to warming, Science, 368, 772–775, https://doi.org/10.1126/science.aba6880, 2020.


