the Creative Commons Attribution 4.0 License.
the Creative Commons Attribution 4.0 License.
Using deep learning and multi-source remote sensing images to map landlocked lakes in Antarctica
Anyao Jiang
Xin Meng
Yan Huang
Antarctic landlocked lake open water (LLOW) plays an important role in the Antarctic ecosystem and serves as a reliable climate indicator. However, since field surveys are currently the main method to study Antarctic landlocked lakes, the spatial and temporal distribution of landlocked lakes across Antarctica remains understudied. We first developed an automated detection workflow for Antarctic LLOW using deep learning and multi-source satellite images. The U-Net model and LLOW identification model achieved average F1 scores of 0.90 and 0.89 on testing datasets, respectively, demonstrating strong spatiotemporal robustness across various study areas. We chose four typical ice-free areas located along coastal Antarctica as our study areas. After applying our LLOW identification model to a total of 79 Landsat 8 Operational Land Imager (OLI) images and 330 Sentinel-1 synthetic aperture radar (SAR) images in these four areas, we generated high-spatiotemporal-resolution LLOW time series from January to April between 2017 and 2021. We analyzed the fluctuation of LLOW areas in the four study areas and found that during expansion of LLOW, over 90 % of the changes were explained by positive degree days, while during contraction, negative degree day changes accounted for more than 50 % of the LLOW area fluctuations. It is shown that our model can provide long-term LLOW time series products that help us better understand how lakes change under a changing climate.
- Article
(6509 KB) - Full-text XML
-
Supplement
(925 KB) - BibTeX
- EndNote
Antarctic lakes play a crucial role in the ecosystem of Antarctica and are reliable indicators of climate change (Lyons et al., 2006). These lakes can be divided into three main types: landlocked lakes, epiglacial lakes, and supraglacial lakes. Landlocked lakes, located in local depressions and usually free of ice during austral summer, primarily receive water inflow from the melting of seasonal snow cover (Shevnina et al., 2021). Epiglacial lakes are situated at the boundary between areas of rock and ice, and melting of the glacier ice is the main source of water inflow into them. Supraglacial lakes are found on the surface of ice sheets, glaciers, and ice shelves, forming during the summer melt (Hodgson, 2012).
Extensive research confirms diverse microorganisms in Antarctic lakes, including prokaryotes like bacteria and eukaryotes such as phytoplankton (Parnikoza and Kozeretska, 2020; Izaguirre et al., 2021; Keskitalo et al., 2013; Rochera and Camacho, 2019). Cyanobacteria play a crucial role in primary production and nutrient cycling, as highlighted by studies on their diversity and distribution (Taton et al., 2006; Komárek et al., 2012), alongside findings on unique microbial assemblages, such as Hymenobacter sp., and diverse bacterial communities (Koo et al., 2014; Huang et al., 2014; Carvalho et al., 2008; Papale et al., 2017). These studies underscore the ecological importance and high diversity of Antarctic lake ecosystems.
Antarctic lakes are rather sensitive to environmental change, especially under a warming climate (Quayle Wendy et al., 2002). Seasonally ice-covered lakes magnify the warming trends observed in air temperature (Convey and Peck, 2019). Recent studies have highlighted the impact of increased temperature and melting of snowfields and glaciers on Antarctic lakes (Izaguirre et al., 2021; Stokes et al., 2019). In particular, the changes in the lake-ice and open water area can have significant implications for the lake environment, affecting both physical and biological aspects. Physically, alterations in lake-ice and open water area influence thermal stratification, leading to variations in heat distribution and vertical mixing within the water column (Preston et al., 2016; Lazhu et al., 2021). This, in turn, has implications for the biological effects observed. The occurrence peak of primary consumers (Hébert et al., 2021; Izaguirre et al., 2021), the nutrient regime (Prater et al., 2022; Yang et al., 2021), the development of a planktonic and benthic microbial population (Camacho, 2006), and the availability of a suitable oxythermal habitat for cold-water organisms (Pöysä, 2022) can all be influenced by the changes in lake-ice and open water area. Rising temperatures and stratification, coupled with reduced ice cover and increased nutrient inputs, may promote the growth of specific phytoplankton (Prowse et al., 2011). Landlocked lakes situated in coastal Antarctica typically undergo rapid species replacements during the active phytoplankton growth season, resulting in changes in plankton abundance (Izaguirre et al., 2021). For example, observations in Lake Limnopolar, Byers Peninsula, have demonstrated that temperature-induced warming significantly alters carbon flow, thereby impacting the abundance of plankton in the lake ecosystem (Villaescusa et al., 2016).
Over the past decade, thanks to the development of satellite remote sensing, there has been an increasing interest in the detection of Antarctic lakes. Compared to manual digitizing, an automated lake detection method is more suitable for larger-scale assessments because it can be automatically applied to hundreds of satellite scenes and can avoid user bias (Arthur et al., 2020). A number of methods have been developed to map Antarctic supraglacial lakes, including threshold-based lake classification methods (Fitzpatrick et al., 2014; Moussavi et al., 2020), adaptive classification methods (Johansson and Brown, 2013), and machine learning algorithms (Dirscherl et al., 2020, 2021a). Most previous works mainly focus on the detection of supraglacial lakes (Dirscherl et al., 2021a, b; Leeson et al., 2015; Li et al., 2021; Moussavi et al., 2020). Currently, a semi-automated algorithm has been developed for the detection of water bodies in Greenland (Miles et al., 2017). This method utilized Sentinel-1 synthetic aperture radar (SAR) and Landsat 8 Operational Land Imager (OLI) imagery to monitor surface and subsurface lakes on the Greenland Ice Sheet. As for Antarctic landlocked lakes, field surveys served as the primary method (Shevnina et al., 2021; Lecomte et al., 2016; Shevnina and Kourzeneva, 2017; Harris and Burton, 2010). Due to the limited study area scope and non-uniformity of field surveys, the spatiotemporal distribution of landlocked lakes across Antarctica remains understudied. Unlike the identification of supraglacial lakes, the detection of landlocked lakes requires information on surrounding land covers. Optical remote sensing images are disturbed by frequent clouds in Antarctica, and SAR images have difficulty capturing the information on land covers around lakes. In addition, compared to single-polarization SAR images, the utilization of multi-polarization SAR images can improve the capability to distinguish LLOW from other ground objects (Zakhvatkina et al., 2019). However, high-resolution ground-range-detected (GRD) products only provide single polarization over the Antarctic continent. High-resolution multi-polarization SAR images are not available in Antarctica. Thus, to better understand the dynamics of landlocked lakes in Antarctica, more efficient and accurate methods are needed.
This study aims to apply a deep learning approach to detect the landlocked lake open water (LLOW) area in Antarctica by combining the Landsat 8–9 OLI and SAR imagery. Then, we aim to investigate the variations in LLOW and their relationship with environmental factors, such as temperature. To the best of our knowledge, this study represents the first attempt to map the open water area of landlocked lakes in Antarctica using remote sensing data.
2.1 Study area
Four typical ice-free areas distributed on coastal Antarctica were selected as study areas (Fig. 1). The Antarctic Peninsula has experienced the largest increases in near-surface air temperature in the Southern Hemisphere during the past few decades (Turner et al., 2016). As a representative site of the Antarctic Peninsula, Clearwater Mesa (CWM; 64.03° S, 57.71° W) on James Ross Island was chosen due to its high density of lakes, unique geomorphological setting, remote elevated position, and lack of previous human presence (Roman et al., 2019). In East Antarctica, we selected two large ice-free oases, the Larsemann Hills (LH; 69.41° S, 76.23° E) and the Vestfold Hills (VH; 68.58° S, 78.18° E). VH are a 400 km2 area of ice-free rock (Seppelt and Broady, 1988), while LH are the second-largest ice-free oasis along East Antarctica with an area of about 50 km2 (Shi et al., 2018). The Schirmacher Oasis (SO; 70.76° S, 11.65° E), which is an east–west trending narrow strip, with an ice-free area of about 35 km2 (Srivastava et al., 2013), was chosen to represent the higher-latitude areas of Antarctica. Since the SO is located about 100 km from the coast, it can also represent the inland area of Antarctica. In these areas, the water source of landlocked lakes is mainly from the melting of seasonal snow cover.
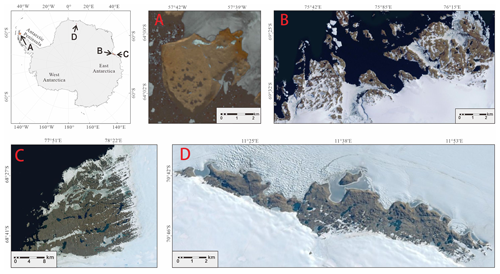
Figure 1Map of study areas. Satellite images based on Landsat 8 and Esri World Imagery scenes show examples of landlocked lake occurrences. Scenes used for this figure include (a) Clearwater Mesa (CWM; Landsat 8; 2 February 2016), (b) Larsemann Hills (LH; Esri World Imagery; 7 April 2022), (c) Vestfold Hills (VH; Esri World Imagery; 7 April 2022), and (d) Schirmacher Oasis (SO; Esri World Imagery; 7 April 2022).
2.2 Dataset
The OLI on board the Landsat 8–9 satellite captures optical information in the visible and near-infrared (VNIR), near-infrared (NIR), and shortwave infrared (SWIR) portions, enabling the comprehensive assessment of diverse surface features. The Landsat 8–9 OLI data are superior in the enhanced radiometric capabilities and the expanded range of spectral bands (Gorji et al., 2020). Leveraging the capabilities of Landsat 8–9 OLI facilitates better monitoring of the LLOW. Thus, a total of 79 optical images of Landsat 8–9 Collection 1 with 30 m resolution between January and April from 2014 to 2022 were obtained from the United States Geological Survey (USGS) Global Visualization Viewer (GloVis) portal (http://earthexplorer.usgs.gov/, last access: 2 May 2022). The Landsat 8–9 satellite has a 16 d repeat cycle. However, cloud cover frequently hampers the detection through visible bands within the study areas. Whenever thick layers of clouds are present above our study areas in the Landsat images, those images are excluded from our study. As a result, the time interval between usable Landsat images can vary. In the Landsat OLI products, the optical bands 1–7 were utilized to identify the land cover in the study areas.
The Sentinel-1 mission is dedicated to SAR imaging and provides all-weather day-and-night imagery in C-band. The SAR-based landscape detection offers a distinct advantage over optical approaches by mitigating the challenges posed by cloud interference. Consequently, it can offer datasets for obtaining long-time-series monitoring of the LLOW. Because of the advantages of SAR images, Sentinel-1 datasets have been widely used for Antarctic open water and snowmelt detection studies (Bowden et al., 2006; Liang et al., 2021; Dirscherl et al., 2021b). The European Space Agency (ESA) facilitates access to various Sentinel-1 products, including raw level-0 data, processed level-1 single-look complex (SLC) data, and level-1 ground-range-detected (GRD) data. To accurately determine the peak dates of landlocked lake area changes, the temporal resolution of area measurements needs to be at the weekly or daily timescale. Considering the high-temporal-resolution requirement of LLOW detection tasks, we used a total of 330 high-resolution Sentinel-1 SAR images from the interferometric wide-swath (IW) GRD products with about 10 m pixel space, which were acquired from the Alaska Satellite Facility (ASF) (https://search.asf.alaska.edu/, last access: 23 November 2022). All Sentinel-1 images are from the descending orbit in order to avoid geometric distortions and orthorectification limitations (Wangchuk et al., 2019). These selected Sentinel-1 images for CWM, LH, and VH span 2017 to 2021. However, for SO, where Sentinel-1 images are unavailable prior to 2019, only the images during 2020 and 2021 were obtained. The revisit period of Sentinel-1 satellites is 12 d. By utilizing both Sentinel-1A and Sentinel-1B images, we obtained a shorter time interval of 6 d between consecutive Sentinel-1 images. These GRD products play a critical role in distinguishing the LLOW in the study areas.
Our dataset of wind speed for the four areas and daily-mean near-surface temperatures for CWM and SO came from the ERA5-Land dataset obtained from Google Earth Engine (Muñoz Sabater, 2019). The daily-mean air temperatures for LH and VH were derived from the weather stations at Zhongshan Station (Ding et al., 2022) and Davis Station. Hereafter, we use temperature to represent daily-mean air temperature and daily-mean near-surface temperature. To facilitate terrain correction, we employed the Copernicus 90 m global DEM data.
During the Antarctic summer, snow cover on lake surfaces undergoes melting, and consequently LLOW will be present, which can easily be observed through remote sensing techniques. The melting and freezing processes typically occur between September and April. However, the identification of LLOW is challenged by rising-temperature events during September and December. These occasional temperature increases can trigger relatively high temperatures and increased snow wetness. This wetness increase can reduce the backscatter of the snow surface (Shokr and Dabboor, 2020). These events lead to the lower backscatter of both snow and snow-covered ice, resulting in similar backscatter characteristics among ice, snow, and LLOW. During the melting period of landlocked lakes, which in general spans September to December, frozen landlocked lakes may be covered by wet snow due to rising-temperature events, resulting in low backscatter. Consequently, these frozen lakes are not LLOW but are incorrectly identified as LLOW. During January to April, the melted landlocked lakes have less snow cover and are less affected by the rising-temperature events. Thus, the identification of LLOW from January to April is much more accurate compared to September to December. To evaluate the influence of rising-temperature events from September to December, we sampled pixels of open water, land ice layers, and sea ice layers from several SAR images during this period. We also sampled LLOW pixels in January as the reference for backscattering analysis. We found that the backscatter of sampled land ice layers was as low as that of sampled LLOW in January in our study areas (Supplement Table S1). Consequently, our model cannot effectively distinguish between LLOW and ice layers in these images from September to December. Our analysis focuses on the changes in LLOW from January to April, when the identification accuracy is relatively high.
To train and validate the U-Net and the random forest (RF) models, we manually annotated ground truth labels from Landsat 8–9 OLI images and Sentinel-1 images. For the U-Net model, several Landsat images were selected, and the pixels in the images were annotated as “open water”, “ice”, and “rock” to serve as ground truth. To enhance the classification capability of U-Net in various scales, the side lengths of Landsat images ranged from 30 pixels to 200 pixels. We annotated 23 patches with 17 100 pixels for U-Net. For the RF model, directly annotating the ground truth in SAR images is challenging and time-consuming, primarily due to their complex backscatter characteristics. Therefore, we conducted a visual interpretation of Sentinel-1 images with the assistance of Landsat images (Liang and Liu, 2020). To ensure that the Landsat images represent the surface of Sentinel-1 images, we selected the Landsat and Sentinel-1 images with the closest dates. Due to the limited availability of cloud-free Landsat images, we used all cloud-free Landsat images from 2017 to 2021 to generate the sample “open water” and “others”. In addition, to validate the accuracy of LLOW identification, we also annotated these Sentinel-1 images as “LLOW” and “others”. We annotated 46 patches with a size of 300×300 to train the RF model and validate the model accuracy. The 46 patches were randomly sampled at a 10 % ratio to generate a sample point set. These points were then randomly divided into 80 % for training and 20 % for testing to train and test the RF model. Additionally, we identified the LLOW with the 46 patches and then calculated the accuracy, F1 score, and mean intersection over union (mIoU) to evaluate the identification accuracy.
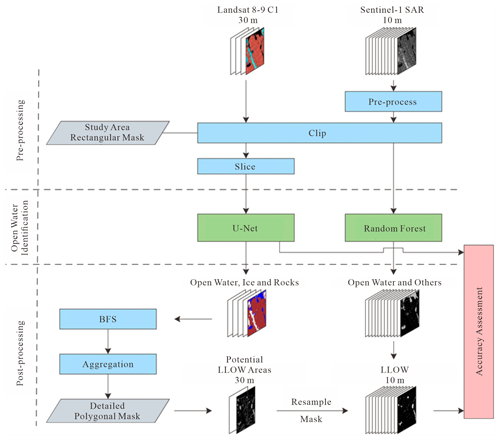
The automated detection workflow for LLOW can be divided into three steps (Fig. 2): (1) pre-processing of Landsat and Sentinel input images, (2) open water identification, and (3) post-processing of extracted open water to generate the LLOW time series. To assess the accuracy of our LLOW detection workflow, we conducted a comparison between the identified LLOW and the labeled ground truth.
3.1 Pre-processing
Ensuring a consistent relative location of the study area in each image enhances the comparability of the detected LLOW within the study area across different images. To achieve this, predefined rectangular boundaries were established based on projected coordinates. We cropped images to fit within these specific boundaries, thereby unifying the relative location of the study area within the predefined boundaries. For Landsat images, we utilized specified coordinates to apply the resampling technique with a nearest neighbor (NN) algorithm and perform image cropping. For Sentinel-1 images, we performed orbital correction, thermal noise removal, radiometric calibration, speckle filtering, terrain correction, and decibel conversion on the Sentinel-1 level-1 GRD products using ESA's Sentinel Application Platform (SNAP) software. In addition, the incidence angles in SAR images were also extracted using SNAP. The corrected Sentinel-1 images were then reprojected and cropped to align with the spatial extent of the cropped Landsat images.
It is necessary to expand the sample set using data augmentation to prevent the network from overfitting. Consequently, we augmented the annotated 23 sample images 20 times and obtained a total of 483 sample images. Our data augmentation methods include mirroring, translation, and rotation. Mirroring consists of three scenarios: vertical mirroring, horizontal mirroring, and vertical and horizontal mirroring. The translation involved a four-way translation up to of the side length. The range of the rotation angle was 0–360°. Any void pixels that arose after data augmentation were filled by the reflecting adjacent image pixels. Among the 483 sample images, 80 % were randomly assigned as the training set and the remaining 20 % as the validation set.
The use of an overlap-tile strategy for splitting large images into smaller patches has proven to be effective in overcoming GPU limitations (Ronneberger et al., 2015). Thus, this strategy was employed before using Landsat images in the U-Net. We sliced the input images into patches of 300×300 pixels. There are many small LLOW areas distributed across the four study areas, especially in LH and VH; however, the U-Net is not ideal for recognizing small-scale open water. Therefore, we resampled the patches with NN from 300×300 pixels to 1024×1024 pixels in order to magnify the small open water area. After land-cover classification using U-Net, we again resampled these classified results of 1024×1024 pixels to 300×300 pixels with NN. To reduce the border effect caused by U-Net (Dirscherl et al., 2021a), we only kept the result of 250×250 pixels in the center of the patch, while discarding the edge with a length of 25 pixels.
3.2 Open water identification
The U-Net neural network is a deep learning network for semantic segmentation based on a fully convolutional network (Ronneberger et al., 2015), which is faster to train due to its context-based learning approach (Siddique et al., 2021). In addition, it does not require the explicit specification of the input image size to achieve end-to-end semantic segmentation. For LLOW detection, the U-Net network can effectively fuse the spatial and spectral information. U-Net can process the spectral information for land-cover classification and can also consider the spatial contexts to effectively reduce the interference of shadows and clouds. Thus, we implemented a U-Net model to detect open water in Landsat images and classify the pixels into three types of land cover: ice, open water, and rock. The backscattering distributions of ice and rock are similar in single horizontal–horizontal (HH) polarization, so we classified the pixels of Sentinel-1 images into only two types: open water and others.
U-Net consists of an encoder and a decoder (Fig. 3). The encoder and decoder are both mainly composed of double-convolutional (double-conv) layers and are used to enhance model depth (Wu et al., 2020). In the double-conv layers, the batch normalization layer and the leaky rectified linear unit (LeakyReLU) layer are added to re-correct the data distribution and achieve nonlinear computation. To avoid gradient vanishing and facilitate the deepening of the U-Net model network, we added a residual layer between the double-conv layers.
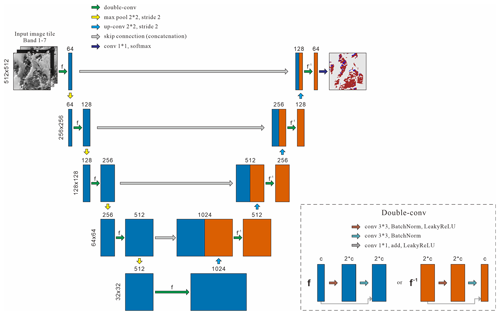
Figure 3The structure of U-Net and the double-conv layer. The numbers on the left of the double-conv blocks represent the image sizes. The numbers above the double-conv blocks represent the feature channels after each operation. Double-conv blocks are able to double the feature channels in the encoder, while they halve the feature channels in the decoder.
Open water bodies exhibit a smooth surface, resulting in weaker backscatters, while areas with rougher surfaces generate stronger backscatters. The backscatter of the surface varies across different incidence angles of SAR images (Wakabayashi et al., 2019). Thus, open water and other features can be distinguished based on backscatter and incidence angles. The RF model, a nonlinear modeling tool, can accurately predict open water and has a high tolerance of noise and outliers (Huang et al., 2021). We established the RF model for each study area to identify the open water in SAR images according to backscatter and incidence angles.
3.3 Post-processing
A landlocked lake is a water region surrounded by a rock region. Not all open water pixels extracted through the open water identification models are LLOW areas, such as glacial rivers and melted water from coastal glaciers. Moreover, LLOW may be indirectly surrounded by rocks. For example, LLOW may be enclosed by ice, which in turn is surrounded by rocks. In our classified results, a classified Landsat image consists of a connected non-rock area and interspersed rock areas containing LLOW. The breadth-first search (BFS) algorithm has been proven to be effective in removing the connected areas (Silvela and Portillo, 2001). Thus, the BFS algorithm can effectively eliminate the connected non-rock area while retaining the rock areas. BFS simulates the spreading of seawater in the Antarctic summer and leaves only rock areas where stable LLOW may exist. Supraglacial lakes, epiglacial lakes, and seawater are all removed during BFS. Finally, all the remaining open water pixels derived from Landsat images are extracted and marked as LLOW.
The use of Landsat images in the visible and near-infrared bands is significantly hindered by cloud interference, especially along the Antarctic coast. As mentioned in Sect. 2.2, within the four study areas over 2014–2022, a total of only 79 Landsat images are suitable for LLOW detection. Therefore, the number of Landsat images with low cloud cover in the study areas is insufficient for our time series analysis. To improve the temporal resolution of LLOW time series, we used Sentinel-1 SAR images as supplements. SAR images are not affected by clouds but have limited spectral information and lack accuracy in distinguishing ground objects among open water, rocks, and ice. The open water identified solely from SAR imagery often includes substantial amounts of mountain shadows and numbers of lakes that were not surrounded by rocks. Without spatial information on rocks and ice, the BFS algorithm is invalid for extracting LLOW from open water. Consequently, SAR images enable the identification of only open water instead of LLOW. Using data from either Landsat 8–9 or Sentinel-1 alone cannot precisely capture the temporal variation in LLOW. However, combining the maximum lake area derived from Landsat with the results obtained from SAR images provides a better approach to achieving higher temporal resolution and more accurate results (Miles et al., 2017). Thus, for each study area, we defined the pixels that are classified as LLOW in multiple Landsat results as potential LLOW. Specifically, if a pixel was identified as LLOW two or more times from 2014 to 2022, it was considered a potential LLOW pixel. We aggregated all LLOW distribution images and obtained one potential LLOW area for each study area. According to the annotated sample set, some LLOW areas are not within the potential LLOW area range. To leverage the resolution advantage of Sentinel-1 and its potential for LLOW identification, we established a buffer zone for the potential LLOW area (Wangchuk et al., 2019). As shown in Fig. S1, the rate of decrease in the ignored LLOW area diminishes as the buffer radius increases. We selected a buffer radius of 20 m, where the reduction in LLOW area is most significant, and resampled the potential LLOW area into a 10 m resolution. After that, we combined the Landsat and Sentinel images, using the potential extents of LLOW and the open water derived from SAR, to generate the long-term time series of LLOW.
Because previous cropped images had wide rectangular boundaries, they still retained large non-research areas. To ensure consistency of the extracted LLOW in study areas, we delineated the more detailed coordinate boundaries according to the irregular shapes of the study area. The detailed boundaries were then used to narrow down potential LLOW regions. It is important to note that identifying LLOW in SAR images can be challenging due to various factors, such as strong wind, floating thin ice layers, and sensor speckle noise (Dirscherl et al., 2021a). These factors can impact the backscatter of LLOW and make accurate detection of LLOW difficult. For instance, congealed ice generates large bubbles, and the bubbles entrained within the ice layer enhance backscatters (Hirose et al., 2008). Consequently, LLOW covered by only a few floating ice layers or affected by strong winds may exhibit higher backscatter coefficients and cannot be detected by our threshold segmentation model. Instances of strong winds and floating ice have temporary effects on the entire study area and result in significant underestimation of LLOW. Therefore, we discarded the underestimated LLOW results and generated a total of 285 long-term time series images of LLOW. The LLOW time series with combined Landsat and Sentinel images have a spatial resolution of 10 m and a time resolution of ∼ 6 d.
3.4 Accuracy assessment
The accuracy of classification models is estimated by a confusion matrix, accuracy, an F1 score, and a mean IoU. The formulas are presented in Eqs. (1), (2), (3), (4), and (5):
where N is the number of categories, TS is the total number of samples, TP is the number of results classified as true positive, FP is the number of results classified as false positive, TN is the number of results classified as true negative, and FN is the number of results classified as false negative in the confusion matrix.
4.1 Classification results
Figure 4 illustrates the process and intermediate results involved in the LLOW identification. The Landsat images were accurately classified into open water, ice, and rocks through the use of U-Net (Fig. 4e, f, g, and h). Compared to the images of the false color band combination, the results derived from threshold segmentation contained a large number of errors (Fig. 4m, n, o, and p). For example, smooth ice layers were misidentified as open water in Fig. 4p. However, we obtained information on potential LLOW areas through the results of U-Net. To rectify these errors, masking of potential LLOW areas was employed (Fig. 4q, r, s, and t), significantly improving the accuracy of LLOW identification based on SAR images.
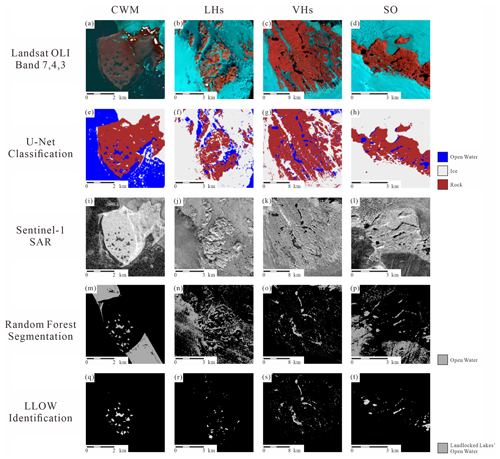
Figure 4The intermediate images and results in the workflow of landlocked lake open water (LLOW) identification. The first row displays the Landsat images by the false color band combination 7–4–3 (RGB). The white regions in these images represent the void data in band 7, 4, or 3. The second row exhibits the classification results of U-Net. The third, fourth, and fifth rows represent the Sentinel images, the results of threshold segmentation, and the results of detected LLOW, respectively.
Figure 5 shows the classification results obtained by U-Net for extracts from all Landsat test scenes. The U-Net network has generally shown good recognition performance across various terrains in all four study areas. Specifically, it effectively mitigates the impacts of diverse brightness and contrast levels in VH (Fig. 5a and b). Moreover, it accurately distinguishes mountain shadows from water bodies in LH without any misclassification (Fig. 5c and d). Notably, in SO, the presence of ice undulations causes numerous shadows. U-Net correctly identifies these shadows as ice (Fig. 5e), which can be a challenging task when using threshold methods. In addition, in both SO and CWM, there are partially melted lakes primarily composed of ice, which appears grayish (Fig. 5e and f). U-Net successfully identifies these lakes as ice surfaces, preventing any overestimation of open water areas.
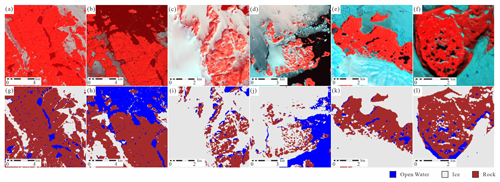
Figure 5Comparison between the Landsat images and auto-generated classification examples of U-Net. The upper row displays Landsat 8 images, using the false color band combination 7–4–3 (RGB) to enhance feature distinction. The lower row shows the corresponding auto-generated classification results of U-Net. Panels (a) and (b) represent the Vestfold Hills (VH), panels (c) and (d) represent the Larsemann Hills (LH), panel (e) represents Schirmacher Oasis (SO), and panel (f) represents Clearwater Mesa (CWM).
Figure 6 displays LLOW results obtained through the fusion of Landsat and SAR images. A comparison within each row highlights differences between varied areas. For example, SO, the highest-latitude area, appears completely frozen in April (Fig. 6h), while the lower-latitude areas like CWM still exhibit LLOW during the same month (Fig. 6e). By contrasting the upper row with the lower row, temporal differences can be observed within the same area, where lakes show larger open water areas in the relatively warmer month of February (e.g., Fig. 6d and h).
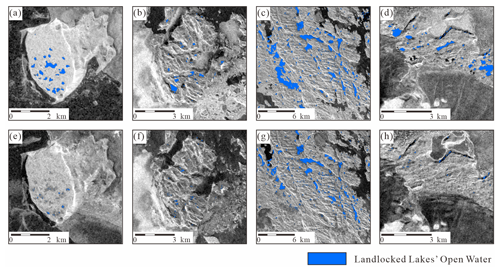
Figure 6The landlocked lake open water (LLOW) area changes over time obtained through the fusion of Landsat and SAR images. The upper row shows the LLOW results in February, with the lower row representing the LLOW results in April. Panels (a) and (e) represent Clearwater Mesa (CWM), panels (b) and (f) represent the Larsemann Hills (LH), panels (c) and (g) represent the Vestfold Hills (VH), and panels (d) and (h) represent Schirmacher Oasis (SO).
4.2 Model validation
We compared the accuracy of LLOW identification between results obtained before applying the potential LLOW area mask and those obtained after applying the mask in LH (Fig. 7). Prior to applying the mask, the RF model identified a large number of false LLOW instances in low-backscatter pixels. The LLOW identification only based on SAR images resulted in a mIoU value of only 0.29 when compared to the ground truth labels. However, the masking process based on potential LLOW areas successfully reduced the majority of false LLOW instances and improved the mIoU value to 0.74. The increase in the mIoU suggests that masking using potential LLOW areas can compensate for the lack of spectral information in Sentinel-1 images, thereby enhancing the accuracy of the LLOW identification model.
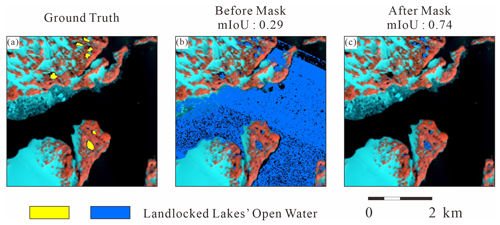
Figure 7Accuracy comparison of LLOW identification before and after masking in LH. The background images are displayed from the false color combination of the 7–4–3 bands. The result before masking was derived from threshold segmentation.
Our land-cover classification model, based on U-Net, has achieved average accuracy, F1 score, and mIoU values of 0.93, 0.90, and 0.82, respectively, on the test datasets, indicating reliable and accurate classification of land cover. The LLOW identification model yielded mean accuracy, F1 score, and mIoU values of 0.94, 0.89, and 0.81, respectively, for four study areas on the test set. We further validated the model performance on four test patches (Fig. 8). The LLOW identification model yielded F1 scores ranging from 0.88 to 0.95 and mIoU ranging from 0.81 to 0.90. Among the four areas, SO exhibited the highest mIoU value of 0.90, suggesting the most similar spatial distribution between the predicted LLOW and the ground truth. LH showed the lowest mIoU of 0.81, while CWM and VH showed mIoU values of 0.82 and 0.83, respectively. In VH and SO, the locations and areas of LLOW were well recognized (Fig. 8k and l). In LH, the spatial distribution of LLOW was also accurately detected, although there were some inconsistencies in the boundaries between the ground truth and the predicted lakes (Fig. 8j). In addition, in CWM, the model successfully identified all LLOW areas, but it misclassified the areas covered by floating ice with low backscatter (Fig. 8a) as LLOW. Overall, our model demonstrated proficiency in detecting LLOW areas, providing reliable information on the spatial distribution and extent of LLOW.
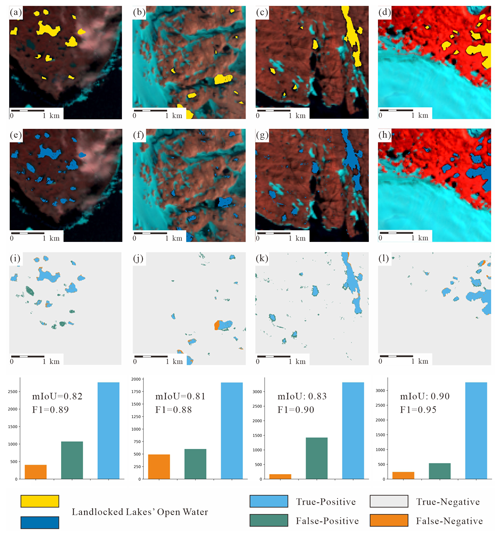
Figure 8Validation of the landlocked lake identification model in the testing dataset for four areas. The four columns of images are validation images for CWM, LH, VH, and SO. The first, second, and third rows are ground truth, predicted, and spatial error images, respectively. The background images are displayed from the false color combination of the 7–4–3 bands. The spatial distribution of classification errors is obtained from overlapping ground truth and predicted images.
4.3 Seasonal variations in LLOW area
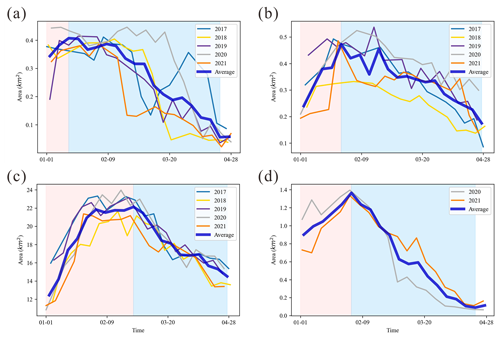
The study focused on changes in LLOW from January to April across four different areas in Antarctica. Figure 9 presents the spatial and temporal variations in the LLOW area during the study period. Our results indicate an initial increase followed by a decreasing trend in the overall LLOW area. Notably, the occurrence and duration of maximum LLOW areas varied among the study areas, with the highest value observed in early January in CWM, while SO in inland Antarctica experienced its peak LLOW area at the end of January, lasting for less than two satellite revisit cycles (12 d). The rate of decrease in LLOW area slowed down from late March, approaching a relatively stable low-value stage. By April, the LLOW areas had reduced to approximately 20 % of their maximum value for CWM, while LH and SO at higher latitudes decreased to 10 % of their maximum or approached zero.
In addition to seasonal variations, interannual variations in LLOW areas were observed. For example, LH exhibited significant variation in LLOW areas in different years, with the maximum recorded in 2018 being only 60 % of that in 2019 (Fig. 9b). Furthermore, CWM experienced a significant freezing and thawing process in March 2017, when the LLOW area dropped to less than 50 % of its maximum before subsequently rebounding to the maximum value (Fig. 9a).
The changes in LLOW areas can be categorized into two distinct phases: the growth phase and the decline phase (Fig. 9). The growth phase spans the initiation of our data collection until the maximum LLOW area is reached, while the decline phase extends from the maximum area to the minimum area after reaching the peak. In the following sections, we discuss these two phases separately.
5.1 Growth phase of LLOW area
With the onset of austral summer, lake surface ice and snow melt, resulting in the generation of meltwater, which contributes to an increase in the LLOW area. This process is closely associated with the changes in temperature, especially the occurrence of days with temperatures exceeding 0 °C (Braithwaite and Hughes, 2022; Li et al., 2021; Wake and Marshall, 2015; Maisincho et al., 2014; Barrand et al., 2013; Johansson et al., 2013). Thus, we evaluate the positive degree day (PDD) sum, which represents the cumulative sum of temperatures above the melting point during a specific period (Cogley et al., 2011). In this study, the PDD for a given day is calculated as the sum of temperatures exceeding 0 °C from 1 November of the previous year until the current day. It is important to note that we only analyzed the PDD for LH and VH in this study, considering that automatic weather station (AWS) data are only available at these two sites. The PDD is calculated using Eq. (6):
Here, the positive degree day sum prior to the day n is denoted as PDDn (°C), and Ti represents the station mean temperature (°C) measured on day i. Figure 10 illustrates the relationship between PDD and LLOW area change over time in LH and VH. During the growth phase of the LLOW area, the average R2 value is around 0.9, indicating that PDD can explain ∼ 90 % of the increase in LLOW area. However, there was a notable exception in LH in 2019, characterized by an unusual cooling event from middle to late January. This event persisted for several consecutive days with temperatures below 0 °C, resulting in a decline in the LLOW area. In addition, since the LLOW area had already reached its maximum at the beginning of January in LH in 2018, the growth phase was short and less discernible, leading to a lack of significant correlation between PDD and the LLOW area.
PDDs can also influence the year-to-year fluctuations in LLOW area, but the relationship between changes in PDD and LLOW area is nonlinear. For instance, the maximum PDD in 2017 was more than 2 times higher than that in 2018 in LH, yet the maximum area increased by 50 % (Fig. 10a and b). The maximum area of VH remained relatively stable over the 5 years. When PDD reaches a certain threshold, all LLOW areas have already melted, so further increases in PDD do not lead to changes in LLOW area. Therefore, across different years, significant differences in PDD can result in minimal variation in LLOW areas. Based on this, it can be inferred that the threshold for PDD in LH is likely between 25 and 35 °C. When PDD exceeds 35 °C, the maximum LLOW area stays relatively invariant at ∼ 0.5 km2.
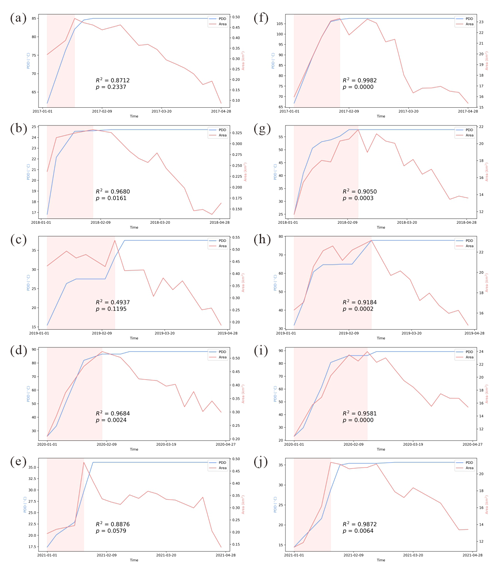
Figure 10The positive degree day (PDD) sums and landlocked lake open water (LLOW) area change during the 2017 (a), 2018 (b), 2019 (c), 2020 (d), and 2021 (e) melt seasons in the Larsemann Hills (LH) and during the 2017 (f), 2018 (g), 2019 (h), 2020 (i), and 2021 (j) melt seasons in the Vestfold Hills (VH). In the figure, the red interval represents the growth phase of the LLOW area. The R2 value in the figure is calculated from a linear fit of PDD and LLOW area during the growth phase.
5.2 Decline phase of LLOW area
Cumulation of successive negative air temperature days contributes to the lowering of water temperature and the commencement of the water freezing process, i.e., the formation and longer-term persistence of ice cover (Graf and Tomczyk, 2018). Therefore, we calculate the negative degree day (NDD) sum by using Eq. (7), which represents the cumulative sum of temperatures below the melting point during a specific period.
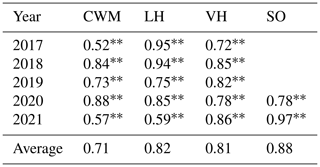
Here, the negative degree day sum prior to the day n is denoted as NDDn (°C), and Ti represents the station mean temperature (°C) measured on day i. The relationship between the LLOW area and NDD in each area during the freezing season is significant (Table 1). The calculation of the R2 value was based on a linear fit of the NDD and the LLOW area, ranging from the maximum LLOW area to the minimum. In all four study areas, the R2 values were found to be greater than 0.5. This indicates a strong response of the LLOW area to NDD changes during the decline phase of the LLOW area.
Table 1R2 of the LLOW area and negative degree days in the freezing phase between 2017 and 2021.
p<0.01.
The relationship between the LLOW area and NDD in CWM in 2017 exhibited a relatively low R2 value (0.52). During that year, sharp declines and subsequent rebounds of the LLOW area were observed (Fig. 11). As temperatures plummeted, the LLOW area decreased rapidly, nearly reaching its nadir simultaneously. Conversely, with rising temperatures, the LLOW area responded promptly, highlighting temperature's predominant influence on fluctuations in the LLOW area. Therefore, using NDD instead of temperature to explain variations in the LLOW area during the freezing phase may overlook these instances of temperature-driven rebounds during the decline phase.
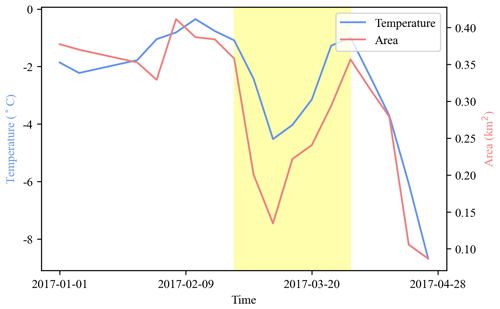
Figure 11The temperature and the landlocked lake open water (LLOW) area in CWM in 2017. The yellow interval represents the declines and rebounds of lake area and temperature.
During the freezing stage, the depth of a lake will affect the time of lake-ice formation (Kirillin et al., 2012), which in turn affects the reduction in LLOW area. Shallower lakes tend to lose heat more quickly, leading to earlier ice cover formation. In contrast, deeper lakes possess greater heat capacity, resulting in a slower cooling process and delayed ice formation. For instance, VH and LH are close to each other with similar temperature conditions, so the LLOW area should begin to decrease around the same time. However, in LH, the LLOW area started to decrease continuously from late January, approximately 1 to 2 weeks earlier than in VH. This discrepancy may be attributed to the fact that the average lake depth in VH is ∼ 30 m, with some lakes exceeding ∼ 100 m in depth, whereas LH consist of lakes with an average depth of 10 m (Shevnina and Kourzeneva, 2017; Harris and Burton, 2010).
5.3 Model limitation
The backscatter of LLOW is mainly disturbed by two types of factors: the first is external factors, such as wind speed and direction, SAR image incidence angles, and mountain shadows; the second is the LLOW surface cover, such as floating ice and snow. Firstly, when the open water is disturbed by wind, the backscatter increases. Additionally, the incidence angles and topography also affect the backscatter of open water. Because the steep terrain yields mountain shadows and identification errors (Dirscherl et al., 2021a), we calculated the slopes from a DEM to evaluate the influence of topography. To evaluate the influence of wind, incidence angles, and topography, we sampled within the LLOW areas of the four study areas between 2017 and 2021 from the 46 sample patches (Figs. S3, S4, S5, and S6). However, there is no obvious linear correlation between LLOW backscatter and wind, incidence angles, or slope. Moreover, we added the wind speed, incidence angles, and slope as input features for the RF model in open water identification. However, only incidence angle yields a significant feature importance. This indicates that the incidence angle is much more important for open water detection compared to wind speed and slope. Thus, our RF model did not consider the wind features and slope. Secondly, unstable factors such as floating ice layers led to fluctuations of the LLOW area. The backscatter of LLOW can be influenced by the floating ice layer and snow covering open water, making accurate identification challenging. By comparing our spatial errors with input SAR images, we found that the floating ice layers directly caused the false positive errors (Fig. 8i). Furthermore, the presence of a blue ice layer with low backscatters can lead to overestimation of LLOW (Table S1). Despite our efforts to remove significantly underestimated results, as mentioned in Sect. 3.3, these factors remain the causes of fluctuations in the LLOW area time series.
Although the LLOW identification model has these limitations, our findings demonstrate its strong performance across the four study areas. The deep learning approach, namely U-Net, enhanced model robustness across diverse environmental conditions such as various surrounding features, cloud covers, lighting conditions, and mountain shadows. Using the RF model to identify open water in SAR images can also overcome unstable factors such as cloud cover, producing a stable high-resolution time series of open water areas. Therefore, our method has the potential to perform well in other regions, such as identifying the other landlocked lakes in Antarctica or detecting numerous landlocked lakes along the coastal areas of Greenland. Additionally, our proposed method for distinguishing between seawater, supraglacial lakes, and landlocked lakes can be applied to the identification of thermokarst lakes, such as the numerous thermokarst lakes on the Alaska North Slope. The BFS algorithm can distinguish between open rivers and closed lakes on plain permafrost. By utilizing BFS and the fusion of Landsat and Sentinel-1 images, we can differentiate thermokarst lakes and river drainages within an image. Consequently, the growth of thermokarst lakes and their integration into river systems can also be detected. Additionally, by combining Landsat and Sentinel-1 images, we overcame the severe cloud interference in the optical images in the Antarctic, significantly improving the detection frequency of landlocked lakes. We also addressed the challenge of obtaining surrounding land-cover information on water in SAR images, thereby successfully generating the high-resolution LLOW products. By providing reliable long-term LLOW time series products, our model contributes to a deeper understanding of the dynamic changes in LLOW under a changing climate.
We proposed an automated detection workflow for LLOW based on deep learning and multi-source satellite images. By utilizing the BFS algorithm and combining Landsat 8–9 OLI and Sentinel-1 SAR images, we successfully distinguished the LLOW from other open waters, overcoming the limitation of models based solely on optical or SAR images. In our model accuracy assessment, our U-Net model and LLOW identification model achieved average F1 score values of 0.90 and 0.89, respectively, on the testing datasets. Our model accurately recognizes both large-scale and small-scale LLOW in the testing images. Applying our LLOW identification model to four typical coastal Antarctic areas, we mitigated cloud and shadow interference and generated high-resolution spatiotemporal LLOW area time series from January to April between 2017 and 2021.
The seasonal changes in LLOW area can be categorized into two phases: the growth phase and the decline phase. The growth phase includes the period from the initiation of our data collection until the maximum LLOW area is reached, while the decline phase extends from the maximum area to the minimum area after reaching the peak. We found that during expansion of LLOW area, ∼ 90 % of the changes are explained by PDDs. PDDs can also influence the interannual variations in LLOW area, but the changes in PDD and LLOW area are not proportional. Furthermore, during the decline phase, NDDs accounted for more than 50 % of changes in LLOW area. Our model provides long-term LLOW time series products that help us better understand how lakes change under a changing climate.
Data presented in this work are available at National Tibetan Plateau/Third Pole Environment Data Center (Shi, 2023; https://doi.org/10.11888/Cryos.tpdc.300665).
The supplement related to this article is available online at: https://doi.org/10.5194/tc-18-5347-2024-supplement.
GS conceived the study. XM designed the method and provided model data. AJ analyzed the data and interpreted the results. AJ and XM designed and wrote the paper with support from all co-authors. GS and YH improved the paper.
The contact author has declared that none of the authors has any competing interests.
Publisher’s note: Copernicus Publications remains neutral with regard to jurisdictional claims made in the text, published maps, institutional affiliations, or any other geographical representation in this paper. While Copernicus Publications makes every effort to include appropriate place names, the final responsibility lies with the authors.
The authors are grateful to CHINARE members for collecting and providing meteorological data.
This research has been supported by the National Key Research and Development Program of China (grant no. 2023YFC2812601), the National Natural Science Foundation of China (grant nos. 42276243 and 42071306), the Fundamental Research Funds for the Central Universities, and the Program of Shanghai Academic Research Leader (grant no. 20XD1421600).
This paper was edited by Nicholas Barrand and reviewed by two anonymous referees.
Arthur, J. F., Stokes, C., Jamieson, S. S. R., Carr, J. R., and Leeson, A. A.: Recent understanding of Antarctic supraglacial lakes using satellite remote sensing, Prog. Phys. Geogr.: Earth Environ., 44, 837–869, https://doi.org/10.1177/0309133320916114, 2020.
Barrand, N. E., Vaughan, D. G., Steiner, N., Tedesco, M., Kuipers Munneke, P., van den Broeke, M. R., and Hosking, J. S.: Trends in Antarctic Peninsula surface melting conditions from observations and regional climate modeling, J. Geophys. Res.-Earth, 118, 315–330, https://doi.org/10.1029/2012JF002559, 2013.
Bowden, D., Clarke, A., Peck, L., and Barnes, D.: Antarctic sessile marine benthos: Colonisation and growth on artificial substrata over three years, Mar. Ecol. Prog. Ser., 316, 1–16, https://doi.org/10.3354/meps316001, 2006.
Braithwaite, R. J. and Hughes, P. D.: Positive degree-day sums in the Alps: a direct link between glacier melt and international climate policy, J. Glaciol., 68, 901–911, https://doi.org/10.1017/jog.2021.140, 2022.
Camacho, A.: Planktonic microbial assemblages and the potential effects of metazooplankton predation on the food web of lakes from the maritime Antarctica and sub-Antarctic islands, Rev. Environ. Sci. Biotechnol., 5, 167–185, https://doi.org/10.1007/s11157-006-0003-2, 2006.
Carvalho, F. R. S., Nastasi, F. R., Gamba, R. C., Foronda, A. S., and Pellizari, V. H.: Occurrence and Diversity of Legionellaceae in Polar Lakes of the Antarctic Peninsula, Curr. Microbiol., 57, 294–300, https://doi.org/10.1007/s00284-008-9192-y, 2008.
Cogley, J. G., Hock, R., Rasmussen, L. A., Arendt, A. A., Bauder, A., Braithwaite, R. J., Jansson, P., Kaser, G., Möller, M., Nicholson, L., and Zemp, M.: Glossary of Glacier Mass Balance and Related Terms, IHP-VII Technical Documents in Hydrology No. 86, IACS Contribution No. 2, UNESCO-IHP, Paris, 2011.
Convey, P. and Peck, L. S.: Antarctic environmental change and biological responses, Sci. Adv., 5, eaaz0888, https://doi.org/10.1126/sciadv.aaz0888, 2019.
Ding, M., Zou, X., Sun, Q., Yang, D., Zhang, W., Bian, L., Lu, C., Allison, I., Heil, P., and Xiao, C.: The PANDA automatic weather station network between the coast and Dome A, East Antarctica, Earth Syst. Sci. Data, 14, 5019–5035, https://doi.org/10.5194/essd-14-5019-2022, 2022.
Dirscherl, M., Dietz, A. J., Kneisel, C., and Kuenzer, C.: Automated Mapping of Antarctic Supraglacial Lakes Using a Machine Learning Approach, Remote Sens., 12, 1203, https://doi.org/10.3390/rs12071203, 2020.
Dirscherl, M., Dietz, A. J., Kneisel, C., and Kuenzer, C.: A Novel Method for Automated Supraglacial Lake Mapping in Antarctica Using Sentinel-1 SAR Imagery and Deep Learning, Remote Sens., 13, 197, https://doi.org/10.3390/rs13020197, 2021a.
Dirscherl, M. C., Dietz, A. J., and Kuenzer, C.: Seasonal evolution of Antarctic supraglacial lakes in 2015–2021 and links to environmental controls, The Cryosphere, 15, 5205–5226, https://doi.org/10.5194/tc-15-5205-2021, 2021b.
Fitzpatrick, A. A. W., Hubbard, A. L., Box, J. E., Quincey, D. J., van As, D., Mikkelsen, A. P. B., Doyle, S. H., Dow, C. F., Hasholt, B., and Jones, G. A.: A decade (2002–2012) of supraglacial lake volume estimates across Russell Glacier, West Greenland, The Cryosphere, 8, 107–121, https://doi.org/10.5194/tc-8-107-2014, 2014.
Gorji, T., Yildirim, A., Hamzehpour, N., Tanik, A., and Sertel, E.: Soil salinity analysis of Urmia Lake Basin using Landsat-8 OLI and Sentinel-2A based spectral indices and electrical conductivity measurements, Ecol. Indic., 112, 106173, https://doi.org/10.1016/j.ecolind.2020.106173, 2020.
Graf, R. and Tomczyk, A. M.: The Impact of Cumulative Negative Air Temperature Degree-Days on the Appearance of Ice Cover on a River in Relation to Atmospheric Circulation, Atmosphere, 9, 204, https://doi.org/10.3390/atmos9060204, 2018.
Harris, U. and Burton, H.: Vestfold Hills Lake Bathymetry, Ver. 1, Australian Antarctic Data Centre [data set], https://doi.org/10.26179/5ce375c36a41c, 2010.
Hébert, M.-P., Beisner, B. E., Rautio, M., and Fussmann, G. F.: Warming winters in lakes: Later ice onset promotes consumer overwintering and shapes springtime planktonic food webs, P. Natl. Acad. Sci. USA, 118, e2114840118, https://doi.org/10.1073/pnas.2114840118, 2021.
Hirose, T., Kapfer, M., Bennett, J., Cott, P., Manson, G., and Solomon, S.: Bottomfast Ice Mapping and the Measurement of Ice Thickness on Tundra Lakes Using C-Band Synthetic Aperture Radar Remote Sensing1, JAWRA J. Am. Water Resour. Assoc., 44, 285–292, https://doi.org/10.1111/j.1752-1688.2007.00161.x, 2008.
Hodgson, D. A.: Antarctic Lakes, in: Encyclopedia of Lakes and Reservoirs, edited by: Bengtsson, L., Herschy, R. W., and Fairbridge, R. W., Springer, Netherlands, 26–31, https://doi.org/10.1007/978-1-4020-4410-6_38, 2012.
Huang, J. P., Swain, A. K., Andersen, D. T., and Bej, A. K.: Bacterial diversity within five unexplored freshwater lakes interconnected by surface channels in East Antarctic Dronning Maud Land (Schirmacher Oasis) using amplicon pyrosequencing, Polar Biol., 37, 359–366, https://doi.org/10.1007/s00300-013-1436-z, 2014.
Huang, Z., Wu, W., Liu, H., Zhang, W., and Hu, J.: Identifying Dynamic Changes in Water Surface Using Sentinel-1 Data Based on Genetic Algorithm and Machine Learning Techniques, Remote Sens., 13, 3745, https://doi.org/10.3390/rs13183745, 2021.
Izaguirre, I., Allende, L., and Romina Schiaffino, M.: Phytoplankton in Antarctic lakes: biodiversity and main ecological features, Hydrobiologia, 848, 177–207, https://doi.org/10.1007/s10750-020-04306-x, 2021.
Johansson, A. M. and Brown, I. A.: Adaptive Classification of Supra-Glacial Lakes on the West Greenland Ice Sheet, IEEE J. Sel. Top. Appl. Earth Obs. Remote Sens., 6, 1998–2007, https://doi.org/10.1109/JSTARS.2012.2233722, 2013.
Johansson, A. M., Jansson, P., and Brown, I. A.: Spatial and temporal variations in lakes on the Greenland Ice Sheet, J. Hydrol., 476, 314–320, 2013.
Keskitalo, J., Leppäranta, M., and Arvola, L.: First records of primary producers of epiglacial and supraglacial lakes in western Dronning Maud Land, Antarctica, Polar Biol., 36, 1441–1450, https://doi.org/10.1007/s00300-013-1362-0, 2013.
Kirillin, G., Leppäranta, M., Terzhevik, A., Granin, N., Bernhardt, J., Engelhardt, C., Efremova, T., Golosov, S., Palshin, N., Sherstyankin, P., Zdorovennova, G., and Zdorovennov, R.: Physics of seasonally ice-covered lakes: a review, Aquat. Sci., 74, 659–682, https://doi.org/10.1007/s00027-012-0279-y, 2012.
Komárek, J., Nedbalová, L., and Hauer, T.: Phylogenetic position and taxonomy of three heterocytous cyanobacteria dominating the littoral of deglaciated lakes, James Ross Island, Antarctica, Polar Biol., 35, 759–774, https://doi.org/10.1007/s00300-011-1123-x, 2012.
Koo, H., Ptacek, T., Crowley, M., Swain, A. K., Osborne, J. D., Bej, A. K., and Andersen, D. T.: Draft Genome Sequence of Hymenobacter sp. Strain IS2118, Isolated from a Freshwater Lake in Schirmacher Oasis, Antarctica, Reveals Diverse Genes for Adaptation to Cold Ecosystems, Genome Announc., 2, e00739-14, https://doi.org/10.1128/genomeA.00739-14, 2014.
Lazhu, Yang, K., Hou, J., Wang, J., Lei, Y., Zhu, L., Chen, Y., Wang, M., and He, X.: A new finding on the prevalence of rapid water warming during lake ice melting on the Tibetan Plateau, Sci. Bull., 66, 2358–2361, https://doi.org/10.1016/j.scib.2021.07.022, 2021.
Lecomte, K. L., A. Vignoni, P., Córdoba, F. E., Chaparro, M. A. E., Chaparro, M. A. E., Kopalová, K., Gargiulo, J. D., M. Lirio, J., Irurzun, M. A., and Böhnel, H. N.: Hydrological systems from the Antarctic Peninsula under climate change: James Ross archipelago as study case, Environ. Earth Sci., 75, 623, https://doi.org/10.1007/s12665-016-5406-y, 2016.
Leeson, A. A., Shepherd, A., Briggs, K., Howat, I., Fettweis, X., Morlighem, M., and Rignot, E.: Supraglacial lakes on the Greenland ice sheet advance inland under warming climate, Nat. Clim. Change, 5, 51–55, https://doi.org/10.1038/nclimate2463, 2015.
Li, Q., Zhou, C., Liu, R., and Zheng, L.: Monitoring the changes of supraglacial lakes on the Polar Record Glacier, East Antarctic, Chin. J. Polar Res., 33, 27–36, 2021 (in Chinese with English abstract).
Liang, D., Guo, H., Zhang, L., Cheng, Y., Zhu, Q., and Liu, X.: Time-series snowmelt detection over the Antarctic using Sentinel-1 SAR images on Google Earth Engine, Remote Sens. Environ., 256, 112318, https://doi.org/10.1016/j.rse.2021.112318, 2021.
Liang, J. and Liu, D.: A local thresholding approach to flood water delineation using Sentinel-1 SAR imagery, ISPRS J. Photogramm. Remote Sens., 159, 53–62, https://doi.org/10.1016/j.isprsjprs.2019.10.017, 2020.
Lyons, W. B., Laybourn-Parry, J., Welch, K. A., and Priscu, J. C.: Antarctic Lake Systems and Climate Change, in: Trends in Antarctic Terrestrial and Limnetic Ecosystems: Antarctica as a Global Indicator, edited by: Bergstrom, D. M., Convey, P., and Huiskes, A. H. L., Springer Netherlands, Dordrecht, 273–295, https://doi.org/10.1007/1-4020-5277-4_13, 2006.
Maisincho, L., Favier, V., Wagnon, P., Basantes Serrano, R., Francou, B., Villacis, M., Rabatel, A., Mourre, L., Jomelli, V., and Cáceres, B.: On the interest of positive degree day models for mass balance modeling in the inner tropics, The Cryosphere Discuss., 8, 2637–2684, https://doi.org/10.5194/tcd-8-2637-2014, 2014.
Miles, K. E., Willis, I. C., Benedek, C. L., Williamson, A. G., and Tedesco, M.: Toward Monitoring Surface and Subsurface Lakes on the Greenland Ice Sheet Using Sentinel-1 SAR and Landsat-8 OLI Imagery, Front. Earth Sci., 5, 58, https://doi.org/10.3389/feart.2017.00058, 2017.
Moussavi, M., Pope, A., Halberstadt, A. R. W., Trusel, L. D., Cioffi, L., and Abdalat, W.: Antarctic supraglacial lake detection using landsat 8 and sentinel-2 imagery: Towards continental generation of lake volumes, Remote Sens., 12, 134, https://doi.org/10.3390/RS12010134, 2020.
Muñoz Sabater, J.: ERA5-Land monthly averaged data from 1950 to present, Copernicus Climate Change Service (C3S) Climate Data Store (CDS) [data set], https://doi.org/10.24381/cds.68d2bb30, 2019.
Papale, M., Rizzo, C., Villescusa, J. A., Rochera, C., Camacho, A., Michaud, L., and Lo Giudice, A.: Prokaryotic assemblages in the maritime Antarctic Lake Limnopolar (Byers Peninsula, South Shetland Islands), Extremophiles, 21, 947–961, https://doi.org/10.1007/s00792-017-0955-x, 2017.
Parnikoza, I. and Kozeretska, I. A.: Antarctic terrestrial biome–most poor, extreme and sensitive on the Planet, in: Encyclopedia of the World's Biomes, Elsevier, Amsterdam, 606–622, https://doi.org/10.1016/B978-0-12-409548-9.12005-6, 2020.
Pöysä, H.: Local variation in the timing and advancement of lake ice breakup and impacts on settling dynamics in a migratory waterbird, Sci. Total Environ., 811, 151397, https://doi.org/10.1016/j.scitotenv.2021.151397, 2022.
Prater, C., Bullard, J. E., Osburn, C. L., Martin, S. L., Watts, M. J., and Anderson, N. J.: Landscape Controls on Nutrient Stoichiometry Regulate Lake Primary Production at the Margin of the Greenland Ice Sheet, Ecosystems, 25, 931–947, https://doi.org/10.1007/s10021-021-00693-x, 2022.
Preston, D. L., Caine, N., McKnight, D. M., Williams, M. W., Hell, K., Miller, M. P., Hart, S. J., and Johnson, P. T.: Climate regulates alpine lake ice cover phenology and aquatic ecosystem structure, Geophys. Res. Lett., 43, 5353–5360, https://doi.org/10.1002/2016GL069036, 2016.
Prowse, T., Alfredsen, K., Beltaos, S., Bonsal, B. R., Bowden, W. B., Duguay, C. R., Korhola, A., McNamara, J., Vincent, W. F., Vuglinsky, V., Anthony, K. M. W., and Weyhenmeyer, G. A.: Effects of Changes in Arctic Lake and River Ice, AMBIO, 40, 63–74, https://doi.org/10.1007/s13280-011-0217-6, 2011.
Quayle Wendy, C., Peck Lloyd, S., Peat, H., Ellis-Evans, J. C., and Harrigan, P. R.: Extreme Responses to Climate Change in Antarctic Lakes, Science, 295, 645, https://doi.org/10.1126/science.1064074, 2002.
Rochera, C. and Camacho, A.: Limnology and Aquatic Microbial Ecology of Byers Peninsula: A Main Freshwater Biodiversity Hotspot in Maritime Antarctica, Diversity, 11, 201, https://doi.org/10.3390/d11100201, 2019.
Roman, M., Nedbalová, L., Kohler, T. J., Lirio, J. M., Coria, S. H., Kopáček, J., Vignoni, P. A., Kopalová, K., Lecomte, K. L., Elster, J., and Nývlt, D.: Lacustrine systems of Clearwater Mesa (James Ross Island, north-eastern Antarctic Peninsula): geomorphological setting and limnological characterization, Antarct. Sci., 31, 169–188, https://doi.org/10.1017/S0954102019000178, 2019.
Ronneberger, O., Fischer, P., and Brox, T.: U-Net: Convolutional Networks for Biomedical Image Segmentation, Cham, 9351, 234–241, https://doi.org/10.1007/978-3-319-24574-4_28, 2015.
Seppelt, R. D. and Broady, P. A.: Antarctic terrestrial ecosystems: The Vestfold Hills in context, Hydrobiologia, 165, 177–184, https://doi.org/10.1007/BF00025586, 1988.
Shevnina, E. and Kourzeneva, E.: Thermal regime and components of water balance of lakes in Antarctica at the Fildes peninsula and the Larsemann Hills, Tellus A: Dyn. Meteorol. Oceanogr., 69, 1317202, https://doi.org/10.1080/16000870.2017.1317202, 2017.
Shevnina, E., Kourzeneva, E., Dvornikov, Y., and Fedorova, I.: Retention time of lakes in the Larsemann Hills oasis, East Antarctica, The Cryosphere, 15, 2667–2682, https://doi.org/10.5194/tc-15-2667-2021, 2021.
Shi, G.: The distribution of Antarctic landlocked lakes' open water, National Tibetan Plateau/Third Pole Environment Data Center [data set], https://doi.org/10.11888/Cryos.tpdc.300665, 2023.
Shi, G., Teng, J., Ma, H., Wang, D., and Li, Y.: Metals in topsoil in Larsemann Hills, an ice-free area in East Antarctica: Lithological and anthropogenic inputs, CATENA, 160, 41–49, https://doi.org/10.1016/j.catena.2017.09.001, 2018.
Shokr, M. and Dabboor, M.: Observations of SAR polarimetric parameters of lake and fast sea ice during the early growth phase, Remote Sens. Environ., 247, 111910, https://doi.org/10.1016/j.rse.2020.111910, 2020.
Siddique, N., Paheding, S., Elkin, C. P., and Devabhaktuni, V.: U-Net and Its Variants for Medical Image Segmentation: A Review of Theory and Applications, IEEE Access, 9, 82031–82057, https://doi.org/10.1109/ACCESS.2021.3086020, 2021.
Silvela, J. and Portillo, J.: Breadth-first search and its application to image processing problems, IEEE Trans. Image Process., 10, 1194–1199, https://doi.org/10.1109/83.935035, 2001.
Srivastava, A. K., Randive, K. R., and Khare, N.: Mineralogical and geochemical studies of glacial sediments from Schirmacher Oasis, East Antarctica, Quat. Int., 292, 205–216, https://doi.org/10.1016/j.quaint.2012.07.028, 2013.
Stokes, C. R., Sanderson, J. E., Miles, B. W. J., Jamieson, S. S. R., and Leeson, A. A.: Widespread distribution of supraglacial lakes around the margin of the East Antarctic Ice Sheet, Sci. Rep., 9, 13823, https://doi.org/10.1038/s41598-019-50343-5, 2019.
Taton, A., Grubisic, S., Balthasart, P., Hodgson, D. A., Laybourn-Parry, J., and Wilmotte, A.: Biogeographical distribution and ecological ranges of benthic cyanobacteria in East Antarctic lakes, FEMS Microbiol. Ecol., 57, 272–289, https://doi.org/10.1111/j.1574-6941.2006.00110.x, 2006.
Turner, J., Lu, H., White, I., King, J. C., Phillips, T., Hosking, J. S., Bracegirdle, T. J., Marshall, G. J., Mulvaney, R., and Deb, P.: Absence of 21st century warming on Antarctic Peninsula consistent with natural variability, Nature, 535, 411–415, https://doi.org/10.1038/nature18645, 2016.
Villaescusa, J. A., Jørgensen, S. E., Rochera, C., Velázquez, D., Quesada, A., and Camacho, A.: Carbon dynamics modelization and biological community sensitivity to temperature in an oligotrophic freshwater Antarctic lake, Ecol. Modell., 319, 21–30, https://doi.org/10.1016/j.ecolmodel.2015.03.008, 2016.
Wakabayashi, H., Motohashi, K., and Maezawa, N.: Monitoring Lake Ice in Northern Alaska with Backscattering and Interferometric Approaches Using Sentinel-1 Sar Data, 2019, 4202–4205, https://doi.org/10.1109/IGARSS.2019.8900371,
Wake, L. and Marshall, S.: Assessment of current methods of positive degree-day calculation using in situ observations from glaciated regions, J. Glaciol., 61, 329–344, https://doi.org/10.3189/2015JoG14J116, 2015.
Wangchuk, S., Bolch, T., and Zawadzki, J.: Towards automated mapping and monitoring of potentially dangerous glacial lakes in Bhutan Himalaya using Sentinel-1 Synthetic Aperture Radar data, Int. J. Remote Sens., 40, 4642–4667, https://doi.org/10.1080/01431161.2019.1569789, 2019.
Wu, B., Fang, Y., and Lai, X.: Left ventricle automatic segmentation in cardiac MRI using a combined CNN and U-net approach, Comput. Med. Imaging Graphics, 82, 101719, https://doi.org/10.1016/j.compmedimag.2020.101719, 2020.
Yang, F., Cen, R., Feng, W., Zhu, Q., Leppäranta, M., Yang, Y., Wang, X., and Liao, H.: Dynamic simulation of nutrient distribution in lakes during ice cover growth and ablation, Chemosphere, 281, 130781, https://doi.org/10.1016/j.chemosphere.2021.130781, 2021.
Zakhvatkina, N., Smirnov, V., and Bychkova, I.: Satellite SAR Data-based Sea Ice Classification: An Overview, Geosciences, 9, 152, https://doi.org/10.3390/geosciences9040152, 2019.


