the Creative Commons Attribution 4.0 License.
the Creative Commons Attribution 4.0 License.
 | 08 Oct 2024
El Niño enhances snow-line rise and ice loss on the Quelccaya Ice Cap, Peru
Laura J. Larocca
Lonnie G. Thompson
Bryan G. Mark
Tropical glaciers in the central Andes are vital water resources and crucial climate indicators, currently undergoing rapid retreat. However, understanding their vulnerability to the combined effects of persistent warming, the El Niño and La Niña climate phenomena, and interannual fluctuations remains limited. Here, we automate the mapping of key mass balance parameters on the Quelccaya Ice Cap (QIC) in Peru, one of the largest tropical ice caps. Using Landsat's near-infrared (NIR) band, we analyze snow cover area (SCA) and total area (TA) and calculate the accumulation area ratio (AAR) and equilibrium-line altitude (ELA) over nearly 40 years (1985–2023). Between 1985 and 2022, the QIC lost ∼58 % and ∼37 % of its SCA and TA, respectively. We show that the QIC's reduction in SCA and rise in ELA are exacerbated by El Niño events, which are strongly correlated with the preceding wet season's Oceanic Niño Index (ONI). Further, expansion in the QIC's SCA is observed during all La Niña years, except during the 2021–2022 La Niña. Although this is a singular event, it could indicate a weakened ability for SCA recovery and an accelerated decline in the future, primarily driven by anthropogenic warming.
- Article
(4134 KB) - Full-text XML
-
Supplement
(1009 KB) - BibTeX
- EndNote


Tropical glaciers are important freshwater resources known to be especially sensitive to climate shifts (Kaser and Osmaston, 2002). The accelerated decline of these glaciers in response to recent warming has been widely documented over the past few decades (Bradley et al., 2006; Braun et al., 2019; Hanshaw and Bookhagen, 2014; Hugonnet et al., 2021; Pepin et al., 2015, 2022; Seehaus et al., 2020; Thompson et al., 2011, 2021; Vuille et al., 2015). At low latitudes, glaciers are projected to lose ∼69 % to 98 % of their 2015 mass by 2100, depending on the emissions scenario (i.e., RCP2.6 (Representative Concentration Pathway 2.6) and RCP8.5, respectively; Rounce et al., 2023). The mass balance of tropical glaciers is strongly affected by the freezing-level height (FLH), the lowest altitude in the atmosphere at which temperatures reach 0 °C (Schauwecker et al., 2017). In the tropics, the FLH is affected on an interannual basis by El Niño–Southern Oscillation (ENSO) variations and follows the multivariate ENSO index (MEI) on a year-to-year basis (Bradley et al., 2009; Favier et al., 2004; Thompson, 2000; Vuille et al., 2000). Of particular concern are the effects of these transient climate events, in combination with ongoing warming, on the Quelccaya Ice Cap (QIC) – one of the largest tropical ice caps in the Cordillera Vilcanota range in the outer tropical Andes (Fig. 1). Worst-case (RCP8.5) projections suggest that the QIC's “point of no return” (i.e., the rise in equilibrium-line altitude (ELA) above the summit) could occur as early as 2050 (Yarleque et al., 2018), potentially leaving the QIC as a wasting ice field (similar to that observed on Mount Kilimanjaro). Contemporary changes in the QIC's outlet glaciers have been frequently monitored (Brecher and Thompson, 1993) and contextualized within a longer, millennial-scale time frame (e.g., Mark et al., 2002; Lamantia et al., 2023). For example, Mark et al. (2002) combined moraine chronology with digital topography to model deglaciation rates for the last glaciation and the Holocene and found that the QIC's most rapid retreat has occurred in recent centuries. Further, radiocarbon-dated plant remains from the QIC ice margin suggest that the ice cap's present-day extent is the most retracted it has been in the last 7000 years (Lamantia et al., 2023). In addition, the QIC's high-resolution ice core records have proven invaluable for understanding past climatic and environmental variability in the region (Thompson, 2000; Thompson et al., 1985, 2013, 2017, 2021). Thus, the ongoing loss of tropical glaciers will not only impact local communities that depend on glacial meltwater but will also have implications for preserving long-term climate records, which are essential for assessing the rate and magnitude of current changes (Thompson et al., 2021).
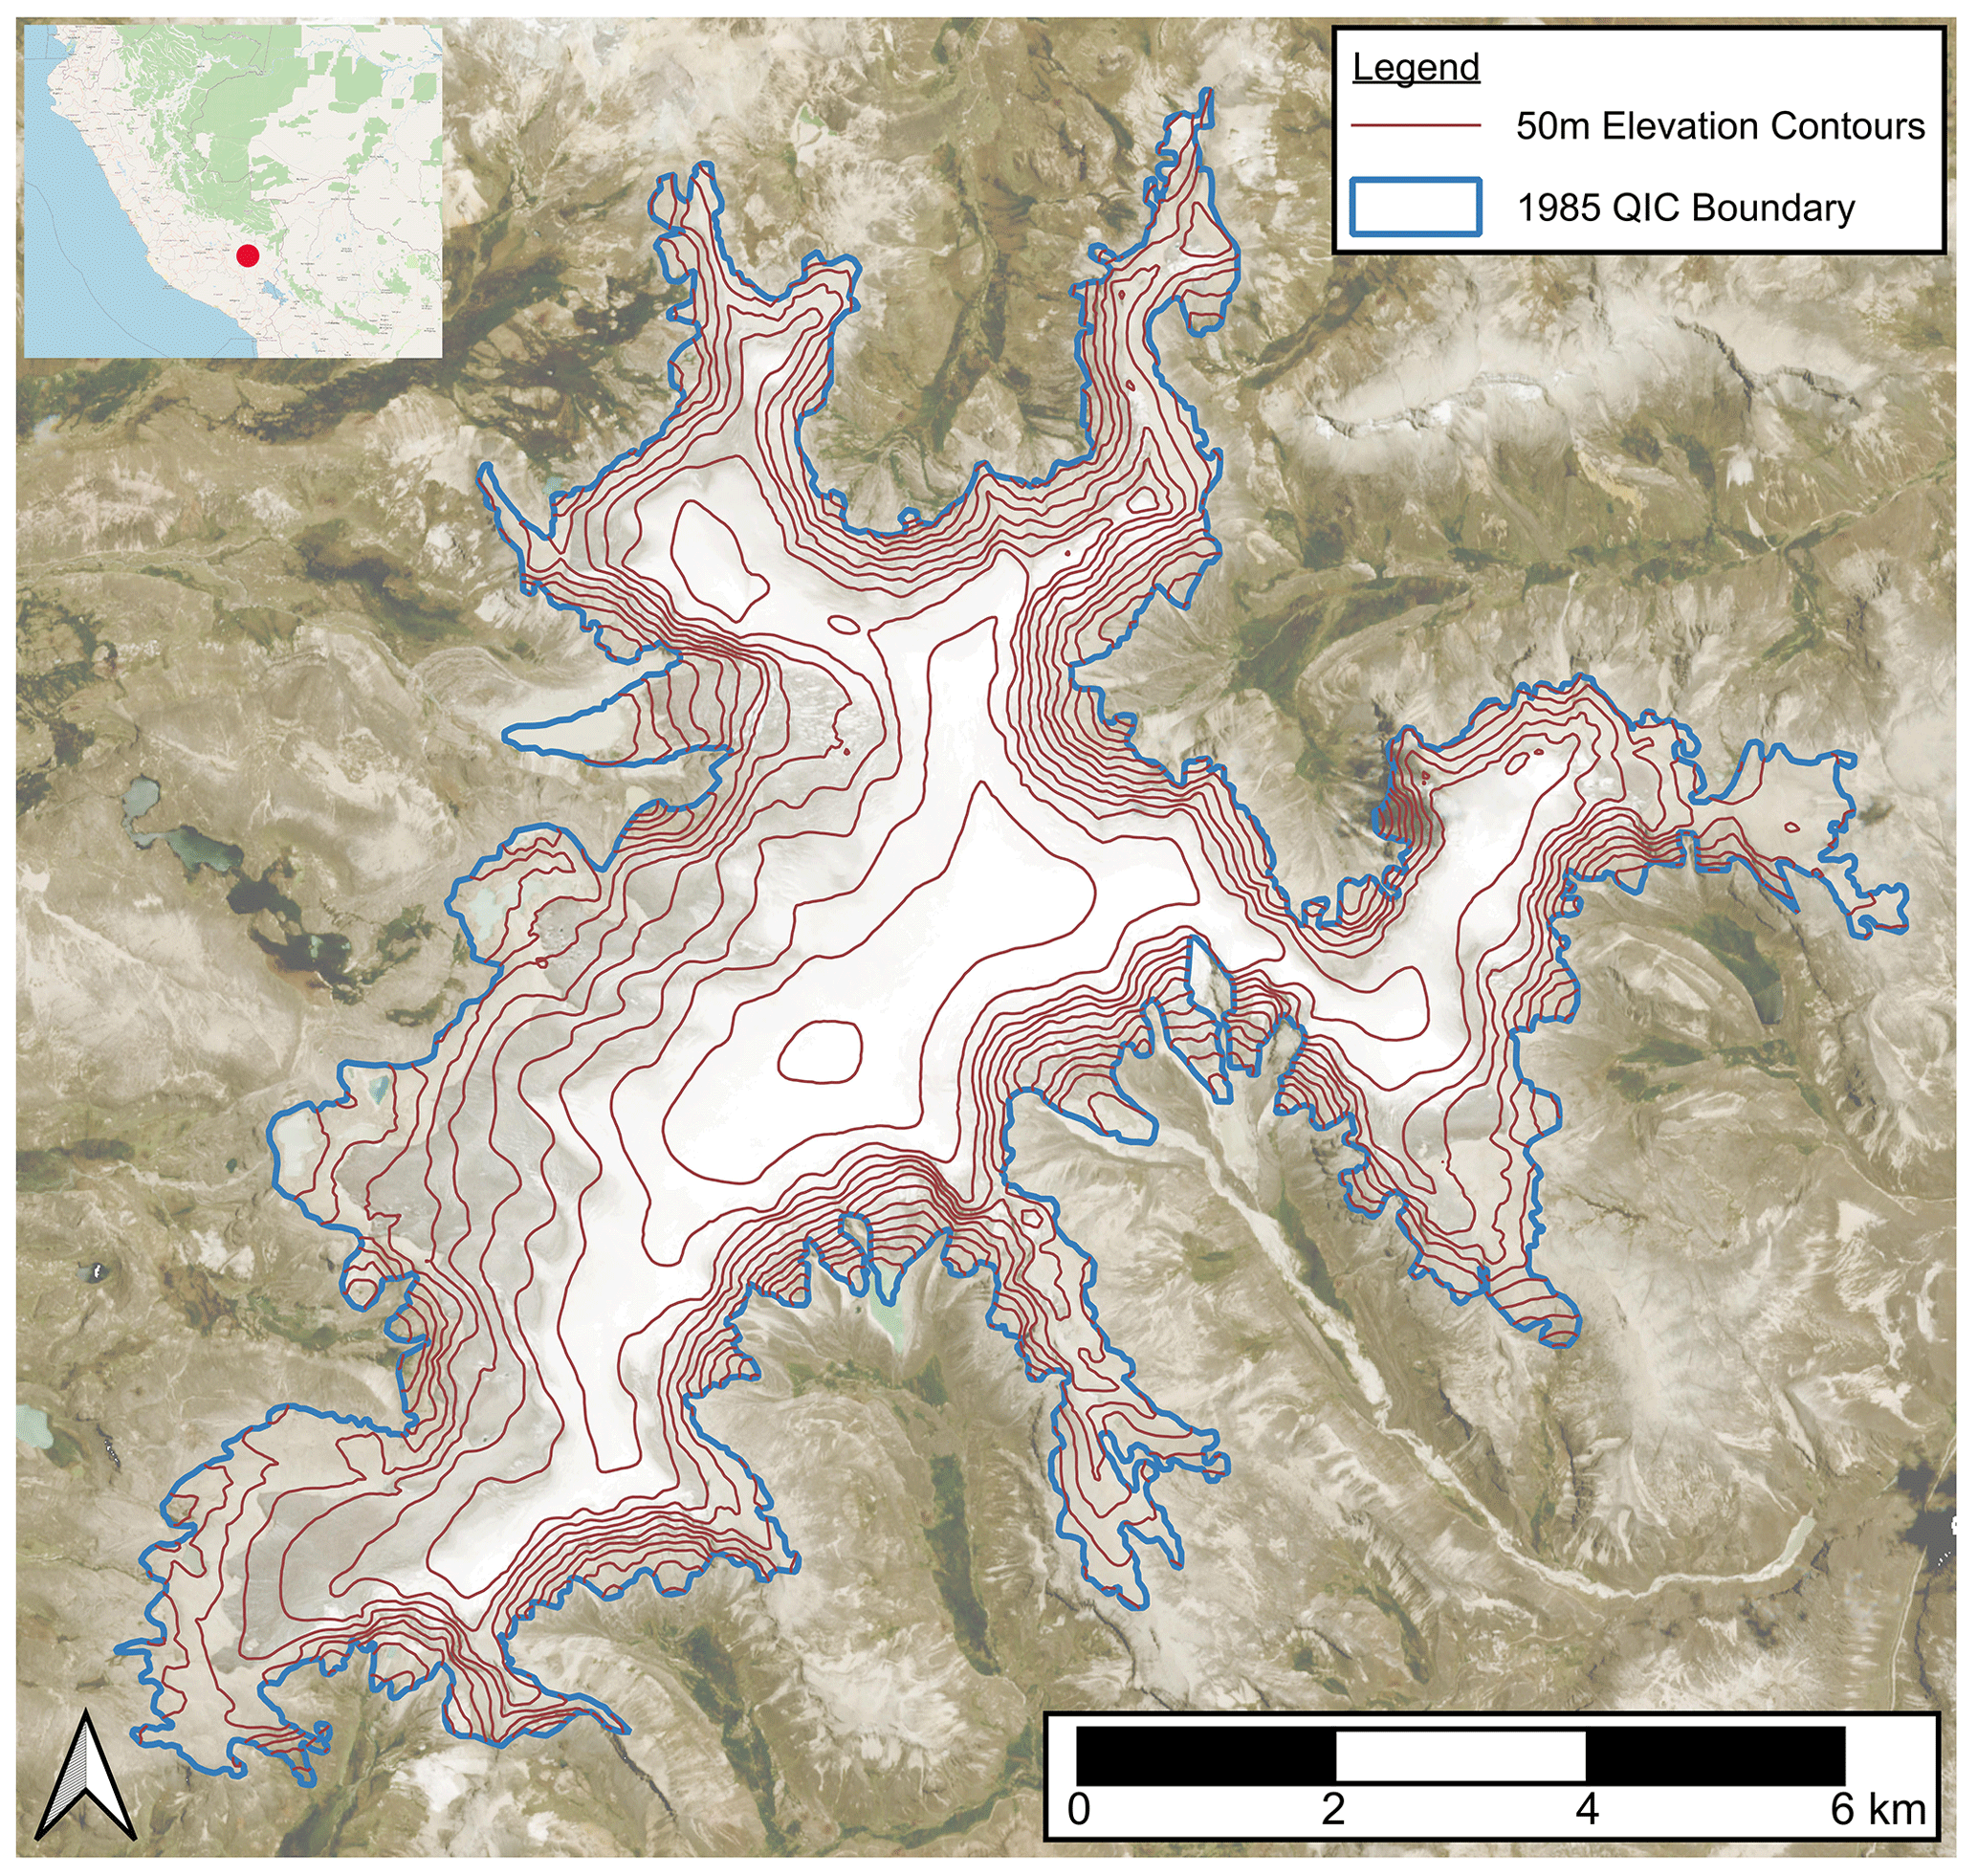
Figure 1Aerial view of the Quelccaya Ice Cap (QIC; 13°56′ S, 70°50′ W) from 11 October 2023. The summit of the QIC reaches 5670 m above sea level (a.s.l.) and is characterized by several outlet glaciers to the west and a steep-sided eastern portion. Base imagery was obtained from Planet Labs' Dove satellites using a 3 m resolution, and the inset (top left) was obtained from the OpenStreetMap database (© OpenStreetMap contributors (2023); distributed under the Open Data Commons Open Database License (ODbL) v1.0).
In the tropics, there is no seasonal snow cover beyond the glacierized area that would provide an additional buffer for the ice cap's decline (Vuille et al., 2018). Snowfall on the QIC is largely controlled by the South American summer monsoon (SAMS), with snow accumulation peaking in December, while moisture transport from the Amazon lowlands to the Andes is modulated by ENSO fluctuations (Hurley et al., 2015). There has been no major change in hydroclimate over the last 40 years in the Andes and Peruvian Amazon Basin, with only 10 % of stations in the Andes recording a decrease in rainfall since the 1980s (Casimiro et al., 2013). However, ice core records from the QIC show that net accumulation in the region has been above average for the last century (Thompson, 2017). In the Andes and Peruvian Amazon Basin, mean annual temperature has increased by ∼0.09 °C per decade over the last 40 years, while maximum summer temperatures exhibit a higher increase in magnitude (∼0.15 °C per decade; Casimiro et al., 2013). This warming trend is also reflected in ice core stable-isotope (δ18O) records from multiple locations in Peru (Thompson, 2017; Thompson et al., 2013, 2017). High-resolution ice core records indicate that the QIC is an excellent recorder of El Niño, characterized by elevated sea surface temperatures (SSTs) in the eastern Pacific Ocean, with strong events recording isotopically enriched δ18O (Thompson et al., 2011, 2017). Nearby mountain ranges, such as the Cordillera Blanca and Cordillera Real, have experienced an increase in FLH of 160 m over the last 5.5 decades (Schauwecker et al., 2017). This has implications not only for where snow can survive and accumulate (Bradley et al., 2009; Schauwecker et al., 2014; Seehaus et al., 2020) but also for the phase of precipitation and the rain–snow line, affecting surface albedo (Rabatel et al., 2013). Although the recent and distant histories of several tropical glaciers have been monitored and reconstructed (Brecher and Thompson, 1993; Lamantia et al., 2023; Mark et al., 2002; Vuille et al., 2018; Yarleque et al., 2018), the sensitivity and response of these glaciers to the combined effects of sustained warming and interannual climate variations, such as the ENSO, have yet to be extensively evaluated over recent decades. The QIC is located in an ideal setting for assessing the impact of these collective effects on tropical glacier vulnerability.
Since routine ground-based measurements obtained in remote locations, such as south-central Peru, are difficult to maintain, using satellite imagery to estimate the ELA has become a viable option for long-term glacier monitoring. Previous studies have shown that the location of snow-line altitude (SLA) at end of the dry season (September) can act as a proxy for ELA and ultimately be used to infer the mass balance of a glacier or ice cap (Fang et al., 2011; Hu et al., 2020; Liu et al., 2021; Racoviteanu et al., 2019). In the outer tropics, Rabatel et al. (2012) compared manual assessments of SLA for the Artesonraju and Zongo glaciers via Landsat and Satellite Pour l'Observation de la Terre (SPOT) imagery with field-based ELA measurements and found that the highest SLA during the dry season provides a good estimate of the annual ELA. More recently, Yarleque et al. (2018) used Landsat observations of the highest annual SLA to calibrate the ELA–FLH relationship to assess the future state of the QIC in response to several warming scenarios. Here, we employ a cloud-based analysis of satellite imagery to assess the QIC at the end of the dry season between 1985 and 2023. We automate not only the detection of the snow-covered area (SCA) and total area (TA) but also the calculation of the accumulation area ratio (AAR), the median elevation of the SCA, and SLA as a proxy for ELA. Changes in the AAR, ELA, and SCA are analyzed alongside climate data from the fifth generation of the European Centre for Medium-Range Weather Forecasts (ECMWF) Land reanalysis (ERA5-Land), including total precipitation and 550 hPa temperature data, as well as multiple ENSO indices – the MEI, the Oceanic Niño Index (ONI), and the Southern Oscillation Index (SOI). We focus our analyses on the strongest and most recent El Niño events (1998, 2016, and 2023) and the QIC's response to these interannual climate anomalies.
2.1 Current analysis techniques
Manual snow-line tracing is often limited to high-quality imagery when discerning between snow and ice. However, recent advances in image analysis have allowed for the automation of snow-line detection via satellite imagery. Typically, a suite of images, often from Landsat satellites, are paired with one or more digital elevation models (DEMs) and a glacier outline within the temporal scale of interest (Li et al., 2022). From there, a variety of thresholds are evaluated and set for the area of interest to separate snow from ice and extract the position of the transition (Racoviteanu et al., 2019). There are challenges in this process, including the adjustment of surface reflectance for varying topographies, the occurrence of patchy snow cover on the glacier surface, and highly variable atmospheric conditions that require the algorithm to be customized for the location of interest (Racoviteanu et al., 2019). Previous studies on Andean glaciers have used a handful of techniques to extract the location of the snow line and to overcome some of the aforementioned challenges; these techniques include spectral mixture analysis, simple band ratios and filtering, hillshade mask shadow removal, and manual editing (Hanshaw and Bookhagen, 2014; Klein and Isacks, 1999). Here, we implement an automated approach that employs a topographic correction, followed by segmentation of the NIR band via the Otsu method (Otsu, 1975), which we describe in further detail in Sect. 2.3.
2.2 Satellite data collection
To automate the SCA detection and ELA calculation, the following data inputs were required: an annual satellite image, a DEM, and the 1985 outline of the QIC. Using Google's Earth Engine platform, we selected annual Landsat images as close as possible to 15 September, with clear visibility of the QIC, from 1985 to 2023 (Table S1 in the Supplement). Middle to late September marks the end of the dry season in the Cordillera Vilcanota, which enabled analysis of the ice cap without extraneous snowfall around the perimeter. Imagery from each year was, on average, ±23 d within the target date and was manually inspected to ensure no recent snowfall events had occurred. If September imagery was not available, October and November images were collected. If imagery was still not available, August and July images were collected with the intent of capturing the conditions closest to the end of the dry season at the QIC. No images were used if a recent snowfall event was evident. Sentinel-2 imagery was used for 2021 and 2023 due to a lack of cloudless images from Landsat-8 and Landsat-9. Separate scripts were adapted for each satellite (i.e., Landsat 8, Landsat 9, and Sentinel-2). We note that the 2023 results are not included in our initial analysis of the QIC's ELA change as they would have been from an incomplete El Niño event. No imagery was collected for the years 1987, 1993, 2004, 2012, and 2018 due to high cloud cover and/or visible snowfall events. We used two DEMs to account for changes in ice elevation over time and any downwasting of the QIC. The NASA Digital Elevation Model (NASADEM), created as part of the Shuttle Radar Topography Mission, was implemented from 1985 to 2005. After 2005, the Copernicus 30 m (COP30) DEM, released in 2010, was implemented. Additionally, multiple images (16 and 18, respectively) were collected before, throughout, and after the two largest El Niño events (i.e., during the periods 1997–1999 and 2015–2017), from June of the first year to November of the last year, to assess intra- and interannual changes and the response of the QIC to these events.
2.3 Satellite image analysis of snow cover area
To begin with, the least cloudy image from the target year that was closest to the end of the dry season was clipped to the region of interest, i.e., the delineated QIC boundary (step 1; Fig. S1 in the Supplement). Preprocessing of each image included calculating the slope and aspect of the region of interest from the DEM (step 2). We implemented an Ekstrand correction (Ekstrand, 1996) to account for topographic effects due to differences in sun elevation and incidence angle (step 3), such as shadowing, rather than using a pixel-based Minnaert correction method (Ge et al., 2008), which would have resulted in the overcorrection of the steeper eastern side of the QIC. To delineate the snow cover area (SCA), the NIR band was assessed with an image segmentation algorithm, the Otsu method (Gaddam et al., 2022; Otsu, 1975). This resulted in a bimodal frequency histogram in which an automatically detected threshold separated snow from ice (step 4; Fig. S2). Once calculated, this threshold was applied to the NIR band to create a binary mask of snow and ice (step 4). The annual image and DEM were then clipped to the snow mask, creating the SCA, and the DEM data were extracted (step 5). Following this, the SCA was calculated based on the number of pixels and the image resolution, and the median elevation of the SCA was determined. SCAs were exported to shapefiles, and the DEM data were exported as a histogram, divided into 50 m elevation bins (step 6).
2.4 Calculation of the total area, AAR, ELA, and uncertainty
As SLA is a proxy for ELA, we will use the term ELA from this point forward. In pursuit of the ELA, we calculated the accumulation area ratio (AAR). The AAR is defined as , where Ac is the accumulation area, Ab is the ice-covered area, and (Ac + Ab) is the total area (TA) (Meier, 1962). In this case, Ac is the SCA, and (Ac + Ab) is the TA (both ice and snow). To calculate the TA, we automated the calculation of the normalized difference snow index (NDSI), which leverages the reflectance of snow and ice in the green and shortwave-infrared (SWIR) spectra compared to other land cover types. The NDSI is calculated as follows: , where ρG and ρSWIR represent the reflectance of the green and shortwave-infrared bands, respectively (Dozier, 1989; Hall and Riggs, 2007). We again used the Otsu thresholding method to calculate the NDSI threshold, typically set around 0.4 (Dozier, 1989; Hall and Riggs, 2007; Otsu, 1975; Sankey et al., 2015). By applying the threshold to each image, we obtained a binary image of snow and ice versus land cover and used this to calculate the TA (i.e., by multiplying the number of snow- and ice-covered pixels by the appropriate pixel resolution; step 7). The AAR was calculated by dividing the SCA by the TA (step 8). The ELA was calculated using the DEM and the AAR by identifying the elevation at the non-AAR percentile (i.e., the percentile corresponding to 1 minus the AAR) for elevations in TA (step 9; Fig. S3). For example, if the AAR is 0.8, we assume that the ELA is located at the 20th percentile of elevations in TA. In summary, for each image analyzed, we obtained the SCA, the median elevation of the SCA, the TA, the AAR, and the ELA. Results calculated for the SCA and TA via our automated methods agree with 10 manual SCA and TA digitizations (±3 %) performed in the following years: 1985, 1989, 1992, 1998, 2002, 2006, 2010, 2016, 2019, and 2023. Other studies have shown that automated detection of snow lines produces results similar to those of manual digitization (Hanshaw and Bookhagen, 2014), with automated detection being preferable as repetition is simpler and any errors are likely to be more consistent (Paul et al., 2013).
2.5 Reanalysis climate data and ENSO correlation
To compare the QIC's SCA and ELA with climate data, we used daily and monthly averaged ERA5-Land reanalysis climate data from the European Centre for Medium-Range Weather Forecasts, including total precipitation and 550 hPa temperature data (Hersbach et al., 2020). We divided the data into wet (October–April) and dry (May–September) seasons based on precipitation records and past literature (Kaser and Osmaston, 2002; Veettil et al., 2017). To assess changes in climate at the QIC over time, we calculated average precipitation and temperature in 5-year intervals, as well as the average number of days above and below freezing for each season and year, from 1985 to 2023. Finally, to assess the QIC's interannual response to climatic anomalies, we paired detrended ELA and SCA, along with the median elevation of the SCA, against the MEI, SOI, and ONI, as obtained from the National Oceanic and Atmospheric Administration (NOAA), for correlation (https://www.weather.gov/fwd/indices, last access: 1 August 2024). We defined El Niño and La Niña periods using the ONI. The ONI is measured as the 3-month running mean of sea surface temperature (SST) anomalies for the Niño 3.4 region (5° N–5° S, 120–170° W). Traditionally, the anomalies must exceed a ±0.5 °C threshold for at least five consecutive 3-month periods to be classified as a “fully fledged” El Niño or La Niña. Here, we used an ONI threshold of ±1.0 °C, instead of the usual ±0.5 °C threshold, to isolate the strongest events across the last 4 decades (i.e., El Niño events were defined by an ONI ≥1, while La Niña events were defined by an ONI ). As the target month of observation for each year was September, QIC variables for each year were correlated with ENSO indices over the preceding months (i.e., over the year before the observation date) to analyze the response of the QIC to climatic anomalies. For example, correlations were tested between QIC variables from September 1998 and ENSO indices from September 1997 to August 1998. We evaluated all three previously mentioned ENSO indices but will focus solely on the ONI in the following sections as it presents the clearest patterns between the ENSO and the assessed QIC variables.
3.1 The decline of the QIC and multi-decadal climate trends
Between 1985 and 2022, the QIC lost ∼37 % of its TA and ∼58 % of its SCA: specifically, in 1985, the TA and SCA were ∼ 58.7 km2 and ∼ 46.4 km2, respectively, while in 2022, the TA and SCA were ∼ 36.7 km2 and ∼ 19.7 km2, respectively (Table S2). Within the first and last 5 years of this observational period (i.e., from 1985–1989 and from 2018–2022), the QIC's TA and SCA declined by ∼29 % and ∼38 %, respectively. These TA losses were concurrent with a retreat in the SCA to higher elevations (Fig. 2). We observed rises of ∼209 and ∼113 m in ELA and the median elevation of the SCA, respectively (from 1985 to 2022). In 1985, 90 % of the SCA existed above 5250 m above sea level (a.s.l.), whereas by 2021, 90 % of the SCA had shifted to elevations above 5350 m a.s.l. Further, by 2022, 90 % of the SCA has shifted to even higher elevations (above 5400 m a.s.l). On average, the SCA and TA decreased by ∼0.72 km2 and ∼0.59 km2 yr−1, respectively, with an average yearly ELA rise of ∼5.65 m yr−1. If we consider the full observation period (1985–2023), linear regression models suggest a loss of 0.47 ± 0.09 km2 yr−1 (R2=0.44; p<0.001) in the QIC's SCA, a loss of 0.49 ± 0.02 km2 yr−1 (R2=0.93; p<0.001) in the QIC's TA, and an average rise of 3.61 ± 0.79 m yr−1 (R2=0.40; p<0.001) in the QIC's ELA. However, the removal of the three strongest El Niño years (1998, 2016, and 2023) resulted in slower average losses in the QIC's SCA and a slower average rise in the QIC's ELA, with values of −0.42 ± 0.07 km2 yr−1 (R2=0.58; p<0.001) and +3.25 ± 0.64 m yr−1 (R2=0.47; p<0.001), respectively (Table S3). The QIC's average AAR (not including the El Niño and La Niña years) is 0.74 over the study period. For comparison, during the strongest El Niño years (1998, 2016, and 2023), the QIC's AAR was lower than average (0.32, 0.40, and 0.52, respectively), while during the strongest La Niña years (1999 and 2011), the QIC's AAR was higher than average (0.83 and 0.82, respectively).
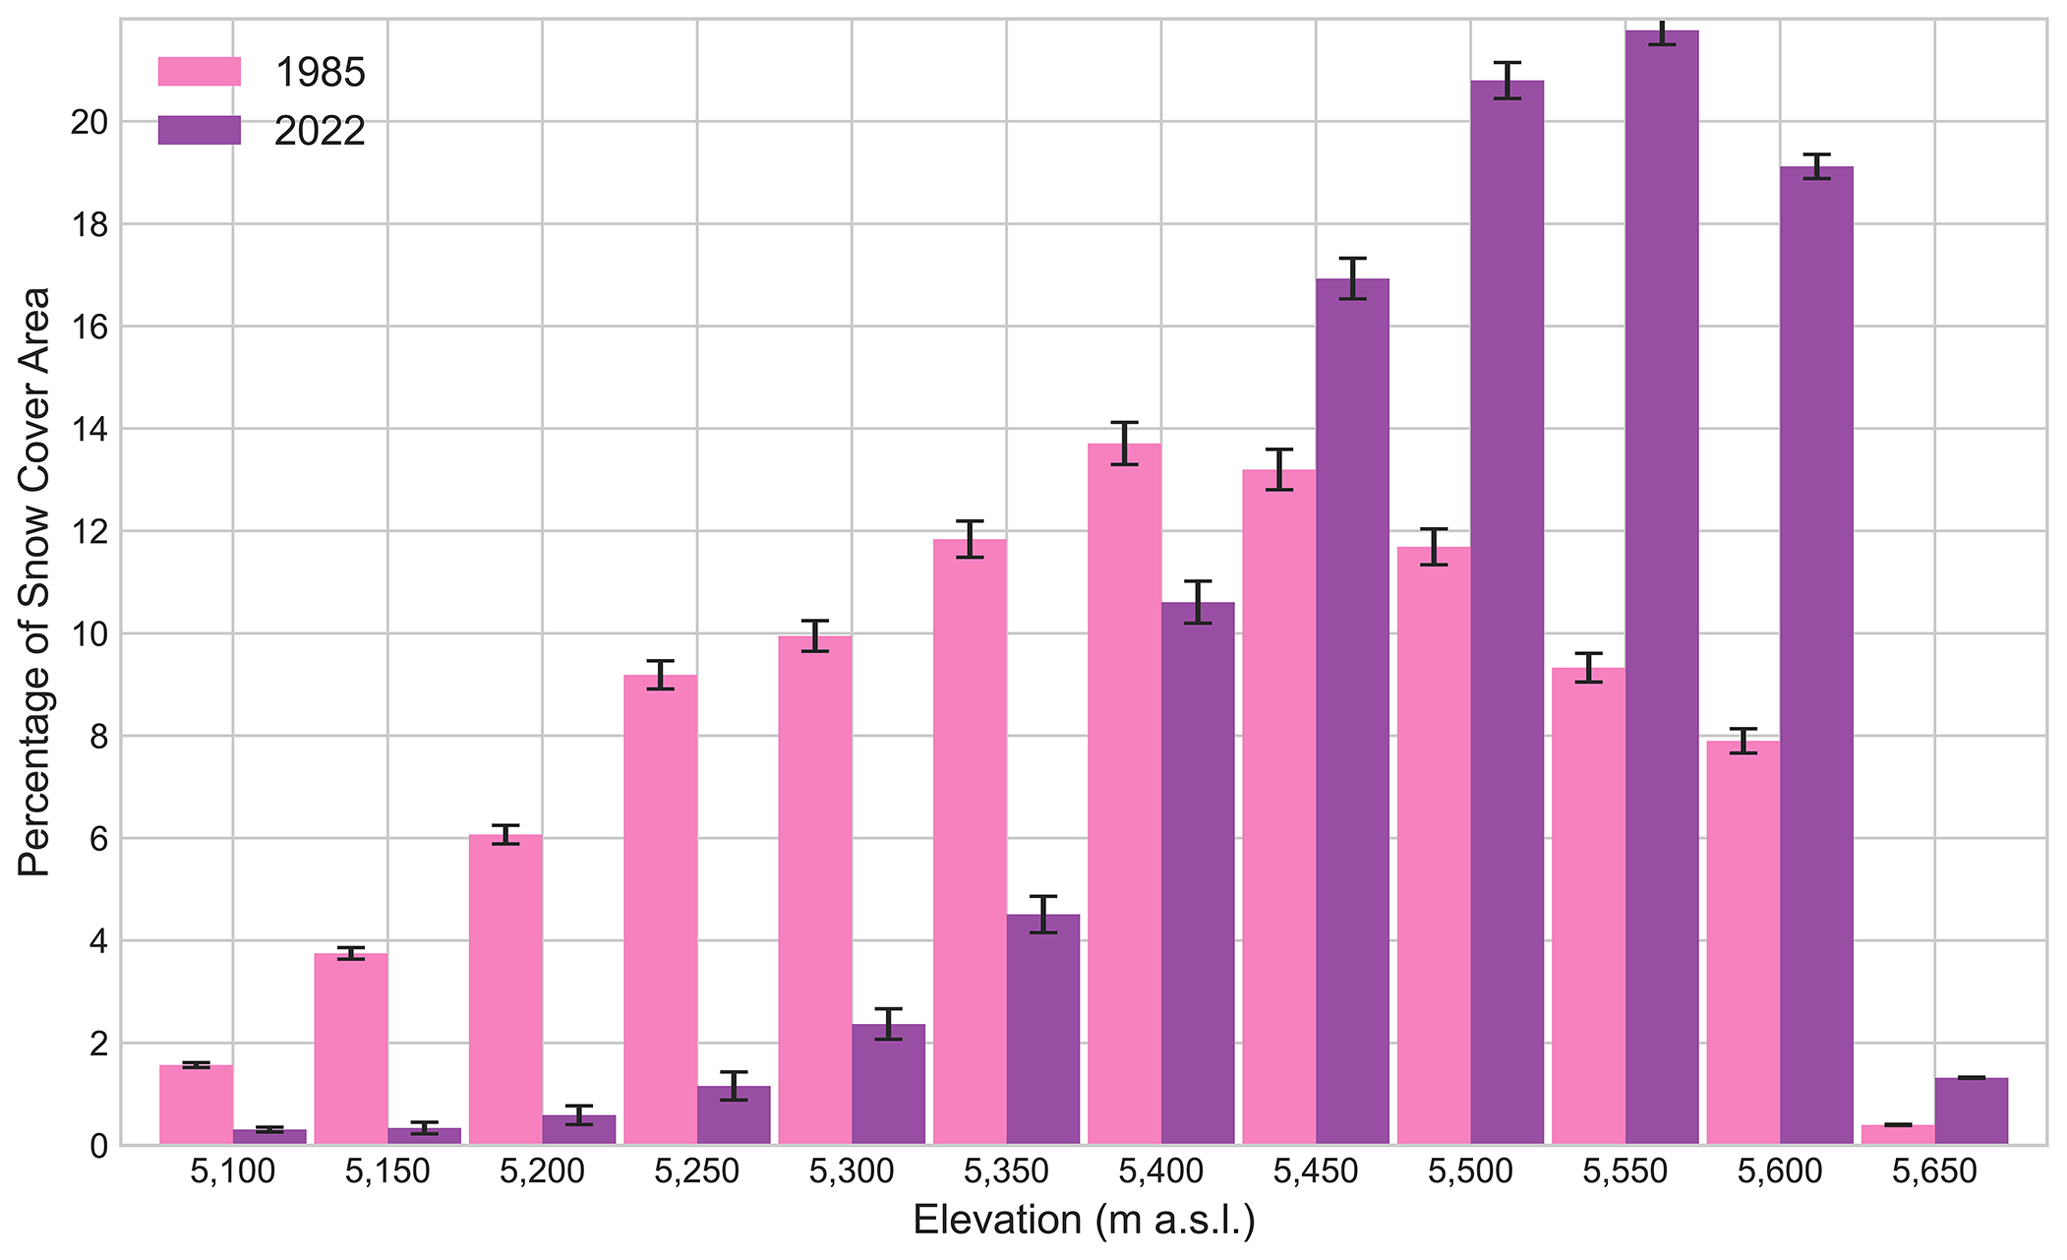
Figure 2Percentage of snow cover area (SCA) in 50 m elevation bins, demonstrating the shift in SCA to higher elevations. Error bars represent the ±3 % uncertainty calculated from comparisons to manual digitization.
Daily and monthly variations recorded at the QIC summit and bottom margin weather stations, as reported by Bradley et al. (2009), are well correlated with the ERA5-Land 550 hPa temperature dataset (R2=0.81), which was used to determine changes in temperature throughout the observation period. Between the first and last 5 years of our observational period, the reanalysis climate data show a ∼0.60 °C increase in wet-season (October–April) temperatures and a ∼1.14 °C increase in dry-season (May–September) temperatures. Correspondingly, the number of days with temperatures above 0 °C rose from 1 % to 6 % in the wet season and from 0.5 % to 8 % in the dry season between the first 5 and last 5 years. These results are consistent with previous studies that suggest a ∼0.1 °C per decade rise in upper-air temperatures and a rise in the height of the freezing level (∼45 m between 1977–2007) in the tropics near the QIC (Bradley et al., 2009; Vuille et al., 2008). We observe no significant change in precipitation in either the wet season or the dry season – in the wet season, R2=0.02 and p=0.11, while in the dry season, R2=0.03 and p=0.09. On average, 73 % of the precipitation occurs during the wet season.
3.2 Response of the QIC to interannual climate phenomena
The strongest El Niño events (1998, 2016, and 2023) coincided with a large decrease in the QIC's SCA. We observed a ∼59 % reduction in SCA from 1997 to 1998 and a 49 % reduction from 2015 to 2016. Likewise, the QIC's AAR decreased from 0.71 to 0.31 from 1997 to 1998, and it decreased from 0.76 to 0.41 from 2015 to 2016. In 1999 (the year following the 1998 El Niño), the QIC's SCA fully rebounded back to its 1997 conditions. However, in 2017 (the year following the 2016 El Niño), the SCA only reached about 77 % of its 2015 value (recorded at ∼ 32.4 km2, whereas the 2017 SCA was recorded at ∼ 24.9 km2; Fig. 3). A modest increase in SCA is observed for 2019 (no imagery was available for 2018); however, to date, the SCA has not returned to its extent from before the 2015 El Niño, continuing to decline through 2022. The 2023 measurements occurred during an ongoing El Niño event. However, if we consider the additional 2023 El Niño year, we observe a ∼61 % decline in the QIC's SCA between 1985 and 2023, i.e., in just under 40 years (Fig. 4). While the height of the 2023 El Niño did not occur until December of 2023 (ONI=2.0), by our definition, an El Niño effect was in place as of July 2023 (ONI=1.1), and measurements were collected in October 2023 (ONI=1.8). The QIC's SCA in 2023 was ∼17.97 km2 – a 9 % loss compared to the 2022 value. The 2023 AAR was 0.53, well below the average (i.e., 0.74), and from 2022 to 2023, we observed rises of 16 and 8 m in the ELA and the median elevation of the SCA, respectively.
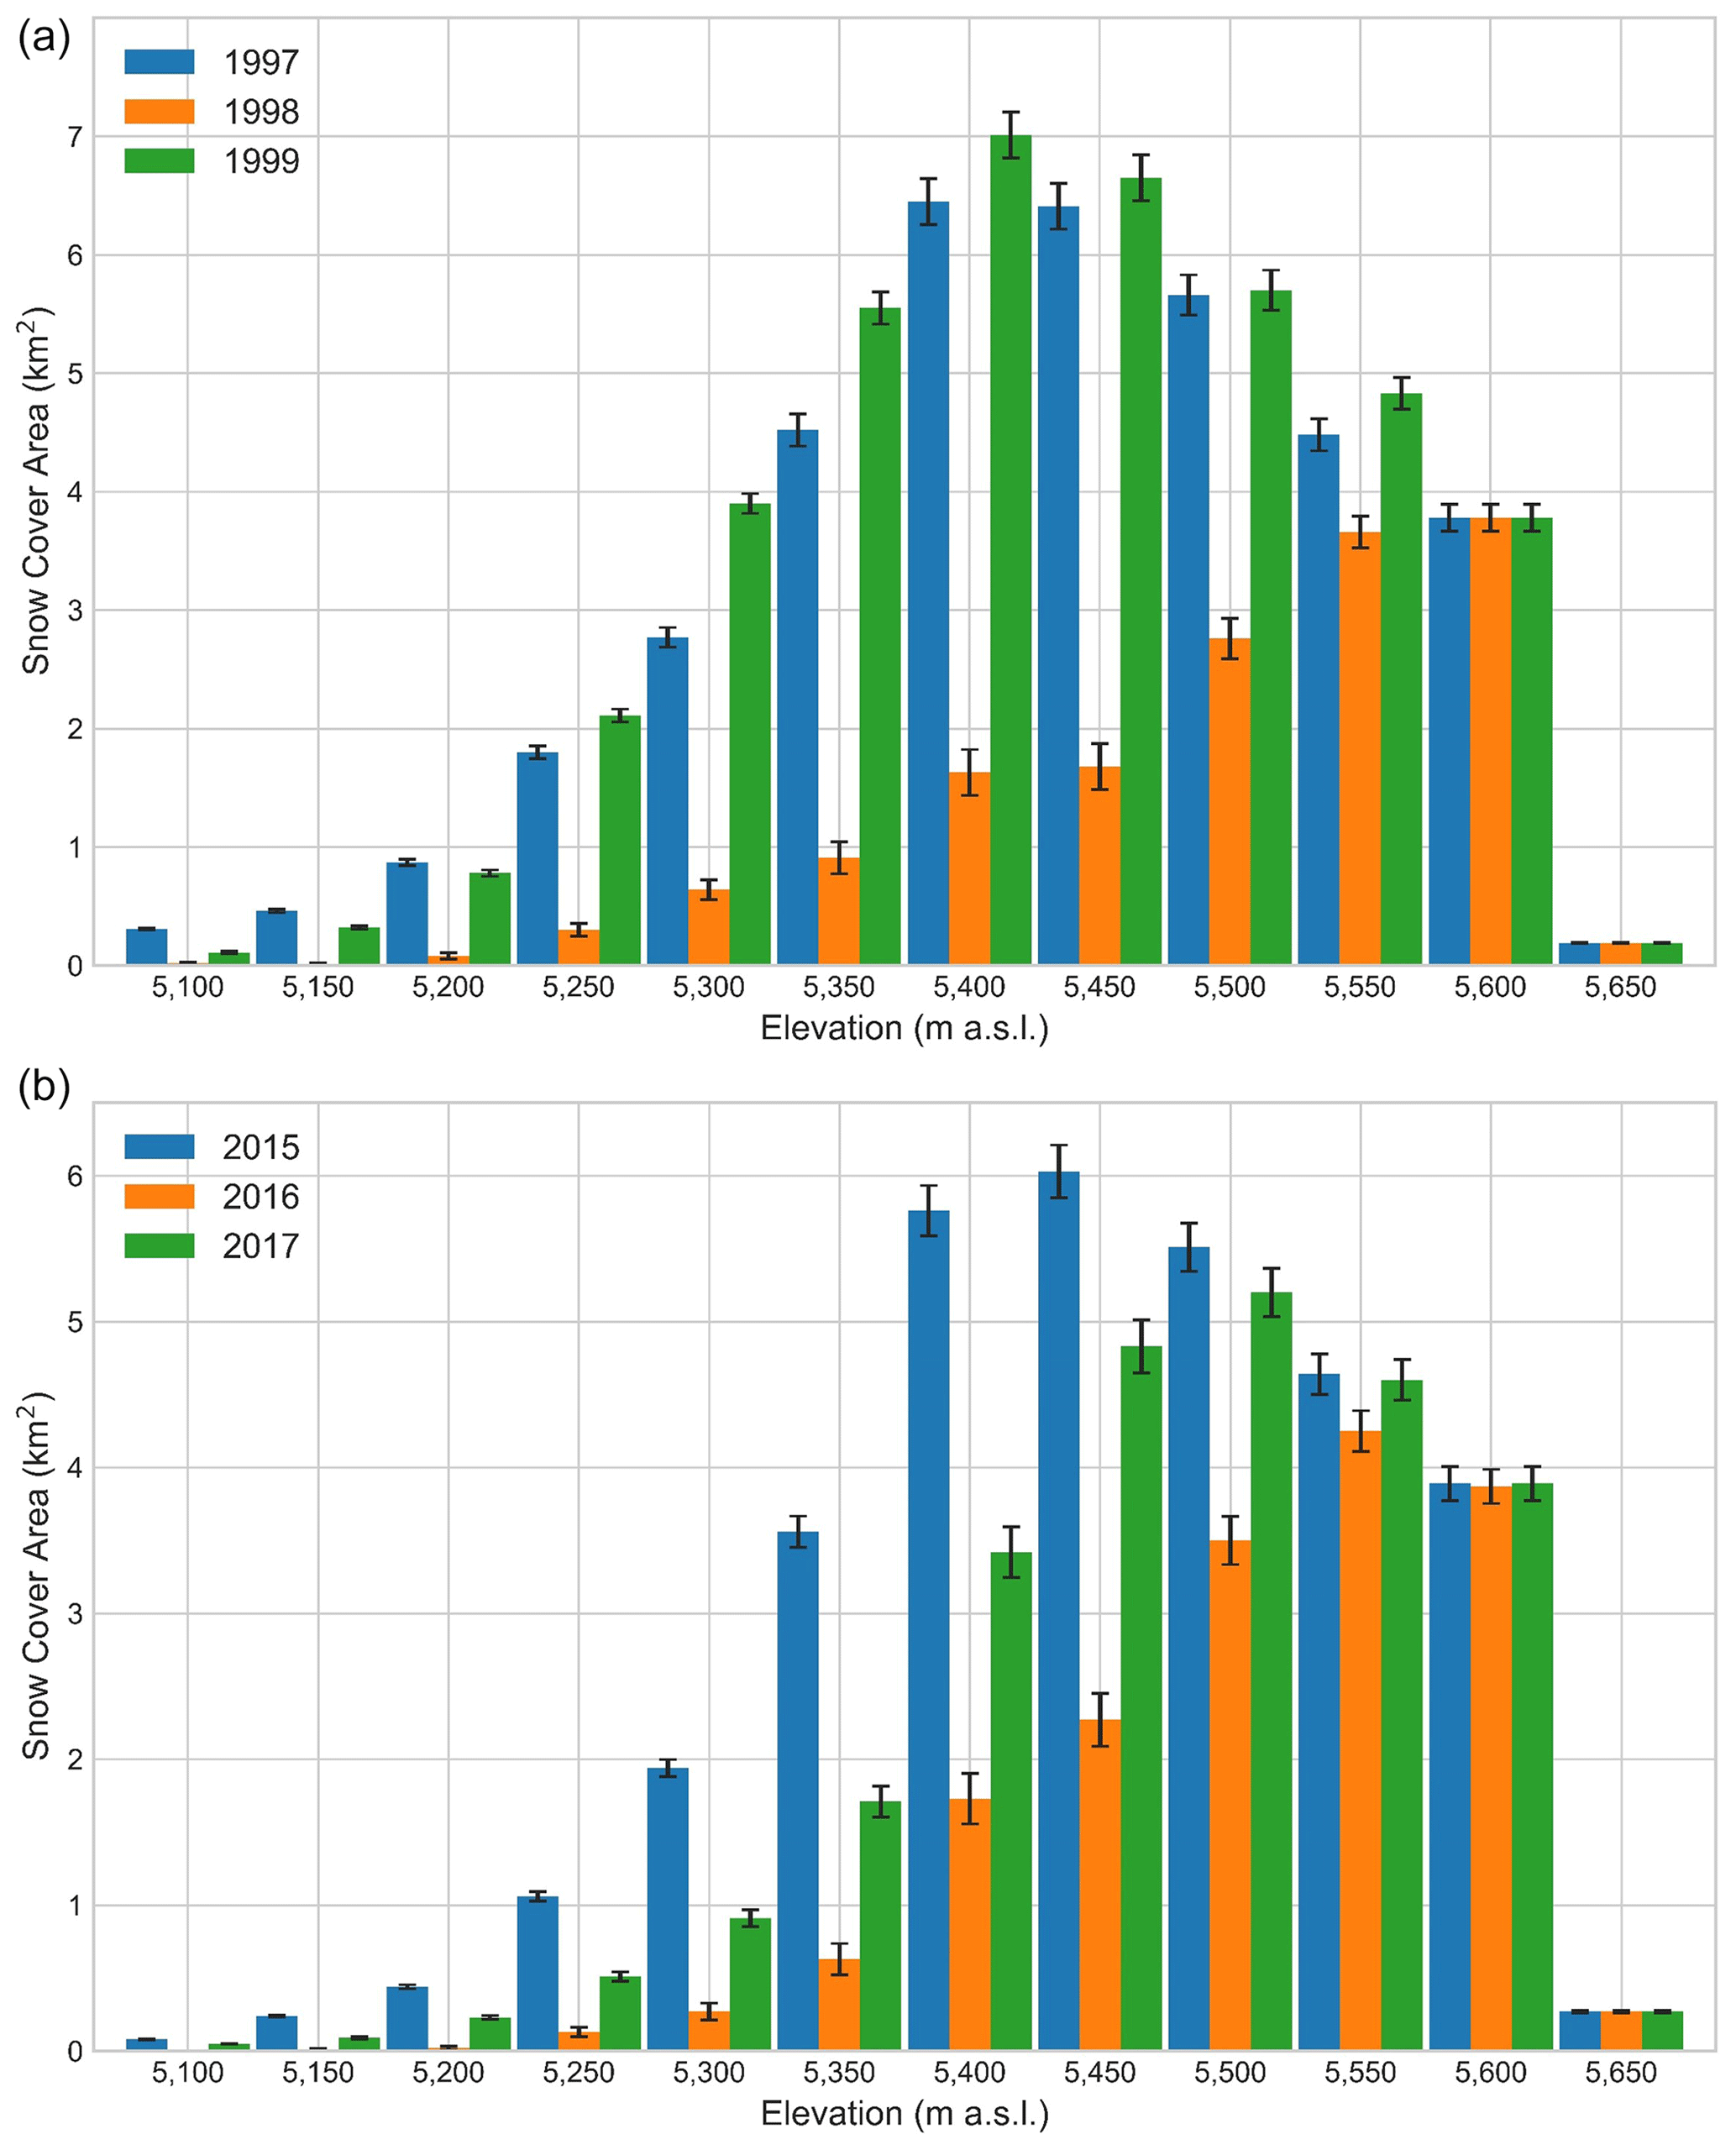
Figure 3(a) The distribution of snow cover (km2) showing the reduction and rebound of SCA during and following the 1998 El Niño event. (b) The reduction and incomplete recovery of SCA during and following the 2016 El Niño event. Error bars represent the ±3 % uncertainty calculated from comparisons to manual digitization.
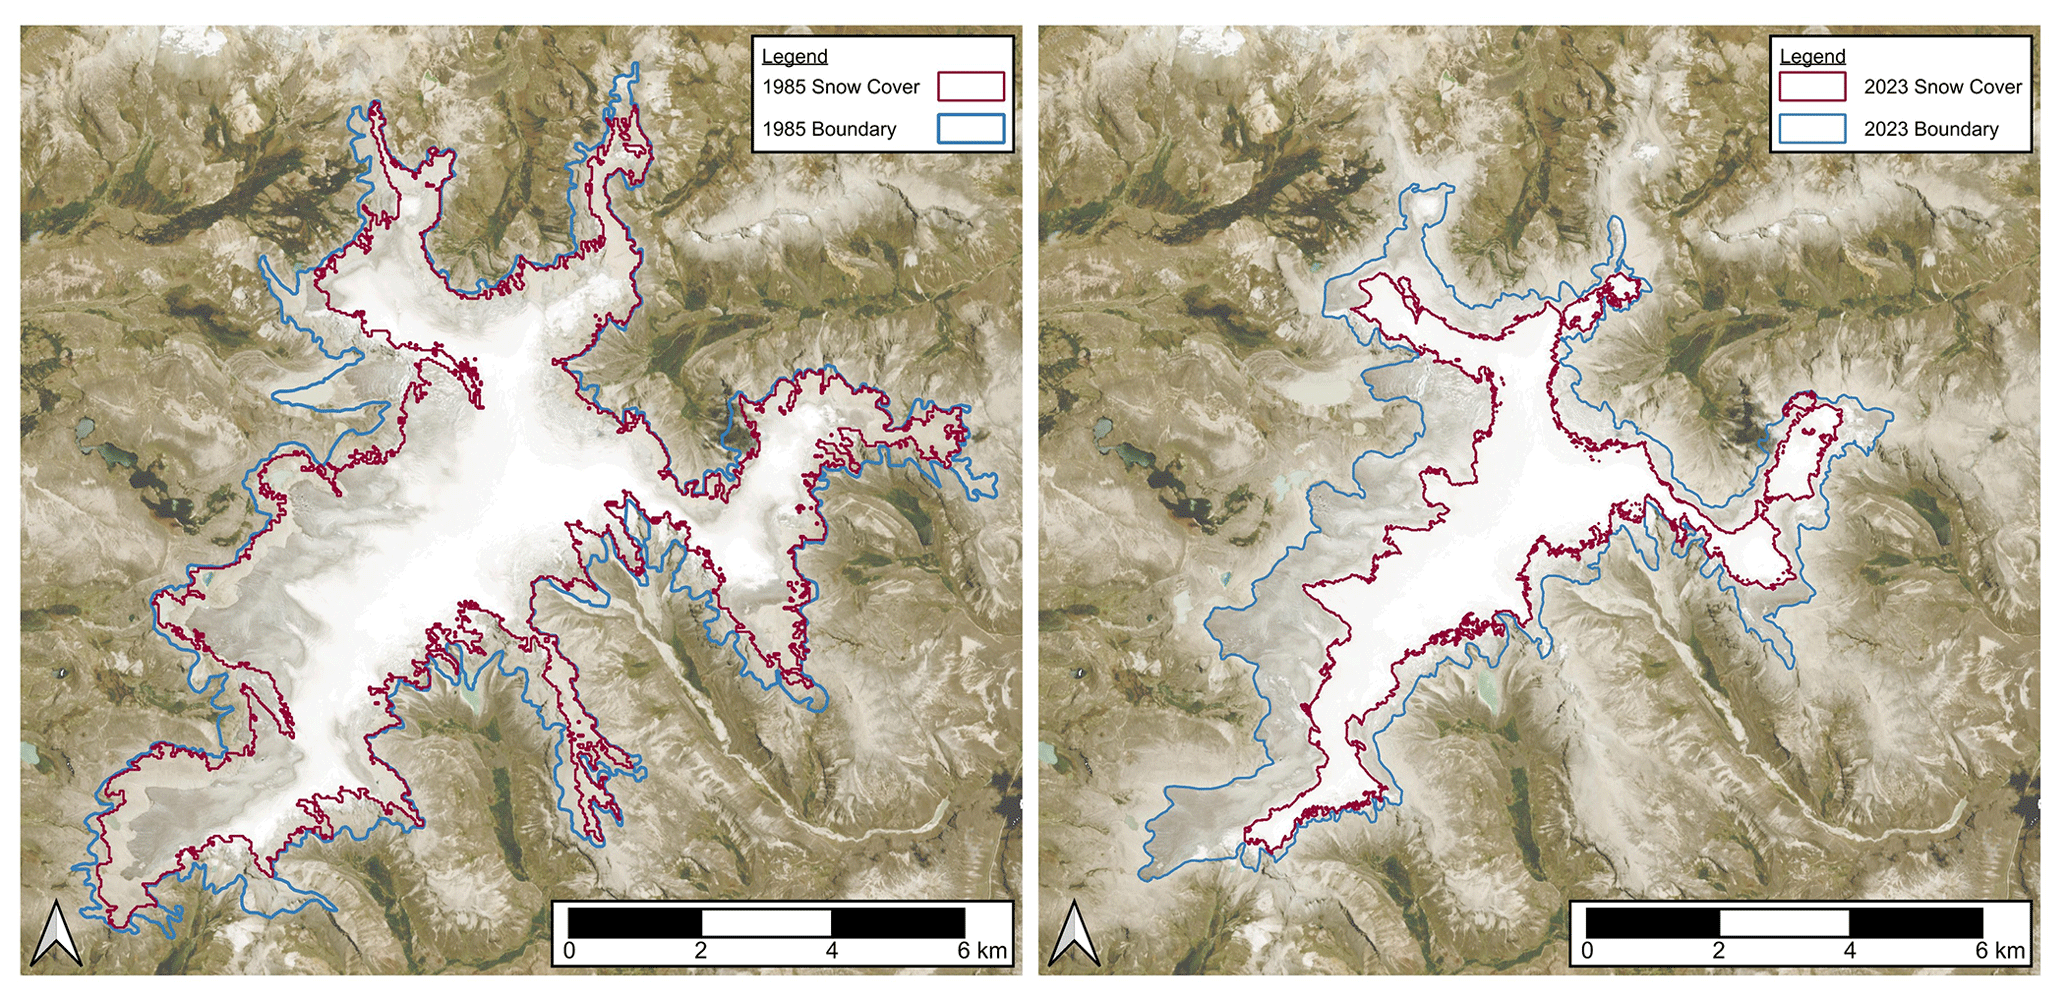
Figure 4Decrease in the QIC's SCA (red) and TA (blue) at the end of the dry season between 1985 (left) and 2023 (right). Base imagery was obtained from Planet Labs' Dove satellites using a 3 m resolution (October 2023).
Overall, the ONI is most strongly correlated with the median elevation of the SCA (Fig. 5), with its Pearson coefficient, calculated from the preceding April to the previous September, ranging from 0.46 to 0.61 (p<0.05; Table S5). The ONI and ELA are similarly positively correlated (with values ranging from 0.41 to 0.58 from April to September), while the ONI and SCA exhibit a negative correlation of similar strength from April through September (ranging from −0.44 to −0.60). To better assess the QIC's response to El Niño events, we utilized our high-frequency (monthly) observations collected around the 1998 and 2016 El Niño events (i.e., between 1997–1999 and 2015–2017). We found that during both the 1997–1999 and 2015–2017 periods, the lowest SCA occurred during the mid-September observations of the El Niño year (1998 or 2016), following a decline in SCA that began with the September measurements of the previous year (1997 or 2015). The ENSO indices are most strongly correlated with the QIC's ELA, SCA, and median elevation as they best represent the changing ice distribution and mass.
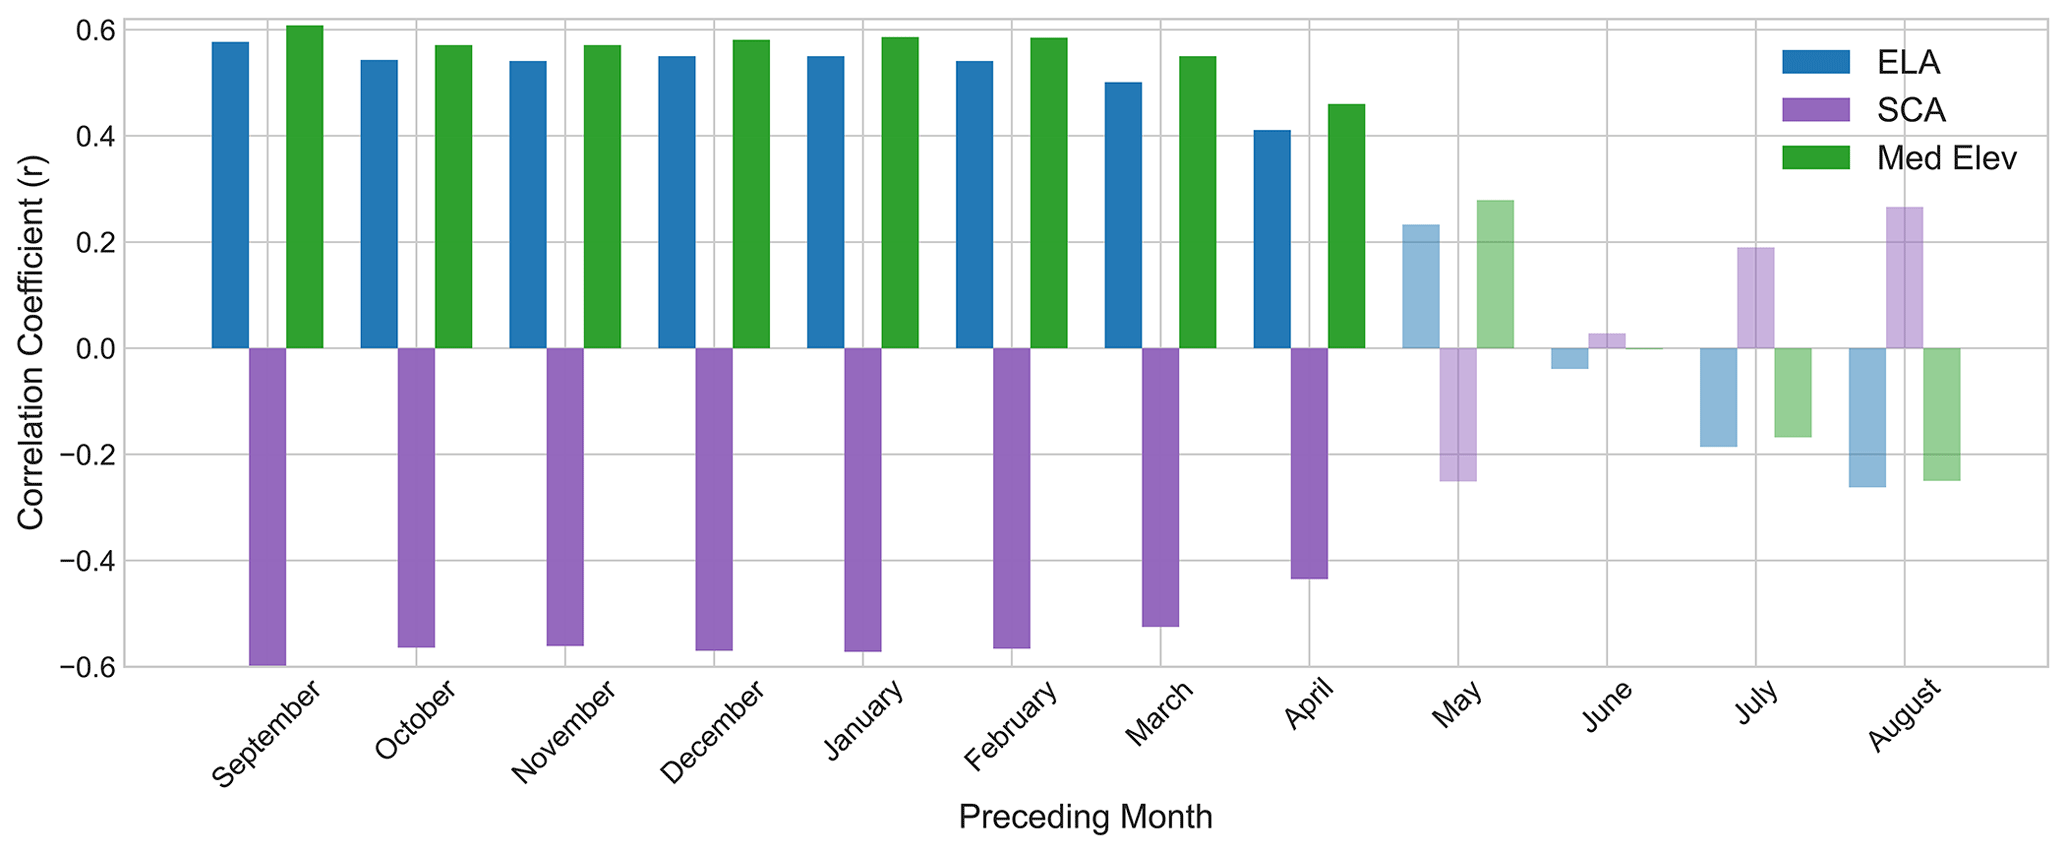
Figure 5Zero-order correlations (r) for the QIC variables (ELA, SCA, and the median elevation of the SCA (Med Elev)) and the ONI from 1985 to 2023. Correlation coefficients with statistically insignificant p values (>0.05) are denoted as semitransparent bars.
In addition, we found that linear regression models for ELA and SCA that include El Niño as a binary predictor (i.e., indicating yes or no) improve the R2 values from 0.40 to 0.67 (p<0.001) and from 0.44 to 0.72 (p<0.001), respectively, while the R2 value for the model predicting TA does not improve with the inclusion of the binary predictor. Finally, to compare the yearly means of the QIC variables over the full observational period, we characterized each year as an El Niño, La Niña, or neutral year using the ONI. El Niño years were defined as having an ONI ≥1, La Niña years as having an ONI , and neutral years as falling within the range of . We then conducted an ANOVA with a post hoc test. We found a significant difference in the mean SCA and ELA between the El Niño and neutral years, as well as in the mean AAR between the El Niño and neutral years and between the El Niño and La Niña years (Fig. S4). There was no significant difference in the mean TA between the El Niño, La Niña, and neutral years (Table S4). Together, the improved R2 values and ANOVA results further indicate that El Niño events have a substantial effect on the QIC's yearly SCA and related variables but not on the TA. During El Niño events, ERA5-Land climate data show a marked increase in air temperatures, while precipitation patterns and magnitude remain largely unchanged. For instance, during the dry season from 1997 to 1998, there was a ∼1.35 °C increase in temperature and a change in total precipitation of less than ∼0.02 m. This suggests that the reduction in the QIC's SCA is likely primarily driven by increased temperatures during the events rather than by reduced precipitation. Changes in the dominant phase of precipitation (e.g., more rain than snow) could also be a contributing factor, but that is beyond the scope of this paper.
4.1 QIC response to interannual climate variability
During El Niño events, the Peruvian Andes are often drier than average (Sulca et al., 2018), with on-site measurements at the QIC recording warmer and drier conditions (Hurley et al., 2019). To be considered an El Niño event, the SST anomalies must be high for at least 4 consecutive months (Lagos et al., 2008). These events are evident in the QIC's shallow ice cores, which display a smoothed δ18O signal during El Niño, instead of the usual high-resolution variability, indicating dry and warm conditions that lead to a lack of accumulation and increased melt (Thompson et al., 2017). Our results suggest that these multi-month positive temperature anomalies have a greater influence on the QIC's SCA than precipitation (i.e., no significant correlation is observed between wet-season precipitation and SCA, ELA, or the median SCA elevation). We demonstrate that the El Niño events of 1998 and 2016 correspond to large reductions in the QIC's SCA (Fig. 6). These SCA perturbations are outliers from the mean SCA (exhibiting z scores of -2.3 and −2.11, respectively, with an average z score of 0.12). Linear regression analysis, with and without El Niño event years, shows differing slope coefficients, indicating that these events are also associated with an enhanced reduction in the QIC's SCA over the full observational period. As noted in the results, the SCA rebound in 2017 from the 2016 El Niño minimum only reached about 77 % of its 2015 value. In contrast, in 1999 (following the 1998 El Niño minimum), the SCA fully recovered and exceeded its 1997 value. The year 1999 was one of the strongest La Niña years within the observation period, with an ONI of −1.5, along with the years 1989 and 2011. This suggests that the timing and magnitude of La Niña events represent additional important factors influencing interannual variability in SCA.
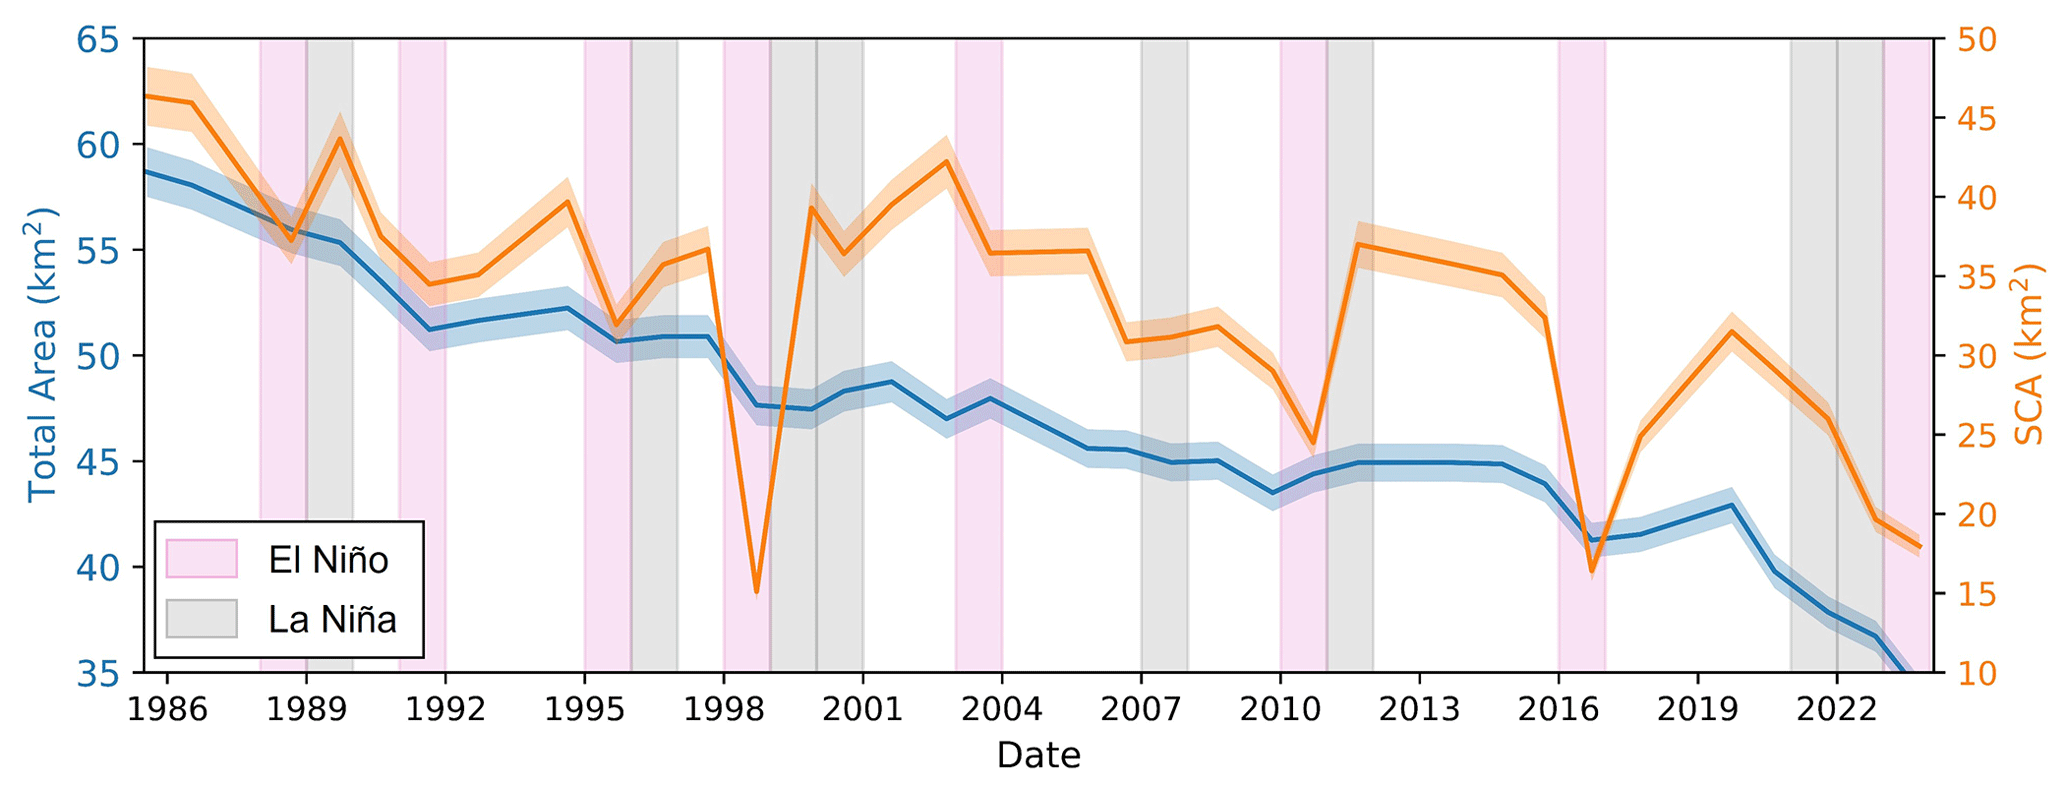
Figure 6Decline in the QIC's TA and SCA over the observational period (1985–2023). The timings of the El Niño and La Niña events (with years containing ONIs that exceed the threshold of ±1.0) are indicated by pink and gray bars, respectively. The shading around the TA and SCA lines represents the ±3 % uncertainty calculated from comparisons to manual digitization.
We observe a strong and significant decline in the QIC's TA over the observational period: −0.49 ± 0.02 km2 yr−1 (R2=0.93; p<0.001). However, comparisons between linear regression models for QIC variables, with and without the inclusion of El Niño as a binary predictor, suggest that El Niño years have a stronger effect on the AAR, SCA, and ELA than on the TA (Fig. S4; Table S4). This indicates that, while the QIC's SCA is notably reduced and its decline is exacerbated over the long term by El Niño events, anthropogenic warming is the primary driver of the multi-decadal decline in the QIC's SCA and TA (Bradley et al., 2009; Rounce et al., 2023; Thompson et al., 2021; Vuille et al., 2018; Yarleque et al., 2018). Further, as previously noted, the QIC's SCA experienced some level of temporary expansion during most La Niña events over the last 40 years (Fig. 6). However, during the 2021–2022 La Niña, SCA declined. While this represents only a single incident, this behavior may persist with the onset of the predicted 2024–2025 La Niña as the QIC continues to be increasingly impacted by the combined effects of El Niño events and anthropogenic warming. Other consequences of overall warming – i.e., a reduction in the percentage of days at or below freezing during the wet season and a rise in the FLH – will further exacerbate the decline in the QIC's SCA. In addition, a recent study has projected a faster onset and slower decline for future El Niños (Lopez et al., 2022). Together, these effects will act to further reduce the QIC's SCA and enhance mass loss.
4.2 Steady state of the QIC and comparison with other studies
For glaciers in other locations, such as the Southern Alps (New Zealand) and the European Alps, the steady-state AAR (associated with a zero annual net mass balance) is around 0.6 (Benn and Lehmkuhl, 2000), but for tropical glaciers, the steady-state AAR is higher, measuring ∼0.8 (Kaser and Osmaston, 2002). Discounting the El Niño years (1998, 2016, and 2023), the QIC's average AAR is 0.74, indicating that the QIC is out of equilibrium and likely somewhat lagging compared with the pace of ongoing climate change. The ice cap is pushed even more noticeably out of equilibrium during the observed El Niño events, with AARs of 0.31, 0.41, and 0.53. These values are far lower than those required for even high-latitude glaciers and far below the average for the QIC. Our results indicate that SCA has changed more dramatically on a year-to-year basis than TA (Fig. 6), indicating a rapid response of SCA (and thus ELA) to interannual climate variability, as well as decadal-scale changes (Zekollari et al., 2020). This is consistent with other studies that indicate that the QIC is likely to respond to climate drivers within a few decades of the present, including the almost immediate response to El Niño events (Thompson, 2017; Veettil et al., 2017). Previous work on the QIC has indicated that the median elevation of the entire QIC rose by ∼1.59 m per decade from 1975 to 2010 (Taylor et al., 2022), which is slightly less than our estimate (∼1.91 m per decade), although we note the differing temporal periods. Similarly, previous studies of the QIC have noted a mean ELA between 1992 and 2017 of ∼5436 m a.s.l. (Yarleque et al., 2018), while our automated methods suggest a lower mean ELA of ∼5351 m a.s.l. for the same temporal period. A linear projection of the ∼40-year trend in SCA and TA suggests that the QIC could lose its SCA before 2080 (becoming a wasting ice field) and may completely melt away before 2100 (Fig. S5). However, we suggest that these simplistic linear projections are conservative. With the increasing loss of SCA and further warming, there is potential for uneven surfaces with standing water, and increases in rainfall could alter surface albedo (Naegeli and Huss, 2017; Wang et al., 2015). In addition, as ice caps shrink and become thinner, elevation-dependent feedbacks and edge effects become increasingly important, resulting in accelerated shrinking over time, especially given the large, flat topography that makes up most of the QIC's remaining ice-covered area. Thus, these combined effects are likely to accelerate the QIC's decline.
Here, we automate the process of a satellite-based collection of yearly variables important for the mass balance assessment of the QIC and evaluate the ice cap's response to interannual climate fluctuations in combination with multi-decadal climate changes. We observe a decline in TA and SCA and a rise in ELA over the last ∼40 years, as well as high interannual variability in SCA and ELA, correlated with ENSO events. Specifically, we observe a ∼42 % loss in TA, a ∼61 % loss in SCA, and a ∼225 m rise in ELA from 1985 to 2023. The QIC's SCA at the end of dry season is significantly correlated with the ONI at the height of the previous wet season, with marked decreases in SCA and the AAR during El Niño events. While SCA has rebounded in response to La Niña events in the past, it has declined during the most recent La Niña. Continued monitoring of the QIC will be vital as the potential for various surface processes and future El Niño events to accelerate the QIC's ice loss will rise with continued warming. Further, the QIC's future demise points toward water scarcity for the local population, creating uncharted difficulties, especially seasonally (Veettil et al., 2017; Vuille et al., 2018).
All calculated QIC variables from this study are provided in the Supplement and detailed in Table S2. Annual SCA shapefile data and DEM bin distributions, calculated within Google Earth Engine, as well as a sample code, are available in the following repository: https://doi.org/10.5281/zenodo.11265568 (Lamantia et al., 2024).
The supplement related to this article is available online at: https://doi.org/10.5194/tc-18-4633-2024-supplement.
KAL designed the study, developed the code, collected the snow cover data, completed the analysis of the data and accompanying climate variables, and wrote the paper. KAL, LJL, LGT, and BGM contributed to the discussion of the results, as well as to the editing and revision of the paper.
The contact author has declared that none of the authors has any competing interests.
Publisher's note: Copernicus Publications remains neutral with regard to jurisdictional claims made in the text, published maps, institutional affiliations, or any other geographical representation in this paper. While Copernicus Publications makes every effort to include appropriate place names, the final responsibility lies with the authors.
This research was supported by the Heising-Simons Foundation and the VoLo Foundation, which provided the past field data used as references and to support the current project. We would like to thank the National Science Foundation (NSF) for its graduate student support. Additionally, we thank James Lea for providing assistance with topographic corrections in Google Earth Engine, Rainey Aberle for providing guidance regarding ELA calculations, and Shelby Turner for insights into climate projections for the Peruvian Andes. This is contribution no. 1630 of the Byrd Polar and Climate Research Center.
This research has been supported by the Heising-Simons Foundation (award no. 2022-4014), the VoLo Foundation, and the National Science Foundation (grant no. 1805819).
This paper was edited by Emily Collier and reviewed by two anonymous referees.
Benn, D. I. and Lehmkuhl, F.: Mass balance and equilibrium-line altitudes of glaciers in high-mountain environments, Quaternary Int., 65, 15–29, 2000.
Bradley, R. S., Vuille, M., Diaz, H. F., and Vergara, W.: Threats to water supplies in the tropical Andes, Science, 312, 1755–1756, 2006.
Bradley, R. S., Keimig, F. T., Diaz, H. F., and Hardy, D. R.: Recent changes in freezing level heights in the Tropics with implications for the deglacierization of high mountain regions, Geophys. Res. Lett., 36, 2009GL037712, https://doi.org/10.1029/2009GL037712, 2009.
Braun, M. H., Malz, P., Sommer, C., Farías-Barahona, D., Sauter, T., Casassa, G., Soruco, A., Skvarca, P., and Seehaus, T. C.: Constraining glacier elevation and mass changes in South America, Nat. Clim. Change, 9, 130–136, 2019.
Brecher, H. H. and Thompson, L. G.: Measurement of the retreat of Qori Kalis glacier in the tropical Andes of Peru by terrestrial photogrammetry, Photogramm. Eng. Rem. S., 59, 1017–1017, 1993.
Casimiro, W. S. L., Labat, D., Ronchail, J., Espinoza, J. C., and Guyot, J. L.: Trends in rainfall and temperature in the Peruvian Amazon–Andes basin over the last 40 years (1965–2007), Hydrol. Process., 27, 2944–2957, 2013.
Dozier, J.: Spectral signature of alpine snow cover from the Landsat Thematic Mapper, Remote Sens. Environ., 28, 9–22, 1989.
Ekstrand, S.: Landsat TM-based forest damage assessment: correction for topographic effects, Photogramm. Eng. Rem. S., 62, 151–162, 1996.
Fang, H., Baiping, Z., Yonghui, Y., Yunhai, Z., and Yu, P.: Mass Elevation Effect and Its Contribution to the Altitude of Snowline in the Tibetan Plateau and Surrounding Areas, Arct. Antarct. Alp. Res., 43, 207–212, https://doi.org/10.1657/1938-4246-43.2.207, 2011.
Favier, V., Wagnon, P., and Ribstein, P.: Glaciers of the outer and inner tropics: A different behaviour but a common response to climatic forcing, Geophys. Res. Lett., 31, L16403, https://doi.org/10.1029/2004GL020654, 2004.
Gaddam, V. K., Boddapati, R., Kumar, T., Kulkarni, A. V., and Bjornsson, H.: Application of “OTSU” – an image segmentation method for differentiation of snow and ice regions of glaciers and assessment of mass budget in Chandra basin, Western Himalaya using Remote Sensing and GIS techniques, Environ. Monit. Assess., 194, 337, https://doi.org/10.1007/s10661-022-09945-2, 2022.
Ge, H., Lu, D., He, S., Xu, A., Zhou, G., and Du, H.: Pixel-based Minnaert Correction Method for Reducing Topographic Effects on a Landsat 7 ETM+ Image, Photogramm. Eng. Rem. S., 74, 1343–1350, https://doi.org/10.14358/PERS.74.11.1343, 2008.
Hall, D. K. and Riggs, G. A.: Accuracy assessment of the MODIS snow products, Hydrol. Process., 21, 1534–1547, 2007.
Hanshaw, M. N. and Bookhagen, B.: Glacial areas, lake areas, and snow lines from 1975 to 2012: status of the Cordillera Vilcanota, including the Quelccaya Ice Cap, northern central Andes, Peru, The Cryosphere, 8, 359–376, https://doi.org/10.5194/tc-8-359-2014, 2014.
Hersbach, H., Bell, B., Berrisford, P., Hirahara, S., Horányi, A., Muñoz‐Sabater, J., Nicolas, J., Peubey, C., Radu, R., Schepers, D., Simmons, A., Soci, C., Abdalla, S., Abellan, X., Balsamo, G., Bechtold, P., Biavati, G., Bidlot, J., Bonavita, M., Chiara, G., Dahlgren, P., Dee, D., Diamantakis, M., Dragani, R., Flemming, J., Forbes, R., Fuentes, M., Geer, A., Haimberger, L., Healy, S., Hogan, R. J., Hólm, E., Janisková, M., Keeley, S., Laloyaux, P., Lopez, P., Lupu, C., Radnoti, G., Rosnay, P., Rozum, I., Vamborg, F., Villaume, S., and Thépaut, J.: The ERA5 global reanalysis, Q. J. Roy. Meteor. Soc., 146, 1999–2049, https://doi.org/10.1002/qj.3803, 2020.
Hu, Z., Dietz, A., Zhao, A., Uereyen, S., Zhang, H., Wang, M., Mederer, P., and Kuenzer, C.: Snow Moving to Higher Elevations: Analyzing Three Decades of Snowline Dynamics in the Alps, Geophys. Res. Lett., 47, e2019GL085742, https://doi.org/10.1029/2019GL085742, 2020.
Hugonnet, R., McNabb, R., Berthier, E., Menounos, B., Nuth, C., Girod, L., Farinotti, D., Huss, M., Dussaillant, I., Brun, F., and Kääb, A.: Accelerated global glacier mass loss in the early twenty-first century, Nature, 592, 726–731, https://doi.org/10.1038/s41586-021-03436-z, 2021.
Hurley, J., Vuille, M., and Hardy, D. R.: On the interpretation of the ENSO signal embedded in the stable isotopic composition of Quelccaya Ice Cap, Peru, J. Geophys. Res.-Atmos., 124, 131–145, 2019.
Hurley, J. V., Vuille, M., Hardy, D. R., Burns, S. J., and Thompson, L. G.: Cold air incursions, δ18O variability, and monsoon dynamics associated with snow days at Quelccaya Ice Cap, Peru, J. Geophys. Res.-Atmos., 120, 7467–7487, https://doi.org/10.1002/2015JD023323, 2015.
Kaser, G. and Osmaston, H.: Tropical glaciers, Cambridge University Press, 2002.
Klein, A. G. and Isacks, B. L.: Spectral mixture analysis of Landsat thematic mapper images applied to the detection of the transient snowline on tropical Andean glaciers, Global Planet. Change, 22, 139–154, https://doi.org/10.1016/S0921-8181(99)00032-6, 1999.
Lagos, P., Silva, Y., Nickl, E., and Mosquera, K.: El Niño – related precipitation variability in Perú, Adv. Geosci., 14, 231–237, https://doi.org/10.5194/adgeo-14-231-2008, 2008.
Lamantia, K., Thompson, L., Davis, M., Mosley-Thompson, E., and Stahl, H.: Unique Collections of 14C-Dated Vegetation Reveal Mid-Holocene Fluctuations of the Quelccaya Ice Cap, Peru, J. Geophys. Res.-Earth, 128, e2023JF007297, https://doi.org/10.1029/2023JF007297, 2023.
Lamantia, K., Larocca, L., Thompson, L., and Mark, B.: El Niño Enhances Snowline Rise and Ice Loss on the Quelccaya Ice Cap, Peru (Version 2), Zenodo [data set], https://doi.org/10.5281/zenodo.11265568, 2024.
Li, X., Wang, N., and Wu, Y.: Automated Glacier Snow Line Altitude Calculation Method Using Landsat Series Images in the Google Earth Engine Platform, Remote Sens., 14, 2377, https://doi.org/10.3390/rs14102377, 2022.
Liu, C., Li, Z., Zhang, P., Tian, B., Zhou, J., and Chen, Q.: Variability of the snowline altitude in the eastern Tibetan Plateau from 1995 to 2016 using Google Earth Engine, J. Appl. Remote Sens., 15, 048505, https://doi.org/10.1117/1.JRS.15.048505, 2021.
Lopez, H., Lee, S.-K., Kim, D., Wittenberg, A. T., and Yeh, S.-W.: Projections of faster onset and slower decay of El Niño in the 21st century, Nat. Commun., 13, 1915, https://doi.org/10.1038/s41467-022-29519-7, 2022.
Mark, B. G., Seltzer, G. O., Rodbell, D. T., and Goodman, A. Y.: Rates of Deglaciation during the Last Glaciation and Holocene in the Cordillera Vilcanota-Quelccaya Ice Cap Region, Southeastern Perú, Quaternary Res., 57, 287–298, https://doi.org/10.1006/qres.2002.2320, 2002.
Meier, M. F.: Proposed definitions for glacier mass budget terms, J. Glaciol., 4, 252–263, 1962.
Naegeli, K. and Huss, M.: Sensitivity of mountain glacier mass balance to changes in bare-ice albedo, Ann. Glaciol., 58, 119–129, 2017.
Otsu, N.: A threshold selection method from gray-level histograms, Automatica, 11, 23–27, 1975.
Paul, F., Barrand, N. E., Baumann, S., Berthier, E., Bolch, T., Casey, K., Frey, H., Joshi, S., Konovalov, V., and Le Bris, R.: On the accuracy of glacier outlines derived from remote-sensing data, Ann. Glaciol., 54, 171–182, 2013.
Pepin, N., Bradley, R. S., Diaz, H. F., Baraer, M., Caceres, E. B., Forsythe, H., Fowler, G., Greenwood, G., Hasmi, M. Z., Liu, X. D., Miller, J. R., Ning, L., Ohmura, A., Palazzi, E., Rangwala, I., Schöner, Severskiy, I., Shahgedanova, M., Wang, M. B., Williamson, S. N., and Yang, D. Q.: Elevation-dependent warming in mountain regions of the world, Nat. Clim. Change, 5, 424–430, 2015.
Pepin, N., Arnone, E., Gobiet, A., Haslinger, K., Kotlarski, S., Notarnicola, C., Palazzi, E., Seibert, P., Serafin, S., Schöner, W., Terzago, J., Thornton, J. M., Vuille, M., and Adler, C.: Climate changes and their elevational patterns in the mountains of the world, Rev. Geophys., 60, e2020RG000730, https://doi.org/10.1029/2020RG000730, 2022.
Rabatel, A., Bermejo, A., Loarte, E., Soruco, A., Gomez, J., Leonardini, G., Vincent, C., and Sicart, J. E.: Can the snowline be used as an indicator of the equilibrium line and mass balance for glaciers in the outer tropics?, J. Glaciol., 58, 1027–1036, 2012.
Rabatel, A., Francou, B., Soruco, A., Gomez, J., Cáceres, B., Ceballos, J. L., Basantes, R., Vuille, M., Sicart, J.-E., Huggel, C., Scheel, M., Lejeune, Y., Arnaud, Y., Collet, M., Condom, T., Consoli, G., Favier, V., Jomelli, V., Galarraga, R., Ginot, P., Maisincho, L., Mendoza, J., Ménégoz, M., Ramirez, E., Ribstein, P., Suarez, W., Villacis, M., and Wagnon, P.: Current state of glaciers in the tropical Andes: a multi-century perspective on glacier evolution and climate change, The Cryosphere, 7, 81–102, https://doi.org/10.5194/tc-7-81-2013, 2013.
Racoviteanu, A. E., Rittger, K., and Armstrong, R.: An Automated Approach for Estimating Snowline Altitudes in the Karakoram and Eastern Himalaya From Remote Sensing, Front. Earth Sci., 7, 220, https://doi.org/10.3389/feart.2019.00220, 2019.
Rounce, D. R., Hock, R., Maussion, F., Hugonnet, R., Kochtitzky, W., Huss, M., Berthier, E., Brinkerhoff, D., Compagno, L., and Copland, L.: Global glacier change in the 21st century: Every increase in temperature matters, Science, 379, 78–83, 2023.
Sankey, T., Donald, J., McVay, J., Ashley, M., O'Donnell, F., Lopez, S. M., and Springer, A.: Multi-scale analysis of snow dynamics at the southern margin of the North American continental snow distribution, Remote Sens. Environ., 169, 307–319, 2015.
Schauwecker, S., Rohrer, M., Acuña, D., Cochachin, A., Dávila, L., Frey, H., Giráldez, C., Gómez, J., Huggel, C., Jacques-Coper, M., Loarte, E., Salzmann, N., and Vuille, M.: Climate trends and glacier retreat in the Cordillera Blanca, Peru, revisited, Global Planet. Change, 119, 85–97, https://doi.org/10.1016/j.gloplacha.2014.05.005, 2014.
Schauwecker, S., Rohrer, M., Huggel, C., Endries, J., Montoya, N., Neukom, R., Perry, B., Salzmann, N., Schwarb, M., and Suarez, W.: The freezing level in the tropical Andes, Peru: An indicator for present and future glacier extents, J. Geophys. Res.-Atmos., 122, 5172–5189, 2017.
Seehaus, T., Malz, P., Sommer, C., Soruco, A., Rabatel, A., and Braun, M.: Mass balance and area changes of glaciers in the Cordillera Real and Tres Cruces, Bolivia, between 2000 and 2016, J. Glaciol., 66, 124–136, 2020.
Sulca, J., Takahashi, K., Espinoza, J., Vuille, M., and Lavado-Casimiro, W.: Impacts of different ENSO flavors and tropical Pacific convection variability (ITCZ, SPCZ) on austral summer rainfall in South America, with a focus on Peru, Int. J. Climatol., 38, 420–435, 2018.
Taylor, L. S., Quincey, D. J., Smith, M. W., Potter, E. R., Castro, J., and Fyffe, C. L.: Multi-Decadal Glacier Area and Mass Balance Change in the Southern Peruvian Andes, Front. Earth Sci., 10, 863933, https://doi.org/10.3389/feart.2022.863933, 2022.
Thompson, L. G.: Ice core evidence for climate change in the Tropics: implications for our future, Quaternary Sci. Rev., 19, 19–35, https://doi.org/10.1016/S0277-3791(99)00052-9, 2000.
Thompson, L. G.: Past, present, and future of glacier archives from the world's highest mountains, P. Am. Philos. Soc., 161, 226–243, 2017.
Thompson, L. G., Mosley-Thompson, E., Bolzan, J. F., and Koci, B. R.: A 1500-Year Record of Tropical Precipitation in Ice Cores from the Quelccaya Ice Cap, Peru, Science, 229, 971–973, https://doi.org/10.1126/science.229.4717.971, 1985.
Thompson, L. G., Mosley-Thompson, E., Davis, M. E., and Brecher, H. H.: Tropical glaciers, recorders and indicators of climate change, are disappearing globally, Ann. Glaciol., 52, 23–34, https://doi.org/10.3189/172756411799096231, 2011.
Thompson, L. G., Mosley-Thompson, E., Davis, M. E., Zagorodnov, V. S., Howat, I. M., Mikhalenko, V. N., and Lin, P.-N.: Annually Resolved Ice Core Records of Tropical Climate Variability over the Past ∼1800 Years, Science, 340, 945–950, https://doi.org/10.1126/science.1234210, 2013.
Thompson, L. G., Davis, M. E., Mosley-Thompson, E., Beaudon, E., Porter, S. E., Kutuzov, S., Lin, P.-N., Mikhalenko, V. N., and Mountain, K. R.: Impacts of Recent Warming and the 2015/2016 El Niño on Tropical Peruvian Ice Fields, J. Geophys. Res.-Atmos., 122, 12688–12701, https://doi.org/10.1002/2017JD026592, 2017.
Thompson, L. G., Davis, M. E., Mosley-Thompson, E., Porter, S. E., Corrales, G. V., Shuman, C. A., and Tucker, C. J.: The impacts of warming on rapidly retreating high-altitude, low-latitude glaciers and ice core-derived climate records, Global Planet. Change, 203, 103538, https://doi.org/10.1016/j.gloplacha.2021.103538, 2021.
Veettil, B. K., Wang, S., Florêncio de Souza, S., Bremer, U. F., and Simões, J. C.: Glacier monitoring and glacier-climate interactions in the tropical Andes: A review, J. S. Am. Earth Sci., 77, 218–246, https://doi.org/10.1016/j.jsames.2017.04.009, 2017.
Vuille, M., Bradley, R. S., and Keimig, F.: Interannual climate variability in the Central Andes and its relation to tropical Pacific and Atlantic forcing, J. Geophys. Res., 105, 12447–12460, https://doi.org/10.1029/2000JD900134, 2000.
Vuille, M., Kaser, G., and Juen, I.: Glacier mass balance variability in the Cordillera Blanca, Peru and its relationship with climate and the large-scale circulation, Global Planet. Change, 62, 14–28, https://doi.org/10.1016/j.gloplacha.2007.11.003, 2008.
Vuille, M., Franquist, E., Garreaud, R., Lavado Casimiro, W. S., and Cáceres, B.: Impact of the global warming hiatus on Andean temperature, J. Geophys. Res.-Atmos., 120, 3745–3757, 2015.
Vuille, M., Carey, M., Huggel, C., Buytaert, W., Rabatel, A., Jacobsen, D., Soruco, A., Villacis, M., Yarleque, C., Elison Timm, O., Condom, T., Salzmann, N., and Sicart, J.-E.: Rapid decline of snow and ice in the tropical Andes – Impacts, uncertainties and challenges ahead, Earth-Sci. Rev., 176, 195–213, https://doi.org/10.1016/j.earscirev.2017.09.019, 2018.
Wang, W., Xiang, Y., Gao, Y., Lu, A., and Yao, T.: Rapid expansion of glacial lakes caused by climate and glacier retreat in the Central Himalayas, Hydrol. Process., 29, 859–874, 2015.
Yarleque, C., Vuille, M., Hardy, D. R., Timm, O. E., De la Cruz, J., Ramos, H., and Rabatel, A.: Projections of the future disappearance of the Quelccaya Ice Cap in the Central Andes, Sci. Rep., 8, 1–11, 2018.
Zekollari, H., Huss, M., and Farinotti, D.: On the imbalance and response time of glaciers in the European Alps, Geophys. Res. Lett., 47, e2019GL085578, https://doi.org/10.1029/2019GL085578, 2020.